0000728889-11-000592.txt : 20110909 0000728889-11-000592.hdr.sgml : 20110909 20110427163424 ACCESSION NUMBER: 0000728889-11-000592 CONFORMED SUBMISSION TYPE: 485BPOS PUBLIC DOCUMENT COUNT: 45 FILED AS OF DATE: 20110427 DATE AS OF CHANGE: 20110427 EFFECTIVENESS DATE: 20110429 FILER: COMPANY DATA: COMPANY CONFORMED NAME: OPPENHEIMER VARIABLE ACCOUNT FUNDS CENTRAL INDEX KEY: 0000752737 IRS NUMBER: 840974272 STATE OF INCORPORATION: MA FISCAL YEAR END: 1231 FILING VALUES: FORM TYPE: 485BPOS SEC ACT: 1940 Act SEC FILE NUMBER: 811-04108 FILM NUMBER: 11784043 BUSINESS ADDRESS: STREET 1: 6803 SOUTH TUCSON WAY CITY: CENTENNIAL STATE: CO ZIP: 80112-3924 BUSINESS PHONE: 3036713200 MAIL ADDRESS: STREET 1: 6803 SOUTH TUCSON WAY CITY: CENTENNIAL STATE: CO ZIP: 80112-3924 FORMER COMPANY: FORMER CONFORMED NAME: OPPENHEIMER VARIABLE LIFE FUNDS DATE OF NAME CHANGE: 19860609 FILER: COMPANY DATA: COMPANY CONFORMED NAME: OPPENHEIMER VARIABLE ACCOUNT FUNDS CENTRAL INDEX KEY: 0000752737 IRS NUMBER: 840974272 STATE OF INCORPORATION: MA FISCAL YEAR END: 1231 FILING VALUES: FORM TYPE: 485BPOS SEC ACT: 1933 Act SEC FILE NUMBER: 002-93177 FILM NUMBER: 11784044 BUSINESS ADDRESS: STREET 1: 6803 SOUTH TUCSON WAY CITY: CENTENNIAL STATE: CO ZIP: 80112-3924 BUSINESS PHONE: 3036713200 MAIL ADDRESS: STREET 1: 6803 SOUTH TUCSON WAY CITY: CENTENNIAL STATE: CO ZIP: 80112-3924 FORMER COMPANY: FORMER CONFORMED NAME: OPPENHEIMER VARIABLE LIFE FUNDS DATE OF NAME CHANGE: 19860609 0000752737 S000010331 Oppenheimer Balanced Fund/VA C000028586 Non-Service C000028587 Service 0000752737 S000010332 Oppenheimer Value Fund/VA C000028588 Non-Service C000028589 Service 0000752737 S000010333 Oppenheimer Small- & Mid-Cap Growth Fund/VA C000028590 Non-Service C000028591 Service 0000752737 S000010334 Oppenheimer Capital Appreciation Fund C000028592 Non-Service C000028593 Service 0000752737 S000010335 Oppenheimer Core Bond Fund/VA C000028594 Non-Service C000028595 Service 0000752737 S000010336 Oppenheimer Global Securities/VA C000028596 Non-Service C000028597 Service C000028916 Class 3 C000028917 Class4 0000752737 S000010337 Oppenheimer High Income Fund/VA C000028598 Non-Service C000028599 Service C000047467 3 C000047468 4 0000752737 S000010338 Oppenheimer Main Street Fund/VA C000028600 Non-Service C000028601 Service 0000752737 S000010339 Oppenheimer Main Street Small- & Mid Cap Fund/VA C000028602 Non-Service C000028603 Service 0000752737 S000010340 Oppenheimer Money Fund/VA C000028604 Non-Service C000028605 Service 0000752737 S000010341 Oppenheimer Global Strategic Income Fund/VA C000028606 Non-Service C000028607 Service 485BPOS 1 ovafpart1rev1.htm PART 1 OF 485B POS

Registration No. 2-93177

File No. 811-4108

UNITED STATES

SECURITIES AND EXCHANGE COMMISSION

Washington, DC 20549

FORM N-1A

REGISTRATION STATEMENT UNDER THE SECURITIES ACT OF 1933                                                                        T

Pre-Effective Amendment No.                                                                                                                                                           o
Post-Effective Amendment No. 60                                                                                                                                                     o

and/or

REGISTRATION STATEMENT UNDER THE INVESTMENT COMPANY ACT OF 1940                                                T
Amendment No. 55

Oppenheimer Variable Account Funds

(Exact Name of Registrant as Specified in Charter)

6803 South Tucson Way, Centennial, Colorado 80112-3924

(Address of Principal Executive Offices)     (Zip Code)

Registrant’s Telephone Number, including Area Code: (303) 768-3200

Arthur S. Gabinet, Esq.
OppenheimerFunds, Inc.

Two World Financial Center, 225 Liberty Street, New York, New York 10281-1008

(Name and Address of Agent for Service)

It is proposed that this filing will become effective (check appropriate box):

     o     immediately upon filing pursuant to paragraph (b)
     T     on April 29, 2011
pursuant to paragraph (b)
     o     60 days after filing pursuant to paragraph (a)(1)

     o     on ______________pursuant to paragraph (a)(1)
     o     75 days after filing pursuant to paragraph (a)(2)
     o     on _______________ pursuant to paragraph (a)(2) of Rule 485.

If appropriate, check the following box:

T      this post-effective amendment designates a new effective date for a previously filed post-effective amendment.


OPPENHEIMER
Balanced Fund/VA

A series of Oppenheimer Variable Account Funds

Share Classes:

     Non-Service Shares

     Service Shares

Prospectus dated April 29, 2011

As with all mutual funds, the Securities and Exchange Commission has not approved or disapproved the Fund's securities nor has it determined that this prospectus is accurate or complete. It is a criminal offense to represent otherwise.

Oppenheimer Balanced Fund/VA is a mutual fund that seeks high total investment return, which includes current income and capital appreciation. The Fund allocates its investments among equity and debt securities.

Shares of the Fund are sold only as an underlying investment for variable life insurance policies, variable annuity contracts and other insurance company separate accounts. A prospectus for the insurance product you have selected accompanies this prospectus and explains how to select shares of the Fund as an investment under that insurance product, and which share class or classes you are eligible to purchase.

This prospectus contains important information about the Fund's objective, investment policies, strategies and risks. Please read this prospectus (and your insurance product prospectus) carefully before you invest and keep them for future reference about your account.


Oppenheimer Balanced Fund/VA


Table of contents

THE FUND SUMMARY

Investment Objective

3

Fees and Expenses of the Fund

3

Principal Investment Strategies

3

Principal Risks

4

The Fund's Past Performance

5

Investment Adviser

6

Portfolio Managers

6

Purchase and Sale of Fund Shares

6

Taxes

6

Payments to Broker-Dealers and Other Financial Intermediaries

6

MORE ABOUT THE FUND

About the Fund's Investments

7

How the Fund is Managed

12

MORE ABOUT YOUR INVESTMENT

How to Buy and Sell Shares

14

Dividends, Capital Gains and Taxes

17

Financial Highlights

17


To Summary Prospectus

THE FUND SUMMARY

Investment Objective.   The Fund seeks high total investment return, which includes current income and capital appreciation.

Fees and Expenses of the Fund. This table describes the fees and expenses that you may pay if you buy and hold or redeem shares of the Fund. The accompanying prospectus of the participating insurance company provides information on initial or contingent deferred sales charges, exchange fees or redemption fees for that variable life insurance policy, variable annuity or other investment product. The fees and expenses of those products are not charged by the Fund and are not reflected in this table. Expenses would be higher if those fees were included.

Shareholder Fees (fees paid directly from your investment)

Non-Service Shares

Service Shares

Maximum Sales Charge (Load) imposed on purchases (as % of offering price)

None

None

Maximum Deferred Sales Charge (Load) (as % of the lower of original offering price or redemption proceeds)

None

None


Annual Fund Operating Expenses (expenses that you pay each year as a percentage of the value of your investment)

Non-Service Shares

Service Shares

Management Fees

0.75%

0.75%

Distribution and/or Service (12b-1) Fees

None

0.25%

Acquired Fund Fees and Expenses

0.01%

0.01%

Other Expenses

0.16%

0.16%

Total Annual Fund Operating Expenses

0.92%

1.17%

     Fee Waiver and Expense Reimbursement*

(0.24%)

(0.24%)

Total Annual Fund Operating Expenses After Fee Waiver and Expense Reimbursement

0.68%

0.93%

* The Manager has voluntarily agreed to waive a portion of the advisory fee and/or reimburse certain expenses so that total annual fund operating expenses will not exceed 0.67% of average annual net assets for Non-Service Shares and 0.92% of average annual net assets for Service Shares. The Manager has also voluntarily agreed to waive fees and/or reimburse Fund expenses in an amount equal to the indirect management fees incurred through the Fund's investment in Oppenheimer Institutional Money Market Fund. These voluntary waivers and/or reimbursements may not be amended or withdrawn until one year after the date of this prospectus.


Example. The following Example is intended to help you compare the cost of investing in the Fund with the cost of investing in other mutual funds. The Example assumes that you invest $10,000 in a class of shares of the Fund for the time periods indicated. The Example also assumes that your investment has a 5% return each year and that the Fund's operating expenses remain the same. Although your actual costs may be higher or lower, based on these assumptions your expenses would be as follows, whether or not you redeemed your shares:

1 Year   3 Years   5 Years   10 Years  
Non-Service Shares $ 70 $ 270 $ 488 $ 1,114
Service Shares $ 95 $ 350 $ 624 $ 1,407

Portfolio Turnover. The Fund pays transaction costs, such as commissions, when it buys and sells securities (or "turns over" its portfolio). A higher portfolio turnover rate may indicate higher transaction costs. These costs, which are not reflected in the annual fund operating expenses or in the example, affect the Fund's performance. During the most recent fiscal year, the Fund's portfolio turnover rate was 54% of the average value of its portfolio.

Principal Investment Strategies. The Fund buys a variety of different types of securities to seek its investment objective. The Fund may invest in equity securities and debt securities of both domestic and foreign issuers and in issuers in any capitalization range. There is no limit on the amount of the Fund's assets that can be invested in foreign securities in developed markets. However, the Fund does not normally expect to invest more than 35% of its total assets in foreign issuers and may not invest more than 10% of its net assets in the securities of governments and companies in emerging markets and it may not invest more than 20% of its net assets in foreign debt securities.
In selecting securities to buy, the portfolio managers use different investment styles to seek diversification across asset classes. They normally maintain a mix of stocks, debt securities and cash, although the Fund is not required to allocate its assets in any fixed proportion. The Fund's asset allocations will change over time as the portfolio managers seek relative opportunities but will generally include:

  • Equity securities: Equity securities are securities that represent an ownership interest in a company. They include common stock, preferred stock and securities convertible into common stock. The Fund will normally invest in stocks and other equity securities, primarily common stocks of U.S. and foreign companies. In selecting equity securities to buy, the portfolio managers mainly look for potential capital appreciation. The portfolio managers employ both "growth" and "value" styles in selecting stocks. Value investing uses fundamental analysis to seek companies whose intrinsic value is greater than the current price of their securities. Companies whose earnings and stock prices are expected to increase at a faster rate than the overall market are considered "growth companies."
  • Debt securities: Debt securities are securities representing money borrowed by the issuer that must be repaid, specifying the amount of principal, the interest or discount rate, and the time or times at which payments are due. The Fund will normally invest in fixed-income senior securities, such as bonds and notes. The debt securities the Fund may buy include securities issued by U.S. and foreign companies, securities issued or guaranteed by the U.S. Government and its agencies and instrumentalities, mortgage-related securities (including private issuer mortgage-backed securities), debt obligations of foreign governments, and money market instruments. The Fund may invest without limit in lower-grade, high-yield debt securities, sometimes referred to as "junk bonds". In selecting debt securities to buy, the portfolio managers look for both income and for total return. The Fund has no requirements as to the maturity of the debt securities it can buy and the average maturity of the Fund's portfolio can be expected to change over time. The Fund may invest in debt securities that pay interest at fixed or floating rates.
  • Derivative Securities: The Fund may also invest in derivative instruments. A derivative is an instrument whose value depends on (or is derived from) the value of an underlying asset or other measure. The derivative instruments in which the Fund may invest include: options, futures, forward contracts, swaps, "structured" notes and "zero-coupon" and "stripped" securities that pay only the interest or only the principal portion of a debt obligation. When interest rates change, the prices of those securities may go up or down more than the prices of other types of debt securities.

In seeking diversification of the Fund's portfolio over asset classes, issuers, and economies, the portfolio managers consider overall and relative economic conditions in U.S. and foreign markets. At times, the Fund may focus more on investing for capital appreciation with less emphasis on seeking income. At other times, perhaps when stock markets are less stable, the Fund might have a greater relative emphasis on income-seeking investments, such as government securities and money market instruments.

The Fund may buy foreign currencies but only in connection with the purchase and sale of foreign securities and not for speculation.

Principal Risks. The price of the Fund's shares can go up and down substantially. The value of the Fund's investments may change because of broad changes in the markets in which the Fund invests or from poor security selection, which could cause the Fund to underperform other funds with similar investment objectives. There is no assurance that the Fund will achieve its investment objective. When you redeem your shares, they may be worth more or less than what you paid for them. These risks mean that you can lose money by investing in the Fund.

Main Risks of Investing in Equity Securities. Stocks and other equity securities fluctuate in price. The value of the Fund's portfolio may be affected by changes in the equity markets generally. Equity markets may experience significant short-term volatility and may fall sharply at times. Different markets may behave differently from each other and U.S. equity markets may move in the opposite direction from one or more foreign markets.

     The prices of individual equity securities generally do not all move in the same direction at the same time and a variety of factors can affect the price of a particular company's securities. These factors may include: poor earnings reports, a loss of customers, litigation against the company, general unfavorable performance of the company's sector or industry, or changes in government regulations affecting the company or its industry.

Main Risks of Debt Securities. Debt securities may be subject to credit risk, interest rate risk, prepayment risk and extension risk. Credit risk is the risk that the issuer of a security might not make interest and principal payments on the security as they become due. If an issuer fails to pay interest or repay principal, the Fund's income or share value might be reduced. Adverse news about an issuer or a downgrade in an issuer's credit rating, for any reason, can also reduce the market value of the issuer's securities. Interest rate risk is the risk that when prevailing interest rates fall, the values of already-issued debt securities generally rise; and when prevailing interest rates rise, the values of already-issued debt securities generally fall, and they may be worth less than the amount the Fund paid for them. When interest rates change, the values of longer-term debt securities usually change more than the values of shorter-term debt securities. When interest rates fall, debt securities may be repaid more quickly than expected and the Fund may be required to reinvest the proceeds at a lower interest rate. This is referred to as "prepayment risk." When interest rates rise, debt securities may be repaid more slowly than expected and the value of the Fund's holdings may fall sharply. This is referred to as "extension risk." Interest rate changes normally have different effects on variable or floating rate securities than they do on securities with fixed interest rates.

     Although some of the securities that the Fund invests in are issued or guaranteed by the U.S. government or it agencies or instrumentalities, the Fund also invests in securities issued by private issuers, which do not have any government guarantees. While the Fund's investments in U.S. Government securities may be subject to little credit risk, the Fund's other investments in debt securities, particularly high-yield lower-grade debt securities and mortgage-backed securities, are subject to risks of default.

Fixed-Income Market Risks . Economic and other market developments can adversely affect fixed-income securities markets in the United States, Europe and elsewhere. At times, participants in debt securities markets may develop concerns about the ability of certain issuers of debt securities to make timely principal and interest payments, or they may develop concerns about the ability of financial institutions that make markets in certain debt securities to facilitate an orderly market. Those concerns can cause increased volatility in those debt securities or debt securities markets. Under some circumstances, as was the case during the latter half of 2008 and early 2009, those concerns could cause reduced liquidity in certain debt securities markets. A lack of liquidity or other adverse credit market conditions may hamper the Fund's ability to sell the debt securities in which it invests or to find and purchase suitable debt instruments.

Special Risks of Lower-Grade Securities.  Lower-grade securities, whether rated or unrated, may be subject to wider market fluctuation, greater credit risk and greater risk of loss of income and principal than investment-grade securities. The market for lower-grade securities may be less liquid and therefore they may be harder to sell at an acceptable price, especially during times of market volatility or decline.

Main Risks of Value Investing. Value investing entails the risk that if the market does not recognize that the Fund's securities are undervalued, the prices of those securities might not appreciate as anticipated. A value approach could also result in fewer investments that increase rapidly during times of market gains and could cause the Fund to underperform funds that use a growth or non-value approach to investing. Value investing has gone in and out of favor during past market cycles and when value investing is out of favor or when markets are unstable, the securities of "value" companies may underperform the securities of "growth" companies.

Main Risks of Growth Investing. If a growth company's earnings or stock price fails to increase as anticipated, or if its business plans do not produce the expected results, its securities may decline sharply. Growth companies may be newer or smaller companies that may experience greater stock price fluctuations and risks of loss than larger, more established companies. Newer growth companies tend to retain a large part of their earnings for research, development or investments in capital assets. Therefore, they may not pay any dividends for some time. Growth investing has gone in and out of favor during past market cycles and is likely to continue to do so. During periods when growth investing is out of favor or when markets are unstable, it may be more difficult to sell growth company securities at an acceptable price. Growth stocks may also be more volatile than other securities because of investor speculation.

Main Risks of Foreign Investing. Foreign securities are subject to special risks. Foreign issuers are usually not subject to the same accounting and disclosure requirements that U.S. companies are subject to, which may make it difficult for the Fund to evaluate a foreign company's operations or financial condition. A change in the value of a foreign currency against the U.S. dollar will result in a change in the U.S. dollar value of securities denominated in that foreign currency and in the value of any income or distributions the Fund may receive on those securities. The value of foreign investments may be affected by exchange control regulations, foreign taxes, higher transaction and other costs, delays in the settlement of transactions, changes in economic or monetary policy in the United States or abroad, expropriation or nationalization of a company's assets, or other political and economic factors. These risks may be greater for investments in developing or emerging market countries.

Main Risks of Derivative Investments. Derivatives may be volatile, may require the payment of premiums, can increase portfolio turnover, may be illiquid, and may not perform as expected. Derivatives are subject to counter-party risk and the Fund may lose money on a derivative investment if the issuer or counter-party fails to pay the amount due. Some derivatives have the potential for unlimited loss, regardless of the size of the Fund 's initial investment.

Asset Allocation Risk. Because the Fund typically invests in a combination of securities, the Fund's ability to achieve its investment objective depends largely upon selecting the best mix of investments. There is the risk that the portfolio managers' evaluations and assumptions regarding the equity and fixed-income markets' prospects may be incorrect in view of actual market conditions. During periods of rapidly rising prices, the Fund might not achieve growth in its share prices to the same degree as funds focusing only on stocks. The Fund's investments in stocks may make it more difficult to preserve principal during periods of stock market volatility. The Fund's use of a value or growth style might not be successful when the particular strategy is out of favor.

Who Is the Fund Designed For? The Fund's shares are available only as an investment option under certain variable annuity contracts, variable life insurance policies and investment plans offered through insurance company separate accounts of participating insurance companies. The Fund is designed primarily for investors seeking high total return from their investment from a fund that allocates its assets among different types of securities. Those investors should be willing to assume the risks of short-term share price fluctuations that are typical for a fund that invests in stocks and foreign securities. The Fund is not a short-term trading vehicle and is not designed for investors needing an assured level of current income but may be appropriate for longer-term investors. The Fund is not a complete investment program. You should carefully consider your own investment goals and risk tolerance before investing in the Fund.

An investment in the Fund is not a deposit of any bank and is not insured or guaranteed by the Federal Deposit Insurance Corporation or any other government agency.

The Fund's Past Performance. The bar chart and table below provide some indication of the risks of investing in the Fund by showing changes in the Fund's Non-Service Shares performance from year to year and by showing how the Fund's average annual returns for 1, 5, and 10 years compare with those of two broad measures of market performance that reflect the markets in which the Fund typically invests. Charges imposed by the insurance accounts that invest in the Fund are not included and the returns would be lower if they were.  The Fund's past investment performance is not necessarily an indication of how the Fund will perform in the future. More recent performance information is available by calling the toll-free number on the back of this prospectus and on the Fund's website at: https://www.oppenheimerfunds.com/fund/investors/overview/BalancedFundVA


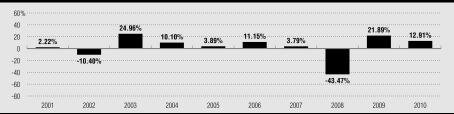
During the period shown, the highest return before taxes for a calendar quarter was 14.27% (2nd qtr 09) and the lowest return before taxes for a calendar quarter was -30.11% (4th qtr 08).


The following table shows the average annual total returns before taxes for each class of the Fund's shares. The Barclays Capital U.S. Aggregate Bond Index is an unmanaged index of U.S. dollar denominated, investment-grade, SEC registered U.S. corporate, government and mortgage-backed securities.


Average Annual Total Returns for the periods ended December 31, 2010

1 Year

5 Years

10 Years (or life of class, if less)

Non-Service Shares (inception 2-9-87)

12.91%


(2.14%)


1.62%


Service Shares (inception 5-1-02)

12.68%


(2.39%)


1.51%


S & P 500 Index

15.08%


2.29%


1.42%


(reflects no deduction for fees, expenses or taxes)


3.84% 1


Barclays Capital U.S. Aggregate Bond Index

6.54%


5.80%


5.84%


(reflects no deduction for fees, expenses or taxes)


5.52% 1


1. From 4-30-02.


Investment Adviser. OppenheimerFunds, Inc. is the Fund's investment adviser (the "Manager").

Portfolio Managers. Emmanuel Ferreira manages the equity component of the Fund's portfolio and Krishna Memani and Peter Strzalkowski manage the fixed-income component of the Fund's portfolio. Mr. Ferreira has been a portfolio manager of the Fund since January 2003 and Vice President of the Fund since February 2003. Mr. Memani has been a portfolio manager and Vice President of the Fund since April 2009. Mr. Strzalkowski has been a portfolio manager of the Fund since April 2009 and Vice President of the Fund since May 2009.

Purchase and Sale of Fund Shares. Shares of the Fund may be purchased only by separate investment accounts of participating insurance companies as an underlying investment for variable life insurance policies, variable annuity contracts or other investment products. Individual investors cannot buy shares of the Fund directly. You may only submit instructions for buying or selling shares of the Fund to your insurance company or its servicing agent, not directly to the Fund or its Transfer Agent. The accompanying prospectus of the participating insurance company provides information about how to select the Fund as an investment option.

Taxes. Because shares of the Fund may be purchased only through insurance company separate accounts for variable annuity contracts, variable life insurance policies or other investment products, any dividends and capital gains distributions will be taxable to the participating insurance company, if at all. However, those payments may affect the tax basis of certain types of distributions from those accounts. Special tax rules apply to life insurance companies, variable annuity contracts and variable life insurance contracts. For information on federal income taxation of a life insurance company with respect to its receipt of distributions from the Fund and federal income taxation of owners of variable annuity or variable life insurance contracts, see the accompanying prospectus for the applicable contract.

Payments to Broker-Dealers and Other Financial Intermediaries. The Fund, the Manager, or their related companies may make payments to financial intermediaries, including to insurance companies that offer shares of the Fund as an investment option. These payments for the sale of Fund shares and related services may create a conflict of interest by influencing the intermediary and your salesperson to recommend the Fund over another investment. Ask your salesperson or visit your financial intermediary's website for more information.

MORE ABOUT THE FUND

About the Fund's Investments

The allocation of the Fund's portfolio among different types of investments will vary over time and the Fund's portfolio might not always include all of the different types of investments described below. The Statement of Additional Information contains more detailed information about the Fund's investment policies and risks.

THE FUND'S PRINCIPAL INVESTMENT STRATEGIES AND RISKS. The following strategies and types of investments are the ones that the Fund considers to be the most important in seeking to achieve its investment objective and the following risks are those the Fund expects its portfolio to be subject to as a whole.

Equity Securities. Equity securities include common stock, preferred stock, rights, warrants and certain debt securities that are convertible into common stock. Equity investments may be exchange-traded or over-the-counter securities.

     In selecting equity securities to buy, the portfolio managers mainly look for potential capital appreciation. The portfolio managers employ both "growth" and "value" styles in selecting stocks.

Common Stock.  Common stock represents an ownership interest in a company. It ranks below preferred stock and debt securities in claims for dividends and in claims for assets of the issuer in a liquidation or bankruptcy. Common stocks may be exchange-traded or over-the-counter securities. Over-the-counter securities may be less liquid than exchange-traded securities.

Value Investing. Value investing seeks stocks that are undervalued in the market by various measures such as the stock's price/earnings ratio. They employ fundamental analysis of a company's financial statements and management structure, operations and product development, as well as the industry of which the company is part. A security may be undervalued because the market is not aware of the issuer's intrinsic value, does not yet recognize its future potential, or the issuer may be temporarily out of favor. The Fund seeks to realize gains in the prices of those securities when other investors recognize their real or prospective worth.

     Value investing entails the risk that if the market does not recognize that the securities selected by the Fund are undervalued, the prices of those securities might not appreciate as anticipated. The portfolio managers' value approach could also result in acquiring fewer investments in securities that increase in price rapidly during times of market advances. This could cause the Fund to underperform other funds that seek capital appreciation but that employ only a growth or non-value approach to investing. Value investing has also gone in and out of favor during past market cycles and is likely to continue to do so. During periods when value investing is out of favor or when markets are unstable, the securities of "value" companies may underperform the securities of "growth" companies.

Growth Investing. Growth investing seeks stocks that the managers believe have possibilities for increases in stock price because of strong earnings growth compared to the market, the development of new products or services or other favorable economic factors. The portfolio managers also consider the effect of worldwide trends on the growth of particular business sectors and looks for companies that may benefit from those trends.

     If a growth company's earnings or stock price fails to increase as anticipated, or if its business plans do not produce the expected results, its securities may decline sharply. Growth companies may be newer or smaller companies that may experience greater stock price fluctuations and risks of loss than larger, more established companies. Newer growth companies tend to retain a large part of their earnings for research, development or investments in capital assets. Therefore, they may not pay any dividends for some time. Growth investing has gone in and out of favor during past market cycles and is likely to continue to do so. During periods when growth investing is out of favor or when markets are unstable, it may be more difficult to sell growth company securities at an acceptable price. Growth stocks may also be more volatile than other securities because of investor speculation.

Debt Securities. The Fund may invest in debt securities, including securities issued or guaranteed by the U.S. Government, or its agencies and instrumentalities, or foreign sovereigns, and foreign and domestic corporate bonds, notes and debentures. The Fund may select debt securities for their income possibilities or to help cushion fluctuations in the value of its portfolio. Debt securities may be subject to the following risks:

  • Interest Rate Risk. The values of debt securities usually change when prevailing interest rates change. When interest rates rise, the values of outstanding debt securities generally fall, and those securities may sell at a discount from their face amount. When interest rates fall, the values of already-issued debt securities generally rise. However, when interest rates fall, the Fund's investments in new securities may be at lower yields and may reduce the Fund's income. The values of longer-term debt securities usually change more than the values of shorter-term debt securities when interest rates change.

       "Zero-coupon" or "stripped" securities may be particularly sensitive to interest rate changes.  Interest rate changes may have different effects on the values of mortgage-related securities because of prepayment and extension risks.

  • Credit Risk. Debt securities are also subject to credit risk. Credit risk is the risk that the issuer of a security might not make interest and principal payments on the security as they become due. U.S. Government securities generally have lower credit risks than securities issued by private issuers or certain foreign governments. If an issuer fails to pay interest, the Fund's income might be reduced, and if an issuer fails to repay principal, the value of the security might fall and the Fund could lose the amount of its investment in the security. The extent of this risk varies based on the terms of the particular security and the financial condition of the issuer. A downgrade in an issuer's credit rating or other adverse news about an issuer can reduce the market value of that issuer's securities.
  • Prepayment Risk. Certain fixed-income securities (in particular mortgage-related securities) are subject to the risk of unanticipated prepayment. That is the risk that when interest rates fall, the issuer will repay the security prior to the security's expected maturity, or with respect to certain fixed-income securities, that borrowers will repay the loans that underlie these securities more quickly than expected, thereby causing the issuer of the security to repay the principal prior to expected maturity. The Fund may need to reinvest the proceeds at a lower interest rate, reducing its income. Securities subject to prepayment risk generally offer less potential for gains when prevailing interest rates fall. If the Fund buys those securities at a premium, accelerated prepayments on those securities could cause the Fund to lose a portion of its principal investment. The impact of prepayments on the price of a security may be difficult to predict and may increase the security's price volatility. Interest-only and principal-only securities are especially sensitive to interest rate changes, which can affect not only their prices but can also change the income flows and repayment assumptions about those investments.
  • Extension Risk. If interest rates rise rapidly, repayments of principal on certain debt securities may occur at a slower rate than expected and the expected maturity of those securities could lengthen as a result. Securities that are subject to extension risk generally have a greater potential for loss when prevailing interest rates rise, which could cause their values to fall sharply.

     Credit Quality. The Fund may invest in securities that are rated or unrated. Credit ratings evaluate the expectation that scheduled interest and principal payments will be made in a timely manner. They do not reflect any judgment of market risk. Rating agencies might not always change their credit rating of an issuer in a timely manner to reflect events that could affect the issuer's ability to make timely payments on its obligations. In selecting securities for the Fund's portfolio and evaluating their income potential and credit risk, the Fund does not rely solely on ratings by rating organizations but evaluates business and economic factors affecting issuers as well.

"Investment-grade" refers to securities that are rated in one of the top four rating categories by nationally-recognized statistical rating organizations such as Moody's Investors Service or Standard & Poor's Ratings Services or that have similar ratings from other nationally-recognized statistical rating organizations. The Fund may also consider unrated securities to be "investment-grade" if they are judged to be of comparable quality to securities rated investment-grade by those organizations. Lower-grade securities are those that are rated below "Baa" by Moody's, that are rated below "BBB" by Standard & Poor's, that have similar ratings from other rating organizations or that are unrated securities judged to be of similar quality. Below investment-grade securities may be considered speculative. The ratings definitions of the principal ratings organizations are included in an Appendix to the Statement of Additional Information.

The Fund may invest in investment-grade securities. The Fund may also invest without limit in securities that are rated below investment-grade and at times may invest substantial amounts of its assets in those securities to seek higher income as part of its investment goal. The Fund can invest in securities rated as low as "C" or "D" or which are in default at the time the Fund buys them.

U.S. Government Securities. The Fund invests in securities issued or guaranteed by the U.S. Government or its agencies and instrumentalities. Some of those securities are directly issued by the U.S. Treasury and are backed by the full faith and credit of the U.S. Government. "Full faith and credit" means that the taxing power of the U.S. Government is pledged to the payment of interest and repayment of principal on a security.

Some securities issued by U.S. Government agencies, such as Government National Mortgage Association pass-through mortgage obligations ("Ginnie Maes"), are also backed by the full faith and credit of the U.S. Government. Others are supported by the right of the agency to borrow an amount from the U.S. Government (for example, "Fannie Mae" bonds issued by the Federal National Mortgage Association and "Freddie Mac" obligations issued by the Federal Home Loan Mortgage Corporation). Others are supported only by the credit of the agency (for example, obligations issued by the Federal Home Loan Banks). In September 2008, the Federal Housing Finance Agency placed the Federal National Mortgage Association and Federal Home Loan Mortgage Corporation into conservatorship. The U.S. Treasury also entered into a secured lending credit facility with those companies and a preferred stock purchase agreement. Under the preferred stock purchase agreement, the Treasury will ensure that each company maintains a positive net worth. 

     U.S. Treasury Securities. Treasury securities are backed by the full faith and credit of the United States for payment of interest and repayment of principal and have little credit risk. Some of the securities that are issued directly by the U.S. Treasury are: Treasury bills (having maturities of one year or less when issued), Treasury notes (having maturities of from one to ten years when issued), Treasury bonds (having maturities of more than ten years when issued) and Treasury Inflation-Protection Securities ("TIPS"). While U.S. Treasury securities have little credit risk, prior to their maturity they are subject to price fluctuations from changes in interest rates.

     Mortgage-Related Government Securities.  Mortgage-related government securities include interests in pools of residential or commercial mortgages, in the form of "pass-through" mortgage securities. They may be issued or guaranteed by the U.S. Government or its agencies and instrumentalities. Mortgage-related U.S. Government securities may be issued in different series, each having different interest rates and maturities.

Mortgage-related securities that are U.S. Government securities have collateral to secure payment of interest and principal. The collateral is either in the form of mortgage pass-through certificates issued or guaranteed by a U.S. agency or instrumentality or mortgage loans insured by a U.S. Government agency. The prices and yields of mortgage-related securities are determined, in part, by assumptions about the rate of payments of the underlying mortgages and are subject to prepayment and extension risks.

Private-Issuer Mortgage-Related Securities. Mortgage-related securities issued by private issuers are not U.S. Government securities, and are subject to greater credit risks than mortgage-related securities that are U.S. Government securities. Primarily these include multi-class debt or pass-through certificates secured by mortgage loans, which may be issued by banks, savings and loans, mortgage bankers and other non-governmental issuers. Private-issuer mortgage-backed securities may include loans on residential or commercial properties. 

Mortgage-related securities issued by private issuers are not U.S. Government securities, which makes them subject to greater credit risks than U.S. Government securities. Private issuer mortgage-backed securities are subject to the credit risks of the issuers, as well as to interest rate risks, although in some cases they may be supported by insurance or guarantees. The prices and yields of private issuer mortgage-related securities are also subject to prepayment and extension risk. The market for private-issuer mortgage-backed securities may be volatile at times and may be less liquid than the markets for other types of securities.

Forward Rolls. The Fund can enter into "forward roll" transactions (also referred to as "mortgage dollar rolls") with respect to mortgage-related securities. In this type of transaction, the Fund sells a mortgage-related security to a buyer and simultaneously agrees to repurchase a similar security at a later date at a set price. During the period between the sale and the repurchase, the Fund will not be entitled to receive interest and principal payments on the securities that have been sold. The Fund will bear the risk that the market value of the securities might decline below the price at which the Fund is obligated to repurchase them or that the counterparty might default in its obligations.

Asset-Backed Securities. The Fund may invest in asset-backed securities, which are fractional interests in pools of loans, receivables or other assets. They are issued by trusts or other special purpose vehicles and are collateralized by the loans, receivables or other assets that make up the pool. The trust or other issuer passes the income from the underlying asset pool to the investor. Neither the Fund nor the Manager selects the loans, receivables or other assets that are included in the pools or the collateral backing those pools. Asset-backed securities are subject to interest rate risk and credit risk. These securities are subject to the risk of default by the issuer as well as by the borrowers of the underlying loans in the pool. Certain asset-backed securities are subject to prepayment and extension risks.

Risks of Small- and Mid-Sized Companies. Small- and mid-sized companies may be either established or newer companies, including "unseasoned" companies that have been in operation for less than three years. While smaller companies might offer greater opportunities for gain than larger companies, they also may involve greater risk of loss. They may be more sensitive to changes in a company's earnings expectations and may experience more abrupt and erratic price movements. Smaller companies' securities often trade in lower volumes and in many instances, are traded over-the-counter or on a regional securities exchange, where the frequency and volume of trading is substantially less than is typical for securities of larger companies traded on national securities exchanges. Therefore, the securities of smaller companies may be subject to wider price fluctuations and it might be harder for the Fund to dispose of its holdings at an acceptable price when it wants to sell them. Small- and mid-sized companies may not have established markets for their products or services and may have fewer customers and product lines. They may have more limited access to financial resources and may not have the financial strength to sustain them through business downturns or adverse market conditions. Since small- and mid-sized companies typically reinvest a high proportion of their earnings in their business, they may not pay dividends for some time, particularly if they are newer companies. Smaller companies may have unseasoned management or less depth in management skill than larger, more established companies. They may be more reliant on the efforts of particular members of their management team and management changes may pose a greater risk to the success of the business. Securities of small, unseasoned companies may be particularly volatile, especially in the short term, and may have very limited liquidity. It may take a substantial period of time to realize a gain on an investment in a small- or mid-sized company, if any gain is realized at all.

     The Fund currently focuses on securities of issuers that have mid-to-large capitalizations. They may pay higher dividends than small-capitalization companies and their stock prices have tended to be less volatile than securities of smaller issuers. However, the Fund can buy stocks of issuers in all capitalization ranges. At times the Manager might increase the relative emphasis of securities of issuers in a particular capitalization range if the Manager believes they offer greater opportunities for total return.

The Fund limits its investments in securities of small, unseasoned issuers to not more than 5% of its net assets.

       Price Arbitrage. Because the Fund may invest in smaller company stocks that might trade infrequently, investors might seek to trade fund shares based on their knowledge or understanding of the value of those securities (this is sometimes referred to as "price arbitrage"). If such price arbitrage were successful, it might interfere with the efficient management of the Fund's portfolio and the Fund may be required to sell securities at disadvantageous times or prices to satisfy the liquidity requirements created by that activity. Successful price arbitrage might also dilute the value of fund shares held by other shareholders.

Foreign Investing. The Fund can buy securities issued by companies or governments in any country, including in developing or emerging market countries, subject to the limits set forth in the "Principal Investment Strategies" in this prospectus.  

     While foreign securities may offer special investment opportunities, there are also special risks. A change in the value of a foreign currency against the U.S. dollar will result in a change in the U.S. dollar value of the Fund's securities that are denominated in that foreign currency and in the value of any income or distributions the Fund may receive on those securities. Additionally, foreign issuers are usually not subject to the same accounting and disclosure requirements that U.S. companies are subject to. The value of foreign investments may be affected by exchange control regulations, expropriation or nationalization of a company's assets, foreign taxes, delays in settlement of transactions, changes in economic or monetary policy in the United States or abroad, or other political and economic factors.

The Fund may invest in securities of foreign issuers that are traded on U.S. or foreign exchanges. If the Fund invests a significant amount of its assets in securities that trade on foreign exchanges, it may be exposed to "time-zone arbitrage" attempts by investors seeking to take advantage of differences in the values of foreign securities that might result from events that occur after the close of the foreign securities market on which a security is traded and before the close of the New York Stock Exchange (the "NYSE") that day, when the Fund's net asset value is calculated. If such time-zone arbitrage were successful, it might dilute the interests of other shareholders. However, the Fund's use of "fair value pricing" under certain circumstances, to adjust the closing market prices of foreign securities to reflect what the Manager and the Board believe to be their fair value, may help deter those activities.

       Special Risks of Developing and Emerging Markets.  Developing or emerging market countries generally have less developed securities markets or exchanges. Securities of issuers in developing or emerging market countries may be more difficult to sell at an acceptable price and their prices may be more volatile than securities of issuers in countries with more mature markets. Settlements of trades may be subject to greater delays so that the proceeds of a sale of a security may not be received on a timely basis. The economies of developing or emerging market countries may be more dependent on relatively few industries that may be highly vulnerable to local and global changes. Developing or emerging market countries may have less developed legal and accounting systems, and investments in those countries may be subject to greater risks of government restrictions, including confiscatory taxation, expropriation or nationalization of company assets, restrictions on foreign ownership of local companies and restrictions on withdrawing assets from the country. Their governments may also be more unstable than the governments of more developed countries. The value of the currency of a developing or emerging market country may fluctuate more than the currencies of countries with more mature markets. Investments in securities of issuers in developing or emerging market countries may be considered speculative.

Time-Zone Arbitrage. The Fund may invest in securities of foreign issuers that are traded in U.S. or foreign markets. If the Fund invests a significant amount of its assets in securities traded in foreign markets, it may be exposed to "time-zone arbitrage" attempts by investors seeking to take advantage of differences in the values of foreign securities that might result from events that occur after the close of the foreign securities market on which a security is traded and before the close of the New York Stock Exchange that day, when the Fund's net asset value is calculated. If such time-zone arbitrage were successful, it might dilute the interests of other shareholders. However, the Fund's use of "fair value pricing" under certain circumstances, to adjust the closing market prices of foreign securities to reflect what the Manager and the Board believe to be their fair value, may help deter those activities.

Derivative Investments. The Fund can invest in "derivative" instruments. A derivative is an instrument whose value depends on (or is derived from) the value of an underlying security, asset, interest rate, index or currency.  Derivatives may allow the Fund to increase or decrease its exposure to certain markets or risks.  

The Fund may use derivatives to seek to increase its investment return or for hedging purposes. The Fund is not required to use derivatives in seeking its investment objective or for hedging and might not do so.

     Options, futures, forward contracts, swaps, "structured" notes, and certain mortgage-related securities are some of the types of derivatives the Fund can use. The Fund may also use other types of derivatives that are consistent with its investment strategies or for hedging purposes.

Credit Default Swaps. A credit default swap enables an investor to buy or sell protection against a credit event with respect to an issuer, such as an issuer's failure to make timely payments of interest or principal on its debt obligations, bankruptcy or restructuring. The terms of the instrument are generally negotiated by the Fund and the swap counterparty. A credit default swap may be embedded within a structured note or other derivative instrument.

Generally, if the Fund buys credit protection using a credit default swap, the Fund will make fixed payments to the counterparty and if a credit event occurs with respect to the applicable issuer, the Fund will deliver the issuer's defaulted bonds underlying the swap to the swap counterparty and the counterparty will pay the Fund par for the bonds. If the Fund sells credit protection using a credit default swap, generally the Fund will receive fixed payments from the counterparty and if a credit event occurs with respect to the applicable issuer, the Fund will pay the swap counterparty par for the issuer's defaulted bonds and the swap counterparty will deliver the bonds to the Fund. Alternatively, a credit default swap may be cash settled and the buyer of protection would receive the difference between the par value and the market value of the issuer's defaulted bonds from the seller of protection. If the credit default swap is on a basket of issuers, the notional value of the swap is reduced by the amount represented by that issuer, and the fixed payments are then made on the reduced notional value.

     Risks of Credit Default Swaps. Credit default swaps are subject to credit risk of the underlying issuer and to counterparty credit risk. If the counterparty fails to meet its obligations, the Fund may lose money. Credit default swaps are also subject to the risk that the Fund will not properly assess the risk of the underlying issuer. If the Fund is selling credit protection, there is a risk that a credit event will occur and that the Fund will have to pay the counterparty. If the Fund is buying credit protection, there is a risk that no credit event will occur and the Fund will receive no benefit for the premium paid.

Interest Rate Swaps.   In an interest rate swap, the Fund and another party exchange their rights to receive interest payments on a security. For example, they might swap the right to receive floating rate payments for the right to receive fixed rate payments. An interest rate swap enables an investor to buy or sell protection against changes in an interest rate event. The terms of the instrument are generally negotiated by the Fund and the swap counterparty. An interest rate swap may be embedded within a structured note or other derivative instrument.

       Risks of Interest Rate Swaps. Interest rate swaps are subject to interest rate risk and credit risk. An interest rate swap transaction could result in losses if the underlying asset or reference does not perform as anticipated. Interest rate swaps are also subject to counterparty risk. If the counterparty fails to meet its obligations, the Fund may lose money.

Hedging.  Hedging transactions are intended to reduce the risks of securities in the Fund's portfolio. If the Fund uses a hedging instrument at the wrong time or judges market conditions incorrectly, however, the hedge might be unsuccessful or could reduce the Fund's return or create a loss. The Fund has percentage limits on its use of derivatives and hedging instruments.

"Structured" Notes. "Structured" notes are specially-designed derivative debt instruments. The terms of the instrument may be determined or "structured" by the purchaser and the issuer of the note. Payments of principal or interest on these notes may be linked to the value of an index (such as a currency or securities index), one or more securities, a commodity or the financial performance of one or more obligors. The value of these notes will normally rise or fall in response to the changes in the performance of the underlying security, index, commodity or obligor.

Risks of Structured Notes. Structured notes are subject to interest rate risk. They are also subject to credit risk with respect both to the issuer and, if applicable, to the underlying security or obligor. If the underlying investment or index does not perform as anticipated, the structured note might pay less interest than the stated coupon payment or repay less principal upon maturity. The price of structured notes may be very volatile and they may have a limited trading market, making it difficult to value them or sell them at an acceptable price. In some cases, the Fund may enter into agreements with an issuer of structured notes to purchase a minimum amount of those notes over time.

Risks of Derivative Investments. Derivatives may be volatile and may involve significant risks. Derivative transactions may require the payment of premiums and can increase portfolio turnover. For example, if a call option sold by the Fund was exercised on an investment that had increased in value above the call price, the Fund would be required to sell the investment at the call price and would not be able to realize any additional profit. Some derivatives have the potential for unlimited loss, regardless of the size of the Fund's initial investment. Certain derivative investments held by the Fund may be illiquid, making it difficult to close out an unfavorable position. The underlying security or other instrument on which a derivative is based, or the derivative itself, may not perform as expected. As a result, the Fund could realize little or no income or lose principal from the investment, or a hedge might be unsuccessful.  Derivatives are also subject to credit risk, since the Fund may lose money if the issuer of the derivative fails to pay the amount due.


OTHER INVESTMENT STRATEGIES AND RISKS. The Fund can also use the investment techniques and strategies described below. The Fund might not use all of these techniques or strategies or might only use them from time to time.

Special Portfolio Diversification Requirements. To enable a variable annuity or variable life insurance contract based on an insurance company separate account to qualify for favorable tax treatment under the Internal Revenue Code, the underlying investments must follow special diversification requirements that limit the percentage of assets that can be invested in securities of particular issuers. The Fund's investment program is managed to meet those requirements, in addition to other diversification requirements under the Internal Revenue Code and the Investment Company Act of 1940 that apply to publicly-sold mutual funds.

Failure by the Fund to meet those special requirements could cause earnings on a contract owner's interest in an insurance company separate account to be taxable income. Those diversification requirements might also limit, to some degree, the Fund's investment decisions in a way that could reduce its performance.

Industry and Sector Focus.  At times the Fund may increase the relative emphasis of its investments in a particular industry or sector. The prices of securities of issuers in a particular industry or sector may go up and down in response to changes in economic conditions, government regulations, availability of basic resources or supplies, or other events that affect that industry or sector more than others. To the extent that the Fund increases the relative emphasis of its investments in a particular industry or sector, its share values may fluctuate in response to events affecting that industry or sector. To some extent that risk may be limited by the Fund's policy of not concentrating 25% or more of its total assets in investments in any one industry.

Other Equity Securities.  In addition to common stocks, the Fund can invest in other equity or "equity equivalents" securities such as preferred stocks or convertible securities. Preferred stocks generally pay a dividend and rank ahead of common stocks and behind debt securities in claims for dividends and for assets of the issuer in a liquidation or bankruptcy. The dividend rate of preferred stocks may cause their prices to behave more like those of debt securities. A convertible security is one that can be converted into or exchanged for common stock of an issuer within a particular period of time at a specified price, upon the occurrence of certain events or according to a price formula. Convertible securities offer the Fund the ability to participate in stock market movements while also seeking some current income. Convertible debt securities pay interest and convertible preferred stocks pay dividends until they mature or are converted, exchanged or redeemed. The Fund considers some convertible securities to be "equity equivalents" because they are convertible into common stock. The credit ratings of those convertible securities generally have less impact on the investment decision, although they are still subject to credit and interest rate risk.

Zero-Coupon and Stripped Securities. Some of the debt securities the Fund may invest in are "zero-coupon" or "stripped" securities. Zero-coupon securities pay no interest prior to their maturity date or another specified date in the future but are issued at a discount from their face value. Stripped securities are the separate income or principal components of a debt security, such as Treasury securities whose coupons have been stripped by a Federal Reserve Bank. One component might receive all the interest and the other all the principal payments.

Interest rate changes generally cause greater price fluctuations in zero-coupon securities or the "principal-only" components of stripped securities than in interest-paying securities of the same or similar maturities. The Fund may be required to pay a dividend of the imputed income on a zero-coupon or principal-only security at a time when it has not actually received the income. The "interest-only" components of stripped securities are also especially sensitive to changes in prevailing interest rates. The market for some of these securities may be limited, making it difficult for the Fund to dispose of its holdings quickly at an acceptable price.

Participation Interests in Loans. These securities represent an undivided fractional interest in a loan obligation of a borrower. They are typically purchased from banks or dealers that have made the loan, or are members of the loan syndicate, and that act as the servicing agent for the principal and interest payments. The loans may be to U.S. or foreign companies. Participation interests may be collateralized or uncollateralized and are subject to the credit risk of the servicing agent as well as the credit risk of the borrower. If the Fund purchases a participation interest, it may only be able to enforce its rights through the lender. The Fund can also buy interests in trusts and other entities that hold loan obligations. In that case the Fund will be subject to the trust's credit risks as well as the credit risks of the servicing agent and the underlying loans. In some cases, participation interests, whether held directly by the Fund or indirectly through an interest in a trust or other entity, may be partially "unfunded," meaning that the Fund may be required to advance additional money on future dates.

Not more than 5% of the Fund's net assets can be invested in participation interests of any one borrower.

Repurchase Agreements. The Fund may also enter into repurchase agreements. In a repurchase transaction, the Fund buys a security and simultaneously sells it back to the vendor for delivery at a future date. Repurchase agreements must be fully collateralized. However, if the seller fails to pay the repurchase price on the delivery date, the Fund may incur costs in disposing of the collateral and may experience losses if there is any delay in its ability to do so. If the default on the part of the seller is due to its bankruptcy, the Fund's ability to liquidate the collateral may be delayed or limited.

There is no limit on the amount of the Fund's net assets that may be subject to repurchase agreements of seven days or less.

Money Market Instruments. The Fund may also invest in "money market instruments." Money market instruments are short-term, high-quality, dollar-denominated debt instruments issued by the U.S. Government, domestic and foreign corporations and financial institutions, and other entities that meet the quality, maturity, diversification and other standards that apply to money market funds under the Investment Company Act of 1940. Money market instruments include bank obligations, repurchase agreements, commercial paper, and other corporate and governmental debt obligations. They may have fixed, variable or floating interest rates. Money market instruments generally do not generate capital appreciation if they are held to maturity.

Illiquid and Restricted Securities. Investments that do not have an active trading market, or that have legal or contractual limitations on their resale, are generally referred to as "illiquid" securities. Illiquid securities may be difficult to value or to sell promptly at an acceptable price or may require registration under applicable securities laws before they can be sold publicly. Securities that have limitations on their resale are referred to as "restricted securities." Certain restricted securities that are eligible for resale to qualified institutional purchasers may not be regarded as illiquid.

     The Fund will not invest more than 15% of its net assets in illiquid securities.  The Manager monitors the Fund's holdings of illiquid securities on an ongoing basis to determine whether to sell any of those securities to maintain adequate liquidity.

Conflicts of Interest. The investment activities of the Manager and its affiliates in regard to other funds and accounts they manage may present conflicts of interest that could disadvantage the Fund and its shareholders. The Manager or its affiliates may provide investment advisory services to other funds and accounts that have investment objectives or strategies that differ from, or are contrary to, those of the Fund. That may result in another fund or account holding investment positions that are adverse to the Fund's investment strategies or activities. Other funds or accounts advised by the Manager or its affiliates may have conflicting interests arising from investment objectives that are similar to those of the Fund. Those funds and accounts may engage in, and compete for, the same types of securities or other investments as the Fund or invest in securities of the same issuers that have different, and possibly conflicting, characteristics. The trading and other investment activities of those other funds or accounts may be carried out without regard to the investment activities of the Fund and, as a result, the value of securities held by the Fund or the Fund's investment strategies may be adversely affected. The Fund's investment performance will usually differ from the performance of other accounts advised by the Manager or its affiliates and the Fund may experience losses during periods in which other accounts advised by the Manager or its affiliates achieve gains. The Manager has adopted policies and procedures designed to address potential conflicts of interest identified by the Manager; however, such policies and procedures may also limit the Fund's investment activities and affect its performance.

     The Fund offers its shares to separate accounts of different insurance companies, as an investment for their variable annuity contracts, variable life insurance policies and other investment products. While the Fund does not foresee any disadvantages to contract owners from these arrangements, it is possible that the interests of owners of different contracts participating in the Fund through different separate accounts might conflict. For example, a conflict could arise because of differences in tax treatment.

Investments in Oppenheimer Institutional Money Market Fund. The Fund can invest its free cash balances in Class E shares of Oppenheimer Institutional Money Market Fund to provide liquidity or for defensive purposes. The Fund invests in Oppenheimer Institutional Money Market Fund, rather than purchasing individual short-term investments, to seek a higher yield than it could obtain on its own. Oppenheimer Institutional Money Market Fund is a registered open-end management investment company, regulated as a money market fund under the Investment Company Act of 1940, and is part of the Oppenheimer family of funds. It invests in a variety of short-term, high-quality, dollar-denominated money market instruments issued by the U.S. Government, domestic and foreign corporations, other financial institutions, and other entities. Those investments may have a higher rate of return than the investments that would be available to the Fund directly. At the time of an investment, the Fund cannot always predict what the yield of the Oppenheimer Institutional Money Market Fund will be because of the wide variety of instruments that fund holds in its portfolio. The return on those investments may, in some cases, be lower than the return that would have been derived from other types of investments that would provide liquidity. As a shareholder, the Fund will be subject to its proportional share of the expenses of Oppenheimer Institutional Money Market Fund's Class E shares, including its advisory fee. However, the Manager will waive a portion of the Fund's advisory fee to the extent of the Fund's share of the advisory fee paid to the Manager by Oppenheimer Institutional Money Market Fund.

Temporary Defensive and Interim Investments. For temporary defensive purposes in times of adverse or unstable market, economic or political conditions, the Fund can invest up to 100% of its total assets in investments that may be inconsistent with the Fund's principal investment strategies. Generally, the Fund would invest in shares of Oppenheimer Institutional Money Market Fund or in the types of money market instruments in which Oppenheimer Institutional Money Market Fund invests or in other short-term U.S. Government securities. The Fund might also hold these types of securities as interim investments pending the investment of proceeds from the sale of Fund shares or the sale of Fund portfolio securities or to meet anticipated redemptions of Fund shares. To the extent the Fund invests in these securities, it might not achieve its investment objective.

Portfolio Turnover . A change in the securities held by the Fund is known as "portfolio turnover." The Fund may engage in active and frequent trading to try to achieve its investment objective and may have a portfolio turnover rate of over 100% annually. Increased portfolio turnover may result in higher brokerage fees or other transaction costs, which can reduce performance. The Financial Highlights table at the end of this prospectus shows the Fund's portfolio turnover rates during past fiscal years.

CHANGES TO THE FUND'S INVESTMENT POLICIES. The Fund's fundamental investment policies cannot be changed without the approval of a majority of the Fund's outstanding voting shares; however, the Fund's Board can change non-fundamental policies without a shareholder vote. Significant policy changes will be described in supplements to this prospectus. The Fund's investment objective is a fundamental policy. Other investment restrictions that are fundamental policies are listed in the Fund's Statement of Additional Information. An investment policy is not fundamental unless this prospectus or the Statement of Additional Information states that it is.

PORTFOLIO HOLDINGS.   The Fund's portfolio holdings are included in its semi-annual and annual reports that are distributed to its shareholders within 60 days after the close of the applicable reporting period. The Fund also discloses its portfolio holdings in its Statements of Investments on Form N-Q, which are public filings that are required to be made with the Securities and Exchange Commission within 60 days after the end of the Fund's first and third fiscal quarters. Therefore, the Fund's portfolio holdings are made publicly available no later than 60 days after the end of each of its fiscal quarters. In addition, the Fund's portfolio holdings information, as of the end of each calendar month, may be posted and available on the Fund's website no sooner than 30 days after the end of each calendar month.    

A description of the Fund's policies and procedures with respect to the disclosure of its portfolio holdings is available in the Fund's Statement of Additional Information.

How the Fund is Managed

THE MANAGER. OppenheimerFunds, Inc., the Manager, chooses the Fund's investments and handles its day-to-day business. The Manager carries out its duties, subject to the policies established by the Fund's Board of Trustees, under an investment advisory agreement that states the Manager's responsibilities. The agreement sets the fees the Fund pays to the Manager and describes the expenses that the Fund is responsible to pay to conduct its business.

The Manager has been an investment adviser since 1960. The Manager is located at Two World Financial Center, 225 Liberty Street, 11th Floor, New York, New York 10281-1008.

Advisory Fees. Under the investment advisory agreement, the Fund pays the Manager an advisory fee at an annual rate that declines on additional assets as the Fund grows: 0.75% of the first $200 million of average annual net assets, 0.72% of the next $200 million, 0.69% of the next $200 million, 0.66% of the next $200 million, and 0.60% of average annual net assets over $800 million. The Fund's management fee for its fiscal year ended December 31, 2010, was 0.75% of the Fund's average annual net assets for each class of shares.

The Manager has voluntarily agreed to waive a portion of the advisory fee and/or reimburse certain expenses so that total annual fund operating expenses will not exceed 0.67% of average annual net assets for Non-Service Shares and 0.92% of average annual net assets for Service Shares. The Manager has also voluntarily agreed to waive fees and/or reimburse Fund expenses in an amount equal to the indirect management fees incurred through the Fund's investment in Oppenheimer Institutional Money Market Fund. These voluntary waivers and/or reimbursements may not be amended or withdrawn until one year after the date of this prospectus. From April 1, 2009 through March 31, 2010, the Manager voluntarily waived its advisory fee, resulting in an expense reduction of 0.02% of the Fund's average annual net assets for the fiscal year ended December 31, 2010. This amount is not reflected in the Annual Fund Operating Expenses table shown earlier in this prospectus. After all waivers and reimbursements, actual total annual fund operating expenses for the fiscal year ended December 31, 2010 were 0.66% for Non-Service Shares and 0.91% for Service Shares. The Fund's management fee and other annual operating expenses may vary in future years.

A discussion regarding the basis for the Board of Trustees' approval of the Fund's investment advisory contract is available in the Fund's Annual Report to shareholders for the fiscal year ended December 31, 2010.

Portfolio Managers. The equity component of the Fund's portfolio is managed by Emmanuel Ferreira and the fixed-income component of the Fund's portfolio is managed by Krishna Memani and Peter A. Strzalkowski. Mr. Ferreira, Mr. Memani and Mr. Strzalkowski are primarily responsible for the day-to-day management of the Fund's investments. Mr. Ferreira has been a portfolio manager of the Fund since January 2003 and Vice President of the Fund since February 2003. Mr. Memani has been a portfolio manager and Vice President of the Fund since April 2009. Mr. Strzalkowski has been a portfolio manager of the Fund since April 2009 and Vice President of the Fund since May 2009.

Mr. Ferreira has been a Vice President of the Manager since January 2003. He was a Portfolio Manager at Lashire Investments from July 1999 through December 2002. He is a portfolio manager and officer of other portfolios in the OppenheimerFunds complex.

Mr. Memani has been the Director of Fixed Income of the Manager since October 2010 and a Senior Vice President and Head of the Investment Grade Fixed Income Team of the Manager since March 2009. Mr. Memani was a Managing Director and Head of the U.S. and European Credit Analyst Team at Deutsche Bank Securities from June 2006 through January 2009. He was the Chief Credit Strategist at Credit Suisse Securities from August 2002 through March 2006. He was a Managing Director and Senior Portfolio Manager at Putnam Investments from September 1998 through June 2002. Mr. Memani is a portfolio manager and an officer of other portfolios in the OppenheimerFunds complex.

     Mr. Strzalkowski, CFA, has been a Vice President of the Manager since August 2007 and a member of the Manager's Investment Grade Fixed Income Team since April 2009. Mr. Strzalkowski was a Managing Partner and Chief Investment Officer of Vector Capital Management, LLC, a structured products money management firm he founded, from July 2006 through August 2007. He was a Senior Portfolio Manager at Highland Capital Management, L.P. from June 2005 through July 2006 and a Senior Fixed Income Portfolio Manager at Microsoft Corp. from June 2003 through June 2005. He was a Vice President and Senior Fixed Income Portfolio Manager at First Citizens Bank Trust, Capital Management Group, from April 2000 through June 2003 and a Vice President and Fixed Income Portfolio Manager at Centura Banks from November 1998 through April 2000. Mr. Strzalkowski is a portfolio manager and an officer of other portfolios in the OppenheimerFunds complex.

     The Statement of Additional Information provides additional information about the portfolio managers' compensation, other accounts they manage and their ownership of Fund shares.

MORE ABOUT YOUR INVESTMENT

How to Buy and Sell Shares

You may only submit instructions for buying or selling shares of the Fund to your insurance company or its servicing agent, not directly to the Fund or its Transfer Agent. Information about your investment in the Fund can only be obtained from your participating insurance company or its servicing agent. The Fund's Transfer Agent does not hold or have access to those records.

WHAT CLASSES OF SHARES DOES THE FUND OFFER? The Fund currently offers two different classes of shares. The different classes of shares represent investments in the same portfolio of securities, but the classes are subject to different expenses and will usually have different share prices. The Service Shares are subject to a distribution and service plan. The expenses of that plan are described below. The Non-Service Shares are not subject to a service and distribution plan.

THE PRICE OF FUND SHARES. Fund shares are sold to participating insurance companies, and are redeemed, at their net asset value per share. The net asset value that applies to a purchase order is the next one calculated after the insurance company (as the Fund's designated agent to receive purchase orders) receives the order from its contract owner, in proper form. Fund shares are redeemed at the next net asset value calculated after the insurance company (as the Fund's designated agent to receive purchase orders) receives the order from its contract owner, in proper form. The Fund's Transfer Agent generally must receive the purchase or redemption order from the insurance company by 9:30 a.m. Eastern Time on the next regular business day.

The Fund does not impose any sales charge on purchases of its shares. If there are any charges imposed under the variable annuity, variable life or other contract through which Fund shares are purchased, they are described in the accompanying prospectus of the participating insurance company. The participating insurance company's prospectus may also include information regarding the time you must submit your purchase and redemption orders.

     The sale and redemption price for Fund shares will change from day to day because the value of the securities in its portfolio and its expenses fluctuate. The redemption price will normally differ for different classes of shares. The redemption price of your shares may be more or less than their original cost.

Net Asset Value. The Fund calculates the net asset value of each class of shares as of the close of the New York Stock Exchange (NYSE), on each day the NYSE is open for trading (referred to in this prospectus as a "regular business day"). The NYSE normally closes at 4:00 p.m., Eastern Time, but may close earlier on some days.

The Fund determines the net assets of each class of shares by subtracting the class-specific expenses and the amount of the Fund's liabilities attributable to the share class from the market value of the Fund's securities and other assets attributable to the share class. The Fund's "other assets" might include, for example, cash and interest or dividends from its portfolio securities that have been accrued but not yet collected. The Fund's securities are valued primarily on the basis of current market quotations.

The net asset value per share for each share class is determined by dividing the net assets of the class by the number of outstanding shares of that class.

     Fair Value Pricing. If market quotations are not readily available or (in the Manager's judgment) do not accurately reflect the fair value of a security, or if after the close of the principal market on which a security held by the Fund is traded and before the time as of which the Fund's net asset value is calculated that day, an event occurs that the Manager learns of and believes in the exercise of its judgment will cause a material change in the value of that security from the closing price of the security on the principal market on which it is traded, that security may be valued by another method that the Board believes would more accurately reflect the security's fair value.

In determining whether current market prices are readily available and reliable, the Manager monitors the information it receives in the ordinary course of its investment management responsibilities. It seeks to identify significant events that it believes, in good faith, will affect the market prices of the securities held by the Fund. Those may include events affecting specific issuers (for example, a halt in trading of the securities of an issuer on an exchange during the trading day) or events affecting securities markets (for example, a foreign securities market closes early because of a natural disaster). The Board has adopted valuation procedures for the Fund and has delegated the day-to-day responsibility for fair value determinations to the Manager's "Valuation Committee." Those determinations may include consideration of recent transactions in comparable securities, information relating to the specific security, developments in the markets and their performance, and current valuations of foreign or U.S. indices. Fair value determinations by the Manager are subject to review, approval and ratification by the Board at its next scheduled meeting after the fair valuations are determined.

The Fund's use of fair value pricing procedures involves subjective judgments and it is possible that the fair value determined for a security may be materially different from the value that could be realized upon the sale of that security. Accordingly, there can be no assurance that the Fund could obtain the fair value assigned to a security if it were to sell the security at approximately the same time at which the Fund determines its net asset value per share.

     Pricing Foreign Securities . The Fund may use fair value pricing more frequently for securities primarily traded on foreign exchanges. Because many foreign markets close hours before the Fund values its foreign portfolio holdings, significant events, including broad market movements, may occur during that time that could potentially affect the values of foreign securities held by the Fund.

The Manager believes that foreign securities values may be affected by volatility that occurs in U.S. markets after the close of foreign securities markets. The Manager's fair valuation procedures therefore include a procedure whereby foreign securities prices may be "fair valued" to take those factors into account.

Because some foreign securities trade in markets and on exchanges that operate on weekends and U.S. holidays, the values of some of the Fund's foreign investments may change on days when investors cannot buy or redeem Fund shares.

HOW CAN YOU BUY FUND SHARES? Shares of the Fund may be purchased only by separate investment accounts of participating insurance companies as an underlying investment for variable life insurance policies, variable annuity contracts or other investment products. Individual investors cannot buy shares of the Fund directly. Please refer to the accompanying prospectus of the participating insurance company for information on how to select the Fund as an investment option. That prospectus will indicate which share class you may be eligible to purchase.

Suspension of Share Offering. The offering of Fund shares may be suspended during any period in which the determination of net asset value is suspended, and may be suspended by the Board at any time the Board believes it is in the Fund's best interest to do so.

HOW CAN YOU REDEEM FUND SHARES? Only the participating insurance companies that hold Fund shares in their separate accounts can place orders to redeem shares. Contract holders and policy holders should not directly contact the Fund or its transfer agent to request a redemption of Fund shares. The Fund normally sends payment by Federal Funds wire to the insurance company's account on the next business day after the Fund receives the order (and no later than seven days after the Fund's receipt of the order). Under unusual circumstances determined by the Securities and Exchange Commission, payment may be delayed or suspended. Contract owners should refer to the withdrawal or surrender instructions in the accompanying prospectus of the participating insurance company.

Limitations on Frequent Transactions

Frequent purchases and redemptions of Fund shares may interfere with the Manager's ability to manage the Fund's investments efficiently, may increase its transaction and administrative costs and may affect its performance, depending on various factors, such as the size of the Fund, the nature of its investments, the amount of Fund assets the portfolio manager maintains in cash or cash equivalents, and the aggregate dollar amount, the number and the frequency of trades.

If large dollar amounts are involved in frequent redemption transactions, the Fund might be required to sell portfolio securities at unfavorable times to meet those transaction requests, and the Fund's brokerage or administrative expenses might be increased. Therefore, the Manager and the Fund's Board have adopted the following policies and procedures to detect and prevent frequent and/or excessive purchase and redemption activity, while addressing the needs of investors who seek liquidity in their investment. There is no guarantee that those policies and procedures, described below, will be sufficient to identify and deter all excessive short-term trading. If the Transfer Agent is not able to detect and curtail such activity, frequent trading could occur in the Fund.

Policies on Disruptive Activity.  The Transfer Agent and the Distributor, on behalf of the Fund, have entered into agreements with participating insurance companies designed to detect and restrict excessive short-term trading activity by contract or policy owners or their financial advisers in their accounts. The Transfer Agent generally does not consider periodic asset allocation or re-balancing that affects a portion of the Fund shares held in the account of a policy or contract owner to be "excessive trading." However, the Transfer Agent has advised participating insurance companies that it generally considers certain other types of trading activity to be "excessive," such as making a "transfer" out of the Fund within 30 days after buying Fund shares (by the sale of the recently purchased Fund shares and the purchase of shares of another fund) or making more than six "round-trip transfers" between funds during one year. The agreements require participating insurance companies to provide transaction information to the Fund and to execute Fund instructions to restrict trading in Fund shares.

 A participating insurance company may also have its own policies and procedures and may impose its own restrictions or limitations to discourage short-term and/or excessive trading by its policy or contract owners. Those policies and procedures may be different from the Fund's in certain respects. You should refer to the prospectus for your insurance company variable annuity contract for specific information about the insurance company's policies. Under certain circumstances, policy or contract owners may be required to transmit purchase or redemption orders only by first class U.S. mail.

Monitoring the Policies. The Fund's policies and procedures for detecting and deterring frequent or excessive trading are administered by the Fund's Transfer Agent. However, the Transfer Agent presently does not have the ability to directly monitor trading activity in the accounts of policy or contract owners within the participating insurance companies' accounts. The Transfer Agent's ability to monitor and deter excessive short-term trading in such insurance company accounts ultimately depends on the capability and diligence of each participating insurance company, under their agreements with the Transfer Agent, the Distributor and the Fund, in monitoring and controlling the trading activity of the policy or contract owners in the insurance company's accounts.

The Transfer Agent will attempt to monitor the net effect on the Fund's assets from the purchase and redemption activity in the accounts of participating insurance companies and will seek to identify patterns that may suggest excessive trading by the contract or policy owners who invest in the insurance company's accounts. If the Transfer Agent believes it has observed evidence of possible excessive trading activity, it will ask the participating insurance companies or other registered owners to provide information about the transaction activity of the contract or policy holders in their respective accounts, and to take appropriate action. In that case, the insurance company must confirm to the Transfer Agent that appropriate action has been taken to curtail the excessive trading activity.

The Transfer Agent will, subject to the limitations described in this section, limit or terminate the trading activity of any person, group or account that it believes would be excessive or disruptive. However, the Transfer Agent may not be able to detect or curtail all such trading activity in the Fund. The Transfer Agent will evaluate trading activity on a case by case basis and the limitations placed on trading may vary between accounts.

Right to Refuse Purchase Orders. The Fund's Distributor or Transfer Agent may, in their discretion, refuse any purchase order and are not obligated to provide notice before rejecting an order.  

DISTRIBUTION AND SERVICE (12b-1) PLANS

Distribution and Service Plan for Service Shares. The Fund has adopted a Distribution and Service Plan for Service Shares to pay the Distributor for distribution related services, personal services and account maintenance for those shares. Under the Plan, the Fund pays the Distributor quarterly at an annual rate of up to 0.25% of the daily net assets of the Fund's Service Shares. Because these fees are paid out of the Fund's assets on an on-going basis, over time they will increase the operating expenses of the Service Shares and may cost you more than other types of fees or sales charges. As a result, the Service Shares may have lower performance compared to the Fund's shares that are not subject to a service fee.

     Use of Plan Fees: The Distributor currently uses all of those fees to compensate sponsor(s) of the insurance product for providing personal services and account maintenance for variable contract owners that hold Service Shares.

PAYMENTS TO FINANCIAL INTERMEDIARIES AND SERVICE PROVIDERS. The Manager and the Distributor, in their discretion, may also make payments for distribution and/or shareholder servicing activities to brokers, dealers and other financial intermediaries, including the insurance companies that offer the Fund as an investment option, or to service providers. Those payments are made out of the Manager's and/or the Distributor's own resources and/or assets, including from the revenues or profits derived from the advisory fees the Manager receives from the Fund. Those cash payments, which may be substantial, are paid to many firms having business relationships with the Manager and Distributor and are in addition to any distribution fees, servicing fees, or transfer agency fees paid directly or indirectly by the Fund to those entities. Payments by the Manager or Distributor from their own resources are not reflected in the tables in the "Fees and Expenses of the Fund" section of this prospectus because they are not paid by the Fund.

The financial intermediaries that may receive those payments include firms that offer and sell Fund shares to their clients, or provide shareholder services to the Fund, or both, and receive compensation for those activities. The financial intermediaries that may receive payments include securities brokers, dealers, financial advisers, insurance companies that offer variable annuity or variable life insurance products and other intermediaries.

In general, these payments to financial intermediaries can be categorized as "distribution-related" or "servicing" payments. Payments for distribution-related expenses, such as marketing or promotional expenses, are often referred to as "revenue sharing." Revenue sharing payments may be made on the basis of the sales of shares attributable to that intermediary, the average net assets of the Fund and other Oppenheimer funds attributable to the accounts of that intermediary and its clients, negotiated lump sum payments for distribution services provided, or similar fees. In some circumstances, revenue sharing payments may create an incentive for a financial intermediary or its representatives to recommend or offer shares of the Fund or other Oppenheimer funds to its customers. These payments also may give an intermediary an incentive to cooperate with the Distributor's marketing efforts. A revenue sharing payment may, for example, qualify the Fund for preferred status with the intermediary receiving the payment or provide representatives of the Distributor with access to representatives of the intermediary's sales force, in some cases on a preferential basis over funds of competitors. Additionally, as firm support, the Manager or Distributor may reimburse expenses related to educational seminars and "due diligence" or training meetings (to the extent permitted by applicable laws or the rules of the Financial Industry Regulatory Authority ("FINRA")) designed to increase sales representatives' awareness about Oppenheimer funds, including travel and lodging expenditures. However, the Manager does not consider a financial intermediary's sale of shares of the Fund or other Oppenheimer funds when selecting brokers or dealers to effect portfolio transactions for the funds.

Various factors are used to determine whether to make revenue sharing payments. Possible considerations include, without limitation, the types of services provided by the intermediary, sales of Fund shares, the redemption rates on accounts of clients of the intermediary or overall asset levels of Oppenheimer funds held for or by clients of the intermediary, the willingness of the intermediary to allow the Distributor to provide educational and training support for the intermediary's sales personnel relating to the Oppenheimer funds, the availability of the Oppenheimer funds on the intermediary's sales system, as well as the overall quality of the services provided by the intermediary and the Manager or Distributor's relationship with the intermediary. The Manager and Distributor have adopted guidelines for assessing and implementing each prospective revenue sharing arrangement. To the extent that financial intermediaries receiving distribution-related payments from the Manager or Distributor sell more shares of the Oppenheimer funds or retain more shares of the funds in their client accounts, the Manager and Distributor benefit from the incremental management and other fees they receive with respect to those assets.

Payments may also be made by the Manager, the Distributor or the Transfer Agent to financial intermediaries to compensate or reimburse them for administrative or other client services provided such as sub-transfer agency services for shareholders, omnibus accounting or sub-accounting, participation in networking arrangements, account set-up, recordkeeping and other shareholder services. Payments may also be made for administrative services related to the distribution of Fund shares through the intermediary. Firms that may receive servicing fees include insurance companies that offer variable annuity or variable life insurance products and others. These fees may be used by the service provider to offset or reduce fees that would otherwise be paid directly to them by certain account holders. The Statement of Additional Information contains more information about revenue sharing and service payments made by the Manager or the Distributor. Your broker, dealer or other financial intermediary may charge you fees or commissions in addition to those disclosed in this prospectus. You should ask your financial intermediary for details about any such payments it receives from the Manager or the Distributor and their affiliates, or any other fees or expenses it charges.

Dividends, Capital Gains and Taxes

DIVIDENDS AND DISTRIBUTIONS. The Fund intends to declare and pay dividends annually from any net investment income. The Fund may also realize capital gains on the sale of portfolio securities, in which case it may make distributions out of any net short-term or long-term capital gains annually. The Fund may also make supplemental distributions of dividends and capital gains following the end of its fiscal year. The Fund has no fixed dividend rate and cannot guarantee that it will pay any dividends or capital gains distributions in a particular year.

Dividends and distributions are paid separately for each share class. Because of the higher expenses on Service Shares, the dividends and capital gains distributions paid on those shares will generally be lower than for other Fund shares.

Receiving Dividends and Distributions. Any dividends and capital gains distributions will be automatically reinvested in additional Fund shares for the account of the participating insurance company, unless the insurance company elects to have dividends or distributions paid in cash.

TAXES. For a discussion of the tax status of a variable annuity contract, a variable life insurance policy or other investment product of a participating insurance company, please refer to the accompanying variable contract prospectus of your participating insurance company. Because shares of the Fund may be purchased only through insurance company separate accounts for variable annuity contracts, variable life insurance policies or other investment products, any dividends from net investment income and distributions of net realized short-term and long-term capital gains will be taxable, if at all, to the participating insurance company. However, those payments may affect the tax basis of certain types of distributions from those accounts.

The Fund has qualified and intends to qualify each year to be taxed as a regulated investment company under the Internal Revenue Code by satisfying certain income, asset diversification and income distribution requirements, but reserves the right not to so qualify. In each year that it qualifies as a regulated investment company, the Fund will not be subject to federal income taxes on its income that it distributes to shareholders.

This information is only a summary of certain Federal income tax information about your investment. You are encouraged to consult your tax adviser about the effect of an investment in the Fund on your particular tax situation and about any changes to the Internal Revenue Code that may occur from time to time. Additional information about the tax effects of investing in the Fund is contained in the Statement of Additional Information.

Financial Highlights

The Financial Highlights Table is presented to help you understand the Fund's financial performance for the past five fiscal years. Certain information reflects financial results for a single Fund share. The total returns in the table represent the rate that an investor would have earned (or lost) on an investment in the Fund (assuming reinvestment of all dividends and distributions). This information has been audited by KPMG LLP, the Fund's independent registered public accounting firm for the fiscal years ended December 31, 2010 and 2009. The financial highlights for the prior years were audited by another independent registered public accounting firm. KPMG's report, along with the Fund's financial statements, are included in the Statement of Additional Information, which is available upon request.

Financial Highlights Table

FINANCIAL HIGHLIGHTS

Non-Service Shares      Year Ended December 31,

2010


2009


2008


2007


2006


Per Share Operating Data


Net asset value, beginning of period

$10.30


$8.45


$16.41


$17.69


$17.07


Income (loss) from investment operations:


Net investment income1

.23


.25


.41


.43


.40


Net realized and unrealized gain (loss)

1.09


1.60


(7.03)


.19


1.38


Total from investment operations

1.32


1.85


(6.62)


.62


1.78


Dividends and/or distributions to shareholders:


Dividends from net investment income

(.15)


--


(.39)


(.46)


(.36)


Distributions from net realized gain

--


--


(.95)


(1.44)


(.80)


Total dividends and/or distributions to shareholders

(.15)


--


(1.34)


(1.90)


(1.16)


Net asset value, end of period

$11.47


$10.30


$8.45


$16.41


$17.69


Total Return, at Net Asset Value2

12.91%


21.89%


(43.47)%


3.79%


11.15%


Ratios/Supplemental Data


Net assets, end of period (in thousands)

$150,622


$159,797


$169,621


$385,948


$435,639


Average net assets (in thousands)

$151,620


$159,013


$295,669


$418,103


$456,513


Ratios to average net assets:3


Net investment income

2.13%


2.71%


3.14%


2.55%


2.42%


Total expenses4

0.91%


0.89%


0.76%


0.75%


0.75%


Expenses after payments, waivers and/or reimbursements and reduction to custodian expenses

0.65%


0.60%


0.67%


0.73%


0.75%


Portfolio turnover rate5

54%


87%


67%


68%


76%


1. Per share amounts calculated based on the average shares outstanding during the period.

2. Assumes an initial investment on the business day before the first day of the fiscal period, with all dividends and distributions reinvested in additional shares on the reinvestment date, and redemption at the net asset value calculated on the last business day of the fiscal period. Total returns are not annualized for periods less than one full year. Total return information does not reflect expenses that apply at the separate account level or to related insurance products. Inclusion of these charges would reduce the total return figures for all periods shown. Returns do not reflect the deduction of taxes that a shareholder would pay on fund distributions or the redemption of fund shares.

3. Annualized for periods less than one full year.

4. Total expenses including indirect expenses from affiliated fund were as follows:

Year Ended December 31, 2010

0.92%

Year Ended December 31, 2009

0.91%

Year Ended December 31, 2008

0.76%

Year Ended December 31, 2007

0.75%

Year Ended December 31, 2006

0.75%

5. The portfolio turnover rate excludes purchase and sale transactions of To Be Announced (TBA) mortgage-related securities as follows:

Purchase Transactions

Sale Transactions

Year Ended December 31, 2010

$ 412,930,431

$ 414,511,903

Year Ended December 31, 2009

$ 504,698,365

$ 520,212,670

Year Ended December 31, 2008

$ 474,582,075

$ 434,587,487

Year Ended December 31, 2007

$ 296,201,319

$ 315,527,720

Year Ended December 31, 2006

$ 612,825,833

$ 666,549,894


Service Shares      Year Ended December 31,

2010


2009


2008


2007


2006


Per Share Operating Data


Net asset value, beginning of period

$10.19


$8.38


$16.28


$17.57


$16.97


Income (loss) from investment operations:


Net investment income1

.20


.22


.37


.38


.36


Net realized and unrealized gain (loss)

1.08


1.59


(6.97)


.19


1.37


Total from investment operations

1.28


1.81


(6.60)


.57


1.73


Dividends and/or distributions to shareholders:


Dividends from net investment income

(.12)


--


(.35)


(.42)


(.33)


Distributions from net realized gain

--


--


(.95)


(1.44)


(.80)


Total dividends and/or distributions to shareholders

(.12)


--


(1.30)


(1.86)


(1.13)


Net asset value, end of period

$11.35


$10.19


$8.38


$16.28


$17.57


Total Return, at Net Asset Value2

12.68%


21.60%


(43.62)%


3.49%


10.86%


Ratios/Supplemental Data


Net assets, end of period (in thousands)

$89,580


$88,746


$68,798


$121,399


$111,363


Average net assets (in thousands)

$87,280


$77,101


$100,164


$117,012


$100,010


Ratios to average net assets:3


Net investment income

1.87%


2.42%


2.90%


2.30%


2.17%


Total expenses4

1.16%


1.15%


1.01%


1.00%


1.01%


Expenses after payments, waivers and/or reimbursements and reduction to custodian expenses

0.90%


0.85%


0.92%


0.98%


1.01%


Portfolio turnover rate5

54%


87%


67%


68%


76%


1. Per share amounts calculated based on the average shares outstanding during the period.

2. Assumes an initial investment on the business day before the first day of the fiscal period, with all dividends and distributions reinvested in additional shares on the reinvestment date, and redemption at the net asset value calculated on the last business day of the fiscal period. Total returns are not annualized for periods less than one full year. Total return information does not reflect expenses that apply at the separate account level or to related insurance products. Inclusion of these charges would reduce the total return figures for all periods shown. Returns do not reflect the deduction of taxes that a shareholder would pay on fund distributions or the redemption of fund shares.

3. Annualized for periods less than one full year.

4. Total expenses including indirect expenses from affiliated fund were as follows:

Year Ended December 31, 2010

1.17%

Year Ended December 31, 2009

1.17%

Year Ended December 31, 2008

1.01%

Year Ended December 31, 2007

1.00%

Year Ended December 31, 2006

1.01%

5. The portfolio turnover rate excludes purchase and sale transactions of To Be Announced (TBA) mortgage-related securities as follows:

Purchase Transactions

Sale Transactions

Year Ended December 31, 2010

$ 412,930,431

$ 414,511,903

Year Ended December 31, 2009

$ 504,698,365

$ 520,212,670

Year Ended December 31, 2008

$ 474,582,075

$ 434,587,487

Year Ended December 31, 2007

$ 296,201,319

$ 315,527,720

Year Ended December 31, 2006

$ 612,825,833

$ 666,549,894

INFORMATION AND SERVICES

STATEMENT OF ADDITIONAL INFORMATION. This document includes additional information about the Fund's investment policies, risks, and operations. It is incorporated by reference into this prospectus (it is legally part of this prospectus).

ANNUAL AND SEMI-ANNUAL REPORTS. The Fund's Annual and Semi-Annual Reports provide additional information about the Fund's investments and performance. The Annual Report includes a discussion of market conditions and investment strategies that significantly affected the Fund's performance during its last fiscal year.

How to Request More Information

You can request the above documents, the notice explaining the Fund's privacy policy, and other information about the Fund, without charge, by:

Telephone:

Call OppenheimerFunds Services toll-free: 1.800.988.8287

Mail:

Use the following address for regular mail:
OppenheimerFunds Services
P.O. Box 5270
Denver, Colorado 80217-5270

Use the following address for courier or express mail:
OppenheimerFunds Services
12100 East Iliff Avenue
Suite 300
Aurora, Colorado 80014

Internet:

You can read or download the Fund's Statement of Additional Information, Annual and Semi-Annual Reports on the OppenheimerFunds website at: www.oppenheimerfunds.com

Information about the Fund including the Statement of Additional Information can be reviewed and copied at the SEC's Public Reference Room in Washington, D.C. Information on the operation of the Public Reference Room may be obtained by calling the SEC at 1.202.551.8090. Reports and other information about the Fund are available on the EDGAR database on the SEC's website at www.sec.gov. Copies may be obtained after payment of a duplicating fee by electronic request at the SEC's e-mail address: publicinfo@sec.gov or by writing to the SEC's Public Reference Section, Washington, D.C. 20549-1520.

No one has been authorized to provide any information about the Fund or to make any representations about the Fund other than what is contained in this prospectus. This prospectus is not an offer to sell shares of the Fund, nor a solicitation of an offer to buy shares of the Fund, to any person in any state or other jurisdiction where it is unlawful to make such an offer.


The Fund's SEC File No.: 811-04108
SP0670.001.0411


OPPENHEIMER
Capital Appreciation Fund/VA

  A series of Oppenheimer Variable Account Funds

Share Classes:

     Non-Service Shares

     Service Shares


Prospectus dated April 29, 2011 

As with all mutual funds, the Securities and Exchange Commission has not approved or disapproved the Fund's securities nor has it determined that this prospectus is accurate or complete. It is a criminal offense to represent otherwise.

Oppenheimer Capital Appreciation Fund/VA is a mutual fund that seeks capital appreciation by investing in securities of well-known, established companies.

Shares of the Fund are sold only as an underlying investment for variable life insurance policies, variable annuity contracts and other insurance company separate accounts. A prospectus for the insurance product you have selected accompanies this prospectus and explains how to select shares of the Fund as an investment under that insurance product, and which share class or classes you are eligible to purchase.

This prospectus contains important information about the Fund's objective, investment policies, strategies and risks. Please read this prospectus (and your insurance product prospectus) carefully before you invest and keep them for future reference about your account.


Oppenheimer Capital Appreciation Fund/VA


Table of contents

THE FUND SUMMARY

Investment Objective

3

Fees and Expenses of the Fund

3

Principal Investment Strategies

3

Principal Risks

3

The Fund's Past Performance

4

Investment Adviser

5

Portfolio Manager

5

Purchase and Sale of Fund Shares

5

Taxes

5

Payments to Broker-Dealers and Other Financial Intermediaries

5

MORE ABOUT THE FUND

About the Fund's Investments

6

How the Fund is Managed

8

MORE ABOUT YOUR INVESTMENT

How to Buy and Sell Shares

9

Dividends, Capital Gains and Taxes

11

Financial Highlights

12


To Summary Prospectus

THE FUND SUMMARY

Investment Objective . The Fund seeks capital appreciation by investing in securities of well-known, established companies.

Fees and Expenses of the Fund. This table describes the fees and expenses that you may pay if you buy and hold or redeem shares of the Fund. The accompanying prospectus of the participating insurance company provides information on initial or contingent deferred sales charges, exchange fees or redemption fees for that variable life insurance policy, variable annuity or other investment product. The fees and expenses of those products are not charged by the Fund and are not reflected in this table. Expenses would be higher if those fees were included.

Shareholder Fees (fees paid directly from your investment)

Non-Service Shares

Service Shares

Maximum Sales Charge (Load) imposed on purchases (as % of offering price)

None

None

Maximum Deferred Sales Charge (Load) (as % of the lower of original offering price or redemption proceeds)

None

None


Annual Fund Operating Expenses (expenses that you pay each year as a percentage of the value of your investment)

Non-Service Shares

Service Shares

Management Fees

0.66%

0.66%

Distribution and/or Service (12b-1) Fees

None

0.25%

Other Expenses

0.13%

0.13%

Total Annual Fund Operating Expenses

0.79%

1.04%


Example. The following Example is intended to help you compare the cost of investing in the Fund with the cost of investing in other mutual funds. The Example assumes that you invest $10,000 in a class of shares of the Fund for the time periods indicated. The Example also assumes that your investment has a 5% return each year and that the Fund's operating expenses remain the same. Although your actual costs may be higher or lower, based on these assumptions your expenses would be as follows, whether or not you redeemed your shares:

Non-Service Shares $ 81 $ 253 $ 440 $ 982
Service Shares $ 107 $ 333 $ 577 $ 1,277


Portfolio Turnover. The Fund pays transaction costs, such as commissions, when it buys and sells securities (or "turns over" its portfolio). A higher portfolio turnover rate may indicate higher transaction costs. These costs, which are not reflected in the annual fund operating expenses or in the examples, affect the Fund's performance. During the most recent fiscal year, the Fund's portfolio turnover rate was 58% of the average value of its portfolio.

Principal Investment Strategies. The Fund mainly invests in common stocks of "growth companies." Growth companies are companies whose earnings and stock prices are expected to increase at a faster rate than the overall market. These may be newer companies or established companies of any capitalization range that the portfolio manager believes may appreciate in value over the long term. Currently, the Fund primarily focuses on established companies that are similar in size to companies in the S&P 500 Index or the Russell 1000 Growth Index. The Fund primarily invests in securities of U.S. issuers but may also invest in foreign securities. The portfolio manager looks for growth companies with stock prices that she believes are reasonable in relation to overall stock market valuations. In seeking broad diversification of the Fund's portfolio among industries and market sectors, the portfolio manager focuses on a number of factors that may vary in particular cases and over time. Currently, the portfolio manager looks for: 

  • companies in business areas that have above-average growth potential,
  • companies with growth rates that the portfolio manager believes are sustainable over time,
  • stocks with reasonable valuations relative to their growth potential.

The Fund may sell the stocks of companies that the portfolio manager believes no longer meet the above criteria, but is not required to do so.

Principal Risks. The price of the Fund's shares can go up and down substantially. The value of the Fund's investments may change because of broad changes in the markets in which the Fund invests or from poor security selection, which could cause the Fund to underperform other funds with similar investment objectives. There is no assurance that the Fund will achieve its investment objective. When you redeem your shares, they may be worth more or less than what you paid for them. These risks mean that you can lose money by investing in the Fund.

Main Risks of Investing in Stock. The value of the Fund's portfolio may be affected by changes in the stock markets. Stock markets may experience significant short-term volatility and may fall sharply at times. Different stock markets may behave differently from each other and U.S. stock markets may move in the opposite direction from one or more foreign stock markets.

The prices of individual stocks generally do not all move in the same direction at the same time and a variety of factors can affect the price of a particular company's stock. These factors may include, but are not limited to: poor earnings reports, a loss of customers, litigation against the company, general unfavorable performance of the company's sector or industry, or changes in government regulations affecting the company or its industry.

Because the Fund currently invests primarily in common stocks of U.S. companies, the value of the Fund's portfolio will mainly be affected by changes in the U.S. stock markets.

Main Risks of Growth Investing. If a growth company's earnings or stock price fails to increase as anticipated, or if its business plans do not produce the expected results, its securities may decline sharply. Growth companies may be newer or smaller companies that may experience greater stock price fluctuations and risks of loss than larger, more established companies. Newer growth companies tend to retain a large part of their earnings for research, development or investments in capital assets. Therefore, they may not pay any dividends for some time. Growth investing has gone in and out of favor during past market cycles and is likely to continue to do so. During periods when growth investing is out of favor or when markets are unstable, it may be more difficult to sell growth company securities at an acceptable price. Growth stocks may also be more volatile than other securities because of investor speculation.

Main Risks of Mid-Sized Companies. Mid-sized companies generally involve greater risk of loss than larger companies. The stock prices of mid-sized companies may be more volatile and their securities may be less liquid and more difficult to sell than those of larger companies. They may have less established markets, fewer customers and product lines, less management depth and more limited access to financial resources. Mid-sized companies may not pay dividends for some time, if at all.

Who Is The Fund Designed For? The Fund's shares are available only as an investment option under certain variable annuity contracts, variable life insurance policies and investment plans offered through insurance company separate accounts of participating insurance companies, for investors seeking capital appreciation in their investment over the long term, from investments in common stocks of well-known companies. Those investors should be willing to assume the risks of short-term share price fluctuations that are typical for a fund focusing on stocks. Because of its focus on long-term growth, the Fund may be more appropriate for investors with longer-term investment goals. The Fund is not designed for investors needing an assured level of current income. The Fund is not a complete investment program and may not be appropriate for all investors. You should carefully consider your own investment goals and risk tolerance before investing in the Fund.

An investment in the Fund is not a deposit of any bank and is not insured or guaranteed by the Federal Deposit Insurance Corporation or any other government agency.


The Fund's Past Performance. The bar chart and table below provide some indication of the risks of investing in the Fund by showing changes in the Fund's Non-Service Shares performance from year to year and by showing how the Fund's average annual returns for 1, 5, and 10 years compare with those of two broad measures of market performance that reflect the markets in which the Fund typically invests. Charges imposed by the insurance accounts that invest in the Fund are not included and the returns would be lower if they were. The Fund's past investment performance is not necessarily an indication of how the Fund will perform in the future. More recent performance information is available by calling the toll-free number on the back of this prospectus and on the Fund's website at: https://www.oppenheimerfunds.com/fund/investors/overview/CapitalAppreciationFundVA


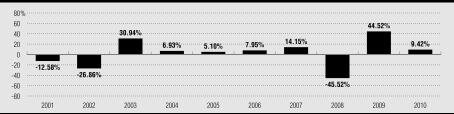
During the period shown, the highest return before taxes for a calendar quarter was 19.10% (2nd qtr 09) and the lowest return before taxes for a calendar quarter was -27.73% (4th qtr 08).


The following table shows the average annual total returns of each class of the Fund's shares before taxes. The Russell 1000 Growth Index is an unmanaged index of 1,000 U.S. large-cap growth stocks.

Average Annual Total Returns for the periods ended December 31, 2010

1 Year

5 Years

10 Years (or life of class, if less)

Non-Service Shares (inception 4-3-85)

9.42%


1.20%


(0.01%)


Service Shares (inception 9-18-01)

9.15%


0.95%


2.78%


S&P 500 Index

15.08%


2.29%


1.42%


(reflects no deduction for fees, expenses or taxes)


4.06% 1


Russell 1000 Growth Index

16.71%


3.75%


0.02%


(reflects no deduction for fees, expenses or taxes)


4.09% 1


1. From 09-30-01.


Investment Adviser. OppenheimerFunds, Inc. is the Fund's investment adviser (the "Manager").

Portfolio Manager. Julie Van Cleave, CFA, has been portfolio manager of the Fund since April 2010.

Purchase and Sale of Fund Shares. Shares of the Fund may be purchased only by separate investment accounts of participating insurance companies as an underlying investment for variable life insurance policies, variable annuity contracts or other investment products. Individual investors cannot buy shares of the Fund directly. You may only submit instructions for buying or selling shares of the Fund to your insurance company or its servicing agent, not directly to the Fund or its Transfer Agent. The accompanying prospectus of the participating insurance company provides information about how to select the Fund as an investment option.

Taxes. Because shares of the Fund may be purchased only through insurance company separate accounts for variable annuity contracts, variable life insurance policies or other investment products, any dividends and capital gains distributions will be taxable to the participating insurance company, if at all. However, those payments may affect the tax basis of certain types of distributions from those accounts. Special tax rules apply to life insurance companies, variable annuity contracts and variable life insurance contracts. For information on federal income taxation of a life insurance company with respect to its receipt of distributions from the Fund and federal income taxation of owners of variable annuity or variable life insurance contracts, see the accompanying prospectus for the applicable contract.

Payments to Broker-Dealers and Other Financial Intermediaries. The Fund, the Manager, or their related companies may make payments to financial intermediaries, including to insurance companies that offer shares of the Fund as an investment option. These payments for the sale of Fund shares and related services may create a conflict of interest by influencing the intermediary and your salesperson to recommend the Fund over another investment. Ask your salesperson or visit your financial intermediary's website for more information.

MORE ABOUT THE FUND

About the Fund's Investments

The allocation of the Fund's portfolio among different types of investments will vary over time and the Fund's portfolio might not always include all of the different types of investments described below. The Statement of Additional Information contains more detailed information about the Fund's investment policies and risks.

THE FUND'S PRINCIPAL INVESTMENT STRATEGIES AND RISKS. The following strategies and types of investments are the ones that the Fund considers to be the most important in seeking to achieve its investment objective and the following risks are those the Fund expects its portfolio to be subject to as a whole.

Common Stock. Common stock represents an ownership interest in a company. It ranks below preferred stock and debt securities in claims for dividends and in claims for assets of the issuer in a liquidation or bankruptcy. Common stocks may be exchange-traded or over-the-counter securities. Over-the-counter securities may be less liquid than exchange-traded securities.

     Growth stocks may be less liquid and more volatile than other stock investments. They may lose value if the company's business plans do not produce the expected results, or if growth investing falls out of favor with investors. Growth stocks may also be more volatile because of investor speculation.

Investing in Growth Companies. Growth companies are companies whose earnings and stock prices are expected to grow at a faster rate than the overall market. Growth companies can be new companies or established companies that may be entering a growth cycle in their business. Their anticipated growth may come from developing new products or services or from expanding into new or growing markets. Growth companies may be applying new technologies, new or improved distribution methods or new business models that could enable them to capture an important or dominant market position. They may have a special area of expertise or the ability to take advantage of changes in demographic or other factors in a more profitable way. Newer growth companies tend to retain a large part of their earnings for research, development or investments in capital assets. Although newer growth companies may not pay any dividends for some time, their stocks may be valued because of their potential for price increases. Current examples include companies in the fields of telecommunications, computer software, and new consumer products.


OTHER INVESTMENT STRATEGIES AND RISKS. The Fund can also use the investment techniques and strategies described below. The Fund might not use all of these techniques or strategies or might only use them from time to time.

Other Equity Securities.  In addition to common stocks, the Fund can invest in other equity or "equity equivalents" securities such as preferred stocks or convertible securities. Preferred stocks generally pay a dividend and rank ahead of common stocks and behind debt securities in claims for dividends and for assets of the issuer in a liquidation or bankruptcy. The dividend rate of preferred stocks may cause their prices to behave more like those of debt securities. A convertible security is one that can be converted into or exchanged for common stock of an issuer within a particular period of time at a specified price, upon the occurrence of certain events or according to a price formula. Convertible securities offer the Fund the ability to participate in stock market movements while also seeking some current income. Convertible debt securities pay interest and convertible preferred stocks pay dividends until they mature or are converted, exchanged or redeemed. The Fund considers some convertible securities to be "equity equivalents" because they are convertible into common stock. The credit ratings of those convertible securities generally have less impact on the investment decision, although they are still subject to credit and interest rate risk.

Risks of Foreign Investing. While foreign securities may offer special investment opportunities, they are also subject to special risks. Foreign issuers are usually not subject to the same accounting and disclosure requirements as U.S. companies are subject to, which may make it difficult to evaluate a foreign company's operations or financial condition. A change in value of a foreign currency against the U.S. dollar will result in a change in the U.S. dollar value of securities denominated in that foreign currency and of any income or distributions the Fund may receive on those securities. Additionally, the value of foreign investments may be affected by exchange control regulations, expropriation or nationalization of a company's assets, foreign taxes, higher transaction and other costs, delays in settlement of transactions, changes in economic or monetary policy in the U.S. or abroad, or other political and economic factors.

     Time-Zone Arbitrage. The Fund may invest in securities of foreign issuers that are traded in U.S. or foreign markets. If the Fund invests a significant amount of its assets in securities traded in foreign markets, it may be exposed to "time-zone arbitrage" attempts by investors seeking to take advantage of differences in the values of foreign securities that might result from events that occur after the close of the foreign securities market on which a security is traded and before the close of the New York Stock Exchange that day, when the Fund's net asset value is calculated. If such time-zone arbitrage were successful, it might dilute the interests of other shareholders. However, the Fund's use of "fair value pricing" under certain circumstances, to adjust the closing market prices of foreign securities to reflect what the Manager and the Board believe to be their fair value, may help deter those activities.

Derivative Investments. The Fund can invest in "derivative" instruments. A derivative is an instrument whose value depends on (or is derived from) the value of an underlying security, asset, interest rate, index or currency.  Derivatives may allow the Fund to increase or decrease its exposure to certain markets or risks.  

The Fund may use derivatives to seek to increase its investment return or for hedging purposes. The Fund is not required to use derivatives in seeking its investment objective or for hedging and might not do so.

       Options, futures, options on futures, swaps and forward contracts are some of the derivatives that the Fund may use. The Fund may also use other types of derivatives that are consistent with its investment strategies or hedging purposes.

Hedging.  Hedging transactions are intended to reduce the risks of securities in the Fund's portfolio. If the Fund uses a hedging instrument at the wrong time or judges market conditions incorrectly, however, the hedge might be unsuccessful or could reduce the Fund's return or create a loss. The Fund has percentage limits on its use of derivatives and hedging instruments.

 Risks of Derivative Investments. Derivatives may be volatile and may involve significant risks. The underlying security, obligor or other instrument on which a derivative is based, or the derivative itself, may not perform the way the Manager expects it to. The Fund may lose money on a derivative investment if the issuer or counterparty fails to pay the amount due. Certain derivative investments held by the Fund may be illiquid, making it difficult to close out an unfavorable position. Derivative transactions may require the payment of premiums and can increase portfolio turnover. As a result, the Fund could realize little or no income or lose principal from the investment, or a hedge might be unsuccessful. For some derivatives, it is possible for the Fund to lose more than the amount invested in the derivative instrument. Some derivatives have the potential for unlimited loss, regardless of the size of the Fund's initial investment.

Illiquid and Restricted Securities. Investments that do not have an active trading market, or that have legal or contractual limitations on their resale, are generally referred to as "illiquid" securities. Illiquid securities may be difficult to value or to sell promptly at an acceptable price or may require registration under applicable securities laws before they can be sold publicly. Securities that have limitations on their resale are referred to as "restricted securities." Certain restricted securities that are eligible for resale to qualified institutional purchasers may not be regarded as illiquid.

     The Fund will not invest more than 15% of its net assets in illiquid securities.  The Manager monitors the Fund's holdings of illiquid securities on an ongoing basis to determine whether to sell any of those securities to maintain adequate liquidity.

Conflicts of Interest. The investment activities of the Manager and its affiliates in regard to other funds and accounts they manage may present conflicts of interest that could disadvantage the Fund and its shareholders. The Manager or its affiliates may provide investment advisory services to other funds and accounts that have investment objectives or strategies that differ from, or are contrary to, those of the Fund. That may result in another fund or account holding investment positions that are adverse to the Fund's investment strategies or activities. Other funds or accounts advised by the Manager or its affiliates may have conflicting interests arising from investment objectives that are similar to those of the Fund. Those funds and accounts may engage in, and compete for, the same types of securities or other investments as the Fund or invest in securities of the same issuers that have different, and possibly conflicting, characteristics. The trading and other investment activities of those other funds or accounts may be carried out without regard to the investment activities of the Fund and, as a result, the value of securities held by the Fund or the Fund's investment strategies may be adversely affected. The Fund's investment performance will usually differ from the performance of other accounts advised by the Manager or its affiliates and the Fund may experience losses during periods in which other accounts advised by the Manager or its affiliates achieve gains. The Manager has adopted policies and procedures designed to address potential conflicts of interest identified by the Manager; however, such policies and procedures may also limit the Fund's investment activities and affect its performance.

     The Fund offers its shares to separate accounts of different insurance companies, as an investment for their variable annuity, variable life and other investment product contracts. While the Fund does not foresee any disadvantages to contract owners from these arrangements, it is possible that the interests of owners of different contracts participating in the Fund through different separate accounts might conflict. For example, a conflict could arise because of differences in tax treatment.

Special Portfolio Diversification Requirements. To enable a variable annuity or variable life insurance contract based on an insurance company separate account to qualify for favorable tax treatment under the Internal Revenue Code, the underlying investments must follow special diversification requirements that limit the percentage of assets that can be invested in securities of particular issuers. The Fund's investment program is managed to meet those requirements, in addition to other diversification requirements under the Internal Revenue Code and the Investment Company Act of 1940 that apply to publicly-sold mutual funds.

Failure by the Fund to meet those special requirements could cause earnings on a contract owner's interest in an insurance company separate account to be taxable income. Those diversification requirements might also limit, to some degree, the Fund's investment decisions in a way that could reduce its performance.

Investments in Oppenheimer Institutional Money Market Fund. The Fund can invest its free cash balances in Class E shares of Oppenheimer Institutional Money Market Fund to provide liquidity or for defensive purposes. The Fund invests in Oppenheimer Institutional Money Market Fund, rather than purchasing individual short-term investments, to seek a higher yield than it could obtain on its own. Oppenheimer Institutional Money Market Fund is a registered open-end management investment company, regulated as a money market fund under the Investment Company Act of 1940, and is part of the Oppenheimer family of funds. It invests in a variety of short-term, high-quality, dollar-denominated money market instruments issued by the U.S. Government, domestic and foreign corporations, other financial institutions, and other entities. Those investments may have a higher rate of return than the investments that would be available to the Fund directly. At the time of an investment, the Fund cannot always predict what the yield of the Oppenheimer Institutional Money Market Fund will be because of the wide variety of instruments that fund holds in its portfolio. The return on those investments may, in some cases, be lower than the return that would have been derived from other types of investments that would provide liquidity. As a shareholder, the Fund will be subject to its proportional share of the expenses of Oppenheimer Institutional Money Market Fund's Class E shares, including its advisory fee. However, the Manager will waive a portion of the Fund's advisory fee to the extent of the Fund's share of the advisory fee paid to the Manager by Oppenheimer Institutional Money Market Fund.

Temporary Defensive and Interim Investments. For temporary defensive purposes in times of adverse or unstable market, economic or political conditions, the Fund can invest up to 100% of its total assets in investments that may be inconsistent with the Fund's principal investment strategies. Generally, the Fund would invest in shares of Oppenheimer Institutional Money Market Fund or in the types of money market instruments in which Oppenheimer Institutional Money Market Fund invests or in other short-term U.S. Government securities. The Fund might also hold these types of securities as interim investments pending the investment of proceeds from the sale of Fund shares or the sale of Fund portfolio securities or to meet anticipated redemptions of Fund shares. To the extent the Fund invests in these securities, it might not achieve its investment objective.

Portfolio Turnover . A change in the securities held by the Fund is known as "portfolio turnover." The Fund may engage in active and frequent trading to try to achieve its investment objective and may have a portfolio turnover rate of over 100% annually. Increased portfolio turnover may result in higher brokerage fees or other transaction costs, which can reduce performance. The Financial Highlights table at the end of this prospectus shows the Fund's portfolio turnover rates during past fiscal years.

CHANGES TO THE FUND'S INVESTMENT POLICIES. The Fund's fundamental investment policies cannot be changed without the approval of a majority of the Fund's outstanding voting shares; however, the Fund's Board can change non-fundamental policies without a shareholder vote. Significant policy changes will be described in supplements to this prospectus. The Fund's investment objective is a fundamental policy. Other investment restrictions that are fundamental policies are listed in the Fund's Statement of Additional Information. An investment policy is not fundamental unless this prospectus or the Statement of Additional Information states that it is.

PORTFOLIO HOLDINGS.   The Fund's portfolio holdings are included in its semi-annual and annual reports that are distributed to its shareholders within 60 days after the close of the applicable reporting period. The Fund also discloses its portfolio holdings in its Statements of Investments on Form N-Q, which are public filings that are required to be made with the Securities and Exchange Commission within 60 days after the end of the Fund's first and third fiscal quarters. Therefore, the Fund's portfolio holdings are made publicly available no later than 60 days after the end of each of its fiscal quarters. In addition, the Fund's portfolio holdings information, as of the end of each calendar month, may be posted and available on the Fund's website no sooner than 30 days after the end of each calendar month.    

A description of the Fund's policies and procedures with respect to the disclosure of its portfolio holdings is available in the Fund's Statement of Additional Information.

How the Fund is Managed

THE MANAGER. OppenheimerFunds, Inc., the Manager, chooses the Fund's investments and handles its day-to-day business. The Manager carries out its duties, subject to the policies established by the Fund's Board of Trustees, under an investment advisory agreement that states the Manager's responsibilities. The agreement sets the fees the Fund pays to the Manager and describes the expenses that the Fund is responsible to pay to conduct its business.

The Manager has been an investment adviser since 1960. The Manager is located at Two World Financial Center, 225 Liberty Street, 11th Floor, New York, New York 10281-1008.

Advisory Fees.  Under the investment advisory agreement, the Fund pays the Manager an advisory fee at an annual rate that declines on additional assets as the Fund grows: 0.75% of the first $200 million of average annual net assets, 0.72% of the next $200 million, 0.69% of the next $200 million, 0.66% of the next $200 million, and 0.60% of average annual net assets over $800 million. The Fund's management fee for its fiscal year ended December 31, 2010, was 0.66% of the Fund's average annual net assets for each class of shares.

The Manager has voluntarily agreed to limit the Fund's total annual operating expenses so that those expenses, as percentages of daily net assets, will not exceed the annual rate of 0.80% for Non-Service shares and 1.05% for Service shares. The Manager has also voluntarily agreed to waive fees and/or reimburse Fund expenses in an amount equal to the indirect management fees incurred through the Fund's investment in Oppenheimer Institutional Money Market Fund. During the fiscal year ended December 31, 2010, the amounts waived as a result of the voluntary expense limitation and waiver and/or reimbursement did not exceed 0.01% and therefore are not reflected in the Annual Fund Operating Expenses table shown earlier in this prospectus. Both the voluntary expense limitation and waiver and/or reimbursement may be amended or withdrawn at any time. Actual total annual operating expenses for the fiscal year ended December 31, 2010 were those shown in the Annual Fund Operating Expenses table earlier in this prospectus. The Fund's management fee and other annual operating expenses may vary in future years.

A discussion regarding the basis for the Board of Trustees' approval of the Fund's investment advisory contract is available in the Fund's Annual Report to shareholders for the year ended December 31, 2010.

The Portfolio Manager. The Fund's portfolio is managed by Julie Van Cleave, CFA, who is primarily responsible for the day-to-day management of the Fund's investments.

Ms. Van Cleave has been a Vice President and Senior Portfolio Manager of the Manager since April 2010. Prior to joining the Manager, she was Managing Director, U.S. Large-Cap Growth Equity, and lead portfolio manager at Deutsche Asset Management from December 2002 to February 2009. Prior to 2002, Ms. Van Cleave was a Managing Director, a portfolio manager and a team leader with Mason Street Advisors, a wholly owned subsidiary of Northwestern Mutual Life.

The Statement of Additional Information provides additional information about the portfolio manager's compensation, other accounts she manages and her ownership of Fund shares.

MORE ABOUT YOUR INVESTMENT

How to Buy and Sell Shares

You may only submit instructions for buying or selling shares of the Fund to your insurance company or its servicing agent, not directly to the Fund or its Transfer Agent. Information about your investment in the Fund can only be obtained from your participating insurance company or its servicing agent. The Fund's Transfer Agent does not hold or have access to those records.

WHAT CLASSES OF SHARES DOES THE FUND OFFER? The Fund currently offers two different classes of shares. The different classes of shares represent investments in the same portfolio of securities, but the classes are subject to different expenses and will usually have different share prices. The Service Shares are subject to a distribution and service plan. The expenses of that plan are described below. The Non-Service Shares are not subject to a service and distribution plan.

THE PRICE OF FUND SHARES. Fund shares are sold to participating insurance companies at their net asset value per share. The net asset value that applies to a purchase order is the next one calculated after the insurance company (as the Fund's designated agent to receive purchase orders) receives the order from its contract owner, in proper form. Fund shares are redeemed at the next net asset value calculated after the insurance company (as the Fund's designated agent to receive purchase orders) receives the order from its contract owner, in proper form. The Fund's Transfer Agent generally must receive the purchase or redemption order from the insurance company by 9:30 a.m. Eastern Time on the next regular business day.

The Fund does not impose any sales charge on purchases of its shares. If there are any charges imposed under the variable annuity, variable life or other contract through which Fund shares are purchased, they are described in the accompanying prospectus of the participating insurance company. The participating insurance company's prospectus may also include information regarding the time you must submit your purchase and redemption orders.

Net Asset Value. The Fund calculates the net asset value of each class of shares as of the close of the New York Stock Exchange (NYSE), on each day the NYSE is open for trading (referred to in this prospectus as a "regular business day"). The NYSE normally closes at 4:00 p.m., Eastern Time, but may close earlier on some days.

The Fund determines the net assets of each class of shares by subtracting the class-specific expenses and the amount of the Fund's liabilities attributable to the share class from the market value of the Fund's securities and other assets attributable to the share class. The Fund's "other assets" might include, for example, cash and interest or dividends from its portfolio securities that have been accrued but not yet collected. The Fund's securities are valued primarily on the basis of current market quotations.

The net asset value per share for each share class is determined by dividing the net assets of the class by the number of outstanding shares of that class.

     Fair Value Pricing. If market quotations are not readily available or (in the Manager's judgment) do not accurately reflect the fair value of a security, or if after the close of the principal market on which a security held by the Fund is traded and before the time as of which the Fund's net asset value is calculated that day, an event occurs that the Manager learns of and believes in the exercise of its judgment will cause a material change in the value of that security from the closing price of the security on the principal market on which it is traded, that security may be valued by another method that the Board believes would more accurately reflect the security's fair value.

In determining whether current market prices are readily available and reliable, the Manager monitors the information it receives in the ordinary course of its investment management responsibilities. It seeks to identify significant events that it believes, in good faith, will affect the market prices of the securities held by the Fund. Those may include events affecting specific issuers (for example, a halt in trading of the securities of an issuer on an exchange during the trading day) or events affecting securities markets (for example, a foreign securities market closes early because of a natural disaster). The Board has adopted valuation procedures for the Fund and has delegated the day-to-day responsibility for fair value determinations to the Manager's "Valuation Committee." Those determinations may include consideration of recent transactions in comparable securities, information relating to the specific security, developments in the markets and their performance, and current valuations of foreign or U.S. indices. Fair value determinations by the Manager are subject to review, approval and ratification by the Board at its next scheduled meeting after the fair valuations are determined.

The Fund's use of fair value pricing procedures involves subjective judgments and it is possible that the fair value determined for a security may be materially different from the value that could be realized upon the sale of that security. Accordingly, there can be no assurance that the Fund could obtain the fair value assigned to a security if it were to sell the security at approximately the same time at which the Fund determines its net asset value per share.

     Pricing Foreign Securities . The Fund may use fair value pricing more frequently for securities primarily traded on foreign exchanges. Because many foreign markets close hours before the Fund values its foreign portfolio holdings, significant events, including broad market movements, may occur during that time that could potentially affect the values of foreign securities held by the Fund.

The Manager believes that foreign securities values may be affected by volatility that occurs in U.S. markets after the close of foreign securities markets. The Manager's fair valuation procedures therefore include a procedure whereby foreign securities prices may be "fair valued" to take those factors into account.

Because some foreign securities trade in markets and on exchanges that operate on weekends and U.S. holidays, the values of some of the Fund's foreign investments may change on days when investors cannot buy or redeem Fund shares.

HOW CAN YOU BUY FUND SHARES? Shares of the Fund may be purchased only by separate investment accounts of participating insurance companies as an underlying investment for variable life insurance policies, variable annuity contracts or other investment products. Individual investors cannot buy shares of the Fund directly. Please refer to the accompanying prospectus of the participating insurance company for information on how to select the Fund as an investment option. That prospectus will indicate which share class you may be eligible to purchase.

Suspension of Share Offering. The offering of Fund shares may be suspended during any period in which the determination of net asset value is suspended, and may be suspended by the Board at any time the Board believes it is in the Fund's best interest to do so.

HOW CAN YOU REDEEM FUND SHARES? Only the participating insurance companies that hold Fund shares in their separate accounts can place orders to redeem shares. Contract holders and policy holders should not directly contact the Fund or its transfer agent to request a redemption of Fund shares. The Fund normally sends payment by Federal Funds wire to the insurance company's account on the next business day after the Fund receives the order (and no later than seven days after the Fund's receipt of the order). Under unusual circumstances determined by the Securities and Exchange Commission, payment may be delayed or suspended. Contract owners should refer to the withdrawal or surrender instructions in the accompanying prospectus of the participating insurance company.

Limitations on Frequent Transactions

Frequent purchases and redemptions of Fund shares may interfere with the Manager's ability to manage the Fund's investments efficiently, may increase its transaction and administrative costs and may affect its performance, depending on various factors, such as the size of the Fund, the nature of its investments, the amount of Fund assets the portfolio manager maintains in cash or cash equivalents, and the aggregate dollar amount, the number and the frequency of trades.

If large dollar amounts are involved in frequent redemption transactions, the Fund might be required to sell portfolio securities at unfavorable times to meet those transaction requests, and the Fund's brokerage or administrative expenses might be increased. Therefore, the Manager and the Fund's Board have adopted the following policies and procedures to detect and prevent frequent and/or excessive purchase and redemption activity, while addressing the needs of investors who seek liquidity in their investment. There is no guarantee that those policies and procedures, described below, will be sufficient to identify and deter all excessive short-term trading. If the Transfer Agent is not able to detect and curtail such activity, frequent trading could occur in the Fund.

Policies on Disruptive Activity

The Transfer Agent and the Distributor, on behalf of the Fund, have entered into agreements with participating insurance companies designed to detect and restrict excessive short-term trading activity by contract or policy owners or their financial advisers in their accounts. The Transfer Agent generally does not consider periodic asset allocation or re-balancing that affects a portion of the Fund shares held in the account of a policy or contract owner to be "excessive trading." However, the Transfer Agent has advised participating insurance companies that it generally considers certain other types of trading activity to be "excessive," such as making a "transfer" out of the Fund within 30 days after buying Fund shares (by the sale of the recently purchased Fund shares and the purchase of shares of another fund) or making more than six "round-trip transfers" between funds during one year. The agreements require participating insurance companies to provide transaction information to the Fund and to execute Fund instructions to restrict trading in Fund shares.

 A participating insurance company may also have its own policies and procedures and may impose its own restrictions or limitations to discourage short-term and/or excessive trading by its policy or contract owners. Those policies and procedures may be different from the Fund's in certain respects. You should refer to the prospectus for your insurance company variable annuity contract for specific information about the insurance company's policies. Under certain circumstances, policy or contract owners may be required to transmit purchase or redemption orders only by first class U.S. mail.

Monitoring the Policies. The Fund's policies and procedures for detecting and deterring frequent or excessive trading are administered by the Fund's Transfer Agent. However, the Transfer Agent presently does not have the ability to directly monitor trading activity in the accounts of policy or contract owners within the participating insurance companies' accounts. The Transfer Agent's ability to monitor and deter excessive short-term trading in such insurance company accounts ultimately depends on the capability and diligence of each participating insurance company, under their agreements with the Transfer Agent, the Distributor and the Fund, in monitoring and controlling the trading activity of the policy or contract owners in the insurance company's accounts.

The Transfer Agent will attempt to monitor the net effect on the Fund's assets from the purchase and redemption activity in the accounts of participating insurance companies and will seek to identify patterns that may suggest excessive trading by the contract or policy owners who invest in the insurance company's accounts. If the Transfer Agent believes it has observed evidence of possible excessive trading activity, it will ask the participating insurance companies or other registered owners to provide information about the transaction activity of the contract or policy holders in their respective accounts, and to take appropriate action. In that case, the insurance company must confirm to the Transfer Agent that appropriate action has been taken to curtail the excessive trading activity.

The Transfer Agent will, subject to the limitations described in this section, limit or terminate the trading activity of any person, group or account that it believes would be excessive or disruptive. However, the Transfer Agent may not be able to detect or curtail all such trading activity in the Fund. The Transfer Agent will evaluate trading activity on a case by case basis and the limitations placed on trading may vary between accounts.

Right to Refuse Purchase Orders. The Fund's Distributor or Transfer Agent may, in their discretion, refuse any purchase order and are not obligated to provide notice before rejecting an order.  

DISTRIBUTION AND SERVICE (12b-1) PLANS

Distribution and Service Plan for Service Shares. The Fund has adopted a Distribution and Service Plan for Service Shares to pay the Distributor for distribution related services, personal services and account maintenance for those shares. Under the Plan, the Fund pays the Distributor quarterly at an annual rate of up to 0.25% of the daily net assets of the Fund's Service Shares. Because these fees are paid out of the Fund's assets on an on-going basis, over time they will increase the operating expenses of the Service Shares and may cost you more than other types of fees or sales charges. As a result, the Service Shares may have lower performance compared to the Fund's shares that are not subject to a service fee.

     Use of Plan Fees: The Distributor currently uses all of those fees to compensate sponsor(s) of the insurance product for providing personal services and account maintenance for variable contract owners that hold Service Shares.

PAYMENTS TO FINANCIAL INTERMEDIARIES AND SERVICE PROVIDERS. The Manager and the Distributor, in their discretion, may also make payments for distribution and/or shareholder servicing activities to brokers, dealers and other financial intermediaries, including the insurance companies that offer the Fund as an investment option, or to service providers. Those payments are made out of the Manager's and/or the Distributor's own resources and/or assets, including from the revenues or profits derived from the advisory fees the Manager receives from the Fund. Those cash payments, which may be substantial, are paid to many firms having business relationships with the Manager and Distributor and are in addition to any distribution fees, servicing fees, or transfer agency fees paid directly or indirectly by the Fund to those entities. Payments by the Manager or Distributor from their own resources are not reflected in the tables in the "Fees and Expenses of the Fund" section of this prospectus because they are not paid by the Fund.

The financial intermediaries that may receive those payments include firms that offer and sell Fund shares to their clients, or provide shareholder services to the Fund, or both, and receive compensation for those activities. The financial intermediaries that may receive payments include securities brokers, dealers, financial advisers, insurance companies that offer variable annuity or variable life insurance products and other intermediaries.

In general, these payments to financial intermediaries can be categorized as "distribution-related" or "servicing" payments. Payments for distribution-related expenses, such as marketing or promotional expenses, are often referred to as "revenue sharing." Revenue sharing payments may be made on the basis of the sales of shares attributable to that intermediary, the average net assets of the Fund and other Oppenheimer funds attributable to the accounts of that intermediary and its clients, negotiated lump sum payments for distribution services provided, or similar fees. In some circumstances, revenue sharing payments may create an incentive for a financial intermediary or its representatives to recommend or offer shares of the Fund or other Oppenheimer funds to its customers. These payments also may give an intermediary an incentive to cooperate with the Distributor's marketing efforts. A revenue sharing payment may, for example, qualify the Fund for preferred status with the intermediary receiving the payment or provide representatives of the Distributor with access to representatives of the intermediary's sales force, in some cases on a preferential basis over funds of competitors. Additionally, as firm support, the Manager or Distributor may reimburse expenses related to educational seminars and "due diligence" or training meetings (to the extent permitted by applicable laws or the rules of the Financial Industry Regulatory Authority ("FINRA")) designed to increase sales representatives' awareness about Oppenheimer funds, including travel and lodging expenditures. However, the Manager does not consider a financial intermediary's sale of shares of the Fund or other Oppenheimer funds when selecting brokers or dealers to effect portfolio transactions for the funds.

Various factors are used to determine whether to make revenue sharing payments. Possible considerations include, without limitation, the types of services provided by the intermediary, sales of Fund shares, the redemption rates on accounts of clients of the intermediary or overall asset levels of Oppenheimer funds held for or by clients of the intermediary, the willingness of the intermediary to allow the Distributor to provide educational and training support for the intermediary's sales personnel relating to the Oppenheimer funds, the availability of the Oppenheimer funds on the intermediary's sales system, as well as the overall quality of the services provided by the intermediary and the Manager or Distributor's relationship with the intermediary. The Manager and Distributor have adopted guidelines for assessing and implementing each prospective revenue sharing arrangement. To the extent that financial intermediaries receiving distribution-related payments from the Manager or Distributor sell more shares of the Oppenheimer funds or retain more shares of the funds in their client accounts, the Manager and Distributor benefit from the incremental management and other fees they receive with respect to those assets.

Payments may also be made by the Manager, the Distributor or the Transfer Agent to financial intermediaries to compensate or reimburse them for administrative or other client services provided such as sub-transfer agency services for shareholders, omnibus accounting or sub-accounting, participation in networking arrangements, account set-up, recordkeeping and other shareholder services. Payments may also be made for administrative services related to the distribution of Fund shares through the intermediary. Firms that may receive servicing fees include insurance companies that offer variable annuity or variable life insurance products and others. These fees may be used by the service provider to offset or reduce fees that would otherwise be paid directly to them by certain account holders. The Statement of Additional Information contains more information about revenue sharing and service payments made by the Manager or the Distributor. Your broker, dealer or other financial intermediary may charge you fees or commissions in addition to those disclosed in this prospectus. You should ask your financial intermediary for details about any such payments it receives from the Manager or the Distributor and their affiliates, or any other fees or expenses it charges.

Dividends, Capital Gains and Taxes

DIVIDENDS AND DISTRIBUTIONS. The Fund intends to declare and pay dividends annually from any net investment income. The Fund may also realize capital gains on the sale of portfolio securities, in which case it may make distributions out of any net short-term or long-term capital gains annually. The Fund may also make supplemental distributions of dividends and capital gains following the end of its fiscal year. The Fund has no fixed dividend rate and cannot guarantee that it will pay any dividends or capital gains distributions in a particular year.

Dividends and distributions are paid separately for each share class. Because of the higher expenses on Service Shares, the dividends and capital gains distributions paid on those shares will generally be lower than for other Fund shares.

Receiving Dividends and Distributions. Any dividends and capital gains distributions will be automatically reinvested in additional Fund shares for the account of the participating insurance company, unless the insurance company elects to have dividends or distributions paid in cash.

TAXES. For a discussion of the tax status of a variable annuity contract, a variable life insurance policy or other investment product of a participating insurance company, please refer to the accompanying variable contract prospectus of your participating insurance company. Because shares of the Fund may be purchased only through insurance company separate accounts for variable annuity contracts, variable life insurance policies or other investment products, any dividends from net investment income and distributions of net realized short-term and long-term capital gains will be taxable, if at all, to the participating insurance company. However, those payments may affect the tax basis of certain types of distributions from those accounts.

The Fund has qualified and intends to qualify each year to be taxed as a regulated investment company under the Internal Revenue Code by satisfying certain income, asset diversification and income distribution requirements, but reserves the right not to so qualify. In each year that it qualifies as a regulated investment company, the Fund will not be subject to federal income taxes on its income that it distributes to shareholders.

This information is only a summary of certain Federal income tax information about your investment. You are encouraged to consult your tax adviser about the effect of an investment in the Fund on your particular tax situation and about any changes to the Internal Revenue Code that may occur from time to time. Additional information about the tax effects of investing in the Fund is contained in the Statement of Additional Information.

Financial Highlights

The Financial Highlights Table is presented to help you understand the Fund's financial performance for the past five fiscal years. Certain information reflects financial results for a single Fund share. The total returns in the table represent the rate that an investor would have earned (or lost) on an investment in the Fund (assuming reinvestment of all dividends and distributions). This information has been audited by KPMG LLP, the Fund's independent registered public accounting firm for the fiscal years ended December 31, 2010 and 2009. The financial highlights for the prior years were audited by another independent registered public accounting firm. KPMG's report, along with the Fund's financial statements, are included in the Statement of Additional Information, which is available upon request.

Financial Highlights Table

FINANCIAL HIGHLIGHTS

Non-Service Shares      Year Ended December 31,

2010


2009


2008


2007


2006


Per Share Operating Data


Net asset value, beginning of period

$36.94


$25.67


$47.18


$41.43


$38.52


Income (loss) from investment operations:


Net investment income1

.11


.09


.10


.07


.07


Net realized and unrealized gain (loss)

3.36


11.27


(21.55)


5.78


2.98


Total from investment operations

3.47


11.36


(21.45)


5.85


3.05


Dividends and/or distributions to shareholders:


Dividends from net investment income

(.06)


(.09)


(.06)


(.10)


(.14)


Net asset value, end of period

$40.35


$36.94


$25.67


$47.18


$41.43


Total Return, at Net Asset Value2

9.42%


44.52%


(45.52)%


14.15%


7.95%


Ratios/Supplemental Data


Net assets, end of period (in thousands)

$771,086


$1,074,190


$ 829,931


$1,631,791


$1,598,967


Average net assets (in thousands)

$976,242


$ 927,670


$1,256,525


$1,631,686


$1,615,352


Ratios to average net assets:3


Net investment income

0.31%


0.29%


0.25%


0.15%


0.17%


Total expenses4

0.79%


0.78%


0.66%


0.65%


0.67%


Expenses after payments, waivers and/or reimbursements and reduction to custodian expenses

0.79%


0.78%


0.66%


0.65%


0.67%


Portfolio turnover rate

58%


46%


67%


59%


47%


1. Per share amounts calculated based on the average shares outstanding during the period.

2. Assumes an initial investment on the business day before the first day of the fiscal period, with all dividends and distributions reinvested in additional shares on the reinvestment date, and redemption at the net asset value calculated on the last business day of the fiscal period. Total returns are not annualized for periods less than one full year. Total return information does not reflect expenses that apply at the separate account level or to related insurance products. Inclusion of these charges would reduce the total return figures for all periods shown. Returns do not reflect the deduction of taxes that a shareholder would pay on fund distributions or the redemption of fund shares.

3. Annualized for periods less than one full year.

4. Total expenses including indirect expenses from affiliated fund were as follows:

Year Ended December 31, 2010

0.79%

Year Ended December 31, 2009

0.78%

Year Ended December 31, 2008

0.66%

Year Ended December 31, 2007

0.65%

Year Ended December 31, 2006

0.67%


Service Shares      Year Ended December 31,

2010


2009


2008


2007


2006


Per Share Operating Data


Net asset value, beginning of period

$36.64


$25.42


$46.78


$41.09


$38.23


Income (loss) from investment operations:


Net investment income (loss)1

.02


.01


-- 2


(.05)


(.03)


Net realized and unrealized gain (loss)

3.33


11.21


(21.36)


5.74


2.96


Total from investment operations

3.35


11.22


(21.36)


5.69


2.93


Dividends and/or distributions to shareholders:


Dividends from net investment income

--


-- 2


--


-- 2


(.07)


Net asset value, end of period

$39.99


$36.64


$25.42


$46.78


$41.09


Total Return, at Net Asset Value3

9.15%


44.15%


(45.66)%


13.86%


7.68%


Ratios/Supplemental Data


Net assets, end of period (in thousands)

$423,989


$444,170


$313,931


$546,887


$463,140


Average net assets (in thousands)

$427,640


$368,634


$454,558


$510,874


$426,539


Ratios to average net assets:4


Net investment income (loss)

0.06%


0.03%


0.00%5


(0.10)%


(0.08)%


Total expenses6

1.04%


1.04%


0.91%


0.91%


0.92%


Expenses after payments, waivers and/or reimbursements and reduction to custodian expenses

1.04%


1.03%


0.91%


0.91%


0.92%


Portfolio turnover rate

58%


46%


67%


59%


47%


1. Per share amounts calculated based on the average shares outstanding during the period.

2. Less than $0.005 per share.

3. Assumes an initial investment on the business day before the first day of the fiscal period, with all dividends and distributions reinvested in additional shares on the reinvestment date, and redemption at the net asset value calculated on the last business day of the fiscal period. Total returns are not annualized for periods less than one full year. Total return information does not reflect expenses that apply at the separate account level or to related insurance products. Inclusion of these charges would reduce the total return figures for all periods shown. Returns do not reflect the deduction of taxes that a shareholder would pay on fund distributions or the redemption of fund shares.

4. Annualized for periods less than one full year.

5. Less than 0.005%.

6. Total expenses including indirect expenses from affiliated fund were as follows:

Year Ended December 31, 2010

1.04%

Year Ended December 31, 2009

1.04%

Year Ended December 31, 2008

0.91%

Year Ended December 31, 2007

0.91%

Year Ended December 31, 2006

0.92%


INFORMATION AND SERVICES

STATEMENT OF ADDITIONAL INFORMATION. This document includes additional information about the Fund's investment policies, risks, and operations. It is incorporated by reference into this prospectus (it is legally part of this prospectus).

ANNUAL AND SEMI-ANNUAL REPORTS. The Fund's Annual and Semi-Annual Reports provide additional information about the Fund's investments and performance. The Annual Report includes a discussion of market conditions and investment strategies that significantly affected the Fund's performance during its last fiscal year.

How to Request More Information

You can request the above documents, the notice explaining the Fund's privacy policy, and other information about the Fund, without charge, by:

Telephone:

Call OppenheimerFunds Services toll-free: 1.800.988.8287

Mail:

Use the following address for regular mail:
OppenheimerFunds Services
P.O. Box 5270
Denver, Colorado 80217-5270

Use the following address for courier or express mail:
OppenheimerFunds Services
12100 East Iliff Avenue
Suite 300
Aurora, Colorado 80014

Internet:

You can read or download the Fund's Statement of Additional Information, Annual and Semi-Annual Reports on the OppenheimerFunds website at: www.oppenheimerfunds.com


Information about the Fund including the Statement of Additional Information can be reviewed and copied at the SEC's Public Reference Room in Washington, D.C. Information on the operation of the Public Reference Room may be obtained by calling the SEC at 1.202.551.8090. Reports and other information about the Fund are available on the EDGAR database on the SEC's website at www.sec.gov. Copies may be obtained after payment of a duplicating fee by electronic request at the SEC's e-mail address: publicinfo@sec.gov or by writing to the SEC's Public Reference Section, Washington, D.C. 20549-1520.

No one has been authorized to provide any information about the Fund or to make any representations about the Fund other than what is contained in this prospectus. This prospectus is not an offer to sell shares of the Fund, nor a solicitation of an offer to buy shares of the Fund, to any person in any state or other jurisdiction where it is unlawful to make such an offer.


The Fund's SEC File No.: 811-04108
SP0610.001.0411


OPPENHEIMER
Core Bond Fund/VA

A Series of Oppenheimer Variable Account Funds

Share Classes:

Non-Service Shares

Service Shares

Prospectus dated April 29, 2011

Oppenheimer Core Bond Fund/VA is a mutual fund whose main objective is to seek a high level of current income. As a secondary objective, the Fund seeks capital appreciation when consistent with its primary objective.

Shares of the Fund are sold only as an underlying investment for variable life insurance policies, variable annuity contracts and other insurance company separate accounts. A prospectus for the insurance product you have selected accompanies this prospectus and explains how to select shares of the Fund as an investment under that insurance product, and which share class or classes you are eligible to purchase.

This prospectus contains important information about the Fund's objective, investment policies, strategies and risks. Please read this prospectus (and your insurance product prospectus) carefully before you invest and keep them for future reference about your account.

As with all mutual funds, the Securities and Exchange Commission has not approved or disapproved the Fund's securities nor has it determined that this prospectus is accurate or complete. It is a criminal offense to represent otherwise.


Oppenheimer Core Bond Fund/VA 


Table of contents

THE FUND SUMMARY

Investment Objective

3

Fees and Expenses of the Fund

3

Principal Investment Strategies

3

Principal Risks

4

The Fund's Past Performance

5

Investment Adviser

5

Portfolio Managers

5

Purchase and Sale of Fund Shares

5

Taxes

6

Payments to Broker-Dealers and Other Financial Intermediaries

6

MORE ABOUT THE FUND

About the Fund's Investments

7

How the Fund is Managed

12

MORE ABOUT YOUR INVESTMENT

How to Buy and Sell Shares

13

Dividends, Capital Gains and Taxes

15

Financial Highlights

16


To Summary Prospectus

THE FUND SUMMARY

Investment Objective. The Fund's main objective is to seek a high level of current income. As a secondary objective, the Fund seeks capital appreciation when consistent with its primary objective.

Fees and Expenses of the Fund. This table describes the fees and expenses that you may pay if you buy and hold or redeem shares of the Fund. The accompanying prospectus of the participating insurance company provides information on initial or contingent deferred sales charges, exchange fees or redemption fees for that variable life insurance policy, variable annuity or other investment product. The fees and expenses of those products are not charged by the Fund and are not reflected in this table. Expenses would be higher if those fees were included.

Shareholder Fees (fees paid directly from your investment)

Non-Service Shares

Service Shares

Maximum Sales Charge (Load) imposed on purchases (as % of offering price)

None

None

Maximum Deferred Sales Charge (Load) (as % of the lower of original offering price or redemption proceeds)

None

None


Annual Fund Operating Expenses (expenses that you pay each year as a percentage of the value of your investment)

Non-Service Shares

Service Shares

Management Fees

0.60%

0.60%

Distribution and/or Service (12b-1) Fees

None

0.25%

Other Expenses

0.19%

0.19%

Acquired Fund Fees and Expenses

0.01%

0.01%

Total Annual Fund Operating Expenses

0.80%

1.05%

     Fee Waiver and Expense Reimbursement*

(0.04%)

(0.04%)

Total Annual Fund Operating Expenses After Fee Waiver and Expense Reimbursement

0.76%

1.01%


* The Manager has voluntarily agreed to limit the Fund's total annual operating expenses so that those expenses, as percentages of daily net assets, will not exceed the annual rate of 0.75% for Non-Service Shares and 1.00% for Service Shares. The Manager has also voluntarily agreed to waive fees and/or reimburse Fund expenses in an amount equal to the indirect management fees incurred through the Fund's investment in Oppenheimer Institutional Money Market Fund. These voluntary expense limitations may not be amended or withdrawn until one year after the date of this prospectus.


Example. The following Example is intended to help you compare the cost of investing in the Fund with the cost of investing in other mutual funds. The Example assumes that you invest $10,000 in a class of shares of the Fund for the time periods indicated. The Example also assumes that your investment has a 5% return each year and that the Fund's operating expenses remain the same. Although your actual costs may be higher or lower, based on these assumptions your expenses would be as follows, whether or not you redeemed your shares:

  1 Year   3 Years   5 Years   10 Years  
Non-Service 78 252 442 990
Service 104 332 578 1,286


Portfolio Turnover. The Fund pays transaction costs, such as commissions, when it buys and sells securities (or "turns over" its portfolio). A higher portfolio turnover rate may indicate higher transaction costs. These costs, which are not reflected in the annual fund operating expenses or in the example, affect the Fund's performance. During the most recent fiscal year, the Fund's portfolio turnover rate was 98% of the average value of its portfolio.

Principal Investment Strategies.  Under normal market conditions, the Fund invests at least 80% of its net assets, plus borrowings for investment purposes, in investment-grade debt securities (generally referred to as "bonds"). A debt security is a security representing money borrowed by the issuer that must be repaid. The terms of a debt security specify the amount of principal, the interest rate or discount, and the time or times at which payments are due. Debt securities can include:

  • Domestic and foreign corporate debt obligations;
  • Domestic and foreign government debt obligations, including U.S. Government securities;
  • Mortgage-related securities;
  • Asset-backed securities; and
  • Other debt obligations.

     The portfolio managers' overall strategy is to build a diversified portfolio of corporate and government bonds. The Fund's investments in U.S. Government securities may include securities issued or guaranteed by the U.S. Government or by its agencies or federally-chartered entities referred to as "instrumentalities." There is no required allocation of the Fund's assets among the classes of securities, but the Fund focuses mainly on U.S. Government securities and investment-grade corporate debt securities. When market conditions change, the portfolio managers might change the Fund's relative asset allocation.

     The Fund can invest up to 20% of its total assets in lower-grade, high-yield debt securities that are below investment-grade (commonly referred to as "junk bonds"). "Investment-grade" debt securities are rated in one of the top four rating categories by nationally recognized statistical rating organizations such as Moody's or Standard & Poor's. The Fund may also invest in unrated securities, in which case the Fund's investment adviser, OppenheimerFunds, Inc., may internally assign ratings to certain of those securities, after assessing their credit quality, in categories similar to those of nationally recognized statistical rating organizations.

     The Fund has no limitations on the range of maturities of the debt securities in which it can invest and may hold securities with short-, medium- or long-term maturities. The maturity of a security differs from its effective duration, which attempts to measure the expected volatility of a security's price to interest rate changes. For example, if a bond has an effective duration of three years, a 1% increase in general interest rates would be expected to cause the bond's value to decrease about 3%. To try to decrease volatility, the Fund seeks to maintain a weighted average effective portfolio duration of three to six years, measured on a dollar-weighted basis using the effective duration of the securities included in its portfolio and the amount invested in each of those securities. However, the duration of the portfolio might not meet that target due to market events.

     The Fund may invest in foreign debt securities, including securities issued by foreign governments or companies in both developed and emerging markets.

     The Fund may also use derivatives to seek increased returns or to try to manage investment risks. Futures, swaps and "structured" notes are examples of some of the types of derivatives the Fund can use.
     In selecting investments for the Fund, the Fund's portfolio managers analyze the overall investment opportunities and risks in different sectors of the debt securities markets by focusing on business cycle analysis and relative values between the corporate and government sectors. The Fund mainly seeks income earnings on the Fund's investments plus capital appreciation that may arise from decreases in interest rates, from improving credit fundamentals for a particular sector or security or from other investment techniques.

     The Fund may sell securities that the portfolio managers believe no longer meet the above criteria.

Principal Risks. The price of the Fund's shares can go up and down substantially. The value of the Fund's investments may change because of broad changes in the markets in which the Fund invests or from poor security selection, which could cause the Fund to underperform other funds with similar investment objectives. There is no assurance that the Fund will achieve its investment objective. When you redeem your shares, they may be worth more or less than what you paid for them. These risks mean that you can lose money by investing in the Fund.

Main Risks of Debt Securities. Debt securities may be subject to credit risk, interest rate risk, prepayment risk and extension risk. Credit risk is the risk that the issuer of a security might not make interest and principal payments on the security as they become due. If an issuer fails to pay interest or repay principal, the Fund's income or share value might be reduced. Adverse news about an issuer or a downgrade in an issuer's credit rating, for any reason, can also reduce the market value of the issuer's securities. Interest rate risk is the risk that when prevailing interest rates fall, the values of already-issued debt securities generally rise; and when prevailing interest rates rise, the values of already-issued debt securities generally fall, and they may be worth less than the amount the Fund paid for them. When interest rates change, the values of longer-term debt securities usually change more than the values of shorter-term debt securities. When interest rates fall, debt securities may be repaid more quickly than expected and the Fund may be required to reinvest the proceeds at a lower interest rate. This is referred to as "prepayment risk." When interest rates rise, debt securities may be repaid more slowly than expected and the value of the Fund's holdings may fall sharply. This is referred to as "extension risk." Interest rate changes normally have different effects on variable or floating rate securities than they do on securities with fixed interest rates.

Fixed-Income Market Risks . Economic and other market developments can adversely affect fixed-income securities markets in the United States, Europe and elsewhere. At times, participants in debt securities markets may develop concerns about the ability of certain issuers of debt securities to make timely principal and interest payments, or they may develop concerns about the ability of financial institutions that make markets in certain debt securities to facilitate an orderly market. Those concerns can cause increased volatility in those debt securities or debt securities markets. Under some circumstances, as was the case during the latter half of 2008 and early 2009, those concerns could cause reduced liquidity in certain debt securities markets. A lack of liquidity or other adverse credit market conditions may hamper the Fund's ability to sell the debt securities in which it invests or to find and purchase suitable debt instruments.

Special Risks of Lower-Grade Securities.  Lower-grade securities, whether rated or unrated, may be subject to wider market fluctuation, greater credit risk and greater risk of loss of income and principal than investment-grade securities. The market for lower-grade securities may be less liquid and therefore they may be harder to sell at an acceptable price, especially during times of market volatility or decline.

     Because the Fund can invest up to 20% of its total assets in lower-grade securities, the Fund's credit risks are greater than those of funds that buy only investment-grade securities.

Main Risks of Foreign Investing. Foreign securities are subject to special risks. Foreign issuers are usually not subject to the same accounting and disclosure requirements that U.S. companies are subject to, which may make it difficult for the Fund to evaluate a foreign company's operations or financial condition. A change in the value of a foreign currency against the U.S. dollar will result in a change in the U.S. dollar value of securities denominated in that foreign currency and in the value of any income or distributions the Fund may receive on those securities. The value of foreign investments may be affected by exchange control regulations, foreign taxes, higher transaction and other costs, delays in the settlement of transactions, changes in economic or monetary policy in the United States or abroad, expropriation or nationalization of a company's assets, or other political and economic factors. These risks may be greater for investments in developing or emerging market countries.

Special Risks of Developing and Emerging Markets. The economies of developing or emerging market countries may be more dependent on relatively few industries that may be highly vulnerable to local and global changes. The governments of developing and emerging market countries may also be more unstable than the governments of more developed countries. These countries generally have less developed securities markets or exchanges, and less developed legal and accounting systems. Securities may be more difficult to sell at an acceptable price and may be more volatile than securities in countries with more mature markets. The value of developing or emerging market currencies may fluctuate more than the currencies of countries with more mature markets. Investments in developing or emerging market countries may be subject to greater risks of government restrictions, including confiscatory taxation, expropriation or nationalization of a company's assets, restrictions on foreign ownership of local companies and restrictions on withdrawing assets from the country. Investments in securities of issuers in developing or emerging market countries may be considered speculative.

Main Risks of Derivative Investments. Derivatives may be volatile and may involve significant risks. The underlying security or other instrument on which a derivative is based, or the derivative itself, may not perform as expected. Some derivatives have the potential for unlimited loss, regardless of the size of the Fund's initial investment. The Fund may also lose money on a derivative investment if the issuer or counterparty fails to pay the amount due. Certain derivative investments may be illiquid, making it difficult to close out an unfavorable position. Derivative transactions may require the payment of premiums and can increase portfolio turnover. As a result of these risks, the Fund could realize little or no income or lose money from its investment, or a hedge might be unsuccessful.

Who Is the Fund Designed For? The Fund's shares are available only as an investment option under certain variable annuity contracts, variable life insurance policies and other investment plans offered through insurance company separate accounts of participating insurance companies. The Fund is designed primarily for investors seeking total return from a fund that invests mainly in investment-grade debt securities but which can also hold high-yield, below investment-grade securities. Those investors should be willing to assume the risks of a fund that typically invests a significant amount of its assets in corporate-debt securities and the changes in debt securities prices that can occur when interest rates change. The Fund is intended to be a long-term investment, not a short-term trading vehicle. Because the Fund's income will fluctuate, it is not designed for investors needing an assured level of current income. The Fund is not a complete investment program and may not be appropriate for all investors. You should carefully consider your own investment goals and risk tolerance before investing in the Fund.

An investment in the Fund is not a deposit of any bank and is not insured or guaranteed by the Federal Deposit Insurance Corporation or any other government agency.


The Fund's Past Performance. The bar chart and table below provide some indication of the risks of investing in the Fund by showing changes in the Fund's Non-Service Shares performance from year to year and by showing how the Fund's average annual returns for 1, 5, and 10 years compare with those of broad measures of market performance that reflect the markets in which the Fund typically invests. Charges imposed by the insurance accounts that invest in the Fund are not included and the returns would be lower if they were. The Fund's past investment performance is not necessarily an indication of how the Fund will perform in the future. More recent performance information is available by calling the toll-free number on the back of this prospectus and on the Fund's website at: https://www.oppenheimerfunds.com/fund/investors/overview/CoreBondFundVA


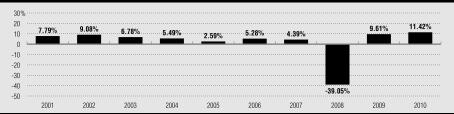
During the period shown, the highest return before taxes for a calendar quarter was 8.52% (3rd Qtr 09) and the lowest return before taxes for a calendar quarter was -29.59% (4th Qtr 08).


The following table shows the average annual total returns before taxes for each class of the Fund's shares. The Barclays Capital U.S. Aggregate Bond Index is an index of U.S. corporate and government bonds. The Barclays Capital Credit Index is an index of non-convertible U.S. investment grade corporate bonds. The Citigroup Broad Investment Grade Bond Index is an index of institutionally traded U.S. Treasury bonds, government-sponsored bonds, mortgage-backed securities and corporate securities.

Average Annual Total Returns for the periods ended December 31, 2010

1 Year

5 Years

10 Years (or life of class, if less)

Non-Service Shares (inception 4-3-85)

11.42%


(3.94%)


1.06%


Service Shares (inception 5-1-02)

11.28%


(4.19%)


0.01%


Barclay's Capital U.S. Aggregate Bond Index

6.54%


5.80%


5.84%


(reflects no deductions for fees, expenses or taxes)


5.52%*


Barclay's Capital Credit Index

8.47%


5.98%


6.55%


(reflects no deductions for fees, expenses or taxes)


6.23%*


Citigroup Broad Investment Grade Bond Index

6.30%


5.98%


5.96%


(reflects no deductions for fees, expenses or taxes)


5.66%*


* From 4-30-02.


Investment Adviser. OppenheimerFunds, Inc. is the Fund's investment adviser (the "Manager").

Portfolio Managers. Krishna Memani and Peter A. Strzalkowski are Vice Presidents of the Fund and have been portfolio managers for the Fund since April 2009.

Purchase and Sale of Fund Shares. Shares of the Fund may be purchased only by separate investment accounts of participating insurance companies as an underlying investment for variable life insurance policies, variable annuity contracts or other investment products. Individual investors cannot buy shares of the Fund directly. You may only submit instructions for buying or selling shares of the Fund to your insurance company or its servicing agent, not directly to the Fund or its Transfer Agent. The accompanying prospectus of the participating insurance company provides information about how to select the Fund as an investment option.

Taxes. Because shares of the Fund may be purchased only through insurance company separate accounts for variable annuity contracts, variable life insurance policies or other investment products, any dividends and capital gains distributions will be taxable to the participating insurance company, if at all. However, those payments may affect the tax basis of certain types of distributions from those accounts. Special tax rules apply to life insurance companies, variable annuity contracts and variable life insurance contracts. For information on federal income taxation of a life insurance company with respect to its receipt of distributions from the Fund and federal income taxation of owners of variable annuity or variable life insurance contracts, see the accompanying prospectus for the applicable contract.

Payments to Broker-Dealers and Other Financial Intermediaries. The Fund, the Manager, or their related companies may make payments to financial intermediaries, including to insurance companies that offer shares of the Fund as an investment option. These payments for the sale of Fund shares and related services may create a conflict of interest by influencing the intermediary and your salesperson to recommend the Fund over another investment. Ask your salesperson or visit your financial intermediary's website for more information.

MORE ABOUT THE FUND

About the Fund's Investments

The allocation of the Fund's portfolio among different types of investments will vary over time and the Fund's portfolio might not always include all of the different types of investments described below. The Statement of Additional Information contains more detailed information about the Fund's investment policies and risks.

THE FUND'S PRINCIPAL INVESTMENT STRATEGIES AND RISKS. The following strategies and types of investments are the ones that the Fund considers to be the most important in seeking to achieve its investment objective and the following risks are those the Fund expects its portfolio to be subject to as a whole.

Debt Securities. The Fund may invest in debt securities, including securities issued or guaranteed by the U.S. Government, or its agencies and instrumentalities, or foreign sovereigns, as well as in foreign and domestic corporate bonds, notes and debentures. The Fund may select debt securities for their income possibilities or to help cushion fluctuations in the value of its portfolio.

Debt securities may be subject to the following risks:

  • Interest Rate Risk. The values of debt securities usually change when prevailing interest rates change. When interest rates rise, the values of outstanding debt securities generally fall, and those securities may sell at a discount from their face amount. When interest rates fall, the values of already-issued debt securities generally rise. However, when interest rates fall, the Fund's investments in new securities may be at lower yields and may reduce the Fund's income. The values of longer-term debt securities usually change more than the values of shorter-term debt securities when interest rates change.

  • Prepayment Risk. Certain fixed-income securities (in particular mortgage-related securities) are subject to the risk of unanticipated prepayment. That is the risk that when interest rates fall, the issuer will repay the security prior to the security's expected maturity, or with respect to certain fixed-income securities, that borrowers will repay the loans that underlie these securities more quickly than expected, thereby causing the issuer of the security to repay the principal prior to expected maturity. The Fund may need to reinvest the proceeds at a lower interest rate, reducing its income. Securities subject to prepayment risk generally offer less potential for gains when prevailing interest rates fall. If the Fund buys those securities at a premium, accelerated prepayments on those securities could cause the Fund to lose a portion of its principal investment. The impact of prepayments on the price of a security may be difficult to predict and may increase the security's price volatility. Interest-only and principal-only securities are especially sensitive to interest rate changes, which can affect not only their prices but can also change the income flows and repayment assumptions about those investments.

  • Extension Risk. If interest rates rise rapidly, repayments of principal on certain debt securities may occur at a slower rate than expected and the expected maturity of those securities could lengthen as a result. Securities that are subject to extension risk generally have a greater potential for loss when prevailing interest rates rise, which could cause their values to fall sharply.

  • Credit Risk. Debt securities are also subject to credit risk. Credit risk is the risk that the issuer of a security might not make interest and principal payments on the security as they become due. U.S. Government securities generally have lower credit risks than securities issued by private issuers or certain foreign governments. If an issuer fails to pay interest, the Fund's income might be reduced, and if an issuer fails to repay principal, the value of the security might fall and the Fund could lose the amount of its investment in the security. The extent of this risk varies based on the terms of the particular security and the financial condition of the issuer. A downgrade in an issuer's credit rating or other adverse news about an issuer can reduce the market value of that issuer's securities.

Credit Quality.  The Fund may invest in securities that are rated or unrated. "Investment-grade" securities are those rated in one of the top four rating categories by nationally recognized statistical rating organizations such as Moody's or Standard & Poor's or unrated securities judged by the Manager to be of comparable quality. "Lower-grade" securities are those that are rated below those categories, which are also referred to as "junk bonds." While securities rated "Baa" by Moody's or "BBB" by Standard & Poor's are considered "investment-grade," they may also have some speculative characteristics. 

Credit ratings evaluate the expectation that scheduled interest and principal payments will be made in a timely manner. They do not reflect any judgment of market risk. Rating agencies might not always change their credit rating of an issuer in a timely manner to reflect events that could affect the issuer's ability to make scheduled payments on its obligations. In selecting securities for its portfolio and evaluating their income potential and credit risk, the Fund does not rely solely on ratings by rating organizations but evaluates business and economic factors affecting issuers as well. The ratings definitions of the principal ratings organizations are included in Appendix B to the Fund's Statement of Additional Information.

     Because the Fund may purchase securities that are not rated by any nationally recognized statistical rating organization, the Manager may internally assign ratings to certain of those securities, after assessing their credit quality, in categories similar to those of nationally recognized statistical rating organizations. However, the Manager's rating does not constitute a guarantee of the credit quality. In evaluating the credit quality of a particular security, whether rated or unrated, the Manager will normally take into consideration a number of factors. Unrated securities also are considered investment-grade or below investment-grade if judged by the Manager to be comparable to rated investment-grade or below investment-grade securities. Some unrated securities may not have an active trading market, which means that the Fund might have difficulty selling them promptly at an acceptable price. 

     The Fund invests primarily in investment-grade debt securities but may invest in lower-grade debt securities and is not required to dispose of debt securities that fall below investment-grade after the Fund buys them.

Duration.  The Fund expects that under normal market conditions it will seek to maintain a weighted average effective portfolio duration of three to six years. While the Fund seeks to maintain a weighted average effective portfolio duration of three to six years, the weighted average maturity of the Fund's portfolio can differ from its duration target, and the Fund can hold securities having long, medium and short maturities. 

Duration is a measure of the price sensitivity of a debt security or portfolio to interest rate changes. "Effective duration" attempts to measure the expected percentage change in the value of a bond or portfolio resulting from a change in prevailing interest rates. The change in the value of a bond or portfolio can be approximated by multiplying its duration by a change in interest rates. For example, if a bond has an effective duration of three years, a 1% increase in general interest rates would be expected to cause the bond's value to decline about 3% while a 1% decrease in general interest rates would be expected to cause the bond's value to increase 3%.

The "maturity" of a security (the date when its principal repayment is due) differs from its effective duration, which attempts to measure the expected volatility of the security's price to interest rate changes. The Fund measures the duration of its entire portfolio of securities on a dollar-weighted basis using the effective duration of the securities included in the portfolio and the amount invested in each of those securities, and tries to maintain a weighted average effective duration of its portfolio of three to six years, under normal market conditions (that is, when financial markets are not in an unstable or volatile state). However, duration cannot be relied on as an exact prediction of future volatility. There can be no assurance that the Fund will achieve its targeted portfolio duration.

Duration calculations rely on a number of assumptions and variables based on the historic performance of similar securities. Therefore, duration can be affected by unexpected economic events or conditions relating to a particular security. In the case of mortgage-related securities, duration calculations are based on historic rates of prepayments of underlying mortgages. If the mortgages underlying the Fund's investments are prepaid more rapidly or more slowly than expected, the duration calculation for that security may not be correct.

U.S. Government Securities. The Fund invests in securities issued or guaranteed by the U.S. Government or its agencies and instrumentalities. Some of those securities are directly issued by the U.S. Treasury and are backed by the full faith and credit of the U.S. Government. "Full faith and credit" means that the taxing power of the U.S. Government is pledged to the payment of interest and repayment of principal on a security.

Some securities issued by U.S. Government agencies, such as Government National Mortgage Association pass-through mortgage obligations ("Ginnie Maes"), are also backed by the full faith and credit of the U.S. Government. Others are supported by the right of the agency to borrow an amount from the U.S. Government (for example, "Fannie Mae" bonds issued by the Federal National Mortgage Association and "Freddie Mac" obligations issued by the Federal Home Loan Mortgage Corporation). Others are supported only by the credit of the agency (for example, obligations issued by the Federal Home Loan Banks). In September 2008, the Federal Housing Finance Agency placed the Federal National Mortgage Association and Federal Home Loan Mortgage Corporation into conservatorship. The U.S. Treasury also entered into a secured lending credit facility with those companies and a preferred stock purchase agreement. Under the preferred stock purchase agreement, the Treasury will ensure that each company maintains a positive net worth. 

     U.S. Treasury Securities. Treasury securities are backed by the full faith and credit of the United States for payment of interest and repayment of principal and have little credit risk. Some of the securities that are issued directly by the U.S. Treasury are: Treasury bills (having maturities of one year or less when issued), Treasury notes (having maturities of from one to ten years when issued), Treasury bonds (having maturities of more than ten years when issued) and Treasury Inflation-Protection Securities ("TIPS"). While U.S. Treasury securities have little credit risk, prior to their maturity they are subject to price fluctuations from changes in interest rates.

     Mortgage-Related Government Securities.  Mortgage-related government securities include interests in pools of residential or commercial mortgages, in the form of "pass-through" mortgage securities. They may be issued or guaranteed by the U.S. Government or its agencies and instrumentalities. Mortgage-related U.S. Government securities may be issued in different series, each having different interest rates and maturities.

Mortgage-related securities that are U.S. Government securities have collateral to secure payment of interest and principal. The collateral is either in the form of mortgage pass-through certificates issued or guaranteed by a U.S. agency or instrumentality or mortgage loans insured by a U.S. Government agency. The prices and yields of mortgage-related securities are determined, in part, by assumptions about the rate of payments of the underlying mortgages and are subject to prepayment and extension risks.

Private-Issuer Securities. The Fund can also invest in securities issued by private issuers, such as corporations, banks, savings and loans, and other entities, including mortgage-related securities. Securities issued by private issuers are subject to greater credit risks than U.S. Government securities.

     Mortgage-Related Private Issuer Securities. Primarily these investments include multi-class debt or pass-through certificates secured by mortgage loans, which may be issued by banks, savings and loans, mortgage bankers and other non-governmental issuers.  Private-issuer mortgage-backed securities may include loans on residential or commercial properties.

Mortgage-related securities, including CMOs, issued by private issuers are not U.S. Government securities, which makes them subject to greater credit risks. Private issuer securities are subject to the credit risks of the issuers as well as to interest rate risks, although in some cases they may be supported by insurance or guarantees. The prices and yields of private issuer mortgage-related securities are also subject to prepayment and extension risk. The market for private-issuer mortgage-backed securities may be volatile at times and may be less liquid than the markets for other types of securities.

Asset-Backed Securities. The Fund may invest in asset-backed securities, which are fractional interests in pools of loans, receivables or other assets. They are issued by trusts or other special purpose vehicles and are collateralized by the loans, receivables or other assets that make up the pool. The trust or other issuer passes the income from the underlying asset pool to the investor. Neither the Fund nor the Manager selects the loans, receivables or other assets that are included in the pools or the collateral backing those pools. Asset-backed securities are subject to interest rate risk and credit risk. These securities are subject to the risk of default by the issuer as well as by the borrowers of the underlying loans in the pool. Certain asset-backed securities are subject to prepayment and extension risks.

Foreign Investments. The Fund can buy a variety of securities issued by foreign governments and other foreign issuers, as well as "supra-national" entities, such as the World Bank. The Fund's foreign investments primarily include bonds, debentures and notes. The Fund's foreign investments can be denominated in U.S. dollars or in foreign currencies and may be in both developed and emerging markets.

Derivative Investments. The Fund can invest in "derivative" instruments. A derivative is an instrument whose value depends on (or is derived from) the value of an underlying security, asset, interest rate, index or currency.  Derivatives may allow the Fund to increase or decrease its exposure to certain markets or risks.  

The Fund may use derivatives to seek to increase its investment return or for hedging purposes. The Fund is not required to use derivatives in seeking its investment objective or for hedging and might not do so.

     Futures, swaps and "structured" notes are some of the types of derivatives the Fund can use. The Fund may also use other types of derivatives that are consistent with its investment strategies or for hedging purposes.

Interest Rate Futures . The Fund may use interest rate futures to manage exposure to interest rate risk or protect the Fund from fluctuations in the value of securities. An interest rate future is a contract for the future delivery of a debt security for a price based on the current value of the security. An interest rate future obligates the seller to deliver (and the purchaser to take) cash or the specified type of debt security to settle the futures transaction at its maturity. Either party could also enter into an offsetting contract to close out the position. For example, to seek to mitigate the risk that increasing prevailing interest rates may decrease the value of the Fund's portfolio securities, the Fund might sell a U.S. Treasury bond future obligating it to sell a U.S. Treasury bond on a future date for an amount based on the current value of the bond. If prevailing interest rates rise, the Fund would be expected to be able to enter into an offsetting contract at a gain.

Risks of Interest Rate Futures . Interest rate futures expose the Fund to price fluctuations resulting from interest rate changes. If interest rates rise when the Fund has purchased an interest rate future, the Fund could suffer a loss in its futures positions. If interest rates fall when the Fund has sold an interest rate future, the Fund could similarly suffer a loss. The market value of interest rate futures may not move in concert with the value of the securities the Fund wishes to hedge or intends to purchase. Further, a lack of market liquidity could make it difficult to close out futures positions.

Credit Default Swaps. A credit default swap enables an investor to buy or sell protection against a credit event with respect to an issuer, such as an issuer's failure to make timely payments of interest or principal on its debt obligations, bankruptcy or restructuring. The terms of the instrument are generally negotiated by the Fund and the swap counterparty. A credit default swap may be embedded within a structured note or other derivative instrument.

Generally, if the Fund buys credit protection using a credit default swap, the Fund will make fixed payments to the counterparty and if a credit event occurs with respect to the applicable issuer, the Fund will deliver the issuer's defaulted bonds underlying the swap to the swap counterparty and the counterparty will pay the Fund par for the bonds. If the Fund sells credit protection using a credit default swap, generally the Fund will receive fixed payments from the counterparty and if a credit event occurs with respect to the applicable issuer, the Fund will pay the swap counterparty par for the issuer's defaulted bonds and the swap counterparty will deliver the bonds to the Fund. Alternatively, a credit default swap may be cash settled and the buyer of protection would receive the difference between the par value and the market value of the issuer's defaulted bonds from the seller of protection. If the credit default swap is on a basket of issuers, the notional value of the swap is reduced by the amount represented by that issuer, and the fixed payments are then made on the reduced notional value.

     Risks of Credit Default Swaps. Credit default swaps are subject to credit risk of the underlying issuer and to counterparty credit risk. If the counterparty fails to meet its obligations, the Fund may lose money. Credit default swaps are also subject to the risk that the Fund will not properly assess the risk of the underlying issuer. If the Fund is selling credit protection, there is a risk that a credit event will occur and that the Fund will have to pay the counterparty. If the Fund is buying credit protection, there is a risk that no credit event will occur and the Fund will receive no benefit for the premium paid.

Interest Rate Swaps.   In an interest rate swap, the Fund and another party exchange the right to receive interest payments on a security or payments based on a reference rate. For example, they might swap the right to receive floating rate payments based on a reference rate such as "LIBOR" for the right to receive fixed rate payments. The terms of the instrument are generally negotiated by the Fund and the swap counterparty. An interest rate swap may be embedded within a structured note or other derivative instrument.

     Risks of Interest Rate Swaps . Interest rate swaps are subject to interest rate risk and credit risk. An interest rate swap transaction could result in losses if the underlying asset or reference rate does not perform as anticipated. Interest rate swaps are also subject to counterparty risk. If the counterparty fails to meet its obligations, the Fund may lose money.

Total Return Swaps. In a total return swap transaction, one party agrees to pay the other party an amount equal to the total return on a defined underlying asset or a non-asset reference during a specified period of time. The underlying asset might be a security or basket of securities or a non-asset reference such as a securities index. In return, the other party would make periodic payments based on a fixed or variable interest rate or on the total return from a different underlying asset or non-asset reference.

Risks of Total Return Swaps. Total return swaps could result in losses if the underlying asset or reference does not perform as anticipated. Total return swaps can have the potential for unlimited losses. They are also subject to counterparty risk. If the counterparty fails to meet its obligations, the Fund may lose money.

"Structured" Notes. "Structured" notes are specially-designed derivative debt instruments. The terms of the instrument may be determined or "structured" by the purchaser and the issuer of the note. Payments of principal or interest on these notes may be linked to the value of an index (such as a currency or securities index), one or more securities, a commodity or the financial performance of one or more obligors. The value of these notes will normally rise or fall in response to the changes in the performance of the underlying security, index, commodity or obligor.

Risks of Structured Notes. Structured notes are subject to interest rate risk. They are also subject to credit risk with respect both to the issuer and, if applicable, to the underlying security or obligor. If the underlying investment or index does not perform as anticipated, the structured note might pay less interest than the stated coupon payment or repay less principal upon maturity. The price of structured notes may be very volatile and they may have a limited trading market, making it difficult to value them or sell them at an acceptable price. In some cases, the Fund may enter into agreements with an issuer of structured notes to purchase a minimum amount of those notes over time.

In some cases, the Fund may invest in structured notes that pay an amount based on a multiple of the relative change in value of the underlying investment or index. This type of note increases the potential for income but at a greater risk of loss than a typical debt security of the same maturity and credit quality.

Hedging.  Hedging transactions are intended to reduce the risks of securities in the Fund's portfolio. If the Fund uses a hedging instrument at the wrong time or judges market conditions incorrectly, however, the hedge might be unsuccessful or could reduce the Fund's return or create a loss. The Fund has percentage limits on its use of derivatives and hedging instruments.

 Risks of Derivative Investments. Derivatives may be volatile and may involve significant risks. The underlying security, obligor or other instrument on which a derivative is based, or the derivative itself, may not perform the way the Manager expects it to. The Fund may lose money on a derivative investment if the issuer or counterparty fails to pay the amount due. Certain derivative investments held by the Fund may be illiquid, making it difficult to close out an unfavorable position. Derivative transactions may require the payment of premiums and can increase portfolio turnover. As a result, the Fund could realize little or no income or lose principal from the investment, or a hedge might be unsuccessful. For some derivatives, it is possible for the Fund to lose more than the amount invested in the derivative instrument. Some derivatives have the potential for unlimited loss, regardless of the size of the Fund's initial investment.


OTHER INVESTMENT STRATEGIES AND RISKS. The Fund can also use the investment techniques and strategies described below. The Fund might not use all of these techniques or strategies or might only use them from time to time.

Special Portfolio Diversification Requirements. To enable a variable annuity or variable life insurance contract based on an insurance company separate account to qualify for favorable tax treatment under the Internal Revenue Code, the underlying investments must follow special diversification requirements that limit the percentage of assets that can be invested in securities of particular issuers. The Fund's investment program is managed to meet those requirements, in addition to other diversification requirements under the Internal Revenue Code and the Investment Company Act of 1940 that apply to publicly-sold mutual funds.

Failure by the Fund to meet those special requirements could cause earnings on a contract owner's interest in an insurance company separate account to be taxable income. Those diversification requirements might also limit, to some degree, the Fund's investment decisions in a way that could reduce its performance.

Forward Rolls. The Fund can enter into "forward roll" transactions (also referred to as "mortgage dollar rolls") with respect to mortgage-related securities. In this type of transaction, the Fund sells a mortgage-related security to a buyer and simultaneously agrees to repurchase a similar security at a later date at a set price. During the period between the sale and the repurchase, the Fund will not be entitled to receive interest and principal payments on the securities that have been sold. The Fund will bear the risk that the market value of the securities might decline below the price at which the Fund is obligated to repurchase them or that the counterparty might default in its obligations.

Zero-Coupon and Stripped Securities. Some of the debt securities the Fund may invest in are "zero-coupon" or "stripped" securities. Zero-coupon securities pay no interest prior to their maturity date or another specified date in the future but are issued at a discount from their face value. Stripped securities are the separate income or principal components of a debt security, such as Treasury securities whose coupons have been stripped by a Federal Reserve Bank. One component might receive all the interest and the other all the principal payments.

Interest rate changes generally cause greater price fluctuations in zero-coupon securities or the "principal-only" components of stripped securities than in interest-paying securities of the same or similar maturities. The Fund may be required to pay a dividend of the imputed income on a zero-coupon or principal-only security at a time when it has not actually received the income. The "interest-only" components of stripped securities are also especially sensitive to changes in prevailing interest rates. The market for some of these securities may be limited, making it difficult for the Fund to dispose of its holdings quickly at an acceptable price.

     The Fund can invest up to 50% of its total assets in zero-coupon securities issued by either the U.S. Treasury or by private issuers.

Participation Interests in Loans . These investments represent an undivided fractional interest in a loan obligation of a borrower. They are typically purchased from banks or dealers that have made the loan, or are members of the loan syndicate, and that act as the servicing agent for the interest. The loans may be to foreign or U.S. borrowers, may be collateralized or uncollateralized and may be rated investment-grade or below or may be unrated. Participation interests are subject to the credit risk of the servicing agent as well as the credit risk of the borrower. If the Fund purchases a participation interest, it may be only able to enforce its rights through the lender. In some cases, these participation interests may be partially "unfunded," meaning that the Fund may be required to advance additional money on future dates.

     The Fund does not invest more than 5% of its net assets in loan participation interests with respect to any one borrower.

Money Market Instruments. The Fund may also invest in "money market instruments." Money market instruments are short-term, high-quality, dollar-denominated debt instruments issued by the U.S. Government, domestic and foreign corporations and financial institutions, and other entities that meet the quality, maturity, diversification and other standards that apply to money market funds under the Investment Company Act of 1940. Money market instruments include bank obligations, repurchase agreements, commercial paper, and other corporate and governmental debt obligations. They may have fixed, variable or floating interest rates. Money market instruments generally do not generate capital appreciation if they are held to maturity.

Common Stock and Other Equity Investments. Equity securities include common stock, preferred stock, rights, warrants and certain securities that are convertible into common stock. Equity investments may be exchange-traded or over-the-counter securities. Common stock represents an ownership interest in a company. It ranks below preferred stock and debt securities in claims for dividends and in claims for assets of the issuer in a liquidation or bankruptcy.

Preferred stock has a set dividend rate and ranks ahead of common stocks and behind debt securities in claims for dividends and for assets of the issuer in a liquidation or bankruptcy. The dividends on preferred stock may be cumulative (they remain a liability of the company until paid) or non-cumulative. The fixed dividend rate of preferred stocks may cause their prices to behave more like those of debt securities. When interest rates rise, the value of preferred stock having a fixed dividend rate tends to fall.

A convertible security can be converted into or exchanged for a set amount of common stock of an issuer within a particular period of time at a specified price or according to a price formula. Convertible debt securities pay interest and convertible preferred stocks pay dividends until they mature or are converted, exchanged or redeemed. Convertible securities may provide more income than common stock but they generally provide less income than comparable non-convertible debt securities. Convertible securities are subject to credit and interest rate risk. The credit ratings of convertible securities generally have less impact on the value of those securities than they do on non-convertible debt securities, however.

Illiquid and Restricted Securities. Investments that do not have an active trading market, or that have legal or contractual limitations on their resale, are generally referred to as "illiquid" securities. Illiquid securities may be difficult to value or to sell promptly at an acceptable price or may require registration under applicable securities laws before they can be sold publicly. Securities that have limitations on their resale are referred to as "restricted securities." Certain restricted securities that are eligible for resale to qualified institutional purchasers may not be regarded as illiquid.

     The Fund will not invest more than 15% of its net assets in illiquid securities.  The Manager monitors the Fund's holdings of illiquid securities on an ongoing basis to determine whether to sell any of those securities to maintain adequate liquidity.

Conflicts of Interest. The investment activities of the Manager and its affiliates in regard to other funds and accounts they manage may present conflicts of interest that could disadvantage the Fund and its shareholders. The Manager or its affiliates may provide investment advisory services to other funds and accounts that have investment objectives or strategies that differ from, or are contrary to, those of the Fund. That may result in another fund or account holding investment positions that are adverse to the Fund's investment strategies or activities. Other funds or accounts advised by the Manager or its affiliates may have conflicting interests arising from investment objectives that are similar to those of the Fund. Those funds and accounts may engage in, and compete for, the same types of securities or other investments as the Fund or invest in securities of the same issuers that have different, and possibly conflicting, characteristics. The trading and other investment activities of those other funds or accounts may be carried out without regard to the investment activities of the Fund and, as a result, the value of securities held by the Fund or the Fund's investment strategies may be adversely affected. The Fund's investment performance will usually differ from the performance of other accounts advised by the Manager or its affiliates and the Fund may experience losses during periods in which other accounts advised by the Manager or its affiliates achieve gains. The Manager has adopted policies and procedures designed to address potential conflicts of interest identified by the Manager; however, such policies and procedures may also limit the Fund's investment activities and affect its performance.

     The Fund offers its shares to separate accounts of different insurance companies, as an investment for their variable annuity contracts, variable life insurance policies and other investment products. While the Fund does not foresee any disadvantages to contract owners from these arrangements, it is possible that the interests of owners of different contracts participating in the Fund through different separate accounts might conflict. For example, a conflict could arise because of differences in tax treatment.

Investments in Oppenheimer Institutional Money Market Fund. The Fund can invest its free cash balances in Class E shares of Oppenheimer Institutional Money Market Fund to provide liquidity or for defensive purposes. The Fund invests in Oppenheimer Institutional Money Market Fund, rather than purchasing individual short-term investments, to seek a higher yield than it could obtain on its own. Oppenheimer Institutional Money Market Fund is a registered open-end management investment company, regulated as a money market fund under the Investment Company Act of 1940, and is part of the Oppenheimer family of funds. It invests in a variety of short-term, high-quality, dollar-denominated money market instruments issued by the U.S. Government, domestic and foreign corporations, other financial institutions, and other entities. Those investments may have a higher rate of return than the investments that would be available to the Fund directly. At the time of an investment, the Fund cannot always predict what the yield of the Oppenheimer Institutional Money Market Fund will be because of the wide variety of instruments that fund holds in its portfolio. The return on those investments may, in some cases, be lower than the return that would have been derived from other types of investments that would provide liquidity. As a shareholder, the Fund will be subject to its proportional share of the expenses of Oppenheimer Institutional Money Market Fund's Class E shares, including its advisory fee. However, the Manager will waive a portion of the Fund's advisory fee to the extent of the Fund's share of the advisory fee paid to the Manager by Oppenheimer Institutional Money Market Fund.

Temporary Defensive and Interim Investments. For temporary defensive purposes in times of adverse or unstable market, economic or political conditions, the Fund can invest up to 100% of its total assets in investments that may be inconsistent with the Fund's principal investment strategies. Generally, the Fund would invest in shares of Oppenheimer Institutional Money Market Fund or in the types of money market instruments in which Oppenheimer Institutional Money Market Fund invests or in other short-term U.S. Government securities. The Fund might also hold these types of securities as interim investments pending the investment of proceeds from the sale of Fund shares or the sale of Fund portfolio securities or to meet anticipated redemptions of Fund shares. To the extent the Fund invests in these securities, it might not achieve its investment objective.

Portfolio Turnover . A change in the securities held by the Fund is known as "portfolio turnover." The Fund may engage in active and frequent trading to try to achieve its investment objective and may have a portfolio turnover rate of over 100% annually. Increased portfolio turnover may result in higher brokerage fees or other transaction costs, which can reduce performance. The Financial Highlights table at the end of this prospectus shows the Fund's portfolio turnover rates during past fiscal years.

CHANGES TO THE FUND'S INVESTMENT POLICIES. The Fund's fundamental investment policies cannot be changed without the approval of a majority of the Fund's outstanding voting shares; however, the Fund's Board can change non-fundamental policies without a shareholder vote. Significant policy changes will be described in supplements to this prospectus. Shareholders will receive 60 days advance notice of any change in the 80% investment policy described in "Principal Investment Strategies." The Fund's investment objective is a fundamental policy. Other investment restrictions that are fundamental policies are listed in the Fund's Statement of Additional Information. An investment policy is not fundamental unless this prospectus or the Statement of Additional Information states that it is.

PORTFOLIO HOLDINGS.   The Fund's portfolio holdings are included in its semi-annual and annual reports that are distributed to its shareholders within 60 days after the close of the applicable reporting period. The Fund also discloses its portfolio holdings in its Statements of Investments on Form N-Q, which are public filings that are required to be made with the Securities and Exchange Commission within 60 days after the end of the Fund's first and third fiscal quarters. Therefore, the Fund's portfolio holdings are made publicly available no later than 60 days after the end of each of its fiscal quarters. In addition, the Fund's portfolio holdings information, as of the end of each calendar month, may be posted and available on the Fund's website no sooner than 30 days after the end of each calendar month.    

A description of the Fund's policies and procedures with respect to the disclosure of its portfolio holdings is available in the Fund's Statement of Additional Information.

How the Fund is Managed

THE MANAGER. OppenheimerFunds, Inc., the Manager, chooses the Fund's investments and handles its day-to-day business. The Manager carries out its duties, subject to the policies established by the Fund's Board of Trustees, under an investment advisory agreement that states the Manager's responsibilities. The agreement sets the fees the Fund pays to the Manager and describes the expenses that the Fund is responsible to pay to conduct its business.

The Manager has been an investment adviser since 1960. The Manager is located at Two World Financial Center, 225 Liberty Street, 11th Floor, New York, New York 10281-1008.

Advisory Fees. Under the investment advisory agreement, the Fund pays the Manager an advisory fee at an annual rate that declines on additional assets as the Fund grows: 0.60% on the first $1 billion of the Fund's daily net assets, and 0.50% of daily net assets in excess of $1 billion. The Fund's advisory fee for its fiscal year ended December 31, 2010 was 0.60% of the Fund's average annual net assets for each class of shares.

The Manager has voluntarily agreed to limit the Fund's total annual operating expenses so that those expenses, as percentages of daily net assets, will not exceed the annual rate of 0.75% for Non-Service Shares and 1.00% for Service Shares. The Manager has also voluntarily agreed to waive fees and/or reimburse Fund expenses in an amount equal to the indirect management fees incurred through the Fund's investment in Oppenheimer Institutional Money Market Fund. These voluntary expense limitations may not be amended or withdrawn until one year after the date of this prospectus.

From April 1, 2009 through March 31, 2010, the Manager voluntarily agreed to waive its advisory fee, resulting in an expense reduction of 0.05% of the Fund's average annual net assets for the fiscal year ended December 31, 2010. This amount is not reflected in the Annual Fund Operating Expenses table shown earlier in this prospectus. After all waivers and reimbursements, actual total annual fund operating expenses for the fiscal year ended December 31, 2010 were 0.71% for Non-Service Shares and 0.96% for Service Shares. The Fund's advisory fee and other annual operating expenses may vary in future years.

A discussion regarding the basis for the Board of Trustees' approval of the Fund's investment advisory contract is available in the Fund's Annual Report to shareholders for the year ended December 31, 2010.

Portfolio Managers. The Fund's portfolio is managed by Krishna Memani and Peter A. Strzalkowski, who are primarily responsible for the day-to-day management of the Fund's investments. Mr. Memani and Mr. Strzalkowski have been portfolio managers and Vice Presidents of the Fund since April 2009.

Mr. Memani has been the Director of Fixed Income of the Manager since October 2010 and a Senior Vice President and Head of the Investment Grade Fixed Income Team of the Manager since March 2009. Mr. Memani was a Managing Director and Head of the U.S. and European Credit Analyst Team at Deutsche Bank Securities from June 2006 through January 2009. He was the Chief Credit Strategist at Credit Suisse Securities from August 2002 through March 2006. He was a Managing Director and Senior Portfolio Manager at Putnam Investments from September 1998 through June 2002. Mr. Memani is a portfolio manager and an officer of other portfolios in the OppenheimerFunds complex.

     Mr. Strzalkowski, CFA, has been a Vice President of the Manager since August 2007 and a member of the Manager's Investment Grade Fixed Income Team since April 2009. Mr. Strzalkowski was a Managing Partner and Chief Investment Officer of Vector Capital Management, LLC, a structured products money management firm he founded, from July 2006 through August 2007. He was a Senior Portfolio Manager at Highland Capital Management, L.P. from June 2005 through July 2006 and a Senior Fixed Income Portfolio Manager at Microsoft Corp. from June 2003 through June 2005. He was a Vice President and Senior Fixed Income Portfolio Manager at First Citizens Bank Trust, Capital Management Group, from April 2000 through June 2003 and a Vice President and Fixed Income Portfolio Manager at Centura Banks from November 1998 through April 2000. Mr. Strzalkowski is a portfolio manager and an officer of other portfolios in the OppenheimerFunds complex.

     The Statement of Additional Information provides additional information about the portfolio managers' compensation, other accounts they manage and their ownership of Fund shares.

MORE ABOUT YOUR INVESTMENT

How to Buy and Sell Shares

You may only submit instructions for buying or selling shares of the Fund to your insurance company or its servicing agent, not directly to the Fund or its Transfer Agent. Information about your investment in the Fund can only be obtained from your participating insurance company or its servicing agent. The Fund's Transfer Agent does not hold or have access to those records.

WHAT CLASSES OF SHARES DOES THE FUND OFFER? The Fund currently offers two different classes of shares. The different classes of shares represent investments in the same portfolio of securities, but the classes are subject to different expenses and will usually have different share prices. The Service Shares are subject to a distribution and service plan. The expenses of that plan are described below. The Non-Service Shares are not subject to a distribution and service plan.

THE PRICE OF FUND SHARES. Fund shares are sold to participating insurance companies, and are redeemed, at their net asset value per share. The net asset value that applies to a purchase order is the next one calculated after the insurance company (as the Fund's designated agent to receive purchase orders) receives the order from its contract owner, in proper form. Fund shares are redeemed at the next net asset value calculated after the insurance company (as the Fund's designated agent to receive purchase orders) receives the order from its contract owner, in proper form. The Fund's Transfer Agent generally must receive the purchase or redemption order from the insurance company by 9:30 a.m. Eastern Time on the next regular business day.

The Fund does not impose any sales charge on purchases of its shares. If there are any charges imposed under the variable annuity, variable life or other contract through which Fund shares are purchased, they are described in the accompanying prospectus of the participating insurance company. The participating insurance company's prospectus may also include information regarding the time you must submit your purchase and redemption orders.

     The sale and redemption price for Fund shares will change from day to day because the value of the securities in its portfolio and its expenses fluctuate. The redemption price will normally differ for different classes of shares. The redemption price of your shares may be more or less than their original cost.

Net Asset Value. The Fund calculates the net asset value of each class of shares as of the close of the New York Stock Exchange (NYSE), on each day the NYSE is open for trading (referred to in this prospectus as a "regular business day"). The NYSE normally closes at 4:00 p.m., Eastern Time, but may close earlier on some days.

The Fund determines the net assets of each class of shares by subtracting the class-specific expenses and the amount of the Fund's liabilities attributable to the share class from the market value of the Fund's securities and other assets attributable to the share class. The Fund's "other assets" might include, for example, cash and interest or dividends from its portfolio securities that have been accrued but not yet collected. The Fund's securities are valued primarily on the basis of current market quotations.

The net asset value per share for each share class is determined by dividing the net assets of the class by the number of outstanding shares of that class.

     Fair Value Pricing. If market quotations are not readily available or (in the Manager's judgment) do not accurately reflect the fair value of a security, or if after the close of the principal market on which a security held by the Fund is traded and before the time as of which the Fund's net asset value is calculated that day, an event occurs that the Manager learns of and believes in the exercise of its judgment will cause a material change in the value of that security from the closing price of the security on the principal market on which it is traded, that security may be valued by another method that the Board believes would more accurately reflect the security's fair value.

In determining whether current market prices are readily available and reliable, the Manager monitors the information it receives in the ordinary course of its investment management responsibilities. It seeks to identify significant events that it believes, in good faith, will affect the market prices of the securities held by the Fund. Those may include events affecting specific issuers (for example, a halt in trading of the securities of an issuer on an exchange during the trading day) or events affecting securities markets (for example, a foreign securities market closes early because of a natural disaster). The Board has adopted valuation procedures for the Fund and has delegated the day-to-day responsibility for fair value determinations to the Manager's "Valuation Committee." Those determinations may include consideration of recent transactions in comparable securities, information relating to the specific security, developments in the markets and their performance, and current valuations of foreign or U.S. indices. Fair value determinations by the Manager are subject to review, approval and ratification by the Board at its next scheduled meeting after the fair valuations are determined.

The Fund's use of fair value pricing procedures involves subjective judgments and it is possible that the fair value determined for a security may be materially different from the value that could be realized upon the sale of that security. Accordingly, there can be no assurance that the Fund could obtain the fair value assigned to a security if it were to sell the security at approximately the same time at which the Fund determines its net asset value per share.

     Pricing Foreign Securities . The Fund may use fair value pricing more frequently for securities primarily traded on foreign exchanges. Because many foreign markets close hours before the Fund values its foreign portfolio holdings, significant events, including broad market movements, may occur during that time that could potentially affect the values of foreign securities held by the Fund.

The Manager believes that foreign securities values may be affected by volatility that occurs in U.S. markets after the close of foreign securities markets. The Manager's fair valuation procedures therefore include a procedure whereby foreign securities prices may be "fair valued" to take those factors into account.

Because some foreign securities trade in markets and on exchanges that operate on weekends and U.S. holidays, the values of some of the Fund's foreign investments may change on days when investors cannot buy or redeem Fund shares.

HOW CAN YOU BUY FUND SHARES? Shares of the Fund may be purchased only by separate investment accounts of participating insurance companies as an underlying investment for variable life insurance policies, variable annuity contracts or other investment products. Individual investors cannot buy shares of the Fund directly. Please refer to the accompanying prospectus of the participating insurance company for information on how to select the Fund as an investment option. That prospectus will indicate which share class you may be eligible to purchase.

Suspension of Share Offering. The offering of Fund shares may be suspended during any period in which the determination of net asset value is suspended, and may be suspended by the Board at any time the Board believes it is in the Fund's best interest to do so.

HOW CAN YOU REDEEM FUND SHARES? Only the participating insurance companies that hold Fund shares in their separate accounts can place orders to redeem shares. Contract holders and policy holders should not directly contact the Fund or its transfer agent to request a redemption of Fund shares. The Fund normally sends payment by Federal Funds wire to the insurance company's account on the next business day after the Fund receives the order (and no later than seven days after the Fund's receipt of the order). Under unusual circumstances determined by the Securities and Exchange Commission, payment may be delayed or suspended. Contract owners should refer to the withdrawal or surrender instructions in the accompanying prospectus of the participating insurance company.

Limitations on Frequent Transactions

Frequent purchases and redemptions of Fund shares may interfere with the Manager's ability to manage the Fund's investments efficiently, may increase its transaction and administrative costs and may affect its performance, depending on various factors, such as the size of the Fund, the nature of its investments, the amount of Fund assets the portfolio manager maintains in cash or cash equivalents, and the aggregate dollar amount, the number and the frequency of trades.

If large dollar amounts are involved in frequent redemption transactions, the Fund might be required to sell portfolio securities at unfavorable times to meet those transaction requests, and the Fund's brokerage or administrative expenses might be increased. Therefore, the Manager and the Fund's Board have adopted the following policies and procedures to detect and prevent frequent and/or excessive purchase and redemption activity, while addressing the needs of investors who seek liquidity in their investment. There is no guarantee that those policies and procedures, described below, will be sufficient to identify and deter all excessive short-term trading. If the Transfer Agent is not able to detect and curtail such activity, frequent trading could occur in the Fund.

Policies on Disruptive Activity.  The Transfer Agent and the Distributor, on behalf of the Fund, have entered into agreements with participating insurance companies designed to detect and restrict excessive short-term trading activity by contract or policy owners or their financial advisers in their accounts. The Transfer Agent generally does not consider periodic asset allocation or re-balancing that affects a portion of the Fund shares held in the account of a policy or contract owner to be "excessive trading." However, the Transfer Agent has advised participating insurance companies that it generally considers certain other types of trading activity to be "excessive," such as making a "transfer" out of the Fund within 30 days after buying Fund shares (by the sale of the recently purchased Fund shares and the purchase of shares of another fund) or making more than six "round-trip transfers" between funds during one year. The agreements require participating insurance companies to provide transaction information to the Fund and to execute Fund instructions to restrict trading in Fund shares.

 A participating insurance company may also have its own policies and procedures and may impose its own restrictions or limitations to discourage short-term and/or excessive trading by its policy or contract owners. Those policies and procedures may be different from the Fund's in certain respects. You should refer to the prospectus for your insurance company variable annuity contract for specific information about the insurance company's policies. Under certain circumstances, policy or contract owners may be required to transmit purchase or redemption orders only by first class U.S. mail.

Monitoring the Policies. The Fund's policies and procedures for detecting and deterring frequent or excessive trading are administered by the Fund's Transfer Agent. However, the Transfer Agent presently does not have the ability to directly monitor trading activity in the accounts of policy or contract owners within the participating insurance companies' accounts. The Transfer Agent's ability to monitor and deter excessive short-term trading in such insurance company accounts ultimately depends on the capability and diligence of each participating insurance company, under their agreements with the Transfer Agent, the Distributor and the Fund, in monitoring and controlling the trading activity of the policy or contract owners in the insurance company's accounts.

The Transfer Agent will attempt to monitor the net effect on the Fund's assets from the purchase and redemption activity in the accounts of participating insurance companies and will seek to identify patterns that may suggest excessive trading by the contract or policy owners who invest in the insurance company's accounts. If the Transfer Agent believes it has observed evidence of possible excessive trading activity, it will ask the participating insurance companies or other registered owners to provide information about the transaction activity of the contract or policy holders in their respective accounts, and to take appropriate action. In that case, the insurance company must confirm to the Transfer Agent that appropriate action has been taken to curtail the excessive trading activity.

The Transfer Agent will, subject to the limitations described in this section, limit or terminate the trading activity of any person, group or account that it believes would be excessive or disruptive. However, the Transfer Agent may not be able to detect or curtail all such trading activity in the Fund. The Transfer Agent will evaluate trading activity on a case by case basis and the limitations placed on trading may vary between accounts.

Right to Refuse Purchase Orders. The Fund's Distributor or Transfer Agent may, in their discretion, refuse any purchase order and are not obligated to provide notice before rejecting an order.  

DISTRIBUTION AND SERVICE (12b-1) PLANS

Distribution and Service Plan for Service Shares. The Fund has adopted a Distribution and Service Plan for Service Shares to pay the Distributor for distribution related services, personal services and account maintenance for those shares. Under the Plan, the Fund pays the Distributor quarterly at an annual rate of up to 0.25% of the daily net assets of the Fund's Service Shares. Because these fees are paid out of the Fund's assets on an on-going basis, over time they will increase the operating expenses of the Service Shares and may cost you more than other types of fees or sales charges. As a result, the Service Shares may have lower performance compared to the Fund's shares that are not subject to a service fee.

     Use of Plan Fees: The Distributor currently uses all of those fees to compensate sponsor(s) of the insurance product for providing personal services and account maintenance for variable contract owners that hold Service Shares.

PAYMENTS TO FINANCIAL INTERMEDIARIES AND SERVICE PROVIDERS. The Manager and the Distributor, in their discretion, may also make payments for distribution and/or shareholder servicing activities to brokers, dealers and other financial intermediaries, including the insurance companies that offer the Fund as an investment option, or to service providers. Those payments are made out of the Manager's and/or the Distributor's own resources and/or assets, including from the revenues or profits derived from the advisory fees the Manager receives from the Fund. Those cash payments, which may be substantial, are paid to many firms having business relationships with the Manager and Distributor and are in addition to any distribution fees, servicing fees, or transfer agency fees paid directly or indirectly by the Fund to those entities. Payments by the Manager or Distributor from their own resources are not reflected in the tables in the "Fees and Expenses of the Fund" section of this prospectus because they are not paid by the Fund.

The financial intermediaries that may receive those payments include firms that offer and sell Fund shares to their clients, or provide shareholder services to the Fund, or both, and receive compensation for those activities. The financial intermediaries that may receive payments include securities brokers, dealers, financial advisers, insurance companies that offer variable annuity or variable life insurance products and other intermediaries.

In general, these payments to financial intermediaries can be categorized as "distribution-related" or "servicing" payments. Payments for distribution-related expenses, such as marketing or promotional expenses, are often referred to as "revenue sharing." Revenue sharing payments may be made on the basis of the sales of shares attributable to that intermediary, the average net assets of the Fund and other Oppenheimer funds attributable to the accounts of that intermediary and its clients, negotiated lump sum payments for distribution services provided, or similar fees. In some circumstances, revenue sharing payments may create an incentive for a financial intermediary or its representatives to recommend or offer shares of the Fund or other Oppenheimer funds to its customers. These payments also may give an intermediary an incentive to cooperate with the Distributor's marketing efforts. A revenue sharing payment may, for example, qualify the Fund for preferred status with the intermediary receiving the payment or provide representatives of the Distributor with access to representatives of the intermediary's sales force, in some cases on a preferential basis over funds of competitors. Additionally, as firm support, the Manager or Distributor may reimburse expenses related to educational seminars and "due diligence" or training meetings (to the extent permitted by applicable laws or the rules of the Financial Industry Regulatory Authority ("FINRA")) designed to increase sales representatives' awareness about Oppenheimer funds, including travel and lodging expenditures. However, the Manager does not consider a financial intermediary's sale of shares of the Fund or other Oppenheimer funds when selecting brokers or dealers to effect portfolio transactions for the funds.

Various factors are used to determine whether to make revenue sharing payments. Possible considerations include, without limitation, the types of services provided by the intermediary, sales of Fund shares, the redemption rates on accounts of clients of the intermediary or overall asset levels of Oppenheimer funds held for or by clients of the intermediary, the willingness of the intermediary to allow the Distributor to provide educational and training support for the intermediary's sales personnel relating to the Oppenheimer funds, the availability of the Oppenheimer funds on the intermediary's sales system, as well as the overall quality of the services provided by the intermediary and the Manager or Distributor's relationship with the intermediary. The Manager and Distributor have adopted guidelines for assessing and implementing each prospective revenue sharing arrangement. To the extent that financial intermediaries receiving distribution-related payments from the Manager or Distributor sell more shares of the Oppenheimer funds or retain more shares of the funds in their client accounts, the Manager and Distributor benefit from the incremental management and other fees they receive with respect to those assets.

Payments may also be made by the Manager, the Distributor or the Transfer Agent to financial intermediaries to compensate or reimburse them for administrative or other client services provided such as sub-transfer agency services for shareholders, omnibus accounting or sub-accounting, participation in networking arrangements, account set-up, recordkeeping and other shareholder services. Payments may also be made for administrative services related to the distribution of Fund shares through the intermediary. Firms that may receive servicing fees include insurance companies that offer variable annuity or variable life insurance products and others. These fees may be used by the service provider to offset or reduce fees that would otherwise be paid directly to them by certain account holders. The Statement of Additional Information contains more information about revenue sharing and service payments made by the Manager or the Distributor. Your broker, dealer or other financial intermediary may charge you fees or commissions in addition to those disclosed in this prospectus. You should ask your financial intermediary for details about any such payments it receives from the Manager or the Distributor and their affiliates, or any other fees or expenses it charges.

Dividends, Capital Gains and Taxes

DIVIDENDS AND DISTRIBUTIONS. The Fund intends to declare and pay dividends annually from any net investment income. The Fund may also realize capital gains on the sale of portfolio securities, in which case it may make distributions out of any net short-term or long-term capital gains annually. The Fund may also make supplemental distributions of dividends and capital gains following the end of its fiscal year. The Fund has no fixed dividend rate and cannot guarantee that it will pay any dividends or capital gains distributions in a particular year.

Dividends and distributions are paid separately for each share class. Because of the higher expenses on Service Shares, the dividends and capital gains distributions paid on those shares will generally be lower than for other Fund shares.

Receiving Dividends and Distributions. Any dividends and capital gains distributions will be automatically reinvested in additional Fund shares for the account of the participating insurance company, unless the insurance company elects to have dividends or distributions paid in cash.

TAXES. For a discussion of the tax status of a variable annuity contract, a variable life insurance policy or other investment product of a participating insurance company, please refer to the accompanying variable contract prospectus of your participating insurance company. Because shares of the Fund may be purchased only through insurance company separate accounts for variable annuity contracts, variable life insurance policies or other investment products, any dividends from net investment income and distributions of net realized short-term and long-term capital gains will be taxable, if at all, to the participating insurance company. However, those payments may affect the tax basis of certain types of distributions from those accounts.

The Fund has qualified and intends to qualify each year to be taxed as a regulated investment company under the Internal Revenue Code by satisfying certain income, asset diversification and income distribution requirements, but reserves the right not to so qualify. In each year that it qualifies as a regulated investment company, the Fund will not be subject to federal income taxes on its income that it distributes to shareholders.

This information is only a summary of certain Federal income tax information about your investment. You are encouraged to consult your tax adviser about the effect of an investment in the Fund on your particular tax situation and about any changes to the Internal Revenue Code that may occur from time to time. Additional information about the tax effects of investing in the Fund is contained in the Statement of Additional Information.

Financial Highlights

The Financial Highlights Table is presented to help you understand the Fund's financial performance for the past five fiscal years. Certain information reflects financial results for a single Fund share. The total returns in the table represent the rate that an investor would have earned (or lost) on an investment in the Fund (assuming reinvestment of all dividends and distributions). This information has been audited by KPMG LLP, the Fund's independent registered public accounting firm for the fiscal years ended December 31, 2010 and 2009. The financial highlights for the prior years were audited by another independent registered public accounting firm. KPMG's report, along with the Fund's financial statements, are included in the Statement of Additional Information, which is available upon request.

Financial Highlights Table

FINANCIAL HIGHLIGHTS

Non-Service Shares      Year Ended December 31,

2010


2009


2008


2007


2006


Per Share Operating Data


Net asset value, beginning of period

$7.07


$6.45


$11.06


$11.16


$11.19


Income (loss) from investment operations:


Net investment income1

.40


.48


.66


.55


.53


Net realized and unrealized gain (loss)

.40


.14


(4.82)


(.08)


.03


Total from investment operations

.80


.62


(4.16)


.47


.56


Dividends and/or distributions to shareholders:


Dividends from net investment income

(.14)


--


(.45)


(.57)


(.59)


Net asset value, end of period

$7.73


$7.07


$6.45


$11.06


$11.16


Total Return, at Net Asset Value2

11.42%


9.61%


(39.05)%


4.39%


5.28%


Ratios/Supplemental Data


Net assets, end of period (in thousands)

$132,557


$137,597


$156,339


$325,661


$367,106


Average net assets (in thousands)

$136,333


$137,631


$271,355


$345,723


$391,750


Ratios to average net assets:3


Net investment income

5.32%


7.40%


6.76%


5.07%


4.83%


Total expenses4

0.79%


0.75%


0.63%


0.68%


0.77%


Expenses after payments, waivers and/or reimbursements and reduction to custodian expenses

0.70%


0.61%


0.62%


0.68%


0.77%


Portfolio turnover rate5

98%


143%


51%


89%


114%


1. Per share amounts calculated based on the average shares outstanding during the period.

2. Assumes an initial investment on the business day before the first day of the fiscal period, with all dividends and distributions reinvested in additional shares on the reinvestment date, and redemption at the net asset value calculated on the last business day of the fiscal period. Total returns are not annualized for periods less than one full year. Total return information does not reflect expenses that apply at the separate account level or to related insurance products. Inclusion of these charges would reduce the total return figures for all periods shown. Returns do not reflect the deduction of taxes that a shareholder would pay on fund distributions or the redemption of fund shares.

3. Annualized for periods less than one full year.

4. Total expenses including indirect expenses from affiliated fund were as follows:

Year Ended December 31, 2010

0.80%

Year Ended December 31, 2009

0.76%

Year Ended December 31, 2008

0.63%

Year Ended December 31, 2007

0.68%

Year Ended December 31, 2006

0.77%

5. The portfolio turnover rate excludes purchase and sale transactions of To Be Announced (TBA) mortgage-related securities as follows:

Purchase Transactions

Sale Transactions

Year Ended December 31, 2010

$ 775,240,942

$ 766,486,357

Year Ended December 31, 2009

$ 977,840,247

$1,009,549,121

Year Ended December 31, 2008

$1,019,711,829

$ 963,377,934

Year Ended December 31, 2007

$ 662,784,931

$ 678,316,693

Year Ended December 31, 2006

$1,168,229,255

$1,270,329,129


Service Shares      Year Ended December 31,

2010


2009


2008


2007


2006


Per Share Operating Data


Net asset value, beginning of period

$6.99


$6.41


$10.98


$11.10


$11.15


Income (loss) from investment operations:


Net investment income1

.37


.46


.63


.52


.49


Net realized and unrealized gain (loss)

.41


.12


(4.77)


(.08)


.03


Total from investment operations

.78


.58


(4.14)


.44


.52


Dividends and/or distributions to shareholders:


Dividends from net investment income

(.12)


--


(.43)


(.56)


(.57)


Net asset value, end of period

$7.65


$6.99


$6.41


$10.98


$11.10


Total Return, at Net Asset Value2

11.28%


9.05%


(39.07)%


4.09%


4.93%


Ratios/Supplemental Data


Net assets, end of period (in thousands)

$56,562


$56,717


$ 63,093


$103,542


$41,191


Average net assets (in thousands)

$57,313


$52,648


$101,597


$ 70,116


$21,265


Ratios to average net assets:3


Net investment income

5.06%


7.16%


6.55%


4.85%


4.56%


Total expenses4

1.04%


1.01%


0.88%


0.92%


1.06%


Expenses after payments, waivers and/or reimbursements and reduction to custodian expenses

0.95%


0.86%


0.87%


0.92%


1.06%


Portfolio turnover rate5

98%


143%


51%


89%


114%


1. Per share amounts calculated based on the average shares outstanding during the period.

2. Assumes an initial investment on the business day before the first day of the fiscal period, with all dividends and distributions reinvested in additional shares on the reinvestment date, and redemption at the net asset value calculated on the last business day of the fiscal period. Total returns are not annualized for periods less than one full year. Total return information does not reflect expenses that apply at the separate account level or to related insurance products. Inclusion of these charges would reduce the total return figures for all periods shown. Returns do not reflect the deduction of taxes that a shareholder would pay on fund distributions or the redemption of fund shares.

3. Annualized for periods less than one full year.

4. Total expenses including indirect expenses from affiliated fund were as follows:

Year Ended December 31, 2010

1.05%

Year Ended December 31, 2009

1.02%

Year Ended December 31, 2008

0.88%

Year Ended December 31, 2007

0.92%

Year Ended December 31, 2006

1.06%

5. The portfolio turnover rate excludes purchase and sale transactions of To Be Announced (TBA) mortgage-related securities as follows:

Purchase Transactions

Sale Transactions

Year Ended December 31, 2010

$ 775,240,942

$ 766,486,357

Year Ended December 31, 2009

$ 977,840,247

$1,009,549,121

Year Ended December 31, 2008

$1,019,711,829

$ 963,377,934

Year Ended December 31, 2007

$ 662,784,931

$ 678,316,693

Year Ended December 31, 2006

$1,168,229,255

$1,270,329,129


INFORMATION AND SERVICES

STATEMENT OF ADDITIONAL INFORMATION. This document includes additional information about the Fund's investment policies, risks, and operations. It is incorporated by reference into this prospectus (it is legally part of this prospectus).

ANNUAL AND SEMI-ANNUAL REPORTS. The Fund's Annual and Semi-Annual Reports provide additional information about the Fund's investments and performance. The Annual Report includes a discussion of market conditions and investment strategies that significantly affected the Fund's performance during its last fiscal year.

How to Request More Information

You can request the above documents, the notice explaining the Fund's privacy policy, and other information about the Fund, without charge, by:

Telephone:

Call OppenheimerFunds Services toll-free: 1.800.988.8287

Mail:

Use the following address for regular mail:
OppenheimerFunds Services
P.O. Box 5270
Denver, Colorado 80217-5270

Use the following address for courier or express mail:
OppenheimerFunds Services
12100 East Iliff Avenue
Suite 300
Aurora, Colorado 80014

Internet:

You can read or download the Fund's Statement of Additional Information, Annual and Semi-Annual Reports on the OppenheimerFunds website at: www.oppenheimerfunds.com


Information about the Fund including the Statement of Additional Information can be reviewed and copied at the SEC's Public Reference Room in Washington, D.C. Information on the operation of the Public Reference Room may be obtained by calling the SEC at 1.202.551.8090. Reports and other information about the Fund are available on the EDGAR database on the SEC's website at www.sec.gov. Copies may be obtained after payment of a duplicating fee by electronic request at the SEC's e-mail address: publicinfo@sec.gov or by writing to the SEC's Public Reference Section, Washington, D.C. 20549-1520.

No one has been authorized to provide any information about the Fund or to make any representations about the Fund other than what is contained in this prospectus. This prospectus is not an offer to sell shares of the Fund, nor a solicitation of an offer to buy shares of the Fund, to any person in any state or other jurisdiction where it is unlawful to make such an offer.


The Fund's SEC File No.: 811-04108
SP0630.001.0411


OPPENHEIMER
Global Securities Fund/VA

A series of Oppenheimer Variable Account Funds

Share Classes:

     Non-Service Shares

     Service Shares

     Class 3 Shares

     Class 4 Shares

Prospectus dated April 29, 2011

As with all mutual funds, the Securities and Exchange Commission has not approved or disapproved the Fund's securities nor has it determined that this prospectus is accurate or complete. It is a criminal offense to represent otherwise.

Oppenheimer Global Securities Fund/VA is a mutual fund that seeks long-term capital appreciation by investing a substantial portion of its assets in securities of foreign issuers, "growth-type" companies, cyclical industries and special situations that are considered to have appreciation possibilities. It invests mainly in common stocks of U.S. and foreign issuers.

Shares of the Fund are sold only as an underlying investment for variable life insurance policies, variable annuity contracts and other insurance company separate accounts. A prospectus for the insurance product you have selected accompanies this prospectus and explains how to select shares of the Fund as an investment under that insurance product, and which share class or classes you are eligible to purchase.

This prospectus contains important information about the Fund's objective, investment policies, strategies and risks. Please read this prospectus (and your insurance product prospectus) carefully before you invest and keep them for future reference about your account.


Oppenheimer Global Securities Fund/VA


Table of contents

THE FUND SUMMARY

Investment Objective

3

Fees and Expenses of the Fund

3

Principal Investment Strategies

3

Principal Risks

4

The Fund's Past Performance

5

Investment Adviser

5

Portfolio Manager

5

Purchase and Sale of Fund Shares

5

Taxes

5

Payments to Broker-Dealers and Other Financial Intermediaries

5

MORE ABOUT THE FUND

About the Fund's Investments

6

How the Fund is Managed

9

MORE ABOUT YOUR INVESTMENT

How to Buy and Sell Shares

10

Dividends, Capital Gains and Taxes

12

Financial Highlights

13


To Summary Prospectus

THE FUND SUMMARY

Investment Objective. The Fund seeks long-term capital appreciation by investing a substantial portion of its assets in securities of foreign issuers, "growth-type" companies, cyclical industries and special situations that are considered to have appreciation possibilities.

Fees and Expenses of the Fund. This table describes the fees and expenses that you may pay if you buy and hold or redeem shares of the Fund. The accompanying prospectus of the participating insurance company provides information on initial or contingent deferred sales charges, exchange fees or redemption fees for that variable life insurance policy, variable annuity or other investment product. The fees and expenses of those products are not charged by the Fund and are not reflected in this table. Expenses would be higher if those fees were included.

Shareholder Fees (fees paid directly from your investment)

Non-Service Shares

Service Shares

Class 3 Shares

Class 4 Shares

Maximum Sales Charge (Load) imposed on purchases (as % of offering price)

None

None

None

None

Maximum Deferred Sales Charge (Load) (as % of the lower of original offering price or redemption proceeds)

None

None

None

None

Redemption Fee (as % of amount redeemed, if applicable)

None

None

1.00%

1.00%


Annual Fund Operating Expenses (expenses that you pay each year as a percentage of the value of your investment)

Non-Service Shares

Service Shares

Class 3 Shares

Class 4 Shares

Management Fees

0.63%

0.63%

0.63%

0.63%

Distribution and/or Service (12b-1) Fees

None

0.25%

None

0.25%

Other Expenses

0.13%

0.13%

0.13%

0.13%

Total Annual Fund Operating Expenses

0.76%

1.01%

0.76%

1.01%


Example. The following Example is intended to help you compare the cost of investing in the Fund with the cost of investing in other mutual funds. The Example assumes that you invest $10,000 in a class of shares of the Fund for the time periods indicated. The Example also assumes that your investment has a 5% return each year and that the Fund's operating expenses remain the same. Although your actual costs may be higher or lower, based on these assumptions your expenses would be as follows, whether or not you redeemed your shares:

1 Year   3 Years   5 Years   10 Years  
Non-Service Shares $ 78 $ 244 $ 424 $ 946
Service Shares $ 104 $ 323 $ 561 $ 1,242
Class 3 Shares $ 78 $ 244 $ 424 $ 946
Class 4 Shares $ 104 $ 323 $ 561 $ 1,242


Portfolio Turnover. The Fund pays transaction costs, such as commissions, when it buys and sells securities (or "turns over" its portfolio). A higher portfolio turnover rate may indicate higher transaction costs. These costs, which are not reflected in the annual fund operating expenses or in the example, affect the Fund's performance. During the most recent fiscal year, the Fund's portfolio turnover rate was 15% of the average value of its portfolio.

Principal Investment Strategies. The Fund invests mainly in common stock of U.S. and foreign companies. The Fund can invest without limit in foreign securities and can invest in any country, including countries with developed or emerging markets. However, the Fund currently has more of its assets invested in developed markets such as the United States, Western European countries and Japan.

As a fundamental policy, the Fund normally will invest in at least three countries (one of which may be the United States). Typically, the Fund invests in a number of different countries. The Fund is not required to allocate its investments in any set percentages in any particular countries.

The portfolio manager also considers the effect of worldwide trends on the growth of particular business sectors and looks for companies that may benefit from those trends. The trends currently considered include: mass affluence, new technologies, corporate restructuring and demographic changes. The portfolio manager does not invest any fixed amount of the Fund's assets according to these criteria and the trends that are considered may change over time.

In seeking diversification of the Fund's portfolio, the portfolio manager generally seeks companies with the following characteristics, which may vary in particular cases and may change over time:

  • Worldwide growth-oriented companies of any market capitalization;
  • Companies at attractive valuations that may benefit from global growth trends;
  • Companies with strong competitive positions and high demand for their products or services;
  • Cyclical opportunities in the business cycle and sectors or industries that may benefit from those opportunities; and
  • Special situations such as mergers, reorganizations, restructurings or other unusual events.

     The Fund does not limit its investments to companies in a particular market capitalization range, but primarily invests in large-cap companies. A company's market capitalization is the value of its outstanding common stock. Relative to other companies, a company may be classified as small-cap, mid-cap or large-cap.

The Fund may sell the stocks of companies that the portfolio manager believes no longer meet the above criteria, but it is not required to do so.

Principal Risks. The price of the Fund's shares can go up and down substantially. The value of the Fund's investments may change because of broad changes in the markets in which the Fund invests or from poor security selection, which could cause the Fund to underperform other funds with similar investment objectives. There is no assurance that the Fund will achieve its investment objective. When you redeem your shares, they may be worth more or less than what you paid for them. These risks mean that you can lose money by investing in the Fund.

Main Risks of Investing in Stock. The value of the Fund's portfolio may be affected by changes in the stock markets. Stock markets may experience significant short-term volatility and may fall sharply at times. Different stock markets may behave differently from each other and U.S. stock markets may move in the opposite direction from one or more foreign stock markets.

The prices of individual stocks generally do not all move in the same direction at the same time and a variety of factors can affect the price of a particular company's stock. These factors may include, but are not limited to: poor earnings reports, a loss of customers, litigation against the company, general unfavorable performance of the company's sector or industry, or changes in government regulations affecting the company or its industry.

At times, the Fund may emphasize investments in a particular industry or economic or market sector. To the extent that the Fund increases its emphasis on investments in a particular industry or sector, the value of its investments may fluctuate more in response to events affecting that industry or sector, such as changes in economic conditions, government regulations, availability of basic resources or supplies, or other events that affect that industry or sector more than others.

Main Risks of Growth Investing. If a growth company's earnings or stock price fails to increase as anticipated, or if its business plans do not produce the expected results, its securities may decline sharply. Growth companies may be newer or smaller companies that may experience greater stock price fluctuations and risks of loss than larger, more established companies. Newer growth companies tend to retain a large part of their earnings for research, development or investments in capital assets. Therefore, they may not pay any dividends for some time. Growth investing has gone in and out of favor during past market cycles and is likely to continue to do so. During periods when growth investing is out of favor or when markets are unstable, it may be more difficult to sell growth company securities at an acceptable price. Growth stocks may also be more volatile than other securities because of investor speculation.

Main Risks of Foreign Investing. Foreign securities are subject to special risks. Foreign issuers are usually not subject to the same accounting and disclosure requirements that U.S. companies are subject to, which may make it difficult for the Fund to evaluate a foreign company's operations or financial condition. A change in the value of a foreign currency against the U.S. dollar will result in a change in the U.S. dollar value of securities denominated in that foreign currency and in the value of any income or distributions the Fund may receive on those securities. The value of foreign investments may be affected by exchange control regulations, foreign taxes, higher transaction and other costs, delays in the settlement of transactions, changes in economic or monetary policy in the United States or abroad, expropriation or nationalization of a company's assets, or other political and economic factors. These risks may be greater for investments in developing or emerging market countries.

Special Risks of Developing and Emerging Markets. The economies of developing or emerging market countries may be more dependent on relatively few industries that may be highly vulnerable to local and global changes. The governments of developing and emerging market countries may also be more unstable than the governments of more developed countries. These countries generally have less developed securities markets or exchanges, and less developed legal and accounting systems. Securities may be more difficult to sell at an acceptable price and may be more volatile than securities in countries with more mature markets. The value of developing or emerging market currencies may fluctuate more than the currencies of countries with more mature markets. Investments in developing or emerging market countries may be subject to greater risks of government restrictions, including confiscatory taxation, expropriation or nationalization of a company's assets, restrictions on foreign ownership of local companies and restrictions on withdrawing assets from the country. Investments in securities of issuers in developing or emerging market countries may be considered speculative.

Investing in Special Situations. At times, the Fund may seek to benefit from what it considers to be "special situations," such as mergers, reorganizations, restructurings or other unusual events that are expected to affect a particular issuer. There is a risk that the expected change or event might not occur, which could cause the price of the security to fall, perhaps sharply. In that case, the investment might not produce the expected gains or might cause a loss. This is an aggressive investment technique that may be considered speculative.

Cyclical Opportunities. At times, the Fund might seek to take advantage of short-term market movements or changes in the business cycle by investing in companies or industries that are sensitive to those changes. For example, when the economy is expanding, companies in consumer durables and the technology sector might benefit. There is a risk that, if a cyclical event does not have the anticipated effect or when the issuer or industry is out of phase in the business cycle, the value of the Fund's investment could fall.

Who Is the Fund Designed For? The Fund's shares are available only as an investment option under certain variable annuity contracts, variable life insurance policies and investment plans offered through insurance company separate accounts of participating insurance companies. The Fund is designed primarily for investors seeking capital appreciation over the long term. Those investors should be willing to assume the risks of short-term share price fluctuations that are typical for a fund that focuses on stocks and foreign securities. Because of its focus on long-term growth, the Fund may be more appropriate for investors with longer term investment goals. The Fund is not designed for investors needing current income. The Fund is not a complete investment program. You should carefully consider your own investment goals and risk tolerance before investing in the Fund.

An investment in the Fund is not a deposit of any bank and is not insured or guaranteed by the Federal Deposit Insurance Corporation or any other government agency.


The Fund's Past Performance. The bar chart and table below provide some indication of the risks of investing in the Fund by showing changes in the Fund's Non-Service Shares performance from year to year and by showing how the Fund's average annual returns for 1, 5 and 10 years compare with those of a broad measure of market performance. Charges imposed by the insurance accounts that invest in the Fund are not included and the returns would be lower if they were. The Fund's past investment performance is not necessarily an indication of how the Fund will perform in the future. More recent performance information is available by calling the toll-free number on the back of this prospectus and on the Fund's website at: https://www.oppenheimerfunds.com/fund/investors/overview/GlobalSecuritiesFundVA


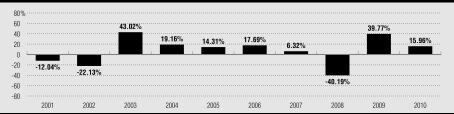
During the period shown, the highest return before taxes for a calendar quarter was 22.81% (2qtr09) and the lowest return before taxes for a calendar quarter was -21.51% (4qtr08).


The following table shows the average annual total returns before taxes for each class of the Fund's shares.

Average Annual Total Returns for the periods ended December 31, 2010

1 Year

5 Years

10 Years (or life of class, if less)

Non-Service Shares (inception 11-12-1990)

15.96%


3.94%


4.93%


Service Shares (inception 07-13-2000)

15.70%


3.68%


4.69%


Class 3 Shares (inception 05-01-2003)

15.97%


3.93%


11.93%


Class 4 Shares (inception 05-03-2004)

15.67%


3.67%


7.21%


Morgan Stanley Capital International World Index

11.76%


2.43%


2.31%


(reflects no deductions for fees, expenses or taxes)


8.15% 1


5.28% 2


1. From 4-30-03.
2. From 4-30-04.


Investment Adviser. OppenheimerFunds, Inc. is the Fund's investment adviser (the "Manager").

Portfolio Manager. Rajeev Bhaman has been portfolio manager and Vice President of the Fund since August 2004.

Purchase and Sale of Fund Shares. Shares of the Fund may be purchased only by separate investment accounts of participating insurance companies as an underlying investment for variable life insurance policies, variable annuity contracts or other investment products. Individual investors cannot buy shares of the Fund directly. You may only submit instructions for buying or selling shares of the Fund to your insurance company or its servicing agent, not directly to the Fund or its Transfer Agent. The accompanying prospectus of the participating insurance company provides information about how to select the Fund as an investment option.

Taxes. Because shares of the Fund may be purchased only through insurance company separate accounts for variable annuity contracts, variable life insurance policies or other investment products, any dividends and capital gains distributions will be taxable to the participating insurance company, if at all. However, those payments may affect the tax basis of certain types of distributions from those accounts. Special tax rules apply to life insurance companies, variable annuity contracts and variable life insurance contracts. For information on federal income taxation of a life insurance company with respect to its receipt of distributions from the Fund and federal income taxation of owners of variable annuity or variable life insurance contracts, see the accompanying prospectus for the applicable contract.

Payments to Broker-Dealers and Other Financial Intermediaries. The Fund, the Manager, or their related companies may make payments to financial intermediaries, including to insurance companies that offer shares of the Fund as an investment option. These payments for the sale of Fund shares and related services may create a conflict of interest by influencing the intermediary and your salesperson to recommend the Fund over another investment. Ask your salesperson or visit your financial intermediary's website for more information.

MORE ABOUT THE FUND

About the Fund's Investments

The allocation of the Fund's portfolio among different types of investments will vary over time and the Fund's portfolio might not always include all of the different types of investments described below. The Statement of Additional Information contains more detailed information about the Fund's investment policies and risks.

THE FUND'S PRINCIPAL INVESTMENT STRATEGIES AND RISKS. The following strategies and types of investments are the ones that the Fund considers to be the most important in seeking to achieve its investment objective and the following risks are those the Fund expects its portfolio to be subject to as a whole.

Investing in Foreign Securities. The Fund may buy stocks and other equity securities of companies that are organized under the laws of a foreign country or that have a substantial portion of their operations or assets in a foreign country or countries, or that derive a substantial portion of their revenue or profits from businesses, investments or sales outside of the United States.

     While foreign securities may offer special investment opportunities, they are also subject to special risks.

  • Foreign Market Risk. If there are fewer investors in a particular foreign market, securities traded in that market may be less liquid and more volatile than U.S. securities. Foreign markets may also be subject to delays in the settlement of transactions and difficulties in pricing securities. If the Fund is delayed in settling a purchase or sale transaction, it may not receive any return on the invested assets or it may lose money if the value of the security declines. It may also be more expensive for the Fund to buy or sell securities in certain foreign markets than in the United States, which may increase the Fund's expense ratio.
  • Foreign Economy Risk. Foreign economies may be more vulnerable to political or economic changes than the U.S. economy. They may be more concentrated in particular industries or may rely on particular resources or trading partners to a greater extent. Certain foreign economies may be adversely affected by shortages of investment capital or by high rates of inflation. Changes in economic or monetary policy in the U.S. or abroad may also have a greater impact on the economies of certain foreign countries.
  • Foreign Governmental and Regulatory Risks. Foreign companies are not subject to the same accounting and disclosure requirements as U.S. companies. As a result there may be less accurate information available regarding a foreign company's operations and financial condition. Foreign companies may be subject to capital controls, nationalization, or confiscatory taxes. Some countries also have restrictions that limit foreign ownership and may impose penalties for increases in the value of the Fund's investment. The value of the Fund's foreign investments may be affected if it experiences difficulties in enforcing legal judgments in foreign courts.
  • Foreign Currency Risk. A change in the value of a foreign currency against the U.S. dollar will result in a change in the U.S. dollar value of securities denominated in that foreign currency. If the U.S. dollar rises in value against a foreign currency, a security denominated in that currency will be worth less in U.S. dollars and if the U.S. dollar decreases in value against a foreign currency, a security denominated in that currency will be worth more in U.S. dollars. The dollar value of foreign investments may also be affected by exchange controls.
  • Foreign Custody Risk. There may be very limited regulatory oversight of certain foreign banks or securities depositories that hold foreign securities and foreign currency and the laws of certain countries may limit the ability to recover such assets if a foreign bank or depository or their agents goes bankrupt.

Investing in Growth Companies. Growth companies are companies whose earnings and stock prices are expected to grow at a faster rate than the overall market. Growth companies can be new companies or established companies that may be entering a growth cycle in their business. Their anticipated growth may come from developing new products or services or from expanding into new or growing markets. Growth companies may be applying new technologies, new or improved distribution methods or new business models that could enable them to capture an important or dominant market position. They may have a special area of expertise or the ability to take advantage of changes in demographic or other factors in a more profitable way. Newer growth companies tend to retain a large part of their earnings for research, development or investments in capital assets.  Although newer growth companies may not pay any dividends for some time, their stocks may be valued because of their potential for price increases. Current examples include companies in the fields of telecommunications, computer software, and new consumer products.

     Growth stocks may be less liquid and more volatile than other stock investments. They may lose value if the company's business plans do not produce the expected results, or if growth investing falls out of favor with investors. Growth stocks may also be more volatile because of investor speculation.


OTHER INVESTMENT STRATEGIES AND RISKS. The Fund can also use the investment techniques and strategies described below. The Fund might not use all of these techniques or strategies or might only use them from time to time.

Special Portfolio Diversification Requirements. To enable a variable annuity or variable life insurance contract based on an insurance company separate account to qualify for favorable tax treatment under the Internal Revenue Code, the underlying investments must follow special diversification requirements that limit the percentage of assets that can be invested in securities of particular issuers. The Fund's investment program is managed to meet those requirements, in addition to other diversification requirements under the Internal Revenue Code and the Investment Company Act of 1940 that apply to publicly-sold mutual funds.

Failure by the Fund to meet those special requirements could cause earnings on a contract owner's interest in an insurance company separate account to be taxable income. Those diversification requirements might also limit, to some degree, the Fund's investment decisions in a way that could reduce its performance.

Other Equity Securities.  In addition to common stocks, the Fund can invest in other equity or "equity equivalents" securities such as preferred stocks or convertible securities. Preferred stocks generally pay a dividend and rank ahead of common stocks and behind debt securities in claims for dividends and for assets of the issuer in a liquidation or bankruptcy. The dividend rate of preferred stocks may cause their prices to behave more like those of debt securities. A convertible security is one that can be converted into or exchanged for common stock of an issuer within a particular period of time at a specified price, upon the occurrence of certain events or according to a price formula. Convertible securities offer the Fund the ability to participate in stock market movements while also seeking some current income. Convertible debt securities pay interest and convertible preferred stocks pay dividends until they mature or are converted, exchanged or redeemed. The Fund considers some convertible securities to be "equity equivalents" because they are convertible into common stock. The credit ratings of those convertible securities generally have less impact on the investment decision, although they are still subject to credit and interest rate risk.

Rights and Warrants. Rights and warrants provide the option to purchase equity securities at a specific price during a specific period of time.

Risks of Technology Stocks. Technology companies and companies having significant investments in technology are particularly vulnerable to the risks of technology markets and economic events that affect those markets. The technology sector has historically exhibited great fluctuation in valuations. The stock prices of technology companies have been highly volatile, largely due to the rapid pace of product changes and developments within the sector. That price volatility may be expected to continue into the future.

Some technological developments may never become commercially successful or may rapidly become obsolete. Technologies that are dependent on consumer demand may also be more sensitive to changes in consumer spending patterns. Technology companies focusing on the information and telecommunications sectors may be adversely affected by international, federal and state regulations.

Risks of Small- and Mid-Sized Companies. Small- and mid-sized companies may be either established or newer companies, including "unseasoned" companies that have been in operation for less than three years. While smaller companies might offer greater opportunities for gain than larger companies, they also may involve greater risk of loss. They may be more sensitive to changes in a company's earnings expectations and may experience more abrupt and erratic price movements. Smaller companies' securities often trade in lower volumes and in many instances, are traded over-the-counter or on a regional securities exchange, where the frequency and volume of trading is substantially less than is typical for securities of larger companies traded on national securities exchanges. Therefore, the securities of smaller companies may be subject to wider price fluctuations and it might be harder for the Fund to dispose of its holdings at an acceptable price when it wants to sell them. Small- and mid-sized companies may not have established markets for their products or services and may have fewer customers and product lines. They may have more limited access to financial resources and may not have the financial strength to sustain them through business downturns or adverse market conditions. Since small- and mid-sized companies typically reinvest a high proportion of their earnings in their business, they may not pay dividends for some time, particularly if they are newer companies. Smaller companies may have unseasoned management or less depth in management skill than larger, more established companies. They may be more reliant on the efforts of particular members of their management team and management changes may pose a greater risk to the success of the business. Securities of small, unseasoned companies may be particularly volatile, especially in the short term, and may have very limited liquidity. It may take a substantial period of time to realize a gain on an investment in a small- or mid-sized company, if any gain is realized at all.

        The Fund currently focuses on securities of issuers that have large capitalizations. They may pay higher dividends than small- and mid-capitalization companies and their stock prices have tended to be less volatile than securities of smaller issuers. However, the Fund can buy stocks of issuers in all capitalization ranges. At times the Manager might increase the relative emphasis of securities of issuers in a particular capitalization range if the Manager believes they offer greater opportunities for total return.

Time-Zone Arbitrage. The Fund may invest in securities of foreign issuers that are traded in U.S. or foreign markets. If the Fund invests a significant amount of its assets in securities traded in foreign markets, it may be exposed to "time-zone arbitrage" attempts by investors seeking to take advantage of differences in the values of foreign securities that might result from events that occur after the close of the foreign securities market on which a security is traded and before the close of the New York Stock Exchange that day, when the Fund's net asset value is calculated. If such time-zone arbitrage were successful, it might dilute the interests of other shareholders. The Fund imposes a 1% redemption fee in certain circumstances, to attempt to deter such activity. The Fund's use of "fair value pricing" under certain circumstances, to adjust the closing market prices of foreign securities to reflect what the Manager and the Board believe to be their fair value, may also help deter those activities.

Derivative Investments. The Fund can invest in "derivative" instruments. A derivative is an instrument whose value depends on (or is derived from) the value of an underlying security, asset, interest rate, index or currency.  Derivatives may allow the Fund to increase or decrease its exposure to certain markets or risks.  

The Fund may use derivatives to seek to increase its investment return or for hedging purposes. The Fund is not required to use derivatives in seeking its investment objective or for hedging and might not do so.

     Options, futures and forward contracts are some of the types of derivatives the Fund can use. The Fund may also use other types of derivatives that are consistent with its investment strategies or for hedging purposes.

Hedging.  Hedging transactions are intended to reduce the risks of securities in the Fund's portfolio. If the Fund uses a hedging instrument at the wrong time or judges market conditions incorrectly, however, the hedge might be unsuccessful or could reduce the Fund's return or create a loss. The Fund has percentage limits on its use of derivatives and hedging instruments.

 Risks of Derivative Investments. Derivatives may be volatile and may involve significant risks. The underlying security, obligor or other instrument on which a derivative is based, or the derivative itself, may not perform the way the Manager expects it to. The Fund may lose money on a derivative investment if the issuer or counterparty fails to pay the amount due. Certain derivative investments held by the Fund may be illiquid, making it difficult to close out an unfavorable position. Derivative transactions may require the payment of premiums and can increase portfolio turnover. As a result, the Fund could realize little or no income or lose principal from the investment, or a hedge might be unsuccessful. For some derivatives, it is possible for the Fund to lose more than the amount invested in the derivative instrument. Some derivatives have the potential for unlimited loss, regardless of the size of the Fund's initial investment.

Illiquid and Restricted Securities. Investments that do not have an active trading market, or that have legal or contractual limitations on their resale, are generally referred to as "illiquid" securities. Illiquid securities may be difficult to value or to sell promptly at an acceptable price or may require registration under applicable securities laws before they can be sold publicly. Securities that have limitations on their resale are referred to as "restricted securities." Certain restricted securities that are eligible for resale to qualified institutional purchasers may not be regarded as illiquid.

     The Fund will not invest more than 15% of its net assets in illiquid securities.  The Manager monitors the Fund's holdings of illiquid securities on an ongoing basis to determine whether to sell any of those securities to maintain adequate liquidity.

Conflicts of Interest. The investment activities of the Manager and its affiliates in regard to other funds and accounts they manage may present conflicts of interest that could disadvantage the Fund and its shareholders. The Manager or its affiliates may provide investment advisory services to other funds and accounts that have investment objectives or strategies that differ from, or are contrary to, those of the Fund. That may result in another fund or account holding investment positions that are adverse to the Fund's investment strategies or activities. Other funds or accounts advised by the Manager or its affiliates may have conflicting interests arising from investment objectives that are similar to those of the Fund. Those funds and accounts may engage in, and compete for, the same types of securities or other investments as the Fund or invest in securities of the same issuers that have different, and possibly conflicting, characteristics. The trading and other investment activities of those other funds or accounts may be carried out without regard to the investment activities of the Fund and, as a result, the value of securities held by the Fund or the Fund's investment strategies may be adversely affected. The Fund's investment performance will usually differ from the performance of other accounts advised by the Manager or its affiliates and the Fund may experience losses during periods in which other accounts advised by the Manager or its affiliates achieve gains. The Manager has adopted policies and procedures designed to address potential conflicts of interest identified by the Manager; however, such policies and procedures may also limit the Fund's investment activities and affect its performance.

     The Fund offers its shares to separate accounts of different insurance companies, as an investment for their variable annuity contracts, variable life insurance policies and other investment products. While the Fund does not foresee any disadvantages to contract owners from these arrangements, it is possible that the interests of owners of different contracts participating in the Fund through different separate accounts might conflict. For example, a conflict could arise because of differences in tax treatment.

Investments in Oppenheimer Institutional Money Market Fund. The Fund can invest its free cash balances in Class E shares of Oppenheimer Institutional Money Market Fund to provide liquidity or for defensive purposes. The Fund invests in Oppenheimer Institutional Money Market Fund, rather than purchasing individual short-term investments, to seek a higher yield than it could obtain on its own. Oppenheimer Institutional Money Market Fund is a registered open-end management investment company, regulated as a money market fund under the Investment Company Act of 1940, and is part of the Oppenheimer family of funds. It invests in a variety of short-term, high-quality, dollar-denominated money market instruments issued by the U.S. Government, domestic and foreign corporations, other financial institutions, and other entities. Those investments may have a higher rate of return than the investments that would be available to the Fund directly. At the time of an investment, the Fund cannot always predict what the yield of the Oppenheimer Institutional Money Market Fund will be because of the wide variety of instruments that fund holds in its portfolio. The return on those investments may, in some cases, be lower than the return that would have been derived from other types of investments that would provide liquidity. As a shareholder, the Fund will be subject to its proportional share of the expenses of Oppenheimer Institutional Money Market Fund's Class E shares, including its advisory fee. However, the Manager will waive a portion of the Fund's advisory fee to the extent of the Fund's share of the advisory fee paid to the Manager by Oppenheimer Institutional Money Market Fund.

Temporary Defensive and Interim Investments. For temporary defensive purposes in times of adverse or unstable market, economic or political conditions, the Fund can invest up to 100% of its total assets in investments that may be inconsistent with the Fund's principal investment strategies. Generally, the Fund would invest in shares of Oppenheimer Institutional Money Market Fund or in the types of money market instruments in which Oppenheimer Institutional Money Market Fund invests or in other short-term U.S. Government securities. The Fund might also hold these types of securities as interim investments pending the investment of proceeds from the sale of Fund shares or the sale of Fund portfolio securities or to meet anticipated redemptions of Fund shares. To the extent the Fund invests in these securities, it might not achieve its investment objective.

Portfolio Turnover. A change in the securities held by the Fund is known as "portfolio turnover." Increased portfolio turnover may result in higher brokerage fees or other transaction costs, which can reduce performance. The Financial Highlights table at the end of this prospectus shows the Fund's portfolio turnover rates during past fiscal years.

CHANGES TO THE FUND'S INVESTMENT POLICIES. The Fund's fundamental investment policies cannot be changed without the approval of a majority of the Fund's outstanding voting shares; however, the Fund's Board can change non-fundamental policies without a shareholder vote. Significant policy changes will be described in supplements to this prospectus. The Fund's investment objective is a fundamental policy. Other investment restrictions that are fundamental policies are listed in the Fund's Statement of Additional Information. An investment policy is not fundamental unless this prospectus or the Statement of Additional Information states that it is.

PORTFOLIO HOLDINGS.   The Fund's portfolio holdings are included in its semi-annual and annual reports that are distributed to its shareholders within 60 days after the close of the applicable reporting period. The Fund also discloses its portfolio holdings in its Statements of Investments on Form N-Q, which are public filings that are required to be made with the Securities and Exchange Commission within 60 days after the end of the Fund's first and third fiscal quarters. Therefore, the Fund's portfolio holdings are made publicly available no later than 60 days after the end of each of its fiscal quarters. In addition, the Fund's portfolio holdings information, as of the end of each calendar month, may be posted and available on the Fund's website no sooner than 30 days after the end of each calendar month.    

A description of the Fund's policies and procedures with respect to the disclosure of its portfolio holdings is available in the Fund's Statement of Additional Information.

How the Fund is Managed

THE MANAGER. OppenheimerFunds, Inc., the Manager, chooses the Fund's investments and handles its day-to-day business. The Manager carries out its duties, subject to the policies established by the Fund's Board of Trustees, under an investment advisory agreement that states the Manager's responsibilities. The agreement sets the fees the Fund pays to the Manager and describes the expenses that the Fund is responsible to pay to conduct its business.

The Manager has been an investment adviser since 1960. The Manager is located at Two World Financial Center, 225 Liberty Street, 11th Floor, New York, New York 10281-1008.

Advisory Fees.  Under the investment advisory agreement, the Fund pays the Manager an advisory fee at an annual rate that declines on additional assets as the Fund grows: 0.75% of the first $200 million of average annual net assets, 0.72% of the next $200 million, 0.69% of the next $200 million, 0.66% of the next $200 million, and 0.60% of average annual net assets over $800 million. The Fund's management fee for its fiscal year ended December 31, 2010, was 0.63% of the Fund's average annual net assets for each class of shares.

The Manager has voluntarily agreed to limit the Fund's total annual operating expenses so that those expenses, as percentages of daily net assets, will not exceed the annual rate of 1.00% for Non-Service and Class 3 Shares and 1.25% for Service and Class 4 Shares. The Manager has voluntarily agreed to waive fees and/or reimburse Fund expenses in an amount equal to the indirect management fees incurred through the Fund's investment in Oppenheimer Institutional Money Market Fund. These waivers and/or reimbursements may be amended or withdrawn at any time. During the fiscal year ended December 31, 2010, these amounts did not exceed 0.01% and therefore are not reflected in the Annual Fund Operating Expenses Table shown earlier in this prospectus. The Fund's management fee and other annual operating expenses may vary in future years.

A discussion regarding the basis for the Board of Trustees' approval of the Fund's investment advisory contract is available in the Fund's Annual Report to shareholders for the year ended December 31, 2010.

Portfolio Manager. The Fund's portfolio is managed by Rajeev Bhaman, who is primarily responsible for the day-to-day management of the Fund's investments. Mr. Bhaman has been portfolio manager and Vice President of the Fund since August 2004.

Mr. Bhaman, CFA, has been a Senior Vice President of the Manager since May 2006 and was a Vice President of the Manager from January 1997 to May 2006. He is a portfolio manager and an officer of other portfolios in the OppenheimerFunds complex.

The Statement of Additional Information provides additional information about the portfolio manager's compensation, other accounts he manages and his ownership of Fund shares.

INVESTING IN THE FUND 

How to Buy and Sell Shares

You may only submit instructions for buying or selling shares of the Fund to your insurance company or its servicing agent, not directly to the Fund or its Transfer Agent. Information about your investment in the Fund can only be obtained from your participating insurance company or its servicing agent. The Fund's Transfer Agent does not hold or have access to those records.

WHAT CLASSES OF SHARES DOES THE FUND OFFER? The Fund currently offers four different classes of shares. The different classes of shares represent investments in the same portfolio of securities, but the classes are subject to different expenses and will usually have different share prices. The Service Shares and Class 4 Shares are subject to a distribution and service plan. The expenses of that plan are described below. The Non-Service Shares and Class 3 Shares are not subject to a service and distribution plan.

THE PRICE OF FUND SHARES. Fund shares are sold to participating insurance companies, and are redeemed, at their net asset value per share. The net asset value that applies to a purchase order is the next one calculated after the insurance company (as the Fund's designated agent to receive purchase orders) receives the order from its contract owner, in proper form. Fund shares are redeemed at the next net asset value calculated after the insurance company (as the Fund's designated agent to receive purchase orders) receives the order from its contract owner, in proper form, less any applicable redemption fee. The Fund's Transfer Agent generally must receive the purchase or redemption order from the insurance company by 9:30 am Eastern Time on the next regular business day.

The Fund does not impose any sales charge on purchases of its shares. However, the Fund imposes a 1% redemption fee on the proceeds of Class 3 and Class 4 shares that a contract owner redeems within 60 days after their purchase. If there are any charges imposed under the variable annuity, variable life or other contract through which Fund shares are purchased, they are described in the accompanying prospectus of the participating insurance company. The participating insurance company's prospectus may also include information regarding the time you must submit your purchase and redemption orders.

     The sale and redemption price for Fund shares will change from day to day because the value of the securities in its portfolio and its expenses fluctuate. The redemption price will normally differ for different classes of shares. The redemption price of your shares may be more or less than their original cost.

Net Asset Value. The Fund calculates the net asset value of each class of shares as of the close of the New York Stock Exchange (NYSE), on each day the NYSE is open for trading (referred to in this prospectus as a "regular business day"). The NYSE normally closes at 4:00 p.m., Eastern Time, but may close earlier on some days.

The Fund determines the net assets of each class of shares by subtracting the class-specific expenses and the amount of the Fund's liabilities attributable to the share class from the market value of the Fund's securities and other assets attributable to the share class. The Fund's "other assets" might include, for example, cash and interest or dividends from its portfolio securities that have been accrued but not yet collected. The Fund's securities are valued primarily on the basis of current market quotations.

The net asset value per share for each share class is determined by dividing the net assets of the class by the number of outstanding shares of that class.

     Fair Value Pricing. If market quotations are not readily available or (in the Manager's judgment) do not accurately reflect the fair value of a security, or if after the close of the principal market on which a security held by the Fund is traded and before the time as of which the Fund's net asset value is calculated that day, an event occurs that the Manager learns of and believes in the exercise of its judgment will cause a material change in the value of that security from the closing price of the security on the principal market on which it is traded, that security may be valued by another method that the Board believes would more accurately reflect the security's fair value.

In determining whether current market prices are readily available and reliable, the Manager monitors the information it receives in the ordinary course of its investment management responsibilities. It seeks to identify significant events that it believes, in good faith, will affect the market prices of the securities held by the Fund. Those may include events affecting specific issuers (for example, a halt in trading of the securities of an issuer on an exchange during the trading day) or events affecting securities markets (for example, a foreign securities market closes early because of a natural disaster). The Board has adopted valuation procedures for the Fund and has delegated the day-to-day responsibility for fair value determinations to the Manager's "Valuation Committee." Those determinations may include consideration of recent transactions in comparable securities, information relating to the specific security, developments in the markets and their performance, and current valuations of foreign or U.S. indices. Fair value determinations by the Manager are subject to review, approval and ratification by the Board at its next scheduled meeting after the fair valuations are determined.

The Fund's use of fair value pricing procedures involves subjective judgments and it is possible that the fair value determined for a security may be materially different from the value that could be realized upon the sale of that security. Accordingly, there can be no assurance that the Fund could obtain the fair value assigned to a security if it were to sell the security at approximately the same time at which the Fund determines its net asset value per share.

     Pricing Foreign Securities . The Fund may use fair value pricing more frequently for securities primarily traded on foreign exchanges. Because many foreign markets close hours before the Fund values its foreign portfolio holdings, significant events, including broad market movements, may occur during that time that could potentially affect the values of foreign securities held by the Fund.

The Manager believes that foreign securities values may be affected by volatility that occurs in U.S. markets after the close of foreign securities markets. The Manager's fair valuation procedures therefore include a procedure whereby foreign securities prices may be "fair valued" to take those factors into account.

Because some foreign securities trade in markets and on exchanges that operate on weekends and U.S. holidays, the values of some of the Fund's foreign investments may change on days when investors cannot buy or redeem Fund shares.

HOW CAN YOU BUY FUND SHARES? Shares of the Fund may be purchased only by separate investment accounts of participating insurance companies as an underlying investment for variable life insurance policies, variable annuity contracts or other investment products. Individual investors cannot buy shares of the Fund directly. Please refer to the accompanying prospectus of the participating insurance company for information on how to select the Fund as an investment option. That prospectus will indicate which share class you may be eligible to purchase.

Suspension of Share Offering. The offering of Fund shares may be suspended during any period in which the determination of net asset value is suspended, and may be suspended by the Board at any time the Board believes it is in the Fund's best interest to do so.

HOW CAN YOU REDEEM FUND SHARES? Only the participating insurance companies that hold Fund shares in their separate accounts can place orders to redeem shares. Contract holders and policy holders should not directly contact the Fund or its transfer agent to request a redemption of Fund shares. The Fund normally sends payment by Federal Funds wire to the insurance company's account on the next business day after the Fund receives the order (and no later than seven days after the Fund's receipt of the order). Under unusual circumstances determined by the Securities and Exchange Commission, payment may be delayed or suspended. Contract owners should refer to the withdrawal or surrender instructions in the accompanying prospectus of the participating insurance company.

Redemption Fee. The Fund imposes a 1% redemption fee on Class 3 and Class 4 shares that a contract owner redeems within 60 days after their purchase. The redemption fee is collected by the participating insurance company and paid to the Fund. It is intended to help offset the trading, market impact, and administrative costs associated with short-term transactions in Fund shares, and to help deter excessive short term trading. The redemption fee will only be imposed on the Class 3 or Class 4 shares you redeem that are more than the number of Class 3 or Class 4 shares you have held for more than 60 days. Shares held the longest will be redeemed first.

Redemptions "In-Kind." Shares may be "redeemed in-kind" under certain circumstances (such as redemptions of substantial amounts of shares by shareholders that have consented to such in kind redemptions). That means that the redemption proceeds will be paid to the participating insurance companies in securities from the Fund's portfolio. If the Fund redeems shares in-kind, the insurance company accounts may bear transaction costs and will bear market risks until such securities are converted into cash.

Limitations on Frequent Transactions

Frequent purchases and redemptions of Fund shares may interfere with the Manager's ability to manage the Fund's investments efficiently, may increase its transaction and administrative costs and may affect its performance, depending on various factors, such as the size of the Fund, the nature of its investments, the amount of Fund assets the portfolio manager maintains in cash or cash equivalents, and the aggregate dollar amount, the number and the frequency of trades.

If large dollar amounts are involved in frequent redemption transactions, the Fund might be required to sell portfolio securities at unfavorable times to meet those transaction requests, and the Fund's brokerage or administrative expenses might be increased. Therefore, the Manager and the Fund's Board have adopted the following policies and procedures to detect and prevent frequent and/or excessive purchase and redemption activity, while addressing the needs of investors who seek liquidity in their investment. There is no guarantee that those policies and procedures, described below, will be sufficient to identify and deter all excessive short-term trading. If the Transfer Agent is not able to detect and curtail such activity, frequent trading could occur in the Fund.

Policies on Disruptive Activity.  The Transfer Agent and the Distributor, on behalf of the Fund, have entered into agreements with participating insurance companies designed to detect and restrict excessive short-term trading activity by contract or policy owners or their financial advisers in their accounts. The Transfer Agent generally does not consider periodic asset allocation or re-balancing that affects a portion of the Fund shares held in the account of a policy or contract owner to be "excessive trading." However, the Transfer Agent has advised participating insurance companies that it generally considers certain other types of trading activity to be "excessive," such as making a "transfer" out of the Fund within 30 days after buying Fund shares (by the sale of the recently purchased Fund shares and the purchase of shares of another fund) or making more than six "round-trip transfers" between funds during one year. The agreements require participating insurance companies to provide transaction information to the Fund and to execute Fund instructions to restrict trading in Fund shares.

 A participating insurance company may also have its own policies and procedures and may impose its own restrictions or limitations to discourage short-term and/or excessive trading by its policy or contract owners. Those policies and procedures may be different from the Fund's in certain respects. You should refer to the prospectus for your insurance company variable annuity contract for specific information about the insurance company's policies. Under certain circumstances, policy or contract owners may be required to transmit purchase or redemption orders only by first class U.S. mail.

Monitoring the Policies. The Fund's policies and procedures for detecting and deterring frequent or excessive trading are administered by the Fund's Transfer Agent. However, the Transfer Agent presently does not have the ability to directly monitor trading activity in the accounts of policy or contract owners within the participating insurance companies' accounts. The Transfer Agent's ability to monitor and deter excessive short-term trading in such insurance company accounts ultimately depends on the capability and diligence of each participating insurance company, under their agreements with the Transfer Agent, the Distributor and the Fund, in monitoring and controlling the trading activity of the policy or contract owners in the insurance company's accounts.

The Transfer Agent will attempt to monitor the net effect on the Fund's assets from the purchase and redemption activity in the accounts of participating insurance companies and will seek to identify patterns that may suggest excessive trading by the contract or policy owners who invest in the insurance company's accounts. If the Transfer Agent believes it has observed evidence of possible excessive trading activity, it will ask the participating insurance companies or other registered owners to provide information about the transaction activity of the contract or policy holders in their respective accounts, and to take appropriate action. In that case, the insurance company must confirm to the Transfer Agent that appropriate action has been taken to curtail the excessive trading activity.

The Transfer Agent will, subject to the limitations described in this section, limit or terminate the trading activity of any person, group or account that it believes would be excessive or disruptive. However, the Transfer Agent may not be able to detect or curtail all such trading activity in the Fund. The Transfer Agent will evaluate trading activity on a case by case basis and the limitations placed on trading may vary between accounts.

Right to Refuse Purchase Orders. The Fund's Distributor or Transfer Agent may, in their discretion, refuse any purchase order and are not obligated to provide notice before rejecting an order.  

DISTRIBUTION AND SERVICE (12b-1) PLANS

Distribution and Service Plan for Service Shares and Class 4 Shares. The Fund has adopted a Distribution and Service Plan for Service Shares and Class 4 Shares to pay the Distributor for distribution related services, personal services and account maintenance for those shares. Under the Plan, the Fund pays the Distributor quarterly at an annual rate of up to 0.25% of the daily net assets of the Fund's Service Shares and Class 4 Shares. Because these fees are paid out of the Fund's assets on an on-going basis, over time they will increase the operating expenses of the Service Shares and Class 4 Shares and may cost you more than other types of fees or sales charges. As a result, the Service Shares and Class 4 Shares may have lower performance compared to the Fund's shares that are not subject to a service fee.

Use of Plan Fees: The Distributor currently uses all of those fees to compensate sponsor(s) of the insurance product for providing personal services and account maintenance for variable contract owners that hold Service Shares and Class 4 Shares.

PAYMENTS TO FINANCIAL INTERMEDIARIES AND SERVICE PROVIDERS. The Manager and the Distributor, in their discretion, may also make payments for distribution and/or shareholder servicing activities to brokers, dealers and other financial intermediaries, including the insurance companies that offer the Fund as an investment option, or to service providers. Those payments are made out of the Manager's and/or the Distributor's own resources and/or assets, including from the revenues or profits derived from the advisory fees the Manager receives from the Fund. Those cash payments, which may be substantial, are paid to many firms having business relationships with the Manager and Distributor and are in addition to any distribution fees, servicing fees, or transfer agency fees paid directly or indirectly by the Fund to those entities. Payments by the Manager or Distributor from their own resources are not reflected in the tables in the "Fees and Expenses of the Fund" section of this prospectus because they are not paid by the Fund.

The financial intermediaries that may receive those payments include firms that offer and sell Fund shares to their clients, or provide shareholder services to the Fund, or both, and receive compensation for those activities. The financial intermediaries that may receive payments include securities brokers, dealers, financial advisers, insurance companies that offer variable annuity or variable life insurance products and other intermediaries.

In general, these payments to financial intermediaries can be categorized as "distribution-related" or "servicing" payments. Payments for distribution-related expenses, such as marketing or promotional expenses, are often referred to as "revenue sharing." Revenue sharing payments may be made on the basis of the sales of shares attributable to that intermediary, the average net assets of the Fund and other Oppenheimer funds attributable to the accounts of that intermediary and its clients, negotiated lump sum payments for distribution services provided, or similar fees. In some circumstances, revenue sharing payments may create an incentive for a financial intermediary or its representatives to recommend or offer shares of the Fund or other Oppenheimer funds to its customers. These payments also may give an intermediary an incentive to cooperate with the Distributor's marketing efforts. A revenue sharing payment may, for example, qualify the Fund for preferred status with the intermediary receiving the payment or provide representatives of the Distributor with access to representatives of the intermediary's sales force, in some cases on a preferential basis over funds of competitors. Additionally, as firm support, the Manager or Distributor may reimburse expenses related to educational seminars and "due diligence" or training meetings (to the extent permitted by applicable laws or the rules of the Financial Industry Regulatory Authority ("FINRA")) designed to increase sales representatives' awareness about Oppenheimer funds, including travel and lodging expenditures. However, the Manager does not consider a financial intermediary's sale of shares of the Fund or other Oppenheimer funds when selecting brokers or dealers to effect portfolio transactions for the funds.

Various factors are used to determine whether to make revenue sharing payments. Possible considerations include, without limitation, the types of services provided by the intermediary, sales of Fund shares, the redemption rates on accounts of clients of the intermediary or overall asset levels of Oppenheimer funds held for or by clients of the intermediary, the willingness of the intermediary to allow the Distributor to provide educational and training support for the intermediary's sales personnel relating to the Oppenheimer funds, the availability of the Oppenheimer funds on the intermediary's sales system, as well as the overall quality of the services provided by the intermediary and the Manager or Distributor's relationship with the intermediary. The Manager and Distributor have adopted guidelines for assessing and implementing each prospective revenue sharing arrangement. To the extent that financial intermediaries receiving distribution-related payments from the Manager or Distributor sell more shares of the Oppenheimer funds or retain more shares of the funds in their client accounts, the Manager and Distributor benefit from the incremental management and other fees they receive with respect to those assets.

Payments may also be made by the Manager, the Distributor or the Transfer Agent to financial intermediaries to compensate or reimburse them for administrative or other client services provided such as sub-transfer agency services for shareholders, omnibus accounting or sub-accounting, participation in networking arrangements, account set-up, recordkeeping and other shareholder services. Payments may also be made for administrative services related to the distribution of Fund shares through the intermediary. Firms that may receive servicing fees include insurance companies that offer variable annuity or variable life insurance products and others. These fees may be used by the service provider to offset or reduce fees that would otherwise be paid directly to them by certain account holders. The Statement of Additional Information contains more information about revenue sharing and service payments made by the Manager or the Distributor. Your broker, dealer or other financial intermediary may charge you fees or commissions in addition to those disclosed in this prospectus. You should ask your financial intermediary for details about any such payments it receives from the Manager or the Distributor and their affiliates, or any other fees or expenses it charges.

Dividends, Capital Gains and Taxes

DIVIDENDS AND DISTRIBUTIONS. The Fund intends to declare and pay dividends annually from any net investment income. The Fund may also realize capital gains on the sale of portfolio securities, in which case it may make distributions out of any net short-term or long-term capital gains annually. The Fund may also make supplemental distributions of dividends and capital gains following the end of its fiscal year. The Fund has no fixed dividend rate and cannot guarantee that it will pay any dividends or capital gains distributions in a particular year.

Dividends and distributions are paid separately for each share class. Because of the higher expenses on Service Shares and Class 4 shares, the dividends and capital gains distributions paid on those shares will generally be lower than for other Fund shares.

Receiving Dividends and Distributions. Any dividends and capital gains distributions will be automatically reinvested in additional Fund shares for the account of the participating insurance company, unless the insurance company elects to have dividends or distributions paid in cash.

TAXES. For a discussion of the tax status of a variable annuity contract, a variable life insurance policy or other investment product of a participating insurance company, please refer to the accompanying variable contract prospectus of your participating insurance company. Because shares of the Fund may be purchased only through insurance company separate accounts for variable annuity contracts, variable life insurance policies or other investment products, any dividends from net investment income and distributions of net realized short-term and long-term capital gains will be taxable, if at all, to the participating insurance company. However, those payments may affect the tax basis of certain types of distributions from those accounts.

The Fund has qualified and intends to qualify each year to be taxed as a regulated investment company under the Internal Revenue Code by satisfying certain income, asset diversification and income distribution requirements, but reserves the right not to so qualify. In each year that it qualifies as a regulated investment company, the Fund will not be subject to federal income taxes on its income that it distributes to shareholders.

This information is only a summary of certain Federal income tax information about your investment. You are encouraged to consult your tax adviser about the effect of an investment in the Fund on your particular tax situation and about any changes to the Internal Revenue Code that may occur from time to time. Additional information about the tax effects of investing in the Fund is contained in the Statement of Additional Information.

Financial Highlights

The Financial Highlights Table is presented to help you understand the Fund's financial performance for the past five fiscal years. Certain information reflects financial results for a single Fund share. The total returns in the table represent the rate that an investor would have earned (or lost) on an investment in the Fund (assuming reinvestment of all dividends and distributions). This information has been audited by KPMG LLP, the Fund's independent registered public accounting firm for the fiscal years ended December 31, 2010 and 2009. The financial highlights for the prior years were audited by another independent registered public accounting firm. KPMG's report, along with the Fund's financial statements, are included in the Statement of Additional Information, which is available upon request.

Financial Highlights Table

FINANCIAL HIGHLIGHTS

Non-Service Shares      Year Ended December 31,

2010


2009


2008


2007


2006


Per Share Operating Data


Net asset value, beginning of period

$26.50


$20.21


$36.60


$36.79


$33.38


Income (loss) from investment operations:


Net investment income1

.33


.33


.55


.45


.43


Net realized and unrealized gain (loss)

3.85


6.94


(14.46)


1.69


5.20


Total from investment operations

4.18


7.27


(13.91)


2.14


5.63


Dividends and/or distributions to shareholders:


Dividends from net investment income

(.38)


(.50)


(.46)


(.50)


(.36)


Distributions from net realized gain

--


(.48)


(2.02)


(1.83)


(1.86)


Total dividends and/or distributions to shareholders

(.38)


(.98)


(2.48)


(2.33)


(2.22)


Net asset value, end of period

$30.30


$26.50


$20.21


$36.60


$36.79


Total Return, at Net Asset Value2

15.96%


39.77%


(40.19)%


6.32%


17.69%


Ratios/Supplemental Data


Net assets, end of period (in thousands)

$1,410,764


$1,364,597


$1,150,113


$2,193,638


$2,297,315


Average net assets (in thousands)

$1,336,110


$1,206,240


$1,679,720


$2,302,726


$2,189,511


Ratios to average net assets:3


Net investment income

1.22%


1.51%


1.95%


1.21%


1.27%


Total expenses4

0.76%


0.75%


0.65%


0.65%


0.66%


Expenses after payments, waivers and/or reimbursements and reduction to custodian expenses

0.76%


0.75%


0.65%


0.65%


0.66%


Portfolio turnover rate

15%


11%


19%


18%


21%


1. Per share amounts calculated based on the average shares outstanding during the period.

2. Assumes an initial investment on the business day before the first day of the fiscal period, with all dividends and distributions reinvested in additional shares on the reinvestment date, and redemption at the net asset value calculated on the last business day of the fiscal period. Total returns are not annualized for periods less than one full year. Total return information does not reflect expenses that apply at the separate account level or to related insurance products. Inclusion of these charges would reduce the total return figures for all periods shown. Returns do not reflect the deduction of taxes that a shareholder would pay on fund distributions or the redemption of fund shares.

3. Annualized for periods less than one full year.

4. Total expenses including indirect expenses from affiliated fund were as follows:

Year Ended December 31, 2010

0.76%

Year Ended December 31, 2009

0.75%

Year Ended December 31, 2008

0.65%

Year Ended December 31, 2007

0.65%

Year Ended December 31, 2006

0.66%


Service Shares      Year Ended December 31,

2010


2009


2008


2007


2006


Per Share Operating Data


Net asset value, beginning of period

$26.28


$20.02


$36.27


$36.49


$33.16


Income (loss) from investment operations:


Net investment income1

.26


.27


.47


.33


.33


Net realized and unrealized gain (loss)

3.82


6.90


(14.32)


1.72


5.16


Total from investment operations

4.08


7.17


(13.85)


2.05


5.49


Dividends and/or distributions to shareholders:


Dividends from net investment income

(.32)


(.43)


(.38)


(.44)


(.30)


Distributions from net realized gain

--


(.48)


(2.02)


(1.83)


(1.86)


Total dividends and/or distributions to shareholders

(.32)


(.91)


(2.40)


(2.27)


(2.16)


Net asset value, end of period

$30.04


$26.28


$20.02


$36.27


$36.49


Total Return, at Net Asset Value2

15.70%


39.36%


(40.33)%


6.08%


17.36%


Ratios/Supplemental Data


Net assets, end of period (in thousands)

$1,101,584


$980,485


$ 772,107


$1,300,989


$983,558


Average net assets (in thousands)

$ 997,627


$830,887


$1,051,239


$1,180,656


$750,499


Ratios to average net assets:3


Net investment income

0.96%


1.23%


1.70%


0.91%


0.98%


Total expenses4

1.01%


1.00%


0.90%


0.89%


0.91%


Expenses after payments, waivers and/or reimbursements and reduction to custodian expenses

1.01%


1.00%


0.90%


0.89%


0.91%


Portfolio turnover rate

15%


11%


19%


18%


21%


1. Per share amounts calculated based on the average shares outstanding during the period.

2. Assumes an initial investment on the business day before the first day of the fiscal period, with all dividends and distributions reinvested in additional shares on the reinvestment date, and redemption at the net asset value calculated on the last business day of the fiscal period. Total returns are not annualized for periods less than one full year. Total return information does not reflect expenses that apply at the separate account level or to related insurance products. Inclusion of these charges would reduce the total return figures for all periods shown. Returns do not reflect the deduction of taxes that a shareholder would pay on fund distributions or the redemption of fund shares.

3. Annualized for periods less than one full year.

4. Total expenses including indirect expenses from affiliated fund were as follows:

Year Ended December 31, 2010

1.01%

Year Ended December 31, 2009

1.00%

Year Ended December 31, 2008

0.90%

Year Ended December 31, 2007

0.89%

Year Ended December 31, 2006

0.91%


Class 3 Shares      Year Ended December 31,

2010


2009


2008


2007


2006


Per Share Operating Data


Net asset value, beginning of period

$26.67


$20.34


$36.82


$36.99


$33.55


Income (loss) from investment operations:


Net investment income1

.33


.33


.56


.45


.43


Net realized and unrealized gain (loss)

3.88


6.98


(14.56)


1.71


5.23


Total from investment operations

4.21


7.31


(14.00)


2.16


5.66


Dividends and/or distributions to shareholders:


Dividends from net investment income

(.38)


(.50)


(.46)


(.50)


(.36)


Distributions from net realized gain

--


(.48)


(2.02)


(1.83)


(1.86)


Total dividends and/or distributions to shareholders

(.38)


(.98)


(2.48)


(2.33)


(2.22)


Net asset value, end of period

$30.50


$26.67


$20.34


$36.82


$36.99


Total Return, at Net Asset Value2

15.97%


39.70%


(40.19)%


6.34%


17.69%


Ratios/Supplemental Data


Net assets, end of period (in thousands)

$202,621


$206,356


$175,971


$361,621


$395,901


Average net assets (in thousands)

$196,495


$182,553


$269,650


$391,270


$369,406


Ratios to average net assets:3


Net investment income

1.22%


1.49%


1.95%


1.22%


1.26%


Total expenses4

0.76%


0.75%


0.65%


0.65%


0.66%


Expenses after payments, waivers and/or reimbursements and reduction to custodian expenses

0.76%


0.75%


0.65%


0.65%


0.66%


Portfolio turnover rate

15%


11%


19%


18%


21%


1. Per share amounts calculated based on the average shares outstanding during the period.

2. Assumes an initial investment on the business day before the first day of the fiscal period, with all dividends and distributions reinvested in additional shares on the reinvestment date, and redemption at the net asset value calculated on the last business day of the fiscal period. Total returns are not annualized for periods less than one full year. Total return information does not reflect expenses that apply at the separate account level or to related insurance products. Inclusion of these charges would reduce the total return figures for all periods shown. Returns do not reflect the deduction of taxes that a shareholder would pay on fund distributions or the redemption of fund shares.

3. Annualized for periods less than one full year.

4. Total expenses including indirect expenses from affiliated fund were as follows:

Year Ended December 31, 2010

0.76%

Year Ended December 31, 2009

0.75%

Year Ended December 31, 2008

0.65%

Year Ended December 31, 2007

0.65%

Year Ended December 31, 2006

0.66%


Class 4 Shares      Year Ended December 31,

2010


2009


2008


2007


2006


Per Share Operating Data


Net asset value, beginning of period

$26.32


$20.03


$36.28


$36.49


$33.15


Income (loss) from investment operations:


Net investment income1

.26


.27


.47


.34


.34


Net realized and unrealized gain (loss)

3.82


6.92


(14.34)


1.70


5.16


Total from investment operations

4.08


7.19


(13.87)


2.04


5.50


Dividends and/or distributions to shareholders:


Dividends from net investment income

(.32)


(.42)


(.36)


(.42)


(.30)


Distributions from net realized gain

--


(.48)


(2.02)


(1.83)


(1.86)


Total dividends and/or distributions to shareholders

(.32)


(.90)


(2.38)


(2.25)


(2.16)


Net asset value, end of period

$30.08


$26.32


$20.03


$36.28


$36.49


Total Return, at Net Asset Value2

15.67%


39.38%


(40.35)%


6.06%


17.40%


Ratios/Supplemental Data


Net assets, end of period (in thousands)

$81,866


$78,043


$63,099


$123,542


$114,232


Average net assets (in thousands)

$76,519


$66,965


$93,909


$122,385


$100,973


Ratios to average net assets:3


Net investment income

0.97%


1.22%


1.69%


0.93%


1.00%


Total expenses4

1.01%


1.00%


0.91%


0.90%


0.91%


Expenses after payments, waivers and/or reimbursements and reduction to custodian expenses

1.01%


1.00%


0.91%


0.90%


0.91%


Portfolio turnover rate

15%


11%


19%


18%


21%


1. Per share amounts calculated based on the average shares outstanding during the period.

2. Assumes an initial investment on the business day before the first day of the fiscal period, with all dividends and distributions reinvested in additional shares on the reinvestment date, and redemption at the net asset value calculated on the last business day of the fiscal period. Total returns are not annualized for periods less than one full year. Total return information does not reflect expenses that apply at the separate account level or to related insurance products. Inclusion of these charges would reduce the total return figures for all periods shown. Returns do not reflect the deduction of taxes that a shareholder would pay on fund distributions or the redemption of fund shares.

3. Annualized for periods less than one full year.

4. Total expenses including indirect expenses from affiliated fund were as follows:

Year Ended December 31, 2010

1.01%

Year Ended December 31, 2009

1.00%

Year Ended December 31, 2008

0.91%

Year Ended December 31, 2007

0.90%

Year Ended December 31, 2006

0.91%


INFORMATION AND SERVICES

STATEMENT OF ADDITIONAL INFORMATION. This document includes additional information about the Fund's investment policies, risks, and operations. It is incorporated by reference into this prospectus (it is legally part of this prospectus).

ANNUAL AND SEMI-ANNUAL REPORTS. The Fund's Annual and Semi-Annual Reports provide additional information about the Fund's investments and performance. The Annual Report includes a discussion of market conditions and investment strategies that significantly affected the Fund's performance during its last fiscal year.

How to Request More Information

You can request the above documents, the notice explaining the Fund's privacy policy, and other information about the Fund, without charge, by:

Telephone:

Call OppenheimerFunds Services toll-free: 1.800.988.8287

Mail:

Use the following address for regular mail:
OppenheimerFunds Services
P.O. Box 5270
Denver, Colorado 80217-5270

Use the following address for courier or express mail:
OppenheimerFunds Services
12100 East Iliff Avenue
Suite 300
Aurora, Colorado 80014

Internet:

You can read or download the Fund's Statement of Additional Information, Annual and Semi-Annual Reports on the OppenheimerFunds website at: www.oppenheimerfunds.com


Information about the Fund including the Statement of Additional Information can be reviewed and copied at the SEC's Public Reference Room in Washington, D.C. Information on the operation of the Public Reference Room may be obtained by calling the SEC at 1.202.551.8090. Reports and other information about the Fund are available on the EDGAR database on the SEC's website at www.sec.gov. Copies may be obtained after payment of a duplicating fee by electronic request at the SEC's e-mail address: publicinfo@sec.gov or by writing to the SEC's Public Reference Section, Washington, D.C. 20549-1520.

No one has been authorized to provide any information about the Fund or to make any representations about the Fund other than what is contained in this prospectus. This prospectus is not an offer to sell shares of the Fund, nor a solicitation of an offer to buy shares of the Fund, to any person in any state or other jurisdiction where it is unlawful to make such an offer.


The Fund's SEC File No.: 811-04108
SP0485.001.0411


Oppenheimer

OPPENHEIMER
Global Strategic Income Fund/VA

A series of Oppenheimer Variable Account Funds

Share Classes:

     Non-Service Shares

     Service Shares

Prospectus dated April 29, 2011

As with all mutual funds, the Securities and Exchange Commission has not approved or disapproved the Fund's securities nor has it determined that this prospectus is accurate or complete. It is a criminal offense to represent otherwise.

Oppenheimer Global Strategic Income Fund/VA is a mutual fund that seeks a high level of current income principally derived from interest on debt securities.

Shares of the Fund are sold only as an underlying investment for variable life insurance policies, variable annuity contracts and other insurance company separate accounts. A prospectus for the insurance product you have selected accompanies this prospectus and explains how to select shares of the Fund as an investment under that insurance product, and which share class or classes you are eligible to purchase.

This prospectus contains important information about the Fund's objective, investment policies, strategies and risks. Please read this prospectus (and your insurance product prospectus) carefully before you invest and keep them for future reference about your account.


Oppenheimer Global Strategic Income Fund/VA 


Table of contents

THE FUND SUMMARY

Investment Objective

3

Fees and Expenses of the Fund

3

Principal Investment Strategies

3

Principal Risks

4

The Fund's Past Performance

5

Investment Adviser

6

Portfolio Managers

6

Purchase and Sale of Fund Shares

6

Taxes

6

Payments to Broker-Dealers and Other Financial Intermediaries

6

MORE ABOUT THE FUND

About the Fund's Investments

7

How the Fund is Managed

13

MORE ABOUT YOUR INVESTMENT

How to Buy and Sell Shares

16

Dividends, Capital Gains and Taxes

18

Financial Highlights

19


To Summary Prospectus

THE FUND SUMMARY

Investment Objective. The Fund seeks a high level of current income principally derived from interest on debt securities.

Fees and Expenses of the Fund. This table describes the fees and expenses that you may pay if you buy and hold or redeem shares of the Fund. The accompanying prospectus of the participating insurance company provides information on initial or contingent deferred sales charges, exchange fees or redemption fees for that variable life insurance policy, variable annuity or other investment product. The fees and expenses of those products are not charged by the Fund and are not reflected in this table. Expenses would be higher if those fees were included.

Shareholder Fees (fees paid directly from your investment)

Non-Service Shares

Service Shares

Maximum Sales Charge (Load) imposed on purchases (as % of offering price)

None

None

Maximum Deferred Sales Charge (Load) (as % of the lower of original offering price or redemption proceeds)

None

None

Annual Fund Operating Expenses (expenses that you pay each year as a percentage of the value of your investment)

Non-Service Shares

Service Shares

Management Fees1

0.60%

060%

Distribution and/or Service (12b-1) Fees

None

0.25%

Acquired Fund Fees and Expenses

0.04%

0.04%

Other Expenses

     Other Expenses of the Fund

0.15%

0.14%

     Other Expenses of the Subsidiary2

0.00%

0.00%

Total Other Expenses

0.15%

0.14%

Total Annual Fund Operating Expenses

0.79%

1.03%

     Fee Waiver and Expense Reimbursement3

(0.08%)

(0.08%)

Total Annual Fund Operating Expenses After Fee Waiver and Expense Reimbursement

0.71%

0.95%


1. "Management Fees" reflects the gross management fees paid to the Manager by the Fund during the Fund's most recent fiscal year and the estimated gross management fee of the Subsidiary for its first fiscal year.
2. "Other Expenses of the Subsidiary" are based on estimated amounts for its first fiscal year.
3. The Manager has agreed to waive fees and/or reimburse Fund expenses in an amount equal to the indirect management fees incurred through the Fund's investments in Oppenheimer Institutional Money Market Fund, Oppenheimer Master Loan Fund, LLC and Oppenheimer Master Event-Linked Bond Fund, LLC. This fee waiver and/or reimbursement may not be amended or withdrawn until one year after the date of this prospectus. The Manager has also contractually agreed to waive the management fee it receives from the Fund in an amount equal to the management fee it receives from the Subsidiary. This undertaking will continue in effect for so long as the Fund invests in the Subsidiary, and may not be terminated by the Manager unless termination is approved by the Fund's Board of Trustees.


Example. The following Example is intended to help you compare the cost of investing in the Fund with the cost of investing in other mutual funds. The Example assumes that you invest $10,000 in a class of shares of the Fund for the time periods indicated. The Example also assumes that your investment has a 5% return each year and that the Fund's operating expenses remain the same. Although your actual costs may be higher or lower, based on these assumptions your expenses would be as follows, whether or not you redeemed your shares:

1 Year   3 Years   5 Years   10 Years  
Non-Service Shares $ 73 $ 245 $ 433 $ 974
Service Shares $ 97 $ 321 $ 564 $ 1,258


Portfolio Turnover. The Fund pays transaction costs, such as commissions, when it buys and sells securities (or "turns over" its portfolio). A higher portfolio turnover rate may indicate higher transaction costs. These costs, which are not reflected in the annual fund operating expenses or in the example, affect the Fund's performance. During the most recent fiscal year, the Fund's portfolio turnover rate was 99% of the average value of its portfolio.

Principal Investment Strategies. Under normal market conditions, the Fund invests at least 80% of its net assets, including any borrowings for investment purposes, in debt securities. A debt security is a security representing money borrowed by the issuer that must be repaid, specifying the amount of principal, the interest rate or discount, and the time or times at which payments are due.

The Fund invests mainly in issuers in three market sectors: (1) foreign governments and companies, (2) U.S. Government securities, and (3) lower-grade, high-yield securities (commonly referred to as "junk bonds") of U.S. and foreign companies. However, the Fund is not required to invest in all three sectors at all times, and the amount of its assets in each of the three sectors will vary over time. The Fund can invest up to 100% of its assets in any one sector at any time, if the Fund's portfolio managers believe that it offers the best investment opportunity. Under normal market conditions, the Fund will invest a substantial portion of its assets in a number of different countries, including the U.S. The Fund is not required to allocate its investments in any set percentages in any particular countries.

The portfolio managers analyze the overall investment opportunities and risks among the three market sectors in which the Fund invests and seek to moderate the special risks of investing in lower-grade, high-yield debt instruments and foreign securities by building a broadly diversified portfolio. The Fund's diversification strategies are intended to help reduce share price volatility while seeking current income. The portfolio managers currently focus on securities offering high current income, securities whose market prices tend to move in different directions (to seek overall portfolio diversification), and relative values among the three market sectors in which the Fund invests. These factors may vary in particular cases and may change over time.

The portfolio managers actively manage foreign currency exposure to seek to reduce risk and enhance return.

The Fund's foreign investments may include debt securities issued by foreign governments or companies in both developed markets and emerging markets. The Fund has no requirements regarding the range of maturities of the debt securities it can buy or the market capitalization of the issuers of those securities.

The Fund's debt securities may be "investment grade" or "lower-grade." Investment grade debt securities are rated in one of the top four categories by nationally recognized statistical rating organizations such as Moody's or Standard & Poor's. The Fund may also invest in unrated securities, in which case the portfolio managers may internally assign ratings to certain of those securities, after assessing their credit quality, in categories similar to those of nationally recognized statistical rating organizations. The Fund' debt investments typically include:  U.S. and foreign government bonds and notes, collateralized mortgage obligations (CMOs) and other mortgage-related securities, domestic and foreign corporate debt obligations, "structured" notes, "zero coupon" and "stripped" securities, participation interests in loans, investments in loan pools and asset-backed securities. The Fund normally invests a substantial amount of its assets in lower-grade, high-yield debt securities, and can do so without limit.

The Fund may also use certain types of derivative instruments for investment purposes or for hedging, including: options, futures, forward contracts, swaps, certain mortgage-related securities, "structured" notes, and event-linked bonds.

The Fund may sell securities that the portfolio managers believe are no longer favorable based on these factors.

The Fund has established a Cayman Islands company that is wholly-owned and controlled by the Fund (the "Subsidiary"). The Fund may invest up to 25% of its total assets in the Subsidiary. The Subsidiary invests primarily in commodity-linked derivatives (including commodity futures, financial futures, options and swap contracts) and exchange traded funds related to gold or other special minerals ("Gold ETFs"). The Subsidiary may also invest in certain fixed-income securities and other investments that may serve as margin or collateral for its derivatives positions. Investments in the Subsidiary are intended to provide the Fund with exposure to commodities market returns within the limitations of the federal tax requirements that apply to the Fund. The Fund applies its investment restrictions and compliance policies and procedures, on a look-through basis, to the Subsidiary. The Fund's investment in the Subsidiary may vary based on the portfolio managers' use of different types of commodity-linked derivatives, fixed-income securities, Gold ETFs, and other investments. Since the Fund may invest a substantial portion of its assets in the Subsidiary, which may hold certain of the investments described in this prospectus, the Fund may be considered to be investing indirectly in those investments through its Subsidiary. Therefore, references in this prospectus to investments by the Fund also may be deemed to include the Fund's indirect investments through the Subsidiary.

Principal Risks. The price of the Fund's shares can go up and down substantially. The value of the Fund's investments may change because of broad changes in the markets in which the Fund invests or from poor security selection, which could cause the Fund to underperform other funds with similar investment objectives. There is no assurance that the Fund will achieve its investment objective. When you redeem your shares, they may be worth more or less than what you paid for them. These risks mean that you can lose money by investing in the Fund.

Main Risks of Debt Securities. Debt securities may be subject to credit risk, interest rate risk, prepayment risk and extension risk. Credit risk is the risk that the issuer of a security might not make interest and principal payments on the security as they become due. If an issuer fails to pay interest or repay principal, the Fund's income or share value might be reduced. Adverse news about an issuer or a downgrade in an issuer's credit rating, for any reason, can also reduce the market value of the issuer's securities. Interest rate risk is the risk that when prevailing interest rates fall, the values of already-issued debt securities generally rise; and when prevailing interest rates rise, the values of already-issued debt securities generally fall, and they may be worth less than the amount the Fund paid for them. When interest rates change, the values of longer-term debt securities usually change more than the values of shorter-term debt securities. When interest rates fall, debt securities may be repaid more quickly than expected and the Fund may be required to reinvest the proceeds at a lower interest rate. This is referred to as "prepayment risk." When interest rates rise, debt securities may be repaid more slowly than expected and the value of the Fund's holdings may fall sharply. This is referred to as "extension risk." Interest rate changes normally have different effects on variable or floating rate securities than they do on securities with fixed interest rates.

Fixed-Income Market Risks . Economic and other market developments can adversely affect fixed-income securities markets in the United States, Europe and elsewhere. At times, participants in debt securities markets may develop concerns about the ability of certain issuers of debt securities to make timely principal and interest payments, or they may develop concerns about the ability of financial institutions that make markets in certain debt securities to facilitate an orderly market. Those concerns can cause increased volatility in those debt securities or debt securities markets. Under some circumstances, as was the case during the latter half of 2008 and early 2009, those concerns could cause reduced liquidity in certain debt securities markets. A lack of liquidity or other adverse credit market conditions may hamper the Fund's ability to sell the debt securities in which it invests or to find and purchase suitable debt instruments.

Special Risks of Lower-Grade Securities.  Lower-grade securities, whether rated or unrated, may be subject to wider market fluctuation, greater credit risk and greater risk of loss of income and principal than investment-grade securities. The market for lower-grade securities may be less liquid and therefore they may be harder to sell at an acceptable price, especially during times of market volatility or decline.

Main Risks of Foreign Investing. Foreign securities are subject to special risks. Foreign issuers are usually not subject to the same accounting and disclosure requirements that U.S. companies are subject to, which may make it difficult for the Fund to evaluate a foreign company's operations or financial condition. A change in the value of a foreign currency against the U.S. dollar will result in a change in the U.S. dollar value of securities denominated in that foreign currency and in the value of any income or distributions the Fund may receive on those securities. The value of foreign investments may be affected by exchange control regulations, foreign taxes, higher transaction and other costs, delays in the settlement of transactions, changes in economic or monetary policy in the United States or abroad, expropriation or nationalization of a company's assets, or other political and economic factors. These risks may be greater for investments in developing or emerging market countries.

Foreign Currency Risk. Fluctuations in foreign currency values will result in fluctuations in the U.S. dollar value of securities denominated in that foreign currency. If the U.S. dollar rises in value against a foreign currency, a security denominated in that currency will be worth less in U.S. dollars and if the U.S. dollar decreases in value against a foreign currency, a security denominated in that currency will be worth more in U.S. dollars. The dollar value of foreign investments may also be affected by exchange controls.

Special Risks of Developing and Emerging Markets. The economies of developing or emerging market countries may be more dependent on relatively few industries that may be highly vulnerable to local and global changes. The governments of developing and emerging market countries may also be more unstable than the governments of more developed countries. These countries generally have less developed securities markets or exchanges, and less developed legal and accounting systems. Securities may be more difficult to sell at an acceptable price and may be more volatile than securities in countries with more mature markets. The value of developing or emerging market currencies may fluctuate more than the currencies of countries with more mature markets. Investments in developing or emerging market countries may be subject to greater risks of government restrictions, including confiscatory taxation, expropriation or nationalization of a company's assets, restrictions on foreign ownership of local companies and restrictions on withdrawing assets from the country. Investments in securities of issuers in developing or emerging market countries may be considered speculative.

Sector Allocation Risk. In allocating investments among its three principal market sectors, the Fund seeks to take advantage of the potential lack of performance correlation between those sectors. There is the risk that the evaluations regarding the sectors' relative performance may be incorrect and those sectors may all perform in a similar manner under certain market conditions.

Main Risks of Derivative Investments. Derivatives may be volatile and may involve significant risks. The underlying security or other instrument on which a derivative is based, or the derivative itself, may not perform as expected. Some derivatives have the potential for unlimited loss, regardless of the size of the Fund's initial investment. The Fund may also lose money on a derivative investment if the issuer or counterparty fails to pay the amount due. Certain derivative investments may be illiquid, making it difficult to close out an unfavorable position. Derivative transactions may require the payment of premiums and can increase portfolio turnover. As a result of these risks, the Fund could realize little or no income or lose money from its investment, or a hedge might be unsuccessful.

Main Risks of Commodity-Linked Investments. Commodity-linked investments are considered speculative and have substantial risks, including the risk of loss of a significant portion of their principal value. Prices of commodities and commodity-linked investments may fluctuate significantly over short periods due to a variety of factors, including for example agricultural, economic and regulatory developments. These risks may make commodity-linked investments more volatile than other types of investments.

Main Risks Of Investments In The Fund's Wholly-Owned Subsidiary. The Subsidiary is not registered under the Investment Company Act of 1940 and is not subject to its investor protections (except as otherwise noted in this prospectus). As an investor in the Subsidiary, the Fund does not have all of the protections offered to investors by the Investment Company Act of 1940. However, the Subsidiary is wholly-owned and controlled by the Fund and managed by the Manager. Therefore, the Fund's ownership and control of the Subsidiary make it unlikely that the Subsidiary would take actions contrary to the interests of the Fund or its shareholders.

Changes in the laws of the Cayman Islands (where the Subsidiary is organized) could prevent the Subsidiary from operating as described in this prospectus and could negatively affect the Fund and its shareholders. For example, the Cayman Islands currently does not impose certain taxes on exempted limited companies like the Subsidiary, including income and capital gains tax, among others. If Cayman Islands laws were changed to require such entities to pay Cayman Islands taxes, the investment returns of the Fund would likely decrease.

Who Is the Fund Designed For? The Fund's shares are available only as an investment option under certain variable annuity contracts, variable life insurance policies and other investment plans offered through insurance company separate accounts of participating insurance companies. The Fund is designed primarily for investors seeking high current income from a fund that invests in a variety of domestic and foreign debt securities, including government and lower-grade debt securities. Those investors should be willing to assume the greater risks of short-term share price fluctuations and the special credit risks that are typical for a fund that invests mainly in lower-grade fixed-income securities and foreign securities. The Fund does not seek capital appreciation. The Fund is not designed for investors needing an assured level of current income. The Fund is not a complete investment program and may not be appropriate for all investors. You should carefully consider your own investment goals and risk tolerance before investing in the Fund.

An investment in the Fund is not a deposit of any bank and is not insured or guaranteed by the Federal Deposit Insurance Corporation or any other government agency.


The Fund's Past Performance. The bar chart and table below provide some indication of the risks of investing in the Fund by showing changes in the Fund's Non-Service Shares performance from year to year and by showing how the Fund's average annual returns for 1, 5, and 10 years compare with those of two broad measures of market performance that reflect the markets in which the Fund typically invests. Charges imposed by the insurance accounts that invest in the Fund are not included and the returns would be lower if they were.  The Fund's past investment performance is not necessarily an indication of how the Fund will perform in the future. More recent performance information is available by calling the toll-free number on the back of this prospectus and on the Fund's website at: https://www.oppenheimerfunds.com/fund/investors/overview/GlobalStrategicIncomeFundVA


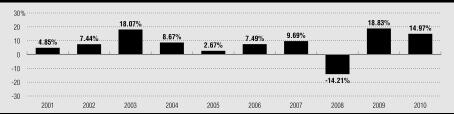
During the period shown, the highest return before taxes for a calendar quarter was 10.00% (2nd Qtr 09) and the lowest return before taxes for a calendar quarter was -9.84% (4th Qtr 08).


The following table shows the average annual total returns before taxes for each class of the Fund's shares.

The Citigroup World Government Bond Index is an unmanaged index of debt securities of major foreign governments.

Average Annual Total Returns for the periods ended December 31, 2010

1 Year

5 Years

10 Years (or life of class, if less)

Non-Service Shares (inception 05-03-93)

14.97%


6.68%


7.45%


Service Shares (inception 03-19-01)

14.77%


6.42%


7.00%


Barclays Capital U.S. Aggregate Bond Index

6.54%


5.80%


5.84%


(reflects no deductions for fees, expenses or taxes)


5.67%*


Citigroup World Government Bond Index

5.17%


7.08%


7.00%


(reflects no deductions for fees, expenses or taxes)


7.53%*


* From 3-31-01.


Investment Adviser. OppenheimerFunds, Inc. is the Fund's investment adviser (the "Manager").

Portfolio Managers. Arthur P. Steinmetz, the lead portfolio manager, has been a Vice President and portfolio manager of the Fund since May 1993. Krishna Memani, Joseph Welsh and Caleb Wong have been Vice Presidents and portfolio managers of the Fund since April 2009.  Sara J. Zervos has been a portfolio manager of the Fund since October 2010 and a Vice President of the Fund since November 2010.

Purchase and Sale of Fund Shares. Shares of the Fund may be purchased only by separate investment accounts of participating insurance companies as an underlying investment for variable life insurance policies, variable annuity contracts or other investment products. Individual investors cannot buy shares of the Fund directly. You may only submit instructions for buying or selling shares of the Fund to your insurance company or its servicing agent, not directly to the Fund or its Transfer Agent. The accompanying prospectus of the participating insurance company provides information about how to select the Fund as an investment option.

Taxes. Because shares of the Fund may be purchased only through insurance company separate accounts for variable annuity contracts, variable life insurance policies or other investment products, any dividends and capital gains distributions will be taxable to the participating insurance company, if at all. However, those payments may affect the tax basis of certain types of distributions from those accounts. Special tax rules apply to life insurance companies, variable annuity contracts and variable life insurance contracts. For information on federal income taxation of a life insurance company with respect to its receipt of distributions from the Fund and federal income taxation of owners of variable annuity or variable life insurance contracts, see the accompanying prospectus for the applicable contract.

Payments to Broker-Dealers and Other Financial Intermediaries. The Fund, the Manager, or their related companies may make payments to financial intermediaries, including to insurance companies that offer shares of the Fund as an investment option. These payments for the sale of Fund shares and related services may create a conflict of interest by influencing the intermediary and your salesperson to recommend the Fund over another investment. Ask your salesperson or visit your financial intermediary's website for more information.

MORE ABOUT THE FUND

About the Fund's Investments

The allocation of the Fund's portfolio among different types of investments will vary over time and the Fund's portfolio might not always include all of the different types of investments described below. The Statement of Additional Information contains more detailed information about the Fund's investment policies and risks.

THE FUND'S PRINCIPAL INVESTMENT STRATEGIES AND RISKS. The following strategies and types of investments are the ones that the Fund considers to be the most important in seeking to achieve its investment objective and the following risks are those the Fund expects its portfolio to be subject to as a whole.

Debt Securities. The Fund may invest in debt securities, including, but not limited to: U.S. and foreign government bonds and notes, collateralized mortgage obligations and other mortgage-related securities, asset-backed securities, participation interests in loans, investments in pooled investment entities (including those that invest in loans), "structured" notes, corporate debt obligations, including lower-grade, high-yield domestic and foreign corporate debt obligations, and "zero-coupon" and "stripped" securities.

Debt securities may be subject to the following risks:

  • Interest Rate Risk. The values of debt securities usually change when prevailing interest rates change. When interest rates rise, the values of outstanding debt securities generally fall, and those securities may sell at a discount from their face amount. When interest rates fall, the values of already-issued debt securities generally rise. However, when interest rates fall, the Fund's investments in new securities may be at lower yields and may reduce the Fund's income. The values of longer-term debt securities usually change more than the values of shorter-term debt securities when interest rates change.

       "Zero-coupon" or "stripped" securities may be particularly sensitive to interest rate changes.  Interest rate changes may have different effects on the values of mortgage-related securities because of prepayment and extension risks.

  • Prepayment Risk. Certain fixed-income securities (in particular mortgage-related securities) are subject to the risk of unanticipated prepayment. That is the risk that when interest rates fall, the issuer will repay the security prior to the security's expected maturity, or with respect to certain fixed-income securities, that borrowers will repay the loans that underlie these securities more quickly than expected, thereby causing the issuer of the security to repay the principal prior to expected maturity. The Fund may need to reinvest the proceeds at a lower interest rate, reducing its income. Securities subject to prepayment risk generally offer less potential for gains when prevailing interest rates fall. If the Fund buys those securities at a premium, accelerated prepayments on those securities could cause the Fund to lose a portion of its principal investment. The impact of prepayments on the price of a security may be difficult to predict and may increase the security's price volatility. Interest-only and principal-only securities are especially sensitive to interest rate changes, which can affect not only their prices but can also change the income flows and repayment assumptions about those investments.
  • Extension Risk. If interest rates rise rapidly, repayments of principal on certain debt securities may occur at a slower rate than expected and the expected maturity of those securities could lengthen as a result. Securities that are subject to extension risk generally have a greater potential for loss when prevailing interest rates rise, which could cause their values to fall sharply.
  • Credit Risk. Debt securities are also subject to credit risk. Credit risk is the risk that the issuer of a security might not make interest and principal payments on the security as they become due. U.S. Government securities generally have lower credit risks than securities issued by private issuers or certain foreign governments. If an issuer fails to pay interest, the Fund's income might be reduced, and if an issuer fails to repay principal, the value of the security might fall and the Fund could lose the amount of its investment in the security. The extent of this risk varies based on the terms of the particular security and the financial condition of the issuer. A downgrade in an issuer's credit rating or other adverse news about an issuer can reduce the market value of that issuer's securities.

Credit Quality.  The Fund may invest in securities that are rated or unrated. "Investment-grade" securities are those rated in one of the top four rating categories by nationally recognized statistical rating organizations such as Moody's or Standard & Poor's or unrated securities judged by the Manager to be of comparable quality. "Lower-grade" securities are those that are rated below those categories, which are also referred to as "junk bonds." While securities rated "Baa" by Moody's or "BBB" by Standard & Poor's are considered "investment-grade," they may also have some speculative characteristics. 

Credit ratings evaluate the expectation that scheduled interest and principal payments will be made in a timely manner. They do not reflect any judgment of market risk. Rating agencies might not always change their credit rating of an issuer in a timely manner to reflect events that could affect the issuer's ability to make scheduled payments on its obligations. In selecting securities for its portfolio and evaluating their income potential and credit risk, the Fund does not rely solely on ratings by rating organizations but evaluates business and economic factors affecting issuers as well. The ratings definitions of the principal ratings organizations are included in Appendix B to the Fund's Statement of Additional Information.

Because the Fund may purchase securities that are not rated by any nationally recognized statistical rating organization, the Manager may internally assign ratings to certain of those securities, after assessing their credit quality, in categories similar to those of nationally recognized statistical rating organizations. However, the Manager's rating does not constitute a guarantee of the credit quality. In evaluating the credit quality of a particular security, whether rated or unrated, the Manager will normally take into consideration a number of factors. Unrated securities also are considered investment-grade or below-investment grade if judged by the Manager to be comparable to rated investment-grade or below-investment grade securities. Some unrated securities may not have an active trading market, which means that the Fund might have difficulty selling them promptly at an acceptable price.

U.S. Government Securities. The Fund invests in securities issued or guaranteed by the U.S. Government or its agencies and instrumentalities. Some of those securities are directly issued by the U.S. Treasury and are backed by the full faith and credit of the U.S. Government. "Full faith and credit" means that the taxing power of the U.S. Government is pledged to the payment of interest and repayment of principal on a security.

Some securities issued by U.S. Government agencies, such as Government National Mortgage Association pass-through mortgage obligations ("Ginnie Maes"), are also backed by the full faith and credit of the U.S. Government. Others are supported by the right of the agency to borrow an amount from the U.S. Government (for example, "Fannie Mae" bonds issued by the Federal National Mortgage Association and "Freddie Mac" obligations issued by the Federal Home Loan Mortgage Corporation). Others are supported only by the credit of the agency (for example, obligations issued by the Federal Home Loan Banks). In September 2008, the Federal Housing Finance Agency placed the Federal National Mortgage Association and Federal Home Loan Mortgage Corporation into conservatorship. The U.S. Treasury also entered into a secured lending credit facility with those companies and a preferred stock purchase agreement. Under the preferred stock purchase agreement, the Treasury will ensure that each company maintains a positive net worth. 

     U.S. Treasury Securities. Treasury securities are backed by the full faith and credit of the United States for payment of interest and repayment of principal and have little credit risk. Some of the securities that are issued directly by the U.S. Treasury are: Treasury bills (having maturities of one year or less when issued), Treasury notes (having maturities of from one to ten years when issued), Treasury bonds (having maturities of more than ten years when issued) and Treasury Inflation-Protection Securities ("TIPS"). While U.S. Treasury securities have little credit risk, prior to their maturity they are subject to price fluctuations from changes in interest rates.

     Mortgage-Related Government Securities.  Mortgage-related government securities include interests in pools of residential or commercial mortgages, in the form of "pass-through" mortgage securities. They may be issued or guaranteed by the U.S. Government or its agencies and instrumentalities. Mortgage-related U.S. Government securities may be issued in different series, each having different interest rates and maturities.

Mortgage-related securities that are U.S. Government securities have collateral to secure payment of interest and principal. The collateral is either in the form of mortgage pass-through certificates issued or guaranteed by a U.S. agency or instrumentality or mortgage loans insured by a U.S. Government agency. The prices and yields of mortgage-related securities are determined, in part, by assumptions about the rate of payments of the underlying mortgages and are subject to prepayment and extension risks.

Private-Issuer Securities. The Fund can also invest in securities issued by private issuers, such as corporations, banks, savings and loans, and other entities, including mortgage-related securities. Securities issued by private issuers are subject to greater credit risks than U.S. Government securities.

     Mortgage-Related Private Issuer Securities. Primarily these investments include multi-class debt or pass-through certificates secured by mortgage loans, which may be issued by banks, savings and loans, mortgage bankers and other non-governmental issuers.  Private-issuer mortgage-backed securities may include loans on residential or commercial properties.

Mortgage-related securities, including CMOs, issued by private issuers are not U.S. Government securities, which makes them subject to greater credit risks. Private issuer securities are subject to the credit risks of the issuers as well as to interest rate risks, although in some cases they may be supported by insurance or guarantees. The prices and yields of private issuer mortgage-related securities are also subject to prepayment and extension risk. The market for private-issuer mortgage-backed securities may be volatile at times and may be less liquid than the markets for other types of securities.

Asset-Backed Securities. The Fund may invest in asset-backed securities, which are fractional interests in pools of loans, receivables or other assets. They are issued by trusts or other special purpose vehicles and are collateralized by the loans, receivables or other assets that make up the pool. The trust or other issuer passes the income from the underlying asset pool to the investor. Neither the Fund nor the Manager selects the loans, receivables or other assets that are included in the pools or the collateral backing those pools. Asset-backed securities are subject to interest rate risk and credit risk. These securities are subject to the risk of default by the issuer as well as by the borrowers of the underlying loans in the pool. Certain asset-backed securities are subject to prepayment and extension risks.

Forward Rolls. The Fund can enter into "forward roll" transactions (also referred to as "mortgage dollar rolls") with respect to mortgage-related securities. In this type of transaction, the Fund sells a mortgage-related security to a buyer and simultaneously agrees to repurchase a similar security at a later date at a set price. During the period between the sale and the repurchase, the Fund will not be entitled to receive interest and principal payments on the securities that have been sold. The Fund will bear the risk that the market value of the securities might decline below the price at which the Fund is obligated to repurchase them or that the counterparty might default in its obligations.

A substantial portion of the Fund's assets may be subject to forward roll transactions at any given time.

Zero-Coupon and Stripped Securities. Some of the debt securities the Fund may invest in are "zero-coupon" or "stripped" securities. Zero-coupon securities pay no interest prior to their maturity date or another specified date in the future but are issued at a discount from their face value. Stripped securities are the separate income or principal components of a debt security, such as Treasury securities whose coupons have been stripped by a Federal Reserve Bank. One component might receive all the interest and the other all the principal payments.

Interest rate changes generally cause greater price fluctuations in zero-coupon securities or the "principal-only" components of stripped securities than in interest-paying securities of the same or similar maturities. The Fund may be required to pay a dividend of the imputed income on a zero-coupon or principal-only security at a time when it has not actually received the income. The "interest-only" components of stripped securities are also especially sensitive to changes in prevailing interest rates. The market for some of these securities may be limited, making it difficult for the Fund to dispose of its holdings quickly at an acceptable price.

The Fund can invest up to 50% of its total assets in zero-coupon securities issued by either the U.S. Treasury or U.S. companies.

Participation Interests in Loans. These securities represent an undivided fractional interest in a loan obligation of a borrower. They are typically purchased from banks or dealers that have made the loan, or are members of the loan syndicate, and that act as the servicing agent for the principal and interest payments. The loans may be to U.S. or foreign companies. Participation interests may be collateralized or uncollateralized and are subject to the credit risk of the servicing agent as well as the credit risk of the borrower. If the Fund purchases a participation interest, it may only be able to enforce its rights through the lender. The Fund can also buy interests in trusts and other entities that hold loan obligations. In that case the Fund will be subject to the trust's credit risks as well as the credit risks of the servicing agent and the underlying loans. In some cases, participation interests, whether held directly by the Fund or indirectly through an interest in a trust or other entity, may be partially "unfunded," meaning that the Fund may be required to advance additional money on future dates.

Investments in Pooled Investment Entities that Invest in Loans. The Fund can also buy interests in trusts and other pooled entities (including other investment companies) that invest primarily or exclusively in loan obligations, including entities sponsored or advised by the Manager or an affiliate. The Fund will be subject to the pooled entity's credit risks as well as the credit risks of the underlying loans. The loans underlying these investments may include loans to foreign or U.S. borrowers, may be collateralized or uncollateralized and may be rated investment grade or below or may be unrated.

These investments are subject to the risk of default by the borrower, interest rate and prepayment risk, as well as credit risks of the pooled entity that holds the loan obligations.

High-Yield, Lower-Grade Debt Securities. The Fund may invest in high-yield, lower-grade fixed-income securities of U.S. and foreign issuers. Those securities may include, among others: bonds, debentures, notes, preferred stock, loan participation interests, "structured" notes, commercial mortgage-backed securities, and asset-backed securities. There are no limits on the amount of the Fund's assets that can be invested in securities rated below investment grade. These securities are generally considered speculative.

     Price Arbitrage. Because the Fund may invest in high yield bonds that may trade infrequently, investors might seek to trade fund shares based on their knowledge or understanding of the value of those securities (this is sometimes referred to as "price arbitrage"). If such price arbitrage were successful, it might interfere with the efficient management of the Fund's portfolio and the Fund may be required to sell securities at disadvantageous times or prices to satisfy the liquidity requirements created by that activity. Successful price arbitrage might also dilute the value of fund shares held by other shareholders.

Investing in Foreign Securities. The Fund can buy debt securities issued by foreign governments and issuers, as well as "supra-national" entities, such as the World Bank. The Fund's foreign debt investments can be denominated in U.S. dollars or in foreign currencies.

     While foreign securities may offer special investment opportunities, they are also subject to special risks.

  • Foreign Market Risk. If there are fewer investors in a particular foreign market, securities traded in that market may be less liquid and more volatile than U.S. securities. Foreign markets may also be subject to delays in the settlement of transactions and difficulties in pricing securities. If the Fund is delayed in settling a purchase or sale transaction, it may not receive any return on the invested assets or it may lose money if the value of the security declines. It may also be more expensive for the Fund to buy or sell securities in certain foreign markets than in the United States, which may increase the Fund's expense ratio.
  • Foreign Economy Risk. Foreign economies may be more vulnerable to political or economic changes than the U.S. economy. They may be more concentrated in particular industries or may rely on particular resources or trading partners to a greater extent. Certain foreign economies may be adversely affected by shortages of investment capital or by high rates of inflation. Changes in economic or monetary policy in the U.S. or abroad may also have a greater impact on the economies of certain foreign countries.
  • Foreign Governmental and Regulatory Risks. Foreign companies may not be subject to the same accounting and disclosure requirements as U.S. companies. As a result there may be less accurate information available regarding a foreign company's operations and financial condition. Foreign companies may be subject to capital controls, nationalization, or confiscatory taxes. Some countries also have restrictions that limit foreign ownership and may impose penalties for increases in the value of the Fund's investment. The value of the Fund's foreign investments may be affected if it experiences difficulties in enforcing legal judgments in foreign courts.
  • Foreign Currency Risk. A change in the value of a foreign currency against the U.S. dollar will result in a change in the U.S. dollar value of securities denominated in that foreign currency. If the U.S. dollar rises in value against a foreign currency, a security denominated in that currency will be worth less in U.S. dollars and if the U.S. dollar decreases in value against a foreign currency, a security denominated in that currency will be worth more in U.S. dollars. The dollar value of foreign investments may also be affected by exchange controls.
    The Fund can also invest in derivative instruments linked to foreign currencies. The change in value of a foreign currency against the U.S. dollar will result in a change in the U.S. dollar value of derivatives linked to that foreign currency.
  • Foreign Custody Risk. There may be very limited regulatory oversight of certain foreign banks or securities depositories that hold foreign securities and foreign currency and the laws of certain countries may limit the ability to recover such assets if a foreign bank or depository or their agents goes bankrupt.
  • Time Zone Arbitrage. If the Fund invests a significant amount of its assets in foreign securities, it may be exposed to "time-zone arbitrage" attempts by investors seeking to take advantage of differences in the values of foreign securities that might result from events that occur after the close of the foreign securities market on which a security is traded and before the close of the New York Stock Exchange that day, when the Fund's net asset value is calculated. If such time zone arbitrage were successful, it might dilute the interests of other shareholders. However, the Fund's use of "fair value pricing" under certain circumstances, to adjust the closing market prices of foreign securities to reflect what the Manager and the Board believe to be their fair value, may help deter those activities.

     These risks may be greater for investments in emerging or developing market countries.

 Derivative Investments. The Fund can invest in "derivative" instruments. A derivative is an instrument whose value depends on (or is derived from) the value of an underlying security, asset, interest rate, index or currency. Derivatives may allow the Fund to increase or decrease its exposure to certain markets or risks.

The Fund may use derivatives to seek to increase its investment return or for hedging purposes. The Fund is not required to use derivatives in seeking its investment objective or for hedging and might not do so.

       Options, futures, forward contracts, swaps, "structured" notes, certain mortgage-related securities and event-linked bonds are some of the derivatives that the Fund may use. The Fund may also use other types of derivatives that are consistent with its investment strategies or hedging purposes.

"Structured" Notes. "Structured" notes are specially-designed derivative debt instruments. The terms of the instrument may be determined or "structured" by the purchaser and the issuer of the note. Payments of principal or interest on these notes may be linked to the value of an index (such as a currency or securities index), one or more securities, a commodity or the financial performance of one or more obligors. The value of these notes will normally rise or fall in response to the changes in the performance of the underlying security, index, commodity or obligor.

Risks of Structured Notes. Structured notes are subject to interest rate risk. They are also subject to credit risk with respect both to the issuer and, if applicable, to the underlying security or obligor. If the underlying investment or index does not perform as anticipated, the structured note might pay less interest than the stated coupon payment or repay less principal upon maturity. The price of structured notes may be very volatile and they may have a limited trading market, making it difficult to value them or sell them at an acceptable price. In some cases, the Fund may enter into agreements with an issuer of structured notes to purchase a minimum amount of those notes over time.

In some cases, the Fund may invest in structured notes that pay an amount based on a multiple of the relative change in value of the underlying investment or index. This type of note increases the potential for income but at a greater risk of loss than a typical debt security of the same maturity and credit quality.

Credit Default Swaps. A credit default swap enables an investor to buy or sell protection against a credit event with respect to an issuer, such as an issuer's failure to make timely payments of interest or principal on its debt obligations, bankruptcy or restructuring. The terms of the instrument are generally negotiated by the Fund and the swap counterparty. A credit default swap may be embedded within a structured note or other derivative instrument.

Generally, if the Fund buys credit protection using a credit default swap, the Fund will make fixed payments to the counterparty and if a credit event occurs with respect to the applicable issuer, the Fund will deliver the issuer's defaulted bonds underlying the swap to the swap counterparty and the counterparty will pay the Fund par for the bonds. If the Fund sells credit protection using a credit default swap, generally the Fund will receive fixed payments from the counterparty and if a credit event occurs with respect to the applicable issuer, the Fund will pay the swap counterparty par for the issuer's defaulted bonds and the swap counterparty will deliver the bonds to the Fund. Alternatively, a credit default swap may be cash settled and the buyer of protection would receive the difference between the par value and the market value of the issuer's defaulted bonds from the seller of protection. If the credit default swap is on a basket of issuers, the notional value of the swap is reduced by the amount represented by that issuer, and the fixed payments are then made on the reduced notional value.

     Risks of Credit Default Swaps. Credit default swaps are subject to credit risk of the underlying issuer and to counterparty credit risk. If the counterparty fails to meet its obligations, the Fund may lose money. Credit default swaps are also subject to the risk that the Fund will not properly assess the risk of the underlying issuer. If the Fund is selling credit protection, there is a risk that a credit event will occur and that the Fund will have to pay the counterparty. If the Fund is buying credit protection, there is a risk that no credit event will occur and the Fund will receive no benefit for the premium paid.

Interest Rate Swaps.   In an interest rate swap, the Fund and another party exchange the right to receive interest payments on a security or payments based on a reference rate. For example, they might swap the right to receive floating rate payments based on a reference rate such as "LIBOR" for the right to receive fixed rate payments. The terms of the instrument are generally negotiated by the Fund and the swap counterparty. An interest rate swap may be embedded within a structured note or other derivative instrument.

     Risks of Interest Rate Swaps . Interest rate swaps are subject to interest rate risk and credit risk. An interest rate swap transaction could result in losses if the underlying asset or reference rate does not perform as anticipated. Interest rate swaps are also subject to counterparty risk. If the counterparty fails to meet its obligations, the Fund may lose money.

Total Return Swaps. In a total return swap transaction, one party agrees to pay the other party an amount equal to the total return on a defined underlying asset or a non-asset reference during a specified period of time. The underlying asset might be a security or basket of securities or a non-asset reference such as a securities index. In return, the other party would make periodic payments based on a fixed or variable interest rate or on the total return from a different underlying asset or non-asset reference.

     Risks of Total Return Swaps. Total return swaps could result in losses if the underlying asset or reference does not perform as anticipated. Total return swaps can have the potential for unlimited losses. They are also subject to counterparty risk. If the counterparty fails to meet its obligations, the Fund may lose money.

Swap Transactions.  There is no central exchange or market for swap transactions and therefore they are less liquid than exchange-traded instruments.

Hedging. Hedging transactions are intended to reduce the risks of securities in the Fund's portfolio. At times, however, a hedging instrument's value might not be correlated with the investment it is intended to hedge, and the hedge might be unsuccessful. If the Fund uses a hedging instrument at the wrong time or judges market conditions incorrectly, the strategy could reduce its return or create a loss.

Foreign Currency Forwards and Options.  Foreign currency forward contracts are used to buy or sell foreign currency for future delivery at a fixed price. They are used to lock in the U.S. dollar price of a security denominated in a foreign currency, or to protect against possible losses from changes in the relative value of the U.S. dollar against a foreign currency. Forward contracts involve the risk that anticipated currency movements will not be accurately predicted, which could result in losses on those contracts and additional transaction costs. The use of forward contracts could reduce performance if there are unanticipated changes in currency prices. Options on foreign currencies may be used to try to protect against declines in the U.S. dollar value of foreign securities the Fund owns and against increases in the dollar cost of foreign securities the Fund anticipates buying. Options on foreign currencies are affected by the factors that influence foreign exchange rates and investments generally. The Fund's ability to establish and close out positions on foreign currency options is subject to the maintenance of a liquid secondary market, and there can be no assurance that a liquid secondary market will exist for a particular option at any specific time.

 Risks of Derivative Investments. Derivatives may be volatile and may involve significant risks. The underlying security, obligor or other instrument on which a derivative is based, or the derivative itself, may not perform the way the Manager expects it to. The Fund may lose money on a derivative investment if the issuer or counterparty fails to pay the amount due. Certain derivative investments held by the Fund may be illiquid, making it difficult to close out an unfavorable position. Derivative transactions may require the payment of premiums and can increase portfolio turnover. As a result, the Fund could realize little or no income or lose principal from the investment, or a hedge might be unsuccessful. For some derivatives, it is possible for the Fund to lose more than the amount invested in the derivative instrument. Some derivatives have the potential for unlimited loss, regardless of the size of the Fund's initial investment.

Commodity-Linked Derivatives. A commodity-linked derivative is a derivative instrument whose value is linked to the price movement of a commodity, commodity index, or commodity option or futures contract. The value of some commodity-linked derivatives may be based on a multiple of those price movements. The Fund is subject to legal requirements, applicable to all mutual funds, that are designed to reduce the effects of any leverage created by the use of derivative instruments.

Commodity-Linked Notes. A commodity-linked note is a derivative instrument that has characteristics of both a debt security and a commodity-linked derivative. It typically makes interest payments like a debt security and at maturity the principal payment is linked to the price movement of a commodity, commodity index, or commodity option or futures contract. Commodity-linked notes are typically issued by a bank, other financial institution or a commodity producer, and the Fund negotiates with the issuer to obtain specific terms and features that are tailored to the Fund's investment needs.

     Commodity-linked notes may be principal-protected, partially-protected, or offer no principal protection. A principal-protected commodity-linked note means that the issuer will pay, at a minimum, the par value of the note at maturity. With a partially-protected or no-principal-protection commodity-linked note, the Fund may receive at maturity an amount less than the note's par value if the commodity, index or other economic variable value to which the note is linked declines over the term of the note.

     Risks of Commodity-Linked Investments. Investments linked to the prices of commodities are considered speculative. The values of commodities and commodity-linked investments are affected by events that might have less impact on the values of stocks and bonds. Prices of commodities and related contracts may fluctuate significantly over short periods due to a variety of factors, including changes in supply and demand relationships, weather, agriculture, fiscal, and exchange control programs, disease, pestilence, and international economic, political, military and regulatory developments. These risks may make commodity-linked investments more volatile than other types of investments. The commodity-linked instruments in which the Fund invests have substantial risks, including risk of loss of a significant portion of their principal value.

The commodity markets are subject to temporary distortions and other disruptions due to, among other factors, lack of liquidity, the participation of speculators, and government regulation and other actions. U.S. futures exchanges and some foreign exchanges limit the amount of fluctuation in futures contract prices which may occur in a single business day (generally referred to as "daily price fluctuation limits"). The maximum or minimum price of a contract as a result of these limits is referred to as a "limit price." If the limit price has been reached in a particular contract, no trades may be made beyond the limit price. Limit prices have the effect of precluding trading in a particular contract or forcing the liquidation of contracts at disadvantageous times or prices. These circumstances could adversely affect the value of the commodity-linked investments.

Investments in the Fund's Wholly-Owned Subsidiary. The Fund may invest up to 25% of its total assets in the Subsidiary. The Subsidiary invests primarily in commodity-linked derivatives (including commodity futures, financial futures, options and swap contracts), and certain fixed-income securities and other investments that may serve as margin or collateral for its derivatives positions.

Investment in the Subsidiary is expected to provide the Fund with exposure to the commodities markets within the limitations of the federal tax requirements of Subchapter M of the Internal Revenue Code ("Subchapter M"). Subchapter M requires, among other things, that at least 90% of the Fund's gross income be derived from securities or derived with respect to its business of investing in securities (typically referred to as "qualifying income"). Income from certain of the commodity-linked derivatives in which the Fund invests may not be treated as "qualifying income" for purposes of the 90% income requirement. The Fund has received a private letter ruling from the Internal Revenue Service confirming that income from the Fund's investment in the Subsidiary constitutes "qualifying income" for purposes of Subchapter M.


OTHER INVESTMENT STRATEGIES AND RISKS. The Fund can also use the investment techniques and strategies described below. The Fund might not use all of these techniques or strategies or might only use them from time to time.

Diversification and Concentration.  The Fund is a diversified fund. It attempts to reduce its exposure to the risks of individual securities by diversifying its investments across a broad number of different companies. The Fund will not concentrate more than 25% of its total assets in issuers in any one industry.  At times, however, the Fund may emphasize investments in some industries more than others.

The Fund will not concentrate more than 25% of its total assets in the securities of any one foreign government.

Special Portfolio Diversification Requirements. To enable a variable annuity or variable life insurance contract based on an insurance company separate account to qualify for favorable tax treatment under the Internal Revenue Code, the underlying investments must follow special diversification requirements that limit the percentage of assets that can be invested in securities of particular issuers. The Fund's investment program is managed to meet those requirements, in addition to other diversification requirements under the Internal Revenue Code and the Investment Company Act of 1940 that apply to publicly-sold mutual funds.

Failure by the Fund to meet those special requirements could cause earnings on a contract owner's interest in an insurance company separate account to be taxable income. Those diversification requirements might also limit, to some degree, the Fund's investment decisions in a way that could reduce its performance.

Common Stock and Other Equity Investments. Equity securities include common stock, preferred stock, rights, warrants and certain securities that are convertible into common stock. Equity investments may be exchange-traded or over-the-counter securities. Common stock represents an ownership interest in a company. It ranks below preferred stock and debt securities in claims for dividends and in claims for assets of the issuer in a liquidation or bankruptcy.

Preferred stock has a set dividend rate and ranks ahead of common stocks and behind debt securities in claims for dividends and for assets of the issuer in a liquidation or bankruptcy. The dividends on preferred stock may be cumulative (they remain a liability of the company until paid) or non-cumulative. The fixed dividend rate of preferred stocks may cause their prices to behave more like those of debt securities. When interest rates rise, the value of preferred stock having a fixed dividend rate tends to fall.

A convertible security can be converted into or exchanged for a set amount of common stock of an issuer within a particular period of time at a specified price or according to a price formula. Convertible debt securities pay interest and convertible preferred stocks pay dividends until they mature or are converted, exchanged or redeemed. Convertible securities may provide more income than common stock but they generally provide less income than comparable non-convertible debt securities. Convertible securities are subject to credit and interest rate risk. The credit ratings of convertible securities generally have less impact on the value of those securities than they do on non-convertible debt securities, however.

Risks of Investing in Equity Securities. Stocks and other equity securities fluctuate in price in response to changes in equity markets in general. Equity markets may experience great short-term volatility and may fall sharply at times. Different markets may behave differently from each other and U.S. equity markets may move in the opposite direction from one or more foreign markets.

The prices of equity securities generally do not all move in the same direction at the same time and a variety of factors can affect the price of a particular company's securities. These factors may include: poor earnings reports, a loss of customers, litigation, or changes in government regulations affecting the company or its industry.

Investments in Mining Securities and Metal Investments. The Fund may invest directly in, or indirectly through the Subsidiary or by means of derivative instruments, securities issued by companies that are involved in mining or processing or dealing in gold or other metals or minerals. These securities are described as "Mining Securities." The Fund may also invest up to 10% of its total assets in gold or silver bullion, in other precious metals, in metals naturally occurring with precious metals, in certificates representing an ownership interest in those metals, and in gold or silver coins. These investments are referred to as "Metal Investments." The Fund's investment in Gold ETFs is subject to this investment restriction.

     Special Risks of Concentrating Investments in Mining Securities and Metal Investments. Investments in Mining Securities and Metal Investments involve additional risks and considerations not typically associated with other types of investments: (1) the risk of substantial price fluctuations of gold and precious metals; (2) the concentration of gold supply is mainly in five territories (South Africa, Australia, the Commonwealth of Independent States (the former Soviet Union), Canada and the United States), and the prevailing economic and political conditions of these countries may have a direct effect on the production and marketing of gold and sales of central bank gold holdings; (3) unpredictable international monetary policies, economic and political conditions; (4) possible U.S. Governmental regulation of Metal Investments, as well as foreign regulation of such investments; and (5) possible adverse tax consequences for the Fund in making Metal Investments, if it fails to qualify as a "regulated investment company" under the Internal Revenue Code.

Investing in Gold ETFs. Shares of Gold ETFs generally represent units of fractional undivided beneficial interests in a trust. The shares are intended to reflect the performance of the price of gold bullion. Because a Gold ETF has operating expenses and transaction and other costs (including storage and insurance costs) while the price of gold bullion does not, a Gold ETF will sell gold from time to time to pay expenses. This will reduce the amount of gold represented by each Gold ETF share, irrespective of whether the trading price of the shares rises or falls in response to changes in the price of gold. An investment in a Gold ETF is subject to all of the risks of investing directly in gold bullion. In addition, the market value of the shares of the Gold ETF may differ from their net asset value because the supply and demand in the market for shares of the Gold ETF at any point in time is not always identical to the supply and demand in the market for the underlying assets. Gold ETFs also have management fees that are part of their costs, and the Fund will indirectly bear its proportionate share of those costs. Under certain circumstances, a Gold ETF could be terminated. Should termination occur, the Gold ETF could have to liquidate its holdings at a time when the price of gold is falling.

Municipal Securities. The Fund may invest in municipal securities. Municipal securities are fixed-income securities primarily issued by states, cities, counties and other governmental entities in the United States to raise money for a variety of public or private purposes, including financing state or local governments, financing specific projects, or financing public facilities. The interest received from most municipal bonds is exempt from federal, state or local income taxes in the municipalities where the bonds are issued, however the Fund can invest in municipal securities because the portfolio managers believe they offer attractive yields relative to the yields and risks of other debt securities, rather than to seek tax-exempt interest income for distribution to shareholders.

Risks of Investing in Municipal Securities . Municipal securities may be subject to interest rate risk and credit risk.   The value of the Fund's investment in municipal securities will be highly sensitive to events affecting the fiscal stability of the states, municipalities, agencies, authorities and other instrumentalities that issue the municipal securities. In particular, economic, legislative, regulatory or political developments affecting the ability of a state's issuers to pay interest or repay principal may significantly affect the value of the Fund's investments in these securities. These developments can include or arise from, for example, insolvency of an issuer, uncertainties related to the tax status of municipal securities, tax base erosion, state constitutional limits on tax increases, budget deficits and other financial difficulties, or changes in the credit ratings assigned to the state's municipal issuers. Other occurrences, such as catastrophic natural disasters, can also adversely affect a state's fiscal stability. The recent national economic crisis, among other factors, has caused deterioration in the economies of many states, resulting in an adverse impact on states' spending, revenues and state budgets that has caused many states to operate under significant financial stress.

When-Issued and Delayed-Delivery Transactions. The Fund may purchase securities on a "when-issued" basis and may purchase or sell such securities on a "delayed-delivery" basis. When-issued and delayed-delivery securities are purchased at a price that is fixed at the time of the transaction, with payment and delivery of the security made at a later date. When purchasing securities in this manner, during the period between purchase and settlement, the Fund makes no payment to the issuer (or seller) of the security and no interest accrues to the Fund from the investment.

The securities are subject to changes in value from market fluctuations during the period until settlement and the value of the security on the delivery date may be more or less than the Fund paid. The Fund may lose money if the value of the security declines below the purchase price.

Illiquid and Restricted Securities. Investments that do not have an active trading market, or that have legal or contractual limitations on their resale, are generally referred to as "illiquid" securities. Illiquid securities may be difficult to value or to sell promptly at an acceptable price or may require registration under applicable securities laws before they can be sold publicly. Securities that have limitations on their resale are referred to as "restricted securities." Certain restricted securities that are eligible for resale to qualified institutional purchasers may not be regarded as illiquid.

     The Fund will not invest more than 15% of its net assets in illiquid securities.  The Manager monitors the Fund's holdings of illiquid securities on an ongoing basis to determine whether to sell any of those securities to maintain adequate liquidity.

Conflicts of Interest. The investment activities of the Manager and its affiliates in regard to other funds and accounts they manage may present conflicts of interest that could disadvantage the Fund and its shareholders. The Manager or its affiliates may provide investment advisory services to other funds and accounts that have investment objectives or strategies that differ from, or are contrary to, those of the Fund. That may result in another fund or account holding investment positions that are adverse to the Fund's investment strategies or activities. Other funds or accounts advised by the Manager or its affiliates may have conflicting interests arising from investment objectives that are similar to those of the Fund. Those funds and accounts may engage in, and compete for, the same types of securities or other investments as the Fund or invest in securities of the same issuers that have different, and possibly conflicting, characteristics. The trading and other investment activities of those other funds or accounts may be carried out without regard to the investment activities of the Fund and, as a result, the value of securities held by the Fund or the Fund's investment strategies may be adversely affected. The Fund's investment performance will usually differ from the performance of other accounts advised by the Manager or its affiliates and the Fund may experience losses during periods in which other accounts advised by the Manager or its affiliates achieve gains. The Manager has adopted policies and procedures designed to address potential conflicts of interest identified by the Manager; however, such policies and procedures may also limit the Fund's investment activities and affect its performance.

     The Fund offers its shares to separate accounts of different insurance companies, as an investment for their variable annuity contracts, variable life insurance policies and other investment products. While the Fund does not foresee any disadvantages to contract owners from these arrangements, it is possible that the interests of owners of different contracts participating in the Fund through different separate accounts might conflict. For example, a conflict could arise because of differences in tax treatment.

Investments in Oppenheimer Institutional Money Market Fund. The Fund can invest its free cash balances in Class E shares of Oppenheimer Institutional Money Market Fund to provide liquidity or for defensive purposes. The Fund invests in Oppenheimer Institutional Money Market Fund, rather than purchasing individual short-term investments, to seek a higher yield than it could obtain on its own. Oppenheimer Institutional Money Market Fund is a registered open-end management investment company, regulated as a money market fund under the Investment Company Act of 1940, and is part of the Oppenheimer family of funds. It invests in a variety of short-term, high-quality, dollar-denominated money market instruments issued by the U.S. Government, domestic and foreign corporations, other financial institutions, and other entities. Those investments may have a higher rate of return than the investments that would be available to the Fund directly. At the time of an investment, the Fund cannot always predict what the yield of the Oppenheimer Institutional Money Market Fund will be because of the wide variety of instruments that fund holds in its portfolio. The return on those investments may, in some cases, be lower than the return that would have been derived from other types of investments that would provide liquidity. As a shareholder, the Fund will be subject to its proportional share of the expenses of Oppenheimer Institutional Money Market Fund's Class E shares, including its advisory fee. However, the Manager will waive a portion of the Fund's advisory fee to the extent of the Fund's share of the advisory fee paid to the Manager by Oppenheimer Institutional Money Market Fund.

Investments in Other Investment Companies. The Fund can also invest in the securities of other investment companies, which can include open-end funds, closed-end funds, unit investment trusts and business development companies. One reason the Fund might do so is to gain exposure to segments of the markets represented by another fund, at times when the Fund might not be able to buy the particular type of securities directly. As a shareholder of an investment company, the Fund would be subject to its ratable share of that investment company's expenses, including its advisory and administration expenses. The Fund does not intend to invest in other investment companies unless the Manager believes that the potential benefits of the investment justify the payment of any premiums or sales charges.

Temporary Defensive and Interim Investments. For temporary defensive purposes in times of adverse or unstable market, economic or political conditions, the Fund can invest up to 100% of its total assets in investments that may be inconsistent with the Fund's principal investment strategies. Generally, the Fund would invest in shares of Oppenheimer Institutional Money Market Fund or in the types of money market instruments in which Oppenheimer Institutional Money Market Fund invests or in other short-term U.S. Government securities. The Fund might also hold these types of securities as interim investments pending the investment of proceeds from the sale of Fund shares or the sale of Fund portfolio securities or to meet anticipated redemptions of Fund shares. To the extent the Fund invests in these securities, it might not achieve its investment objective.

Portfolio Turnover . A change in the securities held by the Fund is known as "portfolio turnover." The Fund may engage in active and frequent trading to try to achieve its investment objective and may have a portfolio turnover rate of over 100% annually. Increased portfolio turnover may result in higher brokerage fees or other transaction costs, which can reduce performance. The Financial Highlights table at the end of this prospectus shows the Fund's portfolio turnover rates during past fiscal years.

CHANGES TO THE FUND'S INVESTMENT POLICIES. The Fund's fundamental investment policies cannot be changed without the approval of a majority of the Fund's outstanding voting shares; however, the Fund's Board can change non-fundamental policies without a shareholder vote. Significant policy changes will be described in supplements to this prospectus. Shareholders will receive 60 days advance notice of any change in the 80% investment policy described in "Principal Investment Strategies." The Fund's investment objective is a fundamental policy. Other investment restrictions that are fundamental policies are listed in the Fund's Statement of Additional Information. An investment policy is not fundamental unless this prospectus or the Statement of Additional Information states that it is.

PORTFOLIO HOLDINGS.   The Fund's portfolio holdings are included in its semi-annual and annual reports that are distributed to its shareholders within 60 days after the close of the applicable reporting period. The Fund also discloses its portfolio holdings in its Statements of Investments on Form N-Q, which are public filings that are required to be made with the Securities and Exchange Commission within 60 days after the end of the Fund's first and third fiscal quarters. Therefore, the Fund's portfolio holdings are made publicly available no later than 60 days after the end of each of its fiscal quarters. In addition, the Fund's portfolio holdings information, as of the end of each calendar month, may be posted and available on the Fund's website no sooner than 30 days after the end of each calendar month.    

A description of the Fund's policies and procedures with respect to the disclosure of its portfolio holdings is available in the Fund's Statement of Additional Information.

How the Fund is Managed

THE MANAGER. OppenheimerFunds, Inc., the Manager, chooses the Fund's investments and handles its day-to-day business. The Manager carries out its duties, subject to the policies established by the Fund's Board of Trustees, under an investment advisory agreement that states the Manager's responsibilities. The agreement sets the fees the Fund pays to the Manager and describes the expenses that the Fund is responsible to pay to conduct its business.

The Manager has been an investment adviser since 1960. The Manager is located at Two World Financial Center, 225 Liberty Street, 11th Floor, New York, New York 10281-1008.

Advisory Fees.  Under the investment advisory agreement, the Fund pays the Manager an advisory fee at an annual rate that declines on additional assets as the Fund grows: 0.75% of the first $200 million of average annual net assets, 0.72% of the next $200 million, 0.69% of the next $200 million, 0.66% of the next $200 million, 0.60% on the next $200 million and 0.50% of average annual net assets over $1 billion. The Fund's management fee for its fiscal year ended December 31, 2010, was 0.56% of the Fund's average annual net assets for each class of shares.

The Manager has contractually agreed to waive the management fee it will receive from the Fund in an amount equal to the management fee to be paid to the Manager by the Subsidiary. This undertaking will continue to be in effect for so long as the Fund invests in the Subsidiary, and may not be terminated by the Manager unless the Manager obtains the prior approval of the Fund's Board of Trustees for such termination.

The Manager has voluntarily agreed to waive fees and/or reimburse Fund expenses in an amount equal to the indirect management fees incurred through the Fund's investments in Oppenheimer Institutional Money Market Fund, Oppenheimer Master Loan Fund, LLC and Oppenheimer Master Event-Linked Bond Fund, LLC. This voluntary fee waiver and/or reimbursement may not be amended or withdrawn until one year after the date of this prospectus. The Manager has voluntarily agreed to limit the Fund's total annual operating expenses so that those expenses, as percentages of daily net assets, will not exceed the annual rate of 0.75% for Non-Service Shares and 1.00% for Service Shares. This voluntary expense limitation may be amended or withdrawn at any time. During the fiscal year ended December 31, 2010, the amount waived in connection with the limitation did not exceed 0.01% and therefore is not reflected in the Annual Fund Operating Expenses table shown earlier in this prospectus. After all waivers and reimbursements, the actual total annual fund operating expenses for the fiscal year ended December 31, 2010 were those shown in the Annual Fund Operating Expenses table earlier in this prospectus. The Fund's management fee and other annual operating expenses may vary in future years.

A discussion regarding the basis for the Board of Trustees' approval of the Fund's investment advisory contract is available in the Fund's Annual Report to shareholders for the year ended December 31, 2010.

Portfolio Managers. The Fund's portfolio is managed by Arthur P. Steinmetz, the lead portfolio manager, Krishna Memani, Joseph Welsh, Caleb Wong and Sara J. Zervos, who are primarily responsible for the day-to-day management of the Fund's investments. Mr. Steinmetz has been the portfolio manager and Vice President of the Fund since May 1993. Messrs. Memani, Welsh and Wong have been portfolio managers and Vice Presidents of the Fund since April 2009. Ms. Zervos has been a portfolio manager of the Fund since October 2010 and a Vice President of the Fund since November 2010.

Mr. Steinmetz has been the Chief Investment Officer of the Manager since October 2010; Chief Investment Officer, Fixed-Income, of the Manager from April 2009 to October 2010; Executive Vice President of the Manager since October 2009; Director of Fixed Income of the Manager from January 2009 to April 2009 and a Senior Vice President of the Manager from March 1993 to September 2009.  He is a portfolio manager and an officer of other portfolios in the OppenheimerFunds complex.

Mr. Memani has been the Director of Fixed Income of the Manager since October 2010 and a Senior Vice President and Head of the Investment Grade Fixed Income Team of the Manager since March 2009. Mr. Memani was a Managing Director and Head of the U.S. and European Credit Analyst Team at Deutsche Bank Securities from June 2006 through January 2009. He was the Chief Credit Strategist at Credit Suisse Securities from August 2002 through March 2006. He was a Managing Director and Senior Portfolio Manager at Putnam Investments from September 1998 through June 2002. Mr. Memani is a portfolio manager and an officer of other portfolios in the OppenheimerFunds complex.

     Mr. Welsh, CFA, has been the Head of the Manager's High Yield Corporate Debt Team since April 2009; Senior Vice President of the Manager since May 2009 and a Vice President of the Manager from December 2000 to April 2009. He was an Assistant Vice President of the Manager from December 1996 to November 2000 and a high yield bond analyst of the Manager from January 1995 to December 1996. He was a senior bond analyst with W.R. Huff Asset Management from November 1991 to December 1994. Mr. Welsh is a portfolio manager and officer of other portfolios in the OppenheimerFunds complex.

    Mr. Wong has been a Vice President of the Manager since June 1999 and has worked in fixed-income quantitative research and risk management for the Manager since July 1996. He has been a member of the Manager's Asset Allocation Committee since April 2005. Mr. Wong is a portfolio manager and an officer of other portfolios in the OppenheimerFunds complex.

     Ms. Zervos has been a Senior Vice President of the Manager since January 2011 and was a Vice President of the Manager from April 2008 to December 2010. She was a portfolio manager with Sailfish Capital Management from May 2007 to February 2008 and a portfolio manager for emerging market debt at Dillon Read Capital Management and OTA Asset Management from June 2004 to April 2007. Ms. Zervos is a portfolio manager and officer of other portfolios in the OppenheimerFunds complex.

     The Statement of Additional Information provides additional information about the portfolio managers' compensation, other accounts they manage and their ownership of Fund shares.

ABOUT THE FUND'S WHOLLY-OWNED SUBSIDIARY. The Subsidiary is a company organized under the laws of the Cayman Islands and is overseen by its own board of directors. The Fund is the sole shareholder of the Subsidiary and it is currently expected that shares of the Subsidiary will not be sold or offered to other investors. If, at any time in the future, the Subsidiary proposes to offer or sell its shares to any investor other than the Fund, shareholders will receive 60 days' prior notice of such offer or sale and this prospectus will be revised accordingly.

The Manager is responsible for the Subsidiary's day-to-day business and investment operations pursuant to an investment advisory agreement with the Subsidiary. Under that agreement, the Manager provides the Subsidiary with the same type of management services, under the same terms, as are provided to the Fund. The Subsidiary's investment advisory agreement provides for its automatic termination upon the termination of the Fund's Investment Advisory Agreement. The Subsidiary has also entered into separate contracts for the provision of custody, transfer agency, and audit services with the same service providers as those engaged by the Fund. In addition, it is expected that an adviser affiliated with the Manager will be engaged to provide sub-advisory services to the Subsidiary.

The Subsidiary is managed pursuant to compliance policies and procedures that are the same, in all material respects, as those adopted by the Fund. As a result, in managing the Subsidiary's portfolio, the Manager is subject to the same investment policies and restrictions that apply to the management of the Fund, and, in particular, to the requirements relating to portfolio leverage, liquidity, brokerage, and the timing and method of the valuation of the Subsidiary's portfolio investments and shares of the Subsidiary. The Fund's Chief Compliance Officer oversees implementation of the Subsidiary's policies and procedures, and makes periodic reports to the Fund's Board regarding the Subsidiary's compliance with its policies and procedures.

The Manager has contractually agreed to waive the management fee it receives from the Fund in an amount equal to the management fee paid to the Manager by the Subsidiary. This undertaking will continue in effect for as long as the Fund invests in the Subsidiary, and may not be terminated by the Manager unless the Manager obtains the prior approval of the Fund's Board of Trustees. The rate of the management fee paid directly or indirectly by the Fund, calculated by aggregating the fees paid to the Manager by the Fund (after the waiver described above) and the Subsidiary, may not increase without the prior approval of the Board and a majority of the Fund's shareholders. The Subsidiary also bears the fees and expenses incurred in connection with the custody, transfer agency, and audit services that it receives. The Fund expects that the expenses borne by the Subsidiary will not be material in relation to the value of the Fund's assets. It is also anticipated that the Fund's expenses will be reduced to a certain extent as a result of the payment of such expenses at the Subsidiary level. It is therefore expected that the Fund's investment in the Subsidiary will not result in the Fund paying duplicative fees for similar services provided to the Fund and the Subsidiary.

The financial statements of the Subsidiary are included in the Fund's Annual and Semi-Annual Reports provided to shareholders (which include the Subsidiary's full audited financial statements and unaudited financial statements, respectively). Copies of the reports are provided without charge upon request as indicated on the back cover of this prospectus. Please refer to the Statement of Additional Information for additional information about the organization and management of the Subsidiary.

INVESTING IN THE FUND 

How to Buy and Sell Shares

You may only submit instructions for buying or selling shares of the Fund to your insurance company or its servicing agent, not directly to the Fund or its Transfer Agent. Information about your investment in the Fund can only be obtained from your participating insurance company or its servicing agent. The Fund's Transfer Agent does not hold or have access to those records.

WHAT CLASSES OF SHARES DOES THE FUND OFFER? The Fund currently offers two different classes of shares. The different classes of shares represent investments in the same portfolio of securities, but the classes are subject to different expenses and will usually have different share prices. The Service Shares are subject to a distribution and service plan. The expenses of that plan are described below. The Non-Service Shares are not subject to a service and distribution plan.

THE PRICE OF FUND SHARES. Fund shares are sold to participating insurance companies, and are redeemed, at their net asset value per share. The net asset value that applies to a purchase order is the next one calculated after the insurance company (as the Fund's designated agent to receive purchase orders) receives the order from its contract owner, in proper form. Fund shares are redeemed at the next net asset value calculated after the insurance company (as the Fund's designated agent to receive purchase orders) receives the order from its contract owner, in proper form. The Fund's Transfer Agent generally must receive the purchase or redemption order from the insurance company by 9:30 a.m. Eastern Time on the next regular business day.

The Fund does not impose any sales charge on purchases of its shares. If there are any charges imposed under the variable annuity, variable life or other contract through which Fund shares are purchased, they are described in the accompanying prospectus of the participating insurance company. The participating insurance company's prospectus may also include information regarding the time you must submit your purchase and redemption orders.

     The sale and redemption price for Fund shares will change from day to day because the value of the securities in its portfolio and its expenses fluctuate. The redemption price will normally differ for different classes of shares. The redemption price of your shares may be more or less than their original cost.

Net Asset Value. The Fund calculates the net asset value of each class of shares as of the close of the New York Stock Exchange (NYSE), on each day the NYSE is open for trading (referred to in this prospectus as a "regular business day"). The NYSE normally closes at 4:00 p.m., Eastern Time, but may close earlier on some days.

The Fund determines the net assets of each class of shares by subtracting the class-specific expenses and the amount of the Fund's liabilities attributable to the share class from the market value of the Fund's securities and other assets attributable to the share class. The Fund's "other assets" might include, for example, cash and interest or dividends from its portfolio securities that have been accrued but not yet collected. The Fund's securities are valued primarily on the basis of current market quotations.

The net asset value per share for each share class is determined by dividing the net assets of the class by the number of outstanding shares of that class.

     Fair Value Pricing. If market quotations are not readily available or (in the Manager's judgment) do not accurately reflect the fair value of a security, or if after the close of the principal market on which a security held by the Fund is traded and before the time as of which the Fund's net asset value is calculated that day, an event occurs that the Manager learns of and believes in the exercise of its judgment will cause a material change in the value of that security from the closing price of the security on the principal market on which it is traded, that security may be valued by another method that the Board believes would more accurately reflect the security's fair value.

In determining whether current market prices are readily available and reliable, the Manager monitors the information it receives in the ordinary course of its investment management responsibilities. It seeks to identify significant events that it believes, in good faith, will affect the market prices of the securities held by the Fund. Those may include events affecting specific issuers (for example, a halt in trading of the securities of an issuer on an exchange during the trading day) or events affecting securities markets (for example, a foreign securities market closes early because of a natural disaster). The Board has adopted valuation procedures for the Fund and has delegated the day-to-day responsibility for fair value determinations to the Manager's "Valuation Committee." Those determinations may include consideration of recent transactions in comparable securities, information relating to the specific security, developments in the markets and their performance, and current valuations of foreign or U.S. indices. Fair value determinations by the Manager are subject to review, approval and ratification by the Board at its next scheduled meeting after the fair valuations are determined.

The Fund's use of fair value pricing procedures involves subjective judgments and it is possible that the fair value determined for a security may be materially different from the value that could be realized upon the sale of that security. Accordingly, there can be no assurance that the Fund could obtain the fair value assigned to a security if it were to sell the security at approximately the same time at which the Fund determines its net asset value per share.

     Pricing Foreign Securities . The Fund may use fair value pricing more frequently for securities primarily traded on foreign exchanges. Because many foreign markets close hours before the Fund values its foreign portfolio holdings, significant events, including broad market movements, may occur during that time that could potentially affect the values of foreign securities held by the Fund.

The Manager believes that foreign securities values may be affected by volatility that occurs in U.S. markets after the close of foreign securities markets. The Manager's fair valuation procedures therefore include a procedure whereby foreign securities prices may be "fair valued" to take those factors into account.

Because some foreign securities trade in markets and on exchanges that operate on weekends and U.S. holidays, the values of some of the Fund's foreign investments may change on days when investors cannot buy or redeem Fund shares.

     Pricing of the Subsidiary. The valuation procedures described above for the Fund are the same used in valuing the Subsidiary's portfolio investments and shares of the Subsidiary.

HOW CAN YOU BUY FUND SHARES? Shares of the Fund may be purchased only by separate investment accounts of participating insurance companies as an underlying investment for variable life insurance policies, variable annuity contracts or other investment products. Individual investors cannot buy shares of the Fund directly. Please refer to the accompanying prospectus of the participating insurance company for information on how to select the Fund as an investment option. That prospectus will indicate which share class you may be eligible to purchase.

Suspension of Share Offering. The offering of Fund shares may be suspended during any period in which the determination of net asset value is suspended, and may be suspended by the Board at any time the Board believes it is in the Fund's best interest to do so.

HOW CAN YOU REDEEM FUND SHARES? Only the participating insurance companies that hold Fund shares in their separate accounts can place orders to redeem shares. Contract holders and policy holders should not directly contact the Fund or its transfer agent to request a redemption of Fund shares. The Fund normally sends payment by Federal Funds wire to the insurance company's account on the next business day after the Fund receives the order (and no later than seven days after the Fund's receipt of the order). Under unusual circumstances determined by the Securities and Exchange Commission, payment may be delayed or suspended. Contract owners should refer to the withdrawal or surrender instructions in the accompanying prospectus of the participating insurance company.

Redemptions "In-Kind." Shares may be "redeemed in-kind" under certain circumstances (such as redemptions of substantial amounts of shares by shareholders that have consented to such in kind redemptions). That means that the redemption proceeds will be paid to the participating insurance companies in securities from the Fund's portfolio. If the Fund redeems shares in-kind, the insurance company accounts may bear transaction costs and will bear market risks until such securities are converted into cash.

Limitations on Frequent Transactions

Frequent purchases and redemptions of Fund shares may interfere with the Manager's ability to manage the Fund's investments efficiently, may increase its transaction and administrative costs and may affect its performance, depending on various factors, such as the size of the Fund, the nature of its investments, the amount of Fund assets the portfolio manager maintains in cash or cash equivalents, and the aggregate dollar amount, the number and the frequency of trades.

If large dollar amounts are involved in frequent redemption transactions, the Fund might be required to sell portfolio securities at unfavorable times to meet those transaction requests, and the Fund's brokerage or administrative expenses might be increased. Therefore, the Manager and the Fund's Board have adopted the following policies and procedures to detect and prevent frequent and/or excessive purchase and redemption activity, while addressing the needs of investors who seek liquidity in their investment. There is no guarantee that those policies and procedures, described below, will be sufficient to identify and deter all excessive short-term trading. If the Transfer Agent is not able to detect and curtail such activity, frequent trading could occur in the Fund.

Policies on Disruptive Activity.  The Transfer Agent and the Distributor, on behalf of the Fund, have entered into agreements with participating insurance companies designed to detect and restrict excessive short-term trading activity by contract or policy owners or their financial advisers in their accounts. The Transfer Agent generally does not consider periodic asset allocation or re-balancing that affects a portion of the Fund shares held in the account of a policy or contract owner to be "excessive trading." However, the Transfer Agent has advised participating insurance companies that it generally considers certain other types of trading activity to be "excessive," such as making a "transfer" out of the Fund within 30 days after buying Fund shares (by the sale of the recently purchased Fund shares and the purchase of shares of another fund) or making more than six "round-trip transfers" between funds during one year. The agreements require participating insurance companies to provide transaction information to the Fund and to execute Fund instructions to restrict trading in Fund shares.

 A participating insurance company may also have its own policies and procedures and may impose its own restrictions or limitations to discourage short-term and/or excessive trading by its policy or contract owners. Those policies and procedures may be different from the Fund's in certain respects. You should refer to the prospectus for your insurance company variable annuity contract for specific information about the insurance company's policies. Under certain circumstances, policy or contract owners may be required to transmit purchase or redemption orders only by first class U.S. mail.

Monitoring the Policies. The Fund's policies and procedures for detecting and deterring frequent or excessive trading are administered by the Fund's Transfer Agent. However, the Transfer Agent presently does not have the ability to directly monitor trading activity in the accounts of policy or contract owners within the participating insurance companies' accounts. The Transfer Agent's ability to monitor and deter excessive short-term trading in such insurance company accounts ultimately depends on the capability and diligence of each participating insurance company, under their agreements with the Transfer Agent, the Distributor and the Fund, in monitoring and controlling the trading activity of the policy or contract owners in the insurance company's accounts.

The Transfer Agent will attempt to monitor the net effect on the Fund's assets from the purchase and redemption activity in the accounts of participating insurance companies and will seek to identify patterns that may suggest excessive trading by the contract or policy owners who invest in the insurance company's accounts. If the Transfer Agent believes it has observed evidence of possible excessive trading activity, it will ask the participating insurance companies or other registered owners to provide information about the transaction activity of the contract or policy holders in their respective accounts, and to take appropriate action. In that case, the insurance company must confirm to the Transfer Agent that appropriate action has been taken to curtail the excessive trading activity.

The Transfer Agent will, subject to the limitations described in this section, limit or terminate the trading activity of any person, group or account that it believes would be excessive or disruptive. However, the Transfer Agent may not be able to detect or curtail all such trading activity in the Fund. The Transfer Agent will evaluate trading activity on a case by case basis and the limitations placed on trading may vary between accounts.

Right to Refuse Purchase Orders. The Fund's Distributor or Transfer Agent may, in their discretion, refuse any purchase order and are not obligated to provide notice before rejecting an order.  

DISTRIBUTION AND SERVICE (12b-1) PLANS

Distribution and Service Plan for Service Shares. The Fund has adopted a Distribution and Service Plan for Service Shares to pay the Distributor for distribution related services, personal services and account maintenance for those shares. Under the Plan, the Fund pays the Distributor quarterly at an annual rate of up to 0.25% of the daily net assets of the Fund's Service Shares. Because these fees are paid out of the Fund's assets on an on-going basis, over time they will increase the operating expenses of the Service Shares and may cost you more than other types of fees or sales charges. As a result, the Service Shares may have lower performance compared to the Fund's shares that are not subject to a service fee.

     Use of Plan Fees: The Distributor currently uses all of those fees to compensate sponsor(s) of the insurance product for providing personal services and account maintenance for variable contract owners that hold Service Shares.

PAYMENTS TO FINANCIAL INTERMEDIARIES AND SERVICE PROVIDERS. The Manager and the Distributor, in their discretion, may also make payments for distribution and/or shareholder servicing activities to brokers, dealers and other financial intermediaries, including the insurance companies that offer the Fund as an investment option, or to service providers. Those payments are made out of the Manager's and/or the Distributor's own resources and/or assets, including from the revenues or profits derived from the advisory fees the Manager receives from the Fund. Those cash payments, which may be substantial, are paid to many firms having business relationships with the Manager and Distributor and are in addition to any distribution fees, servicing fees, or transfer agency fees paid directly or indirectly by the Fund to those entities. Payments by the Manager or Distributor from their own resources are not reflected in the tables in the "Fees and Expenses of the Fund" section of this prospectus because they are not paid by the Fund.

The financial intermediaries that may receive those payments include firms that offer and sell Fund shares to their clients, or provide shareholder services to the Fund, or both, and receive compensation for those activities. The financial intermediaries that may receive payments include securities brokers, dealers, financial advisers, insurance companies that offer variable annuity or variable life insurance products and other intermediaries.

In general, these payments to financial intermediaries can be categorized as "distribution-related" or "servicing" payments. Payments for distribution-related expenses, such as marketing or promotional expenses, are often referred to as "revenue sharing." Revenue sharing payments may be made on the basis of the sales of shares attributable to that intermediary, the average net assets of the Fund and other Oppenheimer funds attributable to the accounts of that intermediary and its clients, negotiated lump sum payments for distribution services provided, or similar fees. In some circumstances, revenue sharing payments may create an incentive for a financial intermediary or its representatives to recommend or offer shares of the Fund or other Oppenheimer funds to its customers. These payments also may give an intermediary an incentive to cooperate with the Distributor's marketing efforts. A revenue sharing payment may, for example, qualify the Fund for preferred status with the intermediary receiving the payment or provide representatives of the Distributor with access to representatives of the intermediary's sales force, in some cases on a preferential basis over funds of competitors. Additionally, as firm support, the Manager or Distributor may reimburse expenses related to educational seminars and "due diligence" or training meetings (to the extent permitted by applicable laws or the rules of the Financial Industry Regulatory Authority ("FINRA")) designed to increase sales representatives' awareness about Oppenheimer funds, including travel and lodging expenditures. However, the Manager does not consider a financial intermediary's sale of shares of the Fund or other Oppenheimer funds when selecting brokers or dealers to effect portfolio transactions for the funds.

Various factors are used to determine whether to make revenue sharing payments. Possible considerations include, without limitation, the types of services provided by the intermediary, sales of Fund shares, the redemption rates on accounts of clients of the intermediary or overall asset levels of Oppenheimer funds held for or by clients of the intermediary, the willingness of the intermediary to allow the Distributor to provide educational and training support for the intermediary's sales personnel relating to the Oppenheimer funds, the availability of the Oppenheimer funds on the intermediary's sales system, as well as the overall quality of the services provided by the intermediary and the Manager or Distributor's relationship with the intermediary. The Manager and Distributor have adopted guidelines for assessing and implementing each prospective revenue sharing arrangement. To the extent that financial intermediaries receiving distribution-related payments from the Manager or Distributor sell more shares of the Oppenheimer funds or retain more shares of the funds in their client accounts, the Manager and Distributor benefit from the incremental management and other fees they receive with respect to those assets.

Payments may also be made by the Manager, the Distributor or the Transfer Agent to financial intermediaries to compensate or reimburse them for administrative or other client services provided such as sub-transfer agency services for shareholders, omnibus accounting or sub-accounting, participation in networking arrangements, account set-up, recordkeeping and other shareholder services. Payments may also be made for administrative services related to the distribution of Fund shares through the intermediary. Firms that may receive servicing fees include insurance companies that offer variable annuity or variable life insurance products and others. These fees may be used by the service provider to offset or reduce fees that would otherwise be paid directly to them by certain account holders. The Statement of Additional Information contains more information about revenue sharing and service payments made by the Manager or the Distributor. Your broker, dealer or other financial intermediary may charge you fees or commissions in addition to those disclosed in this prospectus. You should ask your financial intermediary for details about any such payments it receives from the Manager or the Distributor and their affiliates, or any other fees or expenses it charges.

Dividends, Capital Gains and Taxes

DIVIDENDS AND DISTRIBUTIONS. The Fund intends to declare and pay dividends annually from any net investment income. The Fund may also realize capital gains on the sale of portfolio securities, in which case it may make distributions out of any net short-term or long-term capital gains annually. The Fund may also make supplemental distributions of dividends and capital gains following the end of its fiscal year. The Fund has no fixed dividend rate and cannot guarantee that it will pay any dividends or capital gains distributions in a particular year.

Dividends and distributions are paid separately for each share class. Because of the higher expenses on Service Shares, the dividends and capital gains distributions paid on those shares will generally be lower than for other Fund shares.

Receiving Dividends and Distributions. Any dividends and capital gains distributions will be automatically reinvested in additional Fund shares for the account of the participating insurance company, unless the insurance company elects to have dividends or distributions paid in cash.

TAXES. For a discussion of the tax status of a variable annuity contract, a variable life insurance policy or other investment product of a participating insurance company, please refer to the accompanying variable contract prospectus of your participating insurance company. Because shares of the Fund may be purchased only through insurance company separate accounts for variable annuity contracts, variable life insurance policies or other investment products, any dividends from net investment income and distributions of net realized short-term and long-term capital gains will be taxable, if at all, to the participating insurance company. However, those payments may affect the tax basis of certain types of distributions from those accounts.

The Fund has qualified and intends to qualify each year to be taxed as a regulated investment company under the Internal Revenue Code by satisfying certain income, asset diversification and income distribution requirements, but reserves the right not to so qualify. In each year that it qualifies as a regulated investment company, the Fund will not be subject to federal income taxes on its income that it distributes to shareholders.

This information is only a summary of certain Federal income tax information about your investment. You are encouraged to consult your tax adviser about the effect of an investment in the Fund on your particular tax situation and about any changes to the Internal Revenue Code that may occur from time to time. Additional information about the tax effects of investing in the Fund is contained in the Statement of Additional Information.

Financial Highlights

The Financial Highlights Table is presented to help you understand the Fund's financial performance for the past five fiscal years. Certain information reflects financial results for a single Fund share. The total returns in the table represent the rate that an investor would have earned (or lost) on an investment in the Fund (assuming reinvestment of all dividends and distributions). This information has been audited by KPMG LLP, the Fund's independent registered public accounting firm for the fiscal years ended December 31, 2010 and 2009. The financial highlights for the prior years were audited by another independent registered public accounting firm. KPMG's report, along with the Fund's financial statements, are included in the Statement of Additional Information, which is available upon request.

Financial Highlights Table

FINANCIAL HIGHLIGHTS

Non-Service Shares      Year Ended December 31,

2010


2009


2008


2007


2006


Per Share Operating Data


Net asset value, beginning of period

$5.30


$4.49


$5.56


$5.26


$5.11


Income (loss) from investment operations:


Net investment income1

.34


.30


.30


.28


.26


Net realized and unrealized gain (loss)

.40


.53


(1.04)


.21


.11


Total from investment operations

.74


.83


(.74)


.49


.37


Dividends and/or distributions to shareholders:


Dividends from net investment income

(.46)


(.02)


(.27)


(.19)


(.22)


Distributions from net realized gain

--


-- 2


(.06)


--


--


Total dividends and distributions to shareholders

(.46)


(.02)


(.33)


(.19)


(.22)


Net asset value, end of period

$5.58


$5.30


$4.49


$5.56


$5.26


Total Return, at Net Asset Value3

14.97%


18.83%


(14.21)%


9.69%


7.49%


Ratios/Supplemental Data


Net assets, end of period (in thousands)

$711,755


$757,772


$648,570


$734,611


$606,632


Average net assets (in thousands)

$737,071


$681,926


$753,062


$664,668


$564,248


Ratios to average net assets:4 , 5


Net investment income

6.47%


6.20%


5.78%


5.34%


5.05%


Total expenses6

0.75%


0.67%


0.59%


0.59%


0.64%


Expenses after payments, waivers and/or reimbursements and reduction to custodian expenses

0.71%


0.64%


0.57%


0.57%


0.63%


Portfolio turnover rate7

99%


110%


86%


76%


93%


1. Per share amounts calculated based on the average shares outstanding during the period.

2. Less than $0.005 per share.

3. Assumes an initial investment on the business day before the first day of the fiscal period, with all dividends and distributions reinvested in additional shares on the reinvestment date, and redemption at the net asset value calculated on the last business day of the fiscal period. Total returns are not annualized for periods less than one full year. Total return information does not reflect expenses that apply at the separate account level or to related insurance products. Inclusion of these charges would reduce the total return figures for all periods shown. Returns do not reflect the deduction of taxes that a shareholder would pay on fund distributions or the redemption of fund shares.

4. Annualized for periods less than one full year.

5. Includes the Fund's share of the allocated expenses and/or net investment income from the master funds.

6. Total expenses including all affiliated fund expenses were as follows:

Year Ended December 31, 2010

0.75%

Year Ended December 31, 2009

0.68%

Year Ended December 31, 2008

0.60%

Year Ended December 31, 2007

0.61%

Year Ended December 31, 2006

0.64%

7. The portfolio turnover rate excludes purchase and sale transactions of To Be Announced (TBA) mortgage-related securities as follows:

Purchase Transactions

Sale Transactions

Year Ended December 31, 2010

$1,034,550,699

$1,085,289,655

Year Ended December 31, 2009

$1,909,574,925

$1,836,038,328

Year Ended December 31, 2008

$ 634,319,548

$ 594,845,589

Year Ended December 31, 2007

$1,061,009,472

$1,120,098,096

Year Ended December 31, 2006

$ 742,785,501

$ 749,719,239


Service Shares      Year Ended December 31,

2010


2009


2008


2007


2006


Per Share Operating Data


Net asset value, beginning of period

$5.38


$4.56


$5.65


$5.34


$5.19


Income (loss) from investment operations:


Net investment income1

.33


.29


.29


.28


.25


Net realized and unrealized gain (loss)

.42


.54


(1.06)


.22


.11


Total from investment operations

.75


.83


(.77)


.50


.36


Dividends and/or distributions to shareholders:


Dividends from net investment income

(.45)


(.01)


(.26)


(.19)


(.21)


Distributions from net realized gain

--


-- 2


(.06)


--


--


Total dividends and distributions to shareholders

(.45)


(.01)


(.32)


(.19)


(.21)


Net asset value, end of period

$5.68


$5.38


$4.56


$5.65


$5.34


Total Return, at Net Asset Value3

14.77%


18.41%


(14.49)%


9.55%


7.23%


Ratios/Supplemental Data


Net assets, end of period (in thousands)

$1,670,340


$3,656,726


$2,810,315


$2,876,016


$1,396,188


Average net assets (in thousands)

$2,485,427


$3,143,836


$3,152,967


$2,075,028


$1,016,582


Ratios to average net assets:4 , 5


Net investment income

6.15%


5.95%


5.54%


5.08%


4.83%


Total expenses6

0.99%


0.92%


0.84%


0.84%


0.89%


Expenses after payments, waivers and/or reimbursements and reduction to custodian expenses

0.95%


0.89%


0.82%


0.82%


0.88%


Portfolio turnover rate7

99%


110%


86%


76%


93%


1. Per share amounts calculated based on the average shares outstanding during the period.

2. Less than $0.005 per share.

3. Assumes an initial investment on the business day before the first day of the fiscal period, with all dividends and distributions reinvested in additional shares on the reinvestment date, and redemption at the net asset value calculated on the last business day of the fiscal period. Total returns are not annualized for periods less than one full year. Total return information does not reflect expenses that apply at the separate account level or to related insurance products. Inclusion of these charges would reduce the total return figures for all periods shown. Returns do not reflect the deduction of taxes that a shareholder would pay on fund distributions or the redemption of fund shares.

4. Annualized for periods less than one full year.

5. Includes the Fund's share of the allocated expenses and/or net investment income from the master funds.

6. Total expenses including all affiliated fund expenses were as follows:

Year Ended December 31, 2010

0.99%

Year Ended December 31, 2009

0.93%

Year Ended December 31, 2008

0.85%

Year Ended December 31, 2007

0.86%

Year Ended December 31, 2006

0.89%

7. The portfolio turnover rate excludes purchases and sales of To Be Announced (TBA) mortgage-related securities as follows:

Purchase Transactions

Sale Transactions

Year Ended December 31, 2010

$1,034,550,699

$1,085,289,655

Year Ended December 31, 2009

$1,909,574,925

$1,836,038,328

Year Ended December 31, 2008

$ 634,319,548

$ 594,845,589

Year Ended December 31, 2007

$1,061,009,472

$1,120,098,096

Year Ended December 31, 2006

$ 742,785,501

$ 749,719,239


INFORMATION AND SERVICES

STATEMENT OF ADDITIONAL INFORMATION. This document includes additional information about the Fund's investment policies, risks, and operations. It is incorporated by reference into this prospectus (it is legally part of this prospectus).

ANNUAL AND SEMI-ANNUAL REPORTS. The Fund's Annual and Semi-Annual Reports provide additional information about the Fund's investments and performance. The Annual Report includes a discussion of market conditions and investment strategies that significantly affected the Fund's performance during its last fiscal year.

How to Request More Information

You can request the above documents, the notice explaining the Fund's privacy policy, and other information about the Fund, without charge, by:

Telephone:

Call OppenheimerFunds Services toll-free: 1.800.988.8287

Mail:

Use the following address for regular mail:
OppenheimerFunds Services
P.O. Box 5270
Denver, Colorado 80217-5270

Use the following address for courier or express mail:
OppenheimerFunds Services
12100 East Iliff Avenue
Suite 300
Aurora, Colorado 80014

Internet:

You can read or download the Fund's Statement of Additional Information, Annual and Semi-Annual Reports on the OppenheimerFunds website at: www.oppenheimerfunds.com


Information about the Fund including the Statement of Additional Information can be reviewed and copied at the SEC's Public Reference Room in Washington, D.C. Information on the operation of the Public Reference Room may be obtained by calling the SEC at 1.202.551.8090. Reports and other information about the Fund are available on the EDGAR database on the SEC's website at www.sec.gov. Copies may be obtained after payment of a duplicating fee by electronic request at the SEC's e-mail address: publicinfo@sec.gov or by writing to the SEC's Public Reference Section, Washington, D.C. 20549-1520.

No one has been authorized to provide any information about the Fund or to make any representations about the Fund other than what is contained in this prospectus. This prospectus is not an offer to sell shares of the Fund, nor a solicitation of an offer to buy shares of the Fund, to any person in any state or other jurisdiction where it is unlawful to make such an offer.


The Fund's SEC File No.: 811-04108
SP0265.001.0411


OPPENHEIMER
High Income Fund/VA

A series of Oppenheimer Variable Account Funds

Share Classes:

     Non-Service Shares

     Service Shares

     Class 3 Shares

     Class 4 Shares

Prospectus dated April 29, 2011 

As with all mutual funds, the Securities and Exchange Commission has not approved or disapproved the Fund's securities nor has it determined that this prospectus is accurate or complete. It is a criminal offense to represent otherwise.

Oppenheimer High Income Fund/VA is a mutual fund that seeks a high level of current income from investment in high-yield, fixed-income securities.

Shares of the Fund are sold only as an underlying investment for variable life insurance policies, variable annuity contracts and other insurance company separate accounts. A prospectus for the insurance product you have selected accompanies this prospectus and explains how to select shares of the Fund as an investment under that insurance product, and which share class or classes you are eligible to purchase.

This prospectus contains important information about the Fund's objective, investment policies, strategies and risks. Please read this prospectus (and your insurance product prospectus) carefully before you invest and keep them for future reference about your account.


Oppenheimer High Income Fund/VA 


Table of contents

THE FUND SUMMARY

Investment Objective

3

Fees and Expenses of the Fund

3

Principal Investment Strategies

3

Principal Risks

4

The Fund's Past Performance

5

Investment Adviser

6

Portfolio Manager

6

Purchase and Sale of Fund Shares

6

Taxes

6

Payments to Broker-Dealer and Other Financial Intermediaries

6

MORE ABOUT THE FUND

About the Fund's Investments

7

How the Fund is Managed

11

INVESTING IN THE FUND

How to Buy and Sell Shares

13

Dividends, Capital Gains and Taxes

15

Financial Highlights

16


To Summary Prospectus

THE FUND SUMMARY

Investment Objective. The Fund seeks a high level of current income from investment in high-yield, fixed-income securities.

Fees and Expenses of the Fund. This table describes the fees and expenses that you may pay if you buy and hold or redeem shares of the Fund. The accompanying prospectus of the participating insurance company provides information on initial or contingent deferred sales charges, exchange fees or redemption fees for that variable life insurance policy, variable annuity or other investment product. The fees and expenses of those products are not charged by the Fund and are not reflected in this table. Expenses would be higher if those fees were included.

Shareholder Fees (fees paid directly from your investment)

Non-Service Shares

Service Shares

Class 3 Shares

Class 4 Shares

Maximum Sales Charge (Load) imposed on purchases (as % of offering price)

None

None

None

None

Maximum Deferred Sales Charge (Load) (as % of the lower of original offering price or redemption proceeds)

None

None

None

None

Redemption Fee (as % of amount redeemed, if applicable)

None

None

1.00%

1.00%


Annual Fund Operating Expenses (expenses that you pay each year as a percentage of the value of your investment)

Non-Service Shares

Service Shares

Class 3 Shares

Class 4 Shares

Management Fees

0.75%

0.75%

0.75%

0.75%

Distribution and/or Service (12b-1) Fees

None

0.25%

None

0.25%

Other Expenses

0.23%

0.23%

0.24%

0.23%

Total Annual Fund Operating Expenses

0.98%

1.23%

0.99%

1.23%

    Fee Waiver and Expense Reimbursement *

(0.23%)

(0.23%)

(0.24%)

(0.23%)

Total Annual Fund Operating Expenses after Fee Waiver and Expense Reimbursement

0.75%

1.00%

0.75%

1.00%


* The Manager has voluntarily agreed to limit the Fund's total annual operating expenses so that those expenses, as percentages of daily net assets, will not exceed the annual rate of 0.75% for Non-Service and Class 3 shares and 1.00% for Service and Class 4 shares. This voluntary expense limitation may not be amended or withdrawn until one year after the date of this prospectus.


Example. The following Example is intended to help you compare the cost of investing in the Fund with the cost of investing in other mutual funds. The Example assumes that you invest $10,000 in a class of shares of the Fund for the time periods indicated. The Example also assumes that your investment has a 5% return each year and that the Fund's operating expenses remain the same. Although your actual costs may be higher or lower, based on these assumptions your expenses would be as follows, whether or not you redeemed your shares:

1 Year   3 Years   5 Years   10 Years  
Non-Service Shares $ 77 $ 291 $ 522 $ 1,186
Service Shares $ 103 $ 370 $ 657 $ 1,477
Class 3 Shares $ 77 $ 293 $ 526 $ 1,197
Class 4 Shares $ 103 $ 370 $ 657 $ 1,477


Portfolio Turnover. The Fund pays transaction costs, such as commissions, when it buys and sells securities (or "turns over" its portfolio). A higher portfolio turnover rate may indicate higher transaction costs. These costs, which are not reflected in the annual fund operating expenses or in the example, affect the Fund's performance. During the most recent fiscal year, the Fund's portfolio turnover rate was 132% of the average value of its portfolio.

Principal Investment Strategies. The Fund invests in a variety of high-yield debt securities and related instruments. Those investments primarily include lower-grade corporate bonds. To a lesser extent, the Fund's investments include foreign corporate and government bonds, as well as swaps, including single name and index-linked credit default swaps.

Under normal market conditions, the Fund invests at least 65% of its total assets in high-yield, lower-grade, fixed-income securities, also referred to as "junk" bonds. The remainder of the Fund's assets may be invested in other debt securities, common stocks (and other equity securities), cash or cash equivalents, when the Manager believes these investments are consistent with the Fund's objectives. The Fund has no requirements as to the range of maturities of the debt securities it can buy or as to the market capitalization of the issuers of those securities.

The Fund's debt securities may be rated by nationally recognized statistical rating organizations such as Moody's Investors Service or Standard & Poor's or may be unrated.

Lower-grade debt securities are those rated below "BBB" by Standard & Poor's or below "Baa" by Moody's Investors Service, or that have comparable ratings from other nationally-recognized rating organizations. Additionally, the portfolio managers may internally assign ratings to certain of the Fund's unrated securities, after assessing their credit quality, in categories equivalent to those of nationally recognized statistical rating organizations. The Fund may also invest in unrated securities, in which case the Manager may internally assign ratings to certain of those securities, after assessing their credit quality, in categories similar to those of nationally recognized statistical rating organizations.

The Fund may invest in securities of U.S. or foreign issuers. When it does so, the Fund will tend to focus on securities of foreign issuers in developing markets. The Fund also uses certain types of derivative investments to try to enhance income or to try to manage ("hedge") investment risks, including: options, futures contracts, swaps, "structured" notes, and certain mortgage-related securities.

In selecting securities, the portfolio manager seeks to build a broadly diversified portfolio to try to moderate the special risks of investing in high-yield debt instruments. The portfolio manager currently uses a "bottom up" approach, focusing on the performance of individual securities while considering industry trends. He evaluates an issuer's liquidity, financial strength and earnings power. The Fund's portfolio manager also analyzes the overall investment opportunities and risks in different market sectors, industries and countries. The portfolio manager currently focuses on the following factors, which may vary in particular cases and may change over time:

  • Issuers with earnings growth rates that are faster than the growth rate of the overall economy,
  • Issuers with improvements in relative cash flows and liquidity to help them meet their obligations,
  • Corporate sectors that in the portfolio manager's view are undervalued in the marketplace,

  • Changes in the business cycle that might affect corporate profits, and

  • Securities or sectors that will help the overall diversification of the portfolio.

The Fund may sell securities that the portfolio manager believes no longer meet the above criteria.

Principal Risks. The price of the Fund's shares can go up and down substantially. The value of the Fund's investments may change because of broad changes in the markets in which the Fund invests or from poor security selection, which could cause the Fund to underperform other funds with similar investment objectives. There is no assurance that the Fund will achieve its investment objective. When you redeem your shares, they may be worth more or less than what you paid for them. These risks mean that you can lose money by investing in the Fund.

Main Risks of Debt Securities. Debt securities may be subject to credit risk, interest rate risk, prepayment risk and extension risk. Credit risk is the risk that the issuer of a security might not make interest and principal payments on the security as they become due. If an issuer fails to pay interest or repay principal, the Fund's income or share value might be reduced. Adverse news about an issuer or a downgrade in an issuer's credit rating, for any reason, can also reduce the market value of the issuer's securities. Interest rate risk is the risk that when prevailing interest rates fall, the values of already-issued debt securities generally rise; and when prevailing interest rates rise, the values of already-issued debt securities generally fall, and they may be worth less than the amount the Fund paid for them. When interest rates change, the values of longer-term debt securities usually change more than the values of shorter-term debt securities. When interest rates fall, debt securities may be repaid more quickly than expected and the Fund may be required to reinvest the proceeds at a lower interest rate. This is referred to as "prepayment risk." When interest rates rise, debt securities may be repaid more slowly than expected and the value of the Fund's holdings may fall sharply. This is referred to as "extension risk." Interest rate changes normally have different effects on variable or floating rate securities than they do on securities with fixed interest rates.

Special Risks of Lower-Grade Securities.  Lower-grade securities, whether rated or unrated, may be subject to wider market fluctuation, greater credit risk and greater risk of loss of income and principal than investment-grade securities. The market for lower-grade securities may be less liquid and therefore they may be harder to sell at an acceptable price, especially during times of market volatility or decline.

     Because the Fund can invest without limit in lower-grade securities, the Fund's credit risks are greater than those of funds that buy only investment-grade securities.

Fixed-Income Market Risks . Economic and other market developments can adversely affect fixed-income securities markets in the United States, Europe and elsewhere. At times, participants in debt securities markets may develop concerns about the ability of certain issuers of debt securities to make timely principal and interest payments, or they may develop concerns about the ability of financial institutions that make markets in certain debt securities to facilitate an orderly market. Those concerns can cause increased volatility in those debt securities or debt securities markets. Under some circumstances, as was the case during the latter half of 2008 and early 2009, those concerns could cause reduced liquidity in certain debt securities markets. A lack of liquidity or other adverse credit market conditions may hamper the Fund's ability to sell the debt securities in which it invests or to find and purchase suitable debt instruments.

Main Risks of Foreign Investing. Foreign securities are subject to special risks. Foreign issuers are usually not subject to the same accounting and disclosure requirements that U.S. companies are subject to, which may make it difficult for the Fund to evaluate a foreign company's operations or financial condition. A change in the value of a foreign currency against the U.S. dollar will result in a change in the U.S. dollar value of securities denominated in that foreign currency and in the value of any income or distributions the Fund may receive on those securities. The value of foreign investments may be affected by exchange control regulations, foreign taxes, higher transaction and other costs, delays in the settlement of transactions, changes in economic or monetary policy in the United States or abroad, expropriation or nationalization of a company's assets, or other political and economic factors. These risks may be greater for investments in developing or emerging market countries.

     Time-Zone Arbitrage. The Fund may invest in securities of foreign issuers that are traded in U.S. or foreign markets. If the Fund invests a significant amount of its assets in foreign markets, it may be exposed to "time-zone arbitrage" attempts by investors seeking to take advantage of differences in the values of foreign securities that might result from events that occur after the close of the foreign securities market on which a security is traded and before the Fund's net asset value is calculated.  If such time-zone arbitrage were successful, it might dilute the interests of other shareholders.  The Fund's use of "fair value pricing" to adjust certain market prices of foreign securities may help deter those activities.

Special Risks of Developing and Emerging Markets. The economies of developing or emerging market countries may be more dependent on relatively few industries that may be highly vulnerable to local and global changes. The governments of developing and emerging market countries may also be more unstable than the governments of more developed countries. These countries generally have less developed securities markets or exchanges, and less developed legal and accounting systems. Securities may be more difficult to sell at an acceptable price and may be more volatile than securities in countries with more mature markets. The value of developing or emerging market currencies may fluctuate more than the currencies of countries with more mature markets. Investments in developing or emerging market countries may be subject to greater risks of government restrictions, including confiscatory taxation, expropriation or nationalization of a company's assets, restrictions on foreign ownership of local companies and restrictions on withdrawing assets from the country. Investments in securities of issuers in developing or emerging market countries may be considered speculative.

Who Is The Fund Designed For? The Fund's shares are available only as an investment option under certain variable annuity contracts, variable life insurance policies and investment plans offered through insurance company separate accounts of participating insurance companies. The Fund is designed primarily for investors seeking high current income from a fund that invests mainly in lower grade U.S. and foreign debt securities. Those investors should be willing to assume the greater risks of short-term share price fluctuations and the special credit risks that are typical for a fund that invests mainly in lower grade fixed-income securities. The Fund is intended to be a long-term investment, not a short-term trading vehicle. Because the Fund's income will fluctuate, it is not designed for investors needing an assured level of current income. The Fund is not a complete investment program and may not be appropriate for all investors. You should carefully consider your own investment goals and risk tolerance before investing in the Fund.

An investment in the Fund is not a deposit of any bank and is not insured or guaranteed by the Federal Deposit Insurance Corporation or any other government agency.


The Fund's Past Performance. The bar chart and table below provide some indication of the risks of investing in the Fund by showing changes in the Fund's Non-Service Shares performance from year to year and by showing how the Fund's average annual returns for 1, 5 and 10 years compare with those of a broad measure of market performance. Charges imposed by the insurance accounts that invest in the Fund are not included and the returns would be lower if they were. The Fund's past investment performance is not necessarily an indication of how the Fund will perform in the future. More recent performance information is available by calling the toll-free number on the back of this prospectus and on the Fund's website at: https://www.oppenheimerfunds.com/fund/investors/overview/HighIncomeFundVA


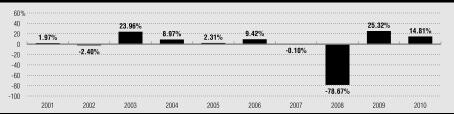
During the period shown, the highest return before taxes for a calendar quarter was 16.67% (2nd qtr 09) and the lowest return before taxes for a calendar quarter was -71.27% (4th qtr 08).


The following table shows the average annual total returns of each class of the Fund's shares before taxes. 

Average Annual Total Returns for the periods ended December 31, 2010

1 Year

5 Years
(or life of
class, if less)

10 Years
(or life of
class, if less)

Non-Service Shares (inception 04-30-1986)

14.81%


(19.62%)


(7.44%)


Service Shares (inception 09-18-2001)

14.44%


(19.61%)


(8.11%)


Class 3 Shares (inception 05-01-2007)

14.69%


(28.22%)


N/A


Class 4 Shares (inception 05-01-2007)

14.27%


(28.13%)


N/A


Merrill Lynch High Yield Master Index

15.24%


8.68%


8.71%


(reflects no deductions for fees, expenses or taxes)


7.95% 1


9.39% 2


1.  From 4-30-07
2.  From 9-30-01


Investment Adviser. OppenheimerFunds, Inc. is the Fund's investment adviser (the "Manager").

Portfolio Manager. Joseph Welsh who has been a Vice President and portfolio manager of the Fund since April 2009. 

Purchase and Sale of Fund Shares. Shares of the Fund may be purchased only by separate investment accounts of participating insurance companies as an underlying investment for variable life insurance policies, variable annuity contracts or other investment products. Individual investors cannot buy shares of the Fund directly. You may only submit instructions for buying or selling shares of the Fund to your insurance company or its servicing agent, not directly to the Fund or its Transfer Agent. The accompanying prospectus of the participating insurance company provides information about how to select the Fund as an investment option.

Taxes. Because shares of the Fund may be purchased only through insurance company separate accounts for variable annuity contracts, variable life insurance policies or other investment products, any dividends and capital gains distributions will be taxable to the participating insurance company, if at all. However, those payments may affect the tax basis of certain types of distributions from those accounts. Special tax rules apply to life insurance companies, variable annuity contracts and variable life insurance contracts. For information on federal income taxation of a life insurance company with respect to its receipt of distributions from the Fund and federal income taxation of owners of variable annuity or variable life insurance contracts, see the accompanying prospectus for the applicable contract.

Payments to Broker-Dealers and Other Financial Intermediaries. The Fund, the Manager, or their related companies may make payments to financial intermediaries, including to insurance companies that offer shares of the Fund as an investment option. These payments for the sale of Fund shares and related services may create a conflict of interest by influencing the intermediary and your salesperson to recommend the Fund over another investment. Ask your salesperson or visit your financial intermediary's website for more information.

MORE ABOUT YOUR INVESTMENT

About the Fund's Investments

The allocation of the Fund's portfolio among different types of investments will vary over time and the Fund's portfolio might not always include all of the different types of investments described below. The Statement of Additional Information contains more detailed information about the Fund's investment policies and risks.

THE FUND'S PRINCIPAL INVESTMENT STRATEGIES AND RISKS. The following strategies and types of investments are the ones that the Fund considers to be the most important in seeking to achieve its investment objective and the following risks are those the Fund expects its portfolio to be subject to as a whole.

Debt Securities.  The Fund may invest in debt securities, primarily including securities issued by domestic corporations and, to a lesser degree, securities issued or guaranteed by the U.S. Government or its agencies and instrumentalities, or by foreign governments, or by foreign corporations. The Fund may select debt securities for their income possibilities or to help cushion fluctuations in the value of its portfolio.

Debt securities may be subject to the following risks:

  • Credit Risk. Debt securities are also subject to credit risk. Credit risk is the risk that the issuer of a security might not make interest and principal payments on the security as they become due. U.S. Government securities generally have lower credit risks than securities issued by private issuers or certain foreign governments. If an issuer fails to pay interest, the Fund's income might be reduced, and if an issuer fails to repay principal, the value of the security might fall and the Fund could lose the amount of its investment in the security. The extent of this risk varies based on the terms of the particular security and the financial condition of the issuer. A downgrade in an issuer's credit rating or other adverse news about an issuer can reduce the market value of that issuer's securities.

  • Interest Rate Risk. The values of debt securities usually change when prevailing interest rates change. When interest rates rise, the values of outstanding debt securities generally fall, and those securities may sell at a discount from their face amount. When interest rates fall, the values of already-issued debt securities generally rise. However, when interest rates fall, the Fund's investments in new securities may be at lower yields and may reduce the Fund's income. The values of longer-term debt securities usually change more than the values of shorter-term debt securities when interest rates change.

  • Prepayment Risk. Certain fixed-income securities (in particular mortgage-related securities) are subject to the risk of unanticipated prepayment. That is the risk that when interest rates fall, the issuer will repay the security prior to the security's expected maturity, or with respect to certain fixed-income securities, that borrowers will repay the loans that underlie these securities more quickly than expected, thereby causing the issuer of the security to repay the principal prior to expected maturity. The Fund may need to reinvest the proceeds at a lower interest rate, reducing its income. Securities subject to prepayment risk generally offer less potential for gains when prevailing interest rates fall. If the Fund buys those securities at a premium, accelerated prepayments on those securities could cause the Fund to lose a portion of its principal investment. The impact of prepayments on the price of a security may be difficult to predict and may increase the security's price volatility. Interest-only and principal-only securities are especially sensitive to interest rate changes, which can affect not only their prices but can also change the income flows and repayment assumptions about those investments.

  • Extension Risk. If interest rates rise rapidly, repayments of principal on certain debt securities may occur at a slower rate than expected and the expected maturity of those securities could lengthen as a result. Securities that are subject to extension risk generally have a greater potential for loss when prevailing interest rates rise, which could cause their values to fall sharply.

Credit Quality.  The Fund may invest in securities that are rated or unrated. "Investment-grade" securities are those rated in one of the top four rating categories by nationally recognized statistical rating organizations such as Moody's or Standard & Poor's or unrated securities judged by the Manager to be of comparable quality. "Lower-grade" securities are those that are rated below those categories, which are also referred to as "junk bonds." While securities rated "Baa" by Moody's or "BBB" by Standard & Poor's are considered "investment-grade," they may also have some speculative characteristics. 

Credit ratings evaluate the expectation that scheduled interest and principal payments will be made in a timely manner. They do not reflect any judgment of market risk. Rating agencies might not always change their credit rating of an issuer in a timely manner to reflect events that could affect the issuer's ability to make scheduled payments on its obligations. In selecting securities for its portfolio and evaluating their income potential and credit risk, the Fund does not rely solely on ratings by rating organizations but evaluates business and economic factors affecting issuers as well. The ratings definitions of the principal ratings organizations are included in Appendix B to the Fund's Statement of Additional Information.

High-Yield, Lower-Grade Debt Securities. To seek high current income, under normal market conditions the Fund invests at least 65% of its total assets in high-yield, lower-grade, fixed-income securities of U.S. and foreign issuers. Those securities may include, among others: bonds, debentures, notes, preferred stock, loan participation interests, "structured" notes, commercial mortgage-backed securities, and asset-backed securities. There are no limits on the amount of the Fund's assets that can be invested in securities rated below investment grade. The Fund may invest in securities rated as low as "C" or "D" or that are in default at the time the Fund buys them. Those securities are generally considered speculative.

     Price Arbitrage. Because the Fund may invest in high yield bonds that may trade infrequently, investors might seek to trade fund shares based on their knowledge or understanding of the value of those securities (this is sometimes referred to as "price arbitrage"). The Fund imposes a 1% redemption fee in certain circumstances, to attempt to deter such activity. If such price arbitrage were successful, it might interfere with the efficient management of the Fund's portfolio and the Fund may be required to sell securities at disadvantageous times or prices to satisfy the liquidity requirements created by that activity. Successful price arbitrage might also dilute the value of fund shares held by other shareholders.

Foreign Investments. The Fund can invest its assets without limit in foreign debt securities and can buy securities of governments and companies in both developed markets and emerging markets. The Fund can buy a variety of securities issued by foreign governments and companies, as well as "supra-national" entities, such as the World Bank. The Fund's foreign investments primarily include bonds, debentures and notes. The Fund's foreign investments can be denominated in U.S. dollars or in foreign currencies. While foreign securities may offer special investment opportunities, they are also subject to special risks.

Diversification And Concentration.  The Fund is a diversified fund. It attempts to reduce its exposure to the risks of individual securities by diversifying its investments across a broad number of different companies. The Fund will not concentrate more than 25% of its total assets in issuers in any one industry.  At times, however, the Fund may emphasize investments in some industries more than others.

The Fund will not concentrate more than 25% of its total assets in the securities of any one foreign government.


OTHER INVESTMENT STRATEGIES AND RISKS. The Fund can also use the investment techniques and strategies described below. The Fund might not use all of these techniques or strategies or might only use them from time to time.

Special Portfolio Diversification Requirements. To enable a variable annuity or variable life insurance contract based on an insurance company separate account to qualify for favorable tax treatment under the Internal Revenue Code, the underlying investments must follow special diversification requirements that limit the percentage of assets that can be invested in securities of particular issuers. The Fund's investment program is managed to meet those requirements, in addition to other diversification requirements under the Internal Revenue Code and the Investment Company Act of 1940 that apply to publicly-sold mutual funds.

Failure by the Fund to meet those special requirements could cause earnings on a contract owner's interest in an insurance company separate account to be taxable income. Those diversification requirements might also limit, to some degree, the Fund's investment decisions in a way that could reduce its performance.

Common Stock and Other Equity Investments. Equity securities include common stock, preferred stock, rights, warrants and certain debt securities that are convertible into common stock. Equity investments may be exchange-traded or over-the-counter securities. Common stock represents an ownership interest in a company. It ranks below preferred stock and debt securities in claims for dividends and in claims for assets of the issuer in a liquidation or bankruptcy.

Preferred stock has a set dividend rate and ranks ahead of common stocks and behind debt securities in claims for dividends and for assets of the issuer in a liquidation or bankruptcy. The dividends on preferred stock may be cumulative (they remain a liability of the company until paid) or non-cumulative. The fixed dividend rate of preferred stocks may cause their prices to behave more like those of debt securities. When interest rates rise, the value of preferred stock having a fixed dividend rate tends to fall.

A convertible security is one that can be converted into or exchanged for a set amount of common stock of an issuer within a particular period of time at a specified price or according to a price formula. Convertible debt securities pay interest and convertible preferred stocks pay dividends until they mature or are converted, exchanged or redeemed. Convertible securities may provide more income than common stock but they generally provide less income than comparable non-convertible debt securities. Convertible securities are subject to credit and interest rate risk. The credit ratings of convertible securities generally have less impact on the value of the securities than they do for non-convertible debt securities, however.

Risks of Investing in Equity Securities. Stocks and other equity securities fluctuate in price in response to changes in equity markets in general. Equity markets may experience great short-term volatility and may fall sharply at times. Different markets may behave differently from each other and U.S. equity markets may move in the opposite direction from one or more foreign markets.

The prices of equity securities generally do not all move in the same direction at the same time and a variety of factors can affect the price of a particular company's securities. These factors may include: poor earnings reports, a loss of customers, litigation, or changes in government regulations affecting the company or its industry.

At times, the Fund may emphasize investments in a particular industry or sector. To the extent that the Fund increases its emphasis on stocks in a particular industry, the value of its investments may fluctuate more in response to events affecting that industry, such as changes in economic conditions, government regulations, availability of basic resources or supplies, or other events that affect that industry more than others.

Preferred stock is considered a debt security for purposes of the Fund's policy of investing 65% or more of its assets in lower-grade debt securities.

Mortgage-Related Securities. The Fund can buy interests in pools of residential or commercial mortgages in the form of  "pass-through" mortgage securities. They may be issued or guaranteed by the U.S. Government, or its agencies and instrumentalities, or by private issuers. Mortgage-related securities may be issued in different series, each having different interest rates and maturities. The prices and yields of mortgage-related securities are determined, in part, by assumptions about the rate of payments of the underlying mortgages and are subject to the risks of unanticipated prepayment.

     Mortgage-Related Government Securities.  Mortgage-related government securities include interests in pools of residential or commercial mortgages, in the form of "pass-through" mortgage securities. They may be issued or guaranteed by the U.S. Government or its agencies and instrumentalities. Mortgage-related U.S. Government securities may be issued in different series, each having different interest rates and maturities.

Mortgage-related securities that are U.S. Government securities have collateral to secure payment of interest and principal. The collateral is either in the form of mortgage pass-through certificates issued or guaranteed by a U.S. agency or instrumentality or mortgage loans insured by a U.S. Government agency. The prices and yields of mortgage-related securities are determined, in part, by assumptions about the rate of payments of the underlying mortgages and are subject to prepayment and extension risks.

     Mortgage-Related Private Issuer Securities. Primarily these investments include multi-class debt or pass-through certificates secured by mortgage loans, which may be issued by banks, savings and loans, mortgage bankers and other non-governmental issuers.  Private-issuer mortgage-backed securities may include loans on residential or commercial properties.

Mortgage-related securities, including CMOs, issued by private issuers are not U.S. Government securities, which makes them subject to greater credit risks. Private issuer securities are subject to the credit risks of the issuers as well as to interest rate risks, although in some cases they may be supported by insurance or guarantees. The prices and yields of private issuer mortgage-related securities are also subject to prepayment and extension risk. The market for private-issuer mortgage-backed securities may be volatile at times and may be less liquid than the markets for other types of securities.

Zero-Coupon Securities. The Fund may invest in "zero-coupon" securities, which pay no interest prior to their maturity date or another specified date in the future but are issued at a discount from their face value. Interest rate changes generally cause greater fluctuations in the prices of zero-coupon securities than in interest-paying securities of the same or similar maturities. The Fund may be required to pay a dividend of the imputed income on a zero-coupon security, at a time when it has not actually received the income.

     The Fund can invest up to 50% of its total assets in zero-coupon securities issued by either the U.S. Treasury or by private issuers.

Stripped Securities. "Stripped" securities are the separate income or principal components of a debt security, such as Treasury securities whose coupons have been stripped by a Federal Reserve Bank. Some mortgage-related securities may be stripped, with each component having a different proportion of principal or interest payments. One class might receive all the interest payments, all the principal payments or some proportional amount of interest and principal. Interest rate changes may cause greater fluctuations in the prices of stripped securities than in other debt securities of the same or similar maturities. The market for these securities may be limited, making it difficult for the Fund to sell its holdings at an acceptable price. The Fund may be required to pay out the imputed income on a stripped security as a dividend, at a time when it has not actually received the income.

Derivative Investments. The Fund can invest in "derivative" instruments. A derivative is an instrument whose value depends on (or is derived from) the value of an underlying security, asset, interest rate, index or currency.  Derivatives may allow the Fund to increase or decrease its exposure to certain markets or risks.  

The Fund may use derivatives to seek to increase its investment return or for hedging purposes. The Fund is not required to use derivatives in seeking its investment objective or for hedging and might not do so.

Options, futures, swaps, "structured" notes, and certain mortgage-related securities are some of the types of derivatives the Fund can use. The Fund may also use other types of derivatives for investment or hedging purposes that are consistent with its investment strategies.

"Structured" Notes. "Structured" notes are specially-designed derivative debt instruments. The terms of the instrument may be determined or "structured" by the purchaser and the issuer of the note. Payments of principal or interest on these notes may be linked to the value of an index (such as a currency or securities index), one or more securities, a commodity or the financial performance of one or more obligors. The value of these notes will normally rise or fall in response to the changes in the performance of the underlying security, index, commodity or obligor.

Risks of Structured Notes. Structured notes are subject to interest rate risk. They are also subject to credit risk with respect both to the issuer and, if applicable, to the underlying security or obligor. If the underlying investment or index does not perform as anticipated, the structured note might pay less interest than the stated coupon payment or repay less principal upon maturity. The price of structured notes may be very volatile and they may have a limited trading market, making it difficult to value them or sell them at an acceptable price. In some cases, the Fund may enter into agreements with an issuer of structured notes to purchase a minimum amount of those notes over time.

Credit Default Swaps. A credit default swap enables an investor to buy or sell protection against a credit event with respect to an issuer, such as an issuer's failure to make timely payments of interest or principal on its debt obligations, bankruptcy or restructuring. The terms of the instrument are generally negotiated by the Fund and the swap counterparty. A credit default swap may be embedded within a structured note or other derivative instrument.

Generally, if the Fund buys credit protection using a credit default swap, the Fund will make fixed payments to the counterparty and if a credit event occurs with respect to the applicable issuer, the Fund will deliver the issuer's defaulted bonds underlying the swap to the swap counterparty and the counterparty will pay the Fund par for the bonds. If the Fund sells credit protection using a credit default swap, generally the Fund will receive fixed payments from the counterparty and if a credit event occurs with respect to the applicable issuer, the Fund will pay the swap counterparty par for the issuer's defaulted bonds and the swap counterparty will deliver the bonds to the Fund. Alternatively, a credit default swap may be cash settled and the buyer of protection would receive the difference between the par value and the market value of the issuer's defaulted bonds from the seller of protection. If the credit default swap is on a basket of issuers, the notional value of the swap is reduced by the amount represented by that issuer, and the fixed payments are then made on the reduced notional value.

     Risks of Credit Default Swaps. Credit default swaps are subject to credit risk of the underlying issuer and to counterparty credit risk. If the counterparty fails to meet its obligations, the Fund may lose money. Credit default swaps are also subject to the risk that the Fund will not properly assess the risk of the underlying issuer. If the Fund is selling credit protection, there is a risk that a credit event will occur and that the Fund will have to pay the counterparty. If the Fund is buying credit protection, there is a risk that no credit event will occur and the Fund will receive no benefit for the premium paid.

Interest Rate Swaps.   In an interest rate swap, the Fund and another party exchange the right to receive interest payments on a security or payments based on a reference rate. For example, they might swap the right to receive floating rate payments based on a reference rate such as "LIBOR" for the right to receive fixed rate payments. The terms of the instrument are generally negotiated by the Fund and the swap counterparty. An interest rate swap may be embedded within a structured note or other derivative instrument.

     Risks of Interest Rate Swaps . Interest rate swaps are subject to interest rate risk and credit risk. An interest rate swap transaction could result in losses if the underlying asset or reference rate does not perform as anticipated. Interest rate swaps are also subject to counterparty risk. If the counterparty fails to meet its obligations, the Fund may lose money.

Total Return Swaps. In a total return swap transaction, one party agrees to pay the other party an amount equal to the total return on a defined underlying asset or a non-asset reference during a specified period of time. The underlying asset might be a security or basket of securities or a non-asset reference such as a securities index. In return, the other party would make periodic payments based on a fixed or variable interest rate or on the total return from a different underlying asset or non-asset reference.

     Risks of Total Return Swaps. Total return swaps could result in losses if the underlying asset or reference does not perform as anticipated. Total return swaps can have the potential for unlimited losses. They are also subject to counterparty risk. If the counterparty fails to meet its obligations, the Fund may lose money.

 Risks of Derivative Investments. Derivatives may be volatile and may involve significant risks. The underlying security, obligor or other instrument on which a derivative is based, or the derivative itself, may not perform the way the Manager expects it to. The Fund may lose money on a derivative investment if the issuer or counterparty fails to pay the amount due. Certain derivative investments held by the Fund may be illiquid, making it difficult to close out an unfavorable position. Derivative transactions may require the payment of premiums and can increase portfolio turnover. As a result, the Fund could realize little or no income or lose principal from the investment, or a hedge might be unsuccessful. For some derivatives, it is possible for the Fund to lose more than the amount invested in the derivative instrument. Some derivatives have the potential for unlimited loss, regardless of the size of the Fund's initial investment.

Hedging. Hedging transactions are intended to reduce the risks of securities in the Fund's portfolio. At times, however, a hedging instrument's value might not be correlated with the investment it is intended to hedge, and the hedge might be unsuccessful. If the Fund uses a hedging instrument at the wrong time or judges market conditions incorrectly, the strategy could reduce its return or create a loss.

Participation Interests in Loans. These securities represent an undivided fractional interest in a loan obligation of a borrower. They are typically purchased from banks or dealers that have made the loan, or are members of the loan syndicate, and that act as the servicing agent for the principal and interest payments. The loans may be to U.S. or foreign companies. Participation interests may be collateralized or uncollateralized and are subject to the credit risk of the servicing agent as well as the credit risk of the borrower. If the Fund purchases a participation interest, it may only be able to enforce its rights through the lender. The Fund can also buy interests in trusts and other entities that hold loan obligations. In that case the Fund will be subject to the trust's credit risks as well as the credit risks of the servicing agent and the underlying loans. In some cases, participation interests, whether held directly by the Fund or indirectly through an interest in a trust or other entity, may be partially "unfunded," meaning that the Fund may be required to advance additional money on future dates.

     The Fund does not invest more than 5% of its net assets in loan participation interests with respect to any one borrower.

Repurchase Agreements. The Fund may also enter into repurchase agreements. In a repurchase transaction, the Fund buys a security and simultaneously sells it back to the vendor for delivery at a future date. Repurchase agreements must be fully collateralized. However, if the seller fails to pay the repurchase price on the delivery date, the Fund may incur costs in disposing of the collateral and may experience losses if there is any delay in its ability to do so. If the default on the part of the seller is due to its bankruptcy, the Fund's ability to liquidate the collateral may be delayed or limited.

When-Issued and Delayed-Delivery Transactions. The Fund may purchase securities on a "when-issued" basis and may purchase or sell such securities on a "delayed-delivery" basis. When-issued and delayed-delivery securities are purchased at a price that is fixed at the time of the transaction, with payment and delivery of the security made at a later date. When purchasing securities in this manner, during the period between purchase and settlement, the Fund makes no payment to the issuer (or seller) of the security and no interest accrues to the Fund from the investment.

The securities are subject to changes in value from market fluctuations during the period until settlement and the value of the security on the delivery date may be more or less than the Fund paid. The Fund may lose money if the value of the security declines below the purchase price.

Illiquid and Restricted Securities. Investments that do not have an active trading market, or that have legal or contractual limitations on their resale, are generally referred to as "illiquid" securities. Illiquid securities may be difficult to value or to sell promptly at an acceptable price or may require registration under applicable securities laws before they can be sold publicly. Securities that have limitations on their resale are referred to as "restricted securities." Certain restricted securities that are eligible for resale to qualified institutional purchasers may not be regarded as illiquid.

     The Fund will not invest more than 15% of its net assets in illiquid securities.  The Manager monitors the Fund's holdings of illiquid securities on an ongoing basis to determine whether to sell any of those securities to maintain adequate liquidity.

Conflicts of Interest. The investment activities of the Manager and its affiliates in regard to other funds and accounts they manage may present conflicts of interest that could disadvantage the Fund and its shareholders. The Manager or its affiliates may provide investment advisory services to other funds and accounts that have investment objectives or strategies that differ from, or are contrary to, those of the Fund. That may result in another fund or account holding investment positions that are adverse to the Fund's investment strategies or activities. Other funds or accounts advised by the Manager or its affiliates may have conflicting interests arising from investment objectives that are similar to those of the Fund. Those funds and accounts may engage in, and compete for, the same types of securities or other investments as the Fund or invest in securities of the same issuers that have different, and possibly conflicting, characteristics. The trading and other investment activities of those other funds or accounts may be carried out without regard to the investment activities of the Fund and, as a result, the value of securities held by the Fund or the Fund's investment strategies may be adversely affected. The Fund's investment performance will usually differ from the performance of other accounts advised by the Manager or its affiliates and the Fund may experience losses during periods in which other accounts advised by the Manager or its affiliates achieve gains. The Manager has adopted policies and procedures designed to address potential conflicts of interest identified by the Manager; however, such policies and procedures may also limit the Fund's investment activities and affect its performance.

     The Fund offers its shares to separate accounts of different insurance companies, as an investment for their variable annuity contracts, variable life insurance policies and other investment products. While the Fund does not foresee any disadvantages to contract owners from these arrangements, it is possible that the interests of owners of different contracts participating in the Fund through different separate accounts might conflict. For example, a conflict could arise because of differences in tax treatment.

Investments in Oppenheimer Institutional Money Market Fund. The Fund can invest its free cash balances in Class E shares of Oppenheimer Institutional Money Market Fund to provide liquidity or for defensive purposes. The Fund invests in Oppenheimer Institutional Money Market Fund, rather than purchasing individual short-term investments, to seek a higher yield than it could obtain on its own. Oppenheimer Institutional Money Market Fund is a registered open-end management investment company, regulated as a money market fund under the Investment Company Act of 1940, and is part of the Oppenheimer family of funds. It invests in a variety of short-term, high-quality, dollar-denominated money market instruments issued by the U.S. Government, domestic and foreign corporations, other financial institutions, and other entities. Those investments may have a higher rate of return than the investments that would be available to the Fund directly. At the time of an investment, the Fund cannot always predict what the yield of the Oppenheimer Institutional Money Market Fund will be because of the wide variety of instruments that fund holds in its portfolio. The return on those investments may, in some cases, be lower than the return that would have been derived from other types of investments that would provide liquidity. As a shareholder, the Fund will be subject to its proportional share of the expenses of Oppenheimer Institutional Money Market Fund's Class E shares, including its advisory fee. However, the Manager will waive a portion of the Fund's advisory fee to the extent of the Fund's share of the advisory fee paid to the Manager by Oppenheimer Institutional Money Market Fund.

Temporary Defensive and Interim Investments. For temporary defensive purposes in times of adverse or unstable market, economic or political conditions, the Fund can invest up to 100% of its total assets in investments that may be inconsistent with the Fund's principal investment strategies. Generally, the Fund would invest in shares of Oppenheimer Institutional Money Market Fund or in the types of money market instruments in which Oppenheimer Institutional Money Market Fund invests or in other short-term U.S. Government securities. The Fund might also hold these types of securities as interim investments pending the investment of proceeds from the sale of Fund shares or the sale of Fund portfolio securities or to meet anticipated redemptions of Fund shares. To the extent the Fund invests in these securities, it might not achieve its investment objective.

Portfolio Turnover . A change in the securities held by the Fund is known as "portfolio turnover." The Fund may engage in active and frequent trading to try to achieve its investment objective and may have a portfolio turnover rate of over 100% annually. Increased portfolio turnover may result in higher brokerage fees or other transaction costs, which can reduce performance. The Financial Highlights table at the end of this prospectus shows the Fund's portfolio turnover rates during past fiscal years.

CHANGES TO THE FUND'S INVESTMENT POLICIES. The Fund's fundamental investment policies cannot be changed without the approval of a majority of the Fund's outstanding voting shares; however, the Fund's Board can change non-fundamental policies without a shareholder vote. Significant policy changes will be described in supplements to this prospectus. The Fund's investment objective is a fundamental policy. Other investment restrictions that are fundamental policies are listed in the Fund's Statement of Additional Information. An investment policy is not fundamental unless this prospectus or the Statement of Additional Information states that it is.

PORTFOLIO HOLDINGS.   The Fund's portfolio holdings are included in its semi-annual and annual reports that are distributed to its shareholders within 60 days after the close of the applicable reporting period. The Fund also discloses its portfolio holdings in its Statements of Investments on Form N-Q, which are public filings that are required to be made with the Securities and Exchange Commission within 60 days after the end of the Fund's first and third fiscal quarters. Therefore, the Fund's portfolio holdings are made publicly available no later than 60 days after the end of each of its fiscal quarters. In addition, the Fund's portfolio holdings information, as of the end of each calendar month, may be posted and available on the Fund's website no sooner than 30 days after the end of each calendar month.    

A description of the Fund's policies and procedures with respect to the disclosure of its portfolio holdings is available in the Fund's Statement of Additional Information.

How the Fund is Managed

THE MANAGER. OppenheimerFunds, Inc., the Manager, chooses the Fund's investments and handles its day-to-day business. The Manager carries out its duties, subject to the policies established by the Fund's Board of Trustees, under an investment advisory agreement that states the Manager's responsibilities. The agreement sets the fees the Fund pays to the Manager and describes the expenses that the Fund is responsible to pay to conduct its business.

The Manager has been an investment adviser since 1960. The Manager is located at Two World Financial Center, 225 Liberty Street, 11th Floor, New York, New York 10281-1008.

Advisory Fees.  Under the investment advisory agreement, the Fund pays the Manager an advisory fee at an annual rate that declines on additional assets as the Fund grows: 0.75% of the first $200 million of average annual net assets, 0.72% of the next $200 million, 0.69% of the next $200 million, 0.66% of the next $200 million, 0.60% on the next $200 million and 0.50% of average annual net assets over $1 billion. The Fund's management fee for its fiscal year ended December 31, 2010 was 0.75% of the Fund's average annual net assets for each class of shares.

The Manager has voluntarily agreed to limit the Fund's total annual operating expenses so that those expenses, as percentages of daily net assets, will not exceed the annual rate of 0.75% for Non-Service and Class 3 Shares and 1.00% for Service and Class 4 Shares. This voluntary expense limitation may not be amended or withdrawn until after one year from the date of this prospectus. The Manager has also voluntarily agreed to waive fees and/or reimburse Fund expenses in an amount equal to the indirect management fees incurred through the Fund's investment in Oppenheimer Institutional Money Market Fund. This waiver and/or reimbursement may be amended or withdrawn at any time.

From April 1, 2009 through March 31, 2010 the Manager voluntarily waived its advisory fee, resulting in an expense reduction of 0.06% of the Fund's average annual net assets. This amount is not reflected in the Annual Fund Operating Expenses table shown earlier in this prospectus. After all waivers and reimbursements, actual total annual fund operating expenses for the fiscal year ended December 31, 2010 were 0.69% for Non-Service Shares, 0.94% for Service Shares, 0.69% for Class 3 Shares and 0.94% for Class 4 Shares. The Fund's management fee and other annual operating expenses may vary in future years.

A discussion regarding the basis for the Board of Trustees' approval of the Fund's investment advisory contract is available in the Fund's Annual Report to shareholders for the year ended December 31, 2010.

Portfolio Manager. The Fund's portfolio is managed by Joseph Welsh, who is primarily responsible for the day-to-day management of the Fund's investments. Mr. Welsh has been a portfolio manager and Vice President of the Fund since April, 2009.

     Mr. Welsh, CFA, has been the Head of the Manager's High Yield Corporate Debt Team since April 2009; Senior Vice President of the Manager since May 2009 and a Vice President of the Manager from December 2000 to April 2009. He was an Assistant Vice President of the Manager from December 1996 to November 2000 and a high yield bond analyst of the Manager from January 1995 to December 1996. He was a senior bond analyst with W.R. Huff Asset Management from November 1991 to December 1994. Mr. Welsh is a portfolio manager and officer of other portfolios in the OppenheimerFunds complex.

The Statement of Additional Information provides additional information about the portfolio manager's compensation, other accounts he manages and his ownership of Fund shares.

INVESTING IN THE FUND 

How to Buy and Sell Shares

You may only submit instructions for buying or selling shares of the Fund to your insurance company or its servicing agent, not directly to the Fund or its Transfer Agent. Information about your investment in the Fund can only be obtained from your participating insurance company or its servicing agent. The Fund's Transfer Agent does not hold or have access to those records.

WHAT CLASSES OF SHARES DOES THE FUND OFFER? The Fund currently offers four different classes of shares. The different classes of shares represent investments in the same portfolio of securities, but the classes are subject to different expenses and will usually have different share prices. The Service Shares and Class 4 Shares are subject to a distribution and service plan. The expenses of that plan are described below. The Non-Service Shares and Class 3 Shares are not subject to a service and distribution plan.

THE PRICE OF FUND SHARES. Fund shares are sold to participating insurance companies, and are redeemed, at their net asset value per share. The net asset value that applies to a purchase order is the next one calculated after the insurance company (as the Fund's designated agent to receive purchase orders) receives the order from its contract owner, in proper form. Fund shares are redeemed at the next net asset value calculated after the insurance company (as the Fund's designated agent to receive purchase orders) receives the order from its contract owner, in proper form, less any applicable redemption fee. The Fund's Transfer Agent generally must receive the purchase or redemption order from the insurance company by 9:30 am Eastern Time on the next regular business day.

The Fund does not impose any sales charge on purchases of its shares. However, the Fund imposes a 1% redemption fee on the proceeds of Class 3 and Class 4 shares that a contract owner redeems within 60 days after their purchase. If there are any charges imposed under the variable annuity, variable life or other contract through which Fund shares are purchased, they are described in the accompanying prospectus of the participating insurance company. The participating insurance company's prospectus may also include information regarding the time you must submit your purchase and redemption orders.

     The sale and redemption price for Fund shares will change from day to day because the value of the securities in its portfolio and its expenses fluctuate. The redemption price will normally differ for different classes of shares. The redemption price of your shares may be more or less than their original cost.

Net Asset Value. The Fund calculates the net asset value of each class of shares as of the close of the New York Stock Exchange (NYSE), on each day the NYSE is open for trading (referred to in this prospectus as a "regular business day"). The NYSE normally closes at 4:00 p.m., Eastern Time, but may close earlier on some days.

The Fund determines the net assets of each class of shares by subtracting the class-specific expenses and the amount of the Fund's liabilities attributable to the share class from the market value of the Fund's securities and other assets attributable to the share class. The Fund's "other assets" might include, for example, cash and interest or dividends from its portfolio securities that have been accrued but not yet collected. The Fund's securities are valued primarily on the basis of current market quotations.

The net asset value per share for each share class is determined by dividing the net assets of the class by the number of outstanding shares of that class.

     Fair Value Pricing. If market quotations are not readily available or (in the Manager's judgment) do not accurately reflect the fair value of a security, or if after the close of the principal market on which a security held by the Fund is traded and before the time as of which the Fund's net asset value is calculated that day, an event occurs that the Manager learns of and believes in the exercise of its judgment will cause a material change in the value of that security from the closing price of the security on the principal market on which it is traded, that security may be valued by another method that the Board believes would more accurately reflect the security's fair value.

In determining whether current market prices are readily available and reliable, the Manager monitors the information it receives in the ordinary course of its investment management responsibilities. It seeks to identify significant events that it believes, in good faith, will affect the market prices of the securities held by the Fund. Those may include events affecting specific issuers (for example, a halt in trading of the securities of an issuer on an exchange during the trading day) or events affecting securities markets (for example, a foreign securities market closes early because of a natural disaster). The Board has adopted valuation procedures for the Fund and has delegated the day-to-day responsibility for fair value determinations to the Manager's "Valuation Committee." Those determinations may include consideration of recent transactions in comparable securities, information relating to the specific security, developments in the markets and their performance, and current valuations of foreign or U.S. indices. Fair value determinations by the Manager are subject to review, approval and ratification by the Board at its next scheduled meeting after the fair valuations are determined.

The Fund's use of fair value pricing procedures involves subjective judgments and it is possible that the fair value determined for a security may be materially different from the value that could be realized upon the sale of that security. Accordingly, there can be no assurance that the Fund could obtain the fair value assigned to a security if it were to sell the security at approximately the same time at which the Fund determines its net asset value per share.

     Pricing Foreign Securities . The Fund may use fair value pricing more frequently for securities primarily traded on foreign exchanges. Because many foreign markets close hours before the Fund values its foreign portfolio holdings, significant events, including broad market movements, may occur during that time that could potentially affect the values of foreign securities held by the Fund.

The Manager believes that foreign securities values may be affected by volatility that occurs in U.S. markets after the close of foreign securities markets. The Manager's fair valuation procedures therefore include a procedure whereby foreign securities prices may be "fair valued" to take those factors into account.

Because some foreign securities trade in markets and on exchanges that operate on weekends and U.S. holidays, the values of some of the Fund's foreign investments may change on days when investors cannot buy or redeem Fund shares.

HOW CAN YOU BUY FUND SHARES? Shares of the Fund may be purchased only by separate investment accounts of participating insurance companies as an underlying investment for variable life insurance policies, variable annuity contracts or other investment products. Individual investors cannot buy shares of the Fund directly. Please refer to the accompanying prospectus of the participating insurance company for information on how to select the Fund as an investment option. That prospectus will indicate which share class you may be eligible to purchase.

Suspension of Share Offering. The offering of Fund shares may be suspended during any period in which the determination of net asset value is suspended, and may be suspended by the Board at any time the Board believes it is in the Fund's best interest to do so.

HOW CAN YOU REDEEM FUND SHARES? Only the participating insurance companies that hold Fund shares in their separate accounts can place orders to redeem shares. Contract holders and policy holders should not directly contact the Fund or its transfer agent to request a redemption of Fund shares. The Fund normally sends payment by Federal Funds wire to the insurance company's account on the next business day after the Fund receives the order (and no later than seven days after the Fund's receipt of the order). Under unusual circumstances determined by the Securities and Exchange Commission, payment may be delayed or suspended. Contract owners should refer to the withdrawal or surrender instructions in the accompanying prospectus of the participating insurance company.

Redemption Fee. The Fund imposes a 1% redemption fee on Class 3 and Class 4 shares that a contract owner redeems within 60 days after their purchase. The redemption fee is collected by the participating insurance company and paid to the Fund. It is intended to help offset the trading, market impact, and administrative costs associated with short-term transactions in Fund shares, and to help deter excessive short term trading. The redemption fee will only be imposed on the Class 3 or Class 4 shares you redeem that are more than the number of Class 3 or Class 4 shares you have held for more than 60 days. Shares held the longest will be redeemed first.

Limitations on Frequent Transactions

Frequent purchases and redemptions of Fund shares may interfere with the Manager's ability to manage the Fund's investments efficiently, may increase its transaction and administrative costs and may affect its performance, depending on various factors, such as the size of the Fund, the nature of its investments, the amount of Fund assets the portfolio manager maintains in cash or cash equivalents, and the aggregate dollar amount, the number and the frequency of trades.

If large dollar amounts are involved in frequent redemption transactions, the Fund might be required to sell portfolio securities at unfavorable times to meet those transaction requests, and the Fund's brokerage or administrative expenses might be increased. Therefore, the Manager and the Fund's Board have adopted the following policies and procedures to detect and prevent frequent and/or excessive purchase and redemption activity, while addressing the needs of investors who seek liquidity in their investment. There is no guarantee that those policies and procedures, described below, will be sufficient to identify and deter all excessive short-term trading. If the Transfer Agent is not able to detect and curtail such activity, frequent trading could occur in the Fund.

Policies on Disruptive Activity.  The Transfer Agent and the Distributor, on behalf of the Fund, have entered into agreements with participating insurance companies designed to detect and restrict excessive short-term trading activity by contract or policy owners or their financial advisers in their accounts. The Transfer Agent generally does not consider periodic asset allocation or re-balancing that affects a portion of the Fund shares held in the account of a policy or contract owner to be "excessive trading." However, the Transfer Agent has advised participating insurance companies that it generally considers certain other types of trading activity to be "excessive," such as making a "transfer" out of the Fund within 30 days after buying Fund shares (by the sale of the recently purchased Fund shares and the purchase of shares of another fund) or making more than six "round-trip transfers" between funds during one year. The agreements require participating insurance companies to provide transaction information to the Fund and to execute Fund instructions to restrict trading in Fund shares.

 A participating insurance company may also have its own policies and procedures and may impose its own restrictions or limitations to discourage short-term and/or excessive trading by its policy or contract owners. Those policies and procedures may be different from the Fund's in certain respects. You should refer to the prospectus for your insurance company variable annuity contract for specific information about the insurance company's policies. Under certain circumstances, policy or contract owners may be required to transmit purchase or redemption orders only by first class U.S. mail.

Monitoring the Policies. The Fund's policies and procedures for detecting and deterring frequent or excessive trading are administered by the Fund's Transfer Agent. However, the Transfer Agent presently does not have the ability to directly monitor trading activity in the accounts of policy or contract owners within the participating insurance companies' accounts. The Transfer Agent's ability to monitor and deter excessive short-term trading in such insurance company accounts ultimately depends on the capability and diligence of each participating insurance company, under their agreements with the Transfer Agent, the Distributor and the Fund, in monitoring and controlling the trading activity of the policy or contract owners in the insurance company's accounts.

The Transfer Agent will attempt to monitor the net effect on the Fund's assets from the purchase and redemption activity in the accounts of participating insurance companies and will seek to identify patterns that may suggest excessive trading by the contract or policy owners who invest in the insurance company's accounts. If the Transfer Agent believes it has observed evidence of possible excessive trading activity, it will ask the participating insurance companies or other registered owners to provide information about the transaction activity of the contract or policy holders in their respective accounts, and to take appropriate action. In that case, the insurance company must confirm to the Transfer Agent that appropriate action has been taken to curtail the excessive trading activity.

The Transfer Agent will, subject to the limitations described in this section, limit or terminate the trading activity of any person, group or account that it believes would be excessive or disruptive. However, the Transfer Agent may not be able to detect or curtail all such trading activity in the Fund. The Transfer Agent will evaluate trading activity on a case by case basis and the limitations placed on trading may vary between accounts.

Right to Refuse Purchase Orders. The Fund's Distributor or Transfer Agent may, in their discretion, refuse any purchase order and are not obligated to provide notice before rejecting an order.  

DISTRIBUTION AND SERVICE (12b-1) PLANS

Distribution and Service Plan for Service Shares and Class 4 Shares. The Fund has adopted a Distribution and Service Plan for Service Shares and Class 4 Shares to pay the Distributor for distribution related services, personal services and account maintenance for those shares. Under the Plan, the Fund pays the Distributor quarterly at an annual rate of up to 0.25% of the daily net assets of the Fund's Service Shares and Class 4 Shares. Because these fees are paid out of the Fund's assets on an on-going basis, over time they will increase the operating expenses of the Service Shares and Class 4 Shares and may cost you more than other types of fees or sales charges. As a result, the Service Shares and Class 4 Shares may have lower performance compared to the Fund's shares that are not subject to a service fee.

Use of Plan Fees: The Distributor currently uses all of those fees to compensate sponsor(s) of the insurance product for providing personal services and account maintenance for variable contract owners that hold Service Shares and Class 4 Shares.

PAYMENTS TO FINANCIAL INTERMEDIARIES AND SERVICE PROVIDERS. The Manager and the Distributor, in their discretion, may also make payments for distribution and/or shareholder servicing activities to brokers, dealers and other financial intermediaries, including the insurance companies that offer the Fund as an investment option, or to service providers. Those payments are made out of the Manager's and/or the Distributor's own resources and/or assets, including from the revenues or profits derived from the advisory fees the Manager receives from the Fund. Those cash payments, which may be substantial, are paid to many firms having business relationships with the Manager and Distributor and are in addition to any distribution fees, servicing fees, or transfer agency fees paid directly or indirectly by the Fund to those entities. Payments by the Manager or Distributor from their own resources are not reflected in the tables in the "Fees and Expenses of the Fund" section of this prospectus because they are not paid by the Fund.

The financial intermediaries that may receive those payments include firms that offer and sell Fund shares to their clients, or provide shareholder services to the Fund, or both, and receive compensation for those activities. The financial intermediaries that may receive payments include securities brokers, dealers, financial advisers, insurance companies that offer variable annuity or variable life insurance products and other intermediaries.

In general, these payments to financial intermediaries can be categorized as "distribution-related" or "servicing" payments. Payments for distribution-related expenses, such as marketing or promotional expenses, are often referred to as "revenue sharing." Revenue sharing payments may be made on the basis of the sales of shares attributable to that intermediary, the average net assets of the Fund and other Oppenheimer funds attributable to the accounts of that intermediary and its clients, negotiated lump sum payments for distribution services provided, or similar fees. In some circumstances, revenue sharing payments may create an incentive for a financial intermediary or its representatives to recommend or offer shares of the Fund or other Oppenheimer funds to its customers. These payments also may give an intermediary an incentive to cooperate with the Distributor's marketing efforts. A revenue sharing payment may, for example, qualify the Fund for preferred status with the intermediary receiving the payment or provide representatives of the Distributor with access to representatives of the intermediary's sales force, in some cases on a preferential basis over funds of competitors. Additionally, as firm support, the Manager or Distributor may reimburse expenses related to educational seminars and "due diligence" or training meetings (to the extent permitted by applicable laws or the rules of the Financial Industry Regulatory Authority ("FINRA")) designed to increase sales representatives' awareness about Oppenheimer funds, including travel and lodging expenditures. However, the Manager does not consider a financial intermediary's sale of shares of the Fund or other Oppenheimer funds when selecting brokers or dealers to effect portfolio transactions for the funds.

Various factors are used to determine whether to make revenue sharing payments. Possible considerations include, without limitation, the types of services provided by the intermediary, sales of Fund shares, the redemption rates on accounts of clients of the intermediary or overall asset levels of Oppenheimer funds held for or by clients of the intermediary, the willingness of the intermediary to allow the Distributor to provide educational and training support for the intermediary's sales personnel relating to the Oppenheimer funds, the availability of the Oppenheimer funds on the intermediary's sales system, as well as the overall quality of the services provided by the intermediary and the Manager or Distributor's relationship with the intermediary. The Manager and Distributor have adopted guidelines for assessing and implementing each prospective revenue sharing arrangement. To the extent that financial intermediaries receiving distribution-related payments from the Manager or Distributor sell more shares of the Oppenheimer funds or retain more shares of the funds in their client accounts, the Manager and Distributor benefit from the incremental management and other fees they receive with respect to those assets.

Payments may also be made by the Manager, the Distributor or the Transfer Agent to financial intermediaries to compensate or reimburse them for administrative or other client services provided such as sub-transfer agency services for shareholders, omnibus accounting or sub-accounting, participation in networking arrangements, account set-up, recordkeeping and other shareholder services. Payments may also be made for administrative services related to the distribution of Fund shares through the intermediary. Firms that may receive servicing fees include insurance companies that offer variable annuity or variable life insurance products and others. These fees may be used by the service provider to offset or reduce fees that would otherwise be paid directly to them by certain account holders. The Statement of Additional Information contains more information about revenue sharing and service payments made by the Manager or the Distributor. Your broker, dealer or other financial intermediary may charge you fees or commissions in addition to those disclosed in this prospectus. You should ask your financial intermediary for details about any such payments it receives from the Manager or the Distributor and their affiliates, or any other fees or expenses it charges.

Dividends, Capital Gains and Taxes

DIVIDENDS AND DISTRIBUTIONS. The Fund intends to declare and pay dividends annually from any net investment income. The Fund may also realize capital gains on the sale of portfolio securities, in which case it may make distributions out of any net short-term or long-term capital gains annually. The Fund may also make supplemental distributions of dividends and capital gains following the end of its fiscal year. The Fund has no fixed dividend rate and cannot guarantee that it will pay any dividends or capital gains distributions in a particular year.

Dividends and distributions are paid separately for each share class. Because of the higher expenses on Service Shares and Class 4 shares, the dividends and capital gains distributions paid on those shares will generally be lower than for other Fund shares.

Receiving Dividends and Distributions. Any dividends and capital gains distributions will be automatically reinvested in additional Fund shares for the account of the participating insurance company, unless the insurance company elects to have dividends or distributions paid in cash.

TAXES. For a discussion of the tax status of a variable annuity contract, a variable life insurance policy or other investment product of a participating insurance company, please refer to the accompanying variable contract prospectus of your participating insurance company. Because shares of the Fund may be purchased only through insurance company separate accounts for variable annuity contracts, variable life insurance policies or other investment products, any dividends from net investment income and distributions of net realized short-term and long-term capital gains will be taxable, if at all, to the participating insurance company. However, those payments may affect the tax basis of certain types of distributions from those accounts.

The Fund has qualified and intends to qualify each year to be taxed as a regulated investment company under the Internal Revenue Code by satisfying certain income, asset diversification and income distribution requirements, but reserves the right not to so qualify. In each year that it qualifies as a regulated investment company, the Fund will not be subject to federal income taxes on its income that it distributes to shareholders.

This information is only a summary of certain Federal income tax information about your investment. You are encouraged to consult your tax adviser about the effect of an investment in the Fund on your particular tax situation and about any changes to the Internal Revenue Code that may occur from time to time. Additional information about the tax effects of investing in the Fund is contained in the Statement of Additional Information.

Financial Highlights

The Financial Highlights Table is presented to help you understand the Fund's financial performance for the past five fiscal years. Certain information reflects financial results for a single Fund share. The total returns in the table represent the rate that an investor would have earned (or lost) on an investment in the Fund (assuming reinvestment of all dividends and distributions). This information has been audited by KPMG LLP, the Fund's independent registered public accounting firm for the fiscal years ended December 31, 2010 and 2009. The financial highlights for the prior years were audited by another independent registered public accounting firm. KPMG's report, along with the Fund's financial statements, are included in the Statement of Additional Information, which is available upon request.

Financial Highlights Table

FINANCIAL HIGHLIGHTS

Non-Service Shares      Year Ended December 31,

2010


2009


2008


2007


2006


Per Share Operating Data


Net asset value, beginning of period

$1.98


$1.58


$7.95


$8.55


$8.44


Income (loss) from investment operations:


Net investment income1

.18


.17


.54


.57


.58


Net realized and unrealized gain (loss)

.10


.23


(6.44)


(.56)


.17


Total from investment operations

.28


.40


(5.90)


.01


.75


Dividends and/or distributions to shareholders:


Dividends from net investment income

(.13)


--


(.47)


(.61)


(.64)


Net asset value, end of period

$2.13


$1.98


$1.58


$7.95


$8.55


Total Return, at Net Asset Value2

14.81%


25.32%


(78.67)%


(0.10)%


9.42%


Ratios/Supplemental Data


Net assets, end of period (in thousands)

$61,563


$67,385


$111,040


$294,819


$361,445


Average net assets (in thousands)

$59,598


$71,782


$211,186


$335,702


$365,154


Ratios to average net assets:3


Net investment income

9.01%


9.78%


9.30%


6.96%


7.05%


Total expenses4

0.98%


0.94%


0.80%


0.75%


0.74%


Expenses after payments, waivers and/or reimbursements and reduction to custodian expenses

0.69%


0.57%


0.78%


0.74%


0.74%


Portfolio turnover rate

132%


128%


53%5


67%5


57%


1. Per share amounts calculated based on the average shares outstanding during the period.

2. Assumes an initial investment on the business day before the first day of the fiscal period, with all dividends and distributions reinvested in additional shares on the reinvestment date, and redemption at the net asset value calculated on the last business day of the fiscal period. Total returns are not annualized for periods less than one full year. Total return information does not reflect expenses that apply at the separate account level or to related insurance products. Inclusion of these charges would reduce the total return figures for all periods shown. Returns do not reflect the deduction of taxes that a shareholder would pay on fund distributions or the redemption of fund shares.

3. Annualized for periods less than one full year.

4. Total expenses including indirect expenses from affiliated fund were as follows:

Year Ended December 31, 2010

0.98%

Year Ended December 31, 2009

0.96%

Year Ended December 31, 2008

0.80%

Year Ended December 31, 2007

0.76%

Year Ended December 31, 2006

0.74%

5. The portfolio turnover rate excludes purchase and sale transactions of To Be Announced (TBA) mortgage-related securities as follows:

Purchase Transactions

Sale Transactions

Year Ended December 31, 2008

$40,240,084

$41,196,921

Year Ended December 31, 2007

$30,798,147

$24,096,458

Service Shares      Year Ended December 31,

2010


2009


2008


2007


2006


Per Share Operating Data


Net asset value, beginning of period

$1.99


$1.58


$7.89


$8.50


$8.39


Income (loss) from investment operations:


Net investment income1

.17


.16


.54


.55


.56


Net realized and unrealized gain (loss)

.10


.25


(6.40)


(.57)


.17


Total from investment operations

.27


.41


(5.86)


(.02)


.73


Dividends and/or distributions to shareholders:


Dividends from net investment income

(.12)


--


(.45)


(.59)


(.62)


Net asset value, end of period

$2.14


$1.99


$1.58


$7.89


$8.50


Total Return, at Net Asset Value2

14.44%


25.95%


(78.57)%


(0.47)%


9.23%


Ratios/Supplemental Data


Net assets, end of period (in thousands)

$63,713


$64,440


$ 43,375


$157,333


$173,299


Average net assets (in thousands)

$63,661


$54,202


$116,236


$169,569


$160,703


Ratios to average net assets:3


Net investment income

8.76%


9.60%


9.13%


6.71%


6.80%


Total expenses4

1.23%


1.21%


1.05%


1.01%


1.00%


Expenses after payments, waivers and/or reimbursements and reduction to custodian expenses

0.94%


0.80%


1.03%


1.00%


1.00%


Portfolio turnover rate

132%


128%


53%5


67%5


57%


1. Per share amounts calculated based on the average shares outstanding during the period.

2. Assumes an initial investment on the business day before the first day of the fiscal period, with all dividends and distributions reinvested in additional shares on the reinvestment date, and redemption at the net asset value calculated on the last business day of the fiscal period. Total returns are not annualized for periods less than one full year. Total return information does not reflect expenses that apply at the separate account level or to related insurance products. Inclusion of these charges would reduce the total return figures for all periods shown. Returns do not reflect the deduction of taxes that a shareholder would pay on fund distributions or the redemption of fund shares.

3. Annualized for periods less than one full year.

4. Total expenses including indirect expenses from affiliated fund were as follows:

Year Ended December 31, 2010

1.23%

Year Ended December 31, 2009

1.23%

Year Ended December 31, 2008

1.05%

Year Ended December 31, 2007

1.02%

Year Ended December 31, 2006

1.00%

5. The portfolio turnover rate excludes purchase and sale transactions of To Be Announced (TBA) mortgage-related securities as follows:

Purchase Transactions

Sale Transactions

Year Ended December 31, 2008

$40,240,084

$41,196,921

Year Ended December 31, 2007

$30,798,147

$24,096,458


Class 3 Shares      Year Ended December 31,                                          

2010


2009


2008


20071


Per Share Operating Data


Net asset value, beginning of period

$1.99


$1.57


$7.98


$8.26


Income (loss) from investment operations:


Net investment income2

.18


.17


.56


.37


Net realized and unrealized gain (loss)

.10


.25


(6.50)


(.65)


Total from investment operations

.28


.42


(5.94)


(.28)


Dividends and/or distributions to shareholders:


Dividends from net investment income

(.13)


--


(.47)


--


Net asset value, end of period

$2.14


$1.99


$1.57


$7.98


Total Return, at Net Asset Value3

14.69%


26.75%


(78.89)%


(3.39)%


Ratios/Supplemental Data


Net assets, end of period (in thousands)

$6,034


$4,684


$1,582


$4,921


Average net assets (in thousands)

$5,279


$3,568


$5,292


$3,750


Ratios to average net assets:4


Net investment income

8.97%


9.86%


9.29%


6.90%


Total expenses5

0.99%


0.97%


0.80%


0.76%


Expenses after payments, waivers and/or reimbursements and reduction to custodian expenses

0.69%


0.53%


0.78%


0.75%


Portfolio turnover rate

132%


128%


53%6


67%6


1. For the period from May 1, 2007 (inception of offering) to December 31, 2007.

2. Per share amounts calculated based on the average shares outstanding during the period.

3. Assumes an initial investment on the business day before the first day of the fiscal period, with all dividends and distributions reinvested in additional shares on the reinvestment date, and redemption at the net asset value calculated on the last business day of the fiscal period. Total returns are not annualized for periods less than one full year. Total return information does not reflect expenses that apply at the separate account level or to related insurance products. Inclusion of these charges would reduce the total return figures for all periods shown. Returns do not reflect the deduction of taxes that a shareholder would pay on fund distributions or the redemption of fund shares.

4. Annualized for periods less than one full year.

5. Total expenses including indirect expenses from affiliated fund were as follows:

Year Ended December 31, 2010

0.99%

Year Ended December 31, 2009

0.99%

Year Ended December 31, 2008

0.80%

Period Ended December 31, 2007

0.77%

6. The portfolio turnover rate excludes purchase and sale transactions of To Be Announced (TBA) mortgage-related securities as follows:

Purchase Transactions

Sale Transactions

Year Ended December 31, 2008

$40,240,084

$41,196,921

Period Ended December 31, 2007

$30,798,147

$24,096,458


Class 4 Shares      Year Ended December 31,

2010


2009


2008


20071


Per Share Operating Data


Net asset value, beginning of period

$2.01


$1.59


$7.97


$8.26


Income (loss) from investment operations:


Net investment income2

.18


.16


.54


.36


Net realized and unrealized gain (loss)

.09


.26


(6.46)


(.65)


Total from investment operations

.27


.42


(5.92)


(.29)


Dividends and/or distributions to shareholders:


Dividends from net investment income

(.12)


--


(.46)


--


Net asset value, end of period

$2.16


$2.01


$1.59


$7.97


Total Return, at Net Asset Value3

14.27%


26.42%


(78.63)%


(3.51)%


Ratios/Supplemental Data


Net assets, end of period (in thousands)

$7,573


$7,107


$ 4,167


$9,476


Average net assets (in thousands)

$7,278


$6,285


$10,658


$7,201


Ratios to average net assets:4


Net investment income

8.74%


9.62%


9.00%


6.61%


Total expenses5

1.23%


1.19%


1.07%


1.05%


Expenses after payments, waivers and/or reimbursements and reduction to custodian expenses

0.94%


0.80%


1.05%


1.04%


Portfolio turnover rate

132%


128%


53%6


67%6


1. For the period from May 1, 2007 (inception of offering) to December 31, 2007.

2. Per share amounts calculated based on the average shares outstanding during the period.

3. Assumes an initial investment on the business day before the first day of the fiscal period, with all dividends and distributions reinvested in additional shares on the reinvestment date, and redemption at the net asset value calculated on the last business day of the fiscal period. Total returns are not annualized for periods less than one full year. Total return information does not reflect expenses that apply at the separate account level or to related insurance products. Inclusion of these charges would reduce the total return figures for all periods shown. Returns do not reflect the deduction of taxes that a shareholder would pay on fund distributions or the redemption of fund shares.

4. Annualized for periods less than one full year.

5. Total expenses including indirect expenses from affiliated fund were as follows:

Year Ended December 31, 2010

1.23%

Year Ended December 31, 2009

1.21%

Year Ended December 31, 2008

1.07%

Period Ended December 31, 2007

1.06%

6. The portfolio turnover rate excludes purchase and sale transactions of To Be Announced (TBA) mortgage-related securities as follows:

Purchase Transactions

Sale Transactions

Year Ended December 31, 2008

$40,240,084

$41,196,921

Period Ended December 31, 2007

$30,798,147

$24,096,458


INFORMATION AND SERVICES

STATEMENT OF ADDITIONAL INFORMATION. This document includes additional information about the Fund's investment policies, risks, and operations. It is incorporated by reference into this prospectus (it is legally part of this prospectus).

ANNUAL AND SEMI-ANNUAL REPORTS. The Fund's Annual and Semi-Annual Reports provide additional information about the Fund's investments and performance. The Annual Report includes a discussion of market conditions and investment strategies that significantly affected the Fund's performance during its last fiscal year.

How to Request More Information

You can request the above documents, the notice explaining the Fund's privacy policy, and other information about the Fund, without charge, by:

Telephone:

Call OppenheimerFunds Services toll-free: 1.800.988.8287

Mail:

Use the following address for regular mail:
OppenheimerFunds Services
P.O. Box 5270
Denver, Colorado 80217-5270

Use the following address for courier or express mail:
OppenheimerFunds Services
12100 East Iliff Avenue
Suite 300
Aurora, Colorado 80014

Internet:

You can read or download the Fund's Statement of Additional Information, Annual and Semi-Annual Reports on the OppenheimerFunds website at: www.oppenheimerfunds.com


Information about the Fund including the Statement of Additional Information can be reviewed and copied at the SEC's Public Reference Room in Washington, D.C. Information on the operation of the Public Reference Room may be obtained by calling the SEC at 1.202.551.8090. Reports and other information about the Fund are available on the EDGAR database on the SEC's website at www.sec.gov. Copies may be obtained after payment of a duplicating fee by electronic request at the SEC's e-mail address: publicinfo@sec.gov or by writing to the SEC's Public Reference Section, Washington, D.C. 20549-1520.

No one has been authorized to provide any information about the Fund or to make any representations about the Fund other than what is contained in this prospectus. This prospectus is not an offer to sell shares of the Fund, nor a solicitation of an offer to buy shares of the Fund, to any person in any state or other jurisdiction where it is unlawful to make such an offer.


The Fund's SEC File No.: 811-04108
SP0640.001.0411


OPPENHEIMER
Main Street Fund®/VA

A series of Oppenheimer Variable Account Funds

Share Classes:

     Non-Service Shares

     Service Shares

Prospectus dated April 29, 2011 

As with all mutual funds, the Securities and Exchange Commission has not approved or disapproved the Fund's securities nor has it determined that this prospectus is accurate or complete. It is a criminal offense to represent otherwise.

     Oppenheimer Main Street Fund/VA is a mutual fund that seeks high total return. It emphasizes investments in common stocks based on analyses using fundamental research and quantitative models.

Shares of the Fund are sold only as an underlying investment for variable life insurance policies, variable annuity contracts and other insurance company separate accounts. A prospectus for the insurance product you have selected accompanies this prospectus and explains how to select shares of the Fund as an investment under that insurance product, and which share class or classes you are eligible to purchase.

This prospectus contains important information about the Fund's objective, investment policies, strategies and risks. Please read this prospectus (and your insurance product prospectus) carefully before you invest and keep them for future reference about your account.


Oppenheimer Main Street Fund/VA


Table of contents

THE FUND SUMMARY

Investment Objective

3

Fees and Expenses of the Fund

3

Principal Investment Strategies

3

Principal Risks

3

The Fund's Past Performance

4

Investment Adviser

5

Portfolio Managers

5

Purchase and Sale Fund Shares

5

Taxes

5

Payments to Broker-Dealers and Other Financial Intermediaries

5

MORE ABOUT THE FUND

About the Fund's Investments

6

How the Fund is Managed

9

MORE ABOUT YOUR INVESTMENT

How to Buy and Sell Shares

10

Dividends, Capital Gains and Taxes

12

Financial Highlights

13


To Summary Prospectus

THE FUND SUMMARY

Investment Objective. The Fund seeks high total return.

Fees and Expenses of the Fund. This table describes the fees and expenses that you may pay if you buy and hold or redeem shares of the Fund. The accompanying prospectus of the participating insurance company provides information on initial or contingent deferred sales charges, exchange fees or redemption fees for that variable life insurance policy, variable annuity or other investment product. The fees and expenses of those products are not charged by the Fund and are not reflected in this table. Expenses would be higher if those fees were included.

Shareholder Fees (fees paid directly from your investment)

Non-Service Shares

Service Shares

Maximum Sales Charge (Load) imposed on purchases (as % of offering price)

None

None

Maximum Deferred Sales Charge (Load) (as % of the lower of original offering price or redemption proceeds)

None

None


Annual Fund Operating Expenses (expenses that you pay each year as a percentage of the value of your investment)

Non-Service Shares

Service Shares

Management Fees

0.65%

0.65%

Distribution and/or Service (12b-1) Fees

None

0.25%

Other Expenses

0.13%

0.13%

Total Annual Operating Expenses

0.78%

1.03%


Example. The following Example is intended to help you compare the cost of investing in the Fund with the cost of investing in other mutual funds. The Example assumes that you invest $10,000 in a class of shares of the Fund for the time periods indicated. The Example also assumes that your investment has a 5% return each year and that the Fund's operating expenses remain the same. Although your actual costs may be higher or lower, based on these assumptions your expenses would be as follows, whether or not you redeemed your shares:

1 Year   3 Years   5 Years   10 Years  
Non-Service Shares $ 80 $ 250 $ 435 $ 970
Service Shares $ 106 $ 329 $ 571 $ 1,266


Portfolio Turnover. The Fund pays transaction costs, such as commissions, when it buys and sells securities (or "turns over" its portfolio). A higher portfolio turnover rate may indicate higher transaction costs. These costs, which are not reflected in the annual fund operating expenses or in the example, affect the Fund's performance. During the most recent fiscal year, the Fund's portfolio turnover rate was 45% of the average value of its portfolio.

Principal Investment Strategies. The Fund mainly invests in common stocks of U.S. companies of different capitalization ranges. The Fund currently focuses on "larger capitalization" issuers, which are considered to be companies with market capitalizations equal to the companies in the Russell 1000 Index. The portfolio managers use fundamental research and quantitative models to select securities for the Fund's portfolio, which is comprised of both growth and value stocks. While the process may change over time or vary in particular cases, in general the selection process currently uses:

  • a fundamental approach in analyzing issuers on factors such as a company's financial performance and prospects, industry position, and business model and management strength. Industry outlook, market trends and general economic conditions may also be considered.

  • quantitative models to rank securities within each sector to identify potential buy and sell candidates for further fundamental analysis. A number of company-specific factors are analyzed in constructing the models, including valuation, fundamentals and momentum.

     The portfolio is constructed and regularly monitored based upon several analytical tools, including quantitative investment models. The Fund aims to maintain a broadly diversified portfolio across major economic sectors by applying investment parameters for both sector and position size. The portfolio managers use the following sell criteria: the stock price is approaching its target, deterioration in the company's competitive position, poor execution by the company's management, or identification of more attractive alternative investment ideas.

Principal Risks. The price of the Fund's shares can go up and down substantially. The value of the Fund's investments may change because of broad changes in the markets in which the Fund invests or from poor security selection, which could cause the Fund to underperform other funds with similar objectives. There is no assurance that the Fund will achieve its investment objective. When you redeem your shares, they may be worth more or less than what you paid for them. These risks mean that you can lose money by investing in the Fund.

Main Risks of Investing in Stock. The value of the Fund's portfolio may be affected by changes in the stock markets. Stock markets may experience significant short-term volatility and may fall sharply at times. Different stock markets may behave differently from each other and U.S. stock markets may move in the opposite direction from one or more foreign stock markets.

The prices of individual stocks generally do not all move in the same direction at the same time and a variety of factors can affect the price of a particular company's stock. These factors may include, but are not limited to: poor earnings reports, a loss of customers, litigation against the company, general unfavorable performance of the company's sector or industry, or changes in government regulations affecting the company or its industry.

At times, the Fund may emphasize investments in a particular industry or economic or market sector. To the extent that the Fund increases its emphasis on investments in a particular industry or sector, the value of its investments may fluctuate more in response to events affecting that industry or sector, such as changes in economic conditions, government regulations, availability of basic resources or supplies, or other events that affect that industry or sector more than others.

Main Risks of Small- and Mid-Sized Companies. The stock prices of small- and mid-sized companies may be more volatile and their securities may be more difficult to sell than those of larger companies. They may not have established markets, may have fewer customers and product lines, may have unseasoned management or less management depth and may have more limited access to financial resources. Smaller companies may not pay dividends or provide capital gains for some time, if at all.

Who Is the Fund Designed For? The Fund's shares are available only as an investment option under certain variable annuity contracts, variable life insurance policies and investment plans offered through insurance company separate accounts of participating insurance companies. The Fund is designed primarily for investors seeking high total return. Those investors should be willing to assume the risks of short-term share price fluctuations that are typical for a fund that focuses on stocks. The Fund is not designed for investors needing current income. The Fund is not a complete investment program. You should carefully consider your own investment goals and risk tolerance before investing in the Fund.

An investment in the Fund is not a deposit of any bank and is not insured or guaranteed by the Federal Deposit Insurance Corporation or any other government agency.


The Fund's Past Performance. The bar chart and table below provide some indication of the risks of investing in the Fund by showing changes in the Fund's Non-Service Shares performance from year to year and by showing how the Fund's average annual returns for 1, 5 and 10 years compare with those of a broad measure of market performance. Charges imposed by the insurance accounts that invest in the Fund are not included and the returns would be lower if they were. The Fund's past investment performance is not necessarily an indication of how the Fund will perform in the future. More recent performance information is available by calling the toll-free number on the back of this prospectus and on the Fund's website at: https://www.oppenheimerfunds.com/fund/investors/overview/MainStreetFundVA


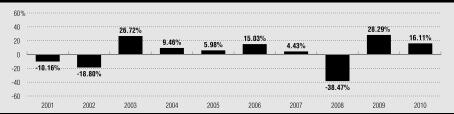
During the period shown, the highest return before taxes for a calendar quarter was 18.50% (2nd Qtr 09) and the lowest return before taxes for a calendar quarter was -22.18% (4th Qtr 08).


The following table shows the average annual total returns before taxes for each class of the Fund's shares.

Average Annual Total Returns for the periods ended December 31, 2010

1 Year

5 Years

10 Years

Non-Service Shares (inception 7-5-95)

16.11%


1.94%


1.67%


Service Shares (inception 7-13-00)

15.83%


1.69%


1.44%


S&P 500 Index

15.08%


2.29%


1.42%


(reflects no deductions for fees, expenses or taxes)


Investment Adviser. OppenheimerFunds, Inc. is the Fund's investment adviser (the "Manager").

Portfolio Managers. Manind ("Mani") Govil has been lead portfolio manager of the Fund and Benjamin Ram has been co-portfolio manager of the Fund since May 2009.

Purchase and Sale of Fund Shares. Shares of the Fund may be purchased only by separate investment accounts of participating insurance companies as an underlying investment for variable life insurance policies, variable annuity contracts or other investment products. Individual investors cannot buy shares of the Fund directly. You may only submit instructions for buying or selling shares of the Fund to your insurance company or its servicing agent, not directly to the Fund or its Transfer Agent. The accompanying prospectus of the participating insurance company provides information about how to select the Fund as an investment option.

Taxes. Because shares of the Fund may be purchased only through insurance company separate accounts for variable annuity contracts, variable life insurance policies or other investment products, any dividends and capital gains distributions will be taxable to the participating insurance company, if at all. However, those payments may affect the tax basis of certain types of distributions from those accounts. Special tax rules apply to life insurance companies, variable annuity contracts and variable life insurance contracts. For information on federal income taxation of a life insurance company with respect to its receipt of distributions from the Fund and federal income taxation of owners of variable annuity or variable life insurance contracts, see the accompanying prospectus for the applicable contract.

Payments to Broker-Dealers and Other Financial Intermediaries. The Fund, the Manager, or their related companies may make payments to financial intermediaries, including to insurance companies that offer shares of the Fund as an investment option. These payments for the sale of Fund shares and related services may create a conflict of interest by influencing the intermediary and your salesperson to recommend the Fund over another investment. Ask your salesperson or visit your financial intermediary's website for more information.

MORE ABOUT THE FUND

About the Fund's Investments

The allocation of the Fund's portfolio among different types of investments will vary over time and the Fund's portfolio might not always include all of the different types of investments described below. The Statement of Additional Information contains more detailed information about the Fund's investment policies and risks.

THE FUND'S PRINCIPAL INVESTMENT STRATEGIES AND RISKS. The following strategies and types of investments are the ones that the Fund considers to be the most important in seeking to achieve its investment objective and the following risks are those the Fund expects its portfolio to be subject to as a whole.

Common Stock. Common stock represents an ownership interest in a company. It ranks below preferred stock and debt securities in claims for dividends and in claims for assets of the issuer in a liquidation or bankruptcy. Common stocks may be exchange-traded or over-the-counter securities. Over-the-counter securities may be less liquid than exchange-traded securities.

Quantitative Models. The portfolio managers use quantitative stock selection models that are based upon many factors that measure individual securities relative to each other. Those measurements may not always identify securities that perform well in the future.

Diversification and Concentration. The Fund is a diversified fund. It attempts to reduce its exposure to the risks of individual securities by diversifying its investments across a broad number of different companies. The Fund will not concentrate more than 25% of its total assets in issuers in any one industry. At times, however, the Fund may emphasize investments in some industries more than others.


OTHER INVESTMENT STRATEGIES AND RISKS. The Fund can also use the investment techniques and strategies described below. The Fund might not use all of these techniques or strategies or might only use them from time to time.

Special Portfolio Diversification Requirements. To enable a variable annuity or variable life insurance contract based on an insurance company separate account to qualify for favorable tax treatment under the Internal Revenue Code, the underlying investments must follow special diversification requirements that limit the percentage of assets that can be invested in securities of particular issuers. The Fund's investment program is managed to meet those requirements, in addition to other diversification requirements under the Internal Revenue Code and the Investment Company Act of 1940 that apply to publicly-sold mutual funds.

Failure by the Fund to meet those special requirements could cause earnings on a contract owner's interest in an insurance company separate account to be taxable income. Those diversification requirements might also limit, to some degree, the Fund's investment decisions in a way that could reduce its performance.

Other Equity Securities.  In addition to common stocks, the Fund can invest in other equity or "equity equivalents" securities such as preferred stocks or convertible securities. Preferred stocks generally pay a dividend and rank ahead of common stocks and behind debt securities in claims for dividends and for assets of the issuer in a liquidation or bankruptcy. The dividend rate of preferred stocks may cause their prices to behave more like those of debt securities. A convertible security is one that can be converted into or exchanged for common stock of an issuer within a particular period of time at a specified price, upon the occurrence of certain events or according to a price formula. Convertible securities offer the Fund the ability to participate in stock market movements while also seeking some current income. Convertible debt securities pay interest and convertible preferred stocks pay dividends until they mature or are converted, exchanged or redeemed. The Fund considers some convertible securities to be "equity equivalents" because they are convertible into common stock. The credit ratings of those convertible securities generally have less impact on the investment decision, although they are still subject to credit and interest rate risk.

Risks of Foreign Investing. The Fund can buy securities issued by companies or governments in any country, including in developing or emerging market countries. While there is no limit on the Fund's foreign investments, the Fund does not currently plan to invest a significant amount of its assets in securities of foreign issuers but may do so in the future.While foreign securities may offer special investment opportunities, they are also subject to special risks. Foreign issuers are usually not subject to the same accounting and disclosure requirements that U.S. companies are subject to, which may make it difficult to evaluate a foreign company's operations or financial condition. A change in value of a foreign currency against the U.S. dollar will result in a change in the U.S. dollar value of securities denominated in that foreign currency and of any income or distributions the Fund may receive on those securities. Additionally, the value of foreign investments may be affected by exchange control regulations, foreign taxes, higher transaction and other costs, delays in settlement of transactions, changes in economic or monetary policy in the U.S. or abroad, expropriation or nationalization of a company's assets, or other political and economic factors.

     The Fund may purchase American Depository Shares ("ADS") as part of American Depository Receipt ("ADR") issuances, which are negotiable certificates issued by a U.S. bank representing a specified number of shares in a foreign stock traded on a U.S. exchange. They are subject to some of the special considerations and risks, discussed above, that apply to foreign securities traded and held abroad.

       Special Risks of Developing and Emerging Markets.  Developing or emerging market countries generally have less developed securities markets or exchanges. Securities of issuers in developing or emerging market countries may be more difficult to sell at an acceptable price and their prices may be more volatile than securities of issuers in countries with more mature markets. Settlements of trades may be subject to greater delays so that the proceeds of a sale of a security may not be received on a timely basis. The economies of developing or emerging market countries may be more dependent on relatively few industries that may be highly vulnerable to local and global changes. Developing or emerging market countries may have less developed legal and accounting systems, and investments in those countries may be subject to greater risks of government restrictions, including confiscatory taxation, expropriation or nationalization of company assets, restrictions on foreign ownership of local companies and restrictions on withdrawing assets from the country. Their governments may also be more unstable than the governments of more developed countries. The value of the currency of a developing or emerging market country may fluctuate more than the currencies of countries with more mature markets. Investments in securities of issuers in developing or emerging market countries may be considered speculative.

Time-Zone Arbitrage. The Fund may invest in securities of foreign issuers that are traded in U.S. or foreign markets. If the Fund invests a significant amount of its assets in securities traded in foreign markets, it may be exposed to "time-zone arbitrage" attempts by investors seeking to take advantage of differences in the values of foreign securities that might result from events that occur after the close of the foreign securities market on which a security is traded and before the close of the New York Stock Exchange that day, when the Fund's net asset value is calculated. If such time-zone arbitrage were successful, it might dilute the interests of other shareholders. However, the Fund's use of "fair value pricing" under certain circumstances, to adjust the closing market prices of foreign securities to reflect what the Manager and the Board believe to be their fair value, may help deter those activities.

Debt Securities. The Fund does not focus on debt securities  What is a Debt Security? A debt security is a security representing money borrowed by the issuer that must be repaid, specifying the amount of principal, the interest or discount rate, and the time or times at which payments are due. What is a Debt Security? A debt security is a security representing money borrowed by the issuer that must be repaid, specifying the amount of principal, the interest or discount rate, and the time or times at which payments are due. as a principal investment strategy, however debt securities are one of the other investments that the Fund may use. The Fund may invest in debt securities to seek income, for liquidity or for hedging purposes.

The debt securities the Fund buys may be of any maturity. The Fund's debt securities may be rated by nationally recognized statistical rating organizations such as Moody's Investors Service or Standard Poor's Ratings Services or may be unrated. "Investment grade" refers to securities that are rated in one of the top four rating categories. The Fund can invest up to 25% of its total assets in debt securities that are rated below investment grade, also referred to as "junk bonds." The Fund cannot invest more than 10% of its assets in lower-grade non convertible debt securities and currently does not intend to invest more than 10% of its assets in lower-grade debt securities of any type.

  • Interest Rate Risk. The values of debt securities usually change when prevailing interest rates change. When interest rates fall, the values of already-issued debt securities generally rise. When interest rates rise, the values of already-issued debt securities generally fall. The values of longer-term debt securities usually change more when interest rates change than the values of shorter-term debt securities.

  • Credit Risk. Debt securities are also subject to credit risk, which is the risk that the issuer of a security might not make principal or interest payments on the security when they are due. If the issuer fails to pay interest, the Fund's income might be reduced, and if the issuer fails to pay interest or repay principal, the value of the security might fall.

  • Special Risks of Lower-Grade Securities. Lower-grade debt securities, whether rated or unrated, have greater risks than investment-grade securities. They may be subject to greater price fluctuations and have a greater risk that the issuer might not be able to pay interest and principal when due. The market for lower-grade securities may be less liquid and therefore they may be harder to value or to sell at an acceptable price, especially during times of market volatility or decline.

Master Limited Partnerships. The Fund may invest in publicly traded limited partnerships known as "master limited partnerships" or MLPs. MLPs issue units that are registered with the Securities and Exchange Commission and are freely tradable on a securities exchange or in the over-the-counter market. An MLP consists of one or more general partners, who conduct the business, and one or more limited partners, who contribute capital. The Fund, as a limited partner, normally would not be liable for the debts of the MLP beyond the amounts the Fund has contributed, but would not be shielded to the same extent that a shareholder of a corporation would be. In certain circumstances creditors of an MLP would have the right to seek return of capital distributed to a limited partner. This right of an MLP's creditors would continue after the Fund sold its investment in the MLP. MLPs are typically real estate, oil and gas and equipment leasing vehicles, but they also finance movies, research and development, and other projects.

Investments in Other Investment Companies. The Fund can also invest in the securities of other investment companies, which can include open-end funds, closed-end funds, unit investment trusts and business development companies. One reason the Fund might do so is to gain exposure to segments of the markets represented by another fund, at times when the Fund might not be able to buy the particular type of securities directly. As a shareholder of an investment company, the Fund would be subject to its ratable share of that investment company's expenses, including its advisory and administration expenses. The Fund does not intend to invest in other investment companies unless the Manager believes that the potential benefits of the investment justify the payment of any premiums or sales charges.

       Exchange-Traded Funds. The Fund can invest in exchange-traded funds (ETFs), which are typically open-end funds or unit investment trusts listed on a stock exchange. The Fund might do so as a way of gaining exposure to securities represented by the ETF's portfolio at times when the Fund may not be able to buy those securities directly. As a shareholder of an investment company, the Fund would be subject to its ratable share of that investment company's expenses, including its advisory and administration expenses. At the same time, the Fund would bear its own management fees and expenses. The Fund does not intend to invest in other ETFs unless the portfolio manager believes that the potential benefits of the investment justify the expenses. The Fund's investments in the securities of other investment companies are subject to the limits that apply to those types of investments under the Investment Company Act of 1940.

Derivative Investments. The Fund can invest in "derivative" instruments. A derivative is an instrument whose value depends on (or is derived from) the value of an underlying security, asset, interest rate, index or currency.  Derivatives may allow the Fund to increase or decrease its exposure to certain markets or risks.  

The Fund may use derivatives to seek to increase its investment return or for hedging purposes. The Fund is not required to use derivatives in seeking its investment objective or for hedging and might not do so.

     Options, futures, options on futures, options on indices, and forward contracts are some of the derivatives that the Fund may use. The Fund may also use other types of derivatives that are consistent with its investment strategies or for hedging.

Hedging.  Hedging transactions are intended to reduce the risks of securities in the Fund's portfolio. If the Fund uses a hedging instrument at the wrong time or judges market conditions incorrectly, however, the hedge might be unsuccessful or could reduce the Fund's return or create a loss. The Fund has percentage limits on its use of derivatives and hedging instruments.

   The Fund has percentage limits on its use of hedging instruments and is not required to use them in seeking its objective.

Risks of Derivative Investments . Derivatives may be volatile and may involve significant risks. The underlying security or other instrument on which a derivative is based, or the derivative itself, may not perform the way the Manager expects it to. For example, if a call option sold by the Fund were exercised on an investment that had increased in value above the call price, the Fund would be required to sell the investment at the call price and would not be able to realize any additional profit. The Fund may lose money on a derivative investment if the issuer fails to pay the amount due. Certain derivative investments held by the Fund may be illiquid, making it difficult to close out an unfavorable position. Derivative transactions may require the payment of premiums and can increase portfolio turnover. As a result, the Fund could realize little or no income or lose principal from the investment, or a hedge might be unsuccessful. For some derivatives, it is possible for the Fund to lose more than the amount invested in the derivative instrument.

Illiquid and Restricted Securities. Investments that do not have an active trading market, or that have legal or contractual limitations on their resale, are generally referred to as "illiquid" securities. Illiquid securities may be difficult to value or to sell promptly at an acceptable price or may require registration under applicable securities laws before they can be sold publicly. Securities that have limitations on their resale are referred to as "restricted securities." Certain restricted securities that are eligible for resale to qualified institutional purchasers may not be regarded as illiquid.

     The Fund will not invest more than 15% of its net assets in illiquid securities.  The Manager monitors the Fund's holdings of illiquid securities on an ongoing basis to determine whether to sell any of those securities to maintain adequate liquidity.

Conflicts of Interest. The investment activities of the Manager and its affiliates in regard to other funds and accounts they manage may present conflicts of interest that could disadvantage the Fund and its shareholders. The Manager or its affiliates may provide investment advisory services to other funds and accounts that have investment objectives or strategies that differ from, or are contrary to, those of the Fund. That may result in another fund or account holding investment positions that are adverse to the Fund's investment strategies or activities. Other funds or accounts advised by the Manager or its affiliates may have conflicting interests arising from investment objectives that are similar to those of the Fund. Those funds and accounts may engage in, and compete for, the same types of securities or other investments as the Fund or invest in securities of the same issuers that have different, and possibly conflicting, characteristics. The trading and other investment activities of those other funds or accounts may be carried out without regard to the investment activities of the Fund and, as a result, the value of securities held by the Fund or the Fund's investment strategies may be adversely affected. The Fund's investment performance will usually differ from the performance of other accounts advised by the Manager or its affiliates and the Fund may experience losses during periods in which other accounts advised by the Manager or its affiliates achieve gains. The Manager has adopted policies and procedures designed to address potential conflicts of interest identified by the Manager; however, such policies and procedures may also limit the Fund's investment activities and affect its performance.

     The Fund offers its shares to separate accounts of different insurance companies, as an investment for their variable annuity contracts, variable life insurance policies and other investment products. While the Fund does not foresee any disadvantages to contract owners from these arrangements, it is possible that the interests of owners of different contracts participating in the Fund through different separate accounts might conflict. For example, a conflict could arise because of differences in tax treatment.

Investments in Oppenheimer Institutional Money Market Fund. The Fund can invest its free cash balances in Class E shares of Oppenheimer Institutional Money Market Fund to provide liquidity or for defensive purposes. The Fund invests in Oppenheimer Institutional Money Market Fund, rather than purchasing individual short-term investments, to seek a higher yield than it could obtain on its own. Oppenheimer Institutional Money Market Fund is a registered open-end management investment company, regulated as a money market fund under the Investment Company Act of 1940, and is part of the Oppenheimer family of funds. It invests in a variety of short-term, high-quality, dollar-denominated money market instruments issued by the U.S. Government, domestic and foreign corporations, other financial institutions, and other entities. Those investments may have a higher rate of return than the investments that would be available to the Fund directly. At the time of an investment, the Fund cannot always predict what the yield of the Oppenheimer Institutional Money Market Fund will be because of the wide variety of instruments that fund holds in its portfolio. The return on those investments may, in some cases, be lower than the return that would have been derived from other types of investments that would provide liquidity. As a shareholder, the Fund will be subject to its proportional share of the expenses of Oppenheimer Institutional Money Market Fund's Class E shares, including its advisory fee. However, the Manager will waive a portion of the Fund's advisory fee to the extent of the Fund's share of the advisory fee paid to the Manager by Oppenheimer Institutional Money Market Fund.

Temporary Defensive and Interim Investments. For temporary defensive purposes in times of adverse or unstable market, economic or political conditions, the Fund can invest up to 100% of its total assets in investments that may be inconsistent with the Fund's principal investment strategies. Generally, the Fund would invest in shares of Oppenheimer Institutional Money Market Fund or in the types of money market instruments in which Oppenheimer Institutional Money Market Fund invests or in other short-term U.S. Government securities. The Fund might also hold these types of securities as interim investments pending the investment of proceeds from the sale of Fund shares or the sale of Fund portfolio securities or to meet anticipated redemptions of Fund shares. To the extent the Fund invests in these securities, it might not achieve its investment objective.

Portfolio Turnover . A change in the securities held by the Fund is known as "portfolio turnover." The Fund may engage in active and frequent trading to try to achieve its investment objective and may have a portfolio turnover rate of over 100% annually. Increased portfolio turnover may result in higher brokerage fees or other transaction costs, which can reduce performance. The Financial Highlights table at the end of this prospectus shows the Fund's portfolio turnover rates during past fiscal years.

CHANGES TO THE FUND'S INVESTMENT POLICIES. The Fund's fundamental investment policies cannot be changed without the approval of a majority of the Fund's outstanding voting shares; however, the Fund's Board can change non-fundamental policies without a shareholder vote. Significant policy changes will be described in supplements to this prospectus. The Fund's investment objective is a fundamental policy. Other investment restrictions that are fundamental policies are listed in the Fund's Statement of Additional Information. An investment policy is not fundamental unless this prospectus or the Statement of Additional Information states that it is.

PORTFOLIO HOLDINGS.   The Fund's portfolio holdings are included in its semi-annual and annual reports that are distributed to its shareholders within 60 days after the close of the applicable reporting period. The Fund also discloses its portfolio holdings in its Statements of Investments on Form N-Q, which are public filings that are required to be made with the Securities and Exchange Commission within 60 days after the end of the Fund's first and third fiscal quarters. Therefore, the Fund's portfolio holdings are made publicly available no later than 60 days after the end of each of its fiscal quarters. In addition, the Fund's portfolio holdings information, as of the end of each calendar month, may be posted and available on the Fund's website no sooner than 30 days after the end of each calendar month.    

A description of the Fund's policies and procedures with respect to the disclosure of its portfolio holdings is available in the Fund's Statement of Additional Information.

How the Fund is Managed

THE MANAGER. OppenheimerFunds, Inc., the Manager, chooses the Fund's investments and handles its day-to-day business. The Manager carries out its duties, subject to the policies established by the Fund's Board of Directors, under an investment advisory agreement that states the Manager's responsibilities. The agreement sets the fees the Fund pays to the Manager and describes the expenses that the Fund is responsible to pay to conduct its business.

The Manager has been an investment adviser since 1960. The Manager is located at Two World Financial Center, 225 Liberty Street, 11th Floor, New York, New York 10281-1008.

Advisory Fees. Under the investment advisory agreement, the Fund pays the Manager an advisory fee at an annual rate that declines on additional assets as the Fund grows: 0.75% of the first $200 million of average annual net assets, 0.72% of the next $200 million, 0.69% of the next $200 million, 0.66% of the next $200 million, and 0.60% of average annual net assets over $800 million. The Fund's management fee for its fiscal year ended December 31, 2010 was 0.65% of the Fund's average annual net assets for each class of shares.

   The Manager has voluntarily agreed to limit the Fund's total annual operating expenses so that those expenses, as percentages of daily net assets, will not exceed the annual rate of 0.80% for Non-Service Shares and 1.05% for Service Shares. The Manager has also voluntarily agreed to waive fees and/or reimburse Fund expenses in an amount equal to the indirect management fees incurred through the Fund's investment in Oppenheimer Institutional Money Market Fund. During the fiscal year ended December 31, 2010, the amounts waived as a result of the voluntary expense limitation and waiver and/or reimbursement did not exceed 0.01% and therefore are not reflected in the Annual Fund Operating Expenses table shown earlier in this prospectus. Both the voluntary expense limitations and waiver and/or reimbursement may be amended or withdrawn at any time. Actual total annual operating expenses for the fiscal year ended December 31, 2010 were those shown in the Annual Fund Operating Expenses table earlier in this prospectus. The Fund's management fee and other annual operating expenses may vary in future years.

   A discussion regarding the basis for the Board of Trustees' approval of the Fund's investment advisory contract is available in the Fund's Annual Report to shareholders for the year ended December 31, 2010.

Portfolio Managers. The Fund's portfolio is managed by Manind ("Mani") Govil and Benjamin Ram, who are primarily responsible for the day-to-day management of the Fund's investments. Mr. Govil has been lead portfolio manager of the Fund and Mr. Ram has been co-portfolio manager of the Fund since May 2009.

     Mr. Govil, CFA, has been a Senior Vice President, the Main Street Team Leader and a portfolio manager of the Manager since May 2009. Prior to joining the Manager, Mr. Govil was a portfolio manager with RS Investment Management Co. LLC from October 2006 until March 2009. He served as the head of equity investments at The Guardian Life Insurance Company of America from August 2005 to October 2006 when Guardian Life Insurance acquired an interest in RS Investment Management Co. LLC. He served as the lead portfolio manager - large cap blend/core equity, co-head of equities and head of equity research, from 2001 to July 2005, and was lead portfolio manager - core equity, from April 1996 to July 2005, at Mercantile Capital Advisers, Inc. Mr. Govil is a portfolio manager of other portfolios in the OppenheimerFunds complex.

     Mr. Ram has been a Vice President and portfolio manager of the Manager since May 2009. Prior to joining the Manager, Mr. Ram was sector manager for financial investments and a co-portfolio manager for mid-cap portfolios with the RS Core Equity Team of RS Investment Management Co. LLC from October 2006 to May 2009. He served as Portfolio Manager Mid Cap Strategies, Sector Manager Financials at The Guardian Life Insurance Company of America from January 2006 to October 2006 when Guardian Life Insurance acquired an interest in RS Investment Management Co. LLC. He was a financial analyst, from 2003 to 2005, and co-portfolio manager, from 2005 to 2006, at Mercantile Capital Advisers, Inc. Mr. Ram was a bank analyst at Legg Mason Securities from 2000 to 2003 and was a senior financial analyst at the CitiFinancial division of Citigroup, Inc. from 1997 to 2000. Mr. Ram is a portfolio manager of other portfolios in the OppenheimerFunds complex.

     The Statement of Additional Information provides additional information about the portfolio managers' compensation, other accounts they manage and their ownership of Fund shares.

MORE ABOUT YOUR INVESTMENT

How to Buy and Sell Shares

You may only submit instructions for buying or selling shares of the Fund to your insurance company or its servicing agent, not directly to the Fund or its Transfer Agent. Information about your investment in the Fund can only be obtained from your participating insurance company or its servicing agent. The Fund's Transfer Agent does not hold or have access to those records.

WHAT CLASSES OF SHARES DOES THE FUND OFFER? The Fund currently offers two different classes of shares. The different classes of shares represent investments in the same portfolio of securities, but the classes are subject to different expenses and will usually have different share prices. The Service Shares are subject to a distribution and service plan. The expenses of that plan are described below. The Non-Service Shares are not subject to a service and distribution plan.

THE PRICE OF FUND SHARES. Fund shares are sold to participating insurance companies, and are redeemed, at their net asset value per share. The net asset value that applies to a purchase order is the next one calculated after the insurance company (as the Fund's designated agent to receive purchase orders) receives the order from its contract owner, in proper form. Fund shares are redeemed at the next net asset value calculated after the insurance company (as the Fund's designated agent to receive purchase orders) receives the order from its contract owner, in proper form. The Fund's Transfer Agent generally must receive the purchase or redemption order from the insurance company by 9:30 a.m. Eastern Time on the next regular business day.

The Fund does not impose any sales charge on purchases of its shares. If there are any charges imposed under the variable annuity, variable life or other contract through which Fund shares are purchased, they are described in the accompanying prospectus of the participating insurance company. The participating insurance company's prospectus may also include information regarding the time you must submit your purchase and redemption orders.

     The sale and redemption price for Fund shares will change from day to day because the value of the securities in its portfolio and its expenses fluctuate. The redemption price will normally differ for different classes of shares. The redemption price of your shares may be more or less than their original cost.

Net Asset Value. The Fund calculates the net asset value of each class of shares as of the close of the New York Stock Exchange (NYSE), on each day the NYSE is open for trading (referred to in this prospectus as a "regular business day"). The NYSE normally closes at 4:00 p.m., Eastern Time, but may close earlier on some days.

The Fund determines the net assets of each class of shares by subtracting the class-specific expenses and the amount of the Fund's liabilities attributable to the share class from the market value of the Fund's securities and other assets attributable to the share class. The Fund's "other assets" might include, for example, cash and interest or dividends from its portfolio securities that have been accrued but not yet collected. The Fund's securities are valued primarily on the basis of current market quotations.

The net asset value per share for each share class is determined by dividing the net assets of the class by the number of outstanding shares of that class.

     Fair Value Pricing. If market quotations are not readily available or (in the Manager's judgment) do not accurately reflect the fair value of a security, or if after the close of the principal market on which a security held by the Fund is traded and before the time as of which the Fund's net asset value is calculated that day, an event occurs that the Manager learns of and believes in the exercise of its judgment will cause a material change in the value of that security from the closing price of the security on the principal market on which it is traded, that security may be valued by another method that the Board believes would more accurately reflect the security's fair value.

In determining whether current market prices are readily available and reliable, the Manager monitors the information it receives in the ordinary course of its investment management responsibilities. It seeks to identify significant events that it believes, in good faith, will affect the market prices of the securities held by the Fund. Those may include events affecting specific issuers (for example, a halt in trading of the securities of an issuer on an exchange during the trading day) or events affecting securities markets (for example, a foreign securities market closes early because of a natural disaster). The Board has adopted valuation procedures for the Fund and has delegated the day-to-day responsibility for fair value determinations to the Manager's "Valuation Committee." Those determinations may include consideration of recent transactions in comparable securities, information relating to the specific security, developments in the markets and their performance, and current valuations of foreign or U.S. indices. Fair value determinations by the Manager are subject to review, approval and ratification by the Board at its next scheduled meeting after the fair valuations are determined.

The Fund's use of fair value pricing procedures involves subjective judgments and it is possible that the fair value determined for a security may be materially different from the value that could be realized upon the sale of that security. Accordingly, there can be no assurance that the Fund could obtain the fair value assigned to a security if it were to sell the security at approximately the same time at which the Fund determines its net asset value per share.

     Pricing Foreign Securities . The Fund may use fair value pricing more frequently for securities primarily traded on foreign exchanges. Because many foreign markets close hours before the Fund values its foreign portfolio holdings, significant events, including broad market movements, may occur during that time that could potentially affect the values of foreign securities held by the Fund.

The Manager believes that foreign securities values may be affected by volatility that occurs in U.S. markets after the close of foreign securities markets. The Manager's fair valuation procedures therefore include a procedure whereby foreign securities prices may be "fair valued" to take those factors into account.

Because some foreign securities trade in markets and on exchanges that operate on weekends and U.S. holidays, the values of some of the Fund's foreign investments may change on days when investors cannot buy or redeem Fund shares.

HOW CAN YOU BUY FUND SHARES? Shares of the Fund may be purchased only by separate investment accounts of participating insurance companies as an underlying investment for variable life insurance policies, variable annuity contracts or other investment products. Individual investors cannot buy shares of the Fund directly. Please refer to the accompanying prospectus of the participating insurance company for information on how to select the Fund as an investment option. That prospectus will indicate which share class you may be eligible to purchase.

Suspension of Share Offering. The offering of Fund shares may be suspended during any period in which the determination of net asset value is suspended, and may be suspended by the Board at any time the Board believes it is in the Fund's best interest to do so.

HOW CAN YOU REDEEM FUND SHARES? Only the participating insurance companies that hold Fund shares in their separate accounts can place orders to redeem shares. Contract holders and policy holders should not directly contact the Fund or its transfer agent to request a redemption of Fund shares. The Fund normally sends payment by Federal Funds wire to the insurance company's account on the next business day after the Fund receives the order (and no later than seven days after the Fund's receipt of the order). Under unusual circumstances determined by the Securities and Exchange Commission, payment may be delayed or suspended. Contract owners should refer to the withdrawal or surrender instructions in the accompanying prospectus of the participating insurance company.

Redemptions "In-Kind." Shares may be "redeemed in-kind" under certain circumstances (such as redemptions of substantial amounts of shares by shareholders that have consented to such in kind redemptions). That means that the redemption proceeds will be paid to the participating insurance companies in securities from the Fund's portfolio. If the Fund redeems shares in-kind, the insurance company accounts may bear transaction costs and will bear market risks until such securities are converted into cash.

Limitations on Frequent Transactions

Frequent purchases and redemptions of Fund shares may interfere with the Manager's ability to manage the Fund's investments efficiently, may increase its transaction and administrative costs and may affect its performance, depending on various factors, such as the size of the Fund, the nature of its investments, the amount of Fund assets the portfolio manager maintains in cash or cash equivalents, and the aggregate dollar amount, the number and the frequency of trades.

If large dollar amounts are involved in frequent redemption transactions, the Fund might be required to sell portfolio securities at unfavorable times to meet those transaction requests, and the Fund's brokerage or administrative expenses might be increased. Therefore, the Manager and the Fund's Board have adopted the following policies and procedures to detect and prevent frequent and/or excessive purchase and redemption activity, while addressing the needs of investors who seek liquidity in their investment. There is no guarantee that those policies and procedures, described below, will be sufficient to identify and deter all excessive short-term trading. If the Transfer Agent is not able to detect and curtail such activity, frequent trading could occur in the Fund.

Policies on Disruptive Activity

The Transfer Agent and the Distributor, on behalf of the Fund, have entered into agreements with participating insurance companies designed to detect and restrict excessive short-term trading activity by contract or policy owners or their financial advisers in their accounts. The Transfer Agent generally does not consider periodic asset allocation or re-balancing that affects a portion of the Fund shares held in the account of a policy or contract owner to be "excessive trading." However, the Transfer Agent has advised participating insurance companies that it generally considers certain other types of trading activity to be "excessive," such as making a "transfer" out of the Fund within 30 days after buying Fund shares (by the sale of the recently purchased Fund shares and the purchase of shares of another fund) or making more than six "round-trip transfers" between funds during one year. The agreements require participating insurance companies to provide transaction information to the Fund and to execute Fund instructions to restrict trading in Fund shares.

 A participating insurance company may also have its own policies and procedures and may impose its own restrictions or limitations to discourage short-term and/or excessive trading by its policy or contract owners. Those policies and procedures may be different from the Fund's in certain respects. You should refer to the prospectus for your insurance company variable annuity contract for specific information about the insurance company's policies. Under certain circumstances, policy or contract owners may be required to transmit purchase or redemption orders only by first class U.S. mail.

Monitoring the Policies. The Fund's policies and procedures for detecting and deterring frequent or excessive trading are administered by the Fund's Transfer Agent. However, the Transfer Agent presently does not have the ability to directly monitor trading activity in the accounts of policy or contract owners within the participating insurance companies' accounts. The Transfer Agent's ability to monitor and deter excessive short-term trading in such insurance company accounts ultimately depends on the capability and diligence of each participating insurance company, under their agreements with the Transfer Agent, the Distributor and the Fund, in monitoring and controlling the trading activity of the policy or contract owners in the insurance company's accounts.

The Transfer Agent will attempt to monitor the net effect on the Fund's assets from the purchase and redemption activity in the accounts of participating insurance companies and will seek to identify patterns that may suggest excessive trading by the contract or policy owners who invest in the insurance company's accounts. If the Transfer Agent believes it has observed evidence of possible excessive trading activity, it will ask the participating insurance companies or other registered owners to provide information about the transaction activity of the contract or policy holders in their respective accounts, and to take appropriate action. In that case, the insurance company must confirm to the Transfer Agent that appropriate action has been taken to curtail the excessive trading activity.

The Transfer Agent will, subject to the limitations described in this section, limit or terminate the trading activity of any person, group or account that it believes would be excessive or disruptive. However, the Transfer Agent may not be able to detect or curtail all such trading activity in the Fund. The Transfer Agent will evaluate trading activity on a case by case basis and the limitations placed on trading may vary between accounts.

Right to Refuse Purchase Orders. The Fund's Distributor or Transfer Agent may, in their discretion, refuse any purchase order and are not obligated to provide notice before rejecting an order.  

DISTRIBUTION AND SERVICE (12b-1) PLANS

Distribution and Service Plan for Service Shares. The Fund has adopted a Distribution and Service Plan for Service Shares to pay the Distributor for distribution related services, personal services and account maintenance for those shares. Under the Plan, the Fund pays the Distributor quarterly at an annual rate of up to 0.25% of the daily net assets of the Fund's Service Shares. Because these fees are paid out of the Fund's assets on an on-going basis, over time they will increase the operating expenses of the Service Shares and may cost you more than other types of fees or sales charges. As a result, the Service Shares may have lower performance compared to the Fund's shares that are not subject to a service fee.

     Use of Plan Fees: The Distributor currently uses all of those fees to compensate sponsor(s) of the insurance product for providing personal services and account maintenance for variable contract owners that hold Service Shares.

PAYMENTS TO FINANCIAL INTERMEDIARIES AND SERVICE PROVIDERS. The Manager and the Distributor, in their discretion, may also make payments for distribution and/or shareholder servicing activities to brokers, dealers and other financial intermediaries, including the insurance companies that offer the Fund as an investment option, or to service providers. Those payments are made out of the Manager's and/or the Distributor's own resources and/or assets, including from the revenues or profits derived from the advisory fees the Manager receives from the Fund. Those cash payments, which may be substantial, are paid to many firms having business relationships with the Manager and Distributor and are in addition to any distribution fees, servicing fees, or transfer agency fees paid directly or indirectly by the Fund to those entities. Payments by the Manager or Distributor from their own resources are not reflected in the tables in the "Fees and Expenses of the Fund" section of this prospectus because they are not paid by the Fund.

The financial intermediaries that may receive those payments include firms that offer and sell Fund shares to their clients, or provide shareholder services to the Fund, or both, and receive compensation for those activities. The financial intermediaries that may receive payments include securities brokers, dealers, financial advisers, insurance companies that offer variable annuity or variable life insurance products and other intermediaries.

In general, these payments to financial intermediaries can be categorized as "distribution-related" or "servicing" payments. Payments for distribution-related expenses, such as marketing or promotional expenses, are often referred to as "revenue sharing." Revenue sharing payments may be made on the basis of the sales of shares attributable to that intermediary, the average net assets of the Fund and other Oppenheimer funds attributable to the accounts of that intermediary and its clients, negotiated lump sum payments for distribution services provided, or similar fees. In some circumstances, revenue sharing payments may create an incentive for a financial intermediary or its representatives to recommend or offer shares of the Fund or other Oppenheimer funds to its customers. These payments also may give an intermediary an incentive to cooperate with the Distributor's marketing efforts. A revenue sharing payment may, for example, qualify the Fund for preferred status with the intermediary receiving the payment or provide representatives of the Distributor with access to representatives of the intermediary's sales force, in some cases on a preferential basis over funds of competitors. Additionally, as firm support, the Manager or Distributor may reimburse expenses related to educational seminars and "due diligence" or training meetings (to the extent permitted by applicable laws or the rules of the Financial Industry Regulatory Authority ("FINRA")) designed to increase sales representatives' awareness about Oppenheimer funds, including travel and lodging expenditures. However, the Manager does not consider a financial intermediary's sale of shares of the Fund or other Oppenheimer funds when selecting brokers or dealers to effect portfolio transactions for the funds.

Various factors are used to determine whether to make revenue sharing payments. Possible considerations include, without limitation, the types of services provided by the intermediary, sales of Fund shares, the redemption rates on accounts of clients of the intermediary or overall asset levels of Oppenheimer funds held for or by clients of the intermediary, the willingness of the intermediary to allow the Distributor to provide educational and training support for the intermediary's sales personnel relating to the Oppenheimer funds, the availability of the Oppenheimer funds on the intermediary's sales system, as well as the overall quality of the services provided by the intermediary and the Manager or Distributor's relationship with the intermediary. The Manager and Distributor have adopted guidelines for assessing and implementing each prospective revenue sharing arrangement. To the extent that financial intermediaries receiving distribution-related payments from the Manager or Distributor sell more shares of the Oppenheimer funds or retain more shares of the funds in their client accounts, the Manager and Distributor benefit from the incremental management and other fees they receive with respect to those assets.

Payments may also be made by the Manager, the Distributor or the Transfer Agent to financial intermediaries to compensate or reimburse them for administrative or other client services provided such as sub-transfer agency services for shareholders, omnibus accounting or sub-accounting, participation in networking arrangements, account set-up, recordkeeping and other shareholder services. Payments may also be made for administrative services related to the distribution of Fund shares through the intermediary. Firms that may receive servicing fees include insurance companies that offer variable annuity or variable life insurance products and others. These fees may be used by the service provider to offset or reduce fees that would otherwise be paid directly to them by certain account holders. The Statement of Additional Information contains more information about revenue sharing and service payments made by the Manager or the Distributor. Your broker, dealer or other financial intermediary may charge you fees or commissions in addition to those disclosed in this prospectus. You should ask your financial intermediary for details about any such payments it receives from the Manager or the Distributor and their affiliates, or any other fees or expenses it charges.

Dividends, Capital Gains and Taxes

DIVIDENDS AND DISTRIBUTIONS. The Fund intends to declare and pay dividends annually from any net investment income. The Fund may also realize capital gains on the sale of portfolio securities, in which case it may make distributions out of any net short-term or long-term capital gains annually. The Fund may also make supplemental distributions of dividends and capital gains following the end of its fiscal year. The Fund has no fixed dividend rate and cannot guarantee that it will pay any dividends or capital gains distributions in a particular year.

Dividends and distributions are paid separately for each share class. Because of the higher expenses on Service Shares, the dividends and capital gains distributions paid on those shares will generally be lower than for other Fund shares.

Receiving Dividends and Distributions. Any dividends and capital gains distributions will be automatically reinvested in additional Fund shares for the account of the participating insurance company, unless the insurance company elects to have dividends or distributions paid in cash.

TAXES. For a discussion of the tax status of a variable annuity contract, a variable life insurance policy or other investment product of a participating insurance company, please refer to the accompanying variable contract prospectus of your participating insurance company. Because shares of the Fund may be purchased only through insurance company separate accounts for variable annuity contracts, variable life insurance policies or other investment products, any dividends from net investment income and distributions of net realized short-term and long-term capital gains will be taxable, if at all, to the participating insurance company. However, those payments may affect the tax basis of certain types of distributions from those accounts.

The Fund has qualified and intends to qualify each year to be taxed as a regulated investment company under the Internal Revenue Code by satisfying certain income, asset diversification and income distribution requirements, but reserves the right not to so qualify. In each year that it qualifies as a regulated investment company, the Fund will not be subject to federal income taxes on its income that it distributes to shareholders.

This information is only a summary of certain Federal income tax information about your investment. You are encouraged to consult your tax adviser about the effect of an investment in the Fund on your particular tax situation and about any changes to the Internal Revenue Code that may occur from time to time. Additional information about the tax effects of investing in the Fund is contained in the Statement of Additional Information.

Financial Highlights

The Financial Highlights Table is presented to help you understand the Fund's financial performance for the past five fiscal years. Certain information reflects financial results for a single Fund share. The total returns in the table represent the rate that an investor would have earned (or lost) on an investment in the Fund (assuming reinvestment of all dividends and distributions). This information has been audited by KPMG LLP, the Fund's independent registered public accounting firm for the fiscal years ended December 31, 2010 and 2009. The financial highlights for the prior years were audited by another independent registered public accounting firm. KPMG's report, along with the Fund's financial statements, are included in the Statement of Additional Information, which is available upon request.

Financial Highlights Table

FINANCIAL HIGHLIGHTS

Non-Service Shares      Year Ended December 31,

2010


2009


2008


2007


2006


Per Share Operating Data


Net asset value, beginning of period

$18.18


$14.56


$25.61


$24.78


$21.79


Income (loss) from investment operations:


Net investment income1

.17


.21


.29


.33


.27


Net realized and unrealized gain (loss)

2.73


3.71


(9.64)


.75


2.98


Total from investment operations

2.90


3.92


(9.35)


1.08


3.25


Dividends and/or distributions to shareholders:


Dividends from net investment income

(.20)


(.30)


(.32)


(.25)


(.26)


Distributions from net realized gain

--


--


(1.38)


--


--


Total dividends and/or distributions to shareholders

(.20)


(.30)


(1.70)


(.25)


(.26)


Net asset value, end of period

$20.88


$18.18


$14.56


$25.61


$24.78


Total Return, at Net Asset Value2

16.11%


28.29%


(38.47)%


4.43%


15.03%


Ratios/Supplemental Data


Net assets, end of period (in thousands)

$469,720


$474,637


$432,360


$ 907,727


$1,046,146


Average net assets (in thousands)

$454,937


$430,517


$670,994


$1,006,655


$1,054,522


Ratios to average net assets:3


Net investment income

0.93%


1.35%


1.42%


1.28%


1.19%


Total expenses4

0.78%


0.78%


0.66%


0.65%


0.66%


Expenses after payments, waivers and/or reimbursements and reduction to custodian expenses

0.78%


0.78%


0.66%


0.65%


0.66%


Portfolio turnover rate

45%


128%


132%


111%


100%


1. Per share amounts calculated based on the average shares outstanding during the period.

2. Assumes an initial investment on the business day before the first day of the fiscal period, with all dividends and distributions reinvested in additional shares on the reinvestment date, and redemption at the net asset value calculated on the last business day of the fiscal period. Total returns are not annualized for periods less than one full year. Total return information does not reflect expenses that apply at the separate account level or to related insurance products. Inclusion of these charges would reduce the total return figures for all periods shown. Returns do not reflect the deduction of taxes that a shareholder would pay on fund distributions or the redemption of fund shares.

3. Annualized for periods less than one full year.

4. Total expenses including indirect expenses from affiliated fund were as follows:

Year Ended December 31, 2010

0.78%

Year Ended December 31, 2009

0.78%

Year Ended December 31, 2008

0.66%

Year Ended December 31, 2007

0.65%

Year Ended December 31, 2006

0.66%


Service Shares      Year Ended December 31,

2010


2009


2008


2007


2006


Per Share Operating Data


Net asset value, beginning of period

$18.04


$14.42


$25.38


$24.58


$21.63


Income (loss) from investment operations:


Net investment income 1

.13


.17


.24


.26


.22


Net realized and unrealized gain (loss)

2.70


3.70


(9.56)


.75


2.95


Total from investment operations

2.83


3.87


(9.32)


1.01


3.17


Dividends and/or distributions to shareholders:


Dividends from net investment income

(.16)


(.25)


(.26)


(.21)


(.22)


Distributions from net realized gain

--


--


(1.38)


--


--


Total dividends and/or distributions to shareholders

(.16)


(.25)


(1.64)


(.21)


(.22)


Net asset value, end of period

$20.71


$18.04


$14.42


$25.38


$24.58


Total Return, at Net Asset Value2

15.83%


27.99%


(38.63)%


4.15%


14.76%


Ratios/Supplemental Data


Net assets, end of period (in thousands)

$1,185,456


$1,154,210


$1,020,103


$1,464,690


$1,099,293


Average net assets (in thousands)

$1,193,630


$1,029,909


$1,268,430


$1,315,488


$ 810,181


Ratios to average net assets:3


Net investment income

0.68%


1.10%


1.20%


1.03%


0.95%


Total expenses4

1.03%


1.03%


0.91%


0.90%


0.91%


Expenses after payments, waivers and/or reimbursements and reduction to custodian expenses

1.03%


1.03%


0.91%


0.90%


0.91%


Portfolio turnover rate

45%


128%


132%


111%


100%


1. Per share amounts calculated based on the average shares outstanding during the period.

2. Assumes an initial investment on the business day before the first day of the fiscal period, with all dividends and distributions reinvested in additional shares on the reinvestment date, and redemption at the net asset value calculated on the last business day of the fiscal period. Total returns are not annualized for periods less than one full year. Total return information does not reflect expenses that apply at the separate account level or to related insurance products. Inclusion of these charges would reduce the total return figures for all periods shown. Returns do not reflect the deduction of taxes that a shareholder would pay on fund distributions or the redemption of fund shares.

3. Annualized for periods less than one full year.

4. Total expenses including indirect expenses from affiliated fund were as follows:

Year Ended December 31, 2010

1.03%

Year Ended December 31, 2009

1.03%

Year Ended December 31, 2008

0.91%

Year Ended December 31, 2007

0.90%

Year Ended December 31, 2006

0.91%


INFORMATION AND SERVICES

STATEMENT OF ADDITIONAL INFORMATION. This document includes additional information about the Fund's investment policies, risks, and operations. It is incorporated by reference into this prospectus (it is legally part of this prospectus).

ANNUAL AND SEMI-ANNUAL REPORTS. The Fund's Annual and Semi-Annual Reports provide additional information about the Fund's investments and performance. The Annual Report includes a discussion of market conditions and investment strategies that significantly affected the Fund's performance during its last fiscal year.

How to Request More Information

You can request the above documents, the notice explaining the Fund's privacy policy, and other information about the Fund, without charge, by:

Telephone:

Call OppenheimerFunds Services toll-free: 1.800.988.8287

Mail:

Use the following address for regular mail:
OppenheimerFunds Services
P.O. Box 5270
Denver, Colorado 80217-5270

Use the following address for courier or express mail:
OppenheimerFunds Services
12100 East Iliff Avenue
Suite 300
Aurora, Colorado 80014

Internet:

You can read or download the Fund's Statement of Additional Information, Annual and Semi-Annual Reports on the OppenheimerFunds website at: www.oppenheimerfunds.com


Information about the Fund including the Statement of Additional Information can be reviewed and copied at the SEC's Public Reference Room in Washington, D.C. Information on the operation of the Public Reference Room may be obtained by calling the SEC at 1.202.551.8090. Reports and other information about the Fund are available on the EDGAR database on the SEC's website at www.sec.gov. Copies may be obtained after payment of a duplicating fee by electronic request at the SEC's e-mail address: publicinfo@sec.gov or by writing to the SEC's Public Reference Section, Washington, D.C. 20549-1520.

No one has been authorized to provide any information about the Fund or to make any representations about the Fund other than what is contained in this prospectus. This prospectus is not an offer to sell shares of the Fund, nor a solicitation of an offer to buy shares of the Fund, to any person in any state or other jurisdiction where it is unlawful to make such an offer.


The Fund's SEC File No.: 811-04108
SP0650.001.0411


OPPENHEIMER
Main Street Small- & Mid-Cap Fund®/VA*

A Series of Oppenheimer Variable Account Funds

Share Classes:

     Non-Service Shares

     Service Shares

Prospectus dated April 29, 2011

As with all mutual funds, the Securities and Exchange Commission has not approved or disapproved the Fund's securities nor has it determined that this prospectus is accurate or complete. It is a criminal offense to represent otherwise.

* Prior to April 29, 2011 the Fund was named "Oppenheimer Main Street Small Cap Fund®/VA"

Oppenheimer Main Street Small- & Mid-Cap Fund/VA is a mutual fund that seeks capital appreciation. The Fund uses fundamental research and quantitative models to invest mainly in common stocks of companies that are within the market capitalization range of the Russell 2500™ Index.

Shares of the Fund are sold only as an underlying investment for variable life insurance policies, variable annuity contracts and other insurance company separate accounts. A prospectus for the insurance product you have selected accompanies this prospectus and explains how to select shares of the Fund as an investment under that insurance product, and which share class or classes you are eligible to purchase.

This prospectus contains important information about the Fund's objective, investment policies, strategies and risks. Please read this prospectus (and your insurance product prospectus) carefully before you invest and keep them for future reference about your account.


Oppenheimer Main Street Small- & Mid-Cap Fund/VA


Table of contents

THE FUND SUMMARY

Investment Objective

3

Fees and Expenses of the Fund

3

Principal Investment Strategies

3

Principal Risks

4

The Fund's Past Performance

4

Investment Adviser

5

Portfolio Managers

5

Purchase and Sale of Fund Shares

5

Taxes

5

Payments to Broker-Dealers and Other Financial Intermediaries

5

MORE ABOUT THE FUND

About the Fund's Investments

6

How the Fund is Managed

9

MORE ABOUT YOUR INVESTMENT

How to Buy and Sell Shares

10

Dividends, Capital Gains and Taxes

12

Financial Highlights

13


To Summary Prospectus

THE FUND SUMMARY

Investment Objective. The Fund seeks capital appreciation.

Fees and Expenses of the Fund. This table describes the fees and expenses that you may pay if you buy and hold or redeem shares of the Fund. The accompanying prospectus of the participating insurance company provides information on initial or contingent deferred sales charges, exchange fees or redemption fees for that variable life insurance policy, variable annuity or other investment product. The fees and expenses of those products are not charged by the Fund and are not reflected in this table. Expenses would be higher if those fees were included.

Shareholder Fees (fees paid directly from your investment)

Non-Service Shares

Service Shares

Maximum Sales Charge (Load) imposed on purchases (as % of offering price)

None

None

Maximum Deferred Sales Charge (Load) (as % of the lower of original offering price or redemption proceeds)

None

None


Annual Fund Operating Expenses (expenses that you pay each year as a percentage of the value of your investment)

Non-Service Shares

Service Shares

Management Fees

0.70%

0.70%

Distribution and/or Service (12b-1) Fees

None

0.25%

Other Expenses

0.15%

0.15%

Total Annual Fund Operating Expenses

0.85%

1.10%

   Fee Waiver and Expense Reimbursement*

(0.05%)

(0.05%)

Total Annual Fund Operating Expenses After Fee Waiver and Expense Reimbursement

0.80%

1.05%


*  The Manager has voluntarily agreed to limit the Fund's total annual operating expenses so that those expenses, as percentages of daily net assets, will not exceed the annual rate of 0.80% for Non-Service Shares and 1.05% for Service Shares. This expense limitation may not be amended or withdrawn until one year after the date of this prospectus.


Example. The following Example is intended to help you compare the cost of investing in the Fund with the cost of investing in other mutual funds. The Example assumes that you invest $10,000 in a class of shares of the Fund for the time periods indicated. The Example also assumes that your investment has a 5% return each year and that the Fund's operating expenses remain the same. Although your actual costs may be higher or lower, based on these assumptions your expenses would be as follows, whether or not you redeemed your shares:

1 Year   3 Years   5 Years   10 Years  
Non-Service Shares $ 82 $ 267 $ 468 $ 1,049
Service Shares $ 108 $ 347 $ 605 $ 1,343


Portfolio Turnover. The Fund pays transaction costs, such as commissions, when it buys and sells securities (or "turns over" its portfolio). A higher portfolio turnover rate may indicate higher transaction costs. These costs, which are not reflected in the annual fund operating expenses or in the example, affect the Fund's performance. During the most recent fiscal year, the Fund's portfolio turnover rate was 73% of the average value of its portfolio.

Principal Investment Strategies. The Fund mainly invests in common stocks of "small-cap" and "mid-cap" companies. A company's "market capitalization" is the value of its outstanding common stock. Under normal market conditions, the Fund will invest at least 80% of its net assets, including any borrowings for investment purposes, in securities of companies having a market capitalization in the range of the Russell 2500™ Index, a measure of small- to mid-cap issuers. The capitalization range of that index is subject to change due to market activity or changes in the composition of the index. The range of the Russell 2500™ Index generally widens over time and it is reconstituted annually to preserve its small- and mid-cap character. On May 31, 2010, the latest reconstitution date, that index included issuers with market capitalizations of approximately $112 million to $5.4 billion dollars. The Fund measures a company's capitalization at the time the Fund buys a security and is not required to sell a security if the company's capitalization moves outside of the Fund's capitalization definition.

     The portfolio managers use both fundamental research and quantitative models to identify investment opportunities. While the process may change over time or vary in particular cases, in general the selection process currently:

  • aims to maintain broad diversification across all major economic sectors;
  • uses quantitative models, including sector-specific factors, to rank securities within each economic sector;
  • uses a fundamental approach to analyze issuers based on factors such as a company's financial performance, competitive strength, industry position, business practices and management; and
  • considers market trends, current industry outlooks and general economic conditions.

     In constructing the portfolio, the Fund seeks to limit exposure to so-called "top-down" or "macro" risks, such as overall stock market movements, economic cycles, and interest rate or currency fluctuations. Instead, the portfolio managers seek to add value by selecting individual securities with superior company-specific fundamental attributes or relative valuations that they expect to outperform their industry and sector peers. This is commonly referred to as a "bottom-up" approach to portfolio construction.

     The portfolio managers consider stock rankings, benchmark weightings and capitalization outlooks in determining security weightings for individual issuers. Although the Fund mainly invests in U.S. companies, it can invest in securities issued by companies or governments in any country. The Fund primarily invests in common stock but may also invest in other types of securities, such as units of master limited partnerships or other securities that are consistent with its investment objective. 

     The portfolio managers might sell a security if the price is approaching their price target, if the company's competitive position has deteriorated or the company's management has performed poorly, or if they have identified more attractive investment prospects.

Principal Risks. The price of the Fund's shares can go up and down substantially. The value of the Fund's investments may change because of broad changes in the markets in which the Fund invests or from poor security selection, which could cause the Fund to underperform other funds with similar objectives. There is no assurance that the Fund will achieve its investment objective. When you redeem your shares, they may be worth more or less than what you paid for them. These risks mean that you can lose money by investing in the Fund.

Main Risks of Investing in Stock. The value of the Fund's portfolio may be affected by changes in the stock markets. Stock markets may experience significant short-term volatility and may fall sharply at times. Different stock markets may behave differently from each other and U.S. stock markets may move in the opposite direction from one or more foreign stock markets.

The prices of individual stocks generally do not all move in the same direction at the same time and a variety of factors can affect the price of a particular company's stock. These factors may include, but are not limited to: poor earnings reports, a loss of customers, litigation against the company, general unfavorable performance of the company's sector or industry, or changes in government regulations affecting the company or its industry.

Main Risks of Small- and Mid-Sized Companies. The stock prices of small- and mid-sized companies may be more volatile and their securities may be more difficult to sell than those of larger companies. They may not have established markets, may have fewer customers and product lines, may have unseasoned management or less management depth and may have more limited access to financial resources. Smaller companies may not pay dividends or provide capital gains for some time, if at all.

       Investing in Small Unseasoned Companies.  The Fund can invest in the securities of small unseasoned companies. These are companies that have been in operation for less than three years, including the operations of any predecessors. In addition to the other risks of smaller issuers, these securities may have a very limited trading market, making it harder for the Fund to sell them at an acceptable price. The price of these securities may be very volatile, especially in the short term.

Main Risks of Foreign Investing. Foreign securities are subject to special risks. Foreign issuers are usually not subject to the same accounting and disclosure requirements that U.S. companies are subject to, which may make it difficult for the Fund to evaluate a foreign company's operations or financial condition. A change in the value of a foreign currency against the U.S. dollar will result in a change in the U.S. dollar value of securities denominated in that foreign currency and in the value of any income or distributions the Fund may receive on those securities. The value of foreign investments may be affected by exchange control regulations, foreign taxes, higher transaction and other costs, delays in the settlement of transactions, changes in economic or monetary policy in the United States or abroad, expropriation or nationalization of a company's assets, or other political and economic factors. These risks may be greater for investments in developing or emerging market countries.

Who Is the Fund Designed For? The Fund's shares are available only as an investment option under certain variable annuity contracts, variable life insurance policies and investment plans offered through insurance company separate accounts of participating insurance companies. The Fund is designed primarily for investors seeking capital appreciation over the long term. Those investors should be willing to assume the greater risks of short-term share price fluctuations that are typical for a fund focusing on stocks of small and medium sized companies. The Fund is not designed for investors needing current income. The Fund is not a complete investment program and may not be appropriate for all investors. You should carefully consider your own investment goals and risk tolerance before investing in the Fund.

An investment in the Fund is not a deposit of any bank and is not insured or guaranteed by the Federal Deposit Insurance Corporation or any other government agency.


The Fund's Past Performance. The bar chart and table below provide some indication of the risks of investing in the Fund by showing changes in the Fund's Non-Service Shares performance from year to year and by showing how the Fund's average annual returns for 1, 5 and 10 years compare with those of a broad measure of market performance. Charges imposed by the insurance accounts that invest in the Fund are not included and the returns would be lower if they were. The Fund's past investment performance is not necessarily an indication of how the Fund will perform in the future. More recent performance information is available by calling the toll-free number on the back of this prospectus and on the Fund's website at: https://www.oppenheimerfunds.com/fund/MainStreetSmallMidCapFundVA


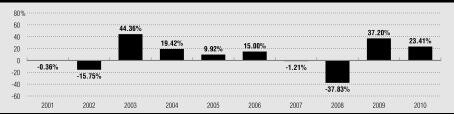
During the period shown, the highest return before taxes for a calendar quarter was 31.71% (2nd Quarter 2009) and the lowest return before taxes for a calendar quarter was -27.25% (4th Quarter 2008).


The following table shows the average annual total returns before taxes for each class of the Fund's shares. Because of the changes in its name and investment strategies, the Fund is adding performance comparisons to the Russell 2500™ Index and, beginning with its next annual prospectus update, it will no longer include the performance of the Russell 2000® Index.

Average Annual Total Returns for the periods ended December 31, 2010

1 Year

5 Years

10 Years
(or lifeof class, if less)

Non-Service Shares (inception 5-1-98)

23.41%


3.64%


6.64%


Service Shares (inception 7-16-01)

23.06%


3.38%


7.32%


Russell 2500 Index (reflects no deduction for fees, expenses or taxes)

26.71%


4.86%


6.98%


7.41%*


Russell 2000 Index (reflects no deduction for fees, expenses or taxes)

26.85%


4.47%


6.33%


6.62%*


* From 7-31-01


Investment Adviser. OppenheimerFunds, Inc. is the Fund's investment adviser (the "Manager").

Portfolio Managers. Matthew P. Ziehl has been lead portfolio manager and Vice President of the Fund since May 2009, Raymond Anello has been co-lead portfolio manager and Vice President of the Fund since April 2011, and Raman Vardharaj has been co-portfolio manager and Vice President of the Fund since May 2009.

Purchase and Sale of Fund Shares. Shares of the Fund may be purchased only by separate investment accounts of participating insurance companies as an underlying investment for variable life insurance policies, variable annuity contracts or other investment products. Individual investors cannot buy shares of the Fund directly. You may only submit instructions for buying or selling shares of the Fund to your insurance company or its servicing agent, not directly to the Fund or its Transfer Agent. The accompanying prospectus of the participating insurance company provides information about how to select the Fund as an investment option.

Taxes. Because shares of the Fund may be purchased only through insurance company separate accounts for variable annuity contracts, variable life insurance policies or other investment products, any dividends and capital gains distributions will be taxable to the participating insurance company, if at all. However, those payments may affect the tax basis of certain types of distributions from those accounts. Special tax rules apply to life insurance companies, variable annuity contracts and variable life insurance contracts. For information on federal income taxation of a life insurance company with respect to its receipt of distributions from the Fund and federal income taxation of owners of variable annuity or variable life insurance contracts, see the accompanying prospectus for the applicable contract.

Payments to Broker-Dealers and Other Financial Intermediaries. The Fund, the Manager, or their related companies may make payments to financial intermediaries, including to insurance companies that offer shares of the Fund as an investment option. These payments for the sale of Fund shares and related services may create a conflict of interest by influencing the intermediary and your salesperson to recommend the Fund over another investment. Ask your salesperson or visit your financial intermediary's website for more information.

MORE ABOUT THE FUND

About the Fund's Investments

The allocation of the Fund's portfolio among different types of investments will vary over time and the Fund's portfolio might not always include all of the different types of investments described below. The Statement of Additional Information contains more detailed information about the Fund's investment policies and risks.

THE FUND'S PRINCIPAL INVESTMENT STRATEGIES AND RISKS. The following strategies and types of investments are the ones that the Fund considers to be the most important in seeking to achieve its investment objective and the following risks are those the Fund expects its portfolio to be subject to as a whole.

Common Stock. Common stock represents an ownership interest in a company. It ranks below preferred stock and debt securities in claims for dividends and in claims for assets of the issuer in a liquidation or bankruptcy. Common stocks may be exchange-traded or over-the-counter securities. Over-the-counter securities may be less liquid than exchange-traded securities.

Small- and Mid-Cap Companies. The Fund invests mainly in the common stock of small- and mid-cap companies. The companies in which the Fund invests may include companies that are developing new products or services that the Fund believes have relatively favorable prospects, or that are expanding into new and growing markets. That may enable them to capture a dominant or important market position. Some small- or mid-cap companies may have a special area of expertise or the ability to take advantage of changes in market or demographic factors in a more profitable way than larger, more established companies.

Risks of Small- and Mid-Sized Companies. Small- and mid-sized companies may be either established or newer companies, including "unseasoned" companies that have been in operation for less than three years. While smaller companies might offer greater opportunities for gain than larger companies, they also may involve greater risk of loss. They may be more sensitive to changes in a company's earnings expectations and may experience more abrupt and erratic price movements. Smaller companies' securities often trade in lower volumes and in many instances, are traded over-the-counter or on a regional securities exchange, where the frequency and volume of trading is substantially less than is typical for securities of larger companies traded on national securities exchanges. Therefore, the securities of smaller companies may be subject to wider price fluctuations and it might be harder for the Fund to dispose of its holdings at an acceptable price when it wants to sell them. Small- and mid-sized companies may not have established markets for their products or services and may have fewer customers and product lines. They may have more limited access to financial resources and may not have the financial strength to sustain them through business downturns or adverse market conditions. Since small- and mid-sized companies typically reinvest a high proportion of their earnings in their business, they may not pay dividends for some time, particularly if they are newer companies. Smaller companies may have unseasoned management or less depth in management skill than larger, more established companies. They may be more reliant on the efforts of particular members of their management team and management changes may pose a greater risk to the success of the business. Securities of small, unseasoned companies may be particularly volatile, especially in the short term, and may have very limited liquidity. It may take a substantial period of time to realize a gain on an investment in a small- or mid-sized company, if any gain is realized at all.

Capitalization Ranges. The Fund measures the market capitalization of an issuer at the time of investment. Because the relative sizes of companies change over time as the stock market changes, the Fund's definition of what is a "small-cap," "mid-cap" or "large-cap" company may change over time as well. After the Fund buys the stock of an individual company, that company may expand or contract and no longer fall within the designated capitalization range. Although the Fund is not required to sell the stock of companies whose market capitalizations have grown or decreased beyond the Fund's capitalization-range definition, it might sell some of those holdings to try to adjust the dollar-weighted median capitalization of its portfolio. That might cause the Fund to realize capital gains on an investment and could increase taxable distributions to shareholders.

Quantitative Models. The portfolio managers use quantitative stock selection models that are based upon many factors that measure individual securities relative to each other. Those measurements may not always identify securities that perform well in the future.

Foreign Investing. The Fund can buy securities issued by companies or governments in any country, including in developing or emerging market countries.

     While foreign securities may offer special investment opportunities, there are also special risks. A change in the value of a foreign currency against the U.S. dollar will result in a change in the U.S. dollar value of the Fund's securities that are denominated in that foreign currency and in the value of any income or distributions the Fund may receive on those securities. Additionally, foreign issuers are usually not subject to the same accounting and disclosure requirements that U.S. companies are subject to. The value of foreign investments may be affected by exchange control regulations, expropriation or nationalization of a company's assets, foreign taxes, delays in settlement of transactions, changes in economic or monetary policy in the United States or abroad, or other political and economic factors.

The Fund may invest in securities of foreign issuers that are traded on U.S. or foreign exchanges. If the Fund invests a significant amount of its assets in securities that trade on foreign exchanges, it may be exposed to "time-zone arbitrage" attempts by investors seeking to take advantage of differences in the values of foreign securities that might result from events that occur after the close of the foreign securities market on which a security is traded and before the close of the New York Stock Exchange (the "NYSE") that day, when the Fund's net asset value is calculated. If such time-zone arbitrage were successful, it might dilute the interests of other shareholders. However, the Fund's use of "fair value pricing" under certain circumstances, to adjust the closing market prices of foreign securities to reflect what the Manager and the Board believe to be their fair value, may help deter those activities.


OTHER INVESTMENT STRATEGIES AND RISKS. The Fund can also use the investment techniques and strategies described below. The Fund might not use all of these techniques or strategies or might only use them from time to time.

Diversification and Concentration. The Fund is a diversified fund. It attempts to reduce its exposure to the risks of individual securities by diversifying its investments across a broad number of different companies. The Fund will not concentrate more than 25% of its total assets in issuers in any one industry. At times, however, the Fund may emphasize investments in some industries more than others.

Special Portfolio Diversification Requirements. To enable a variable annuity or variable life insurance contract based on an insurance company separate account to qualify for favorable tax treatment under the Internal Revenue Code, the underlying investments must follow special diversification requirements that limit the percentage of assets that can be invested in securities of particular issuers. The Fund's investment program is managed to meet those requirements, in addition to other diversification requirements under the Internal Revenue Code and the Investment Company Act of 1940 that apply to publicly-sold mutual funds.

Failure by the Fund to meet those special requirements could cause earnings on a contract owner's interest in an insurance company separate account to be taxable income. Those diversification requirements might also limit, to some degree, the Fund's investment decisions in a way that could reduce its performance.

Special Risks of Initial Public Offerings (IPOs). The Fund has no limit on the amount of its assets that can be invested in IPOs. By definition, securities issued in IPOs have not traded publicly until the time of their offerings. Special risks associated with IPOs may include, among others, the fact that there may be only a limited number of shares available for trading. The market for those securities may be unseasoned. The issuer may have a limited operating history. These factors may contribute to price volatility. The limited number of shares available for trading in some IPOs may also make it more difficult for the Fund to buy or sell significant amounts of shares without an unfavorable impact on prevailing prices. In addition, some companies initially offering their shares publicly are involved in relatively new industries or lines of business, which may not be widely understood by investors. Some of the companies involved in new industries may be regarded as developmental stage companies, without revenues or operating income, or the near-term prospects of them. Many IPOs are by small- or micro-cap companies that are undercapitalized.

Other Capitalization Ranges. If the Manager believes they offer opportunities for growth, up to 20% of the Fund's assets may be invested in securities of micro-cap and large-cap companies.

       Price Arbitrage. Because the Fund may invest in smaller company stocks that might trade infrequently, investors might seek to trade fund shares based on their knowledge or understanding of the value of those securities (this is sometimes referred to as "price arbitrage"). If such price arbitrage were successful, it might interfere with the efficient management of the Fund's portfolio and the Fund may be required to sell securities at disadvantageous times or prices to satisfy the liquidity requirements created by that activity. Successful price arbitrage might also dilute the value of fund shares held by other shareholders.

Other Equity Securities.   In addition to common stocks, the Fund can invest in other equity or "equity equivalents" securities such as preferred stocks or convertible securities. Preferred stocks generally pay a dividend and rank ahead of common stocks and behind debt securities in claims for dividends and for assets of the issuer in a liquidation or bankruptcy. The dividend rate of preferred stocks may cause their prices to behave more like those of debt securities. A convertible security is one that can be converted into or exchanged for common stock of an issuer within a particular period of time at a specified price, upon the occurrence of certain events or according to a price formula. Convertible securities offer the Fund the ability to participate in stock market movements while also seeking some current income. Convertible debt securities pay interest and convertible preferred stocks pay dividends until they mature or are converted, exchanged or redeemed. The Fund considers some convertible securities to be "equity equivalents" because they are convertible into common stock. The credit ratings of those convertible securities generally have less impact on the investment decision, although they are still subject to credit and interest rate risk.

Investments in Other Investment Companies. The Fund can also invest in the securities of other investment companies, which can include open-end funds, closed-end funds, unit investment trusts and business development companies. One reason the Fund might do so is to gain exposure to segments of the markets represented by another fund, at times when the Fund might not be able to buy the particular type of securities directly. As a shareholder of an investment company, the Fund would be subject to its ratable share of that investment company's expenses, including its advisory and administration expenses. The Fund does not intend to invest in other investment companies unless the Manager believes that the potential benefits of the investment justify the payment of any premiums or sales charges.

       Exchange-Traded Funds. The Fund can invest in exchange-traded funds (ETFs), which are typically open-end funds or unit investment trusts listed on a stock exchange. The Fund might do so as a way of gaining exposure to securities represented by the ETF's portfolio at times when the Fund may not be able to buy those securities directly. As a shareholder of an investment company, the Fund would be subject to its ratable share of that investment company's expenses, including its advisory and administration expenses. At the same time, the Fund would bear its own management fees and expenses. The Fund does not intend to invest in other ETFs unless the portfolio manager believes that the potential benefits of the investment justify the expenses. The Fund's investments in the securities of other investment companies are subject to the limits that apply to those types of investments under the Investment Company Act of 1940.

Master Limited Partnerships. The Fund may invest in publicly traded limited partnerships known as "master limited partnerships" or MLPs. MLPs issue units that are registered with the Securities and Exchange Commission and are freely tradable on a securities exchange or in the over-the-counter market. An MLP consists of one or more general partners, who conduct the business, and one or more limited partners, who contribute capital. The Fund, as a limited partner, normally would not be liable for the debts of the MLP beyond the amounts the Fund has contributed, but would not be shielded to the same extent that a shareholder of a corporation would be. In certain circumstances creditors of an MLP would have the right to seek return of capital distributed to a limited partner. This right of an MLP's creditors would continue after the Fund sold its investment in the MLP. MLPs are typically real estate, oil and gas and equipment leasing vehicles, but they also finance movies, research and development, and other projects.

Derivative Investments. The Fund may at times invest in "derivative" instruments. A derivative is an instrument whose value depends on (or is derived from) the value of an underlying security, asset, interest rate, index or currency. Derivatives may allow the Fund to increase or decrease its exposure to certain markets or risks for hedging purposes or to seek investment return.  

       Options, futures, options on futures, and forward contracts are some of the derivatives that the Fund may use. The Fund may also use other types of derivatives that are consistent with its investment strategies or hedging purposes.

Risks of Derivative Investments . Derivatives may be volatile and may involve significant risks. The underlying security or other instrument on which a derivative is based, or the derivative itself, may not perform the way the Manager expects it to. For example, if a call option sold by the Fund were exercised on an investment that had increased in value above the call price, the Fund would be required to sell the investment at the call price and would not be able to realize any additional profit. The Fund may lose money on a derivative investment if the issuer fails to pay the amount due. Certain derivative investments held by the Fund may be illiquid, making it difficult to close out an unfavorable position. Derivative transactions may require the payment of premiums and can increase portfolio turnover. As a result, the Fund could realize little or no income or lose principal from the investment, or a hedge might be unsuccessful. For some derivatives, it is possible for the Fund to lose more than the amount invested in the derivative instrument.

Hedging.  Hedging transactions are intended to reduce the risks of securities in the Fund's portfolio. If the Fund uses a hedging instrument at the wrong time or judges market conditions incorrectly, however, the hedge might be unsuccessful or could reduce the Fund's return or create a loss. The Fund has percentage limits on its use of derivatives and hedging instruments.

Illiquid and Restricted Securities. Investments that do not have an active trading market, or that have legal or contractual limitations on their resale, are generally referred to as "illiquid" securities. Illiquid securities may be difficult to value or to sell promptly at an acceptable price or may require registration under applicable securities laws before they can be sold publicly. Securities that have limitations on their resale are referred to as "restricted securities." Certain restricted securities that are eligible for resale to qualified institutional purchasers may not be regarded as illiquid.

The Fund will not invest more than 10% of its net assets in illiquid or restricted securities.  The Board can increase that limit to 15%. The Manager monitors the Fund's holdings of illiquid securities on an ongoing basis to determine whether to sell any of those securities to maintain adequate liquidity.

Conflicts of Interest. The investment activities of the Manager and its affiliates in regard to other funds and accounts they manage may present conflicts of interest that could disadvantage the Fund and its shareholders. The Manager or its affiliates may provide investment advisory services to other funds and accounts that have investment objectives or strategies that differ from, or are contrary to, those of the Fund. That may result in another fund or account holding investment positions that are adverse to the Fund's investment strategies or activities. Other funds or accounts advised by the Manager or its affiliates may have conflicting interests arising from investment objectives that are similar to those of the Fund. Those funds and accounts may engage in, and compete for, the same types of securities or other investments as the Fund or invest in securities of the same issuers that have different, and possibly conflicting, characteristics. The trading and other investment activities of those other funds or accounts may be carried out without regard to the investment activities of the Fund and, as a result, the value of securities held by the Fund or the Fund's investment strategies may be adversely affected. The Fund's investment performance will usually differ from the performance of other accounts advised by the Manager or its affiliates and the Fund may experience losses during periods in which other accounts advised by the Manager or its affiliates achieve gains. The Manager has adopted policies and procedures designed to address potential conflicts of interest identified by the Manager; however, such policies and procedures may also limit the Fund's investment activities and affect its performance.

     The Fund offers its shares to separate accounts of different insurance companies, as an investment for their variable annuity contracts, variable life insurance policies and other investment products. While the Fund does not foresee any disadvantages to contract owners from these arrangements, it is possible that the interests of owners of different contracts participating in the Fund through different separate accounts might conflict. For example, a conflict could arise because of differences in tax treatment.

Investments in Oppenheimer Institutional Money Market Fund. The Fund can invest its free cash balances in Class E shares of Oppenheimer Institutional Money Market Fund to provide liquidity or for defensive purposes. The Fund invests in Oppenheimer Institutional Money Market Fund, rather than purchasing individual short-term investments, to seek a higher yield than it could obtain on its own. Oppenheimer Institutional Money Market Fund is a registered open-end management investment company, regulated as a money market fund under the Investment Company Act of 1940, and is part of the Oppenheimer family of funds. It invests in a variety of short-term, high-quality, dollar-denominated money market instruments issued by the U.S. Government, domestic and foreign corporations, other financial institutions, and other entities. Those investments may have a higher rate of return than the investments that would be available to the Fund directly. At the time of an investment, the Fund cannot always predict what the yield of the Oppenheimer Institutional Money Market Fund will be because of the wide variety of instruments that fund holds in its portfolio. The return on those investments may, in some cases, be lower than the return that would have been derived from other types of investments that would provide liquidity. As a shareholder, the Fund will be subject to its proportional share of the expenses of Oppenheimer Institutional Money Market Fund's Class E shares, including its advisory fee. However, the Manager will waive a portion of the Fund's advisory fee to the extent of the Fund's share of the advisory fee paid to the Manager by Oppenheimer Institutional Money Market Fund.

Temporary Defensive and Interim Investments. For temporary defensive purposes in times of adverse or unstable market, economic or political conditions, the Fund can invest up to 100% of its total assets in investments that may be inconsistent with the Fund's principal investment strategies. Generally, the Fund would invest in shares of Oppenheimer Institutional Money Market Fund or in the types of money market instruments in which Oppenheimer Institutional Money Market Fund invests or in other short-term U.S. Government securities. The Fund might also hold these types of securities as interim investments pending the investment of proceeds from the sale of Fund shares or the sale of Fund portfolio securities or to meet anticipated redemptions of Fund shares. To the extent the Fund invests in these securities, it might not achieve its investment objective.

Portfolio Turnover . A change in the securities held by the Fund is known as "portfolio turnover." The Fund may engage in active and frequent trading to try to achieve its investment objective and may have a portfolio turnover rate of over 100% annually. Increased portfolio turnover may result in higher brokerage fees or other transaction costs, which can reduce performance. The Financial Highlights table at the end of this prospectus shows the Fund's portfolio turnover rates during past fiscal years.

CHANGES TO THE FUND'S INVESTMENT POLICIES. The Fund's fundamental investment policies cannot be changed without the approval of a majority of the Fund's outstanding voting shares; however, the Fund's Board can change non-fundamental policies without a shareholder vote. Significant policy changes will be described in supplements to this prospectus. Shareholders will receive 60 days advance notice of any change in the 80% investment policy described in "Principal Investment Strategies." The Fund's investment objective is a fundamental policy. Other investment restrictions that are fundamental policies are listed in the Fund's Statement of Additional Information. An investment policy is not fundamental unless this prospectus or the Statement of Additional Information states that it is.

PORTFOLIO HOLDINGS.   The Fund's portfolio holdings are included in its semi-annual and annual reports that are distributed to its shareholders within 60 days after the close of the applicable reporting period. The Fund also discloses its portfolio holdings in its Statements of Investments on Form N-Q, which are public filings that are required to be made with the Securities and Exchange Commission within 60 days after the end of the Fund's first and third fiscal quarters. Therefore, the Fund's portfolio holdings are made publicly available no later than 60 days after the end of each of its fiscal quarters. In addition, the Fund's portfolio holdings information, as of the end of each calendar month, may be posted and available on the Fund's website no sooner than 30 days after the end of each calendar month.    

A description of the Fund's policies and procedures with respect to the disclosure of its portfolio holdings is available in the Fund's Statement of Additional Information.

How the Fund is Managed

THE MANAGER. OppenheimerFunds, Inc., the Manager, chooses the Fund's investments and handles its day-to-day business. The Manager carries out its duties, subject to the policies established by the Fund's Board of Trustees, under an investment advisory agreement that states the Manager's responsibilities. The agreement sets the fees the Fund pays to the Manager and describes the expenses that the Fund is responsible to pay to conduct its business.

The Manager has been an investment adviser since 1960. The Manager is located at Two World Financial Center, 225 Liberty Street, 11th Floor, New York, New York 10281-1008.

Advisory Fee. Under the investment advisory agreement, the Fund pays the Manager an advisory fee at an annual rate that declines on additional assets as the Fund grows: 0.75% of the first $200 million of average annual net assets, 0.72% of the next $200 million, 0.69% of the next $200 million, 0.66% of the next $200 million, and 0.60% of average annual net assets over $800 million. The Fund's management fee for its fiscal year ended December 31, 2010, was 0.70% of the Fund's average annual net assets for each class of shares.

     The Manager has voluntarily agreed to limit the Fund's total annual operating expenses so that those expenses, as percentages of daily net assets, will not exceed the annual rate of 0.80% for Non-Service Shares and 1.05% for Service Shares. This voluntary expense limitation may not be amended or withdrawn until one year after the date of this prospectus. The Manager has also voluntarily agreed to waive fees and/or reimburse Fund expenses in an amount equal to the indirect management fees incurred through the Fund's investment in Oppenheimer Institutional Money Market Fund. During the fiscal year ended December 31, 2010, that amount did not exceed 0.01% and is therefore not reflected in the Annual Operating Expenses table shown earlier in this prospectus. This waiver and/or reimbursement may be amended or withdrawn at any time. The Fund's management fee and other annual operating expenses may vary in future years.

     A discussion regarding the basis for the Board of Trustees' approval of the Fund's investment advisory contract is available in the Fund's Annual Report to shareholders for the year ended December 31, 2010.

Portfolio Managers. The Fund's portfolio is managed by Matthew P. Ziehl, Raymond Anello and Raman Vardharaj, who are primarily responsible for the day-to-day management of the Fund's investments. Mr. Ziehl has been lead portfolio manager and Vice President of the Fund since May 2009, Mr. Anello has been co-lead portfolio manager and Vice President of the Fund since April 2011 and Mr. Vardharaj has been co-portfolio manager and Vice President of the Fund since May 2009.

     Mr. Ziehl has been a Vice President and portfolio manager of the Manager since May 2009. Prior to joining the Manager, Mr. Ziehl was a portfolio manager with RS Investment Management Co. LLC from October 2006 to May 2009 and served as a managing director at The Guardian Life Insurance Company of America from December 2001 to October 2006 when Guardian Life Insurance acquired an interest in RS Investment Management Co. LLC. Mr. Ziehl is a portfolio manager of other portfolios in the OppenheimerFunds complex.

     Mr. Anello has been a Vice President of the Manager since May 2009 and a portfolio manager of the Manager since April 2011. He has served as sector manager for energy and utilities for the Manager's Main Street Investment Team since May 2009. Prior to joining the Manager, Mr. Anello was portfolio manager of the RS All Cap Dividend product from its inception in July 2007 through April 2009 and served as a sector manager for energy and utilities for various other RS Investments products. Mr. Anello joined Guardian Life Insurance Company in October 1999 and transitioned to RS Investments in October 2006 in connection with Guardian Life Insurance Company's acquisition of an interest in RS Investments. Mr. Anello is a portfolio manager of another portfolio in the OppenheimerFunds complex.

     Mr. Vardharaj, CFA, has been a Vice President and portfolio manager of the Manager since May 2009. Prior to joining the Manager, Mr. Vardharaj was sector manager and a senior quantitative analyst creating stock selection models, monitoring portfolio risks and analyzing portfolio performance across the RS Core Equity Team of RS Investment Management Co. LLC from October 2006 to May 2009. He served as quantitative analyst at The Guardian Life Insurance Company of America from 1998 to October 2006 when Guardian Life Insurance acquired an interest in RS Investment Management Co. LLC. Mr. Vardharaj is a portfolio manager of other portfolios in the OppenheimerFunds complex.

     The Statement of Additional Information provides additional information about the portfolio managers' compensation, other accounts they manage and their ownership of Fund shares.

MORE ABOUT YOUR INVESTMENT

How to Buy and Sell Shares

You may only submit instructions for buying or selling shares of the Fund to your insurance company or its servicing agent, not directly to the Fund or its Transfer Agent. Information about your investment in the Fund can only be obtained from your participating insurance company or its servicing agent. The Fund's Transfer Agent does not hold or have access to those records.

WHAT CLASSES OF SHARES DOES THE FUND OFFER? The Fund currently offers two different classes of shares. The different classes of shares represent investments in the same portfolio of securities, but the classes are subject to different expenses and will usually have different share prices. The Service Shares are subject to a distribution and service plan. The expenses of that plan are described below. The Non-Service Shares are not subject to a service and distribution plan.

THE PRICE OF FUND SHARES. Fund shares are sold to participating insurance companies, and are redeemed, at their net asset value per share. The net asset value that applies to a purchase order is the next one calculated after the insurance company (as the Fund's designated agent to receive purchase orders) receives the order from its contract owner, in proper form. Fund shares are redeemed at the next net asset value calculated after the insurance company (as the Fund's designated agent to receive purchase orders) receives the order from its contract owner, in proper form. The Fund's Transfer Agent generally must receive the purchase or redemption order from the insurance company by 9:30 a.m. Eastern Time on the next regular business day.

The Fund does not impose any sales charge on purchases of its shares. If there are any charges imposed under the variable annuity, variable life or other contract through which Fund shares are purchased, they are described in the accompanying prospectus of the participating insurance company. The participating insurance company's prospectus may also include information regarding the time you must submit your purchase and redemption orders.

     The sale and redemption price for Fund shares will change from day to day because the value of the securities in its portfolio and its expenses fluctuate. The redemption price will normally differ for different classes of shares. The redemption price of your shares may be more or less than their original cost.

Net Asset Value. The Fund calculates the net asset value of each class of shares as of the close of the New York Stock Exchange (NYSE), on each day the NYSE is open for trading (referred to in this prospectus as a "regular business day"). The NYSE normally closes at 4:00 p.m., Eastern Time, but may close earlier on some days.

The Fund determines the net assets of each class of shares by subtracting the class-specific expenses and the amount of the Fund's liabilities attributable to the share class from the market value of the Fund's securities and other assets attributable to the share class. The Fund's "other assets" might include, for example, cash and interest or dividends from its portfolio securities that have been accrued but not yet collected. The Fund's securities are valued primarily on the basis of current market quotations.

The net asset value per share for each share class is determined by dividing the net assets of the class by the number of outstanding shares of that class.

     Fair Value Pricing. If market quotations are not readily available or (in the Manager's judgment) do not accurately reflect the fair value of a security, or if after the close of the principal market on which a security held by the Fund is traded and before the time as of which the Fund's net asset value is calculated that day, an event occurs that the Manager learns of and believes in the exercise of its judgment will cause a material change in the value of that security from the closing price of the security on the principal market on which it is traded, that security may be valued by another method that the Board believes would more accurately reflect the security's fair value.

In determining whether current market prices are readily available and reliable, the Manager monitors the information it receives in the ordinary course of its investment management responsibilities. It seeks to identify significant events that it believes, in good faith, will affect the market prices of the securities held by the Fund. Those may include events affecting specific issuers (for example, a halt in trading of the securities of an issuer on an exchange during the trading day) or events affecting securities markets (for example, a foreign securities market closes early because of a natural disaster). The Board has adopted valuation procedures for the Fund and has delegated the day-to-day responsibility for fair value determinations to the Manager's "Valuation Committee." Those determinations may include consideration of recent transactions in comparable securities, information relating to the specific security, developments in the markets and their performance, and current valuations of foreign or U.S. indices. Fair value determinations by the Manager are subject to review, approval and ratification by the Board at its next scheduled meeting after the fair valuations are determined.

The Fund's use of fair value pricing procedures involves subjective judgments and it is possible that the fair value determined for a security may be materially different from the value that could be realized upon the sale of that security. Accordingly, there can be no assurance that the Fund could obtain the fair value assigned to a security if it were to sell the security at approximately the same time at which the Fund determines its net asset value per share.

     Pricing Foreign Securities . The Fund may use fair value pricing more frequently for securities primarily traded on foreign exchanges. Because many foreign markets close hours before the Fund values its foreign portfolio holdings, significant events, including broad market movements, may occur during that time that could potentially affect the values of foreign securities held by the Fund.

The Manager believes that foreign securities values may be affected by volatility that occurs in U.S. markets after the close of foreign securities markets. The Manager's fair valuation procedures therefore include a procedure whereby foreign securities prices may be "fair valued" to take those factors into account.

Because some foreign securities trade in markets and on exchanges that operate on weekends and U.S. holidays, the values of some of the Fund's foreign investments may change on days when investors cannot buy or redeem Fund shares.

HOW CAN YOU BUY FUND SHARES? Shares of the Fund may be purchased only by separate investment accounts of participating insurance companies as an underlying investment for variable life insurance policies, variable annuity contracts or other investment products. Individual investors cannot buy shares of the Fund directly. Please refer to the accompanying prospectus of the participating insurance company for information on how to select the Fund as an investment option. That prospectus will indicate which share class you may be eligible to purchase.

Suspension of Share Offering. The offering of Fund shares may be suspended during any period in which the determination of net asset value is suspended, and may be suspended by the Board at any time the Board believes it is in the Fund's best interest to do so.

HOW CAN YOU REDEEM FUND SHARES? Only the participating insurance companies that hold Fund shares in their separate accounts can place orders to redeem shares. Contract holders and policy holders should not directly contact the Fund or its transfer agent to request a redemption of Fund shares. The Fund normally sends payment by Federal Funds wire to the insurance company's account on the next business day after the Fund receives the order (and no later than seven days after the Fund's receipt of the order). Under unusual circumstances determined by the Securities and Exchange Commission, payment may be delayed or suspended. Contract owners should refer to the withdrawal or surrender instructions in the accompanying prospectus of the participating insurance company.

Redemptions "In-Kind." Shares may be "redeemed in-kind" under certain circumstances (such as redemptions of substantial amounts of shares by shareholders that have consented to such in kind redemptions). That means that the redemption proceeds will be paid to the participating insurance companies in securities from the Fund's portfolio. If the Fund redeems shares in-kind, the insurance company accounts may bear transaction costs and will bear market risks until such securities are converted into cash.

Limitations on Frequent Transactions

Frequent purchases and redemptions of Fund shares may interfere with the Manager's ability to manage the Fund's investments efficiently, may increase its transaction and administrative costs and may affect its performance, depending on various factors, such as the size of the Fund, the nature of its investments, the amount of Fund assets the portfolio manager maintains in cash or cash equivalents, and the aggregate dollar amount, the number and the frequency of trades.

If large dollar amounts are involved in frequent redemption transactions, the Fund might be required to sell portfolio securities at unfavorable times to meet those transaction requests, and the Fund's brokerage or administrative expenses might be increased. Therefore, the Manager and the Fund's Board have adopted the following policies and procedures to detect and prevent frequent and/or excessive purchase and redemption activity, while addressing the needs of investors who seek liquidity in their investment. There is no guarantee that those policies and procedures, described below, will be sufficient to identify and deter all excessive short-term trading. If the Transfer Agent is not able to detect and curtail such activity, frequent trading could occur in the Fund.

Policies on Disruptive Activity.  The Transfer Agent and the Distributor, on behalf of the Fund, have entered into agreements with participating insurance companies designed to detect and restrict excessive short-term trading activity by contract or policy owners or their financial advisers in their accounts. The Transfer Agent generally does not consider periodic asset allocation or re-balancing that affects a portion of the Fund shares held in the account of a policy or contract owner to be "excessive trading." However, the Transfer Agent has advised participating insurance companies that it generally considers certain other types of trading activity to be "excessive," such as making a "transfer" out of the Fund within 30 days after buying Fund shares (by the sale of the recently purchased Fund shares and the purchase of shares of another fund) or making more than six "round-trip transfers" between funds during one year. The agreements require participating insurance companies to provide transaction information to the Fund and to execute Fund instructions to restrict trading in Fund shares.

 A participating insurance company may also have its own policies and procedures and may impose its own restrictions or limitations to discourage short-term and/or excessive trading by its policy or contract owners. Those policies and procedures may be different from the Fund's in certain respects. You should refer to the prospectus for your insurance company variable annuity contract for specific information about the insurance company's policies. Under certain circumstances, policy or contract owners may be required to transmit purchase or redemption orders only by first class U.S. mail.

Monitoring the Policies. The Fund's policies and procedures for detecting and deterring frequent or excessive trading are administered by the Fund's Transfer Agent. However, the Transfer Agent presently does not have the ability to directly monitor trading activity in the accounts of policy or contract owners within the participating insurance companies' accounts. The Transfer Agent's ability to monitor and deter excessive short-term trading in such insurance company accounts ultimately depends on the capability and diligence of each participating insurance company, under their agreements with the Transfer Agent, the Distributor and the Fund, in monitoring and controlling the trading activity of the policy or contract owners in the insurance company's accounts.

The Transfer Agent will attempt to monitor the net effect on the Fund's assets from the purchase and redemption activity in the accounts of participating insurance companies and will seek to identify patterns that may suggest excessive trading by the contract or policy owners who invest in the insurance company's accounts. If the Transfer Agent believes it has observed evidence of possible excessive trading activity, it will ask the participating insurance companies or other registered owners to provide information about the transaction activity of the contract or policy holders in their respective accounts, and to take appropriate action. In that case, the insurance company must confirm to the Transfer Agent that appropriate action has been taken to curtail the excessive trading activity.

The Transfer Agent will, subject to the limitations described in this section, limit or terminate the trading activity of any person, group or account that it believes would be excessive or disruptive. However, the Transfer Agent may not be able to detect or curtail all such trading activity in the Fund. The Transfer Agent will evaluate trading activity on a case by case basis and the limitations placed on trading may vary between accounts.

Right to Refuse Purchase Orders. The Fund's Distributor or Transfer Agent may, in their discretion, refuse any purchase order and are not obligated to provide notice before rejecting an order.  

DISTRIBUTION AND SERVICE (12b-1) PLANS

Distribution and Service Plan for Service Shares. The Fund has adopted a Distribution and Service Plan for Service Shares to pay the Distributor for distribution related services, personal services and account maintenance for those shares. Under the Plan, the Fund pays the Distributor quarterly at an annual rate of up to 0.25% of the daily net assets of the Fund's Service Shares. Because these fees are paid out of the Fund's assets on an on-going basis, over time they will increase the operating expenses of the Service Shares and may cost you more than other types of fees or sales charges. As a result, the Service Shares may have lower performance compared to the Fund's shares that are not subject to a service fee.

     Use of Plan Fees: The Distributor currently uses all of those fees to compensate sponsor(s) of the insurance product for providing personal services and account maintenance for variable contract owners that hold Service Shares.

PAYMENTS TO FINANCIAL INTERMEDIARIES AND SERVICE PROVIDERS. The Manager and the Distributor, in their discretion, may also make payments for distribution and/or shareholder servicing activities to brokers, dealers and other financial intermediaries, including the insurance companies that offer the Fund as an investment option, or to service providers. Those payments are made out of the Manager's and/or the Distributor's own resources and/or assets, including from the revenues or profits derived from the advisory fees the Manager receives from the Fund. Those cash payments, which may be substantial, are paid to many firms having business relationships with the Manager and Distributor and are in addition to any distribution fees, servicing fees, or transfer agency fees paid directly or indirectly by the Fund to those entities. Payments by the Manager or Distributor from their own resources are not reflected in the tables in the "Fees and Expenses of the Fund" section of this prospectus because they are not paid by the Fund.

The financial intermediaries that may receive those payments include firms that offer and sell Fund shares to their clients, or provide shareholder services to the Fund, or both, and receive compensation for those activities. The financial intermediaries that may receive payments include securities brokers, dealers, financial advisers, insurance companies that offer variable annuity or variable life insurance products and other intermediaries.

In general, these payments to financial intermediaries can be categorized as "distribution-related" or "servicing" payments. Payments for distribution-related expenses, such as marketing or promotional expenses, are often referred to as "revenue sharing." Revenue sharing payments may be made on the basis of the sales of shares attributable to that intermediary, the average net assets of the Fund and other Oppenheimer funds attributable to the accounts of that intermediary and its clients, negotiated lump sum payments for distribution services provided, or similar fees. In some circumstances, revenue sharing payments may create an incentive for a financial intermediary or its representatives to recommend or offer shares of the Fund or other Oppenheimer funds to its customers. These payments also may give an intermediary an incentive to cooperate with the Distributor's marketing efforts. A revenue sharing payment may, for example, qualify the Fund for preferred status with the intermediary receiving the payment or provide representatives of the Distributor with access to representatives of the intermediary's sales force, in some cases on a preferential basis over funds of competitors. Additionally, as firm support, the Manager or Distributor may reimburse expenses related to educational seminars and "due diligence" or training meetings (to the extent permitted by applicable laws or the rules of the Financial Industry Regulatory Authority ("FINRA")) designed to increase sales representatives' awareness about Oppenheimer funds, including travel and lodging expenditures. However, the Manager does not consider a financial intermediary's sale of shares of the Fund or other Oppenheimer funds when selecting brokers or dealers to effect portfolio transactions for the funds.

Various factors are used to determine whether to make revenue sharing payments. Possible considerations include, without limitation, the types of services provided by the intermediary, sales of Fund shares, the redemption rates on accounts of clients of the intermediary or overall asset levels of Oppenheimer funds held for or by clients of the intermediary, the willingness of the intermediary to allow the Distributor to provide educational and training support for the intermediary's sales personnel relating to the Oppenheimer funds, the availability of the Oppenheimer funds on the intermediary's sales system, as well as the overall quality of the services provided by the intermediary and the Manager or Distributor's relationship with the intermediary. The Manager and Distributor have adopted guidelines for assessing and implementing each prospective revenue sharing arrangement. To the extent that financial intermediaries receiving distribution-related payments from the Manager or Distributor sell more shares of the Oppenheimer funds or retain more shares of the funds in their client accounts, the Manager and Distributor benefit from the incremental management and other fees they receive with respect to those assets.

Payments may also be made by the Manager, the Distributor or the Transfer Agent to financial intermediaries to compensate or reimburse them for administrative or other client services provided such as sub-transfer agency services for shareholders, omnibus accounting or sub-accounting, participation in networking arrangements, account set-up, recordkeeping and other shareholder services. Payments may also be made for administrative services related to the distribution of Fund shares through the intermediary. Firms that may receive servicing fees include insurance companies that offer variable annuity or variable life insurance products and others. These fees may be used by the service provider to offset or reduce fees that would otherwise be paid directly to them by certain account holders. The Statement of Additional Information contains more information about revenue sharing and service payments made by the Manager or the Distributor. Your broker, dealer or other financial intermediary may charge you fees or commissions in addition to those disclosed in this prospectus. You should ask your financial intermediary for details about any such payments it receives from the Manager or the Distributor and their affiliates, or any other fees or expenses it charges.

Dividends, Capital Gains and Taxes

DIVIDENDS AND DISTRIBUTIONS. The Fund intends to declare and pay dividends annually from any net investment income. The Fund may also realize capital gains on the sale of portfolio securities, in which case it may make distributions out of any net short-term or long-term capital gains annually. The Fund may also make supplemental distributions of dividends and capital gains following the end of its fiscal year. The Fund has no fixed dividend rate and cannot guarantee that it will pay any dividends or capital gains distributions in a particular year.

Dividends and distributions are paid separately for each share class. Because of the higher expenses on Service Shares, the dividends and capital gains distributions paid on those shares will generally be lower than for other Fund shares.

Receiving Dividends and Distributions. Any dividends and capital gains distributions will be automatically reinvested in additional Fund shares for the account of the participating insurance company, unless the insurance company elects to have dividends or distributions paid in cash.

TAXES. For a discussion of the tax status of a variable annuity contract, a variable life insurance policy or other investment product of a participating insurance company, please refer to the accompanying variable contract prospectus of your participating insurance company. Because shares of the Fund may be purchased only through insurance company separate accounts for variable annuity contracts, variable life insurance policies or other investment products, any dividends from net investment income and distributions of net realized short-term and long-term capital gains will be taxable, if at all, to the participating insurance company. However, those payments may affect the tax basis of certain types of distributions from those accounts.

The Fund has qualified and intends to qualify each year to be taxed as a regulated investment company under the Internal Revenue Code by satisfying certain income, asset diversification and income distribution requirements, but reserves the right not to so qualify. In each year that it qualifies as a regulated investment company, the Fund will not be subject to federal income taxes on its income that it distributes to shareholders.

This information is only a summary of certain Federal income tax information about your investment. You are encouraged to consult your tax adviser about the effect of an investment in the Fund on your particular tax situation and about any changes to the Internal Revenue Code that may occur from time to time. Additional information about the tax effects of investing in the Fund is contained in the Statement of Additional Information.

Financial Highlights

The Financial Highlights Table is presented to help you understand the Fund's financial performance for the past five fiscal years. Certain information reflects financial results for a single Fund share. The total returns in the table represent the rate that an investor would have earned (or lost) on an investment in the Fund (assuming reinvestment of all dividends and distributions). This information has been audited by KPMG LLP, the Fund's independent registered public accounting firm for the fiscal years ended December 31, 2010 and 2009. The financial highlights for the prior years were audited by another independent registered public accounting firm. KPMG's report, along with the Fund's financial statements, are included in the Statement of Additional Information, which is available upon request.

Financial Highlights Table

Non-Service Shares      Year Ended December 31,

2010


2009


2008


2007


2006


Per Share Operating Data


Net asset value, beginning of period

$14.40


$ 10.65


$ 18.20


$ 19.15


$ 17.18


Income (loss) from investment operations:


Net investment income1

.10


.08


.12


.09


.08


Net realized and unrealized gain (loss)

3.25


3.78


(6.73)


(.30)


2.46


Total from investment operations

3.35


3.86


(6.61)


(.21)


2.54


Dividends and/or distributions to shareholders:


Dividends from net investment income

(.09)


(.11)


(.08)


(.06)


(.03)


Distributions from net realized gain

--


--


(.86)


(.68)


(.54)


Total dividends and/or distributions to shareholders

(.09)


(.11)


(.94)


(.74)


(.57)


Net asset value, end of period

$17.66


$14.40


$10.65


$18.20


$19.15


Total Return, at Net Asset Value2

23.41%


37.20%


(37.83)%


(1.21)%


15.00%


Ratios/Supplemental Data


Net assets, end of period (in thousands)

$95,576


$81,814


$58,478


$93,939


$81,405


Average net assets (in thousands)

$88,063


$69,585


$80,406


$94,815


$62,659


Ratios to average net assets:3


Net investment income

0.68%


0.71%


0.80%


0.48%


0.46%


Total expenses4

0.85%


0.91%


0.75%


0.73%


0.77%


Expenses after payments, waivers and/or reimbursements and reduction to custodian expenses

0.80%


0.82%


0.75%


0.73%


0.77%


Portfolio turnover rate

73%


140%


130%


115%


110%


1. Per share amounts calculated based on the average shares outstanding during the period.

2. Assumes an initial investment on the business day before the first day of the fiscal period, with all dividends and distributions reinvested in additional shares on the reinvestment date, and redemption at the net asset value calculated on the last business day of the fiscal period. Total returns are not annualized for periods less than one full year. Total return information does not reflect expenses that apply at the separate account level or to related insurance products. Inclusion of these charges would reduce the total return figures for all periods shown. Returns do not reflect the deduction of taxes that a shareholder would pay on fund distributions or the redemption of fund shares.

3. Annualized for periods less than one full year.

4. Total Expenses including indirect expenses from affiliated fund were as follows:

Year Ended December 31, 2010

0.85%

Year Ended December 31, 2009

0.91%

Year Ended December 31, 2008

0.75%

Year Ended December 31, 2007

0.73%

Year Ended December 31, 2006

0.77%


Service Shares      Year Ended December 31,

2010


2009


2008


2007


2006


Per Share Operating Data


Net asset value, beginning of period

$14.28


$10.54


$18.03


$18.98


$17.06


Income (loss) from investment operations:


Net investment income1

.07


.05


.08


.05


.04


Net realized and unrealized gain (loss)

3.21


3.76


(6.67)


(.29)


2.42


Total from investment operations

3.28


3.81


(6.59)


(.24)


2.46


Dividends and/or distributions to shareholders:


Dividends from net investment income

(.06)


(.07)


(.04)


(.03)


-- 2


Distributions from net realized gain

--


--


(.86)


(.68)


(.54)


Total dividends and/or distributions to shareholders

(.06)


(.07)


(.90)


(.71)


(.54)


Net asset value, end of period

$17.50


$14.28


$10.54


$18.03


$18.98


Total Return, at Net Asset Value3

23.06%


36.88%


(38.00)%


(1.39)%


14.66%


Ratios/Supplemental Data


Net assets, end of period (in thousands)

$859,710


$662,347


$551,644


$821,642


$636,430


Average net assets (in thousands)

$730,069


$612,651


$769,150


$766,102


$479,456


Ratios to average net assets:4


Net investment income

0.45%


0.47%


0.52%


0.23%


0.23%


Total expenses5

1.10%


1.15%


0.99%


0.97%


1.00%


Expenses after payments, waivers and/or reimbursements and reduction to custodian expenses

1.05%


1.07%


0.99%


0.97%


1.00%


Portfolio turnover rate

73%


140%


130%


115%


110%


1. Per share amounts calculated based on the average shares outstanding during the period.

2. Less than $0.005 per share.

3. Assumes an initial investment on the business day before the first day of the fiscal period, with all dividends and distributions reinvested in additional shares on the reinvestment date, and redemption at the net asset value calculated on the last business day of the fiscal period. Total returns are not annualized for periods less than one full year. Total return information does not reflect expenses that apply at the separate account level or to related insurance products. Inclusion of these charges would reduce the total return figures for all periods shown. Returns do not reflect the deduction of taxes that a shareholder would pay on fund distributions or the redemption of fund shares.

4. Annualized for periods less than one full year.

5. Total expenses including indirect expenses from affiliated fund were as follows:

Year Ended December 31, 2010

1.10%

Year Ended December 31, 2009

1.15%

Year Ended December 31, 2008

0.99%

Year Ended December 31, 2007

0.97%

Year Ended December 31, 2006

1.00%


INFORMATION AND SERVICES

STATEMENT OF ADDITIONAL INFORMATION. This document includes additional information about the Fund's investment policies, risks, and operations. It is incorporated by reference into this prospectus (it is legally part of this prospectus).

ANNUAL AND SEMI-ANNUAL REPORTS. The Fund's Annual and Semi-Annual Reports provide additional information about the Fund's investments and performance. The Annual Report includes a discussion of market conditions and investment strategies that significantly affected the Fund's performance during its last fiscal year.

How to Request More Information

You can request the above documents, the notice explaining the Fund's privacy policy, and other information about the Fund, without charge, by:

Telephone:

Call OppenheimerFunds Services toll-free: 1.800.988.8287

Mail:

Use the following address for regular mail:
OppenheimerFunds Services
P.O. Box 5270
Denver, Colorado 80217-5270

Use the following address for courier or express mail:
OppenheimerFunds Services
12100 East Iliff Avenue
Suite 300
Aurora, Colorado 80014

Internet:

You can read or download the Fund's Statement of Additional Information, Annual and Semi-Annual Reports on the OppenheimerFunds website at: www.oppenheimerfunds.com


Information about the Fund including the Statement of Additional Information can be reviewed and copied at the SEC's Public Reference Room in Washington, D.C. Information on the operation of the Public Reference Room may be obtained by calling the SEC at 1.202.551.8090. Reports and other information about the Fund are available on the EDGAR database on the SEC's website at www.sec.gov. Copies may be obtained after payment of a duplicating fee by electronic request at the SEC's e-mail address: publicinfo@sec.gov or by writing to the SEC's Public Reference Section, Washington, D.C. 20549-1520.

No one has been authorized to provide any information about the Fund or to make any representations about the Fund other than what is contained in this prospectus. This prospectus is not an offer to sell shares of the Fund, nor a solicitation of an offer to buy shares of the Fund, to any person in any state or other jurisdiction where it is unlawful to make such an offer.


The Fund's SEC File No.: 811-04108
SP0297.001.0411


Oppenheimer
Money Fund/VA

  A series of Oppenheimer Variable Account Funds

Share Class:

    Non-Service Shares


Prospectus dated April 29, 2011

As with all mutual funds, the Securities and Exchange Commission has not approved or disapproved the Fund's securities nor has it determined that this prospectus is accurate or complete. It is a criminal offense to represent otherwise.

Oppenheimer Money Fund/VA is a money market mutual fund. Its goal is to seek the maximum current income from investments in money market securities that is consistent with low capital risk and maintenance of liquidity.

Shares of the Fund are sold only as an underlying investment for variable life insurance policies, variable annuity contracts and other insurance company separate accounts. A prospectus for the insurance product you have selected accompanies this prospectus and explains how to select shares of the Fund as an investment under that insurance product, and which share class or classes you are eligible to purchase.

This prospectus contains important information about the Fund's objective, investment policies, strategies and risks. Please read this prospectus (and your insurance product prospectus) carefully before you invest and keep them for future reference about your account.


Oppenheimer Money Fund/VA 


Table of contents

THE FUND SUMMARY

Investment Objective

3

Fees and Expenses of the Fund

3

Principal Investment Strategies

3

Principal Risks

3

The Fund's Past Performance

4

Investment Adviser

5

Portfolio Managers

5

Purchase and Sale of Fund Shares

5

Taxes

5

Payments to Broker-Dealers and Other Financial Intermediaries

5

MORE ABOUT THE FUND

About the Fund's Investments

6

How the Fund is Managed

7

MORE ABOUT YOUR INVESTMENT

How to Buy and Sell Shares

9

Dividends, Capital Gains and Taxes

11

Financial Highlights

13


To Summary Prospectus

THE FUND SUMMARY

Investment Objective. The Fund seeks maximum current income from investments in "money market" securities consistent with low capital risk and the maintenance of liquidity. The Fund is a money market fund.

Fees and Expenses of the Fund. This table describes the fees and expenses that you may pay if you buy and hold or redeem shares of the Fund. The accompanying prospectus of the participating insurance company provides information on initial or contingent deferred sales charges, exchange fees or redemption fees for that variable life insurance policy, variable annuity or other investment product. The fees and expenses of those products are not charged by the Fund and are not reflected in this table. Expenses would be higher if those fees were included.

Shareholder Fees (fees paid directly from your investment)

Non-Service Shares

Maximum Sales Charge (Load) imposed on purchases (as % of offering price)

None

Maximum Deferred Sales Charge (Load) (as % of the lower of original offering price or redemption proceeds)

None


Annual Fund Operating Expenses (expenses you pay each year as a percentage of the value of your investment)

Management Fees

0.45%

Distribution and/or Service (12b-1) Fees

None

Other Expenses

0.16%

Total Annual Fund Operating Expenses

0.61%

     Fee Waiver and Expense Reimbursement *

(0.26%)

Total Annual Fund Operating Expenses after Fee Waiver and Expense Reimbursement

0.35%


*The Manager has voluntarily agreed to limit the Fund's total annual operating expenses so that those expenses, as a percentage of daily net assets, will not exceed the annual rate of 0.50%. The Manager has also voluntarily agreed to waive fees and/or reimburse expenses to the extent necessary to assist the Fund in attempting to maintain a positive yield. There is no guarantee that the Fund will maintain a positive yield. The voluntary expense limitation and voluntary fee waiver and/or reimbursement may not be amended or withdrawn until one year after the date of this prospectus.


Example. The following example is intended to help you compare the cost of investing in the Fund with the cost of investing in other mutual funds. The example assumes that you invest $10,000 in shares of the Fund for the time periods indicated and reinvest your dividends and distributions. The expenses for your variable life insurance policy, variable annuity or other investment product are not included and if they were included, overall expenses would be higher. The example also assumes that your investment has a 5% return each year and that the Fund's operating expenses remain the same. Although your actual costs may be higher or lower, based on these assumptions your expenses would be as follows, whether or not you redeemed your shares:

Non-Service Shares $ 36 $ 170 $ 315 $ 739


Principal Investment Strategies. The Fund is a money market fund that invests in a variety of money market instruments to seek current income. Money market instruments are short-term, high-quality, dollar-denominated debt instruments issued by the U.S. Government, domestic and foreign corporations and financial institutions, and other entities. Money market instruments include bank obligations, repurchase agreements, commercial paper, and other short-term corporate and governmental debt obligations.

To be considered "high-quality," a debt instrument must be rated in one of the two highest credit-quality categories for short-term securities by a nationally-recognized rating service or, if a security is unrated, it must be determined by the Fund's investment manager, OppenheimerFunds, Inc. (the "Manager"), under the supervision of the Fund's Board, to be of comparable quality to rated securities in one of those two categories.

Principal Risks.  All investments carry risks to some degree. The Fund's investments are subject to changes in their value from a number of factors. However, the Fund's investments must meet strict standards set by its Board of Trustees and special rules under Federal law for money market funds. Those requirements include maintaining high credit quality, a short average maturity and diversification of the Fund's investments among issuers. Those provisions are designed to help minimize credit risks, to reduce the effects of changes in prevailing interest rates and to reduce the effect on the Fund's portfolio of a default by any one issuer. Since income on short-term securities tends to be lower than income on longer-term debt securities, the Fund's yield will likely be lower than the yield on longer-term fixed-income funds.

Even so, there are risks that an issuer of an obligation that the Fund holds might have its credit rating downgraded or might default on its obligations, or that interest rates might rise sharply, causing the value of the Fund's investments to fall. Also, there is the risk that the value of your investment could be eroded over time by the effects of inflation, or that poor security selection could cause the Fund to underperform other funds that have a similar objective. If there is an unexpectedly high demand for the redemption of Fund shares, the Fund might need to sell portfolio securities prior to their maturity, possibly at a loss. As a result, there is a risk that the Fund's shares could fall below $1.00 per share.

Interest Rate Risk. The values of debt securities usually change when prevailing interest rates change. When interest rates fall, the values of already-issued debt securities generally rise. When interest rates rise, the values of already-issued debt securities generally fall. The values of longer-term debt securities usually change more when interest rates change than the values of shorter-term debt securities.

Credit Risk. Debt securities are also subject to credit risk, which is the risk that the issuer of a security might not make principal or interest payments on the security when they are due. If the issuer fails to pay interest, the Fund's income might be reduced, and if the issuer fails to pay interest or repay principal, the value of the security might fall.

Fixed-Income Market Risks . Economic and other market developments can adversely affect fixed-income securities markets in the United States, Europe and elsewhere. At times, participants in debt securities markets may develop concerns about the ability of certain issuers of debt securities to make timely principal and interest payments, or they may develop concerns about the ability of financial institutions that make markets in certain debt securities to facilitate an orderly market. Those concerns can cause increased volatility in those debt securities or debt securities markets. Under some circumstances, as was the case during the latter half of 2008 and early 2009, those concerns could cause reduced liquidity in certain debt securities markets. A lack of liquidity or other adverse credit market conditions may hamper the Fund's ability to sell the debt securities in which it invests or to find and purchase suitable debt instruments.

Main Risks of Foreign Investing. Although the risks of investing in foreign money market securities are significantly lower than the risks of certain other types of foreign securities, to the extent that the Fund invests in foreign securities, those investments may be subject to special risks. Foreign issuers are usually not subject to the same accounting and disclosure requirements that U.S. companies are subject to, which may make it difficult for the Fund to evaluate a foreign company's operations or financial condition. The value of foreign investments may be affected by exchange control regulations, foreign taxes, higher transaction and other costs, delays in the settlement of transactions, changes in economic or monetary policy in the United States or abroad, expropriation or nationalization of a company's assets, or other political and economic factors.

The rate of the Fund's income will vary from day to day, generally reflecting changes in short-term interest rates and in the fixed-income securities market. There is no assurance that the Fund will achieve its investment objective.

Who Is the Fund Designed For? The Fund's shares are available only as an investment option under certain variable annuity contracts, variable life insurance policies and investment plans offered through insurance company separate accounts of participating insurance companies. The Fund is designed for investors who want to earn income at money market rates while maintaining easy access to their investment and seeking to preserve its value. The Fund will invest in a variety of money market instruments to seek current income and stability of principal and to try to maintain a stable share price of $1.00. Since income on short-term securities tends to be lower than income on longer term debt securities, the Fund's yield will likely be lower than the yield on longer-term fixed income funds. The Fund does not invest for the purpose of seeking capital appreciation or gains and is not a complete investment program.

An investment in the Fund is not a deposit of any bank and is not insured or guaranteed by the Federal Deposit Insurance Corporation or any other government agency. Although the Fund seeks to preserve the value of your investment at $1.00 per share, it is possible to lose money by investing in the Fund.


The Fund's Past Performance.  The bar chart and table below provide some indication of the risks of investing in the Fund by showing changes in the Fund's performance from year to year. Charges imposed by the insurance accounts that invest in the Fund are not included and the returns would be lower if they were. The Fund's past investment performance is not necessarily an indication of how the Fund will perform in the future. More recent performance information is available by calling the toll-free number on the back of this prospectus and on the Fund's website at: https://www.oppenheimerfunds.com/fund/investors/overview/MoneyFundVA


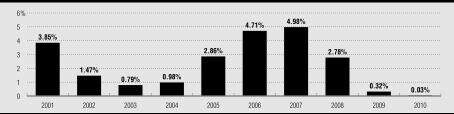
During the period shown, the highest return before taxes for a calendar quarter was 1.37% (1qtr01) and the lowest return before taxes for a calendar quarter was 0.0% (4qtr09 and 4qtr10).


The following table shows the average annual total returns for the Fund's shares.

Average Annual Total Returns for the periods ended
December 31, 2010

1 Year

5 Years

10 Years

Non-Service Shares (inception 4-3-85)

0.03%


2.54%


2.26%


The average annual total returns measure the performance of a hypothetical account, without deducting charges imposed by the separate accounts that invest in the Fund, and assume that all dividends and capital gains distributions have been reinvested in additional shares.
The Fund's total returns should not be expected to be the same as the returns of other Oppenheimer funds, even if both funds have the same portfolio managers and/or similar names.


The total returns are not the Fund's current yield. The Fund's yield more closely reflects the Fund's current earnings. To obtain the Fund's current 7-day yield information, please call the Transfer Agent toll-free at 1.800.CALL OPP (225.5677).

Investment Adviser. OppenheimerFunds, Inc. is the Fund's investment adviser (the "Manager").


Portfolio Managers.
Carol E. Wolf has been a portfolio manager and Vice President of the Fund since July 1998, and Christopher Proctor, CFA, has been a portfolio manager of the Fund since May 2010.

Purchase and Sale of Fund Shares. Shares of the Fund may be purchased only by separate investment accounts of participating insurance companies as an underlying investment for variable life insurance policies, variable annuity contracts or other investment products. Individual investors cannot buy shares of the Fund directly. You may only submit instructions for buying or selling shares of the Fund to your insurance company or its servicing agent, not directly to the Fund or its Transfer Agent. The accompanying prospectus of the participating insurance company provides information about how to select the Fund as an investment option.

Taxes. Because shares of the Fund may be purchased only through insurance company separate accounts for variable annuity contracts, variable life insurance policies or other investment products, any dividends and capital gains distributions will be taxable to the participating insurance company, if at all. However, those payments may affect the tax basis of certain types of distributions from those accounts. Special tax rules apply to life insurance companies, variable annuity contracts and variable life insurance contracts. For information on federal income taxation of a life insurance company with respect to its receipt of distributions from the Fund and federal income taxation of owners of variable annuity or variable life insurance contracts, see the accompanying prospectus for the applicable contract.

Payments to Broker-Dealers and Other Financial Intermediaries. The Fund, the Manager, or their related companies may make payments to financial intermediaries, including to insurance companies that offer shares of the Fund as an investment option. These payments for the sale of Fund shares and related services may create a conflict of interest by influencing the intermediary and your salesperson to recommend the Fund over another investment. Ask your salesperson or visit your financial intermediary's website for more information.

MORE ABOUT THE FUND

About the Fund's Investments

The allocation of the Fund's portfolio among different types of investments will vary over time and the Fund's portfolio might not always include all of the different types of investments described below. The Statement of Additional Information contains more detailed information about the Fund's investment policies and risks.

THE FUND'S PRINCIPAL INVESTMENT STRATEGIES AND RISKS. The following strategies and types of investments are the ones that the Fund considers to be the most important in seeking to achieve its investment objective and the following risks are those the Fund expects its portfolio to be subject to as a whole.

MONEY MARKET INSTRUMENTS. The Fund invests in securities meeting the quality, maturity, diversification and other standards that apply to money market funds under the Investment Company Act of 1940, as amended (the "Investment Company Act"). Money market instruments are high-quality, short-term, dollar-denominated debt instruments. They may have fixed, variable or floating interest rates. All of the Fund's money market investments must meet the requirements of the Investment Company Act and the special standards set by the Fund's Board. The following is a brief description of the types of money market instruments the Fund may invest in.

  • U.S. Government Securities. These include obligations issued or guaranteed by the U.S. Government or any of its agencies or instrumentalities. Some are direct obligations of the U.S. Treasury and are supported by the full faith and credit of the United States. Securities issued by some agencies and instrumentalities of the Government are also supported by the full faith and credit of the U.S. Government. Securities issued by certain other U.S. Government agencies or instrumentalities are supported only by the right of the issuer to borrow from the U.S. Treasury and some are supported only by the credit of the particular instrumentality.
  • Bank Obligations. The Fund can buy bank obligations including time deposits, certificates of deposit and bankers' acceptances, including dollar-denominated obligations of foreign banks, U.S. branches of foreign banks or foreign branches of U.S. banks. These obligations must be denominated in U.S. dollars, even if issued by a foreign bank or branch.
  • Obligations of Foreign Banks and Foreign Branches of U.S. Banks. These securities have investment risks different from obligations of domestic branches of U.S. banks. Risks that may affect a foreign bank's or branch's ability to pay its debt include:
    • political and economic developments in the country in which the bank orbranch is located,
    • imposition of withholding taxes on interest income payable on the securities,
    • seizure or nationalization of foreign deposits,
    • the establishment of exchange control regulations, or
    • the adoption of other governmental restrictions that might affect the payment of principal and interest on those securities.

Additionally, not all of the U.S. and state banking laws and regulations that apply to domestic banks and branches apply to foreign branches of U.S. banks. Those U.S. and state regulations also generally do not apply to foreign banks.


  • Commercial Paper. Commercial paper is a short-term, unsecured promissory note of a domestic or foreign company or other financial firm. The Fund may buy commercial paper.
  • Corporate Debt Obligations. The Fund can invest in other short-term corporate debt obligations, besides commercial paper.
  • Floating Rate and Variable Rate Notes. The Fund can purchase notes with floating or variable interest rates. Variable interest rates are adjustable at stated periodic intervals. Floating interest rates are adjusted automatically according to a specified market rate or benchmark, such as the prime rate of a bank. If the maturity of a note is greater than 397 days, it may be purchased only if it has a demand feature. That feature must permit the Fund to recover the principal amount of the note on not more than thirty days' notice at any time, or at specified times not exceeding 397 days from purchase.
  • Asset-Backed Securities. The Fund can invest in asset-backed investments. These are fractional interests in pools of consumer loans and other trade receivables, which are the obligations of a number of different parties. The income from the underlying pool is passed through to investors, such as the Fund. These investments might be supported by a credit enhancement, such as a letter of credit, a guarantee or a preference right. However, the credit enhancement typically applies only to a fraction of the security's value. If the issuer of the security has no security interest in the related collateral, there is the risk that the Fund could lose money if the issuer defaults.
  • Guaranteed Obligations. The Fund may invest in obligations other than those listed above if they are guaranteed as to their principal and interest by a corporation whose commercial paper may be purchased by the Fund or by a domestic bank. The bank must meet credit criteria set by the Fund's Board.
  • Other Money Market Instruments. The Fund may also buy other money market instruments that its Board approves from time to time. They must be U.S. dollar-denominated short-term investments that the Manager must determine to have minimal credit risks.

CREDIT QUALITY, MATURITY AND DIVERSIFICATION STANDARDS. The Fund's investments must meet standards set by the Board and the standards prescribed for money market funds under the Investment Company Act.

     Credit Quality. In general, the Fund buys only "high-quality" investments that the Manager believes present minimal credit risk at the time of purchase. Those investments must be:

  • rated in one of the two highest short-term rating categories by two nationally-recognized rating organizations, or
  • if only one rating organization has rated the investment, rated in one of that rating organization's two highest rating categories, or
  • unrated investments that the Manager, subject to the supervision of the Fund's Board, determines are comparable in quality to instruments rated in the two highest rating categories. The Manager may consider certain guarantees, letters of credit or other credit enhancements when making this determination.

Instruments rated in the second highest rating category may not represent more than 3% of the Fund's total assets.

     Maturity. A security's maturity must not exceed 397 days (13 months) at the time of purchase, unless if they are subject to repurchase agreements or demand features that permit the Fund to recover the principal amount of the security on not more than thirty days' notice at any time, or at specified times not exceeding 397 days from purchase. The Fund will maintain a dollar-weighted average portfolio maturity of not more than 60 days and a weighted average life to maturity of portfolio securities of not more than 120 days.

     Diversification. The Fund generally may not invest more than 5% of its total assets in the securities of any one issuer in the highest short-term credit rating category or more than one half of one percent of its total assets in the securities of any one issuer in the second highest short-term credit rating category. This limitation does not apply to securities issued by the U.S. government or its agencies or instrumentalities.

     Liquidity. The Fund will maintain at least 10% of its net assets measured on a daily basis, and 30% of its net assets measured on a weekly basis, in cash or securities that can be sold and settled for cash within either one business day or five business days, respectively.


OTHER INVESTMENT STRATEGIES AND RISKS. The Fund can also use the investment techniques and strategies described below. The Fund might not use all of these techniques or strategies or might only use them from time to time.

REPURCHASE AGREEMENTS.  The Fund may also enter into repurchase agreements. In a repurchase transaction, the Fund buys a security and simultaneously sells it back to the vendor for delivery at a future date. Repurchase agreements must be fully collateralized. However, if the seller fails to pay the repurchase price on the delivery date, the Fund may incur costs in disposing of the collateral and may experience losses if there is any delay in its ability to do so. If the default on the part of the seller is due to its bankruptcy, the Fund's ability to liquidate the collateral may be delayed or limited.

     The Fund will not enter into a repurchase agreement that will cause more than 5% of its total assets to be subject to repurchase agreements maturing in more than 7 days. There is no limit on the amount of the Fund's assets that may be subject to repurchase agreements of 7 days or less.

Illiquid and Restricted Securities. Investments that do not have an active trading market, or that have legal or contractual limitations on their resale, are generally referred to as "illiquid" securities. Illiquid securities may be difficult to value or to sell promptly at an acceptable price or may require registration under applicable securities laws before they can be sold publicly. Securities that have limitations on their resale are referred to as "restricted securities." Certain restricted securities that are eligible for resale to qualified institutional purchasers may not be regarded as illiquid.

     The Fund will not invest more than 5% of its total assets in illiquid or restricted securities. The Manager monitors the Fund's holdings of illiquid securities on an ongoing basis to determine whether to sell any of those securities to maintain adequate liquidity.

Conflicts of Interest. The investment activities of the Manager and its affiliates in regard to other funds and accounts they manage may present conflicts of interest that could disadvantage the Fund and its shareholders. The Manager or its affiliates may provide investment advisory services to other funds and accounts that have investment objectives or strategies that differ from, or are contrary to, those of the Fund. That may result in another fund or account holding investment positions that are adverse to the Fund's investment strategies or activities. Other funds or accounts advised by the Manager or its affiliates may have conflicting interests arising from investment objectives that are similar to those of the Fund. Those funds and accounts may engage in, and compete for, the same types of securities or other investments as the Fund or invest in securities of the same issuers that have different, and possibly conflicting, characteristics. The trading and other investment activities of those other funds or accounts may be carried out without regard to the investment activities of the Fund and, as a result, the value of securities held by the Fund or the Fund's investment strategies may be adversely affected. The Fund's investment performance will usually differ from the performance of other accounts advised by the Manager or its affiliates and the Fund may experience losses during periods in which other accounts advised by the Manager or its affiliates achieve gains. The Manager has adopted policies and procedures designed to address potential conflicts of interest identified by the Manager; however, such policies and procedures may also limit the Fund's investment activities and affect its performance.

     The Fund offers its shares to separate accounts of different insurance companies, as an investment for their variable annuity contracts, variable life insurance policies and other investment products. While the Fund does not foresee any disadvantages to contract owners from these arrangements, it is possible that the interests of owners of different contracts participating in the Fund through different separate accounts might conflict. For example, a conflict could arise because of differences in tax treatment.

CHANGES TO THE FUND'S INVESTMENT POLICIES. The Fund's fundamental investment policies cannot be changed without the approval of a majority of the Fund's outstanding voting shares; however, the Fund's Board can change non-fundamental policies without a shareholder vote. Significant policy changes will be described in supplements to this prospectus. The Fund's investment objective is a fundamental policy. Other investment restrictions that are fundamental policies are listed in the Fund's Statement of Additional Information. An investment policy is not fundamental unless this prospectus or the Statement of Additional Information states that it is.

PORTFOLIO HOLDINGS

The Fund's portfolio holdings, as of the most recent prior close of the New York Stock Exchange (the "NYSE"), are posted on the Fund's website at www.oppenheimerfunds.com on each business day. Therefore, the Fund's portfolio holdings are made publicly available no later than one business day after the close of trading on the NYSE on each day on which the NYSE is open.

A description of the Fund's policies and procedures with respect to the disclosure of its portfolio holdings is available in the Fund's Statement of Additional Information.

How the Fund is Managed

THE MANAGER. OppenheimerFunds, Inc., the Manager, chooses the Fund's investments and handles its day-to-day business. The Manager carries out its duties, subject to the policies established by the Fund's Board of Trustees, under an investment advisory agreement that states the Manager's responsibilities. The agreement sets the fees the Fund pays to the Manager and describes the expenses that the Fund is responsible to pay to conduct its business.

The Manager has been an investment adviser since 1960. The Manager is located at Two World Financial Center, 225 Liberty Street, 11th Floor, New York, New York 10281-1008.

Advisory Fees. Under the investment advisory agreement, the Fund pays the Manager an advisory fee at an annual rate that declines on additional assets as the Fund grows: the Fund pays 0.450% of the first $500 million of average annual net assets, 0.425% of the next $500 million, 0.400% of the next $500 million, and 0.375% of average annual net assets in excess of $1.5 billion. The Fund's management fee for its fiscal year ended December 31, 2010, was 0.45% of the Fund's average annual net assets.

The Manager has voluntarily agreed to limit the Fund's total annual operating expenses so that those expenses, as a percentage of daily net assets, will not exceed the annual rate of 0.50%. The Manager has also voluntarily agreed to waive fees and/or reimburse expenses to the extent necessary to assist the Fund in attempting to maintain a positive yield. There is no guarantee that the Fund will maintain a positive yield. The voluntary expense limitation and voluntary fee waiver and/or expense reimbursement may not be amended or withdrawn until one year after the date of this prospectus.  The Fund's management fee and other annual fund operating expenses may vary in future years.

A discussion regarding the basis for the Board of Trustees' approval of the Fund's investment advisory contract is available in the Fund's Annual Report to shareholders for the year ended December 31, 2010.

Portfolio Managers. The Fund's portfolio is managed by Carol E. Wolf, and Christopher Proctor, CFA, who are primarily responsible for the day-to-day management of the Fund's investments. Ms. Wolf has been a portfolio manager of the Fund since July 1998. Mr. Proctor has been a portfolio manager of the Fund since May 2010.

     Ms. Wolf has been a Senior Vice President of the Manager since September 2000 and of HarbourView Asset Management Corporation since June 2003. She was Vice President of the Manager from June 1990 through June 2000. Ms. Wolf is an officer and portfolio manager of other funds for which the Manager or an affiliate serves as investment adviser.

     Mr. Proctor has been a Vice President of the Manager since August 2008. Prior to joining the Manager, Mr. Proctor was a Vice President at Calamos Asset Management from January 2007 through March 2008 and Scudder-Kemper Investments from 1999 through 2002. Mr. Proctor was a Managing Director and Co-Founder of Elmhurst Capital Management through January 2007 and was a Senior Manager of Research for Etrade Global Asset Management from 2002 through 2004. Mr. Proctor is an officer and portfolio manager of other funds for which the Manager or an affiliate serves as investment adviser.

     The Statement of Additional Information provides additional information about the portfolio managers' compensation, other accounts they manage and their ownership of Fund shares.

MORE ABOUT YOUR INVESTMENT

How to Buy and Sell Shares

You may only submit instructions for buying or selling shares of the Fund to your insurance company or its servicing agent, not directly to the Fund or its Transfer Agent. Information about your investment in the Fund can only be obtained from your participating insurance company or its servicing agent. The Fund's Transfer Agent does not hold or have access to those records.

WHAT CLASSES OF SHARES DOES THE FUND OFFER?  The Fund currently offers only one class of shares. That class of shares has no class "name" designation, but is referred to in this prospectus as "Non-Service" shares. The Fund has three additional classes of shares authorized which are not currently offered for sale. There are no outstanding shares of any of those share classes.

THE PRICE OF FUND SHARES. Fund shares are sold to participating insurance companies, and are redeemed, at their net asset value per share. The net asset value per share will normally remain fixed at $1.00 per share. However, there is no guarantee that the Fund will maintain a stable net asset value of $1.00 per share. Shares are also redeemed at their net asset value per share. The net asset value that applies to a purchase or redemption order is the next one calculated after the insurance company (as the Fund's designated agent to receive purchase orders) receives the order from its contract owner, in proper form. The Fund's Transfer Agent generally must receive the purchase or redemption order from the insurance company by 9:30 a.m. Eastern Time on the next regular business day.

The Fund does not impose any sales charge on purchases of its shares. If there are any charges imposed under the variable annuity, variable life or other contract through which Fund shares are purchased, they are described in the accompanying prospectus of the participating insurance company. The participating insurance company's prospectus may also include information regarding the time you must submit your purchase and redemption orders.

Net Asset Value. The Fund calculates the net asset value per share as of the close of the New York Stock Exchange (NYSE), on each day the NYSE is open for trading (referred to in this prospectus as a "regular business day"). The NYSE normally closes at 4:00 p.m., Eastern time, but may close earlier on some days.

Under a policy adopted by the Fund's Board of Trustees, the Fund uses the amortized cost method to value its securities to determine net asset value, subject to the Board's review. A security's valuation may differ depending on the method used for determining value.

The net asset value per share is determined by dividing the Fund's net assets by the number of outstanding shares.

Foreign Securities. Because some foreign securities trade in markets and on exchanges that operate on weekends and U.S. holidays, the values of some of the Fund's foreign investments may change on days when investors cannot buy or redeem Fund shares.

HOW CAN YOU BUY FUND SHARES? Shares of the Fund may be purchased only by separate investment accounts of participating insurance companies as an underlying investment for variable life insurance policies, variable annuity contracts or other investment products. Individual investors cannot buy shares of the Fund directly. Please refer to the accompanying prospectus of the participating insurance company for information on how to select the Fund as an investment option. That prospectus will indicate which share class you may be eligible to purchase.

Suspension of Share Offering. The offering of Fund shares may be suspended during any period in which the determination of net asset value is suspended, and may be suspended by the Board at any time the Board believes it is in the Fund's best interest to do so.

HOW CAN YOU REDEEM FUND SHARES? Only the participating insurance companies that hold Fund shares in their separate accounts can place orders to redeem shares. Contract holders and policy holders should not directly contact the Fund or its transfer agent to request a redemption of Fund shares. The Fund normally sends payment by Federal Funds wire to the insurance company's account on the next business day after the Fund receives the order (and no later than seven days after the Fund's receipt of the order). Under unusual circumstances determined by the Securities and Exchange Commission, payment may be delayed or suspended. Redemption of Fund shares may be suspended by the Board if it determines that it is in the best interest of shareholders to liquidate the Fund. Contract owners should refer to the withdrawal or surrender instructions in the accompanying prospectus of the participating insurance company.

Limitations on Frequent Transactions

Frequent purchases and redemptions of Fund shares may interfere with the Manager's ability to manage the Fund's investments efficiently, may increase its transaction and administrative costs and may affect its performance, depending on various factors, such as the size of the Fund, the nature of its investments, the amount of Fund assets the portfolio manager maintains in cash or cash equivalents, and the aggregate dollar amount, the number and the frequency of trades.

If large dollar amounts are involved in frequent redemption transactions, the Fund might be required to sell portfolio securities at unfavorable times to meet those transaction requests, and the Fund's brokerage or administrative expenses might be increased. Therefore, the Manager and the Fund's Board have adopted the following policies and procedures to detect and prevent frequent and/or excessive purchase and redemption activity, while addressing the needs of investors who seek liquidity in their investment. There is no guarantee that those policies and procedures, described below, will be sufficient to identify and deter all excessive short-term trading. If the Transfer Agent is not able to detect and curtail such activity, frequent trading could occur in the Fund.

Policies on Disruptive Activity.  The Transfer Agent and the Distributor, on behalf of the Fund, have entered into agreements with participating insurance companies designed to detect and restrict excessive short-term trading activity by contract or policy owners or their financial advisers in their accounts. The Transfer Agent generally does not consider periodic asset allocation or re-balancing that affects a portion of the Fund shares held in the account of a policy or contract owner to be "excessive trading." However, the Transfer Agent has advised participating insurance companies that it generally considers certain other types of trading activity to be "excessive," such as making a "transfer" out of the Fund within 30 days after buying Fund shares (by the sale of the recently purchased Fund shares and the purchase of shares of another fund) or making more than six "round-trip transfers" between funds during one year. The agreements require participating insurance companies to provide transaction information to the Fund and to execute Fund instructions to restrict trading in Fund shares.

 A participating insurance company may also have its own policies and procedures and may impose its own restrictions or limitations to discourage short-term and/or excessive trading by its policy or contract owners. Those policies and procedures may be different from the Fund's in certain respects. You should refer to the prospectus for your insurance company variable annuity contract for specific information about the insurance company's policies. Under certain circumstances, policy or contract owners may be required to transmit purchase or redemption orders only by first class U.S. mail.

Monitoring the Policies. The Fund's policies and procedures for detecting and deterring frequent or excessive trading are administered by the Fund's Transfer Agent. However, the Transfer Agent presently does not have the ability to directly monitor trading activity in the accounts of policy or contract owners within the participating insurance companies' accounts. The Transfer Agent's ability to monitor and deter excessive short-term trading in such insurance company accounts ultimately depends on the capability and diligence of each participating insurance company, under their agreements with the Transfer Agent, the Distributor and the Fund, in monitoring and controlling the trading activity of the policy or contract owners in the insurance company's accounts.

The Transfer Agent will attempt to monitor the net effect on the Fund's assets from the purchase and redemption activity in the accounts of participating insurance companies and will seek to identify patterns that may suggest excessive trading by the contract or policy owners who invest in the insurance company's accounts. If the Transfer Agent believes it has observed evidence of possible excessive trading activity, it will ask the participating insurance companies or other registered owners to provide information about the transaction activity of the contract or policy holders in their respective accounts, and to take appropriate action. In that case, the insurance company must confirm to the Transfer Agent that appropriate action has been taken to curtail the excessive trading activity.

The Transfer Agent will, subject to the limitations described in this section, limit or terminate the trading activity of any person, group or account that it believes would be excessive or disruptive. However, the Transfer Agent may not be able to detect or curtail all such trading activity in the Fund. The Transfer Agent will evaluate trading activity on a case by case basis and the limitations placed on trading may vary between accounts.

Right to Refuse Purchase Orders. The Fund's Distributor or Transfer Agent may, in their discretion, refuse any purchase order and are not obligated to provide notice before rejecting an order.  

DISTRIBUTION AND SERVICE (12b-1) PLANS

Distribution and Service Plan. The Fund has not adopted a Distribution and Service Plan for the Non-Service shares offered in this prospectus.

PAYMENTS TO FINANCIAL INTERMEDIARIES AND SERVICE PROVIDERS. The Manager and the Distributor, in their discretion, may also make payments for distribution and/or shareholder servicing activities to brokers, dealers and other financial intermediaries, including the insurance companies that offer the Fund as an investment option, or to service providers. Those payments are made out of the Manager's and/or the Distributor's own resources and/or assets, including from the revenues or profits derived from the advisory fees the Manager receives from the Fund. Those cash payments, which may be substantial, are paid to many firms having business relationships with the Manager and Distributor and are in addition to any distribution fees, servicing fees, or transfer agency fees paid directly or indirectly by the Fund to those entities. Payments by the Manager or Distributor from their own resources are not reflected in the tables in the "Fees and Expenses of the Fund" section of this prospectus because they are not paid by the Fund.

The financial intermediaries that may receive those payments include firms that offer and sell Fund shares to their clients, or provide shareholder services to the Fund, or both, and receive compensation for those activities. The financial intermediaries that may receive payments include securities brokers, dealers, financial advisers, insurance companies that offer variable annuity or variable life insurance products and other intermediaries.

In general, these payments to financial intermediaries can be categorized as "distribution-related" or "servicing" payments. Payments for distribution-related expenses, such as marketing or promotional expenses, are often referred to as "revenue sharing." Revenue sharing payments may be made on the basis of the sales of shares attributable to that intermediary, the average net assets of the Fund and other Oppenheimer funds attributable to the accounts of that intermediary and its clients, negotiated lump sum payments for distribution services provided, or similar fees. In some circumstances, revenue sharing payments may create an incentive for a financial intermediary or its representatives to recommend or offer shares of the Fund or other Oppenheimer funds to its customers. These payments also may give an intermediary an incentive to cooperate with the Distributor's marketing efforts. A revenue sharing payment may, for example, qualify the Fund for preferred status with the intermediary receiving the payment or provide representatives of the Distributor with access to representatives of the intermediary's sales force, in some cases on a preferential basis over funds of competitors. Additionally, as firm support, the Manager or Distributor may reimburse expenses related to educational seminars and "due diligence" or training meetings (to the extent permitted by applicable laws or the rules of the Financial Industry Regulatory Authority ("FINRA")) designed to increase sales representatives' awareness about Oppenheimer funds, including travel and lodging expenditures. However, the Manager does not consider a financial intermediary's sale of shares of the Fund or other Oppenheimer funds when selecting brokers or dealers to effect portfolio transactions for the funds.

Various factors are used to determine whether to make revenue sharing payments. Possible considerations include, without limitation, the types of services provided by the intermediary, sales of Fund shares, the redemption rates on accounts of clients of the intermediary or overall asset levels of Oppenheimer funds held for or by clients of the intermediary, the willingness of the intermediary to allow the Distributor to provide educational and training support for the intermediary's sales personnel relating to the Oppenheimer funds, the availability of the Oppenheimer funds on the intermediary's sales system, as well as the overall quality of the services provided by the intermediary and the Manager or Distributor's relationship with the intermediary. The Manager and Distributor have adopted guidelines for assessing and implementing each prospective revenue sharing arrangement. To the extent that financial intermediaries receiving distribution-related payments from the Manager or Distributor sell more shares of the Oppenheimer funds or retain more shares of the funds in their client accounts, the Manager and Distributor benefit from the incremental management and other fees they receive with respect to those assets.

Payments may also be made by the Manager, the Distributor or the Transfer Agent to financial intermediaries to compensate or reimburse them for administrative or other client services provided such as sub-transfer agency services for shareholders, omnibus accounting or sub-accounting, participation in networking arrangements, account set-up, recordkeeping and other shareholder services. Payments may also be made for administrative services related to the distribution of Fund shares through the intermediary. Firms that may receive servicing fees include insurance companies that offer variable annuity or variable life insurance products and others. These fees may be used by the service provider to offset or reduce fees that would otherwise be paid directly to them by certain account holders. The Statement of Additional Information contains more information about revenue sharing and service payments made by the Manager or the Distributor. Your broker, dealer or other financial intermediary may charge you fees or commissions in addition to those disclosed in this prospectus. You should ask your financial intermediary for details about any such payments it receives from the Manager or the Distributor and their affiliates, or any other fees or expenses it charges.

Dividends, Capital Gains and Taxes

DIVIDENDS AND DISTRIBUTIONS. The Fund intends to declare dividends from net investment income each regular business day and to pay those dividends monthly. To maintain a net asset value of $1.00 per share, the Fund might withhold dividends or make distributions from capital or capital gains. Daily dividends will not be declared or paid on newly purchased shares until Federal Funds are available to the Fund from the purchase payment for such shares.

The Fund normally holds its securities to maturity and therefore will not usually pay capital gains distributions. The Fund may realize capital gains on the sale of portfolio securities, however, in which case it may make distributions out of any net short-term or long-term capital gains annually. The Fund may also make supplemental distributions of dividends and capital gains following the end of its fiscal year. The Fund has no fixed dividend rate and cannot guarantee that it will pay any dividends or capital gains distributions in a particular year.

Receiving Dividends and Distributions. Any dividends and capital gains distributions will be automatically reinvested in additional Fund shares for the account of the participating insurance company, unless the insurance company elects to have dividends or distributions paid in cash.

TAXES. For a discussion of the tax status of a variable annuity contract, a variable life insurance policy or other investment product of a participating insurance company, please refer to the accompanying variable contract prospectus of your participating insurance company. Because shares of the Fund may be purchased only through insurance company separate accounts for variable annuity contracts, variable life insurance policies or other investment products, any dividends from net investment income and distributions of net realized short-term and long-term capital gains will be taxable, if at all, to the participating insurance company. However, those payments may affect the tax basis of certain types of distributions from those accounts.

The Fund has qualified and intends to qualify each year to be taxed as a regulated investment company under the Internal Revenue Code by satisfying certain income, asset diversification and income distribution requirements, but reserves the right not to so qualify. In each year that it qualifies as a regulated investment company, the Fund will not be subject to federal income taxes on its income that it distributes to shareholders.

This information is only a summary of certain Federal income tax information about your investment. You are encouraged to consult your tax adviser about the effect of an investment in the Fund on your particular tax situation and about any changes to the Internal Revenue Code that may occur from time to time. Additional information about the tax effects of investing in the Fund is contained in the Statement of Additional Information.

Financial Highlights

The Financial Highlights Table is presented to help you understand the Fund's financial performance for the past five fiscal years. Certain information reflects financial results for a single Fund share. The total returns in the table represent the rate that an investor would have earned (or lost) on an investment in the Fund (assuming reinvestment of all dividends and distributions). This information has been audited by KPMG LLP, the Fund's independent registered public accounting firm for the fiscal years ended December 31, 2010 and 2009. The financial highlights for the prior years were audited by another independent registered public accounting firm. KPMG's report, along with the Fund's financial statements, are included in the Statement of Additional Information, which is available upon request.

Financial Highlights Table

FINANCIAL HIGHLIGHTS

Year Ended December 31,

2010


2009


2008


2007


2006


Per Share Operating Data


Net asset value, beginning of period

$1.00


$1.00


$1.00


$1.00


$1.00


Income from investment operations-net investment income and net realized gain1

-- 2


-- 2


.03


.05


.05


Dividends and/or distributions to shareholders:


Dividends from net investment income

-- 2


-- 2


(.03)


(.05)


(.05)


Distributions from net realized gain

--


--


--


-- 2


-- 2


Total dividends and/or distributions to shareholders

-- 2


-- 2


(.03)


(.05)


(.05)


Net asset value, end of period

$1.00


$1.00


$1.00


$1.00


$1.00


Total Return3

0.03%


0.32%


2.78%


4.98%


4.71%


Ratios/Supplemental Data


Net assets, end of period (in thousands)

$149,697


$180,955


$243,356


$189,749


$171,521


Average net assets (in thousands)

$164,258


$218,079


$212,564


$181,271


$171,118


Ratios to average net assets:4


Net investment income

0.01%


0.35%


2.72%


4.86%


4.61%


Total expenses

0.61%


0.57%


0.50%


0.50%


0.49%


Expenses after payments, waivers and/or reimbursements and reduction to custodian expenses

0.35%


0.48%


0.50%


0.50%


0.49%


1. Per share amounts calculated based on the average shares outstanding during the period.

2. Less than $0.005 per share.

3. Assumes an initial investment on the business day before the first day of the fiscal period, with all dividends and distributions reinvested in additional shares on the reinvestment date, and redemption at the net asset value calculated on the last business day of the fiscal period. Total returns are not annualized for periods less than one full year. Total return information does not reflect expenses that apply at the separate account level or to related insurance products. Inclusion of these charges would reduce the total return figures for all periods shown. Returns do not reflect the deduction of taxes that a shareholder would pay on fund distributions or the redemption of fund shares.

4. Annualized for periods less than one full year.


INFORMATION AND SERVICES

STATEMENT OF ADDITIONAL INFORMATION. This document includes additional information about the Fund's investment policies, risks, and operations. It is incorporated by reference into this prospectus (it is legally part of this prospectus).

ANNUAL AND SEMI-ANNUAL REPORTS. The Fund's Annual and Semi-Annual Reports provide additional information about the Fund's investments and performance. The Annual Report includes a discussion of market conditions and investment strategies that significantly affected the Fund's performance during its last fiscal year.

How to Request More Information

You can request the above documents, the notice explaining the Fund's privacy policy, and other information about the Fund, without charge, by:

Telephone:

Call OppenheimerFunds Services toll-free: 1.800.988.8287

Mail:

Use the following address for regular mail:
OppenheimerFunds Services
P.O. Box 5270
Denver, Colorado 80217-5270

Use the following address for courier or express mail:
OppenheimerFunds Services
12100 East Iliff Avenue
Suite 300
Aurora, Colorado 80014

Internet:

You can read or download the Fund's Statement of Additional Information, Annual and Semi-Annual Reports on the OppenheimerFunds website at: www.oppenheimerfunds.com


Information about the Fund including the Statement of Additional Information can be reviewed and copied at the SEC's Public Reference Room in Washington, D.C. Information on the operation of the Public Reference Room may be obtained by calling the SEC at 1.202.551.8090. Reports and other information about the Fund are available on the EDGAR database on the SEC's website at www.sec.gov. Copies may be obtained after payment of a duplicating fee by electronic request at the SEC's e-mail address: publicinfo@sec.gov or by writing to the SEC's Public Reference Section, Washington, D.C. 20549-1520.

No one has been authorized to provide any information about the Fund or to make any representations about the Fund other than what is contained in this prospectus. This prospectus is not an offer to sell shares of the Fund, nor a solicitation of an offer to buy shares of the Fund, to any person in any state or other jurisdiction where it is unlawful to make such an offer.


The Fund's SEC File No.: 811-04108
SP0660.001.0411


OPPENHEIMER
Small- & Mid-Cap Growth Fund/VA

A series of Oppenheimer Variable Account Funds

Share Classes:

     Non-Service Shares

     Service Shares

Prospectus dated April 29, 2011

As with all mutual funds, the Securities and Exchange Commission has not approved or disapproved the Fund's securities nor has it determined that this prospectus is accurate or complete. It is a criminal offense to represent otherwise.

Oppenheimer Small- & Mid-Cap Growth Fund/VA is a mutual fund that seeks capital appreciation by investing in "growth type" companies. It currently emphasizes investments in common stocks of companies that, at the time of purchase, are within the range of the market capitalization of the smallest company included in the Russell 2000(R) Growth Index and the largest company included in the Russell Midcap(R) Growth Index.

Shares of the Fund are sold only as an underlying investment for variable life insurance policies, variable annuity contracts and other insurance company separate accounts. A prospectus for the insurance product you have selected accompanies this prospectus and explains how to select shares of the Fund as an investment under that insurance product, and which share class or classes you are eligible to purchase.

This prospectus contains important information about the Fund's objective, investment policies, strategies and risks. Please read this prospectus (and your insurance product prospectus) carefully before you invest and keep them for future reference about your account.


Oppenheimer Small- & Mid-Cap Growth Fund/VA


Table of contents

THE FUND SUMMARY

Investment Objective

3

Fees and Expenses of the Fund

3

Principal Investment Strategies

3

Principal Risks

4

The Fund's Past Performance

4

Investment Adviser

5

Portfolio Manager

5

Purchase and Sale of Fund Shares

5

Taxes

5

Payments to Broker-Dealers and Other Financial Intermediaries

5

MORE ABOUT THE FUND

About the Fund's Investments

6

How the Fund is Managed

8

MORE ABOUT YOUR INVESTMENT

How to Buy and Sell Shares

10

Dividends, Capital Gains and Taxes

13

Financial Highlights

14


To Summary Prospectus

THE FUND SUMMARY

Investment Objective. The Fund seeks capital appreciation by investing in "growth type" companies.

Fees and Expenses of the Fund. This table describes the fees and expenses that you may pay if you buy and hold or redeem shares of the Fund. The accompanying prospectus of the participating insurance company provides information on initial or contingent deferred sales charges, exchange fees or redemption fees for that variable life insurance policy, variable annuity or other investment product. The fees and expenses of those products are not charged by the Fund and are not reflected in this table. Expenses would be higher if those fees were included.

Shareholder Fees (fees paid directly from your investment)

Non-Service Shares

Service Shares

Maximum Sales Charge (Load) imposed on purchases (as % of offering price)

None

None

Maximum Deferred Sales Charge (Load) (as % of the lower of original offering price or redemption proceeds)

None

None

Annual Fund Operating Expenses (expenses that you pay each year as a percentage of the value of your investment)

Non-Service Shares

Service Shares

Management Fees

0.72%

0.72%

Distribution and/or Service (12b-1) Fees

None

0.25%

Other Expenses

0.13%

0.13%

Total Annual Fund Operating Expenses

0.85%

1.10%

Fee Waiver and/or Expense Reimbursement*

(0.05%)

(0.05%)

Total Annual Fund Operating Expenses After Fee Waiver and/or Expense Reimbursement

0.80%

1.05%


* The Manager has voluntarily agreed to limit the Fund's total annual operating expenses so that those expenses, as percentages of daily net assets, will not exceed the annual rate of 0.80% for Non-Service Shares and 1.05% for Service Shares. This voluntary expense limitation may not be amended or withdrawn until one year after the date of this prospectus.


Example. The following Example is intended to help you compare the cost of investing in the Fund with the cost of investing in other mutual funds. The Example assumes that you invest $10,000 in a class of shares of the Fund for the time periods indicated. The Example also assumes that your investment has a 5% return each year and that the Fund's operating expenses remain the same. Although your actual costs may be higher or lower, based on these assumptions your expenses would be as follows, whether or not you redeemed your shares:

1 Year   3 Year   5 Years   10 Years  
Non-Service Shares $ 82 $ 267 $ 468 $ 1,049
Service Shares $ 108 $ 347 $ 605 $ 1,343


Portfolio Turnover. The Fund pays transaction costs, such as commissions, when it buys and sells securities (or "turns over" its portfolio). A higher portfolio turnover rate may indicate higher transaction costs. These costs, which are not reflected in the annual fund operating expenses or in the example, affect the Fund's performance. During the most recent fiscal year, the Fund's portfolio turnover rate was 95% of the average value of its portfolio.

Principal Investment Strategies. The Fund mainly invests in equity securities, such as common stocks of U.S. companies that the portfolio manager expects to have above-average growth rates. Under normal market conditions, the Fund invests at least 80% of its net assets, plus borrowings for investment purposes, in equity securities of "small-cap" and "mid-cap" companies. A company's "market capitalization" is the total value of its outstanding common stock. Relative to other companies, a company may be classified as small-cap, mid-cap or large-cap. The Fund defines small-cap and mid-cap companies as those companies that are within the range of market capitalizations of the Russell 2000® Growth Index and the Russell Midcap® Growth Index, respectively. This range is subject to change daily due to market activity and changes in the composition of those indices. The Fund measures a company's capitalization at the time the Fund buys a security, and it is not required to sell a security if the issuer's capitalization moves outside of the Fund's definition of small- and mid-cap issuers.

Under normal market conditions, the Fund can invest up to 20% of its net assets, plus borrowings for investment purposes, in stocks of companies in other market capitalizations, if the Manager believes they offer opportunities for growth.

The Fund invests primarily in U.S. companies but may also purchase securities of issuers in any country, including developed countries and emerging markets. The Fund has no limits on the amount of its assets that can be invested in foreign securities.

In selecting securities, the Fund's portfolio manager looks for companies with high growth potential using a "bottom-up" stock selection process. The "bottom-up" approach focuses on fundamental analysis of individual issuers before considering the impact of overall economic, market or industry trends. This approach includes analysis of a company's financial statements and management structure and consideration of the company's operations and product development, as well as its position in its industry. The portfolio manager looks for companies with revenues growing at above-average rates that might support and sustain above-average earnings. The portfolio manager also evaluates other business and economic factors, including cyclical factors, that might contribute to the company's stock appreciation. The Fund's portfolio manager currently focuses on companies with the following characteristics, which may vary in particular cases and may change over time:

  • An above-average rate of high quality growth that the portfolio manager believes is sustainable;
  • Experienced management teams with proven records;
  • Industry leaders with competitive advantages;
  • Companies with strong financials including low debt.

The Fund may not invest more than 25% of its total assets in any one industry, but in selecting securities it may, at times, invest more of its assets in issuers within a particular industry or economic or market sector. If so, its shares will be more sensitive to factors affecting that industry or sector.

The portfolio manager monitors individual issuers for changes in business fundamentals and valuation. If the portfolio manager notes a slowdown in the company's internal revenue growth or earnings growth or a negative movement in the company's fundamental economic condition, and if there are other investment alternatives that offer what he believes to be better appreciation possibilities, he may consider selling that stock.

Principal Risks. The price of the Fund's shares can go up and down substantially. The value of the Fund's investments may change because of broad changes in the markets in which the Fund invests or from poor security selection, which could cause the Fund to underperform other funds with similar investment objectives. There is no assurance that the Fund will achieve its investment objective. When you redeem your shares, they may be worth more or less than what you paid for them. These risks mean that you can lose money by investing in the Fund.

Main Risks of Investing in Stock. The value of the Fund's portfolio may be affected by changes in the stock markets. Stock markets may experience significant short-term volatility and may fall sharply at times. Different stock markets may behave differently from each other and U.S. stock markets may move in the opposite direction from one or more foreign stock markets.

The prices of individual stocks generally do not all move in the same direction at the same time and a variety of factors can affect the price of a particular company's stock. These factors may include, but are not limited to: poor earnings reports, a loss of customers, litigation against the company, general unfavorable performance of the company's sector or industry, or changes in government regulations affecting the company or its industry.

Main Risks of Small- and Mid-Sized Companies. The stock prices of small- and mid-sized companies may be more volatile and their securities may be more difficult to sell than those of larger companies. They may not have established markets, may have fewer customers and product lines, may have unseasoned management or less management depth and may have more limited access to financial resources. Smaller companies may not pay dividends or provide capital gains for some time, if at all.

Risks of Growth Investing. If a growth company's earnings or stock price fails to increase as anticipated, or if its business plans do not produce the expected results, its securities may decline sharply. Growth companies may be newer or smaller companies that may experience greater stock price fluctuations and risks of loss than larger, more established companies. Newer growth companies tend to retain a large part of their earnings for research, development or investments in capital assets. Therefore, they may not pay any dividends for some time. Growth investing has gone in and out of favor during past market cycles and is likely to continue to do so. During periods when growth investing is out of favor or when markets are unstable, it may be more difficult to sell growth company securities at an acceptable price. Growth stocks may also be more volatile than other securities because of investor speculation.

Sector Focus. Although the Fund will not invest more than 25% of its total assets in any one industry, it may from time to time invest a greater share of its assets in securities of companies in a particular economic or market sector. Some of those sectors, such as technology-related or healthcare-related securities, have historically experienced greater volatility than other sectors. To the extent that the Fund invests in companies in a particular market sector, it will be more vulnerable to the risks affecting that sector.

Who Is The Fund Designed For? The Fund's shares are available only as an investment option under certain variable annuity contracts, variable life insurance policies and investment plans offered through insurance company separate accounts of participating insurance companies. The Fund is designed primarily for investors seeking capital appreciation over the long term. Those investors should be willing to assume the risks of short-term share price fluctuations and losses that are typical for a growth fund focusing on small- and mid-cap stock investments. Because of its focus on long-term growth, the Fund may be appropriate for investors with longer term investment goals. The Fund is not designed for investors needing current income. The Fund is not a complete investment program and may not be appropriate for all investors. You should carefully consider your own investment goals and risk tolerance before investing in the Fund.

An investment in the Fund is not a deposit of any bank and is not insured or guaranteed by the Federal Deposit Insurance Corporation or any other government agency.


The Fund's Past Performance. The bar chart and table below provide some indication of the risks of investing in the Fund by showing changes in the Fund's Non-Service Shares performance from year to year and by showing how the Fund's average annual returns for 1, 5, and 10 years compare with those of broad measures of market performance that reflect the markets in which the Fund typically invests. Charges imposed by the insurance accounts that invest in the Fund are not included and the returns would be lower if they were. The Fund's past investment performance is not necessarily an indication of how the Fund will perform in the future. More recent performance information is available by calling the toll-free number on the back of this prospectus and on the Fund's website at: https://www.oppenheimerfunds.com/fund/SmallMidCapGrowthFundVA


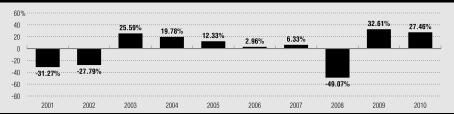
During the period shown, the highest return before taxes for a calendar quarter was 16.05% (4th qtr 10) and the lowest return before taxes for a calendar quarter was -32.43% (4th qtr 08).


The following table shows the average annual total returns before taxes for each class of the Fund's shares.

Average Annual Total Returns for the periods ended December 31, 2010

1 Year

5 Years

10 Years

Non-Service Shares (inception 08-15-1986)

27.46%


(1.18%)


(2.33%)


Service Shares (inception 10-16-2000)

27.16%


(1.44%)


(2.56%)


Russell 2500® Growth Index

28.86%


5.63%


4.19%


(reflects no deduction for fees, expenses or taxes)


Russell 2000® Growth Index

29.09%


5.30%


3.78%


(reflects no deduction for fees, expenses or taxes)


Russell MidCap® Growth Index

26.38%


4.88%


3.12%


(reflects no deduction for fees, expenses or taxes)


Investment Adviser. OppenheimerFunds, Inc. is the Fund's investment adviser (the "Manager").

Portfolio Manager. Ronald J. Zibelli, Jr., CFA, has been Vice President and portfolio manager of the Fund since November 2008.

Purchase and Sale of Fund Shares. Shares of the Fund may be purchased only by separate investment accounts of participating insurance companies as an underlying investment for variable life insurance policies, variable annuity contracts or other investment products. Individual investors cannot buy shares of the Fund directly. You may only submit instructions for buying or selling shares of the Fund to your insurance company or its servicing agent, not directly to the Fund or its Transfer Agent. The accompanying prospectus of the participating insurance company provides information about how to select the Fund as an investment option.

Taxes. Because shares of the Fund may be purchased only through insurance company separate accounts for variable annuity contracts, variable life insurance policies or other investment products, any dividends and capital gains distributions will be taxable to the participating insurance company, if at all. However, those payments may affect the tax basis of certain types of distributions from those accounts. Special tax rules apply to life insurance companies, variable annuity contracts and variable life insurance contracts. For information on federal income taxation of a life insurance company with respect to its receipt of distributions from the Fund and federal income taxation of owners of variable annuity or variable life insurance contracts, see the accompanying prospectus for the applicable contract.

Payments to Broker-Dealers and Other Financial Intermediaries. The Fund, the Manager, or their related companies may make payments to financial intermediaries, including to insurance companies that offer shares of the Fund as an investment option. These payments for the sale of Fund shares and related services may create a conflict of interest by influencing the intermediary and your salesperson to recommend the Fund over another investment. Ask your salesperson or visit your financial intermediary's website for more information.

MORE ABOUT THE FUND

About the Fund's Investments

The allocation of the Fund's portfolio among different types of investments will vary over time and the Fund's portfolio might not always include all of the different types of investments described below. The Statement of Additional Information contains more detailed information about the Fund's investment policies and risks.

THE FUND'S PRINCIPAL INVESTMENT STRATEGIES AND RISKS. The following strategies and types of investments are the ones that the Fund considers to be the most important in seeking to achieve its investment objective and the following risks are those the Fund expects its portfolio to be subject to as a whole.

Common Stock. Common stock represents an ownership interest in a company. It ranks below preferred stock and debt securities in claims for dividends and in claims for assets of the issuer in a liquidation or bankruptcy. Common stocks may be exchange-traded or over-the-counter securities. Over-the-counter securities may be less liquid than exchange-traded securities.

Small-Cap Investments. The Fund may invest in small-cap companies, including "unseasoned" companies that have been in operation for less than three years (including the operations of any predecessors). Small-cap companies may be developing new products or services that the Fund believes have relatively favorable prospects. They may be expanding into new and growing markets that might enable them to achieve a favorable market position. In many instances, the securities of smaller companies are traded over-the-counter or on a regional securities exchange, where the frequency and volume of trading is substantially less than is typical for securities of larger companies traded on national securities exchanges. Therefore, the securities of smaller companies may be subject to wider price fluctuations and may be less liquid.

Mid-Cap Investments. Mid-cap companies are generally companies that have completed their initial start-up cycle, and in many cases have established markets and developed seasoned management teams. The portfolio manager searches for stocks of mid-cap companies that have the financial stability approximating that of larger companies and the high growth potential associated with smaller companies. The portfolio manager will not normally invest in stocks of companies in "turnaround" situations until the company's operating characteristics have improved.

Capitalization Ranges. The Fund measures the market capitalization of an issuer at the time of investment. Because the relative sizes of companies change over time as the stock market changes, the Fund's definition of what is a "small-cap," "mid-cap" or "large-cap" company may change over time as well. After the Fund buys the stock of an individual company, that company may expand or contract and no longer fall within the designated capitalization range. Although the Fund is not required to sell the stock of companies whose market capitalizations have grown or decreased beyond the Fund's capitalization-range definition, it might sell some of those holdings to try to adjust the dollar-weighted median capitalization of its portfolio. That might cause the Fund to realize capital gains on an investment and could increase taxable distributions to shareholders.

Investing in Growth Companies. Growth companies are companies whose earnings and stock prices are expected to grow at a faster rate than the overall market. Growth companies can be new companies or established companies that may be entering a growth cycle in their business. Their anticipated growth may come from developing new products or services or from expanding into new or growing markets. Growth companies may be applying new technologies, new or improved distribution methods or new business models that could enable them to capture an important or dominant market position. They may have a special area of expertise or the ability to take advantage of changes in demographic or other factors in a more profitable way. Newer growth companies tend to retain a large part of their earnings for research, development or investments in capital assets. Although newer growth companies may not pay any dividends for some time, their stocks may be valued because of their potential for price increases. Current examples include companies in the fields of telecommunications, computer software, and new consumer products.

Cyclical Opportunities. At times, the Fund might seek to take advantage of short-term market movements or changes in the business cycle by investing in companies or industries that are sensitive to those changes. For example, when the economy is expanding, companies in consumer durables and the technology sector might benefit. There is a risk that if a cyclical event does not have the anticipated effect, or when the issuer or industry is out of phase in the business cycle, the value of the Fund's investment could fall.

Industry and Sector Focus.  At times the Fund may increase the relative emphasis of its investments in a particular industry or sector. The prices of securities of issuers in a particular industry or sector may go up and down in response to changes in economic conditions, government regulations, availability of basic resources or supplies, or other events that affect that industry or sector more than others. To the extent that the Fund increases the relative emphasis of its investments in a particular industry or sector, its share values may fluctuate in response to events affecting that industry or sector. To some extent that risk may be limited by the Fund's policy of not concentrating 25% or more of its total assets in investments in any one industry.


OTHER INVESTMENT STRATEGIES AND RISKS. The Fund can also use the investment techniques and strategies described below. The Fund might not use all of these techniques or strategies or might only use them from time to time.

Special Portfolio Diversification Requirements. To enable a variable annuity or variable life insurance contract based on an insurance company separate account to qualify for favorable tax treatment under the Internal Revenue Code, the underlying investments must follow special diversification requirements that limit the percentage of assets that can be invested in securities of particular issuers. The Fund's investment program is managed to meet those requirements, in addition to other diversification requirements under the Internal Revenue Code and the Investment Company Act of 1940 that apply to publicly-sold mutual funds.

Failure by the Fund to meet those special requirements could cause earnings on a contract owner's interest in an insurance company separate account to be taxable income. Those diversification requirements might also limit, to some degree, the Fund's investment decisions in a way that could reduce its performance.

Other Equity Securities. In addition to common stocks, the Fund can invest in other equity or "equity equivalents" securities such as preferred stocks or convertible securities. Preferred stocks have a set dividend rate and rank ahead of common stocks and behind debt securities in claims for dividends and for assets of the issuer in a liquidation or bankruptcy. The fixed dividend rate of preferred stocks may cause their prices to behave more like those of debt securities. A convertible security is one that can be converted into or exchanged for a set amount of common stock of an issuer within a particular period of time at a specified price or according to a price formula. Convertible securities offer the Fund the ability to participate in stock market movements while also seeking some current income. Convertible debt securities pay interest and convertible preferred stocks pay dividends until they mature or are converted, exchanged or redeemed. The Fund considers some convertible securities to be "equity equivalents" because they are convertible into common stock. The credit ratings of those convertible securities generally have less impact on the investment decision, although they are still subject to credit and interest rate risk.

The Fund will not invest more than 5% of its net assets in convertible securities that are rated below investment-grade by a nationally recognized rating organization.

       Investing in Small Unseasoned Companies.  The Fund can invest in the securities of small unseasoned companies. These are companies that have been in operation for less than three years, including the operations of any predecessors. In addition to the other risks of smaller issuers, these securities may have a very limited trading market, making it harder for the Fund to sell them at an acceptable price. The price of these securities may be very volatile, especially in the short term.

       Price Arbitrage. Because the Fund may invest in smaller company stocks that might trade infrequently, investors might seek to trade fund shares based on their knowledge or understanding of the value of those securities (this is sometimes referred to as "price arbitrage"). If such price arbitrage were successful, it might interfere with the efficient management of the Fund's portfolio and the Fund may be required to sell securities at disadvantageous times or prices to satisfy the liquidity requirements created by that activity. Successful price arbitrage might also dilute the value of fund shares held by other shareholders.

Investing in Special Situations. At times, the Fund may seek to benefit from what it considers to be "special situations," such as mergers, reorganizations, restructurings or other unusual events that are expected to affect a particular issuer. There is a risk that the expected change or event might not occur, which could cause the price of the security to fall, perhaps sharply. In that case, the investment might not produce the expected gains or might cause a loss. This is an aggressive investment technique that may be considered speculative.

Risks of Foreign Investing. While foreign securities may offer special investment opportunities, they are also subject to special risks. Foreign issuers are usually not subject to the same accounting and disclosure requirements as U.S. companies are subject to, which may make it difficult to evaluate a foreign company's operations or financial condition. A change in value of a foreign currency against the U.S. dollar will result in a change in the U.S. dollar value of securities denominated in that foreign currency and of any income or distributions the Fund may receive on those securities. Additionally, the value of foreign investments may be affected by exchange control regulations, expropriation or nationalization of a company's assets, foreign taxes, higher transaction and other costs, delays in settlement of transactions, changes in economic or monetary policy in the U.S. or abroad, or other political and economic factors.

Time-Zone Arbitrage. The Fund may invest in securities of foreign issuers that are traded in U.S. or foreign markets. If the Fund invests a significant amount of its assets in securities traded in foreign markets, it may be exposed to "time-zone arbitrage" attempts by investors seeking to take advantage of differences in the values of foreign securities that might result from events that occur after the close of the foreign securities market on which a security is traded and before the close of the New York Stock Exchange that day, when the Fund's net asset value is calculated. If such time-zone arbitrage were successful, it might dilute the interests of other shareholders. However, the Fund's use of "fair value pricing" under certain circumstances, to adjust the closing market prices of foreign securities to reflect what the Manager and the Board believe to be their fair value, may help deter those activities.

Derivative Investments. The Fund can invest in "derivative" instruments. A derivative is an instrument whose value depends on (or is derived from) the value of an underlying security, asset, interest rate, index or currency.  Derivatives may allow the Fund to increase or decrease its exposure to certain markets or risks.  

The Fund may use derivatives to seek to increase its investment return or for hedging purposes. The Fund is not required to use derivatives in seeking its investment objective or for hedging and might not do so.

     Options, futures and forward contracts are some of the types of derivatives the Fund can use. The Fund may also use other types of derivatives that are consistent with its investment strategies or for hedging purposes.

Hedging.  Hedging transactions are intended to reduce the risks of securities in the Fund's portfolio. If the Fund uses a hedging instrument at the wrong time or judges market conditions incorrectly, however, the hedge might be unsuccessful or could reduce the Fund's return or create a loss. The Fund has percentage limits on its use of derivatives and hedging instruments.

 Risks of Derivative Investments. Derivatives may be volatile and may involve significant risks. The underlying security, obligor or other instrument on which a derivative is based, or the derivative itself, may not perform the way the Manager expects it to. The Fund may lose money on a derivative investment if the issuer or counterparty fails to pay the amount due. Certain derivative investments held by the Fund may be illiquid, making it difficult to close out an unfavorable position. Derivative transactions may require the payment of premiums and can increase portfolio turnover. As a result, the Fund could realize little or no income or lose principal from the investment, or a hedge might be unsuccessful. For some derivatives, it is possible for the Fund to lose more than the amount invested in the derivative instrument. Some derivatives have the potential for unlimited loss, regardless of the size of the Fund's initial investment.

Illiquid and Restricted Securities. Investments that do not have an active trading market, or that have legal or contractual limitations on their resale, are generally referred to as "illiquid" securities. Illiquid securities may be difficult to value or to sell promptly at an acceptable price or may require registration under applicable securities laws before they can be sold publicly. Securities that have limitations on their resale are referred to as "restricted securities." Certain restricted securities that are eligible for resale to qualified institutional purchasers may not be regarded as illiquid.

     The Fund will not invest more than 15% of its net assets in illiquid securities.  The Manager monitors the Fund's holdings of illiquid securities on an ongoing basis to determine whether to sell any of those securities to maintain adequate liquidity.

Conflicts of Interest. The investment activities of the Manager and its affiliates in regard to other funds and accounts they manage may present conflicts of interest that could disadvantage the Fund and its shareholders. The Manager or its affiliates may provide investment advisory services to other funds and accounts that have investment objectives or strategies that differ from, or are contrary to, those of the Fund. That may result in another fund or account holding investment positions that are adverse to the Fund's investment strategies or activities. Other funds or accounts advised by the Manager or its affiliates may have conflicting interests arising from investment objectives that are similar to those of the Fund. Those funds and accounts may engage in, and compete for, the same types of securities or other investments as the Fund or invest in securities of the same issuers that have different, and possibly conflicting, characteristics. The trading and other investment activities of those other funds or accounts may be carried out without regard to the investment activities of the Fund and, as a result, the value of securities held by the Fund or the Fund's investment strategies may be adversely affected. The Fund's investment performance will usually differ from the performance of other accounts advised by the Manager or its affiliates and the Fund may experience losses during periods in which other accounts advised by the Manager or its affiliates achieve gains. The Manager has adopted policies and procedures designed to address potential conflicts of interest identified by the Manager; however, such policies and procedures may also limit the Fund's investment activities and affect its performance.

     The Fund offers its shares to separate accounts of different insurance companies, as an investment for their variable annuity contracts, variable life insurance policies and other investment products. While the Fund does not foresee any disadvantages to contract owners from these arrangements, it is possible that the interests of owners of different contracts participating in the Fund through different separate accounts might conflict. For example, a conflict could arise because of differences in tax treatment.

Investments in Oppenheimer Institutional Money Market Fund. The Fund can invest its free cash balances in Class E shares of Oppenheimer Institutional Money Market Fund to provide liquidity or for defensive purposes. The Fund invests in Oppenheimer Institutional Money Market Fund, rather than purchasing individual short-term investments, to seek a higher yield than it could obtain on its own. Oppenheimer Institutional Money Market Fund is a registered open-end management investment company, regulated as a money market fund under the Investment Company Act of 1940, and is part of the Oppenheimer family of funds. It invests in a variety of short-term, high-quality, dollar-denominated money market instruments issued by the U.S. Government, domestic and foreign corporations, other financial institutions, and other entities. Those investments may have a higher rate of return than the investments that would be available to the Fund directly. At the time of an investment, the Fund cannot always predict what the yield of the Oppenheimer Institutional Money Market Fund will be because of the wide variety of instruments that fund holds in its portfolio. The return on those investments may, in some cases, be lower than the return that would have been derived from other types of investments that would provide liquidity. As a shareholder, the Fund will be subject to its proportional share of the expenses of Oppenheimer Institutional Money Market Fund's Class E shares, including its advisory fee. However, the Manager will waive a portion of the Fund's advisory fee to the extent of the Fund's share of the advisory fee paid to the Manager by Oppenheimer Institutional Money Market Fund.

Temporary Defensive and Interim Investments. For temporary defensive purposes in times of adverse or unstable market, economic or political conditions, the Fund can invest up to 100% of its total assets in investments that may be inconsistent with the Fund's principal investment strategies. Generally, the Fund would invest in shares of Oppenheimer Institutional Money Market Fund or in the types of money market instruments in which Oppenheimer Institutional Money Market Fund invests or in other short-term U.S. Government securities. The Fund might also hold these types of securities as interim investments pending the investment of proceeds from the sale of Fund shares or the sale of Fund portfolio securities or to meet anticipated redemptions of Fund shares. To the extent the Fund invests in these securities, it might not achieve its investment objective.

Portfolio Turnover . A change in the securities held by the Fund is known as "portfolio turnover." The Fund may engage in active and frequent trading to try to achieve its investment objective and may have a portfolio turnover rate of over 100% annually. Increased portfolio turnover may result in higher brokerage fees or other transaction costs, which can reduce performance. The Financial Highlights table at the end of this prospectus shows the Fund's portfolio turnover rates during past fiscal years.

CHANGES TO THE FUND'S INVESTMENT POLICIES. The Fund's fundamental investment policies cannot be changed without the approval of a majority of the Fund's outstanding voting shares; however, the Fund's Board can change non-fundamental policies without a shareholder vote. Significant policy changes will be described in supplements to this prospectus. Shareholders will receive 60 days advance notice of any change in the 80% investment policy described in "Principal Investment Strategies." The Fund's investment objective is a fundamental policy. Other investment restrictions that are fundamental policies are listed in the Fund's Statement of Additional Information. An investment policy is not fundamental unless this prospectus or the Statement of Additional Information states that it is.

PORTFOLIO HOLDINGS.   The Fund's portfolio holdings are included in its semi-annual and annual reports that are distributed to its shareholders within 60 days after the close of the applicable reporting period. The Fund also discloses its portfolio holdings in its Statements of Investments on Form N-Q, which are public filings that are required to be made with the Securities and Exchange Commission within 60 days after the end of the Fund's first and third fiscal quarters. Therefore, the Fund's portfolio holdings are made publicly available no later than 60 days after the end of each of its fiscal quarters. In addition, the Fund's portfolio holdings information, as of the end of each calendar month, may be posted and available on the Fund's website no sooner than 30 days after the end of each calendar month.    

A description of the Fund's policies and procedures with respect to the disclosure of its portfolio holdings is available in the Fund's Statement of Additional Information.

How the Fund is Managed

THE MANAGER. OppenheimerFunds, Inc., the Manager, chooses the Fund's investments and handles its day-to-day business. The Manager carries out its duties, subject to the policies established by the Fund's Board of Trustees, under an investment advisory agreement that states the Manager's responsibilities. The agreement sets the fees the Fund pays to the Manager and describes the expenses that the Fund is responsible to pay to conduct its business.

The Manager has been an investment adviser since 1960. The Manager is located at Two World Financial Center, 225 Liberty Street, 11th Floor, New York, New York 10281-1008.

Advisory Fees.  Under the investment advisory agreement, the Fund pays the Manager an advisory fee at an annual rate that declines on additional assets as the Fund grows: 0.75% of the first $200 million of average annual net assets, 0.72% of the next $200 million, 0.69% of the next $200 million, 0.66% of the next $200 million, 0.60% of the next $700 million, and 0.58% of average annual net assets over $1.5 billion. The Fund's management fee for its fiscal year ended December 31, 2010, was 0.72% of the Fund's average annual net assets for each class of shares.

The Manager has voluntarily agreed to limit the Fund's total annual operating expenses so that those expenses, as percentages of daily net assets, will not exceed the annual rate of 0.80% of Non-Service Shares and 1.05% for Service Shares. This voluntary expense limitation may not be amended or withdrawn until one year after the date of this prospectus. The Manager has also voluntarily agreed to waive fees and/or reimburse Fund expenses in an amount equal to the indirect management fees incurred through the Fund's investment in Oppenheimer Institutional Money Market Fund. This waiver/and or reimbursement may be amended or withdrawn at any time. During the fiscal year ended December 31, 2010, this amount did not exceed 0.01% and therefore is not reflected in the Annual Fund Operating Expenses table shown earlier in this prospectus.

From April 1, 2009 through August 31, 2010, the Manager voluntarily agreed to waive its advisory fee, resulting in an expense reduction of 0.05% of the Fund's average annual net assets for the fiscal year ended December 31, 2010. This amount is not reflected in the Annual Fund Operating Expenses table shown earlier in this prospectus. After all waivers and reimbursements, actual total annual fund operating expenses for the fiscal year ended December 31, 2010 were 0.76% for Non-Service Shares and 1.01% for Service Shares. The Fund's management fee and other annual operating expenses may vary in future years.

A discussion regarding the basis for the Board of Trustees' approval of the Fund's investment advisory contract is available in the Fund's Annual Report to shareholders for the year ended December 31, 2010.

Portfolio Manager. The Fund's portfolio is managed by Ronald J. Zibelli, Jr. who is primarily responsible for the day-to-day management of the Fund's investments. Mr. Zibelli has been a portfolio manager and Vice President of the Fund since November 2008. 

Mr. Zibelli has been a Vice President of the Manager since May 2006. Prior to joining the Manager, he spent six years at Merrill Lynch Investment Managers, during which time he was a Managing Director and Small Cap Growth Team Leader, responsible for managing 11 portfolios. Prior to joining Merrill Lynch Investment Managers, Mr. Zibelli spent 12 years with Chase Manhattan Bank, including two years as Senior Portfolio Manager (U.S. Small Cap Equity) at Chase Asset Management. Mr. Zibelli is a portfolio manager and officer of other portfolios in the OppenheimerFunds complex.

The Statement of Additional Information provides additional information about the portfolio manager's compensation, other accounts he manages and his ownership of Fund shares.

MORE ABOUT YOUR INVESTMENT

How to Buy and Sell Shares

You may only submit instructions for buying or selling shares of the Fund to your insurance company or its servicing agent, not directly to the Fund or its Transfer Agent. Information about your investment in the Fund can only be obtained from your participating insurance company or its servicing agent. The Fund's Transfer Agent does not hold or have access to those records.

WHAT CLASSES OF SHARES DOES THE FUND OFFER? The Fund currently offers two different classes of shares. The different classes of shares represent investments in the same portfolio of securities, but the classes are subject to different expenses and will usually have different share prices. The Service Shares are subject to a distribution and service plan. The expenses of that plan are described below. The Non-Service Shares are not subject to a service and distribution plan.

THE PRICE OF FUND SHARES. Fund shares are sold to participating insurance companies, and are redeemed, at their net asset value per share. The net asset value that applies to a purchase order is the next one calculated after the insurance company (as the Fund's designated agent to receive purchase orders) receives the order from its contract owner, in proper form. Fund shares are redeemed at the next net asset value calculated after the insurance company (as the Fund's designated agent to receive purchase orders) receives the order from its contract owner, in proper form. The Fund's Transfer Agent generally must receive the purchase or redemption order from the insurance company by 9:30 a.m. Eastern Time on the next regular business day.

The Fund does not impose any sales charge on purchases of its shares. If there are any charges imposed under the variable annuity, variable life or other contract through which Fund shares are purchased, they are described in the accompanying prospectus of the participating insurance company. The participating insurance company's prospectus may also include information regarding the time you must submit your purchase and redemption orders.

     The sale and redemption price for Fund shares will change from day to day because the value of the securities in its portfolio and its expenses fluctuate. The redemption price will normally differ for different classes of shares. The redemption price of your shares may be more or less than their original cost.

Net Asset Value. The Fund calculates the net asset value of each class of shares as of the close of the New York Stock Exchange (NYSE), on each day the NYSE is open for trading (referred to in this prospectus as a "regular business day"). The NYSE normally closes at 4:00 p.m., Eastern Time, but may close earlier on some days.

The Fund determines the net assets of each class of shares by subtracting the class-specific expenses and the amount of the Fund's liabilities attributable to the share class from the market value of the Fund's securities and other assets attributable to the share class. The Fund's "other assets" might include, for example, cash and interest or dividends from its portfolio securities that have been accrued but not yet collected. The Fund's securities are valued primarily on the basis of current market quotations.

The net asset value per share for each share class is determined by dividing the net assets of the class by the number of outstanding shares of that class.

     Fair Value Pricing. If market quotations are not readily available or (in the Manager's judgment) do not accurately reflect the fair value of a security, or if after the close of the principal market on which a security held by the Fund is traded and before the time as of which the Fund's net asset value is calculated that day, an event occurs that the Manager learns of and believes in the exercise of its judgment will cause a material change in the value of that security from the closing price of the security on the principal market on which it is traded, that security may be valued by another method that the Board believes would more accurately reflect the security's fair value.

In determining whether current market prices are readily available and reliable, the Manager monitors the information it receives in the ordinary course of its investment management responsibilities. It seeks to identify significant events that it believes, in good faith, will affect the market prices of the securities held by the Fund. Those may include events affecting specific issuers (for example, a halt in trading of the securities of an issuer on an exchange during the trading day) or events affecting securities markets (for example, a foreign securities market closes early because of a natural disaster). The Board has adopted valuation procedures for the Fund and has delegated the day-to-day responsibility for fair value determinations to the Manager's "Valuation Committee." Those determinations may include consideration of recent transactions in comparable securities, information relating to the specific security, developments in the markets and their performance, and current valuations of foreign or U.S. indices. Fair value determinations by the Manager are subject to review, approval and ratification by the Board at its next scheduled meeting after the fair valuations are determined.

The Fund's use of fair value pricing procedures involves subjective judgments and it is possible that the fair value determined for a security may be materially different from the value that could be realized upon the sale of that security. Accordingly, there can be no assurance that the Fund could obtain the fair value assigned to a security if it were to sell the security at approximately the same time at which the Fund determines its net asset value per share.

     Pricing Foreign Securities . The Fund may use fair value pricing more frequently for securities primarily traded on foreign exchanges. Because many foreign markets close hours before the Fund values its foreign portfolio holdings, significant events, including broad market movements, may occur during that time that could potentially affect the values of foreign securities held by the Fund.

The Manager believes that foreign securities values may be affected by volatility that occurs in U.S. markets after the close of foreign securities markets. The Manager's fair valuation procedures therefore include a procedure whereby foreign securities prices may be "fair valued" to take those factors into account.

Because some foreign securities trade in markets and on exchanges that operate on weekends and U.S. holidays, the values of some of the Fund's foreign investments may change on days when investors cannot buy or redeem Fund shares.

HOW CAN YOU BUY FUND SHARES? Shares of the Fund may be purchased only by separate investment accounts of participating insurance companies as an underlying investment for variable life insurance policies, variable annuity contracts or other investment products. Individual investors cannot buy shares of the Fund directly. Please refer to the accompanying prospectus of the participating insurance company for information on how to select the Fund as an investment option. That prospectus will indicate which share class you may be eligible to purchase.

Suspension of Share Offering. The offering of Fund shares may be suspended during any period in which the determination of net asset value is suspended, and may be suspended by the Board at any time the Board believes it is in the Fund's best interest to do so.

HOW CAN YOU REDEEM FUND SHARES? Only the participating insurance companies that hold Fund shares in their separate accounts can place orders to redeem shares. Contract holders and policy holders should not directly contact the Fund or its transfer agent to request a redemption of Fund shares. The Fund normally sends payment by Federal Funds wire to the insurance company's account on the next business day after the Fund receives the order (and no later than seven days after the Fund's receipt of the order). Under unusual circumstances determined by the Securities and Exchange Commission, payment may be delayed or suspended. Contract owners should refer to the withdrawal or surrender instructions in the accompanying prospectus of the participating insurance company.

Limitations on Frequent Transactions

Frequent purchases and redemptions of Fund shares may interfere with the Manager's ability to manage the Fund's investments efficiently, may increase its transaction and administrative costs and may affect its performance, depending on various factors, such as the size of the Fund, the nature of its investments, the amount of Fund assets the portfolio manager maintains in cash or cash equivalents, and the aggregate dollar amount, the number and the frequency of trades.

If large dollar amounts are involved in frequent redemption transactions, the Fund might be required to sell portfolio securities at unfavorable times to meet those transaction requests, and the Fund's brokerage or administrative expenses might be increased. Therefore, the Manager and the Fund's Board have adopted the following policies and procedures to detect and prevent frequent and/or excessive purchase and redemption activity, while addressing the needs of investors who seek liquidity in their investment. There is no guarantee that those policies and procedures, described below, will be sufficient to identify and deter all excessive short-term trading. If the Transfer Agent is not able to detect and curtail such activity, frequent trading could occur in the Fund.

Policies on Disruptive Activity.  The Transfer Agent and the Distributor, on behalf of the Fund, have entered into agreements with participating insurance companies designed to detect and restrict excessive short-term trading activity by contract or policy owners or their financial advisers in their accounts. The Transfer Agent generally does not consider periodic asset allocation or re-balancing that affects a portion of the Fund shares held in the account of a policy or contract owner to be "excessive trading." However, the Transfer Agent has advised participating insurance companies that it generally considers certain other types of trading activity to be "excessive," such as making a "transfer" out of the Fund within 30 days after buying Fund shares (by the sale of the recently purchased Fund shares and the purchase of shares of another fund) or making more than six "round-trip transfers" between funds during one year. The agreements require participating insurance companies to provide transaction information to the Fund and to execute Fund instructions to restrict trading in Fund shares.

 A participating insurance company may also have its own policies and procedures and may impose its own restrictions or limitations to discourage short-term and/or excessive trading by its policy or contract owners. Those policies and procedures may be different from the Fund's in certain respects. You should refer to the prospectus for your insurance company variable annuity contract for specific information about the insurance company's policies. Under certain circumstances, policy or contract owners may be required to transmit purchase or redemption orders only by first class U.S. mail.

Monitoring the Policies. The Fund's policies and procedures for detecting and deterring frequent or excessive trading are administered by the Fund's Transfer Agent. However, the Transfer Agent presently does not have the ability to directly monitor trading activity in the accounts of policy or contract owners within the participating insurance companies' accounts. The Transfer Agent's ability to monitor and deter excessive short-term trading in such insurance company accounts ultimately depends on the capability and diligence of each participating insurance company, under their agreements with the Transfer Agent, the Distributor and the Fund, in monitoring and controlling the trading activity of the policy or contract owners in the insurance company's accounts.

The Transfer Agent will attempt to monitor the net effect on the Fund's assets from the purchase and redemption activity in the accounts of participating insurance companies and will seek to identify patterns that may suggest excessive trading by the contract or policy owners who invest in the insurance company's accounts. If the Transfer Agent believes it has observed evidence of possible excessive trading activity, it will ask the participating insurance companies or other registered owners to provide information about the transaction activity of the contract or policy holders in their respective accounts, and to take appropriate action. In that case, the insurance company must confirm to the Transfer Agent that appropriate action has been taken to curtail the excessive trading activity.

The Transfer Agent will, subject to the limitations described in this section, limit or terminate the trading activity of any person, group or account that it believes would be excessive or disruptive. However, the Transfer Agent may not be able to detect or curtail all such trading activity in the Fund. The Transfer Agent will evaluate trading activity on a case by case basis and the limitations placed on trading may vary between accounts.

Right to Refuse Purchase Orders. The Fund's Distributor or Transfer Agent may, in their discretion, refuse any purchase order and are not obligated to provide notice before rejecting an order.  

DISTRIBUTION AND SERVICE (12b-1) PLANS

Distribution and Service Plan for Service Shares. The Fund has adopted a Distribution and Service Plan for Service Shares to pay the Distributor for distribution related services, personal services and account maintenance for those shares. Under the Plan, the Fund pays the Distributor quarterly at an annual rate of up to 0.25% of the daily net assets of the Fund's Service Shares. Because these fees are paid out of the Fund's assets on an on-going basis, over time they will increase the operating expenses of the Service Shares and may cost you more than other types of fees or sales charges. As a result, the Service Shares may have lower performance compared to the Fund's shares that are not subject to a service fee.

     Use of Plan Fees: The Distributor currently uses all of those fees to compensate sponsor(s) of the insurance product for providing personal services and account maintenance for variable contract owners that hold Service Shares.

PAYMENTS TO FINANCIAL INTERMEDIARIES AND SERVICE PROVIDERS. The Manager and the Distributor, in their discretion, may also make payments for distribution and/or shareholder servicing activities to brokers, dealers and other financial intermediaries, including the insurance companies that offer the Fund as an investment option, or to service providers. Those payments are made out of the Manager's and/or the Distributor's own resources and/or assets, including from the revenues or profits derived from the advisory fees the Manager receives from the Fund. Those cash payments, which may be substantial, are paid to many firms having business relationships with the Manager and Distributor and are in addition to any distribution fees, servicing fees, or transfer agency fees paid directly or indirectly by the Fund to those entities. Payments by the Manager or Distributor from their own resources are not reflected in the tables in the "Fees and Expenses of the Fund" section of this prospectus because they are not paid by the Fund.

The financial intermediaries that may receive those payments include firms that offer and sell Fund shares to their clients, or provide shareholder services to the Fund, or both, and receive compensation for those activities. The financial intermediaries that may receive payments include securities brokers, dealers, financial advisers, insurance companies that offer variable annuity or variable life insurance products and other intermediaries.

In general, these payments to financial intermediaries can be categorized as "distribution-related" or "servicing" payments. Payments for distribution-related expenses, such as marketing or promotional expenses, are often referred to as "revenue sharing." Revenue sharing payments may be made on the basis of the sales of shares attributable to that intermediary, the average net assets of the Fund and other Oppenheimer funds attributable to the accounts of that intermediary and its clients, negotiated lump sum payments for distribution services provided, or similar fees. In some circumstances, revenue sharing payments may create an incentive for a financial intermediary or its representatives to recommend or offer shares of the Fund or other Oppenheimer funds to its customers. These payments also may give an intermediary an incentive to cooperate with the Distributor's marketing efforts. A revenue sharing payment may, for example, qualify the Fund for preferred status with the intermediary receiving the payment or provide representatives of the Distributor with access to representatives of the intermediary's sales force, in some cases on a preferential basis over funds of competitors. Additionally, as firm support, the Manager or Distributor may reimburse expenses related to educational seminars and "due diligence" or training meetings (to the extent permitted by applicable laws or the rules of the Financial Industry Regulatory Authority ("FINRA")) designed to increase sales representatives' awareness about Oppenheimer funds, including travel and lodging expenditures. However, the Manager does not consider a financial intermediary's sale of shares of the Fund or other Oppenheimer funds when selecting brokers or dealers to effect portfolio transactions for the funds.

Various factors are used to determine whether to make revenue sharing payments. Possible considerations include, without limitation, the types of services provided by the intermediary, sales of Fund shares, the redemption rates on accounts of clients of the intermediary or overall asset levels of Oppenheimer funds held for or by clients of the intermediary, the willingness of the intermediary to allow the Distributor to provide educational and training support for the intermediary's sales personnel relating to the Oppenheimer funds, the availability of the Oppenheimer funds on the intermediary's sales system, as well as the overall quality of the services provided by the intermediary and the Manager or Distributor's relationship with the intermediary. The Manager and Distributor have adopted guidelines for assessing and implementing each prospective revenue sharing arrangement. To the extent that financial intermediaries receiving distribution-related payments from the Manager or Distributor sell more shares of the Oppenheimer funds or retain more shares of the funds in their client accounts, the Manager and Distributor benefit from the incremental management and other fees they receive with respect to those assets.

Payments may also be made by the Manager, the Distributor or the Transfer Agent to financial intermediaries to compensate or reimburse them for administrative or other client services provided such as sub-transfer agency services for shareholders, omnibus accounting or sub-accounting, participation in networking arrangements, account set-up, recordkeeping and other shareholder services. Payments may also be made for administrative services related to the distribution of Fund shares through the intermediary. Firms that may receive servicing fees include insurance companies that offer variable annuity or variable life insurance products and others. These fees may be used by the service provider to offset or reduce fees that would otherwise be paid directly to them by certain account holders. The Statement of Additional Information contains more information about revenue sharing and service payments made by the Manager or the Distributor. Your broker, dealer or other financial intermediary may charge you fees or commissions in addition to those disclosed in this prospectus. You should ask your financial intermediary for details about any such payments it receives from the Manager or the Distributor and their affiliates, or any other fees or expenses it charges.

Dividends, Capital Gains and Taxes

DIVIDENDS AND DISTRIBUTIONS. The Fund intends to declare and pay dividends annually from any net investment income. The Fund may also realize capital gains on the sale of portfolio securities, in which case it may make distributions out of any net short-term or long-term capital gains annually. The Fund may also make supplemental distributions of dividends and capital gains following the end of its fiscal year. The Fund has no fixed dividend rate and cannot guarantee that it will pay any dividends or capital gains distributions in a particular year.

Dividends and distributions are paid separately for each share class. Because of the higher expenses on Service Shares, the dividends and capital gains distributions paid on those shares will generally be lower than for other Fund shares.

Receiving Dividends and Distributions. Any dividends and capital gains distributions will be automatically reinvested in additional Fund shares for the account of the participating insurance company, unless the insurance company elects to have dividends or distributions paid in cash.

TAXES. For a discussion of the tax status of a variable annuity contract, a variable life insurance policy or other investment product of a participating insurance company, please refer to the accompanying variable contract prospectus of your participating insurance company. Because shares of the Fund may be purchased only through insurance company separate accounts for variable annuity contracts, variable life insurance policies or other investment products, any dividends from net investment income and distributions of net realized short-term and long-term capital gains will be taxable, if at all, to the participating insurance company. However, those payments may affect the tax basis of certain types of distributions from those accounts.

The Fund has qualified and intends to qualify each year to be taxed as a regulated investment company under the Internal Revenue Code by satisfying certain income, asset diversification and income distribution requirements, but reserves the right not to so qualify. In each year that it qualifies as a regulated investment company, the Fund will not be subject to federal income taxes on its income that it distributes to shareholders.

This information is only a summary of certain Federal income tax information about your investment. You are encouraged to consult your tax adviser about the effect of an investment in the Fund on your particular tax situation and about any changes to the Internal Revenue Code that may occur from time to time. Additional information about the tax effects of investing in the Fund is contained in the Statement of Additional Information.

Financial Highlights

The Financial Highlights Table is presented to help you understand the Fund's financial performance for the past five fiscal years. Certain information reflects financial results for a single Fund share. The total returns in the table represent the rate that an investor would have earned (or lost) on an investment in the Fund (assuming reinvestment of all dividends and distributions). This information has been audited by KPMG LLP, the Fund's independent registered public accounting firm for the fiscal years ended December 31, 2010 and 2009. The financial highlights for the prior years were audited by another independent registered public accounting firm. KPMG's report, along with the Fund's financial statements, are included in the Statement of Additional Information, which is available upon request.

Financial Highlights Table

FINANCIAL HIGHLIGHTS

Non-Service Shares      Year Ended December 31,

2010


2009


2008


2007


2006


Per Share Operating Data


Net asset value, beginning of period

$36.52


$27.54


$54.07


$50.85


$49.39


Income (loss) from investment operations:


Net investment loss1

(.11)


(.05)


(.13)


(.02)


(.02)


Net realized and unrealized gain (loss)

10.14


9.03


(26.40)


3.24


1.48


Total from investment operations

10.03


8.98


(26.53)


3.22


1.46


Net asset value, end of period

$46.55


$36.52


$27.54


$54.07


$50.85


Total Return, at Net Asset Value2

27.46%


32.61%


(49.07)%


6.33%


2.96%


Ratios/Supplemental Data


Net assets, end of period (in thousands)

$611,872


$547,683


$461,684


$1,002,442


$1,054,809


Average net assets (in thousands)

$548,739


$478,968


$754,170


$1,045,592


$1,135,831


Ratios to average net assets:3


Net investment loss

(0.29)%


(0.17)%


(0.30)%


(0.04)%


(0.04)%


Total expenses4

0.85%


0.86%


0.71%


0.69%


0.69%


Expenses after payments, waivers and/or reimbursements and reduction to custodian expenses

0.76%


0.71%


0.68%


0.69%


0.69%


Portfolio turnover rate

95%


102%


78%


112%


56%


1. Per share amounts calculated based on the average shares outstanding during the period.

2. Assumes an initial investment on the business day before the first day of the fiscal period, with all dividends and distributions reinvested in additional shares on the reinvestment date, and redemption at the net asset value calculated on the last business day of the fiscal period. Total returns are not annualized for periods less than one full year. Total return information does not reflect expenses that apply at the separate account level or to related insurance products. Inclusion of these charges would reduce the total return figures for all periods shown. Returns do not reflect the deduction of taxes that a shareholder would pay on fund distributions or the redemption of fund shares.

3. Annualized for periods less than one full year.

4. Total expenses including indirect expenses from affiliated fund were as follows:

Year Ended December 31, 2010

0.85%

Year Ended December 31, 2009

0.86%

Year Ended December 31, 2008

0.71%

Year Ended December 31, 2007

0.69%

Year Ended December 31, 2006

0.69%


Service Shares      Year Ended December 31,

2010


2009


2008


2007


2006


Per Share Operating Data


Net asset value, beginning of period

$35.75


$27.03


$53.22


$50.19


$48.87


Income (loss) from investment operations:


Net investment loss1

(.20)


(.13)


(.24)


(.17)


(.16)


Net realized and unrealized gain (loss)

9.91


8.85


(25.95)


3.20


1.48


Total from investment operations

9.71


8.72


(26.19)


3.03


1.32


Net asset value, end of period

$45.46


$35.75


$27.03


$53.22


$50.19


Total Return, at Net Asset Value2

27.16%


32.26%


(49.21)%


6.04%


2.70%


Ratios/Supplemental Data


Net assets, end of period (in thousands)

$32,669


$26,098


$21,952


$47,270


$47,131


Average net assets (in thousands)

$27,552


$22,605


$35,815


$49,421


$44,273


Ratios to average net assets:3


Net investment loss

(0.53)%


(0.44)%


(0.57)%


(0.31)%


(0.33)%


Total expenses4

1.10%


1.12%


0.98%


0.96%


0.97%


Expenses after payments, waivers and/or reimbursements and reduction to custodian expenses

1.01%


0.97%


0.95%


0.96%


0.97%


Portfolio turnover rate

95%


102%


78%


112%


56%


1. Per share amounts calculated based on the average shares outstanding during the period.

2. Assumes an initial investment on the business day before the first day of the fiscal period, with all dividends and distributions reinvested in additional shares on the reinvestment date, and redemption at the net asset value calculated on the last business day of the fiscal period. Total returns are not annualized for periods less than one full year. Total return information does not reflect expenses that apply at the separate account level or to related insurance products. Inclusion of these charges would reduce the total return figures for all periods shown. Returns do not reflect the deduction of taxes that a shareholder would pay on fund distributions or the redemption of fund shares.

3. Annualized for periods less than one full year.

4. Total expenses including indirect expenses from affiliated fund were as follows:

Year Ended December 31, 2010

1.10%

Year Ended December 31, 2009

1.12%

Year Ended December 31, 2008

0.98%

Year Ended December 31, 2007

0.96%

Year Ended December 31, 2006

0.97%


INFORMATION AND SERVICES

STATEMENT OF ADDITIONAL INFORMATION. This document includes additional information about the Fund's investment policies, risks, and operations. It is incorporated by reference into this prospectus (it is legally part of this prospectus).

ANNUAL AND SEMI-ANNUAL REPORTS. The Fund's Annual and Semi-Annual Reports provide additional information about the Fund's investments and performance. The Annual Report includes a discussion of market conditions and investment strategies that significantly affected the Fund's performance during its last fiscal year.

How to Request More Information

You can request the above documents, the notice explaining the Fund's privacy policy, and other information about the Fund, without charge, by:

Telephone:

Call OppenheimerFunds Services toll-free: 1.800.988.8287

Mail:

Use the following address for regular mail:
OppenheimerFunds Services
P.O. Box 5270
Denver, Colorado 80217-5270

Use the following address for courier or express mail:
OppenheimerFunds Services
12100 East Iliff Avenue
Suite 300
Aurora, Colorado 80014

Internet:

You can read or download the Fund's Statement of Additional Information, Annual and Semi-Annual Reports on the OppenheimerFunds website at: www.oppenheimerfunds.com


Information about the Fund including the Statement of Additional Information can be reviewed and copied at the SEC's Public Reference Room in Washington, D.C. Information on the operation of the Public Reference Room may be obtained by calling the SEC at 1.202.551.8090. Reports and other information about the Fund are available on the EDGAR database on the SEC's website at www.sec.gov. Copies may be obtained after payment of a duplicating fee by electronic request at the SEC's e-mail address: publicinfo@sec.gov or by writing to the SEC's Public Reference Section, Washington, D.C. 20549-1520.

No one has been authorized to provide any information about the Fund or to make any representations about the Fund other than what is contained in this prospectus. This prospectus is not an offer to sell shares of the Fund, nor a solicitation of an offer to buy shares of the Fund, to any person in any state or other jurisdiction where it is unlawful to make such an offer.


The Fund's SEC File No.: 811-04108
SP0620.001.0411


OPPENHEIMER
Value Fund/VA

A series of Oppenheimer Variable Account Funds

Share Classes:

     Non-Service Shares

     Service Shares

Prospectus dated April 29, 2011

As with all mutual funds, the Securities and Exchange Commission has not approved or disapproved the Fund's securities nor has it determined that this prospectus is accurate or complete. It is a criminal offense to represent otherwise.

Oppenheimer Value Fund/VA is a mutual fund. It seeks long-term growth of capital by investing primarily in common stocks with low price-earnings ratios and better-than-anticipated earnings. Realization of current income is a secondary consideration.

Shares of the Fund are sold only as an underlying investment for variable life insurance policies, variable annuity contracts and other insurance company separate accounts. A prospectus for the insurance product you have selected accompanies this prospectus and explains how to select shares of the Fund as an investment under that insurance product, and which share class or classes you are eligible to purchase.

This prospectus contains important information about the Fund's objective, investment policies, strategies and risks. Please read this prospectus (and your insurance product prospectus) carefully before you invest and keep them for future reference about your account.


Oppenheimer Value Fund/VA


Table of contents

THE FUND SUMMARY

Investment Objective

3

Fees and Expenses of the Fund

3

Principal Investment Strategies

3

Principal Risks

4

The Fund's Past Performance

5

Investment Adviser

5

Portfolio Manager

5

Purchase and Sale of Fund Shares

5

Taxes

5

Payments to Broker-Dealers and Other Financial Intermediaries

5

MORE ABOUT THE FUND

About the Fund's Investments

6

How the Fund is Managed

9

MORE ABOUT YOUR INVESTMENT

How to Buy and Sell Shares

11

Dividends, Capital Gains and Taxes

14

Financial Highlights

15


To Summary Prospectus

THE FUND SUMMARY

Investment Objective. The Fund seeks long-term growth of capital by investing primarily in common stocks with low price-earnings ratios and better-than-anticipated earnings. Realization of current income is a secondary consideration.

Fees and Expenses of the Fund. This table describes the fees and expenses that you may pay if you buy and hold or redeem shares of the Fund. The accompanying prospectus of the participating insurance company provides information on initial or contingent deferred sales charges, exchange fees or redemption fees for that variable life insurance policy, variable annuity or other investment product. The fees and expenses of those products are not charged by the Fund and are not reflected in this table. Expenses would be higher if those fees were included.

Shareholder Fees (fees paid directly from your investment)

Non-Service Shares

Service Shares

Maximum Sales Charge (Load) imposed on purchases (as % of offering price)

None

None

Maximum Deferred Sales Charge (Load) (as % of the lower of original offering price or redemption proceeds)

None

None


Annual Fund Operating Expenses (expenses that you pay each year as a percentage of the value of your investment)

Non-Service Shares

Service Shares

Management Fees

0.75%

0.75%

Distribution and/or Service (12b-1) Fees

None

0.25%

Other Expenses

1.30%

1.08%

Total Annual Fund Operating Expenses

2.05%

2.08%

    Fee Waiver and/or Expense Reimbursement*

(1.48%)

(1.15%)

Total Annual Fund Operating Expenses After Fee Waiverand/or Expense Reimbursement

0.57%

0.93%


* The Manager has voluntarily agreed to limit the Fund's total annual operating expenses so that those expenses, as percentages of daily net assets, will not exceed the annual rate of 0.80% for Non-Service Shares and 1.05% of Service Shares. This voluntary expense limitation may not be amended or withdrawn until one year after the date of this prospectus.


Example. The following Example is intended to help you compare the cost of investing in the Fund with the cost of investing in other mutual funds. The Example assumes that you invest $10,000 in a class of shares of the Fund for the time periods indicated. The Example also assumes that your investment has a 5% return each year and that the Fund's operating expenses remain the same. Although your actual costs may be higher or lower, based on these assumptions your expenses would be as follows, whether or not you redeemed your shares:

  1 Year   3 Years   5 Years   10 Years  
Non-Service Shares 58 504 976 2,283
Service Shares 95 546 1,022 2,342


Portfolio Turnover. The Fund pays transaction costs, such as commissions, when it buys and sells securities (or "turns over" its portfolio). A higher portfolio turnover rate may indicate higher transaction costs. These costs, which are not reflected in the annual fund operating expenses or in the example, affect the Fund's performance. During the most recent fiscal year, the Fund's portfolio turnover rate was 109% of the average value of its portfolio.

Principal Investment Strategies. The Fund mainly invests in common stocks of companies that the portfolio manager believes are undervalued in the marketplace. They use fundamental analysis to seek companies whose intrinsic value is greater than the current price of their securities. A company's security may be undervalued because the market is not aware of the issuer's intrinsic value, does not yet recognize its future potential, or the issuer may be temporarily out of favor. The Fund may realize gains in the prices of those securities when other investors recognize their real or prospective worth. The portfolio manager's "bottom up" approach uses fundamental analysis to select securities one at a time, based on factors such as a company's long-term earnings and growth potential, before considering industry trends. The portfolio manager currently focus on companies with the following characteristics, which may vary in particular cases and may change over time:

  • Future supply and demand conditions for its key products,
  • Product cycles,
  • Quality of management,
  • Competitive position in the market place,
  • Reinvestment plans for cash generated, and
  • Better-than-expected earnings reports.

The Fund may buy securities issued by companies of any size or market capitalization range and at times might increase its emphasis on securities of issuers in a particular capitalization range, including small- and mid-sized companies. While the Fund does not limit its investments to issuers in a particular capitalization range, the portfolio manager currently focuses on securities of larger-size companies.

The Fund may invest up to 25% of its total assets in securities of companies or governments in any foreign country, including both developed and emerging market countries. The Fund may also invest in other equity securities, such as preferred stock, rights, warrants and securities convertible into common stock and may invest up to 10% of its net assets in debt securities.

The portfolio manager may consider selling a stock, but are not required to, for one or more of the following reasons:

  • the stock price is approaching its price target,
  • the company's fundamentals are deteriorating, or
  • alternative investment ideas have been developed.

Principal Risks. The price of the Fund's shares can go up and down substantially. The value of the Fund's investments may change because of broad changes in the markets in which the Fund invests or from poor security selection, which could cause the Fund to underperform other funds with similar objectives. There is no assurance that the Fund will achieve its investment objective. When you redeem your shares, they may be worth more or less than what you paid for them. These risks mean that you can lose money by investing in the Fund.

Main Risks of Investing in Stock. The value of the Fund's portfolio may be affected by changes in the stock markets. Stock markets may experience significant short-term volatility and may fall sharply at times. Different stock markets may behave differently from each other and U.S. stock markets may move in the opposite direction from one or more foreign stock markets.

The prices of individual stocks generally do not all move in the same direction at the same time and a variety of factors can affect the price of a particular company's stock. These factors may include, but are not limited to: poor earnings reports, a loss of customers, litigation against the company, general unfavorable performance of the company's sector or industry, or changes in government regulations affecting the company or its industry.

At times, the Fund may emphasize investments in a particular industry or economic or market sector. To the extent that the Fund increases its emphasis on investments in a particular industry or sector, the value of its investments may fluctuate more in response to events affecting that industry or sector, such as changes in economic conditions, government regulations, availability of basic resources or supplies, or other events that affect that industry or sector more than others.

Main Risks of Value Investing. Value investing entails the risk that if the market does not recognize that the Fund's securities are undervalued, the prices of those securities might not appreciate as anticipated. A value approach could also result in fewer investments that increase rapidly during times of market gains and could cause the Fund to underperform funds that use a growth or non-value approach to investing. Value investing has gone in and out of favor during past market cycles and when value investing is out of favor or when markets are unstable, the securities of "value" companies may underperform the securities of "growth" companies.

Main Risks of Foreign Investing. Foreign securities are subject to special risks. Foreign issuers are usually not subject to the same accounting and disclosure requirements that U.S. companies are subject to, which may make it difficult for the Fund to evaluate a foreign company's operations or financial condition. A change in the value of a foreign currency against the U.S. dollar will result in a change in the U.S. dollar value of securities denominated in that foreign currency and in the value of any income or distributions the Fund may receive on those securities. The value of foreign investments may be affected by exchange control regulations, foreign taxes, higher transaction and other costs, delays in the settlement of transactions, changes in economic or monetary policy in the United States or abroad, expropriation or nationalization of a company's assets, or other political and economic factors. These risks may be greater for investments in developing or emerging market countries.

     Time-Zone Arbitrage. The Fund may invest in securities of foreign issuers that are traded in U.S. or foreign markets. If the Fund invests a significant amount of its assets in foreign markets, it may be exposed to "time-zone arbitrage" attempts by investors seeking to take advantage of differences in the values of foreign securities that might result from events that occur after the close of the foreign securities market on which a security is traded and before the Fund's net asset value is calculated.  If such time-zone arbitrage were successful, it might dilute the interests of other shareholders.  The Fund's use of "fair value pricing" to adjust certain market prices of foreign securities may help deter those activities.

Main Risks of Small- and Mid-Sized Companies. The stock prices of small- and mid-sized companies may be more volatile and their securities may be more difficult to sell than those of larger companies. They may not have established markets, may have fewer customers and product lines, may have unseasoned management or less management depth and may have more limited access to financial resources. Smaller companies may not pay dividends or provide capital gains for some time, if at all.

Who Is the Fund Designed For? The Fund's shares are available only as an investment option under certain variable annuity contracts, variable life insurance policies and investment plans offered through insurance company separate accounts of participating insurance companies. Those investors should be willing to assume the risks of short-term share price fluctuations and losses that are typical for a fund emphasizing investments in stocks. Since the Fund's income level will fluctuate and will likely be small, it is not designed for investors needing an assured level of current income. The Fund is not a complete investment program. You should carefully consider your own investment goals and risk tolerance before investing in the Fund.

An investment in the Fund is not a deposit of any bank and is not insured or guaranteed by the Federal Deposit Insurance Corporation or any other government agency.


The Fund's Past Performance. The bar chart and table below provide some indication of the risks of investing in the Fund by showing changes in the Fund's Non-Service Shares performance from year to year and by showing how the Fund's average annual returns for 1, 5 and 10 years compare with those of a broad measure of market performance. Charges imposed by the insurance accounts that invest in the Fund are not included and the returns would be lower if they were. The Fund's past investment performance is not necessarily an indication of how the Fund will perform in the future. More recent performance information is available by calling the toll-free number on the back of this prospectus and on the Fund's website at: https://www.oppenheimerfunds.com/fund/OppenheimerValueFundVA


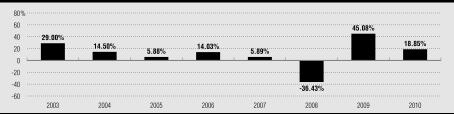
During the period shown, the highest return before taxes for a calendar quarter was 26.91% (2nd qtr 09) and the lowest return before taxes for a calendar quarter was -24.60% (4th qtr 08).


The following table shows the average annual total returns before taxes for each class of the Fund's shares.

Average Annual Total Returns for the periods ended December 31, 2010


1 Year

5 Years
(or life of
class, if less)

10 Years
(or life of
class, if less)

Non-Service Shares (inception 01-02-2003)

18.85%


5.77%


9.52%


Service Shares (inception 09-18-2006)

14.81%


0.08%


N/A


Russell 1000® Value Index

15.51%


1.28%


7.07% 2


(reflects no deduction for fees, expenses or taxes)


(0.42%) 1


1.  From 8-31-06
2.  From 12-31-02


Investment Adviser. OppenheimerFunds, Inc. is the Fund's investment adviser (the "Manager").

Portfolio Managers. Mitch Williams has been a portfolio manager and Vice President of the Fund since January 2009.

Purchase and Sale of Fund Shares. Shares of the Fund may be purchased only by separate investment accounts of participating insurance companies as an underlying investment for variable life insurance policies, variable annuity contracts or other investment products. Individual investors cannot buy shares of the Fund directly. You may only submit instructions for buying or selling shares of the Fund to your insurance company or its servicing agent, not directly to the Fund or its Transfer Agent. The accompanying prospectus of the participating insurance company provides information about how to select the Fund as an investment option.

Taxes. Because shares of the Fund may be purchased only through insurance company separate accounts for variable annuity contracts, variable life insurance policies or other investment products, any dividends and capital gains distributions will be taxable to the participating insurance company, if at all. However, those payments may affect the tax basis of certain types of distributions from those accounts. Special tax rules apply to life insurance companies, variable annuity contracts and variable life insurance contracts. For information on federal income taxation of a life insurance company with respect to its receipt of distributions from the Fund and federal income taxation of owners of variable annuity or variable life insurance contracts, see the accompanying prospectus for the applicable contract.

Payments to Broker-Dealers and Other Financial Intermediaries. The Fund, the Manager, or their related companies may make payments to financial intermediaries, including to insurance companies that offer shares of the Fund as an investment option. These payments for the sale of Fund shares and related services may create a conflict of interest by influencing the intermediary and your salesperson to recommend the Fund over another investment. Ask your salesperson or visit your financial intermediary's website for more information.

MORE ABOUT YOUR INVESTMENT

About the Fund's Investments

The allocation of the Fund's portfolio among different types of investments will vary over time and the Fund's portfolio might not always include all of the different types of investments described below. The Statement of Additional Information contains more detailed information about the Fund's investment policies and risks.

THE FUND'S PRINCIPAL INVESTMENT STRATEGIES AND RISKS. The following strategies and types of investments are the ones that the Fund considers to be the most important in seeking to achieve its investment objective and the following risks are those the Fund expects its portfolio to be subject to as a whole.

Common Stock and Other Equity Investments. Equity securities include common stock, preferred stock, rights, warrants and certain debt securities that are convertible into common stock. Equity investments may be exchange-traded or over-the-counter securities. Common stock represents an ownership interest in a company. It ranks below preferred stock and debt securities in claims for dividends and in claims for assets of the issuer in a liquidation or bankruptcy.

Preferred stock has a set dividend rate and ranks ahead of common stocks and behind debt securities in claims for dividends and for assets of the issuer in a liquidation or bankruptcy. The dividends on preferred stock may be cumulative (they remain a liability of the company until paid) or non-cumulative. The fixed dividend rate of preferred stocks may cause their prices to behave more like those of debt securities. When interest rates rise, the value of preferred stock having a fixed dividend rate tends to fall.

A convertible security can be converted into or exchanged for a set amount of common stock of an issuer within a particular period of time at a specified price or according to a price formula. Convertible debt securities pay interest and convertible preferred stocks pay dividends until they mature or are converted, exchanged or redeemed. Some convertible debt securities may be considered "equity equivalents" because of the feature that makes them convertible into common stock. Convertible securities may offer the Fund the ability to participate in stock market movements while also seeking some current income. Convertible securities may provide more income than common stock but they generally provide less income than comparable non-convertible debt securities. Convertible debt securities are subject to credit and interest rate risk. Credit risk is the risk that the issuer of a security might not make interest and principal payments on the security as they become due. Interest rate risk is the risk that when prevailing interest rates fall, the values of already-issued debt securities generally rise; and when prevailing interest rates rise the values of already-issued debt securities generally fall, and they may be worth less than the amount the Fund paid for them. However, credit ratings of convertible securities that are considered to be equity equivalents generally have less impact on the value of the securities than they do for non-convertible debt securities.

     The Fund's convertible debt securities are subject to the same credit rating limits as the Fund's other debt securities and to the Fund's policy of not investing more than 10% of its net assets in all debt securities.

Foreign Investing. The Fund can buy foreign securities that are listed on a domestic or foreign stock exchange, traded in domestic or foreign over-the-counter markets, or that are represented by American Depository Receipts (ADRs). The Fund also can invest in emerging markets, which have greater risks than developed markets. The Fund will hold foreign currency only in connection with buying and selling foreign securities.

       Special Risks of Developing and Emerging Markets.  Developing or emerging market countries generally have less developed securities markets or exchanges. Securities of issuers in developing or emerging market countries may be more difficult to sell at an acceptable price and their prices may be more volatile than securities of issuers in countries with more mature markets. Settlements of trades may be subject to greater delays so that the proceeds of a sale of a security may not be received on a timely basis. The economies of developing or emerging market countries may be more dependent on relatively few industries that may be highly vulnerable to local and global changes. Developing or emerging market countries may have less developed legal and accounting systems, and investments in those countries may be subject to greater risks of government restrictions, including confiscatory taxation, expropriation or nationalization of company assets, restrictions on foreign ownership of local companies and restrictions on withdrawing assets from the country. Their governments may also be more unstable than the governments of more developed countries. The value of the currency of a developing or emerging market country may fluctuate more than the currencies of countries with more mature markets. Investments in securities of issuers in developing or emerging market countries may be considered speculative.

Risks of Small- and Mid-Sized Companies. Small- and mid-sized companies may be either established or newer companies, including "unseasoned" companies that have been in operation for less than three years. While smaller companies might offer greater opportunities for gain than larger companies, they also may involve greater risk of loss. They may be more sensitive to changes in a company's earnings expectations and may experience more abrupt and erratic price movements. Smaller companies' securities often trade in lower volumes and in many instances, are traded over-the-counter or on a regional securities exchange, where the frequency and volume of trading is substantially less than is typical for securities of larger companies traded on national securities exchanges. Therefore, the securities of smaller companies may be subject to wider price fluctuations and it might be harder for the Fund to dispose of its holdings at an acceptable price when it wants to sell them. Small- and mid-sized companies may not have established markets for their products or services and may have fewer customers and product lines. They may have more limited access to financial resources and may not have the financial strength to sustain them through business downturns or adverse market conditions. Since small- and mid-sized companies typically reinvest a high proportion of their earnings in their business, they may not pay dividends for some time, particularly if they are newer companies. Smaller companies may have unseasoned management or less depth in management skill than larger, more established companies. They may be more reliant on the efforts of particular members of their management team and management changes may pose a greater risk to the success of the business. Securities of small, unseasoned companies may be particularly volatile, especially in the short term, and may have very limited liquidity. It may take a substantial period of time to realize a gain on an investment in a small- or mid-sized company, if any gain is realized at all.


OTHER INVESTMENT STRATEGIES AND RISKS. The Fund can also use the investment techniques and strategies described below. The Fund might not use all of these techniques or strategies or might only use them from time to time.

Special Portfolio Diversification Requirements. To enable a variable annuity or variable life insurance contract based on an insurance company separate account to qualify for favorable tax treatment under the Internal Revenue Code, the underlying investments must follow special diversification requirements that limit the percentage of assets that can be invested in securities of particular issuers. The Fund's investment program is managed to meet those requirements, in addition to other diversification requirements under the Internal Revenue Code and the Investment Company Act of 1940, as amended, that apply to publicly-sold mutual funds.

     Failure by the Fund to meet those special requirements could cause earnings on a contract owner's interest in an insurance company separate account to be taxable income. Those diversification requirements might also limit, to some degree, the Fund's investment decisions in a way that could reduce its performance.

Industry and Sector Focus.  At times the Fund may increase the relative emphasis of its investments in a particular industry or sector. The prices of securities of issuers in a particular industry or sector may go up and down in response to changes in economic conditions, government regulations, availability of basic resources or supplies, or other events that affect that industry or sector more than others. To the extent that the Fund increases the relative emphasis of its investments in a particular industry or sector, its share values may fluctuate in response to events affecting that industry or sector. To some extent that risk may be limited by the Fund's policy of not concentrating 25% or more of its total assets in investments in any one industry.

Debt Securities.  The Fund may invest in debt securities, including: securities issued or guaranteed by the U.S. government or its agencies and instrumentalities, foreign government securities, and foreign and domestic corporate bonds and debentures. Debt securities are securities representing money borrowed by the issuer that must be repaid, specifying the amount of principal, the interest or discount rate, and the time or times at which payments are due. Normally the Fund's investments in debt securities, including convertible debt securities, are limited to not more than 10% of the Fund's net assets.

Debt securities may be subject to the following risks:

  • Interest Rate Risk. The values of debt securities usually change when prevailing interest rates change. When interest rates rise, the values of outstanding debt securities generally fall, and those securities may sell at a discount from their face amount. When interest rates fall, the values of already-issued debt securities generally rise. However, when interest rates fall, the Fund's investments in new securities may be at lower yields and may reduce the Fund's income. The values of longer-term debt securities usually change more than the values of shorter-term debt securities when interest rates change.

The Fund may also buy zero-coupon or "stripped" securities, which may be particularly sensitive to interest rate changes. Interest rate changes may have different effects on the values of mortgage-related securities because of prepayment and extension risks.

  • Prepayment Risk. Certain fixed-income securities (in particular mortgage-related securities) are subject to the risk of unanticipated prepayment. That is the risk that when interest rates fall, the issuer will repay the security prior to the security's expected maturity, or with respect to certain fixed-income securities, that borrowers will repay the loans that underlie these securities more quickly than expected, thereby causing the issuer of the security to repay the principal prior to expected maturity. The Fund may need to reinvest the proceeds at a lower interest rate, reducing its income. Securities subject to prepayment risk generally offer less potential for gains when prevailing interest rates fall. If the Fund buys those securities at a premium, accelerated prepayments on those securities could cause the Fund to lose a portion of its principal investment. The impact of prepayments on the price of a security may be difficult to predict and may increase the security's price volatility. Interest-only and principal-only securities are especially sensitive to interest rate changes, which can affect not only their prices but can also change the income flows and repayment assumptions about those investments.

  • Extension Risk. If interest rates rise rapidly, repayments of principal on certain debt securities may occur at a slower rate than expected and the expected maturity of those securities could lengthen as a result. Securities that are subject to extension risk generally have a greater potential for loss when prevailing interest rates rise, which could cause their values to fall sharply.

  • Credit Risk. Debt securities are also subject to credit risk. Credit risk is the risk that the issuer of a security might not make interest and principal payments on the security as they become due. U.S. Government securities generally have lower credit risks than securities issued by private issuers or certain foreign governments. If an issuer fails to pay interest, the Fund's income might be reduced, and if an issuer fails to repay principal, the value of the security might fall and the Fund could lose the amount of its investment in the security. The extent of this risk varies based on the terms of the particular security and the financial condition of the issuer. A downgrade in an issuer's credit rating or other adverse news about an issuer can reduce the market value of that issuer's securities.

Credit Quality.  The Fund may invest in securities that are rated or unrated. "Investment-grade" securities are those rated in one of the top four rating categories by nationally recognized statistical rating organizations such as Moody's or Standard & Poor's or unrated securities judged by the Manager to be of comparable quality. "Lower-grade" securities are those that are rated below those categories, which are also referred to as "junk bonds." While securities rated "Baa" by Moody's or "BBB" by Standard & Poor's are considered "investment-grade," they may also have some speculative characteristics. 

Credit ratings evaluate the expectation that scheduled interest and principal payments will be made in a timely manner. They do not reflect any judgment of market risk. Rating agencies might not always change their credit rating of an issuer in a timely manner to reflect events that could affect the issuer's ability to make scheduled payments on its obligations. In selecting securities for its portfolio and evaluating their income potential and credit risk, the Fund does not rely solely on ratings by rating organizations but evaluates business and economic factors affecting issuers as well. The ratings definitions of the principal ratings organizations are included in Appendix B to the Fund's Statement of Additional Information.

     The Fund can invest in debt securities with credit ratings as low as "B," or in equivalent unrated securities. Below investment-grade debt securities are commonly known as "junk bonds."

Fixed-Income Market Risks. Recent developments relating to subprime mortgages have adversely affected fixed-income securities markets in the United States, Europe and elsewhere. The values of many types of debt securities have been reduced, including debt securities that are not related to mortgage loans. These developments have reduced the willingness of some lenders to extend credit and have made it more difficult for borrowers to obtain financing on attractive terms or at all. In addition, broker-dealers and other market participants have been less willing to make a market in some types of debt instruments, which has impacted the liquidity of those instruments. These developments may also have a negative effect on the broader economy. There is a risk that the lack of liquidity or other adverse credit market conditions may hamper the Fund's ability to sell the debt securities in which it invests or to find and purchase suitable debt instruments.

     Special Risks of Lower-Grade Securities. Lower-grade debt securities, whether rated or unrated, have greater risks than investment-grade securities. They may be subject to greater price fluctuations and have a greater risk that the issuer might not be able to pay interest and principal when due. The market for lower-grade securities may be less liquid and therefore they may be harder to value or to sell at an acceptable price, especially during times of market volatility or decline.

The Fund can invest in debt securities with credit ratings as low as "B," or in equivalent unrated securities. Below investment grade debt securities are commonly known as "junk bonds."

Derivative Investments. The Fund can invest in "derivative" instruments. A derivative is an instrument whose value depends on (or is derived from) the value of an underlying security, asset, interest rate, index or currency.  Derivatives may allow the Fund to increase or decrease its exposure to certain markets or risks.  

The Fund may use derivatives to seek to increase its investment return or for hedging purposes. The Fund is not required to use derivatives in seeking its investment objective or for hedging and might not do so.

     Options, futures, forward contracts, swaps, mortgage-related securities and "stripped" securities are some of the types of derivatives the Fund can use. The Fund may also use other types of derivatives that are consistent with its investment strategies or for hedging purposes.

Hedging. Hedging transactions are intended to reduce the risks of securities in the Fund's portfolio. At times, however, a hedging instrument's value might not be correlated with the investment it is intended to hedge, and the hedge might be unsuccessful. If the Fund uses a hedging instrument at the wrong time or judges market conditions incorrectly, the strategy could reduce its return or create a loss.

 Risks of Derivative Investments. Derivatives may be volatile and may involve significant risks. The underlying security, obligor or other instrument on which a derivative is based, or the derivative itself, may not perform the way the Manager expects it to. The Fund may lose money on a derivative investment if the issuer or counterparty fails to pay the amount due. Certain derivative investments held by the Fund may be illiquid, making it difficult to close out an unfavorable position. Derivative transactions may require the payment of premiums and can increase portfolio turnover. As a result, the Fund could realize little or no income or lose principal from the investment, or a hedge might be unsuccessful. For some derivatives, it is possible for the Fund to lose more than the amount invested in the derivative instrument. Some derivatives have the potential for unlimited loss, regardless of the size of the Fund's initial investment.

Asset-Backed Securities. The Fund may invest in asset-backed securities, which are fractional interests in pools of loans, receivables or other assets. They are issued by trusts or other special purpose vehicles and are collateralized by the loans, receivables or other assets that make up the pool. The trust or other issuer passes the income from the underlying asset pool to the investor. Neither the Fund nor the Manager selects the loans, receivables or other assets that are included in the pools or the collateral backing those pools. Asset-backed securities are subject to interest rate risk and credit risk. These securities are subject to the risk of default by the issuer as well as by the borrowers of the underlying loans in the pool. Certain asset-backed securities are subject to prepayment and extension risks.

Illiquid and Restricted Securities. Investments that do not have an active trading market, or that have legal or contractual limitations on their resale, are generally referred to as "illiquid" securities. Illiquid securities may be difficult to value or to sell promptly at an acceptable price or may require registration under applicable securities laws before they can be sold publicly. Securities that have limitations on their resale are referred to as "restricted securities." Certain restricted securities that are eligible for resale to qualified institutional purchasers may not be regarded as illiquid.

The Fund will not invest more than 10% of its net assets in illiquid or restricted securities.  The Board can increase that limit to 15%. The Manager monitors the Fund's holdings of illiquid securities on an ongoing basis to determine whether to sell any of those securities to maintain adequate liquidity.

Conflicts of Interest. The investment activities of the Manager and its affiliates in regard to other funds and accounts they manage may present conflicts of interest that could disadvantage the Fund and its shareholders. The Manager or its affiliates may provide investment advisory services to other funds and accounts that have investment objectives or strategies that differ from, or are contrary to, those of the Fund. That may result in another fund or account holding investment positions that are adverse to the Fund's investment strategies or activities. Other funds or accounts advised by the Manager or its affiliates may have conflicting interests arising from investment objectives that are similar to those of the Fund. Those funds and accounts may engage in, and compete for, the same types of securities or other investments as the Fund or invest in securities of the same issuers that have different, and possibly conflicting, characteristics. The trading and other investment activities of those other funds or accounts may be carried out without regard to the investment activities of the Fund and, as a result, the value of securities held by the Fund or the Fund's investment strategies may be adversely affected. The Fund's investment performance will usually differ from the performance of other accounts advised by the Manager or its affiliates and the Fund may experience losses during periods in which other accounts advised by the Manager or its affiliates achieve gains. The Manager has adopted policies and procedures designed to address potential conflicts of interest identified by the Manager; however, such policies and procedures may also limit the Fund's investment activities and affect its performance.

     The Fund offers its shares to separate accounts of different insurance companies, as an investment for their variable annuity contracts, variable life insurance policies and other investment products. While the Fund does not foresee any disadvantages to contract owners from these arrangements, it is possible that the interests of owners of different contracts participating in the Fund through different separate accounts might conflict. For example, a conflict could arise because of differences in tax treatment.

Investments in Oppenheimer Institutional Money Market Fund. The Fund can invest its free cash balances in Class E shares of Oppenheimer Institutional Money Market Fund to provide liquidity or for defensive purposes. The Fund invests in Oppenheimer Institutional Money Market Fund, rather than purchasing individual short-term investments, to seek a higher yield than it could obtain on its own. Oppenheimer Institutional Money Market Fund is a registered open-end management investment company, regulated as a money market fund under the Investment Company Act of 1940, and is part of the Oppenheimer family of funds. It invests in a variety of short-term, high-quality, dollar-denominated money market instruments issued by the U.S. Government, domestic and foreign corporations, other financial institutions, and other entities. Those investments may have a higher rate of return than the investments that would be available to the Fund directly. At the time of an investment, the Fund cannot always predict what the yield of the Oppenheimer Institutional Money Market Fund will be because of the wide variety of instruments that fund holds in its portfolio. The return on those investments may, in some cases, be lower than the return that would have been derived from other types of investments that would provide liquidity. As a shareholder, the Fund will be subject to its proportional share of the expenses of Oppenheimer Institutional Money Market Fund's Class E shares, including its advisory fee. However, the Manager will waive a portion of the Fund's advisory fee to the extent of the Fund's share of the advisory fee paid to the Manager by Oppenheimer Institutional Money Market Fund.

Cash and Cash Equivalents. Under normal market conditions the Fund can invest up to 15% of its net assets in cash and cash equivalents, including shares of Oppenheimer Institutional Money Market Fund. This strategy would be used primarily for cash management or liquidity purposes. To the extent that the Fund uses this strategy, it might reduce its opportunities to seek its objective of long-term growth of capital.

Temporary Defensive and Interim Investments. For temporary defensive purposes in times of adverse or unstable market, economic or political conditions, the Fund can invest up to 100% of its total assets in investments that may be inconsistent with the Fund's principal investment strategies. Generally, the Fund would invest in shares of Oppenheimer Institutional Money Market Fund or in the types of money market instruments in which Oppenheimer Institutional Money Market Fund invests or in other short-term U.S. Government securities. The Fund might also hold these types of securities as interim investments pending the investment of proceeds from the sale of Fund shares or the sale of Fund portfolio securities or to meet anticipated redemptions of Fund shares. To the extent the Fund invests in these securities, it might not achieve its investment objective.

Portfolio Turnover . A change in the securities held by the Fund is known as "portfolio turnover." The Fund may engage in active and frequent trading to try to achieve its investment objective and may have a portfolio turnover rate of over 100% annually. Increased portfolio turnover may result in higher brokerage fees or other transaction costs, which can reduce performance. The Financial Highlights table at the end of this prospectus shows the Fund's portfolio turnover rates during past fiscal years.


CHANGES TO THE FUND'S INVESTMENT POLICIES. The Fund's fundamental investment policies cannot be changed without the approval of a majority of the Fund's outstanding voting shares, however, the Fund's Board can change non-fundamental policies without a shareholder vote. Significant policy changes will be described in supplements to this prospectus. The Fund's investment objective is not a fundamental policy but will not be changed by the Board without advance notice to shareholders. Investment restrictions that are fundamental policies are listed in the Fund's Statement of Additional Information. An investment policy is not fundamental unless this prospectus or the Statement of Additional Information states that it is.

PORTFOLIO HOLDINGS.   The Fund's portfolio holdings are included in its semi-annual and annual reports that are distributed to its shareholders within 60 days after the close of the applicable reporting period. The Fund also discloses its portfolio holdings in its Statements of Investments on Form N-Q, which are public filings that are required to be made with the Securities and Exchange Commission within 60 days after the end of the Fund's first and third fiscal quarters. Therefore, the Fund's portfolio holdings are made publicly available no later than 60 days after the end of each of its fiscal quarters. In addition, the Fund's portfolio holdings information, as of the end of each calendar month, may be posted and available on the Fund's website no sooner than 30 days after the end of each calendar month.    

A description of the Fund's policies and procedures with respect to the disclosure of its portfolio holdings is available in the Fund's Statement of Additional Information.

How the Fund is Managed

THE MANAGER. OppenheimerFunds, Inc., the Manager, chooses the Fund's investments and handles its day-to-day business. The Manager carries out its duties, subject to the policies established by the Fund's Board of Trustees, under an investment advisory agreement that states the Manager's responsibilities. The agreement sets the fees the Fund pays to the Manager and describes the expenses that the Fund is responsible to pay to conduct its business.

The Manager has been an investment adviser since 1960. The Manager is located at Two World Financial Center, 225 Liberty Street, 11th Floor, New York, New York 10281-1008.

Advisory Fees.  Under the investment advisory agreement, the Fund pays the Manager an advisory fee at an annual rate that declines on additional assets as the Fund grows: 0.75% of the first $200 million of average annual net assets, 0.72% of the next $200 million, 0.69% of the next $200 million, 0.66% of the next $200 million, and 0.60% of average annual net assets over $800 million.  The Fund's management fee for its fiscal year ended December 31, 2010, was 0.75% of the Fund's average annual net assets for each class of shares.

The Manager has voluntarily agreed to limit the Fund's total annual operating expenses so that those expenses, as percentages of daily net assets, will not exceed the annual rate of 0.80% for Non-Service Shares and 1.05% for Service Shares. This voluntary expense limitation may not be amended or withdrawn until one year after the date of this prospectus. The Manager has also voluntarily agreed to waive fees and/or reimburse Fund expenses in an amount equal to the indirect management fees incurred through the Fund's investment in Oppenheimer Institutional Money Market Fund. This waiver/and or reimbursement may be amended or withdrawn at any time. During the fiscal year ended December 31, 2010, this amount did not exceed 0.01% and therefore is not reflected in the Annual Fund Operating Expenses table shown earlier in this prospectus. After all waivers and reimbursements, actual total annual fund operating expenses for the fiscal year ended December 31, 2010 were those shown in the Annual Fund Operating Expenses table earlier in this prospectus.

A discussion regarding the basis for the Board of Trustees' approval of the Fund's investment advisory contract is available in the Fund's Annual Report to shareholders for the year ended December 31, 2010.

Portfolio Manager. The Fund's portfolio is managed by Mitch Williams, who is primarily responsible for the day-to-day management of the Fund's investments. Mr. Williams has been a portfolio manager and Vice President of the Fund since January 2009.

     Mr. Williams, CFA, has been a Vice President of the Manager since July 2006 and a Senior Research Analyst of the Manager since April 2002. He was a Vice President and Research Analyst for Evergreen Funds from October 2000 to January 2002. Mr. Williams is a portfolio manager of other portfolios in the OppenheimerFunds complex.

The Statement of Additional Information provides additional information about the portfolio manager's compensation, other accounts he manages and his ownership of Fund shares.

INVESTING IN THE FUND 

How to Buy and Sell Shares

You may only submit instructions for buying or selling shares of the Fund to your insurance company or its servicing agent, not directly to the Fund or its Transfer Agent. Information about your investment in the Fund can only be obtained from your participating insurance company or its servicing agent. The Fund's Transfer Agent does not hold or have access to those records.

WHAT CLASSES OF SHARES DOES THE FUND OFFER? The Fund currently offers two different classes of shares. The different classes of shares represent investments in the same portfolio of securities, but the classes are subject to different expenses and will usually have different share prices. The Service Shares are subject to a distribution and service plan. The expenses of that plan are described below. The Non-Service Shares are not subject to a service and distribution plan.

THE PRICE OF FUND SHARES. Fund shares are sold to participating insurance companies, and are redeemed, at their net asset value per share. The net asset value that applies to a purchase order is the next one calculated after the insurance company (as the Fund's designated agent to receive purchase orders) receives the order from its contract owner, in proper form. Fund shares are redeemed at the next net asset value calculated after the insurance company (as the Fund's designated agent to receive purchase orders) receives the order from its contract owner, in proper form. The Fund's Transfer Agent generally must receive the purchase or redemption order from the insurance company by 9:30 a.m. Eastern Time on the next regular business day.

The Fund does not impose any sales charge on purchases of its shares. If there are any charges imposed under the variable annuity, variable life or other contract through which Fund shares are purchased, they are described in the accompanying prospectus of the participating insurance company. The participating insurance company's prospectus may also include information regarding the time you must submit your purchase and redemption orders.

     The sale and redemption price for Fund shares will change from day to day because the value of the securities in its portfolio and its expenses fluctuate. The redemption price will normally differ for different classes of shares. The redemption price of your shares may be more or less than their original cost.

Net Asset Value. The Fund calculates the net asset value of each class of shares as of the close of the New York Stock Exchange (NYSE), on each day the NYSE is open for trading (referred to in this prospectus as a "regular business day"). The NYSE normally closes at 4:00 p.m., Eastern Time, but may close earlier on some days.

The Fund determines the net assets of each class of shares by subtracting the class-specific expenses and the amount of the Fund's liabilities attributable to the share class from the market value of the Fund's securities and other assets attributable to the share class. The Fund's "other assets" might include, for example, cash and interest or dividends from its portfolio securities that have been accrued but not yet collected. The Fund's securities are valued primarily on the basis of current market quotations.

The net asset value per share for each share class is determined by dividing the net assets of the class by the number of outstanding shares of that class.

     Fair Value Pricing. If market quotations are not readily available or (in the Manager's judgment) do not accurately reflect the fair value of a security, or if after the close of the principal market on which a security held by the Fund is traded and before the time as of which the Fund's net asset value is calculated that day, an event occurs that the Manager learns of and believes in the exercise of its judgment will cause a material change in the value of that security from the closing price of the security on the principal market on which it is traded, that security may be valued by another method that the Board believes would more accurately reflect the security's fair value.

In determining whether current market prices are readily available and reliable, the Manager monitors the information it receives in the ordinary course of its investment management responsibilities. It seeks to identify significant events that it believes, in good faith, will affect the market prices of the securities held by the Fund. Those may include events affecting specific issuers (for example, a halt in trading of the securities of an issuer on an exchange during the trading day) or events affecting securities markets (for example, a foreign securities market closes early because of a natural disaster). The Board has adopted valuation procedures for the Fund and has delegated the day-to-day responsibility for fair value determinations to the Manager's "Valuation Committee." Those determinations may include consideration of recent transactions in comparable securities, information relating to the specific security, developments in the markets and their performance, and current valuations of foreign or U.S. indices. Fair value determinations by the Manager are subject to review, approval and ratification by the Board at its next scheduled meeting after the fair valuations are determined.

The Fund's use of fair value pricing procedures involves subjective judgments and it is possible that the fair value determined for a security may be materially different from the value that could be realized upon the sale of that security. Accordingly, there can be no assurance that the Fund could obtain the fair value assigned to a security if it were to sell the security at approximately the same time at which the Fund determines its net asset value per share.

     Pricing Foreign Securities . The Fund may use fair value pricing more frequently for securities primarily traded on foreign exchanges. Because many foreign markets close hours before the Fund values its foreign portfolio holdings, significant events, including broad market movements, may occur during that time that could potentially affect the values of foreign securities held by the Fund.

The Manager believes that foreign securities values may be affected by volatility that occurs in U.S. markets after the close of foreign securities markets. The Manager's fair valuation procedures therefore include a procedure whereby foreign securities prices may be "fair valued" to take those factors into account.

Because some foreign securities trade in markets and on exchanges that operate on weekends and U.S. holidays, the values of some of the Fund's foreign investments may change on days when investors cannot buy or redeem Fund shares.

HOW CAN YOU BUY FUND SHARES? Shares of the Fund may be purchased only by separate investment accounts of participating insurance companies as an underlying investment for variable life insurance policies, variable annuity contracts or other investment products. Individual investors cannot buy shares of the Fund directly. Please refer to the accompanying prospectus of the participating insurance company for information on how to select the Fund as an investment option. That prospectus will indicate which share class you may be eligible to purchase.

Suspension of Share Offering. The offering of Fund shares may be suspended during any period in which the determination of net asset value is suspended, and may be suspended by the Board at any time the Board believes it is in the Fund's best interest to do so.

HOW CAN YOU REDEEM FUND SHARES? Only the participating insurance companies that hold Fund shares in their separate accounts can place orders to redeem shares. Contract holders and policy holders should not directly contact the Fund or its transfer agent to request a redemption of Fund shares. The Fund normally sends payment by Federal Funds wire to the insurance company's account on the next business day after the Fund receives the order (and no later than seven days after the Fund's receipt of the order). Under unusual circumstances determined by the Securities and Exchange Commission, payment may be delayed or suspended. Contract owners should refer to the withdrawal or surrender instructions in the accompanying prospectus of the participating insurance company.

Limitations on Frequent Transactions

Frequent purchases and redemptions of Fund shares may interfere with the Manager's ability to manage the Fund's investments efficiently, may increase its transaction and administrative costs and may affect its performance, depending on various factors, such as the size of the Fund, the nature of its investments, the amount of Fund assets the portfolio manager maintains in cash or cash equivalents, and the aggregate dollar amount, the number and the frequency of trades.

If large dollar amounts are involved in frequent redemption transactions, the Fund might be required to sell portfolio securities at unfavorable times to meet those transaction requests, and the Fund's brokerage or administrative expenses might be increased. Therefore, the Manager and the Fund's Board have adopted the following policies and procedures to detect and prevent frequent and/or excessive purchase and redemption activity, while addressing the needs of investors who seek liquidity in their investment. There is no guarantee that those policies and procedures, described below, will be sufficient to identify and deter all excessive short-term trading. If the Transfer Agent is not able to detect and curtail such activity, frequent trading could occur in the Fund.

Policies on Disruptive Activity.  The Transfer Agent and the Distributor, on behalf of the Fund, have entered into agreements with participating insurance companies designed to detect and restrict excessive short-term trading activity by contract or policy owners or their financial advisers in their accounts. The Transfer Agent generally does not consider periodic asset allocation or re-balancing that affects a portion of the Fund shares held in the account of a policy or contract owner to be "excessive trading." However, the Transfer Agent has advised participating insurance companies that it generally considers certain other types of trading activity to be "excessive," such as making a "transfer" out of the Fund within 30 days after buying Fund shares (by the sale of the recently purchased Fund shares and the purchase of shares of another fund) or making more than six "round-trip transfers" between funds during one year. The agreements require participating insurance companies to provide transaction information to the Fund and to execute Fund instructions to restrict trading in Fund shares.

 A participating insurance company may also have its own policies and procedures and may impose its own restrictions or limitations to discourage short-term and/or excessive trading by its policy or contract owners. Those policies and procedures may be different from the Fund's in certain respects. You should refer to the prospectus for your insurance company variable annuity contract for specific information about the insurance company's policies. Under certain circumstances, policy or contract owners may be required to transmit purchase or redemption orders only by first class U.S. mail.

Monitoring the Policies. The Fund's policies and procedures for detecting and deterring frequent or excessive trading are administered by the Fund's Transfer Agent. However, the Transfer Agent presently does not have the ability to directly monitor trading activity in the accounts of policy or contract owners within the participating insurance companies' accounts. The Transfer Agent's ability to monitor and deter excessive short-term trading in such insurance company accounts ultimately depends on the capability and diligence of each participating insurance company, under their agreements with the Transfer Agent, the Distributor and the Fund, in monitoring and controlling the trading activity of the policy or contract owners in the insurance company's accounts.

The Transfer Agent will attempt to monitor the net effect on the Fund's assets from the purchase and redemption activity in the accounts of participating insurance companies and will seek to identify patterns that may suggest excessive trading by the contract or policy owners who invest in the insurance company's accounts. If the Transfer Agent believes it has observed evidence of possible excessive trading activity, it will ask the participating insurance companies or other registered owners to provide information about the transaction activity of the contract or policy holders in their respective accounts, and to take appropriate action. In that case, the insurance company must confirm to the Transfer Agent that appropriate action has been taken to curtail the excessive trading activity.

The Transfer Agent will, subject to the limitations described in this section, limit or terminate the trading activity of any person, group or account that it believes would be excessive or disruptive. However, the Transfer Agent may not be able to detect or curtail all such trading activity in the Fund. The Transfer Agent will evaluate trading activity on a case by case basis and the limitations placed on trading may vary between accounts.

Right to Refuse Purchase Orders. The Fund's Distributor or Transfer Agent may, in their discretion, refuse any purchase order and are not obligated to provide notice before rejecting an order.  

DISTRIBUTION AND SERVICE (12b-1) PLANS

Distribution and Service Plan for Service Shares. The Fund has adopted a Distribution and Service Plan for Service Shares to pay the Distributor for distribution related services, personal services and account maintenance for those shares. Under the Plan, the Fund pays the Distributor quarterly at an annual rate of up to 0.25% of the daily net assets of the Fund's Service Shares. Because these fees are paid out of the Fund's assets on an on-going basis, over time they will increase the operating expenses of the Service Shares and may cost you more than other types of fees or sales charges. As a result, the Service Shares may have lower performance compared to the Fund's shares that are not subject to a service fee.

     Use of Plan Fees: The Distributor currently uses all of those fees to compensate sponsor(s) of the insurance product for providing personal services and account maintenance for variable contract owners that hold Service Shares.

PAYMENTS TO FINANCIAL INTERMEDIARIES AND SERVICE PROVIDERS. The Manager and the Distributor, in their discretion, may also make payments for distribution and/or shareholder servicing activities to brokers, dealers and other financial intermediaries, including the insurance companies that offer the Fund as an investment option, or to service providers. Those payments are made out of the Manager's and/or the Distributor's own resources and/or assets, including from the revenues or profits derived from the advisory fees the Manager receives from the Fund. Those cash payments, which may be substantial, are paid to many firms having business relationships with the Manager and Distributor and are in addition to any distribution fees, servicing fees, or transfer agency fees paid directly or indirectly by the Fund to those entities. Payments by the Manager or Distributor from their own resources are not reflected in the tables in the "Fees and Expenses of the Fund" section of this prospectus because they are not paid by the Fund.

The financial intermediaries that may receive those payments include firms that offer and sell Fund shares to their clients, or provide shareholder services to the Fund, or both, and receive compensation for those activities. The financial intermediaries that may receive payments include securities brokers, dealers, financial advisers, insurance companies that offer variable annuity or variable life insurance products and other intermediaries.

In general, these payments to financial intermediaries can be categorized as "distribution-related" or "servicing" payments. Payments for distribution-related expenses, such as marketing or promotional expenses, are often referred to as "revenue sharing." Revenue sharing payments may be made on the basis of the sales of shares attributable to that intermediary, the average net assets of the Fund and other Oppenheimer funds attributable to the accounts of that intermediary and its clients, negotiated lump sum payments for distribution services provided, or similar fees. In some circumstances, revenue sharing payments may create an incentive for a financial intermediary or its representatives to recommend or offer shares of the Fund or other Oppenheimer funds to its customers. These payments also may give an intermediary an incentive to cooperate with the Distributor's marketing efforts. A revenue sharing payment may, for example, qualify the Fund for preferred status with the intermediary receiving the payment or provide representatives of the Distributor with access to representatives of the intermediary's sales force, in some cases on a preferential basis over funds of competitors. Additionally, as firm support, the Manager or Distributor may reimburse expenses related to educational seminars and "due diligence" or training meetings (to the extent permitted by applicable laws or the rules of the Financial Industry Regulatory Authority ("FINRA")) designed to increase sales representatives' awareness about Oppenheimer funds, including travel and lodging expenditures. However, the Manager does not consider a financial intermediary's sale of shares of the Fund or other Oppenheimer funds when selecting brokers or dealers to effect portfolio transactions for the funds.

Various factors are used to determine whether to make revenue sharing payments. Possible considerations include, without limitation, the types of services provided by the intermediary, sales of Fund shares, the redemption rates on accounts of clients of the intermediary or overall asset levels of Oppenheimer funds held for or by clients of the intermediary, the willingness of the intermediary to allow the Distributor to provide educational and training support for the intermediary's sales personnel relating to the Oppenheimer funds, the availability of the Oppenheimer funds on the intermediary's sales system, as well as the overall quality of the services provided by the intermediary and the Manager or Distributor's relationship with the intermediary. The Manager and Distributor have adopted guidelines for assessing and implementing each prospective revenue sharing arrangement. To the extent that financial intermediaries receiving distribution-related payments from the Manager or Distributor sell more shares of the Oppenheimer funds or retain more shares of the funds in their client accounts, the Manager and Distributor benefit from the incremental management and other fees they receive with respect to those assets.

Payments may also be made by the Manager, the Distributor or the Transfer Agent to financial intermediaries to compensate or reimburse them for administrative or other client services provided such as sub-transfer agency services for shareholders, omnibus accounting or sub-accounting, participation in networking arrangements, account set-up, recordkeeping and other shareholder services. Payments may also be made for administrative services related to the distribution of Fund shares through the intermediary. Firms that may receive servicing fees include insurance companies that offer variable annuity or variable life insurance products and others. These fees may be used by the service provider to offset or reduce fees that would otherwise be paid directly to them by certain account holders. The Statement of Additional Information contains more information about revenue sharing and service payments made by the Manager or the Distributor. Your broker, dealer or other financial intermediary may charge you fees or commissions in addition to those disclosed in this prospectus. You should ask your financial intermediary for details about any such payments it receives from the Manager or the Distributor and their affiliates, or any other fees or expenses it charges.

Dividends, Capital Gains and Taxes

DIVIDENDS AND DISTRIBUTIONS. The Fund intends to declare and pay dividends annually from any net investment income. The Fund may also realize capital gains on the sale of portfolio securities, in which case it may make distributions out of any net short-term or long-term capital gains annually. The Fund may also make supplemental distributions of dividends and capital gains following the end of its fiscal year. The Fund has no fixed dividend rate and cannot guarantee that it will pay any dividends or capital gains distributions in a particular year.

Dividends and distributions are paid separately for each share class. Because of the higher expenses on Service Shares, the dividends and capital gains distributions paid on those shares will generally be lower than for other Fund shares.

Receiving Dividends and Distributions. Any dividends and capital gains distributions will be automatically reinvested in additional Fund shares for the account of the participating insurance company, unless the insurance company elects to have dividends or distributions paid in cash.

TAXES. For a discussion of the tax status of a variable annuity contract, a variable life insurance policy or other investment product of a participating insurance company, please refer to the accompanying variable contract prospectus of your participating insurance company. Because shares of the Fund may be purchased only through insurance company separate accounts for variable annuity contracts, variable life insurance policies or other investment products, any dividends from net investment income and distributions of net realized short-term and long-term capital gains will be taxable, if at all, to the participating insurance company. However, those payments may affect the tax basis of certain types of distributions from those accounts.

The Fund has qualified and intends to qualify each year to be taxed as a regulated investment company under the Internal Revenue Code by satisfying certain income, asset diversification and income distribution requirements, but reserves the right not to so qualify. In each year that it qualifies as a regulated investment company, the Fund will not be subject to federal income taxes on its income that it distributes to shareholders.

This information is only a summary of certain Federal income tax information about your investment. You are encouraged to consult your tax adviser about the effect of an investment in the Fund on your particular tax situation and about any changes to the Internal Revenue Code that may occur from time to time. Additional information about the tax effects of investing in the Fund is contained in the Statement of Additional Information.

Financial Highlights

The Financial Highlights Table is presented to help you understand the Fund's financial performance for the past five fiscal years. Certain information reflects financial results for a single Fund share. The total returns in the table represent the rate that an investor would have earned (or lost) on an investment in the Fund (assuming reinvestment of all dividends and distributions). This information has been audited by KPMG LLP, the Fund's independent registered public accounting firm for the fiscal years ended December 31, 2010 and 2009. The financial highlights for the prior years were audited by another independent registered public accounting firm. KPMG's report, along with the Fund's financial statements, are included in the Statement of Additional Information, which is available upon request.

Financial Highlights Table

FINANCIAL HIGHLIGHTS

Non-Service Shares      Year Ended December 31,

2010


2009


2008


2007


2006


Per Share Operating Data


Net asset value, beginning of period

$7.22


$4.99


$11.73


$11.58


$11.16


Income (loss) from investment operations:


Net investment income (loss)1

.11


.11


.12


.10


(.03)


Net realized and unrealized gain (loss)

1.24


2.14


(4.44)


.59


1.61


Total from investment operations

1.35


2.25


(4.32)


.69


1.58


Dividends and/or distributions to shareholders:


Dividends from net investment income

(.08)


(.02)


(2.42)


(.10)


(.01)


Distributions from net realized gain

--


--


--


(.44)


(1.15)


Total dividends and/or distributions to shareholders

(.08)


(.02)


(2.42)


(.54)


(1.16)


Net asset value, end of period

$8.49


$7.22


$4.99


$11.73


$11.58


Total Return, at Net Asset Value2

18.85%


45.08%


(36.43)%


5.89%


14.03%


Ratios/Supplemental Data


Net assets, end of period (in thousands)

$92


$38


$ 6


$1,728


$2,657


Average net assets (in thousands)

$57


$20


$857


$2,753


$2,695


Ratios to average net assets:3


Net investment income (loss)

1.46%


1.75%


1.07%


0.80%


(0.29)%


Total expenses4

2.05%


2.30%


1.48%


1.49%


2.14%


Expenses after payments, waivers and/or reimbursements and reduction to custodian expenses

0.57%


0.85%


1.25%


1.25%


2.14%


Portfolio turnover rate

109%


122%


175%


142%


124%


1. Per share amounts calculated based on the average shares outstanding during the period.

2. Assumes an initial investment on the business day before the first day of the fiscal period, with all dividends and distributions reinvested in additional shares on the reinvestment date, and redemption at the net asset value calculated on the last business day of the fiscal period. Total returns are not annualized for periods less than one full year. Total return information does not reflect expenses that apply at the separate account level or to related insurance products. Inclusion of these charges would reduce the total return figures for all periods shown. Returns do not reflect the deduction of taxes that a shareholder would pay on fund distributions or the redemption of fund shares.

3. Annualized for periods less than one full year.

4. Total expenses including indirect expenses from affiliated fund were as follows:

Year Ended December 31, 2010

2.05%

Year Ended December 31, 2009

2.31%

Year Ended December 31, 2008

1.48%

Year Ended December 31, 2007

1.49%

Year Ended December 31, 2006

2.14%

Service Shares      Year Ended December 31,

2010


2009


2008


2007


20061


Per Share Operating Data


Net asset value, beginning of period

$8.99


$6.79


$11.75


$11.57


$11.89


Income (loss) from investment operations:


Net investment income (loss)2

.08


.09


.08


.06


(.05)


Net realized and unrealized gain (loss)

1.24


2.12


(4.97)


.60


.88


Total from investment operations

1.32


2.21


(4.89)


.66


.83


Dividends and/or distributions to shareholders:


Dividends from net investment income

(.08)


(.01)


(.07)


(.04)


--


Distributions from net realized gain

--


--


--


(.44)


(1.15)


Total dividends and/or distributions to shareholders

(.08)


(.01)


(.07)


(.48)


(1.15)


Net asset value, end of period

$10.23


$8.99


$6.79


$11.75


$11.57


Total Return, at Net Asset Value3

14.81%


32.57%


(41.62)%


5.70%


6.81%


Ratios/Supplemental Data


Net assets, end of period (in thousands)

$7,311


$7,505


$4,690


$6,481


$455


Average net assets (in thousands)

$7,008


$5,501


$5,561


$3,527


$268


Ratios to average net assets:4


Net investment income (loss)

0.85%


1.10%


0.84%


0.49%


(1.30)%


Total expenses5

2.08%


2.17%


2.13%


1.63%


2.89%


Expenses after payments, waivers and/or reimbursements and reduction to custodian expenses

0.93%


1.15%


1.50%


1.50%


2.88%


Portfolio turnover rate

109%


122%


175%


142%


124%


1. For the period from September 18, 2006 (inception of offering) to December 31, 2006.

2. Per share amounts calculated based on the average shares outstanding during the period.

3. Assumes an initial investment on the business day before the first day of the fiscal period, with all dividends and distributions reinvested in additional shares on the reinvestment date, and redemption at the net asset value calculated on the last business day of the fiscal period. Total returns are not annualized for periods less than one full year. Total return information does not reflect expenses that apply at the separate account level or to related insurance products. Inclusion of these charges would reduce the total return figures for all periods shown. Returns do not reflect the deduction of taxes that a shareholder would pay on fund distributions or the redemption of fund shares.

4. Annualized for periods less than one full year.

5. Total expenses including indirect expenses from affiliated fund were as follows:

Year Ended December 31, 2010

2.08%

Year Ended December 31, 2009

2.18%

Year Ended December 31, 2008

2.13%

Year Ended December 31, 2007

1.63%

Period Ended December 31, 2006

2.89%


INFORMATION AND SERVICES

STATEMENT OF ADDITIONAL INFORMATION. This document includes additional information about the Fund's investment policies, risks, and operations. It is incorporated by reference into this prospectus (it is legally part of this prospectus).

ANNUAL AND SEMI-ANNUAL REPORTS. The Fund's Annual and Semi-Annual Reports provide additional information about the Fund's investments and performance. The Annual Report includes a discussion of market conditions and investment strategies that significantly affected the Fund's performance during its last fiscal year.

How to Request More Information

You can request the above documents, the notice explaining the Fund's privacy policy, and other information about the Fund, without charge, by:

Telephone:

Call OppenheimerFunds Services toll-free: 1.800.988.8287

Mail:

Use the following address for regular mail:
OppenheimerFunds Services
P.O. Box 5270
Denver, Colorado 80217-5270

Use the following address for courier or express mail:
OppenheimerFunds Services
12100 East Iliff Avenue
Suite 300
Aurora, Colorado 80014

Internet:

You can read or download the Fund's Statement of Additional Information, Annual and Semi-Annual Reports on the OppenheimerFunds website at: www.oppenheimerfunds.com


Information about the Fund including the Statement of Additional Information can be reviewed and copied at the SEC's Public Reference Room in Washington, D.C. Information on the operation of the Public Reference Room may be obtained by calling the SEC at 1.202.551.8090. Reports and other information about the Fund are available on the EDGAR database on the SEC's website at www.sec.gov. Copies may be obtained after payment of a duplicating fee by electronic request at the SEC's e-mail address: publicinfo@sec.gov or by writing to the SEC's Public Reference Section, Washington, D.C. 20549-1520.

No one has been authorized to provide any information about the Fund or to make any representations about the Fund other than what is contained in this prospectus. This prospectus is not an offer to sell shares of the Fund, nor a solicitation of an offer to buy shares of the Fund, to any person in any state or other jurisdiction where it is unlawful to make such an offer.


The Fund's SEC File No.: 811-04108
SP0642.001.0411


Oppenheimer Variable Account Funds

April 29, 2011

 
Statement of Additional Information
 This document contains additional information about the Funds and the Trust, and supplements information in the Funds' Prospectuses dated April 29, 2011.This Statement of Additional Information is not a prospectus. It should be read together with the Funds' Prospectuses and the Prospectus for the insurance products you have selected.Shares of the Funds are sold to provide benefits under variable life insurance policies and variable annuity contracts and other insurance company separate accounts, as described in the Prospectuses for the Funds and for the insurance products you have selected.This Statement of Additional Information consists of two separate documents. This text comprises the first document. The second document contains the Report of the Independent Registered Public Accounting Firm and Financial Statements for each Fund.

This Statement of Additional Information and the Fund's Prospectuses can also be viewed or downloaded online at the OppenheimerFunds internet website at www.oppenheimerfunds.com. They may also be obtained by writing to the Fund's Transfer Agent, OppenheimerFunds Services, at P.O. Box 5270, Denver, Colorado 80217, or by calling the Transfer Agent at the toll-free number shown below.

OPPENHEIMER VARIABLE ACCOUNT FUNDS (the "Trust") is an investment company consisting of 11 separate Series (the "Funds"):

     Oppenheimer Balanced Fund/VA

     Non-Service Shares
     Service Shares
 

     Oppenheimer Capital Appreciation Fund/VA

     Non-Service Shares
     Service Shares
 

     Oppenheimer Core Bond Fund/VA

     Non-Service Shares
     Service Shares
 

     Oppenheimer Global Securities Fund/VA

     Non-Service Shares
     Service Shares
     Class 3 Shares
     Class 4 Shares
 

     Oppenheimer Global Strategic Income Fund/VA

     Non-Service Shares
     Service Shares
 

     Oppenheimer High Income Fund/VA

     Non-Service Shares
     Service Shares
     Class 3 Shares
     Class 4 Shares
 

     Oppenheimer Main Street Fund®/VA

     Non-Service Shares
     Service Shares
 

     Oppenheimer Main Street Small- & Mid-Cap Fund®/VA*

     Non-Service Shares
     Service Shares
 

     Oppenheimer Money Fund/VA

     Non-Service Shares
 

     Oppenheimer Small- & Mid-Cap Growth Fund/VA

     Non-Service Shares
     Service Shares
 

     Oppenheimer Value Fund/VA

     Non-Service Shares
     Service Shares

 * Prior to April 29, 2011 Main Street Small- & Mid-Cap Fund/VA was named "Oppenheimer Main Street Small Cap Fund®/VA"


6803 South Tucson Way, Centennial, Colorado 80112-3924
1.800.988.8287


Table of contents

ABOUT THE FUND

Additional Information About the Funds Investment Policies and Risks

3

The Funds Main Investment Policies

3

Other Investments and Investment Strategies

12

Investment Restrictions

28

Disclosure of Portfolio Holdings

31

Organization and History

34

Board of Trustees and Oversight Committees

35

Trustees and Officers of the Fund

36

The Manager

50

Brokerage Policies of the Fund

56

Distribution and Service Arrangements

60

Payments to Fund Intermediaries

61

Performance of the Fund

64

ABOUT YOUR ACCOUNT

How to Buy Shares

68

Distributions and Taxes

71

Additional Information About the Fund

73

APPENDIX A: MAJOR SHAREHOLDERS

Appendix A

74

APPENDIX B: RATINGS DEFINITIONS

Appendix B

79

FINANCIAL INFORMATION ABOUT THE FUND

Report of Independent Registered Public Accounting Firm

84

FINANCIAL STATEMENTS

Financial Statements

85


To Summary Prospectus

Additional Information About the Funds Investment Policies and Risks

The investment objective, the principal investment policies and the main risks of the Funds are described in their Prospectuses. This SAI contains supplemental information about those policies and risks and the types of securities that the Funds' investment adviser, OppenheimerFunds, Inc. (the "Manager"), can select for the Funds. Additional information is also provided about the strategies that the Funds may use to try to achieve their objectives.

The composition of the Funds' portfolios and the techniques and strategies that the Funds use in selecting portfolio securities will vary over time. The Funds are not required to use all of the investment techniques and strategies described below in seeking their objectives. They may use some of the investment techniques and strategies only at some times or they may not use them at all.

The Funds Main Investment Policies

In selecting securities for the Funds' portfolios, the Manager evaluates the merits of particular securities primarily through the exercise of its own investment analysis. That process may include, among other things:

  • evaluation of the issuer's historical operations,
  • prospects for the industry of which the issuer is part,
  • the issuer's financial condition,
  • its pending product developments and business (and those of competitors),
  • the effect of general market and economic conditions on the issuer's business, and
  • legislative proposals that might affect the issuer.

The Funds are categorized by the types of investment they make. Capital Appreciation Fund/VA, Global Securities Fund/VA, Main Street Small- & Mid-Cap Fund®/VA, Small- & Mid-Cap Growth Fund/VA, Main Street Fund®/VA and Value Fund/VA can be categorized as "Equity Funds." High Income Fund/VA, Core Bond Fund/VA, and Global Strategic Income Fund/VA can be categorized as "Fixed Income Funds." Balanced Fund/VA shares the investment characteristics (and certain of the investment policies) of both the Equity Funds and the Fixed Income Funds, depending upon the allocations determined from time to time by their respective portfolio managers. In general, the discussion of particular investments and strategies below indicates which Funds can use that investment or technique as part of their investment program. For example, some investments can be held by only some of the Funds and some can be held by all. Please refer to the prospectus of a particular Fund for an explanation of its principal investment policies and risks. The allocation of Main Street Fund®/VA's portfolio to equity securities is generally substantially larger than its allocation to fixed-income securities. Money Fund/VA's investment policies are explained separately; however, discussion below about investment restrictions, repurchase agreements and illiquid securities also apply to Money Fund/VA.

Fund

Investment Category

Oppenheimer Capital Appreciation Fund/VA

Equity

Oppenheimer Global Securities Fund/VA

Equity

Oppenheimer Main Street Small- & Mid-Cap Fund/VA

Equity

Oppenheimer Small- & Mid-Cap Growth Fund/VA

Equity

Oppenheimer Value Fund/VA

Equity

Oppenheimer Main Street Fund/VA

Equity

Oppenheimer High Income Fund/VA

Fixed-Income

Oppenheimer Core Bond Fund/VA

Fixed-Income

Oppenheimer Global Strategic Income Fund/VA

Fixed-Income

Oppenheimer Money Fund/VA

Money Market

Oppenheimer Balanced Fund/VA

Other


The full name of each Fund is shown above and on the cover page. The word "Oppenheimer" is omitted from these names in the rest of this document to conserve space.

Investments in Equity Securities. The Equity Funds focus their investments in equity securities, which include common stocks, preferred stocks, rights and warrants, and securities convertible into common stock. Certain equity securities may be selected not only for their appreciation possibilities but because they may provide dividend income. At times, a Fund may have substantial amounts of its assets invested in securities of issuers in one or more capitalization ranges, based upon the Manager's use of its investment strategies and its judgment of where the best market opportunities are to seek a Fund's objective.

Small- and mid-cap companies may offer greater opportunities for capital appreciation than securities of larger, more established companies. However, those securities also involve greater risks than securities of larger companies. Securities of small- and mid- cap issuers may be subject to greater price volatility in general than securities of large-cap companies. Therefore, to the degree that a Fund has investments in smaller capitalization companies at times of market volatility, that Fund's share prices may fluctuate more. Main Street Small- & Mid-Cap Fund®/VA and Small & Mid-Cap Growth Fund/VA will invest primarily in securities of small- and mid-cap issuers, but, for the other Equity Funds those investments may be limited to the extent the Manager believes that such investments would be inconsistent with the goal of preservation of principal.

Risks of Small- and Mid-Sized Companies. Small- and mid-sized companies may be either established or newer companies, including "unseasoned" companies that have been in operation for less than three years. While smaller companies might offer greater opportunities for gain than larger companies, they also may involve greater risk of loss. They may be more sensitive to changes in a company's earnings expectations and may experience more abrupt and erratic price movements. Smaller companies' securities often trade in lower volumes and in many instances, are traded over-the-counter or on a regional securities exchange, where the frequency and volume of trading is substantially less than is typical for securities of larger companies traded on national securities exchanges. Therefore, the securities of smaller companies may be subject to wider price fluctuations and it might be harder for the Fund to dispose of its holdings at an acceptable price when it wants to sell them. Small- and mid-sized companies may not have established markets for their products or services and may have fewer customers and product lines. They may have more limited access to financial resources and may not have the financial strength to sustain them through business downturns or adverse market conditions. Since small- and mid-sized companies typically reinvest a high proportion of their earnings in their business, they may not pay dividends for some time, particularly if they are newer companies. Smaller companies may have unseasoned management or less depth in management skill than larger, more established companies. They may be more reliant on the efforts of particular members of their management team and management changes may pose a greater risk to the success of the business. Securities of small, unseasoned companies may be particularly volatile, especially in the short term, and may have very limited liquidity. It may take a substantial period of time to realize a gain on an investment in a small- or mid-sized company, if any gain is realized at all.

Growth Investing. In selecting equity investments, the portfolio managers for the Equity Funds may from time to time use a growth investing style, a value investing style, or a combination of both. In using a growth approach, the portfolio managers seek securities of "growth" companies. Growth companies are those companies that the Manager believes are entering into a growth cycle in their business, with the expectation that their stock will increase in value. They may be established companies, as well as, newer companies in the development stage. Growth companies may have a variety of characteristics that in the Manager's view define them as "growth" issuers.

Growth companies may be generating or applying new technologies, new or improved distribution techniques or new services. They may own or develop natural resources. They may be companies that can benefit from changing consumer demands or lifestyles, or companies that have projected earnings in excess of the average for their sector or industry. In each case, they have prospects that the Manager believes are favorable for the long term. The portfolio managers of the Funds look for growth companies with strong, capable management, sound financial and accounting policies, successful product development and marketing and other factors.

Value Investing. In selecting equity investments, the portfolio managers for the Equity Funds in particular may from time to time use a value investing style. In using a value approach, the portfolio managers seek stock and other equity securities that appear to be temporarily undervalued, by various measures, such as price/earnings ratios, rather than seeking stocks of "growth" issuers. This approach is subject to change and might not necessarily be used in all cases. Value investing seeks stocks having prices that are low in relation to their real worth or future prospects, in the hope that a Fund will realize appreciation in the value of its holdings when other investors realize the intrinsic value of the stock.

Using value investing requires research as to the issuer's underlying financial condition and prospects. Some of the measures that can be used to identify these securities include, among others:

  • Price/Earnings ratio, which is the stock's price divided by its earnings per share. A stock having a price/earnings ratio lower than its historical range, or the market as a whole or that of similar companies may offer attractive investment opportunities.
  • Price/book value ratio, which is the stock price divided by the book value of the company per share, which measures the company's stock price in relation to its asset value.
  • Dividend Yield is measured by dividing the annual dividend by the stock price per share.
  • Valuation of Assets, which compares the stock price to the value of the company's underlying assets, including their projected value in the marketplace and liquidation value.

Convertible Securities. Convertible securities are debt securities that are convertible into an issuer's common stock. Convertible securities rank senior to common stock in a corporation's capital structure and therefore are subject to less risk than common stock in case of the issuer's bankruptcy or liquidation.

The value of a convertible security is a function of its "investment value" and its "conversion value." If the investment value exceeds the conversion value, the security will behave more like a debt security, and the security's price will likely increase when interest rates fall and decrease when interest rates rise. If the conversion value exceeds the investment value, the security will behave more like an equity security: it will likely sell at a premium over its conversion value, and its price will tend to fluctuate directly with the price of the underlying security.

While many convertible securities are a form of debt security, in some cases their conversion feature (allowing conversion into equity securities) causes the Manager to regard them more as "equity equivalents." In those cases, the credit rating assigned to the security has less impact on the Manager's investment decision than in the case of non-convertible fixed income securities. Convertible securities are subject to the credit risks and interest rate risks described below in "Investments in Bonds and Other Debt Securities."

To determine whether convertible securities should be regarded as "equity equivalents," the Manager may examine the following factors:

  1. whether, at the option of the investor, the convertible security can be exchanged for a fixed number of shares of common stock of the issuer,
  2. whether the issuer of the convertible securities has restated its earnings per share of common stock on a fully diluted basis (considering the effect of conversion of the convertible securities), and
  3. the extent to which the convertible security may be a defensive "equity substitute," providing the ability to participate in any appreciation in the price of the issuer's common stock.

Preferred Stocks. Preferred stocks are equity securities but have certain attributes of debt securities. Preferred stock, unlike common stock, has a stated dividend rate payable from the corporation's earnings. Preferred stock dividends may be cumulative or non-cumulative, participating, or auction rate. "Cumulative" dividend provisions require all or a portion of prior unpaid dividends to be paid before the issuer can pay dividends on common shares.

If interest rates rise, the fixed dividend on preferred stocks may be less attractive, causing the price of preferred stocks to decline. Preferred stock may have mandatory sinking fund provisions, as well as provisions for their call or redemption prior to maturity which can have a negative effect on their prices when interest rates decline. Preferred stock may be "participating" stock, which means that it may be entitled to a dividend exceeding the stated dividend in certain cases.

Preferred stocks are equity securities because they do not constitute a liability of the issuer and therefore do not offer the same degree of protection of capital as debt securities and may not offer the same degree of assurance of continued income as debt securities. The rights of preferred stock on distribution of a corporation's assets in the event of its liquidation are generally subordinate to the rights associated with a corporation's debt securities. Preferred stock generally has a preference over common stock on the distribution of a corporation's assets in the event of its liquidation.

Rights and Warrants. The Funds may invest in warrants or rights. Warrants basically are options to purchase equity securities at specific prices valid for a specific period of time. Their prices do not necessarily move parallel to the prices of the underlying securities. Rights are similar to warrants, but normally have a short duration and are distributed directly by the issuer to its shareholders. Rights and warrants have no voting rights, receive no dividends and have no rights with respect to the assets of the issuer.

Investments in Bonds and Other Debt Securities. The Fixed Income Funds in particular can invest in bonds, debentures and other debt securities to seek current income as part of their investment objectives.

A Fund's debt investments can include investment-grade and non-investment-grade bonds (commonly referred to as "junk bonds"). Investment-grade bonds are bonds rated at least "Baa" by Moody's Investors Service, Inc., ("Moody's") or at least "BBB" by Standard & Poor's Rating Services ("S&P") or Fitch, Inc. ("Fitch") or that have comparable ratings by another nationally recognized rating organization. In making investments in debt securities, the Manager may rely to some extent on the ratings of ratings organizations or it may use its own research to evaluate a security's credit-worthiness. If the securities that a Fund buys are unrated, to be considered part of a Fund's holdings of investment-grade securities, they must be judged by the Manager to be of comparable quality to bonds rated as investment grade by a rating organization.

Credit Risk. Credit risk relates to the ability of the issuer of a debt security to meet interest and principal payment obligations as they become due. Some of the special credit risks of lower-grade securities are discussed in the Prospectus. There is a greater risk that the issuer may default on its obligation to pay interest or to repay principal than in the case of investment grade securities. The issuer's low creditworthiness may increase the potential for its insolvency. An overall decline in values in the high yield bond market is also more likely during a period of a general economic downturn. An economic downturn or an increase in interest rates could severely disrupt the market for high yield bonds, adversely affecting the values of outstanding bonds as well as the ability of issuers to pay interest or repay principal. In the case of foreign high yield bonds, these risks are in addition to the special risks of foreign investing discussed in the Prospectus and in this SAI.

Interest Rate Risk. Interest rate risk refers to the fluctuations in value of fixed-income securities resulting from the inverse relationship between price and yield. For example, an increase in general interest rates will tend to reduce the market value of already-issued fixed-income investments, and a decline in general interest rates will tend to increase their value. In addition, debt securities with longer maturities, which tend to have higher yields, are subject to potentially greater fluctuations in value from changes in interest rates than obligations with shorter maturities.

Fluctuations in the market value of fixed-income securities after the Funds buy them will not affect the interest income payable on those securities (unless the security pays interest at a variable rate pegged to interest rate changes). However, those price fluctuations will be reflected in the valuations of the securities, and therefore the Funds' net asset values will be affected by those fluctuations.

       Prepayment Risk. Certain fixed-income securities (in particular mortgage-related securities) are subject to the risk of unanticipated prepayment. That is the risk that when interest rates fall, the issuer will repay the security prior to the security's expected maturity, or with respect to certain fixed-income securities, that borrowers will prepay the loans that underlie these securities more quickly than expected, thereby causing the issuer of the security to repay the principal prior to the security's expected maturity. The Fund may need to reinvest the proceeds at a lower interest rate, reducing its income. Securities subject to prepayment risk generally offer less potential for gains when prevailing interest rates fall. If the Fund buys those securities at a premium, accelerated prepayments on those securities could cause it to lose a portion of its principal investment represented by the premium. The impact of prepayments on the price of a security may be difficult to predict and may increase the security's price volatility. Interest-only and principal-only securities are especially sensitive to interest rate changes, which can affect not only their prices but can also change the income flows and prepayment assumptions about those investments.

       Extension Risk. If interest rates rise rapidly, repayments of principal on certain debt securities may occur at a slower rate than expected and the expected maturity of those securities could lengthen as a result. Those securities generally have a greater potential for loss when prevailing interest rates rise, which could cause their value to fall sharply.

Special Risks of Lower-Grade Securities. Because lower-grade securities tend to offer higher yields than investment grade securities, a Fund may invest in lower grade securities if the Manager is trying to achieve greater income (and, in some cases, the appreciation possibilities of lower-grade securities may be a reason they are selected for a Fund's portfolio). High-yield convertible debt securities might be selected as "equity substitutes," as described above but are subject to a Fund's limitation on its investment in debt securities as stated in the Prospectus.

As mentioned above, "lower-grade" debt securities are those rated below "investment grade," which means they have a rating lower than "Baa" by Moody's or lower than "BBB" by S&P or Fitch, Inc. or similar ratings by other nationally recognized rating organizations. If they are unrated, and are determined by the Manager to be of comparable quality to debt securities rated below investment grade, they are included in the limitation on the percentage of a Fund's assets that can be invested in lower-grade securities.

While securities rated "Baa" by Moody's or "BBB" by Standard & Poor's or Fitch are investment-grade and are not regarded as junk bonds, those securities may be subject to special risks, and have some speculative characteristics. Definitions of the debt security ratings categories of Moody's, Standard & Poor's and Fitch are included in Appendix B to this SAI.

Floating Rate and Variable Rate Obligations. Some securities the Funds can purchase have variable or floating interest rates. Variable rates are adjusted at stated periodic intervals. Variable rate obligations can have a demand feature that allows the Funds to tender the obligation to the issuer or a third party prior to its maturity. The tender may be at par value plus accrued interest, according to the terms of the obligations.

The interest rate on a floating rate demand note is adjusted automatically according to a stated prevailing market rate, such as a bank's prime rate, the 91-day U.S. Treasury Bill rate, or some other standard. The instrument's rate is adjusted automatically each time the base rate is adjusted. The interest rate on a variable rate note is also based on a stated prevailing market rate but is adjusted automatically at specified intervals of not less than one year. Generally, the changes in the interest rate on such securities reduce the fluctuation in their market value. As interest rates decrease or increase, the potential for capital appreciation or depreciation is less than that for fixed-rate obligations of the same maturity. The Manager may determine that an unrated floating rate or variable rate demand obligation meets the Funds' quality standards by reason of being backed by a letter of credit or guarantee issued by a bank that meets those quality standards.

Floating rate and variable rate demand notes that have a stated maturity in excess of one year may have features that permit the holder to recover the principal amount of the underlying security at specified intervals not exceeding one year and upon no more than 30 days' notice. The issuer of that type of note normally has a corresponding right in its discretion, after a given period, to prepay the outstanding principal amount of the note plus accrued interest. Generally, the issuer must provide a specified number of days' notice to the holder.

Asset-Backed Securities. Asset-backed securities are fractional interests in pools of assets, typically accounts receivable or consumer loans. They are issued by trusts or special-purpose corporations. They are similar to mortgage-backed securities, described below, and are backed by a pool of assets that consist of obligations of individual borrowers. The income from the pool is passed through to the holders of the asset-back security. The pools may offer a credit enhancement, such as a bank letter of credit, to try to reduce the risks that the underlying debtors will not pay their obligations when due. However, the enhancement, if any, might not be for the full par value of the security. If the enhancement is exhausted and any required payments of interest or repayments of principal are not made, that Fund could suffer losses on its investment or delays in receiving payment.

The value of an asset-backed security is affected by changes in the market's perception of the asset backing the security, the creditworthiness of the servicing agent for the loan pool, the originator of the loans, or the financial institution providing any credit enhancement, and is also affected if any credit enhancement has been exhausted. The risks of investing in asset-backed securities are ultimately related to payment of consumer loans by the individual borrowers. As a purchaser of an asset-backed security, a Fund would generally have no recourse to the entity that originated the loans in the event of default by a borrower. The underlying loans are subject to prepayments, which may shorten the weighted average life of asset-backed securities and may lower their return, in the same manner as in the case of mortgage-backed securities and CMOs, described below.

Mortgage-Related Securities. Mortgage-related securities (also referred to as mortgage-backed securities) are a form of fixed-income investment collateralized by pools of commercial or residential mortgages. Pools of mortgage loans are assembled as securities for sale to investors by government agencies or entities or by private issuers. These securities include collateralized mortgage obligations ("CMOs"), mortgage pass-through securities, stripped mortgage pass-through securities, interests in real estate mortgage investment conduits ("REMICs") and other real-estate related securities.

Mortgage-related securities that are issued or guaranteed by agencies or instrumentalities of the U.S. government have relatively little credit risk (depending on the nature of the issuer). Privately issued mortgage-related securities have some credit risk, as the underlying mortgage may not fully collateralize the obligation and full payment of them is not guaranteed. Both types of mortgage-related securities are subject to interest rate risks and prepayment risks, as described in the Prospectuses.

As with other debt securities, the prices of mortgage-related securities tend to move inversely to changes in interest rates. The Fixed Income Funds and Value Fund/VA can buy mortgage-related securities that have interest rates that move inversely to changes in general interest rates, based on a multiple of a specific index. Although the value of a mortgage-related security may decline when interest rates rise, the converse is not always the case.
In periods of declining interest rates, mortgages are more likely to be prepaid. Therefore, a mortgage-related security's maturity can be shortened by unscheduled prepayments on the underlying mortgages. Therefore, it is not possible to predict accurately the security's yield. The principal that is returned earlier than expected may have to be reinvested in other investments having a lower yield than the prepaid security. Therefore, these securities may be less effective as a means of "locking in" attractive long-term interest rates, and they may have less potential for appreciation during periods of declining interest rates, than conventional bonds with comparable stated maturities.

Prepayment risks can lead to substantial fluctuations in the value of a mortgage-related security. In turn, this can affect the value of that Fund's shares. If a mortgage-related security has been purchased at a premium, all or part of the premium that Fund paid may be lost if there is a decline in the market value of the security, whether that results from interest rate changes or prepayments on the underlying mortgages. In the case of stripped mortgage-related securities, if they experience greater rates of prepayment than were anticipated, that Fund may fail to recoup its initial investment on the security.

During periods of rapidly rising interest rates, prepayments of mortgage-related securities may occur at slower than expected rates. Slower prepayments effectively may lengthen a mortgage-related security's expected maturity. Generally, that would cause the value of the security to fluctuate more widely in responses to changes in interest rates. If the prepayments on a Fund's mortgage-related securities were to decrease broadly, that Fund's effective duration, and therefore its sensitivity to interest rate changes, would increase. As with other debt securities, the values of mortgage-related securities may be affected by changes in the market's perception of the creditworthiness of the entity issuing the securities or guaranteeing them. Their values may also be affected by changes in government regulations and tax policies.

Collateralized Mortgage Obligations. CMOs are multi-class bonds that are backed by pools of mortgage loans or mortgage pass-through certificates. They may be collateralized by:

  1. pass-through certificates issued or guaranteed by Ginnie Mae, Fannie Mae, or Freddie Mac,
  2. unsecuritized mortgage loans insured by the Federal Housing Administration or guaranteed by the Department of Veterans' Affairs,
  3. unsecuritized conventional mortgages,
  4. other mortgage-related securities, or
  5. any combination of these.

Each class of CMO, referred to as a "tranche," is issued at a specific coupon rate and has a stated maturity or final distribution date. Principal prepayments on the underlying mortgages may cause the CMO to be retired much earlier than the stated maturity or final distribution date. The principal and interest on the underlying mortgages may be allocated among the several classes of a series of a CMO in different ways. One or more trenches may have coupon rates that reset periodically at a specified increase over an index. These are floating rate CMOs, and typically have a cap on the coupon rate. Inverse floating rate CMOs have a coupon rate that moves in the reverse direction to an applicable index. The coupon rate on these CMOs will increase as general interest rates decrease. These are usually much more volatile than fixed rate CMOs or floating rate CMOs.

U.S. Government Securities. These are securities issued or guaranteed by the U.S. Treasury or other government agencies or federally-chartered corporate entities referred to as "instrumentalities." The obligations of U.S. government agencies or instrumentalities in which the Funds may invest may or may not be guaranteed or supported by the "full faith and credit" of the United States. "Full faith and credit," means generally that the taxing power of the U.S. government is pledged to the payment of interest and repayment of principal on a security. If a security is not backed by the full faith and credit of the United States, the owner of the security must look principally to the agency issuing the obligation for repayment. The owner might not be able to assert a claim against the United States if the issuing agency or instrumentality does not meet its commitment. The Funds will invest in securities of U.S. government agencies and instrumentalities only if the Manager is satisfied that the credit risk with respect to the agency or instrumentality is minimal.

U.S. Treasury Obligations. These include Treasury bills (maturities of one year or less when issued), Treasury notes (maturities of one to 10 years), and Treasury bonds (maturities of more than 10 years). Treasury securities are backed by the full faith and credit of the United States as to timely payments of interest and repayments of principal. They also can include U.S. Treasury securities that have been "stripped" by a Federal Reserve Bank, zero-coupon U.S. Treasury securities described below, and Treasury Inflation-Protection Securities ("TIPS").

Treasury Inflation-Protection Securities. The Funds can buy these TIPS, which are designed to provide an investment vehicle that is not vulnerable to inflation. The interest rate paid by TIPS is fixed. The principal value rises or falls semi-annually based on changes in the published Consumer Price Index. If inflation occurs, the principal and interest payments on TIPS are adjusted to protect investors from inflationary loss. If deflation occurs, the principal and interest payments will be adjusted downward, although the principal will not fall below its face amount at maturity.

Obligations Issued or Guaranteed by U.S. Government Agencies or Instrumentalities. These include direct obligations and mortgage-related securities that have different levels of credit support from the government. Some are supported by the full faith and credit of the U.S. government, such as Government National Mortgage Association ("GNMA") pass-through mortgage certificates (called "Ginnie Maes"). Some are supported by the right of the issuer to borrow from the U.S. Treasury under certain circumstances, such as Federal National Mortgage Association bonds ("Fannie Maes"). Others are supported only by the credit of the entity that issued them, such as Federal Home Loan Mortgage Corporation ("FHLMC") obligations ("Freddie Macs").

U.S. Government Mortgage-Related Securities. The Funds can invest in a variety of mortgage-related securities that are issued by U.S. government agencies or instrumentalities, some of which are described below.

GNMA Certificates. The Government National Mortgage Association is a wholly-owned corporate instrumentality of the United States within the U.S. Department of Housing and Urban Development. GNMA's principal programs involve its guarantees of privately-issued securities backed by pools of mortgages. Ginnie Maes are debt securities representing an interest in one mortgage or a pool of mortgages that are insured by the Federal Housing Administration ("FHA") or the Farmers Home Administration ("FMHA") or guaranteed by the Veterans Administration ("VA").

The Ginnie Maes in which the Funds invest are of the "fully modified pass-through" type. They provide that the registered holders of the Ginnie Maes will receive timely monthly payments of the pro-rata share of the scheduled principal payments on the underlying mortgages, whether or not those amounts are collected by the issuers. Amounts paid include, on a pro rata basis, any prepayment of principal of such mortgages and interest (net of servicing and other charges) on the aggregate unpaid principal balance of the Ginnie Maes, whether or not the interest on the underlying mortgages has been collected by the issuers.

The Ginnie Maes purchased by the Funds are guaranteed as to timely payment of principal and interest by GNMA. In giving that guaranty, GNMA expects that payments received by the issuers of Ginnie Maes on account of the mortgages backing the Ginnie Maes will be sufficient to make the required payments of principal of and interest on those Ginnie Maes. However, if those payments are insufficient, the guaranty agreements between the issuers of the Ginnie Maes and GNMA require the issuers to make advances sufficient for the payments. If the issuers fail to make those payments, GNMA will do so.

Under federal law, the full faith and credit of the United States is pledged to the payment of all amounts that may be required to be paid under any guaranty issued by GNMA as to such mortgage pools. An opinion of an Assistant Attorney General of the United States, dated December 9, 1969, states that such guaranties "constitute general obligations of the United States backed by its full faith and credit." GNMA is empowered to borrow from the United States Treasury to the extent necessary to make any payments of principal and interest required under those guaranties.

Ginnie Maes are backed by the aggregate indebtedness secured by the underlying FHA-insured, FMHA-insured or VA-guaranteed mortgages. Except to the extent of payments received by the issuers on account of such mortgages, Ginnie Maes do not constitute a liability of those issuers, nor do they evidence any recourse against those issuers. Recourse is solely against GNMA. Holders of Ginnie Maes (such as the Funds) have no security interest in or lien on the underlying mortgages.

Monthly payments of principal will be made, and additional prepayments of principal may be made, to the Funds with respect to the mortgages underlying the Ginnie Maes owned by the Funds. All of the mortgages in the pools relating to the Ginnie Maes in the Funds are subject to prepayment without any significant premium or penalty, at the option of the mortgagors. While the mortgages on one-to-four family dwellings underlying certain Ginnie Maes have a stated maturity of up to 30 years, it has been the experience of the mortgage industry that the average life of comparable mortgages, as a result of prepayments, refinancing and payments from foreclosures, is considerably less.

Federal Home Loan Mortgage Corporation (FHLMC) Certificates. FHLMC, a corporate instrumentality of the United States, issues FHLMC Certificates representing interests in mortgage loans. FHLMC guarantees to each registered holder of a FHLMC Certificate timely payment of the amounts representing a holder's proportionate share in:

  1. interest payments less servicing and guarantee fees,
  2. principal prepayments, and
  3. the ultimate collection of amounts representing the holder's proportionate interest in principal payments on the mortgage loans in the pool represented by the FHLMC Certificate, in each case whether or not such amounts are actually received.

The obligations of FHLMC under its guarantees are obligations solely of FHLMC and are not backed by the full faith and credit of the United States.

Federal National Mortgage Association (Fannie Mae) Certificates. Fannie Mae, a federally-chartered and privately-owned corporation, issues Fannie Mae Certificates which are backed by a pool of mortgage loans. Fannie Mae guarantees to each registered holder of a Fannie Mae Certificate that the holder will receive amounts representing the holder's proportionate interest in scheduled principal and interest payments, and any principal prepayments, on the mortgage loans in the pool represented by such Certificate, less servicing and guarantee fees, and the holder's proportionate interest in the full principal amount of any foreclosed or other liquidated mortgage loan. In each case the guarantee applies whether or not those amounts are actually received. The obligations of Fannie Mae under its guarantees are obligations solely of Fannie Mae and are not backed by the full faith and credit of the United States or any of its agencies or instrumentalities other than Fannie Mae.

Forward Rolls. The Funds can enter into "forward roll" transactions with respect to mortgage-related securities (also referred to as "mortgage dollar rolls"). In this type of transaction, a Fund sells a mortgage-related security to a buyer and simultaneously agrees to repurchase a similar security (the same type of security, and having the same coupon and maturity) at a later date at a set price. The securities that are repurchased will have the same interest rate as the securities that are sold, but typically will be collateralized by different pools of mortgages (with different prepayment histories) than the securities that have been sold. Proceeds from the sale are invested in short-term instruments, such as repurchase agreements. The income from those investments, plus the fees from the forward roll transaction, are expected to generate income to a Fund in excess of the yield on the securities that have been sold.

The Funds will only enter into "covered" rolls. To assure its future payment of the purchase price, the Funds will identify on its books liquid assets in an amount equal to the payment obligation under the roll.

These transactions have risks. During the period between the sale and the repurchase, the Fund will not be entitled to receive interest and principal payments on the securities that have been sold. It is possible that the market value of the securities the Fund sells may decline below the price at which the Fund is obligated to repurchase securities.

Zero-Coupon U.S. Government Securities. The Funds may buy zero-coupon U.S. government securities. These will typically be U.S. Treasury Notes and Bonds that have been stripped of their unmatured interest coupons, the coupons themselves, or certificates representing interests in those stripped debt obligations and coupons.

Zero-coupon securities do not make periodic interest payments and are sold at a deep discount from their face value at maturity. The buyer recognizes a rate of return determined by the gradual appreciation of the security, which is redeemed at face value on a specified maturity date. This discount depends on the time remaining until maturity, as well as prevailing interest rates, the liquidity of the security and the credit quality of the issuer. The discount typically decreases as the maturity date approaches.

Because zero-coupon securities pay no interest and compound semi-annually at the rate fixed at the time of their issuance, their value is generally more volatile than the value of other debt securities that pay interest. Their value may fall more dramatically than the value of interest-bearing securities when interest rates rise. When prevailing interest rates fall, zero-coupon securities tend to rise more rapidly in value because they have a fixed rate of return.

A Fund's investment in zero-coupon securities may cause that Fund to recognize income and make distributions to shareholders before it receives any cash payments on the zero-coupon investment. To generate cash to satisfy those distribution requirements, a Fund may have to sell portfolio securities that it otherwise might have continued to hold or to use cash flows from other sources such as the sale of Fund shares.

Commercial (Privately-Issued) Mortgage Related Securities. The Funds can invest in commercial mortgage-related securities issued by private entities. Generally these are multi-class debt or pass-through certificates secured by mortgage loans on commercial properties. They are subject to the credit risk of the issuer. These securities typically are structured to provide protection to investors in senior classes from possible losses on the underlying loans. They do so by having holders of subordinated classes take the first loss if there are defaults on the underlying loans. They may also be protected to some extent by guarantees, reserve funds or additional collateralization mechanisms.

Loan Participation Interests. The Fund may invest in loan participation interests, subject to the Fund's limitation on investments in illiquid investments. A participation interest is an undivided interest in a loan made by the issuing financial institution in the proportion that the buyer's participation interest bears to the total principal amount of the loan. The issuing financial institution may have no obligation to the Fund other than to pay the Fund the proportionate amount of the principal and interest payments it receives. The Fund may also buy interests in trusts and other entities that hold loan obligations. 

Participation interests are primarily dependent upon the creditworthiness of the borrowing corporation, which is obligated to make payments of principal and interest on the loan. There is a risk that a borrower may have difficulty making payments. If a borrower fails to pay scheduled interest or principal payments, the Fund could experience a reduction in its income. The value of that participation interest might also decline, which could affect the net asset value of the Fund's shares. If the issuing financial institution fails to perform its obligations under the participation agreement, the Fund might incur costs and delays in realizing payment and suffer a loss of principal and/or interest. In some cases, these participation interests, whether held directly by the Fund or indirectly through an interest in a trust or other entity, may be partially "unfunded," meaning the Fund may be required to advance additional money on future dates. 

Event-Linked Bonds. The Funds may invest in "event-linked" bonds. Event-linked bonds, which are sometimes referred to as "catastrophe" bonds, are fixed income securities for which the return of principal and payment of interest is contingent on the non-occurrence of a specific trigger event, such as a hurricane, earthquake, or other occurrence that leads to physical or economic loss. In some cases, the trigger event will not be deemed to have occurred unless the event is of a certain magnitude (based on scientific readings) or causes a certain measurable amount of loss to the issuer, a particular industry group or a reference index. If the trigger event occurs prior to maturity, a Fund may lose all or a portion of its principal and additional interest. The Funds may also invest in similar bonds where a Fund may lose all or a portion of its principal and additional interest if the mortality rate in a geographic area exceeds a stated threshold prior to maturity whether or not a particular catastrophic event has occurred.

Event-linked bonds may be issued by government agencies, insurance companies, reinsurers, and financial institutions, among other issuers, or special purpose vehicles associated with the foregoing. Often event-linked bonds provide for extensions of maturity in order to process and audit loss claims in those cases when a trigger event has occurred or is likely to have occurred. An extension of maturity may increase a bond's volatility.

Event-linked bonds may expose the Funds to certain other risks, including issuer default, adverse regulatory or jurisdictional interpretations, liquidity risk and adverse tax consequences. Lack of a liquid market may result in higher transaction costs and the possibility that a Fund may be forced to liquidate positions when it would not be advantageous to do so. Event-linked bonds are typically rated by one or more nationally recognized statistical rating organization and a Fund will only invest in event-linked bonds that meet the credit quality requirements for the Fund.

Foreign Securities. The Equity Funds and the Fixed Income Funds may invest in foreign securities, and Global Securities Fund/VA and Global Strategic Income Fund/VA expect to have substantial investments in foreign securities. These include equity securities issued by foreign companies and debt securities issued or guaranteed by foreign companies or governments, including supra-national entities. "Foreign securities" include equity and debt securities of companies organized under the laws of countries other than the United States and debt securities issued or guaranteed by governments other than the U.S. government or by foreign supra-national entities. They also include securities of companies (including those that are located in the U.S. or organized under U.S. law) that derive a significant portion of their revenue or profits from foreign businesses, investments or sales, or that have a significant portion of their assets abroad. They may be traded on foreign securities exchanges or in the foreign over-the-counter markets. Value Fund/VA can purchase up to 25% of its total assets in certain equity and debt securities issued or guaranteed by foreign companies or of foreign governments or their agencies and as stated in the Prospectus, Value Fund/VA does not concentrate 25% or more of its total assets in the securities of any one foreign government. Global Strategic Income Fund/VA has no limitation on the amount of foreign securities in which it may invest but will not concentrate 25% or more of its total assets in the securities of any one foreign government.

Securities of foreign issuers that are represented by American Depository Receipts or that are listed on a U.S. securities exchange or traded in the U.S. over-the-counter markets are not considered "foreign securities" for the purpose of a Fund's investment allocations, because they are not subject to many of the special considerations and risks, discussed below, that apply to foreign securities traded and held abroad.

Because the Funds may purchase securities denominated in foreign currencies, a change in the value of such foreign currency against the U.S. dollar will result in a change in the amount of income the Funds have available for distribution. Because a portion of the Funds' investment income may be received in foreign currencies, the Funds will be required to compute their income in U.S. dollars for distribution to shareholders, and therefore the Funds will absorb the cost of currency fluctuations. After the Funds have distributed income, subsequent foreign currency losses may result in the Funds' having distributed more income in a particular fiscal period than was available from investment income, which could result in a return of capital to shareholders.

Investing in foreign securities offers potential benefits not available from investing solely in securities of domestic issuers. They include the opportunity to invest in foreign issuers that appear to offer growth potential, or in foreign countries with economic policies or business cycles different from those of the U.S., or to reduce fluctuations in portfolio value by taking advantage of foreign stock markets that do not move in a manner parallel to U.S. markets. The Funds will hold foreign currency only in connection with the purchase or sale of foreign securities.

Foreign Debt Obligations. The debt obligations of foreign governments and entities may or may not be supported by the full faith and credit of the foreign government. The Fixed Income Funds may buy securities issued by certain supra-national entities, which include entities designated or supported by governments to promote economic reconstruction or development, international banking organizations and related government agencies. Examples are the International Bank for Reconstruction and Development (commonly called the "World Bank"), the Asian Development bank and the Inter-American Development Bank.

The governmental members of these supra-national entities are "stockholders" that typically make capital contributions and may be committed to make additional capital contributions if the entity is unable to repay its borrowings. A supra-national entity's lending activities may be limited to a percentage of its total capital, reserves and net income. There can be no assurance that the constituent foreign governments will continue to be able or willing to honor their capitalization commitments for those entities.

The Fixed Income Funds can invest in U.S. dollar-denominated "Brady Bonds." These foreign debt obligations may be fixed-rate par bonds or floating-rate discount bonds. They are generally collateralized in full as to repayment of principal at maturity by U.S. Treasury zero-coupon obligations that have the same maturity as the Brady Bonds. Brady Bonds can be viewed as having three or four valuation components: (i) the collateralized repayment of principal at final maturity; (ii) the collateralized interest payments; (iii) the uncollateralized interest payments; and (iv) any uncollateralized repayment of principal at maturity. Those uncollateralized amounts constitute what is called the "residual risk".

If there is a default on collateralized Brady Bonds resulting in acceleration of the payment obligations of the issuer, the zero-coupon U.S. Treasury securities held as collateral for the payment of principal will not be distributed to investors, nor will those obligations be sold to distribute the proceeds. The collateral will be held by the collateral agent to the scheduled maturity of the defaulted Brady Bonds. The defaulted bonds will continue to remain outstanding, and the face amount of the collateral will equal the principal payments which would have then been due on the Brady Bonds in the normal course. Because of the residual risk of Brady Bonds and the history of defaults with respect to commercial bank loans by public and private entities of countries issuing Brady Bonds, Brady Bonds are considered speculative investments.

Risks of Foreign Investing. Investments in foreign securities may offer special opportunities for investing but also present special additional risks and considerations not typically associated with investments in domestic securities. Some of these additional risks are:

  • reduction of income by foreign taxes;
  • fluctuation in value of foreign investments due to changes in currency rates or currency control regulations (for example, currency blockage);
  • transaction charges for currency exchange;
  • lack of public information about foreign issuers;
  • lack of uniform accounting, auditing and financial reporting standards in foreign countries comparable to those applicable to domestic issuers;
  • less volume on foreign exchanges than on U.S. exchanges;
  • reater volatility and less liquidity on foreign markets than in the U.S.;
  • less governmental regulation of foreign issuers, stock exchanges and brokers than in the U.S.;
  • greater difficulties in commencing lawsuits;
  • higher brokerage commission rates than in the U.S.;
  • increased risks of delays in settlement of portfolio transactions or loss of certificates for portfolio securities;
  • possibilities in some countries of expropriation, confiscatory taxation, currency devaluation, political, financial or social instability or adverse diplomatic developments; and
  • unfavorable differences between the U.S. economy and foreign economies.

In the past, U.S. government policies have discouraged certain investments abroad by U.S. investors, through taxation or other restrictions, and it is possible that such restrictions could be re-imposed.


Special Risks of Emerging Markets. Emerging and developing markets abroad may also offer special opportunities for growth investing but have greater risks than more developed foreign markets, such as those in Europe, Canada, Australia, New Zealand and Japan. There may be even less liquidity in their securities markets, and settlements of purchases and sales of securities may be subject to additional delays. They are subject to greater risks of limitations on the repatriation of income and profits because of currency restrictions imposed by local governments. Those countries may also be subject to the risk of greater political and economic instability, which can greatly affect the volatility of prices of securities in those countries. The Manager will consider these factors when evaluating securities in these markets, because the selection of those securities must be consistent with a Fund's goal of preservation of principal.

Portfolio Turnover. "Portfolio turnover" describes the rates at which the Funds traded their portfolio securities during their last fiscal year. For example, if a Fund sold all of its securities during the year, its portfolio turnover rate would have been 100%. The Funds' portfolio turnover rates will fluctuate from year to year, and any of the Funds may have portfolio turnover rates of more than 100% annually.

The decreases in the portfolio turnover rates in 2010 for Main Street Fund/VA and Main Street Small- & Mid-Cap Fund/VA, as compared to their turnover rates in 2009, was due primarily to the completion of the restructurings of those Funds' portfolios after the current Main Street portfolio teams took over the management of those Funds in the latter half of 2009.

Other Investments and Investment Strategies

Other Investment Techniques and Strategies. In seeking their respective objectives, the Funds may from time to time use the types of investment strategies and investments described below. They are not required to use all of these strategies at all times, and at times may not use them.

Investing in Small, Unseasoned Companies. A Fund may invest in securities of small, unseasoned companies, subject to limits (if any) stated in that Fund's Prospectus. These are companies that have been in operation for less than three years, including the operations of any predecessors. Securities of these companies may be subject to volatility in their prices. They may have a limited trading market or no trading market, which may adversely affect a Fund's ability to value them or to dispose of them and can reduce the price that Fund might be able to obtain for them. Other investors that own a security issued by a small, unseasoned issuer for which there is limited liquidity might trade the security when a Fund is attempting to dispose of their holdings of that security. In that case, a Fund might receive a lower price for its holdings than might otherwise be obtained.

When-Issued and Delayed-Delivery Transactions. The Funds may invest in securities on a "when-issued" basis and may purchase or sell securities on a "delayed-delivery" or "forward commitment" basis. When-issued and delayed-delivery are terms that refer to securities whose terms and indenture are available and for which a market exists, but which are not available for immediate delivery.

When such transactions are negotiated, the price (which is generally expressed in yield terms) is fixed at the time the commitment is made. Delivery and payment for the securities take place at a later date. The securities are subject to change in value from market fluctuations during the period until settlement. The value at delivery may be less than the purchase price. For example, changes in interest rates in a direction other than that expected by the Manager before settlement will affect the value of such securities and may cause a loss to the Funds. During the period between purchase and settlement, no payment is made by a Fund to the issuer and no interest accrues to that Fund from the investment until it receives the security at settlement. There is a risk of loss to a Fund if the value of the security changes prior to the settlement date, and there is the risk that the other party may not perform.

The Funds engage in when-issued transactions to secure what the Manager considers to be an advantageous price and yield at the time of entering into the obligation. When a Fund enters into a when-issued or delayed-delivery transaction, it relies on the other party to complete the transaction. Its failure to do so may cause that Fund to lose the opportunity to obtain the security at a price and yield the Manager considers to be advantageous.

When a Fund engages in when-issued and delayed-delivery transactions, it does so for the purpose of acquiring or selling securities consistent with its investment objective and policies for its portfolio or for delivery pursuant to options contracts it has entered into, and not for the purpose of investment leverage. Although a Fund will enter into delayed-delivery or when-issued purchase transactions to acquire securities, it may dispose of a commitment prior to settlement. If a Fund chooses to dispose of the right to acquire a when-issued security prior to its acquisition or to dispose of its right to delivery against a forward commitment, it may incur a gain or loss.

At the time a Fund makes the commitment to purchase or sell a security on a when-issued or delayed delivery basis, it records the transaction on its books and reflects the value of the security purchased in determining that Fund's net asset value. In a sale transaction, it records the proceeds to be received. That Fund will identify on its books liquid assets at least equal in value to the value of that Fund's purchase commitments until that Fund pays for the investment.

When-issued and delayed-delivery transactions can be used by the Funds as a defensive technique to hedge against anticipated changes in interest rates and prices. For instance, in periods of rising interest rates and falling prices, a Fund might sell securities in its portfolio on a forward commitment basis to attempt to limit its exposure to anticipated falling prices. In periods of falling interest rates and rising prices, a Fund might sell portfolio securities and purchase the same or similar securities on a when-issued or delayed-delivery basis to obtain the benefit of currently higher cash yields.

Zero-Coupon Securities. The Fixed Income Funds may buy zero-coupon and delayed interest securities, and "stripped" securities of foreign government issuers, which may or may not be backed by the "full faith and credit" of the issuing foreign government, and of domestic and foreign corporations. The Fixed Income Funds and Value Fund/VA may also buy zero-coupon and "stripped" U.S. government securities. Zero-coupon securities issued by foreign governments and by corporations will be subject to greater credit risks than U.S. government zero-coupon securities.

"Stripped" Mortgage-Related Securities. The Fixed Income Funds and Value Fund/VA can invest in stripped mortgage-related securities that are created by segregating the cash flows from underlying mortgage loans or mortgage securities to create two or more new securities. Each has a specified percentage of the underlying security's principal or interest payments. These are a form of derivative investment.

Mortgage securities may be partially stripped so that each class receives some interest and some principal. However, they may be completely stripped. In that case all of the interest is distributed to holders of one type of security, known as an "interest-only" security, or "I/O," and all of the principal is distributed to holders of another type of security, known as a "principal-only" security or "P/O." Strips can be created for pass-through certificates or CMOs.

The yields to maturity of I/Os and P/Os are very sensitive to principal repayments (including prepayments) on the underlying mortgages. If the underlying mortgages experience greater than anticipated prepayments of principal, a Fund might not fully recoup its investment in an I/O based on those assets. If underlying mortgages experience less than anticipated prepayments of principal, the yield on the P/Os based on them could decline substantially.

Repurchase Agreements. The Funds may acquire securities subject to repurchase agreements. They may do so for liquidity purposes to meet anticipated redemptions of Funds shares, or pending the investment of the proceeds from sales of Funds shares, or pending the settlement of portfolio securities transactions, or for temporary defensive purposes, as described below.

In a repurchase transaction, a Fund buys a security from, and simultaneously resells it to, an approved vendor for delivery on an agreed-upon future date. The resale price exceeds the purchase price by an amount that reflects an agreed-upon interest rate effective for the period during which the repurchase agreement is in effect. Approved vendors include U.S. commercial banks, U.S. branches of foreign banks, or broker-dealers that have been designated as primary dealers in government securities. They must meet credit requirements set by the Manager from time to time.

The majority of these transactions run from day to day, and delivery pursuant to the resale typically occurs within one to five days of the purchase. Repurchase agreements having a maturity beyond seven days are subject to each Fund's limit on holding illiquid investments. No Fund will enter into a repurchase agreement that causes more than 15% of its net assets (for Money Fund/VA, 10%) to be subject to repurchase agreements having a maturity beyond seven days. There is no limit on the amount of a Fund's net assets that may be subject to repurchase agreements having maturities of seven days or less.

Repurchase agreements, considered "loans" under the Investment Company Act, are collateralized by the underlying security. The Funds' repurchase agreements require that at all times while the repurchase agreements are in effect, the value of the collateral must equal or exceed the repurchase price to fully collateralize the repayment obligation. However, if the vendor fails to pay the resale price on the delivery date, the Funds may incur costs in disposing of the collateral and may experience losses if there is any delay in its ability to do so. The Manager will monitor the vendor's creditworthiness to confirm that the vendor is financially sound and will continuously monitor the collateral's value.

Pursuant to an Exemptive Order issued by the Securities and Exchange Commission (the "SEC"), the Funds, along with other affiliated entities managed by the Manager, may transfer uninvested cash balances into one or more joint repurchase accounts. These balances are invested in one or more repurchase agreements, secured by U.S. government securities. Securities that are collateral for repurchase agreements are financial assets subject to the Funds' entitlement orders through its securities account at its custodian bank until the agreements mature. Each joint repurchase arrangement requires that the market value of the collateral be sufficient to cover payments of interest and principal; however, in the event of default by the other party to the agreement, retention or sale of the collateral may be subject to legal proceedings.

Illiquid and Restricted Securities. Generally, an illiquid asset is an asset that cannot be sold or disposed of in the ordinary course of business within seven days at approximately the price at which it has been valued. Under the policies and procedures established by the Board, the Manager determines the liquidity of portfolio investments. The Manager monitors holdings of illiquid and restricted securities on an ongoing basis to determine whether to sell any holdings to maintain adequate liquidity. Among the types of illiquid securities are repurchase agreements maturing in more than seven days.

Restricted securities acquired through private placements have contractual restrictions on their public resale that might limit the ability to value or to dispose of the securities and might lower the price that could be realized on a sale. To sell a restricted security that is not registered under applicable securities laws, the securities might need to be registered. The expense of registering restricted securities may be negotiated with the issuer at the time of purchase. If the securities must be registered in order to be sold, a significant period may elapse between the time the decision is made to sell the security and the time the security is registered. There is a risk of downward price fluctuation during that period.

Limitations that apply to purchases of restricted securities do not limit purchases of restricted securities that are eligible for sale to qualified institutional buyers under Rule 144A of the Securities Act of 1933, if those securities have been determined to be liquid by the Manager under Board-approved guidelines. Those guidelines take into account the trading activity for the securities and the availability of reliable pricing information, among other factors. If there is a lack of trading interest in a particular Rule 144A security, holdings of that security may be considered to be illiquid.

Borrowing and Leverage. Each Fund, other than Money Fund/VA, has the ability to borrow from banks on an unsecured basis. Each Fund has undertaken to limit borrowing to 25% of the value of that Fund's net assets, which is further limited to 10% if borrowing is for a purpose other than to facilitate redemptions. Investing borrowed funds in portfolio securities is a speculative technique known as "leverage." A Fund cannot borrow money in excess of 33-1/3% of the value of that Fund's total assets. The Funds may borrow only from banks and/or affiliated investment companies. With respect to this fundamental policy, the Funds can borrow only if they maintain a 300% ratio of assets to borrowings at all times in the manner set forth in the Investment Company Act.  Currently, under the Investment Company Act, a mutual fund may borrow only from banks (for other than emergency purposes) and only to the extent that the value of the Fund's assets, less its liabilities other than borrowings, is equal to at least 300% of all borrowings including the proposed borrowing, except that it may also borrow up to 5% of its total assets for temporary or emergency purposes from any lender. Under the Investment Company Act, there is a rebuttable presumption that a loan is temporary if it is repaid within 60 days and not extended or renewed.

When a Fund borrows, it segregates or identifies securities on its books equal to 300% of the amount borrowed to cover its obligation to repay the loan. If the value of the Fund's assets fail to meet this 300% asset coverage requirement, it will reduce its borrowings within three days to meet the requirement. To do so, the Fund might have to sell a portion of its investments at a disadvantageous time.

When a Fund invests borrowed money in portfolio securities, it is using a speculative investment technique known as "leverage." If the Fund does borrow, its expenses may be greater than comparable funds that do not borrow. The Fund will pay interest on loans, and that interest expense may raise the overall expenses of the Fund and reduce its returns. In the case of borrowing for leverage, the interest paid on a loan might be more (or less) than the yield on the securities purchased with the loan proceeds. Additionally, the use of leverage may make the Fund's share prices more sensitive to interest rate changes and thus might cause the Fund's net asset value per share to fluctuate more than that of funds that do not borrow.

Currently, the Funds do not contemplate using this technique in the next year but if they do so, it will not likely be to a substantial degree. 

Bank Obligations. The Funds can buy time deposits, certificates of deposit and bankers' acceptances. They must be:

  • obligations issued or guaranteed by a domestic bank (including a foreign branch of a domestic bank) having total assets of at least U.S. $1 billion, or
  • obligations of a foreign bank with total assets of at least U.S. $1 billion

"Banks" include commercial banks, savings banks and savings and loan associations, which may or may not be members of the Federal Deposit Insurance Corporation.

Commercial Paper. The Funds can invest in commercial paper if it is rated within the top three rating categories of S&P and Moody's or other rating organizations.

If the paper is not rated, it may be purchased if the Manager determines that it is comparable to rated commercial paper in the top three rating categories of national rating organizations.

The Funds can buy commercial paper, including U.S. dollar-denominated securities of foreign branches of U.S. banks, issued by other entities if the commercial paper is guaranteed as to principal and interest by a bank, government or corporation whose certificates of deposit or commercial paper may otherwise be purchased by the Funds.

Variable Amount Master Demand Notes. Master demand notes are corporate obligations that permit the investment of fluctuating amounts by the Funds at varying rates of interest under direct arrangements between the Funds, as lender, and the borrower. They permit daily changes in the amounts borrowed. The Funds have the right to increase the amount under the note at any time up to the full amount provided by the note agreement, or to decrease the amount. The borrower may prepay up to the full amount of the note without penalty. These notes may or may not be backed by bank letters of credit.

Because these notes are direct lending arrangements between the lender and borrower, it is not expected that there will be a trading market for them. There is no secondary market for these notes, although they are redeemable (and thus are immediately repayable by the borrower) at principal amount, plus accrued interest, at any time. Accordingly, the Funds' right to redeem such notes is dependent upon the ability of the borrower to pay principal and interest on demand.

The Funds have no limitations on the type of issuer from whom these notes will be purchased. However, in connection with such purchases and on an ongoing basis, the Manager will consider the earning power, cash flow and other liquidity ratios of the issuer, and its ability to pay principal and interest on demand, including a situation in which all holders of such notes made demand simultaneously. Investments in master demand notes are subject to the limitation on investments by the Funds in illiquid securities, described in the Prospectus. A description of the investment policies for Money Fund/VA is located below under the heading "Money Fund/VA Investment Policies."

Derivatives. The Funds can invest in a variety of derivative investments, including swaps, "structured" notes, convertible notes, options, forward contracts and futures contracts, to seek income or for hedging purposes. The use of derivatives requires special skills and knowledge of investment techniques that are different than what is required for normal portfolio management. If the Manager uses a derivative instrument at the wrong time or judges market conditions incorrectly, the use of derivatives may reduce a Fund's return.

Although it is not obligated to do so, the Funds can use derivatives to hedge. To attempt to protect against declines in the market value of a Fund's portfolio, to permit a Fund to retain unrealized gains in the value of portfolio securities which have appreciated, or to facilitate selling securities for investment reasons, a Fund could:

  • sell futures contracts,
  • buy puts on such futures or on securities, or
  • write covered calls on securities or futures. Covered calls may also be used to increase a Fund's income, but the Manager does not expect to engage extensively in that practice.

The Funds can use hedging to establish a position in the securities market as a temporary substitute for purchasing particular securities. In that case a Fund would normally seek to purchase the securities and then terminate that hedging position. A Fund might also use this type of hedge to attempt to protect against the possibility that its portfolio securities would not be fully included in a rise in value of the market. To do so a Fund could:

  • buy futures, or
  • buy calls on such futures or on securities.

A Fund's strategy of hedging with futures and options on futures will be incidental to that Fund's activities in the underlying cash market. The particular hedging strategies a Fund can use are described below. A Fund may employ new hedging strategies when they are developed, if those investment methods are consistent with that Fund's investment objectives and are permissible under applicable regulations governing that Fund.

"Structured" Notes. "Structured" notes are specially-designed derivative debt instruments. The terms of the instrument may be "structured" by the purchaser and the issuer of the note. Payments of principal or interest on these notes may be linked to the value of an index (such as a currency or securities index), one or more securities or a commodity or to the financial performance of one or more obligors. The value of these notes will normally rise or fall in response to the changes in the performance of the underlying security, index, commodity or obligors.

Structured notes are subject to interest rate risk and are also subject to credit risk with respect both to the issuer and, if applicable, to the underlying security or obligor. If the underlying investment or index does not perform as anticipated, the Funds might receive less interest than the stated coupon payment or receive less principal upon maturity of the structured note. The price of structured notes may be very volatile and they may have a limited trading market, making it difficult for the Funds to value them or sell them at an acceptable price.  In some cases, the Funds may enter into agreements with an issuer of structured notes to purchase a minimum amount of these notes over time.

Swaps. The Funds may enter into swap agreements, including interest rate, total return, credit default and volatility swaps. Swap agreements are two-party contracts entered into primarily by institutional investors for a specified period of time typically ranging from a few weeks to more than one year. In a standard swap transaction, two parties agree to exchange the returns (or the difference between the returns) earned or realized on a particular asset, such as an equity or debt security, commodity or currency, or non-asset reference, such as an interest rate or index. The swapped returns are generally calculated with respect to a notional amount, that is, the return on a particular dollar amount invested in the underlying asset or reference. A Fund may enter into a swap agreement to, among other reasons, gain exposure to certain markets in the most economical way possible, protect against currency fluctuations, or reduce risk arising from ownership of a particular security or instrument. A Fund will identify liquid assets on that Fund's books (such as cash or U.S. government securities) to cover any amounts it could owe under swaps that exceed the amounts it is entitled to receive, and it will adjust that amount daily, as needed.

The Funds may enter into swap transactions with certain counterparties pursuant to master netting agreements. A master netting agreement provides that all swaps done between a Fund and that counterparty shall be regarded as parts of an integral agreement. If amounts are payable on a particular date in the same currency in respect of more than one swap transaction, the amount payable shall be the net amount. In addition, the master netting agreement may provide that if one party defaults generally or on any swap, the counterparty can terminate all outstanding swaps with that party.

The use of swap agreements by the Funds entails certain risks. The swaps market is generally unregulated. There is no central exchange or market for swap transactions and therefore they are less liquid investments than exchange-traded instruments and may be considered illiquid by a Fund. Swap agreements entail credit risk arising from the possibility that the counterparty will default. If the counterparty defaults, a Fund's loss will consist of the net amount of contractual payments that that Fund has not yet received. The Manager will monitor the creditworthiness of counterparties to a Fund's swap transactions on an ongoing basis. A Fund's successful use of swap agreements is dependent upon the Manager's ability to predict correctly whether certain types of investments are likely to produce greater returns than other investments. Swap agreements may effectively add leverage to a Fund's portfolio because that Fund would be subject to investment exposure on the notional amount of the swap.

  • Interest Rate Swaps. The Funds, especially Core Bond Fund/VA, High Income Fund/VA, Global Strategic Income Fund/ VA and Value Fund/VA, may enter into interest rate swaps. In an interest rate swap, a Fund and another party exchange their right to receive or their obligation to pay interest on a security or other reference rate. For example, they might swap the right to receive floating rate payments for fixed rate payments. There is a risk that, based on movements of interest rates, the payments made by a Fund under a swap agreement will be greater than the payments it receives.
  • Total Return Swaps. The Funds may enter into total return swaps, under which one party agrees to pay the other the total return of a defined underlying asset, such as a security or basket of securities, or non-asset reference, such as a securities index, during the specified period in return for periodic payments based on a fixed or variable interest rate or the total return from different underlying assets or references. Total return swaps could result in losses if the underlying asset or reference does not perform as anticipated by the Manager.
  • Credit Default Swaps. The Fixed Income Funds and Balanced Fund/ VA may enter into credit default swaps. A credit default swap enables an investor to buy or sell protection against a credit event, such as an issuer's failure to make timely payments of interest or principal, bankruptcy or restructuring. The Funds may seek to enhance returns by selling protection or attempt to mitigate credit risk by buying protection against the occurrence of a credit event by a specified issuer. The Funds may enter into credit default swaps, both directly and indirectly in the form of a swap embedded within a structured security. Credit default swaps may refer to a single security or on a basket of securities.

If a Fund buys credit protection using a credit default swap and a credit event occurs, that Fund will deliver the defaulted bonds underlying the swap and the swap counterparty will pay the par amount of the bonds. Alternatively, the credit default swap may be cash settled where the seller of protection will pay the buyer of protection the difference between the par value and the market value of the defaulted bonds. If a Fund sells credit protection using a credit default swap and a credit event occurs, that Fund will pay the par amount of the defaulted bonds underlying the swap and the swap counterparty will deliver the bonds. If the swap is on a basket of securities, the notional amount of the swap is reduced by the par amount of the defaulted bonds, and the fixed payments are then made on the reduced notional amount.

Risks of credit default swaps include counterparty credit risk (if the counterparty fails to meet its obligations) and the risk that a Fund will not properly assess the cost of the instrument based on the lack of transparency in the market. If a Fund is selling credit protection, there is a risk that a credit event will occur and that the Fund will have to pay par value on defaulted bonds. If a Fund is buying credit protection, there is a risk that no credit event will occur and that Fund will receive no benefit for the premium paid. In addition, if a Fund is buying credit protection and a credit event does occur, there is a risk when that Fund does not own the underlying security, that Fund will have difficulty acquiring the bond on the open market and may receive adverse pricing.

  • Volatility Swap Contracts. The Funds may enter into volatility swaps to hedge the direction of volatility in a particular asset or non-asset reference, or for other non-speculative purposes. For volatility swaps, counterparties agree to buy or sell volatility at a specific level over a fixed period. Volatility swaps are subject to credit risks (if the counterparty fails to meet its obligations), and the risk that the Manager is incorrect in forecasts of volatility of the underlying asset or reference.

Swap Options and Swap Forwards. The Funds also may enter into options on swaps as well as forwards on swaps. A swap option is a contract that gives a counterparty the right (but not the obligation) to enter into a new swap agreement or to shorten, extend, cancel, or otherwise modify an existing swap agreement on pre-designated terms. The Funds may write (sell) and purchase put and call swap options. A swap forward is an agreement to enter into a swap agreement at some point in the future, usually three to six months from the date of the contract.

The writer of the contract receives the premium and bears the risk of unfavorable changes in the preset rate on the underlying swap. The Funds generally will incur a greater risk when it writes a swap option than when it purchases a swap option. When a Fund purchases a swap option it risks losing only the amount of the premium it has paid if that Fund lets the option expire unexercised. When a Fund writes a swap option it will become obligated, upon exercise of the option by the counterparty, according to the terms of the underlying agreement.

Futures. The Funds can buy and sell futures contracts that relate to debt securities (these are referred to as "interest rate futures"), broadly-based securities indices ("stock index futures" and "bond index futures"), foreign currencies, commodities and an individual stock ("single stock futures").

A broadly-based stock index is used as the basis for trading stock index futures. They may in some cases be based on stocks of issuers in a particular industry or group of industries. A stock index assigns relative values to the securities included in the index and its value fluctuates in response to the changes in value of the underlying securities. A stock index cannot be purchased or sold directly. Bond index futures are similar contracts based on the future value of the basket of securities that comprise the index. These contracts obligate the seller to deliver, and the purchaser to take, cash to settle the futures transaction. There is no delivery made of the underlying securities to settle the futures obligation. Either party may also settle the transaction by entering into an offsetting contract.

An interest rate future obligates the seller to deliver (and the purchaser to take) cash or a specified type of debt security to settle the futures transaction. Either party could also enter into an offsetting contract to close out the position. Similarly, a single stock future obligates the seller to deliver (and the purchaser to take) cash or a specified equity security to settle the futures transaction. Either party could also enter into an offsetting contract to close out the position. Single stock futures trade on a very limited number of exchanges, with contracts typically not fungible among the exchanges.

The Funds can invest a portion of its assets in commodity futures contracts. Commodity futures may be based upon commodities within five main commodity groups: (1) energy, which includes crude oil, natural gas, gasoline and heating oil; (2) livestock, which includes cattle and hogs; (3) agriculture, which includes wheat, corn, soybeans, cotton, coffee, sugar and cocoa; (4) industrial metals, which includes aluminum, copper, lead, nickel, tin and zinc; and (5) precious metals, which includes gold, platinum and silver. The Funds may purchase and sell commodity futures contracts, options on futures contracts and options and futures on commodity indices with respect to these five main commodity groups and the individual commodities within each group, as well as other types of commodities.

No money is paid or received by the Funds on the purchase or sale of a future. Upon entering into a futures transaction, the Funds will be required to deposit an initial margin payment with the futures commission merchant (the "futures broker"). Initial margin payments will be deposited with the Funds' custodian bank in an account registered in the futures broker's name. However, the futures broker can gain access to that account only under specified conditions. As the future is marked to market (that is, its value on that Fund's books is changed) to reflect changes in its market value, subsequent margin payments, called variation margin, will be paid to or by the futures broker daily.

At any time prior to expiration of the future, the Funds may elect to close out its position by taking an opposite position, at which time a final determination of variation margin is made and any additional cash must be paid by or released to that Fund. Any loss or gain on the future is then realized by that Fund for tax purposes. All futures transactions (except forward contracts) are effected through a clearinghouse associated with the exchange on which the contracts are traded.

Put and Call Options. The Funds can buy and sell exchange-traded and over-the-counter put options ("puts") and call options ("calls"), including index options, securities options, currency options, commodities options and options on futures.

Writing Call Options. The Funds may write (that is, sell) calls. If a Fund sells a call option, it must be covered. That means a Fund must own the security subject to the call while the call is outstanding, or the call must be covered by segregating liquid assets to enable that Fund to satisfy its obligations if the call is exercised. There is no limit on the amount of a Fund's total assets that may be subject to covered calls that Fund writes.

When a Fund writes a call on a security, it receives cash (a premium). That Fund agrees to sell the underlying security to a purchaser of a corresponding call on the same security during the call period at a fixed exercise price regardless of market price changes during the call period. The call period is usually not more than nine months. The exercise price may differ from the market price of the underlying security. That Fund has the risk of loss that the price of the underlying security may decline during the call period. That risk may be offset to some extent by the premium that Fund receives. If the value of the investment does not rise above the call price, it is likely that the call will lapse without being exercised. In that case that Fund would keep the cash premium and the investment.

When a Fund writes a call on an index, it receives cash (a premium). If the buyer of the call exercises it, that Fund will pay an amount of cash equal to the difference between the closing price of the call and the exercise price, multiplied by a specific multiple that determines the total value of the call for each point of difference. If the value of the underlying investment does not rise above the call price, it is likely that the call will lapse without being exercised. In that case, that Fund would keep the cash premium.

A Fund's custodian bank, or a securities depository acting for the custodian, will act as that Fund's escrow agent, through the facilities of the Options Clearing Corporation ("OCC"), as to the investments on which that Fund has written calls traded on exchanges or as to other acceptable escrow securities. In that way, no margin will be required for such transactions. OCC will release the securities on the expiration of the option or when the Fund enters into a closing transaction.

When a Fund writes an over-the-counter ("OTC") option, it will enter into an arrangement with a primary U.S. government securities dealer which will establish a formula price at which that Fund will have the absolute right to repurchase that OTC option. The formula price will generally be based on a multiple of the premium received for the option, plus the amount by which the option is exercisable below the market price of the underlying security (i.e., the option is "in the money"). When that Fund writes an OTC option, it will treat as illiquid (for purposes of its restriction on holding illiquid securities) the market-to-market value of the underlying security, unless the option is subject to a buy-back agreement with the executing broker.

To terminate its obligation on a call it has written, a Fund may purchase a corresponding call in a "closing purchase transaction." That Fund will then realize a profit or loss, depending upon whether the net of the amount of the option transaction costs and the premium received on the call that Fund wrote is more or less than the price of the call that Fund purchases to close out the transaction. That Fund may realize a profit if the call expires unexercised, because that Fund will retain the underlying security and the premium it received when it wrote the call. If that Fund cannot effect a closing purchase transaction due to the lack of a market, it will have to hold the callable securities until the call expires or is exercised.

A Fund may also write calls on a futures contract without owning the futures contract or securities deliverable under the contract. To do so, at the time the call is written, that Fund must cover the call by segregating an equivalent dollar amount of liquid assets as identified in that Fund's books. That Fund will segregate additional liquid assets if the value of the segregated assets drops below 100% of the current value of the future. Because of this segregation requirement, in no circumstances would that Fund's receipt of an exercise notice as to that future require that Fund to deliver a futures contract. It would simply put that Fund in a short futures position, which is permitted by that Fund's hedging policies.

Writing Put Options. The Funds may write (that is, sell) put options. A put option on securities gives the purchaser the right to sell, and the writer the obligation to buy, the underlying investment at the exercise price during the option period. A put must be covered by segregated liquid assets.

If a Fund writes a put, the put must be covered by liquid assets identified in that Fund's books. The premium a Fund receives from writing a put represents a profit, as long as the price of the underlying investment remains equal to or above the exercise price. However, a Fund also assumes the obligation during the option period to buy the underlying investment from the buyer of the put at the exercise price, even if the value of the investment falls below the exercise price.

If a put a Fund has written expires unexercised, that Fund realizes a gain in the amount of the premium less the transaction costs incurred. If the put is exercised, that Fund must fulfill its obligation to purchase the underlying investment at the exercise price. That price will usually exceed the market value of the investment at that time. In that case, that Fund may incur a loss if it sells the underlying investment. That loss will be equal to the sum of the sale price of the underlying investment and the premium received minus the sum of the exercise price and any transaction costs that Fund incurred.

When writing a put option on a security, to secure its obligation to pay for the underlying security a Fund will deposit in escrow liquid assets with a value equal to or greater than the exercise price of the underlying securities. That Fund therefore forgoes the opportunity of investing the segregated assets or writing calls against those assets.

As long as a Fund's obligation as the put writer continues, it may be assigned an exercise notice by the broker-dealer through which the put was sold. That notice will require that Fund to take delivery of the underlying security and pay the exercise price. That Fund has no control over when it may be required to purchase the underlying security, since it may be assigned an exercise notice at any time prior to the termination of its obligation as the writer of the put. That obligation terminates upon expiration of the put. It may also terminate if, before it receives an exercise notice, that Fund effects a closing purchase transaction by purchasing a put of the same series as it sold. Once that Fund has been assigned an exercise notice, it cannot effect a closing purchase transaction.

A Fund may decide to effect a closing purchase transaction to realize a profit on an outstanding put option it has written or to prevent the underlying security from being put. Effecting a closing purchase transaction will also permit that Fund to write another put option on the security, or to sell the security and use the proceeds from the sale for other investments. That Fund will realize a profit or loss from a closing purchase transaction depending on whether the cost of the transaction is less or more than the premium received from writing the put option.

Purchasing Puts and Calls. The Funds may purchase call options. When a Fund buys a call (other than in a closing purchase transaction), it pays a premium. That Fund then has the right to buy the underlying investment from a seller of a corresponding call on the same investment during the call period at a fixed exercise price.

A Fund benefits only if it sells the call at a profit or if, during the call period, the market price of the underlying investment is above the sum of the call price plus the transaction costs and the premium paid for the call and that Fund exercises the call. If that Fund does not exercise the call or sell it (whether or not at a profit), the call will become worthless at its expiration date. In that case that Fund will have paid the premium but lost the right to purchase the underlying investment.

A Fund can buy puts whether or not it owns the underlying investment. When a Fund purchases a put, it pays a premium and, except as to puts on indices, has the right to sell the underlying investment to a seller of a put on a corresponding investment during the put period at a fixed exercise price.

Buying a put on an investment the Fund does not own (such as an index or a future) permits the Fund either to resell the put or to buy the underlying investment and sell it at the exercise price. The resale price will vary inversely to the price of the underlying investment. If the market price of the underlying investment is above the exercise price and, as a result, the put is not exercised, the put will become worthless on its expiration date.

Buying a put on securities or futures a Fund owns enables the Fund to attempt to protect itself during the put period against a decline in the value of the underlying investment below the exercise price by selling the underlying investment at the exercise price to a seller of a corresponding put. If the market price of the underlying investment is equal to or above the exercise price and, as a result, the put is not exercised or resold, the put will become worthless at its expiration date. In that case the Fund will have paid the premium but lost the right to sell the underlying investment. However, the Fund may sell the put prior to its expiration. That sale may or may not be at a profit.

When the Fund purchases a call or put on an index or future, it pays a premium, but settlement is in cash rather than by delivery of the underlying investment to the Fund. Gain or loss depends on changes in the index in question (and thus on price movements in the securities market generally) rather than on price movements in individual securities or futures contracts.

Buying and Selling Options on Foreign Currencies. The Funds can buy and sell exchange-traded and over-the-counter put options and call options on foreign currencies. A Fund could use these calls and puts to try to protect against declines in the dollar value of foreign securities and increases in the dollar cost of foreign securities the Fund wants to acquire.

If the Manager anticipates a rise in the dollar value of a foreign currency in which securities to be acquired are denominated, the increased cost of those securities may be partially offset by purchasing calls or writing puts on that foreign currency. If the Manager anticipates a decline in the dollar value of a foreign currency, the decline in the dollar value of portfolio securities denominated in that currency might be partially offset by writing calls or purchasing puts on that foreign currency. However, the currency rates could fluctuate in a direction adverse to a Fund's position. That Fund will then have incurred option premium payments and transaction costs without a corresponding benefit.

A call the Fund writes on a foreign currency is "covered" if the Fund owns the underlying foreign currency covered by the call or has an absolute and immediate right to acquire that foreign currency without additional cash consideration (or it can do so for additional cash consideration held in a segregated account by its custodian bank) upon conversion or exchange of other foreign currency held in its portfolio.

A Fund could write a call on a foreign currency to provide a hedge against a decline in the U.S. dollar value of a security which a Fund owns or has the right to acquire and which is denominated in the currency underlying the option. That decline might be one that occurs due to an expected adverse change in the exchange rate. This is known as a "cross-hedging" strategy. In those circumstances, that Fund covers the option by maintaining cash, U.S. government securities or other liquid, high grade debt securities in an amount equal to the exercise price of the option, in a segregated account with that Fund's custodian bank.

Risks of Hedging with Options and Futures. The use of hedging strategies requires special skills and knowledge of investment techniques that are different than what is required for normal portfolio management. If the Manager uses a hedging strategy at the wrong time or judges market conditions incorrectly, hedging strategies may reduce a Fund's return. The Fund could also experience losses if the prices of its futures and options positions were not correlated with its other investments.

A Fund's option activities could affect its portfolio turnover rate and brokerage commissions. The exercise of calls written by a Fund might cause that Fund to sell related portfolio securities, thus increasing its turnover rate. The exercise by a Fund of puts on securities will cause the sale of underlying investments, increasing portfolio turnover. Although the decision whether to exercise a put it holds is within a Fund's control, holding a put might cause that Fund to sell the related investments for reasons that would not exist in the absence of the put.

A Fund could pay a brokerage commission each time it buys a call or put, sells a call or put, or buys or sells an underlying investment in connection with the exercise of a call or put. Those commissions could be higher on a relative basis than the commissions for direct purchases or sales of the underlying investments. Premiums paid for options are small in relation to the market value of the underlying investments. Consequently, put and call options offer large amounts of leverage. The leverage offered by trading in options could result in a Fund's net asset value being more sensitive to changes in the value of the underlying investment.

If a covered call written by a Fund is exercised on an investment that has increased in value, that Fund will be required to sell the investment at the call price. It will not be able to realize any profit if the investment has increased in value above the call price.

An option position may be closed out only on a market that provides secondary trading for options of the same series, and there is no assurance that a liquid secondary market will exist for any particular option. The Fund might experience losses if it could not close out a position because of an illiquid market for the future or option.

There is a risk in using short hedging by selling futures or purchasing puts on broadly-based indices or futures to attempt to protect against declines in the value of a Fund's portfolio securities. The risk is that the prices of the futures or the applicable index will correlate imperfectly with the behavior of the cash prices of a Fund's securities. For example, it is possible that while a Fund has used derivative instruments in a short hedge, the market may advance and the value of the securities held in that Fund's portfolio might decline. If that occurred, that Fund would lose money on the derivative instruments and also experience a decline in the value of its portfolio securities. However, while this could occur for a very brief period or to a very small degree, over time the value of a diversified portfolio of securities will tend to move in the same direction as the indices upon which the derivative instruments are based.

The risk of imperfect correlation increases as the composition of a Fund's portfolio diverges from the securities included in the applicable index. To compensate for the imperfect correlation of movements in the price of the portfolio securities being hedged and movements in the price of the hedging instruments, that Fund might use derivative instruments in a greater dollar amount than the dollar amount of portfolio securities being hedged. It might do so if the historical volatility of the prices of the portfolio securities being hedged is more than the historical volatility of the applicable index.

The ordinary spreads between prices in the cash and futures markets are subject to distortions, due to differences in the nature of those markets. First, all participants in the futures market are subject to margin deposit and maintenance requirements. Rather than meeting additional margin deposit requirements, investors may close futures contracts through offsetting transactions which could distort the normal relationship between the cash and futures markets. Second, the liquidity of the futures market depends on participants entering into offsetting transactions rather than making or taking delivery. To the extent participants decide to make or take delivery, liquidity in the futures market could be reduced, thus producing distortion. Third,
from the point of view of speculators, the deposit requirements in the futures market are less onerous than margin requirements in the securities markets. Therefore, increased participation by speculators in the futures market may cause temporary price distortions.

The Fund can use derivative instruments to establish a position in the securities markets as a temporary substitute for the purchase of individual securities (long hedging) by buying futures and/or calls on such futures, broadly-based indices or on securities. It is possible that when the Fund does so the market might decline. If the Fund then concludes not to invest in securities because of concerns that the market might decline further or for other reasons, the Fund will realize a loss on the hedge position that is not offset by a reduction in the price of the securities purchased.

Forward Contracts. Forward contracts are foreign currency exchange contracts. They are used to buy or sell foreign currency for future delivery at a fixed price. The Funds can use them to "lock in" the U.S. dollar price of a security denominated in a foreign currency that the Fund has bought or sold, or to protect against possible losses from changes in the relative values of the U.S. dollar and a foreign currency. The Fund can also use "cross-hedging" where the Fund hedges against changes in currencies other than the currency in which a security it holds is denominated.

Under a forward contract, one party agrees to purchase, and another party agrees to sell, a specific currency at a future date. That date may be any fixed number of days from the date of the contract agreed upon by the parties. The transaction price is set at the time the contract is entered into. These contracts are traded in the inter-bank market conducted directly among currency traders (usually large commercial banks) and their customers.

The Fund may use forward contracts to protect against uncertainty in the level of future exchange rates. The use of forward contracts does not eliminate the risk of fluctuations in the prices of the underlying securities the Fund owns or intends to acquire, but it does fix a rate of exchange in advance. Although forward contracts may reduce the risk of loss from a decline in the value of the hedged currency, at the same time they limit any potential gain if the value of the hedged currency increases.

When the Fund enters into a contract for the purchase or sale of a security denominated in a foreign currency, or when it anticipates receiving dividend payments in a foreign currency, the Fund might desire to "lock-in" the U.S. dollar price of the security or the U.S. dollar equivalent of the dividend payments. To do so, the Fund could enter into a forward contract for the purchase or sale of the amount of foreign currency involved in the underlying transaction, in a fixed amount of U.S. dollars per unit of the foreign currency. This is called a "transaction hedge." The transaction hedge will protect the Fund against a loss from an adverse change in the currency exchange rates during the period between the date on which the security is purchased or sold or on which the payment is declared, and the date on which the payments are made or received.

The Fund could also use forward contracts to lock in the U.S. dollar value of portfolio positions. This is called a "position hedge." When the Fund believes that a foreign currency might suffer a substantial decline against the U.S. dollar, it could enter into a forward contract to sell an amount of that foreign currency approximating the value of some or all of a Fund's portfolio securities denominated in that foreign currency. When the Fund believes that the U.S. dollar might suffer a substantial decline against a foreign currency, it could enter into a forward contract to buy that foreign currency for a fixed dollar amount. Alternatively, the Fund could enter into a forward contract to sell a different foreign currency for a fixed U.S. dollar amount if the Fund believes that the U.S. dollar value of the foreign currency to be sold pursuant to its forward contract will fall whenever there is a decline in the U.S. dollar value of the currency in which portfolio securities of the Fund are denominated. That is referred to as a "cross hedge."

A Fund will cover its short positions in these cases by identifying on its books assets having a value equal to the aggregate amount of that Fund's commitment under forward contracts. A Fund will not enter into forward contracts or maintain a net exposure to such contracts if the consummation of the contracts would obligate that Fund to deliver an amount of foreign currency in excess of the value of that Fund's portfolio securities or other assets denominated in that currency or another currency that is the subject of the hedge.

However, to avoid excess transactions and transaction costs, a Fund may maintain a net exposure to forward contracts in excess of the value of that Fund's portfolio securities or other assets denominated in foreign currencies if the excess amount is "covered" by liquid securities denominated in any currency. The cover must be at least equal at all times to the amount of that excess. As one alternative, the Fund may purchase a call option permitting the Fund to purchase the amount of foreign currency being hedged by a forward sale contract at a price no higher than the forward contract price. As another alternative, the Fund may purchase a put option permitting the Fund to sell the amount of foreign currency subject to a forward purchase contract at a price as high or higher than the forward contact price.

The precise matching of the amounts under forward contracts and the value of the securities involved generally will not be possible because the future value of securities denominated in foreign currencies will change as a consequence of market movements between the date the forward contract is entered into and the date it is sold. In some cases the Manager might decide to sell the security and deliver foreign currency to settle the original purchase obligation. If the market value of the security is less than the amount of foreign currency the Fund is obligated to deliver, the Fund might have to purchase additional foreign currency on the "spot" (that is, cash) market to settle the security trade. If the market value of the security instead exceeds the amount of foreign currency the Fund is obligated to deliver to settle the trade, the Fund might have to sell on the spot market some of the foreign currency received upon the sale of the security. There will be additional transaction costs on the spot market in those cases.

The projection of short-term currency market movements is extremely difficult, and the successful execution of a short-term hedging strategy is highly uncertain. Forward contracts involve the risk that anticipated currency movements will not be accurately predicted, causing the Fund to sustain losses on these contracts and to pay additional transactions costs. The use of forward contracts in this manner might reduce a Fund's performance if there are unanticipated changes in currency prices to a greater degree than if the Fund had not entered into such contracts.


At or before the maturity of a forward contract requiring a Fund to sell a currency, that Fund might sell a portfolio security and use the sale proceeds to make delivery of the currency. In the alternative a Fund might retain the security and offset its contractual obligation to deliver the currency by purchasing a second contract. Under that contract the Fund will obtain, on the same maturity date, the same amount of the currency that it is obligated to deliver. Similarly, a Fund might close out a forward contract requiring it to purchase a specified currency by entering into a second contract entitling it to sell the same amount of the same currency on the maturity date of the first contract. The Fund would realize a gain or loss as a result of entering into such an offsetting forward contract under either circumstance. The gain or loss will depend on the extent to which the exchange rate or rates between the currencies involved moved between the execution dates of the first contract and offsetting contract.

The costs to the Fund of engaging in forward contracts varies with factors such as the currencies involved, the length of the contract period and the market conditions then prevailing. Because forward contracts are usually entered into on a principal basis, no brokerage fees or commissions are involved. Because these contracts are not traded on an exchange, the Fund must evaluate the credit and performance risk of the counterparty under each forward contract.

Although the Fund values its assets daily in terms of U.S. dollars, it does not intend to convert its holdings of foreign currencies into U.S. dollars on a daily basis. The Fund may convert foreign currency from time to time, and will incur costs in doing so. Foreign exchange dealers do not charge a fee for conversion, but they do seek to realize a profit based on the difference between the prices at which they buy and sell various currencies. Thus, a dealer might offer to sell a foreign currency to the Fund at one rate, while offering a lesser rate of exchange if the Fund desires to resell that currency to the dealer.

Asset Coverage for Certain Investments and Trading Practices. Typically, the Fund's investments in equity and fixed-income securities do not involve any future financial obligations. However, the Fund may make investments or employ trading practices that obligate the Fund, on a fixed or contingent basis, to deliver an asset or make a cash payment to another party in the future. The Fund will comply with guidance from the U.S. Securities and Exchange Commission (the "SEC") and other applicable regulatory bodies with respect to coverage of certain investments and trading practices. This guidance may require earmarking or segregation by the Fund of cash or liquid securities with its custodian or a designated sub-custodian to the extent the Fund's obligations with respect to these strategies are not otherwise "covered" through ownership of the underlying security or financial instrument or by other portfolio positions, or by other means consistent with applicable regulatory policies. In some cases, SEC guidance permits the Fund to cover its obligation by entering into an offsetting transaction.

For example, if the Fund enters into a currency forward contract to sell foreign currency on a future date, the Fund may cover its obligation to deliver the foreign currency by earmarking or otherwise segregating cash or liquid securities having a value at least equal to the value of the deliverable currency. Alternatively, the Fund could cover its obligation by earmarking or otherwise segregating an amount of the foreign currency at least equal to the deliverable amount or by entering into an offsetting transaction to acquire an amount of foreign currency at least equal to the deliverable amount at a price at or below the sale price received by the Fund under the currency forward contract.

The Fund's approach to asset coverage may vary among different types of swaps. With respect to most swap agreements (but excluding, for example, credit default swaps), the Fund calculates the obligations of the parties to the agreement on a "net basis" (i.e., the two payment streams are netted out with the Fund receiving or paying, as the case may be, only the net amount of the two payments). Consequently the Fund 's current obligations (or rights) under these swap agreements will generally be equal only to the net amount to be paid or received under the agreement based on the relative values of the positions held by each party to the agreement (the "net amount"). The Fund's current obligation, if any, under a swap agreement will generally be covered by earmarking or otherwise segregating cash or liquid securities having an aggregate net asset value at least equal to the accrued unpaid net amounts owed. To the extent that the obligations of the parties under these swaps are not calculated on a net basis, the amount earmarked or otherwise segregated will be the full amount of the Fund's obligations, if any. Alternatively, the Fund could cover its obligation by other means consistent with applicable regulatory policies.

With respect to credit default swaps, typically, if the Fund enters into a credit default swap as the buyer of credit protection, then it will earmark or otherwise segregate an amount of cash or liquid securities at least equal to any accrued payment or delivery obligations under the swap. Alternatively, if the Fund enters into a credit default swap as the seller of credit protection, then the Fund will earmark or otherwise segregate an amount of cash or liquid securities at least equal to the full notional amount of the swap. Alternatively, the Fund could cover its obligation by other means consistent with applicable regulatory policies.

Inasmuch as the Fund covers its obligations under these transactions as described above, the Manager and the Fund believe such obligations do not constitute senior securities and, accordingly, will not treat them as being subject to its borrowing restrictions. Earmarking or otherwise segregating a large percentage of the Fund's assets could impede the Manager's ability to manage the Fund's portfolio.

Regulatory Aspects of Derivatives and Hedging Instruments. The Commodity Futures Trading Commission has eliminated limitations on futures trading by certain regulated entities, including registered investment companies. Consequently, registered investment companies may engage in unlimited futures transactions and options thereon by claiming an exclusion from regulation as a commodity pool operator under the Commodity Exchange Act.

Options transactions are subject to limitations established by the option exchanges. The exchanges limit the maximum number of options that may be written or held by a single investor or group of investors acting in concert. Those limits apply regardless of whether the options were purchased, sold or held through one or more different exchanges or are held in one or more accounts or through one or more brokers. Thus, the number of options that can be sold by an investment company advised by the Manager may be affected by options written or held by other investment companies advised by the Manager or affiliated entities. The exchanges also impose position limits on futures transactions. An exchange may order the liquidation of positions found to be in violation of those limits and may impose certain other sanctions.

Under SEC staff interpretations regarding applicable provisions of the Investment Company Act, when a registered investment company purchases a future, it must identify cash or other liquid assets at its custodian bank in an amount equal to the purchase price of the future, less the margin deposit applicable to it.

Tax Aspects of Certain Hedging Instruments. Certain foreign currency exchange contracts in which a Fund may invest are treated as "Section 1256 contracts" under the IRC. In general, gains or losses relating to Section 1256 contracts are characterized as 60% long-term and 40% short-term capital gains or losses under the Code. However, foreign currency gains or losses arising from Section 1256 contracts that are forward contracts generally are treated as ordinary income or loss. In addition, Section 1256 contracts held by a Fund at the end of each taxable year are "marked-to-market," and unrealized gains or losses are treated as though they were realized. These contracts also may be marked-to-market for purposes of determining the excise tax applicable to investment company distributions and for other purposes under rules prescribed pursuant to the IRC. An election can be made by a Fund to exempt those transactions from this marked-to-market treatment.

Certain forward contracts a Fund enters into may result in "straddles" for federal income tax purposes. The straddle rules may affect the character and timing of gains (or losses) recognized by that Fund on straddle positions. Generally, a loss sustained on the disposition of a position making up a straddle is allowed only to the extent that the loss exceeds any unrecognized gain in the offsetting positions making up the straddle. Disallowed loss is generally allowed at the point where there is no unrecognized gain in the offsetting positions making up the straddle, or the offsetting position is disposed of.

Under the IRC, the following gains or losses are treated as ordinary income or loss:

  1. gains or losses attributable to fluctuations in exchange rates that occur between the time the Fund accrues interest or other receivables or accrues expenses or other liabilities denominated in a foreign currency and the time a Fund actually collects such receivables or pays such liabilities, and
  2. gains or losses attributable to fluctuations in the value of a foreign currency between the date of acquisition of a debt security denominated in a foreign currency or foreign currency forward contracts and the date of disposition.

Currency gains and losses are offset against market gains and losses on each trade before determining a net "Section 988" gain or loss under the IRC for that trade, which may increase or decrease the amount of a Fund's investment income available for distribution to its shareholders.

Global Strategic Income Fund/VA can also engage in the following techniques and strategies.

"Structured" Investments. "Structured" investments are financial instruments and contractual obligations designed to provide a specific risk-reward profile. A structured instrument is generally a hybrid security (often referred to as "hybrids") that combines characteristics of two or more different financial instruments. The terms of these investments may be contractually "structured" by the purchaser and the issuer (which is typically associated with an investment banking firm) of the instrument. Structured investments may have certain features of equity and debt securities, but may also have additional features. The key characteristics of structured investments are:

  • They change the risk or return on an underlying investment asset (such as a bond, money market instrument, loan or equity security).

  • They may replicate the risk or return of an underlying investment asset.

  • They typically involve the combination of an investment asset and a derivative.

  • The derivative is an integral part of the structure, not just a temporary hedging tool.

The returns on these investments may be linked to the value of an index (such as a currency or securities index) or a basket of instruments (a portfolio of assets, such as, high yield bonds, emerging market bonds, equities from a specific industry sector, a broad-based equity index or commodities), an individual stock, bond or other security, an interest rate, or a commodity. Some of the types of structured investments are:

  • Equity-linked notes

  • Index-linked notes

  • Inflation-linked notes

  • Commodity-linked notes

  • Credit-linked notes

  • Currency-linked notes

The values of structured investments will normally rise or fall in response to the changes in the performance of the underlying index, security, interest rate or commodity. Certain structured investments may offer full or partial principal protection, or may pay a variable amount at maturity, or may pay a coupon linked to a specific security or index while leaving the principal at risk. These investments may be used to seek to realize gain or limit exposure to price fluctuations and help control risk.

Depending on the terms of the particular instrument, structured investments may be subject to equity market risk, commodity market risk, currency market risk or interest rate risk. Structured notes are subject to credit risk with respect to the issuer of the instrument (referred to as "counter-party" risk) and, for structured debt investments, might also be subject to credit risk with respect to the issuer of the underlying investment. For notes that do not include principal protection (a form of insurance), a main risk is the possible loss of principal. There is a legal risk involved with holding complex instruments, where regulatory or tax considerations may change during the term of a note. Some structured investments may create leverage, which involves additional risks.

If the underlying investment or index does not perform as anticipated, the investment might not result in a gain or may cause a loss. The price of structured investments may be very volatile and they may have a limited trading market, making it difficult for the Fund to value them or sell them at an acceptable price. Usually structured investments are considered illiquid investments for purposes of limits on those investments.

Commodity-Linked Notes. A commodity-linked note is a derivative instrument that has characteristics of both a debt security and a commodity-linked derivative. It typically makes interest payments like a debt security and at maturity the principal payment is linked to the price movement of an underlying commodity-related variable that may be: a physical commodity (such as heating oil, livestock, or agricultural products), a commodity future or option contract, a commodity index, or some other readily measurable variable that reflects changes in the value of particular commodities or the commodities markets. Commodity-linked notes are typically issued by a bank, other financial institution or a commodity producer, and are negotiated with the issuer to obtain specific terms and features that are tailored to particular investment needs.

Qualifying Hybrid Instruments. "Qualifying hybrid instruments" are commodity-linked notes that are excluded from regulation under the Commodity Exchange Act and the rules thereunder.

Investment in Wholly-Owned Subsidiary. The Fund may invest up to 25% of its total assets in a wholly-owned and controlled subsidiary (the "Subsidiary"). The Subsidiary invests primarily in commodity-linked derivatives (including commodity futures, financial futures, options and swap contracts) and exchange traded funds related to gold or other special minerals ("Gold ETFs"). The Subsidiary may also invest in certain fixed-income securities and other investments that may serve as margin or collateral for its derivatives positions.

Since the Fund may invest a substantial portion of its assets in the Subsidiary, which may hold certain of the investments described in the Fund's prospectus and this Statement of Additional Information, the Fund may be considered to be investing indirectly in those investments through its Subsidiary. Therefore, references in the Fund's prospectus and in this Statement of Additional Information to investments by the Fund also may be deemed to include the Fund's indirect investments through the Subsidiary.

The Subsidiary is not registered under the Investment Company Act of 1940 (the "Investment Company Act") and does not subject its investor protections, except as noted in the Fund's prospectus or this Statement of Additional Information. The Fund, as the sole shareholder of the Subsidiary, does not have all of the protections offered by the Investment Company Act. However, the Subsidiary is wholly-owned and controlled by the Fund and managed by the Manager. Therefore, the Fund's ownership and control of the Subsidiary make it unlikely that the Subsidiary would take action contrary to the interests of the Fund or its shareholders. The Fund's Board has oversight responsibility for the investment activities of the Fund, including its expected investment in the Subsidiary, and the Fund's role as the sole shareholder of the Subsidiary. Also, in managing the Subsidiary's portfolio, the Manager is subject to the same investment policies and restrictions that apply to the management of the Fund, and, in particular, to the requirements relating to portfolio leverage, liquidity, brokerage, and the timing and method of the valuation of the Subsidiary's portfolio investments and shares of the Subsidiary.

Changes in the laws of the United States (where the Fund is organized) and/or the Cayman Islands (where the Subsidiary is organized), could prevent the Fund and/or the Subsidiary from operating as described in the Fund's prospectus and this Statement of Additional Information and could negatively affect the Fund and its shareholders. For example, the Cayman Islands currently does not impose certain taxes on the Subsidiary, including income and capital gains tax, among others. If Cayman Islands laws were changed to require the Subsidiary to pay Cayman Islands taxes, the investment returns of the Fund would likely decrease.

For information about the tax treatment of the Subsidiary and its investments, please refer to "Distributions and Taxes."

Money Fund/VA Investment Policies. Under Rule 2a-7 under the investment Company Act, Money Fund/VA may purchase only "Eligible Securities," as defined below, that the Manger, under procedures approved by the Trust's Board of Trustees, has determined have minimal credit risk. An "Eligible Security" is (a) a security that has received a rating in one of the two highest short-term rating categories by any two "nationally-recognized statistical rating organizations" as defined in Rule 2a-7 ("Rating Organizations"), or, if only one Rating Organization has rated that security, by that Rating Organization (the "Rating Requirements"), (b) a security that is guaranteed, and either that guarantee or the party providing that guarantee meets the Rating Requirements, or (c) an unrated security that is either issued by an issuer having another similar security that meets the Rating Requirements, or is judged by the Manager to be of comparable quality to investments that meet the Rating Requirements. Rule 2a-7 permits Money Fund/VA to purchase "First Tier Securities," which are Eligible Securities rated in the highest category for short-term debt obligations by at least two Rating Organizations, or, if only one Rating Organization has rated a particular security, by that Rating Organization, or comparable unrated securities, subject to limits set forth in the Money Fund/VA's Prospectus. The Fund can also buy "Second Tier Securities," which are Eligible Securities that are not First Tier securities.

If a security's rating is downgraded, the Manager and/or the Board may have to reassess the security's credit risk. If a security has ceased to be a First Tier Security, the Manager will promptly reassess whether the security continues to present "minimal credit risk." If the Manager becomes aware that any Rating Organization has downgraded its rating of a Second Tier Security or rated an unrated security below its second highest rating category, the Trust's Board of Trustees shall promptly reassess whether the security presents minimal credit risk and whether it is in Money Fund/VA's best interests to dispose of it.

If Money Fund/VA disposes of the security within five days of the Manager learning of the downgrade, the Manager will provide the Board with subsequent notice of such downgrade. If a security is in default, or ceases to be an Eligible Security, or is determined no longer to present minimal credit risks, the Board must determine if disposal of the security would be in Money Fund/VA's best interests.

The Rating Organizations currently designated as nationally-recognized statistical rating organizations by the SEC include Standard & Poor's (a division of the McGraw-Hill Companies), Moody's Investors Service, Inc., Fitch, Inc. and Dominion Bond Rating Service Limited. See Appendix B to this SAI for a description of the rating categories of those Rating Organizations.

  • Certificates of Deposit and Commercial Paper. Money Fund/VA may invest in certificates of deposit of up to $100,000 of a domestic bank if such certificates of deposit are fully insured as to principal by the Federal Deposit Insurance Corporation. For purposes of this section, the term "bank" includes commercial banks, savings banks, and savings and loan associations and the term "foreign bank" includes foreign branches of U.S. banks (issuers of "Eurodollar" instruments), U.S. branches and agencies of foreign banks (issuers of "Yankee dollar" instruments) and foreign branches of foreign banks. Money Fund/VA also may purchase obligations issued by other entities if they are: (i) guaranteed as to principal and interest by a bank or corporation whose certificates of deposit or commercial paper may otherwise be purchased by Money Fund/VA, or (ii) subject to repurchase agreements (explained in the prospectus), if the collateral for the agreement complies with Rule 2a-7.
  • Bank Loan Participation Agreements. Money Fund/VA may invest in bank loan participation agreements, although such investments have not been a principal investment strategy. They provide that Fund with an undivided interest in a loan made by the issuing bank in the proportion that Fund's interest bears to the total principal amount of the loan. In evaluating the risk of these investments, that Fund looks to the creditworthiness of the borrower that is obligated to make principal and interest payments on the loan.
  • Time Deposits. Money Fund/VA may invest in fixed time deposits, which are non-negotiable deposits in a bank for a specified period of time at a stated interest rate, whether or not subject to withdrawal penalties; however, such deposits which are subject to such penalties, other than deposits maturing in less than seven days, are subject to the 10% limitation applicable to illiquid securities purchased by Money Fund/VA. As discussed in the Money Fund/VA's Prospectus, the limit on illiquid securities will decrease to 5% of the Fund's assets on May 28, 2010.
  • Floating Rate/Variable Rate Notes. Money Fund/VA may invest in instruments with floating or variable interest rates. The interest rate on a floating rate obligation is based on a stated prevailing market rate, such as a bank's prime rate, the 90-day U.S. Treasury Bill rate, the rate of return on commercial paper or bank certificates of deposit, or some other standard, and is adjusted automatically each time such market rate is adjusted. The interest rate on a variable rate obligation is also based on a stated prevailing market rate but is adjusted automatically at a specified interval of no less than one year. Some variable rate or floating rate obligations in which Money Fund/VA may invest have a demand feature entitling the holder to demand payment at an amount approximately equal to the principal amount thereof plus accrued interest at any time, or at specified intervals not exceeding one year. These notes may or may not be backed by bank letters of credit. The interest rates on these notes fluctuate from time to time. Generally, the changes in the interest rate on such securities reduce the fluctuation in their market value. As interest rates decrease or increase, the potential for capital appreciation or depreciation is less than that for fixed-rate obligations of the same maturity.
  • Master Demand Notes. Master demand notes are corporate obligations that permit the investment of fluctuating amounts by Money Fund/VA at varying rates of interest pursuant to direct arrangements between Money Fund/VA, as lender, and the corporate borrower that issues the note. These notes permit daily changes in the amounts borrowed. Money Fund/VA has the right to increase the amount under the note at any time up to the full amount provided by the note agreement, or to decrease the amount. The borrower may repay up to the full amount of the note at any time without penalty. It is not generally contemplated that master demand notes will be traded because they are direct lending arrangements between the lender and the borrower. There is no secondary market for these notes, although they are redeemable and thus immediately repayable by the borrower at face value, plus accrued interest, at any time. Accordingly, where these obligations are not secured by letters of credit or other credit support arrangements, Money Fund/VA's right to redeem is dependent upon the ability of the borrower to pay principal and interest on demand. In evaluating the master demand arrangements, the Manager considers the earning power, cash flow, and other liquidity ratios of the issuer. If they are not rated by Rating Organizations, Money Fund/VA may invest in them only if, at the time of an investment, they are Eligible Securities. The Manager will continuously monitor the borrower's financial ability to meet all of its obligations because Money Fund/VA's liquidity might be impaired if the borrower were unable to pay principal and interest on demand. There is no limit on the amount of the Money Fund/VA's assets that may be invested in floating rate and variable rate obligations. Floating rate or variable rate obligations which do not provide for recovery of principal and interest within seven days' notice will be subject to the limitation applicable to illiquid securities purchased by Money Fund/VA.

Investment in Other Investment Companies. The Funds can also invest in the securities of other investment companies, which can include open-end funds, closed-end funds and unit investment trusts, subject to the limits set forth in the Investment Company Act that apply to those types of investments. For example, a Fund can invest in Exchange-Traded Funds, which are typically open-end funds or unit investment trusts, listed on a stock exchange. A Fund might do so as a way of gaining exposure to the segments of the equity or fixed-income markets represented by the Exchange-Traded Funds' portfolio, at times when a Fund may not be able to buy those portfolio securities directly.

Investing in another investment company may involve the payment of substantial premiums above the value of such investment company's portfolio securities and is subject to limitations under the Investment Company Act. The Funds do not intend to invest in other investment companies unless the Manager believes that the potential benefits of the investment justify the payment of any premiums or sales charges. As a shareholder of an investment company, a Fund would be subject to its ratable share of that investment company's expenses, including its advisory and administration expenses. The Funds do not anticipate investing a substantial amount of their net assets in shares of other investment companies.

Passive Foreign Investment Companies. Under U.S. tax laws, passive foreign investment companies ("PFICs") are those foreign corporations which generate primarily "passive" income. Passive income is defined as any income that is considered foreign personal holding company income under the Internal Revenue Code. For federal tax purposes, a foreign corporation is deemed to be a PFIC if 75% or more of its gross income during a fiscal year is passive income or if 50% or more of its assets are assets that produce, or are held to produce, passive income.

Foreign mutual funds are generally deemed to be PFICs, since nearly all of the income of a mutual fund is passive income. Foreign mutual funds investments may be used to gain exposure to the securities of companies in countries that limit or prohibit direct foreign investment.

Other types of foreign corporations may also be considered PFICs if their percentage of passive income or passive assets exceeds the limits described above. Federal tax laws impose severe tax penalties for failure to properly report investment income from PFICs. Although every effort is made to ensure compliance with federal tax reporting requirements for these investments, foreign corporations that are PFICs for federal tax purposes may not always be recognized as such.

Loans of Portfolio Securities. Securities lending pursuant to a Securities Lending Agency Agreement (the "Securities Lending Agreement") with Goldman Sachs Bank USA, doing business as Goldman Sachs Agency Lending ("Goldman Sachs"), may be used to attempt to increase income. Loans of portfolio securities are subject to the restrictions stated in the Prospectus and must comply with all applicable regulations and with the Funds' Securities Lending Procedures adopted by the Board. The terms of any loans must also meet applicable tests under the Internal Revenue Code.

There are certain risks in connection with securities lending, including possible delays in receiving additional collateral to secure a loan, or a delay or expenses in recovery of the loaned securities. Goldman Sachs has agreed, in general, to guarantee the obligations of borrowers to return loaned securities and to be responsible for certain expenses relating to securities lending. Under the Securities Lending Agreement, the Funds' securities lending procedures and applicable regulatory requirements (which are subject to change), the Funds must receive collateral from the borrower consisting of cash, bank letters of credit or securities of the U.S. Government (or its agencies or instrumentalities). On each business day, the amount of collateral that the Funds have received must at least equal the value of the loaned securities. If the Funds receive cash collateral from the borrower, the Manager, in its capacity as the Fund's collateral administrator, may invest that cash in certain high quality, short-term investments, including in money market funds advised by the Manager. The Funds will be subject to its proportional share of the expenses of such money market funds, including the advisory fee payable to the Manager or its affiliate as adviser to such funds. The Manager may charge a collateral administration fee of 0.08% on the value of cash collateral invested in other securities. All of the Funds' collateral investments must comply with its securities lending procedures. The Funds will be responsible for the risks associated with the investment of cash collateral, including the risk that the Fund may lose money on the investment or may fail to earn sufficient income to meet its obligations to the borrower.

The terms of the loans must permit the Funds to recall loaned securities on five business days' notice and the Funds will seek to recall loaned securities in time to vote on any matters that the Manager determines would have a material effect on the Funds' investment. The Securities Lending Agreement may be terminated by either Goldman Sachs or the Funds on 30 days' written notice.

Loans of portfolio securities are limited to not more than 25% of the value of the Funds' net assets.

Temporary Defensive and Interim Investments. When market conditions are unstable, or the Manager believes it is otherwise appropriate to reduce holdings in stocks or bonds, the Funds can invest in a variety of debt securities for defensive purposes. The Funds can also purchase these securities for liquidity purposes to meet cash needs due to the redemption of Fund shares, or to hold while waiting to reinvest cash received from the sale of other portfolio securities. The Funds can buy:

  • obligations issued or guaranteed by the U.S. government or its instrumentalities or agencies,
  • commercial paper (short-term, unsecured, promissory notes of domestic or foreign companies) rated in the three top rating categories of a nationally recognized rating organization,
  • short-term debt obligations of corporate issuers, rated investment grade (rated at least Baa by Moody's or at least BBB by Standard & Poor's or a comparable rating by another rating organization), or unrated securities judged by the Manager to have a comparable quality to rated securities in those categories,
  • certificates of deposit and bankers' acceptances of domestic and foreign banks having total assets in excess of $1 billion, and
  • repurchase agreements.

Short-term debt securities would normally be selected for defensive or cash management purposes because they can normally be disposed of quickly, are not generally subject to significant fluctuations in principal value and their value will be less subject to interest rate risk than longer-term debt securities.

Investment Restrictions

In addition to having a number of investment policies and restrictions identified in the Prospectuses or elsewhere as "fundamental policies," the Funds have other investment restrictions that are fundamental policies, described below.

Fundamental Policies. Fundamental policies are those policies that the Funds have adopted to govern its investments that can be changed only by the vote of a "majority" of each Fund's outstanding voting securities. Under the Investment Company Act, a "majority" vote is defined as the vote of the holders of the lesser of:

  • 67% or more of the shares present or represented by proxy at a shareholder meeting, if the holders of more than 50% of the outstanding shares are present or represented by proxy, or
  • more than 50% of the outstanding shares.

The Funds' (except Value Fund /VA) investment objectives are fundamental policies. Other policies described in the Prospectuses or this SAI are "fundamental" only if they are identified as such. The Funds' Board of Trustees can change non-fundamental policies without shareholder approval. However, significant changes to investment policies will be described in supplements or updates to the Prospectuses or this SAI, as appropriate. The Funds' most significant investment policies are described in the Prospectus.

Other Fundamental Investment Restrictions. The following investment restrictions are fundamental policies of the Funds (except Value Fund/VA).

  • No Fund can buy securities issued or guaranteed by any one issuer if (i) more than 5% of its total assets would be invested in securities of that issuer or (ii) it would then own more than 10% of that issuer's voting securities, or (iii) it would then own more than 10% in principal amount of that issuer's outstanding debt securities. The restriction on debt securities does not apply to Global Strategic Income Fund/VA. All of the restrictions apply only to 75% of each Fund's total assets. The limits do not apply to securities issued by the U.S. government or any of its agencies or instrumentalities, or securities of other investment companies.
  • The Funds cannot make loans except (a) through lending of securities, (b) through the purchase of debt instruments or similar evidences of indebtedness, (c) through an interfund lending program with other affiliated funds, and (d) through repurchase agreements.
  • The Funds cannot concentrate investments. That means they cannot invest 25% or more of their total assets in companies in any one industry. Obligations of the U.S. government, its agencies and instrumentalities are not considered to be part of an "industry" for the purposes of this restriction. This policy does not limit investments by Money Fund/VA in obligations issued by banks.
  • The Funds cannot buy or sell real estate or interests in real estate. However, the Funds can purchase debt securities secured by real estate or interests in real estate, or issued by companies, including real estate investment trusts, which invest in real estate or interests in real estate.
  • The Funds cannot underwrite securities of other companies. A permitted exception is in case a Fund is deemed to be an underwriter under the Securities Act when reselling any securities held in its own portfolio.
  • The Funds cannot invest in commodities or commodity contracts, other than the hedging instruments permitted by any of its other fundamental policies. It does not matter whether the hedging instrument is considered to be a commodity or commodity contract.
  • The Funds cannot issue "senior securities," but this does not prohibit certain investment activities for which assets of the Funds are designated as segregated, or margin, collateral or escrow arrangements are established, to cover the related obligations. Examples of those activities include borrowing money, reverse repurchase agreements, delayed-delivery and when-issued arrangements for portfolio securities transactions, and contracts to buy or sell derivatives, hedging instruments, options or futures.
  • The Funds cannot borrow money in excess of 33-1/3% of the value of that Fund's total assets. The Funds may borrow only from banks and/or affiliated investment companies. With respect to this fundamental policy, the Funds can borrow only if they maintain a 300% ratio of assets to borrowings at all times in the manner set forth in the Investment Company Act.

The following investment restrictions are fundamental policies of Value Fund/VA.

  • Value Fund/VA cannot issue senior securities. However, it can make payments or deposits of margin in connection with options or futures transactions, lend its portfolio securities, enter into repurchase agreements, borrow money and pledge its assets as permitted by its other fundamental policies. For purposes of this restriction, the issuance of shares of common stock in multiple classes or series, the purchase or sale of options, futures contracts and options on futures contracts, forward commitments, and repurchase agreements entered into in accordance with Value Fund/VA's investment policies, and the pledge, mortgage or hypothecation of Value Fund/VA's assets are not deemed to be senior securities.
  • Value Fund/VA cannot buy securities or other instruments issued or guaranteed by any one issuer if more than 5% of its total assets would be invested in securities or other instruments of that issuer or if it would then own more than 10% of that issuer's voting securities. This limitation applies to 75% of the Value Fund/VA's total assets. The limit does not apply to securities issued or guaranteed by the U.S. government or any of its agencies or instrumentalities or securities of other investment companies.
  • Value Fund/VA cannot invest 25% or more of its total assets in any one industry. That limit does not apply to securities issued or guaranteed by the U.S. government or its agencies and instrumentalities or securities issued by investment companies.
  • Value Fund/VA cannot invest in physical commodities or commodities contracts. However, the Fund can invest in hedging instruments permitted by any of its other investment policies, and can buy or sell options, futures, securities or other instruments backed by, or the investment return from which is linked to, changes in the price of physical commodities, commodity contracts or currencies.
  • Value Fund/VA cannot invest in real estate or in interests in real estate. However, the Fund can purchase securities of issuers holding real estate or interests in real estate (including securities of real estate investment trusts) if permitted by its other investment policies.
  • Value Fund/VA cannot underwrite securities of other issuers. A permitted exception is in case it is deemed to be an underwriter under the Securities Act in reselling its portfolio securities.
  • Value Fund/VA cannot make loans, except to the extent permitted under the Investment Company Act, the rules or regulations thereunder or any exemption therefrom that is applicable to the Fund, as such statute, rules or regulations may be amended or interpreted from time to time.
  • Value Fund/VA may not borrow money, except to the extent permitted under the Investment Company Act, the rules or regulations thereunder or any exemption therefrom that is applicable to the Fund, as such statute, rules or regulations may be amended or interpreted from time to time.

Funds' Non-Fundamental Restrictions. Main Street Small- & Mid-Cap Fund®/VA, Small- & Mid-Cap Growth Fund/VA and Value Fund/VA have other investment restrictions that are not fundamental policies, which means that they can be changed by the Board of Trustees without shareholder approval.

  • Main Street Small- & Mid-Cap Fund®/VA has also adopted the following non-fundamental policy: Main Street Small- & Mid-Cap Fund/VA will provide shareholders at least 60 days' prior notice of any change with respect to its non-fundamental policy that, under normal market conditions, it will invest at least 80% of its net assets, including any borrowings for investment purposes, in securities of companies having a market capitalization in the range of the Russell 2500TM Index.

  • Small- & Mid-Cap Growth Fund/VA has also adopted the following non-fundamental policy: Under normal market conditions, as a non-fundamental policy, the Fund will invest at least 80% of its net assets (plus borrowing for investment purposes) in equity securities of "small-cap" and "mid-cap" companies. This non-fundamental policy will not be changed without first providing 60 days' written notice to shareholders.

  • Value Fund/VA has also adopted the following non-fundamental policy: The Fund cannot invest in securities of other investment companies, except to the extent permitted under the Investment Company Act, the rules or regulations thereunder or any exemption therefrom, as such statute, rules or regulations may be amended or interpreted from time to time.

Unless the Prospectus or this SAI states that a percentage restriction applies on an ongoing basis, it applies only at the time the Funds makes an investment (except in the case of borrowing and investments in illiquid securities). The Funds need not sell securities to meet the percentage limits if the value of the investment increases in proportion to the size of the Fund.

For purposes of the Funds' policy not to concentrate its investments as described above, the Funds have adopted classifications of industries and group of related industries. These classifications are not fundamental policies.

Global Strategic Income Fund/VA's Subsidiary will also follow that Fund's fundamental and non-fundamental investment restrictions, described above, with respect to its investments.

Disclosure of Portfolio Holdings

While recognizing the importance of providing Fund shareholders with information about their Fund's investments and providing portfolio information to a variety of third parties to assist with the management, distribution and administrative processes, the need for transparency must be balanced against the risk that third parties who gain access to a Fund's portfolio holdings information could attempt to use that information to trade ahead of or against a Fund, which could negatively affect the prices a Fund is able to obtain in portfolio transactions or the availability of the securities that a portfolio manager is trading on a Fund's behalf.

The Funds, the Manager, the Distributor and the Transfer Agent have therefore adopted policies and procedures regarding the dissemination of information about the Funds' portfolio holdings by employees, officers and directors or trustees of the Funds, the Manager, the Distributor and the Transfer Agent. These policies are designed to assure that non-public information about the Funds' portfolio securities holdings is distributed only for a legitimate business purpose, and is done in a manner that (a) conforms to applicable laws and regulations and (b) is designed to prevent that information from being used in a way that could negatively affect the Funds' investment program or enable third parties to use that information in a manner that is harmful to the Funds. It is a violation of the Code of Ethics for any covered person to release holdings in contravention of the portfolio holdings disclosure policies and procedures adopted by the Funds.

Portfolio Holdings Disclosure Policies. The Funds, the Manager, the Distributor and the Transfer Agent and their affiliates and subsidiaries, employees, officers, and directors or trustees, shall neither solicit nor accept any compensation or other consideration (including any agreement to maintain assets in the Funds or in other investment companies or accounts managed by the Manager or any affiliated person of the Manager) in connection with the disclosure of the Funds' non-public portfolio holdings. The receipt of investment advisory fees or other fees and compensation paid to the Manager and its subsidiaries pursuant to agreements approved by the Funds' Board shall not be deemed to be "compensation" or "consideration" for these purposes. Until publicly disclosed, the Funds' portfolio holdings are proprietary, confidential business information. After they are publicly disclosed, the Funds' portfolio holdings may be released in any appropriate manner.

  • Public Disclosure. The Funds' portfolio holdings, other than Money Fund/VA, are made publicly available no later than 60 days after the close of each of the Funds' fiscal quarters, either in its annual or semi-annual report to shareholders or in its Statements of Investments on Form N-Q. Those documents are publicly available at the SEC. In addition, the top 20 month-end securities holdings (based on invested assets), listed by security or by issuer, may be posted on the OppenheimerFunds' website (at www.oppenheimerfunds.com) with a 15-day delay. The Funds may post a smaller list of holdings (e.g., the top five or top 10 portfolio holdings), or may not post any holdings, if the Manager believes that would be in the best interests of the Funds and their shareholders. Other general information about the Funds' portfolio investments, such as portfolio composition by asset class, industry, country, currency, credit rating or maturity, may also be publicly disclosed with a 15-day delay. 
  • Money Fund/VA's portfolio holdings, as of the most recent prior close of the New York Stock Exchange (the "NYSE"), are posted on the Money Fund/VA's website at www.oppenheimerfunds.com on each business day. Therefore, the Money Fund/VA's portfolio holdings are made publicly available no later than one business day after the close of trading on the NYSE on each day on which the NYSE is open. The Money Fund/VA's portfolio holdings are also made publicly available no later than 60 days after the close of each of the Fund's fiscal quarters in its semi-annual and annual report to shareholders, or in its Statements of Investment on Form N-Q. Those documents are publicly available at the SEC.

The Fund's complete portfolio holdings positions may be released to the following categories of individuals or entities on an ongoing basis, provided that such individual or entity either (1) has signed an agreement to keep such information confidential and not trade on the basis of such information, or (2) as a member of the Fund's Board, or as an employee, officer or director of the Manager, the Distributor, or the Transfer Agent, or of their legal counsel, is subject to fiduciary obligations (a) not to disclose such information except in compliance with the Fund's policies and procedures and (b) not to trade for his or her personal account on the basis of such information:

  • Employees of the Fund's Manager, Distributor and Transfer Agent who need to have access to such information (as determined by senior officers of such entities);
  • The Fund's independent registered public accounting firm;
  • Members of the Fund's Board and the Board's legal counsel;
  • The Fund's custodian bank;
  • A proxy voting service designated by the Fund and its Board;
  • Rating/ranking organizations (such as Lipper, Inc. and Morningstar, Inc.);
  • Portfolio pricing services retained by the Manager to provide portfolio security prices; and
  • Dealers, to obtain bids (price quotations if securities are not priced by the Fund's regular pricing services).

Month-end lists of the Fund's complete portfolio holdings may be disclosed for legitimate business reasons, no sooner than 30 days after the relevant month end, pursuant to special requests and under limited circumstances discussed below, provided that:

  • The third-party recipient must first submit a request for release of Fund portfolio holdings, explaining the business reason for the request;
  • Senior officers (a Senior Vice President, Deputy General Counsel or above) in the Manager's Portfolio and Legal departments must approve the completed request for release of Fund portfolio holdings; and
  • Before receiving the data, the third-party recipient must sign the Manager's portfolio holdings non-disclosure agreement, agreeing to keep confidential the information that is not publicly available regarding the Fund's holdings and agreeing not to trade directly or indirectly based on the information.

Other than for Money Fund/VA, portfolio holdings information of the Fund may be provided, under limited circumstances, to brokers or dealers with whom the Fund trades and entities that provide investment coverage or analytical information regarding the Fund's portfolio, provided that there is a legitimate investment reason for providing the information to the broker, dealer or other entity. Month-end portfolio holdings information may, under this procedure, be provided to vendors providing research information or analytics to the Fund, with at least a 15-day delay after the month end, but in certain cases may be provided to a broker or analytical vendor with a 1- 2 day lag to facilitate the provision of requested investment information to the Manager to facilitate a particular trade or portfolio manager's investment process for the Fund. Any third party receiving such information must first sign the Manager's portfolio holdings non-disclosure agreement as a pre-condition to receiving this information.

Portfolio holdings information (which may include information on the Fund's entire portfolio or individual securities therein) may be provided by senior officers of the Manager or attorneys on the legal staff of the Manager, Distributor, or Transfer Agent, in the following circumstances:

  • Response to legal process in litigation matters, such as responses to subpoenas or in class action matters where the Fund may be part of the plaintiff class (and seeks recovery for losses on a security) or a defendant; 
  • Response to regulatory requests for information (from the SEC, the Financial Industry Regulatory Authority ("FINRA"), state securities regulators, and/or foreign securities authorities, including without limitation requests for information in inspections or for position reporting purposes); 
  • To potential sub-advisers of portfolios (pursuant to confidentiality agreements); 
  • To consultants for retirement plans for plan sponsors/discussions at due diligence meetings (pursuant to confidentiality agreements); 
  • Investment bankers in connection with merger discussions (pursuant to confidentiality agreements).

Portfolio managers and analysts may, subject to the Manager's policies on communications with the press and other media, discuss portfolio information in interviews with members of the media, or in due diligence or similar meetings with clients or prospective purchasers of Fund shares or their financial representatives.

The Fund's shareholders may, under unusual circumstances (such as a lack of liquidity in the Fund's portfolio to meet redemptions), receive redemption proceeds of their Fund shares paid as pro rata shares of securities held in the Fund's portfolio. In such circumstances, disclosure of the Fund's portfolio holdings may be made to such shareholders.

Any permitted release of otherwise non-public portfolio holdings information must be in accordance with the then-current policy on approved methods for communicating confidential information.

The Chief Compliance Officer (the "CCO") of the Fund and the Manager, Distributor, and Transfer Agent shall oversee the compliance by the Manager, Distributor, Transfer Agent, and their personnel with these policies and procedures. At least annually the CCO reports to the Fund's Board any material violation of these policies and procedures during the previous period and makes recommendations to the Board as to any amendments that the CCO believes are necessary and desirable to carry out or improve these policies and procedures.

The Manager and the Fund have entered into ongoing arrangements to make available information about the Fund's portfolio holdings. One or more of the Oppenheimer funds may currently disclose portfolio holdings information based on ongoing arrangements to the following parties:

13D Research

Exane, Inc.

Multi-Bank Securities

1st Discount Brokerage

Fahnestock

Murphy & Durieu

ABG Sundal Collier

Fidelity Capital Markets

Natexis Bleichroeder

ABN Amro

FMS Bonds, Inc.

National Bank Financial

Advisor Asset Management

Fox-Pitt Kelton Inc.

Ned Davis Research Group

Alfa Capital Markets

Friedman, Billings, Ramsey & Co.

Needham & Company

Altrushare

FTN Financial

Nomura Securities International

Auerbach Grayson

Gabelli & Co.

Oddo Securities Corporation

Banco de Brasil Securities LLC

George K. Baum & Co.

Oppenheimer & Co. Inc.

Bank of America Securities LLC

GMP Securities L.P.

OTA-Off the Record Research

Barclays Capital

Goldman, Sachs & Co.

Pacific Crest Securities

Barnard Jacobs Mellet

Handelsbanken Markets Securities

Petercam

Belle Haven Investments

Hapoalim Securities Bank USA

Piper Jaffray

Beltone Financial

Helvea

Prager McCarthy & Sealy

Bergen Capital

HSBC Securities Inc.

R. Seelaus & Co. Inc.

Bernstein

Hyundai Securities America, Inc.

Ramirez & Co. Inc.

BMO Capital Markets

Intermonte

Raymond James & Associates

BNP Paribas

ISI Group, Inc.

RBC Capital Markets

Bradesco Securities, Inc.

Janco Partners

Red Capital Markets

Branch Bank & Trust Capital Markets

Janney Montgomery Scott LLC

Redburn Partners

Cabrera Capital

Jefferies & Company

Rice Financial Products Co.

Canaccord Adams, Inc.

Jennings Capital Inc.

Robert W. Baird & Co.

Canaccord Capital Corp.

JNK Securities Corp.

Roosevelt & Cross

Caris & Co.

JP Morgan Securities

Royal Bank of Scotland

Carnegie

JPP Eurosecurities

Samsung Securities Inc.

Cazenove

Keefe, Bruyette & Woods, Inc.

Sandford C. Bernstein & Co.

Cheuvreux NA

Keijser Securities N.V.

Scotia Capital Markets

Citigroup

Kempen & Co. USA

Seattle Northwest Securities

Citigroup Global Markets

Kepler Capital Markets

Securevest Financial

Cleveland Research

KeyBanc Capital Markets

SG Cowen

CLSA

Kotak Mahindra Inc.

Siebert Brandford Shank & Co.

Cormark Securities

Lazard Capital Markets

Sterne Agee

Cowen and Company, LLC

Lebenthal & Co. LLC

Stifel Nicolaus & Co.

Craig-Hallum Capital Group

Leerink Swann

Stone & Youngberg

Credit Suisse First Boston

Loop Capital Markets

SWS Group, Inc.

Credit Suisse Securities LLC

M&T Securities

TD Securities

Crews & Associates

Macquarie Securities

Think Equity Partners

D.A. Davidson & Company

Madison Williams and Company LLC

Troika Dialog

Dahlman Rose & Co.

MainFirst Bank AG

UBS

Daiwa Securities

Mediobanca Securities USA LLC

UOB Kay Hian Inc.

Davy

Merrill Lynch & Company, Inc.

US Bancorp

Desjardins Securities, Inc.

Merrion Stockbrokers Ltd.

Vining & Sparks

Deutsche Bank Securities Inc.

Mesirow Financial

Vontobel Securities Ltd.

Dougherty & Co.

MF Global Securities, Ltd.

Wachovia

Duncan Williams, Inc.

Mitsubishi UFJ Securities Inc.

Wedbush Morgan Securities

Dundee Securities Inc.

Mizuho Securities USA, Inc.

Wells Fargo Securities

DZ Financial Markets

Morgan Keegan

WH Mell & Associates

Emmet & Co., Inc.

Morgan Stanley Smith Barney

William Blair & Co.

Empirical Research Partners

Motilal Oswal Securities Ltd.

Ziegler Capital Markets Group

Enam Securities PVT Ltd.

MR Beal & Co.


The shareholders of Global Securities Fund/VA, Main Street Fund/VA and Global Strategic Income Fund/VA may, under unusual circumstances (such as a lack of liquidity in a Fund's portfolio to meet redemptions), receive redemption proceeds of their Fund shares paid as pro rata shares of securities held in a Fund's portfolio. In such circumstances, disclosure of a Fund's portfolio holdings may be made to such shareholders.

Organization and History

Each Fund is an investment portfolio, or "series" of Oppenheimer Variable Account Funds (the "Trust"), a multi-series open-end diversified management investment company organized as a Massachusetts business trust that presently includes 11 series. Money Fund/VA, Core Bond Fund/VA and Capital Appreciation Fund/VA were all organized in 1983, High Income Fund/VA, Small- & Mid-Cap Growth Fund/VA and Balanced Fund/VA, were all organized in 1986, Global Securities Fund/VA was organized in 1990, Global Strategic Income Fund/VA was organized in 1993, Main Street Fund®/VA was organized in 1995, Main Street Small- & Mid-Cap Fund®/VA was organized in 1998 and Value Fund/ VA was organized in 2002. The suffix "VA" was added to each Fund's name on May 1, 1999. Prior to April 29, 2005, Oppenheimer Core Bond Fund/VA was named "Oppenheimer Bond Fund/VA." Prior to April 30, 2010, Oppenheimer Small- & Mid-Cap Growth Fund/VA was named "Oppenheimer MidCap Fund/VA," and prior to April 30, 2006, that Fund was named "Oppenheimer Aggressive Growth Fund/VA." Prior to April 30, 2010, Oppenheimer Global Strategic Income Fund/VA was named "Oppenheimer Strategic Bond Fund/VA." Prior to April 29, 2011, Oppenheimer Main Street Small- & Mid-Cap Fund®/VA was named "Oppenheimer  Main Street Small Cap Fund/VA." All references to the Funds' Board of Trustees and Officers refer to the Trustees and Officers, respectively, of Oppenheimer Variable Account Funds.

Shareholders. Insurance companies that hold shares of the Funds in their separate accounts for the benefit of their customers' variable annuities, variable life insurance policies and other investment products are the record holders and the owners of shares of beneficial interest in the Funds. The right of those customers of the insurance companies to give directions to the insurance company for the purchase or redemption of shares is determined under the contract between the customer and the insurance company. The insurance companies, and not their customers, are "shareholders" of the Funds. The rights of those insurance companies as record holders and owners of shares of a Fund are different from the rights of their customers. These customers are indirect owners for all purposes except for those rights reserved by insurance companies in the insurance contract, or as permitted by the SEC. The term "shareholder" in this SAI refers to the indirect or underlying owner of shares held in the account, and not to the insurance companies.

Classes of Shares. The Trustees are authorized, without shareholder approval, to create new series and classes of shares, to reclassify unissued shares into additional series or classes and to divide or combine the shares of a class into a greater or lesser number of shares without changing the proportionate beneficial interest of a shareholder in the Fund. Shares do not have cumulative voting rights, preemptive rights or subscription rights. Shares may be voted in person or by proxy at shareholder meetings.

The Funds currently have four classes of shares authorized. All Funds offer a class of shares with no name designation referred to in this SAI and the Prospectus as "non-service shares." As of September 15, 2006, all Funds except Money Fund/VA also offer a service share class, subject to a Distribution and Service Plan. Money Fund/VA currently only offers the class of non-service shares. Global Securities Fund/VA and High Income Fund/VA offer two additional share classes, referred to in this SAI "Class 3" and "Class 4", which are subject to a redemption fee. In addition, Class 4 shares are subject to a Distribution and Service Plan. Each class of shares:

  • has its own dividends and distributions,
  • pays certain expenses which may be different for the different classes,
  • will generally have a different net asset value,
  • will generally have separate voting rights on matters in which interests of one class are different from interests of another class, and
  • votes as a class on matters that affect that class alone.

Each share of each class has one vote at shareholder meetings, with fractional shares voting proportionally, on matters submitted to a vote of shareholders. Each share of a Fund represents an interest in each Fund proportionately equal to the interest of each other share of the same class of that Fund.

Meetings of Shareholders. The Trust is a Massachusetts business Trust. The Funds are not required to hold, and do not plan to hold, regular annual meetings of shareholders, but may hold shareholder meetings from time to time on important matters or when required to do so by the Investment Company Act or other applicable law. Shareholders have the right, upon a vote or declaration in writing of two-thirds of the outstanding shares of the Funds, to remove a Trustee or to take other action described in the Trust's Declaration of Trust.

The Trustees will call a meeting of shareholders to vote on the removal of a Trustee upon the written request of the record holders of 10% of its outstanding shares. If the Trustees receive a request from at least 10 shareholders stating that they wish to communicate with other shareholders to request a meeting to remove a Trustee, the Trustees will then either make the Funds' shareholder list available to the applicants or mail their communication to all other shareholders at the applicants' expense. The shareholders making the request must have been shareholders for at least six months and must hold shares of a Fund valued at $25,000 or more or constituting at least 1% of a Fund's outstanding shares. The Trustees may also take other action as permitted by the Investment Company Act.

Shareholder and Trustee Liability. The Trust's Declaration of Trust contains an express disclaimer of shareholder or Trustee liability for the Trust's obligations. It also provides for indemnification and reimbursement of expenses out of the Trust's property for any shareholder held personally liable for its obligations. The Declaration of Trust also states that upon request, the Trust shall assume the defense of any claim made against a shareholder for any act or obligation of the Trust and shall satisfy any judgment on that claim. Massachusetts law permits a shareholder of a business trust (such as the Trust) to be held personally liable as a "partner" under certain circumstances. However, the risk that a Fund shareholder will incur financial loss from being held liable as a "partner" of the Trust is limited to the relatively remote circumstances in which the Trust would be unable to meet its obligations.

The Trust's contractual arrangements state that any person doing business with the Trust (and each shareholder of the Funds) agrees under its Declaration of Trust to look solely to the assets of the Funds for satisfaction of any claim or demand that may arise out of any dealings with the Funds. Additionally, the Trustees shall have no personal liability to any such person, to the extent permitted by law.

Board of Trustees and Oversight Committees

The Fund is governed by a Board of Trustees, which is responsible for overseeing the Fund. The Board is led by William L. Armstrong, an independent trustee, who is not an "interested person" of the Fund, as that term is defined in the Investment Company Act of 1940. The Board meets periodically throughout the year to oversee the Fund's activities, including to review its performance, oversee potential conflicts that could affect the Fund, and review the actions of the Manager. With respect to its oversight of risk, the Board, through its committees, relies on reports and information received from various parties, including the Manager, internal auditors, the Fund's Chief Compliance Officer, the Fund's outside auditors and Fund counsel. It is important to note that, despite the efforts of the Board and of the various parties that play a role in the oversight of risk, it is likely that not all risks will be identified or mitigated.

The Board has an Audit Committee, a Review Committee and a Governance Committee. Each of the Committees is comprised solely of Trustees who are not "interested persons" under the Investment Company Act (the "Independent Trustees"). The Board has determined that its leadership structure is appropriate in light of the characteristics and circumstances of the Trust because it allocates areas of responsibility among the committees in a manner that enhances the Board's oversight.

During the Funds' fiscal year ended December 31, 2010, the Audit Committee held 4 meetings, the Review Committee held 4 meetings and the Governance Committee held 4 meetings.

The members of the Audit Committee are George C. Bowen (Chairman), Edward L. Cameron, Robert J. Malone and F. William Marshall, Jr. The Audit Committee selects the Fund's independent registered public accounting firm (also referred to as the "independent Auditors"). Other main functions of the Audit Committee, outlined in the Audit Committee Charter, include, but are not limited to: (i) reviewing the scope and results of financial statement audits and the audit fees charged; (ii) reviewing reports from the Fund independent Auditors regarding the Fund internal accounting procedures and controls; (iii) reviewing reports from the Manager's Internal Audit Department; (iv) reviewing certain reports from and meet periodically with the Funds' Chief Compliance Officer; (v) maintaining a separate line of communication between the Fund independent Auditors and the Independent Directors/Trustees; (vi) reviewing the independence of the Fund independent Auditors; and (vii) approving in advance the provision of any audit or non-audit services by the Fund independent Auditors, including tax services, that are not prohibited by the Sarbanes-Oxley Act, to the Fund, the Manager and certain affiliates of the Manager. The Audit Committee also reviews reports concerning the valuation on certain investments.

The members of the Review Committee are Sam Freedman (Chairman), Jon S. Fossel and Beverly L. Hamilton. Among other duties, as set forth in the Review Committee's Charter, the Review Committee reviews Fund performance and expenses as well as oversees several of the Fund's principal service providers and certain policies and procedures of the Fund.

The members of the Governance Committee are Robert J. Malone (Chairman), William Armstrong, Edward L. Cameron, Beverly L. Hamilton and F. William Marshall, Jr. The Governance Committee has adopted a charter setting forth its duties and responsibilities. Among other duties, the Governance Committee reviews and oversees Fund governance and the nomination of Directors/Trustees, including Independent Directors/Trustees. The Governance Committee has adopted a process for shareholder submission of nominees for board positions. Shareholders may submit names of individuals, accompanied by complete and properly supported resumes, for the Governance Committee's consideration by mailing such information to the Governance Committee in care of the Fund. The Governance Committee has not established specific qualifications that it believes must be met by a nominee. In evaluating nominees, the Governance Committee considers, among other things, an individual's background, skills, and experience; whether the individual is an "interested person" as defined in the Investment Company Act; and whether the individual would be deemed an "audit committee financial expert" within the meaning of applicable SEC rules. The Governance Committee also considers whether the individual's background, skills, and experience will complement the background, skills, and experience of other Trustees and will contribute to the Board's diversity. The Governance Committee may consider such persons at such time as it meets to consider possible nominees. The Governance Committee, however, reserves sole discretion to determine which candidates for Director/Trustee it will recommend to the Board and the shareholders and it may identify candidates other than those submitted by shareholders. The Governance Committee may, but need not, consider the advice and recommendation of the Manager or its affiliates in selecting nominees. The full Board elects new Directors/Trustees except for those instances when a shareholder vote is required.

Shareholders who desire to communicate with the Board should address correspondence to the Board or an individual Board member and may submit correspondence electronically at www.oppenheimerfunds.com under the caption "contact us" or by mail to the Fund at the address on the front cover of this SAI.

Below is a brief discussion of the specific experience, qualifications, attributes or skills of each Board member that led the Board to conclude that he or she should serve as a Director/Trustee of the Fund.

Each Independent Director/Trustee has served on the Board for the number of years listed below, during the course of which he or she has become familiar with the Fund's (and other Oppenheimer funds') financial, accounting, regulatory and investment matters and has contributed to the Board's deliberations. Each Director's/Trustee's outside professional experience is outlined in the table of Biographical Information, below.

Trustees and Officers of the Fund

Except for Mr. Glavin, each of the Trustees is an Independent Trustee and is also a director or trustee of the following Oppenheimer funds (referred to as "Denver Board Funds"):

Oppenheimer Capital Income Fund

Oppenheimer Main Street Funds, Inc.

Oppenheimer Cash Reserves Fund

Oppenheimer Main Street Select Fund

Oppenheimer Champion Income Fund

Oppenheimer Main Street Small- & Mid-Cap Fund

Oppenheimer Commodity Strategy Total Return Fund

Oppenheimer Master Event-Linked Bond Fund, LLC

Oppenheimer Corporate Bond Fund

Oppenheimer Master Inflation Protected Securities Fund, LLC

Oppenheimer Currency Opportunities Fund

Oppenheimer Master Loan Fund, LLC

Oppenheimer Emerging Markets Debt Fund

Oppenheimer Portfolio Series Fixed Income Active

Oppenheimer Equity Fund, Inc.

Allocation Fund

Oppenheimer Global Strategic Income Fund

Oppenheimer Principal Protected Trust III

Oppenheimer Integrity Funds

Oppenheimer Senior Floating Rate Fund

Oppenheimer International Bond Fund

Oppenheimer Short Duration Fund

Oppenheimer Limited-Term Government Fund

Oppenheimer Variable Account Funds

Panorama Series Fund, Inc.


Messrs. Anello, Bhaman, Edwards, Ferreira, Gabinet, Glavin, Govil, Keffer, Legg, Memani, Petersen, Proctor, Ram, Steinmetz, Strzalkowski, Vandehey, Vardharaj, Welsh, Williams, Wixted, Wong, Zack, Ziehl and Zibelli and Mss. Bloomberg, Bullington, Ives, Ruffle, Van Cleave and Wolf, who are officers of the Funds, hold the same offices with one or more of the other Denver Board Funds.

Present or former officers, directors, trustees and employees (and their immediate family members) of the Fund, the Manager and its affiliates, and retirement plans established by them for their employees are permitted to purchase Class A shares of other Oppenheimer funds at net asset value without sales charge. The sales charge on Class A shares is waived for that group because of the reduced sales efforts realized by the Distributor. Present or former officers, directors, trustees and employees (and their eligible family members) of the Fund, the Manager and its affiliates, its parent company and the subsidiaries of its parent company, and retirement plans established for the benefit of such individuals, are also permitted to purchase Class Y shares of the Oppenheimer funds that offer Class Y shares.

As of April 5, 2011 the Trustees/Directors and officers of the Fund, as a group, owned less than 1% of any class of shares of the Fund beneficially or of record.

The foregoing statement does not reflect ownership of shares held of record by an employee benefit plan for employees of the Manager, other than the shares beneficially owned under that plan by the officers of the Fund. In addition, none of the Independent Trustees/Directors (nor any of their immediate family members) owns securities of either the Manager or the Distributor or of any entity directly or indirectly controlling, controlled by or under common control with the Manager or the Distributor.

Biographical Information. The Trustees and officers, their positions with the Fund, length of service in such position(s) and principal occupations and business affiliations during at least the past five years are listed in the charts below. The address of each Independent Trustee in the chart below is 6803 S. Tucson Way, Centennial, Colorado 80112-3924. Each Trustee serves for an indefinite term, or until his or her resignation, retirement, death or removal.

Each Independent Trustee has served the Fund in the following capacities from the following dates:

Position(s)

Length of Service

William L. Armstrong

Board Chairman

Since 2003

Trustee

Since 1999

George C. Bowen

Trustee

Since 1998

Edward L. Cameron

Trustee

Since 1999

Jon S. Fossel

Trustee

Since 1990

Sam Freedman

Trustee

Since 1996

Beverly L. Hamilton

Trustee

Since 2002

Robert J. Malone

Trustee

Since 2002

F. William Marshall, Jr.

Trustee

Since 2000


Independent Trustees

Name, Age, Position(s)

Principal Occupations(s) During the Past
5 Years; Other Trusteeship/Directorships Held

Portfolios Overseen
in Fund Complex

William L. Armstrong (74), Chairman of the Board of Trustees

President, Colorado Christian University (since 2006); Chairman, Cherry Creek Mortgage Company (since 1991), Chairman, Centennial State Mortgage Company (since 1994), Chairman, The El Paso Mortgage Company (since 1993); Chairman, Ambassador Media Corporation (since 1984); Chairman, Broadway Ventures (since 1984); Director of Helmerich Payne, Inc. (oil and gas drilling/production company) (since 1992), former Director of Campus Crusade for Christ (non-profit) (1991-2008); former Director, The Lynde and Harry Bradley Foundation, Inc. (non-profit organization) (2002-2006); former Chairman of: Transland Financial Services, Inc. (private mortgage banking company) (1997-2003), Great Frontier Insurance (1995-2000), Frontier Real Estate, Inc. (residential real estate brokerage) (1994-2000) and Frontier Title (title insurance agency) (1995-2000); former Director of the following: UNUMProvident (insurance company) (1991-2004), Storage Technology Corporation (computer equipment company) (1991-2003) and International Family Entertainment (television channel) (1992-1997); U.S. Senator (January 1979-January 1991). Mr. Armstrong has served on the Boards of certain Oppenheimer funds since 1999, during which time he has become familiar with the Fund's (and other Oppenheimer funds') financial, accounting, regulatory and investment matters and has contributed to the Boards' deliberations.

36

George C. Bowen (74), Trustee

Assistant Secretary and Director of Centennial Asset Management Corporation (December 1991-April 1999); President, Treasurer and Director of Centennial Capital Corporation (June 1989-April 1999); Chief Executive Officer and Director of MultiSource Services, Inc. (March 1996-April 1999); Mr. Bowen held several positions with the Manager and with subsidiary or affiliated companies of the Manager (September 1987-April 1999). Mr. Bowen has served on the Boards of certain Oppenheimer funds since 1998, during which time he has become familiar with the Fund's (and other Oppenheimer funds') financial, accounting, regulatory and investment matters and has contributed to the Boards' deliberations.

36

Edward L. Cameron (72), Trustee

Member of The Life Guard of Mount Vernon (George Washington historical site) (June 2000 – June 2006); Partner of PricewaterhouseCoopers LLP (accounting firm) (July 1974-June 1999); Chairman of Price Waterhouse LLP Global Investment Management Industry Services Group (accounting firm) (July 1994-June 1998). Mr. Cameron has served on the Boards of certain Oppenheimer funds since 1999, during which time he has become familiar with the Fund's (and other Oppenheimer funds') financial, accounting, regulatory and investment matters and has contributed to the Boards' deliberations.

36

Jon S. Fossel (68), Trustee

Chairman of the Board (since 2006) and Director (since June 2002) of UNUMProvident (insurance company); Director of Northwestern Energy Corp. (public utility corporation) (since November 2004); Director of P.R. Pharmaceuticals (October 1999-October 2003); Director of Rocky Mountain Elk Foundation (non-profit organization) (February 1998-February 2003 and February 2005-February 2007); Chairman and Director (until October 1996) and President and Chief Executive Officer (until October 1995) of the Manager; President, Chief Executive Officer and Director of the following: Oppenheimer Acquisition Corp. ("OAC") (parent holding company of the Manager), Shareholders Services, Inc. and Shareholder Financial Services, Inc. (until October 1995). Mr. Fossel has served on the Boards of certain Oppenheimer funds since 1990, during which time he has become familiar with the Fund's (and other Oppenheimer funds') financial, accounting, regulatory and investment matters and has contributed to the Boards' deliberations.

36

Sam Freedman (70), Trustee

Director of Colorado UpLIFT (charitable organization) (since September 1984). Mr. Freedman held several positions with the Manager and with subsidiary or affiliated companies of the Manager (until October 1994). Mr. Freeman has served on the Boards of certain Oppenheimer funds since 1996, during which time he has become familiar with the Fund's (and other Oppenheimer funds') financial, accounting, regulatory and investment matters and has contributed to the Boards' deliberations.

36

Beverly L. Hamilton (64), Trustee

Trustee of Monterey Institute for International Studies (educational organization) (since February 2000); Board Member of Middlebury College (educational organization) (since December 2005); Chairman (since 2010) of American Funds' Emerging Markets Growth Fund, Inc. (mutual fund); Director of The California Endowment (philanthropic organization) (April 2002-April 2008); Director (February 2002-2005) and Chairman of Trustees (2006-2007) of the Community Hospital of Monterey Peninsula; Director (October 1991-2005); Vice Chairman (2006-2009) of American Funds' Emerging Markets Growth Fund, Inc. (mutual fund); President of ARCO Investment Management Company (February 1991-April 2000); Member of the investment committees of The Rockefeller Foundation (2001-2006) and The University of Michigan (since 2000); Advisor at Credit Suisse First Boston's Sprout venture capital unit (venture capital fund) (1994-January 2005); Trustee of MassMutual Institutional Funds (investment company) (1996-June 2004); Trustee of MML Series Investment Fund (investment company) (April 1989-June 2004); Member of the investment committee of Hartford Hospital (2000-2003); and Advisor to Unilever (Holland) pension fund (2000-2003). Ms. Hamilton has served on the Boards of certain Oppenheimer funds since 2002, during which time she has become familiar with the Fund's (and other Oppenheimer funds') financial, accounting, regulatory and investment matters and has contributed to the Boards' deliberations.

36

Robert J. Malone (66), Trustee

Board of Directors of Opera Colorado Foundation (non-profit organization) (since March 2008); Director of Jones Knowledge, Inc. (since 2006); Director of Jones International University (educational organization) (since August 2005); Chairman, Chief Executive Officer and Director of Steele Street Bank Trust (commercial banking) (since August 2003); Trustee of the Gallagher Family Foundation (non-profit organization) (since 2000); Director of Colorado UpLIFT (charitable organization) (1986-2010); Former Chairman of U.S. Bank-Colorado (subsidiary of U.S. Bancorp and formerly Colorado National Bank) (July 1996-April 1999); Director of Commercial Assets, Inc. (real estate investment trust) (1993-2000); Director of Jones Knowledge, Inc. (2001-July 2004); and Director of U.S. Exploration, Inc. (oil and gas exploration) (1997-February 2004). Mr. Malone has served on the Boards of certain Oppenheimer funds since 2002, during which time he has become familiar with the Fund's (and other Oppenheimer funds') financial, accounting, regulatory and investment matters and has contributed to the Boards' deliberations.

36

F. William Marshall, Jr. (68), Trustee

Trustee Emeritus of Worcester Polytech Institute (WPI) (private university) (since 2009); Trustee of MassMutual Select Funds (formerly MassMutual Institutional Funds) (investment company) (since 1996) and MML Series Investment Fund (investment company) (since 1996); President and Treasurer of the SIS Funds (private charitable fund) (January 1999-November 2010); Former Trustee of WPI (1985-2008); Former Chairman of the Board (2004-2006) and Former Chairman of the Investment Committee of WPI (1994-2008); Chairman of SIS Family Bank, F.S.B. (formerly SIS Bank) (commercial bank) (January 1999-July 1999); Executive Vice President of Peoples Heritage Financial Group, Inc. (commercial bank) (January 1999-July 1999); and Former President and Chief Executive Officer of SIS Bancorp. (1993-1999). Mr. Marshall has served on the Boards of certain Oppenheimer Funds since 2000, during which time he has become familiar with the Fund's (and other Oppenheimer funds') financial, accounting, regulatory and investment matters and has contributed to the Boards' deliberations.

38*


* Includes two open-end investment companies: MassMutual Select Funds and MML Series Investment Fund. In accordance with the instructions for SEC Form N-1A, for purposes of this section only, MassMutual Select Funds and MML Series Investment Fund are included in the "Fund Complex." The Manager does not consider MassMutual Select Funds and MML Series Investment Fund to be part of the OppenheimerFunds' "Fund Complex" as that term may be otherwise interpreted.

Mr. Glavin is an "Interested Trustee" because he is affiliated with the Manager by virtue of his positions as an officer and director of the Manager, and as a shareholder of its parent company. Mr. Glavin was elected as a Trustee of the Fund with the understanding that if he ceases to be the chief executive officer of the Manager, he will resign as a Trustee of the Fund and of the other Denver Board Funds (defined above). Mr. Glavin's address is Two World Financial Center, 225 Liberty Street, 11th Floor, New York, New York 10281-1008.

Interested Trustee and Officer

Name, Age, Position(s)

Principal Occupation(s) During the Past 5
Years; Other Trusteeships/Directorships Held

Portfolios Overseen
in Fund Complex

William F. Glavin Jr. (52) Trustee, President and Principal Executive Officer

Chairman of the Manager (since December 2009); Chief Executive Officer and Director of the Manager (since January 2009); President of the Manager (since May 2009); Director of Oppenheimer Acquisition Corp. ("OAC") (the Manager's parent holding company) (since June 2009); Executive Vice President (March 2006 - February 2009) and Chief Operating Officer (July 2007 - February 2009) of Massachusetts Mutual Life Insurance Company (OAC's parent company); Director (May 2004 - March 2006) and Chief Operating Officer and Chief Compliance Officer (May 2004 - January 2005), President (January 2005 - March 2006) and Chief Executive Officer (June 2005 - March 2006) of Babson Capital Management LLC; Director (March 2005 - March 2006), President (May 2003 - March 2006) and Chief Compliance Officer (July 2005 - March 2006) of Babson Capital Securities, Inc. (a broker-dealer); President (May 2003 - March 2006) of Babson Investment Company, Inc.; Director (May 2004 - August 2006) of Babson Capital Europe Limited; Director (May 2004 - October 2006) of Babson Capital Guernsey Limited; Director (May 2004 - March 2006) of Babson Capital Management LLC; Non-Executive Director (March 2005 - March 2007) of Baring Asset Management Limited; Director (February 2005 - June 2006) Baring Pension Trustees Limited; Director and Treasurer (December 2003 - November 2006) of Charter Oak Capital Management, Inc.; Director (May 2006 - September 2006) of C.M. Benefit Insurance Company; Director (May 2008 - June 2009) and Executive Vice President (June 2007 - July 2009) of C.M. Life Insurance Company; President (March 2006 - May 2007) of MassMutual Assignment Company; Director (January 2005 - December 2006), Deputy Chairman (March 2005 - December 2006) and President (February 2005 - March 2005) of MassMutual Holdings (Bermuda) Limited; Director (May 2008 - June 2009) and Executive Vice President (June 2007 - July 2009) of MML Bay State Life Insurance Company; Chief Executive Officer and President (April 2007 - January 2009) of MML Distributors, LLC.; and Chairman (March 2006 -December 2008) and Chief Executive Officer (May 2007 - December 2008) of MML Investors Services, Inc. Mr. Glavin has served on the Board since December 2009, during which time he has become familiar with the Fund's (and other Oppenheimer funds') financial, accounting, regulatory and investment matters and has contributed to the Board's deliberations.

96


The addresses of the officers in the chart below are as follows: for Messrs. Anello, Bhaman, Edwards, Ferreira, Gabinet, Glavin, Govil, Keffer, Memani, Ram, Steinmetz, Strzalkowski, Vardharaj, Williams, Wong, Zack, Ziehl and Zibelli and Mss. Bloomberg, Ruffle and Van Cleave, Two World Financial Center, 225 Liberty Street, New York, New York 10281-1008, for Messrs. Legg, Petersen, Proctor, Vandehey, Welsh and Wixted and Mss. Bullington, Ives and Wolf, 6803 S. Tucson Way, Centennial, Colorado 80112-3924. Each officer serves for an indefinite term or until his or her resignation, retirement death or removal.

Each of the Officers has served the Funds in the following capacities from the following dates:

Raymond Anello

Vice President and Portfolio Manager

Since 2011

Rajeev Bhaman

Vice President and Portfolio Manager

Since 2004

Emmanuel Ferreira

Vice President and Portfolio Manager

Since 2003

Manind Govil

Vice President and Portfolio Manager

Since 2009

Krishna Memani

Vice President and Portfolio Manager

Since 2009

Christopher Proctor

Vice President and Portfolio Manager

Since 2010

Benjamin Ram

Vice President and Portfolio Manager

Since 2009

Arthur P. Steinmetz

Vice President and Portfolio Manager

Since 1993

Peter A. Strzalkowski

Vice President and Portfolio Manager

Since 2009

Julie Van Cleave

Vice President and Portfolio Manager

Since 2010

Raman Vardharaj

Vice President and Portfolio Manager

Since 2009

Joseph Welsh

Vice President and Portfolio Manager

Since 2009

Mitch Williams

Vice President and Portfolio Manager

Since 2008 & 2009 respectively

Carol E. Wolf

Vice President and Portfolio Manager

Since 1998

Caleb Wong

Vice President and Portfolio Manager

Since 2009

Ronald Zibelli, Jr.

Vice President and Portfolio Manager

Since 2006

Matthew Ziehl

Vice President and Portfolio Manager

Since 2009

Thomas W. Keffer

Vice President and Chief Business Officer

Since 2009

Mark S. Vandehey

Vice President and Chief Compliance Officer

Since 2004

Robert G. Zack

Vice President

Since 2011

Brian W. Wixted

Treasurer and Principal Financial & Accounting Officer

Since 1999

James Kennedy

Assistant Treasurer

Since 2011

Brian S. Petersen

Assistant Treasurer

Since 2004

Stephanie J. Bullington

Assistant Treasurer

Since 2008

Arthur S. Gabinet

Secretary

Since 2011

Lisa I. Bloomberg

Assistant Secretary

Since 2004

Kathleen T. Ives

Assistant Secretary

Since 2001

Taylor V. Edwards

Assistant Secretary

Since 2008

Randy G. Legg

Assistant Secretary

Since 2008

Adrienne M. Ruffle

Assistant Secretary

Since 2008


Other Officers of the Funds - Portfolio Managers

Name, Age, Position(s)

Principal Occupation(s) During the Last 5 Years

Portfolios Overseen in Fund Complex

Raymond Anello (46)
Vice President and Portfolio Manager

Mr. Anello has been a Vice President of the Manager since May 2009 and a portfolio manager of the Manager since April 2011. He has served as sector manager for energy and utilities for the Manager's Main Street Investment Team since May 2009. Prior to joining the Manager, Mr. Anello was portfolio manager of the RS All Cap Dividend product from its inception in July 2007 through April 2009 and served as a sector manager for energy and utilities for various other RS Investments products. Mr. Anello joined Guardian Life Insurance Company in October 1999 and transitioned to RS Investments in October 2006 in connection with Guardian Life Insurance Company's acquisition of an interest in RS Investments. Before joining Guardian, he was an equity portfolio manager/analyst and high-yield analyst for Orion Capital from 1995 to 1998. He served as an assistant portfolio manager at the Garrison Bradford portfolio management firm from 1988 to 1995.

2

Rajeev Bhaman (47)
Vice President and Portfolio Manager

Senior Vice President of the Manager (since May 2006). He was a Vice President of the Manager (January 1997-May 2006).

2

Emmanuel Ferreira (43)
Vice President and Portfolio Manager

Vice President of the Manager since January 2003; Portfolio Manager at Lashire Investments (July 1999-December 2002).

3

Manind "Mani" Govil (41)
Vice President and Portfolio Manager

Mr. Govil, CFA, has been a Senior Vice President, the Main Street Team Leader and a portfolio manager of the Manager since May 2009. Prior to joining the Manager, Mr. Govil was a portfolio manager with RS Investment Management Co. LLC (October 2006-March 2009). He served as the head of equity investments at The Guardian Life Insurance Company of America (August 2005-October 2006) when Guardian Life Insurance acquired an interest in RS Investment Management Co. LLC. He served as the lead portfolio manager - large cap blend/core equity, co-head of equities and head of equity research (2001-July 2005), and was lead portfolio manager - core equity (April 1996-July 2005), at Mercantile Capital Advisers, Inc. A portfolio manager of other portfolios in the OppenheimerFunds complex.

4

Krishna Memani (50)
Vice President and Portfolio Manager

Senior Vice President and Head of the Investment Grade Fixed Income Team of the Manager since March 2009. Mr. Memani was a Managing Director and Head of the U.S. and European Credit Analyst Team at Deutsche Bank Securities from June 2006 through January 2009. He was the Chief Credit Strategist at Credit Suisse Securities from August 2002 through March 2006. He was a Managing Director and Senior Portfolio Manager at Putnam Investments from September 1998 through June 2002.

10

Christopher Proctor (43)
Vice President and Portfolio Manager

Vice President of the Manager (since August 2008); Vice President of the Fund (since May 2010); Vice President at Calamos Asset Management (January 2007-March 2008); Vice President at Scudder-Kemper Investments (1999-2002).

6

Benjamin Ram (39)
Vice President and Portfolio Manager

Vice President and portfolio manager of the Manager since May 2009. Prior to joining the Manager, Mr. Ram was sector manager for financial investments and a co portfolio manager for mid-cap portfolios with the RS Core Equity Team of RS Investment Management Co. LLC (October 2006-May 2009). He served as Portfolio Manager Mid Cap Strategies, Sector Manager Financials at The Guardian Life Insurance Company of America (January 2006-October 2006) when Guardian Life Insurance acquired an interest in RS Investment Management Co. LLC. He was a financials analyst, from 2003 to 2005, and co portfolio manager, from 2005 to 2006, at Mercantile Capital Advisers, Inc. Mr. Ram was a bank analyst at Legg Mason Securities from 2000 to 2003 and was a senior financial analyst at the CitiFinancial division of Citigroup, Inc. from 1997 to 2000. Mr. Ram is a portfolio manager of other portfolios in the OppenheimerFunds complex.

3

Arthur P. Steinmetz (52)
Vice President and Portfolio Manager

Chief Investment Officer of Fixed-Income Investments of the Manager (since April 2009) and Executive Vice President of the Manager (since October 2009). He was a Senior Vice President of the Manager (March 1993-September 2009) and Director of Fixed-Income Investments of the Manager (January 2009-April 2009).

4

Peter A. Strzalkowski (45)
Vice President and Portfolio Manager

Vice President of the Manager (since August 2007), CFA and a member of the Manager's Investment Grade Fixed-Income Team (since April 2009). A Managing Partner and Chief Investment Officer of Vector Capital Management, LLC (July 2006-August 2007). A Senior Portfolio Manager at Highland Capital Management, L.P. (June 2005-July 2006). A Senior Fixed Income Portfolio Manager at Microsoft Corp. (June 2003-June 2005).

7

Julie Van Cleave (51)
Vice President and Portfolio Manager

Vice President and Senior Portfolio Manager of the Manager (since April 2010). Prior to joining the Manager, she was Managing Director, U.S. Large-Cap Growth Equity, and lead portfolio manager at Deutsche Asset Management (from December 2002 to February 2009). Prior to 2002, Ms. Van Cleave was a Managing Director, a portfolio manager and a team leader with Mason Street Advisors, a wholly owned subsidiary of Northwestern Mutual Life. She is a portfolio manager of other portfolios in the OppenheimerFunds complex.

3

Raman Vardharaj (40)
Vice President and Portfolio Manager

Vice President of the Manager (since May 2009) and CFA. Prior to joining the Manager, Mr. Vardharaj was sector manager and a senior quantitative analyst creating stock selection models, monitoring portfolio risks and analyzing portfolio performance across the RS Core Equity Team of RS Investment Management Co. LLC (October 2006-May 2009). He served as quantitative analyst at The Guardian Life Insurance Company of America (1998-October 2006) when Guardian Life Insurance acquired an interest in RS Investment Management Co. LLC. He is a portfolio manager of other portfolios in the OppenheimerFunds complex.

2

Joseph Welsh (47)
Vice President and Portfolio Manager

Head of the Manager's High Yield Corporate Debt Team (since April 2009); Vice President of the Manager (since December 2000) and a CFA. He was an Assistant Vice President of the Manager (December 1996-November 2000) and a high yield bond analyst of the Manager (January 1995-December 1996). He was a senior bond analyst with W.R. Huff Asset Management (November 1991-December 1994).

6

Mitch Williams (42)
Vice President and Portfolio Manager

Vice President of the Manager (since July 2006); Vice President of the Fund (since February 2009); CFA and a Senior Research Manager (since April 2002). He was a Vice President and Research Analyst for Evergreen Funds (October 2000-January 2002).

4

Carol E. Wolf (59)
Vice President and Portfolio Manager

Senior Vice President of the Manager (since June 2000); Vice President of the Manager (June 1990-June 2000).

7

Caleb Wong (45)
Vice President and Portfolio Manager

Vice President of the Manager (since June 1999); employed in fixed-income quantitative research and risk management for the Manager (since July 1996).

5

Ronald Zibelli, Jr. (52)
Vice President and Portfolio Manager

Vice President of the Manager (since May 2006) and a CFA. He was a Managing Director and Small Cap Growth Team Leader at Merrill Lynch Investment Managers (January 2002-May 2006).

5

Matthew Ziehl (44)
Vice President and Portfolio Manager

Vice President and portfolio manager of the Manager (since May 2009). Prior to joining the Manager, Mr. Ziehl was a portfolio manager with RS Investment Management Co. LLC (October 2006-May 2009) and served as a managing director at The Guardian Life Insurance Company of America (December 2001-October 2006) when Guardian Life Insurance acquired an interest in RS Investment Management Co. LLC. He was a team leader and co portfolio manager with Salomon Brothers Asset Management, Inc. for small growth portfolios (January 2001-December 2001). A portfolio manager of other portfolios in the OppenheimerFunds complex.

2


Name, Age, Position(s)

Principal Occupation(s) During the Past 5 Years

Portfolios Overseen
in Fund Complex

Thomas W. Keffer (55)
Vice President and Chief Business Officer

Senior Vice President of the Manager (since March 1997); Director of Investment Brand Management of the Manager (since November 1997); Senior Vice President of OppenheimerFunds Distributor, Inc. (since December 1997).

96

Mark S. Vandehey (60)
Vice President and Chief Compliance Officer

Senior Vice President and Chief Compliance Officer of the Manager (since March 2004); Chief Compliance Officer of OppenheimerFunds Distributor, Inc., Centennial Asset Management and Shareholder Services, Inc. (since March 2004); Vice President of OppenheimerFunds Distributor, Inc., Centennial Asset Management Corporation and Shareholder Services, Inc. (since June 1983).

96

Brian W. Wixted (51)
Treasurer and Principal Financial & Accounting Officer

Senior Vice President of the Manager (since March 1999); Treasurer of the Manager and the following: HarbourView Asset Management Corporation, Shareholder Financial Services, Inc., Shareholder Services, Inc., Oppenheimer Real Asset Management, Inc. and Oppenheimer Partnership Holdings, Inc. (March 1999-June 2008), OFI Private Investments, Inc. (March 2000-June 2008), OppenheimerFunds International Ltd. and OppenheimerFunds plc (since May 2000), OFI Institutional Asset Management, Inc. (since November 2000), and OppenheimerFunds Legacy Program (charitable trust program established by the Manager) (since June 2003); Treasurer and Chief Financial Officer of OFI Trust Company (trust company subsidiary of the Manager) (since May 2000); Assistant Treasurer of the following: OAC (March 1999-June 2008).

96

Robert G. Zack (62)
Vice President

Vice President, Secretary and General Counsel of OAC (since November 2001); Executive Vice President (since January 2004) and General Counsel (from March 2002 to December 2010) of the Manager; General Counsel of the Distributor (from December 2001 to December 2010); General Counsel of Centennial Asset Management Corporation (from December 2001 to December 2010); Senior Vice President and General Counsel of HarbourView Asset Management Corporation (from December 2001 to December 2010); Assistant Secretary (from September 1997 to December 2010) and Director (from November 2001 to December 2010) of OppenheimerFunds International Ltd. and OppenheimerFunds plc; Vice President and Director of Oppenheimer Partnership Holdings, Inc. (from December 2002 to December 2010); Director of Oppenheimer Real Asset Management, Inc. (from November 2001 to December 2010); Senior Vice President, General Counsel and Director of Shareholder Financial Services, Inc. and Shareholder Services, Inc. (from December 2001 to December 2010); Senior Vice President, General Counsel and Director of OFI Private Investments, Inc. (from November 2001 to December 2010); Executive Vice President, General Counsel and Director of OFI Trust Company (since November 2001); Vice President of OppenheimerFunds Legacy Program (from June 2003 to December 2010); Senior Vice President and General Counsel of OFI Institutional Asset Management, Inc. (from November 2001 to December 2010).

96

Arthur S. Gabinet (52)
Secretary

Executive Vice President (since May 2010) and General Counsel (since January 2011) of the Manager; General Counsel of the Distributor (since January 2011); General Counsel of Centennial Asset Management Corporation (since January 2011); Executive Vice President and General Counsel of HarbourView Asset Management Corporation (since January 2011); Assistant Secretary (since January 2011) and Director (since January 2011) of OppenheimerFunds International Ltd. and OppenheimerFunds plc; Vice President and Director of Oppenheimer Partnership Holdings, Inc. (since January 2011); Director of Oppenheimer Real Asset Management, Inc. (since January 2011); Executive Vice President and General Counsel of Shareholder Financial Services, Inc. and Shareholder Services, Inc. (since January 2011); Executive Vice President and General Counsel of OFI Private Investments, Inc. (since January 2011); Vice President of OppenheimerFunds Legacy Program (since January 2011); Executive Vice President and General Counsel of OFI Institutional Asset Management, Inc. (since January 2011); General Counsel, Asset Management of the Manager (May 2010-December 2010); Principal, The Vanguard Group (November 2005-April 2010); District Administrator, U.S. Securities and Exchange Commission (January 2003-October 2005).

96

Brian Petersen (40)
Assistant Treasurer

Vice President of the Manager (since February 2007); Assistant Vice President of the Manager (August 2002-February 2007); Manager/Financial Product Accounting of the Manager (November 1998-July 2002).

96

Stephanie Bullington (34)
Assistant Treasurer

Vice President of the Manager (since January 2010); Assistant Vice President of the Manager (October 2005-January 2010); Assistant Vice President of ButterField Fund Services (Bermuda) Limited, part of The Bank of N.T. Butterfield Son Limited (Butterfield) (February 2004-June 2005).

96

James Kennedy (52)
Assistant Treasurer

Senior Vice President of the Manager (since September 2006).

96

Kathleen T. Ives (45)
Assistant Secretary

Senior Vice President (since May 2009), Deputy General Counsel (since May 2008) and Assistant Secretary (since October 2003) of the Manager; Vice President (since 1999) and Assistant Secretary (since October 2003) of the Distributor; Assistant Secretary of Centennial Asset Management Corporation (since October 2003); Vice President and Assistant Secretary of Shareholder Services, Inc. (since 1999); Assistant Secretary of OppenheimerFunds Legacy Program and Shareholder Financial Services, Inc. (since December 2001); Vice President of the Manager (June 1998-May 2009); Senior Counsel of the Manager (October 2003-May 2008).

96

Lisa I. Bloomberg (43)
Assistant Secretary

Senior Vice President (since February 2010) and Deputy General Counsel (since May 2008) of the Manager; Vice President (May 2004-January 2010) and Associate Counsel of the Manager (May 2004-May 2008); First Vice President (April 2001-April 2004), Associate General Counsel (December 2000-April 2004) of UBS Financial Services, Inc.

96

Taylor V. Edwards (43)
Assistant Secretary

Vice President (since February 2007) and Associate Counsel (since May 2009) of the Manager; Assistant Vice President (January 2006-January 2007) and Assistant Counsel (January 2006-April 2009) of the Manager; Associate at Dechert LLP (September 2000-December 2005).

96

Randy G. Legg (45)
Assistant Secretary

Vice President (since June 2005) and Senior Counsel (since March 2011) of the Manager; Associate Counsel (January 2007-March 2011) of the Manager.

96

Adrienne M. Ruffle (33)
Assistant Secretary

Vice President (since February 2007) and Associate Counsel (since May 2009) of the Manager; Assistant Vice President (February 2005-January 2007) and Assistant Counsel (February 2005-April 2009) of the Manager; Associate (September 2002-February 2005) at Sidley Austin LLP.

96


Trustees Share Ownership. The chart below shows information about each Trustee's beneficial share ownership in the Fund and in all of the registered investment companies that the Trustee oversees in the Oppenheimer family of funds ("Supervised Funds").

As of December 31, 2010

Dollar Range of Shares Beneficially Owned in the Fund

Aggregate Dollar Range of Shares Beneficially Owned in Supervised Funds

Independent Trustees

William L. Armstrong

None

Over $100,000

George C. Bowen

None

Over $100,000

Edward L. Cameron

None

Over $100,000

Jon S. Fossel

None

Over $100,000

Sam Freedman

None

Over $100,000

Beverly L. Hamilton

None

Over $100,000

Robert J. Malone

None

Over $100,000

F. William Marshall, Jr.

None

Over $100,000

Interested Trustee

William F. Glavin

None

Over $100,000


Remuneration of the Officers and Trustees. The officers of the Fund, who are affiliated with the Manager, receive no salary or fee from the Fund. The Independent Trustees' total compensation from the Fund and fund complex represents compensation for serving as a Trustee and member of a committee (if applicable) of the Boards of the Fund and other funds in the OppenheimerFunds complex during the calendar year ended December 31, 2010.

Name and Other Fund Position(s) (as applicable)

Aggregate Compensation From the Fund1

Total Compensation From the Fund and Fund Complex2

Fiscal Year Ended December 31, 2010

Year Ended December 31, 2010

William L. Armstrong

$ 62,321

$285,000

Chairman of the Board and Governance Committee Member

George C. Bowen

$ 50,813

$232,050

Audit Committee Member

Edward L. Cameron

$ 43,584

$199,000

Audit Committee Chairman

Jon S. Fossel

$ 40,940

$187,125

Review Committee Chairman

Sam Freedman

$ 46,305

$211,600

Review Committee Member

Beverly Hamilton

$ 40,9273

$187,000

Review Committee Member and Governance Committee Member

Robert J. Malone

$ 49,623

$226,600

Governance Committee Chairman and Audit Committee Member

F. William Marshall, Jr.

$ 43,584

$288,4004

Audit Committee Member and Governance Committee Member


1. "Aggregate Compensation From the Fund" includes fees and deferred compensation, if any.
2. In accordance with SEC regulations, for purposes of this section only, "Fund Complex" includes the Oppenheimer funds, the MassMutual Institutional Funds, the MassMutual Select Funds and the MML Series Investment Fund, the investment adviser for which is the indirect parent company of the Fund's Manager. The Manager also serves as the Sub-Advisor to the following: MassMutual Premier International Equity Fund, MassMutual Premier Main Street Fund, MassMutual Premier Strategic Income Fund, MassMutual Premier Capital Appreciation Fund, and MassMutual Premier Global Fund. The Manager does not consider MassMutual Institutional Funds, MassMutual Select Funds and MML Series Investment Fund to be part of the OppenheimerFunds' "Fund Complex" as that term may be otherwise interpreted.
3. Includes $40,927 deferred by Ms. Hamilton under the "Compensation Deferral Plan" described below.
4. Includes $89,400 compensation paid to Mr. Marshall for serving as a Trustee for MassMutual Select Funds and MML Series Investment Fund.


Compensation Deferral Plan. The Board of Trustees has adopted a Compensation Deferral Plan for Independent Trustees that enables them to elect to defer receipt of all or a portion of the annual fees they are entitled to receive from certain Funds. Under the plan, the compensation deferred by a Trustee is periodically adjusted as though an equivalent amount had been invested in shares of one or more Oppenheimer funds selected by the Trustee. The amount paid to the Trustee under the plan will be determined based on the amount of compensation deferred and the performance of the selected funds.

Deferral of the Trustees' fees under the plan will not materially affect a Fund's assets, liabilities or net income per share. The plan will not obligate a fund to retain the services of any Trustee or to pay any particular level of compensation to any Trustee. Pursuant to an Order issued by the SEC, a fund may invest in the funds selected by the Trustee under the plan without shareholder approval for the limited purpose of determining the value of the Trustee's deferred compensation account.

Major Shareholders.  As of April 5, 2011, the only persons or entities who owned of record or were known by the Funds to own beneficially 5% or more of any class of the Funds' outstanding shares were the Manager and the insurance companies and their respective affiliates, such shares were held as shown in Appendix A.

The Manager

The Manager is wholly-owned by Oppenheimer Acquisition Corp., a holding company primarily owned by Massachusetts Mutual Life Insurance Company, a global, diversified insurance and financial services company.

Code of Ethics. The Funds (except Money Fund/VA), Manager and the Distributor have a Code of Ethics. It is designed to detect and prevent improper personal trading by certain employees, including portfolio managers, that would compete with or take advantage of a Fund's portfolio transactions. Covered persons include persons with knowledge of the investments and investment intentions of the Fund and other funds advised by the Manager. The Code of Ethics does permit personnel subject to the Code to invest in securities, including securities that may be purchased or held by the Fund, subject to a number of restrictions and controls. Compliance with the Code of Ethics is carefully monitored and enforced by the Manager.

The Code of Ethics is an exhibit to the Funds' registration statement filed with the SEC and can be reviewed and copied at the SEC's Public Reference Room in Washington, D.C. You can obtain information about the hours of operation of the Public Reference Room by calling the SEC at 1.202.551.8090. The Code of Ethics can also be viewed as part of the Funds' registration statement on the SEC's EDGAR database at the SEC's Internet website at http://www.sec.gov. Copies may be obtained, after paying a duplicating fee, by electronic request at the following E-mail address: publicinfo@sec.gov., or by writing to the SEC's Public Reference Section, Washington, D.C. 20549-1520.

The Investment Advisory Agreement. The Manager provides investment advisory and management services to each Fund under an investment advisory agreement between the Manager of each Fund. The Manager selects securities for the Funds' portfolios and handles their day-to-day business. The portfolio managers of the Funds are employed by the Manager and are the persons who are principally responsible for the day-to-day management of the Funds' portfolios. Other members of the Manager's investment teams provide the portfolio managers with counsel and support in managing the Funds' portfolios.

The agreement requires the Manager, at its expense, to provide the Funds with adequate office space, facilities and equipment. It also requires the Manager to provide and supervise the activities of all administrative and clerical personnel required to provide effective administration for the Funds. Those responsibilities include the compilation and maintenance of records with respect to Funds' operations, the preparation and filing of specified reports, and composition of proxy materials and registration statements for the continuous public sale of shares of the Funds.

The Funds pays expenses not expressly assumed by the Manager under the advisory agreements. The advisory agreements lists examples of expenses paid by the Funds. The major categories relate to interest, taxes, brokerage commissions, fees to certain Trustees, legal and audit expenses, custodian and transfer agent expenses, share issuance costs, certain printing and registration costs and non-recurring expenses, including litigation costs. The management fees paid by the Funds to the Manager are calculated at the rates described in the Prospectus, which are applied to the assets of the Funds as a whole. The fees are allocated to each class of shares based upon the relative proportion of a Fund's net assets represented by that class. The management fees paid by the Funds to the Manager during their last three fiscal years were:

Management Fees for the Fiscal Year Ended December 31

Fund

2008

2009

2010

Balanced Fund/VA

$2,905,296

$1,759,787

$1,780,237

Capital Appreciation/VA

$11,123,637

$8,611,318

$9,268,654

Core Bond Fund/VA

$2,241,087

$1,142,088

$1,161,961

Global Securities Fund/VA

$19,436,828

$14,552,153

$16,477,772

Global Strategic Income Fund/VA

$21,372,387

$20,955,987

$17,980,400

High Income Fund/VA

$2,529,797

$1,019,105

$1,018,717

Main Street Fund/VA

$12,491,552

$9,599,661

$10,730,968

Main Street Small- & Mid-Cap Fund/VA

$5,909,561

$4,857,461

$5,732,969

Money Fund/VA

$955,875

$982,135

$739,544

Small- & Mid-Cap Growth Fund/VA

$5,532,191

$3,638,767

$4,152,994

Value Fund/VA

$48,203

$41,350

$52,993


The investment advisory agreements state that in the absence of willful misfeasance, bad faith, gross negligence in the performance of its duties or reckless disregard of its obligations and duties under the investment advisory agreements, the Manager is not liable for any loss the Funds sustain in connection with matters to which the agreement relates.

The agreements permit the Manager to act as investment advisor for any other person, firm or corporation and to use the name "Oppenheimer" in connection with other investment companies for which it may act as investment advisor or general distributor. If OFI shall no longer act as investment advisor to the Funds, OFI may withdraw the right of the Funds to use the name "Oppenheimer" as part of their name.

In addition, as described below under "Organization and Management of Wholly-Owned Subsidiary," the Subsidiary has entered into a separate contract with the Manager for the management of the Subsidiary's portfolio. The Manager has contractually agreed to waive the management fee it receives from the Global Strategic Income Fund/VA in an amount equal to the management fee paid to the Manager by the Subsidiary. This undertaking will continue in effect for so long as the Global Strategic Income Fund/VA invests in the Subsidiary, and may not be terminated by the Manager unless the Manager first obtains the prior approval of the Global Strategic Income Fund/VA's Board of Trustees for such termination.

Portfolio Proxy Voting. The Fund has adopted Portfolio Proxy Voting Policies and Procedures, which include Proxy Voting Guidelines, under which the Fund votes proxies relating to securities held by the Fund ("portfolio proxies"). The Manager generally undertakes to vote portfolio proxies with a view to enhancing the value of the company's stock held by the Funds. The Fund has retained an independent, third party proxy voting agent to vote portfolio proxies in accordance with the Fund's Proxy Voting Guidelines and to maintain records of such portfolio proxy voting. The Portfolio Proxy Voting Policies and Procedures include provisions to address conflicts of interest that may arise between the Fund and the Manager or the Manager's affiliates or business relationships. Such a conflict of interest may arise, for example, where the Manager or an affiliate of the Manager manages or administers the assets of a pension plan or other investment account of the portfolio company soliciting the proxy or seeks to serve in that capacity. The Manager and its affiliates generally seek to avoid such material conflicts of interest by maintaining separate investment decision making processes to prevent the sharing of business objectives with respect to proposed or actual actions regarding portfolio proxy voting decisions. Additionally, the Manager employs the following procedures, as long as OFI determines that the course of action is consistent with the best interests of the Fund and its shareholders: (1) if the proposal that gives rise to the conflict is specifically addressed in the Proxy Voting Guidelines, the Manager will vote the portfolio proxy in accordance with the Proxy Voting Guidelines, unless (i) the Proxy Voting Guidelines provide discretion to the Manager on how to vote on the matter; or (ii) to the extent a portfolio manager has requested that OFI vote in a manner inconsistent with the Proxy Voting Guidelines, it is determined that such a request is in the best interest of the Fund and its shareholders and does not pose an actual material conflict of interest; (2) if such proposal is not specifically addressed in the Proxy Voting Guidelines or the Proxy Voting Guidelines provide discretion to the Manager on how to vote, the Manager will vote in accordance with the third-party proxy voting agent's general recommended guidelines on the proposal provided that the Manager has reasonably determined that there is no conflict of interest on the part of the proxy voting agent or item (1) (ii), above, is not applicable; and (3) if neither of the previous two procedures provides an appropriate voting recommendation, the Manager may retain an independent fiduciary to advise the Manager on how to vote the proposal or may abstain from voting. The Proxy Voting Guidelines' provisions with respect to certain routine and non-routine proxy proposals are summarized below:

  • The Fund evaluates director nominees on a case-by-case basis, examining the following factors, among others: composition of the board and key board committees, experience and qualifications, attendance at board meetings, corporate governance provisions and takeover activity, long-term company performance and the nominee's investment in the company.
  • The Fund generally supports proposals requiring the position of chairman to be filled by an independent director unless there are compelling reasons to recommend against the proposal such as a counterbalancing governance structure.
  • The Fund generally supports proposals asking that a majority of directors be independent. The Fund generally supports proposals asking that a board audit, compensation, and/or nominating committee be composed exclusively of independent directors.
  • The Fund generally supports shareholder proposals to reduce a super-majority vote requirement, and opposes management proposals to add a super-majority vote requirement.
  • The Fund generally supports proposals to allow shareholders the ability to call special meetings.
  • The Fund generally supports proposals to allow or make easier shareholder action by written consent.
  • The Fund generally votes against proposals to create a new class of stock with superior voting rights.
  • The Fund generally votes against proposals to classify a board.
  • The Fund generally supports proposals to eliminate cumulative voting.
  • The Fund generally votes against proposals to establish a new board committee.
  • The Fund generally opposes re-pricing of stock options without shareholder approval.
  • The Fund generally supports proposals to require majority voting for the election of directors.
  • The Fund generally supports proposals seeking additional disclosure of executive and director pay information.
  • The Fund generally supports proposals seeking disclosure regarding the company's, board's or committee's use of compensation consultants.
  • The Fund generally supports "pay-for-performance" and "pay-for-superior-performance standard" proposals that align a significant portion of total compensation of senior executives to company performance, and generally supports an annual frequency for advisory votes on executive compensation.
  • The Fund generally supports having shareholder votes on poison pills.
  • The Fund generally supports proposals calling for companies to adopt a policy of not providing tax gross-up payments.
  • In the case of social, political and environmental responsibility issues, the Fund will generally abstain where there could be a detrimental impact on share value or where the perceived value if the proposal was adopted is unclear or unsubstantiated. The Fund generally supports proposals that would clearly have a discernible positive impact on short- or long-term share value, or that would have a presently indiscernible impact on short- or long-term share value but promotes general long-term interests of the company and its shareholders.

The Fund is required to file Form N-PX, with its complete proxy voting record for the 12 months ended June 30th, no later than August 31st of each year. The Fund's Form N-PX filing is available (i) without charge, upon request, by calling the Fund toll-free at 1.800.525.7048 and (ii) on the SEC's website at www.sec.gov.

Money Fund/VA is the only Fund that has not adopted the Portfolio Proxy Voting Policies and Procedures.

Investment in Wholly-Owned Subsidiary. Global Strategic Income Fund/VA may invest up to 25% of its total assets in a wholly-owned and controlled subsidiary (the "Subsidiary"). The Subsidiary invests primarily in commodity-linked derivatives (including commodity futures, financial futures, options and swap contracts) and exchange tradedGlobal Strategic Income Fund/VAs related to gold or other special minerals ("Gold ETFs"). The Subsidiary may also invest in certain fixed-income securities and other investments that may serve as margin or collateral for its derivatives positions.

Since Global Strategic Income Fund/VA may invest a substantial portion of its assets in the Subsidiary, which may hold certain of the investments described in Global Strategic Income Fund/VA's prospectus and this Statement of Additional Information, Global Strategic Income Fund/VA may be considered to be investing indirectly in those investments through its Subsidiary. Therefore, references in Global Strategic Income Fund/VA's prospectus and in this Statement of Additional Information to investments by Global Strategic Income Fund/VA also may be deemed to include theGlobal Strategic Income Fund/VA's indirect investments through the Subsidiary.

The Subsidiary is not registered under the Investment Company Act of 1940 (the "Investment Company Act") and does not subject its investor protections, except as noted in Global Strategic Income Fund/VA's prospectus or this Statement of Additional Information. Global Strategic Income Fund/VA, as the sole shareholder of the Subsidiary, does not have all of the protections offered by the Investment Company Act. However, the Subsidiary is wholly-owned and controlled by Global Strategic Income Fund/VA and managed by the Manager. Therefore, Global Strategic Income Fund/VA's ownership and control of the Subsidiary make it unlikely that the Subsidiary would take action contrary to the interests of Global Strategic Income Fund/VA or its shareholders. Global Strategic Income Fund/VA's Board has oversight responsibility for the investment activities of Global Strategic Income Fund/VA, including its expected investment in the Subsidiary, and Global Strategic Income Fund/VA's role as the sole shareholder of the Subsidiary. Also, in managing the Subsidiary's portfolio, the Manager is subject to the same investment policies and restrictions that apply to the management of Global Strategic Income Fund/VA, and, in particular, to the requirements relating to portfolio leverage, liquidity, brokerage, and the timing and method of the valuation of the Subsidiary's portfolio investments and shares of the Subsidiary.

Changes in the laws of the United States (where Global Strategic Income Fund/VA is organized) and/or the Cayman Islands (where the Subsidiary is organized), could prevent Global Strategic Income Fund/VA and/or the Subsidiary from operating as described in Global Strategic Income Fund/VA's prospectus and this Statement of Additional Information and could negatively affect Global Strategic Income Fund/VA and its shareholders. For example, the Cayman Islands currently does not impose certain taxes on the Subsidiary, including income and capital gains tax, among others. If Cayman Islands laws were changed to require the Subsidiary to pay Cayman Islands taxes, the investment returns of Global Strategic Income Fund/VA would likely decrease.

Pending Litigation. Since 2009, a number of lawsuits have been pending in federal courts against the Manager, the Distributor, and certain mutual funds ("Defendant Funds") advised by the Manager and distributed by the Distributor (but not including the Fund). The lawsuits naming the Defendant Funds also name as defendants certain officers and current and former trustees of the respective Defendant Funds. The plaintiffs seek class action status on behalf of purchasers of shares of the respective Defendant Fund during a particular time period. The lawsuits raise claims under federal securities laws alleging that, among other things, the disclosure documents of the respective Defendant Fund contained misrepresentations and omissions, that such Defendant Fund's investment policies were not followed, and that such Defendant Fund and the other defendants violated federal securities laws and regulations. The plaintiffs seek unspecified damages, equitable relief and an award of attorneys' fees and litigation expenses.

In 2009, what are claimed to be derivative lawsuits were filed in state court against the Manager and a subsidiary (but not against the Fund), on behalf of the New Mexico Education Plan Trust. These lawsuits allege breach of contract, breach of fiduciary duty, negligence and violation of state securities laws, and seek compensatory damages, equitable relief and an award of attorneys' fees and litigation expenses. 

Other lawsuits have been filed since 2008 in various state and federal courts, against the Manager and certain of its affiliates. Those lawsuits were filed by investors who made investments through an affiliate of the Manager, and relate to the alleged investment fraud perpetrated by Bernard Madoff and his firm ("Madoff"). Those suits allege a variety of claims, including breach of fiduciary duty, fraud, negligent misrepresentation, unjust enrichment, and violation of federal and state securities laws and regulations, among others. They seek unspecified damages, equitable relief and an award of attorneys' fees and litigation expenses. None of the suits have named the Distributor, any of the Oppenheimer mutual funds or any of their independent Trustees or Directors as defendants. None of the Oppenheimer funds invested in any funds or accounts managed by Madoff. On February 28, 2011, a Stipulation of Partial Settlement of certain of those lawsuits was filed in the U.S. District Court for the Southern District of New York. That proposed settlement is subject to the preliminary and final approval of the Court and the determination by the settling defendants that class members representing a sufficient proportion of the losses allegedly suffered by class members had elected to participate in the settlement. The proposed settlement does not settle any of the other outstanding lawsuits pending in other courts relating to these matters.

The Manager believes that the lawsuits described above are without legal merit and is defending against them vigorously. The Defendant Funds' Boards of Trustees have also engaged counsel to defend the suits brought against those Funds and the present and former Independent Trustees named in those suits. While it is premature to render any opinion as to the outcome in these lawsuits, or whether any costs that the Defendant Funds may bear in defending the suits might not be reimbursed by insurance, the Manager believes that these suits should not impair the ability of the Manager or the Distributor to perform their respective duties to the Fund, and that the outcome of all of the suits together should not have any material effect on the operations of any of the Oppenheimer funds.

Portfolio Managers. Each Fund's portfolio is managed by the following:

Fund

Portfolio Manager(s)

Balanced Fund/VA

Emmanuel Ferreira, Krishna Memani, Peter A. Strzalkowski

Capital Appreciation Fund/VA

Julie Van Cleave

Core Bond Fund/VA

Krishna Memani, Peter A. Strzalkowski

Global Securities Fund/VA

Rajeev Bhaman

Global Strategic Income Fund/VA

Arthur P. Steinmetz, Krishna Memani, Joseph Welsh, Caleb Wong

High Income Fund/VA

Joseph Welsh

Main Street Fund/VA

Manind "Mani" Govil, Benjamin Ram

Main Street Small- & Mid-Cap Fund/VA

Matthew Ziehl, Raymond Anello, Raman Vardharaj

Money Fund/VA

Carol E. Wolf, Christopher Proctor

Small- & Mid-Cap Growth Fund/VA

Ronald Zibelli, Jr.

Value Fund/VA

Mitch Williams


Each of the above individuals is referred to as a "Portfolio Manager" and collectively they are referred to as the "Portfolio Managers." They are the persons who are responsible for the day-to-day management of each Fund's respective investments.

Other Accounts Managed. In addition to managing the Funds' investment portfolio, Messrs. Anello, Bhaman, Ferreira, Govil, Memani, Proctor, Ram, Steinmetz, Strzalkowski, Vardharaj, Welsh, Williams, Wong, Ziehl and Zibelli and Ms. Van Cleave and Wolf also manage other investment portfolios or accounts on behalf of the Manager or its affiliates. The following tables provide information regarding those portfolios and accounts as of December 31, 2010, except that information for Ms. Van Cleave is as of the most recent practicable date. Except for one registered investment company managed by Mr. Bhaman, no portfolio or account has a performance-based advisory fee:

Fund Name & Portfolio Managers

Registered Investment Companies Managed

Total Assets in Registered Investment Companies Managed1

Other Pooled Investment Vehicles Managed

Total Assets in Other Pooled Investment Vehicles Managed

Other Accounts Managed

Total Assets in Other Accounts Managed3

Balanced Fund/VA

Emmanuel Ferreira

3

$2.3

0

$0

0

$0

Krishna Memani

20

$24.4

0

$0

0

$0

Peter A. Strzalkowski

8

$16.4

2

$1.8 2

0

$0

Capital Appreciation Fund/VA

Julie Van Cleave

8

$10.6

1

$150 2

0

$0

Core Bond/VA

Krishna Memani

20

$24.5

0

$0

0

$0

Peter A. Strzalkowski

8

$16.2

2

$1.8 2

0

$0

Global Securities Fund/VA

Rajeev Bhaman

8

$13.4

4

$653 2

2

$380 2

Global Strategic Income Fund/VA

Arthur P. Steinmetz

5

$25.1

2

$11 4

0

$0

Krishna Memani

20

$22.3

0

$0

0

$0

Joseph Welsh

6

$15.4

1

$57 2

0

$0

Caleb Wong

6

$11.8

1

$10 4

0

$0

High Income Fund/VA

Joseph Welsh

6

$17.6

1

$57 2

0

$0

Main Street Fund/VA

Manind Govil

7

$9.5

0

$0

1

$218 2

Benjamin Ram

8

$11.8

0

$0

0

$0

Main Street Small- & Mid-Cap Fund/VA

Matthew Ziehl

6

$4.5

0

$0

1

$103 2

Raymond Anello

6

$4.5

0

$0

1

$103 2

Raman Vardharaj

5

$4.5

0

$0

1

$103 2

Money Fund/VA

Carol E. Wolf

5

$11.8

1

$2 2

0

$0

Christopher Proctor

4

$10.1

0

$0

1

$1902

Small- & Mid-Cap Growth Fund/VA

Ronald J. Zibelli, Jr.

2

$1.2

2

$114 2

0

$0

Value Fund/VA

Mitch Williams

9

$5.8

0

$0

4

$220 2


1. In billions.
2. In millions.
3. Does not include personal accounts of portfolio managers and their families, which are subject to the Code of Ethics.
4. In thousands.


As indicated above, each of the Portfolio Managers also manages other funds and accounts. Potentially, at times, those responsibilities could conflict with the interests of the Funds. That may occur whether the investment strategies of the other funds or accounts are the same as, or different from, the Funds' investment objectives and strategies. For example, a Portfolio Manager may need to allocate investment opportunities between a Fund and another fund or account having similar objectives or strategies, or a Portfolio Manager may need to execute transactions for another fund or account that could have a negative impact on the value of securities held by a Fund. Not all funds and accounts advised by the Manager have the same management fee. If the management fee structure of another fund or account is more advantageous to the Manager than the fee structure of a Fund, the Manager could have an incentive to favor the other fund or account. However, the Manager's compliance procedures and Code of Ethics recognize the Manager's fiduciary obligations to treat all of its clients, including the Funds, fairly and equitably, and are designed to preclude the Portfolio Managers from favoring one client over another. It is possible, of course, that those compliance procedures and the Code of Ethics may not always be adequate to do so. At various times, the Funds' Portfolio Managers may manage other funds or accounts with investment objectives and strategies that are similar to those of the Funds, or may manage funds or accounts with investment objectives and strategies that are different from those of the Funds.

Compensation of the Portfolio Managers. The Funds' Portfolio Managers are employed and compensated by the Manager, not the Funds. The Manager's compensation structure is designed to attract and retain highly qualified investment management professionals and to reward individual and team contributions toward creating shareholder value. As of December 31, 2009, each Portfolio Managers' compensation consisted principally of three elements: a base salary, an annual discretionary bonus and eligibility to participate in long-term awards of options and appreciation rights in regard to the common stock of the Manager's holding company parent. Senior portfolio managers may also be eligible to participate in the Manager's deferred compensation plan.

To help the Manager attract and retain talent, the base pay component of each portfolio manager is reviewed regularly to ensure that it reflects the performance of the individual, is commensurate with the requirements of the particular portfolio, reflects any specific competence or specialty of the individual manager, and is competitive with other comparable positions. The annual discretionary bonus is determined by senior management of the Manager and is based on a number of factors, including management quality (such as style consistency, risk management, sector coverage, team leadership and coaching) and organizational development. The Portfolio Managers' compensation is not based on the total value of a Fund's portfolio assets or its investment performance. However, each portfolio managers' compensation is based on the performance of a tracking portfolio that is substantially similar to the Fund or Funds that he or she manages, measured against an appropriate Lipper benchmark selected by management. The Manager has a number of procedures in place to ensure that portfolio managers do not allocate securities to those portfolios in an inequitable manner, including monitoring and dispersion analysis. The compensation structure of certain other funds and accounts managed by the Portfolio Managers differs from the compensation structure of the Funds, described above. A portion of the Portfolio Managers' compensation with regard to other portfolios may be based on the performance of those portfolios compared to a particular benchmark and, with respect to one portfolio managed by Mr. Bhaman, may, under certain circumstances, include an amount based in part on the amount of that portfolio's management fee.

Ownership of Fund Shares. As of December 31, 2010, the Portfolio Managers did not beneficially own any shares of the Funds, which are sold only through insurance companies to their contract owners.

Organization and Management of Wholly-Owned Subsidiary. The Global Strategic Income Fund/VA may invest up to 25% of its total assets in the Subsidiary. It is expected that the Subsidiary will invest primarily in commodity and financial futures and option contracts, Gold ETFs, as well as fixed income securities and other investments intended to serve as margin or collateral for the Subsidiary's derivatives positions.

The Subsidiary is a company organized under the laws of the Cayman Islands, whose registered office is located at the offices of Maples Corporate Services Limited, PO Box 309, Ugland House, South Church Street, Grand Cayman, KY1-1104, Cayman Islands. The Subsidiary's affairs are overseen by a board of directors consisting of the following directors:

Mark Cook: Mark Cook is a Senior Vice President of Maples Fiduciary Services, a division of the MaplesFS group with offices in the Cayman Islands, Dubai, Dublin, Hong Kong, Luxembourg, Montreal and New York. MaplesFS offers a comprehensive range of fiduciary and administration services to finance vehicles and investment funds. Mr Cook joined Maples Fiduciary Services in 2008 and works on a wide range of investment fund products, including multi-manager funds, hedge funds, private equity funds and unit trust structures. From 2005 to 2008 Mr Cook worked with Citco Fund Services (Cayman Islands) Limited servicing a number of complex investment vehicles most recently as a Relationship Manager. From 1998 to 2005 he worked at WHK Greenwoods, Chartered Accountants in Australia where he provided taxation, business and advisory services to a variety of clients including a number in the financial services industry. Mr Cook started his career with KPMG in 1995. Mr Cook holds Bachelors degrees in Commerce and Economics from the University of Queensland, Australia. He is a member of the Australian Institute of Chartered Accountants, the Cayman Islands Society of Professional Accountants, the Cayman Islands Directors Association and holds the designation of Accredited Director granted by Chartered Secretaries Canada. Mr Cook is currently resident in the Cayman Islands and has been since 2005.

Victor Murray: Mark Victor Murray (known as Victor Murray) is a Senior Vice President of Maples Fiduciary Services, a division of the MaplesFS group with offices in the Cayman Islands, Dubai, Dublin, Hong Kong, Luxembourg, Montreal and New York. MaplesFS offers a comprehensive range of fiduciary and administration services to finance vehicles and investment funds. Mr. Murray joined Maples Fiduciary Services in 2007 and is responsible for a wide range of investment fund and structured finance products, including multi-manager funds, hedge funds, private equity funds and unit trust structures. From 2002 to 2007 Mr. Murray worked with Citco Fund Services (Cayman Islands) Limited where he was the in-house counsel advising on a wide range of corporate and financial services oriented legal matters. He was also responsible for the corporate governance of a number of complex investment vehicles. Prior to joining Citco, Mr. Murray was in private legal practice as a Solicitor (Lawyer) in Scotland. Mr. Murray graduated from the University of Dundee, Scotland with an LL.B (Bachelor of Laws Degree) and Postgraduate Diploma in Legal Practice. As part of his law degree he studied Investor Protection. Mr. Murray's professional designations include admission as a Solicitor and Notary Public, Scotland and admission as an Attorney-at-Law in the State of New York, USA. He is also a Notary Public for the Cayman Islands. He does not currently practice law in any jurisdiction. Mr. Murray is also a member of the Cayman Islands Directors Association and is currently appointed to its executive committee. He is an Accredited Director by the Chartered Secretaries of Canada. Mr. Murray is currently resident in the Cayman Islands and has been since 2002.

Brian W. Wixted: Mr. Wixted's biographical information appears above in the chart "Other Officers of the Funds."

The Subsidiary has entered into separate contracts with the Manager for the management of the Subsidiary's portfolio. The Subsidiary has also entered into arrangements with KPMG LLP to serve as the Subsidiary's independent auditor. The Subsidiary has also entered into arrangements with JP Morgan Chase Bank to serve as the Subsidiary's custodian, and with OppenheimerFunds Services to serve as the Subsidiary's transfer agent. The Subsidiary has adopted compliance policies and procedures that are substantially similar to the policies and procedures adopted by Global Strategic Income Fund/VA. Global Strategic Income Fund/VA's Chief Compliance Officer oversees implementation of the Subsidiary's policies and procedures, and makes periodic reports to Global Strategic Income Fund/VA's Board regarding the Subsidiary's compliance with its policies and procedures.

Global Strategic Income Fund/VA pays the Manager a fee for its services. The Manager has contractually agreed to waive the management fee it receives from Global Strategic Income Fund/VA in an amount equal to the management fee paid to the Manager by the Subsidiary. This undertaking will continue in effect for so long as Global Strategic Income Fund/VA invests in the Subsidiary, and may not be terminated by the Manager unless the Manager first obtains the prior approval of Global Strategic Income Fund/VA's Board of Trustees for such termination. The Subsidiary will bear the fees and expenses incurred in connection with the custody, transfer agency, and audit services that it receives. Global Strategic Income Fund/VA expects that the expenses borne by the Subsidiary will not be material in relation to the value of Global Strategic Income Fund/VA's assets. It is also anticipated that Global Strategic Income Fund/VA's own expenses will be reduced to some extent as a result of the payment of such expenses at the Subsidiary level. It is therefore expected that Global Strategic Income Fund/VA's investment in the Subsidiary will not result in Global Strategic Income Fund/VA's paying duplicative fees for similar services provided to Global Strategic Income Fund/VA and Subsidiary.

Please refer to the section titled "Dividends and Taxes" for information about certain tax aspects of Global Strategic Income Fund/VA's investment in the Subsidiary.

Brokerage Policies of the Fund

Brokerage Provisions of the Investment Advisory Agreement. One of the duties of the Manager under the investment advisory agreements is to arrange the portfolio transactions for the Funds. The advisory agreements contain provisions relating to the employment of broker-dealers to effect the Funds' portfolio transactions. The Manager is authorized by the advisory agreements to employ broker-dealers, including "affiliated brokers," as that term is defined in the Investment Company Act, that the Manager thinks, in its best judgment based on all relevant factors, will implement the policy of the Funds to obtain, at reasonable expense, the "best execution" of the Funds' portfolio transactions. "Best execution" means prompt and reliable execution at the most favorable price obtainable for the services provided. The Manager need not seek competitive commission bidding. However, it is expected to be aware of the current rates of eligible brokers and to minimize the commissions paid to the extent consistent with the interests and policies of the Funds as established by its Board of Trustees.

Under the investment advisory agreements, in choosing brokers to execute portfolio transactions for the Funds, the Manager may select brokers (other than affiliates) that provide both brokerage and research services to the Funds. The commissions paid to those brokers may be higher than another qualified broker would charge, if the Manager makes a good faith determination that the commission is fair and reasonable in relation to the services provided.

Brokerage Practices Followed by the Manager. The Manager allocates brokerage for the Funds subject to the provisions of the investment advisory agreements and other applicable rules and procedures described below.

The Manager's portfolio traders allocate brokerage based upon recommendations from the Manager's portfolio managers, together with the portfolio traders' judgment as to the execution capability of the broker or dealer. In certain instances, portfolio managers may directly place trades and allocate brokerage. In either case, the Manager's executive officers supervise the allocation of brokerage.

For Equity Funds, transactions in securities other than those for which an exchange is the primary market are generally done with principals or market makers. In transactions on foreign exchanges, a Fund may be required to pay fixed brokerage commissions and therefore would not have the benefit of negotiated commissions that are available in U.S. markets. Brokerage commissions are paid primarily for transactions in listed securities or for certain fixed-income agency transactions executed in the secondary market. Otherwise, brokerage commissions are paid only if it appears likely that a better price or execution can be obtained by doing so. In an option transaction, a Fund ordinarily uses the same broker for the purchase or sale of the option and any transaction in the securities to which the option relates.

For the Fixed-Income Funds, most securities purchases made by a Fund are in principal transactions at net prices. A Fund usually deals directly with the selling or purchasing principal or market maker without incurring charges for the services of a broker on its behalf unless the Manager determines that a better price or execution may be obtained by using the services of a broker. Therefore, a Fund does not incur substantial brokerage costs. Portfolio securities purchased from underwriters include a commission or concession paid by the issuer to the underwriter in the price of the security. Portfolio securities purchased from dealers include a spread between the bid and asked price. In an option transaction, a Fund ordinarily uses the same broker for the purchase or sale of the option and any transaction in the investment to which the option relates.

Other accounts advised by the Manager have investment policies similar to those of the Funds. Those other accounts may purchase or sell the same securities as a Fund at the same time as that Fund, which could affect the supply and price of the securities. If two or more accounts advised by the Manager purchase the same security on the same day from the same dealer, the transactions under those combined orders are averaged as to price and allocated in accordance with the purchase or sale orders actually placed for each account. When possible, the Manager tries to combine concurrent orders to purchase or sell the same security by more than one of the accounts managed by the Manager or its affiliates. The transactions under those combined orders are averaged as to price and allocated in accordance with the purchase or sale orders actually placed for each account.

Rule 12b-1 under the Investment Company Act prohibits any fund from compensating a broker or dealer for promoting or selling the fund's shares by (1) directing to that broker or dealer any of the fund's portfolio transactions, or (2) directing any other remuneration to that broker or dealer, such as commissions, mark-ups, mark downs or other fees from the fund's portfolio transactions, that were effected by another broker or dealer (these latter arrangements are considered to be a type of "step-out" transaction). In other words, a fund and its investment adviser cannot use the fund's brokerage for the purpose of rewarding broker-dealers for selling the fund's shares.

However, the Rule permits funds to effect brokerage transactions through firms that also sell fund shares, provided that certain procedures are adopted to prevent a quid pro quo with respect to portfolio brokerage allocations. As permitted by the Rule, the Manager has adopted procedures (and the Funds' Board of Trustees has approved those procedures) that permit the Funds to direct portfolio securities transactions to brokers or dealers that also promote or sell shares of the Funds, subject to the "best execution" considerations discussed above. Those procedures are designed to prevent: (1) the Manager's personnel who effect the Funds' portfolio transactions from taking into account a broker's or dealer's promotion or sales of the Funds shares when allocating the Funds' portfolio transactions, and (2) the Funds, the Manager and the Distributor from entering into agreements or understandings under which the Manager directs or is expected to direct the Funds' brokerage directly, or through a "step-out" arrangement, to any broker or dealer in consideration of that broker's or dealer's promotion or sale of the Funds' shares or the shares of any of the other Oppenheimer funds.

The investment advisory agreement permits the Manager to allocate brokerage for research services. The research services provided by a particular broker may be useful both to the Funds and to one or more of the other accounts advised by the Manager or its affiliates. Investment research may be supplied to the Manager by the broker or by a third party at the instance of a broker through which trades are placed.

Investment research services include information and analysis on particular companies and industries as well as market or economic trends and portfolio strategy, market quotations for portfolio evaluations, analytical software and similar products and services. If a research service also assists the Manager in a non research capacity (such as bookkeeping or other administrative functions), then only the percentage or component that provides assistance to the Manager in the investment decision making process may be paid in commission dollars.

Although the Manager currently does not do so, the Board of Trustees may permit the Manager to use stated commissions on secondary fixed-income agency trades to obtain research if the broker represents to the Manager that: (i) the trade is not from or for the broker's own inventory, (ii) the trade was executed by the broker on an agency basis at the stated commission, and (iii) the trade is not a riskless principal transaction. The Board of Trustees may also permit the Manager to use commissions on fixed-price offerings to obtain research, in the same manner as is permitted for agency transactions.

The research services provided by brokers broaden the scope and supplement the research activities of the Manager. That research provides additional views and comparisons for consideration, and helps the Manager to obtain market information for the valuation of securities that are either held in the Funds' portfolio or are being considered for purchase. The Manager provides information to the Board about the commissions paid to brokers furnishing such services, together with the Manager's representation that the amount of such commissions was reasonably related to the value or benefit of such services.

During the fiscal years ended December 31, 2008, 2009 and 2010, the Fund paid the total brokerage commissions indicated in the chart below:

Total Brokerage Commissions Paid by the Funds*

Fund

2008

2009

2010

Balanced Fund/VA

$366,700

$225,733

$88,070

Capital AppreciationFund/VA

$2,131,803

$1,203,623

$1,121,338

Core Bond Fund/VA

$79,727

$19,457

$8,759

Global Securities Fund/VA

$1,165,815

$954,874

$1,058,464

Global Strategic Income Fund/VA

$541,579

$470,849

$343,287

High Income Fund/VA

$45,699

$2,432

$10,673

Main Street Fund/VA

$1,650,295

$1,909,107

$1,348,818

Main Street Small- & Mid-Cap Fund/VA

$1,480,655

$2,087,784

$1,160,632

Small- & Mid-Cap Growth Fund/VA

$1,186,270

$1,014,498

$985,846

Value Fund/VA

$16,525

$13,470

$14,042


* Amounts do not include spreads or commissions on principal transactions on a net trade basis.


During the fiscal year ended December 31, 2010, the Fund paid the following amounts in commissions to firms that provide brokerage and research services to the Fund with respect to the aggregate portfolio transactions indicated. All such transactions were on a "best execution" basis, as described above. The provision of research services was not necessarily a factor in the placement of all such transactions.

Fund

Commissions Paid
to Firms that
Provide Research

Aggregate Transactions
by Firms that
Provide Research

Balanced Fund/VA

$77,921

$95,931,141

Capital Appreciation Fund/VA

$987,088

$1,496,104,066

Core Bond Fund/VA

$0

$0

Global Securities Fund/VA

$929,422

$756,868,239

Global Strategic Income Fund/VA

$0

$0

High Income Fund/VA

$0

$0

Main Street Fund/VA

$1,311,780

$1,603,337,232

Main Street Small- & Mid-Cap Fund/VA

$1,014,354

$1,039,603,390

Small- & Mid-Cap Growth Fund/VA

$891,458

$945,288,268

Value Fund/VA

$12,757

$14,125,494


Distribution and Service Arrangements

The Distributor. Under its General Distributor's Agreement with each Fund, OppenheimerFunds Distributor, Inc. ("OFDI" or the "Distributor") will act as the principal underwriter for the Funds' Service shares and Class 4 shares only.

Each Fund has adopted a Distribution and Service Plan under Rule 12b-1 of the Investment Company Act (a "Plan") for its Service shares and Class 4 shares, although as of December 31, 2010, only Global Securities Fund/VA and High Income Fund/VA offered Class 4 shares. Each Fund that offers Service shares and/or Class 4 shares will make compensation payments to the Distributor in connection with the distribution and/or servicing of those shares. The Distributor will pay insurance company separate account sponsors and other entities that offer and/or provide services to Service shares and Class 4 shares, as described in the applicable Fund's Prospectus.

Each Plan has been approved by a vote of (i) the Board of Trustees of the Trust, including a majority of the Independent Trustees, cast in person at a meeting called for the purpose of voting on that Plan, and (ii) the Manager as the then-sole initial holder of such shares.

Under the Plans, the Funds currently use the fees it receives to pay insurance company separate account sponsors or their affiliates (each is referred to as a "Recipient") for personal services and account maintenance services they provide for their customers who hold Service and Class 4 shares. The services include, among others, answering customer inquiries about the Funds, assisting in establishing and maintaining accounts in the Funds, and providing other services at the request of a Fund.

Under the Plans, no payment will be made to any Recipient in any period if the aggregate net assets of a Fund's Service and Class 4 shares held by the Recipient for itself and its customers did not exceed a minimum amount, if any, that may be determined from time to time by a majority of the Trust's Independent Trustees. The Plans provide for a fee of 0.25% of average annual net assets (although the Board of Trustees had set the fee at 0.15% of average net assets for all series prior to May 1, 2003). As of December 31, 2010, the Board had set no minimum asset amount. For the fiscal year ended December 31, 2010, all payments made under the Service share Plan were paid by the Distributor, to Recipients (including Recipients affiliated with the Manager).

The Service shares class payments during the fiscal year ended December 31, 2010, for all Funds having Service shares outstanding as of that date, were as follows:

Fund

Service Plan Payments by OFDI

Balanced Fund/VA Service Shares

$218,194

Capital Appreciation Fund/VA Service Shares

$1,058,768

Core Bond Fund/VA Service Shares

$143,251

Global Securities Fund/VA Service Shares

$2,487,757

Global Securities Fund/VA Class 4 Shares

$191,270

Global Strategic Income Fund/VA Service Shares

$6,223,086

High Income Fund/VA Service Shares

$159,158

High Income Fund/VA Class 4 Shares

$18,190

Main Street Fund/VA Service Shares

$2,959,203

Main Street Small- & Mid-Cap Fund/VA Service Shares

$1,818,061

Small- & Mid-Cap Growth Fund/VA Service Shares

$68,751

Value Fund/VA Service Shares

$17,522


Under the Plans, the Manager and the Distributor may make payments to affiliates. In their sole discretion, they may also from time to time make substantial payments from their own resources, which include the profits the Manager derives from the advisory fees it receives from the Funds, to compensate brokers, dealers, financial institutions and other intermediaries for providing distribution assistance and/or administrative services or that otherwise promote sales of the Funds' shares. These payments, some of which may be referred to as "revenue sharing," may relate to the Funds' inclusion on a financial intermediary's preferred list of funds offered to its clients.

Unless a plan is terminated as described below, each Plan continues in effect from year to year but only if the Trust's Board of Trustees and its Independent Trustees specially vote annually to approve its continuance. Approval must be by a vote cast in person at a meeting called for the purpose of voting on continuing each Plan. Each Plan may be terminated at any time by the vote of a majority of the Independent Trustees or by the vote of the holders of a "majority" (as defined in the Investment Company Act) of the outstanding Service shares or Class 4 shares. The Board of Trustees and the Independent Trustees must approve all material amendments to each plan. An amendment to increase materially the amount of payments to be made under a plan must be approved by shareholders of the class affected by the amendment.

While the plans are in effect and Service shares and/or Class 4 shares are outstanding, the Treasurer of the Trust shall provide separate written reports on each plan to the Board of Trustees at least quarterly for their review. The reports shall detail the amount of all payments made under a plan and the purpose for which the payments were made. Those reports are subject to the review and approval of the Independent Trustees.

Payments to Fund Intermediaries

Financial intermediaries may receive various forms of compensation or reimbursement from the Fund in the form of distribution and service (12b-1) plan payments as described above. They may also receive payments or concessions from the Distributor, derived from sales charges paid by the financial intermediary's clients, also as described in this SAI. In addition, the Manager and the Distributor (including their affiliates) may make payments to financial intermediaries in connection with the intermediaries' offering and sales of Fund shares and shares of other Oppenheimer funds, or their provision of marketing or promotional support, transaction processing or administrative services. Among the financial intermediaries that may receive these payments are brokers or dealers who sell or hold shares of the Fund, banks (including bank trust departments), registered investment advisers, insurance companies, retirement plan or qualified tuition program administrators, third party administrators, recordkeepers or other institutions that have selling, servicing or similar arrangements with the Manager or the Distributor. The payments to financial intermediaries vary by the types of product sold, the features of the Fund share class and the role played by the intermediary.

Types of payments to financial intermediaries may include, and the Fund or an investor buying or selling Fund shares may pay, without limitation, all or portions of the following:

  • ongoing asset-based distribution and/or service fees (described in the section "Distribution and Service Arrangements - Distribution and Service (12b-1) Plans" above);
  • shareholder servicing expenses that are paid from Fund assets to reimburse the Manager or the Distributor for Fund expenses they incur for providing omnibus accounting, recordkeeping, networking, sub-transfer agency or other administrative or shareholder services (including retirement plan and 529 plan administrative services fees).

In addition, the Manager or Distributor may, at their discretion, make the following types of payments from their own respective resources, which may include profits the Manager derives from investment advisory fees paid by the Fund. Payments are made based on the guidelines established by the Manager and Distributor, subject to applicable law. These payments are often referred to as "revenue sharing" payments, and may include:

  • compensation for marketing support, support provided in offering shares in the Fund or other Oppenheimer funds through certain trading platforms and programs, and transaction processing or other services;
  • other compensation, to the extent the payment is not prohibited by law or by any self-regulatory agency, such as FINRA.

Although a broker or dealer that sells Fund shares may also act as a broker or dealer in connection with the purchase or sale of portfolio securities by the Fund or other Oppenheimer funds, the Manager does not consider a financial intermediary's sales of shares of the Fund or other Oppenheimer funds when choosing brokers or dealers to effect portfolio transactions for the Fund or other Oppenheimer funds.

Revenue sharing payments can pay for distribution-related or asset retention items including, without limitation:

  • transactional support, one-time charges for setting up access for the Fund or other Oppenheimer funds on particular trading systems, and paying the intermediary's networking fees;
  • program support, such as expenses related to including the Oppenheimer funds in retirement plans, college savings plans, fee-based advisory or wrap fee programs, fund "supermarkets", bank or trust company products or insurance companies' variable annuity or variable life insurance products;
  • placement on the dealer's list of offered funds and providing representatives of the Distributor with access to a financial intermediary's sales meetings, sales representatives and management representatives; or
  • firm support, such as business planning assistance, advertising, or educating a financial intermediary's sales personnel about the Oppenheimer funds and shareholder financial planning needs.

These payments may provide an incentive to financial intermediaries to actively market or promote the sale of shares of the Fund or other Oppenheimer funds, or to support the marketing or promotional efforts of the Distributor in offering shares of the Fund or other Oppenheimer funds. In addition, some types of payments may provide a financial intermediary with an incentive to recommend the Fund or a particular share class. Financial intermediaries may earn profits on these payments, since the amount of the payments may exceed the cost of providing the services. Certain of these payments are subject to limitations under applicable law. Financial intermediaries may categorize and disclose these arrangements to their clients and to members of the public in a manner different from the disclosures in the Fund's Prospectus and this SAI. You should ask your financial intermediary for information about any payments it receives from the Fund, the Manager or the Distributor and any services it provides, as well as the fees and commissions it charges.

For the year ended December 31, 2010, the following financial intermediaries that are broker dealers offering shares of the Oppenheimer and Centennial funds, and/or their respective affiliates, received revenue sharing or similar distribution related payments from the Manager or the Distributor for marketing or program support:

A.G. Edwards and Sons, Inc.

H.D. Vest Investment Services, Inc.

Prime Capital Services, Inc.

Aetna Life Insurance & Annuity Company

Hartford Life & Annuity Insurance
  Company

Primevest Financial Services, Inc.

AIG Advisor Group, Inc.

Independent Financial Group, LLC

Proequities, Inc.

Allianz Life Insurance Company

ING Financial Advisers, LLC

Protective Group Securities, Inc.

Allstate Financial Services LLC

ING Financial Partners, Inc.

Protective Life and Annuity Insurance
  Company

Allstate Life Insurance Company

Invest Financial Corporation

Pruco Securities, LLC

American Enterprise Life Insurance
  Company

Jackson National Life Insurance Company

Prudential Investment Management
  Services, Inc.

American General Annuity Insurance
  Company

Janney Montgomery Scott LLC

Raymond James & Associates, Inc.

American Portfolios Financial Services, Inc.

Jefferson Pilot Securities Corporation

Raymond James Financial Services, Inc.

American United Life Insurance Company

JJB Hillard W.L. Lyons, Inc.

RBC Capital Markets Corporation

Ameriprise Advisor Services, Inc.

JP Morgan Securities, Inc.

RBC Dain Rauscher

Ameriprise Financial Services, Inc.

Kemper Investors Life Insurance Company

Retirement Plan Consultants

Ameritas Life Insurance Company

Key Investment Services LLC

Robert W. Baird & Co.

AXA Advisors, LLC

KMS Financial Services Inc.

Royal Alliance Associates, Inc.

AXA Equitable Life Insurance Company

Legend Equities Corporation

Sagepoint Financial Advisors

Banc of America Investment Services, Inc.

Lincoln Financial Advisors Corporation

Securities America, Inc.

Cadaret Grant & Co.

Lincoln Financial Securities Corporation

Security Benefit Life Insurance Company

Cambridge Investment Research, Inc.

Lincoln Investment Planning, Inc.

Sigma Financial Corp.

CCO Investment Services Corporation

Lincoln National Life Insurance Company

Signator Investments, Inc.

Charles Schwab & Co., Inc.

LPL Financial Corporation

State Farm VP Management Corp.

Chase Investment Services Corporation

Manulife Financial

Stifel, Nicolaus & Company, Inc.

Citigroup Global Markets, Inc.

Massachusetts Mutual Life Insurance
  Company

Sun Life Financial Distributors, Inc.

CitiStreet Advisors LLC

MassMutual Financial Group

Sun Life Insurance Company

Citizens Bank of Rhode Island

Merrill Lynch Pierce Fenner & Smith Inc.

Sun Trust Securities, Inc.

C.M. Life Insurance Company

MetLife Investors Insurance Company

Sunamerica Securities, Inc.

Commonwealth Financial Network

MetLife Securities, Inc.

SunTrust Bank

CUNA Brokerage Services, Inc.

MML Investor Services, Inc.

Suntrust Investment Services, Inc.

CUSO Financial Services, LP

Morgan Stanley & Co., Incorporated

TD Ameritrade Clearing, Inc.

Direct Services LLC

Morgan Stanley Smith Barney LLC

The Hartford/Planco

Edward D. Jones and Company, LP

Multi-Financial Securities Corporation

The Investment Center, Inc.

Essex National Securities, Inc.

Mutual Funds Against Cancer

Thrivent Financial for Lutherans

Federal Kemper Life Assurance Company

National Planning Corporation

Thrivent Investment Management, Inc.

Financial Network Investment Corporation

National Retirement Partners, Inc.

Transamerica Life Insurance Co.

Financial Services Corporation

Nationwide Financial Services, Inc.

UBS Financial Services, Inc.

First Allied Securities, Inc.

New England Securities, Inc.

Union Central Life Insurance Company

First Clearing LLC

NFP Securities Inc.

USI Securities, Inc.

First Global Capital Corporation

North Ridge Securities Corp.

Valic Financial Advisors, Inc.

FSC Securities Corporation

Northwestern Mutual Investment Services

Vanderbilt Securities LLC

GE Life and Annuity Company

NRP Financial, Inc.

VSR Financial Services, Inc.

Geneos Wealth Management, Inc.

Oppenheimer & Co. Inc.

Wachovia Securities, LLC

Genworth Financial, Inc.

Pacific Life Insurance Co.

Walnut Street Securities, Inc.

Great West Life Insurance Company

Park Avenue Securities LLC

Wells Fargo Advisors, LLC

Guardian Insurance & Annuity Company

Pershing LLC

Wells Fargo Investments, LLC

H. Beck, Inc.

PFS Investments, Inc.

Woodbury Financial Services, Inc.

PlanMember Securities Corp.


For the year ended December 31, 2010, the following firms (which in some cases are broker-dealers) received payments from the Manager or Distributor (of at least $2,500) for administrative or other services provided (other than revenue sharing arrangements), as described above:

Acensus, Inc.

First Clearing LLC

National Financial Services LLC

ACS HR Solutions LLC

First Global Capital Corporation

New York Life Insurance and Annuity
  Company

ADP Broker-Dealer, Inc.

First Trust Corp.

Northwest Plan Services Inc.

Aegon USA

GE Financial Assurance

Oppenheimer & Co. Inc.

Aetna Life Insurance & Annuity Company

GE Life and Annuity Company

Pershing LLC

Alliance Benefit Group

Geller Group Ltd.

Phoenix Life Insurance Company

Allianz Life Insurance Company

Genworth Financial, Inc.

Plan Administrators Inc.

American Diversified Distribution, LLC

Great West Life Insurance Company

PlanMember Securities

American Enterprise Life Insurance

Guardian Insurance & Annuity Company

Primevest Financial Services, Inc.

American Funds

H&R Block Financial Advisors, Inc.

Principal Life Insurance

American General Annuity Insurance
  Company

H.D. Vest Investment Services, Inc.

Protective Life and Annuity Insurance
  Company

American United Life Insurance Co.

Hartford Life Insurance Company

Prudential Investment Management
  Services, Inc.

Ameriprise Financial Services, Inc.

Hewitt Associates LLC

PSMI Group

Ameritas Life Insurance Company

ICMA-RC Services LLC

Raymond James & Associates, Inc.

Ameritrade, Inc.

Ingham Group

Reliance Trust Co.

Annuity Investors Life Insurance Company

Interactive Retirement Systems

Robert W. Baird & Co.

AST Trust Company

Intuition Systems, Inc.

RSM McGladrey, Inc.

AXA Equitable Life Insurance Company

Investmart

Scott & Stringfellow, Inc.

Benefit Administration Co.

Janney Montgomery Scott LLC

Scottrade, Inc.

Benefit Consultants Group

JJB Hillard W. L. Lyons, Inc.

Security Benefit Life Insurance Company

Benefit Plans Administrative Services, Inc.

John Hancock Life Insurance Company

Southwest Securities, Inc.

Boston Financial Data Services, Inc.

JP Morgan Securities, Inc.

Standard Insurance Co.

Ceridian

July Business Services

Standard Retirement Services, Inc.

Charles Schwab & Co., Inc.

Kemper Investors Life Insurance Company

Stanton Group, Inc.

Citigroup Global Markets Inc.

Lincoln Benefit National Life

Sterne Agee & Leach, Inc.

CitiStreet Advisors LLC

Lincoln Financial Advisors Corporation

Stifel Nicolaus & Company, Inc.

Clark Consulting

Lincoln Investment Planning Inc.

Sun Trust Securities, Inc.

CPI Qualified Plan Consultants

LPL Financial Corporation

T. Rowe Price

CUNA Mutual Insurance Society

Marshall & Ilsley Trust Company, Inc.

The Princeton Retirement Group

DA Davidson & Co.

Massachusetts Mutual Life Insurance
  Company

The Retirement Plan Company, LLC

Daily Access. Com, Inc.

Matrix Settlement & Clearance Services

Transamerica Retirement Services

Davenport & Company, LLC

Mercer HR Services

UBS Financial Services, Inc.

David Lerner Associates, Inc.

Merrill Lynch Pierce Fenner & Smith Inc.

Unified Fund Services, Inc.

Digital Retirement Solutions

Mesirow Financial, Inc.

Union Bank & Trust Company

Diversified Advisors Investments Inc.

MG Trust

US Clearing Co.

DR, Inc.

Mid Atlantic Capital Co.

USAA Investment Management Co.

Dyatech, LLC

Milliman, Inc.

USI Consulting Group

E*TRADE Clearing LLC

Minnesota Life Insurance Company

Valic Financial Advisors, Inc.

Edward D. Jones and Company, LP

Mony Life Insurance Company of America

Vanguard Group

ExpertPlan.com

Morgan Stanley & Co., Incorporated

Wachovia Securities, LLC

Federal Kemper Life Assurance Company

Morgan Stanley Dean Witter

Wedbush Morgan Securities

Fidelity Brokerage Services, LLC

Mutual of Omaha Insurance Company

Wells Fargo Bank NA

Fidelity Investments Institutional
  Operations Co.

National City Bank

Wells Fargo Investments, LLC

Financial Administrative Services
  Corporation

National Deferred Compensation

Wilmington Trust Company


Performance of the Fund

Explanation of Performance Terminology. The Funds use a variety of terms to illustrate their investment performance. Those terms include "cumulative total return," "average annual total return," "average annual total return at net asset value" and "total return at net asset value." An explanation of how total returns are calculated is set forth below. The charts below show the Funds' performance as of the Funds' most recent fiscal year end. You can obtain current performance information by calling the Funds' Transfer Agent at 1.800.981.2871 or by visiting the OppenheimerFunds Internet website at www.oppenheimerfunds.com.

The Funds' illustrations of their performance data in advertisements must comply with rules of the SEC. Those rules describe the types of performance data that may be used and how it is to be calculated. In general, any advertisement by a Fund of its performance data must include the average annual total returns for the advertised class of shares of that Fund.

Use of standardized performance calculations enables an investor to compare the Funds' performance to the performance of other funds for the same periods. However, a number of factors should be considered before using the Funds' performance information as a basis for comparison with other investments:

  • Yields and total returns measure the performance of a hypothetical account in a Fund over various periods and do not show the performance of each shareholder's account. Your account's performance will vary from the model performance data if the participating insurance company selects to have dividends paid in cash, or you buy or sell shares during the period, or you bought your shares at a different time and price than the shares used in the model.
  • The Funds' performance does not reflect the charges deducted from an investor's separate account by the insurance company or other sponsor of that separate account, which vary from product to product. If these charges were deducted, performance will be lower than as described in the Funds' Prospectus and Statement of Additional Information. In addition, the separate accounts may have inception dates different from those of the Funds. The sponsor for your insurance product can provide performance information that reflects those charges and inception dates.
  • The Funds' performance returns may not reflect the effect of taxes on dividends and capital gains distributions.
  • An investment in the Funds is not insured by the FDIC or any other government agency.
  • The principal value of the Funds' shares, its yields and total returns are not guaranteed and normally will fluctuate on a daily basis.
  • The preceding statement does not apply to Money Fund/VA, which seeks to maintain a stable net asset value of $1.00 per share. There can be no assurance that Money Fund/VA will be able to do so.
  • When an investor's shares are redeemed, they may be worth more or less than their original cost.
  • Oppenheimer Small- & Mid-Cap Growth Fund/VA did not adopt its investment policy on investing in small- and mid-cap stocks until April 30, 2010, and prior to that, the Fund did not adopt its investment policy on investing in mid-cap stocks until April 30, 2006.
  • Prior to April 29, 2011, Oppenheimer Main Street Small- & Mid-Cap Fund/VA had a policy of investing in small-cap securities rather than in small- and mid-cap securities.
  • Yields and total returns for any given past period represent historical performance information and are not, and should not be considered, a prediction of future yields or returns. The Funds' total returns should not be expected to be the same as the returns of other Oppenheimer funds, whether or not such other funds have the same portfolio managers and/or similar names.

The performance of each class of shares is shown separately, because the performance of each class of shares will usually be different. That is because of the different kinds of expenses each class bears. The yields and total returns of each class of shares of the Funds are affected by market conditions, the quality of that Fund's investments, the maturity of debt investments, the types of investments that Fund holds, and its operating expenses that are allocated to the particular class.

Yields. The Fixed Income Funds use a variety of different yields to illustrate their current returns. Each class of shares calculates its yield separately because of the different expenses that affect each class.

  • Standardized Yield. The "standardized yield" (sometimes referred to just as "yield") is shown for a class of shares for a stated 30-day period. It is not based on actual distributions paid by the Fixed Income Funds to shareholders in the 30-day period, but is a hypothetical yield based upon the net investment income from the Fixed Income Funds' portfolio investments for that period. It may therefore differ from the "dividend yield" for the same class of shares, described below.

Standardized yield is calculated using the following formula set forth in rules adopted by the SEC, designed to assure uniformity in the way that all funds calculate their yields:


The symbols above represent the following factors:
a =dividends and interest earned during the 30-day period.
b =expenses accrued for the period (net of any expense assumptions).
c =the average daily number of shares of that class outstanding during the 30-day period that were entitled to receive dividends.
d =the maximum offering price per share of that class on the last day of the period, adjusted for undistributed net investment income.

  • Dividend Yield. The Fixed Income Funds may quote a "dividend yield" for each class of its shares. Dividend yield is based on the dividends paid on a class of shares during the actual dividend period. To calculate dividend yield, the dividends of a class declared during a stated period are added together, and the sum is multiplied by 12 (to annualize the yield) and divided by the maximum offering price on the last day of the dividend period. Because the Fixed Income Funds pay their annual dividend in March of each year, dividend yield is shown for the 30 days ended March 31, 2011. The formula is shown below:

Dividend Yield = Distribution Paid ÷ No. of Days in the Period x No. of Days in the Calendar Year
                                   Maximum Offering Price (payment date)

Fund

Standardized Yield for the 30-Day Period Ended 12/31/10

Dividend Yield for the 30-Day Period Ended 03/31/11

Core Bond Fund/VA Non-Service Shares

4.82%

N/A

Core Bond Fund/VA Service Shares

4.58%

N/A

High Income Fund/VA Non-Service Shares

9.39%

6.69%

High Income Fund/VA Service Shares

9.16%

6.42%

High Income Fund/VA Class 3 Shares

9.44%

6.61%

High Income Fund/VA Class 4 Shares

9.19%

6.30%

Global Strategic Income Fund/VA Non-Service Shares

5.17%

N/A

Global Strategic Income Fund/VA Service Shares

4.96%

N/A


  • Money Fund/VA Yields. The current yield for Money Fund/VA is calculated for a seven-day period of time as follows. First, a base period return is calculated for the seven-day period by determining the net change in the value of a hypothetical pre-existing account having one share at the beginning of the seven-day period. The change includes dividends declared on the original share and dividends declared on any shares purchased with dividends on that share, but such dividends are adjusted to exclude any realized or unrealized capital gains or losses affecting the dividends declared. Next, the base period return is multiplied by 365/7 to obtain the current yield to the nearest hundredth of one percent.

The compounded effective yield for a seven-day period is calculated by
(1)adding 1 to the base period return (obtained as described above),
(2)raising the sum to a power equal to 365 divided by 7, and
(3)subtracting 1 from the result.

Total Return Information. There are different types of "total returns" to measure the Funds' performance. Total return is the change in value of a hypothetical investment in a Fund over a given period, assuming that all dividends and capital gains distributions are reinvested in additional shares and that the investment is redeemed at the end of the period. Because of differences in expenses for each class of shares, the total returns for each class are separately measured. The cumulative total return measures the change in value over the entire period (for example, ten years). An average annual total return shows the average rate of return for each year in a period that would produce the cumulative total return over the entire period. However, average annual total returns do not show actual year-by-year performance. Each Fund uses standardized calculations for its total returns as prescribed by the SEC. The methodology is discussed below.

  • Average Annual Total Return. The "average annual total return" of each class is an average annual compounded rate of return for each year in a specified number of years. It is the rate of return based on the change in value of a hypothetical initial investment of $1,000 ("P" in the formula below) held for a number of years ("n" in the formula) to achieve an Ending Redeemable Value ("ERV" in the formula) of that investment, according to the following formula:


  • Cumulative Total Return. The "cumulative total return" calculation measures the change in value of a hypothetical investment of $1,000 over an entire period of years. Its calculation uses some of the same factors as average annual total return, but it does not average the rate of return on an annual basis. Cumulative total return is determined as follows:


The Funds' Total Returns for the Periods Ended 12/31/10

Fund and Class/Inception Date

1 Year

5-Years (or life of class, if less)

10 Years (or life of class, if less)

Balanced Fund/VA Non-Service Shares (2/9/87)

12.91%

-2.14%

1.62%

Balanced Fund/VA Service Shares (5/1/02)

12.68%

-2.39%

1.51%

Capital Appreciation Fund/VA Non-Service Shares (4/3/85)

9.42%

1.20%

-0.01%

Capital Appreciation Fund/VA Service Shares (9/18/01)

9.15%

0.95%

2.78%

Core Bond Fund/VA Non-Service Shares (4/3/85)

11.42%

-3.94%

1.06%

Core Bond Fund/VA Service Shares (5/1/02)

11.28%

-4.19%

0.01%

Global Securities Fund/VA Non-Service Shares (11/12/90)

15.96%

3.94%

4.93%

Global Securities Fund/VA Service Shares (7/13/00)

15.70%

3.68%

4.69%

Global Securities Fund/VA Class 3 Shares (5/1/03)

15.97%

3.93%

11.93%

Global Securities Fund/VA Class 4 Shares (5/3/04)

15.67%

3.67%

7.21%

Global Strategic Income Fund/VA Non-Service Shares (5/3/93)

14.97%

6.68%

7.45%

Global Strategic Income Fund/VA Service Shares (3/19/01)

14.77%

6.42%

7.00%

High Income Fund/VA Non-Service Shares (4/30/86)

14.81%

-19.62%

-7.44%

High Income Fund/VA Service Shares (9/18/01)

14.44%

-19.61%

-8.11%

High Income Fund/VA Class 3 Shares (5/1/07)

14.69%

-28.22%

N/A

High Income Fund/VA Class 4 Shares (5/1/07)

14.27%

-28.13%

N/A

Main Street Fund/VA Non-Service Shares (7/5/95)

16.11%

1.94%

1.67%

Main Street Fund/VA Service Shares (7/13/00)

15.83%

1.69%

1.44%

Main Street Small- & Mid-Cap Fund/VA Non-Service Shares (5/1/98)

23.41%

3.64%

6.64%

Main Street Small- & Mid-Cap Fund/VA Service Shares (7/16/01)

23.06%

3.38%

7.32%

Money Fund/VA (4/3/85)

0.03%

2.54%

2.26%

Small- & Mid-Cap Growth Fund/VA Non-Service Shares (8/15/86)

27.46%

-1.18%

-2.33%

Small- & Mid-Cap Growth Fund/VA Service Shares (10/16/00)

27.16%

-1.44%

-2.56%

Value Fund/VA Non-Service Shares (1/2/03)

18.85%

5.77%

9.52%

Value Fund/VA Service Shares (9/18/06)

14.81%

0.08%

N/A


Other Performance Comparisons. In its Annual Report to shareholders, the Fund compares its performance to that of one or more appropriate market indices. You can obtain that information by visiting the OppenheimerFunds website at www.oppenheimerfunds.com or by calling the Fund's Transfer Agent at the telephone number shown on the cover of this SAI. The Fund may also compare its performance to that of other investments, including other mutual funds, or use rankings of its performance by independent ranking entities. The following are examples of some of those comparisons.

     Lipper Rankings. From time to time the Fund may publish the ranking of the performance of its share classes by Lipper, Inc. ("Lipper"), a widely-recognized independent mutual fund monitoring service. Lipper monitors and ranks the performance of regulated investment companies for various periods in categories based on investment styles. Lipper also publishes "peer-group" indices and averages of the performance of all mutual funds in particular categories.

     Morningstar Ratings. From time to time the Fund may publish the "star ratings" of its classes of shares by Morningstar, Inc. ("Morningstar"), an independent mutual fund monitoring service that rates and ranks mutual funds within their specialized market sectors. Morningstar proprietary star ratings reflect risk-adjusted historical total investment returns for funds with at least a three-year performance history. The top 10% of funds in each category receive 5 stars, the next 22.5% receive 4 stars, the next 35% receive 3 stars, the next 22.5% receive 2 stars, and the bottom 10% receive 1 star.

     Performance Rankings and Comparisons by Other Entities and Publications. From time to time the Fund may include in its advertisements and sales literature performance information about the Fund cited in newspapers and other periodicals such as The New York Times, The Wall Street Journal, Barron's or other similar publications. That information may include performance quotations from other sources, including Lipper and Morningstar or the Fund's performance may be compared to the performance of various market indices, other investments, or averages, performance rankings or other benchmarks prepared by recognized mutual fund statistical services. The Fund's advertisements and sales literature may also include, for illustrative or comparative purposes, statistical data or other information about general or specific market and economic conditions, for example:

  • information about the performance of certain securities or commodities markets or segments of those markets,
  • information about the performance of the economies of particular countries or regions,
  • the earnings of companies included in segments of particular industries, sectors, securities markets, countries or regions,
  • the availability of different types of securities or offerings of securities,
  • information relating to the gross national or gross domestic product of the United States or other countries or regions,
  • comparisons of various market sectors or indices to demonstrate performance, risk, or other characteristics of the Fund.

From time to time, the Fund may publish rankings or ratings of the Manager or Transfer Agent by third parties, including comparisons of investor services provided to shareholders of the Oppenheimer funds to those provided by other mutual fund families selected by the rating or ranking services. Those comparisons may be based on the opinions of the rating or ranking service itself, using its research or judgment, or may be based on surveys of investors, brokers, shareholders or others.

Investors may also wish to compare the returns on the Fund's share classes to the return on fixed-income investments available from banks and thrift institutions, including certificates of deposit, ordinary interest-paying checking and savings accounts, and other forms of fixed or variable time deposits or instruments such as Treasury bills. However, the Fund's returns and share price are not guaranteed or insured by the FDIC or any other agency and will fluctuate daily, while bank depository obligations may be insured by the FDIC and may provide fixed rates of return. Repayment of principal and payment of interest on Treasury securities is backed by the full faith and credit of the U.S. Government.

How to Buy Shares

Shares of the Funds are sold to provide benefits under variable life insurance policies and variable annuity and other insurance company separate accounts, as explained in the Prospectuses of the Funds and of the insurance product you have selected. Instructions from an investor to buy or sell shares of a Fund should be directed to the insurance sponsor for the investor's separate account, or that insurance sponsor's agent.

Allocation of Expenses. Each Fund pays expenses related to its daily operations, such as custodian fees, Trustees' fees, transfer agency fees, legal fees and auditing costs. Those expenses are paid out of each Fund's assets and are not paid directly by shareholders. However, those expenses reduce the net asset values of shares, and therefore are indirectly borne by shareholders through their investment.

For each Fund that has more than one class of shares outstanding, methodology for calculating the net asset value, dividends and distributions of each Fund's share classes recognizes two types of expenses. General expenses that do not pertain specifically to any one class are allocated pro rata to the shares of all classes. The allocation is based on the percentage of a Fund's total assets that is represented by the assets of each class, and then equally to each outstanding share within a given class. Such general expenses include management fees, legal, bookkeeping and audit fees, printing and mailing costs of shareholder reports, Prospectuses, Statements of Additional Information and other materials for current shareholders, fees to unaffiliated Trustees, custodian expenses, share issuance costs, organization and start-up costs, interest, taxes and brokerage commissions, and non-recurring expenses, such as litigation costs.

Other expenses that are directly attributable to a particular class are allocated equally to each outstanding share within that class. Examples of such expenses include distribution and service plan (12b-1) fees, transfer and shareholder servicing agent fees and expenses, and shareholder meeting expenses (to the extent that such expenses pertain only to a specific class).

Determination of Net Asset Values Per Share. The net asset values per share of each class of shares of the Funds are determined as of the close of business of the NYSE on each day that the NYSE is open. The calculation is done by dividing the value of a Fund's net assets attributable to a class by the number of shares of that class that are outstanding. The NYSE normally closes at 4:00 p.m., Eastern time, but may close earlier on some other days (for example, in case of weather emergencies or on days falling before a U.S. holiday). All references to time in this SAI mean "Eastern time." The NYSE's most recent annual announcement (which is subject to change) states that it will close on New Year's Day, Martin Luther King, Jr. Day, Presidents' Day, Good Friday, Memorial Day, Independence Day, Labor Day, Thanksgiving Day and Christmas Day. It may also close on other days.

Dealers other than NYSE members may conduct trading in certain securities on days on which the NYSE is closed (including weekends and holidays) or after 4:00 p.m. on a regular business day. Because the Funds' net asset values will not be calculated on those days, the Funds' net asset values per share may be significantly affected on such days when shareholders may not purchase or redeem shares. Additionally, trading on many foreign stock exchanges and over-the-counter markets normally is completed before the close of the NYSE.

Changes in the values of securities traded on foreign exchanges or markets as a result of events that occur after the prices of those securities are determined, but before the close of the NYSE, will not be reflected in the Funds' calculation of its net asset values that day unless the Manager determines that the event is likely to effect a material change in the value of the security. The Manager, or an internal valuation committee established by the Manager, as applicable, may establish a valuation, under procedures established by the Board and subject to the approval, ratification and confirmation by the Board at its next ensuing meeting.

Securities Valuation. The Funds' Board of Trustees has established procedures for the valuation of the Funds' securities. In general those procedures for all Funds other than Money Fund/VA are as follows:

  • Equity securities traded on a U.S. securities exchange are valued as follows:
  1. if last sale information is regularly reported, they are valued at the last reported sale price on the principal exchange on which they are traded, on that day, or
  2. if last sale information is not available on a valuation date, they are valued at the last reported sale price preceding the valuation date if it is within the spread of the closing "bid" and "asked" prices on the valuation date or, if not, at the closing "bid" price on the valuation date.
  • Equity securities traded on a foreign securities exchange generally are valued in one of the following ways:
  1. at the last sale price available to the pricing service approved by the Board of Trustees, or
  2. at the last sale price obtained by the Manager from the report of the principal exchange on which the security is traded at its last trading session on or immediately before the valuation date, or
  3. at the mean between the "bid" and "asked" prices obtained from the principal exchange on which the security is traded or, on the basis of reasonable inquiry, from two market makers in the security.
  • Long-term debt securities having a remaining maturity in excess of 60 days are valued based on the mean between the "bid" and "asked" prices determined by a portfolio pricing service approved by the Funds' Board of Trustees or obtained by the Manager from two active market makers in the security on the basis of reasonable inquiry.
  • The following securities are valued at the mean between the "bid" and "asked" prices determined by a pricing service approved by the Funds' Board of Trustees or obtained by the Manager from two active market makers in the security on the basis of reasonable inquiry:
  1. debt instruments that have a maturity of more than 397 days when issued,
  2. debt instruments that had a maturity of 397 days or less when issued and have a remaining maturity of more than 60 days, and
  3. non-money market debt instruments that had a maturity of 397 days or less when issued and which have a remaining maturity of 60 days or less.
  • The following securities are valued at cost, adjusted for amortization of premiums and accretion of discounts:
  1. money market debt securities held by a non-money market fund that had a maturity of less than 397 days when issued that have a remaining maturity of 60 days or less, and
  2. debt instruments held by a money market fund that have a remaining maturity of 397 days or less.
  • Securities (including restricted securities) not having readily-available market quotations are valued at fair value determined under the Board's procedures. If the Manager is unable to locate two market makers willing to give quotes, a security may be priced at the mean between the "bid" and "asked" prices provided by a single active market maker (which in certain cases may be the "bid" price if no "asked" price is available).

In the case of U.S. government securities, mortgage-backed securities, corporate bonds and foreign government securities, when last sale information is not generally available, the Manager may use pricing services approved by the Board of Trustees. The pricing service may use "matrix" comparisons to the prices for comparable instruments on the basis of quality, yield and maturity. Other special factors may be involved (such as the tax-exempt status of the interest paid by municipal securities). The Manager will monitor the accuracy of the pricing services. That monitoring may include comparing prices used for portfolio valuation to actual sales prices of selected securities.

The closing prices in the New York foreign exchange market on a particular business day that are provided to the Manager by a bank, dealer or pricing service that the Manager has determined to be reliable are used to value foreign currency, including forward contracts, and to convert to U.S. dollars securities that are denominated in foreign currency.

Puts, calls, and futures are valued at the last sale price on the principal exchange on which they are traded, as determined by a pricing service approved by the Board of Trustees or by the Manager. If there were no sales that day, they shall be valued at the last sale price on the preceding trading day if it is within the spread of the closing "bid" and "asked" prices on the principal exchange on the valuation date. If not, the value shall be the closing bid price on the principal exchange on the valuation date. If the put, call or future is not traded on an exchange, it shall be valued by the mean between "bid" and "asked" prices obtained by the Manager from two active market makers. In certain cases that may be at the "bid" price if no "asked" price is available.

When a Fund writes an option, an amount equal to the premium received is included in that Fund's Statement of Assets and Liabilities as an asset. An equivalent credit is included in the liability section. The credit is adjusted ("marked-to-market") to reflect the current market value of the option. In determining the Funds' gain on investments, if a call or put written by a Fund is exercised, the proceeds are increased by the premium received. If a call or put written by a Fund expires, that Fund has a gain in the amount of the premium. If a Fund enters into a closing purchase transaction, it will have a gain or loss, depending on whether the premium received was more or less than the cost of the closing transaction. If a Fund exercises a put it holds, the amount that Fund receives on its sale of the underlying investment is reduced by the amount of premium paid by that Fund.

Money Fund/VA Net Asset Valuation Per Share. Money Fund/VA will seek to maintain a net asset value of $1.00 per share for purchases and redemptions. There can be no assurance it will be able to do so. Money Fund/VA operates under Rule 2a-7 under which it may use the amortized cost method of valuing their shares. The Funds' Board of Trustees has adopted procedures for that purpose. The amortized cost method values a security initially at its cost and thereafter assumes a constant amortization of any premium or accretion of any discount, regardless of the impact of fluctuating interest rates on the market value of the security. This method does not take into account unrealized capital gains or losses.

The Funds' Board of Trustees has established procedures intended to stabilize Money Fund/VA's net asset value at $1.00 per share. If Money Fund/VA's net asset value per share were to deviate from $1.00 by more than 0.5%, Rule 2a-7 requires the Board promptly to consider what action, if any, should be taken. If the Trustees find that the extent of any such deviation may result in material dilution or other unfair effects on shareholders, the Board will take whatever steps it considers appropriate to eliminate or reduce such dilution or unfair effects, including, without limitation, selling portfolio securities prior to maturity, shortening the average portfolio maturity, withholding or reducing dividends, reducing the outstanding number of shares of that Fund without monetary consideration, or calculating net asset value per share by using available market quotations.

As long as Money Fund/VA uses Rule 2a-7, it must abide by certain conditions described in the Prospectus which limit the maturity of securities that Fund buys. Under Rule 2a-7, the maturity of an instrument is generally considered to be its stated maturity (or in the case of an instrument called for redemption, the date on which the redemption payment must be made), with special exceptions for certain variable rate demand and floating rate instruments. Repurchase agreements and securities loan agreements are, in general, treated as having maturity equal to the period scheduled until repurchase or return, or if subject to demand, equal to the notice period.

While amortized cost method provides certainty in valuation, there may be periods during which the value of an instrument, as determined by amortized cost, is higher or lower than the price Money Fund/VA would receive if it sold the instrument. During periods of declining interest rates, the daily yield on shares of that Fund may tend to be lower (and net investment income and daily dividends higher) than market prices or estimates of market prices for its portfolio. Thus, if the use of amortized cost by the funds resulted in a lower aggregate portfolio value on a particular day, a prospective investor in Money Fund/VA would be able to obtain a somewhat higher yield than would result from investment in a fund utilizing solely market values, and existing investors in that Fund would receive less investment income than if Money Fund/VA were priced at market value. Conversely, during periods of rising interest rates, the daily yield on shares of that Fund will tend to be higher and its aggregate value lower than that of a portfolio priced at market value. A prospective investor would receive a lower yield than from an investment in a portfolio priced at market value, while existing investors in Money Fund/VA would receive more investment income than if that Fund were priced at market value.

Fair Value Pricing. Pursuant to Rule 2a-7, Money Fund/VA will also calculate a shadow price for periodic review by the Board. For purposes of calculating the shadow price, Money Fund/VA may if after the close of the principal market on which a security held by the Fund is traded and before the time as of which the Fund's net asset value is calculated that day, an event occurs that the Manager learns of and believes in the exercise of its judgment will cause a material change in the value of that security, that security may be valued by another method that the Board believes would more accurately reflect the security's fair value. Fair value determinations by the Manager are subject to review, approval and ratification by the Board at its next scheduled meeting after the fair valuations are determined.

Money Fund/VA's use of fair value pricing procedures involves subjective judgments and it is possible that the fair value determined for a security may be materially different from the value that could be realized upon the sale of that security.

Valuation of the Subsidiary and its Underlying Investments. The securities valuation procedures for the Fund are the same used in valuing the Subsidiary's portfolio investments and shares of the Subsidiary.

Payments "In Kind". The Prospectus states that payment for shares tendered for redemption is ordinarily made in cash. However, under certain circumstances, the Board of Trustees of the Global Securities Fund/VA, Main Street Fund®/VA and Global Strategic Income Fund/VA may determine that it would be detrimental to the best interests of the remaining shareholders of those Funds to make payment of a redemption order wholly or partly in cash. In that case, the Funds may pay the redemption proceeds in whole or in part by a distribution "in kind" of liquid portfolio securities from the portfolio of the Funds, in lieu of cash. The Board of Trustees of the Fund has adopted procedures for "in kind" redemptions. In accordance with the procedures, the Board of Trustees of a Fund may be required to approve an "in kind" redemption paid to a shareholder that holds 5% or more of the shares of any class, or of all outstanding shares, of that Fund, or to any other shareholder that may be deemed to be an "affiliated person" under section 2(a)(3) of the Investment Company Act.

Each of Oppenheimer Global Securities Fund/VA, Oppenheimer Main Street Fund®/VA and Oppenheimer Global Strategic Income Fund/VA has elected to be governed by Rule 18f-1 under the Investment Company Act. Under that rule, each of Oppenheimer Global Securities Fund/VA, Oppenheimer Main Street Fund®/VA and Oppenheimer Global Strategic Income Fund/VA is obligated to redeem shares solely in cash up to the lesser of $250,000 or 1% of the net assets of such Fund redeemed during any 90-day period for any one shareholder. As of the date of this SAI, those Funds intend to redeem shares in kind only under certain limited circumstances (such as redemptions of substantial amounts by shareholders that have consented to such in kind redemptions). If shares are redeemed in kind, the redeeming shareholder may incur brokerage or other costs in selling the securities. Each of Oppenheimer Global Securities Fund/VA, Oppenheimer Main Street Fund®/VA and Oppenheimer Global Strategic Income Fund/VA will value securities used to pay redemptions in kind using the same method it uses to value its portfolio securities described above under "Determination of Net Asset Values Per Share." That valuation will be made as of the time the redemption price is determined.

Distributions and Taxes

Dividends and Distributions. The Funds have no fixed dividend rate and there can be no assurance as to the payment of any dividends or the realization of any capital gains. The dividends and distributions paid by a class of shares will vary from time to time depending on market conditions, the composition of the Funds' portfolio, and expenses borne by the Fund or borne separately by a class (if more than one class of shares is outstanding). Dividends are calculated in the same manner, at the same time, and on the same day for each class of shares. Dividends on Service shares and Class 4 Shares are expected to be lower because of the additional expenses for those shares. Dividends will also differ in amount as a consequence of any difference in the net asset values of the different classes of shares.

Taxes. Each Fund is treated as a separate entity for federal income tax purposes. Each Fund intends to qualify as a "regulated investment company" under the provisions of Subchapter M of the Code. As a regulated investment company, each Fund is required to distribute to its shareholders for each taxable year at least 90% of its investment company taxable income (consisting generally of net investment income, net short-term capital gain, and net gains from certain foreign currency transactions). To qualify for treatment as a regulated investment company, a Fund must meet certain income source, asset diversification and income distribution requirements. If each Fund qualifies as a "regulated investment company" and complies with the relevant provisions of the Code, each Fund will be relieved of federal income tax on the part of its net ordinary income and realized net capital gain which it distributes to the separate accounts. If a Fund fails to qualify as a regulated investment company, the Fund will be subject to federal, and possibly state, corporate taxes on its taxable income and gains. Furthermore, distributions to its shareholders will constitute ordinary dividend income to the extent of such Fund's available earnings and profits, and insurance policy and product holders could be subject to current tax on distributions received with respect to Fund shares.

Each Fund supports variable life insurance, variable annuity contracts and other insurance company separate accounts and therefore must, and intends to, comply with the diversification requirements imposed by section 817(h) of the Code and the regulations hereunder. These requirements place certain limitations on the proportion of each Fund's assets that may be represented by any single investment (which includes all securities of the issuer) and are in addition to the diversification requirements applicable to such Fund's status as a regulated investment company. For these purposes, each U.S. Government agency or instrumentality is treated as a separate issuer, while a particular foreign government and its agencies, instrumentalities, and political subdivisions are all considered the same issuer.

Generally, a regulated investment company must distribute substantially all of its ordinary income and capital gains in accordance with a calendar year distribution requirement in order to avoid a nondeductible 4% federal excise tax. However, the excise tax does not apply to a Fund whose only shareholders are certain tax-exempt trusts or segregated asset accounts of life insurance companies held in connection with variable contracts. The Funds intend to qualify for this exemption or to make distributions in accordance with the calendar year distribution requirements and therefore do not expect to be subject to this excise tax.

Foreign Taxes. Investment income received from sources within foreign countries may be subject to foreign income taxes. In this regard, withholding tax rates in countries with which the United States does not have a tax treaty are often as high as 30% or more. The United States has entered into tax treaties with many foreign countries that entitle certain investors to a reduced rate of tax (generally 10-15%) or to certain exemptions from tax. Each Fund will operate so as to qualify for such reduced tax rates or tax exemptions whenever possible. While insurance policy and product holders will bear the cost of any foreign tax withholding, they will not be able to claim a foreign tax credit or deduction for taxes paid by the Fund.

The Funds that may invest in foreign securities, may invest in securities of "passive foreign investment companies" ("PFICs"). A PFIC is a foreign corporation that, in general, meets either of the following tests: (1) at least 75% of the its gross income is passive; or (2) an average of at least 50% of its assets produce, or are held for the production of, passive income. A Fund investing in securities of PFICs may be subject to U.S. federal income taxes and interest charges, which would reduce the investment return of a Fund making such investments. The owners of variable annuities, variable life insurance products and other insurance company separate accounts investing in such Fund would effectively bear the cost of these taxes and interest charges. In certain cases, a Fund may be eligible to make certain elections with respect to securities of PFICs that could reduce taxes and interest charges payable by the Fund. However, no assurance can be given that such elections can or will be made.

Tax Considerations with Respect to the Subsidiary. Global Strategic Income Fund/VA may invest a portion of its assets in the Subsidiary, which is classified as a corporation for U.S. federal income tax purposes. A foreign corporation, such as the Subsidiary, will generally not be subject to U.S. federal income taxation unless it is deemed to be engaged in a U.S. trade or business. It is expected that the Subsidiary will conduct its activities in a manner so as to meet the requirements of a safe harbor under Section 864(b)(2) of the Internal Revenue Code (the "Safe Harbor") pursuant to which the Subsidiary, provided it is not a dealer in stocks, securities or commodities, may engage in the following activities without being deemed to be engaged in a U.S. trade or business: (1) trading in stocks or securities (including contracts or options to buy or sell securities) for its own account; and (2) trading, for its own account, in commodities that are "of a kind customarily dealt in on an organized commodity exchange" if the transaction is of a kind customarily consummated at such place. Thus, the Subsidiary's securities and commodities trading activities should not constitute a U.S. trade or business. However, if certain of the Subsidiary's activities were determined not to be of the type described in the Safe Harbor or if the Subsidiary's gains are attributable to investments in securities that constitute U.S. real property interests (which is not expected), then the activities of the Subsidiary may constitute a U.S. trade or business, or be taxed as such.

In general, a foreign corporation that does not conduct a U.S. trade or business is nonetheless subject to tax at a flat rate of 30 percent on the gross amount of certain U.S.-source income that is not effectively connected with a U.S. trade or business (or lower tax treaty rate), generally payable through withholding. There is presently no tax treaty in force between the U.S. and the Cayman Islands that would reduce this rate of withholding tax. Income subject to such a flat tax includes dividends and certain interest income. The 30 percent tax does not apply to U.S.-source capital gains (whether long-term or short-term) or to interest paid to a foreign corporation on its deposits with U.S. banks. The 30 percent tax also does not apply to interest which qualifies as "portfolio interest." The term "portfolio interest" generally includes interest (including original issue discount) on an obligation in registered form which has been issued after July 18, 1984 and with respect to which the person, who would otherwise be required to deduct and withhold the 30 percent tax, received the required statement that the beneficial owner of the obligation is not a U.S. person within the meaning of the Internal Revenue Code. Under certain circumstances, interest on bearer obligations may also be considered portfolio interest.

The Subsidiary is wholly-owned by Global Strategic Income Fund/VA. A U.S. person who owns (directly, indirectly or constructively) 10 percent or more of the total combined voting power of all classes of stock of a foreign corporation is a "U.S. Shareholder" for purposes of the controlled foreign corporation ("CFC") provisions of the Internal Revenue Code. A foreign corporation is a CFC if, on any day of its taxable year, more than 50 percent of the voting power or value of its stock is owned (directly, indirectly or constructively) by "U.S. Shareholders." Because Global Strategic Income Fund/VA is a U.S. person that owns all of the stock of the Subsidiary, Global Strategic Income Fund/VA is a "U.S. Shareholder" and the Subsidiary is a CFC. As a "U.S. Shareholder," Global Strategic Income Fund/VA is required to include in gross income for United States federal income tax purposes all of the Subsidiary's "subpart F income" (defined, in part, below), whether or not such income is distributed by the Subsidiary. It is expected that all of the Subsidiary's income will be "subpart F income." "Subpart F income" generally includes interest, original issue discount, dividends, net gains from the disposition of stocks or securities, receipts with respect to securities loans and net payments received with respect to equity swaps and similar derivatives. "Subpart F income" also includes the excess of gains over losses from transactions (including futures, forward and similar transactions) in any commodities. Global Strategic Income Fund/VA's recognition of the Subsidiary's "subpart F income" will increase Global Strategic Income Fund/VA's tax basis in the Subsidiary.

Distributions by the Subsidiary to Global Strategic Income Fund/VA will be tax-free, to the extent of its previously undistributed "subpart F income," and will correspondingly reduce Global Strategic Income Fund/VA's tax basis in the Subsidiary. "Subpart F income" is generally treated as ordinary income, regardless of the character of the Subsidiary's underlying income.

In general, each "U.S. Shareholder" is required to file IRS Form 5471 with its U.S. federal income tax (or information) returns providing information about its ownership of the CFC and the CFC. In addition, a "U.S. Shareholder" may in certain circumstances be required to report a disposition of shares in the Subsidiary by attaching IRS Form 5471 to its U.S. federal income tax (or information) return that it would normally file for the taxable year in which the disposition occurs. In general, these filing requirements will apply to investors of Global Strategic Income Fund/VA if the investor is a U.S. person who owns directly, indirectly or constructively (within the meaning of Sections 958(a) and (b) of the Internal Revenue Code) 10 percent or more of the total combined voting power of all classes of voting stock of a foreign corporation that is a CFC for an uninterrupted period of 30 days or more during any tax year of the foreign corporation, and who owned that stock on the last day of that year.

This is a general and abbreviated summary of the applicable provisions of the Code and Treasury Regulations currently in effect as interpreted by the Courts and the Internal Revenue Service. For further information, consult the prospectus and/or statement of additional information for your particular insurance product, as well as your own tax advisor.

Additional Information About the Fund

The Transfer Agent. OppenheimerFunds Services, the Fund's Transfer Agent, is a division of the Manager. It is responsible for maintaining the Fund's shareholder registry and shareholder accounting records, and for paying dividends and distributions to shareholders. It also handles shareholder servicing and administrative functions. It serves as the Transfer Agent for an annual per account fee. It also acts as shareholder servicing agent for the other Oppenheimer funds. Shareholders should direct inquiries about their accounts to the Transfer Agent at the address and toll-free numbers shown on the back cover.

Information about your investment in the Funds through your variable annuity contract, variable life insurance policy or other plan can be obtained only from your participating insurance company or its servicing agent. The Funds' Transfer Agent does not hold or have access to those records. Instructions for buying or selling shares of the Funds should be given to your insurance company or its servicing agent, not directly to the Funds or its Transfer Agent.

The Custodian. JPMorgan Chase Bank is the custodian of the Fund's assets. The custodian's responsibilities include safeguarding and controlling the Fund's portfolio securities and handling the delivery of such securities to and from the Fund. It is the practice of the Fund to deal with the custodian in a manner uninfluenced by any banking relationship the custodian may have with the Manager and its affiliates. The Fund's cash balances with the custodian in excess of $250,000 are not protected by the federal deposit insurance corporation ("FDIC"). Those uninsured balances at times may be substantial.

Independent Registered Public Accounting Firm .  KPMG LLP serves as the independent registered public accounting firm for the Fund. KPMG LLP audits the Fund's financial statements and performs other related audit and tax services.  KPMG LLP also acts as the independent registered public accounting firm for the Manager and certain other funds advised by the Manager and its affiliates. Audit and non-audit services provided by KPMG LLP to the Fund must be pre-approved by the Audit Committee.

Appendix A

Major Shareholders. As of April 5, 2011, the total number of shares outstanding, and the number of shares and approximate percentage of Fund shares held of record by separate accounts of the following insurance companies (and their respective subsidiaries) and by OppenheimerFunds, Inc. ("OFI") were as follows.

Oppenheimer Variable Account Funds (consisting of 11 separate Funds)

Total Number of Shares in Fund

Name of Insurance Company

Number of Shares Owned by Insurance Co.

% Owned by Insurance Co.

Balanced Fund/VA - Non-Service Shares

12,890,601.020

Genworth Life and Annuity Insurance Company

1,782,458.984

13.83%

Transamerica Advisors Life Insurance Company

1,721,380.596

13.35%

Mass Mutual Life Insurance Company

3,854,093.973

29.90%

Nationwide Life Insurance Company

4,803,309.868

37.26%

Balanced Fund/VA - Service Shares

7,851,362.244

Allstate Life Insurance Company

1,473,669.678

18.77%

Genworth Life Insurance Company of New York

605,780.676

7.72%

Genworth Life and Annuity Insurance Company

3,518,347.209

44.81%

Sun Life Assurance Company of Canada (U.S.)

1,192,973.984

15.19%

Capital Appreciation Fund/VA - Non-Service Shares

18,473,206.575

Mass Mutual Life Insurance Company

13,537,103.474

73.28%

Nationwide Life Insurance Company

1,131,626.597

6.13%

Capital Appreciation Fund/VA - Service Shares

10,420,201.996

RiverSource Life Insurance Company

1,009,058.290

9.68%

Allstate Life Insurance Company

986,835.123

9.47%

Guardian Insurance & Annuity Co. Inc.

1,856,212.309

17.81%

Hartford Life Insurance Company

1,150,832.030

11.04%

Hartford Life & Annuity Insurance Company

2,560,553.566

24.57%

Protective Life Insurance Company

886,370.637

8.31%

Sun Life Assurance Company of Canada (U.S.)

644,632.299

6.19%

Core Bond Fund/VA - Non-Service Shares

17,366,611.333

Genworth Life and Annuity Insurance Company

2,771,975.035

15.96%

Mass Mutual Life Insurance Company

6,640638.672

38.24%

Nationwide Life Insurance Company

6,228,134.599

35.86%

Core Bond Fund/VA - Service Shares

7,451,422.112

Allstate Life Insurance Company of New York

1,141,677.380

15.32%

Allstate Life Insurance Company

4,699,692.917

63.07%

Security Benefit Life Insurance Company

1,533,162.715

20.58%

Global Securities Fund/VA - Non-Service Shares

45,666,504.641

Allianz Life Insurance Company of North America

2,871,483.832

6.29%

Mass Mutual Life Insurance Company

29,208,314.746

63.96%

Nationwide Life Insurance Company

9,946,051.951

21.78%

Global Securities Fund/VA - Service Shares

36,892,166.658

Hartford Life Insurance Company

5,883,348.716

15.95%

Hartford Life & Annuity Insurance Company

11,080,792.157

30.04%

RiverSource Life Insurance Company

3,792,561.827

10.28%

Genworth Life and Annuity Insurance Company

4,028,605.011

10.92%

Protective Life Insurance Company

4,664,039.741

12.64%

Global Securities Fund/VA - Class 3 Shares

6,474,178.188

Nationwide Life Insurance Company

6,474,178.188

100%

Global Securities Fund/VA - Class 4 Shares

2,679,029.918

Nationwide Life Insurance Company

2,679,029.918

100%

Global Strategic Income Fund/VA - Non-Service Shares

130,541,751.066

Mass Mutual Life Insurance Company

119,328,415.798

91.41%

Protective Life Insurance Company

7,255,613.866

5.56%

Global Strategic Income Fund/VA - Service Shares

303,774,414.696

Allstate Life Insurance Company

16,425,890.858

5.41%

RiverSource Life Insurance Company

183,579,711.746

60.43%

Protective Life Insurance Company

35,338,236.456

11.63%

High Income Fund/VA - Non-Service Shares

30,217,052.913

Allianz Life Insurance Company of North America

6,157,106.255

20.38%

Genworth Life and Annuity Insurance Company

4,334,110.927

14.34%

Mass Mutual Life Insurance Company

15,120,467.282

50.04%

High Income Fund/VA - Service Shares

31,430,284.089

Allstate Life Insurance Company of New York

2,346,270.923

7.47%

Commonwealth Annuity and Life Insurance Company

1,928,159.884

6.13%

Allstate Life Insurance Company

7,464,833.859

23.75%

Minnesota Life Insurance Company

15,326,590.167

48.76%

Nationwide Life Insurance Company

1,687,321.680

5.37%

High Income Fund/VA - Class 3 Shares

3,195,668.387

Nationwide Life Insurance Company

3,195,516.887

100%

High Income Fund/VA - Class 4 Shares

4,164,353.405

Nationwide Life Insurance Company

4,164,203.031

100%

Main Street Fund/VA - Non-Service Shares

21,797,815.572

Allianz Life Insurance Company of North America

2,981,648.867

13.68%

Mutual of America

1,225,872.830

5.62%

Mass Mutual Life Insurance Company

6,750,804.443

30.97%

Nationwide Life Insurance Company

7,753,588.702

35.57%

Main Street Fund/VA - Service Shares

55,322,833.406

Allstate Life Insurance Company

2,943,360.362

5.32%

Genworth Life and Annuity Insurance Company

10,464,164.432

18.91%

Nationwide Life Insurance Company

11,746,642.623

21.23%

Sun Life Assurance Company of Canada (U.S.)

21,874,002.535

39.54%

Main Street Small- & Mid-Cap Fund/VA - Non-Service Shares

5,372,678.331

ING Life Insurance and Annuity Company

1,973,432.182

36.73%

CUNA Mutual Life Insurance Company

414,988.863

7.72%

Lincoln Benefit Life Company

387,993.930

7.22%

Mass Mutual Life Insurance Company

334,991.164

6.24%

Nationwide Life Insurance Company

1,549,180.232

28.83%

Main Street Small- & Mid-Cap Fund/VA - Service Shares

47,714,752.025

Guardian Insurance & Annuity Co. Inc.

3,521,793.365

7.38%

Hartford Life Insurance Company

3,627,406.892

7.60%

Hartford Life & Annuity Company

9,576,128.840

20.07%

RiverSource Life Insurance Company

4,534,627.833

9.50%

Genworth Life and Annuity Insurance Company

6,829,244.746

14.31%

MetLife Investors Insurance Company

4,354,524.620

9.13%

Nationwide Life Insurance Company

2,627,786.463

5.51%

Phoenix Life Insurance Company

2,878,045.177

6.03%

Money Fund/VA - Non-Service Shares

142,218,483.780

Mass Mutual Life Insurance Company

84,088,593.500

59.13%

Protective Life Insurance Company

51,531,761.810

36.23%

Small- & Mid-Cap Growth Fund/VA - Non-Service Shares

12,804,798.820

Genworth Life and Annuity Insurance Company

712,604.474

5.57%

Mass Mutual Life Insurance Company

9,414,059.279

73.52%

Nationwide Life Insurance Company

2,172,312.129

16.96%

Small- & Mid-Cap Growth Fund/VA - Service Shares

769,367.047

Allstate Life Insurance Company of New York

56,500.033

7.34%

Allstate Life Insurance Company

216,273.227

28.11%

Hartford Life Insurance Company

86,994.396

11.31%

Hartford Life & Annuity Insurance Company

186,114.133

24.19%

Genworth Life and Annuity Insurance Company

74,359.936

9.67%

Mass Mutual Life Insurance Company

40,560.552

5.27%

Value Fund/VA - Non-Service Shares

11,810.919

Lincoln Benefit Life Company

11,231.506

95.09%

Value Fund/VA - Service Shares

749,196.567

Hartford Life Insurance Company

173,241.605

23.12%

RiverSource Life Insurance Company

455,347.250

60.78%

RiverSource Life Insurance Company of NY

99,780.357

13.32%


Appendix B

Ratings Definitions

Below are summaries of the rating definitions used by the nationally recognized statistical rating organizations ("NRSROs") listed below. Those ratings represent the opinion of the NRSRO as to the credit quality of issues that they rate. The summaries below are based upon publicly available information provided by the NRSROs.

Moody's Investors Service, Inc. ("Moody's")

LONG-TERM RATINGS: BONDS AND PREFERRED STOCK ISSUER RATINGS

Aaa: Bonds and preferred stock rated "Aaa" are judged to be the best quality. They carry the smallest degree of investment risk. Interest payments are protected by a large or by an exceptionally stable margin and principal is secure. While the various protective elements are likely to change, the changes that can be expected are most unlikely to impair the fundamentally strong position of such issues.

Aa: Bonds and preferred stock rated "Aa" are judged to be of high quality by all standards. Together with the "Aaa" group, they comprise what are generally known as high-grade bonds. They are rated lower than the best bonds because margins of protection may not be as large as with "Aaa" securities or fluctuation of protective elements may be of greater amplitude or there may be other elements present which make the long-term risk appear somewhat larger than that of "Aaa" securities.

A: Bonds and preferred stock rated "A" possess many favorable investment attributes and are to be considered as upper-medium grade obligations. Factors giving security to principal and interest are considered adequate but elements may be present which suggest a susceptibility to impairment some time in the future.

Baa: Bonds and preferred stock rated "Baa" are considered medium-grade obligations; that is, they are neither highly protected nor poorly secured. Interest payments and principal security appear adequate for the present but certain protective elements may be lacking or may be characteristically unreliable over any great length of time. Such bonds lack outstanding investment characteristics and have speculative characteristics as well.

Ba: Bonds and preferred stock rated "Ba" are judged to have speculative elements. Their future cannot be considered well-assured. Often the protection of interest and principal payments may be very moderate and thereby not well safeguarded during both good and bad times over the future. Uncertainty of position characterizes bonds in this class.

B: Bonds and preferred stock rated "B" generally lack characteristics of the desirable investment. Assurance of interest and principal payments or of maintenance of other terms of the contract over any long period of time may be small.

Caa: Bonds and preferred stock rated "Caa" are of poor standing. Such issues may be in default or there may be present elements of danger with respect to principal or interest.

Ca: Bonds and preferred stock rated "Ca" represent obligations which are speculative in a high degree. Such issues are often in default or have other marked shortcomings.

C: Bonds and preferred stock rated "C" are the lowest class of rated bonds and can be regarded as having extremely poor prospects of ever attaining any real investment standing.

Moody's applies numerical modifiers 1, 2, and 3 in each generic rating classification from "Aa" through "Caa." The modifier "1" indicates that the obligation ranks in the higher end of its generic rating category; the modifier "2" indicates a mid-range ranking; and the modifier "3" indicates a ranking in the lower end of that generic rating category. Advanced refunded issues that are secured by certain assets are identified with a # symbol.

PRIME RATING SYSTEM (SHORT-TERM RATINGS – TAXABLE DEBT)

These ratings are opinions of the ability of issuers to honor senior financial obligations and contracts. Such obligations generally have an original maturity not exceeding one year, unless explicitly noted.

Prime-1: Issuer has a superior ability for repayment of senior short-term debt obligations.

Prime-2: Issuer has a strong ability for repayment of senior short-term debt obligations. Earnings trends and coverage ratios, while sound, may be more subject to variation. Capitalization characteristics, while appropriate, may be more affected by external conditions. Ample alternate liquidity is maintained.

Prime-3: Issuer has an acceptable ability for repayment of senior short-term obligations. The effect of industry characteristics and market compositions may be more pronounced. Variability in earnings and profitability may result in changes in the level of debt protection measurements and may require relatively high financial leverage. Adequate alternate liquidity is maintained.

Not Prime: Issuer does not fall within any Prime rating category.

Standard & Poor's Ratings Services ("Standard & Poor's"), a division of The McGraw-Hill Companies, Inc.

LONG-TERM ISSUE CREDIT RATINGS

Issue credit ratings are based in varying degrees, on the following considerations:

  • Likelihood of payment-capacity and willingness of the obligor to meet its financial commitment on an obligation in accordance with the terms of the obligation;
  • Nature of and provisions of the obligation; and
  • Protection afforded by, and relative position of, the obligation in the event of bankruptcy, reorganization, or other arrangement under the laws of bankruptcy and other laws affecting creditors' rights.

The issue ratings definitions are expressed in terms of default risk. As such, they pertain to senior obligations of an entity. Junior obligations are typically rated lower than senior obligations, to reflect the lower priority in bankruptcy, as noted above.

AAA: An obligation rated "AAA" has the highest rating assigned by Standard & Poor's. The obligor's capacity to meet its financial commitment on the obligation is extremely strong.

AA: An obligation rated "AA" differs from the highest rated obligations only in small degree. The obligor's capacity to meet its financial commitment on the obligation is very strong.

A: An obligation rated "A" is somewhat more susceptible to the adverse effects of changes in circumstances and economic conditions than obligations in higher-rated categories. However, the obligor's capacity to meet its financial commitment on the obligation is still strong.

BBB: An obligation rated "BBB" exhibits adequate protection parameters. However, adverse economic conditions or changing circumstances are more likely to lead to a weakened capacity of the obligor to meet its financial commitment on the obligation.

BB, B, CCC, CC, and C: Obligations rated "BB", "B", "CCC", "CC", and "C" are regarded as having significant speculative characteristics. "BB" indicates the least degree of speculation and "C" the highest. While such obligations will likely have some quality and protective characteristics, these may be outweighed by large uncertainties or major exposures to adverse conditions.

BB: An obligation rated "BB" is less vulnerable to nonpayment than other speculative issues. However, they face major ongoing uncertainties or exposure to adverse business, financial, or economic conditions which could lead to the obligor's inadequate capacity to meet its financial commitment on the obligation.

B: An obligation rated "B" is more vulnerable to nonpayment than obligations rated "BB", but the obligor currently has the capacity to meet its financial commitment on the obligation. Adverse business, financial, or economic conditions will likely impair the obligor's capacity or willingness to meet its financial commitment on the obligation.

CCC: An obligation rated "CCC" is currently vulnerable to nonpayment, and are dependent upon favorable business, financial, and economic conditions for the obligor to meet its financial commitment on the obligation. In the event of adverse business, financial, or economic conditions, the obligor is not likely to have the capacity to meet its financial commitment on the obligation.

CC: An obligation rated "CC" is currently highly vulnerable to nonpayment.

C: Subordinated debt or preferred stock obligations rated "C" are currently highly vulnerable to nonpayment. The "C" rating may be used to cover a situation where a bankruptcy petition has been filed or similar action taken, but payments on this obligation are being continued. A "C" also will be assigned to a preferred stock issue in arrears on dividends or sinking fund payments, but that is currently paying.

D: An obligation rated "D" is in payment default. The "D" rating category is used when payments on an obligation are not made on the date due even if the applicable grace period has not expired, unless Standard & Poor's believes that such payments will be made during such grace period. The "D" rating also will be used upon the filing of a bankruptcy petition or the taking of a similar action if payments on an obligation are jeopardized.

The ratings from "AA" to "CCC" may be modified by the addition of a plus (+) or minus (-) sign to show relative standing within the major rating categories.

c: The "c" subscript is used to provide additional information to investors that the bank may terminate its obligation to purchase tendered bonds if the long-term credit rating of the issuer is below an investment-grade level and/or the issuer's bonds are deemed taxable.

p: The letter "p" indicates that the rating is provisional. A provisional rating assumes the successful completion of the project financed by the debt being rated and indicates that payment of debt service requirements is largely or entirely dependent upon the successful, timely completion of the project. This rating, however, while addressing credit quality subsequent to completion of the project, makes no comment on the likelihood of or the risk of default upon failure of such completion. The investor should exercise his own judgment with respect to such likelihood and risk.

Continuance of the ratings is contingent upon Standard & Poor's receipt of an executed copy of the escrow agreement or closing documentation confirming investments and cash flows.

r: The "r" highlights derivative, hybrid, and certain other obligations that Standard & Poor's believes may experience high volatility or high variability in expected returns as a result of noncredit risks. Examples of such obligations are securities with principal or interest return indexed to equities, commodities, or currencies; certain swaps and options; and interest-only and principal-only mortgage securities. The absence of an "r" symbol should not be taken as an indication that an obligation will exhibit no volatility or variability in total return.

N.R. Not rated.

Debt obligations of issuers outside the United States and its territories are rated on the same basis as domestic corporate and municipal issues. The ratings measure the creditworthiness of the obligor but do not take into account currency exchange and related uncertainties.

''

Bond Investment Quality Standards

Under present commercial bank regulations issued by the Comptroller of the Currency, bonds rated in the top four categories ("AAA", "AA", "A", and "BBB", commonly known as investment-grade ratings) generally are regarded as eligible for bank investment. Also, the laws of various states governing legal investments impose certain rating or other standards for obligations eligible for investment by savings banks, trust companies, insurance companies, and fiduciaries in general

SHORT-TERM ISSUE CREDIT RATINGS

Short-term ratings are generally assigned to those obligations considered short-term in the relevant market. In the U.S., for example, that means obligations with an original maturity of no more than 365 days-including commercial paper.

A-1: A short-term obligation rated "A-1" is rated in the highest category by Standard & Poor's. The obligor's capacity to meet its financial commitment on the obligation is strong. Within this category, certain obligations are designated with a plus sign (+). This indicates that the obligor's capacity to meet its financial commitment on these obligations is extremely strong.

A-2: A short-term obligation rated "A-2" is somewhat more susceptible to the adverse effects of changes in circumstances and economic conditions than obligations in higher rating categories. However, the obligor's capacity to meet its financial commitment on the obligation is satisfactory.

A-3: A short-term obligation rated "A-3" exhibits adequate protection parameters. However, adverse economic conditions or changing circumstances are more likely to lead to a weakened capacity of the obligor to meet its financial commitment on the obligation.

B: A short-term obligation rated "B" is regarded as having significant speculative characteristics. The obligor currently has the capacity to meet its financial commitment on the obligation; however, it faces major ongoing uncertainties which could lead to the obligor's inadequate capacity to meet its financial commitment on the obligation.

C: A short-term obligation rated "C" is currently vulnerable to nonpayment and is dependent upon favorable business, financial, and economic conditions for the obligor to meet its financial commitment on the obligation.

D: A short-term obligation rated "D" is in payment default. The "D" rating category is used when payments on an obligation are not made on the date due even if the applicable grace period has not expired, unless Standard & Poor's believes that such payments will be made during such grace period. The "D" rating also will be used upon the filing of a bankruptcy petition or the taking of a similar action if payments on an obligation are jeopardized.

NOTES:
A Standard & Poor's note rating reflects the liquidity factors and market access risks unique to notes. Notes due in three years or less will likely receive a note rating. Notes maturing beyond three years will most likely receive a long-term debt rating. The following criteria will be used in making that assessment:

  • Amortization schedule-the larger the final maturity relative to other maturities, the more likely it will be treated as a note; and
  • Source of payment-the more dependent the issue is on the market for its refinancing, the more likely it will be treated as a note.

SP-1: Strong capacity to pay principal and interest. An issue with a very strong capacity to pay debt service is given a (+) designation.

SP-2: Satisfactory capacity to pay principal and interest, with some vulnerability to adverse financial and economic changes over the term of the notes.

SP-3: Speculative capacity to pay principal and interest.

Fitch, Inc.
International credit ratings assess the capacity to meet foreign currency or local currency commitments. Both "foreign currency" and "local currency" ratings are internationally comparable assessments. The local currency rating measures the probability of payment within the relevant sovereign state's currency and jurisdiction and therefore, unlike the foreign currency rating, does not take account of the possibility of foreign exchange controls limiting transfer into foreign currency.

INTERNATIONAL LONG-TERM CREDIT RATINGS
The following ratings scale applies to foreign currency and local currency ratings.

Investment-Grade:

AAA: Highest Credit Quality. "AAA" ratings denote the lowest expectation of credit risk. They are assigned only in the case of exceptionally strong capacity for timely payment of financial commitments. This capacity is highly unlikely to be adversely affected by foreseeable events.

AA: Very High Credit Quality. "AA" ratings denote a very low expectation of credit risk. They indicate a very strong capacity for timely payment of financial commitments. This capacity is not significantly vulnerable to foreseeable events.

A: High Credit Quality. "A" ratings denote a low expectation of credit risk. The capacity for timely payment of financial commitments is considered strong. This capacity may, nevertheless, be more vulnerable to changes in circumstances or in economic conditions than is the case for higher ratings.

BBB: Good Credit Quality. "BBB" ratings indicate that there is currently a low expectation of credit risk. The capacity for timely payment of financial commitments is considered adequate, but adverse changes in circumstances and in economic conditions are more likely to impair this capacity. This is the lowest investment-grade category.


Speculative Grade:

BB: Speculative. "BB" ratings indicate that there is a possibility of credit risk developing, particularly as the result of adverse economic change over time. However, business or financial alternatives may be available to allow financial commitments to be met. Securities rated in this category are not investment-grade.

B: Highly Speculative. "B" ratings indicate that significant credit risk is present, but a limited margin of safety remains. Financial commitments are currently being met. However, capacity for continued payment is contingent upon a sustained, favorable business and economic environment.

CCC, CC, and C: High Default Risk. Default is a real possibility. Capacity for meeting financial commitments is solely reliant upon sustained, favorable business or economic developments. A "CC" rating indicates that default of some kind appears probable. "C" ratings signal imminent default.

DDD, DD, and D: Default. The ratings of obligations in this category are based on their prospects for achieving partial or full recovery in a reorganization or liquidation of the obligor. While expected recovery values are highly speculative and cannot be estimated with any precision, the following serve as general guidelines. "DDD" obligations have the highest potential for recovery, around 90%-100% of outstanding amounts and accrued interest. "DD" indicates potential recoveries in the range of 50%-90%, and "D" the lowest recovery potential, i.e., below 50%.

Entities rated in this category have defaulted on some or all of their obligations. Entities rated "DDD" have the highest prospect for resumption of performance or continued operation with or without a formal reorganization process. Entities rated "DD" and "D" are generally undergoing a formal reorganization or liquidation process; those rated "DD" are likely to satisfy a higher portion of their outstanding obligations, while entities rated "D" have a poor prospect for repaying all obligations.

Plus (+) and minus (-) signs may be appended to a rating symbol to denote relative status within the major rating categories. Plus and minus signs are not added to the "AAA" category or to categories below "CCC," nor to short-term ratings other than "F1" (see below).

INTERNATIONAL SHORT-TERM CREDIT RATINGS
The following ratings scale applies to foreign currency and local currency ratings. A short-term rating has a time horizon of less than 12 months for most obligations, or up to three years for U.S. public finance securities, and thus places greater emphasis on the liquidity necessary to meet financial commitments in a timely manner.

F1: Highest credit quality. Strongest capacity for timely payment of financial commitments. May have an added "+" to denote any exceptionally strong credit feature.

F2: Good credit quality. A satisfactory capacity for timely payment of financial commitments, but the margin of safety is not as great as in the case of higher ratings.

F3: Fair credit quality. Capacity for timely payment of financial commitments is adequate. However, near-term adverse changes could result in a reduction to non-investment-grade.

B: Speculative. Minimal capacity for timely payment of financial commitments, plus vulnerability to near-term adverse changes in financial and economic conditions.

C: High default risk. Default is a real possibility. Capacity for meeting financial commitments is solely reliant upon a sustained, favorable business and economic environment.

D: Default. Denotes actual or imminent payment default.

GRAPHIC 4 pr1004img000.jpg GRAPHIC begin 644 pr1004img000.jpg M_]C_X``02D9)1@`!`@```0`!``#_VP!#``@&!@<&!0@'!P<)"0@*#!0-#`L+ M#!D2$P\4'1H?'AT:'!P@)"XG("(L(QP<*#7J#A(6&AXB)BI*3E)66EYB9FJ*CI*6FIZBIJK*SM+6VM[BYNL+#Q,7& MQ\C)RM+3U-76U]C9VN'BX^3EYN?HZ>KQ\O/T]?;W^/GZ_\0`'P$``P$!`0$! M`0$!`0````````$"`P0%!@<("0H+_\0`M1$``@$"!`0#!`<%!`0``0)W``$" M`Q$$!2$Q!A)!40=A<1,B,H$(%$*1H;'!"2,S4O`58G+1"A8D-.$E\1<8&1HF M)R@I*C4V-S@Y.D-$149'2$E*4U155E=865IC9&5F9VAI:G-T=79W>'EZ@H.$ MA8:'B(F*DI.4E9:7F)F:HJ.DI::GJ*FJLK.TM;:WN+FZPL/$Q<;'R,G*TM/4 MU=;7V-G:XN/DY>;GZ.GJ\O/T]?;W^/GZ_]H`#`,!``(1`Q$`/P#W^BBL[6=> MTOP]9-=ZK?06L(!QYC@%R!G"CJQXZ#F@"IXK\46'A/0Y=2OB&(^6*`,`TSGH MHSU]3Z`$]JX#5O%/BC5I)=.@DM=,-Y;H]D4F_=WJ'&X077:8DX4;.!R>Q#M? MB\3^.IK/7M#TW[)8Z=')Y=IJJE'U#`E;NWN5 M9]4T^3&3YHX#Q``G=U.[K@5Z/H^M:=KVG1W^EW<5U;OCYHV!VD@':P_A8`C( M/(S6+IGA6:.XAN=2NA)>6 M/4>(2)X>\02"+RU(V6]\QX(7@*K*,<9Y]@*`/2****`"BBB@`HHHH`****`" MBBB@`HH)`ZFB@`HHHH`****`"BBB@`HHHH`****`"BBB@`HHHZT`%%(2%&20 M/K2T`8'B_P`2)X9T)[I8VFO9F%O96ZH6,T[`[%P.<9ZXYP#7-^$_!MGO1G;,DKK+#8R$B3RT7D*RDCZ9X`S6=XJGOI?B&\"PN]Y]D$.FJ^##: M1MDR7Y)X#(?EV\$@#GFI_#.LVFG+:31W!31&F^PP3>2?.UJ_?`><]3@E6Y/4 MY)(`%`'IMKOB;QU9^' MM0@T]+::^N_DFNHH$6![>22-7:&0@M&2,E3@D9'3@ MXK'\:Q:1+X1U$:W(D-BL+,9CC=&P!VLF?XP<;>^<5S6G?$#4;5-1_M?26N-. MTF=[2[UFSD789$QN8PMAE&""=NX`Y`SBFWRW/B<#Q%J>G2RZ+9_/I6DCYCJ$ MI(\J=\?=#;@H1A\N2S$#B@##T#XDZ_I5AITGB6VAELYHMD,,,;G49(U7(N70 ML08R%.3P2>1Q7KEG=P7]E!>6TBRV\\:RQ2+T96&01]0:\9U"TNWGU2&[N]FJ M7,)N=;U`_O%T>Q(W?9(R"=S?>^[C([=Z[3X6:A]I\+-:>=.ZV!,G('H<#/KEEY M&2:Q-=/BCX67=GK)\076N:--*EO=07SL\@)R24R<#Y5.#GJ1D&K,MW#X>_:& M>2_DVIJ]BD5NQZ!CM4#\6B([=15_XX74(LT@3]TV,')XSR.,YIUAXT\-ZI:75U9:Q:S16D;2 MSX;#1HHR6*GG;[XQ7F$6A0M\4/!6DZO913&#PW"DT$RAU\Q%E'(Z'!'O3?$^ MGV6F?$77+?1;>"W@?PO=/=Q0(%524?L..<1_G0!Z2_Q#\(1FV#>(+$?:%#)^ M\Z`]"W]S_@6,5K7^N:5IFG+J%]J%M;V;@%)I)0%?(R`I_B)`)`'7M7DNC:!H M+_`.?4;K3K(W9M+B47+Q+YGFAF"?-C/4**Y;5+W59#\.-.FC6>(6\4D%K.^( M9G\UEC#>VP(/HQ]30![MI_C+PYJEC^*K2? M$/PA%;V\S>(+'9/]P"3+=<9*CE1D$<@=*XA?"6LVUSXL\3:K8:9IRW.B7%O] MELFW;CM!W'@#^'\<)!Y93?$=V[IMQSFNVTSQIX;UG46T_3M9M+ MFZ&?W:/]['7:>C?AFO%VC34/"WPOM[M?/AEU!X71^0R&=5VGVQQ6QXVTVQTC MXR>#$TRT@LD=XMR6T8C!_>D=%`[$CZ4`>H:IXU\-:)>K9ZCK-K!7M[<3QW-Q=S!)H-_91M/`;)'/4>PJ]XA\.7OA7P1X0TO4+M;F= M-85SM)*Q[LG8">H&3Z=:`/6KKQCXLA;Q-LM`'K^E^(-(UO3WO]-U""XM8R0\J-PA`R0V>AP0>:S[7QYX5OM3&G6V MO6,ETS!402<.Q.`%;HQ)Z`$YKQ47-QI>D?$^UT]?+MDOE@$48PL<1GD0@`=! MMPOTK:T_PEK_`(F\+>&(;/2-&TRVMC!<+J<$O[]@J\DA5!W$X8C/WEZ\9H`] M2E\<^%H)[V";7;*.6R)6=&DPRL."`.YR",#)SQUK@_$^JZIXA^)>AZ/HGB.Z ML-+O],6Z66U_B),IWGB/ M7_$\UZ]UO4FK'Q.8/\5/`N M"#_I,)X_Z^$Y_G0!Z+<^-_#%G>W=G?2;^&[C0X?RSRI[9!Y'XUYM#H^FZG^T%J\-_86]S$FG+,L">37(:9/-I'B#XFQZ:IA2.VN52.$[!&!-M!4#IM5FQCI0!Z?XU\=>&H_ M#VM:6FNVW]H/93QQQPR%CYFQ@%W+P&SQC.:7P'K-AI'PKT>]U6^AM8!&P\V= MPN3O?@9ZG@\#DUS?A_1]`_X49?WEK:VD]RVFW+SSM$"ZS!&R,GD;3C'X$=:@ M'AC4O%'P/\/0:4(9+NTE^U)#+C$F#(-O/RY^;^+@\@]:`.OU-K#XA:4LFAZG M%=6\)='"$C#G:5)!QC`!'T8XKKK*)[>Q@ADP'1`"`VX#V!P,@>N!7#?#3Q7! MJTNI:++HT&E:M8./MD=NJA)7'R,YV@`'*XQD\`8)%>A8H`\Y^*'A\RPP:[:V M5Y=.FVVU*&VEVF:Q!:1D(R#@N%&1R`Q[5R^B:G`KL!M)!^8]#C[K>W5Q/BWPC;);?V[H-G;VNMV$YOT>&$*UT5!+1 M,1R0X)'UH`W?#?AVV\.:>T$1,MSLGVEE8QIN7^'.3AOEZUT?AK7[7Q/X?L]6M"`D\8+Q MYR8G_B0].0^/F;\6R?QK5KS_1O$Q\-S6&E:M]1?['UG! MVRJV!'#)@<.%.=YP&`R<'-6]5\J2?,LLCYR%!R,'`)'H%!Z_P M9H,^AZ,S7\IEU6^E-Y?R$\&9P-RKC@*N`!CCC/>LO0?`6(XK8>B*.N"6YXZ]`>:[:@##\2^$M'\6V:6VKVOFK&Q:-T+3K:Y MANKR"S5GNVC8/*X4$@1MP,^N?:LRZ\,M(MM>^.>CZ=#/$UQ91RR7=QIMSY]W]\1Z)I^H6ME=ZC:PWEV!Y M$;.-S@G`Q[$Y`I=7U*ZL[BSM;.RAN9;KS`!-.8E&U=V,A6Z]*`/,/A]\-M#\ M0>"=*OM2DOIHI"\CV7VDB`N&9=VT<@X&.#7HNO\`@S0_$FDP:;J-IF"W_P"/ M?RG*&'Y=HVX[8['(X''%2:3KRZA::=<2+!:BXM))Y(&DW-&4*AL'`!52Q!;C ML>]4[CQOHT]A)+I.JV5S+%-$LB>8"51I41FQP<`/][I0!5T7X::%H=M>Q0-> MSR7=J]F\]Q.7986'**.`!T[=JOZ5X)TC1O"MYX=M!.+&[6192TF7/F+M;!QQ MQ[4LOCOPQ%IBZD=8MFLFNA9^PVHFC?`19Z'%;:);A;DQZ-,9[0&7G>7#Y;U MY'2K>J^#=)UK7]/UN\25KS3]I@*2%5!#;AD=^:AM_&VG3^)M7T8_(-,@\Z2X M))4[0#(,8_AW)GG^+VIVE^-]&OX+3S[RWMKNYM!>K:F7UN"GF,3DD@YQGOC%:EUX'T6[TO2M.DBF%KI MDJS6Z"4YW#NQ/)SSGGO6Q!JMC=)9O!GQ:I;F[M&=9XF.TIL&6//8=STH`1Y`8O\H3Z5 M%8^$-*T[Q3>^(X$E_M&\0QRLTA*[3M.`.WW%JYI&OZ5KT4DNE7\%VD3;7,39 MP<9_+T/0UEVWC73P-5?4Y(=/AL=2?3UDEER)2L2RD]!CY2W'/W>M`#['P1HE MA+KCI;O(-;9S?+)(2'#%B0/0?.U8^G_"3PQIFJQ7]LM\HBF6>.W-VQB#J05) M'5L$#J3[UT^G>)-'U>6*+3]1M[F26%ID6-LDHK!6/X$@'ZU%+XLT&&[L[675 M;5+B\(%O&7YDRQ48^I&!ZF@".R\):78>*KWQ)"LW]HWD?E2LTA*[?EX`[?<6 MGW'A?3;KQ9;>)94E.HVT'D1D/A0OS]1Z_.U5[SQUX9L6N4N-9M4>VF6"8;B2 MDA)`4X]P?I@YQ@UM6-]:ZE917EE.D]M*,QR(2%9!*A1RK(X!`88]F/!R.>EF#7344`>>K\%O!HNWF:TNFB8<6YNG\M3V/'S9^I-3_\` M"IO#?]B1Z4#?K%%)V`!VGH.%';^9KNZ*`,'PQX/TCPE;2Q:7"X: M8@S2RR%WD([DG\>F!R:WJ**`"BBB@#S34++5O`NN:KJ=C!-=^&-2+7%]'%(! M+8RL1YDZ@@EAM!.!^@49R9]4>2;3]575X1<2*+?2_$JQ_N[L,Q(L[F(#Y"3R M6(`&,C:I?#[0K^_GN=MS;"]<&^AMYBD5W@[OG7IDDO%2Z#X;TCPS9R6FCV2VL$DAE=0S-EL`9RQ)Z`#' M2M7I0`4444`> M+-9O8K8/;7/APV$3EU&Z8O(=F"<]&7GIS7:T4`>9Z5X;U6PM[?3K_0;F_M+R MRM([EX=2$(MV2%(GC=`XWJ-A;5VQGC'F.VN]8\)74(MS;W\]J6BB=U8PS8 MW)D@X)5P.AQQZ5LXI:`//;CPMJ+:#I*Q:?&;Z_ED36U,BC9#=?/=`'/.&"@; M?3BH-9TKQ7>>)M/C&F"32;'5X+F!HIX4C6!4V'Y3\Y<%V)YQA0`,UZ33)(DF MB>.1`Z.I5E89!!Z@T`<)X'TJ9_$&JZH]T9;*REN--TU`FU5B\WS'QZ@,%C!] M(L]ZL7VDZQ)/XDT^'3P\&H2B]ANVF41LRQQ+Y++G<-QBP3C&&]L'LK>WBM;> M.W@C6.&)0D<:`!54#```Z`"I*`.0TBQU74/&0\1ZCI?]EB+338B!YDE>1FD5 MRV4)&P;<#/)R3@5BR^%-8>_,OV,%/^$P75,^8G_'L(`N_K_>&,=?:O2<44`> M92^$_$0MM8>P"VE[)8V?KV.'P>3Y8'>KR^&I]+U&32TT6ZU M'1;E;=!/'J/E"W5$2+8\9<;@`F[<,DYQBN_HH`\ZDTCQ(USJAM-/E@TM'CNH M=/GNHW,]TMRLS-&^3L1E7A6(`+?='-=Y833W%C%+=6C6DSC+0,ZN8_8E>"?I 8D>YJS10`4444`%%%%`!1110`4444`?_9 ` end GRAPHIC 5 pr1004img001.jpg GRAPHIC begin 644 pr1004img001.jpg M_]C_X``02D9)1@`!`0```0`!``#_VP!#``@&!@<&!0@'!P<)"0@*#!0-#`L+ M#!D2$P\4'1H?'AT:'!P@)"XG("(L(QP<*#7J#A(6&AXB)BI*3E)66EYB9FJ*CI*6FIZBIJK*SM+6VM[BYNL+#Q,7& MQ\C)RM+3U-76U]C9VN'BX^3EYN?HZ>KQ\O/T]?;W^/GZ_\0`'P$``P$!`0$! M`0$!`0````````$"`P0%!@<("0H+_\0`M1$``@$"!`0#!`<%!`0``0)W``$" M`Q$$!2$Q!A)!40=A<1,B,H$(%$*1H;'!"2,S4O`58G+1"A8D-.$E\1<8&1HF M)R@I*C4V-S@Y.D-$149'2$E*4U155E=865IC9&5F9VAI:G-T=79W>'EZ@H.$ MA8:'B(F*DI.4E9:7F)F:HJ.DI::GJ*FJLK.TM;:WN+FZPL/$Q<;'R,G*TM/4 MU=;7V-G:XN/DY>;GZ.GJ\O/T]?;W^/GZ_]H`#`,!``(1`Q$`/P#=_P"%'>"_ M^>%[_P"!)_PH_P"%'>"_^>%[_P"!)_PKTBJ6K7,MIISRPE0^]%W.0`H9PI.3 MTP"3G!_&@#A/^%'>"_\`GA>_^!)_PH_X4=X+_P">%[_X$G_"M^/7-1ELY;F/ MRR(]K.KI@J"SKMP.^%4XSGYO2NB@N/M%O'-$A*.H89(!Z'_ZWYT`>??\*.\% M_P#/"]_\"3_A1_PH[P7_`,\+W_P)/^%>BEGYQ'G_`(%]?_K?G06?G$>?^!?7 M_P"M^=`'G7_"CO!?_/"]_P#`D_X4?\*.\%_\\+W_`,"3_A7HI9^<1Y_X%]?_ M`*WYT%GYQ'G_`(%]?_K?G0!YU_PH[P7_`,\+W_P)/^%'_"CO!?\`SPO?_`D_ MX5Z*6?G$>?\`@7U_^M^=!9^<1Y_X%]?_`*WYT`>=?\*.\%_\\+W_`,"3_A1_ MPH[P7_SPO?\`P)/^%>BEGYQ'G_@7U_\`K?G06?G$>?\`@7U_^M^=`'G7_"CO M!?\`SPO?_`D_X4?\*.\%_P#/"]_\"3_A7HI9^<1Y_P"!?7_ZWYT%GYQ'G_@7 MU_\`K?G0!YU_PH[P7_SPO?\`P)/^%'_"CO!?_/"]_P#`D_X5Z*6?G$>?^!?7 M_P"M^=!9^<1Y_P"!?7_ZWYT`>=?\*.\%_P#/"]_\"3_A1_PH[P7_`,\+W_P) M/^%>BEGYQ'G_`(%]?_K?G06?G$>?^!?7_P"M^=`'G7_"CO!?_/"]_P#`D_X4 M?\*.\%_\\+W_`,"3_A7HI9^<1Y_X%]?_`*WYT%GYQ'G_`(%]?_K?G0!YU_PH M[P7_`,\+W_P)/^%'_"CO!?\`SPO?_`D_X5Z*6?G$>?\`@7U_^M^=!9^<1Y_X M%]?_`*WYT`>=?\*.\%_\\+W_`,"3_A1_PH[P7_SPO?\`P)/^%>BEGYQ'G_@7 MU_\`K?G06?G$>?\`@7U_^M^=`'G7_"CO!?\`SPO?_`D_X4?\*.\%_P#/"]_\ M"3_A7HI9^<1Y_P"!?7_ZWYT%GYQ'G_@7U_\`K?G0!YU_PH[P7_SPO?\`P)/^ M%'_"CO!?_/"]_P#`D_X5Z*6?G$>?^!?7_P"M^=!9^<1Y_P"!?7_ZWYT`>=?\ M*.\%_P#/"]_\"3_A1_PH[P7_`,\+W_P)/^%>BEGYQ'G_`(%]?_K?G06?G$>? M^!?7_P"M^=`'G7_"CO!?_/"]_P#`D_X4?\*.\%_\\+W_`,"3_A7HI9^<1Y_X M%]?_`*WYT%GYQ'G_`(%]?_K?G0!YU_PH[P7_`,\+W_P)/^%'_"CO!?\`SPO? M_`D_X5Z*6?G$>?\`@7U_^M^=!9^<1Y_X%]?_`*WYT`>=?\*.\%_\\+W_`,"3 M_A1_PH[P7_SPO?\`P)/^%>BEGYQ'G_@7U_\`K?G06?G$>?\`@7U_^M^=`'G7 M_"CO!?\`SPO?_`D_X4?\*.\%_P#/"]_\"3_A7HI9^<1Y_P"!?7_ZWYT%GYQ' MG_@7U_\`K?G0!YU_PH[P7_SPO?\`P)/^%'_"CO!?_/"]_P#`D_X5Z*6?G$>? M^!?7_P"M^=!9^<1Y_P"!?7_ZWYT`>=?\*.\%_P#/"]_\"3_A1_PH[P7_`,\+ MW_P)/^%>BEGYQ'G_`(%]?_K?G06?G$>?^!?7_P"M^=`'G7_"CO!?_/"]_P#` MD_X4?\*.\%_\\+W_`,"3_A7HI9^<1Y_X%]?_`*WYT%GYQ'G_`(%]?_K?G0!Y MU_PH[P7_`,\+W_P)/^%'_"CO!?\`SPO?_`D_X5Z*6?G$>?\`@7U_^M^=!9^< M1Y_X%]?_`*WYT`>=?\*.\%_\\+W_`,"3_A1_PH[P7_SPO?\`P)/^%>BEGYQ' MG_@7U_\`K?G06?G$>?\`@7U_^M^=`'G7_"CO!?\`SPO?_`D_X4?\*.\%_P#/ M"]_\"3_A7HI9^<1Y_P"!?7_ZWYT%GYQ'G_@7U_\`K?G0!YU_PH[P7_SPO?\` MP)/^%'_"CO!?_/"]_P#`D_X5Z*6?G$>?^!?7_P"M^=!9^<1Y_P"!?7_ZWYT` M>=?\*.\%_P#/"]_\"3_A1_PH[P7_`,\+W_P)/^%>BEGYQ'G_`(%]?_K?G06? MG$>?^!?7_P"M^=`'G7_"CO!?_/"]_P#`D_X4?\*.\%_\\+W_`,"3_A7HI9^< M1Y_X%]?_`*WYT^@#S?\`X4=X+_YX7O\`X$G_``HKTBB@`HHJGJD%Q=:9<06S MA)9$V@DD<=QD="1D9[4`7**R-%L[NU:?E]`*U6 M5B>'*\=@/?\`S^%`#J*848Y_>L/P'O[>X_*@HQS^]8?@/?V]Q^5`#Z*848Y_ M>L/P'O[>X_*@HQS^]8?@/?V]Q^5`#Z*848Y_>L/P'O[>X_*@HQS^]8?@/?V] MQ^5`#Z*848Y_>L/P'O[>X_*@HQS^]8?@/?V]Q^5`#Z*848Y_>L/P'O[>X_*@ MHQS^]8?@/?V]Q^5`#Z*BD#JCL)#D`D`X'KWQ]/RKC-*\97][K.GV-U:1PQW: MEA<(VY6!$I0KD9P1$Q!/4`'OR`=Q17(W?B'5H=3FM8+>VG"WR6J!7(=MR[V` M&WJJ,C$]!@_C=T779[^X:SOX_L5^%R;<$/@Y;^(#'3;CGL?0T`=#13"C'/[U MA^`]_;W'Y4%&.?WK#\![^WN/RH`?13"C'/[UA^`]_;W'Y4%&.?WK#\![^WN/ MRH`?13"C'/[UA^`]_;W'Y4%&.?WK#\![^WN/RH`?13"C'/[UA^`]_;W'Y4%& M.?WK#\![^WN/RH`?13"C'/[UA^`]_;W'Y4%&.?WK#\![^WN/RH`?13"C'/[U MA^`]_;W'Y4%&.?WK#\![^WN/RH`?13"C'/[UA^`]_;W'Y4%&.?WK#\![^WN/ MRH`?13"C'/[UA^`]_;W'Y4%&.?WK#\![^WN/RH`?13"C'/[UA^`]_;W'Y4%& M.?WK#\![^WN/RH`?13"C'/[UA^`]_;W'Y4%&.?WK#\![^WN/RH`?13"C'/[U MA^`]_;W'Y4%&.?WK#\![^WN/RH`?13"C'/[UA^`]_;W'Y4%&.?WK#\![^WN/ MRH`?13"C'/[UA^`]_;W'Y4%&.?WK#\![^WN/RH`?13"C'/[UA^`]_;W'Y4%& M.?WK#\![^WN/RH`?17FUAXOU:;5-+1]0MIK.ZGE#21Q*#L55ZC)VD$LV.H7: M6YS2ZYXLUJUEU*33;ZVN((+A8UC"()`3'(P4`G+`L(ESU/S;1Z@'I%%C*,<_O6'X#W]OV[W5H\,:`"UOK:]W&VE$@7!)`.,'(R/49!& M1Z&K%4=/TU;"25PX;S.`JKM"C_^)_, MT&&(YS&ASU^4>_\`B?S-`#Z*888CG,:'/7Y1[_XG\S088CG,:'/7Y1[_`.)_ M,T`/HIAAB. M_P#B?S-!AB.T3?';3KAE:;P/;2E9/-4O=*V'X^89BZ\#GVK:\,?&6U\0>*[#3 MU\*Q6TUU(8A_!H`^NZ M*888CG,:'/7Y1[_XG\S088CG,:'/7Y1[_P")_,T`!FB$PA,B"4KN";AN(]<> ME-:YMT<(T\2N6V!2X!W8SCZXYQ7.:AX=FF\8VVMVS6^R*#8T4CX#L!*`,;"0 M/WI).>WW3UK"G^'UY+KKWSWUI-')??:'RK(VUC$6R.0QQ&R@<`!LY&,4`>A1 MRQR@&.17!`(*G/![_H:?7.Z/H,NDZA*$DM_[,='(@/S,)"YP=Q&<;2_^)_,USOB6>^M-0TC[$DC0 MRW`2XBB@#>8"Z#EMC;0`TC'[N1GD4`=+17F?B75_$<>J7XTM;@V;6ZR0LMED M1Y,.,[HR=QW7&>&X(X!!K?TZZU:#5(X-2@ENHKEF*NEL%$6[!"O@<%03ZYW- MR2,4`=;13##$ORCW_Q/YF@#)U[6I]'>Q$=J MDR7,DD;,TNW85A>0<8YSY9';%8][XUGM/"":N+*-KGS98I(&D*A#&KLPS@YX MC(].:P/'_P`3[+PCXA72;CPY'J!$2SB1I@N"V]3P4/8L,Y_B/K7''XTZ`;86 MQ\`61@``$7FQ[1@DCCRL=68_4GUH`]/'C*^%Q=@Z9`UO;2$-.EQE0I`\LG([ MG()Z`@BNLM;F*\MDG@??&V<'!'(.",'D'((P:\)C^.>D1>;Y?@BW3SG,DNVX M0;V((+']WR2">3ZFO4/`'B.T\7^&1J$&DQ:?$DS0"W4A@`!GC"C^\>,=SZT` M=913##$_FF$`O$+!%!_LZX. M5T4` M>T>&_C;XFUCQ/I6FW%II2P7=W%!(8X9`P5F`.,N>>:]]KXY\#@-X]\/JP!!U M&`$'O^\%?89AB.,-3T.\NHEBM?*BEB"ML+D1M M%-(V064%B80`,_Q=SBNV,,1SF-#GK\H]_P#$_F:^?;OX[:G'=3PG0-+<)(5R MP8YP3SU]S^9H`]BU;7+ZVU/R+$6]AN[0:I';QVMX(/(>)26+2(>#R<98'!]%8<\&O(C\>]5._N M?S-!^/FJGKH&EG\&]_?W/YF@#Z)HJO;B.XM8IFB3,B!B-OJ,G^9_,U8H`*** M*`"BBB@"E9:A]KN+B(Q;/*/!W9W#>Z>G'*'UZBGS7R6\S1R1SD8!4QP.X/XJ M"*EBMH8'D>*-5:0Y8COU/\R3]23W-2T`8>H^,-`TAHUU/45LFD!*"YC>,L!U MQN`S5+_A9/@S_H8K'_ONN3^+O@/7/&5YI4ND1PNMM'(LGF2A.25QC\C7FW_" MC_&G_/O9_P#@2*`/=?\`A9/@S_H8K'_ONK^G>+=#U=9&TR^^VK&0'-M$\@4G MIG:#BOGO_A1_C3_GWL__``)%>J_"+P7K'@VSU6+5XX4:YDC:/RY`_`#9S^8H M`[HZK#YB@0W>S!R?LDO!XQ_#]?RJOJ'B?2-)MQ<:C=-9PE@@DN89(U+O+/C[_P`B#:_]A&/_`-%R4`=5_P`+)\&?]#%8_P#?='_"R?!G_0Q6 M/_?=?(=%`'V-I_C;PYJUP;?3M5BO)@IN__'?\:^N:*`/DF/X9>-%D4GP]=X!!/W?\:^J?[4M_^>=W_P"`(/ M$WC(7^CZ/=W-J+6./?Y93Y@6R,-@]Q7"_P#"L?&O_0O7?_CO^-?7-%`'R-_P MK'QK_P!"]=_^._XU[E\)K*]\,^#6L-8L;NVNC=22;/L[O\I"X.5!'8UZ/10! M0&JP^8P,-WLP,'[)+R><_P`/T_.N=\6>)?$.GK:?\(SX?DU0N7\\2QO'Y>,; M<9QG.6_*NQHH`\F_X3+XDX(_X5_%@]?F/^-`\8_$E00OP_A`)+'#'J>IZUZS M10!QGA+Q+XCOC=+XE\.OI2QA/L_DQO)OZ[ONYQC"_G72'58?,4"&[VD')^R2 M\'C'\/UJ_10!DWWB72M+MCLO\A0!]'OJL(`V0W9.1G_`$27IGG^ M&LKQ7/\`VEX0UFQM+>[DN;BRFBB3[+(-S,A`&2N!R>]=)10!\C?\*Q\:_P#0 MO7?_`([_`(T?\*Q\:_\`0O7?_CO^-?7-%`'R]X4^'_BS3?%^C7UWH5W';6][ M#+*^T':JN"3@')X':OI*3581&Q2&[9P#M'V27D_]\U?HH`I?VI;_`//.[_\` M`.7_`.)KY:O/AKXREO;B1/#]V4>1F4X'()^M?65%`'R-_P`*Q\:_]"]=_P#C MO^-'_"L?&O\`T+UW_P"._P"-?7-%`&99ZA#%8V\;Q78=(U5A]DEX('^[5^"0 MRPI(5*EAG!!!'X'D5)10`4444`%4=5N);>S=HUE[?/$`6!W`8P0>N>3@X&35 MZCH,F@#(T6>^E>=;R1Y-@&&,>P9WN..!QM"'OU]ZU6,@/RJI&.[8]?;Z?YZJ M&5LX(..N#TI:`,?Q!'JL^D7L.GL(I&MI=DD4F)1)@[`N5QSP">V>.F:Q=%C\ M00^(M2-ZEX;6552)FFW(IQPR@Y`QSGCJ>"LTDVXR9R2.!QCY1^/ MJ#G;HH`83+SA$]OG/O[?3\SZ<\UXX\()XVT2/3+BX:V2.<3AXSDDA7`'(_VA M_D<]14-S;BY14:1U4,&8+C#C^ZV1R#WH`\33X'>'Y9XX(O%!>:56:.-7C+.` M2"0.I`(P?3GTYC;X*^&5E,7_``EJ>8)O(VF6,'S.?DQ_>Z<=>3Z<^AV7@NYT M[5[*]MKR`+:Q.B1&(A<(GM\Y]_;Z?F?3G&TG09M)U)WM[H+I[(P^R!];E M`#"9><(GM\Y]_;Z?F?3D)EYPB>WSGW]OI^9].7T4`,)EYPB>WSGW]OI^9].0 MF7G")[?.??V^GYGTY?10`PF7G")[?.??V^GYGTY"9><(GM\Y]_;Z?F?3E]%` M#"9><(GM\Y]_;Z?F?3D)EYPB>WSGW]OI^9].7T4`,)EYPB>WSGW]OI^9].0F M7G")[?.??V^GYGTY?10`PF7G")[?.??V^GYGTY"9><(GM\Y]_;Z?F?3E]%`# M"9><(GM\Y]_;Z?F?3D)EYPB>WSGW]OI^9].7T4`,)EYPB>WSGW]OI^9].0F7 MG")[?.??V^GYGTY?10`PF7G")[?.??V^GYGTY"9><(GM\Y]_;Z?F?3E]%`#" M9><(GM\Y]_;Z?F?3D)EYPB>WSGW]OI^9].7T4`,)EYPB>WSGW]OI^9].0F7G M")[?.??V^GYGTY?10`PF7G")[?.??V^GYGTY"9><(GM\Y]_;Z?F?3E]%`#"9 M><(GM\Y]_;Z?F?3D)EYPB>WSGW]OI^9].7T4`>:_'`O_`,*XFRJ@?:HNC>Y] MOI7S)7T[\H/?D9'![U>J"\NXK&V:XF.$4@?B2`!SQU(ZT` M4-&TV?3VF,YB.\``QD\_.[9.1Q]\#OTK49"QX=EX[8]_\?TJO:7\%ZTBQ;\I MUW+C(R1G\U8?A]*LEE'5@/J:`&F,G/[QQ^7O[>_Z"@QDY_>./R]_;W_04N]1 M_$/S_P`^AHWJ/XA^?^?0T`(8R<_O''Y>_M[_`*"@QDY_>./R]_;W_04N]1_$ M/S_SZ&C>H_B'Y_Y]#0`AC)S^\_P"@H,9.?WCC\O?V]_T%+O4?Q#\_\^AH MWJ/XA^?^?0T`(8R<_O''Y>_M[_H*#&3G]XX_+W]O?]!2[U'\0_/_`#Z&C>H_ MB'Y_Y]#0`AC)S^\_Z"@QDY_>./R]_;W_04N]1_$/S_P`^AHWJ/XA^?^?0 MT`(8R<_O''Y>_M[_`*"@QDY_>./R]_;W_04N]1_$/S_SZ&C>H_B'Y_Y]#0`A MC)S^\_P"@H,9.?WCC\O?V]_T%+O4?Q#\_\^AHWJ/XA^?^?0T`(8R<_O'' MY>_M[_H*#&3G]XX_+W]O?]!2[U'\0_/_`#Z&C>H_B'Y_Y]#0`AC)S^\_Z M"@QDY_>./R]_;W_04N]1_$/S_P`^AHWJ/XA^?^?0T`(8R<_O''Y>_M[_`*"@ MQDY_>./R]_;W_04N]1_$/S_SZ&C>H_B'Y_Y]#0`AC)S^\_P"@H,9.?WCC M\O?V]_T%+O4?Q#\_\^AHWJ/XA^?^?0T`(8R<_O''Y>_M[_H*#&3G]XX_+W]O M?]!2[U'\0_/_`#Z&C>H_B'Y_Y]#0`AC)S^\"KW5;/3CX/M8+BYEEB(>T@(C9`20<9SZ<=P.M>E/Y;J5?:5[@_P"? M8UAP>$/#]K)%)#;.DD.=K_:I=PRI7).[)(&0"?N]L4`1)9)%.TNZ;L,V#R?F8Y/4]>E3C2]/74?[0$0^ MU#/[PN?<@R!Q0!<,9.?WCC\O?V]_T%!C)S^\./R]_;W_04&,G/[QQ^7O[>_Z"EWJ/XA^?\` MGT-&]1_$/S_SZ&@!#&3G]XX_+W]O?]!08R<_O''Y>_M[_H*7>H_B'Y_Y]#1O M4?Q#\_\`/H:`$,9.?WCC\O?V]_T%!C)S^\./R]_;W_04&,G/[QQ^7O[>_Z"EWJ/XA^?^?0T;U'\0_/_ M`#Z&@!#&3G]XX_+W]O?]!3Z;O4?Q#\_\^AIU`!1110`56O+&&]0"1<.I5DD" M@LI#!AC(/<"K-%`%'3=*M]+5E@:0J5"@.0=H!8X''JS=?6KI53U4'ZBEHH`; ML4_PC\O\^IJK)?V$7,TKW:XD.T#RCE8RI M4J#NQ_$3G'7UXP`78+VQNG"0S1.[*7"@\E1C)QZ?,.??WJSL4_PC\O\`/J:S MM.TC[`\G2M.@!NQ3_``C\O\^IHV*?X1^7^?4T MZB@"K/>6=M)Y<#J<''>HUU/3I'55N(F+D`8YSDX!^F3C M/3)QUJ._TV6]NHY?M"*D6UHT:,MM=6W;OO#K@#Z9P1DU3LO#LEDT"K>*\,6S M*-#][:S.,D-UW,3Z<#@XH`W-BG^$?E_GU-&Q3_"/R_SZFG44`-V*?X1^7^?4 MU%//;6Q03NB>8=JY[D\?U_7WJ>J.I6#:A''$9@D(;,B%,[_3G(QCKWY`H`:= M6TS9N-Q'@KNZ=L[?3UR*O!4900%(/.1W_P`YK"_X1V7YR;U"TF2_[D@%CD'H MV0-IQC/7G/:MR)/*A2,L6VJ%W'J<=Z`%V*?X1^7^?4T;%/\`"/R_SZFG44`0 MSR06\32S;508!.,\DX'YD_K4"ZCI\D@19XF9C@8YSSC\LG&>F3CK4M];RW5F M\,,WDLV/GVD\9&1P0>1D9!!&:LPRP7"N8L,%_ MI0!;V*?X1^7^?4T;%/\`"/R_SZFG44`-V*?X1^7^?4U3;4].4L&N(@06!S_L M]?Y]?>KU8-SX=DNUF$MZN9BV]A"1U&>>M3[%/\(_+_/J:S--T;^S[VXN?/#M.S/(`FW+-MSW/`V\#MN/ M)S6K0`W8I_A'Y?Y]31L4_P`(_+_/J:=10!3FO[""5HY9HU=?O`CVR?R!R?0' M)X-"7]C+(D:2(S2,57"G!.-V,X],GW!S5._T62_N)9'NE`(*Q@Q$F-2A1AG= MCG<3G'IG(`J73](^PR(QG\P("%&S'\*(#U/($?7_`&CTH`T=BG^$?E_GU-&Q M3_"/R_SZFG44`-V*?X1^7^?4U!<7=G;.$GD1&8%L$=L$_P#Q7UYJS6=J.FR7 M\T;?:%1(QE4,9.'[-G(^F/0GUR`!_P#:>G,0/M$1R5'3KN!(_3)_G5S8I_A' MY?Y]37/GPL6\O-Z/W;[U_=="1\Q^]USR.PZ$&NBH`;L4_P`(_+_/J:-BG^$? ME_GU-.HH`@N)K:V56G9$#MM!(ZGD_P`LG\ZK_P!JZ:?^7B,YZ`#).>@^IYP. M_;-2WUK)=QQ(DJHBR!I%9"PD49^7@C'.#^&#D$UCIX7*,&-XK$&(\Q$]2U!=PRSVLD4, MWDR,,"3;G'//<=O>@"%-2TZ0@+1(9(3./*;:%5(]NT!G8CJ>[G'H`.O6M#3[1K.V,;RB61F+,P M7:"3Z#)QQCO0!8V*?X1^7^?4TZBB@`HHHH`^-_\`A-?%?_0S:S_X'R__`!5' M_":^*_\`H9M9_P#`^7_XJBB@`_X37Q7_`-#-K/\`X'R__%4?\)KXK_Z&;6?_ M``/E_P#BJ**`#_A-?%?_`$,VL_\`@?+_`/%4?\)KXK_Z&;6?_`^7_P"*HHH` M/^$U\5_]#-K/_@?+_P#%4?\`":^*_P#H9M9_\#Y?_BJ**`#_`(37Q7_T,VL_ M^!\O_P`51_PFOBO_`*&;6?\`P/E_^*HHH`/^$U\5_P#0S:S_`.!\O_Q5'_": M^*_^AFUG_P`#Y?\`XJBB@`_X37Q7_P!#-K/_`('R_P#Q5'_":^*_^AFUG_P/ ME_\`BJ**`#_A-?%?_0S:S_X'R_\`Q5'_``FOBO\`Z&;6?_`^7_XJBB@`_P"$ MU\5_]#-K/_@?+_\`%4?\)KXK_P"AFUG_`,#Y?_BJ**`#_A-?%?\`T,VL_P#@ M?+_\51_PFOBO_H9M9_\``^7_`.*HHH`/^$U\5_\`0S:S_P"!\O\`\51_PFOB MO_H9M9_\#Y?_`(JBB@`_X37Q7_T,VL_^!\O_`,51_P`)KXK_`.AFUG_P/E_^ M*HHH`/\`A-?%?_0S:S_X'R__`!5'_":^*_\`H9M9_P#`^7_XJBB@`_X37Q7_ M`-#-K/\`X'R__%4?\)KXK_Z&;6?_``/E_P#BJ**`#_A-?%?_`$,VL_\`@?+_ M`/%4?\)KXK_Z&;6?_`^7_P"*HHH`/^$U\5_]#-K/_@?+_P#%4?\`":^*_P#H M9M9_\#Y?_BJ**`#_`(37Q7_T,VL_^!\O_P`51_PFOBO_`*&;6?\`P/E_^*HH MH`/^$U\5_P#0S:S_`.!\O_Q5'_":^*_^AFUG_P`#Y?\`XJBB@`_X37Q7_P!# M-K/_`('R_P#Q5'_":^*_^AFUG_P/E_\`BJ**`#_A-?%?_0S:S_X'R_\`Q5'_ M``FOBO\`Z&;6?_`^7_XJBB@`_P"$U\5_]#-K/_@?+_\`%4?\)KXK_P"AFUG_ M`,#Y?_BJ**`#_A-?%?\`T,VL_P#@?+_\51_PFOBO_H9M9_\``^7_`.*HHH`/ M^$U\5_\`0S:S_P"!\O\`\51_PFOBO_H9M9_\#Y?_`(JBB@`_X37Q7_T,VL_^ M!\O_`,51_P`)KXK_`.AFUG_P/E_^*HHH`/\`A-?%?_0S:S_X'R__`!5'_":^ M*_\`H9M9_P#`^7_XJBB@`_X37Q7_`-#-K/\`X'R__%4?\)KXK_Z&;6?_``/E M_P#BJ**`#_A-?%?_`$,VL_\`@?+_`/%4?\)KXK_Z&;6?_`^7_P"*HHH`/^$U M\5_]#-K/_@?+_P#%4?\`":^*_P#H9M9_\#Y?_BJ**`#_`(37Q7_T,VL_^!\O )_P`51110!__9 ` end GRAPHIC 6 pr1004img002.jpg GRAPHIC begin 644 pr1004img002.jpg M_]C_X``02D9)1@`!`@```0`!``#_VP!#``@&!@<&!0@'!P<)"0@*#!0-#`L+ M#!D2$P\4'1H?'AT:'!P@)"XG("(L(QP<*#7J#A(6&AXB)BI*3E)66EYB9FJ*CI*6FIZBIJK*SM+6VM[BYNL+#Q,7& MQ\C)RM+3U-76U]C9VN'BX^3EYN?HZ>KQ\O/T]?;W^/GZ_\0`'P$``P$!`0$! M`0$!`0````````$"`P0%!@<("0H+_\0`M1$``@$"!`0#!`<%!`0``0)W``$" M`Q$$!2$Q!A)!40=A<1,B,H$(%$*1H;'!"2,S4O`58G+1"A8D-.$E\1<8&1HF M)R@I*C4V-S@Y.D-$149'2$E*4U155E=865IC9&5F9VAI:G-T=79W>'EZ@H.$ MA8:'B(F*DI.4E9:7F)F:HJ.DI::GJ*FJLK.TM;:WN+FZPL/$Q<;'R,G*TM/4 MU=;7V-G:XN/DY>;GZ.GJ\O/T]?;W^/GZ_]H`#`,!``(1`Q$`/P#W^BBL[6=> MTOP]9-=ZK?06L(!QYC@%R!G"CJQXZ#F@"IXK\46'A/0Y=2OB&(^6*`,`TSGH MHSU]3Z`$]JX#5O%/BC5I)=.@DM=,-Y;H]D4F_=WJ'&X077:8DX4;.!R>Q#M? MB\3^.IK/7M#TW[)8Z=')Y=IJJE'U#`E;NWN5 M9]4T^3&3YHX#Q``G=U.[K@5Z/H^M:=KVG1W^EW<5U;OCYHV!VD@':P_A8`C( M/(S6+IGA6:.XAN=2NA)>6 M/4>(2)X>\02"+RU(V6]\QX(7@*K*,<9Y]@*`/2****`"BBB@`HHHH`****`" MBBB@`HH)`ZFB@`HHHH`****`"BBB@`HHHH`****`"BBB@`HHHZT`%%(2%&20 M/K2T`8'B_P`2)X9T)[I8VFO9F%O96ZH6,T[`[%P.<9ZXYP#7-^$_!MGO1G;,DKK+#8R$B3RT7D*RDCZ9X`S6=XJGOI?B&\"PN]Y]D$.FJ^##: M1MDR7Y)X#(?EV\$@#GFI_#.LVFG+:31W!31&F^PP3>2?.UJ_?`><]3@E6Y/4 MY)(`%`'IMKOB;QU9^' MM0@T]+::^N_DFNHH$6![>22-7:&0@M&2,E3@D9'3@ MXK'\:Q:1+X1U$:W(D-BL+,9CC=&P!VLF?XP<;>^<5S6G?$#4;5-1_M?26N-. MTF=[2[UFSD789$QN8PMAE&""=NX`Y`SBFWRW/B<#Q%J>G2RZ+9_/I6DCYCJ$ MI(\J=\?=#;@H1A\N2S$#B@##T#XDZ_I5AITGB6VAELYHMD,,,;G49(U7(N70 ML08R%.3P2>1Q7KEG=P7]E!>6TBRV\\:RQ2+T96&01]0:\9U"TNWGU2&[N]FJ M7,)N=;U`_O%T>Q(W?9(R"=S?>^[C([=Z[3X6:A]I\+-:>=.ZV!,G('H<#/KEEY M&2:Q-=/BCX67=GK)\076N:--*EO=07SL\@)R24R<#Y5.#GJ1D&K,MW#X>_:& M>2_DVIJ]BD5NQZ!CM4#\6B([=15_XX74(LT@3]TV,')XSR.,YIUAXT\-ZI:75U9:Q:S16D;2 MSX;#1HHR6*GG;[XQ7F$6A0M\4/!6DZO913&#PW"DT$RAU\Q%E'(Z'!'O3?$^ MGV6F?$77+?1;>"W@?PO=/=Q0(%524?L..<1_G0!Z2_Q#\(1FV#>(+$?:%#)^ M\Z`]"W]S_@6,5K7^N:5IFG+J%]J%M;V;@%)I)0%?(R`I_B)`)`'7M7DNC:!H M+_`.?4;K3K(W9M+B47+Q+YGFAF"?-C/4**Y;5+W59#\.-.FC6>(6\4D%K.^( M9G\UEC#>VP(/HQ]30![MI_C+PYJEC^*K2? M$/PA%;V\S>(+'9/]P"3+=<9*CE1D$<@=*XA?"6LVUSXL\3:K8:9IRW.B7%O] MELFW;CM!W'@#^'\<)!Y93?$=V[IMQSFNVTSQIX;UG46T_3M9M+ MFZ&?W:/]['7:>C?AFO%VC34/"WPOM[M?/AEU!X71^0R&=5VGVQQ6QXVTVQTC MXR>#$TRT@LD=XMR6T8C!_>D=%`[$CZ4`>H:IXU\-:)>K9ZCK-K!7M[<3QW-Q=S!)H-_91M/`;)'/4>PJ]XA\.7OA7P1X0TO4+M;F= M-85SM)*Q[LG8">H&3Z=:`/6KKQCXLA;Q-LM`'K^E^(-(UO3WO]-U""XM8R0\J-PA`R0V>AP0>:S[7QYX5OM3&G6V MO6,ETS!402<.Q.`%;HQ)Z`$YKQ47-QI>D?$^UT]?+MDOE@$48PL<1GD0@`=! MMPOTK:T_PEK_`(F\+>&(;/2-&TRVMC!<+J<$O[]@J\DA5!W$X8C/WEZ\9H`] M2E\<^%H)[V";7;*.6R)6=&DPRL."`.YR",#)SQUK@_$^JZIXA^)>AZ/HGB.Z ML-+O],6Z66U_B),IWGB/ M7_$\UZ]UO4FK'Q.8/\5/`N M"#_I,)X_Z^$Y_G0!Z+<^-_#%G>W=G?2;^&[C0X?RSRI[9!Y'XUYM#H^FZG^T%J\-_86]S$FG+,L">37(:9/-I'B#XFQZ:IA2.VN52.$[!&!-M!4#IM5FQCI0!Z?XU\=>&H_ M#VM:6FNVW]H/93QQQPR%CYFQ@%W+P&SQC.:7P'K-AI'PKT>]U6^AM8!&P\V= MPN3O?@9ZG@\#DUS?A_1]`_X49?WEK:VD]RVFW+SSM$"ZS!&R,GD;3C'X$=:@ M'AC4O%'P/\/0:4(9+NTE^U)#+C$F#(-O/RY^;^+@\@]:`.OU-K#XA:4LFAZG M%=6\)='"$C#G:5)!QC`!'T8XKKK*)[>Q@ADP'1`"`VX#V!P,@>N!7#?#3Q7! MJTNI:++HT&E:M8./MD=NJA)7'R,YV@`'*XQD\`8)%>A8H`\Y^*'A\RPP:[:V M5Y=.FVVU*&VEVF:Q!:1D(R#@N%&1R`Q[5R^B:G`KL!M)!^8]#C[K>W5Q/BWPC;);?V[H-G;VNMV$YOT>&$*UT5!+1 M,1R0X)'UH`W?#?AVV\.:>T$1,MSLGVEE8QIN7^'.3AOEZUT?AK7[7Q/X?L]6M"`D\8+Q MYR8G_B0].0^/F;\6R?QK5KS_1O$Q\-S6&E:M]1?['UG! MVRJV!'#)@<.%.=YP&`R<'-6]5\J2?,LLCYR%!R,'`)'H%!Z_P M9H,^AZ,S7\IEU6^E-Y?R$\&9P-RKC@*N`!CCC/>LO0?`6(XK8>B*.N"6YXZ]`>:[:@##\2^$M'\6V:6VKVOFK&Q:-T+3K:Y MANKR"S5GNVC8/*X4$@1MP,^N?:LRZ\,M(MM>^.>CZ=#/$UQ91RR7=QIMSY]W]\1Z)I^H6ME=ZC:PWEV!Y M$;.-S@G`Q[$Y`I=7U*ZL[BSM;.RAN9;KS`!-.8E&U=V,A6Z]*`/,/A]\-M#\ M0>"=*OM2DOIHI"\CV7VDB`N&9=VT<@X&.#7HNO\`@S0_$FDP:;J-IF"W_P"/ M?RG*&'Y=HVX[8['(X''%2:3KRZA::=<2+!:BXM))Y(&DW-&4*AL'`!52Q!;C ML>]4[CQOHT]A)+I.JV5S+%-$LB>8"51I41FQP<`/][I0!5T7X::%H=M>Q0-> MSR7=J]F\]Q.7986'**.`!T[=JOZ5X)TC1O"MYX=M!.+&[6192TF7/F+M;!QQ MQ[4LOCOPQ%IBZD=8MFLFNA9^PVHFC?`19Z'%;:);A;DQZ-,9[0&7G>7#Y;U MY'2K>J^#=)UK7]/UN\25KS3]I@*2%5!#;AD=^:AM_&VG3^)M7T8_(-,@\Z2X M))4[0#(,8_AW)GG^+VIVE^-]&OX+3S[RWMKNYM!>K:F7UN"GF,3DD@YQGOC%:EUX'T6[TO2M.DBF%KI MDJS6Z"4YW#NQ/)SSGGO6Q!JMC=)9O!GQ:I;F[M&=9XF.TIL&6//8=STH`1Y`8O\H3Z5 M%8^$-*T[Q3>^(X$E_M&\0QRLTA*[3M.`.WW%JYI&OZ5KT4DNE7\%VD3;7,39 MP<9_+T/0UEVWC73P-5?4Y(=/AL=2?3UDEER)2L2RD]!CY2W'/W>M`#['P1HE MA+KCI;O(-;9S?+)(2'#%B0/0?.U8^G_"3PQIFJQ7]LM\HBF6>.W-VQB#J05) M'5L$#J3[UT^G>)-'U>6*+3]1M[F26%ID6-LDHK!6/X$@'ZU%+XLT&&[L[675 M;5+B\(%O&7YDRQ48^I&!ZF@".R\):78>*KWQ)"LW]HWD?E2LTA*[?EX`[?<6 MGW'A?3;KQ9;>)94E.HVT'D1D/A0OS]1Z_.U5[SQUX9L6N4N-9M4>VF6"8;B2 MDA)`4X]P?I@YQ@UM6-]:ZE917EE.D]M*,QR(2%9!*A1RK(X!`88]F/!R.>EF#7344`>>K\%O!HNWF:TNFB8<6YNG\M3V/'S9^I-3_\` M"IO#?]B1Z4#?K%%)V`!VGH.%';^9KNZ*`,'PQX/TCPE;2Q:7"X: M8@S2RR%WD([DG\>F!R:WJ**`"BBB@#S34++5O`NN:KJ=C!-=^&-2+7%]'%(! M+8RL1YDZ@@EAM!.!^@49R9]4>2;3]575X1<2*+?2_$JQ_N[L,Q(L[F(#Y"3R M6(`&,C:I?#[0K^_GN=MS;"]<&^AMYBD5W@[OG7IDDO%2Z#X;TCPS9R6FCV2VL$DAE=0S-EL`9RQ)Z`#' M2M7I0`4444`> M+-9O8K8/;7/APV$3EU&Z8O(=F"<]&7GIS7:T4`>9Z5X;U6PM[?3K_0;F_M+R MRM([EX=2$(MV2%(GC=`XWJ-A;5VQGC'F.VN]8\)74(MS;W\]J6BB=U8PS8 MW)D@X)5P.AQQZ5LXI:`//;CPMJ+:#I*Q:?&;Z_ED36U,BC9#=?/=`'/.&"@; M?3BH-9TKQ7>>)M/C&F"32;'5X+F!HIX4C6!4V'Y3\Y<%V)YQA0`,UZ33)(DF MB>.1`Z.I5E89!!Z@T`<)X'TJ9_$&JZH]T9;*REN--TU`FU5B\WS'QZ@,%C!] M(L]ZL7VDZQ)/XDT^'3P\&H2B]ANVF41LRQQ+Y++G<-QBP3C&&]L'LK>WBM;> M.W@C6.&)0D<:`!54#```Z`"I*`.0TBQU74/&0\1ZCI?]EB+338B!YDE>1FD5 MRV4)&P;<#/)R3@5BR^%-8>_,OV,%/^$P75,^8G_'L(`N_K_>&,=?:O2<44`> M92^$_$0MM8>P"VE[)8V?KV.'P>3Y8'>KR^&I]+U&32TT6ZU M'1;E;=!/'J/E"W5$2+8\9<;@`F[<,DYQBN_HH`\ZDTCQ(USJAM-/E@TM'CNH M=/GNHW,]TMRLS-&^3L1E7A6(`+?='-=Y833W%C%+=6C6DSC+0,ZN8_8E>"?I 8D>YJS10`4444`%%%%`!1110`4444`?_9 ` end GRAPHIC 7 pr1006img000.jpg GRAPHIC begin 644 pr1006img000.jpg M_]C_X``02D9)1@`!`@```0`!``#_VP!#``@&!@<&!0@'!P<)"0@*#!0-#`L+ M#!D2$P\4'1H?'AT:'!P@)"XG("(L(QP<*#7J#A(6&AXB)BI*3E)66EYB9FJ*CI*6FIZBIJK*SM+6VM[BYNL+#Q,7& MQ\C)RM+3U-76U]C9VN'BX^3EYN?HZ>KQ\O/T]?;W^/GZ_\0`'P$``P$!`0$! M`0$!`0````````$"`P0%!@<("0H+_\0`M1$``@$"!`0#!`<%!`0``0)W``$" M`Q$$!2$Q!A)!40=A<1,B,H$(%$*1H;'!"2,S4O`58G+1"A8D-.$E\1<8&1HF M)R@I*C4V-S@Y.D-$149'2$E*4U155E=865IC9&5F9VAI:G-T=79W>'EZ@H.$ MA8:'B(F*DI.4E9:7F)F:HJ.DI::GJ*FJLK.TM;:WN+FZPL/$Q<;'R,G*TM/4 MU=;7V-G:XN/DY>;GZ.GJ\O/T]?;W^/GZ_]H`#`,!``(1`Q$`/P#W^BBL[6=> MTOP]9-=ZK?06L(!QYC@%R!G"CJQXZ#F@"IXK\46'A/0Y=2OB&(^6*`,`TSGH MHSU]3Z`$]JX#5O%/BC5I)=.@DM=,-Y;H]D4F_=WJ'&X077:8DX4;.!R>Q#M? MB\3^.IK/7M#TW[)8Z=')Y=IJJE'U#`E;NWN5 M9]4T^3&3YHX#Q``G=U.[K@5Z/H^M:=KVG1W^EW<5U;OCYHV!VD@':P_A8`C( M/(S6+IGA6:.XAN=2NA)>6 M/4>(2)X>\02"+RU(V6]\QX(7@*K*,<9Y]@*`/2****`"BBB@`HHHH`****`" MBBB@`HH)`ZFB@`HHHH`****`"BBB@`HHHH`****`"BBB@`HHHZT`%%(2%&20 M/K2T`8'B_P`2)X9T)[I8VFO9F%O96ZH6,T[`[%P.<9ZXYP#7-^$_!MGO1G;,DKK+#8R$B3RT7D*RDCZ9X`S6=XJGOI?B&\"PN]Y]D$.FJ^##: M1MDR7Y)X#(?EV\$@#GFI_#.LVFG+:31W!31&F^PP3>2?.UJ_?`><]3@E6Y/4 MY)(`%`'IMKOB;QU9^' MM0@T]+::^N_DFNHH$6![>22-7:&0@M&2,E3@D9'3@ MXK'\:Q:1+X1U$:W(D-BL+,9CC=&P!VLF?XP<;>^<5S6G?$#4;5-1_M?26N-. MTF=[2[UFSD789$QN8PMAE&""=NX`Y`SBFWRW/B<#Q%J>G2RZ+9_/I6DCYCJ$ MI(\J=\?=#;@H1A\N2S$#B@##T#XDZ_I5AITGB6VAELYHMD,,,;G49(U7(N70 ML08R%.3P2>1Q7KEG=P7]E!>6TBRV\\:RQ2+T96&01]0:\9U"TNWGU2&[N]FJ M7,)N=;U`_O%T>Q(W?9(R"=S?>^[C([=Z[3X6:A]I\+-:>=.ZV!,G('H<#/KEEY M&2:Q-=/BCX67=GK)\076N:--*EO=07SL\@)R24R<#Y5.#GJ1D&K,MW#X>_:& M>2_DVIJ]BD5NQZ!CM4#\6B([=15_XX74(LT@3]TV,')XSR.,YIUAXT\-ZI:75U9:Q:S16D;2 MSX;#1HHR6*GG;[XQ7F$6A0M\4/!6DZO913&#PW"DT$RAU\Q%E'(Z'!'O3?$^ MGV6F?$77+?1;>"W@?PO=/=Q0(%524?L..<1_G0!Z2_Q#\(1FV#>(+$?:%#)^ M\Z`]"W]S_@6,5K7^N:5IFG+J%]J%M;V;@%)I)0%?(R`I_B)`)`'7M7DNC:!H M+_`.?4;K3K(W9M+B47+Q+YGFAF"?-C/4**Y;5+W59#\.-.FC6>(6\4D%K.^( M9G\UEC#>VP(/HQ]30![MI_C+PYJEC^*K2? M$/PA%;V\S>(+'9/]P"3+=<9*CE1D$<@=*XA?"6LVUSXL\3:K8:9IRW.B7%O] MELFW;CM!W'@#^'\<)!Y93?$=V[IMQSFNVTSQIX;UG46T_3M9M+ MFZ&?W:/]['7:>C?AFO%VC34/"WPOM[M?/AEU!X71^0R&=5VGVQQ6QXVTVQTC MXR>#$TRT@LD=XMR6T8C!_>D=%`[$CZ4`>H:IXU\-:)>K9ZCK-K!7M[<3QW-Q=S!)H-_91M/`;)'/4>PJ]XA\.7OA7P1X0TO4+M;F= M-85SM)*Q[LG8">H&3Z=:`/6KKQCXLA;Q-LM`'K^E^(-(UO3WO]-U""XM8R0\J-PA`R0V>AP0>:S[7QYX5OM3&G6V MO6,ETS!402<.Q.`%;HQ)Z`$YKQ47-QI>D?$^UT]?+MDOE@$48PL<1GD0@`=! MMPOTK:T_PEK_`(F\+>&(;/2-&TRVMC!<+J<$O[]@J\DA5!W$X8C/WEZ\9H`] M2E\<^%H)[V";7;*.6R)6=&DPRL."`.YR",#)SQUK@_$^JZIXA^)>AZ/HGB.Z ML-+O],6Z66U_B),IWGB/ M7_$\UZ]UO4FK'Q.8/\5/`N M"#_I,)X_Z^$Y_G0!Z+<^-_#%G>W=G?2;^&[C0X?RSRI[9!Y'XUYM#H^FZG^T%J\-_86]S$FG+,L">37(:9/-I'B#XFQZ:IA2.VN52.$[!&!-M!4#IM5FQCI0!Z?XU\=>&H_ M#VM:6FNVW]H/93QQQPR%CYFQ@%W+P&SQC.:7P'K-AI'PKT>]U6^AM8!&P\V= MPN3O?@9ZG@\#DUS?A_1]`_X49?WEK:VD]RVFW+SSM$"ZS!&R,GD;3C'X$=:@ M'AC4O%'P/\/0:4(9+NTE^U)#+C$F#(-O/RY^;^+@\@]:`.OU-K#XA:4LFAZG M%=6\)='"$C#G:5)!QC`!'T8XKKK*)[>Q@ADP'1`"`VX#V!P,@>N!7#?#3Q7! MJTNI:++HT&E:M8./MD=NJA)7'R,YV@`'*XQD\`8)%>A8H`\Y^*'A\RPP:[:V M5Y=.FVVU*&VEVF:Q!:1D(R#@N%&1R`Q[5R^B:G`KL!M)!^8]#C[K>W5Q/BWPC;);?V[H-G;VNMV$YOT>&$*UT5!+1 M,1R0X)'UH`W?#?AVV\.:>T$1,MSLGVEE8QIN7^'.3AOEZUT?AK7[7Q/X?L]6M"`D\8+Q MYR8G_B0].0^/F;\6R?QK5KS_1O$Q\-S6&E:M]1?['UG! MVRJV!'#)@<.%.=YP&`R<'-6]5\J2?,LLCYR%!R,'`)'H%!Z_P M9H,^AZ,S7\IEU6^E-Y?R$\&9P-RKC@*N`!CCC/>LO0?`6(XK8>B*.N"6YXZ]`>:[:@##\2^$M'\6V:6VKVOFK&Q:-T+3K:Y MANKR"S5GNVC8/*X4$@1MP,^N?:LRZ\,M(MM>^.>CZ=#/$UQ91RR7=QIMSY]W]\1Z)I^H6ME=ZC:PWEV!Y M$;.-S@G`Q[$Y`I=7U*ZL[BSM;.RAN9;KS`!-.8E&U=V,A6Z]*`/,/A]\-M#\ M0>"=*OM2DOIHI"\CV7VDB`N&9=VT<@X&.#7HNO\`@S0_$FDP:;J-IF"W_P"/ M?RG*&'Y=HVX[8['(X''%2:3KRZA::=<2+!:BXM))Y(&DW-&4*AL'`!52Q!;C ML>]4[CQOHT]A)+I.JV5S+%-$LB>8"51I41FQP<`/][I0!5T7X::%H=M>Q0-> MSR7=J]F\]Q.7986'**.`!T[=JOZ5X)TC1O"MYX=M!.+&[6192TF7/F+M;!QQ MQ[4LOCOPQ%IBZD=8MFLFNA9^PVHFC?`19Z'%;:);A;DQZ-,9[0&7G>7#Y;U MY'2K>J^#=)UK7]/UN\25KS3]I@*2%5!#;AD=^:AM_&VG3^)M7T8_(-,@\Z2X M))4[0#(,8_AW)GG^+VIVE^-]&OX+3S[RWMKNYM!>K:F7UN"GF,3DD@YQGOC%:EUX'T6[TO2M.DBF%KI MDJS6Z"4YW#NQ/)SSGGO6Q!JMC=)9O!GQ:I;F[M&=9XF.TIL&6//8=STH`1Y`8O\H3Z5 M%8^$-*T[Q3>^(X$E_M&\0QRLTA*[3M.`.WW%JYI&OZ5KT4DNE7\%VD3;7,39 MP<9_+T/0UEVWC73P-5?4Y(=/AL=2?3UDEER)2L2RD]!CY2W'/W>M`#['P1HE MA+KCI;O(-;9S?+)(2'#%B0/0?.U8^G_"3PQIFJQ7]LM\HBF6>.W-VQB#J05) M'5L$#J3[UT^G>)-'U>6*+3]1M[F26%ID6-LDHK!6/X$@'ZU%+XLT&&[L[675 M;5+B\(%O&7YDRQ48^I&!ZF@".R\):78>*KWQ)"LW]HWD?E2LTA*[?EX`[?<6 MGW'A?3;KQ9;>)94E.HVT'D1D/A0OS]1Z_.U5[SQUX9L6N4N-9M4>VF6"8;B2 MDA)`4X]P?I@YQ@UM6-]:ZE917EE.D]M*,QR(2%9!*A1RK(X!`88]F/!R.>EF#7344`>>K\%O!HNWF:TNFB8<6YNG\M3V/'S9^I-3_\` M"IO#?]B1Z4#?K%%)V`!VGH.%';^9KNZ*`,'PQX/TCPE;2Q:7"X: M8@S2RR%WD([DG\>F!R:WJ**`"BBB@#S34++5O`NN:KJ=C!-=^&-2+7%]'%(! M+8RL1YDZ@@EAM!.!^@49R9]4>2;3]575X1<2*+?2_$JQ_N[L,Q(L[F(#Y"3R M6(`&,C:I?#[0K^_GN=MS;"]<&^AMYBD5W@[OG7IDDO%2Z#X;TCPS9R6FCV2VL$DAE=0S-EL`9RQ)Z`#' M2M7I0`4444`> M+-9O8K8/;7/APV$3EU&Z8O(=F"<]&7GIS7:T4`>9Z5X;U6PM[?3K_0;F_M+R MRM([EX=2$(MV2%(GC=`XWJ-A;5VQGC'F.VN]8\)74(MS;W\]J6BB=U8PS8 MW)D@X)5P.AQQZ5LXI:`//;CPMJ+:#I*Q:?&;Z_ED36U,BC9#=?/=`'/.&"@; M?3BH-9TKQ7>>)M/C&F"32;'5X+F!HIX4C6!4V'Y3\Y<%V)YQA0`,UZ33)(DF MB>.1`Z.I5E89!!Z@T`<)X'TJ9_$&JZH]T9;*REN--TU`FU5B\WS'QZ@,%C!] M(L]ZL7VDZQ)/XDT^'3P\&H2B]ANVF41LRQQ+Y++G<-QBP3C&&]L'LK>WBM;> M.W@C6.&)0D<:`!54#```Z`"I*`.0TBQU74/&0\1ZCI?]EB+338B!YDE>1FD5 MRV4)&P;<#/)R3@5BR^%-8>_,OV,%/^$P75,^8G_'L(`N_K_>&,=?:O2<44`> M92^$_$0MM8>P"VE[)8V?KV.'P>3Y8'>KR^&I]+U&32TT6ZU M'1;E;=!/'J/E"W5$2+8\9<;@`F[<,DYQBN_HH`\ZDTCQ(USJAM-/E@TM'CNH M=/GNHW,]TMRLS-&^3L1E7A6(`+?='-=Y833W%C%+=6C6DSC+0,ZN8_8E>"?I 8D>YJS10`4444`%%%%`!1110`4444`?_9 ` end GRAPHIC 8 pr1006img001.jpg GRAPHIC begin 644 pr1006img001.jpg M_]C_X``02D9)1@`!`0```0`!``#_VP!#``@&!@<&!0@'!P<)"0@*#!0-#`L+ M#!D2$P\4'1H?'AT:'!P@)"XG("(L(QP<*#7J#A(6&AXB)BI*3E)66EYB9FJ*CI*6FIZBIJK*SM+6VM[BYNL+#Q,7& MQ\C)RM+3U-76U]C9VN'BX^3EYN?HZ>KQ\O/T]?;W^/GZ_\0`'P$``P$!`0$! M`0$!`0````````$"`P0%!@<("0H+_\0`M1$``@$"!`0#!`<%!`0``0)W``$" M`Q$$!2$Q!A)!40=A<1,B,H$(%$*1H;'!"2,S4O`58G+1"A8D-.$E\1<8&1HF M)R@I*C4V-S@Y.D-$149'2$E*4U155E=865IC9&5F9VAI:G-T=79W>'EZ@H.$ MA8:'B(F*DI.4E9:7F)F:HJ.DI::GJ*FJLK.TM;:WN+FZPL/$Q<;'R,G*TM/4 MU=;7V-G:XN/DY>;GZ.GJ\O/T]?;W^/GZ_]H`#`,!``(1`Q$`/P#=_P"%'>"_ M^>%[_P"!)_PH_P"%'>"_^>%[_P"!)_PKTBJ6K7,MIISRPE0^]%W.0`H9PI.3 MTP"3G!_&@#A/^%'>"_\`GA>_^!)_PH_X4=X+_P">%[_X$G_"M^/7-1ELY;F/ MRR(]K.KI@J"SKMP.^%4XSGYO2NB@N/M%O'-$A*.H89(!Z'_ZWYT`>??\*.\% M_P#/"]_\"3_A1_PH[P7_`,\+W_P)/^%>BEGYQ'G_`(%]?_K?G06?G$>?^!?7 M_P"M^=`'G7_"CO!?_/"]_P#`D_X4?\*.\%_\\+W_`,"3_A7HI9^<1Y_X%]?_ M`*WYT%GYQ'G_`(%]?_K?G0!YU_PH[P7_`,\+W_P)/^%'_"CO!?\`SPO?_`D_ MX5Z*6?G$>?\`@7U_^M^=!9^<1Y_X%]?_`*WYT`>=?\*.\%_\\+W_`,"3_A1_ MPH[P7_SPO?\`P)/^%>BEGYQ'G_@7U_\`K?G06?G$>?\`@7U_^M^=`'G7_"CO M!?\`SPO?_`D_X4?\*.\%_P#/"]_\"3_A7HI9^<1Y_P"!?7_ZWYT%GYQ'G_@7 MU_\`K?G0!YU_PH[P7_SPO?\`P)/^%'_"CO!?_/"]_P#`D_X5Z*6?G$>?^!?7 M_P"M^=!9^<1Y_P"!?7_ZWYT`>=?\*.\%_P#/"]_\"3_A1_PH[P7_`,\+W_P) M/^%>BEGYQ'G_`(%]?_K?G06?G$>?^!?7_P"M^=`'G7_"CO!?_/"]_P#`D_X4 M?\*.\%_\\+W_`,"3_A7HI9^<1Y_X%]?_`*WYT%GYQ'G_`(%]?_K?G0!YU_PH M[P7_`,\+W_P)/^%'_"CO!?\`SPO?_`D_X5Z*6?G$>?\`@7U_^M^=!9^<1Y_X M%]?_`*WYT`>=?\*.\%_\\+W_`,"3_A1_PH[P7_SPO?\`P)/^%>BEGYQ'G_@7 MU_\`K?G06?G$>?\`@7U_^M^=`'G7_"CO!?\`SPO?_`D_X4?\*.\%_P#/"]_\ M"3_A7HI9^<1Y_P"!?7_ZWYT%GYQ'G_@7U_\`K?G0!YU_PH[P7_SPO?\`P)/^ M%'_"CO!?_/"]_P#`D_X5Z*6?G$>?^!?7_P"M^=!9^<1Y_P"!?7_ZWYT`>=?\ M*.\%_P#/"]_\"3_A1_PH[P7_`,\+W_P)/^%>BEGYQ'G_`(%]?_K?G06?G$>? M^!?7_P"M^=`'G7_"CO!?_/"]_P#`D_X4?\*.\%_\\+W_`,"3_A7HI9^<1Y_X M%]?_`*WYT%GYQ'G_`(%]?_K?G0!YU_PH[P7_`,\+W_P)/^%'_"CO!?\`SPO? M_`D_X5Z*6?G$>?\`@7U_^M^=!9^<1Y_X%]?_`*WYT`>=?\*.\%_\\+W_`,"3 M_A1_PH[P7_SPO?\`P)/^%>BEGYQ'G_@7U_\`K?G06?G$>?\`@7U_^M^=`'G7 M_"CO!?\`SPO?_`D_X4?\*.\%_P#/"]_\"3_A7HI9^<1Y_P"!?7_ZWYT%GYQ' MG_@7U_\`K?G0!YU_PH[P7_SPO?\`P)/^%'_"CO!?_/"]_P#`D_X5Z*6?G$>? M^!?7_P"M^=!9^<1Y_P"!?7_ZWYT`>=?\*.\%_P#/"]_\"3_A1_PH[P7_`,\+ MW_P)/^%>BEGYQ'G_`(%]?_K?G06?G$>?^!?7_P"M^=`'G7_"CO!?_/"]_P#` MD_X4?\*.\%_\\+W_`,"3_A7HI9^<1Y_X%]?_`*WYT%GYQ'G_`(%]?_K?G0!Y MU_PH[P7_`,\+W_P)/^%'_"CO!?\`SPO?_`D_X5Z*6?G$>?\`@7U_^M^=!9^< M1Y_X%]?_`*WYT`>=?\*.\%_\\+W_`,"3_A1_PH[P7_SPO?\`P)/^%>BEGYQ' MG_@7U_\`K?G06?G$>?\`@7U_^M^=`'G7_"CO!?\`SPO?_`D_X4?\*.\%_P#/ M"]_\"3_A7HI9^<1Y_P"!?7_ZWYT%GYQ'G_@7U_\`K?G0!YU_PH[P7_SPO?\` MP)/^%'_"CO!?_/"]_P#`D_X5Z*6?G$>?^!?7_P"M^=!9^<1Y_P"!?7_ZWYT` M>=?\*.\%_P#/"]_\"3_A1_PH[P7_`,\+W_P)/^%>BEGYQ'G_`(%]?_K?G06? MG$>?^!?7_P"M^=`'G7_"CO!?_/"]_P#`D_X4?\*.\%_\\+W_`,"3_A7HI9^< M1Y_X%]?_`*WYT^@#S?\`X4=X+_YX7O\`X$G_``HKTBB@`IDTL<$,DTKA(XU+ M.S'A0.233ZK7]FFH64EK(S*K@?,IP1@Y'\J`'6]Y;W1<0R!RG7'XC\>01]01 MVJ>L_3-+_LXR'SC)N`497&!N=N?4Y<_I5YHT>O'U_Q/YT&&,YRB\]>/K_`(G\Z`'T4PPQG.47GKQ]?\3^=!AC.>O'U_ MQ/YT&&,YRB\]>/K_`(G\Z`'T4PPQG.47GKQ]?\3^=!AC.25/W<9/7IGOR?SK@=&T_7[/4=.N9[;5)8=DAN+>>XWB,;93M! M,GSMDQC+`@Y)&WL`>B45YK?Z5XI?4+C[,M]Y1U$2(S3D95I)<_\`+0CRU4I@ M8&=Q!'%=)HEEJFGWYLKI);RSV'%Y/)ELAFX*DDY.X\]P1TQB@#IJ*888SG*+ MSUX^O^)_.@PQG.47GKQ]?\3^=`#Z*Y'5?&5II=U-#<:;(OEWBVI9W0!@R;]P MP3G(8X7@GGI5G7O$2Z'<21R::)T$0D#K*,_-(L8!&,C+2'IDG#8!Z4`=+17. M:7XEM-3EB26S:T$ZAXC<$*)`W0+V8G)QC((SSU`Z`PQG.47GKQ]?\3^=`#Z* M888SG*+SUX^O^)_.@PQG.47GKQ]?\3^=`#Z*888SG*+SUX^O^)_.@PQG.47G MKQ]?\3^=`#Z*888SG*+SUX^O^)_.@PQG.47GKQ]?\3^=`#Z*888SG*+SUX^O M^)_.@PQG.47GKQ]?\3^=`#Z*888SG*+SUX^O^)_.@PQG.47GKQ]?\3^=`#Z* M888SG*+SUX^O^)_.@PQG.47GKQ]?\3^=`#Z*888SG*+SUX^O^)_.@PQG.47G MKQ]?\3^=`#Z*888SG*+SUX^O^)_.@PQG.47GKQ]?\3^=`#Z*888SG*+SUX^O M^)_.@PQG.47GKQ]?\3^=`#Z*888SG*+SUX^O^)_.@PQG.47GKQ]?\3^=`#Z* M888SG*+SUX^O^)_.JFJW=II.DWFI749,%K"\T@1OYT`9%IXR@N[ MR"U_LV]C>6Z>T8ML(CD50V#ACG@\XSC!STH?QK8K>WEL+:Y8VMU#:NR[3EI' MV!L;LA0W!)'TS7FUK\1?AG97"SV]CK4J7'V73I9O-,6TJ-P` MSRP&/FX&!G)Z5=;J1)"@'*+A0V]Q@>VU4;GGYL]"*U6, M@/RJI&.[8]?;Z?YZQPW<%Q)+'$^YHCAQ@C')'?KR"./0U('#.RCJN,T`(3+S MA$]OG/O[?3\SZ6:5U?PT_ MY*1H/_7T/Y&@#ZW)EYPB>WSGW]OI^9].4=Y%5FV(0`3]X^_M]/S/IRZ1Q'&S MM]U1DTDO^I?_`'30!XK=?&?P=>2.\V@:D[/*LS?,HWLHPN[#\C`7@\?7'*7' MQE\&W4WSGW]OI^9].>4\3V.MRW<\VGQ7,\;V?EB**[\M1)YR$'&5_A!)Y&1D9&1G MK(W$D:NOW6`(^AKY?\<>-O%%CXYUJUM=>U"&WBNY$CC2=@J@'@`4`>V:O9Z[ M(FCQ6=IJ4C6B[)96OEC,HV+G?AOO'^]@X(8<`AC6LM,\3V-A#=QB[GN$\P?8 MKB[X*>>63/S$`[2O\1X4@GD"OGW_`(6#XO\`^ADU/_P(:C_A8/B__H9-3_\` M`AJ`/KT--MR8T!QTWGW]OI^9].5)EYPB>WSGW]OI^9].

ZO'CBA4@;BQ/))`&`"?3\ MSZ\_:;>5(VRSEL##9"J"549X!QR.*]`TW5=/UBU M^U:;>07<&XKYD#AUR.HR/K0!8)EYPB>WSGW]OI^9].:FJ:@=*TF]U&6(/%:0 M23LJMR0BEL#CKP/S]N;@<&1D_B`!/T.?\#7(>/O'&D^#[2V@U>QN+N#45EC* M0JI!4`!@VXC@AJ`+HR3C.<$@9KSE_BUX#DMH[=_#VJ M-%&VY59E/.6))_>!K>UEMHO#VI+#*Q=TPA!)79W?IMX M`Z`=*`/:(YC/$LL)BDC<;D=9,AAS@@@?3\SZWSGW]OI^9].>/\`^ M.](\80W5MI-E=6L>GI&")PO(;=C&&.?NGK78EP)%3^)@2/PQ_C0`A,O.$3V^ M<^_M]/S/IR$R\X1/;YS[^WT_,^G+Z*`&$R\X1/;YS[^WT_,^G(3+SA$]OG/O M[?3\SZWT_,^G/ M0.XC`+="0/Q)Q6%XY_Y$'Q#_`-@Z?_T6:`/CFBBB@#?\#Y_X3WP_M`)_M&#` M)Q_RT%?89,O.$3V^<^_M]/S/IS\>>!O^1^\/?]A&#_T8*^Q)'$<;.WW5!)^@ MH`0F7G")[?.??V^GYGTY^+;^_O!J-T!=S_ZU_P#EH?4U]JU\1:A_R$KK_KL_ M\S0`?;[S_G[G_P"_A_QH^WWG_/W/_P!_#_C5>B@#[:L&E.G6QVH3Y*]7//'T M^GYGTYMU6T__`)!MK_UQ3^0J='$B!EZ&@!U%%%`!115'5;F2VLW=%F'3]Y&% M)!W`8P<]<]<''6@!UG8+:7%Q*)"QE/0C&!N9_P`>7;\,?4OGT^SNI/,N+2"5 MP,;GC#''XU1T6XO9GG6[D,FP#YO+VC=O<<<=-H0\Y^][UJL9`?E52,=VQZ^W MT_SU`/"?CK+)H]_HJZ9(UDLD4I<6Y\L,05QG'6O(_P"W]8_Z"M[_`-_V_P`: M]8_:&+?VEH6X`?N9L8.?XE_^M7BU`&C_`&_K'_05O?\`O^W^->U_`HG6;#6F MU,F]:.6((;C]X5!#9QGI7@=>\_L]%QINO;54_OH>IQ_"_M]*`/7_`.Q],_Z! M]K_WY7_"O-_C9&FD>";:XTU%LYC?HADMQY;%2DAQD=N!^5>I$R\X1/;YS[^W MT_,^G/EOQ[+_`/"!6VY0!_:,>,'/\$OM]*`/`/[?UC_H*WO_`'_;_&C^W]8_ MZ"M[_P!_V_QK.HH`]9^"=WWSGW M]OI^9].0F7G")[?.??V^GYGTY`*G]C:7_P!`ZT_[\K_A1_8VE_\`0.M/^_*_ MX5;)EYPB>WSGW]OI^9].0F7G")[?.??V^GYGTY`*G]C:9_T#K7_ORO\`A2_V M/IG_`$#[7_ORO^%6B9><(GM\Y]_;Z?F?3D)EYPB>WSGW]OI^9].0#S?XQ01: M7X`EN=/B2TG%Q$HE@4(V"3D9'-?.W]OZQ_T%;W_O^W^-?17QP+_\*XFRJ@?: MHNC>Y]OI7S)0!H_V_K'_`$%;W_O^W^-=]\';Z[U3Q_%;:A':`3]EFZG':@#Z2_L?3/^@?:_\`?E?\*/['TS_H'VO_ M`'Y7_"K1,O.$3V^<^_M]/S/IR$R\X1/;YS[^WT_,^G(!4_L;2_\`H'6G_?E? M\*/[&TO_`*!UI_WY7_"K9,O.$3V^<^_M]/S/IR$R\X1/;YS[^WT_,^G(!4_L M;2_^@=:?]^5_PI?['TS_`*!]K_WY7_"K1,O.$3V^<^_M]/S/IR$R\X1/;YS[ M^WT_,^G(!5_L?3/^@?:_]^5_PI/[&TO_`*!UI_WY7_"K9,O.$3V^<^_M]/S/ MIR$R\X1/;YS[^WT_,^G(!4_L;2_^@=:?]^5_PH_L;2_^@=:?]^5_PJV3+SA$ M]OG/O[?3\SZLX@,L;#Q1>XD!*'SXOFP2#CY.N01CVKT+ MP)X*TCP=:78TB]N+N*[=69YG5AET?0O[*\]'N?M$+A0D;1@!,;MQZ]]QZ8'XDD@&Q6;K=M MI-W9+%J]I:7<)D'E0W*(P>3!VA0W!8\@?6KYAB.XB M>*6)620%6&,9!SGG\3^9H`X;2[#PIJEQ91+X(TV-;H3$.;6!@OE-M8\#E<[1 MD?WA56_/@W3;\VEUX)TX$72VVY;6`@D[.G')Q(AQUP3Z&NTM_#>E6L*10VS@ M1P-;H3-(S+&QR5#%LC\#QVHG\.:3EWOEE71;>.*;;GD$`9V\*<]#D5U%4$T73H]0-\MJOVDHT9_\`B?S-!AB._^)_,T`/HIAAB._^)_,T&&(YS&ASU^4>_P#B M?S-`#Z*888CG,:'/7Y1[_P")_,T&&(YS&ASU^4>_^)_,T`/HIAAB._^)_,T&&(YS&ASU^4 M>_\`B?S-`#Z*888CG,:'/7Y1[_XG\S088CG,:'/7Y1[_`.)_,T`/HIAAB._P#B?S-!AB.< MQH<]?E'O_B?S-`#Z*888CG,:'/7Y1[_XG\S088CG,:'/7Y1[_P")_,T`/HIA MAB.&O&4>HZM:0): MB"1"5F5^6&.@H`]QHIAAB._P#B?S-!AB._\`B?S-!AB.^G\XWJSK\H.V5,;6W/P#@9^4)TX_6M9C)GY0I&.Y^O_ M`-:JUEJ-OJ&_[.6(4`Y*XR"2,C\58?A]*M%E'5@/J:`&DR\X5/;D^_M]/UH) MEYPJ>W)]_;Z?K2[U'\0_/_/H:-ZC^(?G_GT-`"$R\X5/;D^_M]/UH)EYPJ>W M)]_;Z?K2[U'\0_/_`#Z&C>H_B'Y_Y]#0`A,O.%3VY/O[?3]:"9><*GMR??V^ MGZTN]1_$/S_SZ&C>H_B'Y_Y]#0`A,O.%3VY/O[?3]:"9><*GMR??V^GZTN]1 M_$/S_P`^AHWJ/XA^?^?0T`(3+SA4]N3[^WT_6@F7G"I[W)]_;Z?K2[U'\0_/_/H:-ZC^(?G M_GT-`"$R\X5/;D^_M]/UH)EYPJ>W)]_;Z?K2[U'\0_/_`#Z&C>H_B'Y_Y]#0 M`A,O.%3VY/O[?3]:"9><*GMR??V^GZTN]1_$/S_SZ&C>H_B'Y_Y]#0`A,O.% M3VY/O[?3]:"9><*GMR??V^GZTN]1_$/S_P`^AHWJ/XA^?^?0T`(3+SA4]N3[ M^WT_6@F7G"I[W)]_;Z?K2[U'\0_/_/H:-ZC^(?G_GT-`"$R\X5/;D^_M]/UH)EYPJ>W)]_; MZ?K2[U'\0_/_`#Z&C>H_B'Y_Y]#0`A,O.%3VY/O[?3]:"9><*GMR??V^GZTN M]1_$/S_SZ&C>H_B'Y_Y]#0`A,O.%3VY/O[?3]:"9><*GMR??V^GZTN]1_$/S M_P`^AHWJ/XA^?^?0T`(3+SA4]N3[^WT_6@F7G"I[;:*"1]PXDD*C&3GD`\XQ7G^GKXTAUBRFOTNF1;B=ID64E- MF&/`'!!)4*#R,#'4UZ-O4?Q#\_\`/H:-ZC^(?G_GT-`'!+:>([G5]063^T4A M>\A\E_M#HB)YLI8J`>GE"(8Z9/0D&MG1UUNPU$V5TLM[;E2%O)'*]-QR5YY) M('7IC`P..DWJ/XA^?^?0T;U'\0_/_/H:`$)EYPJ>W)]_;Z?K03+SA4]N3[^W MT_6EWJ/XA^?^?0T;U'\0_/\`SZ&@!"9><*GMR??V^GZT$R\X5/;D^_M]/UI= MZC^(?G_GT-&]1_$/S_SZ&@!"9><*GMR??V^GZT$R\X5/;D^_M]/UI=ZC^(?G M_GT-&]1_$/S_`,^AH`0F7G"I[H_B'Y_Y]#1 MO4?Q#\_\^AH`0F7G"I[H_B'Y_Y]#1O4?Q#\ M_P#/H:`$)EYPJ>W)]_;Z?K3Z;O4?Q#\_\^AIU`!1110`55OM/@OXMDJ@,""' M"J67#!N,@\9`XJU10!1T[2H-,5A"\C`J%^<@X`+''3U9CSZU=*J>J@_44M%` M#=BG^$?E_GU-59+^PCE:*2:,.&"$$=SD_P"-7*Q[O19+RYFE>[7$AV@>4V-TX2&:)W92X4'DJ,9./3YAS[^]6=BG^$?E_GU-9 MVG:1]@>.1I_,9$*'";0>(U'<]HA^)/3I6G0`W8I_A'Y?Y]31L4_PC\O\^IIU M%`%6>\L[:3RYI$5R,A2,DYS@?4\X'4X..]1KJ>G2.JK<1,7(`QSG)P#],G&> MF3CK4=_ILM[=1R_:$5(MK1HT9;:ZMNW?>'7`'TS@C)JG9>'9+)H%6\5X8MF4 M:'[VUF<9(;KN8GTX'!Q0!N;%/\(_+_/J:-BG^$?E_GU-.HH`;L4_PC\O\^IJ M*>>VMB@G=$\P[5SW)X_K^OO4]4=2L&U"..(S!(0V9$*9W^G.1C'7OR!0`TZM MIFS<;B/!7=T[9V^GKD5>"HR@@*0>O.>U;D2>5"D98MM4+N/4X[T`+L4_PC\O\`/J:-BG^$?E_GU-.HH`AG MD@MXFEFVJ@P"<9Y)P/S)_6H%U'3Y)`BSQ,S'`QSGG'Y9.,],G'6I;ZWENK-X M89O)9L?/M)XR,C@@\C(R"",Y%8Y\,[IB_P!KV*1MVQ1[=J^;YN`<\'=QGT[= MZ`-N&2"YB$L+))&V0&7D'D@_UI^Q3_"/R_SZFH-/LQ86:VZR%PK.P8J!]YBV M,#CC.*LT`-V*?X1^7^?4TDGE1QM))L5%!+,W``[D_K3Z9*KO"ZQN$=E(5BN= MI[''>@"FVJZ:`Q:XC&`2V1R,'!S[@GD=L\U9AE@N%_ZUB- MX9G*6#7$0(+`Y_V M>O\`/K[U>K!N?#LEVLPEO5S,6WL(3D@E2H^]QMV@>X]^:`-6"[M+IV2%T=@, MD8Z>H/OSR.HSSUJ?8I_A'Y?Y]369INC?V?>W%SYX=IV9Y`$VY9MN>YX&W@=M MQY.:U:`&[%/\(_+_`#ZFC8I_A'Y?Y]33J*`*V3^0.3Z M`Y/!H2_L99$C21&:1BJX4X)QNQG'ID^X.:IW^BR7]Q+(]TH!!6,&(DQJ4*,, M[L<[BIY`CZ_P"T>E`&CL4_PC\O\^IH MV*?X1^7^?4TZB@!NQ3_"/R_SZFH+B[L[9PD\B(S`M@CM@G_XKZ\U9K.U'39+ M^:-OM"HD8RJ&,G#]FSD?3'H3ZY``_P#M/3F('VB(Y*CIUW`D?ID_SJYL4_PC M\O\`/J:Y\^%BWEYO1^[?>O[KH2/F/WNN>1V'0@UT5`#=BG^$?E_GU-&Q3_"/ MR_SZFG44`07$UM;*K3LB!VV@D=3R?Y9/YU7_`+5TT_\`+Q&<]`!DG/0?4\X' M?MFI;ZUDNXXD25419`TBLA82*,_+P1CG!_#!R":QT\+E&#&\5B#$>8B.8T** M>&!'!SUZCMTH`WT,4L:R)L='&X,.00>_Z_K2[%/\(_+_`#ZFH[.W%G906RL6 M6&-8PQZG`Q4U`#=BG^$?E_GU-,F>&&-I)=H4=3C.2>,>Y)/3WJ6H+N&6>UDB MAF\F1A@2;O1NGH?>IX);>[A$T)5X MVS@@?7/]:RXO#R)#)"9QY3;0JI'MV@,[$=3W42R,Q9 MF"[02?09..,=Z`+&Q3_"/R_SZFG444`%%%%`'QO_`,)KXK_Z&;6?_`^7_P"* MH_X37Q7_`-#-K/\`X'R__%444`'_``FOBO\`Z&;6?_`^7_XJC_A-?%?_`$,V ML_\`@?+_`/%444`'_":^*_\`H9M9_P#`^7_XJC_A-?%?_0S:S_X'R_\`Q5%% M`!_PFOBO_H9M9_\``^7_`.*H_P"$U\5_]#-K/_@?+_\`%444`'_":^*_^AFU MG_P/E_\`BJ/^$U\5_P#0S:S_`.!\O_Q5%%`!_P`)KXK_`.AFUG_P/E_^*H_X M37Q7_P!#-K/_`('R_P#Q5%%`!_PFOBO_`*&;6?\`P/E_^*H_X37Q7_T,VL_^ M!\O_`,5110`?\)KXK_Z&;6?_``/E_P#BJ/\`A-?%?_0S:S_X'R__`!5%%`!_ MPFOBO_H9M9_\#Y?_`(JC_A-?%?\`T,VL_P#@?+_\5110`?\`":^*_P#H9M9_ M\#Y?_BJ/^$U\5_\`0S:S_P"!\O\`\5110`?\)KXK_P"AFUG_`,#Y?_BJ/^$U M\5_]#-K/_@?+_P#%444`'_":^*_^AFUG_P`#Y?\`XJC_`(37Q7_T,VL_^!\O M_P`5110`?\)KXK_Z&;6?_`^7_P"*H_X37Q7_`-#-K/\`X'R__%444`'_``FO MBO\`Z&;6?_`^7_XJC_A-?%?_`$,VL_\`@?+_`/%444`'_":^*_\`H9M9_P#` M^7_XJC_A-?%?_0S:S_X'R_\`Q5%%`!_PFOBO_H9M9_\``^7_`.*H_P"$U\5_ M]#-K/_@?+_\`%444`'_":^*_^AFUG_P/E_\`BJ/^$U\5_P#0S:S_`.!\O_Q5 M%%`!_P`)KXK_`.AFUG_P/E_^*H_X37Q7_P!#-K/_`('R_P#Q5%%`!_PFOBO_ M`*&;6?\`P/E_^*H_X37Q7_T,VL_^!\O_`,5110`?\)KXK_Z&;6?_``/E_P#B MJ/\`A-?%?_0S:S_X'R__`!5%%`!_PFOBO_H9M9_\#Y?_`(JC_A-?%?\`T,VL M_P#@?+_\5110`?\`":^*_P#H9M9_\#Y?_BJ/^$U\5_\`0S:S_P"!\O\`\511 M0`?\)KXK_P"AFUG_`,#Y?_BJ/^$U\5_]#-K/_@?+_P#%444`'_":^*_^AFUG M_P`#Y?\`XJC_`(37Q7_T,VL_^!\O_P`5110`?\)KXK_Z&;6?_`^7_P"*H_X3 M7Q7_`-#-K/\`X'R__%444`'_``FOBO\`Z&;6?_`^7_XJC_A-?%?_`$,VL_\` M@?+_`/%444`'_":^*_\`H9M9_P#`^7_XJC_A-?%?_0S:S_X'R_\`Q5%%`!_P MFOBO_H9M9_\``^7_`.*H_P"$U\5_]#-K/_@?+_\`%444`'_":^*_^AFUG_P/ *E_\`BJ***`/_V3\_ ` end
GRAPHIC 9 pr1006img002.jpg GRAPHIC begin 644 pr1006img002.jpg M_]C_X``02D9)1@`!`@```0`!``#_VP!#``@&!@<&!0@'!P<)"0@*#!0-#`L+ M#!D2$P\4'1H?'AT:'!P@)"XG("(L(QP<*#7J#A(6&AXB)BI*3E)66EYB9FJ*CI*6FIZBIJK*SM+6VM[BYNL+#Q,7& MQ\C)RM+3U-76U]C9VN'BX^3EYN?HZ>KQ\O/T]?;W^/GZ_\0`'P$``P$!`0$! M`0$!`0````````$"`P0%!@<("0H+_\0`M1$``@$"!`0#!`<%!`0``0)W``$" M`Q$$!2$Q!A)!40=A<1,B,H$(%$*1H;'!"2,S4O`58G+1"A8D-.$E\1<8&1HF M)R@I*C4V-S@Y.D-$149'2$E*4U155E=865IC9&5F9VAI:G-T=79W>'EZ@H.$ MA8:'B(F*DI.4E9:7F)F:HJ.DI::GJ*FJLK.TM;:WN+FZPL/$Q<;'R,G*TM/4 MU=;7V-G:XN/DY>;GZ.GJ\O/T]?;W^/GZ_]H`#`,!``(1`Q$`/P#W^BBL[6=> MTOP]9-=ZK?06L(!QYC@%R!G"CJQXZ#F@"IXK\46'A/0Y=2OB&(^6*`,`TSGH MHSU]3Z`$]JX#5O%/BC5I)=.@DM=,-Y;H]D4F_=WJ'&X077:8DX4;.!R>Q#M? MB\3^.IK/7M#TW[)8Z=')Y=IJJE'U#`E;NWN5 M9]4T^3&3YHX#Q``G=U.[K@5Z/H^M:=KVG1W^EW<5U;OCYHV!VD@':P_A8`C( M/(S6+IGA6:.XAN=2NA)>6 M/4>(2)X>\02"+RU(V6]\QX(7@*K*,<9Y]@*`/2****`"BBB@`HHHH`****`" MBBB@`HH)`ZFB@`HHHH`****`"BBB@`HHHH`****`"BBB@`HHHZT`%%(2%&20 M/K2T`8'B_P`2)X9T)[I8VFO9F%O96ZH6,T[`[%P.<9ZXYP#7-^$_!MGO1G;,DKK+#8R$B3RT7D*RDCZ9X`S6=XJGOI?B&\"PN]Y]D$.FJ^##: M1MDR7Y)X#(?EV\$@#GFI_#.LVFG+:31W!31&F^PP3>2?.UJ_?`><]3@E6Y/4 MY)(`%`'IMKOB;QU9^' MM0@T]+::^N_DFNHH$6![>22-7:&0@M&2,E3@D9'3@ MXK'\:Q:1+X1U$:W(D-BL+,9CC=&P!VLF?XP<;>^<5S6G?$#4;5-1_M?26N-. MTF=[2[UFSD789$QN8PMAE&""=NX`Y`SBFWRW/B<#Q%J>G2RZ+9_/I6DCYCJ$ MI(\J=\?=#;@H1A\N2S$#B@##T#XDZ_I5AITGB6VAELYHMD,,,;G49(U7(N70 ML08R%.3P2>1Q7KEG=P7]E!>6TBRV\\:RQ2+T96&01]0:\9U"TNWGU2&[N]FJ M7,)N=;U`_O%T>Q(W?9(R"=S?>^[C([=Z[3X6:A]I\+-:>=.ZV!,G('H<#/KEEY M&2:Q-=/BCX67=GK)\076N:--*EO=07SL\@)R24R<#Y5.#GJ1D&K,MW#X>_:& M>2_DVIJ]BD5NQZ!CM4#\6B([=15_XX74(LT@3]TV,')XSR.,YIUAXT\-ZI:75U9:Q:S16D;2 MSX;#1HHR6*GG;[XQ7F$6A0M\4/!6DZO913&#PW"DT$RAU\Q%E'(Z'!'O3?$^ MGV6F?$77+?1;>"W@?PO=/=Q0(%524?L..<1_G0!Z2_Q#\(1FV#>(+$?:%#)^ M\Z`]"W]S_@6,5K7^N:5IFG+J%]J%M;V;@%)I)0%?(R`I_B)`)`'7M7DNC:!H M+_`.?4;K3K(W9M+B47+Q+YGFAF"?-C/4**Y;5+W59#\.-.FC6>(6\4D%K.^( M9G\UEC#>VP(/HQ]30![MI_C+PYJEC^*K2? M$/PA%;V\S>(+'9/]P"3+=<9*CE1D$<@=*XA?"6LVUSXL\3:K8:9IRW.B7%O] MELFW;CM!W'@#^'\<)!Y93?$=V[IMQSFNVTSQIX;UG46T_3M9M+ MFZ&?W:/]['7:>C?AFO%VC34/"WPOM[M?/AEU!X71^0R&=5VGVQQ6QXVTVQTC MXR>#$TRT@LD=XMR6T8C!_>D=%`[$CZ4`>H:IXU\-:)>K9ZCK-K!7M[<3QW-Q=S!)H-_91M/`;)'/4>PJ]XA\.7OA7P1X0TO4+M;F= M-85SM)*Q[LG8">H&3Z=:`/6KKQCXLA;Q-LM`'K^E^(-(UO3WO]-U""XM8R0\J-PA`R0V>AP0>:S[7QYX5OM3&G6V MO6,ETS!402<.Q.`%;HQ)Z`$YKQ47-QI>D?$^UT]?+MDOE@$48PL<1GD0@`=! MMPOTK:T_PEK_`(F\+>&(;/2-&TRVMC!<+J<$O[]@J\DA5!W$X8C/WEZ\9H`] M2E\<^%H)[V";7;*.6R)6=&DPRL."`.YR",#)SQUK@_$^JZIXA^)>AZ/HGB.Z ML-+O],6Z66U_B),IWGB/ M7_$\UZ]UO4FK'Q.8/\5/`N M"#_I,)X_Z^$Y_G0!Z+<^-_#%G>W=G?2;^&[C0X?RSRI[9!Y'XUYM#H^FZG^T%J\-_86]S$FG+,L">37(:9/-I'B#XFQZ:IA2.VN52.$[!&!-M!4#IM5FQCI0!Z?XU\=>&H_ M#VM:6FNVW]H/93QQQPR%CYFQ@%W+P&SQC.:7P'K-AI'PKT>]U6^AM8!&P\V= MPN3O?@9ZG@\#DUS?A_1]`_X49?WEK:VD]RVFW+SSM$"ZS!&R,GD;3C'X$=:@ M'AC4O%'P/\/0:4(9+NTE^U)#+C$F#(-O/RY^;^+@\@]:`.OU-K#XA:4LFAZG M%=6\)='"$C#G:5)!QC`!'T8XKKK*)[>Q@ADP'1`"`VX#V!P,@>N!7#?#3Q7! MJTNI:++HT&E:M8./MD=NJA)7'R,YV@`'*XQD\`8)%>A8H`\Y^*'A\RPP:[:V M5Y=.FVVU*&VEVF:Q!:1D(R#@N%&1R`Q[5R^B:G`KL!M)!^8]#C[K>W5Q/BWPC;);?V[H-G;VNMV$YOT>&$*UT5!+1 M,1R0X)'UH`W?#?AVV\.:>T$1,MSLGVEE8QIN7^'.3AOEZUT?AK7[7Q/X?L]6M"`D\8+Q MYR8G_B0].0^/F;\6R?QK5KS_1O$Q\-S6&E:M]1?['UG! MVRJV!'#)@<.%.=YP&`R<'-6]5\J2?,LLCYR%!R,'`)'H%!Z_P M9H,^AZ,S7\IEU6^E-Y?R$\&9P-RKC@*N`!CCC/>LO0?`6(XK8>B*.N"6YXZ]`>:[:@##\2^$M'\6V:6VKVOFK&Q:-T+3K:Y MANKR"S5GNVC8/*X4$@1MP,^N?:LRZ\,M(MM>^.>CZ=#/$UQ91RR7=QIMSY]W]\1Z)I^H6ME=ZC:PWEV!Y M$;.-S@G`Q[$Y`I=7U*ZL[BSM;.RAN9;KS`!-.8E&U=V,A6Z]*`/,/A]\-M#\ M0>"=*OM2DOIHI"\CV7VDB`N&9=VT<@X&.#7HNO\`@S0_$FDP:;J-IF"W_P"/ M?RG*&'Y=HVX[8['(X''%2:3KRZA::=<2+!:BXM))Y(&DW-&4*AL'`!52Q!;C ML>]4[CQOHT]A)+I.JV5S+%-$LB>8"51I41FQP<`/][I0!5T7X::%H=M>Q0-> MSR7=J]F\]Q.7986'**.`!T[=JOZ5X)TC1O"MYX=M!.+&[6192TF7/F+M;!QQ MQ[4LOCOPQ%IBZD=8MFLFNA9^PVHFC?`19Z'%;:);A;DQZ-,9[0&7G>7#Y;U MY'2K>J^#=)UK7]/UN\25KS3]I@*2%5!#;AD=^:AM_&VG3^)M7T8_(-,@\Z2X M))4[0#(,8_AW)GG^+VIVE^-]&OX+3S[RWMKNYM!>K:F7UN"GF,3DD@YQGOC%:EUX'T6[TO2M.DBF%KI MDJS6Z"4YW#NQ/)SSGGO6Q!JMC=)9O!GQ:I;F[M&=9XF.TIL&6//8=STH`1Y`8O\H3Z5 M%8^$-*T[Q3>^(X$E_M&\0QRLTA*[3M.`.WW%JYI&OZ5KT4DNE7\%VD3;7,39 MP<9_+T/0UEVWC73P-5?4Y(=/AL=2?3UDEER)2L2RD]!CY2W'/W>M`#['P1HE MA+KCI;O(-;9S?+)(2'#%B0/0?.U8^G_"3PQIFJQ7]LM\HBF6>.W-VQB#J05) M'5L$#J3[UT^G>)-'U>6*+3]1M[F26%ID6-LDHK!6/X$@'ZU%+XLT&&[L[675 M;5+B\(%O&7YDRQ48^I&!ZF@".R\):78>*KWQ)"LW]HWD?E2LTA*[?EX`[?<6 MGW'A?3;KQ9;>)94E.HVT'D1D/A0OS]1Z_.U5[SQUX9L6N4N-9M4>VF6"8;B2 MDA)`4X]P?I@YQ@UM6-]:ZE917EE.D]M*,QR(2%9!*A1RK(X!`88]F/!R.>EF#7344`>>K\%O!HNWF:TNFB8<6YNG\M3V/'S9^I-3_\` M"IO#?]B1Z4#?K%%)V`!VGH.%';^9KNZ*`,'PQX/TCPE;2Q:7"X: M8@S2RR%WD([DG\>F!R:WJ**`"BBB@#S34++5O`NN:KJ=C!-=^&-2+7%]'%(! M+8RL1YDZ@@EAM!.!^@49R9]4>2;3]575X1<2*+?2_$JQ_N[L,Q(L[F(#Y"3R M6(`&,C:I?#[0K^_GN=MS;"]<&^AMYBD5W@[OG7IDDO%2Z#X;TCPS9R6FCV2VL$DAE=0S-EL`9RQ)Z`#' M2M7I0`4444`> M+-9O8K8/;7/APV$3EU&Z8O(=F"<]&7GIS7:T4`>9Z5X;U6PM[?3K_0;F_M+R MRM([EX=2$(MV2%(GC=`XWJ-A;5VQGC'F.VN]8\)74(MS;W\]J6BB=U8PS8 MW)D@X)5P.AQQZ5LXI:`//;CPMJ+:#I*Q:?&;Z_ED36U,BC9#=?/=`'/.&"@; M?3BH-9TKQ7>>)M/C&F"32;'5X+F!HIX4C6!4V'Y3\Y<%V)YQA0`,UZ33)(DF MB>.1`Z.I5E89!!Z@T`<)X'TJ9_$&JZH]T9;*REN--TU`FU5B\WS'QZ@,%C!] M(L]ZL7VDZQ)/XDT^'3P\&H2B]ANVF41LRQQ+Y++G<-QBP3C&&]L'LK>WBM;> M.W@C6.&)0D<:`!54#```Z`"I*`.0TBQU74/&0\1ZCI?]EB+338B!YDE>1FD5 MRV4)&P;<#/)R3@5BR^%-8>_,OV,%/^$P75,^8G_'L(`N_K_>&,=?:O2<44`> M92^$_$0MM8>P"VE[)8V?KV.'P>3Y8'>KR^&I]+U&32TT6ZU M'1;E;=!/'J/E"W5$2+8\9<;@`F[<,DYQBN_HH`\ZDTCQ(USJAM-/E@TM'CNH M=/GNHW,]TMRLS-&^3L1E7A6(`+?='-=Y833W%C%+=6C6DSC+0,ZN8_8E>"?I 8D>YJS10`4444`%%%%`!1110`4444`?_9 ` end GRAPHIC 10 pr1009img000.jpg GRAPHIC begin 644 pr1009img000.jpg M_]C_X``02D9)1@`!`@```0`!``#_VP!#``@&!@<&!0@'!P<)"0@*#!0-#`L+ M#!D2$P\4'1H?'AT:'!P@)"XG("(L(QP<*#7J#A(6&AXB)BI*3E)66EYB9FJ*CI*6FIZBIJK*SM+6VM[BYNL+#Q,7& MQ\C)RM+3U-76U]C9VN'BX^3EYN?HZ>KQ\O/T]?;W^/GZ_\0`'P$``P$!`0$! M`0$!`0````````$"`P0%!@<("0H+_\0`M1$``@$"!`0#!`<%!`0``0)W``$" M`Q$$!2$Q!A)!40=A<1,B,H$(%$*1H;'!"2,S4O`58G+1"A8D-.$E\1<8&1HF M)R@I*C4V-S@Y.D-$149'2$E*4U155E=865IC9&5F9VAI:G-T=79W>'EZ@H.$ MA8:'B(F*DI.4E9:7F)F:HJ.DI::GJ*FJLK.TM;:WN+FZPL/$Q<;'R,G*TM/4 MU=;7V-G:XN/DY>;GZ.GJ\O/T]?;W^/GZ_]H`#`,!``(1`Q$`/P#W^BBL[6=> MTOP]9-=ZK?06L(!QYC@%R!G"CJQXZ#F@"IXK\46'A/0Y=2OB&(^6*`,`TSGH MHSU]3Z`$]JX#5O%/BC5I)=.@DM=,-Y;H]D4F_=WJ'&X077:8DX4;.!R>Q#M? MB\3^.IK/7M#TW[)8Z=')Y=IJJE'U#`E;NWN5 M9]4T^3&3YHX#Q``G=U.[K@5Z/H^M:=KVG1W^EW<5U;OCYHV!VD@':P_A8`C( M/(S6+IGA6:.XAN=2NA)>6 M/4>(2)X>\02"+RU(V6]\QX(7@*K*,<9Y]@*`/2****`"BBB@`HHHH`****`" MBBB@`HH)`ZFB@`HHHH`****`"BBB@`HHHH`****`"BBB@`HHHZT`%%(2%&20 M/K2T`8'B_P`2)X9T)[I8VFO9F%O96ZH6,T[`[%P.<9ZXYP#7-^$_!MGO1G;,DKK+#8R$B3RT7D*RDCZ9X`S6=XJGOI?B&\"PN]Y]D$.FJ^##: M1MDR7Y)X#(?EV\$@#GFI_#.LVFG+:31W!31&F^PP3>2?.UJ_?`><]3@E6Y/4 MY)(`%`'IMKOB;QU9^' MM0@T]+::^N_DFNHH$6![>22-7:&0@M&2,E3@D9'3@ MXK'\:Q:1+X1U$:W(D-BL+,9CC=&P!VLF?XP<;>^<5S6G?$#4;5-1_M?26N-. MTF=[2[UFSD789$QN8PMAE&""=NX`Y`SBFWRW/B<#Q%J>G2RZ+9_/I6DCYCJ$ MI(\J=\?=#;@H1A\N2S$#B@##T#XDZ_I5AITGB6VAELYHMD,,,;G49(U7(N70 ML08R%.3P2>1Q7KEG=P7]E!>6TBRV\\:RQ2+T96&01]0:\9U"TNWGU2&[N]FJ M7,)N=;U`_O%T>Q(W?9(R"=S?>^[C([=Z[3X6:A]I\+-:>=.ZV!,G('H<#/KEEY M&2:Q-=/BCX67=GK)\076N:--*EO=07SL\@)R24R<#Y5.#GJ1D&K,MW#X>_:& M>2_DVIJ]BD5NQZ!CM4#\6B([=15_XX74(LT@3]TV,')XSR.,YIUAXT\-ZI:75U9:Q:S16D;2 MSX;#1HHR6*GG;[XQ7F$6A0M\4/!6DZO913&#PW"DT$RAU\Q%E'(Z'!'O3?$^ MGV6F?$77+?1;>"W@?PO=/=Q0(%524?L..<1_G0!Z2_Q#\(1FV#>(+$?:%#)^ M\Z`]"W]S_@6,5K7^N:5IFG+J%]J%M;V;@%)I)0%?(R`I_B)`)`'7M7DNC:!H M+_`.?4;K3K(W9M+B47+Q+YGFAF"?-C/4**Y;5+W59#\.-.FC6>(6\4D%K.^( M9G\UEC#>VP(/HQ]30![MI_C+PYJEC^*K2? M$/PA%;V\S>(+'9/]P"3+=<9*CE1D$<@=*XA?"6LVUSXL\3:K8:9IRW.B7%O] MELFW;CM!W'@#^'\<)!Y93?$=V[IMQSFNVTSQIX;UG46T_3M9M+ MFZ&?W:/]['7:>C?AFO%VC34/"WPOM[M?/AEU!X71^0R&=5VGVQQ6QXVTVQTC MXR>#$TRT@LD=XMR6T8C!_>D=%`[$CZ4`>H:IXU\-:)>K9ZCK-K!7M[<3QW-Q=S!)H-_91M/`;)'/4>PJ]XA\.7OA7P1X0TO4+M;F= M-85SM)*Q[LG8">H&3Z=:`/6KKQCXLA;Q-LM`'K^E^(-(UO3WO]-U""XM8R0\J-PA`R0V>AP0>:S[7QYX5OM3&G6V MO6,ETS!402<.Q.`%;HQ)Z`$YKQ47-QI>D?$^UT]?+MDOE@$48PL<1GD0@`=! MMPOTK:T_PEK_`(F\+>&(;/2-&TRVMC!<+J<$O[]@J\DA5!W$X8C/WEZ\9H`] M2E\<^%H)[V";7;*.6R)6=&DPRL."`.YR",#)SQUK@_$^JZIXA^)>AZ/HGB.Z ML-+O],6Z66U_B),IWGB/ M7_$\UZ]UO4FK'Q.8/\5/`N M"#_I,)X_Z^$Y_G0!Z+<^-_#%G>W=G?2;^&[C0X?RSRI[9!Y'XUYM#H^FZG^T%J\-_86]S$FG+,L">37(:9/-I'B#XFQZ:IA2.VN52.$[!&!-M!4#IM5FQCI0!Z?XU\=>&H_ M#VM:6FNVW]H/93QQQPR%CYFQ@%W+P&SQC.:7P'K-AI'PKT>]U6^AM8!&P\V= MPN3O?@9ZG@\#DUS?A_1]`_X49?WEK:VD]RVFW+SSM$"ZS!&R,GD;3C'X$=:@ M'AC4O%'P/\/0:4(9+NTE^U)#+C$F#(-O/RY^;^+@\@]:`.OU-K#XA:4LFAZG M%=6\)='"$C#G:5)!QC`!'T8XKKK*)[>Q@ADP'1`"`VX#V!P,@>N!7#?#3Q7! MJTNI:++HT&E:M8./MD=NJA)7'R,YV@`'*XQD\`8)%>A8H`\Y^*'A\RPP:[:V M5Y=.FVVU*&VEVF:Q!:1D(R#@N%&1R`Q[5R^B:G`KL!M)!^8]#C[K>W5Q/BWPC;);?V[H-G;VNMV$YOT>&$*UT5!+1 M,1R0X)'UH`W?#?AVV\.:>T$1,MSLGVEE8QIN7^'.3AOEZUT?AK7[7Q/X?L]6M"`D\8+Q MYR8G_B0].0^/F;\6R?QK5KS_1O$Q\-S6&E:M]1?['UG! MVRJV!'#)@<.%.=YP&`R<'-6]5\J2?,LLCYR%!R,'`)'H%!Z_P M9H,^AZ,S7\IEU6^E-Y?R$\&9P-RKC@*N`!CCC/>LO0?`6(XK8>B*.N"6YXZ]`>:[:@##\2^$M'\6V:6VKVOFK&Q:-T+3K:Y MANKR"S5GNVC8/*X4$@1MP,^N?:LRZ\,M(MM>^.>CZ=#/$UQ91RR7=QIMSY]W]\1Z)I^H6ME=ZC:PWEV!Y M$;.-S@G`Q[$Y`I=7U*ZL[BSM;.RAN9;KS`!-.8E&U=V,A6Z]*`/,/A]\-M#\ M0>"=*OM2DOIHI"\CV7VDB`N&9=VT<@X&.#7HNO\`@S0_$FDP:;J-IF"W_P"/ M?RG*&'Y=HVX[8['(X''%2:3KRZA::=<2+!:BXM))Y(&DW-&4*AL'`!52Q!;C ML>]4[CQOHT]A)+I.JV5S+%-$LB>8"51I41FQP<`/][I0!5T7X::%H=M>Q0-> MSR7=J]F\]Q.7986'**.`!T[=JOZ5X)TC1O"MYX=M!.+&[6192TF7/F+M;!QQ MQ[4LOCOPQ%IBZD=8MFLFNA9^PVHFC?`19Z'%;:);A;DQZ-,9[0&7G>7#Y;U MY'2K>J^#=)UK7]/UN\25KS3]I@*2%5!#;AD=^:AM_&VG3^)M7T8_(-,@\Z2X M))4[0#(,8_AW)GG^+VIVE^-]&OX+3S[RWMKNYM!>K:F7UN"GF,3DD@YQGOC%:EUX'T6[TO2M.DBF%KI MDJS6Z"4YW#NQ/)SSGGO6Q!JMC=)9O!GQ:I;F[M&=9XF.TIL&6//8=STH`1Y`8O\H3Z5 M%8^$-*T[Q3>^(X$E_M&\0QRLTA*[3M.`.WW%JYI&OZ5KT4DNE7\%VD3;7,39 MP<9_+T/0UEVWC73P-5?4Y(=/AL=2?3UDEER)2L2RD]!CY2W'/W>M`#['P1HE MA+KCI;O(-;9S?+)(2'#%B0/0?.U8^G_"3PQIFJQ7]LM\HBF6>.W-VQB#J05) M'5L$#J3[UT^G>)-'U>6*+3]1M[F26%ID6-LDHK!6/X$@'ZU%+XLT&&[L[675 M;5+B\(%O&7YDRQ48^I&!ZF@".R\):78>*KWQ)"LW]HWD?E2LTA*[?EX`[?<6 MGW'A?3;KQ9;>)94E.HVT'D1D/A0OS]1Z_.U5[SQUX9L6N4N-9M4>VF6"8;B2 MDA)`4X]P?I@YQ@UM6-]:ZE917EE.D]M*,QR(2%9!*A1RK(X!`88]F/!R.>EF#7344`>>K\%O!HNWF:TNFB8<6YNG\M3V/'S9^I-3_\` M"IO#?]B1Z4#?K%%)V`!VGH.%';^9KNZ*`,'PQX/TCPE;2Q:7"X: M8@S2RR%WD([DG\>F!R:WJ**`"BBB@#S34++5O`NN:KJ=C!-=^&-2+7%]'%(! M+8RL1YDZ@@EAM!.!^@49R9]4>2;3]575X1<2*+?2_$JQ_N[L,Q(L[F(#Y"3R M6(`&,C:I?#[0K^_GN=MS;"]<&^AMYBD5W@[OG7IDDO%2Z#X;TCPS9R6FCV2VL$DAE=0S-EL`9RQ)Z`#' M2M7I0`4444`> M+-9O8K8/;7/APV$3EU&Z8O(=F"<]&7GIS7:T4`>9Z5X;U6PM[?3K_0;F_M+R MRM([EX=2$(MV2%(GC=`XWJ-A;5VQGC'F.VN]8\)74(MS;W\]J6BB=U8PS8 MW)D@X)5P.AQQZ5LXI:`//;CPMJ+:#I*Q:?&;Z_ED36U,BC9#=?/=`'/.&"@; M?3BH-9TKQ7>>)M/C&F"32;'5X+F!HIX4C6!4V'Y3\Y<%V)YQA0`,UZ33)(DF MB>.1`Z.I5E89!!Z@T`<)X'TJ9_$&JZH]T9;*REN--TU`FU5B\WS'QZ@,%C!] M(L]ZL7VDZQ)/XDT^'3P\&H2B]ANVF41LRQQ+Y++G<-QBP3C&&]L'LK>WBM;> M.W@C6.&)0D<:`!54#```Z`"I*`.0TBQU74/&0\1ZCI?]EB+338B!YDE>1FD5 MRV4)&P;<#/)R3@5BR^%-8>_,OV,%/^$P75,^8G_'L(`N_K_>&,=?:O2<44`> M92^$_$0MM8>P"VE[)8V?KV.'P>3Y8'>KR^&I]+U&32TT6ZU M'1;E;=!/'J/E"W5$2+8\9<;@`F[<,DYQBN_HH`\ZDTCQ(USJAM-/E@TM'CNH M=/GNHW,]TMRLS-&^3L1E7A6(`+?='-=Y833W%C%+=6C6DSC+0,ZN8_8E>"?I 8D>YJS10`4444`%%%%`!1110`4444`?_9 ` end GRAPHIC 11 pr1009img001.jpg GRAPHIC begin 644 pr1009img001.jpg M_]C_X``02D9)1@`!`0```0`!``#_VP!#``@&!@<&!0@'!P<)"0@*#!0-#`L+ M#!D2$P\4'1H?'AT:'!P@)"XG("(L(QP<*#7J#A(6&AXB)BI*3E)66EYB9FJ*CI*6FIZBIJK*SM+6VM[BYNL+#Q,7& MQ\C)RM+3U-76U]C9VN'BX^3EYN?HZ>KQ\O/T]?;W^/GZ_\0`'P$``P$!`0$! M`0$!`0````````$"`P0%!@<("0H+_\0`M1$``@$"!`0#!`<%!`0``0)W``$" M`Q$$!2$Q!A)!40=A<1,B,H$(%$*1H;'!"2,S4O`58G+1"A8D-.$E\1<8&1HF M)R@I*C4V-S@Y.D-$149'2$E*4U155E=865IC9&5F9VAI:G-T=79W>'EZ@H.$ MA8:'B(F*DI.4E9:7F)F:HJ.DI::GJ*FJLK.TM;:WN+FZPL/$Q<;'R,G*TM/4 MU=;7V-G:XN/DY>;GZ.GJ\O/T]?;W^/GZ_]H`#`,!``(1`Q$`/P#=_P"%'>"_ M^>%[_P"!)_PH_P"%'>"_^>%[_P"!)_PKTBB@#S?_`(4=X+_YX7O_`($G_"C_ M`(4=X+_YX7O_`($G_"NDEU?4`EZ\?E?Z/,05(SA-[J!QWPH./<'.#@;L%Q]H MMXYHD)1U##)`/0__`%OSH`\^_P"%'>"_^>%[_P"!)_PH_P"%'>"_^>%[_P"! M)_PKT4L_.(\_\"^O_P!;\Z"S\XCS_P`"^O\`];\Z`/.O^%'>"_\`GA>_^!)_ MPH_X4=X+_P">%[_X$G_"O12S\XCS_P`"^O\`];\Z"S\XCS_P+Z__`%OSH`\Z M_P"%'>"_^>%[_P"!)_PH_P"%'>"_^>%[_P"!)_PKT4L_.(\_\"^O_P!;\Z"S M\XCS_P`"^O\`];\Z`/.O^%'>"_\`GA>_^!)_PH_X4=X+_P">%[_X$G_"O12S M\XCS_P`"^O\`];\Z"S\XCS_P+Z__`%OSH`\Z_P"%'>"_^>%[_P"!)_PH_P"% M'>"_^>%[_P"!)_PKT4L_.(\_\"^O_P!;\Z"S\XCS_P`"^O\`];\Z`/.O^%'> M"_\`GA>_^!)_PH_X4=X+_P">%[_X$G_"O12S\XCS_P`"^O\`];\Z"S\XCS_P M+Z__`%OSH`\Z_P"%'>"_^>%[_P"!)_PH_P"%'>"_^>%[_P"!)_PKT4L_.(\_ M\"^O_P!;\Z"S\XCS_P`"^O\`];\Z`/.O^%'>"_\`GA>_^!)_PH_X4=X+_P"> M%[_X$G_"O12S\XCS_P`"^O\`];\Z"S\XCS_P+Z__`%OSH`\Z_P"%'>"_^>%[ M_P"!)_PH_P"%'>"_^>%[_P"!)_PKT4L_.(\_\"^O_P!;\Z"S\XCS_P`"^O\` M];\Z`/.O^%'>"_\`GA>_^!)_PH_X4=X+_P">%[_X$G_"O12S\XCS_P`"^O\` M];\Z"S\XCS_P+Z__`%OSH`\Z_P"%'>"_^>%[_P"!)_PH_P"%'>"_^>%[_P"! M)_PKT4L_.(\_\"^O_P!;\Z"S\XCS_P`"^O\`];\Z`/.O^%'>"_\`GA>_^!)_ MPH_X4=X+_P">%[_X$G_"O12S\XCS_P`"^O\`];\Z"S\XCS_P+Z__`%OSH`\Z M_P"%'>"_^>%[_P"!)_PH_P"%'>"_^>%[_P"!)_PKT4L_.(\_\"^O_P!;\Z"S M\XCS_P`"^O\`];\Z`/.O^%'>"_\`GA>_^!)_PH_X4=X+_P">%[_X$G_"O12S M\XCS_P`"^O\`];\Z"S\XCS_P+Z__`%OSH`\Z_P"%'>"_^>%[_P"!)_PH_P"% M'>"_^>%[_P"!)_PKT4L_.(\_\"^O_P!;\Z"S\XCS_P`"^O\`];\Z`/.O^%'> M"_\`GA>_^!)_PH_X4=X+_P">%[_X$G_"O12S\XCS_P`"^O\`];\Z"S\XCS_P M+Z__`%OSH`\Z_P"%'>"_^>%[_P"!)_PH_P"%'>"_^>%[_P"!)_PKT4L_.(\_ M\"^O_P!;\Z"S\XCS_P`"^O\`];\Z`/.O^%'>"_\`GA>_^!)_PH_X4=X+_P"> M%[_X$G_"O12S\XCS_P`"^O\`];\Z"S\XCS_P+Z__`%OSH`\Z_P"%'>"_^>%[ M_P"!)_PH_P"%'>"_^>%[_P"!)_PKT4L_.(\_\"^O_P!;\Z"S\XCS_P`"^O\` M];\Z`/.O^%'>"_\`GA>_^!)_PH_X4=X+_P">%[_X$G_"O12S\XCS_P`"^O\` M];\Z"S\XCS_P+Z__`%OSH`\Z_P"%'>"_^>%[_P"!)_PH_P"%'>"_^>%[_P"! M)_PKT4L_.(\_\"^O_P!;\Z"S\XCS_P`"^O\`];\Z`/.O^%'>"_\`GA>_^!)_ MPH_X4=X+_P">%[_X$G_"O12S\XCS_P`"^O\`];\Z"S\XCS_P+Z__`%OSH`\Z M_P"%'>"_^>%[_P"!)_PH_P"%'>"_^>%[_P"!)_PKT4L_.(\_\"^O_P!;\Z"S M\XCS_P`"^O\`];\Z`/.O^%'>"_\`GA>_^!)_PH_X4=X+_P">%[_X$G_"O12S M\XCS_P`"^O\`];\Z"S\XCS_P+Z__`%OSH`\Z_P"%'>"_^>%[_P"!)_PH_P"% M'>"_^>%[_P"!)_PKT4L_.(\_\"^O_P!;\Z"S\XCS_P`"^O\`];\Z`/.O^%'> M"_\`GA>_^!)_PH_X4=X+_P">%[_X$G_"O12S\XCS_P`"^O\`];\Z?0!YO_PH M[P7_`,\+W_P)/^%%>D44`%%%%`!16?IUM-;W-X70K')(74MM+,2S$\K_``XV MXSR.1Z5>96)X7EOI]G->7N;"XT36/$5OITDR;MKSHC`<[3ANHSC_`+YJHOB/ MPL;NQFF\9Z;(MFKB-//B&2RA0QYZ@;A_P+\P#I[77=+OFB6UO8I3*BO'M.=Z ML`01Z\$'V!![UH5YM]I\'1Z=9V]MXTTVWGM8%A%U%/&LC8P`200>G`&>_<9! M[O3]1LM8M3=_%3QYJO@5-+;3HK:;[89@_VA"=NW;C&" M/[_Z#WR`37GC34X?!EAJ49M3J#S,MQ$4V''[T(%1V#?,T8`ZG&[`.*33O%^N M74%W>/\`8S:6UU-%)MC.\*(PRX&>2OS$@X.!@X->9'X_>*#G_0-+'_;-_?\` MV_?]*#\?O%!S_H&EC_MF_O\`[?O^E`'T197<=_907<.[RYD#KNZX(J>O-/A9 MX_U;QW)JJZA%:P?9!$8_LR$9W[\YW$],#\J](*,<_O6'X#W]O)GS<$,P9B0#DGC/UJRT<;G+(K$C'(SZ_XG\Z`*FKSM:Z1 M=SI,862,D2B/?L]]O?%)]631/#TL3'[7<3QK>`0YW*>PX[CD8QGKQTK( M^+7CO5?!=YID6EP63+=1R-)Y\.[D$=,$?WF_.O.3\Y_,UZC\)_&6H^-K/5 M)=6ALPUM(BIY,6W(8-G.2<]_S-`'I-%,,,1SF-#GK\H]_P#$_F:##$ORCW_Q/YF@PQ'.8T.>ORCW_P`3^9H`?13##$ORCW_`,3^9H,,1SF-#GK\H]_\3^9H`?13 M##$ORCW_P`3^9H,,1SF-#GK\H]_\3^9 MH`?13##$ORCW_Q/YF@!]%,,,1SF-#GK\H]_ M\3^9H,,1SF-#GK\H]_\`$_F:`'T4PPQ'.8T.>ORCW_Q/YF@PQ'.8T.>ORCW_ M`,3^9H`^:OCO_P`E#7_KRB_FU>95Z9\=@%^(:@``?8HSQ_O-7F=`!7TQ\"/^ M2>-_U^R_R6OF>OI7X%1QO\/'+(K$WLHY&?X5_P`3^=`'J%>'_M$_ZGP[_O7' M_M.O;3#$%T444 M`>X?L[?Z[Q%_NV__`+4KW6O"/V>$5Y?$0=0PVV_!&?\`GJ*]T,,1SF-#GK\H M]_\`$_F:`'T4PPQ'.8T.>ORCW_Q/YF@PQ'.8T.>ORCW_`,3^9H`?13##$ORCW_Q/YF@!]%,,,1SF-#GK\H]_P#$_F:##$ORCW_Q/YF@PQ'.8T.>ORCW_P`3^9H`?13# M#$ORCW_`,3^9H,,1SF-#GK\H]_\3^9H M`?13##$+88=I!W9W`YP>@ M].V1VSD$"RT@4X(;IGA2?7_#_.:9#:P0/(\485I#ER._)/\`,D_4D]ZEH`\# M_:&8-J6A8SQ#-U!'\2UXM7M7[0__`"$M!_ZXS?S6O%:`"O>?V>G":;KV0W^N MAZ*3_"_I7@U>]_L\?\@W7O\`KM#_`":@#VHI]%`##*HSP_'^P??V]OY>HH,JC/#\?[!]_;V_EZBGT4`,,JC/#\ M?[!]_;V_EZB@RJ,\/Q_L'W]O;^7J*?10`PRJ,\/Q_L'W]O;^7J*#*HSP_'^P M??V]OY>HI]%`##*HSP_'^P??V]OY>HH,JC/#\?[!]_;V_EZBGT4`,,JC/#\? M[!]_;V_EZB@RJ,\/Q_L'W]O;^7J*?10`PRJ,\/Q_L'W]O;^7J*#*HSP_'^P? M?V]OY>HI]%`##*HSP_'^P??V]OY>HH,JC/#\?[!]_;V_EZBGT4`,,JC/#\?[ M!]_;V_EZBL#Q%IDFJ7^D.ELLD-KR`*LK``9],T`>T^(O"&LZQK%_?I';JL\2`Q%BV['E?*HH,JC/#\? M[!]_;V_EZBN?\`2/+\/]!DD=G=K*,EF.23CUKHZ`/F;X[$'XAJ1G_CRC'(Q_ M$U>9UZ;\=_\`DH:_]>47\VKS*@`KZ5^!4@7X>."&_P"/V4\*3_"O^'^`!X:YZ@C_G MG_A7N->'_M$_ZGP[_O7'_M.@#PJBBB@#V[]GAPDOB(D'[MOT!/\`SU]*]T,J MC/#\?[!]_;V_EZBO#?V=O]=XB_W;?_VI7NM`##*HSP_'^P??V]OY>HKD+(ZC M'HFLB:WU>:>5YI+>"25PPVK\BB16!&\KG"X`W8'J:_Q;UC4-"\"RWNF74EK< MBXC42)UP3R*\`_X6;XT_Z&*\_-?\*`/=H-,\21:Q>QF^U,V]O'%Y$CN[+.R1 MH,?>_B8.2<#D<[@0*Z_1;J[?3PM_:RPS1'9\Q+F0`?>R!W(/Y<=17RU_PLWQ MI_T,5Y^:_P"%=U\)/&OB37?'45EJ>KW%U;&WD8QR8QD#@]*`/?#*HSP_'^P? M?V]OY>HH,JC/#\?[!]_;V_EZBGT4`,,JC/#\?[!]_;V_EZB@RJ,\/Q_L'W]O M;^7J*?10`PRJ,\/Q_L'W]O;^7J*#*HSP_'^P??V]OY>HI]%`##*HSP_'^P?? MV]OY>HH,JC/#\?[!]_;V_EZBGT4`,,JC/#\?[!]_;V_EZB@RJ,\/Q_L'W]O; M^7J*?10`PRJ,\/Q_L'W]O;^7J*?110`4444`%%%%`&?I\TTUU>[Y)&B238BR M)M(P3DC@9'0#KTSWJ\QD!^55(QW;'K[?3_/5V?THH`\#_:&+?VEH6X`?N9L8 M.?XE_P#K5XM7M7[0_P#R$M!_ZXS?S6O%:`"O>?V>BXTW7MJJ?WT/4X_A?V^E M>#5[W^SQ_P`@W7O^NT/\FH`]G)EYPB>WSGW]OI^9].0F7G")[?.??V^GYGTY M?7)?$3QC+X(\.Q:I#9I=M)%(8Y&924D*`G@$J#M).!P3TXS!%XEUR8//;VMG=6T9MS($!1E$B[RO+?, MVUHL8'5\8KS+_A?]QDG_`(1BSR0P/[\_QW:3J:ZMID-Y;-'*CC[PW*"1G.`PR!G'Y_G>)EYPB>WSGW]OI M^9].?,?AO\4I?&6ORZ0='M[&*.V><-%(3R&48Q@?WB:]1H`83+SA$]OG/O[? M3\SZ]$0JQ M8;W4$`')7$;-N'&,>M=-IVI0:G;F:`]"04)&Y?3('3(Y'L10!9)EYPB>WSGW M]OI^9].0F7G")[?.??V^GYGTY?10`PF7G")[?.??V^GYGTY"9><(GM\Y]_;Z M?F?3GF;[5-4MO'<%MF?^ROLRO(JV^Y#Q-N;<%)R"L0P#_%TYKFGUWQA_;/V5 M7N?)_M+RO,%F"FSS0I4?)G:$.><'ACNXP0#TLF7G")[?.??V^GYGTY"9><(G MM\Y]_;Z?F?3G!T+4-3-_)IVII-+*L;2+:!A$/\`H4>,L?3Z?3\SZ<]*3+SA$]OG/O[?3\SZ<\[\ M/?\`DGF@?]>4?\JZ6@#YF^.V?^%AKD`'[%'T/^TU>9UZ;\=_^2AK_P!>47\V MKS*@`KZ5^!1D'P\?:JD?;9>K8_A7V^G^>OS57TQ\"/\`DGC?]?LO\EH`]*)E MYPB>WSGW]OI^9].?$?VB"WE>'MP`&ZYQ@Y_YY_\`UJ]QKP_]HG_4^'?]ZX_] MIT`>%4444`>W?L\%A+XBV`$[;?JWSGW]OI^9].?#?V=O]=X MB_W;?_VI7NM`'FOQP+_\*XFRJ@?:HNC>Y]OI7S)7T[\C?!#C_`[_`)*1#_UZR_R%`'TV3+SA$]OG/O[? M3\SZ'9>.V/?\`Q_2H;>]ANI9HXRVZ(X.1C/)7(_%6'X?2E>]MHI6C MEFCC90#AW`SF@#PK]H92-2T+YB?W,W7_`'EKQ:O:_CXC7^H:(;-3/?V9?_P#/E<_]^F_PH`JU[S^STI;3=>PS+^^AZ8_NO7B']F7_`/SY M7/\`WZ;_``KW'X!_Z!I^MB\_T8O+$5$WR9X;IF@#V./R]_;W_05Y;\ M>U(\!6QW$_\`$QCX/^Y+_G\*]+.I60D"?:H!K: M*T9;B0:A&Q2([R!LDYP*`/F^BK7]F7__`#Y7/_?IO\*/[,O_`/GRN?\`OTW^ M%`'I'P$4MX]N@&*_\2Z3D?[\=?2!C)S^\ M,Z?(H>92@)WQ\9/T-?0K:E9*5'VJ$[CCB1>.">>?:@"MKFJ0:#HMYJMVT[6] MLAD=8@I;'L#@=_7L*\JB^+O@.WU&XOX;#78[FX8-(ZA1DC=V\S`'S9QC!(!. M37ZW#!/'+*]L0J(X9B` M8);62+3]=1K2W^S6^`N(TP0,#S,9P<;NOO6OX7^)_A"_UV+3-)LM5M[B_D$8 M+QH$!^8C^,X`R>@Z_4Y^=_[,O_\`GRN?^_3?X5T_PZL[JV^(6B33VTT427(+ M.Z%548/4F@#ZQ,9.?WCC\O?V]_T%-D5A&["1P0"1T]_;W_05$^I64<;.;J$[ M1G`D7)_6DEO[/R7_`-+@^Z?^6@_QH`^:?^%V^-?^?NU_\!EH_P"%V^-?^?NU M_P#`9:X7^S+_`/Y\KG_OTW^%']F7_P#SY7/_`'Z;_"@#O$^-GC1I%4W=K@G' M_'LM?3AC)S^\'_+)O\*^S_[0LO\`G\M_^_@_ MQH`F,9.?WCC\O?V]_P!!7R%\0O\`DH>O_P#7])_.OK9-2LGC5_M4(#`'!D7( M_6OE#Q[97<_C[798;::2-[R0JZ1DAAGJ"*`.3HJU_9E__P`^5S_WZ;_"C^S+ M_P#Y\KG_`+]-_A0!]9_#Y"?AYH'[QQ_H,?3'I]/?]!72F,G/[QQ^7O[>_P"@ MKE_`5U;V_@'0HIKB*.1+.,,CN`5..A!Z5T*ZE9-N_P!*A&#CF1?\:`/G#X[# M'Q#7DG_0H^O^\U>9UZC\;8)KWQ\LMI$]Q']CC&^)2XSEN,BO./[,O_\`GRN? M^_3?X4`5:^E?@4A;X>/AV7_39>F/[J_X_I7SI_9E_P#\^5S_`-^F_P`*^B_@ ME)'9>`6BNW6WD^V2'9*=AQA><&@#TTQDY_>./R]_;W_05XC^T0I$7AX[B`#GS%QSGW]J\:^/P-_%H`LQ]I*-<;O)^?;GR\ M9QTZ&@#PFBK7]F7_`/SY7/\`WZ;_``H_LR__`.?*Y_[]-_A0![)^SPI:7Q$` MQ7Y;?D?]M:]T,9.?WCC\O?V]_P!!7AWP!4Z?+KYO0;8.MOM\[Y-V/,SC/6O: MCJ5D)`GVJ'D$Y\Q<#'XT`>?_`!P4CX<3'>Q_TJ+@X]3_`(_I7S)7TW\:)8[W MX>RPVLBSR_:8CLB.YL9/85\W?V9?_P#/E<_]^F_PH`JUZ-\$`6^(\(#%?]%F MY'TK@_[,O_\`GRN?^_3?X5Z%\%[>:R^(44UU#)!$+:4;Y5*KG'J:`/I8QDY_ M>./R]_;W_04&,G/[QQ^7O[>_Z"H'U*R0`FZA/('$B]SCUJEK>NPZ9H6H7UM) M!<3VUO)+'")!^\95)"\<\XQ0!EV_B2>3Q;JNE32016UJI\MB<,"$B;YCTP3- M@=O2/@[5W[77+;<$[,#<2W)RNTUP_\`PNS6 MS(TA\&P^8V,MA\G'3G;VIB?&?5XF1H_!5NC("$*JX*@YSCY>.I_.@#V#0-9_ MMA)HI)-EY`$,T2#A`X)4AB,,#R1CMC/?.R8R<_O''Y>_M[_H*\9T'XPZO?Z] M8V4WA>*UANKB.&6<%QL4D#)R,<#UKU^34K*.-G-U"=H)P)%R?UH`G,9.?WCC M\O?V]_T%027%O'=1VKWJ)>*++6(-9TY!;)S')(#EE64+R#TS+S_N^_`!OOJFFK,T+:M;+*)1"4,Z M9$ASA,?WO0=>*G@G@NUW6UXLJD9S&ZL,98=O<$?\!^M<#)X6?KNY.92N#P0O-;FEV]CI&I%[36K*/3RI'V42J<_Z"GU6_M"R_Y_+?\`[^K_`(U-%*LT2R(KL?QJ66UMYVW2P12-C&70$XJ6B M@"M_9]E_SYV__?L?X55D;1HY6B>.U5PP0@QCJ>?3Z_2M.L>[T62\N9I7NUQ( M=H'E'*QE2I4'=C^(G..OKQ@`F@_L>Z=4A2T=V4N%"+DJ,9.,=/F'/N/6K/\` M9]E_SYV__?L?X55T[2/L#QR-/YC(A0X3:#Q&H[GM$/Q)Z=*TZ`*W]GV7_/G; M_P#?L?X4?V?9?\^=O_W['^%6:*`,Z<:3;2".:&V5R`0OE`DYS@=.IP<#J<'' M2HUFT.1U5!9L6("XC!SDX!Z=,\9Z9XZT^_TV6]NHY?M"*D6UHT:,MM=6W;OO M#K@#Z9P1DU3LO#LEDT"K>*\,6S*-#][:S.,D-UW,3Z<#@XH`U?[/LO\`GSM_ M^_8_PH_L^R_Y\[?_`+]C_"K-%`%;^S[+_GSM_P#OV/\`"HIX=+MB@F@MDWG: MN8QR>GI[C\QZU>JCJ5@VH1QQ&8)"&S(A3._TYR,8Z]^0*`*WVG0MF[%IC;N_ MU0Z9V^GKQ5X6%BR@BTMR#R"(UYK)_P"$=E^@"'^S[+_GSM_P#OV/\`"C^S[+_GSM_^_8_PJS10 M!2GMM.MXC+-;6ZH,`GR@>2<#MZFH$DT22141;1F8X&(P<\X].F>,],\=:N7U MO+=6;PPS>2S8^?:3QD9'!!Y&1D$$9R*QSX9W3%_M>Q2-NV*/;M7S?-P#G@[N M,^G;O0!J0VVFW$0EAM[62,Y`98U(.#@_UI_]GV7_`#YV_P#W['^%&GV8L+-; M=9"X5G8,5`^\Q;&!QQG%6:`*W]GV7_/G;_\`?L?X4CV5A'&TDEM;*B@EF,:@ M`=R:M4R57>%UC<([*0K%<[3V..]`&8;C0@"66U&`2W-9;>&7)W"]57PYSY).7=0K,3C)/?TH`D_L^R_Y\[?_`+]C_"C^S[+_`)\[?_OV/\*L MT4`5O[/LO^?.W_[]C_"J;3:&I(9;0$%@_7WK5K!N?#LEVLPEO5S, M6WL(3D@E2H^]QMV@>X]^:`+T"Z3=.4AAMG8#)`B''MTZC(R.HR,]:G_L^R_Y M\[?_`+]C_"J>FZ-_9][<7/GAVG9GD`3;EFVY[G@;>!VW'DYK5H`K?V?9?\^= MO_W['^%']GV7_/G;_P#?L?X59HH`S)FT:"5HY8[577J#&/3)[=@*(V MT>61(TBMF9V*KB$8)`W8SCTY]QS45_HLE_<2R/=*`05C!B),:E"C#.['.XG. M/3.0!4NGZ1]AD1C/Y@0$*-F/X40'J>0(^O\`M'I0!:_L^R_Y\[?_`+]C_"C^ MS[+_`)\[?_OV/\*LT4`5O[/LO^?.W_[]C_"H)UTFV<)-#:HQ!8`QCH`3Z>Q^ MN#6A6=J.FR7\T;?:%1(QE4,9.'[-G(^F/0GUR`",3:&2`%M.2H'[L?Q#([>G M/M5S^S[+_GSM_P#OV/\`"L8^%BWEYO1^[?>O[KH2/F/WNN>1V'0@UT5`%;^S M[+_GSM_^_8_PH_L^R_Y\[?\`[]C_``JS10!1N(-,M55IX+9`S;03&.O)]/0$ M_G5?[1H1QA;0YZ`1`DYZ#IU/8=^V:N7UK)=QQ(DJHBR!I%9"PD49^7@C'.#^ M&#D$UCIX7*,&-XK$&(\Q$KE07<,L]K)%#-Y,C#`DVYQSSW';WH M`I)+HV>-LX(B'^%4HO#R)#) M"9QY3;0JI'MV@,[$=3W42R,Q9F"[02?09..,=Z`%_L M^R_Y\[?_`+]C_"K"JJ*%4`*!@`#@"EHH`****`/C?_A-?%?_`$,VL_\`@?+_ M`/%4?\)KXK_Z&;6?_`^7_P"*HHH`/^$U\5_]#-K/_@?+_P#%4?\`":^*_P#H M9M9_\#Y?_BJ**`#_`(37Q7_T,VL_^!\O_P`51_PFOBO_`*&;6?\`P/E_^*HH MH`/^$U\5_P#0S:S_`.!\O_Q5'_":^*_^AFUG_P`#Y?\`XJBB@`_X37Q7_P!# M-K/_`('R_P#Q5'_":^*_^AFUG_P/E_\`BJ**`#_A-?%?_0S:S_X'R_\`Q5'_ M``FOBO\`Z&;6?_`^7_XJBB@`_P"$U\5_]#-K/_@?+_\`%4?\)KXK_P"AFUG_ M`,#Y?_BJ**`#_A-?%?\`T,VL_P#@?+_\51_PFOBO_H9M9_\``^7_`.*HHH`/ M^$U\5_\`0S:S_P"!\O\`\51_PFOBO_H9M9_\#Y?_`(JBB@`_X37Q7_T,VL_^ M!\O_`,51_P`)KXK_`.AFUG_P/E_^*HHH`/\`A-?%?_0S:S_X'R__`!5'_":^ M*_\`H9M9_P#`^7_XJBB@`_X37Q7_`-#-K/\`X'R__%4?\)KXK_Z&;6?_``/E M_P#BJ**`#_A-?%?_`$,VL_\`@?+_`/%4?\)KXK_Z&;6?_`^7_P"*HHH`/^$U M\5_]#-K/_@?+_P#%4?\`":^*_P#H9M9_\#Y?_BJ**`#_`(37Q7_T,VL_^!\O M_P`51_PFOBO_`*&;6?\`P/E_^*HHH`/^$U\5_P#0S:S_`.!\O_Q5'_":^*_^ MAFUG_P`#Y?\`XJBB@`_X37Q7_P!#-K/_`('R_P#Q5'_":^*_^AFUG_P/E_\` MBJ**`#_A-?%?_0S:S_X'R_\`Q5'_``FOBO\`Z&;6?_`^7_XJBB@`_P"$U\5_ M]#-K/_@?+_\`%4?\)KXK_P"AFUG_`,#Y?_BJ**`#_A-?%?\`T,VL_P#@?+_\ M51_PFOBO_H9M9_\``^7_`.*HHH`/^$U\5_\`0S:S_P"!\O\`\51_PFOBO_H9 MM9_\#Y?_`(JBB@`_X37Q7_T,VL_^!\O_`,51_P`)KXK_`.AFUG_P/E_^*HHH M`/\`A-?%?_0S:S_X'R__`!5'_":^*_\`H9M9_P#`^7_XJBB@`_X37Q7_`-#- MK/\`X'R__%4?\)KXK_Z&;6?_``/E_P#BJ**`#_A-?%?_`$,VL_\`@?+_`/%4 M?\)KXK_Z&;6?_`^7_P"*HHH`/^$U\5_]#-K/_@?+_P#%4?\`":^*_P#H9M9_ M\#Y?_BJ**`#_`(37Q7_T,VL_^!\O_P`51_PFOBO_`*&;6?\`P/E_^*HHH`/^ M$U\5_P#0S:S_`.!\O_Q5'_":^*_^AFUG_P`#Y?\`XJBB@`_X37Q7_P!#-K/_ -`('R_P#Q5%%%`'__V3\_ ` end GRAPHIC 12 pr1009img002.jpg GRAPHIC begin 644 pr1009img002.jpg M_]C_X``02D9)1@`!`@```0`!``#_VP!#``@&!@<&!0@'!P<)"0@*#!0-#`L+ M#!D2$P\4'1H?'AT:'!P@)"XG("(L(QP<*#7J#A(6&AXB)BI*3E)66EYB9FJ*CI*6FIZBIJK*SM+6VM[BYNL+#Q,7& MQ\C)RM+3U-76U]C9VN'BX^3EYN?HZ>KQ\O/T]?;W^/GZ_\0`'P$``P$!`0$! M`0$!`0````````$"`P0%!@<("0H+_\0`M1$``@$"!`0#!`<%!`0``0)W``$" M`Q$$!2$Q!A)!40=A<1,B,H$(%$*1H;'!"2,S4O`58G+1"A8D-.$E\1<8&1HF M)R@I*C4V-S@Y.D-$149'2$E*4U155E=865IC9&5F9VAI:G-T=79W>'EZ@H.$ MA8:'B(F*DI.4E9:7F)F:HJ.DI::GJ*FJLK.TM;:WN+FZPL/$Q<;'R,G*TM/4 MU=;7V-G:XN/DY>;GZ.GJ\O/T]?;W^/GZ_]H`#`,!``(1`Q$`/P#W^BBL[6=> MTOP]9-=ZK?06L(!QYC@%R!G"CJQXZ#F@"IXK\46'A/0Y=2OB&(^6*`,`TSGH MHSU]3Z`$]JX#5O%/BC5I)=.@DM=,-Y;H]D4F_=WJ'&X077:8DX4;.!R>Q#M? MB\3^.IK/7M#TW[)8Z=')Y=IJJE'U#`E;NWN5 M9]4T^3&3YHX#Q``G=U.[K@5Z/H^M:=KVG1W^EW<5U;OCYHV!VD@':P_A8`C( M/(S6+IGA6:.XAN=2NA)>6 M/4>(2)X>\02"+RU(V6]\QX(7@*K*,<9Y]@*`/2****`"BBB@`HHHH`****`" MBBB@`HH)`ZFB@`HHHH`****`"BBB@`HHHH`****`"BBB@`HHHZT`%%(2%&20 M/K2T`8'B_P`2)X9T)[I8VFO9F%O96ZH6,T[`[%P.<9ZXYP#7-^$_!MGO1G;,DKK+#8R$B3RT7D*RDCZ9X`S6=XJGOI?B&\"PN]Y]D$.FJ^##: M1MDR7Y)X#(?EV\$@#GFI_#.LVFG+:31W!31&F^PP3>2?.UJ_?`><]3@E6Y/4 MY)(`%`'IMKOB;QU9^' MM0@T]+::^N_DFNHH$6![>22-7:&0@M&2,E3@D9'3@ MXK'\:Q:1+X1U$:W(D-BL+,9CC=&P!VLF?XP<;>^<5S6G?$#4;5-1_M?26N-. MTF=[2[UFSD789$QN8PMAE&""=NX`Y`SBFWRW/B<#Q%J>G2RZ+9_/I6DCYCJ$ MI(\J=\?=#;@H1A\N2S$#B@##T#XDZ_I5AITGB6VAELYHMD,,,;G49(U7(N70 ML08R%.3P2>1Q7KEG=P7]E!>6TBRV\\:RQ2+T96&01]0:\9U"TNWGU2&[N]FJ M7,)N=;U`_O%T>Q(W?9(R"=S?>^[C([=Z[3X6:A]I\+-:>=.ZV!,G('H<#/KEEY M&2:Q-=/BCX67=GK)\076N:--*EO=07SL\@)R24R<#Y5.#GJ1D&K,MW#X>_:& M>2_DVIJ]BD5NQZ!CM4#\6B([=15_XX74(LT@3]TV,')XSR.,YIUAXT\-ZI:75U9:Q:S16D;2 MSX;#1HHR6*GG;[XQ7F$6A0M\4/!6DZO913&#PW"DT$RAU\Q%E'(Z'!'O3?$^ MGV6F?$77+?1;>"W@?PO=/=Q0(%524?L..<1_G0!Z2_Q#\(1FV#>(+$?:%#)^ M\Z`]"W]S_@6,5K7^N:5IFG+J%]J%M;V;@%)I)0%?(R`I_B)`)`'7M7DNC:!H M+_`.?4;K3K(W9M+B47+Q+YGFAF"?-C/4**Y;5+W59#\.-.FC6>(6\4D%K.^( M9G\UEC#>VP(/HQ]30![MI_C+PYJEC^*K2? M$/PA%;V\S>(+'9/]P"3+=<9*CE1D$<@=*XA?"6LVUSXL\3:K8:9IRW.B7%O] MELFW;CM!W'@#^'\<)!Y93?$=V[IMQSFNVTSQIX;UG46T_3M9M+ MFZ&?W:/]['7:>C?AFO%VC34/"WPOM[M?/AEU!X71^0R&=5VGVQQ6QXVTVQTC MXR>#$TRT@LD=XMR6T8C!_>D=%`[$CZ4`>H:IXU\-:)>K9ZCK-K!7M[<3QW-Q=S!)H-_91M/`;)'/4>PJ]XA\.7OA7P1X0TO4+M;F= M-85SM)*Q[LG8">H&3Z=:`/6KKQCXLA;Q-LM`'K^E^(-(UO3WO]-U""XM8R0\J-PA`R0V>AP0>:S[7QYX5OM3&G6V MO6,ETS!402<.Q.`%;HQ)Z`$YKQ47-QI>D?$^UT]?+MDOE@$48PL<1GD0@`=! MMPOTK:T_PEK_`(F\+>&(;/2-&TRVMC!<+J<$O[]@J\DA5!W$X8C/WEZ\9H`] M2E\<^%H)[V";7;*.6R)6=&DPRL."`.YR",#)SQUK@_$^JZIXA^)>AZ/HGB.Z ML-+O],6Z66U_B),IWGB/ M7_$\UZ]UO4FK'Q.8/\5/`N M"#_I,)X_Z^$Y_G0!Z+<^-_#%G>W=G?2;^&[C0X?RSRI[9!Y'XUYM#H^FZG^T%J\-_86]S$FG+,L">37(:9/-I'B#XFQZ:IA2.VN52.$[!&!-M!4#IM5FQCI0!Z?XU\=>&H_ M#VM:6FNVW]H/93QQQPR%CYFQ@%W+P&SQC.:7P'K-AI'PKT>]U6^AM8!&P\V= MPN3O?@9ZG@\#DUS?A_1]`_X49?WEK:VD]RVFW+SSM$"ZS!&R,GD;3C'X$=:@ M'AC4O%'P/\/0:4(9+NTE^U)#+C$F#(-O/RY^;^+@\@]:`.OU-K#XA:4LFAZG M%=6\)='"$C#G:5)!QC`!'T8XKKK*)[>Q@ADP'1`"`VX#V!P,@>N!7#?#3Q7! MJTNI:++HT&E:M8./MD=NJA)7'R,YV@`'*XQD\`8)%>A8H`\Y^*'A\RPP:[:V M5Y=.FVVU*&VEVF:Q!:1D(R#@N%&1R`Q[5R^B:G`KL!M)!^8]#C[K>W5Q/BWPC;);?V[H-G;VNMV$YOT>&$*UT5!+1 M,1R0X)'UH`W?#?AVV\.:>T$1,MSLGVEE8QIN7^'.3AOEZUT?AK7[7Q/X?L]6M"`D\8+Q MYR8G_B0].0^/F;\6R?QK5KS_1O$Q\-S6&E:M]1?['UG! MVRJV!'#)@<.%.=YP&`R<'-6]5\J2?,LLCYR%!R,'`)'H%!Z_P M9H,^AZ,S7\IEU6^E-Y?R$\&9P-RKC@*N`!CCC/>LO0?`6(XK8>B*.N"6YXZ]`>:[:@##\2^$M'\6V:6VKVOFK&Q:-T+3K:Y MANKR"S5GNVC8/*X4$@1MP,^N?:LRZ\,M(MM>^.>CZ=#/$UQ91RR7=QIMSY]W]\1Z)I^H6ME=ZC:PWEV!Y M$;.-S@G`Q[$Y`I=7U*ZL[BSM;.RAN9;KS`!-.8E&U=V,A6Z]*`/,/A]\-M#\ M0>"=*OM2DOIHI"\CV7VDB`N&9=VT<@X&.#7HNO\`@S0_$FDP:;J-IF"W_P"/ M?RG*&'Y=HVX[8['(X''%2:3KRZA::=<2+!:BXM))Y(&DW-&4*AL'`!52Q!;C ML>]4[CQOHT]A)+I.JV5S+%-$LB>8"51I41FQP<`/][I0!5T7X::%H=M>Q0-> MSR7=J]F\]Q.7986'**.`!T[=JOZ5X)TC1O"MYX=M!.+&[6192TF7/F+M;!QQ MQ[4LOCOPQ%IBZD=8MFLFNA9^PVHFC?`19Z'%;:);A;DQZ-,9[0&7G>7#Y;U MY'2K>J^#=)UK7]/UN\25KS3]I@*2%5!#;AD=^:AM_&VG3^)M7T8_(-,@\Z2X M))4[0#(,8_AW)GG^+VIVE^-]&OX+3S[RWMKNYM!>K:F7UN"GF,3DD@YQGOC%:EUX'T6[TO2M.DBF%KI MDJS6Z"4YW#NQ/)SSGGO6Q!JMC=)9O!GQ:I;F[M&=9XF.TIL&6//8=STH`1Y`8O\H3Z5 M%8^$-*T[Q3>^(X$E_M&\0QRLTA*[3M.`.WW%JYI&OZ5KT4DNE7\%VD3;7,39 MP<9_+T/0UEVWC73P-5?4Y(=/AL=2?3UDEER)2L2RD]!CY2W'/W>M`#['P1HE MA+KCI;O(-;9S?+)(2'#%B0/0?.U8^G_"3PQIFJQ7]LM\HBF6>.W-VQB#J05) M'5L$#J3[UT^G>)-'U>6*+3]1M[F26%ID6-LDHK!6/X$@'ZU%+XLT&&[L[675 M;5+B\(%O&7YDRQ48^I&!ZF@".R\):78>*KWQ)"LW]HWD?E2LTA*[?EX`[?<6 MGW'A?3;KQ9;>)94E.HVT'D1D/A0OS]1Z_.U5[SQUX9L6N4N-9M4>VF6"8;B2 MDA)`4X]P?I@YQ@UM6-]:ZE917EE.D]M*,QR(2%9!*A1RK(X!`88]F/!R.>EF#7344`>>K\%O!HNWF:TNFB8<6YNG\M3V/'S9^I-3_\` M"IO#?]B1Z4#?K%%)V`!VGH.%';^9KNZ*`,'PQX/TCPE;2Q:7"X: M8@S2RR%WD([DG\>F!R:WJ**`"BBB@#S34++5O`NN:KJ=C!-=^&-2+7%]'%(! M+8RL1YDZ@@EAM!.!^@49R9]4>2;3]575X1<2*+?2_$JQ_N[L,Q(L[F(#Y"3R M6(`&,C:I?#[0K^_GN=MS;"]<&^AMYBD5W@[OG7IDDO%2Z#X;TCPS9R6FCV2VL$DAE=0S-EL`9RQ)Z`#' M2M7I0`4444`> M+-9O8K8/;7/APV$3EU&Z8O(=F"<]&7GIS7:T4`>9Z5X;U6PM[?3K_0;F_M+R MRM([EX=2$(MV2%(GC=`XWJ-A;5VQGC'F.VN]8\)74(MS;W\]J6BB=U8PS8 MW)D@X)5P.AQQZ5LXI:`//;CPMJ+:#I*Q:?&;Z_ED36U,BC9#=?/=`'/.&"@; M?3BH-9TKQ7>>)M/C&F"32;'5X+F!HIX4C6!4V'Y3\Y<%V)YQA0`,UZ33)(DF MB>.1`Z.I5E89!!Z@T`<)X'TJ9_$&JZH]T9;*REN--TU`FU5B\WS'QZ@,%C!] M(L]ZL7VDZQ)/XDT^'3P\&H2B]ANVF41LRQQ+Y++G<-QBP3C&&]L'LK>WBM;> M.W@C6.&)0D<:`!54#```Z`"I*`.0TBQU74/&0\1ZCI?]EB+338B!YDE>1FD5 MRV4)&P;<#/)R3@5BR^%-8>_,OV,%/^$P75,^8G_'L(`N_K_>&,=?:O2<44`> M92^$_$0MM8>P"VE[)8V?KV.'P>3Y8'>KR^&I]+U&32TT6ZU M'1;E;=!/'J/E"W5$2+8\9<;@`F[<,DYQBN_HH`\ZDTCQ(USJAM-/E@TM'CNH M=/GNHW,]TMRLS-&^3L1E7A6(`+?='-=Y833W%C%+=6C6DSC+0,ZN8_8E>"?I 8D>YJS10`4444`%%%%`!1110`4444`?_9 ` end GRAPHIC 13 pr1010img000.jpg GRAPHIC begin 644 pr1010img000.jpg M_]C_X``02D9)1@`!`@```0`!``#_VP!#``@&!@<&!0@'!P<)"0@*#!0-#`L+ M#!D2$P\4'1H?'AT:'!P@)"XG("(L(QP<*#7J#A(6&AXB)BI*3E)66EYB9FJ*CI*6FIZBIJK*SM+6VM[BYNL+#Q,7& MQ\C)RM+3U-76U]C9VN'BX^3EYN?HZ>KQ\O/T]?;W^/GZ_\0`'P$``P$!`0$! M`0$!`0````````$"`P0%!@<("0H+_\0`M1$``@$"!`0#!`<%!`0``0)W``$" M`Q$$!2$Q!A)!40=A<1,B,H$(%$*1H;'!"2,S4O`58G+1"A8D-.$E\1<8&1HF M)R@I*C4V-S@Y.D-$149'2$E*4U155E=865IC9&5F9VAI:G-T=79W>'EZ@H.$ MA8:'B(F*DI.4E9:7F)F:HJ.DI::GJ*FJLK.TM;:WN+FZPL/$Q<;'R,G*TM/4 MU=;7V-G:XN/DY>;GZ.GJ\O/T]?;W^/GZ_]H`#`,!``(1`Q$`/P#W^BBL[6=> MTOP]9-=ZK?06L(!QYC@%R!G"CJQXZ#F@"IXK\46'A/0Y=2OB&(^6*`,`TSGH MHSU]3Z`$]JX#5O%/BC5I)=.@DM=,-Y;H]D4F_=WJ'&X077:8DX4;.!R>Q#M? MB\3^.IK/7M#TW[)8Z=')Y=IJJE'U#`E;NWN5 M9]4T^3&3YHX#Q``G=U.[K@5Z/H^M:=KVG1W^EW<5U;OCYHV!VD@':P_A8`C( M/(S6+IGA6:.XAN=2NA)>6 M/4>(2)X>\02"+RU(V6]\QX(7@*K*,<9Y]@*`/2****`"BBB@`HHHH`****`" MBBB@`HH)`ZFB@`HHHH`****`"BBB@`HHHH`****`"BBB@`HHHZT`%%(2%&20 M/K2T`8'B_P`2)X9T)[I8VFO9F%O96ZH6,T[`[%P.<9ZXYP#7-^$_!MGO1G;,DKK+#8R$B3RT7D*RDCZ9X`S6=XJGOI?B&\"PN]Y]D$.FJ^##: M1MDR7Y)X#(?EV\$@#GFI_#.LVFG+:31W!31&F^PP3>2?.UJ_?`><]3@E6Y/4 MY)(`%`'IMKOB;QU9^' MM0@T]+::^N_DFNHH$6![>22-7:&0@M&2,E3@D9'3@ MXK'\:Q:1+X1U$:W(D-BL+,9CC=&P!VLF?XP<;>^<5S6G?$#4;5-1_M?26N-. MTF=[2[UFSD789$QN8PMAE&""=NX`Y`SBFWRW/B<#Q%J>G2RZ+9_/I6DCYCJ$ MI(\J=\?=#;@H1A\N2S$#B@##T#XDZ_I5AITGB6VAELYHMD,,,;G49(U7(N70 ML08R%.3P2>1Q7KEG=P7]E!>6TBRV\\:RQ2+T96&01]0:\9U"TNWGU2&[N]FJ M7,)N=;U`_O%T>Q(W?9(R"=S?>^[C([=Z[3X6:A]I\+-:>=.ZV!,G('H<#/KEEY M&2:Q-=/BCX67=GK)\076N:--*EO=07SL\@)R24R<#Y5.#GJ1D&K,MW#X>_:& M>2_DVIJ]BD5NQZ!CM4#\6B([=15_XX74(LT@3]TV,')XSR.,YIUAXT\-ZI:75U9:Q:S16D;2 MSX;#1HHR6*GG;[XQ7F$6A0M\4/!6DZO913&#PW"DT$RAU\Q%E'(Z'!'O3?$^ MGV6F?$77+?1;>"W@?PO=/=Q0(%524?L..<1_G0!Z2_Q#\(1FV#>(+$?:%#)^ M\Z`]"W]S_@6,5K7^N:5IFG+J%]J%M;V;@%)I)0%?(R`I_B)`)`'7M7DNC:!H M+_`.?4;K3K(W9M+B47+Q+YGFAF"?-C/4**Y;5+W59#\.-.FC6>(6\4D%K.^( M9G\UEC#>VP(/HQ]30![MI_C+PYJEC^*K2? M$/PA%;V\S>(+'9/]P"3+=<9*CE1D$<@=*XA?"6LVUSXL\3:K8:9IRW.B7%O] MELFW;CM!W'@#^'\<)!Y93?$=V[IMQSFNVTSQIX;UG46T_3M9M+ MFZ&?W:/]['7:>C?AFO%VC34/"WPOM[M?/AEU!X71^0R&=5VGVQQ6QXVTVQTC MXR>#$TRT@LD=XMR6T8C!_>D=%`[$CZ4`>H:IXU\-:)>K9ZCK-K!7M[<3QW-Q=S!)H-_91M/`;)'/4>PJ]XA\.7OA7P1X0TO4+M;F= M-85SM)*Q[LG8">H&3Z=:`/6KKQCXLA;Q-LM`'K^E^(-(UO3WO]-U""XM8R0\J-PA`R0V>AP0>:S[7QYX5OM3&G6V MO6,ETS!402<.Q.`%;HQ)Z`$YKQ47-QI>D?$^UT]?+MDOE@$48PL<1GD0@`=! MMPOTK:T_PEK_`(F\+>&(;/2-&TRVMC!<+J<$O[]@J\DA5!W$X8C/WEZ\9H`] M2E\<^%H)[V";7;*.6R)6=&DPRL."`.YR",#)SQUK@_$^JZIXA^)>AZ/HGB.Z ML-+O],6Z66U_B),IWGB/ M7_$\UZ]UO4FK'Q.8/\5/`N M"#_I,)X_Z^$Y_G0!Z+<^-_#%G>W=G?2;^&[C0X?RSRI[9!Y'XUYM#H^FZG^T%J\-_86]S$FG+,L">37(:9/-I'B#XFQZ:IA2.VN52.$[!&!-M!4#IM5FQCI0!Z?XU\=>&H_ M#VM:6FNVW]H/93QQQPR%CYFQ@%W+P&SQC.:7P'K-AI'PKT>]U6^AM8!&P\V= MPN3O?@9ZG@\#DUS?A_1]`_X49?WEK:VD]RVFW+SSM$"ZS!&R,GD;3C'X$=:@ M'AC4O%'P/\/0:4(9+NTE^U)#+C$F#(-O/RY^;^+@\@]:`.OU-K#XA:4LFAZG M%=6\)='"$C#G:5)!QC`!'T8XKKK*)[>Q@ADP'1`"`VX#V!P,@>N!7#?#3Q7! MJTNI:++HT&E:M8./MD=NJA)7'R,YV@`'*XQD\`8)%>A8H`\Y^*'A\RPP:[:V M5Y=.FVVU*&VEVF:Q!:1D(R#@N%&1R`Q[5R^B:G`KL!M)!^8]#C[K>W5Q/BWPC;);?V[H-G;VNMV$YOT>&$*UT5!+1 M,1R0X)'UH`W?#?AVV\.:>T$1,MSLGVEE8QIN7^'.3AOEZUT?AK7[7Q/X?L]6M"`D\8+Q MYR8G_B0].0^/F;\6R?QK5KS_1O$Q\-S6&E:M]1?['UG! MVRJV!'#)@<.%.=YP&`R<'-6]5\J2?,LLCYR%!R,'`)'H%!Z_P M9H,^AZ,S7\IEU6^E-Y?R$\&9P-RKC@*N`!CCC/>LO0?`6(XK8>B*.N"6YXZ]`>:[:@##\2^$M'\6V:6VKVOFK&Q:-T+3K:Y MANKR"S5GNVC8/*X4$@1MP,^N?:LRZ\,M(MM>^.>CZ=#/$UQ91RR7=QIMSY]W]\1Z)I^H6ME=ZC:PWEV!Y M$;.-S@G`Q[$Y`I=7U*ZL[BSM;.RAN9;KS`!-.8E&U=V,A6Z]*`/,/A]\-M#\ M0>"=*OM2DOIHI"\CV7VDB`N&9=VT<@X&.#7HNO\`@S0_$FDP:;J-IF"W_P"/ M?RG*&'Y=HVX[8['(X''%2:3KRZA::=<2+!:BXM))Y(&DW-&4*AL'`!52Q!;C ML>]4[CQOHT]A)+I.JV5S+%-$LB>8"51I41FQP<`/][I0!5T7X::%H=M>Q0-> MSR7=J]F\]Q.7986'**.`!T[=JOZ5X)TC1O"MYX=M!.+&[6192TF7/F+M;!QQ MQ[4LOCOPQ%IBZD=8MFLFNA9^PVHFC?`19Z'%;:);A;DQZ-,9[0&7G>7#Y;U MY'2K>J^#=)UK7]/UN\25KS3]I@*2%5!#;AD=^:AM_&VG3^)M7T8_(-,@\Z2X M))4[0#(,8_AW)GG^+VIVE^-]&OX+3S[RWMKNYM!>K:F7UN"GF,3DD@YQGOC%:EUX'T6[TO2M.DBF%KI MDJS6Z"4YW#NQ/)SSGGO6Q!JMC=)9O!GQ:I;F[M&=9XF.TIL&6//8=STH`1Y`8O\H3Z5 M%8^$-*T[Q3>^(X$E_M&\0QRLTA*[3M.`.WW%JYI&OZ5KT4DNE7\%VD3;7,39 MP<9_+T/0UEVWC73P-5?4Y(=/AL=2?3UDEER)2L2RD]!CY2W'/W>M`#['P1HE MA+KCI;O(-;9S?+)(2'#%B0/0?.U8^G_"3PQIFJQ7]LM\HBF6>.W-VQB#J05) M'5L$#J3[UT^G>)-'U>6*+3]1M[F26%ID6-LDHK!6/X$@'ZU%+XLT&&[L[675 M;5+B\(%O&7YDRQ48^I&!ZF@".R\):78>*KWQ)"LW]HWD?E2LTA*[?EX`[?<6 MGW'A?3;KQ9;>)94E.HVT'D1D/A0OS]1Z_.U5[SQUX9L6N4N-9M4>VF6"8;B2 MDA)`4X]P?I@YQ@UM6-]:ZE917EE.D]M*,QR(2%9!*A1RK(X!`88]F/!R.>EF#7344`>>K\%O!HNWF:TNFB8<6YNG\M3V/'S9^I-3_\` M"IO#?]B1Z4#?K%%)V`!VGH.%';^9KNZ*`,'PQX/TCPE;2Q:7"X: M8@S2RR%WD([DG\>F!R:WJ**`"BBB@#S34++5O`NN:KJ=C!-=^&-2+7%]'%(! M+8RL1YDZ@@EAM!.!^@49R9]4>2;3]575X1<2*+?2_$JQ_N[L,Q(L[F(#Y"3R M6(`&,C:I?#[0K^_GN=MS;"]<&^AMYBD5W@[OG7IDDO%2Z#X;TCPS9R6FCV2VL$DAE=0S-EL`9RQ)Z`#' M2M7I0`4444`> M+-9O8K8/;7/APV$3EU&Z8O(=F"<]&7GIS7:T4`>9Z5X;U6PM[?3K_0;F_M+R MRM([EX=2$(MV2%(GC=`XWJ-A;5VQGC'F.VN]8\)74(MS;W\]J6BB=U8PS8 MW)D@X)5P.AQQZ5LXI:`//;CPMJ+:#I*Q:?&;Z_ED36U,BC9#=?/=`'/.&"@; M?3BH-9TKQ7>>)M/C&F"32;'5X+F!HIX4C6!4V'Y3\Y<%V)YQA0`,UZ33)(DF MB>.1`Z.I5E89!!Z@T`<)X'TJ9_$&JZH]T9;*REN--TU`FU5B\WS'QZ@,%C!] M(L]ZL7VDZQ)/XDT^'3P\&H2B]ANVF41LRQQ+Y++G<-QBP3C&&]L'LK>WBM;> M.W@C6.&)0D<:`!54#```Z`"I*`.0TBQU74/&0\1ZCI?]EB+338B!YDE>1FD5 MRV4)&P;<#/)R3@5BR^%-8>_,OV,%/^$P75,^8G_'L(`N_K_>&,=?:O2<44`> M92^$_$0MM8>P"VE[)8V?KV.'P>3Y8'>KR^&I]+U&32TT6ZU M'1;E;=!/'J/E"W5$2+8\9<;@`F[<,DYQBN_HH`\ZDTCQ(USJAM-/E@TM'CNH M=/GNHW,]TMRLS-&^3L1E7A6(`+?='-=Y833W%C%+=6C6DSC+0,ZN8_8E>"?I 8D>YJS10`4444`%%%%`!1110`4444`?_9 ` end GRAPHIC 14 pr1010img001.jpg GRAPHIC begin 644 pr1010img001.jpg M_]C_X``02D9)1@`!`0```0`!``#_VP!#``@&!@<&!0@'!P<)"0@*#!0-#`L+ M#!D2$P\4'1H?'AT:'!P@)"XG("(L(QP<*#7J#A(6&AXB)BI*3E)66EYB9FJ*CI*6FIZBIJK*SM+6VM[BYNL+#Q,7& MQ\C)RM+3U-76U]C9VN'BX^3EYN?HZ>KQ\O/T]?;W^/GZ_\0`'P$``P$!`0$! M`0$!`0````````$"`P0%!@<("0H+_\0`M1$``@$"!`0#!`<%!`0``0)W``$" M`Q$$!2$Q!A)!40=A<1,B,H$(%$*1H;'!"2,S4O`58G+1"A8D-.$E\1<8&1HF M)R@I*C4V-S@Y.D-$149'2$E*4U155E=865IC9&5F9VAI:G-T=79W>'EZ@H.$ MA8:'B(F*DI.4E9:7F)F:HJ.DI::GJ*FJLK.TM;:WN+FZPL/$Q<;'R,G*TM/4 MU=;7V-G:XN/DY>;GZ.GJ\O/T]?;W^/GZ_]H`#`,!``(1`Q$`/P#=_P"%'>"_ M^>%[_P"!)_PH_P"%'>"_^>%[_P"!)_PKTBJ6KW4EGILDT1"L&1"_\`GA>_^!)_PK>BUS4IK&2Y3R3Y M>UG4H1MRSKMQUZ*IP>?F]*Z."X^T6\??\*.\%_\ M\+W_`,"3_A1_PH[P7_SPO?\`P)/^%>BEGYQ'G_@7U_\`K?G06?G$>?\`@7U_ M^M^=`'G7_"CO!?\`SPO?_`D_X4?\*.\%_P#/"]_\"3_A7HI9^<1Y_P"!?7_Z MWYT%GYQ'G_@7U_\`K?G0!YU_PH[P7_SPO?\`P)/^%'_"CO!?_/"]_P#`D_X5 MZ*6?G$>?^!?7_P"M^=!9^<1Y_P"!?7_ZWYT`>=?\*.\%_P#/"]_\"3_A1_PH M[P7_`,\+W_P)/^%>BEGYQ'G_`(%]?_K?G06?G$>?^!?7_P"M^=`'G7_"CO!? M_/"]_P#`D_X4?\*.\%_\\+W_`,"3_A7HI9^<1Y_X%]?_`*WYT%GYQ'G_`(%] M?_K?G0!YU_PH[P7_`,\+W_P)/^%'_"CO!?\`SPO?_`D_X5Z*6?G$>?\`@7U_ M^M^=!9^<1Y_X%]?_`*WYT`>=?\*.\%_\\+W_`,"3_A1_PH[P7_SPO?\`P)/^ M%>BEGYQ'G_@7U_\`K?G06?G$>?\`@7U_^M^=`'G7_"CO!?\`SPO?_`D_X4?\ M*.\%_P#/"]_\"3_A7HI9^<1Y_P"!?7_ZWYT%GYQ'G_@7U_\`K?G0!YU_PH[P M7_SPO?\`P)/^%'_"CO!?_/"]_P#`D_X5Z*6?G$>?^!?7_P"M^=!9^<1Y_P"! M?7_ZWYT`>=?\*.\%_P#/"]_\"3_A1_PH[P7_`,\+W_P)/^%>BEGYQ'G_`(%] M?_K?G06?G$>?^!?7_P"M^=`'G7_"CO!?_/"]_P#`D_X4?\*.\%_\\+W_`,"3 M_A7HI9^<1Y_X%]?_`*WYT%GYQ'G_`(%]?_K?G0!YU_PH[P7_`,\+W_P)/^%' M_"CO!?\`SPO?_`D_X5Z*6?G$>?\`@7U_^M^=!9^<1Y_X%]?_`*WYT`>=?\*. M\%_\\+W_`,"3_A1_PH[P7_SPO?\`P)/^%>BEGYQ'G_@7U_\`K?G06?G$>?\` M@7U_^M^=`'G7_"CO!?\`SPO?_`D_X4?\*.\%_P#/"]_\"3_A7HI9^<1Y_P"! M?7_ZWYT%GYQ'G_@7U_\`K?G0!YU_PH[P7_SPO?\`P)/^%'_"CO!?_/"]_P#` MD_X5Z*6?G$>?^!?7_P"M^=!9^<1Y_P"!?7_ZWYT`>=?\*.\%_P#/"]_\"3_A M1_PH[P7_`,\+W_P)/^%>BEGYQ'G_`(%]?_K?G06?G$>?^!?7_P"M^=`'G7_" MCO!?_/"]_P#`D_X4?\*.\%_\\+W_`,"3_A7HI9^<1Y_X%]?_`*WYT%GYQ'G_ M`(%]?_K?G0!YU_PH[P7_`,\+W_P)/^%'_"CO!?\`SPO?_`D_X5Z*6?G$>?\` M@7U_^M^=!9^<1Y_X%]?_`*WYT`>=?\*.\%_\\+W_`,"3_A1_PH[P7_SPO?\` MP)/^%>BEGYQ'G_@7U_\`K?G06?G$>?\`@7U_^M^=`'G7_"CO!?\`SPO?_`D_ MX4?\*.\%_P#/"]_\"3_A7HI9^<1Y_P"!?7_ZWYT%GYQ'G_@7U_\`K?G0!YU_ MPH[P7_SPO?\`P)/^%'_"CO!?_/"]_P#`D_X5Z*6?G$>?^!?7_P"M^=!9^<1Y M_P"!?7_ZWYT`>=?\*.\%_P#/"]_\"3_A1_PH[P7_`,\+W_P)/^%>BEGYQ'G_ M`(%]?_K?G06?G$>?^!?7_P"M^=`'G7_"CO!?_/"]_P#`D_X4?\*.\%_\\+W_ M`,"3_A7HI9^<1Y_X%]?_`*WYT%GYQ'G_`(%]?_K?G0!YU_PH[P7_`,\+W_P) M/^%'_"CO!?\`SPO?_`D_X5Z*6?G$>?\`@7U_^M^=!9^<1Y_X%]?_`*WYT`>= M?\*.\%_\\+W_`,"3_A1_PH[P7_SPO?\`P)/^%>BEGYQ'G_@7U_\`K?G06?G$ M>?\`@7U_^M^=`'G7_"CO!?\`SPO?_`D_X4?\*.\%_P#/"]_\"3_A7HI9^<1Y M_P"!?7_ZWYT^@#S?_A1W@O\`YX7O_@2?\**](HH`*KWU[%I]HUS-G8K*O!`Y M9@HZD#J15BH;J&*>W9)B50$-N#8VE2"#GV(!H`@L-3AU`R")'78`Z-^56VDC0X9U4@9Y./7_`_E5/3K.PL_,6R*X&%8"3=M`R0.O'+$_C5Z@! MAFB&_^!_(T M&:(9S(@QU^8>_P#@?R-/HH`89HAG,B#'7YA[_P"!_(T&:(9S(@QU^8>_^!_( MT^B@!AFB&_ M^!_(T&:(9S(@QU^8>_\`@?R-/HH`89HAG,B#'7YA[_X'\C09HAG,B#'7YA[_ M`.!_(TYF"*68X`&2:QK3Q9HM]=V]K;W;&>X+"-&@D0Y`8X.Y1M.$8@'&<'&: M`-OW@`21UX-12Z]H\#R)+JUC&T4@BD5KA`4/8UP]EX?TJPOK2[C\86TKVMY)=()9(2&WQ[&W8QEB0"3WY[\U)=Z99 MW-]XG226W+Y5P-^X?ZS@DL`2N,J"#G-`'=PZC8W&?(O+>7&<[)5 M;&,YZ'V/Y&IC-$,YD08Z_,/?_`_D:Y;3XM,M=_^!_(T^B@!AFB& M_^!_(T^BB@ M`HHHH`*J:G9G4-.GM!*8_-7:6`!X[@Y['H?8FK=4]4D>+3I7C$S."H`A4ECE M@.P)`]2`2!D]J`*^D:9+I[2F61'W*%4KW^=WR?3[^,>WO@:31ACDENF.&(]? M\?\`.*RM%DOF>=;QY7V@8=XM@+;W&0,#C:$/X^N:U6\S/RA2,=S]?_K4`(8E M.>7Y_P!L^_O[_P`O04&)3GE^?]L^_O[_`,O04$R\X">W)]__`*WZT$R\X">W M)]__`*WZT`!B4YY?G_;/O[^_\O04&)3GE^?]L^_O[_R]!03+S@)[7Y_VS[^_O_+T%!B4YY?G_;/O M[^_\O04$R\X">W)]_P#ZWZT$R\X">W)]_P#ZWZT`!B4YY?G_`&S[^_O_`"]! M08E.>7Y_VS[^_O\`R]!03+S@)[?#>XO[F\D\58EFN8[ MD>7(R!"DC28``[L[\]>?7FMW1M<\%S^(H_[+\1*UQ<;D2SANJ^&N?\`A8^A;<9^TC&?H:`/K@Q*<\OS_MGW]_?^7H*#$ISR_/\` MMGW]_?\`EZ"@F7G`3VY/O_\`6_6@F7G`3VY/O_\`6_6@`,2G/+\_[9]_?W_E MZ"@Q*<\OS_MGW]_?^7H*Y>]\07UGXYCTZ3RDT\V@E)/7/[TEB7Y_V MS[^_O_+T%!B4YY?G_;/O[^_\O05SVAZQJ$U_)IFH*C7:1-()(Q^[95@H)EYP$]N3[__`%OUK#U_7+K1[W38TAA:&YEV2N6!9071%PN03RZY(!QG MI0!N&)3GE^?]L^_O[_R]!08E.>7Y_P!L^_O[_P`O05R7B+Q;J&CW-U##:VCJ MD4,D,C2L0P=V4[@`,8V]B>O7M5C2_$]U<7L=MJ%I%:-."]N-Q?>AQL.1D#.> M@H)EYP$]N3[_\` MUOUH)EYP$]N3[_\`UOUH`#$ISR_/^V??W]_Y>@H,2G/+\_[9]_?W_EZ"LOQ% M)J$>AW3V$DD=V!B$PJKMO)PN0RL,9*YXZ9]*YSQ5J?B.TN[2'2)IV7R)DD9; M0OF148[V_=G_`&2`O4Y&#P*`.W,2G/+\_P"V??W]_P"7H*#$ISR_/^V??W]_ MY>@KB+75_$=O:P7]PMS=V[!\P+`/,8*Y4-PBXW<,..AQ@8R>W)EYP$]N3[__ M`%OUH`#$ISR_/^V??W]_Y>@J"[FM+*`S7=P((L[=\DI49.0!UZ\_R]!4Y,O. M`GMR??\`^M^M8GBA["32FLM2U&QL!.08GN957)5@>`Q&?X>G3/Y@&E]KL6:Z M'VM,VIQ42-WS<_+PV?ICT%5O[]9]K8^';>3]YXJT*: M-;$6H4RQCC((IDWH[,I)&5<^I![^Y_3T%.,2G M/+\_[9]_?W_EZ"L+PU-;?9[JWLM;M-41)2R"*8/Y$9&$0X)X^7KQWXXK=)EY MP$]N3[__`%OUH`#$ISR_/^V??W]_Y>@H,2G/+\_[9]_?W_EZ"@F7G`3VY/O_ M`/6_6@F7G`3VY/O_`/6_6@`,2G/+\_[9]_?W_EZ"@Q*<\OS_`+9]_?W_`)>@ MH)EYP$]N3[__`%OUH)EYP$]N3[__`%OUH`#$ISR_/^V??W]_Y>@K`\`O M$)RV?[.N#]X_W&_Q_EZ"M\F7G`3VY/O_`/6_6L#QSYG_``@7B'(7']G7'?\` MV&_^M^M`'QY1110!O^!P&\>^'P@ MKX\\#Y_X3WP_MQG^T8,9_P"N@K[#)EYP$]N3[_\`UOUH`#$ISR_/^V??W]_Y M>@H,2G/+\_[9]_?W_EZ"@F7G`3VY/O\`_6_6N8UD:Y'XNTRXM%GDT]$C$DQXSR"..IH`Z6 M^P[;V60C."W5>>22._(QCI0!T9B4YY?G_;/O[^_\O04^F$R\X">W)]__`*WZ MT^@`HHHH`***CFGCMXC+*V$!`X!)R3@``=3DB@"M9:A]KN+B(Q;/*/!W9W#> MZ>G'*'UZBGS7R6\S1R1SD8!4QP.X/XJ"*98R6$KS/9-&S,=SLG?)/(]L[NG& M=W?-7:`,/4?&&@:0T:ZGJ*V32`E!K^.+O3)=,N+*);6.17^TNRDEB",;5/I7GG_"@/%?_/\`Z-_W^E_^-T`> MS_\`"R?!G_0Q6/\`WW5_3O%NAZNLC:9??;5C(#FVB>0*3TSM!Q7A/_"@/%?_ M`#_Z-_W^E_\`C=>F_"KP)JG@>TU.+4Y[25KJ2-D^S.S`!00<[E'K0!VAU6'S M%`AN]F#D_9)>#QC^'Z_E5?4/$^D:3;BXU&Z:SA+!!)#^5:] M>6?'W_D0;7_L(Q_^BY*`.J_X63X,_P"ABL?^^Z/^%D^#/^ABL?\`ONOD.B@# M[&T_QMX.6?6/!.K:=86MW-=7$!2*/[+(NXY M'K_`-J6_P#SSN__``#E M_P#B:NT4`4(]5A,:EX;M7(&X?9)>#_WS7$:QXJ\4?VJZ6_P[?4+>VF)M;F28 M*3CHX5DRI_6O1J*`/*Y/%/BV:$PR_"L/$4"%&N$*[0<@8V=`>@J4^,?&9D60 M_#!RZ-N5C=+D'&,@[.N./I7I]%`&1INM/<:;;S7]A=VEV\8:6W%O))Y;=UW! M<'ZU83583NW0W8YX_P!$EY'_`'S5^B@#R[QMK?Q$CU\+X3L)9=-\EZT4`>%?V_\:O^@4W_`("Q_P"->B^"=8U^ M302WBRUN(M2\YL*EHQ'EX&/N`CUKL**`*`U6'S&!AN]F!@_9)>3SG^'Z?G7E MOQGT/5O%D>BC1--N[HVQF,O[EDV[MF/O`9^Z>E>PT4`?(W_"L?&O_0O7?_CO M^-'_``K'QK_T+UW_`.._XU]-?!C0=7\)RZT=;TR[M1,?P_6K]%`&3?>)=*TNV-SJ%P]I`"%,MQ! M)&N3T&2H%9G_``LGP9_T,5C_`-]U@?''_DF\W_7U%_,U\Q4`?7G_``LGP9_T M,5C_`-]U9L?''AK5+D6VGZM#=SD%A%;AI&P.IP`37QU7H_P._P"2D0_]>LO\ MA0!]'OJL(`V0W9.1G_1)>F>?X:RO%<_]I>$-9L;2WNY+FXLIHHD^RR#FJ_]\QU]%44`9UMJ<8M81-'>>;L&_P#T27[V.?X: MNP2&6%)"I4L,X(((_`\BI**`"BBB@`JK?6CW<#+%.\,A&`P+8QD9&`1U&1GJ M,\&K54=5COIK":.Q9%D="H)8JW/H1T.,X/KB@!-.TP:>\K"16#C"JJ;0HW.V M.I[N?P`JZT:.HK&M M-)U".\UF22SNQ]IA6&'%RA1CL.9,ER5.21C:,#UR<=<1+SAT]OD/O[_3\CZ\ M!$O.'3V^0^_O]/R/KP`>;6/A7Q!/J-FMXMW;V20,C,MRF\#?,P#`-@L=T><# M!&OZ_XG\ZY+XB>#)?&OAV+3+:ZBM7 M2Z6B>#]8TC6++4 M(XK)?)MF5X@XVAR9V*I\N54M)'T/1"#DX-57\!ZXVMM>*]D(FU)KG!;=PTN[ M?@KU"\#^($G#`8P`1_#SX3W7@OQ%+J5UJ5O=H]J\'EI&5(+,ISS[*?SKT\PQ MG.4'/7]?\3^=<[H>BZCHM\\$3V_]F&-MN\%I0V]BHXP-N#NQZLP]*Z(B7G#I M[?(??W^GY'UX``PQG.4'/7]?\3^=!AC.OZ_XG\Z")><.GM\A]_?Z?D?7 M@(EYPZ>WR'W]_I^1]>``,,9SE!SU_7_$_G088SG*#GK^O^)_.@B7G#I[?(?? MW^GY'UX")><.GM\A]_?Z?D?7@`##&OZ_P")_.@B M7G#I[?(??W^GY'UX")><.GM\A]_?Z?D?7@`##&WR'W]_I^1]>`B7G#I[?(??W^GY'UX``PQG.4'/7]?\3^=!AC. MOZ_XG\Z")><.GM\A]_?Z?D?7@(EYPZ>WR'W]_I^1]>``,,9SE!SU_7_$ M_G088SG*#GK^O^)_.@B7G#I[?(??W^GY'UX")><.GM\A]_?Z?D?7@`##&OZ_P")_.@B7G#I[?(??W^GY'UX")><.GM\A]_?Z?D? M7@`##&WR'W]_I^1]>`B7G#I[?(? M?W^GY'UX``PQG.4'/7]?\3^=!AC.OZ_XG\Z")><.GM\A]_?Z?D?7@(EY MPZ>WR'W]_I^1]>``,,9SE!SU_7_$_G088SG*#GK^O^)_.@B7G#I[?(??W^GY M'UX")><.GM\A]_?Z?D?7@`##&OZ_P")_.@B7G#I M[?(??W^GY'UX")><.GM\A]_?Z?D?7@`##&WR'W]_I^1]>`B7G#I[?(??W^GY'UX``PQG.4'/7]?\3^=!AC. MOZ_XG\Z")><.GM\A]_?Z?D?7@(EYPZ>WR'W]_I^1]>`#SCXX1H/AQ,0H!^U1 M?S/^)KYDKZL^*N@ZKXB\$RV&EVXN;DW$;B,$(<`G/+$#T_ST\)_X5%XZ_P"@ M"_\`X$0__%T`<37HWP057^(\(8`C[+-U^E9__"HO'7_0!?\`\"(?_BZ[7X5_ M#_Q5X=\;1W^IZ6;6V%O(AD:6-P"1QPK9H`]W,,9SE!SU_7_$_G088SG*#GK^ MO^)_.@B7G#I[?(??W^GY'UX")><.GM\A]_?Z?D?7@`##&OZ_P")_.@B7G#I[?(??W^GY'UX")><.GM\A]_?Z?D?7@`##&WR'W]_I^1]>`B7G#I[?(??W^GY'UX``PQ MG.4'/7]?\3^=!AC.OZ_XG\Z")><.GM\A]_?Z?D?7@(EYPZ>WR'W]_I^1 M]>``,,9SE!SU_7_$_G088SG*#GK^O^)_.@B7G#I[?(??W^GY'UX")><.GM\A M]_?Z?D?7@`##&O M96V88VDF9T51L)'S.J\G('?."1FKU5[Z6""S=[E`\7"E2`=V2`!SQU(ZT`4= M%U5]3$C,$V;`Z%01P7=>_O[?K533[VSO#*;1<=&8 M[-N_DKG\U(YYX^E7"RCJP'U-`#2[#/[IS^(YZ^_M^H]\!=AG]TY_$<]??V_4 M>^%WJ/XA^?\`GT-&]1_$/S_SZ&@!"[#/[IS^(YZ^_M^H]\!=AG]TY_$<]??V M_4>^%WJ/XA^?^?0T;U'\0_/_`#Z&@!"[#/[IS^(YZ^_M^H]\!=AG]TY_$<]? M?V_4>^%WJ/XA^?\`GT-&]1_$/S_SZ&@!"[#/[IS^(YZ^_M^H]\!=AG]TY_$< M]??V_4>^%WJ/XA^?^?0T;U'\0_/_`#Z&@!"[#/[IS^(YZ^_M^H]\!=AG]TY_ M$<]??V_4>^%WJ/XA^?\`GT-&]1_$/S_SZ&@!"[#/[IS^(YZ^_M^H]\!=AG]T MY_$<]??V_4>^%WJ/XA^?^?0T;U'\0_/_`#Z&@!"[#/[IS^(YZ^_M^H]\!=AG M]TY_$<]??V_4>^%WJ/XA^?\`GT-&]1_$/S_SZ&@!"[#/[IS^(YZ^_M^H]\!= MAG]TY_$<]??V_4>^%WJ/XA^?^?0T;U'\0_/_`#Z&@!"[#/[IS^(YZ^_M^H]\ M!=AG]TY_$<]??V_4>^%WJ/XA^?\`GT-&]1_$/S_SZ&@!"[#/[IS^(YZ^_M^H M]\!=AG]TY_$<]??V_4>^%WJ/XA^?^?0T;U'\0_/_`#Z&@!"[#/[IS^(YZ^_M M^H]\!=AG]TY_$<]??V_4>^%WJ/XA^?\`GT-&]1_$/S_SZ&@!"[#/[IS^(YZ^ M_M^H]\!=AG]TY_$<]??V_4>^%WJ/XA^?^?0T;U'\0_/_`#Z&@!"[#/[IS^(Y MZ^_M^H]\!=AG]TY_$<]??V_4>^%WJ/XA^?\`GT-&]1_$/S_SZ&@!"[#/[IS^ M(YZ^_M^H]\!=AG]TY_$<]??V_4>^%WJ/XA^?^?0T;U'\0_/_`#Z&@!"[#/[I MS^(YZ^_M^H]\!=AG]TY_$<]??V_4>^%WJ/XA^?\`GT-&]1_$/S_SZ&@!"[#/ M[IS^(YZ^_M^H]\!=AG]TY_$<]??V_4>^%WJ/XA^?^?0T;U'\0_/_`#Z&@!"[ M#/[IS^(YZ^_M^H]\!=AG]TY_$<]??V_4>^%WJ/XA^?\`GT-&]1_$/S_SZ&@! M"[#/[IS^(YZ^_M^H]\!=AG]TY_$<]??V_4>^%WJ/XA^?^?0T;U'\0_/_`#Z& M@""YFN8XMUO:><^X95I`G'.2#SSQP/<;`+8 M%`F'8$,F00,*H!Y;(QFO0MZC^(?G_GT-&]1_$/S_`,^AH`\^N=0\1?VG=0(V MK+&;Y#%,MDQ1$+2Y4C:ZUFUU`V.HQW-XNTA;ORPBG&X MYQT&3@^%WJ/XA^?^?0T;U'\0_/_/H:`$+L,_NG/XCGK[^WZCWP M%V&?W3G\1SU]_;]1[X7>H_B'Y_Y]#1O4?Q#\_P#/H:`$+L,_NG/XCGK[^WZC MWP%V&?W3G\1SU]_;]1[X7>H_B'Y_Y]#1O4?Q#\_\^AH`0NPS^Z<_B.>OO[?J M/?`789_=.?Q'/7W]OU'OA=ZC^(?G_GT-&]1_$/S_`,^AH`0NPS^Z<_B.>OO[ M?J/?`789_=.?Q'/7W]OU'OA=ZC^(?G_GT-&]1_$/S_SZ&@!"[#/[IS^(YZ^_ MM^H]\/IN]1_$/S_SZ&G4`%%%%`!56^T^"_BV2J`P((<*I9<,&XR#QD#BK5%` M%'3M*@TQ6$+R,"H7YR#@`L<=/5F//K5TJIZJ#]12T4`-V*?X1^7^?4U5DO[" M.5HI)HPX8(01W.3_`(U2HQDX]/F'/O[U9V*?X1^7^?4UG:=I'V!XY&G\QD0H<) MM!XC4=SVB'XD].E:=`#=BG^$?E_GU-&Q3_"/R_SZFG44`59[RSMI/+FD17(R M%(R3G.!]3S@=3@X[U&NIZ=(ZJMQ$Q<@#'._(%`#3JVF;-QN(\%=W3MG;Z>N M15X*C*"`I!YR._\`G-87_".R_.3>H6DR7_2"WB:6;:J#`)QGDG` M_,G]:@74=/DD"+/$S,<#'.>6ZLWAAF\EFQ\^TGC(R."#R M,C(((SD5CGPSNF+_`&O8I&W;%'MVKYOFX!SP=W&?3MWH`VX9(+F(2PLDD;9` M9>0>2#_6G[%/\(_+_/J:@T^S%A9K;K(7"L[!BH'WF+8P..,XJS0`W8I_A'Y? MY]322>5'&TDFQ44$LS<`#N3^M/IDJN\+K&X1V4A6*YVGL<=Z`*;:KIH#%KB, M8!+9'(P<'/N">1VSS5F&6"X5S%A@KE&.WN.OU[_K6(WAER=PO55\.<^23EW4 M*S'+-/29`ZD.^X!$V@<`=,GDXR3W]*`+>Q3_"/R_P`^IHV* M?X1^7^?4TZB@!NQ3_"/R_P`^IJFVIZPA.2"5*C[W&W:![CWYH`U8+NTNG9(71V`R1CIZ@^_/(ZC//6I]B MG^$?E_GU-9FFZ-_9][<7/GAVG9GD`3;EFVY[G@;>!VW'DYK5H`;L4_PC\O\` M/J:-BG^$?E_GU-.HH`IS7]A!*TF3[@YJG?Z+)?W$LCW2@$%8P8B3&I0HPSNQSN)SCTSD`5+I^D? M89$8S^8$!"C9C^%$!ZGD"/K_`+1Z4`:.Q3_"/R_SZFC8I_A'Y?Y]33J*`&[% M/\(_+_/J:@N+NSMG"3R(C,"V".V"?_BOKS5FL[4=-DOYHV^T*B1C*H8RA/KD`#_`.T].8@?:(CDJ.G7<"1^F3_.KFQ3_"/R_P`^IKGSX6+>7F]' M[M]Z_NNA(^8_>ZYY'8="#714`-V*?X1^7^?4T;%/\(_+_/J:=10!!<36ULJM M.R(';:"1U/)_ED_G5?\`M733_P`O$9ST`&2<]!]3S@=^V:EOK62[CB1)51%D M#2*R%A(HS\O!&.<'\,'()K'3PN48,;Q6(,1YB(YC0HIX8$<'/7J.W2@#?0Q2 MQK(FQT<;@PY!![_K^M+L4_PC\O\`/J:CL[<6=E!;*Q988UC#'J<#%34`-V*? MX1^7^?4TR9X88VDEVA1U.,Y)XQ[DD]/>I:@NX99[62*&;R9&&!)MSCGGN.WO M0!"FI:=(0%N8#N(`Y'S;LXQZ]&Z>A]ZG@EM[N$30E7C;."!]<_UK+B\/(D,D M)G'E-M"JD>W:`SL1U/=SCT`'7K6AI]HUG;&-Y1+(S%F8+M!)]!DXXQWH`L;% M/\(_+_/J:=110`4444`?&_\`PFOBO_H9M9_\#Y?_`(JC_A-?%?\`T,VL_P#@ M?+_\5110`?\`":^*_P#H9M9_\#Y?_BJ/^$U\5_\`0S:S_P"!\O\`\5110`?\ M)KXK_P"AFUG_`,#Y?_BJ/^$U\5_]#-K/_@?+_P#%444`'_":^*_^AFUG_P`# MY?\`XJC_`(37Q7_T,VL_^!\O_P`5110`?\)KXK_Z&;6?_`^7_P"*H_X37Q7_ M`-#-K/\`X'R__%444`'_``FOBO\`Z&;6?_`^7_XJC_A-?%?_`$,VL_\`@?+_ M`/%444`'_":^*_\`H9M9_P#`^7_XJC_A-?%?_0S:S_X'R_\`Q5%%`!_PFOBO M_H9M9_\``^7_`.*H_P"$U\5_]#-K/_@?+_\`%444`'_":^*_^AFUG_P/E_\` MBJ/^$U\5_P#0S:S_`.!\O_Q5%%`!_P`)KXK_`.AFUG_P/E_^*H_X37Q7_P!# M-K/_`('R_P#Q5%%`!_PFOBO_`*&;6?\`P/E_^*H_X37Q7_T,VL_^!\O_`,51 M10`?\)KXK_Z&;6?_``/E_P#BJ/\`A-?%?_0S:S_X'R__`!5%%`!_PFOBO_H9 MM9_\#Y?_`(JC_A-?%?\`T,VL_P#@?+_\5110`?\`":^*_P#H9M9_\#Y?_BJ/ M^$U\5_\`0S:S_P"!\O\`\5110`?\)KXK_P"AFUG_`,#Y?_BJ/^$U\5_]#-K/ M_@?+_P#%444`'_":^*_^AFUG_P`#Y?\`XJC_`(37Q7_T,VL_^!\O_P`5110` M?\)KXK_Z&;6?_`^7_P"*H_X37Q7_`-#-K/\`X'R__%444`'_``FOBO\`Z&;6 M?_`^7_XJC_A-?%?_`$,VL_\`@?+_`/%444`'_":^*_\`H9M9_P#`^7_XJC_A M-?%?_0S:S_X'R_\`Q5%%`!_PFOBO_H9M9_\``^7_`.*H_P"$U\5_]#-K/_@? M+_\`%444`'_":^*_^AFUG_P/E_\`BJ/^$U\5_P#0S:S_`.!\O_Q5%%`!_P`) MKXK_`.AFUG_P/E_^*H_X37Q7_P!#-K/_`('R_P#Q5%%`!_PFOBO_`*&;6?\` MP/E_^*H_X37Q7_T,VL_^!\O_`,5110`?\)KXK_Z&;6?_``/E_P#BJ/\`A-?% M?_0S:S_X'R__`!5%%`!_PFOBO_H9M9_\#Y?_`(JC_A-?%?\`T,VL_P#@?+_\ M5110`?\`":^*_P#H9M9_\#Y?_BJ/^$U\5_\`0S:S_P"!\O\`\5110`?\)KXK M_P"AFUG_`,#Y?_BJ/^$U\5_]#-K/_@?+_P#%444`'_":^*_^AFUG_P`#Y?\` JXJC_`(37Q7_T,VL_^!\O_P`5110`?\)KXK_Z&;6?_`^7_P"*HHHH`__9 ` end GRAPHIC 15 pr1010img002.jpg GRAPHIC begin 644 pr1010img002.jpg M_]C_X``02D9)1@`!`@```0`!``#_VP!#``@&!@<&!0@'!P<)"0@*#!0-#`L+ M#!D2$P\4'1H?'AT:'!P@)"XG("(L(QP<*#7J#A(6&AXB)BI*3E)66EYB9FJ*CI*6FIZBIJK*SM+6VM[BYNL+#Q,7& MQ\C)RM+3U-76U]C9VN'BX^3EYN?HZ>KQ\O/T]?;W^/GZ_\0`'P$``P$!`0$! M`0$!`0````````$"`P0%!@<("0H+_\0`M1$``@$"!`0#!`<%!`0``0)W``$" M`Q$$!2$Q!A)!40=A<1,B,H$(%$*1H;'!"2,S4O`58G+1"A8D-.$E\1<8&1HF M)R@I*C4V-S@Y.D-$149'2$E*4U155E=865IC9&5F9VAI:G-T=79W>'EZ@H.$ MA8:'B(F*DI.4E9:7F)F:HJ.DI::GJ*FJLK.TM;:WN+FZPL/$Q<;'R,G*TM/4 MU=;7V-G:XN/DY>;GZ.GJ\O/T]?;W^/GZ_]H`#`,!``(1`Q$`/P#W^BBL[6=> MTOP]9-=ZK?06L(!QYC@%R!G"CJQXZ#F@"IXK\46'A/0Y=2OB&(^6*`,`TSGH MHSU]3Z`$]JX#5O%/BC5I)=.@DM=,-Y;H]D4F_=WJ'&X077:8DX4;.!R>Q#M? MB\3^.IK/7M#TW[)8Z=')Y=IJJE'U#`E;NWN5 M9]4T^3&3YHX#Q``G=U.[K@5Z/H^M:=KVG1W^EW<5U;OCYHV!VD@':P_A8`C( M/(S6+IGA6:.XAN=2NA)>6 M/4>(2)X>\02"+RU(V6]\QX(7@*K*,<9Y]@*`/2****`"BBB@`HHHH`****`" MBBB@`HH)`ZFB@`HHHH`****`"BBB@`HHHH`****`"BBB@`HHHZT`%%(2%&20 M/K2T`8'B_P`2)X9T)[I8VFO9F%O96ZH6,T[`[%P.<9ZXYP#7-^$_!MGO1G;,DKK+#8R$B3RT7D*RDCZ9X`S6=XJGOI?B&\"PN]Y]D$.FJ^##: M1MDR7Y)X#(?EV\$@#GFI_#.LVFG+:31W!31&F^PP3>2?.UJ_?`><]3@E6Y/4 MY)(`%`'IMKOB;QU9^' MM0@T]+::^N_DFNHH$6![>22-7:&0@M&2,E3@D9'3@ MXK'\:Q:1+X1U$:W(D-BL+,9CC=&P!VLF?XP<;>^<5S6G?$#4;5-1_M?26N-. MTF=[2[UFSD789$QN8PMAE&""=NX`Y`SBFWRW/B<#Q%J>G2RZ+9_/I6DCYCJ$ MI(\J=\?=#;@H1A\N2S$#B@##T#XDZ_I5AITGB6VAELYHMD,,,;G49(U7(N70 ML08R%.3P2>1Q7KEG=P7]E!>6TBRV\\:RQ2+T96&01]0:\9U"TNWGU2&[N]FJ M7,)N=;U`_O%T>Q(W?9(R"=S?>^[C([=Z[3X6:A]I\+-:>=.ZV!,G('H<#/KEEY M&2:Q-=/BCX67=GK)\076N:--*EO=07SL\@)R24R<#Y5.#GJ1D&K,MW#X>_:& M>2_DVIJ]BD5NQZ!CM4#\6B([=15_XX74(LT@3]TV,')XSR.,YIUAXT\-ZI:75U9:Q:S16D;2 MSX;#1HHR6*GG;[XQ7F$6A0M\4/!6DZO913&#PW"DT$RAU\Q%E'(Z'!'O3?$^ MGV6F?$77+?1;>"W@?PO=/=Q0(%524?L..<1_G0!Z2_Q#\(1FV#>(+$?:%#)^ M\Z`]"W]S_@6,5K7^N:5IFG+J%]J%M;V;@%)I)0%?(R`I_B)`)`'7M7DNC:!H M+_`.?4;K3K(W9M+B47+Q+YGFAF"?-C/4**Y;5+W59#\.-.FC6>(6\4D%K.^( M9G\UEC#>VP(/HQ]30![MI_C+PYJEC^*K2? M$/PA%;V\S>(+'9/]P"3+=<9*CE1D$<@=*XA?"6LVUSXL\3:K8:9IRW.B7%O] MELFW;CM!W'@#^'\<)!Y93?$=V[IMQSFNVTSQIX;UG46T_3M9M+ MFZ&?W:/]['7:>C?AFO%VC34/"WPOM[M?/AEU!X71^0R&=5VGVQQ6QXVTVQTC MXR>#$TRT@LD=XMR6T8C!_>D=%`[$CZ4`>H:IXU\-:)>K9ZCK-K!7M[<3QW-Q=S!)H-_91M/`;)'/4>PJ]XA\.7OA7P1X0TO4+M;F= M-85SM)*Q[LG8">H&3Z=:`/6KKQCXLA;Q-LM`'K^E^(-(UO3WO]-U""XM8R0\J-PA`R0V>AP0>:S[7QYX5OM3&G6V MO6,ETS!402<.Q.`%;HQ)Z`$YKQ47-QI>D?$^UT]?+MDOE@$48PL<1GD0@`=! MMPOTK:T_PEK_`(F\+>&(;/2-&TRVMC!<+J<$O[]@J\DA5!W$X8C/WEZ\9H`] M2E\<^%H)[V";7;*.6R)6=&DPRL."`.YR",#)SQUK@_$^JZIXA^)>AZ/HGB.Z ML-+O],6Z66U_B),IWGB/ M7_$\UZ]UO4FK'Q.8/\5/`N M"#_I,)X_Z^$Y_G0!Z+<^-_#%G>W=G?2;^&[C0X?RSRI[9!Y'XUYM#H^FZG^T%J\-_86]S$FG+,L">37(:9/-I'B#XFQZ:IA2.VN52.$[!&!-M!4#IM5FQCI0!Z?XU\=>&H_ M#VM:6FNVW]H/93QQQPR%CYFQ@%W+P&SQC.:7P'K-AI'PKT>]U6^AM8!&P\V= MPN3O?@9ZG@\#DUS?A_1]`_X49?WEK:VD]RVFW+SSM$"ZS!&R,GD;3C'X$=:@ M'AC4O%'P/\/0:4(9+NTE^U)#+C$F#(-O/RY^;^+@\@]:`.OU-K#XA:4LFAZG M%=6\)='"$C#G:5)!QC`!'T8XKKK*)[>Q@ADP'1`"`VX#V!P,@>N!7#?#3Q7! MJTNI:++HT&E:M8./MD=NJA)7'R,YV@`'*XQD\`8)%>A8H`\Y^*'A\RPP:[:V M5Y=.FVVU*&VEVF:Q!:1D(R#@N%&1R`Q[5R^B:G`KL!M)!^8]#C[K>W5Q/BWPC;);?V[H-G;VNMV$YOT>&$*UT5!+1 M,1R0X)'UH`W?#?AVV\.:>T$1,MSLGVEE8QIN7^'.3AOEZUT?AK7[7Q/X?L]6M"`D\8+Q MYR8G_B0].0^/F;\6R?QK5KS_1O$Q\-S6&E:M]1?['UG! MVRJV!'#)@<.%.=YP&`R<'-6]5\J2?,LLCYR%!R,'`)'H%!Z_P M9H,^AZ,S7\IEU6^E-Y?R$\&9P-RKC@*N`!CCC/>LO0?`6(XK8>B*.N"6YXZ]`>:[:@##\2^$M'\6V:6VKVOFK&Q:-T+3K:Y MANKR"S5GNVC8/*X4$@1MP,^N?:LRZ\,M(MM>^.>CZ=#/$UQ91RR7=QIMSY]W]\1Z)I^H6ME=ZC:PWEV!Y M$;.-S@G`Q[$Y`I=7U*ZL[BSM;.RAN9;KS`!-.8E&U=V,A6Z]*`/,/A]\-M#\ M0>"=*OM2DOIHI"\CV7VDB`N&9=VT<@X&.#7HNO\`@S0_$FDP:;J-IF"W_P"/ M?RG*&'Y=HVX[8['(X''%2:3KRZA::=<2+!:BXM))Y(&DW-&4*AL'`!52Q!;C ML>]4[CQOHT]A)+I.JV5S+%-$LB>8"51I41FQP<`/][I0!5T7X::%H=M>Q0-> MSR7=J]F\]Q.7986'**.`!T[=JOZ5X)TC1O"MYX=M!.+&[6192TF7/F+M;!QQ MQ[4LOCOPQ%IBZD=8MFLFNA9^PVHFC?`19Z'%;:);A;DQZ-,9[0&7G>7#Y;U MY'2K>J^#=)UK7]/UN\25KS3]I@*2%5!#;AD=^:AM_&VG3^)M7T8_(-,@\Z2X M))4[0#(,8_AW)GG^+VIVE^-]&OX+3S[RWMKNYM!>K:F7UN"GF,3DD@YQGOC%:EUX'T6[TO2M.DBF%KI MDJS6Z"4YW#NQ/)SSGGO6Q!JMC=)9O!GQ:I;F[M&=9XF.TIL&6//8=STH`1Y`8O\H3Z5 M%8^$-*T[Q3>^(X$E_M&\0QRLTA*[3M.`.WW%JYI&OZ5KT4DNE7\%VD3;7,39 MP<9_+T/0UEVWC73P-5?4Y(=/AL=2?3UDEER)2L2RD]!CY2W'/W>M`#['P1HE MA+KCI;O(-;9S?+)(2'#%B0/0?.U8^G_"3PQIFJQ7]LM\HBF6>.W-VQB#J05) M'5L$#J3[UT^G>)-'U>6*+3]1M[F26%ID6-LDHK!6/X$@'ZU%+XLT&&[L[675 M;5+B\(%O&7YDRQ48^I&!ZF@".R\):78>*KWQ)"LW]HWD?E2LTA*[?EX`[?<6 MGW'A?3;KQ9;>)94E.HVT'D1D/A0OS]1Z_.U5[SQUX9L6N4N-9M4>VF6"8;B2 MDA)`4X]P?I@YQ@UM6-]:ZE917EE.D]M*,QR(2%9!*A1RK(X!`88]F/!R.>EF#7344`>>K\%O!HNWF:TNFB8<6YNG\M3V/'S9^I-3_\` M"IO#?]B1Z4#?K%%)V`!VGH.%';^9KNZ*`,'PQX/TCPE;2Q:7"X: M8@S2RR%WD([DG\>F!R:WJ**`"BBB@#S34++5O`NN:KJ=C!-=^&-2+7%]'%(! M+8RL1YDZ@@EAM!.!^@49R9]4>2;3]575X1<2*+?2_$JQ_N[L,Q(L[F(#Y"3R M6(`&,C:I?#[0K^_GN=MS;"]<&^AMYBD5W@[OG7IDDO%2Z#X;TCPS9R6FCV2VL$DAE=0S-EL`9RQ)Z`#' M2M7I0`4444`> M+-9O8K8/;7/APV$3EU&Z8O(=F"<]&7GIS7:T4`>9Z5X;U6PM[?3K_0;F_M+R MRM([EX=2$(MV2%(GC=`XWJ-A;5VQGC'F.VN]8\)74(MS;W\]J6BB=U8PS8 MW)D@X)5P.AQQZ5LXI:`//;CPMJ+:#I*Q:?&;Z_ED36U,BC9#=?/=`'/.&"@; M?3BH-9TKQ7>>)M/C&F"32;'5X+F!HIX4C6!4V'Y3\Y<%V)YQA0`,UZ33)(DF MB>.1`Z.I5E89!!Z@T`<)X'TJ9_$&JZH]T9;*REN--TU`FU5B\WS'QZ@,%C!] M(L]ZL7VDZQ)/XDT^'3P\&H2B]ANVF41LRQQ+Y++G<-QBP3C&&]L'LK>WBM;> M.W@C6.&)0D<:`!54#```Z`"I*`.0TBQU74/&0\1ZCI?]EB+338B!YDE>1FD5 MRV4)&P;<#/)R3@5BR^%-8>_,OV,%/^$P75,^8G_'L(`N_K_>&,=?:O2<44`> M92^$_$0MM8>P"VE[)8V?KV.'P>3Y8'>KR^&I]+U&32TT6ZU M'1;E;=!/'J/E"W5$2+8\9<;@`F[<,DYQBN_HH`\ZDTCQ(USJAM-/E@TM'CNH M=/GNHW,]TMRLS-&^3L1E7A6(`+?='-=Y833W%C%+=6C6DSC+0,ZN8_8E>"?I 8D>YJS10`4444`%%%%`!1110`4444`?_9 ` end GRAPHIC 16 pr1012img000.jpg GRAPHIC begin 644 pr1012img000.jpg M_]C_X``02D9)1@`!`@```0`!``#_VP!#``@&!@<&!0@'!P<)"0@*#!0-#`L+ M#!D2$P\4'1H?'AT:'!P@)"XG("(L(QP<*#7J#A(6&AXB)BI*3E)66EYB9FJ*CI*6FIZBIJK*SM+6VM[BYNL+#Q,7& MQ\C)RM+3U-76U]C9VN'BX^3EYN?HZ>KQ\O/T]?;W^/GZ_\0`'P$``P$!`0$! M`0$!`0````````$"`P0%!@<("0H+_\0`M1$``@$"!`0#!`<%!`0``0)W``$" M`Q$$!2$Q!A)!40=A<1,B,H$(%$*1H;'!"2,S4O`58G+1"A8D-.$E\1<8&1HF M)R@I*C4V-S@Y.D-$149'2$E*4U155E=865IC9&5F9VAI:G-T=79W>'EZ@H.$ MA8:'B(F*DI.4E9:7F)F:HJ.DI::GJ*FJLK.TM;:WN+FZPL/$Q<;'R,G*TM/4 MU=;7V-G:XN/DY>;GZ.GJ\O/T]?;W^/GZ_]H`#`,!``(1`Q$`/P#W^BBL[6=> MTOP]9-=ZK?06L(!QYC@%R!G"CJQXZ#F@"IXK\46'A/0Y=2OB&(^6*`,`TSGH MHSU]3Z`$]JX#5O%/BC5I)=.@DM=,-Y;H]D4F_=WJ'&X077:8DX4;.!R>Q#M? MB\3^.IK/7M#TW[)8Z=')Y=IJJE'U#`E;NWN5 M9]4T^3&3YHX#Q``G=U.[K@5Z/H^M:=KVG1W^EW<5U;OCYHV!VD@':P_A8`C( M/(S6+IGA6:.XAN=2NA)>6 M/4>(2)X>\02"+RU(V6]\QX(7@*K*,<9Y]@*`/2****`"BBB@`HHHH`****`" MBBB@`HH)`ZFB@`HHHH`****`"BBB@`HHHH`****`"BBB@`HHHZT`%%(2%&20 M/K2T`8'B_P`2)X9T)[I8VFO9F%O96ZH6,T[`[%P.<9ZXYP#7-^$_!MGO1G;,DKK+#8R$B3RT7D*RDCZ9X`S6=XJGOI?B&\"PN]Y]D$.FJ^##: M1MDR7Y)X#(?EV\$@#GFI_#.LVFG+:31W!31&F^PP3>2?.UJ_?`><]3@E6Y/4 MY)(`%`'IMKOB;QU9^' MM0@T]+::^N_DFNHH$6![>22-7:&0@M&2,E3@D9'3@ MXK'\:Q:1+X1U$:W(D-BL+,9CC=&P!VLF?XP<;>^<5S6G?$#4;5-1_M?26N-. MTF=[2[UFSD789$QN8PMAE&""=NX`Y`SBFWRW/B<#Q%J>G2RZ+9_/I6DCYCJ$ MI(\J=\?=#;@H1A\N2S$#B@##T#XDZ_I5AITGB6VAELYHMD,,,;G49(U7(N70 ML08R%.3P2>1Q7KEG=P7]E!>6TBRV\\:RQ2+T96&01]0:\9U"TNWGU2&[N]FJ M7,)N=;U`_O%T>Q(W?9(R"=S?>^[C([=Z[3X6:A]I\+-:>=.ZV!,G('H<#/KEEY M&2:Q-=/BCX67=GK)\076N:--*EO=07SL\@)R24R<#Y5.#GJ1D&K,MW#X>_:& M>2_DVIJ]BD5NQZ!CM4#\6B([=15_XX74(LT@3]TV,')XSR.,YIUAXT\-ZI:75U9:Q:S16D;2 MSX;#1HHR6*GG;[XQ7F$6A0M\4/!6DZO913&#PW"DT$RAU\Q%E'(Z'!'O3?$^ MGV6F?$77+?1;>"W@?PO=/=Q0(%524?L..<1_G0!Z2_Q#\(1FV#>(+$?:%#)^ M\Z`]"W]S_@6,5K7^N:5IFG+J%]J%M;V;@%)I)0%?(R`I_B)`)`'7M7DNC:!H M+_`.?4;K3K(W9M+B47+Q+YGFAF"?-C/4**Y;5+W59#\.-.FC6>(6\4D%K.^( M9G\UEC#>VP(/HQ]30![MI_C+PYJEC^*K2? M$/PA%;V\S>(+'9/]P"3+=<9*CE1D$<@=*XA?"6LVUSXL\3:K8:9IRW.B7%O] MELFW;CM!W'@#^'\<)!Y93?$=V[IMQSFNVTSQIX;UG46T_3M9M+ MFZ&?W:/]['7:>C?AFO%VC34/"WPOM[M?/AEU!X71^0R&=5VGVQQ6QXVTVQTC MXR>#$TRT@LD=XMR6T8C!_>D=%`[$CZ4`>H:IXU\-:)>K9ZCK-K!7M[<3QW-Q=S!)H-_91M/`;)'/4>PJ]XA\.7OA7P1X0TO4+M;F= M-85SM)*Q[LG8">H&3Z=:`/6KKQCXLA;Q-LM`'K^E^(-(UO3WO]-U""XM8R0\J-PA`R0V>AP0>:S[7QYX5OM3&G6V MO6,ETS!402<.Q.`%;HQ)Z`$YKQ47-QI>D?$^UT]?+MDOE@$48PL<1GD0@`=! MMPOTK:T_PEK_`(F\+>&(;/2-&TRVMC!<+J<$O[]@J\DA5!W$X8C/WEZ\9H`] M2E\<^%H)[V";7;*.6R)6=&DPRL."`.YR",#)SQUK@_$^JZIXA^)>AZ/HGB.Z ML-+O],6Z66U_B),IWGB/ M7_$\UZ]UO4FK'Q.8/\5/`N M"#_I,)X_Z^$Y_G0!Z+<^-_#%G>W=G?2;^&[C0X?RSRI[9!Y'XUYM#H^FZG^T%J\-_86]S$FG+,L">37(:9/-I'B#XFQZ:IA2.VN52.$[!&!-M!4#IM5FQCI0!Z?XU\=>&H_ M#VM:6FNVW]H/93QQQPR%CYFQ@%W+P&SQC.:7P'K-AI'PKT>]U6^AM8!&P\V= MPN3O?@9ZG@\#DUS?A_1]`_X49?WEK:VD]RVFW+SSM$"ZS!&R,GD;3C'X$=:@ M'AC4O%'P/\/0:4(9+NTE^U)#+C$F#(-O/RY^;^+@\@]:`.OU-K#XA:4LFAZG M%=6\)='"$C#G:5)!QC`!'T8XKKK*)[>Q@ADP'1`"`VX#V!P,@>N!7#?#3Q7! MJTNI:++HT&E:M8./MD=NJA)7'R,YV@`'*XQD\`8)%>A8H`\Y^*'A\RPP:[:V M5Y=.FVVU*&VEVF:Q!:1D(R#@N%&1R`Q[5R^B:G`KL!M)!^8]#C[K>W5Q/BWPC;);?V[H-G;VNMV$YOT>&$*UT5!+1 M,1R0X)'UH`W?#?AVV\.:>T$1,MSLGVEE8QIN7^'.3AOEZUT?AK7[7Q/X?L]6M"`D\8+Q MYR8G_B0].0^/F;\6R?QK5KS_1O$Q\-S6&E:M]1?['UG! MVRJV!'#)@<.%.=YP&`R<'-6]5\J2?,LLCYR%!R,'`)'H%!Z_P M9H,^AZ,S7\IEU6^E-Y?R$\&9P-RKC@*N`!CCC/>LO0?`6(XK8>B*.N"6YXZ]`>:[:@##\2^$M'\6V:6VKVOFK&Q:-T+3K:Y MANKR"S5GNVC8/*X4$@1MP,^N?:LRZ\,M(MM>^.>CZ=#/$UQ91RR7=QIMSY]W]\1Z)I^H6ME=ZC:PWEV!Y M$;.-S@G`Q[$Y`I=7U*ZL[BSM;.RAN9;KS`!-.8E&U=V,A6Z]*`/,/A]\-M#\ M0>"=*OM2DOIHI"\CV7VDB`N&9=VT<@X&.#7HNO\`@S0_$FDP:;J-IF"W_P"/ M?RG*&'Y=HVX[8['(X''%2:3KRZA::=<2+!:BXM))Y(&DW-&4*AL'`!52Q!;C ML>]4[CQOHT]A)+I.JV5S+%-$LB>8"51I41FQP<`/][I0!5T7X::%H=M>Q0-> MSR7=J]F\]Q.7986'**.`!T[=JOZ5X)TC1O"MYX=M!.+&[6192TF7/F+M;!QQ MQ[4LOCOPQ%IBZD=8MFLFNA9^PVHFC?`19Z'%;:);A;DQZ-,9[0&7G>7#Y;U MY'2K>J^#=)UK7]/UN\25KS3]I@*2%5!#;AD=^:AM_&VG3^)M7T8_(-,@\Z2X M))4[0#(,8_AW)GG^+VIVE^-]&OX+3S[RWMKNYM!>K:F7UN"GF,3DD@YQGOC%:EUX'T6[TO2M.DBF%KI MDJS6Z"4YW#NQ/)SSGGO6Q!JMC=)9O!GQ:I;F[M&=9XF.TIL&6//8=STH`1Y`8O\H3Z5 M%8^$-*T[Q3>^(X$E_M&\0QRLTA*[3M.`.WW%JYI&OZ5KT4DNE7\%VD3;7,39 MP<9_+T/0UEVWC73P-5?4Y(=/AL=2?3UDEER)2L2RD]!CY2W'/W>M`#['P1HE MA+KCI;O(-;9S?+)(2'#%B0/0?.U8^G_"3PQIFJQ7]LM\HBF6>.W-VQB#J05) M'5L$#J3[UT^G>)-'U>6*+3]1M[F26%ID6-LDHK!6/X$@'ZU%+XLT&&[L[675 M;5+B\(%O&7YDRQ48^I&!ZF@".R\):78>*KWQ)"LW]HWD?E2LTA*[?EX`[?<6 MGW'A?3;KQ9;>)94E.HVT'D1D/A0OS]1Z_.U5[SQUX9L6N4N-9M4>VF6"8;B2 MDA)`4X]P?I@YQ@UM6-]:ZE917EE.D]M*,QR(2%9!*A1RK(X!`88]F/!R.>EF#7344`>>K\%O!HNWF:TNFB8<6YNG\M3V/'S9^I-3_\` M"IO#?]B1Z4#?K%%)V`!VGH.%';^9KNZ*`,'PQX/TCPE;2Q:7"X: M8@S2RR%WD([DG\>F!R:WJ**`"BBB@#S34++5O`NN:KJ=C!-=^&-2+7%]'%(! M+8RL1YDZ@@EAM!.!^@49R9]4>2;3]575X1<2*+?2_$JQ_N[L,Q(L[F(#Y"3R M6(`&,C:I?#[0K^_GN=MS;"]<&^AMYBD5W@[OG7IDDO%2Z#X;TCPS9R6FCV2VL$DAE=0S-EL`9RQ)Z`#' M2M7I0`4444`> M+-9O8K8/;7/APV$3EU&Z8O(=F"<]&7GIS7:T4`>9Z5X;U6PM[?3K_0;F_M+R MRM([EX=2$(MV2%(GC=`XWJ-A;5VQGC'F.VN]8\)74(MS;W\]J6BB=U8PS8 MW)D@X)5P.AQQZ5LXI:`//;CPMJ+:#I*Q:?&;Z_ED36U,BC9#=?/=`'/.&"@; M?3BH-9TKQ7>>)M/C&F"32;'5X+F!HIX4C6!4V'Y3\Y<%V)YQA0`,UZ33)(DF MB>.1`Z.I5E89!!Z@T`<)X'TJ9_$&JZH]T9;*REN--TU`FU5B\WS'QZ@,%C!] M(L]ZL7VDZQ)/XDT^'3P\&H2B]ANVF41LRQQ+Y++G<-QBP3C&&]L'LK>WBM;> M.W@C6.&)0D<:`!54#```Z`"I*`.0TBQU74/&0\1ZCI?]EB+338B!YDE>1FD5 MRV4)&P;<#/)R3@5BR^%-8>_,OV,%/^$P75,^8G_'L(`N_K_>&,=?:O2<44`> M92^$_$0MM8>P"VE[)8V?KV.'P>3Y8'>KR^&I]+U&32TT6ZU M'1;E;=!/'J/E"W5$2+8\9<;@`F[<,DYQBN_HH`\ZDTCQ(USJAM-/E@TM'CNH M=/GNHW,]TMRLS-&^3L1E7A6(`+?='-=Y833W%C%+=6C6DSC+0,ZN8_8E>"?I 8D>YJS10`4444`%%%%`!1110`4444`?_9 ` end GRAPHIC 17 pr1012img001.jpg GRAPHIC begin 644 pr1012img001.jpg M_]C_X``02D9)1@`!`0```0`!``#_VP!#``@&!@<&!0@'!P<)"0@*#!0-#`L+ M#!D2$P\4'1H?'AT:'!P@)"XG("(L(QP<*#7J#A(6&AXB)BI*3E)66EYB9FJ*CI*6FIZBIJK*SM+6VM[BYNL+#Q,7& MQ\C)RM+3U-76U]C9VN'BX^3EYN?HZ>KQ\O/T]?;W^/GZ_\0`'P$``P$!`0$! M`0$!`0````````$"`P0%!@<("0H+_\0`M1$``@$"!`0#!`<%!`0``0)W``$" M`Q$$!2$Q!A)!40=A<1,B,H$(%$*1H;'!"2,S4O`58G+1"A8D-.$E\1<8&1HF M)R@I*C4V-S@Y.D-$149'2$E*4U155E=865IC9&5F9VAI:G-T=79W>'EZ@H.$ MA8:'B(F*DI.4E9:7F)F:HJ.DI::GJ*FJLK.TM;:WN+FZPL/$Q<;'R,G*TM/4 MU=;7V-G:XN/DY>;GZ.GJ\O/T]?;W^/GZ_]H`#`,!``(1`Q$`/P#=_P"%'>"_ M^>%[_P"!)_PH_P"%'>"_^>%[_P"!)_PKTBJ6KW4EGILDT1"L&1"_\`GA>_^!)_PK>BUS4IK&2Y3R3Y M>UG4H1MRSKMQUZ*IP>?F]*Z."X^T6\??\*.\%_\ M\+W_`,"3_A1_PH[P7_SPO?\`P)/^%>BEGYQ'G_@7U_\`K?G06?G$>?\`@7U_ M^M^=`'G7_"CO!?\`SPO?_`D_X4?\*.\%_P#/"]_\"3_A7HI9^<1Y_P"!?7_Z MWYT%GYQ'G_@7U_\`K?G0!YU_PH[P7_SPO?\`P)/^%'_"CO!?_/"]_P#`D_X5 MZ*6?G$>?^!?7_P"M^=!9^<1Y_P"!?7_ZWYT`>=?\*.\%_P#/"]_\"3_A1_PH M[P7_`,\+W_P)/^%>BEGYQ'G_`(%]?_K?G06?G$>?^!?7_P"M^=`'G7_"CO!? M_/"]_P#`D_X4?\*.\%_\\+W_`,"3_A7HI9^<1Y_X%]?_`*WYT%GYQ'G_`(%] M?_K?G0!YU_PH[P7_`,\+W_P)/^%'_"CO!?\`SPO?_`D_X5Z*6?G$>?\`@7U_ M^M^=!9^<1Y_X%]?_`*WYT`>=?\*.\%_\\+W_`,"3_A1_PH[P7_SPO?\`P)/^ M%>BEGYQ'G_@7U_\`K?G06?G$>?\`@7U_^M^=`'G7_"CO!?\`SPO?_`D_X4?\ M*.\%_P#/"]_\"3_A7HI9^<1Y_P"!?7_ZWYT%GYQ'G_@7U_\`K?G0!YU_PH[P M7_SPO?\`P)/^%'_"CO!?_/"]_P#`D_X5Z*6?G$>?^!?7_P"M^=!9^<1Y_P"! M?7_ZWYT`>=?\*.\%_P#/"]_\"3_A1_PH[P7_`,\+W_P)/^%>BEGYQ'G_`(%] M?_K?G06?G$>?^!?7_P"M^=`'G7_"CO!?_/"]_P#`D_X4?\*.\%_\\+W_`,"3 M_A7HI9^<1Y_X%]?_`*WYT%GYQ'G_`(%]?_K?G0!YU_PH[P7_`,\+W_P)/^%' M_"CO!?\`SPO?_`D_X5Z*6?G$>?\`@7U_^M^=!9^<1Y_X%]?_`*WYT`>=?\*. M\%_\\+W_`,"3_A1_PH[P7_SPO?\`P)/^%>BEGYQ'G_@7U_\`K?G06?G$>?\` M@7U_^M^=`'G7_"CO!?\`SPO?_`D_X4?\*.\%_P#/"]_\"3_A7HI9^<1Y_P"! M?7_ZWYT%GYQ'G_@7U_\`K?G0!YU_PH[P7_SPO?\`P)/^%'_"CO!?_/"]_P#` MD_X5Z*6?G$>?^!?7_P"M^=!9^<1Y_P"!?7_ZWYT`>=?\*.\%_P#/"]_\"3_A M1_PH[P7_`,\+W_P)/^%>BEGYQ'G_`(%]?_K?G06?G$>?^!?7_P"M^=`'G7_" MCO!?_/"]_P#`D_X4?\*.\%_\\+W_`,"3_A7HI9^<1Y_X%]?_`*WYT%GYQ'G_ M`(%]?_K?G0!YU_PH[P7_`,\+W_P)/^%'_"CO!?\`SPO?_`D_X5Z*6?G$>?\` M@7U_^M^=!9^<1Y_X%]?_`*WYT`>=?\*.\%_\\+W_`,"3_A1_PH[P7_SPO?\` MP)/^%>BEGYQ'G_@7U_\`K?G06?G$>?\`@7U_^M^=`'G7_"CO!?\`SPO?_`D_ MX4?\*.\%_P#/"]_\"3_A7HI9^<1Y_P"!?7_ZWYT%GYQ'G_@7U_\`K?G0!YU_ MPH[P7_SPO?\`P)/^%'_"CO!?_/"]_P#`D_X5Z*6?G$>?^!?7_P"M^=!9^<1Y M_P"!?7_ZWYT`>=?\*.\%_P#/"]_\"3_A1_PH[P7_`,\+W_P)/^%>BEGYQ'G_ M`(%]?_K?G06?G$>?^!?7_P"M^=`'G7_"CO!?_/"]_P#`D_X4?\*.\%_\\+W_ M`,"3_A7HI9^<1Y_X%]?_`*WYT%GYQ'G_`(%]?_K?G0!YU_PH[P7_`,\+W_P) M/^%'_"CO!?\`SPO?_`D_X5Z*6?G$>?\`@7U_^M^=!9^<1Y_X%]?_`*WYT`>= M?\*.\%_\\+W_`,"3_A1_PH[P7_SPO?\`P)/^%>BEGYQ'G_@7U_\`K?G06?G$ M>?\`@7U_^M^=`'G7_"CO!?\`SPO?_`D_X4?\*.\%_P#/"]_\"3_A7HI9^<1Y M_P"!?7_ZWYT^@#S?_A1W@O\`YX7O_@2?\**](HH`*KWU[%I]HUS-G8K*O!`Y M9@HZD#J15BH;J&*>W9)B50$-N#8VE2"#GV(!H`@L-3AU`R")'78`Z-^56VDC0X9U4@9Y./7_`_E5/3K.PL_,6R*X&%8"3=M`R0.O'+$_C5Z@! MAFB&_^!_(T M&:(9S(@QU^8>_P#@?R-/HH`89HAG,B#'7YA[_P"!_(T&:(9S(@QU^8>_^!_( MT^B@!AFB&_ M^!_(T&:(9S(@QU^8>_\`@?R-/HH`89HAG,B#'7YA[_X'\C3?M5N&V^?%NYXW MC/&<_E@_E3W#&-@C!7(.UB,X/KCO7!:3X,U?2M0L+AGTVZ:SFN)A-EXY)=XE MPK<-U,@.<\9;AN*`.Y-W;`D&XB!!VD%QP>>/KP?RIWVB'G]]'QU^8>_^!_(U MP'_""ZB=:GN9(M.EMY;X3MF5EDVB::4$'8<-^]1?HF`1GCH=$T"ZT._\NU>% M=*V%1$6+2+\S$#)'3DGKP68<\$`&^9HAG,B#'7YA[_X'\C09HAG,B#'7YA[_ M`.!_(T^B@!AFB&_P#@?R-!FB&_\`@?R-!FB&_^!_(T^B@!AFB&_^!_(T&:(9S(@QU^8>_P#@?R-/HH`89HAG,B#'7YA[_P"! M_(T&:(9S(@QU^8>_^!_(T^B@!AFB&_^!_(T&:(9S(@QU^8>_\`@?R-/HH`89HAG,B#'7YA M[_X'\C09HAG,B#'7YA[_`.!_(T^B@!AFB&_P#@?R-!FB&=6$OBE=5L9 M"=4:Q%V^4N48/Y6R,G>`N"<^8.H&02F00!LW]KJES=WSVTVIQ1R7%M%"!(P" M@D&60#T"OC'3*4`=89HAG,B#'7YA[_X'\C09HAG,B#'7YA[_`.!_(USVF-K% MCJXL[OS[ZWD)`NBNQ4PNXG'._SN^3 MZ??QCV]\#2:,,9GY0I&.Y^O\`]:@!#$ISR_/^V??W]_Y>@H,2G/+\_P"V??W]_P"7H*"9 M>@H)EYP$]N3[_P#UOUH)EYP$]N3[_P#UOUH`#$ISR_/^V??W]_Y>@H,2 MG/+\_P"V??W]_P"7H*"9>@H)EYP$]N3[_P#UOUH)EYP$]N3[_P#UOUH` M#$ISR_/^V??W]_Y>@H,2G/+\_P"V??W]_P"7H*"9>7_OLUU/PWGFD^(NAH\TI5 MKD`C>?0UR-=5\-<_\+'T+;C/VD8S]#0!]<&)3GE^?]L^_O[_`,O04&)3GE^? M]L^_O[_R]!03+S@)[<0)&>98@` M%W-P9,],\<`\5YG<_&SPS=R,\_A>>1C*LQ+.O+J,*3Z\`"DN/C5X8NHC'-X7 MN)%V;`&=>F[>!G_>"GZB@#T_3/$\&H3Q)-"UJEPH>&1YV`E#?=VY`SNSQCM[ MC`Z(Q*<\OS_MGW]_?^7H*\2'QM\-.]N!X8FS"4$/S)\FW.T#T`XP*]M)EYP$ M]N3[_P#UOUH`#$ISR_/^V??W]_Y>@JI/?Z=;S313WL<'M1O[B.Z\3Z;8S?9FM9(_M42NIWJXW! MO=`"I'0F@#IIM3TN![99K^.,W:EH-TQ'F#&U)#JVDW;(L&H12F1 M=ZA)L[E+;7Y_P!L M^_O[_P`O04&)3GE^?]L^_O[_`,O05%;W`N;6.>VEAGA==R2H^Y7'."".#VZ> M]2DR\X">W)]__K?K0!GZCJ,.GW5C;/!=2R7TCQ1^4>`P1WP22`,A3C\/3C,N M_%EC9Z`FKW%K>1QRW#VZQ-(@;I!.:`.\B\<:7<7.@`KJ$$/)\4OA_&MZJVNHLM[)YDX=6.\_-@_632[C3XKB>(R M0@[PJID';N/0ACSR57.!D9`.Z,2G/+\_[9]_?W_EZ"@Q*<\OS_MGW]_?^7H* M@L[S[?90W<`4Q3('3<><$'']/UJ?:DJQQMT59$QS&<9$AYZ@\C&.0#M]4\2Z-H]XUK?74L< MHB$I`5R,-NP,CC)VO@=>/85+8ZYI>IW!M[6>9IMJLR%9$(#J6!YQCC/T.!UQ M7G>L>)/A[K=^MY=^*-TR(40B'&/FZ>G'*'UZBGS7R6\S1R1SD8!4QP.X/XJ"*98R6$KS/9-&S, M=SLG?)/(]L[NG&=W?-7:`,/4?&&@:0T:ZGJ*V32`E!+=#U=9&TR^^VK&0'-M$\@4GIG:#BO$ M?^&??$'_`$%M,_.3_P")KTGX7^`[_P`"VFI17UU;7!NG1E,&[C:".<@>M`'8 M'58?,4"&[V8.3]DEX/&/X?K^55]0\3Z1I-N+C4;IK.$L$$ES#)&I;DXRR@9X M/Y5KUY9\??\`D0;7_L(Q_P#HN2@#JO\`A9/@S_H8K'_ONC_A9/@S_H8K'_ON MOD.B@#[&T_QMXN__`!W_`!KZ MYHH`Y;P;(VE>#=(L+VVNXKJWM4CE3[+(VU@.1D*0?PK:3583NW0W8YX_T27D M?]\U?HH`\`^+/A+Q!XF\9"_T?1[NYM1:QQ[_`"RGS`MD8;![BN%_X5CXU_Z% MZ[_\=_QKZYHH`^1O^%8^-?\`H7KO_P`=_P`:]R^$UE>^&?!K6&L6-W;71NI) M-GV=W^4A<'*@CL:]'HH`H#58?,8&&[V8&#]DEY/.?X?I^=)K%;/\` MX170FU(N7^T">"1/+QMVXSMSG+>O2NTHH`\B_P"$S^*N`/\`A![;`Z?*W_Q= M'_":?%7_`*$>V_[Y;_XNO7:*`.)\'^)/%%\UX/%6@G30@3[.8()'\S.=V<%L M8POIUKISJL/F*!#=[2#D_9)>#QC^'ZU?HH`R;[Q+I6EVQN=0N'M(`0IEN()( MUR>@R5`K,_X63X,_Z&*Q_P"^ZP/CC_R3>;_KZB_F:^8J`/KS_A9/@S_H8K'_ M`+[JS8^./#6J7(MM/U:&[G(+"*W#2-@=3@`FOCJO1_@=_P`E(A_Z]9?Y"@#Z M/?580!LANR*Y_[2\(:S8VEO=R7-Q9311)]ED&YF0@#)7`Y M/>NDHH`^1O\`A6/C7_H7KO\`\=_QH_X5CXU_Z%Z[_P#'?\:^N:*`/E[PI\/_ M`!9IOB_1KZ[T*[CMK>]AEE?:#M57!)P#D\#M7TE)JL(C8I#=LX!VC[)+R?\` MOFK]%`%+^U+?_GG=_P#@'+_\37RU>?#7QE+>W$B>'[LH\C,IP.03]:^LJ*`/ MD;_A6/C7_H7KO_QW_&C_`(5CXU_Z%Z[_`/'?\:^N:*`,RSU"&*QMXWBNPZ1J MK#[)+P0/]VK\$AEA20J5+#."""/P/(J2B@`HHHH`*JWUH]W`RQ3O#(1@,"V, M9&1@$=1D9ZC/!JU5'58[Z:PFCL619'0J"6*MSZ$=#C.#ZXH`33M,&GO*PD5@ MXPJJFT*-SMCJ>[G\`*NM&CG+*#QCG\?\365HD-]$TYO!(,@8WR;@6WN<.GM\A] M_?Z?D?7@(EYPZ>WR'W]_I^1]>`#SG3O!6LM)IZ7S"&PC2=7@BF&^/<.GM\A]_?Z?D?7@`##&M8B7G#I[?(??W^GY'UXKWEBM]#Y6 MC?G#KD\,,C!]CZ\`'FMAX)^&.H7=O:Q:! MHR3>"_A?!(Z/H5Q^[O!9.V^YPLI"$`_-T/F+@]\Y'`)KLK+PDNGRPR6^J70: M"U:UCW1Q':I+'(^3ALE22,;M@W9J2\\*V]Y>/<-=7"&2\2\>-3\CNBQJN1Z# MR8SQ@_>Y`8B@#)\&^%_!=I*VJ^&]-,3M&86D,LK<$\KAF(S\H_`CUKLC#&)HB"/EP6+#CV^4?1?IC3(EYPZ>WR'W]_I^ M1]>``,,9SE!SU_7_`!/YT&&,YR@YZ_K_`(G\Z")><.GM\A]_?Z?D?7@(EYPZ M>WR'W]_I^1]>``,,9SE!SU_7_$_G088SG*#GK^O^)_.@B7G#I[?(??W^GY'U MX")><.GM\A]_?Z?D?7@`##&WR'W M]_I^1]>`B7G#I[?(??W^GY'UX``PQG.4'/7]?\3^=!AC.OZ_XG\Z")>< M.GM\A]_?Z?D?7@(EYPZ>WR'W]_I^1]>``,,9SE!SU_7_`!/YT&&,YR@YZ_K_ M`(G\Z")><.GM\A]_?Z?D?7@(EYPZ>WR'W]_I^1]>``,,9SE!SU_7_$_G088S MG*#GK^O^)_.@B7G#I[?(??W^GY'UX")><.GM\A]_?Z?D?7@`##&WR'W]_I^1]>`B7G#I[?(??W^GY'UX``PQG.4 M'/7]?\3^=!AC.OZ_XG\Z")><.GM\A]_?Z?D?7@(EYPZ>WR'W]_I^1]>` M`,,9SE!SU_7_`!/YT&&,YR@YZ_K_`(G\Z")><.GM\A]_?Z?D?7@(EYPZ>WR' MW]_I^1]>``,,9SE!SU_7_$_G088SG*#GK^O^)_.@B7G#I[?(??W^GY'UX")> M<.GM\A]_?Z?D?7@`##&WR'W]_I^ M1]>`B7G#I[?(??W^GY'UX``PQG.4'/7]?\3^=!AC.OZ_XG\Z")><.GM\ MA]_?Z?D?7@(EYPZ>WR'W]_I^1]>``,,9SE!SU_7_`!/YT&&,YR@YZ_K_`(G\ MZ")><.GM\A]_?Z?D?7@(EYPZ>WR'W]_I^1]>`#SCXX1H/AQ,0H!^U1?S/^)K MYDK[$\7^%8O&.@OI-U=/!$TBR;XD&X%2<=?P_(^O'F*_!/PF]TEJGBN1KB1W M1(@\19F3.X`=21W';!_``\)KT;X(*K_$>$,`1]EFZ_2NPG^"7A2VN+K&DZZ]\ZQ,@!V,N&R,Y7W'Z'\`#TD MPQG.4'/7]?\`$_G088SG*#GK^O\`B?SH(EYPZ>WR'W]_I^1]>`B7G#I[?(?? MW^GY'UX``PQG.4'/7]?\3^=!AC.OZ_XG\Z")><.GM\A]_?Z?D?7@(EYP MZ>WR'W]_I^1]>``,,9SE!SU_7_$_G088SG*#GK^O^)_.@B7G#I[?(??W^GY' MUX")><.GM\A]_?Z?D?7@`##&WR' MW]_I^1]>`B7G#I[?(??W^GY'UX``PQG.4'/7]?\`$_G088SG*#GK^O\`B?SH M(EYPZ>WR'W]_I^1]>`B7G#I[?(??W^GY'UX``PQG.4'/7]?\3^=/IA$O.'3V M^0^_O]/R/KP^@`HHHH`*HZI>O96V88VDF9T51L)'S.J\G('?."1FKU5[Z6"" MS=[E`\7"E2`=V2`!SQU(ZT`4=%U5]3$C,$V;`Z%01P7=>>/I5PLHZL!]30`TNPS^Z<_ MB.>OO[?J/?`789_=.?Q'/7W]OU'OA=ZC^(?G_GT-&]1_$/S_`,^AH`0NPS^Z M<_B.>OO[?J/?`789_=.?Q'/7W]OU'OA=ZC^(?G_GT-&]1_$/S_SZ&@!"[#/[ MIS^(YZ^_M^H]\!=AG]TY_$<]??V_4>^%WJ/XA^?^?0T;U'\0_/\`SZ&@!"[# M/[IS^(YZ^_M^H]\!=AG]TY_$<]??V_4>^%WJ/XA^?^?0T;U'\0_/_/H:`$+L M,_NG/XCGK[^WZCWP%V&?W3G\1SU]_;]1[X7>H_B'Y_Y]#1O4?Q#\_P#/H:`$ M+L,_NG/XCGK[^WZCWP%V&?W3G\1SU]_;]1[X7>H_B'Y_Y]#1O4?Q#\_\^AH` M0NPS^Z<_B.>OO[?J/?`789_=.?Q'/7W]OU'OA=ZC^(?G_GT-&]1_$/S_`,^A MH`0NPS^Z<_B.>OO[?J/?`789_=.?Q'/7W]OU'OA=ZC^(?G_GT-&]1_$/S_SZ M&@!"[#/[IS^(YZ^_M^H]\!=AG]TY_$<]??V_4>^%WJ/XA^?^?0T;U'\0_/\` MSZ&@!"[#/[IS^(YZ^_M^H]\!=AG]TY_$<]??V_4>^%WJ/XA^?^?0T;U'\0_/ M_/H:`$+L,_NG/XCGK[^WZCWP%V&?W3G\1SU]_;]1[X7>H_B'Y_Y]#1O4?Q#\ M_P#/H:`$+L,_NG/XCGK[^WZCWP%V&?W3G\1SU]_;]1[X7>H_B'Y_Y]#1O4?Q M#\_\^AH`0NPS^Z<_B.>OO[?J/?`789_=.?Q'/7W]OU'OA=ZC^(?G_GT-&]1_ M$/S_`,^AH`0NPS^Z<_B.>OO[?J/?`789_=.?Q'/7W]OU'OA=ZC^(?G_GT-&] M1_$/S_SZ&@!"[#/[IS^(YZ^_M^H]\!=AG]TY_$<]??V_4>^%WJ/XA^?^?0T; MU'\0_/\`SZ&@!"[#/[IS^(YZ^_M^H]\!=AG]TY_$<]??V_4>^%WJ/XA^?^?0 MT;U'\0_/_/H:`$+L,_NG/XCGK[^WZCWP%V&?W3G\1SU]_;]1[X7>H_B'Y_Y] M#1O4?Q#\_P#/H:`$+L,_NG/XCGK[^WZCWP%V&?W3G\1SU]_;]1[X7>H_B'Y_ MY]#1O4?Q#\_\^AH`@N8VN(M@^T1D,,`>,^_0X_7ZXXO3_``#<:5J-O%2S'#[6R3C)SVYQW>]1_$/S_SZ&C>H_B'Y_Y]#0!Q^M># M&U2:YECE6!I[E)F*Q<@",HP&'&2W7)SU_$:5AH4FEZH9[25HK,@@VBH,'&=H M!+=.A]B>,`FM[>H_B'Y_Y]#1O4?Q#\_\^AH`0NPS^Z<_B.>OO[?J/?`789_= M.?Q'/7W]OU'OA=ZC^(?G_GT-&]1_$/S_`,^AH`0NPS^Z<_B.>OO[?J/?`789 M_=.?Q'/7W]OU'OA=ZC^(?G_GT-&]1_$/S_SZ&@!"[#/[IS^(YZ^_M^H]\!=A MG]TY_$<]??V_4>^%WJ/XA^?^?0T;U'\0_/\`SZ&@!"[#/[IS^(YZ^_M^H]\! M=AG]TY_$<]??V_4>^%WJ/XA^?^?0T;U'\0_/_/H:`$+L,_NG/XCGK[^WZCWP M%V&?W3G\1SU]_;]1[X7>H_B'Y_Y]#1O4?Q#\_P#/H:`$+L,_NG/XCGK[^WZC MWP^F[U'\0_/_`#Z&G4`%%%%`!56^T^"_BV2J`P((<*I9<,&XR#QD#BK5%`%' M3M*@TQ6$+R,"H7YR#@`L<=/5F//K5TJIZJ#]12T4`-V*?X1^7^?4U5DO[".5 MHI)HPX8(01W.3_C5RL>[T62\N9I7NUQ(=H'E'*QE2I4'=C^(G..OKQ@`NP7M MC=.$AFB=V4N%!Y*C&3CT^8<^_O5G8I_A'Y?Y]36=IVD?8'CD:?S&1"APFT'B M-1W/:(?B3TZ5IT`-V*?X1^7^?4T;%/\`"/R_SZFG44`59[RSMI/+FD17(R%( MR3G.!]3S@=3@X[U&NIZ=(ZJMQ$Q<@#'./Z_K[U/5'4K!M0CCB,P2$-F1"F=_ISD8QU[\@4`-.K:9LW&XCP5W=.V=OIZ MY%7@J,H("D'G([_YS6%_PCLOSDWJ%I,E_P!R0"QR#T;(&TXQGKSGM6Y$GE0I M&6+;5"[CU..]`"[%/\(_+_/J:-BG^$?E_GU-.HH`AGD@MXFEFVJ@P"<9Y)P/ MS)_6H%U'3Y)`BSQ,S'`QSGG'Y9.,],G'6I;ZWENK-X89O)9L?/M)XR,C@@\C M(R"",Y%8Y\,[IB_VO8I&W;%'MVKYOFX!SP=W&?3MWH`VX9(+F(2PLDD;9`9> M0>2#_6G[%/\`"/R_SZFH-/LQ86:VZR%PK.P8J!]YBV,#CC.*LT`-V*?X1^7^ M?4TDGE1QM))L5%!+,W``[D_K3Z9*KO"ZQN$=E(5BN=I[''>@"FVJZ:`Q:XC& M`2V1R,'!S[@GD=L\U9AE@N%_ZUB-X9':=F>0!-N6;;GN>!MX';<>3FM6@!NQ3_"/R_SZFC8 MI_A'Y?Y]33J*`*V3^0.3Z`Y/!H2_L99$C21&:1BJX4X M)QNQG'ID^X.:IW^BR7]Q+(]TH!!6,&(DQJ4*,,[L<[BIY`CZ_[1Z4`:.Q3_"/R_P`^IHV*?X1^7^?4TZB@!NQ3_"/R M_P`^IJ"XN[.V<)/(B,P+8([8)_\`BOKS5FL[4=-DOYHV^T*B1C*H8RA/KD`#_[3TYB!]HB.2HZ==P)'Z9/\ZN;%/\(_+_/J:Y\^%BWEYO1^[?>O M[KH2/F/WNN>1V'0@UT5`#=BG^$?E_GU-&Q3_``C\O\^IIU%`$%Q-;6RJT[(@ M=MH)'4\G^63^=5_[5TT_\O$9ST`&2<]!]3S@=^V:EOK62[CB1)51%D#2*R%A M(HS\O!&.<'\,'()K'3PN48,;Q6(,1YB(YC0HIX8$<'/7J.W2@#?0Q2QK(FQT M<;@PY!![_K^M+L4_PC\O\^IJ.SMQ9V4%LK%EAC6,,>IP,5-0`W8I_A'Y?Y]3 M3)GAAC:27:%'4XSDGC'N23T]ZEJ"[AEGM9(H9O)D88$FW..>>X[>]`$*:EIT MA`6Y@.X@#D?-NSC'KT;IZ'WJ>"6WNX1-"5>-LX('US_6LN+P\B0R0F<>4VT* MJ1[=H#.Q'4]W./0`=>M:&GVC6=L8WE$LC,69@NT$GT&3CC'>@"QL4_PC\O\` M/J:=110`4444`?&__":^*_\`H9M9_P#`^7_XJC_A-?%?_0S:S_X'R_\`Q5%% M`!_PFOBO_H9M9_\``^7_`.*H_P"$U\5_]#-K/_@?+_\`%444`'_":^*_^AFU MG_P/E_\`BJ/^$U\5_P#0S:S_`.!\O_Q5%%`!_P`)KXK_`.AFUG_P/E_^*H_X M37Q7_P!#-K/_`('R_P#Q5%%`!_PFOBO_`*&;6?\`P/E_^*H_X37Q7_T,VL_^ M!\O_`,5110`?\)KXK_Z&;6?_``/E_P#BJ/\`A-?%?_0S:S_X'R__`!5%%`!_ MPFOBO_H9M9_\#Y?_`(JC_A-?%?\`T,VL_P#@?+_\5110`?\`":^*_P#H9M9_ M\#Y?_BJ/^$U\5_\`0S:S_P"!\O\`\5110`?\)KXK_P"AFUG_`,#Y?_BJ/^$U M\5_]#-K/_@?+_P#%444`'_":^*_^AFUG_P`#Y?\`XJC_`(37Q7_T,VL_^!\O M_P`5110`?\)KXK_Z&;6?_`^7_P"*H_X37Q7_`-#-K/\`X'R__%444`'_``FO MBO\`Z&;6?_`^7_XJC_A-?%?_`$,VL_\`@?+_`/%444`'_":^*_\`H9M9_P#` M^7_XJC_A-?%?_0S:S_X'R_\`Q5%%`!_PFOBO_H9M9_\``^7_`.*H_P"$U\5_ M]#-K/_@?+_\`%444`'_":^*_^AFUG_P/E_\`BJ/^$U\5_P#0S:S_`.!\O_Q5 M%%`!_P`)KXK_`.AFUG_P/E_^*H_X37Q7_P!#-K/_`('R_P#Q5%%`!_PFOBO_ M`*&;6?\`P/E_^*H_X37Q7_T,VL_^!\O_`,5110`?\)KXK_Z&;6?_``/E_P#B MJ/\`A-?%?_0S:S_X'R__`!5%%`!_PFOBO_H9M9_\#Y?_`(JC_A-?%?\`T,VL M_P#@?+_\5110`?\`":^*_P#H9M9_\#Y?_BJ/^$U\5_\`0S:S_P"!\O\`\511 M0`?\)KXK_P"AFUG_`,#Y?_BJ/^$U\5_]#-K/_@?+_P#%444`'_":^*_^AFUG M_P`#Y?\`XJC_`(37Q7_T,VL_^!\O_P`5110`?\)KXK_Z&;6?_`^7_P"*H_X3 M7Q7_`-#-K/\`X'R__%444`'_``FOBO\`Z&;6?_`^7_XJC_A-?%?_`$,VL_\` M@?+_`/%444`'_":^*_\`H9M9_P#`^7_XJC_A-?%?_0S:S_X'R_\`Q5%%`!_P MFOBO_H9M9_\``^7_`.*H_P"$U\5_]#-K/_@?+_\`%444`'_":^*_^AFUG_P/ ME_\`BJ/^$U\5_P#0S:S_`.!\O_Q5%%`!_P`)KXK_`.AFUG_P/E_^*H_X37Q7 F_P!#-K/_`('R_P#Q5%%`!_PFOBO_`*&;6?\`P/E_^*HHHH`__]D_ ` end GRAPHIC 18 pr1012img002.jpg GRAPHIC begin 644 pr1012img002.jpg M_]C_X``02D9)1@`!`@```0`!``#_VP!#``@&!@<&!0@'!P<)"0@*#!0-#`L+ M#!D2$P\4'1H?'AT:'!P@)"XG("(L(QP<*#7J#A(6&AXB)BI*3E)66EYB9FJ*CI*6FIZBIJK*SM+6VM[BYNL+#Q,7& MQ\C)RM+3U-76U]C9VN'BX^3EYN?HZ>KQ\O/T]?;W^/GZ_\0`'P$``P$!`0$! M`0$!`0````````$"`P0%!@<("0H+_\0`M1$``@$"!`0#!`<%!`0``0)W``$" M`Q$$!2$Q!A)!40=A<1,B,H$(%$*1H;'!"2,S4O`58G+1"A8D-.$E\1<8&1HF M)R@I*C4V-S@Y.D-$149'2$E*4U155E=865IC9&5F9VAI:G-T=79W>'EZ@H.$ MA8:'B(F*DI.4E9:7F)F:HJ.DI::GJ*FJLK.TM;:WN+FZPL/$Q<;'R,G*TM/4 MU=;7V-G:XN/DY>;GZ.GJ\O/T]?;W^/GZ_]H`#`,!``(1`Q$`/P#W^BBL[6=> MTOP]9-=ZK?06L(!QYC@%R!G"CJQXZ#F@"IXK\46'A/0Y=2OB&(^6*`,`TSGH MHSU]3Z`$]JX#5O%/BC5I)=.@DM=,-Y;H]D4F_=WJ'&X077:8DX4;.!R>Q#M? MB\3^.IK/7M#TW[)8Z=')Y=IJJE'U#`E;NWN5 M9]4T^3&3YHX#Q``G=U.[K@5Z/H^M:=KVG1W^EW<5U;OCYHV!VD@':P_A8`C( M/(S6+IGA6:.XAN=2NA)>6 M/4>(2)X>\02"+RU(V6]\QX(7@*K*,<9Y]@*`/2****`"BBB@`HHHH`****`" MBBB@`HH)`ZFB@`HHHH`****`"BBB@`HHHH`****`"BBB@`HHHZT`%%(2%&20 M/K2T`8'B_P`2)X9T)[I8VFO9F%O96ZH6,T[`[%P.<9ZXYP#7-^$_!MGO1G;,DKK+#8R$B3RT7D*RDCZ9X`S6=XJGOI?B&\"PN]Y]D$.FJ^##: M1MDR7Y)X#(?EV\$@#GFI_#.LVFG+:31W!31&F^PP3>2?.UJ_?`><]3@E6Y/4 MY)(`%`'IMKOB;QU9^' MM0@T]+::^N_DFNHH$6![>22-7:&0@M&2,E3@D9'3@ MXK'\:Q:1+X1U$:W(D-BL+,9CC=&P!VLF?XP<;>^<5S6G?$#4;5-1_M?26N-. MTF=[2[UFSD789$QN8PMAE&""=NX`Y`SBFWRW/B<#Q%J>G2RZ+9_/I6DCYCJ$ MI(\J=\?=#;@H1A\N2S$#B@##T#XDZ_I5AITGB6VAELYHMD,,,;G49(U7(N70 ML08R%.3P2>1Q7KEG=P7]E!>6TBRV\\:RQ2+T96&01]0:\9U"TNWGU2&[N]FJ M7,)N=;U`_O%T>Q(W?9(R"=S?>^[C([=Z[3X6:A]I\+-:>=.ZV!,G('H<#/KEEY M&2:Q-=/BCX67=GK)\076N:--*EO=07SL\@)R24R<#Y5.#GJ1D&K,MW#X>_:& M>2_DVIJ]BD5NQZ!CM4#\6B([=15_XX74(LT@3]TV,')XSR.,YIUAXT\-ZI:75U9:Q:S16D;2 MSX;#1HHR6*GG;[XQ7F$6A0M\4/!6DZO913&#PW"DT$RAU\Q%E'(Z'!'O3?$^ MGV6F?$77+?1;>"W@?PO=/=Q0(%524?L..<1_G0!Z2_Q#\(1FV#>(+$?:%#)^ M\Z`]"W]S_@6,5K7^N:5IFG+J%]J%M;V;@%)I)0%?(R`I_B)`)`'7M7DNC:!H M+_`.?4;K3K(W9M+B47+Q+YGFAF"?-C/4**Y;5+W59#\.-.FC6>(6\4D%K.^( M9G\UEC#>VP(/HQ]30![MI_C+PYJEC^*K2? M$/PA%;V\S>(+'9/]P"3+=<9*CE1D$<@=*XA?"6LVUSXL\3:K8:9IRW.B7%O] MELFW;CM!W'@#^'\<)!Y93?$=V[IMQSFNVTSQIX;UG46T_3M9M+ MFZ&?W:/]['7:>C?AFO%VC34/"WPOM[M?/AEU!X71^0R&=5VGVQQ6QXVTVQTC MXR>#$TRT@LD=XMR6T8C!_>D=%`[$CZ4`>H:IXU\-:)>K9ZCK-K!7M[<3QW-Q=S!)H-_91M/`;)'/4>PJ]XA\.7OA7P1X0TO4+M;F= M-85SM)*Q[LG8">H&3Z=:`/6KKQCXLA;Q-LM`'K^E^(-(UO3WO]-U""XM8R0\J-PA`R0V>AP0>:S[7QYX5OM3&G6V MO6,ETS!402<.Q.`%;HQ)Z`$YKQ47-QI>D?$^UT]?+MDOE@$48PL<1GD0@`=! MMPOTK:T_PEK_`(F\+>&(;/2-&TRVMC!<+J<$O[]@J\DA5!W$X8C/WEZ\9H`] M2E\<^%H)[V";7;*.6R)6=&DPRL."`.YR",#)SQUK@_$^JZIXA^)>AZ/HGB.Z ML-+O],6Z66U_B),IWGB/ M7_$\UZ]UO4FK'Q.8/\5/`N M"#_I,)X_Z^$Y_G0!Z+<^-_#%G>W=G?2;^&[C0X?RSRI[9!Y'XUYM#H^FZG^T%J\-_86]S$FG+,L">37(:9/-I'B#XFQZ:IA2.VN52.$[!&!-M!4#IM5FQCI0!Z?XU\=>&H_ M#VM:6FNVW]H/93QQQPR%CYFQ@%W+P&SQC.:7P'K-AI'PKT>]U6^AM8!&P\V= MPN3O?@9ZG@\#DUS?A_1]`_X49?WEK:VD]RVFW+SSM$"ZS!&R,GD;3C'X$=:@ M'AC4O%'P/\/0:4(9+NTE^U)#+C$F#(-O/RY^;^+@\@]:`.OU-K#XA:4LFAZG M%=6\)='"$C#G:5)!QC`!'T8XKKK*)[>Q@ADP'1`"`VX#V!P,@>N!7#?#3Q7! MJTNI:++HT&E:M8./MD=NJA)7'R,YV@`'*XQD\`8)%>A8H`\Y^*'A\RPP:[:V M5Y=.FVVU*&VEVF:Q!:1D(R#@N%&1R`Q[5R^B:G`KL!M)!^8]#C[K>W5Q/BWPC;);?V[H-G;VNMV$YOT>&$*UT5!+1 M,1R0X)'UH`W?#?AVV\.:>T$1,MSLGVEE8QIN7^'.3AOEZUT?AK7[7Q/X?L]6M"`D\8+Q MYR8G_B0].0^/F;\6R?QK5KS_1O$Q\-S6&E:M]1?['UG! MVRJV!'#)@<.%.=YP&`R<'-6]5\J2?,LLCYR%!R,'`)'H%!Z_P M9H,^AZ,S7\IEU6^E-Y?R$\&9P-RKC@*N`!CCC/>LO0?`6(XK8>B*.N"6YXZ]`>:[:@##\2^$M'\6V:6VKVOFK&Q:-T+3K:Y MANKR"S5GNVC8/*X4$@1MP,^N?:LRZ\,M(MM>^.>CZ=#/$UQ91RR7=QIMSY]W]\1Z)I^H6ME=ZC:PWEV!Y M$;.-S@G`Q[$Y`I=7U*ZL[BSM;.RAN9;KS`!-.8E&U=V,A6Z]*`/,/A]\-M#\ M0>"=*OM2DOIHI"\CV7VDB`N&9=VT<@X&.#7HNO\`@S0_$FDP:;J-IF"W_P"/ M?RG*&'Y=HVX[8['(X''%2:3KRZA::=<2+!:BXM))Y(&DW-&4*AL'`!52Q!;C ML>]4[CQOHT]A)+I.JV5S+%-$LB>8"51I41FQP<`/][I0!5T7X::%H=M>Q0-> MSR7=J]F\]Q.7986'**.`!T[=JOZ5X)TC1O"MYX=M!.+&[6192TF7/F+M;!QQ MQ[4LOCOPQ%IBZD=8MFLFNA9^PVHFC?`19Z'%;:);A;DQZ-,9[0&7G>7#Y;U MY'2K>J^#=)UK7]/UN\25KS3]I@*2%5!#;AD=^:AM_&VG3^)M7T8_(-,@\Z2X M))4[0#(,8_AW)GG^+VIVE^-]&OX+3S[RWMKNYM!>K:F7UN"GF,3DD@YQGOC%:EUX'T6[TO2M.DBF%KI MDJS6Z"4YW#NQ/)SSGGO6Q!JMC=)9O!GQ:I;F[M&=9XF.TIL&6//8=STH`1Y`8O\H3Z5 M%8^$-*T[Q3>^(X$E_M&\0QRLTA*[3M.`.WW%JYI&OZ5KT4DNE7\%VD3;7,39 MP<9_+T/0UEVWC73P-5?4Y(=/AL=2?3UDEER)2L2RD]!CY2W'/W>M`#['P1HE MA+KCI;O(-;9S?+)(2'#%B0/0?.U8^G_"3PQIFJQ7]LM\HBF6>.W-VQB#J05) M'5L$#J3[UT^G>)-'U>6*+3]1M[F26%ID6-LDHK!6/X$@'ZU%+XLT&&[L[675 M;5+B\(%O&7YDRQ48^I&!ZF@".R\):78>*KWQ)"LW]HWD?E2LTA*[?EX`[?<6 MGW'A?3;KQ9;>)94E.HVT'D1D/A0OS]1Z_.U5[SQUX9L6N4N-9M4>VF6"8;B2 MDA)`4X]P?I@YQ@UM6-]:ZE917EE.D]M*,QR(2%9!*A1RK(X!`88]F/!R.>EF#7344`>>K\%O!HNWF:TNFB8<6YNG\M3V/'S9^I-3_\` M"IO#?]B1Z4#?K%%)V`!VGH.%';^9KNZ*`,'PQX/TCPE;2Q:7"X: M8@S2RR%WD([DG\>F!R:WJ**`"BBB@#S34++5O`NN:KJ=C!-=^&-2+7%]'%(! M+8RL1YDZ@@EAM!.!^@49R9]4>2;3]575X1<2*+?2_$JQ_N[L,Q(L[F(#Y"3R M6(`&,C:I?#[0K^_GN=MS;"]<&^AMYBD5W@[OG7IDDO%2Z#X;TCPS9R6FCV2VL$DAE=0S-EL`9RQ)Z`#' M2M7I0`4444`> M+-9O8K8/;7/APV$3EU&Z8O(=F"<]&7GIS7:T4`>9Z5X;U6PM[?3K_0;F_M+R MRM([EX=2$(MV2%(GC=`XWJ-A;5VQGC'F.VN]8\)74(MS;W\]J6BB=U8PS8 MW)D@X)5P.AQQZ5LXI:`//;CPMJ+:#I*Q:?&;Z_ED36U,BC9#=?/=`'/.&"@; M?3BH-9TKQ7>>)M/C&F"32;'5X+F!HIX4C6!4V'Y3\Y<%V)YQA0`,UZ33)(DF MB>.1`Z.I5E89!!Z@T`<)X'TJ9_$&JZH]T9;*REN--TU`FU5B\WS'QZ@,%C!] M(L]ZL7VDZQ)/XDT^'3P\&H2B]ANVF41LRQQ+Y++G<-QBP3C&&]L'LK>WBM;> M.W@C6.&)0D<:`!54#```Z`"I*`.0TBQU74/&0\1ZCI?]EB+338B!YDE>1FD5 MRV4)&P;<#/)R3@5BR^%-8>_,OV,%/^$P75,^8G_'L(`N_K_>&,=?:O2<44`> M92^$_$0MM8>P"VE[)8V?KV.'P>3Y8'>KR^&I]+U&32TT6ZU M'1;E;=!/'J/E"W5$2+8\9<;@`F[<,DYQBN_HH`\ZDTCQ(USJAM-/E@TM'CNH M=/GNHW,]TMRLS-&^3L1E7A6(`+?='-=Y833W%C%+=6C6DSC+0,ZN8_8E>"?I 8D>YJS10`4444`%%%%`!1110`4444`?_9 ` end GRAPHIC 19 pr1013img000.jpg GRAPHIC begin 644 pr1013img000.jpg M_]C_X``02D9)1@`!`@```0`!``#_VP!#``@&!@<&!0@'!P<)"0@*#!0-#`L+ M#!D2$P\4'1H?'AT:'!P@)"XG("(L(QP<*#7J#A(6&AXB)BI*3E)66EYB9FJ*CI*6FIZBIJK*SM+6VM[BYNL+#Q,7& MQ\C)RM+3U-76U]C9VN'BX^3EYN?HZ>KQ\O/T]?;W^/GZ_\0`'P$``P$!`0$! M`0$!`0````````$"`P0%!@<("0H+_\0`M1$``@$"!`0#!`<%!`0``0)W``$" M`Q$$!2$Q!A)!40=A<1,B,H$(%$*1H;'!"2,S4O`58G+1"A8D-.$E\1<8&1HF M)R@I*C4V-S@Y.D-$149'2$E*4U155E=865IC9&5F9VAI:G-T=79W>'EZ@H.$ MA8:'B(F*DI.4E9:7F)F:HJ.DI::GJ*FJLK.TM;:WN+FZPL/$Q<;'R,G*TM/4 MU=;7V-G:XN/DY>;GZ.GJ\O/T]?;W^/GZ_]H`#`,!``(1`Q$`/P#W^BBL[6=> MTOP]9-=ZK?06L(!QYC@%R!G"CJQXZ#F@"IXK\46'A/0Y=2OB&(^6*`,`TSGH MHSU]3Z`$]JX#5O%/BC5I)=.@DM=,-Y;H]D4F_=WJ'&X077:8DX4;.!R>Q#M? MB\3^.IK/7M#TW[)8Z=')Y=IJJE'U#`E;NWN5 M9]4T^3&3YHX#Q``G=U.[K@5Z/H^M:=KVG1W^EW<5U;OCYHV!VD@':P_A8`C( M/(S6+IGA6:.XAN=2NA)>6 M/4>(2)X>\02"+RU(V6]\QX(7@*K*,<9Y]@*`/2****`"BBB@`HHHH`****`" MBBB@`HH)`ZFB@`HHHH`****`"BBB@`HHHH`****`"BBB@`HHHZT`%%(2%&20 M/K2T`8'B_P`2)X9T)[I8VFO9F%O96ZH6,T[`[%P.<9ZXYP#7-^$_!MGO1G;,DKK+#8R$B3RT7D*RDCZ9X`S6=XJGOI?B&\"PN]Y]D$.FJ^##: M1MDR7Y)X#(?EV\$@#GFI_#.LVFG+:31W!31&F^PP3>2?.UJ_?`><]3@E6Y/4 MY)(`%`'IMKOB;QU9^' MM0@T]+::^N_DFNHH$6![>22-7:&0@M&2,E3@D9'3@ MXK'\:Q:1+X1U$:W(D-BL+,9CC=&P!VLF?XP<;>^<5S6G?$#4;5-1_M?26N-. MTF=[2[UFSD789$QN8PMAE&""=NX`Y`SBFWRW/B<#Q%J>G2RZ+9_/I6DCYCJ$ MI(\J=\?=#;@H1A\N2S$#B@##T#XDZ_I5AITGB6VAELYHMD,,,;G49(U7(N70 ML08R%.3P2>1Q7KEG=P7]E!>6TBRV\\:RQ2+T96&01]0:\9U"TNWGU2&[N]FJ M7,)N=;U`_O%T>Q(W?9(R"=S?>^[C([=Z[3X6:A]I\+-:>=.ZV!,G('H<#/KEEY M&2:Q-=/BCX67=GK)\076N:--*EO=07SL\@)R24R<#Y5.#GJ1D&K,MW#X>_:& M>2_DVIJ]BD5NQZ!CM4#\6B([=15_XX74(LT@3]TV,')XSR.,YIUAXT\-ZI:75U9:Q:S16D;2 MSX;#1HHR6*GG;[XQ7F$6A0M\4/!6DZO913&#PW"DT$RAU\Q%E'(Z'!'O3?$^ MGV6F?$77+?1;>"W@?PO=/=Q0(%524?L..<1_G0!Z2_Q#\(1FV#>(+$?:%#)^ M\Z`]"W]S_@6,5K7^N:5IFG+J%]J%M;V;@%)I)0%?(R`I_B)`)`'7M7DNC:!H M+_`.?4;K3K(W9M+B47+Q+YGFAF"?-C/4**Y;5+W59#\.-.FC6>(6\4D%K.^( M9G\UEC#>VP(/HQ]30![MI_C+PYJEC^*K2? M$/PA%;V\S>(+'9/]P"3+=<9*CE1D$<@=*XA?"6LVUSXL\3:K8:9IRW.B7%O] MELFW;CM!W'@#^'\<)!Y93?$=V[IMQSFNVTSQIX;UG46T_3M9M+ MFZ&?W:/]['7:>C?AFO%VC34/"WPOM[M?/AEU!X71^0R&=5VGVQQ6QXVTVQTC MXR>#$TRT@LD=XMR6T8C!_>D=%`[$CZ4`>H:IXU\-:)>K9ZCK-K!7M[<3QW-Q=S!)H-_91M/`;)'/4>PJ]XA\.7OA7P1X0TO4+M;F= M-85SM)*Q[LG8">H&3Z=:`/6KKQCXLA;Q-LM`'K^E^(-(UO3WO]-U""XM8R0\J-PA`R0V>AP0>:S[7QYX5OM3&G6V MO6,ETS!402<.Q.`%;HQ)Z`$YKQ47-QI>D?$^UT]?+MDOE@$48PL<1GD0@`=! MMPOTK:T_PEK_`(F\+>&(;/2-&TRVMC!<+J<$O[]@J\DA5!W$X8C/WEZ\9H`] M2E\<^%H)[V";7;*.6R)6=&DPRL."`.YR",#)SQUK@_$^JZIXA^)>AZ/HGB.Z ML-+O],6Z66U_B),IWGB/ M7_$\UZ]UO4FK'Q.8/\5/`N M"#_I,)X_Z^$Y_G0!Z+<^-_#%G>W=G?2;^&[C0X?RSRI[9!Y'XUYM#H^FZG^T%J\-_86]S$FG+,L">37(:9/-I'B#XFQZ:IA2.VN52.$[!&!-M!4#IM5FQCI0!Z?XU\=>&H_ M#VM:6FNVW]H/93QQQPR%CYFQ@%W+P&SQC.:7P'K-AI'PKT>]U6^AM8!&P\V= MPN3O?@9ZG@\#DUS?A_1]`_X49?WEK:VD]RVFW+SSM$"ZS!&R,GD;3C'X$=:@ M'AC4O%'P/\/0:4(9+NTE^U)#+C$F#(-O/RY^;^+@\@]:`.OU-K#XA:4LFAZG M%=6\)='"$C#G:5)!QC`!'T8XKKK*)[>Q@ADP'1`"`VX#V!P,@>N!7#?#3Q7! MJTNI:++HT&E:M8./MD=NJA)7'R,YV@`'*XQD\`8)%>A8H`\Y^*'A\RPP:[:V M5Y=.FVVU*&VEVF:Q!:1D(R#@N%&1R`Q[5R^B:G`KL!M)!^8]#C[K>W5Q/BWPC;);?V[H-G;VNMV$YOT>&$*UT5!+1 M,1R0X)'UH`W?#?AVV\.:>T$1,MSLGVEE8QIN7^'.3AOEZUT?AK7[7Q/X?L]6M"`D\8+Q MYR8G_B0].0^/F;\6R?QK5KS_1O$Q\-S6&E:M]1?['UG! MVRJV!'#)@<.%.=YP&`R<'-6]5\J2?,LLCYR%!R,'`)'H%!Z_P M9H,^AZ,S7\IEU6^E-Y?R$\&9P-RKC@*N`!CCC/>LO0?`6(XK8>B*.N"6YXZ]`>:[:@##\2^$M'\6V:6VKVOFK&Q:-T+3K:Y MANKR"S5GNVC8/*X4$@1MP,^N?:LRZ\,M(MM>^.>CZ=#/$UQ91RR7=QIMSY]W]\1Z)I^H6ME=ZC:PWEV!Y M$;.-S@G`Q[$Y`I=7U*ZL[BSM;.RAN9;KS`!-.8E&U=V,A6Z]*`/,/A]\-M#\ M0>"=*OM2DOIHI"\CV7VDB`N&9=VT<@X&.#7HNO\`@S0_$FDP:;J-IF"W_P"/ M?RG*&'Y=HVX[8['(X''%2:3KRZA::=<2+!:BXM))Y(&DW-&4*AL'`!52Q!;C ML>]4[CQOHT]A)+I.JV5S+%-$LB>8"51I41FQP<`/][I0!5T7X::%H=M>Q0-> MSR7=J]F\]Q.7986'**.`!T[=JOZ5X)TC1O"MYX=M!.+&[6192TF7/F+M;!QQ MQ[4LOCOPQ%IBZD=8MFLFNA9^PVHFC?`19Z'%;:);A;DQZ-,9[0&7G>7#Y;U MY'2K>J^#=)UK7]/UN\25KS3]I@*2%5!#;AD=^:AM_&VG3^)M7T8_(-,@\Z2X M))4[0#(,8_AW)GG^+VIVE^-]&OX+3S[RWMKNYM!>K:F7UN"GF,3DD@YQGOC%:EUX'T6[TO2M.DBF%KI MDJS6Z"4YW#NQ/)SSGGO6Q!JMC=)9O!GQ:I;F[M&=9XF.TIL&6//8=STH`1Y`8O\H3Z5 M%8^$-*T[Q3>^(X$E_M&\0QRLTA*[3M.`.WW%JYI&OZ5KT4DNE7\%VD3;7,39 MP<9_+T/0UEVWC73P-5?4Y(=/AL=2?3UDEER)2L2RD]!CY2W'/W>M`#['P1HE MA+KCI;O(-;9S?+)(2'#%B0/0?.U8^G_"3PQIFJQ7]LM\HBF6>.W-VQB#J05) M'5L$#J3[UT^G>)-'U>6*+3]1M[F26%ID6-LDHK!6/X$@'ZU%+XLT&&[L[675 M;5+B\(%O&7YDRQ48^I&!ZF@".R\):78>*KWQ)"LW]HWD?E2LTA*[?EX`[?<6 MGW'A?3;KQ9;>)94E.HVT'D1D/A0OS]1Z_.U5[SQUX9L6N4N-9M4>VF6"8;B2 MDA)`4X]P?I@YQ@UM6-]:ZE917EE.D]M*,QR(2%9!*A1RK(X!`88]F/!R.>EF#7344`>>K\%O!HNWF:TNFB8<6YNG\M3V/'S9^I-3_\` M"IO#?]B1Z4#?K%%)V`!VGH.%';^9KNZ*`,'PQX/TCPE;2Q:7"X: M8@S2RR%WD([DG\>F!R:WJ**`"BBB@#S34++5O`NN:KJ=C!-=^&-2+7%]'%(! M+8RL1YDZ@@EAM!.!^@49R9]4>2;3]575X1<2*+?2_$JQ_N[L,Q(L[F(#Y"3R M6(`&,C:I?#[0K^_GN=MS;"]<&^AMYBD5W@[OG7IDDO%2Z#X;TCPS9R6FCV2VL$DAE=0S-EL`9RQ)Z`#' M2M7I0`4444`> M+-9O8K8/;7/APV$3EU&Z8O(=F"<]&7GIS7:T4`>9Z5X;U6PM[?3K_0;F_M+R MRM([EX=2$(MV2%(GC=`XWJ-A;5VQGC'F.VN]8\)74(MS;W\]J6BB=U8PS8 MW)D@X)5P.AQQZ5LXI:`//;CPMJ+:#I*Q:?&;Z_ED36U,BC9#=?/=`'/.&"@; M?3BH-9TKQ7>>)M/C&F"32;'5X+F!HIX4C6!4V'Y3\Y<%V)YQA0`,UZ33)(DF MB>.1`Z.I5E89!!Z@T`<)X'TJ9_$&JZH]T9;*REN--TU`FU5B\WS'QZ@,%C!] M(L]ZL7VDZQ)/XDT^'3P\&H2B]ANVF41LRQQ+Y++G<-QBP3C&&]L'LK>WBM;> M.W@C6.&)0D<:`!54#```Z`"I*`.0TBQU74/&0\1ZCI?]EB+338B!YDE>1FD5 MRV4)&P;<#/)R3@5BR^%-8>_,OV,%/^$P75,^8G_'L(`N_K_>&,=?:O2<44`> M92^$_$0MM8>P"VE[)8V?KV.'P>3Y8'>KR^&I]+U&32TT6ZU M'1;E;=!/'J/E"W5$2+8\9<;@`F[<,DYQBN_HH`\ZDTCQ(USJAM-/E@TM'CNH M=/GNHW,]TMRLS-&^3L1E7A6(`+?='-=Y833W%C%+=6C6DSC+0,ZN8_8E>"?I 8D>YJS10`4444`%%%%`!1110`4444`?_9 ` end GRAPHIC 20 pr1013img001.jpg GRAPHIC begin 644 pr1013img001.jpg M_]C_X``02D9)1@`!`0```0`!``#_VP!#``@&!@<&!0@'!P<)"0@*#!0-#`L+ M#!D2$P\4'1H?'AT:'!P@)"XG("(L(QP<*#7J#A(6&AXB)BI*3E)66EYB9FJ*CI*6FIZBIJK*SM+6VM[BYNL+#Q,7& MQ\C)RM+3U-76U]C9VN'BX^3EYN?HZ>KQ\O/T]?;W^/GZ_\0`'P$``P$!`0$! M`0$!`0````````$"`P0%!@<("0H+_\0`M1$``@$"!`0#!`<%!`0``0)W``$" M`Q$$!2$Q!A)!40=A<1,B,H$(%$*1H;'!"2,S4O`58G+1"A8D-.$E\1<8&1HF M)R@I*C4V-S@Y.D-$149'2$E*4U155E=865IC9&5F9VAI:G-T=79W>'EZ@H.$ MA8:'B(F*DI.4E9:7F)F:HJ.DI::GJ*FJLK.TM;:WN+FZPL/$Q<;'R,G*TM/4 MU=;7V-G:XN/DY>;GZ.GJ\O/T]?;W^/GZ_]H`#`,!``(1`Q$`/P#=_P"%'>"_ M^>%[_P"!)_PH_P"%'>"_^>%[_P"!)_PKTBJ6K7,MIISRPE0^]%W.0`H9PI.3 MTP"3G!_&@#A/^%'>"_\`GA>_^!)_PH_X4=X+_P">%[_X$G_"M^/7-1ELY;F/ MRR(]K.KI@J"SKMP.^%4XSGYO2NB@N/M%O'-$A*.H89(!Z'_ZWYT`>??\*.\% M_P#/"]_\"3_A1_PH[P7_`,\+W_P)/^%>BEGYQ'G_`(%]?_K?G06?G$>?^!?7 M_P"M^=`'G7_"CO!?_/"]_P#`D_X4?\*.\%_\\+W_`,"3_A7HI9^<1Y_X%]?_ M`*WYT%GYQ'G_`(%]?_K?G0!YU_PH[P7_`,\+W_P)/^%'_"CO!?\`SPO?_`D_ MX5Z*6?G$>?\`@7U_^M^=!9^<1Y_X%]?_`*WYT`>=?\*.\%_\\+W_`,"3_A1_ MPH[P7_SPO?\`P)/^%>BEGYQ'G_@7U_\`K?G06?G$>?\`@7U_^M^=`'G7_"CO M!?\`SPO?_`D_X4?\*.\%_P#/"]_\"3_A7HI9^<1Y_P"!?7_ZWYT%GYQ'G_@7 MU_\`K?G0!YU_PH[P7_SPO?\`P)/^%'_"CO!?_/"]_P#`D_X5Z*6?G$>?^!?7 M_P"M^=!9^<1Y_P"!?7_ZWYT`>=?\*.\%_P#/"]_\"3_A1_PH[P7_`,\+W_P) M/^%>BEGYQ'G_`(%]?_K?G06?G$>?^!?7_P"M^=`'G7_"CO!?_/"]_P#`D_X4 M?\*.\%_\\+W_`,"3_A7HI9^<1Y_X%]?_`*WYT%GYQ'G_`(%]?_K?G0!YU_PH M[P7_`,\+W_P)/^%'_"CO!?\`SPO?_`D_X5Z*6?G$>?\`@7U_^M^=!9^<1Y_X M%]?_`*WYT`>=?\*.\%_\\+W_`,"3_A1_PH[P7_SPO?\`P)/^%>BEGYQ'G_@7 MU_\`K?G06?G$>?\`@7U_^M^=`'G7_"CO!?\`SPO?_`D_X4?\*.\%_P#/"]_\ M"3_A7HI9^<1Y_P"!?7_ZWYT%GYQ'G_@7U_\`K?G0!YU_PH[P7_SPO?\`P)/^ M%'_"CO!?_/"]_P#`D_X5Z*6?G$>?^!?7_P"M^=!9^<1Y_P"!?7_ZWYT`>=?\ M*.\%_P#/"]_\"3_A1_PH[P7_`,\+W_P)/^%>BEGYQ'G_`(%]?_K?G06?G$>? M^!?7_P"M^=`'G7_"CO!?_/"]_P#`D_X4?\*.\%_\\+W_`,"3_A7HI9^<1Y_X M%]?_`*WYT%GYQ'G_`(%]?_K?G0!YU_PH[P7_`,\+W_P)/^%'_"CO!?\`SPO? M_`D_X5Z*6?G$>?\`@7U_^M^=!9^<1Y_X%]?_`*WYT`>=?\*.\%_\\+W_`,"3 M_A1_PH[P7_SPO?\`P)/^%>BEGYQ'G_@7U_\`K?G06?G$>?\`@7U_^M^=`'G7 M_"CO!?\`SPO?_`D_X4?\*.\%_P#/"]_\"3_A7HI9^<1Y_P"!?7_ZWYT%GYQ' MG_@7U_\`K?G0!YU_PH[P7_SPO?\`P)/^%'_"CO!?_/"]_P#`D_X5Z*6?G$>? M^!?7_P"M^=!9^<1Y_P"!?7_ZWYT`>=?\*.\%_P#/"]_\"3_A1_PH[P7_`,\+ MW_P)/^%>BEGYQ'G_`(%]?_K?G06?G$>?^!?7_P"M^=`'G7_"CO!?_/"]_P#` MD_X4?\*.\%_\\+W_`,"3_A7HI9^<1Y_X%]?_`*WYT%GYQ'G_`(%]?_K?G0!Y MU_PH[P7_`,\+W_P)/^%'_"CO!?\`SPO?_`D_X5Z*6?G$>?\`@7U_^M^=!9^< M1Y_X%]?_`*WYT`>=?\*.\%_\\+W_`,"3_A1_PH[P7_SPO?\`P)/^%>BEGYQ' MG_@7U_\`K?G06?G$>?\`@7U_^M^=`'G7_"CO!?\`SPO?_`D_X4?\*.\%_P#/ M"]_\"3_A7HI9^<1Y_P"!?7_ZWYT%GYQ'G_@7U_\`K?G0!YU_PH[P7_SPO?\` MP)/^%'_"CO!?_/"]_P#`D_X5Z*6?G$>?^!?7_P"M^=!9^<1Y_P"!?7_ZWYT` M>=?\*.\%_P#/"]_\"3_A1_PH[P7_`,\+W_P)/^%>BEGYQ'G_`(%]?_K?G06? MG$>?^!?7_P"M^=`'G7_"CO!?_/"]_P#`D_X4?\*.\%_\\+W_`,"3_A7HI9^< M1Y_X%]?_`*WYT^@#S?\`X4=X+_YX7O\`X$G_``HKTBB@`J"\NH[*TEN9=Q2- M2Q"C)/H!ZD]!4]07L=K-9R1WJQ&W(^<2XV_CGWH`AL=2BU!I!$DB[.?G`Y&Y MER,'U1ORJVTD:'#.JD#/)QZ_X'\JJ:?:6-JTHLRIZ*P5]VWDMCVY9C^-7:`& M&:(9S(@QU^8>_P#@?R-!FB&_\`@?R-!FB&_^!_(T^B@!AFB&;*T#O,UZ748==M8@UT)$038V+YD MLC=,9):5OE.1[XP!T>C:;%I>J;;'4;9=/92HM%<.0_^!_(T^B@!AFB&N/>JS:]HZR^4VK6( MD\TP[3<)GS!@%,9^]R..O-`%TS1#.9$&.OS#W_P/Y&@S1#.9$&.OS#W_`,#^ M1IEO=VUV@>VN(IE(W!HW##'(SQ]#^1J:@!AFB&_P#@?R-!FB&VNG6K7-[<16\"X#22L%49.!R?>F7.I6-FD;W-Y;P MI*&,;22!0P"EB1GKA03]!F@"221@ MJHHY))/`%`&;;>)M$O94BMM3MY7'FN;>5Y7F5XE>5B!C+>:2 M.F"!P5`4!<4^\E\/WNHSWQT3>0C8E!(R_MP,'=DY`.]M= M6T^]!-M>0RA>NUP<=?\``_E5DS1#.9$&.OS#W_P/Y&N/T^]\,+K\,NF>*=)7 MS7VBQMKF/$I(VJH`;GDYZ$Y/&.<]G0`PS1#.9$&.OS#W_P`#^1H,T0SF1!CK M\P]_\#^1I]9N)/^R`J,>>3C&*`.G,T0SF1 M!CK\P]_\#^1H,T0SF1!CK\P]_P#`_D:YS6/%CZ7KS:8FG&X(LS<[UF"DG$AV M8(QTC)ZY]`<'$EIXJ$MY##>6?V..=8FAEDE^63>N<+P,D$@8[\GC!%`&^9HA MG,B#'7YA[_X'\C3Z**`"BBB@`JM?Q33V3QV^P2DKM+]!@@Y'!P<=#@X.*LT4 M`9FDZ8VG-+G8L94)&B$G:N]VZG_?Q^&>^!HM&&.26Z8X8CU_Q_SBL_39+M[R M\%QYOEAODWI@??@KC=1\47T&@^'KN!X&N;W[/]JCW_-ND4':%W`C M.YL8R1@<<5T=R/$C%?LKZ3&/XO-61\_D1BH-GB[_`)^-#_[\2_\`Q=`&,FLZ MS#;_`&V>6":P:>:,,JLDFU&=2V-V.BLP.0,$9Q@5U]K)#>V<-U$9/+GC$BY8 M@X89'&>.O^<"LG9XN_Y^-#_[\2__`!=6+<>(U#?:6TJ0_P`/E"1,?7)-`&H8 ME.>7Y_VS[^_O_+T%!B4YY?G_`&S[^_O_`"]!5`C63(&VV.`"-N]\'/?I[?K4 M=S-KT48:&TLIVSC:)67CUY'TH`TS$ISR_/\`MGW]_?\`EZ"@Q*<\OS_MGW]_ M?^7H*POM_B?_`*`UK_X$BC[?XG_Z`UK_`.!(H`W3$ISR_/\`MGW]_?\`EZ"@ MQ*<\OS_MGW]_?^7H*Q[>Z\12R%9M.LX%QG@KY'K[!\1:1JOB'P_>Z1(UE"EU&8S(K M,2OZ5Y;_`,,]S?\`093_`+Y/^%`'B%=5\-0&^(^A`YP;D#@X[&O1?^&>YO\` MH,I_WR?\*T_#WP4N?#WB"RU:+5(9GM9/,6-@0&Z]>*`/8#$ISR_/^V??W]_Y M>@H,2\Y+_P#?9]_?W_EZ"J$@UEXV4+8J2"`0[Y'Z4/\`VPR,NRPY!'WW_P`* M`.>O;:QG\6Q:Y!X@T]!';^4(GGSD@2]PXX_>Y]1MP"`35.RT72H+V=YO$%A) M:37OVAK<3#!0"0JF=W9Y`W_`!^'$?\,]S?\`093_`+Y/^%'_``SW-_T&4_[Y M/^%`'I.E1:;I>I2O#X@LQ82(_P#HBW`_UA(K^>RO](M[:[CA:[N0C)*3AUR-WS$C'RLP`&26*=@:T$&LI&JE;%B! MC<7?)]^E498O%S2N8;K1DC)^56@D8@>YW#/Y4`86L>(M034=532KV&:&'3VN MD'E,?+(\L@9##.X2,0W3L!F,YUH=3O;;Q`]AJ7SQSS2"W:W+$!205#$D88*< MD#/W@>B\2>3XR_Y_=$_\!Y?_`(NCR?&7_/[HG_@/+_\`%T`=`8E.>7Y_VS[^ M_O\`R]!08E.>7Y_VS[^_O_+T%9\7]NK$HE&G/(!\S*74$^PPZ;+I=UK5E87+%)$-Q<8*8;(.W>I]>^/KC%8.HV6B7JZ M&#,L3IM:)X\E6;.N=_X9[F_Z#*?]\G_"@#M!9^'HK*W6T\5:5:WL2,&NHK@9=R>7 M.9"=Q!.3DY)YS@"NWM+FRU&$S6=W'*?\,]S?\` M093_`+Y/^%>A^"O"FI>"]!.E6\UI@JAC61(S;;'!`&W>^!C/M[C\J7=K/\`SSL/^^W_ M`,*`+QB4YY?G_;/O[^_\O04&)3GE^?\`;/O[^_\`+T%9XEU9E9E&G$*2"1*_ M&/PH\[5BQ4#3B1C(\U^,].U`&@8E.>7Y_P!L^_O[_P`O04&)3GE^?]L^_O[_ M`,O051#:P1D)8$'H?,?_``I"-9,@8+8X`(QO?!_3V_6@"^8E.>7Y_P!L^_O[ M_P`O04&)3GE^?]L^_O[_`,O05ROBWQ5?>#]"?5KVUMYH5D6/9"[%LMTZX%7Y_VS[^_O\`R]!7 MBW_#0=K_`-`>;\Q_C6[X2^+9\8:ZNDV6F^3,T;2!YF^7"_3)H`],,2G/+\_[ M9]_?W_EZ"L#QS&!X"\0G+9_LZX/WC_<;_'^7H*T'&LL``MBO(.0[]CTZ53UK M3M6UG0[_`$Q_L4:7=N\!=7]`'QQ17M__``SW-_T&4_[Y/^%'_#/< MW_093_OD_P"%`'E_@XNXKCPQ<3%V\N4M,IW[2V,_3<<>E>O[M9_YYV'_ M`'V_^%>.3_`":>XEF.L1@NY;&T\9.?2@")OC/X7:Z-TWA.8SE&3S/.7=M8L6 M&?WJ6<+-NB\P#<$DDV9& M1D]SQ[`U:J"]6V:SD-WM%N@\QRQP%"_-G/;&,_A0!6TS4VU!I%>W,#(`=I;) M^\ZX/'!RA]>U7FD"G!#=,\*3Z_X?YS52Q-@7F^Q[=V1O(SSR?7MG=T[[N^:N MT`,,JC/#\?[!]_;V_EZB@RJ,\/Q_L'W]O;^7J*?10`PRJ,\/Q_L'W]O;^7J* M#*HSP_'^P??V]OY>HI]%`##*HSP_'^P??V]OY>HIDTKB&3R1^]"G9O1MN><9 MP.G'^.Z:3E78@=1ESM'.!P<9[5ZA10!CZ'/J(@GBU.V>-XY M6"N"7\P9)R/;C@>A`^NJ95&>'X_V#[^WM_+U%/HH`895&>'X_P!@^_M[?R]1 M095&>'X_V#[^WM_+U%/HH`895&>'X_V#[^WM_+U%!E49X?C_`&#[^WM_+U%/ MHH`895&>'X_V#[^WM_+U%!E49X?C_8/O[>W\O44^B@!AE49X?C_8/O[>W\O4 M4&51GA^/]@^_M[?R]13Z*`&&51GA^/\`8/O[>W\O44&51GA^/]@^_M[?R]13 MZ*`&&51GA^/]@^_M[?R]1095&>'X_P!@^_M[?R]13Z*`&&51GA^/]@^_M[?R M]1095&>'X_V#[^WM_+U%/HH`895&>'X_V#[^WM_+U%!E49X?C_8/O[>W\O44 M^B@!AE49X?C_`&#[^WM_+U%!E49X?C_8/O[>W\O44^B@!AE49X?C_8/O[>W\ MO44&51GA^/\`8/O[>W\O44^B@!AE49X?C_8/O[>W\O45%71BPSQRVTD1?>)%XW,-O\(#8&3GCID5W]%`&9HR7EGI<<&H- M&TT>5'D(VT*,X`X'I_+KU.@95&>'X_V#[^WM_+U%/HH`\U^.#@_#B8`-_P`? M4752.Y_P_P`YKYDKZ=^./_)-YO\`KZB_F:^8J`"O1O@@P7XCPDY_X]9N@)[5 MYS7H_P`#O^2D0_\`7K+_`"%`'TV95&>'X_V#[^WM_+U%!E49X?C_`&#[^WM_ M+U%/HH`895&>'X_V#[^WM_+U%!E49X?C_8/O[>W\O44^B@!AE49X?C_8/O[> MW\O44&51GA^/]@^_M[?R]13Z*`&&51GA^/\`8/O[>W\O44&51GA^/]@^_M[? MR]13Z*`&&51GA^/]@^_M[?R]1095&>'X_P!@^_M[?R]13Z*`&&51GA^/]@^_ MM[?R]13Z**`"BBB@`JIJ&GQ:C;/#(\J;AC*.1CD'IT/3O5NL_5XKN:S*6IQE MD+;?OX#J6QR/X<]Z`#3-+_LXR'SC+N`497&!N=N?4Y<^G:KS1HYRR@\8Y_'_ M`!-9.A0W\7G&^21&91PTN\;MSDXY/&TH/PK682$_*R@8[KGU]_I_GH`(88SG M*#GK^O\`B?SH,,9SE!SU_7_$_G01+SAT]OD/O[_3\CZ\!$O.'3V^0^_O]/R/ MKP`!AC.OZ_XG\Z##&OZ_XG\Z##&OZ_P")_.@PQG.4'/7]?\3^=!$O M.'3V^0^_O]/R/KP$2\X=/;Y#[^_T_(^O``&&,YR@YZ_K_B?SH,,9SE!SU_7_ M`!/YT$2\X=/;Y#[^_P!/R/KP$2\X=/;Y#[^_T_(^O``&&,YR@YZ_K_B?SH,, M9SE!SU_7_$_G01+SAT]OD/O[_3\CZ\!$O.'3V^0^_O\`3\CZ\``88SG*#GK^ MO^)_.@PQG.4'/7]?\3^=!$O.'3V^0^_O]/R/KP$2\X=/;Y#[^_T_(^O``&&, MYR@YZ_K_`(G\Z##&OZ_XG\Z##&OZ_XG\Z##&OZ_XG\Z# M#&OZ_P")_.@PQG.4'/7]?\3^=!$O.'3V^0^_O]/R/KP$2\X=/;Y#[^_T M_(^O``&&,YR@YZ_K_B?SH,,9SE!SU_7_`!/YT$2\X=/;Y#[^_P!/R/KP$2\X M=/;Y#[^_T_(^O`!YQ\<(T'PXF(4`_:HOYG_$U\R5]-_'`/\`\*XFRRD?:HNB M^Y]_I7S)0`5Z-\$%5_B/"&`(^RS=?I7G->C?!#OZ_XG\Z##&OZ_XG\Z?3")><.GM\ MA]_?Z?D?7A]`!1110`51U2]>RMMT,;/,S(J#82.6"]<@9YZ$BKU4KZ\M8C]F MN(VD,B;A'Y>0_P`RKC)XSEEX]Z`*VB:M)JBN[K&%V!UV9Z%W7'/7[F>W7I6H MSE3Q&S<=L>_O[?K5/3KZRO?,:S``.'+!-N\'*AOS4CGT^E72RCJP'U-`#2[# M/[IS^(YZ^_M^H]\!=AG]TY_$<]??V_4>^%WJ/XA^?^?0T;U'\0_/_/H:`$+L M,_NG/XCGK[^WZCWP%V&?W3G\1SU]_;]1[X7>H_B'Y_Y]#1O4?Q#\_P#/H:`$ M+L,_NG/XCGK[^WZCWP%V&?W3G\1SU]_;]1[X7>H_B'Y_Y]#1O4?Q#\_\^AH` M0NPS^Z<_B.>OO[?J/?`789_=.?Q'/7W]OU'OA=ZC^(?G_GT-&]1_$/S_`,^A MH`0NPS^Z<_B.>OO[?J/?`789_=.?Q'/7W]OU'OA=ZC^(?G_GT-&]1_$/S_SZ M&@!"[#/[IS^(YZ^_M^H]\!=AG]TY_$<]??V_4>^%WJ/XA^?^?0T;U'\0_/\` MSZ&@!"[#/[IS^(YZ^_M^H]\!=AG]TY_$<]??V_4>^%WJ/XA^?^?0T;U'\0_/ M_/H:`$+L,_NG/XCGK[^WZCWP%V&?W3G\1SU]_;]1[X7>H_B'Y_Y]#1O4?Q#\ M_P#/H:`$+L,_NG/XCGK[^WZCWP%V&?W3G\1SU]_;]1[X7>H_B'Y_Y]#1O4?Q M#\_\^AH`0NPS^Z<_B.>OO[?J/?`789_=.?Q'/7W]OU'OA=ZC^(?G_GT-&]1_ M$/S_`,^AH`0NPS^Z<_B.>OO[?J/?`789_=.?Q'/7W]OU'OA=ZC^(?G_GT-&] M1_$/S_SZ&@!"[#/[IS^(YZ^_M^H]\!=AG]TY_$<]??V_4>^%WJ/XA^?^?0T; MU'\0_/\`SZ&@!"[#/[IS^(YZ^_M^H]\!=AG]TY_$<]??V_4>^%WJ/XA^?^?0 MT;U'\0_/_/H:`$+L,_NG/XCGK[^WZCWP%V&?W3G\1SU]_;]1[X7>H_B'Y_Y] M#1O4?Q#\_P#/H:`$+L,_NG/XCGK[^WZCWP%V&?W3G\1SU]_;]1[X7>H_B'Y_ MY]#1O4?Q#\_\^AH`0NPS^Z<_B.>OO[?J/?`789_=.?Q'/7W]OU'OA=ZC^(?G M_GT-&]1_$/S_`,^AH`0NPS^Z<_B.>OO[?J/?`789_=.?Q'/7W]OU'OA=ZC^( M?G_GT-&]1_$/S_SZ&@!"[#/[IS^(YZ^_M^H]\!=AG]TY_$<]??V_4>^%WJ/X MA^?^?0T;U'\0_/\`SZ&@#DOB-X:OO%_A*32;#RHYVF20-.V%PI/ID^G;N/?' MCQ^`7BH9_P!-TH_]M7YZ_P"Q[?J/?'T3<>8\86":&-MPW&1"X*]Q@,,'`//; MT-<-;Z#J]EKNEWD4+>1#)<331)4#MZ]Q M[XZ:+P_JTVJ:B;M2;>>_BF21IQE(Q+(S;<'./+V)SSG=C@"MG1K#4=(U'[.' M:?3BI'G7$H:08W'G!ZDDGIR.I!&"`=$789_=.?Q'/7W]OU'O@+L,_NG/XCGK M[^WZCWPN]1_$/S_SZ&C>H_B'Y_Y]#0`A=AG]TY_$<]??V_4>^`NPS^Z<_B.> MOO[?J/?"[U'\0_/_`#Z&C>H_B'Y_Y]#0`A=AG]TY_$<]??V_4>^`NPS^Z<_B M.>OO[?J/?"[U'\0_/_/H:-ZC^(?G_GT-`"%V&?W3G\1SU]_;]1[X"[#/[IS^ M(YZ^_M^H]\+O4?Q#\_\`/H:-ZC^(?G_GT-`"%V&?W3G\1SU]_;]1[X"[#/[I MS^(YZ^_M^H]\+O4?Q#\_\^AHWJ/XA^?^?0T`(789_=.?Q'/7W]OU'OA]-WJ/ MXA^?^?0TZ@`HHHH`*I7&EV\^TKF$IG:8@!@EU?.,8SE!^M7:*`*.G:5;Z6K+ M;M(5*A0'(.T`L<#CU9NOK5TJIZJ#]12T4`-V*?X1^7^?4U5DO[".5HI)HPX8 M(01W.3_C5RL>[T62\N9I7NUQ(=H'E'*QE2I4'=C^(G..OKQ@`NP7MC=.$AFB M=V4N%!Y*C&3CT^8<^_O5G8I_A'Y?Y]36=IVD?8'CD:?S&1"APFT'B-1W/:(? MB3TZ5IT`-V*?X1^7^?4T;%/\(_+_`#ZFG44`59[RSMI/+FD17(R%(R3G.!]3 MS@=3@X[U&NIZ=(ZJMQ$Q<@#'._(%`#3JVF;-QN(\%=W3MG;Z>N15X*C*"`I M!YR._P#G-87_``CLOSDWJ%I,E_W)`+'(/1L@;3C&>O.>U;D2>5"D98MM4+N/ M4X[T`+L4_P`(_+_/J:-BG^$?E_GU-.HH`AGD@MXFEFVJ@P"<9Y)P/S)_6H%U M'3Y)`BSQ,S'`QSGG'Y9.,],G'6I;ZWENK-X89O)9L?/M)XR,C@@\C(R"",Y% M8Y\,[IB_VO8I&W;%'MVKYOFX!SP=W&?3MWH`VX9(+F(2PLDD;9`9>0>2#_6G M[%/\(_+_`#ZFH-/LQ86:VZR%PK.P8J!]YBV,#CC.*LT`-V*?X1^7^?4TDGE1 MQM))L5%!+,W``[D_K3Z9*KO"ZQN$=E(5BN=I[''>@"FVJZ:`Q:XC&`2V1R,' M!S[@GD=L\U9AE@N%_ZUB-X9G*6#7$0(+`Y_V>O\^OO5ZL&Y\.R7:S"6]7,Q;> MPA.2"5*C[W&W:![CWYH`U8+NTNG9(71V`R1CIZ@^_/(ZC//6I]BG^$?E_GU- M9FFZ-_9][<7/GAVG9GD`3;EFVY[G@;>!VW'DYK5H`;L4_P`(_+_/J:-BG^$? ME_GU-.HH`IS7]A!*TF3[@YJG?Z+)?W$LCW2@$%8P8B3&I0HPSNQSN)SCTSD`5+I^D?89$8S^8$! M"C9C^%$!ZGD"/K_M'I0!H[%/\(_+_/J:-BG^$?E_GU-.HH`;L4_PC\O\^IJ" MXN[.V<)/(B,P+8([8)_^*^O-6:SM1TV2_FC;[0J)&,JAC)P_9LY'TQZ$^N0` M/_M/3F('VB(Y*CIUW`D?ID_SJYL4_P`(_+_/J:Y\^%BWEYO1^[?>O[KH2/F/ MWNN>1V'0@UT5`#=BG^$?E_GU-&Q3_"/R_P`^IIU%`$%Q-;6RJT[(@=MH)'4\ MG^63^=5_[5TT_P#+Q&<]`!DG/0?4\X'?MFI;ZUDNXXD25419`TBLA82*,_+P M1CG!_#!R":QT\+E&#&\5B#$>8B.8T**>&!'!SUZCMTH`WT,4L:R)L='&X,.0 M0>_Z_K2[%/\`"/R_SZFH[.W%G906RL66&-8PQZG`Q4U`#=BG^$?E_GU-,F>& M&-I)=H4=3C.2>,>Y)/3WJ6H+N&6>UDBAF\F1A@2;O1NGH?>IX);>[A$T)5XVS@@?7/\`6LN+P\B0R0F<>4VT*J1[ M=H#.Q'4]W./0`=>M:&GVC6=L8WE$LC,69@NT$GT&3CC'>@"QL4_PC\O\^IIU M%%`!1110!\;_`/":^*_^AFUG_P`#Y?\`XJC_`(37Q7_T,VL_^!\O_P`5110` M?\)KXK_Z&;6?_`^7_P"*H_X37Q7_`-#-K/\`X'R__%444`'_``FOBO\`Z&;6 M?_`^7_XJC_A-?%?_`$,VL_\`@?+_`/%444`'_":^*_\`H9M9_P#`^7_XJC_A M-?%?_0S:S_X'R_\`Q5%%`!_PFOBO_H9M9_\``^7_`.*H_P"$U\5_]#-K/_@? M+_\`%444`'_":^*_^AFUG_P/E_\`BJ/^$U\5_P#0S:S_`.!\O_Q5%%`!_P`) MKXK_`.AFUG_P/E_^*H_X37Q7_P!#-K/_`('R_P#Q5%%`!_PFOBO_`*&;6?\` MP/E_^*H_X37Q7_T,VL_^!\O_`,5110`?\)KXK_Z&;6?_``/E_P#BJ/\`A-?% M?_0S:S_X'R__`!5%%`!_PFOBO_H9M9_\#Y?_`(JC_A-?%?\`T,VL_P#@?+_\ M5110`?\`":^*_P#H9M9_\#Y?_BJ/^$U\5_\`0S:S_P"!\O\`\5110`?\)KXK M_P"AFUG_`,#Y?_BJ/^$U\5_]#-K/_@?+_P#%444`'_":^*_^AFUG_P`#Y?\` MXJC_`(37Q7_T,VL_^!\O_P`5110`?\)KXK_Z&;6?_`^7_P"*H_X37Q7_`-#- MK/\`X'R__%444`'_``FOBO\`Z&;6?_`^7_XJC_A-?%?_`$,VL_\`@?+_`/%4 M44`'_":^*_\`H9M9_P#`^7_XJC_A-?%?_0S:S_X'R_\`Q5%%`!_PFOBO_H9M M9_\``^7_`.*H_P"$U\5_]#-K/_@?+_\`%444`'_":^*_^AFUG_P/E_\`BJ/^ M$U\5_P#0S:S_`.!\O_Q5%%`!_P`)KXK_`.AFUG_P/E_^*H_X37Q7_P!#-K/_ M`('R_P#Q5%%`!_PFOBO_`*&;6?\`P/E_^*H_X37Q7_T,VL_^!\O_`,5110`? M\)KXK_Z&;6?_``/E_P#BJ/\`A-?%?_0S:S_X'R__`!5%%`!_PFOBO_H9M9_\ M#Y?_`(JC_A-?%?\`T,VL_P#@?+_\5110`?\`":^*_P#H9M9_\#Y?_BJ/^$U\ M5_\`0S:S_P"!\O\`\5110`?\)KXK_P"AFUG_`,#Y?_BJ/^$U\5_]#-K/_@?+ M_P#%444`'_":^*_^AFUG_P`#Y?\`XJC_`(37Q7_T,VL_^!\O_P`5110`?\)K MXK_Z&;6?_`^7_P"*H_X37Q7_`-#-K/\`X'R__%444`'_``FOBO\`Z&;6?_`^ M7_XJC_A-?%?_`$,VL_\`@?+_`/%444`'_":^*_\`H9M9_P#`^7_XJC_A-?%? C_0S:S_X'R_\`Q5%%`!_PFOBO_H9M9_\``^7_`.*HHHH`_]D_ ` end GRAPHIC 21 pr1013img002.jpg GRAPHIC begin 644 pr1013img002.jpg M_]C_X``02D9)1@`!`@```0`!``#_VP!#``@&!@<&!0@'!P<)"0@*#!0-#`L+ M#!D2$P\4'1H?'AT:'!P@)"XG("(L(QP<*#7J#A(6&AXB)BI*3E)66EYB9FJ*CI*6FIZBIJK*SM+6VM[BYNL+#Q,7& MQ\C)RM+3U-76U]C9VN'BX^3EYN?HZ>KQ\O/T]?;W^/GZ_\0`'P$``P$!`0$! M`0$!`0````````$"`P0%!@<("0H+_\0`M1$``@$"!`0#!`<%!`0``0)W``$" M`Q$$!2$Q!A)!40=A<1,B,H$(%$*1H;'!"2,S4O`58G+1"A8D-.$E\1<8&1HF M)R@I*C4V-S@Y.D-$149'2$E*4U155E=865IC9&5F9VAI:G-T=79W>'EZ@H.$ MA8:'B(F*DI.4E9:7F)F:HJ.DI::GJ*FJLK.TM;:WN+FZPL/$Q<;'R,G*TM/4 MU=;7V-G:XN/DY>;GZ.GJ\O/T]?;W^/GZ_]H`#`,!``(1`Q$`/P#W^BBL[6=> MTOP]9-=ZK?06L(!QYC@%R!G"CJQXZ#F@"IXK\46'A/0Y=2OB&(^6*`,`TSGH MHSU]3Z`$]JX#5O%/BC5I)=.@DM=,-Y;H]D4F_=WJ'&X077:8DX4;.!R>Q#M? MB\3^.IK/7M#TW[)8Z=')Y=IJJE'U#`E;NWN5 M9]4T^3&3YHX#Q``G=U.[K@5Z/H^M:=KVG1W^EW<5U;OCYHV!VD@':P_A8`C( M/(S6+IGA6:.XAN=2NA)>6 M/4>(2)X>\02"+RU(V6]\QX(7@*K*,<9Y]@*`/2****`"BBB@`HHHH`****`" MBBB@`HH)`ZFB@`HHHH`****`"BBB@`HHHH`****`"BBB@`HHHZT`%%(2%&20 M/K2T`8'B_P`2)X9T)[I8VFO9F%O96ZH6,T[`[%P.<9ZXYP#7-^$_!MGO1G;,DKK+#8R$B3RT7D*RDCZ9X`S6=XJGOI?B&\"PN]Y]D$.FJ^##: M1MDR7Y)X#(?EV\$@#GFI_#.LVFG+:31W!31&F^PP3>2?.UJ_?`><]3@E6Y/4 MY)(`%`'IMKOB;QU9^' MM0@T]+::^N_DFNHH$6![>22-7:&0@M&2,E3@D9'3@ MXK'\:Q:1+X1U$:W(D-BL+,9CC=&P!VLF?XP<;>^<5S6G?$#4;5-1_M?26N-. MTF=[2[UFSD789$QN8PMAE&""=NX`Y`SBFWRW/B<#Q%J>G2RZ+9_/I6DCYCJ$ MI(\J=\?=#;@H1A\N2S$#B@##T#XDZ_I5AITGB6VAELYHMD,,,;G49(U7(N70 ML08R%.3P2>1Q7KEG=P7]E!>6TBRV\\:RQ2+T96&01]0:\9U"TNWGU2&[N]FJ M7,)N=;U`_O%T>Q(W?9(R"=S?>^[C([=Z[3X6:A]I\+-:>=.ZV!,G('H<#/KEEY M&2:Q-=/BCX67=GK)\076N:--*EO=07SL\@)R24R<#Y5.#GJ1D&K,MW#X>_:& M>2_DVIJ]BD5NQZ!CM4#\6B([=15_XX74(LT@3]TV,')XSR.,YIUAXT\-ZI:75U9:Q:S16D;2 MSX;#1HHR6*GG;[XQ7F$6A0M\4/!6DZO913&#PW"DT$RAU\Q%E'(Z'!'O3?$^ MGV6F?$77+?1;>"W@?PO=/=Q0(%524?L..<1_G0!Z2_Q#\(1FV#>(+$?:%#)^ M\Z`]"W]S_@6,5K7^N:5IFG+J%]J%M;V;@%)I)0%?(R`I_B)`)`'7M7DNC:!H M+_`.?4;K3K(W9M+B47+Q+YGFAF"?-C/4**Y;5+W59#\.-.FC6>(6\4D%K.^( M9G\UEC#>VP(/HQ]30![MI_C+PYJEC^*K2? M$/PA%;V\S>(+'9/]P"3+=<9*CE1D$<@=*XA?"6LVUSXL\3:K8:9IRW.B7%O] MELFW;CM!W'@#^'\<)!Y93?$=V[IMQSFNVTSQIX;UG46T_3M9M+ MFZ&?W:/]['7:>C?AFO%VC34/"WPOM[M?/AEU!X71^0R&=5VGVQQ6QXVTVQTC MXR>#$TRT@LD=XMR6T8C!_>D=%`[$CZ4`>H:IXU\-:)>K9ZCK-K!7M[<3QW-Q=S!)H-_91M/`;)'/4>PJ]XA\.7OA7P1X0TO4+M;F= M-85SM)*Q[LG8">H&3Z=:`/6KKQCXLA;Q-LM`'K^E^(-(UO3WO]-U""XM8R0\J-PA`R0V>AP0>:S[7QYX5OM3&G6V MO6,ETS!402<.Q.`%;HQ)Z`$YKQ47-QI>D?$^UT]?+MDOE@$48PL<1GD0@`=! MMPOTK:T_PEK_`(F\+>&(;/2-&TRVMC!<+J<$O[]@J\DA5!W$X8C/WEZ\9H`] M2E\<^%H)[V";7;*.6R)6=&DPRL."`.YR",#)SQUK@_$^JZIXA^)>AZ/HGB.Z ML-+O],6Z66U_B),IWGB/ M7_$\UZ]UO4FK'Q.8/\5/`N M"#_I,)X_Z^$Y_G0!Z+<^-_#%G>W=G?2;^&[C0X?RSRI[9!Y'XUYM#H^FZG^T%J\-_86]S$FG+,L">37(:9/-I'B#XFQZ:IA2.VN52.$[!&!-M!4#IM5FQCI0!Z?XU\=>&H_ M#VM:6FNVW]H/93QQQPR%CYFQ@%W+P&SQC.:7P'K-AI'PKT>]U6^AM8!&P\V= MPN3O?@9ZG@\#DUS?A_1]`_X49?WEK:VD]RVFW+SSM$"ZS!&R,GD;3C'X$=:@ M'AC4O%'P/\/0:4(9+NTE^U)#+C$F#(-O/RY^;^+@\@]:`.OU-K#XA:4LFAZG M%=6\)='"$C#G:5)!QC`!'T8XKKK*)[>Q@ADP'1`"`VX#V!P,@>N!7#?#3Q7! MJTNI:++HT&E:M8./MD=NJA)7'R,YV@`'*XQD\`8)%>A8H`\Y^*'A\RPP:[:V M5Y=.FVVU*&VEVF:Q!:1D(R#@N%&1R`Q[5R^B:G`KL!M)!^8]#C[K>W5Q/BWPC;);?V[H-G;VNMV$YOT>&$*UT5!+1 M,1R0X)'UH`W?#?AVV\.:>T$1,MSLGVEE8QIN7^'.3AOEZUT?AK7[7Q/X?L]6M"`D\8+Q MYR8G_B0].0^/F;\6R?QK5KS_1O$Q\-S6&E:M]1?['UG! MVRJV!'#)@<.%.=YP&`R<'-6]5\J2?,LLCYR%!R,'`)'H%!Z_P M9H,^AZ,S7\IEU6^E-Y?R$\&9P-RKC@*N`!CCC/>LO0?`6(XK8>B*.N"6YXZ]`>:[:@##\2^$M'\6V:6VKVOFK&Q:-T+3K:Y MANKR"S5GNVC8/*X4$@1MP,^N?:LRZ\,M(MM>^.>CZ=#/$UQ91RR7=QIMSY]W]\1Z)I^H6ME=ZC:PWEV!Y M$;.-S@G`Q[$Y`I=7U*ZL[BSM;.RAN9;KS`!-.8E&U=V,A6Z]*`/,/A]\-M#\ M0>"=*OM2DOIHI"\CV7VDB`N&9=VT<@X&.#7HNO\`@S0_$FDP:;J-IF"W_P"/ M?RG*&'Y=HVX[8['(X''%2:3KRZA::=<2+!:BXM))Y(&DW-&4*AL'`!52Q!;C ML>]4[CQOHT]A)+I.JV5S+%-$LB>8"51I41FQP<`/][I0!5T7X::%H=M>Q0-> MSR7=J]F\]Q.7986'**.`!T[=JOZ5X)TC1O"MYX=M!.+&[6192TF7/F+M;!QQ MQ[4LOCOPQ%IBZD=8MFLFNA9^PVHFC?`19Z'%;:);A;DQZ-,9[0&7G>7#Y;U MY'2K>J^#=)UK7]/UN\25KS3]I@*2%5!#;AD=^:AM_&VG3^)M7T8_(-,@\Z2X M))4[0#(,8_AW)GG^+VIVE^-]&OX+3S[RWMKNYM!>K:F7UN"GF,3DD@YQGOC%:EUX'T6[TO2M.DBF%KI MDJS6Z"4YW#NQ/)SSGGO6Q!JMC=)9O!GQ:I;F[M&=9XF.TIL&6//8=STH`1Y`8O\H3Z5 M%8^$-*T[Q3>^(X$E_M&\0QRLTA*[3M.`.WW%JYI&OZ5KT4DNE7\%VD3;7,39 MP<9_+T/0UEVWC73P-5?4Y(=/AL=2?3UDEER)2L2RD]!CY2W'/W>M`#['P1HE MA+KCI;O(-;9S?+)(2'#%B0/0?.U8^G_"3PQIFJQ7]LM\HBF6>.W-VQB#J05) M'5L$#J3[UT^G>)-'U>6*+3]1M[F26%ID6-LDHK!6/X$@'ZU%+XLT&&[L[675 M;5+B\(%O&7YDRQ48^I&!ZF@".R\):78>*KWQ)"LW]HWD?E2LTA*[?EX`[?<6 MGW'A?3;KQ9;>)94E.HVT'D1D/A0OS]1Z_.U5[SQUX9L6N4N-9M4>VF6"8;B2 MDA)`4X]P?I@YQ@UM6-]:ZE917EE.D]M*,QR(2%9!*A1RK(X!`88]F/!R.>EF#7344`>>K\%O!HNWF:TNFB8<6YNG\M3V/'S9^I-3_\` M"IO#?]B1Z4#?K%%)V`!VGH.%';^9KNZ*`,'PQX/TCPE;2Q:7"X: M8@S2RR%WD([DG\>F!R:WJ**`"BBB@#S34++5O`NN:KJ=C!-=^&-2+7%]'%(! M+8RL1YDZ@@EAM!.!^@49R9]4>2;3]575X1<2*+?2_$JQ_N[L,Q(L[F(#Y"3R M6(`&,C:I?#[0K^_GN=MS;"]<&^AMYBD5W@[OG7IDDO%2Z#X;TCPS9R6FCV2VL$DAE=0S-EL`9RQ)Z`#' M2M7I0`4444`> M+-9O8K8/;7/APV$3EU&Z8O(=F"<]&7GIS7:T4`>9Z5X;U6PM[?3K_0;F_M+R MRM([EX=2$(MV2%(GC=`XWJ-A;5VQGC'F.VN]8\)74(MS;W\]J6BB=U8PS8 MW)D@X)5P.AQQZ5LXI:`//;CPMJ+:#I*Q:?&;Z_ED36U,BC9#=?/=`'/.&"@; M?3BH-9TKQ7>>)M/C&F"32;'5X+F!HIX4C6!4V'Y3\Y<%V)YQA0`,UZ33)(DF MB>.1`Z.I5E89!!Z@T`<)X'TJ9_$&JZH]T9;*REN--TU`FU5B\WS'QZ@,%C!] M(L]ZL7VDZQ)/XDT^'3P\&H2B]ANVF41LRQQ+Y++G<-QBP3C&&]L'LK>WBM;> M.W@C6.&)0D<:`!54#```Z`"I*`.0TBQU74/&0\1ZCI?]EB+338B!YDE>1FD5 MRV4)&P;<#/)R3@5BR^%-8>_,OV,%/^$P75,^8G_'L(`N_K_>&,=?:O2<44`> M92^$_$0MM8>P"VE[)8V?KV.'P>3Y8'>KR^&I]+U&32TT6ZU M'1;E;=!/'J/E"W5$2+8\9<;@`F[<,DYQBN_HH`\ZDTCQ(USJAM-/E@TM'CNH M=/GNHW,]TMRLS-&^3L1E7A6(`+?='-=Y833W%C%+=6C6DSC+0,ZN8_8E>"?I 8D>YJS10`4444`%%%%`!1110`4444`?_9 ` end GRAPHIC 22 pr1015img000.jpg GRAPHIC begin 644 pr1015img000.jpg M_]C_X``02D9)1@`!`@```0`!``#_VP!#``@&!@<&!0@'!P<)"0@*#!0-#`L+ M#!D2$P\4'1H?'AT:'!P@)"XG("(L(QP<*#7J#A(6&AXB)BI*3E)66EYB9FJ*CI*6FIZBIJK*SM+6VM[BYNL+#Q,7& MQ\C)RM+3U-76U]C9VN'BX^3EYN?HZ>KQ\O/T]?;W^/GZ_\0`'P$``P$!`0$! M`0$!`0````````$"`P0%!@<("0H+_\0`M1$``@$"!`0#!`<%!`0``0)W``$" M`Q$$!2$Q!A)!40=A<1,B,H$(%$*1H;'!"2,S4O`58G+1"A8D-.$E\1<8&1HF M)R@I*C4V-S@Y.D-$149'2$E*4U155E=865IC9&5F9VAI:G-T=79W>'EZ@H.$ MA8:'B(F*DI.4E9:7F)F:HJ.DI::GJ*FJLK.TM;:WN+FZPL/$Q<;'R,G*TM/4 MU=;7V-G:XN/DY>;GZ.GJ\O/T]?;W^/GZ_]H`#`,!``(1`Q$`/P#W^BBL[6=> MTOP]9-=ZK?06L(!QYC@%R!G"CJQXZ#F@"IXK\46'A/0Y=2OB&(^6*`,`TSGH MHSU]3Z`$]JX#5O%/BC5I)=.@DM=,-Y;H]D4F_=WJ'&X077:8DX4;.!R>Q#M? MB\3^.IK/7M#TW[)8Z=')Y=IJJE'U#`E;NWN5 M9]4T^3&3YHX#Q``G=U.[K@5Z/H^M:=KVG1W^EW<5U;OCYHV!VD@':P_A8`C( M/(S6+IGA6:.XAN=2NA)>6 M/4>(2)X>\02"+RU(V6]\QX(7@*K*,<9Y]@*`/2****`"BBB@`HHHH`****`" MBBB@`HH)`ZFB@`HHHH`****`"BBB@`HHHH`****`"BBB@`HHHZT`%%(2%&20 M/K2T`8'B_P`2)X9T)[I8VFO9F%O96ZH6,T[`[%P.<9ZXYP#7-^$_!MGO1G;,DKK+#8R$B3RT7D*RDCZ9X`S6=XJGOI?B&\"PN]Y]D$.FJ^##: M1MDR7Y)X#(?EV\$@#GFI_#.LVFG+:31W!31&F^PP3>2?.UJ_?`><]3@E6Y/4 MY)(`%`'IMKOB;QU9^' MM0@T]+::^N_DFNHH$6![>22-7:&0@M&2,E3@D9'3@ MXK'\:Q:1+X1U$:W(D-BL+,9CC=&P!VLF?XP<;>^<5S6G?$#4;5-1_M?26N-. MTF=[2[UFSD789$QN8PMAE&""=NX`Y`SBFWRW/B<#Q%J>G2RZ+9_/I6DCYCJ$ MI(\J=\?=#;@H1A\N2S$#B@##T#XDZ_I5AITGB6VAELYHMD,,,;G49(U7(N70 ML08R%.3P2>1Q7KEG=P7]E!>6TBRV\\:RQ2+T96&01]0:\9U"TNWGU2&[N]FJ M7,)N=;U`_O%T>Q(W?9(R"=S?>^[C([=Z[3X6:A]I\+-:>=.ZV!,G('H<#/KEEY M&2:Q-=/BCX67=GK)\076N:--*EO=07SL\@)R24R<#Y5.#GJ1D&K,MW#X>_:& M>2_DVIJ]BD5NQZ!CM4#\6B([=15_XX74(LT@3]TV,')XSR.,YIUAXT\-ZI:75U9:Q:S16D;2 MSX;#1HHR6*GG;[XQ7F$6A0M\4/!6DZO913&#PW"DT$RAU\Q%E'(Z'!'O3?$^ MGV6F?$77+?1;>"W@?PO=/=Q0(%524?L..<1_G0!Z2_Q#\(1FV#>(+$?:%#)^ M\Z`]"W]S_@6,5K7^N:5IFG+J%]J%M;V;@%)I)0%?(R`I_B)`)`'7M7DNC:!H M+_`.?4;K3K(W9M+B47+Q+YGFAF"?-C/4**Y;5+W59#\.-.FC6>(6\4D%K.^( M9G\UEC#>VP(/HQ]30![MI_C+PYJEC^*K2? M$/PA%;V\S>(+'9/]P"3+=<9*CE1D$<@=*XA?"6LVUSXL\3:K8:9IRW.B7%O] MELFW;CM!W'@#^'\<)!Y93?$=V[IMQSFNVTSQIX;UG46T_3M9M+ MFZ&?W:/]['7:>C?AFO%VC34/"WPOM[M?/AEU!X71^0R&=5VGVQQ6QXVTVQTC MXR>#$TRT@LD=XMR6T8C!_>D=%`[$CZ4`>H:IXU\-:)>K9ZCK-K!7M[<3QW-Q=S!)H-_91M/`;)'/4>PJ]XA\.7OA7P1X0TO4+M;F= M-85SM)*Q[LG8">H&3Z=:`/6KKQCXLA;Q-LM`'K^E^(-(UO3WO]-U""XM8R0\J-PA`R0V>AP0>:S[7QYX5OM3&G6V MO6,ETS!402<.Q.`%;HQ)Z`$YKQ47-QI>D?$^UT]?+MDOE@$48PL<1GD0@`=! MMPOTK:T_PEK_`(F\+>&(;/2-&TRVMC!<+J<$O[]@J\DA5!W$X8C/WEZ\9H`] M2E\<^%H)[V";7;*.6R)6=&DPRL."`.YR",#)SQUK@_$^JZIXA^)>AZ/HGB.Z ML-+O],6Z66U_B),IWGB/ M7_$\UZ]UO4FK'Q.8/\5/`N M"#_I,)X_Z^$Y_G0!Z+<^-_#%G>W=G?2;^&[C0X?RSRI[9!Y'XUYM#H^FZG^T%J\-_86]S$FG+,L">37(:9/-I'B#XFQZ:IA2.VN52.$[!&!-M!4#IM5FQCI0!Z?XU\=>&H_ M#VM:6FNVW]H/93QQQPR%CYFQ@%W+P&SQC.:7P'K-AI'PKT>]U6^AM8!&P\V= MPN3O?@9ZG@\#DUS?A_1]`_X49?WEK:VD]RVFW+SSM$"ZS!&R,GD;3C'X$=:@ M'AC4O%'P/\/0:4(9+NTE^U)#+C$F#(-O/RY^;^+@\@]:`.OU-K#XA:4LFAZG M%=6\)='"$C#G:5)!QC`!'T8XKKK*)[>Q@ADP'1`"`VX#V!P,@>N!7#?#3Q7! MJTNI:++HT&E:M8./MD=NJA)7'R,YV@`'*XQD\`8)%>A8H`\Y^*'A\RPP:[:V M5Y=.FVVU*&VEVF:Q!:1D(R#@N%&1R`Q[5R^B:G`KL!M)!^8]#C[K>W5Q/BWPC;);?V[H-G;VNMV$YOT>&$*UT5!+1 M,1R0X)'UH`W?#?AVV\.:>T$1,MSLGVEE8QIN7^'.3AOEZUT?AK7[7Q/X?L]6M"`D\8+Q MYR8G_B0].0^/F;\6R?QK5KS_1O$Q\-S6&E:M]1?['UG! MVRJV!'#)@<.%.=YP&`R<'-6]5\J2?,LLCYR%!R,'`)'H%!Z_P M9H,^AZ,S7\IEU6^E-Y?R$\&9P-RKC@*N`!CCC/>LO0?`6(XK8>B*.N"6YXZ]`>:[:@##\2^$M'\6V:6VKVOFK&Q:-T+3K:Y MANKR"S5GNVC8/*X4$@1MP,^N?:LRZ\,M(MM>^.>CZ=#/$UQ91RR7=QIMSY]W]\1Z)I^H6ME=ZC:PWEV!Y M$;.-S@G`Q[$Y`I=7U*ZL[BSM;.RAN9;KS`!-.8E&U=V,A6Z]*`/,/A]\-M#\ M0>"=*OM2DOIHI"\CV7VDB`N&9=VT<@X&.#7HNO\`@S0_$FDP:;J-IF"W_P"/ M?RG*&'Y=HVX[8['(X''%2:3KRZA::=<2+!:BXM))Y(&DW-&4*AL'`!52Q!;C ML>]4[CQOHT]A)+I.JV5S+%-$LB>8"51I41FQP<`/][I0!5T7X::%H=M>Q0-> MSR7=J]F\]Q.7986'**.`!T[=JOZ5X)TC1O"MYX=M!.+&[6192TF7/F+M;!QQ MQ[4LOCOPQ%IBZD=8MFLFNA9^PVHFC?`19Z'%;:);A;DQZ-,9[0&7G>7#Y;U MY'2K>J^#=)UK7]/UN\25KS3]I@*2%5!#;AD=^:AM_&VG3^)M7T8_(-,@\Z2X M))4[0#(,8_AW)GG^+VIVE^-]&OX+3S[RWMKNYM!>K:F7UN"GF,3DD@YQGOC%:EUX'T6[TO2M.DBF%KI MDJS6Z"4YW#NQ/)SSGGO6Q!JMC=)9O!GQ:I;F[M&=9XF.TIL&6//8=STH`1Y`8O\H3Z5 M%8^$-*T[Q3>^(X$E_M&\0QRLTA*[3M.`.WW%JYI&OZ5KT4DNE7\%VD3;7,39 MP<9_+T/0UEVWC73P-5?4Y(=/AL=2?3UDEER)2L2RD]!CY2W'/W>M`#['P1HE MA+KCI;O(-;9S?+)(2'#%B0/0?.U8^G_"3PQIFJQ7]LM\HBF6>.W-VQB#J05) M'5L$#J3[UT^G>)-'U>6*+3]1M[F26%ID6-LDHK!6/X$@'ZU%+XLT&&[L[675 M;5+B\(%O&7YDRQ48^I&!ZF@".R\):78>*KWQ)"LW]HWD?E2LTA*[?EX`[?<6 MGW'A?3;KQ9;>)94E.HVT'D1D/A0OS]1Z_.U5[SQUX9L6N4N-9M4>VF6"8;B2 MDA)`4X]P?I@YQ@UM6-]:ZE917EE.D]M*,QR(2%9!*A1RK(X!`88]F/!R.>EF#7344`>>K\%O!HNWF:TNFB8<6YNG\M3V/'S9^I-3_\` M"IO#?]B1Z4#?K%%)V`!VGH.%';^9KNZ*`,'PQX/TCPE;2Q:7"X: M8@S2RR%WD([DG\>F!R:WJ**`"BBB@#S34++5O`NN:KJ=C!-=^&-2+7%]'%(! M+8RL1YDZ@@EAM!.!^@49R9]4>2;3]575X1<2*+?2_$JQ_N[L,Q(L[F(#Y"3R M6(`&,C:I?#[0K^_GN=MS;"]<&^AMYBD5W@[OG7IDDO%2Z#X;TCPS9R6FCV2VL$DAE=0S-EL`9RQ)Z`#' M2M7I0`4444`> M+-9O8K8/;7/APV$3EU&Z8O(=F"<]&7GIS7:T4`>9Z5X;U6PM[?3K_0;F_M+R MRM([EX=2$(MV2%(GC=`XWJ-A;5VQGC'F.VN]8\)74(MS;W\]J6BB=U8PS8 MW)D@X)5P.AQQZ5LXI:`//;CPMJ+:#I*Q:?&;Z_ED36U,BC9#=?/=`'/.&"@; M?3BH-9TKQ7>>)M/C&F"32;'5X+F!HIX4C6!4V'Y3\Y<%V)YQA0`,UZ33)(DF MB>.1`Z.I5E89!!Z@T`<)X'TJ9_$&JZH]T9;*REN--TU`FU5B\WS'QZ@,%C!] M(L]ZL7VDZQ)/XDT^'3P\&H2B]ANVF41LRQQ+Y++G<-QBP3C&&]L'LK>WBM;> M.W@C6.&)0D<:`!54#```Z`"I*`.0TBQU74/&0\1ZCI?]EB+338B!YDE>1FD5 MRV4)&P;<#/)R3@5BR^%-8>_,OV,%/^$P75,^8G_'L(`N_K_>&,=?:O2<44`> M92^$_$0MM8>P"VE[)8V?KV.'P>3Y8'>KR^&I]+U&32TT6ZU M'1;E;=!/'J/E"W5$2+8\9<;@`F[<,DYQBN_HH`\ZDTCQ(USJAM-/E@TM'CNH M=/GNHW,]TMRLS-&^3L1E7A6(`+?='-=Y833W%C%+=6C6DSC+0,ZN8_8E>"?I 8D>YJS10`4444`%%%%`!1110`4444`?_9 ` end GRAPHIC 23 pr1015img001.jpg GRAPHIC begin 644 pr1015img001.jpg M_]C_X``02D9)1@`!`0```0`!``#_VP!#``@&!@<&!0@'!P<)"0@*#!0-#`L+ M#!D2$P\4'1H?'AT:'!P@)"XG("(L(QP<*#7J#A(6&AXB)BI*3E)66EYB9FJ*CI*6FIZBIJK*SM+6VM[BYNL+#Q,7& MQ\C)RM+3U-76U]C9VN'BX^3EYN?HZ>KQ\O/T]?;W^/GZ_\0`'P$``P$!`0$! M`0$!`0````````$"`P0%!@<("0H+_\0`M1$``@$"!`0#!`<%!`0``0)W``$" M`Q$$!2$Q!A)!40=A<1,B,H$(%$*1H;'!"2,S4O`58G+1"A8D-.$E\1<8&1HF M)R@I*C4V-S@Y.D-$149'2$E*4U155E=865IC9&5F9VAI:G-T=79W>'EZ@H.$ MA8:'B(F*DI.4E9:7F)F:HJ.DI::GJ*FJLK.TM;:WN+FZPL/$Q<;'R,G*TM/4 MU=;7V-G:XN/DY>;GZ.GJ\O/T]?;W^/GZ_]H`#`,!``(1`Q$`/P#=_P"%'>"_ M^>%[_P"!)_PH_P"%'>"_^>%[_P"!)_PKTBJ6KW4EGILDT1"L&1"_\`GA>_^!)_PK>BUS4IK&2Y3R3Y M>UG4H1MRSKMQUZ*IP>?F]*Z."X^T6\??\*.\%_\ M\+W_`,"3_A1_PH[P7_SPO?\`P)/^%>BEGYQ'G_@7U_\`K?G06?G$>?\`@7U_ M^M^=`'G7_"CO!?\`SPO?_`D_X4?\*.\%_P#/"]_\"3_A7HI9^<1Y_P"!?7_Z MWYT%GYQ'G_@7U_\`K?G0!YU_PH[P7_SPO?\`P)/^%'_"CO!?_/"]_P#`D_X5 MZ*6?G$>?^!?7_P"M^=!9^<1Y_P"!?7_ZWYT`>=?\*.\%_P#/"]_\"3_A1_PH M[P7_`,\+W_P)/^%>BEGYQ'G_`(%]?_K?G06?G$>?^!?7_P"M^=`'G7_"CO!? M_/"]_P#`D_X4?\*.\%_\\+W_`,"3_A7HI9^<1Y_X%]?_`*WYT%GYQ'G_`(%] M?_K?G0!YU_PH[P7_`,\+W_P)/^%'_"CO!?\`SPO?_`D_X5Z*6?G$>?\`@7U_ M^M^=!9^<1Y_X%]?_`*WYT`>=?\*.\%_\\+W_`,"3_A1_PH[P7_SPO?\`P)/^ M%>BEGYQ'G_@7U_\`K?G06?G$>?\`@7U_^M^=`'G7_"CO!?\`SPO?_`D_X4?\ M*.\%_P#/"]_\"3_A7HI9^<1Y_P"!?7_ZWYT%GYQ'G_@7U_\`K?G0!YU_PH[P M7_SPO?\`P)/^%'_"CO!?_/"]_P#`D_X5Z*6?G$>?^!?7_P"M^=!9^<1Y_P"! M?7_ZWYT`>=?\*.\%_P#/"]_\"3_A1_PH[P7_`,\+W_P)/^%>BEGYQ'G_`(%] M?_K?G06?G$>?^!?7_P"M^=`'G7_"CO!?_/"]_P#`D_X4?\*.\%_\\+W_`,"3 M_A7HI9^<1Y_X%]?_`*WYT%GYQ'G_`(%]?_K?G0!YU_PH[P7_`,\+W_P)/^%' M_"CO!?\`SPO?_`D_X5Z*6?G$>?\`@7U_^M^=!9^<1Y_X%]?_`*WYT`>=?\*. M\%_\\+W_`,"3_A1_PH[P7_SPO?\`P)/^%>BEGYQ'G_@7U_\`K?G06?G$>?\` M@7U_^M^=`'G7_"CO!?\`SPO?_`D_X4?\*.\%_P#/"]_\"3_A7HI9^<1Y_P"! M?7_ZWYT%GYQ'G_@7U_\`K?G0!YU_PH[P7_SPO?\`P)/^%'_"CO!?_/"]_P#` MD_X5Z*6?G$>?^!?7_P"M^=!9^<1Y_P"!?7_ZWYT`>=?\*.\%_P#/"]_\"3_A M1_PH[P7_`,\+W_P)/^%>BEGYQ'G_`(%]?_K?G06?G$>?^!?7_P"M^=`'G7_" MCO!?_/"]_P#`D_X4?\*.\%_\\+W_`,"3_A7HI9^<1Y_X%]?_`*WYT%GYQ'G_ M`(%]?_K?G0!YU_PH[P7_`,\+W_P)/^%'_"CO!?\`SPO?_`D_X5Z*6?G$>?\` M@7U_^M^=!9^<1Y_X%]?_`*WYT`>=?\*.\%_\\+W_`,"3_A1_PH[P7_SPO?\` MP)/^%>BEGYQ'G_@7U_\`K?G06?G$>?\`@7U_^M^=`'G7_"CO!?\`SPO?_`D_ MX4?\*.\%_P#/"]_\"3_A7HI9^<1Y_P"!?7_ZWYT%GYQ'G_@7U_\`K?G0!YU_ MPH[P7_SPO?\`P)/^%'_"CO!?_/"]_P#`D_X5Z*6?G$>?^!?7_P"M^=!9^<1Y M_P"!?7_ZWYT`>=?\*.\%_P#/"]_\"3_A1_PH[P7_`,\+W_P)/^%>BEGYQ'G_ M`(%]?_K?G06?G$>?^!?7_P"M^=`'G7_"CO!?_/"]_P#`D_X4?\*.\%_\\+W_ M`,"3_A7HI9^<1Y_X%]?_`*WYT%GYQ'G_`(%]?_K?G0!YU_PH[P7_`,\+W_P) M/^%'_"CO!?\`SPO?_`D_X5Z*6?G$>?\`@7U_^M^=!9^<1Y_X%]?_`*WYT`>= M?\*.\%_\\+W_`,"3_A1_PH[P7_SPO?\`P)/^%>BEGYQ'G_@7U_\`K?G06?G$ M>?\`@7U_^M^=`'G7_"CO!?\`SPO?_`D_X4?\*.\%_P#/"]_\"3_A7HI9^<1Y M_P"!?7_ZWYT^@#S?_A1W@O\`YX7O_@2?\**](HH`*CFFCMXC)*V%!`Z$G).` M`!U))Q4E5=0LUO[-K=MN"R/\Z[ERK!AD<9&10`^WO+>Z+B"4/LZX_'\QD$?4 M'TJ>L[2M*_LP./M#3;E"@L./K_`(G\Z##&>O'U_P`3^=`#Z*888SG* M+SUX^O\`B?SH,,9SE%YZ\?7_`!/YT`/HIAAC./K_`(G\Z##&>O'U_P`3^=`#Z*888SG*+SUX M^O\`B?SH,,9SE%YZ\?7_`!/YT`/HIAAC./K_`(G\Z##&>O'U_P`3^=`#Z*888SG*+SUX^O\` MB?SH,,9SE%YZ\?7_`!/YT`/HIAAC./K_`(G\Z##&>O'U_P`3^=`#Z*888SG*+SUX^O\`B?SH M,,9SE%YZ\?7_`!/YT`/HIAAC./K_`(G\Z##&>O'U_P`3^=`#Z*888SG*+SUX^O\`B?SH,,9S ME%YZ\?7_`!/YT`/HIAAC./K_`(G\Z##&>O'U_P`3^=`#Z*888SG*+SUX^O\`B?SH,,9SE%YZ M\?7_`!/YT`/HIAAC.GT5RMA#JUEK*Q7,4U[;7,DC-*YVBWR`VW M'(8>O'U_Q/YT`/HIAAC.>O M'U_Q/YT`/HIAAC.>O'U_Q/YT`/HIAAC.>O'U_Q/YT`/HIAAC.A%:K&0'Y54C'=L>OM]/\]8+2_M;X,;:42!0"2`0, M'(R,]1D$9'H:LT`,)EYPB>WSGW]OI^9].>#\2^,-6TO4=6BLYM+:*RCC9UD. M)(BQ3&06&[()SC`&Y,$G(KOZ\%USXY:YIFOZEI\>E::\=K=2P*SA\L%<@$_- MUXH`[CQ'XZU+3/LK6:63,]C).\+9=C(L;MM&",;2JY'7YNW6K%GXOU.*WCO- M16S:P=I`DT`.75'9-V,D?,0I^AXR>*\P_P"&@?$&<_V1I>?I)_\`%4#]H'Q` M.FD:6.W23_XJ@#Z&)EYPB>WSGW]OI^9].0F7G")[?.??V^GYGTYIZ'?2:IH& MFZA*JI)=6L4[*O0%E#$#VYJ_0`PF7G")[?.??V^GYGTY"9><(GM\Y]_;Z?F? M3E]9GB+4;C1_#FHZE:PQ32VEN\XCE0#V!X[^HZT`:!,O.$3V^<^_M M]/S/IR$R\X1/;YS[^WT_,^G/-#Q:9+[Q';1Q0C^RK=9(C))M\UL2;@VE9$/CG5KN]%G9Z=!-/L961F",)%D=7_C*X`C;^+D]Z`.\)EYPB>WSGW] MOI^9].0F7G")[?.??V^GYGTYS]%UF'6+9I(R!(C$.@!&T9(')'/3G'<$=JTZ M`&$R\X1/;YS[^WT_,^G(3+SA$]OG/O[?3\SZAZ9Z5C+XTCFM?$D]O M!'(-(<(GM\Y]_;Z M?F?3GBH/&^HW$@2+2K>5OL[S$1W7W3&R*X.1Q]\'V!4G@UU6E:G#JMHTT1&Y M',':DD5M*Z,&Y!"L0>GL/U].=&LWQ#_`,BU MJO\`UYS?^@&@#Y=_X6KXW_Z&"X_[]I_\31_PM7QO_P!#!-+G7-/@EUV=XY;F-&4H@#`L`1]VOJ0F7G")[?.??V^GYGTY^+_#W_(R MZ5_U^0_^ABOM.@!A,O.$3V^<^_M]/S/IR$R\X1/;YS[^WT_,^G+Z*`&$R\X1 M/;YS[^WT_,^G(3+SA$]OG/O[?3\SZ<(GM\Y]_;Z?F?3GA-/T7Q(SW9GN+^!EECDB9KH/O8N^X<,1L M5=AY`S\PP>".PT=[V328&U"U%K=8(>(/OV@$@V[W5H\"2F(O@;@,\9&1U'49'7O5BB@"C8::MC)*X M?=YG``7:%&YFQ^;M^&/J;C1QNQ>$H8CX+T+,:'.G09^4?\\Q_B?S-;)AB.T4Y!S]I;L>GW*`+AAB./XY6+2> M#[1V/!+7.2?O?],_]IO^^CZFHH_CC9Q%3'X)L$*QF)=LP&$.M1_Z#MK_P!^FH_X9ZU'_H.VO_?IJ`.S^''Q#B\;ZKJ%K_8-O8&.+SW= M)`YD).WGY1V)YKT@PQ'.8T.>ORCW_P`3^9KS/X??#34O`FI7=X+RTO?M$(BV M$M'MY!SG!STKT+S-4_Y];/\`\"6_^-T`6C#$ORCW_Q/YFJ:MJH9R;>T(8Y`^TMQP./N?YS3O,U3_GUL_P#P);_XW0!BZMIM M\?%FGZA:6C36\<3+,-\80C;)D;3@[B67!!QR\GB@?R9=0CF M4?:%`*@S?XLY`!`%9\_PP\<37$LJ^/KR-7,,1SF-#GK\H]_\`$_F:##$(NGM7??#CQS8^-Y-46#08M.^SE))"KJ_FM)NR3A1SP>>M1_P"@[:_]^FKMOAW\/-3\`R:BPNK2^^V",8+-'LV;O]DYSN_2@#T4 MPQ'.8T.>ORCW_P`3^9H,,1SF-#GK\H]_\3^9JKYFJ?\`/K9_^!+?_&Z:C:JN M[-O:-DY'^DMQ[?_^)_,US5[IM^OC2/48+-IK06OER#?' MM/\`K#@*<$.2PYS@@G/(%;+OJC(RBVM`2,9^TMQ_XY7E?_"J_'7_`$4&^_\` M`F?_`.*H`TV\(^(YM1>1O-CC?5#*Q$P($1E5F8'?D?(&4<$G>P*@'-=9H>EW M^FW\EK-$LNG&-BDTS!I`V\X7CC;M9FZ<;L9K@/\`A5?CK_HH-]_X$S__`!5* MOPM\D`YQ]IGY_P#'J`/7S#$_]]I_C0!["88CG,:'/7Y1[ M_P")_,T&&(YS&ASU^4>_^)_,UQW@SQ\?'%M=SZ;IODK;.J.+F;:22"1C:I]* MZ?S-4_Y];/\`\"6_^-T`6C#$JGRUS]CFYQ M_L-_B?S-3(VJJI#6]HQR3G[2W<]/N5!J$&J7^FW5GY%FGVB%XM_VACMW`C.- MGO0!\845[/\`\,]:C_T';7_OTU'_``SUJ/\`T';7_OTU`'E/A\`^)-+!&0;R M+(/^^*^T3#$6PW;2#C/; MI7M'F:I_SZV?_@2W_P`;H`M&&(YS&ASU^4>_^)_,T&&(YS&ASU^4>_\`B?S- M4V;52R$6]H`IR1]I;G@\?<_SBG>9JG_/K9_^!+?_`!N@#Q/XW>(=8T7Q996^ MF:E:'QUXJ.<^(-0.>O[\^_^)_,U[E\0/A?J7CK M6K?43?6EEY-N(/+^:3.&9LYP/[WZ5R?_``SUJ/\`T';7_OTU`'G)\=>*CG/B M#4#GK^_/O_B?S->Z_!/4[[7/"=_<:K=2WLRWS('G;>0OEJ<9/;+-^9]:Y#_A MGK4?^@[:_P#?IJ]%^'_@[4_`NBW&G"6TO?.N#/YF]H\955QC:?[OZT`=L88C MG,:'/7Y1[_XG\S3ZI>9JG_/K9_\`@2W_`,;JS`)!`@E(,F/FPO*D?A5JJ=EIT=C)*Z2.YD_O8P!N9N,#U=OTJTT M<;G+(K$C'(SZ_P")_.@!U%,,,1SF-#GK\H]_\3^9H,,1SF-#GK\H]_\`$_F: M`'T4PPQ'.8T.>ORCW_Q/YF@PQ'.8T.>ORCW_`,3^9H`?13##$ORCW_Q/YF@!]%,,,1SF-#GK\H]_P#$_F:##$ORCW_Q/YF@PQ'.8T.>ORCW_P`3^9H`?13##$ORCW_`,3^9H,,1SF-#GK\H]_\3^9H`?13##$< MYC0YZ_*/?_$_F:##$ORCW_P`3^9H,,1SF-#GK\H]_\3^9H`?1 M3##$ORCW_Q/YF@!]%,,,1SF-#GK\H]_\3^9 MH,,1SF-#GK\H]_\`$_F:`'T4PPQ'.8T.>ORCW_Q/YF@PQ'.8T.>ORCW_`,3^ M9H`?13##$ORCW_Q/YF@!]%,,,1SF-#GK\H] M_P#$_F:##$C#$ M*_L]QH^D:YN16_?Q]1G^%O\`$U[.88CG,:'/7Y1[_P")_,T`/HIAAB._\`B?S-!AB._^)_,T`/HIAAB. M_^)_,T&&(Y MS&ASU^4>_P#B?S-`#Z*888CG,:'/7Y1[_P")_,T&&(YS&ASU^4>_^)_,T`/H MIAAB.J"\NXK&V:XF.$4@?B2`!SQU(ZT`9^BS7TK3_;!,,`8$J;<'M(L6_*==RXR,D9_-6'X?2K)91U8#ZF@!I,O. M%3VY/O[?3]:"9><*GMR??V^GZTN]1_$/S_SZ&C>H_B'Y_P"?0T`(3+SA4]N3 M[^WT_6@F7G"I[W)]_;Z?K2[U'\0_/_/H:-ZC^(?G_`)]#0`A,O.%3VY/O[?3]:"9> M<*GMR??V^GZTN]1_$/S_`,^AHWJ/XA^?^?0T`(3+SA4]N3[^WT_6@F7G"I[< MGW]OI^M+O4?Q#\_\^AHWJ/XA^?\`GT-`"$R\X5/;D^_M]/UH)EYPJ>W)]_;Z M?K2[U'\0_/\`SZ&C>H_B'Y_Y]#0`A,O.%3VY/O[?3]:"9><*GMR??V^GZTN] M1_$/S_SZ&C>H_B'Y_P"?0T`(3+SA4]N3[^WT_6@F7G"I[W)]_;Z?K2[U'\0_/_/H: M-ZC^(?G_`)]#0`A,O.%3VY/O[?3]:"9><*GMR??V^GZTN]1_$/S_`,^AHWJ/ MXA^?^?0T`(3+SA4]N3[^WT_6@F7G"I[W)]_;Z?K2[U'\0_/\`SZ&C>H_B'Y_Y]#0` MA,O.%3VY/O[?3]:"9><*GMR??V^GZTN]1_$/S_SZ&C>H_B'Y_P"?0T`(3+SA M4]N3[^WT_6@F7G"I[W)]_;Z?K2[U'\0_/_/H:-ZC^(?G_`)]#0`A,O.%3VY/O[?3] M:"9><*GMR??V^GZTN]1_$/S_`,^AHWJ/XA^?^?0T`(3+SA4]N3[^WT_6N5\: M>&?#NL6PU'Q#IC7@LU*IYH_B'Y_P"?0U0U72K3 M58&25S%+MVK<1;?,1<@E02",';@@@@C((H`\]TKP!\-=;FN8[#1_,^SJK.S7 M5PHPP)'5OIG\?2J'_",?"LQ12KHTIBF5VBD,UT%?;(T>`=W7Z?X- MTK3#<"">Y\N>)8)(VD4@QA2"N<;N>I.T/0;&9_#EDL%O,=``-'>H_B'Y M_P"?0T`(3+SA4]N3[^WT_6@F7G"I[W)]_;Z?K2[U'\0_/_/H:-ZC^(?G_`)]#0`A, MO.%3VY/O[?3]:"9><*GMR??V^GZTN]1_$/S_`,^AHWJ/XA^?^?0T`(3+SA4] MN3[^WT_6@F7G"I[W)]_;Z?K2[U'\0_/\`SZ&C>H_B'Y_Y]#0`A,O.%3VY/O[?3]:" M9><*GMR??V^GZTN]1_$/S_SZ&C>H_B'Y_P"?0T`(3+SA4]N3[^WT_6GTW>H_ MB'Y_Y]#3J`"BBB@`JM>6,-Z@$BX=2K)(%!92&##&0>X%6:*`*.FZ5;Z6K+`T MA4J%`<@[0"QP./5FZ^M72JGJH/U%+10`W8I_A'Y?Y]3393%%$\LFU44%F8C@ M#G)_G4E1W"22VTL<,OE2LA"2%=VTXX..^*`*AU33>V3^0.3Z`\XJQ M!-;7<9>%DD7."0/Q_4'/N#GO6-)X8,C`_:U4`.,+$?XXQ&QY8DG"@Y/?.4!_>;!.!Z]&_(^]5K[2IKRZ,ZW2)M4"(-$6V'()/WAG./T'OFM;>&DM[FW MF^UR$V[8C4(`"F6.#G.3ECR,4`;>Q3_"/R_SZFC8I_A'Y?Y]33J*`&[%/\(_ M+_/J:-BG^$?E_GU-.HH`BF:&&-I)=H4=3C.<\8]R<]/>JRZGISD!;B)BQ4#' M.=VUDBAF\F1A@2;<[?PR*QAX:*L-ETJ(%"!%AX"%B[`?-ZG@ M]@,<]:`-F"2"Z@6:'#QN,JVW&1^/X_G4FQ3_``C\O\^IJMIUE]@LUM]R$`D@ M(FQ5R>BKDX'XU;H`;L4_PC\O\^IHV*?X1^7^?4TZB@!NQ3_"/R_SZFJLU_80 M2M'--&KK]X$>V3^0.3Z`Y/!JY6/J&BR7]Q)(]TH!!6,&(DQJ4*,,[L<[B411RQN[$@`#KQG^1S[@\59V*?X1^7^?4UC6/A[[%?1W0N@Q7: M"/+P2JQ[%&<_B?4@=,5MT`-V*?X1^7^?4T;%/\(_+_/J:=10`W8I_A'Y?Y]3 M4<\D%O$TLVU4&`3C/)./YG]:FJO?6\MU9O#%,(6;&7VD\9Y'!!Y&1D$$9XH` MA_M/3F;:)XF))'`SGM^(R<9]3CKQ5B"2"ZA$L6&0DC.W'()!Z^^:R%\.%+L3 MK=*N#@(L.`%\WS0!S_>X^G;O6Q:P+:VD-NIR(D"`GO@8S0`_8I_A'Y?Y]31L M4_PC\O\`/J:=10`W8I_A'Y?Y]31L4_PC\O\`/J:=10!3>_L$F:)YHPX8(01W M.?\`Z_ZT0W]C,,L/#YL]02\:Z$CA%5@(]N=JE1W..",^X[=*`-G8I_A'Y?Y]31L M4_PC\O\`/J:=10`W8I_A'Y?Y]31L4_PC\O\`/J:=10!!<36UK%YEPR(F<9(^ MI/Z9/TR:@.J::"0;B+JP/'H,G]#GWS4FH6LE[;>2DJQ@L-^Y-P9>Z\$=?K63 M_P`(R?F'VL%2`N#$>BIM3D,#D=21U[8H`W(VBGB62/:R.,@XZ@__`*S3MBG^ M$?E_GU-0V5J+.SBMPY?8.6.>3U)Y)[^YJQ0`W8I_A'Y?Y]31L4_PC\O\^IIU M%`#=BG^$?E_GU-53J&GB4Q-/$'W;2#ZY(_+.1GIGCKQ5RL=]%DEOOM4ETK-Y MF[_5'.P.KA<[NVP GRAPHIC 24 pr1015img002.jpg GRAPHIC begin 644 pr1015img002.jpg M_]C_X``02D9)1@`!`@```0`!``#_VP!#``@&!@<&!0@'!P<)"0@*#!0-#`L+ M#!D2$P\4'1H?'AT:'!P@)"XG("(L(QP<*#7J#A(6&AXB)BI*3E)66EYB9FJ*CI*6FIZBIJK*SM+6VM[BYNL+#Q,7& MQ\C)RM+3U-76U]C9VN'BX^3EYN?HZ>KQ\O/T]?;W^/GZ_\0`'P$``P$!`0$! M`0$!`0````````$"`P0%!@<("0H+_\0`M1$``@$"!`0#!`<%!`0``0)W``$" M`Q$$!2$Q!A)!40=A<1,B,H$(%$*1H;'!"2,S4O`58G+1"A8D-.$E\1<8&1HF M)R@I*C4V-S@Y.D-$149'2$E*4U155E=865IC9&5F9VAI:G-T=79W>'EZ@H.$ MA8:'B(F*DI.4E9:7F)F:HJ.DI::GJ*FJLK.TM;:WN+FZPL/$Q<;'R,G*TM/4 MU=;7V-G:XN/DY>;GZ.GJ\O/T]?;W^/GZ_]H`#`,!``(1`Q$`/P#W^BBL[6=> MTOP]9-=ZK?06L(!QYC@%R!G"CJQXZ#F@"IXK\46'A/0Y=2OB&(^6*`,`TSGH MHSU]3Z`$]JX#5O%/BC5I)=.@DM=,-Y;H]D4F_=WJ'&X077:8DX4;.!R>Q#M? MB\3^.IK/7M#TW[)8Z=')Y=IJJE'U#`E;NWN5 M9]4T^3&3YHX#Q``G=U.[K@5Z/H^M:=KVG1W^EW<5U;OCYHV!VD@':P_A8`C( M/(S6+IGA6:.XAN=2NA)>6 M/4>(2)X>\02"+RU(V6]\QX(7@*K*,<9Y]@*`/2****`"BBB@`HHHH`****`" MBBB@`HH)`ZFB@`HHHH`****`"BBB@`HHHH`****`"BBB@`HHHZT`%%(2%&20 M/K2T`8'B_P`2)X9T)[I8VFO9F%O96ZH6,T[`[%P.<9ZXYP#7-^$_!MGO1G;,DKK+#8R$B3RT7D*RDCZ9X`S6=XJGOI?B&\"PN]Y]D$.FJ^##: M1MDR7Y)X#(?EV\$@#GFI_#.LVFG+:31W!31&F^PP3>2?.UJ_?`><]3@E6Y/4 MY)(`%`'IMKOB;QU9^' MM0@T]+::^N_DFNHH$6![>22-7:&0@M&2,E3@D9'3@ MXK'\:Q:1+X1U$:W(D-BL+,9CC=&P!VLF?XP<;>^<5S6G?$#4;5-1_M?26N-. MTF=[2[UFSD789$QN8PMAE&""=NX`Y`SBFWRW/B<#Q%J>G2RZ+9_/I6DCYCJ$ MI(\J=\?=#;@H1A\N2S$#B@##T#XDZ_I5AITGB6VAELYHMD,,,;G49(U7(N70 ML08R%.3P2>1Q7KEG=P7]E!>6TBRV\\:RQ2+T96&01]0:\9U"TNWGU2&[N]FJ M7,)N=;U`_O%T>Q(W?9(R"=S?>^[C([=Z[3X6:A]I\+-:>=.ZV!,G('H<#/KEEY M&2:Q-=/BCX67=GK)\076N:--*EO=07SL\@)R24R<#Y5.#GJ1D&K,MW#X>_:& M>2_DVIJ]BD5NQZ!CM4#\6B([=15_XX74(LT@3]TV,')XSR.,YIUAXT\-ZI:75U9:Q:S16D;2 MSX;#1HHR6*GG;[XQ7F$6A0M\4/!6DZO913&#PW"DT$RAU\Q%E'(Z'!'O3?$^ MGV6F?$77+?1;>"W@?PO=/=Q0(%524?L..<1_G0!Z2_Q#\(1FV#>(+$?:%#)^ M\Z`]"W]S_@6,5K7^N:5IFG+J%]J%M;V;@%)I)0%?(R`I_B)`)`'7M7DNC:!H M+_`.?4;K3K(W9M+B47+Q+YGFAF"?-C/4**Y;5+W59#\.-.FC6>(6\4D%K.^( M9G\UEC#>VP(/HQ]30![MI_C+PYJEC^*K2? M$/PA%;V\S>(+'9/]P"3+=<9*CE1D$<@=*XA?"6LVUSXL\3:K8:9IRW.B7%O] MELFW;CM!W'@#^'\<)!Y93?$=V[IMQSFNVTSQIX;UG46T_3M9M+ MFZ&?W:/]['7:>C?AFO%VC34/"WPOM[M?/AEU!X71^0R&=5VGVQQ6QXVTVQTC MXR>#$TRT@LD=XMR6T8C!_>D=%`[$CZ4`>H:IXU\-:)>K9ZCK-K!7M[<3QW-Q=S!)H-_91M/`;)'/4>PJ]XA\.7OA7P1X0TO4+M;F= M-85SM)*Q[LG8">H&3Z=:`/6KKQCXLA;Q-LM`'K^E^(-(UO3WO]-U""XM8R0\J-PA`R0V>AP0>:S[7QYX5OM3&G6V MO6,ETS!402<.Q.`%;HQ)Z`$YKQ47-QI>D?$^UT]?+MDOE@$48PL<1GD0@`=! MMPOTK:T_PEK_`(F\+>&(;/2-&TRVMC!<+J<$O[]@J\DA5!W$X8C/WEZ\9H`] M2E\<^%H)[V";7;*.6R)6=&DPRL."`.YR",#)SQUK@_$^JZIXA^)>AZ/HGB.Z ML-+O],6Z66U_B),IWGB/ M7_$\UZ]UO4FK'Q.8/\5/`N M"#_I,)X_Z^$Y_G0!Z+<^-_#%G>W=G?2;^&[C0X?RSRI[9!Y'XUYM#H^FZG^T%J\-_86]S$FG+,L">37(:9/-I'B#XFQZ:IA2.VN52.$[!&!-M!4#IM5FQCI0!Z?XU\=>&H_ M#VM:6FNVW]H/93QQQPR%CYFQ@%W+P&SQC.:7P'K-AI'PKT>]U6^AM8!&P\V= MPN3O?@9ZG@\#DUS?A_1]`_X49?WEK:VD]RVFW+SSM$"ZS!&R,GD;3C'X$=:@ M'AC4O%'P/\/0:4(9+NTE^U)#+C$F#(-O/RY^;^+@\@]:`.OU-K#XA:4LFAZG M%=6\)='"$C#G:5)!QC`!'T8XKKK*)[>Q@ADP'1`"`VX#V!P,@>N!7#?#3Q7! MJTNI:++HT&E:M8./MD=NJA)7'R,YV@`'*XQD\`8)%>A8H`\Y^*'A\RPP:[:V M5Y=.FVVU*&VEVF:Q!:1D(R#@N%&1R`Q[5R^B:G`KL!M)!^8]#C[K>W5Q/BWPC;);?V[H-G;VNMV$YOT>&$*UT5!+1 M,1R0X)'UH`W?#?AVV\.:>T$1,MSLGVEE8QIN7^'.3AOEZUT?AK7[7Q/X?L]6M"`D\8+Q MYR8G_B0].0^/F;\6R?QK5KS_1O$Q\-S6&E:M]1?['UG! MVRJV!'#)@<.%.=YP&`R<'-6]5\J2?,LLCYR%!R,'`)'H%!Z_P M9H,^AZ,S7\IEU6^E-Y?R$\&9P-RKC@*N`!CCC/>LO0?`6(XK8>B*.N"6YXZ]`>:[:@##\2^$M'\6V:6VKVOFK&Q:-T+3K:Y MANKR"S5GNVC8/*X4$@1MP,^N?:LRZ\,M(MM>^.>CZ=#/$UQ91RR7=QIMSY]W]\1Z)I^H6ME=ZC:PWEV!Y M$;.-S@G`Q[$Y`I=7U*ZL[BSM;.RAN9;KS`!-.8E&U=V,A6Z]*`/,/A]\-M#\ M0>"=*OM2DOIHI"\CV7VDB`N&9=VT<@X&.#7HNO\`@S0_$FDP:;J-IF"W_P"/ M?RG*&'Y=HVX[8['(X''%2:3KRZA::=<2+!:BXM))Y(&DW-&4*AL'`!52Q!;C ML>]4[CQOHT]A)+I.JV5S+%-$LB>8"51I41FQP<`/][I0!5T7X::%H=M>Q0-> MSR7=J]F\]Q.7986'**.`!T[=JOZ5X)TC1O"MYX=M!.+&[6192TF7/F+M;!QQ MQ[4LOCOPQ%IBZD=8MFLFNA9^PVHFC?`19Z'%;:);A;DQZ-,9[0&7G>7#Y;U MY'2K>J^#=)UK7]/UN\25KS3]I@*2%5!#;AD=^:AM_&VG3^)M7T8_(-,@\Z2X M))4[0#(,8_AW)GG^+VIVE^-]&OX+3S[RWMKNYM!>K:F7UN"GF,3DD@YQGOC%:EUX'T6[TO2M.DBF%KI MDJS6Z"4YW#NQ/)SSGGO6Q!JMC=)9O!GQ:I;F[M&=9XF.TIL&6//8=STH`1Y`8O\H3Z5 M%8^$-*T[Q3>^(X$E_M&\0QRLTA*[3M.`.WW%JYI&OZ5KT4DNE7\%VD3;7,39 MP<9_+T/0UEVWC73P-5?4Y(=/AL=2?3UDEER)2L2RD]!CY2W'/W>M`#['P1HE MA+KCI;O(-;9S?+)(2'#%B0/0?.U8^G_"3PQIFJQ7]LM\HBF6>.W-VQB#J05) M'5L$#J3[UT^G>)-'U>6*+3]1M[F26%ID6-LDHK!6/X$@'ZU%+XLT&&[L[675 M;5+B\(%O&7YDRQ48^I&!ZF@".R\):78>*KWQ)"LW]HWD?E2LTA*[?EX`[?<6 MGW'A?3;KQ9;>)94E.HVT'D1D/A0OS]1Z_.U5[SQUX9L6N4N-9M4>VF6"8;B2 MDA)`4X]P?I@YQ@UM6-]:ZE917EE.D]M*,QR(2%9!*A1RK(X!`88]F/!R.>EF#7344`>>K\%O!HNWF:TNFB8<6YNG\M3V/'S9^I-3_\` M"IO#?]B1Z4#?K%%)V`!VGH.%';^9KNZ*`,'PQX/TCPE;2Q:7"X: M8@S2RR%WD([DG\>F!R:WJ**`"BBB@#S34++5O`NN:KJ=C!-=^&-2+7%]'%(! M+8RL1YDZ@@EAM!.!^@49R9]4>2;3]575X1<2*+?2_$JQ_N[L,Q(L[F(#Y"3R M6(`&,C:I?#[0K^_GN=MS;"]<&^AMYBD5W@[OG7IDDO%2Z#X;TCPS9R6FCV2VL$DAE=0S-EL`9RQ)Z`#' M2M7I0`4444`> M+-9O8K8/;7/APV$3EU&Z8O(=F"<]&7GIS7:T4`>9Z5X;U6PM[?3K_0;F_M+R MRM([EX=2$(MV2%(GC=`XWJ-A;5VQGC'F.VN]8\)74(MS;W\]J6BB=U8PS8 MW)D@X)5P.AQQZ5LXI:`//;CPMJ+:#I*Q:?&;Z_ED36U,BC9#=?/=`'/.&"@; M?3BH-9TKQ7>>)M/C&F"32;'5X+F!HIX4C6!4V'Y3\Y<%V)YQA0`,UZ33)(DF MB>.1`Z.I5E89!!Z@T`<)X'TJ9_$&JZH]T9;*REN--TU`FU5B\WS'QZ@,%C!] M(L]ZL7VDZQ)/XDT^'3P\&H2B]ANVF41LRQQ+Y++G<-QBP3C&&]L'LK>WBM;> M.W@C6.&)0D<:`!54#```Z`"I*`.0TBQU74/&0\1ZCI?]EB+338B!YDE>1FD5 MRV4)&P;<#/)R3@5BR^%-8>_,OV,%/^$P75,^8G_'L(`N_K_>&,=?:O2<44`> M92^$_$0MM8>P"VE[)8V?KV.'P>3Y8'>KR^&I]+U&32TT6ZU M'1;E;=!/'J/E"W5$2+8\9<;@`F[<,DYQBN_HH`\ZDTCQ(USJAM-/E@TM'CNH M=/GNHW,]TMRLS-&^3L1E7A6(`+?='-=Y833W%C%+=6C6DSC+0,ZN8_8E>"?I 8D>YJS10`4444`%%%%`!1110`4444`?_9 ` end GRAPHIC 25 pr1019img000.jpg GRAPHIC begin 644 pr1019img000.jpg M_]C_X``02D9)1@`!`@```0`!``#_VP!#``@&!@<&!0@'!P<)"0@*#!0-#`L+ M#!D2$P\4'1H?'AT:'!P@)"XG("(L(QP<*#7J#A(6&AXB)BI*3E)66EYB9FJ*CI*6FIZBIJK*SM+6VM[BYNL+#Q,7& MQ\C)RM+3U-76U]C9VN'BX^3EYN?HZ>KQ\O/T]?;W^/GZ_\0`'P$``P$!`0$! M`0$!`0````````$"`P0%!@<("0H+_\0`M1$``@$"!`0#!`<%!`0``0)W``$" M`Q$$!2$Q!A)!40=A<1,B,H$(%$*1H;'!"2,S4O`58G+1"A8D-.$E\1<8&1HF M)R@I*C4V-S@Y.D-$149'2$E*4U155E=865IC9&5F9VAI:G-T=79W>'EZ@H.$ MA8:'B(F*DI.4E9:7F)F:HJ.DI::GJ*FJLK.TM;:WN+FZPL/$Q<;'R,G*TM/4 MU=;7V-G:XN/DY>;GZ.GJ\O/T]?;W^/GZ_]H`#`,!``(1`Q$`/P#W^BBL[6=> MTOP]9-=ZK?06L(!QYC@%R!G"CJQXZ#F@"IXK\46'A/0Y=2OB&(^6*`,`TSGH MHSU]3Z`$]JX#5O%/BC5I)=.@DM=,-Y;H]D4F_=WJ'&X077:8DX4;.!R>Q#M? MB\3^.IK/7M#TW[)8Z=')Y=IJJE'U#`E;NWN5 M9]4T^3&3YHX#Q``G=U.[K@5Z/H^M:=KVG1W^EW<5U;OCYHV!VD@':P_A8`C( M/(S6+IGA6:.XAN=2NA)>6 M/4>(2)X>\02"+RU(V6]\QX(7@*K*,<9Y]@*`/2****`"BBB@`HHHH`****`" MBBB@`HH)`ZFB@`HHHH`****`"BBB@`HHHH`****`"BBB@`HHHZT`%%(2%&20 M/K2T`8'B_P`2)X9T)[I8VFO9F%O96ZH6,T[`[%P.<9ZXYP#7-^$_!MGO1G;,DKK+#8R$B3RT7D*RDCZ9X`S6=XJGOI?B&\"PN]Y]D$.FJ^##: M1MDR7Y)X#(?EV\$@#GFI_#.LVFG+:31W!31&F^PP3>2?.UJ_?`><]3@E6Y/4 MY)(`%`'IMKOB;QU9^' MM0@T]+::^N_DFNHH$6![>22-7:&0@M&2,E3@D9'3@ MXK'\:Q:1+X1U$:W(D-BL+,9CC=&P!VLF?XP<;>^<5S6G?$#4;5-1_M?26N-. MTF=[2[UFSD789$QN8PMAE&""=NX`Y`SBFWRW/B<#Q%J>G2RZ+9_/I6DCYCJ$ MI(\J=\?=#;@H1A\N2S$#B@##T#XDZ_I5AITGB6VAELYHMD,,,;G49(U7(N70 ML08R%.3P2>1Q7KEG=P7]E!>6TBRV\\:RQ2+T96&01]0:\9U"TNWGU2&[N]FJ M7,)N=;U`_O%T>Q(W?9(R"=S?>^[C([=Z[3X6:A]I\+-:>=.ZV!,G('H<#/KEEY M&2:Q-=/BCX67=GK)\076N:--*EO=07SL\@)R24R<#Y5.#GJ1D&K,MW#X>_:& M>2_DVIJ]BD5NQZ!CM4#\6B([=15_XX74(LT@3]TV,')XSR.,YIUAXT\-ZI:75U9:Q:S16D;2 MSX;#1HHR6*GG;[XQ7F$6A0M\4/!6DZO913&#PW"DT$RAU\Q%E'(Z'!'O3?$^ MGV6F?$77+?1;>"W@?PO=/=Q0(%524?L..<1_G0!Z2_Q#\(1FV#>(+$?:%#)^ M\Z`]"W]S_@6,5K7^N:5IFG+J%]J%M;V;@%)I)0%?(R`I_B)`)`'7M7DNC:!H M+_`.?4;K3K(W9M+B47+Q+YGFAF"?-C/4**Y;5+W59#\.-.FC6>(6\4D%K.^( M9G\UEC#>VP(/HQ]30![MI_C+PYJEC^*K2? M$/PA%;V\S>(+'9/]P"3+=<9*CE1D$<@=*XA?"6LVUSXL\3:K8:9IRW.B7%O] MELFW;CM!W'@#^'\<)!Y93?$=V[IMQSFNVTSQIX;UG46T_3M9M+ MFZ&?W:/]['7:>C?AFO%VC34/"WPOM[M?/AEU!X71^0R&=5VGVQQ6QXVTVQTC MXR>#$TRT@LD=XMR6T8C!_>D=%`[$CZ4`>H:IXU\-:)>K9ZCK-K!7M[<3QW-Q=S!)H-_91M/`;)'/4>PJ]XA\.7OA7P1X0TO4+M;F= M-85SM)*Q[LG8">H&3Z=:`/6KKQCXLA;Q-LM`'K^E^(-(UO3WO]-U""XM8R0\J-PA`R0V>AP0>:S[7QYX5OM3&G6V MO6,ETS!402<.Q.`%;HQ)Z`$YKQ47-QI>D?$^UT]?+MDOE@$48PL<1GD0@`=! MMPOTK:T_PEK_`(F\+>&(;/2-&TRVMC!<+J<$O[]@J\DA5!W$X8C/WEZ\9H`] M2E\<^%H)[V";7;*.6R)6=&DPRL."`.YR",#)SQUK@_$^JZIXA^)>AZ/HGB.Z ML-+O],6Z66U_B),IWGB/ M7_$\UZ]UO4FK'Q.8/\5/`N M"#_I,)X_Z^$Y_G0!Z+<^-_#%G>W=G?2;^&[C0X?RSRI[9!Y'XUYM#H^FZG^T%J\-_86]S$FG+,L">37(:9/-I'B#XFQZ:IA2.VN52.$[!&!-M!4#IM5FQCI0!Z?XU\=>&H_ M#VM:6FNVW]H/93QQQPR%CYFQ@%W+P&SQC.:7P'K-AI'PKT>]U6^AM8!&P\V= MPN3O?@9ZG@\#DUS?A_1]`_X49?WEK:VD]RVFW+SSM$"ZS!&R,GD;3C'X$=:@ M'AC4O%'P/\/0:4(9+NTE^U)#+C$F#(-O/RY^;^+@\@]:`.OU-K#XA:4LFAZG M%=6\)='"$C#G:5)!QC`!'T8XKKK*)[>Q@ADP'1`"`VX#V!P,@>N!7#?#3Q7! MJTNI:++HT&E:M8./MD=NJA)7'R,YV@`'*XQD\`8)%>A8H`\Y^*'A\RPP:[:V M5Y=.FVVU*&VEVF:Q!:1D(R#@N%&1R`Q[5R^B:G`KL!M)!^8]#C[K>W5Q/BWPC;);?V[H-G;VNMV$YOT>&$*UT5!+1 M,1R0X)'UH`W?#?AVV\.:>T$1,MSLGVEE8QIN7^'.3AOEZUT?AK7[7Q/X?L]6M"`D\8+Q MYR8G_B0].0^/F;\6R?QK5KS_1O$Q\-S6&E:M]1?['UG! MVRJV!'#)@<.%.=YP&`R<'-6]5\J2?,LLCYR%!R,'`)'H%!Z_P M9H,^AZ,S7\IEU6^E-Y?R$\&9P-RKC@*N`!CCC/>LO0?`6(XK8>B*.N"6YXZ]`>:[:@##\2^$M'\6V:6VKVOFK&Q:-T+3K:Y MANKR"S5GNVC8/*X4$@1MP,^N?:LRZ\,M(MM>^.>CZ=#/$UQ91RR7=QIMSY]W]\1Z)I^H6ME=ZC:PWEV!Y M$;.-S@G`Q[$Y`I=7U*ZL[BSM;.RAN9;KS`!-.8E&U=V,A6Z]*`/,/A]\-M#\ M0>"=*OM2DOIHI"\CV7VDB`N&9=VT<@X&.#7HNO\`@S0_$FDP:;J-IF"W_P"/ M?RG*&'Y=HVX[8['(X''%2:3KRZA::=<2+!:BXM))Y(&DW-&4*AL'`!52Q!;C ML>]4[CQOHT]A)+I.JV5S+%-$LB>8"51I41FQP<`/][I0!5T7X::%H=M>Q0-> MSR7=J]F\]Q.7986'**.`!T[=JOZ5X)TC1O"MYX=M!.+&[6192TF7/F+M;!QQ MQ[4LOCOPQ%IBZD=8MFLFNA9^PVHFC?`19Z'%;:);A;DQZ-,9[0&7G>7#Y;U MY'2K>J^#=)UK7]/UN\25KS3]I@*2%5!#;AD=^:AM_&VG3^)M7T8_(-,@\Z2X M))4[0#(,8_AW)GG^+VIVE^-]&OX+3S[RWMKNYM!>K:F7UN"GF,3DD@YQGOC%:EUX'T6[TO2M.DBF%KI MDJS6Z"4YW#NQ/)SSGGO6Q!JMC=)9O!GQ:I;F[M&=9XF.TIL&6//8=STH`1Y`8O\H3Z5 M%8^$-*T[Q3>^(X$E_M&\0QRLTA*[3M.`.WW%JYI&OZ5KT4DNE7\%VD3;7,39 MP<9_+T/0UEVWC73P-5?4Y(=/AL=2?3UDEER)2L2RD]!CY2W'/W>M`#['P1HE MA+KCI;O(-;9S?+)(2'#%B0/0?.U8^G_"3PQIFJQ7]LM\HBF6>.W-VQB#J05) M'5L$#J3[UT^G>)-'U>6*+3]1M[F26%ID6-LDHK!6/X$@'ZU%+XLT&&[L[675 M;5+B\(%O&7YDRQ48^I&!ZF@".R\):78>*KWQ)"LW]HWD?E2LTA*[?EX`[?<6 MGW'A?3;KQ9;>)94E.HVT'D1D/A0OS]1Z_.U5[SQUX9L6N4N-9M4>VF6"8;B2 MDA)`4X]P?I@YQ@UM6-]:ZE917EE.D]M*,QR(2%9!*A1RK(X!`88]F/!R.>EF#7344`>>K\%O!HNWF:TNFB8<6YNG\M3V/'S9^I-3_\` M"IO#?]B1Z4#?K%%)V`!VGH.%';^9KNZ*`,'PQX/TCPE;2Q:7"X: M8@S2RR%WD([DG\>F!R:WJ**`"BBB@#S34++5O`NN:KJ=C!-=^&-2+7%]'%(! M+8RL1YDZ@@EAM!.!^@49R9]4>2;3]575X1<2*+?2_$JQ_N[L,Q(L[F(#Y"3R M6(`&,C:I?#[0K^_GN=MS;"]<&^AMYBD5W@[OG7IDDO%2Z#X;TCPS9R6FCV2VL$DAE=0S-EL`9RQ)Z`#' M2M7I0`4444`> M+-9O8K8/;7/APV$3EU&Z8O(=F"<]&7GIS7:T4`>9Z5X;U6PM[?3K_0;F_M+R MRM([EX=2$(MV2%(GC=`XWJ-A;5VQGC'F.VN]8\)74(MS;W\]J6BB=U8PS8 MW)D@X)5P.AQQZ5LXI:`//;CPMJ+:#I*Q:?&;Z_ED36U,BC9#=?/=`'/.&"@; M?3BH-9TKQ7>>)M/C&F"32;'5X+F!HIX4C6!4V'Y3\Y<%V)YQA0`,UZ33)(DF MB>.1`Z.I5E89!!Z@T`<)X'TJ9_$&JZH]T9;*REN--TU`FU5B\WS'QZ@,%C!] M(L]ZL7VDZQ)/XDT^'3P\&H2B]ANVF41LRQQ+Y++G<-QBP3C&&]L'LK>WBM;> M.W@C6.&)0D<:`!54#```Z`"I*`.0TBQU74/&0\1ZCI?]EB+338B!YDE>1FD5 MRV4)&P;<#/)R3@5BR^%-8>_,OV,%/^$P75,^8G_'L(`N_K_>&,=?:O2<44`> M92^$_$0MM8>P"VE[)8V?KV.'P>3Y8'>KR^&I]+U&32TT6ZU M'1;E;=!/'J/E"W5$2+8\9<;@`F[<,DYQBN_HH`\ZDTCQ(USJAM-/E@TM'CNH M=/GNHW,]TMRLS-&^3L1E7A6(`+?='-=Y833W%C%+=6C6DSC+0,ZN8_8E>"?I 8D>YJS10`4444`%%%%`!1110`4444`?_9 ` end GRAPHIC 26 pr1019img001.jpg GRAPHIC begin 644 pr1019img001.jpg M_]C_X``02D9)1@`!`0```0`!``#_VP!#``@&!@<&!0@'!P<)"0@*#!0-#`L+ M#!D2$P\4'1H?'AT:'!P@)"XG("(L(QP<*#7J#A(6&AXB)BI*3E)66EYB9FJ*CI*6FIZBIJK*SM+6VM[BYNL+#Q,7& MQ\C)RM+3U-76U]C9VN'BX^3EYN?HZ>KQ\O/T]?;W^/GZ_\0`'P$``P$!`0$! M`0$!`0````````$"`P0%!@<("0H+_\0`M1$``@$"!`0#!`<%!`0``0)W``$" M`Q$$!2$Q!A)!40=A<1,B,H$(%$*1H;'!"2,S4O`58G+1"A8D-.$E\1<8&1HF M)R@I*C4V-S@Y.D-$149'2$E*4U155E=865IC9&5F9VAI:G-T=79W>'EZ@H.$ MA8:'B(F*DI.4E9:7F)F:HJ.DI::GJ*FJLK.TM;:WN+FZPL/$Q<;'R,G*TM/4 MU=;7V-G:XN/DY>;GZ.GJ\O/T]?;W^/GZ_]H`#`,!``(1`Q$`/P#=_P"%'>"_ M^>%[_P"!)_PH_P"%'>"_^>%[_P"!)_PKTBJ6K7,MIISRPE0^]%W.0`H9PI.3 MTP"3G!_&@#A/^%'>"_\`GA>_^!)_PH_X4=X+_P">%[_X$G_"M^/7-1ELY;F/ MRR(]K.KI@J"SKMP.^%4XSGYO2NB@N/M%O'-$A*.H89(!Z'_ZWYT`>??\*.\% M_P#/"]_\"3_A1_PH[P7_`,\+W_P)/^%>BEGYQ'G_`(%]?_K?G06?G$>?^!?7 M_P"M^=`'G7_"CO!?_/"]_P#`D_X4?\*.\%_\\+W_`,"3_A7HI9^<1Y_X%]?_ M`*WYT%GYQ'G_`(%]?_K?G0!YU_PH[P7_`,\+W_P)/^%'_"CO!?\`SPO?_`D_ MX5Z*6?G$>?\`@7U_^M^=!9^<1Y_X%]?_`*WYT`>=?\*.\%_\\+W_`,"3_A1_ MPH[P7_SPO?\`P)/^%>BEGYQ'G_@7U_\`K?G06?G$>?\`@7U_^M^=`'G7_"CO M!?\`SPO?_`D_X4?\*.\%_P#/"]_\"3_A7HI9^<1Y_P"!?7_ZWYT%GYQ'G_@7 MU_\`K?G0!YU_PH[P7_SPO?\`P)/^%'_"CO!?_/"]_P#`D_X5Z*6?G$>?^!?7 M_P"M^=!9^<1Y_P"!?7_ZWYT`>=?\*.\%_P#/"]_\"3_A1_PH[P7_`,\+W_P) M/^%>BEGYQ'G_`(%]?_K?G06?G$>?^!?7_P"M^=`'G7_"CO!?_/"]_P#`D_X4 M?\*.\%_\\+W_`,"3_A7HI9^<1Y_X%]?_`*WYT%GYQ'G_`(%]?_K?G0!YU_PH M[P7_`,\+W_P)/^%'_"CO!?\`SPO?_`D_X5Z*6?G$>?\`@7U_^M^=!9^<1Y_X M%]?_`*WYT`>=?\*.\%_\\+W_`,"3_A1_PH[P7_SPO?\`P)/^%>BEGYQ'G_@7 MU_\`K?G06?G$>?\`@7U_^M^=`'G7_"CO!?\`SPO?_`D_X4?\*.\%_P#/"]_\ M"3_A7HI9^<1Y_P"!?7_ZWYT%GYQ'G_@7U_\`K?G0!YU_PH[P7_SPO?\`P)/^ M%'_"CO!?_/"]_P#`D_X5Z*6?G$>?^!?7_P"M^=!9^<1Y_P"!?7_ZWYT`>=?\ M*.\%_P#/"]_\"3_A1_PH[P7_`,\+W_P)/^%>BEGYQ'G_`(%]?_K?G06?G$>? M^!?7_P"M^=`'G7_"CO!?_/"]_P#`D_X4?\*.\%_\\+W_`,"3_A7HI9^<1Y_X M%]?_`*WYT%GYQ'G_`(%]?_K?G0!YU_PH[P7_`,\+W_P)/^%'_"CO!?\`SPO? M_`D_X5Z*6?G$>?\`@7U_^M^=!9^<1Y_X%]?_`*WYT`>=?\*.\%_\\+W_`,"3 M_A1_PH[P7_SPO?\`P)/^%>BEGYQ'G_@7U_\`K?G06?G$>?\`@7U_^M^=`'G7 M_"CO!?\`SPO?_`D_X4?\*.\%_P#/"]_\"3_A7HI9^<1Y_P"!?7_ZWYT%GYQ' MG_@7U_\`K?G0!YU_PH[P7_SPO?\`P)/^%'_"CO!?_/"]_P#`D_X5Z*6?G$>? M^!?7_P"M^=!9^<1Y_P"!?7_ZWYT`>=?\*.\%_P#/"]_\"3_A1_PH[P7_`,\+ MW_P)/^%>BEGYQ'G_`(%]?_K?G06?G$>?^!?7_P"M^=`'G7_"CO!?_/"]_P#` MD_X4?\*.\%_\\+W_`,"3_A7HI9^<1Y_X%]?_`*WYT%GYQ'G_`(%]?_K?G0!Y MU_PH[P7_`,\+W_P)/^%'_"CO!?\`SPO?_`D_X5Z*6?G$>?\`@7U_^M^=!9^< M1Y_X%]?_`*WYT`>=?\*.\%_\\+W_`,"3_A1_PH[P7_SPO?\`P)/^%>BEGYQ' MG_@7U_\`K?G06?G$>?\`@7U_^M^=`'G7_"CO!?\`SPO?_`D_X4?\*.\%_P#/ M"]_\"3_A7HI9^<1Y_P"!?7_ZWYT%GYQ'G_@7U_\`K?G0!YU_PH[P7_SPO?\` MP)/^%'_"CO!?_/"]_P#`D_X5Z*6?G$>?^!?7_P"M^=!9^<1Y_P"!?7_ZWYT` M>=?\*.\%_P#/"]_\"3_A1_PH[P7_`,\+W_P)/^%>BEGYQ'G_`(%]?_K?G06? MG$>?^!?7_P"M^=`'G7_"CO!?_/"]_P#`D_X4?\*.\%_\\+W_`,"3_A7HI9^< M1Y_X%]?_`*WYT^@#S?\`X4=X+_YX7O\`X$G_``HKTBB@`IDTL<$,DTKA(XU+ M.S'A0.233ZK7]FFH64EK(S*K@?,IP1@Y'\J`'6]Y;W1<0R!RG7'XC\>01]01 MVJ>L_3-+_LXR'SC)N`497&!N=N?4Y<_I5YHT>O'U_Q/YT&&,YRB\]>/K_`(G\Z`'T4PPQG.47GKQ]?\3^=!AC.>O'U_ MQ/YT&&,YRB\]>/K_`(G\Z`'T4PPQG.47GKQ]?\3^=!AC.6>&_DL`9Y+I)1ND&4P[#B^D&T'#-G*\\DL>=W(VX'7`!T]%,,,9SE%YZ\?7_$_G08 M8SG*+SUX^O\`B?SH`?13##&>O'U_Q/YT&&,YRB\]>/K_`(G\Z`'T4PPQ MG.47GKQ]?\3^=!AC.>O'U_Q/YT&&,YRB\]>/K_`(G\Z`'T4PPQG.47GKQ] M?\3^=!AC.>O'U_Q/YT&&,YRB\]>/K_`(G\Z`'T4PPQG.47GKQ]?\3^=!AC M.>O'U_Q/YT&&,YRB\]>/K_`(G\Z`'T4PPQG.47GKQ]?\3^=!AC.>O'U_ MQ/YT&&,YRB\]>/K_`(G\Z`'T5QFD^([Z]ET]KB#3FM+N[FA^T0LP!586?(4] MMP<;B1E<':-W&3K'CR\L;_58X+2SE@M90$;8S%EV2L>C3A@,T`> MDT5S>F:T\NJ'3=5MX8+MB51(U+!CM+$9R0,*2>O.>QXKH3#&>O'U_P`3 M^=`#Z*888SG*+SUX^O\`B?SH,,9SE%YZ\?7_`!/YT`/HIAAC./K_`(G\Z?0`4444`%4]4N/LNG2S M>:8MI4;@!GE@,?-P,YQD\#.3TJY10!D:+=W=R\ZW4B2%`.47"AM[C`]MJHW/ M/S9Z$5JL9`?E52,=VQZ^WT_SUCANX+B26.)]S1'#C!&.2._7D$<>AJ0.&=E' M5<9H`BN+D6MO+<3M#%#&I9Y))-JJ!GDG'';\SZ2ST MNS'B;0%M;*1':+<#YNWG!)ES][#=3DCG/.0#IH-?TRZQ]FU&PFSG:$N0WSGW]OI^9].>`MK/0(=-2.3Q/HIU`2&1KR)U0L<(GM\Y]_;Z?F?3E2X$BI_$02/H,?XBG4`,)EYPB>WSGW]OI^9]. M0F7G")[?.??V^GYGTY?10`PF7G")[?.??V^GYGTY"9><(GM\Y]_;Z?F?3E]- M9PA4'JQP/KC/]*`.=\=:C?:5X(U>_LI!#<00%HY5.2ISUP1CT_,^G/SC_P`+ M8\65U?PT_Y*1H/_7T/Y&@ M#ZW)EYPB>WSGW]OI^9].0F7G")[?.??V^GYGTY61Q'&SM]U1DT2$K&S#J`30 M!P>N:UXFLM1GB@8F(:@D<)BMLAHS$&"'(/4G!;USC%6O$FLZW;3N^GRXLV@C M8/'`2T>;A$=B2#DA"QQC`Y.#BO&/^%Y^,O[]A_X#_P#UZ/\`A>?C+^_8?^`_ M_P!>@#V?2=9\00M8'5X6F^UQQ$K#%CRG<WSGW] MOI^9].?FE/CEXQ:15+V&"0/^/?\`^O7TS0`PF7G")[?.??V^GYGTYHZAK$&F M26R77RFYE$41"NPW%@JY(4A497`/5?=?S.,XKS;4-9^'6IW5 MUD$R\X1/;YS[^WT_,^G(3+SA$]OG/O[?3\SZ<\5E&37SX12-7N_[4C<,TGEC=(OG,,'Y<,$`]N_G?Q: M^('BCPUXS%AI&J&VM3:QR;/(C?YB6R
  • //\`H/'_`,!8/_B*]S^$OB#5/$O@QK_5[K[3 M="ZDCW^6J?*`N!A0!W-`';DR\X1/;YS[^WT_,^G,=Q<&UMIKB15$<2,[$$DX M`)Z`$GH.!ZG\90X,C)_$`"?H<_X&L3Q/XBT70[,0ZQJO]G?;$=(I5SO!``)4 M@'!&X'F@"5_$EDFDIJF9&M'XF\J&Y# M2%W15,<@W%5W@08 M&XC@<`*H&.I$R\X M1/;YS[^WT_,^G(3+SA$]OG/O[?3\SZE;Q<"14_B8$C\,?XT`(3+SA$]OG/O[?3\SZU+4UACD-I;23A"Y&[:I..GL/S/ISI.XC`+="0/Q)Q6%XY_Y M$'Q#_P!@Z?\`]%F@#QI/CW<1)LC\,:>BY)PLA`R1@GIZ<4A^/,Y))\+Z>2Q5 MB?,/)7H>G;M7C]%`'NN@_&^\UGQ)INGG0+.,W5RD'FB4Y7>P!/2O;29><(GM M\Y]_;Z?F?3GX\\#?\C]X>_[",'_HP5]B2.(XV=ONJ"3]!0`A,O.$3V^<^_M] M/S/ISQ>OZ#JMS>7S6\-S-#+_ M`!,NH7*KXBU8*)6``O9,`9/^U0!]&ZUHFMZGXE^UP":&U-G)"P6XV$,!,%PR MMD;BT;=.PR1C!FM](UO3;JTN;4&=G$"W,<\^43"E69<8(('KNSOX!VBOF3_A M,?$__0QZO_X'2_\`Q5'_``F/B?\`Z&/5_P#P.E_^*H`^R"9><(GM\Y]_;Z?F M?3E]5[%F?3[9F)+&)223R3@5,CB1`R]#0`ZBBB@`HHJCJMS);6;NBS#I^\C" MD@[@,8.>N>N#CK0`ZSL%M+BXE$A8RGH1C`W,_P"/+M^&/J7SZ?9W4GF7%I!* MX&-SQACC\:HZ+<7LSSK=R&38!\WE[1NWN...FT(><_>]ZU6,@/RJI&.[8]?; MZ?YZ@%/^QM,/_,.M?^_*_P"%']C:7_T#K3_ORO\`A5LF7G")[?.??V^GYGTY M"9><(GM\Y]_;Z?F?3D`J?V-I?_0.M/\`ORO^%']C:9_T#K7_`+\K_A5LF7G" M)[?.??V^GYGTY"9><(GM\Y]_;Z?F?3D`J_V/IG_0/M?^_*_X5PGQ9T.^D\)P M#PUI\OV[[8A;[#'A_+V/G.WG&=OZ5Z*3+SA$]OG/O[?3\SZ: MSMMR'&$SGYF!(R!QD#GDXZ4`?+'_``COQ(_Y\/$'Y24?\([\2/\`GP\0?E)7 MN.G^)=<&N6$%^Z^087:?$&Q6PUUELX)4#RH!U/\`K._/1$R\X1/;YS[^WT_,^G(!5_L?3/\`H'6O_?E?\*3^QM+_`.@= M:?\`?E?\*MDR\X1/;YS[^WT_,^G(3+SA$]OG/O[?3\SZ<@%3^QM+_P"@=:?] M^5_PH_L;2_\`H'6G_?E?\*MDR\X1/;YS[^WT_,^G(3+SA$]OG/O[?3\SZ<@% M7^Q],_Z!]K_WY7_"C^Q],_Z!]K_WY7_"K1,O.$3V^<^_M]/S/IR$R\X1/;YS M[^WT_,^G(!4_L;2_^@=:?]^5_P`*/[&TO_H'6G_?E?\`"K9,O.$3V^<^_M]/ MS/IR$R\X1/;YS[^WT_,^G(!4_L;2_P#H'6G_`'Y7_"E_L?3/^@?:_P#?E?\` M"K1,O.$3V^<^_M]/S/IR$R\X1/;YS[^WT_,^G(!5_L?3/^@?:_\`?E?\*3^Q MM+_Z!UI_WY7_``JV3+SA$]OG/O[?3\SZWSGW]OI^9].0F7G")[?.??V^GYGTY`*G M]C:7_P!`ZT_[\K_A1_8VE_\`0.M/^_*_X5;)EYPB>WSGW]OI^9].0F7G")[? M.??V^GYGTY`*G]C:9_T#K7_ORO\`A2_V/IG_`$#[7_ORO^%6B9><(GM\Y]_; MZ?F?3D)EYPB>WSGW]OI^9].0#S?XQ01:7X`EN=/B2TG%Q$HE@4(V"3D9'-?. MW]OZQ_T%;W_O^W^-?17QP+_\*XFRJ@?:HNC>Y]OI7S)0!H_V_K'_`$%;W_O^ MW^-=]\';Z[U3Q_%;:A':`3]EFZG': M@#Z2_L?3/^@?:_\`?E?\*/['TS_H'VO_`'Y7_"K1,O.$3V^<^_M]/S/IR$R\ MX1/;YS[^WT_,^G(!4_L;2_\`H'6G_?E?\*/[&TO_`*!UI_WY7_"K9,O.$3V^ M<^_M]/S/IR$R\X1/;YS[^WT_,^G(!4_L;2_^@=:?]^5_PI?['TS_`*!]K_WY M7_"K1,O.$3V^<^_M]/S/IR$R\X1/;YS[^WT_,^G(!5_L?3/^@?:_]^5_PI/[ M&TO_`*!UI_WY7_"K9,O.$3V^<^_M]/S/IR$R\X1/;YS[^WT_,^G(!4_L;2_^ M@=:?]^5_PH_L;2_^@=:?]^5_PJV3+SA$]OG/O[?3\SZLX@ORCW_Q/YF@PQ'.8T.>ORCW_`,3^9H`?13## M$ORCW_Q/YF@!]%,,,1SF-#GK\H]_P#$_F:# M#$ORCW_Q/YF@PQ'.8T.>ORCW_P`3^9H` M?13##$ORCW_`,3^9H,,1SF-#GK\H]_\ M3^9H`?13##$ORCW_P`3^9H,,1SF-#GK M\H]_\3^9H`?13##$ORCW_Q/YF@!]%,,,1SF M-#GK\H]_\3^9H,,1SF-#GK\H]_\`$_F:`'T4PPQ'.8T.>ORCW_Q/YF@PQ'.8 MT.>ORCW_`,3^9H`?13##$ORCW_Q/YF@!]%, M,,1SF-#GK\H]_P#$_F:##$ORCW_Q/YF@ MPQ'.8T.>ORCW_P`3^9H`?13##$W9PY",4.021R/J?SKSNW^'?PQNKV*T@CNI))I MI($(DFVETW;EW8Q_"V.><<9H`^=:]'^!W_)2(?\`KUE_D*]$N?AS\,[2YN;: M2"],ML\:3+&T\GEM)]P$J"!FMWP=X*\%6%^-5\/Q2M,L1&Z1Y"-K9'1O7!_R M:`.]HIAAB. M_P#B?S-!AB._\`B?S-!AB.^G\XWJSK\H.V5,;6W/P#@9^4)TX_6M9C)GY0I&.Y^O_`-:JUEJ-OJ&_ M[.6(4`Y*XR"2,C\58?A]*M%E'5@/J:`&DR\X5/;D^_M]/UH)EYPJ>W)]_;Z? MK2[U'\0_/_/H:-ZC^(?G_GT-`"$R\X5/;D^_M]/UH)EYPJ>W)]_;Z?K2[U'\ M0_/_`#Z&C>H_B'Y_Y]#0`A,O.%3VY/O[?3]:"9><*GMR??V^GZTN]1_$/S_S MZ&C>H_B'Y_Y]#0`A,O.%3VY/O[?3]:"9><*GMR??V^GZTN]1_$/S_P`^AHWJ M/XA^?^?0T`(3+SA4]N3[^WT_6@F7G"I[W)]_;Z?K2[U'\0_/_/H:-ZC^(?G_GT-`"$R\X5/ M;D^_M]/UH)EYPJ>W)]_;Z?K2[U'\0_/_`#Z&C>H_B'Y_Y]#0`A,O.%3VY/O[ M?3]:"9><*GMR??V^GZTN]1_$/S_SZ&C>H_B'Y_Y]#0`A,O.%3VY/O[?3]:"9 M><*GMR??V^GZTN]1_$/S_P`^AHWJ/XA^?^?0T`(3+SA4]N3[^WT_6@F7G"I[ MW)]_;Z?K2[U M'\0_/_/H:-ZC^(?G_GT-`"$R\X5/;D^_M]/UH)EYPJ>W)]_;Z?K2[U'\0_/_ M`#Z&C>H_B'Y_Y]#0`A,O.%3VY/O[?3]:"9><*GMR??V^GZTN]1_$/S_SZ&C> MH_B'Y_Y]#0`A,O.%3VY/O[?3]:"9><*GMR??V^GZTN]1_$/S_P`^AHWJ/XA^ M?^?0T`(3+SA4]N3[^WT_6@F7G"I[2RO+N-+:226&-I0X1F5E&"RD@`$ M<9P<#.<<]5O4?Q#\_P#/H:-ZC^(?G_GT-`'/)X1M8M1N+V.2?=//%<2(TQ9& M>-G<<$'`W.#@=,<8QS:@T".VU;^T()'1OFS"K!8SG(^Z!_N_4C/45K[U'\0_ M/_/H:-ZC^(?G_GT-`"$R\X5/;D^_M]/UH)EYPJ>W)]_;Z?K2[U'\0_/_`#Z& MC>H_B'Y_Y]#0`A,O.%3VY/O[?3]:"9><*GMR??V^GZTN]1_$/S_SZ&C>H_B' MY_Y]#0`A,O.%3VY/O[?3]:"9><*GMR??V^GZTN]1_$/S_P`^AHWJ/XA^?^?0 MT`(3+SA4]N3[^WT_6@F7G"I[,@<5:H MH`HZ=I4&F*PA>1@5"_.0<`%CCIZLQY]:NE5/50?J*6B@!NQ3_"/R_P`^IJK) M?V$K.Q3_``C\O\^IK.T[2/L#QR-/YC(A M0X3:#Q&H[GM$/Q)Z=*TZ`&[%/\(_+_/J:-BG^$?E_GU-.HH`JSWEG;2>7-(B MN1D*1DG.<#ZGG`ZG!QWJ-=3TZ1U5;B)BY`&.VLSC)#==S$^ MG`X.*`-S8I_A'Y?Y]31L4_PC\O\`/J:=10`W8I_A'Y?Y]344\]M;%!.Z)YAV MKGN3Q_7]?>IZHZE8-J$<<1F"0ALR(4SO]."N[IVS MM]/7(J\%1E!`4@\Y'?\`SFL+_A'9?G)O4+29+_N2`6.0>C9`VG&,]><]JW(D M\J%(RQ;:H7<>IQWH`78I_A'Y?Y]31L4_PC\O\^IIU%`$,\D%O$TLVU4&`3C/ M).!^9/ZU`NHZ?)($6>)F8X&.<\X_+)QGIDXZU+?6\MU9O##-Y+-CY]I/&1D< M$'D9&001G(K'/AG=,7^U[%(V[8H]NU?-\W`.>#NXSZ=N]`&W#)!:LPRP7"N8L,%_I0!;V*?X1^7^?4T;% M/\(_+_/J:=10`W8I_A'Y?Y]35-M3TY2P:XB!!8'/^SU_GU]ZO5@W/AV2[682 MWJYF+;V$)R02I4?>XV[0/<>_-`&K!=VET[)"Z.P&2,=/4'WYY'49YZU/L4_P MC\O\^IK,TW1O[/O;BY\\.T[,\@";#0E_8RR)&DB,TC%5PI MP3C=C./3)]P@`R3GH/J><#OVS4M]:R7<<2)*J(L@:160L) M%&?EX(QS@_A@Y!-8Z>%RC!C>*Q!B/,1',:%%/#`C@YZ]1VZ4`;Z&*6-9$V.C MC<&'((/?]?UI=BG^$?E_GU-1V=N+.R@ME8LL,:QACU.!BIJ`&[%/\(_+_/J: M9,\,,;22[0HZG&GO4M07<,L]K)%#-Y,C#`DVYQSSW';WH`A34M.D M("W,!W$`C=/0^]3P2V]W")H2KQMG!`^N?ZUEQ>'D2&2$SCRFVA5 M2/;M`9V(ZGNYQZ`#KUK0T^T:SMC&\HED9BS,%V@D^@R<<8[T`6-BG^$?E_GU M-.HHH`****`/C?\`X37Q7_T,VL_^!\O_`,51_P`)KXK_`.AFUG_P/E_^*HHH M`/\`A-?%?_0S:S_X'R__`!5'_":^*_\`H9M9_P#`^7_XJBB@`_X37Q7_`-#- MK/\`X'R__%4?\)KXK_Z&;6?_``/E_P#BJ**`#_A-?%?_`$,VL_\`@?+_`/%4 M?\)KXK_Z&;6?_`^7_P"*HHH`/^$U\5_]#-K/_@?+_P#%4?\`":^*_P#H9M9_ M\#Y?_BJ**`#_`(37Q7_T,VL_^!\O_P`51_PFOBO_`*&;6?\`P/E_^*HHH`/^ M$U\5_P#0S:S_`.!\O_Q5'_":^*_^AFUG_P`#Y?\`XJBB@`_X37Q7_P!#-K/_ M`('R_P#Q5'_":^*_^AFUG_P/E_\`BJ**`#_A-?%?_0S:S_X'R_\`Q5'_``FO MBO\`Z&;6?_`^7_XJBB@`_P"$U\5_]#-K/_@?+_\`%4?\)KXK_P"AFUG_`,#Y M?_BJ**`#_A-?%?\`T,VL_P#@?+_\51_PFOBO_H9M9_\``^7_`.*HHH`/^$U\ M5_\`0S:S_P"!\O\`\51_PFOBO_H9M9_\#Y?_`(JBB@`_X37Q7_T,VL_^!\O_ M`,51_P`)KXK_`.AFUG_P/E_^*HHH`/\`A-?%?_0S:S_X'R__`!5'_":^*_\` MH9M9_P#`^7_XJBB@`_X37Q7_`-#-K/\`X'R__%4?\)KXK_Z&;6?_``/E_P#B MJ**`#_A-?%?_`$,VL_\`@?+_`/%4?\)KXK_Z&;6?_`^7_P"*HHH`/^$U\5_] M#-K/_@?+_P#%4?\`":^*_P#H9M9_\#Y?_BJ**`#_`(37Q7_T,VL_^!\O_P`5 M1_PFOBO_`*&;6?\`P/E_^*HHH`/^$U\5_P#0S:S_`.!\O_Q5'_":^*_^AFUG M_P`#Y?\`XJBB@`_X37Q7_P!#-K/_`('R_P#Q5'_":^*_^AFUG_P/E_\`BJ** M`#_A-?%?_0S:S_X'R_\`Q5'_``FOBO\`Z&;6?_`^7_XJBB@`_P"$U\5_]#-K M/_@?+_\`%4?\)KXK_P"AFUG_`,#Y?_BJ**`#_A-?%?\`T,VL_P#@?+_\51_P MFOBO_H9M9_\``^7_`.*HHH`/^$U\5_\`0S:S_P"!\O\`\51_PFOBO_H9M9_\ M#Y?_`(JBB@`_X37Q7_T,VL_^!\O_`,51_P`)KXK_`.AFUG_P/E_^*HHH`/\` MA-?%?_0S:S_X'R__`!5'_":^*_\`H9M9_P#`^7_XJBB@`_X37Q7_`-#-K/\` MX'R__%4?\)KXK_Z&;6?_``/E_P#BJ**`#_A-?%?_`$,VL_\`@?+_`/%4?\)K DXK_Z&;6?_`^7_P"*HHH`/^$U\5_]#-K/_@?+_P#%4444`?_9 ` end GRAPHIC 27 pr1019img002.jpg GRAPHIC begin 644 pr1019img002.jpg M_]C_X``02D9)1@`!`@```0`!``#_VP!#``@&!@<&!0@'!P<)"0@*#!0-#`L+ M#!D2$P\4'1H?'AT:'!P@)"XG("(L(QP<*#7J#A(6&AXB)BI*3E)66EYB9FJ*CI*6FIZBIJK*SM+6VM[BYNL+#Q,7& MQ\C)RM+3U-76U]C9VN'BX^3EYN?HZ>KQ\O/T]?;W^/GZ_\0`'P$``P$!`0$! M`0$!`0````````$"`P0%!@<("0H+_\0`M1$``@$"!`0#!`<%!`0``0)W``$" M`Q$$!2$Q!A)!40=A<1,B,H$(%$*1H;'!"2,S4O`58G+1"A8D-.$E\1<8&1HF M)R@I*C4V-S@Y.D-$149'2$E*4U155E=865IC9&5F9VAI:G-T=79W>'EZ@H.$ MA8:'B(F*DI.4E9:7F)F:HJ.DI::GJ*FJLK.TM;:WN+FZPL/$Q<;'R,G*TM/4 MU=;7V-G:XN/DY>;GZ.GJ\O/T]?;W^/GZ_]H`#`,!``(1`Q$`/P#W^BBL[6=> MTOP]9-=ZK?06L(!QYC@%R!G"CJQXZ#F@"IXK\46'A/0Y=2OB&(^6*`,`TSGH MHSU]3Z`$]JX#5O%/BC5I)=.@DM=,-Y;H]D4F_=WJ'&X077:8DX4;.!R>Q#M? MB\3^.IK/7M#TW[)8Z=')Y=IJJE'U#`E;NWN5 M9]4T^3&3YHX#Q``G=U.[K@5Z/H^M:=KVG1W^EW<5U;OCYHV!VD@':P_A8`C( M/(S6+IGA6:.XAN=2NA)>6 M/4>(2)X>\02"+RU(V6]\QX(7@*K*,<9Y]@*`/2****`"BBB@`HHHH`****`" MBBB@`HH)`ZFB@`HHHH`****`"BBB@`HHHH`****`"BBB@`HHHZT`%%(2%&20 M/K2T`8'B_P`2)X9T)[I8VFO9F%O96ZH6,T[`[%P.<9ZXYP#7-^$_!MGO1G;,DKK+#8R$B3RT7D*RDCZ9X`S6=XJGOI?B&\"PN]Y]D$.FJ^##: M1MDR7Y)X#(?EV\$@#GFI_#.LVFG+:31W!31&F^PP3>2?.UJ_?`><]3@E6Y/4 MY)(`%`'IMKOB;QU9^' MM0@T]+::^N_DFNHH$6![>22-7:&0@M&2,E3@D9'3@ MXK'\:Q:1+X1U$:W(D-BL+,9CC=&P!VLF?XP<;>^<5S6G?$#4;5-1_M?26N-. MTF=[2[UFSD789$QN8PMAE&""=NX`Y`SBFWRW/B<#Q%J>G2RZ+9_/I6DCYCJ$ MI(\J=\?=#;@H1A\N2S$#B@##T#XDZ_I5AITGB6VAELYHMD,,,;G49(U7(N70 ML08R%.3P2>1Q7KEG=P7]E!>6TBRV\\:RQ2+T96&01]0:\9U"TNWGU2&[N]FJ M7,)N=;U`_O%T>Q(W?9(R"=S?>^[C([=Z[3X6:A]I\+-:>=.ZV!,G('H<#/KEEY M&2:Q-=/BCX67=GK)\076N:--*EO=07SL\@)R24R<#Y5.#GJ1D&K,MW#X>_:& M>2_DVIJ]BD5NQZ!CM4#\6B([=15_XX74(LT@3]TV,')XSR.,YIUAXT\-ZI:75U9:Q:S16D;2 MSX;#1HHR6*GG;[XQ7F$6A0M\4/!6DZO913&#PW"DT$RAU\Q%E'(Z'!'O3?$^ MGV6F?$77+?1;>"W@?PO=/=Q0(%524?L..<1_G0!Z2_Q#\(1FV#>(+$?:%#)^ M\Z`]"W]S_@6,5K7^N:5IFG+J%]J%M;V;@%)I)0%?(R`I_B)`)`'7M7DNC:!H M+_`.?4;K3K(W9M+B47+Q+YGFAF"?-C/4**Y;5+W59#\.-.FC6>(6\4D%K.^( M9G\UEC#>VP(/HQ]30![MI_C+PYJEC^*K2? M$/PA%;V\S>(+'9/]P"3+=<9*CE1D$<@=*XA?"6LVUSXL\3:K8:9IRW.B7%O] MELFW;CM!W'@#^'\<)!Y93?$=V[IMQSFNVTSQIX;UG46T_3M9M+ MFZ&?W:/]['7:>C?AFO%VC34/"WPOM[M?/AEU!X71^0R&=5VGVQQ6QXVTVQTC MXR>#$TRT@LD=XMR6T8C!_>D=%`[$CZ4`>H:IXU\-:)>K9ZCK-K!7M[<3QW-Q=S!)H-_91M/`;)'/4>PJ]XA\.7OA7P1X0TO4+M;F= M-85SM)*Q[LG8">H&3Z=:`/6KKQCXLA;Q-LM`'K^E^(-(UO3WO]-U""XM8R0\J-PA`R0V>AP0>:S[7QYX5OM3&G6V MO6,ETS!402<.Q.`%;HQ)Z`$YKQ47-QI>D?$^UT]?+MDOE@$48PL<1GD0@`=! MMPOTK:T_PEK_`(F\+>&(;/2-&TRVMC!<+J<$O[]@J\DA5!W$X8C/WEZ\9H`] M2E\<^%H)[V";7;*.6R)6=&DPRL."`.YR",#)SQUK@_$^JZIXA^)>AZ/HGB.Z ML-+O],6Z66U_B),IWGB/ M7_$\UZ]UO4FK'Q.8/\5/`N M"#_I,)X_Z^$Y_G0!Z+<^-_#%G>W=G?2;^&[C0X?RSRI[9!Y'XUYM#H^FZG^T%J\-_86]S$FG+,L">37(:9/-I'B#XFQZ:IA2.VN52.$[!&!-M!4#IM5FQCI0!Z?XU\=>&H_ M#VM:6FNVW]H/93QQQPR%CYFQ@%W+P&SQC.:7P'K-AI'PKT>]U6^AM8!&P\V= MPN3O?@9ZG@\#DUS?A_1]`_X49?WEK:VD]RVFW+SSM$"ZS!&R,GD;3C'X$=:@ M'AC4O%'P/\/0:4(9+NTE^U)#+C$F#(-O/RY^;^+@\@]:`.OU-K#XA:4LFAZG M%=6\)='"$C#G:5)!QC`!'T8XKKK*)[>Q@ADP'1`"`VX#V!P,@>N!7#?#3Q7! MJTNI:++HT&E:M8./MD=NJA)7'R,YV@`'*XQD\`8)%>A8H`\Y^*'A\RPP:[:V M5Y=.FVVU*&VEVF:Q!:1D(R#@N%&1R`Q[5R^B:G`KL!M)!^8]#C[K>W5Q/BWPC;);?V[H-G;VNMV$YOT>&$*UT5!+1 M,1R0X)'UH`W?#?AVV\.:>T$1,MSLGVEE8QIN7^'.3AOEZUT?AK7[7Q/X?L]6M"`D\8+Q MYR8G_B0].0^/F;\6R?QK5KS_1O$Q\-S6&E:M]1?['UG! MVRJV!'#)@<.%.=YP&`R<'-6]5\J2?,LLCYR%!R,'`)'H%!Z_P M9H,^AZ,S7\IEU6^E-Y?R$\&9P-RKC@*N`!CCC/>LO0?`6(XK8>B*.N"6YXZ]`>:[:@##\2^$M'\6V:6VKVOFK&Q:-T+3K:Y MANKR"S5GNVC8/*X4$@1MP,^N?:LRZ\,M(MM>^.>CZ=#/$UQ91RR7=QIMSY]W]\1Z)I^H6ME=ZC:PWEV!Y M$;.-S@G`Q[$Y`I=7U*ZL[BSM;.RAN9;KS`!-.8E&U=V,A6Z]*`/,/A]\-M#\ M0>"=*OM2DOIHI"\CV7VDB`N&9=VT<@X&.#7HNO\`@S0_$FDP:;J-IF"W_P"/ M?RG*&'Y=HVX[8['(X''%2:3KRZA::=<2+!:BXM))Y(&DW-&4*AL'`!52Q!;C ML>]4[CQOHT]A)+I.JV5S+%-$LB>8"51I41FQP<`/][I0!5T7X::%H=M>Q0-> MSR7=J]F\]Q.7986'**.`!T[=JOZ5X)TC1O"MYX=M!.+&[6192TF7/F+M;!QQ MQ[4LOCOPQ%IBZD=8MFLFNA9^PVHFC?`19Z'%;:);A;DQZ-,9[0&7G>7#Y;U MY'2K>J^#=)UK7]/UN\25KS3]I@*2%5!#;AD=^:AM_&VG3^)M7T8_(-,@\Z2X M))4[0#(,8_AW)GG^+VIVE^-]&OX+3S[RWMKNYM!>K:F7UN"GF,3DD@YQGOC%:EUX'T6[TO2M.DBF%KI MDJS6Z"4YW#NQ/)SSGGO6Q!JMC=)9O!GQ:I;F[M&=9XF.TIL&6//8=STH`1Y`8O\H3Z5 M%8^$-*T[Q3>^(X$E_M&\0QRLTA*[3M.`.WW%JYI&OZ5KT4DNE7\%VD3;7,39 MP<9_+T/0UEVWC73P-5?4Y(=/AL=2?3UDEER)2L2RD]!CY2W'/W>M`#['P1HE MA+KCI;O(-;9S?+)(2'#%B0/0?.U8^G_"3PQIFJQ7]LM\HBF6>.W-VQB#J05) M'5L$#J3[UT^G>)-'U>6*+3]1M[F26%ID6-LDHK!6/X$@'ZU%+XLT&&[L[675 M;5+B\(%O&7YDRQ48^I&!ZF@".R\):78>*KWQ)"LW]HWD?E2LTA*[?EX`[?<6 MGW'A?3;KQ9;>)94E.HVT'D1D/A0OS]1Z_.U5[SQUX9L6N4N-9M4>VF6"8;B2 MDA)`4X]P?I@YQ@UM6-]:ZE917EE.D]M*,QR(2%9!*A1RK(X!`88]F/!R.>EF#7344`>>K\%O!HNWF:TNFB8<6YNG\M3V/'S9^I-3_\` M"IO#?]B1Z4#?K%%)V`!VGH.%';^9KNZ*`,'PQX/TCPE;2Q:7"X: M8@S2RR%WD([DG\>F!R:WJ**`"BBB@#S34++5O`NN:KJ=C!-=^&-2+7%]'%(! M+8RL1YDZ@@EAM!.!^@49R9]4>2;3]575X1<2*+?2_$JQ_N[L,Q(L[F(#Y"3R M6(`&,C:I?#[0K^_GN=MS;"]<&^AMYBD5W@[OG7IDDO%2Z#X;TCPS9R6FCV2VL$DAE=0S-EL`9RQ)Z`#' M2M7I0`4444`> M+-9O8K8/;7/APV$3EU&Z8O(=F"<]&7GIS7:T4`>9Z5X;U6PM[?3K_0;F_M+R MRM([EX=2$(MV2%(GC=`XWJ-A;5VQGC'F.VN]8\)74(MS;W\]J6BB=U8PS8 MW)D@X)5P.AQQZ5LXI:`//;CPMJ+:#I*Q:?&;Z_ED36U,BC9#=?/=`'/.&"@; M?3BH-9TKQ7>>)M/C&F"32;'5X+F!HIX4C6!4V'Y3\Y<%V)YQA0`,UZ33)(DF MB>.1`Z.I5E89!!Z@T`<)X'TJ9_$&JZH]T9;*REN--TU`FU5B\WS'QZ@,%C!] M(L]ZL7VDZQ)/XDT^'3P\&H2B]ANVF41LRQQ+Y++G<-QBP3C&&]L'LK>WBM;> M.W@C6.&)0D<:`!54#```Z`"I*`.0TBQU74/&0\1ZCI?]EB+338B!YDE>1FD5 MRV4)&P;<#/)R3@5BR^%-8>_,OV,%/^$P75,^8G_'L(`N_K_>&,=?:O2<44`> M92^$_$0MM8>P"VE[)8V?KV.'P>3Y8'>KR^&I]+U&32TT6ZU M'1;E;=!/'J/E"W5$2+8\9<;@`F[<,DYQBN_HH`\ZDTCQ(USJAM-/E@TM'CNH M=/GNHW,]TMRLS-&^3L1E7A6(`+?='-=Y833W%C%+=6C6DSC+0,ZN8_8E>"?I 8D>YJS10`4444`%%%%`!1110`4444`?_9 ` end GRAPHIC 28 pr1021img000.jpg GRAPHIC begin 644 pr1021img000.jpg M_]C_X``02D9)1@`!`@```0`!``#_VP!#``@&!@<&!0@'!P<)"0@*#!0-#`L+ M#!D2$P\4'1H?'AT:'!P@)"XG("(L(QP<*#7J#A(6&AXB)BI*3E)66EYB9FJ*CI*6FIZBIJK*SM+6VM[BYNL+#Q,7& MQ\C)RM+3U-76U]C9VN'BX^3EYN?HZ>KQ\O/T]?;W^/GZ_\0`'P$``P$!`0$! M`0$!`0````````$"`P0%!@<("0H+_\0`M1$``@$"!`0#!`<%!`0``0)W``$" M`Q$$!2$Q!A)!40=A<1,B,H$(%$*1H;'!"2,S4O`58G+1"A8D-.$E\1<8&1HF M)R@I*C4V-S@Y.D-$149'2$E*4U155E=865IC9&5F9VAI:G-T=79W>'EZ@H.$ MA8:'B(F*DI.4E9:7F)F:HJ.DI::GJ*FJLK.TM;:WN+FZPL/$Q<;'R,G*TM/4 MU=;7V-G:XN/DY>;GZ.GJ\O/T]?;W^/GZ_]H`#`,!``(1`Q$`/P#W^BBL[6=> MTOP]9-=ZK?06L(!QYC@%R!G"CJQXZ#F@"IXK\46'A/0Y=2OB&(^6*`,`TSGH MHSU]3Z`$]JX#5O%/BC5I)=.@DM=,-Y;H]D4F_=WJ'&X077:8DX4;.!R>Q#M? MB\3^.IK/7M#TW[)8Z=')Y=IJJE'U#`E;NWN5 M9]4T^3&3YHX#Q``G=U.[K@5Z/H^M:=KVG1W^EW<5U;OCYHV!VD@':P_A8`C( M/(S6+IGA6:.XAN=2NA)>6 M/4>(2)X>\02"+RU(V6]\QX(7@*K*,<9Y]@*`/2****`"BBB@`HHHH`****`" MBBB@`HH)`ZFB@`HHHH`****`"BBB@`HHHH`****`"BBB@`HHHZT`%%(2%&20 M/K2T`8'B_P`2)X9T)[I8VFO9F%O96ZH6,T[`[%P.<9ZXYP#7-^$_!MGO1G;,DKK+#8R$B3RT7D*RDCZ9X`S6=XJGOI?B&\"PN]Y]D$.FJ^##: M1MDR7Y)X#(?EV\$@#GFI_#.LVFG+:31W!31&F^PP3>2?.UJ_?`><]3@E6Y/4 MY)(`%`'IMKOB;QU9^' MM0@T]+::^N_DFNHH$6![>22-7:&0@M&2,E3@D9'3@ MXK'\:Q:1+X1U$:W(D-BL+,9CC=&P!VLF?XP<;>^<5S6G?$#4;5-1_M?26N-. MTF=[2[UFSD789$QN8PMAE&""=NX`Y`SBFWRW/B<#Q%J>G2RZ+9_/I6DCYCJ$ MI(\J=\?=#;@H1A\N2S$#B@##T#XDZ_I5AITGB6VAELYHMD,,,;G49(U7(N70 ML08R%.3P2>1Q7KEG=P7]E!>6TBRV\\:RQ2+T96&01]0:\9U"TNWGU2&[N]FJ M7,)N=;U`_O%T>Q(W?9(R"=S?>^[C([=Z[3X6:A]I\+-:>=.ZV!,G('H<#/KEEY M&2:Q-=/BCX67=GK)\076N:--*EO=07SL\@)R24R<#Y5.#GJ1D&K,MW#X>_:& M>2_DVIJ]BD5NQZ!CM4#\6B([=15_XX74(LT@3]TV,')XSR.,YIUAXT\-ZI:75U9:Q:S16D;2 MSX;#1HHR6*GG;[XQ7F$6A0M\4/!6DZO913&#PW"DT$RAU\Q%E'(Z'!'O3?$^ MGV6F?$77+?1;>"W@?PO=/=Q0(%524?L..<1_G0!Z2_Q#\(1FV#>(+$?:%#)^ M\Z`]"W]S_@6,5K7^N:5IFG+J%]J%M;V;@%)I)0%?(R`I_B)`)`'7M7DNC:!H M+_`.?4;K3K(W9M+B47+Q+YGFAF"?-C/4**Y;5+W59#\.-.FC6>(6\4D%K.^( M9G\UEC#>VP(/HQ]30![MI_C+PYJEC^*K2? M$/PA%;V\S>(+'9/]P"3+=<9*CE1D$<@=*XA?"6LVUSXL\3:K8:9IRW.B7%O] MELFW;CM!W'@#^'\<)!Y93?$=V[IMQSFNVTSQIX;UG46T_3M9M+ MFZ&?W:/]['7:>C?AFO%VC34/"WPOM[M?/AEU!X71^0R&=5VGVQQ6QXVTVQTC MXR>#$TRT@LD=XMR6T8C!_>D=%`[$CZ4`>H:IXU\-:)>K9ZCK-K!7M[<3QW-Q=S!)H-_91M/`;)'/4>PJ]XA\.7OA7P1X0TO4+M;F= M-85SM)*Q[LG8">H&3Z=:`/6KKQCXLA;Q-LM`'K^E^(-(UO3WO]-U""XM8R0\J-PA`R0V>AP0>:S[7QYX5OM3&G6V MO6,ETS!402<.Q.`%;HQ)Z`$YKQ47-QI>D?$^UT]?+MDOE@$48PL<1GD0@`=! MMPOTK:T_PEK_`(F\+>&(;/2-&TRVMC!<+J<$O[]@J\DA5!W$X8C/WEZ\9H`] M2E\<^%H)[V";7;*.6R)6=&DPRL."`.YR",#)SQUK@_$^JZIXA^)>AZ/HGB.Z ML-+O],6Z66U_B),IWGB/ M7_$\UZ]UO4FK'Q.8/\5/`N M"#_I,)X_Z^$Y_G0!Z+<^-_#%G>W=G?2;^&[C0X?RSRI[9!Y'XUYM#H^FZG^T%J\-_86]S$FG+,L">37(:9/-I'B#XFQZ:IA2.VN52.$[!&!-M!4#IM5FQCI0!Z?XU\=>&H_ M#VM:6FNVW]H/93QQQPR%CYFQ@%W+P&SQC.:7P'K-AI'PKT>]U6^AM8!&P\V= MPN3O?@9ZG@\#DUS?A_1]`_X49?WEK:VD]RVFW+SSM$"ZS!&R,GD;3C'X$=:@ M'AC4O%'P/\/0:4(9+NTE^U)#+C$F#(-O/RY^;^+@\@]:`.OU-K#XA:4LFAZG M%=6\)='"$C#G:5)!QC`!'T8XKKK*)[>Q@ADP'1`"`VX#V!P,@>N!7#?#3Q7! MJTNI:++HT&E:M8./MD=NJA)7'R,YV@`'*XQD\`8)%>A8H`\Y^*'A\RPP:[:V M5Y=.FVVU*&VEVF:Q!:1D(R#@N%&1R`Q[5R^B:G`KL!M)!^8]#C[K>W5Q/BWPC;);?V[H-G;VNMV$YOT>&$*UT5!+1 M,1R0X)'UH`W?#?AVV\.:>T$1,MSLGVEE8QIN7^'.3AOEZUT?AK7[7Q/X?L]6M"`D\8+Q MYR8G_B0].0^/F;\6R?QK5KS_1O$Q\-S6&E:M]1?['UG! MVRJV!'#)@<.%.=YP&`R<'-6]5\J2?,LLCYR%!R,'`)'H%!Z_P M9H,^AZ,S7\IEU6^E-Y?R$\&9P-RKC@*N`!CCC/>LO0?`6(XK8>B*.N"6YXZ]`>:[:@##\2^$M'\6V:6VKVOFK&Q:-T+3K:Y MANKR"S5GNVC8/*X4$@1MP,^N?:LRZ\,M(MM>^.>CZ=#/$UQ91RR7=QIMSY]W]\1Z)I^H6ME=ZC:PWEV!Y M$;.-S@G`Q[$Y`I=7U*ZL[BSM;.RAN9;KS`!-.8E&U=V,A6Z]*`/,/A]\-M#\ M0>"=*OM2DOIHI"\CV7VDB`N&9=VT<@X&.#7HNO\`@S0_$FDP:;J-IF"W_P"/ M?RG*&'Y=HVX[8['(X''%2:3KRZA::=<2+!:BXM))Y(&DW-&4*AL'`!52Q!;C ML>]4[CQOHT]A)+I.JV5S+%-$LB>8"51I41FQP<`/][I0!5T7X::%H=M>Q0-> MSR7=J]F\]Q.7986'**.`!T[=JOZ5X)TC1O"MYX=M!.+&[6192TF7/F+M;!QQ MQ[4LOCOPQ%IBZD=8MFLFNA9^PVHFC?`19Z'%;:);A;DQZ-,9[0&7G>7#Y;U MY'2K>J^#=)UK7]/UN\25KS3]I@*2%5!#;AD=^:AM_&VG3^)M7T8_(-,@\Z2X M))4[0#(,8_AW)GG^+VIVE^-]&OX+3S[RWMKNYM!>K:F7UN"GF,3DD@YQGOC%:EUX'T6[TO2M.DBF%KI MDJS6Z"4YW#NQ/)SSGGO6Q!JMC=)9O!GQ:I;F[M&=9XF.TIL&6//8=STH`1Y`8O\H3Z5 M%8^$-*T[Q3>^(X$E_M&\0QRLTA*[3M.`.WW%JYI&OZ5KT4DNE7\%VD3;7,39 MP<9_+T/0UEVWC73P-5?4Y(=/AL=2?3UDEER)2L2RD]!CY2W'/W>M`#['P1HE MA+KCI;O(-;9S?+)(2'#%B0/0?.U8^G_"3PQIFJQ7]LM\HBF6>.W-VQB#J05) M'5L$#J3[UT^G>)-'U>6*+3]1M[F26%ID6-LDHK!6/X$@'ZU%+XLT&&[L[675 M;5+B\(%O&7YDRQ48^I&!ZF@".R\):78>*KWQ)"LW]HWD?E2LTA*[?EX`[?<6 MGW'A?3;KQ9;>)94E.HVT'D1D/A0OS]1Z_.U5[SQUX9L6N4N-9M4>VF6"8;B2 MDA)`4X]P?I@YQ@UM6-]:ZE917EE.D]M*,QR(2%9!*A1RK(X!`88]F/!R.>EF#7344`>>K\%O!HNWF:TNFB8<6YNG\M3V/'S9^I-3_\` M"IO#?]B1Z4#?K%%)V`!VGH.%';^9KNZ*`,'PQX/TCPE;2Q:7"X: M8@S2RR%WD([DG\>F!R:WJ**`"BBB@#S34++5O`NN:KJ=C!-=^&-2+7%]'%(! M+8RL1YDZ@@EAM!.!^@49R9]4>2;3]575X1<2*+?2_$JQ_N[L,Q(L[F(#Y"3R M6(`&,C:I?#[0K^_GN=MS;"]<&^AMYBD5W@[OG7IDDO%2Z#X;TCPS9R6FCV2VL$DAE=0S-EL`9RQ)Z`#' M2M7I0`4444`> M+-9O8K8/;7/APV$3EU&Z8O(=F"<]&7GIS7:T4`>9Z5X;U6PM[?3K_0;F_M+R MRM([EX=2$(MV2%(GC=`XWJ-A;5VQGC'F.VN]8\)74(MS;W\]J6BB=U8PS8 MW)D@X)5P.AQQZ5LXI:`//;CPMJ+:#I*Q:?&;Z_ED36U,BC9#=?/=`'/.&"@; M?3BH-9TKQ7>>)M/C&F"32;'5X+F!HIX4C6!4V'Y3\Y<%V)YQA0`,UZ33)(DF MB>.1`Z.I5E89!!Z@T`<)X'TJ9_$&JZH]T9;*REN--TU`FU5B\WS'QZ@,%C!] M(L]ZL7VDZQ)/XDT^'3P\&H2B]ANVF41LRQQ+Y++G<-QBP3C&&]L'LK>WBM;> M.W@C6.&)0D<:`!54#```Z`"I*`.0TBQU74/&0\1ZCI?]EB+338B!YDE>1FD5 MRV4)&P;<#/)R3@5BR^%-8>_,OV,%/^$P75,^8G_'L(`N_K_>&,=?:O2<44`> M92^$_$0MM8>P"VE[)8V?KV.'P>3Y8'>KR^&I]+U&32TT6ZU M'1;E;=!/'J/E"W5$2+8\9<;@`F[<,DYQBN_HH`\ZDTCQ(USJAM-/E@TM'CNH M=/GNHW,]TMRLS-&^3L1E7A6(`+?='-=Y833W%C%+=6C6DSC+0,ZN8_8E>"?I 8D>YJS10`4444`%%%%`!1110`4444`?_9 ` end GRAPHIC 29 pr1021img001.jpg GRAPHIC begin 644 pr1021img001.jpg M_]C_X``02D9)1@`!`0```0`!``#_VP!#``@&!@<&!0@'!P<)"0@*#!0-#`L+ M#!D2$P\4'1H?'AT:'!P@)"XG("(L(QP<*#7J#A(6&AXB)BI*3E)66EYB9FJ*CI*6FIZBIJK*SM+6VM[BYNL+#Q,7& MQ\C)RM+3U-76U]C9VN'BX^3EYN?HZ>KQ\O/T]?;W^/GZ_\0`'P$``P$!`0$! M`0$!`0````````$"`P0%!@<("0H+_\0`M1$``@$"!`0#!`<%!`0``0)W``$" M`Q$$!2$Q!A)!40=A<1,B,H$(%$*1H;'!"2,S4O`58G+1"A8D-.$E\1<8&1HF M)R@I*C4V-S@Y.D-$149'2$E*4U155E=865IC9&5F9VAI:G-T=79W>'EZ@H.$ MA8:'B(F*DI.4E9:7F)F:HJ.DI::GJ*FJLK.TM;:WN+FZPL/$Q<;'R,G*TM/4 MU=;7V-G:XN/DY>;GZ.GJ\O/T]?;W^/GZ_]H`#`,!``(1`Q$`/P#=_P"%'>"_ M^>%[_P"!)_PH_P"%'>"_^>%[_P"!)_PKTBJNHS&WL)95E$17&&./4#'/`STR M>!F@#@?^%'>"_P#GA>_^!)_PH_X4=X+_`.>%[_X$G_"M^/6]2ELI;E/)/E[6 M=2A&W+.NW'7HJG!Y^;TKHH+C[1;QS1(2CJ&&2`>A_P#K?G0!Y]_PH[P7_P`\ M+W_P)/\`A1_PH[P7_P`\+W_P)/\`A7HI9^<1Y_X%]?\`ZWYT%GYQ'G_@7U_^ MM^=`'G7_``H[P7_SPO?_``)/^%'_``H[P7_SPO?_``)/^%>BEGYQ'G_@7U_^ MM^=!9^<1Y_X%]?\`ZWYT`>=?\*.\%_\`/"]_\"3_`(4?\*.\%_\`/"]_\"3_ M`(5Z*6?G$>?^!?7_`.M^=!9^<1Y_X%]?_K?G0!YU_P`*.\%_\\+W_P`"3_A1 M_P`*.\%_\\+W_P`"3_A7HI9^<1Y_X%]?_K?G06?G$>?^!?7_`.M^=`'G7_"C MO!?_`#PO?_`D_P"%'_"CO!?_`#PO?_`D_P"%>BEGYQ'G_@7U_P#K?G06?G$> M?^!?7_ZWYT`>=?\`"CO!?_/"]_\``D_X4?\`"CO!?_/"]_\``D_X5Z*6?G$> M?^!?7_ZWYT%GYQ'G_@7U_P#K?G0!YU_PH[P7_P`\+W_P)/\`A1_PH[P7_P`\ M+W_P)/\`A7HI9^<1Y_X%]?\`ZWYT%GYQ'G_@7U_^M^=`'G7_``H[P7_SPO?_ M``)/^%'_``H[P7_SPO?_``)/^%>BEGYQ'G_@7U_^M^=!9^<1Y_X%]?\`ZWYT M`>=?\*.\%_\`/"]_\"3_`(4?\*.\%_\`/"]_\"3_`(5Z*6?G$>?^!?7_`.M^ M=!9^<1Y_X%]?_K?G0!YU_P`*.\%_\\+W_P`"3_A1_P`*.\%_\\+W_P`"3_A7 MHI9^<1Y_X%]?_K?G06?G$>?^!?7_`.M^=`'G7_"CO!?_`#PO?_`D_P"%'_"C MO!?_`#PO?_`D_P"%>BEGYQ'G_@7U_P#K?G06?G$>?^!?7_ZWYT`>=?\`"CO! M?_/"]_\``D_X4?\`"CO!?_/"]_\``D_X5Z*6?G$>?^!?7_ZWYT%GYQ'G_@7U M_P#K?G0!YU_PH[P7_P`\+W_P)/\`A1_PH[P7_P`\+W_P)/\`A7HI9^<1Y_X% M]?\`ZWYT%GYQ'G_@7U_^M^=`'G7_``H[P7_SPO?_``)/^%'_``H[P7_SPO?_ M``)/^%>BEGYQ'G_@7U_^M^=!9^<1Y_X%]?\`ZWYT`>=?\*.\%_\`/"]_\"3_ M`(4?\*.\%_\`/"]_\"3_`(5Z*6?G$>?^!?7_`.M^=!9^<1Y_X%]?_K?G0!YU M_P`*.\%_\\+W_P`"3_A1_P`*.\%_\\+W_P`"3_A7HI9^<1Y_X%]?_K?G06?G M$>?^!?7_`.M^=`'G7_"CO!?_`#PO?_`D_P"%'_"CO!?_`#PO?_`D_P"%>BEG MYQ'G_@7U_P#K?G06?G$>?^!?7_ZWYT`>=?\`"CO!?_/"]_\``D_X4?\`"CO! M?_/"]_\``D_X5Z*6?G$>?^!?7_ZWYT%GYQ'G_@7U_P#K?G0!YU_PH[P7_P`\ M+W_P)/\`A1_PH[P7_P`\+W_P)/\`A7HI9^<1Y_X%]?\`ZWYT%GYQ'G_@7U_^ MM^=`'G7_``H[P7_SPO?_``)/^%'_``H[P7_SPO?_``)/^%>BEGYQ'G_@7U_^ MM^=!9^<1Y_X%]?\`ZWYT`>=?\*.\%_\`/"]_\"3_`(4?\*.\%_\`/"]_\"3_ M`(5Z*6?G$>?^!?7_`.M^=!9^<1Y_X%]?_K?G0!YU_P`*.\%_\\+W_P`"3_A1 M_P`*.\%_\\+W_P`"3_A7HI9^<1Y_X%]?_K?G06?G$>?^!?7_`.M^=`'G7_"C MO!?_`#PO?_`D_P"%'_"CO!?_`#PO?_`D_P"%>BEGYQ'G_@7U_P#K?G06?G$> M?^!?7_ZWYT`>=?\`"CO!?_/"]_\``D_X4?\`"CO!?_/"]_\``D_X5Z*6?G$> M?^!?7_ZWYT%GYQ'G_@7U_P#K?G0!YU_PH[P7_P`\+W_P)/\`A1_PH[P7_P`\ M+W_P)/\`A7HI9^<1Y_X%]?\`ZWYT%GYQ'G_@7U_^M^=`'G7_``H[P7_SPO?_ M``)/^%'_``H[P7_SPO?_``)/^%>BEGYQ'G_@7U_^M^=/H`\W_P"%'>"_^>%[ M_P"!)_PHKTBB@`J*YG^S6[S%&<+C*K@'KUY(&!UZU+5>]MX;JT>*X)$7#,0V MW&"#U].*`(=/U2'4M_E1RIM`;]X`,@EE]?5&'/I5QI(T.&=5(&>3CU_P/Y55 ML[:T@EG-N^Z0MB3Y]Q!R6Q[..H7+'_=-`&\9HAG,B#'7YA[_`.!_(T&:(9S(@QU^8>_^!_(UQ6E^.;^] M@\^YT?[/"LJQ2.6;*.8UD(VD!B5#X.!\V"17:03QW-O%<0N'BE0.C#HRD9!H M`4S1#.9$&.OS#W_P/Y&@S1#.9$&.OS#W_P`#^1I]%`##-$,YD08Z_,/?_`_D M:#-$,YD08Z_,/?\`P/Y&N`M?$VMMX2O9[J5HK]+R*-91"IQ$3`)G4`$$*TD@ M!(R`!NY!J/1_$'BO49[@OL0P_97:&6'9G<"'C'RD@D[<9/?.0.*`/0S-$,YD M08Z_,/?_``/Y&@S1#.9$&.OS#W_P/Y&J6BZB-4TF"Z"3H6&TB=`C$C@D@$@9 M(K0H`89HAG,B#'7YA[_X'\C09HAG,B#'7YA[_P"!_(T^L6P\10ZEJ>J6%O;R M>;8':=S*/-/(XYZ9&,T`:YFB&8R`C!Y'R%L^A!KI-.U*#4[_^!_(T&:(9S(@QU^8>_\`@?R-5CJEH-6_LO>YO/*$Q01,0$)(!+8VCE3P M3GBJ-QXMT.UNGMIK\"6.;R'`C=@K_+P2!@#YT&>@+`9S0!KF:(9S(@QU^8>_ M^!_(T&:(9S(@QU^8>_\`@?R-5[#4[35(C+9RF1!P3L9<')&#D#!XZ=>GJ*MT M`,,T0SF1!CK\P]_\#^1H,T0SF1!CK\P]_P#`_D:?10`PS1#.9$&.OS#W_P`# M^1H,T0SF1!CK\P]_\#^1I]%`##-$,YD08Z_,/?\`P/Y&@S1#.9$&.OS#W_P/ MY>4`,,T0SF1!CK\P]_\#^1H,T0SF1!CK\P]_\``_D:AOK^VTVV^T73LL>X M(-J,Y))P``H)//M5:_U_2]+ECCOKL0-)&T@WHV`H!)).,+P#UQG!Q0!?,T0S MF1!CK\P]_P#`_D:#-$,YD08Z_,/?_`_D:S[/Q#I6H2+';78>1B0$*,K9'48( M'([CJ.^*TZ`&&:(9S(@QU^8>_P#@?R-!FB&@!S@ MG@\>U-35M-D8JFH6C$,ZD+,IP5&6'7J!U]*`+)FB&_^!_(T&:(9S(@QU^8>_\`@?R-/HH` M89HAG,B#'7YA[_X'\C09HAG,B#'7YA[_`.!_(T^B@!AFB&_P#@?R-!FB&ZW%XRU6*07$FG"'_1L0,45R(@@!V<\F0DAB!WQBLS0Y?%=]9Z<+BYO( M7DBG69Y[;;\X"%6.5!7DLH'MD9XH`[PS1#.9$&.OS#W_`,#^1H,T0SF1!CK\ MP]_\#^1K&\.WNH3K/;ZC!.)85C/VB2/8LVY>PQP1@9&3@D_2MR@!AFB&7VHSQ>4/M$]E.FZ1N&AD+ M.3_P$X`Z9]*`.F:>%<[I8QC._P#@?R-RFTGR82JP M)<+-*9`512IVG:/F`X!P,[FZ<4`=:9HAG,B#'7YA[_X'\C3Z**`"BBB@`JMJ M%H+[3;FT(7]]$R#<,@$C@U9HH`S["PDM;JZE=E*R'Y0N>F^1^?\`OYC\/?B\ MT88Y);ICAB/7_'_.*S]-DNWO+P7'F^6&^3>F!]]Q\O'(VB/_`/7FI;@:BL[& MU^S-&0.)68$'\!]*`.*^)'Q!A\$26=K-H[:C'?1R%@;HQ@`<$$;6SG;$R"3_A#U\P$,&%_R"`R@@^7Q@,P'H#7:>//AS?>.[BRFN+RVM3:HZJ(R MQW;B#SD>U`*2V0QP( M\]`'>F)3GE^?\`;/O[^_\` M+T%<1\4_$U_X/\+0ZCIGEF>2[6$^=N8;2KD\`CGC_.!74$:R9`VVQP`1MWO@ MY[]/;]:YSQQX0U+QMH<>F7$]I;(EPLX>,L22%88Y'^U0!XR?CEXN.?EL.?\` MID_O_M^_\O04'XY>+CGY;#G_`*9/[_[?O_+T%=+_`,,]S?\`093_`+Y/^%'_ M``SW-_T&4_[Y/^%`&E\+?B/KOC+Q3/IVJ"V$"VCS#R593N#*.NX\?.?T]!7L M)B4YY?G_`&S[^_O_`"]!7F/@CX67O@G7)=3M[^WN7>W:#9)D``LISP/]D?G7 M?L-98J0MB-IS@._/!]J`$US4K70=%N]5NQ.UO;(9)!$Q+$>P)'KZ^GH*\LB^ M+O@&"_N+Z'3MH#,`W49ZUL^%_B;X,O\`7(M,TG3]4@N+^01@NH"`_-C_`):':/F;H.IK MF_\`AGN;_H,I_P!\G_"M/P]\%+GP]X@LM6BU2&9[63S%C8$!NO7B@#V`Q*<\ MOS_MGW]_?^7H*1HTP22X'.?G/O[^_P#+T%49!K+QLH6Q4D$`AWR/TH?^V&1E MV6'((^^_^%`'$WGBKP+=Z]'JX\61Q3QQ&-`@Z$AQG)7/21N,XX'I69+>?#:2 M]-R/%.W=>+>,AD9LL"K8R1D`L@)Y_D,8G_#/@KPU?V?9E<-_;,?!S]T_X5[+NUG_GG8?]]O\`X4`73$ISR_/^V??W M]_Y>@K`\16EY/?Z0MH;]8_M(:>6WG*JB!@<,NX;L\KW`!8X)"UH(-92-5*V+ M$#&XN^3[]*X[4O!WC.]U*XNH/&,]I%+(62"-CMC!_A''2@!NOV?B6YOM2ET] M-46":-)$07#(5/[K")MEP,YE+8`(V]2#6QIEEKNGZC"MPUS?0SDF:1[@@0LP M!(`SR!V(QT(QR#7/_P#"">./^A\N_P#OK_[&C_A!/''_`$/EW_WU_P#8T`>E M&)3GE^?]L^_O[_R]!08E.>7Y_P!L^_O[_P`O05D:=;Z]9:;;VL\]I=RQ1A6G ME=MTA'\1XZU84:RN[Y;$Y)(R[\?I0!A>,]1\,O:R:-J^N6EC-(%DV7!#\9/. MUN/7Z<8Z"L&_U;P=J$<4,OC>W\B*VEMT4R@E=Z%-X.?O@$X;'<^M0>-?A1>> M-->&JSW\%LXA6+8F2,`DYY'O7._\,]S?]!E/^^3_`(4`=,E]X%BT^&WA\7VE MO-&'Q<6\@C;YG+<8Z!0Q51V![UZ!IFI:9KEH;O3+U+NWW%#)#*2-W<=?]K^7 MH*\9_P"&>YO^@RG_`'R?\*]#\%>%-2\%Z"=*MYK2Y0S-+OD9@.A`(/!X9:^%M-MXKMO[0,YSQD>]<;_`,,]S?\`093_`+Y/^%'_``SW-_T&4_[Y/^%` M'LNF-'+91Q-J"7EQ&@$TD4O4\\X!XZG_`"!5XQ*<\OS_`+9]_?W_`)>@KSWP M%\/+_P`!O?M;7=M=?;!&&\PLNW9NQT'^U79D:R9`P6QP`1C>^#^GM^M`%\Q* M<\OS_MGW]_?^7H*#$ISR_/\`MGW]_?\`EZ"N5\6^*K[P?H3ZM>VMO-"LBQ[( M78MENG7`K@/^&@[7_H#S?F/\:`/:3$ISR_/^V??W]_Y>@H,2G/+\_P"V??W] M_P"7H*\6_P"&@[7_`*`\WYC_`!K=\)?%L^,-=72;+3?)F:-I`\S?+A?IDT`> MF&)3GE^?]L^_O[_R]!61XKN9M-\(ZS?VDC)@KM?^&>YO^@RG M_?)_PH_X9[F_Z#*?]\G_``H`P?"WQ3\8:IXMTBPN]4#VUS>Q12J(47*L^",@ M9'#'I[>@KZ1,2G/+\_[9]_?W_EZ"O&M&^!UQHVN6.IQZK%(]I<).J,"`Q5@< M'CVKU:0:R\;*%L5)!`8.^1^E`%\Q*<\OS_MGW]_?^7H*^+;^^O!J-T!=3X\U M_P#EH?4U]B[M9_YYV'_?;_X5XY/\`)I[B68ZQ&"[EL;3QDY]*`/%?M]Y_P`_ M<_\`W\-'V^\_Y^Y_^_AKV?\`X9[F_P"@RG_?)_PH_P"&>YO^@RG_`'R?\*`/ M:["-6TZV)+Y,*Y^<^GU]_P"7H*MUEP1ZQ!;QPA+$B-`H)=^<#'I6A`LBP()6 M!DQ\Q'3/M0!)1110`54U"^2QM)I<"22.)I%AW@,X49.,U;J&Z>!+63[3@PL- MC`@G=GC&!USG&*`(++4/M=Q<1&+9Y1X.[.X;W3TXY0^O45;:0*<$-TSPI/K_ M`(?YS52QDL)7F>R:-F8[G9.^2>1[9W=.,[N^:NT`,,JC/#\?[!]_;V_EZB@R MJ,\/Q_L'W]O;^7J*?10`PRJ,\/Q_L'W]O;^7J*#*HSP_'^P??V]OY>HI]%`# M#*HSP_'^P??V]OY>HH,JC/#\?[!]_;V_EZBGT4`,,JC/#\?[!]_;V_EZB@RJ M,\/Q_L'W]O;^7J*?10`PRJ,\/Q_L'W]O;^7J*#*HSP_'^P??V]OY>HI]%`## M*HSP_'^P??V]OY>HH,JC/#\?[!]_;V_EZBGT4`,,JC/#\?[!]_;V_EZB@RJ, M\/Q_L'W]O;^7J*?10`PRJ,\/Q_L'W]O;^7J*#*HSP_'^P??V]OY>HI]%`##* MHSP_'^P??V]OY>HH,JC/#\?[!]_;V_EZBGT4`,,JC/#\?[!]_;V_EZB@RJ,\ M/Q_L'W]O;^7J*?10`PRJ,\/Q_L'W]O;^7J*#*HSP_'^P??V]OY>HI]%`##*H MSP_'^P??V]OY>HH,JC/#\?[!]_;V_EZBGT4`,,JC/#\?[!]_;V_EZB@RJ,\/ MQ_L'W]O;^7J*?10`PRJ,\/Q_L'W]O;^7J*#*HSP_'^P??V]OY>HI]%`##*HS MP_'^P??V]OY>HH,JC/#\?[!]_;V_EZBGT4`,,JC/#\?[!]_;V_EZB@RJ,\/Q M_L'W]O;^7J*?10`PRJ,\/Q_L'W]O;^7J*#*HSP_'^P??V]OY>HI]%`##*HSP M_'^P??V]OY>HH,JC/#\?[!]_;V_EZBGT4`>:_'!P?AQ,`&_X^HNJD=S_`(?Y MS7S)7T[\C?!!@OQ'A)S_P`>LW0$]J\YKT?X'?\` M)2(?^O67^0H`^FS*HSP_'^P??V]OY>HH,JC/#\?[!]_;V_EZBGT4`,,JC/#\ M?[!]_;V_EZB@RJ,\/Q_L'W]O;^7J*?10`PRJ,\/Q_L'W]O;^7J*#*HSP_'^P M??V]OY>HI]%`##*HSP_'^P??V]OY>HH,JC/#\?[!]_;V_EZBGT4`,,JC/#\? M[!]_;V_EZB@RJ,\/Q_L'W]O;^7J*?10`PRJ,\/Q_L'W]O;^7J*?110`4444` M%5;ZT>[@98IWAD(P&!;&,C(P".HR,]1G@U:JEJ:3R6CK"I8$=$)#9R,'[R\# MJ1D9'%`#=.TP:>\K"16#C"JJ;0HW.V.I[N?P`JZT:.WR'W]_I^1]>`B7G#I[?(??W^GY'UX``PQG M.4'/7]?\3^=!AC.OZ_XG\Z")><.GM\A]_?Z?D?7@(EYPZ>WR'W]_I^1] M>``,,9SE!SU_7_$_G088SG*#GK^O^)_.@B7G#I[?(??W^GY'UX")><.GM\A] M_?Z?D?7@`##&WR'W]_I^1]>`B7G M#I[?(??W^GY'UX``PQG.4'/7]?\`$_G088SG*#GK^O\`B?SH(EYPZ>WR'W]_ MI^1]>`B7G#I[?(??W^GY'UX``PQG.4'/7]?\3^=!AC.OZ_XG\Z")><.G MM\A]_?Z?D?7@(EYPZ>WR'W]_I^1]>``,,9SE!SU_7_$_G088SG*#GK^O^)_. M@B7G#I[?(??W^GY'UX")><.GM\A]_?Z?D?7@`##&WR'W]_I^1]>`B7G#I[?(??W^GY'UX``PQG.4'/7]?\`$_G0 M88SG*#GK^O\`B?SH(EYPZ>WR'W]_I^1]>`B7G#I[?(??W^GY'UX``PQG.4'/ M7]?\3^=!AC.OZ_XG\Z")><.GM\A]_?Z?D?7@(EYPZ>WR'W]_I^1]>``, M,9SE!SU_7_$_G088SG*#GK^O^)_.@B7G#I[?(??W^GY'UX")><.GM\A]_?Z? MD?7@`##&WR'W]_I^1]>`B7G#I[? M(??W^GY'UX``PQG.4'/7]?\`$_G088SG*#GK^O\`B?SH(EYPZ>WR'W]_I^1] M>`B7G#I[?(??W^GY'UX``PQG.4'/7]?\3^=!AC.OZ_XG\Z")><.GM\A] M_?Z?D?7@(EYPZ>WR'W]_I^1]>``,,9SE!SU_7_$_G088SG*#GK^O^)_.@B7G M#I[?(??W^GY'UX")><.GM\A]_?Z?D?7@`##&WR'W]_I^1]>`B7G#I[?(??W^GY'UX``PQG.4'/7]?\`$_G088SG M*#GK^O\`B?SH(EYPZ>WR'W]_I^1]>`B7G#I[?(??W^GY'UX``PQG.4'/7]?\ M3^=!AC.OZ_XG\Z")><.GM\A]_?Z?D?7@(EYPZ>WR'W]_I^1]>`#SCXX1 MH/AQ,0H!^U1?S/\`B:^9*^F_C@'_`.%<3992/M471?<^_P!*^9*`"O1O@@JO M\1X0P!'V6;K]*\YKT;X(;C\1X=I`/V6;J,]J`/IPPQG.4'/7]?\`$_G088SG M*#GK^O\`B?SH(EYPZ>WR'W]_I^1]>`B7G#I[?(??W^GY'UX``PQG.4'/7]?\ M3^=!AC.OZ_XG\Z")><.GM\A]_?Z?D?7@(EYPZ>WR'W]_I^1]>``,,9SE M!SU_7_$_G088SG*#GK^O^)_.@B7G#I[?(??W^GY'UX")><.GM\A]_?Z?D?7@ M`##&WR'W]_I^1]>`B7G#I[?(??W M^GY'UX``PQG.4'/7]?\`$_G088SG*#GK^O\`B?SH(EYPZ>WR'W]_I^1]>`B7 MG#I[?(??W^GY'UX``PQG.4'/7]?\3^=/IA$O.'3V^0^_O]/R/KP^@`HHHH`* MHZKJ!T^QFE2&2654)15C9AGH,E0<#)Y]LU>JO>W<-C:/<3G$:D`].Y`'7W(H M`IZ1J_O[?K56RN;6>6=;= M-C*H_B'Y_Y]#1O4?Q#\_P#/H:`$+L,_NG/XCGK[^WZCWP%V&?W3 MG\1SU]_;]1[X7>H_B'Y_Y]#1O4?Q#\_\^AH`0NPS^Z<_B.>OO[?J/?`789_= M.?Q'/7W]OU'OA=ZC^(?G_GT-&]1_$/S_`,^AH`0NPS^Z<_B.>OO[?J/?`789 M_=.?Q'/7W]OU'OA=ZC^(?G_GT-&]1_$/S_SZ&@!"[#/[IS^(YZ^_M^H]\!=A MG]TY_$<]??V_4>^%WJ/XA^?^?0T;U'\0_/\`SZ&@!"[#/[IS^(YZ^_M^H]\! M=AG]TY_$<]??V_4>^%WJ/XA^?^?0T;U'\0_/_/H:`$+L,_NG/XCGK[^WZCWP M%V&?W3G\1SU]_;]1[X7>H_B'Y_Y]#1O4?Q#\_P#/H:`$+L,_NG/XCGK[^WZC MWP%V&?W3G\1SU]_;]1[X7>H_B'Y_Y]#1O4?Q#\_\^AH`0NPS^Z<_B.>OO[?J M/?`789_=.?Q'/7W]OU'OA=ZC^(?G_GT-&]1_$/S_`,^AH`0NPS^Z<_B.>OO[ M?J/?`789_=.?Q'/7W]OU'OA=ZC^(?G_GT-&]1_$/S_SZ&@!"[#/[IS^(YZ^_ MM^H]\!=AG]TY_$<]??V_4>^%WJ/XA^?^?0T;U'\0_/\`SZ&@!"[#/[IS^(YZ M^_M^H]\!=AG]TY_$<]??V_4>^%WJ/XA^?^?0T;U'\0_/_/H:`$+L,_NG/XCG MK[^WZCWP%V&?W3G\1SU]_;]1[X7>H_B'Y_Y]#1O4?Q#\_P#/H:`$+L,_NG/X MCGK[^WZCWP%V&?W3G\1SU]_;]1[X7>H_B'Y_Y]#1O4?Q#\_\^AH`0NPS^Z<_ MB.>OO[?J/?`789_=.?Q'/7W]OU'OA=ZC^(?G_GT-&]1_$/S_`,^AH`0NPS^Z M<_B.>OO[?J/?`789_=.?Q'/7W]OU'OA=ZC^(?G_GT-&]1_$/S_SZ&@!"[#/[ MIS^(YZ^_M^H]\!=AG]TY_$<]??V_4>^%WJ/XA^?^?0T;U'\0_/\`SZ&@!"[# M/[IS^(YZ^_M^H]\!=AG]TY_$<]??V_4>^%WJ/XA^?^?0T;U'\0_/_/H:`.4^ M(7AF[\8>%9-)M76"5IDD#R_=PI/H?I^8]\>2']G_`%T9_P")I8G\&YZ_X?J/ M?'T!=>:\.+>>.-\@DNNX$=QP1CH>>U>?:9X5UFQU73KT10Q1V\TLA@\\-Y:E M#\BGCJQ(SCD`%N0<@'`']G_71G_B:6)_!N>O^'ZCWQU/P^^%&J^#O%2:M=7E MO<1)"\>R($,21QU^GZCWQJW7A/6GUJ\O42`[[M)HRTR,I(>8[W5E.0%=%[-\ MG!X%=+HVE7NBZCY,+QOIA4C=,^95`W$=,#J2>G0G)R.0#HB[#/[IS^(YZ^_M M^H]\!=AG]TY_$<]??V_4>^%WJ/XA^?\`GT-&]1_$/S_SZ&@!"[#/[IS^(YZ^ M_M^H]\!=AG]TY_$<]??V_4>^%WJ/XA^?^?0T;U'\0_/_`#Z&@!"[#/[IS^(Y MZ^_M^H]\!=AG]TY_$<]??V_4>^%WJ/XA^?\`GT-&]1_$/S_SZ&@!"[#/[IS^ M(YZ^_M^H]\!=AG]TY_$<]??V_4>^%WJ/XA^?^?0T;U'\0_/_`#Z&@!"[#/[I MS^(YZ^_M^H]\!=AG]TY_$<]??V_4>^%WJ/XA^?\`GT-&]1_$/S_SZ&@!"[#/ M[IS^(YZ^_M^H]\/IN]1_$/S_`,^AIU`!1110`5![T62\N9I7NUQ(=H'E'*QE2I4'=C^(G. M.OKQ@`NP7MC=.$AFB=V4N%!Y*C&3CT^8<^_O5G8I_A'Y?Y]36=IVD?8'CD:? MS&1"APFT'B-1W/:(?B3TZ5IT`-V*?X1^7^?4T;%/\(_+_/J:=10!5GO+.VD\ MN:1% MW4&+9E&A^]M9G&2&Z M[F)].!P<4`;FQ3_"/R_SZFC8I_A'Y?Y]33J*`&[%/\(_+_/J:BGGMK8H)W1/ M,.U<]R>/Z_K[U/5'4K!M0CCB,P2$-F1"F=_ISD8QU[\@4`-.K:9LW&XCP5W= M.V=OIZY%7@J,H("D'G([_P")I9MJH, M`G&>2<#\R?UJ!=1T^20(L\3,QP,&&;R6;'S[2> M,C(X(/(R,@@C.16.?#.Z8O\`:]BD;=L4>W:OF^;@'/!W<9].W>@#;AD@N8A+ M"R21MD!EY!Y(/]:?L4_PC\O\^IJ#3[,6%FMNLA<*SL&*@?>8MC`XXSBK-`#= MBG^$?E_GU-))Y4<;22;%102S-P`.Y/ZT^F2J[PNL;A'92%8KG:>QQWH`IMJN MF@,6N(Q@$MDXZ_7O^M8C>&7)W"]57PY MSY).7=0K,3C)/?TH`M[%/\(_+_ M`#ZFC8I_A'Y?Y]33J*`&[%/\(_+_`#ZFJ;:GIRE@UQ$""P.?]GK_`#Z^]7JP M;GP[)=K,);U':=F>0!-N6;;GN>!MX';<>3FM6@!NQ3 M_"/R_P`^IHV*?X1^7^?4TZB@"G-?V$$K1RS1JZ_>!'MD_D#D^@.3P:$O[&61 M(TD1FD8JN%."<;L9QZ9/N#FJ=_HLE_<2R/=*`05C!B),:E"C#.['.XG./3.0 M!4NGZ1]AD1C/Y@0$*-F/X40'J>0(^O\`M'I0!H[%/\(_+_/J:-BG^$?E_GU- M.HH`;L4_PC\O\^IJ"XN[.V<)/(B,P+8([8)_^*^O-6:SM1TV2_FC;[0J)&,J MAC)P_9LY'TQZ$^N0`/\`[3TYB!]HB.2HZ==P)'Z9/\ZN;%/\(_+_`#ZFN?/A M8MY>;T?NWWK^ZZ$CYC][KGD=AT(-=%0`W8I_A'Y?Y]31L4_PC\O\^IIU%`$% MQ-;6RJT[(@=MH)'4\G^63^=5_P"U=-/_`"\1G/0`9)ST'U/.!W[9J6^M9+N. M)$E5$60-(K(6$BC/R\$8YP?PP<@FL=/"Y1@QO%8@Q'F(CF-"BGA@1P<]>H[= M*`-]#%+&LB;'1QN##D$'O^OZTNQ3_"/R_P`^IJ.SMQ9V4%LK%EAC6,,>IP,5 M-0`W8I_A'Y?Y]33)GAAC:27:%'4XSDGC'N23T]ZEJ"[AEGM9(H9O)D88$FW. M.>>X[>]`$*:EITA`6Y@.X@#D?-NSC'KT;IZ'WJ>"6WNX1-"5>-LX('US_6LN M+P\B0R0F<>4VT*J1[=H#.Q'4]W./0`=>M:&GVC6=L8WE$LC,69@NT$GT&3CC M'>@"QL4_PC\O\^IIU%%`!1110!\;_P#":^*_^AFUG_P/E_\`BJ/^$U\5_P#0 MS:S_`.!\O_Q5%%`!_P`)KXK_`.AFUG_P/E_^*H_X37Q7_P!#-K/_`('R_P#Q M5%%`!_PFOBO_`*&;6?\`P/E_^*H_X37Q7_T,VL_^!\O_`,5110`?\)KXK_Z& M;6?_``/E_P#BJ/\`A-?%?_0S:S_X'R__`!5%%`!_PFOBO_H9M9_\#Y?_`(JC M_A-?%?\`T,VL_P#@?+_\5110`?\`":^*_P#H9M9_\#Y?_BJ/^$U\5_\`0S:S M_P"!\O\`\5110`?\)KXK_P"AFUG_`,#Y?_BJ/^$U\5_]#-K/_@?+_P#%444` M'_":^*_^AFUG_P`#Y?\`XJC_`(37Q7_T,VL_^!\O_P`5110`?\)KXK_Z&;6? M_`^7_P"*H_X37Q7_`-#-K/\`X'R__%444`'_``FOBO\`Z&;6?_`^7_XJC_A- M?%?_`$,VL_\`@?+_`/%444`'_":^*_\`H9M9_P#`^7_XJC_A-?%?_0S:S_X' MR_\`Q5%%`!_PFOBO_H9M9_\``^7_`.*H_P"$U\5_]#-K/_@?+_\`%444`'_" M:^*_^AFUG_P/E_\`BJ/^$U\5_P#0S:S_`.!\O_Q5%%`!_P`)KXK_`.AFUG_P M/E_^*H_X37Q7_P!#-K/_`('R_P#Q5%%`!_PFOBO_`*&;6?\`P/E_^*H_X37Q M7_T,VL_^!\O_`,5110`?\)KXK_Z&;6?_``/E_P#BJ/\`A-?%?_0S:S_X'R__ M`!5%%`!_PFOBO_H9M9_\#Y?_`(JC_A-?%?\`T,VL_P#@?+_\5110`?\`":^* M_P#H9M9_\#Y?_BJ/^$U\5_\`0S:S_P"!\O\`\5110`?\)KXK_P"AFUG_`,#Y M?_BJ/^$U\5_]#-K/_@?+_P#%444`'_":^*_^AFUG_P`#Y?\`XJC_`(37Q7_T M,VL_^!\O_P`5110`?\)KXK_Z&;6?_`^7_P"*H_X37Q7_`-#-K/\`X'R__%44 M4`'_``FOBO\`Z&;6?_`^7_XJC_A-?%?_`$,VL_\`@?+_`/%444`'_":^*_\` MH9M9_P#`^7_XJC_A-?%?_0S:S_X'R_\`Q5%%`!_PFOBO_H9M9_\``^7_`.*H M_P"$U\5_]#-K/_@?+_\`%444`'_":^*_^AFUG_P/E_\`BJ/^$U\5_P#0S:S_ M`.!\O_Q5%%`!_P`)KXK_`.AFUG_P/E_^*H_X37Q7_P!#-K/_`('R_P#Q5%%` M!_PFOBO_`*&;6?\`P/E_^*H_X37Q7_T,VL_^!\O_`,5110`?\)KXK_Z&;6?_ M``/E_P#BJ/\`A-?%?_0S:S_X'R__`!5%%`!_PFOBO_H9M9_\#Y?_`(JBBB@# "_]D_ ` end GRAPHIC 30 pr1021img002.jpg GRAPHIC begin 644 pr1021img002.jpg M_]C_X``02D9)1@`!`@```0`!``#_VP!#``@&!@<&!0@'!P<)"0@*#!0-#`L+ M#!D2$P\4'1H?'AT:'!P@)"XG("(L(QP<*#7J#A(6&AXB)BI*3E)66EYB9FJ*CI*6FIZBIJK*SM+6VM[BYNL+#Q,7& MQ\C)RM+3U-76U]C9VN'BX^3EYN?HZ>KQ\O/T]?;W^/GZ_\0`'P$``P$!`0$! M`0$!`0````````$"`P0%!@<("0H+_\0`M1$``@$"!`0#!`<%!`0``0)W``$" M`Q$$!2$Q!A)!40=A<1,B,H$(%$*1H;'!"2,S4O`58G+1"A8D-.$E\1<8&1HF M)R@I*C4V-S@Y.D-$149'2$E*4U155E=865IC9&5F9VAI:G-T=79W>'EZ@H.$ MA8:'B(F*DI.4E9:7F)F:HJ.DI::GJ*FJLK.TM;:WN+FZPL/$Q<;'R,G*TM/4 MU=;7V-G:XN/DY>;GZ.GJ\O/T]?;W^/GZ_]H`#`,!``(1`Q$`/P#W^BBL[6=> MTOP]9-=ZK?06L(!QYC@%R!G"CJQXZ#F@"IXK\46'A/0Y=2OB&(^6*`,`TSGH MHSU]3Z`$]JX#5O%/BC5I)=.@DM=,-Y;H]D4F_=WJ'&X077:8DX4;.!R>Q#M? MB\3^.IK/7M#TW[)8Z=')Y=IJJE'U#`E;NWN5 M9]4T^3&3YHX#Q``G=U.[K@5Z/H^M:=KVG1W^EW<5U;OCYHV!VD@':P_A8`C( M/(S6+IGA6:.XAN=2NA)>6 M/4>(2)X>\02"+RU(V6]\QX(7@*K*,<9Y]@*`/2****`"BBB@`HHHH`****`" MBBB@`HH)`ZFB@`HHHH`****`"BBB@`HHHH`****`"BBB@`HHHZT`%%(2%&20 M/K2T`8'B_P`2)X9T)[I8VFO9F%O96ZH6,T[`[%P.<9ZXYP#7-^$_!MGO1G;,DKK+#8R$B3RT7D*RDCZ9X`S6=XJGOI?B&\"PN]Y]D$.FJ^##: M1MDR7Y)X#(?EV\$@#GFI_#.LVFG+:31W!31&F^PP3>2?.UJ_?`><]3@E6Y/4 MY)(`%`'IMKOB;QU9^' MM0@T]+::^N_DFNHH$6![>22-7:&0@M&2,E3@D9'3@ MXK'\:Q:1+X1U$:W(D-BL+,9CC=&P!VLF?XP<;>^<5S6G?$#4;5-1_M?26N-. MTF=[2[UFSD789$QN8PMAE&""=NX`Y`SBFWRW/B<#Q%J>G2RZ+9_/I6DCYCJ$ MI(\J=\?=#;@H1A\N2S$#B@##T#XDZ_I5AITGB6VAELYHMD,,,;G49(U7(N70 ML08R%.3P2>1Q7KEG=P7]E!>6TBRV\\:RQ2+T96&01]0:\9U"TNWGU2&[N]FJ M7,)N=;U`_O%T>Q(W?9(R"=S?>^[C([=Z[3X6:A]I\+-:>=.ZV!,G('H<#/KEEY M&2:Q-=/BCX67=GK)\076N:--*EO=07SL\@)R24R<#Y5.#GJ1D&K,MW#X>_:& M>2_DVIJ]BD5NQZ!CM4#\6B([=15_XX74(LT@3]TV,')XSR.,YIUAXT\-ZI:75U9:Q:S16D;2 MSX;#1HHR6*GG;[XQ7F$6A0M\4/!6DZO913&#PW"DT$RAU\Q%E'(Z'!'O3?$^ MGV6F?$77+?1;>"W@?PO=/=Q0(%524?L..<1_G0!Z2_Q#\(1FV#>(+$?:%#)^ M\Z`]"W]S_@6,5K7^N:5IFG+J%]J%M;V;@%)I)0%?(R`I_B)`)`'7M7DNC:!H M+_`.?4;K3K(W9M+B47+Q+YGFAF"?-C/4**Y;5+W59#\.-.FC6>(6\4D%K.^( M9G\UEC#>VP(/HQ]30![MI_C+PYJEC^*K2? M$/PA%;V\S>(+'9/]P"3+=<9*CE1D$<@=*XA?"6LVUSXL\3:K8:9IRW.B7%O] MELFW;CM!W'@#^'\<)!Y93?$=V[IMQSFNVTSQIX;UG46T_3M9M+ MFZ&?W:/]['7:>C?AFO%VC34/"WPOM[M?/AEU!X71^0R&=5VGVQQ6QXVTVQTC MXR>#$TRT@LD=XMR6T8C!_>D=%`[$CZ4`>H:IXU\-:)>K9ZCK-K!7M[<3QW-Q=S!)H-_91M/`;)'/4>PJ]XA\.7OA7P1X0TO4+M;F= M-85SM)*Q[LG8">H&3Z=:`/6KKQCXLA;Q-LM`'K^E^(-(UO3WO]-U""XM8R0\J-PA`R0V>AP0>:S[7QYX5OM3&G6V MO6,ETS!402<.Q.`%;HQ)Z`$YKQ47-QI>D?$^UT]?+MDOE@$48PL<1GD0@`=! MMPOTK:T_PEK_`(F\+>&(;/2-&TRVMC!<+J<$O[]@J\DA5!W$X8C/WEZ\9H`] M2E\<^%H)[V";7;*.6R)6=&DPRL."`.YR",#)SQUK@_$^JZIXA^)>AZ/HGB.Z ML-+O],6Z66U_B),IWGB/ M7_$\UZ]UO4FK'Q.8/\5/`N M"#_I,)X_Z^$Y_G0!Z+<^-_#%G>W=G?2;^&[C0X?RSRI[9!Y'XUYM#H^FZG^T%J\-_86]S$FG+,L">37(:9/-I'B#XFQZ:IA2.VN52.$[!&!-M!4#IM5FQCI0!Z?XU\=>&H_ M#VM:6FNVW]H/93QQQPR%CYFQ@%W+P&SQC.:7P'K-AI'PKT>]U6^AM8!&P\V= MPN3O?@9ZG@\#DUS?A_1]`_X49?WEK:VD]RVFW+SSM$"ZS!&R,GD;3C'X$=:@ M'AC4O%'P/\/0:4(9+NTE^U)#+C$F#(-O/RY^;^+@\@]:`.OU-K#XA:4LFAZG M%=6\)='"$C#G:5)!QC`!'T8XKKK*)[>Q@ADP'1`"`VX#V!P,@>N!7#?#3Q7! MJTNI:++HT&E:M8./MD=NJA)7'R,YV@`'*XQD\`8)%>A8H`\Y^*'A\RPP:[:V M5Y=.FVVU*&VEVF:Q!:1D(R#@N%&1R`Q[5R^B:G`KL!M)!^8]#C[K>W5Q/BWPC;);?V[H-G;VNMV$YOT>&$*UT5!+1 M,1R0X)'UH`W?#?AVV\.:>T$1,MSLGVEE8QIN7^'.3AOEZUT?AK7[7Q/X?L]6M"`D\8+Q MYR8G_B0].0^/F;\6R?QK5KS_1O$Q\-S6&E:M]1?['UG! MVRJV!'#)@<.%.=YP&`R<'-6]5\J2?,LLCYR%!R,'`)'H%!Z_P M9H,^AZ,S7\IEU6^E-Y?R$\&9P-RKC@*N`!CCC/>LO0?`6(XK8>B*.N"6YXZ]`>:[:@##\2^$M'\6V:6VKVOFK&Q:-T+3K:Y MANKR"S5GNVC8/*X4$@1MP,^N?:LRZ\,M(MM>^.>CZ=#/$UQ91RR7=QIMSY]W]\1Z)I^H6ME=ZC:PWEV!Y M$;.-S@G`Q[$Y`I=7U*ZL[BSM;.RAN9;KS`!-.8E&U=V,A6Z]*`/,/A]\-M#\ M0>"=*OM2DOIHI"\CV7VDB`N&9=VT<@X&.#7HNO\`@S0_$FDP:;J-IF"W_P"/ M?RG*&'Y=HVX[8['(X''%2:3KRZA::=<2+!:BXM))Y(&DW-&4*AL'`!52Q!;C ML>]4[CQOHT]A)+I.JV5S+%-$LB>8"51I41FQP<`/][I0!5T7X::%H=M>Q0-> MSR7=J]F\]Q.7986'**.`!T[=JOZ5X)TC1O"MYX=M!.+&[6192TF7/F+M;!QQ MQ[4LOCOPQ%IBZD=8MFLFNA9^PVHFC?`19Z'%;:);A;DQZ-,9[0&7G>7#Y;U MY'2K>J^#=)UK7]/UN\25KS3]I@*2%5!#;AD=^:AM_&VG3^)M7T8_(-,@\Z2X M))4[0#(,8_AW)GG^+VIVE^-]&OX+3S[RWMKNYM!>K:F7UN"GF,3DD@YQGOC%:EUX'T6[TO2M.DBF%KI MDJS6Z"4YW#NQ/)SSGGO6Q!JMC=)9O!GQ:I;F[M&=9XF.TIL&6//8=STH`1Y`8O\H3Z5 M%8^$-*T[Q3>^(X$E_M&\0QRLTA*[3M.`.WW%JYI&OZ5KT4DNE7\%VD3;7,39 MP<9_+T/0UEVWC73P-5?4Y(=/AL=2?3UDEER)2L2RD]!CY2W'/W>M`#['P1HE MA+KCI;O(-;9S?+)(2'#%B0/0?.U8^G_"3PQIFJQ7]LM\HBF6>.W-VQB#J05) M'5L$#J3[UT^G>)-'U>6*+3]1M[F26%ID6-LDHK!6/X$@'ZU%+XLT&&[L[675 M;5+B\(%O&7YDRQ48^I&!ZF@".R\):78>*KWQ)"LW]HWD?E2LTA*[?EX`[?<6 MGW'A?3;KQ9;>)94E.HVT'D1D/A0OS]1Z_.U5[SQUX9L6N4N-9M4>VF6"8;B2 MDA)`4X]P?I@YQ@UM6-]:ZE917EE.D]M*,QR(2%9!*A1RK(X!`88]F/!R.>EF#7344`>>K\%O!HNWF:TNFB8<6YNG\M3V/'S9^I-3_\` M"IO#?]B1Z4#?K%%)V`!VGH.%';^9KNZ*`,'PQX/TCPE;2Q:7"X: M8@S2RR%WD([DG\>F!R:WJ**`"BBB@#S34++5O`NN:KJ=C!-=^&-2+7%]'%(! M+8RL1YDZ@@EAM!.!^@49R9]4>2;3]575X1<2*+?2_$JQ_N[L,Q(L[F(#Y"3R M6(`&,C:I?#[0K^_GN=MS;"]<&^AMYBD5W@[OG7IDDO%2Z#X;TCPS9R6FCV2VL$DAE=0S-EL`9RQ)Z`#' M2M7I0`4444`> M+-9O8K8/;7/APV$3EU&Z8O(=F"<]&7GIS7:T4`>9Z5X;U6PM[?3K_0;F_M+R MRM([EX=2$(MV2%(GC=`XWJ-A;5VQGC'F.VN]8\)74(MS;W\]J6BB=U8PS8 MW)D@X)5P.AQQZ5LXI:`//;CPMJ+:#I*Q:?&;Z_ED36U,BC9#=?/=`'/.&"@; M?3BH-9TKQ7>>)M/C&F"32;'5X+F!HIX4C6!4V'Y3\Y<%V)YQA0`,UZ33)(DF MB>.1`Z.I5E89!!Z@T`<)X'TJ9_$&JZH]T9;*REN--TU`FU5B\WS'QZ@,%C!] M(L]ZL7VDZQ)/XDT^'3P\&H2B]ANVF41LRQQ+Y++G<-QBP3C&&]L'LK>WBM;> M.W@C6.&)0D<:`!54#```Z`"I*`.0TBQU74/&0\1ZCI?]EB+338B!YDE>1FD5 MRV4)&P;<#/)R3@5BR^%-8>_,OV,%/^$P75,^8G_'L(`N_K_>&,=?:O2<44`> M92^$_$0MM8>P"VE[)8V?KV.'P>3Y8'>KR^&I]+U&32TT6ZU M'1;E;=!/'J/E"W5$2+8\9<;@`F[<,DYQBN_HH`\ZDTCQ(USJAM-/E@TM'CNH M=/GNHW,]TMRLS-&^3L1E7A6(`+?='-=Y833W%C%+=6C6DSC+0,ZN8_8E>"?I 8D>YJS10`4444`%%%%`!1110`4444`?_9 ` end GRAPHIC 31 pr1022img000.jpg GRAPHIC begin 644 pr1022img000.jpg M_]C_X``02D9)1@`!`@```0`!``#_VP!#``@&!@<&!0@'!P<)"0@*#!0-#`L+ M#!D2$P\4'1H?'AT:'!P@)"XG("(L(QP<*#7J#A(6&AXB)BI*3E)66EYB9FJ*CI*6FIZBIJK*SM+6VM[BYNL+#Q,7& MQ\C)RM+3U-76U]C9VN'BX^3EYN?HZ>KQ\O/T]?;W^/GZ_\0`'P$``P$!`0$! M`0$!`0````````$"`P0%!@<("0H+_\0`M1$``@$"!`0#!`<%!`0``0)W``$" M`Q$$!2$Q!A)!40=A<1,B,H$(%$*1H;'!"2,S4O`58G+1"A8D-.$E\1<8&1HF M)R@I*C4V-S@Y.D-$149'2$E*4U155E=865IC9&5F9VAI:G-T=79W>'EZ@H.$ MA8:'B(F*DI.4E9:7F)F:HJ.DI::GJ*FJLK.TM;:WN+FZPL/$Q<;'R,G*TM/4 MU=;7V-G:XN/DY>;GZ.GJ\O/T]?;W^/GZ_]H`#`,!``(1`Q$`/P#W^BBL[6=> MTOP]9-=ZK?06L(!QYC@%R!G"CJQXZ#F@"IXK\46'A/0Y=2OB&(^6*`,`TSGH MHSU]3Z`$]JX#5O%/BC5I)=.@DM=,-Y;H]D4F_=WJ'&X077:8DX4;.!R>Q#M? MB\3^.IK/7M#TW[)8Z=')Y=IJJE'U#`E;NWN5 M9]4T^3&3YHX#Q``G=U.[K@5Z/H^M:=KVG1W^EW<5U;OCYHV!VD@':P_A8`C( M/(S6+IGA6:.XAN=2NA)>6 M/4>(2)X>\02"+RU(V6]\QX(7@*K*,<9Y]@*`/2****`"BBB@`HHHH`****`" MBBB@`HH)`ZFB@`HHHH`****`"BBB@`HHHH`****`"BBB@`HHHZT`%%(2%&20 M/K2T`8'B_P`2)X9T)[I8VFO9F%O96ZH6,T[`[%P.<9ZXYP#7-^$_!MGO1G;,DKK+#8R$B3RT7D*RDCZ9X`S6=XJGOI?B&\"PN]Y]D$.FJ^##: M1MDR7Y)X#(?EV\$@#GFI_#.LVFG+:31W!31&F^PP3>2?.UJ_?`><]3@E6Y/4 MY)(`%`'IMKOB;QU9^' MM0@T]+::^N_DFNHH$6![>22-7:&0@M&2,E3@D9'3@ MXK'\:Q:1+X1U$:W(D-BL+,9CC=&P!VLF?XP<;>^<5S6G?$#4;5-1_M?26N-. MTF=[2[UFSD789$QN8PMAE&""=NX`Y`SBFWRW/B<#Q%J>G2RZ+9_/I6DCYCJ$ MI(\J=\?=#;@H1A\N2S$#B@##T#XDZ_I5AITGB6VAELYHMD,,,;G49(U7(N70 ML08R%.3P2>1Q7KEG=P7]E!>6TBRV\\:RQ2+T96&01]0:\9U"TNWGU2&[N]FJ M7,)N=;U`_O%T>Q(W?9(R"=S?>^[C([=Z[3X6:A]I\+-:>=.ZV!,G('H<#/KEEY M&2:Q-=/BCX67=GK)\076N:--*EO=07SL\@)R24R<#Y5.#GJ1D&K,MW#X>_:& M>2_DVIJ]BD5NQZ!CM4#\6B([=15_XX74(LT@3]TV,')XSR.,YIUAXT\-ZI:75U9:Q:S16D;2 MSX;#1HHR6*GG;[XQ7F$6A0M\4/!6DZO913&#PW"DT$RAU\Q%E'(Z'!'O3?$^ MGV6F?$77+?1;>"W@?PO=/=Q0(%524?L..<1_G0!Z2_Q#\(1FV#>(+$?:%#)^ M\Z`]"W]S_@6,5K7^N:5IFG+J%]J%M;V;@%)I)0%?(R`I_B)`)`'7M7DNC:!H M+_`.?4;K3K(W9M+B47+Q+YGFAF"?-C/4**Y;5+W59#\.-.FC6>(6\4D%K.^( M9G\UEC#>VP(/HQ]30![MI_C+PYJEC^*K2? M$/PA%;V\S>(+'9/]P"3+=<9*CE1D$<@=*XA?"6LVUSXL\3:K8:9IRW.B7%O] MELFW;CM!W'@#^'\<)!Y93?$=V[IMQSFNVTSQIX;UG46T_3M9M+ MFZ&?W:/]['7:>C?AFO%VC34/"WPOM[M?/AEU!X71^0R&=5VGVQQ6QXVTVQTC MXR>#$TRT@LD=XMR6T8C!_>D=%`[$CZ4`>H:IXU\-:)>K9ZCK-K!7M[<3QW-Q=S!)H-_91M/`;)'/4>PJ]XA\.7OA7P1X0TO4+M;F= M-85SM)*Q[LG8">H&3Z=:`/6KKQCXLA;Q-LM`'K^E^(-(UO3WO]-U""XM8R0\J-PA`R0V>AP0>:S[7QYX5OM3&G6V MO6,ETS!402<.Q.`%;HQ)Z`$YKQ47-QI>D?$^UT]?+MDOE@$48PL<1GD0@`=! MMPOTK:T_PEK_`(F\+>&(;/2-&TRVMC!<+J<$O[]@J\DA5!W$X8C/WEZ\9H`] M2E\<^%H)[V";7;*.6R)6=&DPRL."`.YR",#)SQUK@_$^JZIXA^)>AZ/HGB.Z ML-+O],6Z66U_B),IWGB/ M7_$\UZ]UO4FK'Q.8/\5/`N M"#_I,)X_Z^$Y_G0!Z+<^-_#%G>W=G?2;^&[C0X?RSRI[9!Y'XUYM#H^FZG^T%J\-_86]S$FG+,L">37(:9/-I'B#XFQZ:IA2.VN52.$[!&!-M!4#IM5FQCI0!Z?XU\=>&H_ M#VM:6FNVW]H/93QQQPR%CYFQ@%W+P&SQC.:7P'K-AI'PKT>]U6^AM8!&P\V= MPN3O?@9ZG@\#DUS?A_1]`_X49?WEK:VD]RVFW+SSM$"ZS!&R,GD;3C'X$=:@ M'AC4O%'P/\/0:4(9+NTE^U)#+C$F#(-O/RY^;^+@\@]:`.OU-K#XA:4LFAZG M%=6\)='"$C#G:5)!QC`!'T8XKKK*)[>Q@ADP'1`"`VX#V!P,@>N!7#?#3Q7! MJTNI:++HT&E:M8./MD=NJA)7'R,YV@`'*XQD\`8)%>A8H`\Y^*'A\RPP:[:V M5Y=.FVVU*&VEVF:Q!:1D(R#@N%&1R`Q[5R^B:G`KL!M)!^8]#C[K>W5Q/BWPC;);?V[H-G;VNMV$YOT>&$*UT5!+1 M,1R0X)'UH`W?#?AVV\.:>T$1,MSLGVEE8QIN7^'.3AOEZUT?AK7[7Q/X?L]6M"`D\8+Q MYR8G_B0].0^/F;\6R?QK5KS_1O$Q\-S6&E:M]1?['UG! MVRJV!'#)@<.%.=YP&`R<'-6]5\J2?,LLCYR%!R,'`)'H%!Z_P M9H,^AZ,S7\IEU6^E-Y?R$\&9P-RKC@*N`!CCC/>LO0?`6(XK8>B*.N"6YXZ]`>:[:@##\2^$M'\6V:6VKVOFK&Q:-T+3K:Y MANKR"S5GNVC8/*X4$@1MP,^N?:LRZ\,M(MM>^.>CZ=#/$UQ91RR7=QIMSY]W]\1Z)I^H6ME=ZC:PWEV!Y M$;.-S@G`Q[$Y`I=7U*ZL[BSM;.RAN9;KS`!-.8E&U=V,A6Z]*`/,/A]\-M#\ M0>"=*OM2DOIHI"\CV7VDB`N&9=VT<@X&.#7HNO\`@S0_$FDP:;J-IF"W_P"/ M?RG*&'Y=HVX[8['(X''%2:3KRZA::=<2+!:BXM))Y(&DW-&4*AL'`!52Q!;C ML>]4[CQOHT]A)+I.JV5S+%-$LB>8"51I41FQP<`/][I0!5T7X::%H=M>Q0-> MSR7=J]F\]Q.7986'**.`!T[=JOZ5X)TC1O"MYX=M!.+&[6192TF7/F+M;!QQ MQ[4LOCOPQ%IBZD=8MFLFNA9^PVHFC?`19Z'%;:);A;DQZ-,9[0&7G>7#Y;U MY'2K>J^#=)UK7]/UN\25KS3]I@*2%5!#;AD=^:AM_&VG3^)M7T8_(-,@\Z2X M))4[0#(,8_AW)GG^+VIVE^-]&OX+3S[RWMKNYM!>K:F7UN"GF,3DD@YQGOC%:EUX'T6[TO2M.DBF%KI MDJS6Z"4YW#NQ/)SSGGO6Q!JMC=)9O!GQ:I;F[M&=9XF.TIL&6//8=STH`1Y`8O\H3Z5 M%8^$-*T[Q3>^(X$E_M&\0QRLTA*[3M.`.WW%JYI&OZ5KT4DNE7\%VD3;7,39 MP<9_+T/0UEVWC73P-5?4Y(=/AL=2?3UDEER)2L2RD]!CY2W'/W>M`#['P1HE MA+KCI;O(-;9S?+)(2'#%B0/0?.U8^G_"3PQIFJQ7]LM\HBF6>.W-VQB#J05) M'5L$#J3[UT^G>)-'U>6*+3]1M[F26%ID6-LDHK!6/X$@'ZU%+XLT&&[L[675 M;5+B\(%O&7YDRQ48^I&!ZF@".R\):78>*KWQ)"LW]HWD?E2LTA*[?EX`[?<6 MGW'A?3;KQ9;>)94E.HVT'D1D/A0OS]1Z_.U5[SQUX9L6N4N-9M4>VF6"8;B2 MDA)`4X]P?I@YQ@UM6-]:ZE917EE.D]M*,QR(2%9!*A1RK(X!`88]F/!R.>EF#7344`>>K\%O!HNWF:TNFB8<6YNG\M3V/'S9^I-3_\` M"IO#?]B1Z4#?K%%)V`!VGH.%';^9KNZ*`,'PQX/TCPE;2Q:7"X: M8@S2RR%WD([DG\>F!R:WJ**`"BBB@#S34++5O`NN:KJ=C!-=^&-2+7%]'%(! M+8RL1YDZ@@EAM!.!^@49R9]4>2;3]575X1<2*+?2_$JQ_N[L,Q(L[F(#Y"3R M6(`&,C:I?#[0K^_GN=MS;"]<&^AMYBD5W@[OG7IDDO%2Z#X;TCPS9R6FCV2VL$DAE=0S-EL`9RQ)Z`#' M2M7I0`4444`> M+-9O8K8/;7/APV$3EU&Z8O(=F"<]&7GIS7:T4`>9Z5X;U6PM[?3K_0;F_M+R MRM([EX=2$(MV2%(GC=`XWJ-A;5VQGC'F.VN]8\)74(MS;W\]J6BB=U8PS8 MW)D@X)5P.AQQZ5LXI:`//;CPMJ+:#I*Q:?&;Z_ED36U,BC9#=?/=`'/.&"@; M?3BH-9TKQ7>>)M/C&F"32;'5X+F!HIX4C6!4V'Y3\Y<%V)YQA0`,UZ33)(DF MB>.1`Z.I5E89!!Z@T`<)X'TJ9_$&JZH]T9;*REN--TU`FU5B\WS'QZ@,%C!] M(L]ZL7VDZQ)/XDT^'3P\&H2B]ANVF41LRQQ+Y++G<-QBP3C&&]L'LK>WBM;> M.W@C6.&)0D<:`!54#```Z`"I*`.0TBQU74/&0\1ZCI?]EB+338B!YDE>1FD5 MRV4)&P;<#/)R3@5BR^%-8>_,OV,%/^$P75,^8G_'L(`N_K_>&,=?:O2<44`> M92^$_$0MM8>P"VE[)8V?KV.'P>3Y8'>KR^&I]+U&32TT6ZU M'1;E;=!/'J/E"W5$2+8\9<;@`F[<,DYQBN_HH`\ZDTCQ(USJAM-/E@TM'CNH M=/GNHW,]TMRLS-&^3L1E7A6(`+?='-=Y833W%C%+=6C6DSC+0,ZN8_8E>"?I 8D>YJS10`4444`%%%%`!1110`4444`?_9 ` end GRAPHIC 32 pr1022img001.jpg GRAPHIC begin 644 pr1022img001.jpg M_]C_X``02D9)1@`!`0```0`!``#_VP!#``@&!@<&!0@'!P<)"0@*#!0-#`L+ M#!D2$P\4'1H?'AT:'!P@)"XG("(L(QP<*#7J#A(6&AXB)BI*3E)66EYB9FJ*CI*6FIZBIJK*SM+6VM[BYNL+#Q,7& MQ\C)RM+3U-76U]C9VN'BX^3EYN?HZ>KQ\O/T]?;W^/GZ_\0`'P$``P$!`0$! M`0$!`0````````$"`P0%!@<("0H+_\0`M1$``@$"!`0#!`<%!`0``0)W``$" M`Q$$!2$Q!A)!40=A<1,B,H$(%$*1H;'!"2,S4O`58G+1"A8D-.$E\1<8&1HF M)R@I*C4V-S@Y.D-$149'2$E*4U155E=865IC9&5F9VAI:G-T=79W>'EZ@H.$ MA8:'B(F*DI.4E9:7F)F:HJ.DI::GJ*FJLK.TM;:WN+FZPL/$Q<;'R,G*TM/4 MU=;7V-G:XN/DY>;GZ.GJ\O/T]?;W^/GZ_]H`#`,!``(1`Q$`/P#=_P"%'>"_ M^>%[_P"!)_PH_P"%'>"_^>%[_P"!)_PKTBJNHS&WL)95E$17&&./4#'/`STR M>!F@#@?^%'>"_P#GA>_^!)_PH_X4=X+_`.>%[_X$G_"M^/6]2ELI;E/)/E[6 M=2A&W+.NW'7HJG!Y^;TKHH+C[1;QS1(2CJ&&2`>A_P#K?G0!Y]_PH[P7_P`\ M+W_P)/\`A1_PH[P7_P`\+W_P)/\`A7HI9^<1Y_X%]?\`ZWYT%GYQ'G_@7U_^ MM^=`'G7_``H[P7_SPO?_``)/^%'_``H[P7_SPO?_``)/^%>BEGYQ'G_@7U_^ MM^=!9^<1Y_X%]?\`ZWYT`>=?\*.\%_\`/"]_\"3_`(4?\*.\%_\`/"]_\"3_ M`(5Z*6?G$>?^!?7_`.M^=!9^<1Y_X%]?_K?G0!YU_P`*.\%_\\+W_P`"3_A1 M_P`*.\%_\\+W_P`"3_A7HI9^<1Y_X%]?_K?G06?G$>?^!?7_`.M^=`'G7_"C MO!?_`#PO?_`D_P"%'_"CO!?_`#PO?_`D_P"%>BEGYQ'G_@7U_P#K?G06?G$> M?^!?7_ZWYT`>=?\`"CO!?_/"]_\``D_X4?\`"CO!?_/"]_\``D_X5Z*6?G$> M?^!?7_ZWYT%GYQ'G_@7U_P#K?G0!YU_PH[P7_P`\+W_P)/\`A1_PH[P7_P`\ M+W_P)/\`A7HI9^<1Y_X%]?\`ZWYT%GYQ'G_@7U_^M^=`'G7_``H[P7_SPO?_ M``)/^%'_``H[P7_SPO?_``)/^%>BEGYQ'G_@7U_^M^=!9^<1Y_X%]?\`ZWYT M`>=?\*.\%_\`/"]_\"3_`(4?\*.\%_\`/"]_\"3_`(5Z*6?G$>?^!?7_`.M^ M=!9^<1Y_X%]?_K?G0!YU_P`*.\%_\\+W_P`"3_A1_P`*.\%_\\+W_P`"3_A7 MHI9^<1Y_X%]?_K?G06?G$>?^!?7_`.M^=`'G7_"CO!?_`#PO?_`D_P"%'_"C MO!?_`#PO?_`D_P"%>BEGYQ'G_@7U_P#K?G06?G$>?^!?7_ZWYT`>=?\`"CO! M?_/"]_\``D_X4?\`"CO!?_/"]_\``D_X5Z*6?G$>?^!?7_ZWYT%GYQ'G_@7U M_P#K?G0!YU_PH[P7_P`\+W_P)/\`A1_PH[P7_P`\+W_P)/\`A7HI9^<1Y_X% M]?\`ZWYT%GYQ'G_@7U_^M^=`'G7_``H[P7_SPO?_``)/^%'_``H[P7_SPO?_ M``)/^%>BEGYQ'G_@7U_^M^=!9^<1Y_X%]?\`ZWYT`>=?\*.\%_\`/"]_\"3_ M`(4?\*.\%_\`/"]_\"3_`(5Z*6?G$>?^!?7_`.M^=!9^<1Y_X%]?_K?G0!YU M_P`*.\%_\\+W_P`"3_A1_P`*.\%_\\+W_P`"3_A7HI9^<1Y_X%]?_K?G06?G M$>?^!?7_`.M^=`'G7_"CO!?_`#PO?_`D_P"%'_"CO!?_`#PO?_`D_P"%>BEG MYQ'G_@7U_P#K?G06?G$>?^!?7_ZWYT`>=?\`"CO!?_/"]_\``D_X4?\`"CO! M?_/"]_\``D_X5Z*6?G$>?^!?7_ZWYT%GYQ'G_@7U_P#K?G0!YU_PH[P7_P`\ M+W_P)/\`A1_PH[P7_P`\+W_P)/\`A7HI9^<1Y_X%]?\`ZWYT%GYQ'G_@7U_^ MM^=`'G7_``H[P7_SPO?_``)/^%'_``H[P7_SPO?_``)/^%>BEGYQ'G_@7U_^ MM^=!9^<1Y_X%]?\`ZWYT`>=?\*.\%_\`/"]_\"3_`(4?\*.\%_\`/"]_\"3_ M`(5Z*6?G$>?^!?7_`.M^=!9^<1Y_X%]?_K?G0!YU_P`*.\%_\\+W_P`"3_A1 M_P`*.\%_\\+W_P`"3_A7HI9^<1Y_X%]?_K?G06?G$>?^!?7_`.M^=`'G7_"C MO!?_`#PO?_`D_P"%'_"CO!?_`#PO?_`D_P"%>BEGYQ'G_@7U_P#K?G06?G$> M?^!?7_ZWYT`>=?\`"CO!?_/"]_\``D_X4?\`"CO!?_/"]_\``D_X5Z*6?G$> M?^!?7_ZWYT%GYQ'G_@7U_P#K?G0!YU_PH[P7_P`\+W_P)/\`A1_PH[P7_P`\ M+W_P)/\`A7HI9^<1Y_X%]?\`ZWYT%GYQ'G_@7U_^M^=`'G7_``H[P7_SPO?_ M``)/^%'_``H[P7_SPO?_``)/^%>BEGYQ'G_@7U_^M^=/H`\W_P"%'>"_^>%[ M_P"!)_PHKTBB@`HHJGJD'*\=@/?_`#^%`#J*848Y_>L/ MP'O[>X_*@HQS^]8?@/?V]Q^5`#Z*848Y_>L/P'O[>X_*@HQS^]8?@/?V]Q^5 M`#Z*848Y_>L/P'O[>X_*@HQS^]8?@/?V]Q^5`#Z*848Y_>L/P'O[>X_*@HQS M^]8?@/?V]Q^5`#Z*848Y_>L/P'O[>X_*@HQS^]8?@/?V]Q^5`#B<`DYX]!FN M?M/&6G7NHV%C'#=K+>M,L?F1A=IC:16W`G(YC;MQQG!(%:&L:E!HFD76IWDT MBVUNA>0H@8@>P[]1^5>5'XA?#C[9'=I<:K'-&961DC88:0RDMUZ@S28],T`> MA#QG9MVZ9VQZFM?1 M?'_@K6?%MN;":^.J71,*.\)`.=Q&?IG`]@*`/3:*848Y_>L/P'O[>X_*@HQS M^]8?@/?V]Q^5`#Z*848Y_>L/P'O[>X_*@HQS^]8?@/?V]Q^5`#Z*848Y_>L/ MP'O[>X_*@HQS^]8?@/?V]Q^5`#Z*848Y_>L/P'O[>X_*@HQS^]8?@/?V]Q^5 M`#Z*848Y_>L/P'O[>X_*@HQS^]8?@/?V]Q^5`#Z*848Y_>L/P'O[>X_*@HQS M^]8?@/?V]Q^5`#Z*848Y_>L/P'O[>X_*@HQS^]8?@/?V]Q^5`#Z*848Y_>L/ MP'O[>X_*@HQS^]8?@/?V]Q^5`#Z*848Y_>L/P'O[>X_*@HQS^]8?@/?V]Q^5 M`#Z*848Y_>L/P'O[>X_*@HQS^]8?@/?V]Q^5`#Z*848Y_>L/P'O[>X_*@HQS M^]8?@/?V]Q^5`#Z*848Y_>L/P'O[>X_*@HQS^]8?@/?V]Q^5`#Z*848Y_>L/ MP'O[>X_*@HQS^]8?@/?V]Q^5`#Z*848Y_>L/P'O[>X_*J.M7_P#8VAW^IOOD M2TMY)RBX!8*I.!Q_G%`&'%XU:35K"P?3#$;JYGMW+3@F+RVV@G`(Y/N/0$GB MH;[QV]I?:I`FF+(FGR(K.;@KO4[MS`;#]TKS@D#)+%<&O.9?C-X9FG2=_"TI ME1G='+1Y4OG<>G?/Z5%)\7?"4TCR/X09G=@[$^622`P!Z>C$?SZG(!['I?B$ M7UXUG=6WV*YZ+%))EF.,X`P.0.3^F1S6W7C>C_&'1=:\3Z?;)H,\=W=7"PQW M#,A*%SMSTST('T'UKV$HQS^]8?@/?V]Q^5`#Z*848Y_>L/P'O[>X_*N,\1)X MICDU7^RI+R9':W:+:44QK\Y=8^!GD(#G)P3S0!VU%<1KS:\_B$RV:W\FGBSD M)BB+1DN@FX&!C+-Y6#G.!TP2:L0VVOZ->6JM=7>J12>3')GY?*.UE+YYW#.2 M1@<[.>IH`Z^BF%&.?WK#\![^WN/RI]`!1110`5'<7$-I;R7$\BQQ1J6=V/`% M25#=6XNK.>W9BJRQLA([9&*`"&[@N))8XGW-$<.,$8Y(_'D$?4'TJ:J=GIXM M+BXE$A;S3P,8VC<[_CR[?ACZFTT<;G+(K$C'(SZ_XG\Z`'5`;VT6.&1KF$1S M,%B8R#$A/0*>Y/M5;5;6"ZTZXM#/';-/&R>80,C.0?3U/YFN0F\)RRZ)H6G? M;]-_XECQEG'&\+UX[]_E/!SSB@#MHM1L9P##>V\@()^253TZ]#VR*LUP-AX0 M6TTQ(S>60NXG!A99G=(T5,*HWD\;]S<[MN\KR.O9V2*UG$LTD%Q.L:B:1%&& M;')P.F26_,T`6Z*888CG,:'/7Y1[_P")_,UR_CSQ7;^"-!CU233A>"2X6#RP MX3[RN^D9)_X0Y,D*I_?IT4DJ/N=`68CTR?6@#VS3;^' M4K"*ZAD1U<G1Q6[S@JZE>&`(VA1U MWD_GZUZ488CG,:'/7Y1[_P")_,T`__P!<_F:^1Z`"NK^&G_)2-!_Z^A_(URE=5\-0&^(^A*P!!N0" M#WX-`'UW13##$6]KF8:3]D#R!8-R[OWI)W!2>-J#KQD<'=D96GZGXEO[EX'GN[>;^U&B5O(0 MQ"(;V(;,8.`L8`(;K(/F/2O'3\:_%YSEM/.>O^BK[_XG\S0?C7XO.159M/(8X/^BCOG_$_F:^G##$WA^>PM/L MB7-[!?\+OT7[,EM_P@UMY"#:L7 MG)M49S@#R\=>:]4\#>*(/&WA]M6&G+:#SGA,;.),X&_\`B?S->/?'?5M1 MT:+0CIE]<61F:X\S[/(8]^-F,XZ_>;_OH^M`'17.E>*)/"VFVD4%PMY!>23R M#[0H!1C/Y:$^83A,Q9&3@8VEB."Q\.^(H4NYY+B\:9+F4V\+W`"S(8P"7P[8 MW$8&"""V<#%?/!\9^*#G/B'5#GK_`*6_O[^Y_,T'QGXH.<^(=4.>O^EO[^_N M?S-`'V%9/<264#W<:Q7+(#(BG(5LS&&(YS&ASU^4>_P#B?S-`#Z*888CG,:'/7Y1[_P")_,T& M&(YS&ASU^4>_^)_,T`/HIAAB.`O$+!%!_LZX. M4444`;_`(&_Y'[P]_V$8/\`T8*^QJ^.?`X#>/?#ZL`0=1@! M![_O!7V&88CG,:'/7Y1[_P")_,T`/KY4O/BKXWBOKB-->E"K(R@>3'P`?]VO MJ@PQ'.8T.>ORCW_Q/YFOB74/^0E=?]=G_F:`.K_X6SXY_P"@_+_WYB_^)H_X M6SXY_P"@_+_WYB_^)KC**`/MZS=I;&WDZ>G'*'UZBGS7R6\S1 MR1SD8!4QP.X/XJ"*EBMH8'D>*-5:0Y8COU/\R3]23W-2T`>+?&7P]K/BN]TF M31-+N[I+>.193Y+)M)*X^]C/0]*\O_X5CXU_Z%Z[_P#'?\:^N:*`/D;_`(5C MXU_Z%Z[_`/'?\:]=^#6C:IX4LM6CUO3;NU>XDC:(>2S[@`V?N@XZCK7KE%`% M`ZK#YB@0W>S!R?LDO!XQ_#]?RK@_B]87WBCPA!8Z-87=SI*R?9W3"A'!. M6`'4BO2Z*`/D;_A6/C7_`*%Z[_\`'?\`&C_A6/C7_H7KO_QW_&OKFB@#P7X0 M^%=?\+^+Y[[6=(N[:V>R>)7\LOEBZ$#"Y/0&O:VU6$%-L-V03\W^B2\#!_V? MI5^B@#DO'+/K'@G5M.L+6[FNKB`I%']ED7<N__'?\:/\`A6/C7_H7KO\`\=_QKZYHH`^28_AEXT612?#U MW@$$_=_QKZI_M2W_`.>=W_X!R_\`Q-7:*`*$>JPF-2\-VKD#UN(=1:)3<1QVD MI57QR!@$?J:NIJL)W;H;L<\?Z)+R/^^:OT4`>`?%GPEX@\3>,A?Z/H]WY?":RO?#/@UK#6+&[MKHW4DFS[.[_*0N#E01V->CT4`4!JL/F,##=[, M#!^R2\GG/\/T_.O+?C/H>K>+(]%&B:;=W1MC,9?W+)MW;,?>`S]T]*]AHH`^ M1O\`A6/C7_H7KO\`\=_QH_X5CXU_Z%Z[_P#'?\:^N:*`/&O@QH.K^$Y=:.MZ M9=VHN1"(OW+/NV[\_=!Q]X=:]6.JP^8H$-WM(.3]DEX/&/X?K5^B@#)OO$NE M:7;&YU"X>T@!"F6X@DC7)Z#)4"LS_A9/@S_H8K'_`+[K`^./_)-YO^OJ+^9K MYBH`^O/^%D^#/^ABL?\`ONK-CXX\-:IN_P#QW_&C_A6/C7_H7KO_ M`,=_QKZYHH`^7O"GP_\`%FF^+]&OKO0KN.VM[V&65]H.U5<$G`.3P.U?24FJ MPB-BD-VS@':/LDO)_P"^:OT4`4O[4M_^>=W_`.`N__'?\:/\`A6/C7_H7KO\`\=_QKZYH MH`S+/4(8K&WC>*[#I&JL/LDO!`_W:OP2&6%)"I4L,X(((_`\BI**`"BBB@`J MEJDETEA<_9%82B%V1U`8A@.!@]35VD9@JEF(`'4F@#.TV>ZEO+Q9RYC1ODW) MM`^=Q@''/RA#WZ^]:#&0'Y54C'=L>OM]/\]5#`D@$$@X..U+0`PF7G")[?.? M?V^GYGTY"9><(GM\Y]_;Z?F?3E]%`#"9><(GM\Y]_;Z?F?3D)EYPB>WSGW]O MI^9].7T4`,)EYPB>WSGW]OI^9].0F7G")[?.??V^GYGTY?10`PF7G")[?.?? MV^GYGTY"9><(GM\Y]_;Z?F?3E]%`#"9><(GM\Y]_;Z?F?3D)EYPB>WSGW]OI M^9].7T4`,)EYPB>WSGW]OI^9].0F7G")[?.??V^GYGTY?10`PF7G")[?.??V M^GYGTY"9><(GM\Y]_;Z?F?3E]%`#"9><(GM\Y]_;Z?F?3D)EYPB>WSGW]OI^ M9].7T4`,)EYPB>WSGW]OI^9].0F7G")[?.??V^GYGTY?10`PF7G")[?.??V^ MGYGTY"9><(GM\Y]_;Z?F?3E]%`#"9><(GM\Y]_;Z?F?3D)EYPB>WSGW]OI^9 M].7T4`,)EYPB>WSGW]OI^9].0F7G")[?.??V^GYGTY?10`PF7G")[?.??V^G MYGTY"9><(GM\Y]_;Z?F?3E]%`#"9><(GM\Y]_;Z?F?3D)EYPB>WSGW]OI^9] M.7T4`,)EYPB>WSGW]OI^9].0F7G")[?.??V^GYGTY?10`PF7G")[?.??V^GY MGTY"9><(GM\Y]_;Z?F?3E]%`#"9><(GM\Y]_;Z?F?3D)EYPB>WSGW]OI^9]. M7T4`,)EYPB>WSGW]OI^9].0F7G")[?.??V^GYGTY?10!YK\<"_\`PKB;*J!] MJBZ-[GV^E?,E?:.O^']-\2Z6VG:M`9K4L'*!V3D=.5(->?6_P^^&%U)8QPV, MI>^EFAMU,\X+-%NW]3QC8>M`'S?7HWP0W#XCP[0"?LLW4X[5Z0_@+X81WLEH M^G7*S)/%`5:2X&6DG'TK=\&^$O!-E?#5O#EK(LZQD"1I93\K$ MCHY[[30!VY,O.$3V^<^_M]/S/IR$R\X1/;YS[^WT_,^G+Z*`&$R\X1/;YS[^ MWT_,^G(3+SA$]OG/O[?3\SZ8,(UC8!4",6.`[MR2!V<#\*U&0L>'9>.V/?_']*K66HV]_O\@L0H!R5QD9 M(R/Q5A^'TJT64=6`^IH`:8R<_O''Y>_M[_H*#&3G]XX_+W]O?]!2[U'\0_/_ M`#Z&C>H_B'Y_Y]#0`AC)S^\_Z"@QDY_>./R]_;W_04N]1_$/S_P`^AHWJ M/XA^?^?0T`(8R<_O''Y>_M[_`*"@QDY_>./R]_;W_04N]1_$/S_SZ&C>H_B' MY_Y]#0`AC)S^\_P"@H,9.?WCC\O?V]_T%+O4?Q#\_\^AHWJ/XA^?^?0T` M(8R<_O''Y>_M[_H*#&3G]XX_+W]O?]!2[U'\0_/_`#Z&C>H_B'Y_Y]#0`AC) MS^\_Z"@QDY_>./R]_;W_04N]1_$/S_P`^AHWJ/XA^?^?0T`(8R<_O''Y> M_M[_`*"@QDY_>./R]_;W_04N]1_$/S_SZ&C>H_B'Y_Y]#0`AC)S^\_P"@ MH,9.?WCC\O?V]_T%+O4?Q#\_\^AHWJ/XA^?^?0T`(8R<_O''Y>_M[_H*#&3G M]XX_+W]O?]!2[U'\0_/_`#Z&C>H_B'Y_Y]#0`AC)S^\_Z"@QDY_>./R]_ M;W_04N]1_$/S_P`^AHWJ/XA^?^?0T`(8R<_O''Y>_M[_`*"@QDY_>./R]_;W M_04N]1_$/S_SZ&C>H_B'Y_Y]#0`AC)S^\_P"@H,9.?WCC\O?V]_T%+O4? MQ#\_\^AHWJ/XA^?^?0T`0W%G%=($G_>*&#@,`<,"2#T[1W,$\\\H_B'Y_Y]#1O4?Q#\_P#/H:`$,9.?WCC\O?V]_P!!08R< M_O''Y>_M[_H*7>H_B'Y_Y]#1O4?Q#\_\^AH`0QDY_>./R]_;W_04&,G/[QQ^ M7O[>_P"@I=ZC^(?G_GT-&]1_$/S_`,^AH`0QDY_>./R]_;W_`$%!C)S^\_M[_ M`*"EWJ/XA^?^?0T;U'\0_/\`SZ&@!#&3G]XX_+W]O?\`04^F[U'\0_/_`#Z& MG4`%%%%`!5>[LXKN,JXVMC`D"J6`SR.01@XP15BB@"CI^EP::'$+RL&`7]XP M.`"QQT]68\^M72JGJH/U%+10`W8I_A'Y?Y]3562_L(Y6BDFC#A@A!'[7$AV@>4V-TX2&:)W92X4'DJ, M9./3YAS[^]6=BG^$?E_GU-9VG:1]@>.1I_,9$*'";0>(U'<]HA^)/3I6G0`W M8I_A'Y?Y]31L4_PC\O\`/J:=10!5GO+.VD\N:1%W4&+9E&A^]M9G&2&Z[F)].!P<4`;FQ3_"/R_SZFC8I M_A'Y?Y]33J*`&[%/\(_+_/J:BGGMK8H)W1/,.U<]R>/Z_K[U/5'4K!M0CCB, MP2$-F1"F=_ISD8QU[\@4`-.K:9LW&XCP5W=.V=OIZY%7@J,H("D'G([_`.H6DR7_2"WB:6;:J#`)QGDG`_,G]:@74=/DD"+/$S M,<#'.>6ZLWAAF\EFQ\^TGC(R."#R,C(((SD5CGPSNF+_: M]BD;=L4>W:OF^;@'/!W<9].W>@#;AD@N8A+"R21MD!EY!Y(/]:?L4_PC\O\` M/J:@T^S%A9K;K(7"L[!BH'WF+8P..,XJS0`W8I_A'Y?Y]322>5'&TDFQ44$L MS<`#N3^M/IDJN\+K&X1V4A6*YVGL<=Z`*;:KIH#%KB,8!+9'(P<'/N">1VSS M5F&6"X5S%A@KE&.WN.OU[_K6(WAER=PO55\.<^23EW4*S'+ M-/29`ZD.^X!$V@<`=,GDXR3W]*`+>Q3_``C\O\^IHV*?X1^7^?4TZB@!NQ3_ M``C\O\^IJFVIZ':=F>0!-N6;;GN>!MX';<>3FM6@!NQ3_``C\O\^IHV*?X1^7^?4TZB@" MG-?V$$K1RS1JZ_>!'MD_D#D^@.3P:$O[&61(TD1FD8JN%."<;L9QZ9/N#FJ= M_HLE_<2R/=*`05C!B),:E"C#.['.XG./3.0!4NGZ1]AD1C/Y@0$*-F/X40'J M>0(^O^T>E`&CL4_PC\O\^IHV*?X1^7^?4TZB@!NQ3_"/R_SZFH+B[L[9PD\B M(S`M@CM@G_XKZ\U9K.U'39+^:-OM"HD8RJ&,G#]FSD?3'H3ZY``_^T].8@?: M(CDJ.G7<"1^F3_.KFQ3_``C\O\^IKGSX6+>7F]'[M]Z_NNA(^8_>ZYY'8="# M714`-V*?X1^7^?4T;%/\(_+_`#ZFG44`07$UM;*K3LB!VV@D=3R?Y9/YU7_M M733_`,O$9ST`&2<]!]3S@=^V:EOK62[CB1)51%D#2*R%A(HS\O!&.<'\,'() MK'3PN48,;Q6(,1YB(YC0HIX8$<'/7J.W2@#?0Q2QK(FQT<;@PY!![_K^M+L4 M_P`(_+_/J:CL[<6=E!;*Q988UC#'J<#%34`-V*?X1^7^?4TR9X88VDEVA1U. M,Y)XQ[DD]/>I:@NX99[62*&;R9&&!)MSCGGN.WO0!"FI:=(0%N8#N(`Y'S;L MXQZ]&Z>A]ZG@EM[N$30E7C;."!]<_P!:RXO#R)#)"9QY3;0JI'MV@,[$=3W< MX]`!UZUH:?:-9VQC>42R,Q9F"[02?09..,=Z`+&Q3_"/R_SZFG444`%%%%`' MQO\`\)KXK_Z&;6?_``/E_P#BJ/\`A-?%?_0S:S_X'R__`!5%%`!_PFOBO_H9 MM9_\#Y?_`(JC_A-?%?\`T,VL_P#@?+_\5110`?\`":^*_P#H9M9_\#Y?_BJ/ M^$U\5_\`0S:S_P"!\O\`\5110`?\)KXK_P"AFUG_`,#Y?_BJ/^$U\5_]#-K/ M_@?+_P#%444`'_":^*_^AFUG_P`#Y?\`XJC_`(37Q7_T,VL_^!\O_P`5110` M?\)KXK_Z&;6?_`^7_P"*H_X37Q7_`-#-K/\`X'R__%444`'_``FOBO\`Z&;6 M?_`^7_XJC_A-?%?_`$,VL_\`@?+_`/%444`'_":^*_\`H9M9_P#`^7_XJC_A M-?%?_0S:S_X'R_\`Q5%%`!_PFOBO_H9M9_\``^7_`.*H_P"$U\5_]#-K/_@? M+_\`%444`'_":^*_^AFUG_P/E_\`BJ/^$U\5_P#0S:S_`.!\O_Q5%%`!_P`) MKXK_`.AFUG_P/E_^*H_X37Q7_P!#-K/_`('R_P#Q5%%`!_PFOBO_`*&;6?\` MP/E_^*H_X37Q7_T,VL_^!\O_`,5110`?\)KXK_Z&;6?_``/E_P#BJ/\`A-?% M?_0S:S_X'R__`!5%%`!_PFOBO_H9M9_\#Y?_`(JC_A-?%?\`T,VL_P#@?+_\ M5110`?\`":^*_P#H9M9_\#Y?_BJ/^$U\5_\`0S:S_P"!\O\`\5110`?\)KXK M_P"AFUG_`,#Y?_BJ/^$U\5_]#-K/_@?+_P#%444`'_":^*_^AFUG_P`#Y?\` MXJC_`(37Q7_T,VL_^!\O_P`5110`?\)KXK_Z&;6?_`^7_P"*H_X37Q7_`-#- MK/\`X'R__%444`'_``FOBO\`Z&;6?_`^7_XJC_A-?%?_`$,VL_\`@?+_`/%4 M44`'_":^*_\`H9M9_P#`^7_XJC_A-?%?_0S:S_X'R_\`Q5%%`!_PFOBO_H9M M9_\``^7_`.*H_P"$U\5_]#-K/_@?+_\`%444`'_":^*_^AFUG_P/E_\`BJ/^ M$U\5_P#0S:S_`.!\O_Q5%%`!_P`)KXK_`.AFUG_P/E_^*H_X37Q7_P!#-K/_ M`('R_P#Q5%%`!_PFOBO_`*&;6?\`P/E_^*H_X37Q7_T,VL_^!\O_`,5110`? M\)KXK_Z&;6?_``/E_P#BJ/\`A-?%?_0S:S_X'R__`!5%%`!_PFOBO_H9M9_\ M#Y?_`(JC_A-?%?\`T,VL_P#@?+_\5110`?\`":^*_P#H9M9_\#Y?_BJ/^$U\ M5_\`0S:S_P"!\O\`\5110`?\)KXK_P"AFUG_`,#Y?_BJ/^$U\5_]#-K/_@?+ <_P#%444`'_":^*_^AFUG_P`#Y?\`XJBBB@#_V3\_ ` end GRAPHIC 33 pr1022img002.jpg GRAPHIC begin 644 pr1022img002.jpg M_]C_X``02D9)1@`!`@```0`!``#_VP!#``@&!@<&!0@'!P<)"0@*#!0-#`L+ M#!D2$P\4'1H?'AT:'!P@)"XG("(L(QP<*#7J#A(6&AXB)BI*3E)66EYB9FJ*CI*6FIZBIJK*SM+6VM[BYNL+#Q,7& MQ\C)RM+3U-76U]C9VN'BX^3EYN?HZ>KQ\O/T]?;W^/GZ_\0`'P$``P$!`0$! M`0$!`0````````$"`P0%!@<("0H+_\0`M1$``@$"!`0#!`<%!`0``0)W``$" M`Q$$!2$Q!A)!40=A<1,B,H$(%$*1H;'!"2,S4O`58G+1"A8D-.$E\1<8&1HF M)R@I*C4V-S@Y.D-$149'2$E*4U155E=865IC9&5F9VAI:G-T=79W>'EZ@H.$ MA8:'B(F*DI.4E9:7F)F:HJ.DI::GJ*FJLK.TM;:WN+FZPL/$Q<;'R,G*TM/4 MU=;7V-G:XN/DY>;GZ.GJ\O/T]?;W^/GZ_]H`#`,!``(1`Q$`/P#W^BBL[6=> MTOP]9-=ZK?06L(!QYC@%R!G"CJQXZ#F@"IXK\46'A/0Y=2OB&(^6*`,`TSGH MHSU]3Z`$]JX#5O%/BC5I)=.@DM=,-Y;H]D4F_=WJ'&X077:8DX4;.!R>Q#M? MB\3^.IK/7M#TW[)8Z=')Y=IJJE'U#`E;NWN5 M9]4T^3&3YHX#Q``G=U.[K@5Z/H^M:=KVG1W^EW<5U;OCYHV!VD@':P_A8`C( M/(S6+IGA6:.XAN=2NA)>6 M/4>(2)X>\02"+RU(V6]\QX(7@*K*,<9Y]@*`/2****`"BBB@`HHHH`****`" MBBB@`HH)`ZFB@`HHHH`****`"BBB@`HHHH`****`"BBB@`HHHZT`%%(2%&20 M/K2T`8'B_P`2)X9T)[I8VFO9F%O96ZH6,T[`[%P.<9ZXYP#7-^$_!MGO1G;,DKK+#8R$B3RT7D*RDCZ9X`S6=XJGOI?B&\"PN]Y]D$.FJ^##: M1MDR7Y)X#(?EV\$@#GFI_#.LVFG+:31W!31&F^PP3>2?.UJ_?`><]3@E6Y/4 MY)(`%`'IMKOB;QU9^' MM0@T]+::^N_DFNHH$6![>22-7:&0@M&2,E3@D9'3@ MXK'\:Q:1+X1U$:W(D-BL+,9CC=&P!VLF?XP<;>^<5S6G?$#4;5-1_M?26N-. MTF=[2[UFSD789$QN8PMAE&""=NX`Y`SBFWRW/B<#Q%J>G2RZ+9_/I6DCYCJ$ MI(\J=\?=#;@H1A\N2S$#B@##T#XDZ_I5AITGB6VAELYHMD,,,;G49(U7(N70 ML08R%.3P2>1Q7KEG=P7]E!>6TBRV\\:RQ2+T96&01]0:\9U"TNWGU2&[N]FJ M7,)N=;U`_O%T>Q(W?9(R"=S?>^[C([=Z[3X6:A]I\+-:>=.ZV!,G('H<#/KEEY M&2:Q-=/BCX67=GK)\076N:--*EO=07SL\@)R24R<#Y5.#GJ1D&K,MW#X>_:& M>2_DVIJ]BD5NQZ!CM4#\6B([=15_XX74(LT@3]TV,')XSR.,YIUAXT\-ZI:75U9:Q:S16D;2 MSX;#1HHR6*GG;[XQ7F$6A0M\4/!6DZO913&#PW"DT$RAU\Q%E'(Z'!'O3?$^ MGV6F?$77+?1;>"W@?PO=/=Q0(%524?L..<1_G0!Z2_Q#\(1FV#>(+$?:%#)^ M\Z`]"W]S_@6,5K7^N:5IFG+J%]J%M;V;@%)I)0%?(R`I_B)`)`'7M7DNC:!H M+_`.?4;K3K(W9M+B47+Q+YGFAF"?-C/4**Y;5+W59#\.-.FC6>(6\4D%K.^( M9G\UEC#>VP(/HQ]30![MI_C+PYJEC^*K2? M$/PA%;V\S>(+'9/]P"3+=<9*CE1D$<@=*XA?"6LVUSXL\3:K8:9IRW.B7%O] MELFW;CM!W'@#^'\<)!Y93?$=V[IMQSFNVTSQIX;UG46T_3M9M+ MFZ&?W:/]['7:>C?AFO%VC34/"WPOM[M?/AEU!X71^0R&=5VGVQQ6QXVTVQTC MXR>#$TRT@LD=XMR6T8C!_>D=%`[$CZ4`>H:IXU\-:)>K9ZCK-K!7M[<3QW-Q=S!)H-_91M/`;)'/4>PJ]XA\.7OA7P1X0TO4+M;F= M-85SM)*Q[LG8">H&3Z=:`/6KKQCXLA;Q-LM`'K^E^(-(UO3WO]-U""XM8R0\J-PA`R0V>AP0>:S[7QYX5OM3&G6V MO6,ETS!402<.Q.`%;HQ)Z`$YKQ47-QI>D?$^UT]?+MDOE@$48PL<1GD0@`=! MMPOTK:T_PEK_`(F\+>&(;/2-&TRVMC!<+J<$O[]@J\DA5!W$X8C/WEZ\9H`] M2E\<^%H)[V";7;*.6R)6=&DPRL."`.YR",#)SQUK@_$^JZIXA^)>AZ/HGB.Z ML-+O],6Z66U_B),IWGB/ M7_$\UZ]UO4FK'Q.8/\5/`N M"#_I,)X_Z^$Y_G0!Z+<^-_#%G>W=G?2;^&[C0X?RSRI[9!Y'XUYM#H^FZG^T%J\-_86]S$FG+,L">37(:9/-I'B#XFQZ:IA2.VN52.$[!&!-M!4#IM5FQCI0!Z?XU\=>&H_ M#VM:6FNVW]H/93QQQPR%CYFQ@%W+P&SQC.:7P'K-AI'PKT>]U6^AM8!&P\V= MPN3O?@9ZG@\#DUS?A_1]`_X49?WEK:VD]RVFW+SSM$"ZS!&R,GD;3C'X$=:@ M'AC4O%'P/\/0:4(9+NTE^U)#+C$F#(-O/RY^;^+@\@]:`.OU-K#XA:4LFAZG M%=6\)='"$C#G:5)!QC`!'T8XKKK*)[>Q@ADP'1`"`VX#V!P,@>N!7#?#3Q7! MJTNI:++HT&E:M8./MD=NJA)7'R,YV@`'*XQD\`8)%>A8H`\Y^*'A\RPP:[:V M5Y=.FVVU*&VEVF:Q!:1D(R#@N%&1R`Q[5R^B:G`KL!M)!^8]#C[K>W5Q/BWPC;);?V[H-G;VNMV$YOT>&$*UT5!+1 M,1R0X)'UH`W?#?AVV\.:>T$1,MSLGVEE8QIN7^'.3AOEZUT?AK7[7Q/X?L]6M"`D\8+Q MYR8G_B0].0^/F;\6R?QK5KS_1O$Q\-S6&E:M]1?['UG! MVRJV!'#)@<.%.=YP&`R<'-6]5\J2?,LLCYR%!R,'`)'H%!Z_P M9H,^AZ,S7\IEU6^E-Y?R$\&9P-RKC@*N`!CCC/>LO0?`6(XK8>B*.N"6YXZ]`>:[:@##\2^$M'\6V:6VKVOFK&Q:-T+3K:Y MANKR"S5GNVC8/*X4$@1MP,^N?:LRZ\,M(MM>^.>CZ=#/$UQ91RR7=QIMSY]W]\1Z)I^H6ME=ZC:PWEV!Y M$;.-S@G`Q[$Y`I=7U*ZL[BSM;.RAN9;KS`!-.8E&U=V,A6Z]*`/,/A]\-M#\ M0>"=*OM2DOIHI"\CV7VDB`N&9=VT<@X&.#7HNO\`@S0_$FDP:;J-IF"W_P"/ M?RG*&'Y=HVX[8['(X''%2:3KRZA::=<2+!:BXM))Y(&DW-&4*AL'`!52Q!;C ML>]4[CQOHT]A)+I.JV5S+%-$LB>8"51I41FQP<`/][I0!5T7X::%H=M>Q0-> MSR7=J]F\]Q.7986'**.`!T[=JOZ5X)TC1O"MYX=M!.+&[6192TF7/F+M;!QQ MQ[4LOCOPQ%IBZD=8MFLFNA9^PVHFC?`19Z'%;:);A;DQZ-,9[0&7G>7#Y;U MY'2K>J^#=)UK7]/UN\25KS3]I@*2%5!#;AD=^:AM_&VG3^)M7T8_(-,@\Z2X M))4[0#(,8_AW)GG^+VIVE^-]&OX+3S[RWMKNYM!>K:F7UN"GF,3DD@YQGOC%:EUX'T6[TO2M.DBF%KI MDJS6Z"4YW#NQ/)SSGGO6Q!JMC=)9O!GQ:I;F[M&=9XF.TIL&6//8=STH`1Y`8O\H3Z5 M%8^$-*T[Q3>^(X$E_M&\0QRLTA*[3M.`.WW%JYI&OZ5KT4DNE7\%VD3;7,39 MP<9_+T/0UEVWC73P-5?4Y(=/AL=2?3UDEER)2L2RD]!CY2W'/W>M`#['P1HE MA+KCI;O(-;9S?+)(2'#%B0/0?.U8^G_"3PQIFJQ7]LM\HBF6>.W-VQB#J05) M'5L$#J3[UT^G>)-'U>6*+3]1M[F26%ID6-LDHK!6/X$@'ZU%+XLT&&[L[675 M;5+B\(%O&7YDRQ48^I&!ZF@".R\):78>*KWQ)"LW]HWD?E2LTA*[?EX`[?<6 MGW'A?3;KQ9;>)94E.HVT'D1D/A0OS]1Z_.U5[SQUX9L6N4N-9M4>VF6"8;B2 MDA)`4X]P?I@YQ@UM6-]:ZE917EE.D]M*,QR(2%9!*A1RK(X!`88]F/!R.>EF#7344`>>K\%O!HNWF:TNFB8<6YNG\M3V/'S9^I-3_\` M"IO#?]B1Z4#?K%%)V`!VGH.%';^9KNZ*`,'PQX/TCPE;2Q:7"X: M8@S2RR%WD([DG\>F!R:WJ**`"BBB@#S34++5O`NN:KJ=C!-=^&-2+7%]'%(! M+8RL1YDZ@@EAM!.!^@49R9]4>2;3]575X1<2*+?2_$JQ_N[L,Q(L[F(#Y"3R M6(`&,C:I?#[0K^_GN=MS;"]<&^AMYBD5W@[OG7IDDO%2Z#X;TCPS9R6FCV2VL$DAE=0S-EL`9RQ)Z`#' M2M7I0`4444`> M+-9O8K8/;7/APV$3EU&Z8O(=F"<]&7GIS7:T4`>9Z5X;U6PM[?3K_0;F_M+R MRM([EX=2$(MV2%(GC=`XWJ-A;5VQGC'F.VN]8\)74(MS;W\]J6BB=U8PS8 MW)D@X)5P.AQQZ5LXI:`//;CPMJ+:#I*Q:?&;Z_ED36U,BC9#=?/=`'/.&"@; M?3BH-9TKQ7>>)M/C&F"32;'5X+F!HIX4C6!4V'Y3\Y<%V)YQA0`,UZ33)(DF MB>.1`Z.I5E89!!Z@T`<)X'TJ9_$&JZH]T9;*REN--TU`FU5B\WS'QZ@,%C!] M(L]ZL7VDZQ)/XDT^'3P\&H2B]ANVF41LRQQ+Y++G<-QBP3C&&]L'LK>WBM;> M.W@C6.&)0D<:`!54#```Z`"I*`.0TBQU74/&0\1ZCI?]EB+338B!YDE>1FD5 MRV4)&P;<#/)R3@5BR^%-8>_,OV,%/^$P75,^8G_'L(`N_K_>&,=?:O2<44`> M92^$_$0MM8>P"VE[)8V?KV.'P>3Y8'>KR^&I]+U&32TT6ZU M'1;E;=!/'J/E"W5$2+8\9<;@`F[<,DYQBN_HH`\ZDTCQ(USJAM-/E@TM'CNH M=/GNHW,]TMRLS-&^3L1E7A6(`+?='-=Y833W%C%+=6C6DSC+0,ZN8_8E>"?I 8D>YJS10`4444`%%%%`!1110`4444`?_9 ` end GRAPHIC 34 pr965img000.jpg GRAPHIC begin 644 pr965img000.jpg M_]C_X``02D9)1@`!`@```0`!``#_VP!#``@&!@<&!0@'!P<)"0@*#!0-#`L+ M#!D2$P\4'1H?'AT:'!P@)"XG("(L(QP<*#7J#A(6&AXB)BI*3E)66EYB9FJ*CI*6FIZBIJK*SM+6VM[BYNL+#Q,7& MQ\C)RM+3U-76U]C9VN'BX^3EYN?HZ>KQ\O/T]?;W^/GZ_\0`'P$``P$!`0$! M`0$!`0````````$"`P0%!@<("0H+_\0`M1$``@$"!`0#!`<%!`0``0)W``$" M`Q$$!2$Q!A)!40=A<1,B,H$(%$*1H;'!"2,S4O`58G+1"A8D-.$E\1<8&1HF M)R@I*C4V-S@Y.D-$149'2$E*4U155E=865IC9&5F9VAI:G-T=79W>'EZ@H.$ MA8:'B(F*DI.4E9:7F)F:HJ.DI::GJ*FJLK.TM;:WN+FZPL/$Q<;'R,G*TM/4 MU=;7V-G:XN/DY>;GZ.GJ\O/T]?;W^/GZ_]H`#`,!``(1`Q$`/P#W^BBL[6=> MTOP]9-=ZK?06L(!QYC@%R!G"CJQXZ#F@"IXK\46'A/0Y=2OB&(^6*`,`TSGH MHSU]3Z`$]JX#5O%/BC5I)=.@DM=,-Y;H]D4F_=WJ'&X077:8DX4;.!R>Q#M? MB\3^.IK/7M#TW[)8Z=')Y=IJJE'U#`E;NWN5 M9]4T^3&3YHX#Q``G=U.[K@5Z/H^M:=KVG1W^EW<5U;OCYHV!VD@':P_A8`C( M/(S6+IGA6:.XAN=2NA)>6 M/4>(2)X>\02"+RU(V6]\QX(7@*K*,<9Y]@*`/2****`"BBB@`HHHH`****`" MBBB@`HH)`ZFB@`HHHH`****`"BBB@`HHHH`****`"BBB@`HHHZT`%%(2%&20 M/K2T`8'B_P`2)X9T)[I8VFO9F%O96ZH6,T[`[%P.<9ZXYP#7-^$_!MGO1G;,DKK+#8R$B3RT7D*RDCZ9X`S6=XJGOI?B&\"PN]Y]D$.FJ^##: M1MDR7Y)X#(?EV\$@#GFI_#.LVFG+:31W!31&F^PP3>2?.UJ_?`><]3@E6Y/4 MY)(`%`'IMKOB;QU9^' MM0@T]+::^N_DFNHH$6![>22-7:&0@M&2,E3@D9'3@ MXK'\:Q:1+X1U$:W(D-BL+,9CC=&P!VLF?XP<;>^<5S6G?$#4;5-1_M?26N-. MTF=[2[UFSD789$QN8PMAE&""=NX`Y`SBFWRW/B<#Q%J>G2RZ+9_/I6DCYCJ$ MI(\J=\?=#;@H1A\N2S$#B@##T#XDZ_I5AITGB6VAELYHMD,,,;G49(U7(N70 ML08R%.3P2>1Q7KEG=P7]E!>6TBRV\\:RQ2+T96&01]0:\9U"TNWGU2&[N]FJ M7,)N=;U`_O%T>Q(W?9(R"=S?>^[C([=Z[3X6:A]I\+-:>=.ZV!,G('H<#/KEEY M&2:Q-=/BCX67=GK)\076N:--*EO=07SL\@)R24R<#Y5.#GJ1D&K,MW#X>_:& M>2_DVIJ]BD5NQZ!CM4#\6B([=15_XX74(LT@3]TV,')XSR.,YIUAXT\-ZI:75U9:Q:S16D;2 MSX;#1HHR6*GG;[XQ7F$6A0M\4/!6DZO913&#PW"DT$RAU\Q%E'(Z'!'O3?$^ MGV6F?$77+?1;>"W@?PO=/=Q0(%524?L..<1_G0!Z2_Q#\(1FV#>(+$?:%#)^ M\Z`]"W]S_@6,5K7^N:5IFG+J%]J%M;V;@%)I)0%?(R`I_B)`)`'7M7DNC:!H M+_`.?4;K3K(W9M+B47+Q+YGFAF"?-C/4**Y;5+W59#\.-.FC6>(6\4D%K.^( M9G\UEC#>VP(/HQ]30![MI_C+PYJEC^*K2? M$/PA%;V\S>(+'9/]P"3+=<9*CE1D$<@=*XA?"6LVUSXL\3:K8:9IRW.B7%O] MELFW;CM!W'@#^'\<)!Y93?$=V[IMQSFNVTSQIX;UG46T_3M9M+ MFZ&?W:/]['7:>C?AFO%VC34/"WPOM[M?/AEU!X71^0R&=5VGVQQ6QXVTVQTC MXR>#$TRT@LD=XMR6T8C!_>D=%`[$CZ4`>H:IXU\-:)>K9ZCK-K!7M[<3QW-Q=S!)H-_91M/`;)'/4>PJ]XA\.7OA7P1X0TO4+M;F= M-85SM)*Q[LG8">H&3Z=:`/6KKQCXLA;Q-LM`'K^E^(-(UO3WO]-U""XM8R0\J-PA`R0V>AP0>:S[7QYX5OM3&G6V MO6,ETS!402<.Q.`%;HQ)Z`$YKQ47-QI>D?$^UT]?+MDOE@$48PL<1GD0@`=! MMPOTK:T_PEK_`(F\+>&(;/2-&TRVMC!<+J<$O[]@J\DA5!W$X8C/WEZ\9H`] M2E\<^%H)[V";7;*.6R)6=&DPRL."`.YR",#)SQUK@_$^JZIXA^)>AZ/HGB.Z ML-+O],6Z66U_B),IWGB/ M7_$\UZ]UO4FK'Q.8/\5/`N M"#_I,)X_Z^$Y_G0!Z+<^-_#%G>W=G?2;^&[C0X?RSRI[9!Y'XUYM#H^FZG^T%J\-_86]S$FG+,L">37(:9/-I'B#XFQZ:IA2.VN52.$[!&!-M!4#IM5FQCI0!Z?XU\=>&H_ M#VM:6FNVW]H/93QQQPR%CYFQ@%W+P&SQC.:7P'K-AI'PKT>]U6^AM8!&P\V= MPN3O?@9ZG@\#DUS?A_1]`_X49?WEK:VD]RVFW+SSM$"ZS!&R,GD;3C'X$=:@ M'AC4O%'P/\/0:4(9+NTE^U)#+C$F#(-O/RY^;^+@\@]:`.OU-K#XA:4LFAZG M%=6\)='"$C#G:5)!QC`!'T8XKKK*)[>Q@ADP'1`"`VX#V!P,@>N!7#?#3Q7! MJTNI:++HT&E:M8./MD=NJA)7'R,YV@`'*XQD\`8)%>A8H`\Y^*'A\RPP:[:V M5Y=.FVVU*&VEVF:Q!:1D(R#@N%&1R`Q[5R^B:G`KL!M)!^8]#C[K>W5Q/BWPC;);?V[H-G;VNMV$YOT>&$*UT5!+1 M,1R0X)'UH`W?#?AVV\.:>T$1,MSLGVEE8QIN7^'.3AOEZUT?AK7[7Q/X?L]6M"`D\8+Q MYR8G_B0].0^/F;\6R?QK5KS_1O$Q\-S6&E:M]1?['UG! MVRJV!'#)@<.%.=YP&`R<'-6]5\J2?,LLCYR%!R,'`)'H%!Z_P M9H,^AZ,S7\IEU6^E-Y?R$\&9P-RKC@*N`!CCC/>LO0?`6(XK8>B*.N"6YXZ]`>:[:@##\2^$M'\6V:6VKVOFK&Q:-T+3K:Y MANKR"S5GNVC8/*X4$@1MP,^N?:LRZ\,M(MM>^.>CZ=#/$UQ91RR7=QIMSY]W]\1Z)I^H6ME=ZC:PWEV!Y M$;.-S@G`Q[$Y`I=7U*ZL[BSM;.RAN9;KS`!-.8E&U=V,A6Z]*`/,/A]\-M#\ M0>"=*OM2DOIHI"\CV7VDB`N&9=VT<@X&.#7HNO\`@S0_$FDP:;J-IF"W_P"/ M?RG*&'Y=HVX[8['(X''%2:3KRZA::=<2+!:BXM))Y(&DW-&4*AL'`!52Q!;C ML>]4[CQOHT]A)+I.JV5S+%-$LB>8"51I41FQP<`/][I0!5T7X::%H=M>Q0-> MSR7=J]F\]Q.7986'**.`!T[=JOZ5X)TC1O"MYX=M!.+&[6192TF7/F+M;!QQ MQ[4LOCOPQ%IBZD=8MFLFNA9^PVHFC?`19Z'%;:);A;DQZ-,9[0&7G>7#Y;U MY'2K>J^#=)UK7]/UN\25KS3]I@*2%5!#;AD=^:AM_&VG3^)M7T8_(-,@\Z2X M))4[0#(,8_AW)GG^+VIVE^-]&OX+3S[RWMKNYM!>K:F7UN"GF,3DD@YQGOC%:EUX'T6[TO2M.DBF%KI MDJS6Z"4YW#NQ/)SSGGO6Q!JMC=)9O!GQ:I;F[M&=9XF.TIL&6//8=STH`1Y`8O\H3Z5 M%8^$-*T[Q3>^(X$E_M&\0QRLTA*[3M.`.WW%JYI&OZ5KT4DNE7\%VD3;7,39 MP<9_+T/0UEVWC73P-5?4Y(=/AL=2?3UDEER)2L2RD]!CY2W'/W>M`#['P1HE MA+KCI;O(-;9S?+)(2'#%B0/0?.U8^G_"3PQIFJQ7]LM\HBF6>.W-VQB#J05) M'5L$#J3[UT^G>)-'U>6*+3]1M[F26%ID6-LDHK!6/X$@'ZU%+XLT&&[L[675 M;5+B\(%O&7YDRQ48^I&!ZF@".R\):78>*KWQ)"LW]HWD?E2LTA*[?EX`[?<6 MGW'A?3;KQ9;>)94E.HVT'D1D/A0OS]1Z_.U5[SQUX9L6N4N-9M4>VF6"8;B2 MDA)`4X]P?I@YQ@UM6-]:ZE917EE.D]M*,QR(2%9!*A1RK(X!`88]F/!R.>EF#7344`>>K\%O!HNWF:TNFB8<6YNG\M3V/'S9^I-3_\` M"IO#?]B1Z4#?K%%)V`!VGH.%';^9KNZ*`,'PQX/TCPE;2Q:7"X: M8@S2RR%WD([DG\>F!R:WJ**`"BBB@#S34++5O`NN:KJ=C!-=^&-2+7%]'%(! M+8RL1YDZ@@EAM!.!^@49R9]4>2;3]575X1<2*+?2_$JQ_N[L,Q(L[F(#Y"3R M6(`&,C:I?#[0K^_GN=MS;"]<&^AMYBD5W@[OG7IDDO%2Z#X;TCPS9R6FCV2VL$DAE=0S-EL`9RQ)Z`#' M2M7I0`4444`> M+-9O8K8/;7/APV$3EU&Z8O(=F"<]&7GIS7:T4`>9Z5X;U6PM[?3K_0;F_M+R MRM([EX=2$(MV2%(GC=`XWJ-A;5VQGC'F.VN]8\)74(MS;W\]J6BB=U8PS8 MW)D@X)5P.AQQZ5LXI:`//;CPMJ+:#I*Q:?&;Z_ED36U,BC9#=?/=`'/.&"@; M?3BH-9TKQ7>>)M/C&F"32;'5X+F!HIX4C6!4V'Y3\Y<%V)YQA0`,UZ33)(DF MB>.1`Z.I5E89!!Z@T`<)X'TJ9_$&JZH]T9;*REN--TU`FU5B\WS'QZ@,%C!] M(L]ZL7VDZQ)/XDT^'3P\&H2B]ANVF41LRQQ+Y++G<-QBP3C&&]L'LK>WBM;> M.W@C6.&)0D<:`!54#```Z`"I*`.0TBQU74/&0\1ZCI?]EB+338B!YDE>1FD5 MRV4)&P;<#/)R3@5BR^%-8>_,OV,%/^$P75,^8G_'L(`N_K_>&,=?:O2<44`> M92^$_$0MM8>P"VE[)8V?KV.'P>3Y8'>KR^&I]+U&32TT6ZU M'1;E;=!/'J/E"W5$2+8\9<;@`F[<,DYQBN_HH`\ZDTCQ(USJAM-/E@TM'CNH M=/GNHW,]TMRLS-&^3L1E7A6(`+?='-=Y833W%C%+=6C6DSC+0,ZN8_8E>"?I 8D>YJS10`4444`%%%%`!1110`4444`?_9 ` end GRAPHIC 35 pr965img001.jpg GRAPHIC begin 644 pr965img001.jpg M_]C_X``02D9)1@`!`0```0`!``#_VP!#``@&!@<&!0@'!P<)"0@*#!0-#`L+ M#!D2$P\4'1H?'AT:'!P@)"XG("(L(QP<*#7J#A(6&AXB)BI*3E)66EYB9FJ*CI*6FIZBIJK*SM+6VM[BYNL+#Q,7& MQ\C)RM+3U-76U]C9VN'BX^3EYN?HZ>KQ\O/T]?;W^/GZ_\0`'P$``P$!`0$! M`0$!`0````````$"`P0%!@<("0H+_\0`M1$``@$"!`0#!`<%!`0``0)W``$" M`Q$$!2$Q!A)!40=A<1,B,H$(%$*1H;'!"2,S4O`58G+1"A8D-.$E\1<8&1HF M)R@I*C4V-S@Y.D-$149'2$E*4U155E=865IC9&5F9VAI:G-T=79W>'EZ@H.$ MA8:'B(F*DI.4E9:7F)F:HJ.DI::GJ*FJLK.TM;:WN+FZPL/$Q<;'R,G*TM/4 MU=;7V-G:XN/DY>;GZ.GJ\O/T]?;W^/GZ_]H`#`,!``(1`Q$`/P#=_P"%'>"_ M^>%[_P"!)_PH_P"%'>"_^>%[_P"!)_PKTBJ6KW4EGILDT1"L&1"_\`GA>_^!)_PK>BUS4IK&2Y3R3Y M>UG4H1MRSKMQUZ*IP>?F]*Z."X^T6\??\*.\%_\ M\+W_`,"3_A1_PH[P7_SPO?\`P)/^%>BEGYQ'G_@7U_\`K?G06?G$>?\`@7U_ M^M^=`'G7_"CO!?\`SPO?_`D_X4?\*.\%_P#/"]_\"3_A7HI9^<1Y_P"!?7_Z MWYT%GYQ'G_@7U_\`K?G0!YU_PH[P7_SPO?\`P)/^%'_"CO!?_/"]_P#`D_X5 MZ*6?G$>?^!?7_P"M^=!9^<1Y_P"!?7_ZWYT`>=?\*.\%_P#/"]_\"3_A1_PH M[P7_`,\+W_P)/^%>BEGYQ'G_`(%]?_K?G06?G$>?^!?7_P"M^=`'G7_"CO!? M_/"]_P#`D_X4?\*.\%_\\+W_`,"3_A7HI9^<1Y_X%]?_`*WYT%GYQ'G_`(%] M?_K?G0!YU_PH[P7_`,\+W_P)/^%'_"CO!?\`SPO?_`D_X5Z*6?G$>?\`@7U_ M^M^=!9^<1Y_X%]?_`*WYT`>=?\*.\%_\\+W_`,"3_A1_PH[P7_SPO?\`P)/^ M%>BEGYQ'G_@7U_\`K?G06?G$>?\`@7U_^M^=`'G7_"CO!?\`SPO?_`D_X4?\ M*.\%_P#/"]_\"3_A7HI9^<1Y_P"!?7_ZWYT%GYQ'G_@7U_\`K?G0!YU_PH[P M7_SPO?\`P)/^%'_"CO!?_/"]_P#`D_X5Z*6?G$>?^!?7_P"M^=!9^<1Y_P"! M?7_ZWYT`>=?\*.\%_P#/"]_\"3_A1_PH[P7_`,\+W_P)/^%>BEGYQ'G_`(%] M?_K?G06?G$>?^!?7_P"M^=`'G7_"CO!?_/"]_P#`D_X4?\*.\%_\\+W_`,"3 M_A7HI9^<1Y_X%]?_`*WYT%GYQ'G_`(%]?_K?G0!YU_PH[P7_`,\+W_P)/^%' M_"CO!?\`SPO?_`D_X5Z*6?G$>?\`@7U_^M^=!9^<1Y_X%]?_`*WYT`>=?\*. M\%_\\+W_`,"3_A1_PH[P7_SPO?\`P)/^%>BEGYQ'G_@7U_\`K?G06?G$>?\` M@7U_^M^=`'G7_"CO!?\`SPO?_`D_X4?\*.\%_P#/"]_\"3_A7HI9^<1Y_P"! M?7_ZWYT%GYQ'G_@7U_\`K?G0!YU_PH[P7_SPO?\`P)/^%'_"CO!?_/"]_P#` MD_X5Z*6?G$>?^!?7_P"M^=!9^<1Y_P"!?7_ZWYT`>=?\*.\%_P#/"]_\"3_A M1_PH[P7_`,\+W_P)/^%>BEGYQ'G_`(%]?_K?G06?G$>?^!?7_P"M^=`'G7_" MCO!?_/"]_P#`D_X4?\*.\%_\\+W_`,"3_A7HI9^<1Y_X%]?_`*WYT%GYQ'G_ M`(%]?_K?G0!YU_PH[P7_`,\+W_P)/^%'_"CO!?\`SPO?_`D_X5Z*6?G$>?\` M@7U_^M^=!9^<1Y_X%]?_`*WYT`>=?\*.\%_\\+W_`,"3_A1_PH[P7_SPO?\` MP)/^%>BEGYQ'G_@7U_\`K?G06?G$>?\`@7U_^M^=`'G7_"CO!?\`SPO?_`D_ MX4?\*.\%_P#/"]_\"3_A7HI9^<1Y_P"!?7_ZWYT%GYQ'G_@7U_\`K?G0!YU_ MPH[P7_SPO?\`P)/^%'_"CO!?_/"]_P#`D_X5Z*6?G$>?^!?7_P"M^=!9^<1Y M_P"!?7_ZWYT`>=?\*.\%_P#/"]_\"3_A1_PH[P7_`,\+W_P)/^%>BEGYQ'G_ M`(%]?_K?G06?G$>?^!?7_P"M^=`'G7_"CO!?_/"]_P#`D_X4?\*.\%_\\+W_ M`,"3_A7HI9^<1Y_X%]?_`*WYT%GYQ'G_`(%]?_K?G0!YU_PH[P7_`,\+W_P) M/^%'_"CO!?\`SPO?_`D_X5Z*6?G$>?\`@7U_^M^=!9^<1Y_X%]?_`*WYT`>= M?\*.\%_\\+W_`,"3_A1_PH[P7_SPO?\`P)/^%>BEGYQ'G_@7U_\`K?G06?G$ M>?\`@7U_^M^=`'G7_"CO!?\`SPO?_`D_X4?\*.\%_P#/"]_\"3_A7HI9^<1Y M_P"!?7_ZWYT^@#S?_A1W@O\`YX7O_@2?\**](HH`*CFFCMXC)*V%!`Z$G).` M`!U))Q4E5=0LUO[-K=MN"R/\Z[ERK!AD<9&10`^WO+>Z+B"4/LZX_'\QD$?4 M'TJ>L[2M*_LP./M#3;E"@L./K_`(G\Z##&>O'U_P`3^=`#Z*888SG* M+SUX^O\`B?SH,,9SE%YZ\?7_`!/YT`/HIAAC.A45YK?W?B5=?E6TBU.2P^WH,/:8)!:0,H.S[ MG0[N1@KDY+"NCT-M4@OSI^J1RW?R'_3?)V(V&;/&,`_,1UY&T@')-`'3T4PP MQG.47GKQ]?\`$_G088SG*+SUX^O^)_.@!]%,,,9SE%YZ\?7_`!/YT&&,YRB\ M]>/K_B?SH`?13##&>O'U_P`3^=!AC./K_B?S MH`?13##&>O'U_P`3^=!AC./K_B?SH`?13##& M>O'U_P`3^=!AC./K_B?SH`?13##&>O'U M_P`3^=!AC./K_B?SH`?16';^(]%O)8HXFF9IYC`N M;24#?MWX)*X&58MSC@YJ.]\5^'[&XF@NK@I)$^QP;>0\D.200O(`60DC@8.: M`.@HK.L-1TW5=_V-Q+M&6_=L,`YQU`ZY./7-7C#&>O'U_P`3^=`#Z*88 M8SG*+SUX^O\`B?SH,,9SE%YZ\?7_`!/YT`/HIAAC./K_`(G\Z?0`4444`%4]4FN+?3+B6TC,DX3Y M``#@],X/7'7'?%7*CFF2WB,DA(4$#Y5+').!P.3R:`,S1;VZO&G^T$_*`<%0 M-AW.-O\`WRJ'_@7H16JQD!^55(QW;'K[?3_/6"TO[6^#&VE$@4`D@$#!R,C/ M49!&1Z&K-`#"9><(GM\Y]_;Z?F?3D)EYPB>WSGW]OI^9].7T4`,)EYPB>WSG MW]OI^9].0F7G")[?.??V^GYGTY?10`PF7G")[?.??V^GYGTY"9><(GM\Y]_; MZ?F?3E]%`#"9><(GM\Y]_;Z?F?3D)EYPB>WSGW]OI^9].7T4`,)EYPB>WSGW M]OI^9].0F7G")[?.??V^GYGTY?10!SOC?5+[1O!FK:C8LD5S;PEXY.&VG/7! M&#V_,^G/SS_PN;QU_P!!A/\`P$B_^)KWWXE_\DWU[_KU/\Q7R+0!WO\`PN;Q MU_T&$_\``2+_`.)K?\$_%/QAK/C/2M.O=226VN)@DD?V>-=PP>,AZ?< M%7RP&/+@J`V2`,^RFG>(])\0ZCJSW<%MYEH]BT"VXN=I1_-A8,5R`QPKG&X! M@-IQGD`[8F7G")[?.??V^GYGTY"9><(GM\Y]_;Z?F?3GEK+1]3TF^M7LVN+F M!O+687TP=E!^^>#]X``9Y].G(ZR@!A,O.$3V^<^_M]/S/IR$R\X1/;YS[^WT M_,^G+ZI7^KV.F2VT5Y/Y3W+B.(;6.22!S@<#+*,G`R1ZT`6B9><(GM\Y]_;Z M?F?3D)EYPB>WSGW]OI^9].2/]H?Y%`%PF7G")[?.??V^GYGTY"9> M<(GM\Y]_;Z?F?3E]%`#"9><(GM\Y]_;Z?F?3D)EYPB>WSGW]OI^9].<;Q%J] MYI#Z?]FAMWCN)9(Y&E<@J5ADD7';!,?))X'UR.?OO'-U;>"TU6,V;7PEECD5 MUP@V"0\!9#D$Q[0=QY.?:@#N29><(GM\Y]_;Z?F?3D)EYPB>WSGW]OI^9].> M$M/&NL7+WTOV6S-K:S2)(P#9C&]D0,-V2?DR2!T/0=:[:QO8=0LX[JW8M$^< M$J1R#@\'W!H`E)EYPB>WSGW]OI^9].0F7G")[?.??V^GYGTY?10`PF7G")[? M.??V^GYGTY"9><(GM\Y]_;Z?F?3E]%`#"9><(GM\Y]_;Z?F?3D)EYPB>WSGW M]OI^9].7T4`,)EYPB>WSGW]OI^9].0F7G")[?.??V^GYGTY?10`PF7G")[?. M??V^GYGTY"9><(GM\Y]_;Z?F?3E]%`#"9><(GM\Y]_;Z?F?3F"\O$L+*>\N6 MCCMX(VDDD9CA5`))/'H!^OIS:K`\<_\`(@^(?^P=/_Z+-`'&:=XG\#Z;()4\ M6)-*LLLX>3O(\8CWD"/&["Y)[EW)SFJNHZUX&U-KEKGQ@'>>;S2V`&`\J2+9 MGR_N[9#QV+$CG.?G:B@#ZDL/%'@VZ\26TNGZ_";J64K';1,RI(S@J`1L]2#U MZDGMSWQ,O.$3V^<^_M]/S/IS\>>!O^1^\/?]A&#_`-&"OL:@!A,O.$3V^<^_ MM]/S/ISC77BS2K.XN()KE5D@8*X\N0@$ACG(3!`V\D9"\YQCG,X%^URJ91A2RJH("`DO%7?B#P+>ZL-3 MF\6PFY$$MN<2X4H^X`;<8^4,?KWI7\0^!"]G)#XKM[>2V\H%X7V-*$&,.0/F M!&W@_P!T4`>B$R\X1/;YS[^WT_,^G+Z:CK(BNA!5AD$=Q3J`"BBB@`JO>V[W M5H\"2F(O@;@,\9&1U'49'7O5BB@"C8::MC)*X?=YG``7:%&YFQ^;M^&/J;C1 MQN_WO>K$QODG8P1 M021D#_62E"#]`IH`G,,1SF-#GK\H]_\`$_F:##$ORCW_Q/YFJ9;53(K?9[3:`05^TMSTY^Y[?K6#XO\9R M^"]'CU/4=/26%YE@"V\Y9MQ#'^)0,?*>]`'5&&(YS&ASU^4>_P#B?S-!AB.< MQH<]?E'O_B?S->/?\-":3_T!+W_OM/\`&C_AH32?^@)>_P#?:?XT`>PF&(YS M&ASU^4>_^)_,T&&(YS&ASU^4>_\`B?S->?>$/BM!XTUB33-.TJ2*9(6G+7$H M5=H*C^$$Y^8=J[5FU5BA%O:``Y(^TMSP>/N4`8/Q+CC'PXUU@B@_9B>N-@S^=>1_\,]:C_T';7_O MTU`'C%=5\-0&^(^A*P!!N0"#WX-=[_PSUJ/_`$';7_OTU:OAKX*:EX=\26&K MC5K2X^R2B3RMC+N]L\X_*@#V8PQ'.8T.>ORCW_Q/YFF2Q1^5(?+3.T]OK_B? MS-5I&U5HV5;>T4D8#?:6X_\`'*'?5&1E^RV8R,?\?+?_`!%`'R`?%?B,YSK^ MJG/7_3)/?W]S^9H/BOQ&91^*O$32J#K^J$%N]25U;^W;4X.?]4U>X>9JG_/K9_^!+?_`!N@"T88CG,:'/7Y1[_X MG\S7"^*-7\$WNHV]OJ6O6EK\0W^K?VO:0?:YVF\K8S;,G.,\9_*@#5O[[P+?ZE- M?OXQMDGFA$4NT*%D!,>_<,8.[RU!]02#D<#2/B/P'_:D=_'XGLX75LR1PD(D MO'\0`Y.2W)[,17#?\,]:C_T';7_OTU'_``SUJ/\`T';7_OTU`'NEI-9:C9Q7 MEJ8IK>==Z2*,AU.>?U/YFIS#$L-)$=G/] MD@6'S?/9=^!C.-AQ^=:*-JJ[LV]HV3D?Z2W'M]R@#S7XB?%&?P=XF&E1:-9W M:>0LWF2L03^9KU;X=^)?^$R\+G4YM/M[4B=X1%%RN`!Z_[Q_.O,?^&>M1 M_P"@[:_]^FKTOP)X5U/P3X>.DA[2\S.TWF^8T?4`8QM/IZT`=@88CG,:'/7Y M1[_XG\S088CG,:'/7Y1[_P")_,U3#:J)&;[/:;2``OVEN.O/W/ORCW_Q/YF@PQ'.8T.>ORCW_`,3^9JA]IU?_`*!U MM_X%'_XBC[3J_P#T#K;_`,"C_P#$4`7S#$PF&(YS&ASU^4>_\`B?S-!AB./?\-":3_T!+W_`+[3_&MOPI\7+;Q?K:Z3I^DRQ3M&T@:XE`7"]>@) M_2@#T8PQ'.8T.>ORCW_Q/YFL#QS'&/`7B%@B@_V=<'./]AO\3^9K3=M58`+; MVBG(.?M+>O3[E4=9Y[-LW*1G&P9QF@#XWHKV?\` MX9ZU'_H.VO\`WZ:C_AGK4?\`H.VO_?IJ`/-_`X#>/?#ZL`0=1@!![_O!7V&8 M8CG,:'/7Y1[_`.)_,UXGH?P-U+1=?T_5/[8M)OL=S'/Y>QEW[6!QGG&<5[!( MVJO&RK;VBL00&^TMQ[__^)_,U\2ZA_R$KK_KL_\`,U]H M>9JG_/K9_P#@2W_QNO$KC]G_`%*>YEF_MRU7S'+8\IN,G-`'BE%>S_\`#/6H M_P#0=M?^_34?\,]:C_T';7_OTU`'N5A#$=-MLQH9+>(R.&*@ M@852QR3@<#GO4E5;ZQ2^@:-I'C8C&]#SC()'/&#C!]B:`"SU&UU`,;:3>%`. M=I&021D9Z\J1^%6JIV6G1V,DKI([F3^]C`&YFXP/5V_2K31QN2';;S)$^1EF3=QW'48/OVK@K3POK$'@.XT6:RBDFE((`N!A2% M121D$$E@S\^O/->@&&(YS&ASU^4>_P#B?S-!AB.)*5:14^4(X)R3ZL*[DPQ'.8T.>ORCW_P`3^9J&YAQ7MU`()1<;XB1P]P=^58*6(,8VE.C`@]12:A8ZS'J MWG6HOFA?4=BPMN=#'\@+$[AM'S3$9!4@8(YY`.3^$OP\\2>%/%L]_J]G'#;O M9O$&6='^8NA`P#Z*:]IKFM"BU&UOWT^_ADNH?*9EOI!M!P[#:5.>3N8YW$E2 M/>NB,,1SF-#GK\H]_P#$_F:`'T4PPQ'.8T.>ORCW_P`3^9H,,1SF-#GK\H]_ M\3^9H`?13##$ORCW_Q/YF@!]%,,,1SF-#GK M\H]_\3^9H,,1SF-#GK\H]_\`$_F:`'T4PPQ'.8T.>ORCW_Q/YF@PQ'.8T.>O MRCW_`,3^9H`?13##$ORCW_Q/YF@!]%,,,1S MF-#GK\H]_P#$_F:##$ORCW_Q/YF@PQ'. M8T.>ORCW_P`3^9H`?13##$ORCW_`,3^ M9H,,1SF-#GK\H]_\3^9H`?45P)S"1;/&DN1@R*67&>>`1VSWIQAB._^)_,T&&(YS&ASU^4>_\`B?S-`'G7QQ_Y M)O-_U]1?S-?,5?3?QPC1?AQ,0B@_:HN0/<_XG\Z^9*`"O1_@=_R4B'_KUE_D M*\XKT;X(*K_$>$,H(^RS<$9[4`?3]%,,,1SF-#GK\H]_\3^9H,,1SF-#GK\H M]_\`$_F:`'T4PPQ'.8T.>ORCW_Q/YF@PQ'.8T.>ORCW_`,3^9H`?13##$ORCW_Q/YF@!]%,,,1SF-#GK\H]_P#$_F:##$ORCW_Q/YF@PQ'.8T.>ORCW_P`3^9H`?13# M#$.I'6@#/T6:^E:?[8)A@#`E3;@[G&!QS\H3I_C6JQ MDS\H4C'<_7_ZU5[2_@O6D6+?E.NY<9&2,_FK#\/I5DLHZL!]30`TF7G"I[H_B'Y_P"?0T;U'\0_/_/H:`$)EYPJ>W)]_;Z? MK03+SA4]N3[^WT_6EWJ/XA^?^?0T;U'\0_/_`#Z&@!"9><*GMR??V^GZT$R\ MX5/;D^_M]/UI=ZC^(?G_`)]#1O4?Q#\_\^AH`0F7G"I[H_B'Y_Y]#1O4?Q#\_\`/H:`$)EYPJ>W)]_;Z?K03+SA4]N3[^WT M_6EWJ/XA^?\`GT-&]1_$/S_SZ&@!"9><*GMR??V^GZT$R\X5/;D^_M]/UI=Z MC^(?G_GT-&]1_$/S_P`^AH`0F7G"I[H_B'Y M_P"?0T;U'\0_/_/H:`$)EYPJ>W)]_;Z?K03+SA4]N3[^WT_6EWJ/XA^?^?0T M;U'\0_/_`#Z&@!"9><*GMR??V^GZT$R\X5/;D^_M]/UI=ZC^(?G_`)]#1O4? MQ#\_\^AH`0F7G"I[H_B'Y_Y]#1O4?Q#\_\` M/H:`$)EYPJ>W)]_;Z?K03+SA4]N3[^WT_6EWJ/XA^?\`GT-&]1_$/S_SZ&@! M"9><*GMR??V^GZT$R\X5/;D^_M]/UI=ZC^(?G_GT-&]1_$/S_P`^AH`0F7G" MI[H_B'Y_P"?0T;U'\0_/_/H:`$)EYPJ>W)] M_;Z?K03+SA4]N3[^WT_6EWJ/XA^?^?0T;U'\0_/_`#Z&@!"9><*GMR??V^GZ MT$R\X5/;D^_M]/UI=ZC^(?G_`)]#1O4?Q#\_\^AH`0F7G"I[H_B'Y_Y]#1O4?Q#\_\`/H:`$)EYPJ>W)]_;Z?K03+SA4]N3 M[^WT_6EWJ/XA^?\`GT-&]1_$/S_SZ&@!"9><*GMR??V^GZT$R\X5/;D^_M]/ MUI=ZC^(?G_GT-&]1_$/S_P`^AH`Q/%7AJU\6:(^EZBTB6Q<2%H9`K97..2I] MOUKS*V^%/P_O7@2VU349#<,4AQ,,,P!.,^5@'`!^G/3&?8[F**YBV/+(F&#` MQRE""/<$9''0\'O6#IGAEM.>.9]3\Z9&GER8@J^;(%&_:#P0%?([EVZ=*`/. M9?A7\/(;F2W?6+Y98Y1"RFX7ACNQG]WTRI&>@(/I72^"OA[X8T/5QK&A7MS< MS+$RCS9@R[6W#.`@_N_SK3F\#^9>7T_]L%5O+B.:5/)!X1W<YXZC(QD@@&P3+SA4]N3[^WT_6@F7G" MI[W)] M_;Z?K2[U'\0_/_/H:-ZC^(?G_GT-`"$R\X5/;D^_M]/UH)EYPJ>W)]_;Z?K2 M[U'\0_/_`#Z&C>H_B'Y_Y]#0`A,O.%3VY/O[?3]:"9><*GMR??V^GZTN]1_$ M/S_SZ&C>H_B'Y_Y]#0`A,O.%3VY/O[?3]:"9><*GMR??V^GZTN]1_$/S_P`^ MAHWJ/XA^?^?0T`(3+SA4]N3[^WT_6GTW>H_B'Y_Y]#3J`"BBB@`JM>6,-Z@$ MBX=2K)(%!92&##&0>X%6:*`*.FZ5;Z6K+`TA4J%`<@[0"QP./5FZ^M72JGJH M/U%+10`W8I_A'Y?Y]3562_L(Y6BDFC#A@A!'[7$AV@ M>4V-TX2&:)W92X4'DJ,9./3YAS[^]6=BG^$?E M_GU-9VG:1]@>.1I_,9$*'";0>(U'<]HA^)/3I6G0`W8I_A'Y?Y]31L4_PC\O M\^IIU%`%6>\L[:3RYI$5R,A2,DYS@?4\X'4X..]1KJ>G2.JK<1,7(`QSG)P# M],G&>F3CK4=_ILM[=1R_:$5(MK1HT9;:ZMNW?>'7`'TS@C)JG9>'9+)H%6\5 MX8MF4:'[VUF<9(;KN8GTX'!Q0!N;%/\`"/R_SZFC8I_A'Y?Y]33J*`&[%/\` M"/R_SZFHIY[:V*"=T3S#M7/ M_(%`#3JVF;-QN(\%=W3MG;Z>N15X*C*"`I!YR._^0>2#_`%I^Q3_"/R_SZFH-/LQ86:VZR%PK.P8J M!]YBV,#CC.*LT`-V*?X1^7^?4TDGE1QM))L5%!+,W``[D_K3Z9*KO"ZQN$=E M(5BN=I[''>@"FVJZ:`Q:XC&`2V1R,'!S[@GD=L\U9AE@N% M_P"M8C>&7)W"]57PYSY).7=0K, M3C)/?TH`M[%/\(_+_/J:-BG^$?E_GU-.HH`;L4_PC\O\^IJFVIZ':=F>0!-N6;;GN>!MX M';<>3FM6@!NQ3_"/R_SZFC8I_A'Y?Y]33J*`*V3^0.3 MZ`Y/!H2_L99$C21&:1BJX4X)QNQG'ID^X.:IW^BR7]Q+(]TH!!6,&(DQJ4*, M,[L<[BIY`CZ_[1Z4`:.Q3_``C\O\^I MHV*?X1^7^?4TZB@!NQ3_``C\O\^IJ"XN[.V<)/(B,P+8([8)_P#BOKS5FL[4 M=-DOYHV^T*B1C*H8RA/KD`#_P"T].8@?:(CDJ.G7<"1^F3_`#JY ML4_PC\O\^IKGSX6+>7F]'[M]Z_NNA(^8_>ZYY'8="#714`-V*?X1^7^?4T;% M/\(_+_/J:=10!!<36ULJM.R(';:"1U/)_ED_G5?^U=-/_+Q&<]`!DG/0?4\X M'?MFI;ZUDNXXD25419`TBLA82*,_+P1CG!_#!R":QT\+E&#&\5B#$>8B.8T* M*>&!'!SUZCMTH`WT,4L:R)L='&X,.00>_P"OZTNQ3_"/R_SZFH[.W%G906RL M66&-8PQZG`Q4U`#=BG^$?E_GU-,F>&&-I)=H4=3C.2>,>Y)/3WJ6H+N&6>UD MBAF\F1A@2;O1NGH?>IX);>[A$T)5 MXVS@@?7/]:RXO#R)#)"9QY3;0JI'MV@,[$=3W42R,Q M9F"[02?09..,=Z`+&Q3_``C\O\^IIU%%`!1110!\;_\`":^*_P#H9M9_\#Y? M_BJ/^$U\5_\`0S:S_P"!\O\`\5110`?\)KXK_P"AFUG_`,#Y?_BJ/^$U\5_] M#-K/_@?+_P#%444`'_":^*_^AFUG_P`#Y?\`XJC_`(37Q7_T,VL_^!\O_P`5 M110`?\)KXK_Z&;6?_`^7_P"*H_X37Q7_`-#-K/\`X'R__%444`'_``FOBO\` MZ&;6?_`^7_XJC_A-?%?_`$,VL_\`@?+_`/%444`'_":^*_\`H9M9_P#`^7_X MJC_A-?%?_0S:S_X'R_\`Q5%%`!_PFOBO_H9M9_\``^7_`.*H_P"$U\5_]#-K M/_@?+_\`%444`'_":^*_^AFUG_P/E_\`BJ/^$U\5_P#0S:S_`.!\O_Q5%%`! M_P`)KXK_`.AFUG_P/E_^*H_X37Q7_P!#-K/_`('R_P#Q5%%`!_PFOBO_`*&; M6?\`P/E_^*H_X37Q7_T,VL_^!\O_`,5110`?\)KXK_Z&;6?_``/E_P#BJ/\` MA-?%?_0S:S_X'R__`!5%%`!_PFOBO_H9M9_\#Y?_`(JC_A-?%?\`T,VL_P#@ M?+_\5110`?\`":^*_P#H9M9_\#Y?_BJ/^$U\5_\`0S:S_P"!\O\`\5110`?\ M)KXK_P"AFUG_`,#Y?_BJ/^$U\5_]#-K/_@?+_P#%444`'_":^*_^AFUG_P`# MY?\`XJC_`(37Q7_T,VL_^!\O_P`5110`?\)KXK_Z&;6?_`^7_P"*H_X37Q7_ M`-#-K/\`X'R__%444`'_``FOBO\`Z&;6?_`^7_XJC_A-?%?_`$,VL_\`@?+_ M`/%444`'_":^*_\`H9M9_P#`^7_XJC_A-?%?_0S:S_X'R_\`Q5%%`!_PFOBO M_H9M9_\``^7_`.*H_P"$U\5_]#-K/_@?+_\`%444`'_":^*_^AFUG_P/E_\` MBJ/^$U\5_P#0S:S_`.!\O_Q5%%`!_P`)KXK_`.AFUG_P/E_^*H_X37Q7_P!# M-K/_`('R_P#Q5%%`!_PFOBO_`*&;6?\`P/E_^*H_X37Q7_T,VL_^!\O_`,51 M10`?\)KXK_Z&;6?_``/E_P#BJ/\`A-?%?_0S:S_X'R__`!5%%`!_PFOBO_H9 MM9_\#Y?_`(JC_A-?%?\`T,VL_P#@?+_\5110`?\`":^*_P#H9M9_\#Y?_BJ/ M^$U\5_\`0S:S_P"!\O\`\5110`?\)KXK_P"AFUG_`,#Y?_BJ/^$U\5_]#-K/ M_@?+_P#%444`'_":^*_^AFUG_P`#Y?\`XJC_`(37Q7_T,VL_^!\O_P`5110` M?\)KXK_Z&;6?_`^7_P"*H_X37Q7_`-#-K/\`X'R__%444`'_``FOBO\`Z&;6 ,?_`^7_XJBBB@#__9 ` end GRAPHIC 36 pr965img002.jpg GRAPHIC begin 644 pr965img002.jpg M_]C_X``02D9)1@`!`@```0`!``#_VP!#``@&!@<&!0@'!P<)"0@*#!0-#`L+ M#!D2$P\4'1H?'AT:'!P@)"XG("(L(QP<*#7J#A(6&AXB)BI*3E)66EYB9FJ*CI*6FIZBIJK*SM+6VM[BYNL+#Q,7& MQ\C)RM+3U-76U]C9VN'BX^3EYN?HZ>KQ\O/T]?;W^/GZ_\0`'P$``P$!`0$! M`0$!`0````````$"`P0%!@<("0H+_\0`M1$``@$"!`0#!`<%!`0``0)W``$" M`Q$$!2$Q!A)!40=A<1,B,H$(%$*1H;'!"2,S4O`58G+1"A8D-.$E\1<8&1HF M)R@I*C4V-S@Y.D-$149'2$E*4U155E=865IC9&5F9VAI:G-T=79W>'EZ@H.$ MA8:'B(F*DI.4E9:7F)F:HJ.DI::GJ*FJLK.TM;:WN+FZPL/$Q<;'R,G*TM/4 MU=;7V-G:XN/DY>;GZ.GJ\O/T]?;W^/GZ_]H`#`,!``(1`Q$`/P#W^BBL[6=> MTOP]9-=ZK?06L(!QYC@%R!G"CJQXZ#F@"IXK\46'A/0Y=2OB&(^6*`,`TSGH MHSU]3Z`$]JX#5O%/BC5I)=.@DM=,-Y;H]D4F_=WJ'&X077:8DX4;.!R>Q#M? MB\3^.IK/7M#TW[)8Z=')Y=IJJE'U#`E;NWN5 M9]4T^3&3YHX#Q``G=U.[K@5Z/H^M:=KVG1W^EW<5U;OCYHV!VD@':P_A8`C( M/(S6+IGA6:.XAN=2NA)>6 M/4>(2)X>\02"+RU(V6]\QX(7@*K*,<9Y]@*`/2****`"BBB@`HHHH`****`" MBBB@`HH)`ZFB@`HHHH`****`"BBB@`HHHH`****`"BBB@`HHHZT`%%(2%&20 M/K2T`8'B_P`2)X9T)[I8VFO9F%O96ZH6,T[`[%P.<9ZXYP#7-^$_!MGO1G;,DKK+#8R$B3RT7D*RDCZ9X`S6=XJGOI?B&\"PN]Y]D$.FJ^##: M1MDR7Y)X#(?EV\$@#GFI_#.LVFG+:31W!31&F^PP3>2?.UJ_?`><]3@E6Y/4 MY)(`%`'IMKOB;QU9^' MM0@T]+::^N_DFNHH$6![>22-7:&0@M&2,E3@D9'3@ MXK'\:Q:1+X1U$:W(D-BL+,9CC=&P!VLF?XP<;>^<5S6G?$#4;5-1_M?26N-. MTF=[2[UFSD789$QN8PMAE&""=NX`Y`SBFWRW/B<#Q%J>G2RZ+9_/I6DCYCJ$ MI(\J=\?=#;@H1A\N2S$#B@##T#XDZ_I5AITGB6VAELYHMD,,,;G49(U7(N70 ML08R%.3P2>1Q7KEG=P7]E!>6TBRV\\:RQ2+T96&01]0:\9U"TNWGU2&[N]FJ M7,)N=;U`_O%T>Q(W?9(R"=S?>^[C([=Z[3X6:A]I\+-:>=.ZV!,G('H<#/KEEY M&2:Q-=/BCX67=GK)\076N:--*EO=07SL\@)R24R<#Y5.#GJ1D&K,MW#X>_:& M>2_DVIJ]BD5NQZ!CM4#\6B([=15_XX74(LT@3]TV,')XSR.,YIUAXT\-ZI:75U9:Q:S16D;2 MSX;#1HHR6*GG;[XQ7F$6A0M\4/!6DZO913&#PW"DT$RAU\Q%E'(Z'!'O3?$^ MGV6F?$77+?1;>"W@?PO=/=Q0(%524?L..<1_G0!Z2_Q#\(1FV#>(+$?:%#)^ M\Z`]"W]S_@6,5K7^N:5IFG+J%]J%M;V;@%)I)0%?(R`I_B)`)`'7M7DNC:!H M+_`.?4;K3K(W9M+B47+Q+YGFAF"?-C/4**Y;5+W59#\.-.FC6>(6\4D%K.^( M9G\UEC#>VP(/HQ]30![MI_C+PYJEC^*K2? M$/PA%;V\S>(+'9/]P"3+=<9*CE1D$<@=*XA?"6LVUSXL\3:K8:9IRW.B7%O] MELFW;CM!W'@#^'\<)!Y93?$=V[IMQSFNVTSQIX;UG46T_3M9M+ MFZ&?W:/]['7:>C?AFO%VC34/"WPOM[M?/AEU!X71^0R&=5VGVQQ6QXVTVQTC MXR>#$TRT@LD=XMR6T8C!_>D=%`[$CZ4`>H:IXU\-:)>K9ZCK-K!7M[<3QW-Q=S!)H-_91M/`;)'/4>PJ]XA\.7OA7P1X0TO4+M;F= M-85SM)*Q[LG8">H&3Z=:`/6KKQCXLA;Q-LM`'K^E^(-(UO3WO]-U""XM8R0\J-PA`R0V>AP0>:S[7QYX5OM3&G6V MO6,ETS!402<.Q.`%;HQ)Z`$YKQ47-QI>D?$^UT]?+MDOE@$48PL<1GD0@`=! MMPOTK:T_PEK_`(F\+>&(;/2-&TRVMC!<+J<$O[]@J\DA5!W$X8C/WEZ\9H`] M2E\<^%H)[V";7;*.6R)6=&DPRL."`.YR",#)SQUK@_$^JZIXA^)>AZ/HGB.Z ML-+O],6Z66U_B),IWGB/ M7_$\UZ]UO4FK'Q.8/\5/`N M"#_I,)X_Z^$Y_G0!Z+<^-_#%G>W=G?2;^&[C0X?RSRI[9!Y'XUYM#H^FZG^T%J\-_86]S$FG+,L">37(:9/-I'B#XFQZ:IA2.VN52.$[!&!-M!4#IM5FQCI0!Z?XU\=>&H_ M#VM:6FNVW]H/93QQQPR%CYFQ@%W+P&SQC.:7P'K-AI'PKT>]U6^AM8!&P\V= MPN3O?@9ZG@\#DUS?A_1]`_X49?WEK:VD]RVFW+SSM$"ZS!&R,GD;3C'X$=:@ M'AC4O%'P/\/0:4(9+NTE^U)#+C$F#(-O/RY^;^+@\@]:`.OU-K#XA:4LFAZG M%=6\)='"$C#G:5)!QC`!'T8XKKK*)[>Q@ADP'1`"`VX#V!P,@>N!7#?#3Q7! MJTNI:++HT&E:M8./MD=NJA)7'R,YV@`'*XQD\`8)%>A8H`\Y^*'A\RPP:[:V M5Y=.FVVU*&VEVF:Q!:1D(R#@N%&1R`Q[5R^B:G`KL!M)!^8]#C[K>W5Q/BWPC;);?V[H-G;VNMV$YOT>&$*UT5!+1 M,1R0X)'UH`W?#?AVV\.:>T$1,MSLGVEE8QIN7^'.3AOEZUT?AK7[7Q/X?L]6M"`D\8+Q MYR8G_B0].0^/F;\6R?QK5KS_1O$Q\-S6&E:M]1?['UG! MVRJV!'#)@<.%.=YP&`R<'-6]5\J2?,LLCYR%!R,'`)'H%!Z_P M9H,^AZ,S7\IEU6^E-Y?R$\&9P-RKC@*N`!CCC/>LO0?`6(XK8>B*.N"6YXZ]`>:[:@##\2^$M'\6V:6VKVOFK&Q:-T+3K:Y MANKR"S5GNVC8/*X4$@1MP,^N?:LRZ\,M(MM>^.>CZ=#/$UQ91RR7=QIMSY]W]\1Z)I^H6ME=ZC:PWEV!Y M$;.-S@G`Q[$Y`I=7U*ZL[BSM;.RAN9;KS`!-.8E&U=V,A6Z]*`/,/A]\-M#\ M0>"=*OM2DOIHI"\CV7VDB`N&9=VT<@X&.#7HNO\`@S0_$FDP:;J-IF"W_P"/ M?RG*&'Y=HVX[8['(X''%2:3KRZA::=<2+!:BXM))Y(&DW-&4*AL'`!52Q!;C ML>]4[CQOHT]A)+I.JV5S+%-$LB>8"51I41FQP<`/][I0!5T7X::%H=M>Q0-> MSR7=J]F\]Q.7986'**.`!T[=JOZ5X)TC1O"MYX=M!.+&[6192TF7/F+M;!QQ MQ[4LOCOPQ%IBZD=8MFLFNA9^PVHFC?`19Z'%;:);A;DQZ-,9[0&7G>7#Y;U MY'2K>J^#=)UK7]/UN\25KS3]I@*2%5!#;AD=^:AM_&VG3^)M7T8_(-,@\Z2X M))4[0#(,8_AW)GG^+VIVE^-]&OX+3S[RWMKNYM!>K:F7UN"GF,3DD@YQGOC%:EUX'T6[TO2M.DBF%KI MDJS6Z"4YW#NQ/)SSGGO6Q!JMC=)9O!GQ:I;F[M&=9XF.TIL&6//8=STH`1Y`8O\H3Z5 M%8^$-*T[Q3>^(X$E_M&\0QRLTA*[3M.`.WW%JYI&OZ5KT4DNE7\%VD3;7,39 MP<9_+T/0UEVWC73P-5?4Y(=/AL=2?3UDEER)2L2RD]!CY2W'/W>M`#['P1HE MA+KCI;O(-;9S?+)(2'#%B0/0?.U8^G_"3PQIFJQ7]LM\HBF6>.W-VQB#J05) M'5L$#J3[UT^G>)-'U>6*+3]1M[F26%ID6-LDHK!6/X$@'ZU%+XLT&&[L[675 M;5+B\(%O&7YDRQ48^I&!ZF@".R\):78>*KWQ)"LW]HWD?E2LTA*[?EX`[?<6 MGW'A?3;KQ9;>)94E.HVT'D1D/A0OS]1Z_.U5[SQUX9L6N4N-9M4>VF6"8;B2 MDA)`4X]P?I@YQ@UM6-]:ZE917EE.D]M*,QR(2%9!*A1RK(X!`88]F/!R.>EF#7344`>>K\%O!HNWF:TNFB8<6YNG\M3V/'S9^I-3_\` M"IO#?]B1Z4#?K%%)V`!VGH.%';^9KNZ*`,'PQX/TCPE;2Q:7"X: M8@S2RR%WD([DG\>F!R:WJ**`"BBB@#S34++5O`NN:KJ=C!-=^&-2+7%]'%(! M+8RL1YDZ@@EAM!.!^@49R9]4>2;3]575X1<2*+?2_$JQ_N[L,Q(L[F(#Y"3R M6(`&,C:I?#[0K^_GN=MS;"]<&^AMYBD5W@[OG7IDDO%2Z#X;TCPS9R6FCV2VL$DAE=0S-EL`9RQ)Z`#' M2M7I0`4444`> M+-9O8K8/;7/APV$3EU&Z8O(=F"<]&7GIS7:T4`>9Z5X;U6PM[?3K_0;F_M+R MRM([EX=2$(MV2%(GC=`XWJ-A;5VQGC'F.VN]8\)74(MS;W\]J6BB=U8PS8 MW)D@X)5P.AQQZ5LXI:`//;CPMJ+:#I*Q:?&;Z_ED36U,BC9#=?/=`'/.&"@; M?3BH-9TKQ7>>)M/C&F"32;'5X+F!HIX4C6!4V'Y3\Y<%V)YQA0`,UZ33)(DF MB>.1`Z.I5E89!!Z@T`<)X'TJ9_$&JZH]T9;*REN--TU`FU5B\WS'QZ@,%C!] M(L]ZL7VDZQ)/XDT^'3P\&H2B]ANVF41LRQQ+Y++G<-QBP3C&&]L'LK>WBM;> M.W@C6.&)0D<:`!54#```Z`"I*`.0TBQU74/&0\1ZCI?]EB+338B!YDE>1FD5 MRV4)&P;<#/)R3@5BR^%-8>_,OV,%/^$P75,^8G_'L(`N_K_>&,=?:O2<44`> M92^$_$0MM8>P"VE[)8V?KV.'P>3Y8'>KR^&I]+U&32TT6ZU M'1;E;=!/'J/E"W5$2+8\9<;@`F[<,DYQBN_HH`\ZDTCQ(USJAM-/E@TM'CNH M=/GNHW,]TMRLS-&^3L1E7A6(`+?='-=Y833W%C%+=6C6DSC+0,ZN8_8E>"?I 8D>YJS10`4444`%%%%`!1110`4444`?_9 ` end GRAPHIC 37 sa972img000.jpg GRAPHIC begin 644 sa972img000.jpg M_]C_X``02D9)1@`!`@```0`!``#_VP!#``@&!@<&!0@'!P<)"0@*#!0-#`L+ M#!D2$P\4'1H?'AT:'!P@)"XG("(L(QP<*#7J#A(6&AXB)BI*3E)66EYB9FJ*CI*6FIZBIJK*SM+6VM[BYNL+#Q,7& MQ\C)RM+3U-76U]C9VN'BX^3EYN?HZ>KQ\O/T]?;W^/GZ_\0`'P$``P$!`0$! M`0$!`0````````$"`P0%!@<("0H+_\0`M1$``@$"!`0#!`<%!`0``0)W``$" M`Q$$!2$Q!A)!40=A<1,B,H$(%$*1H;'!"2,S4O`58G+1"A8D-.$E\1<8&1HF M)R@I*C4V-S@Y.D-$149'2$E*4U155E=865IC9&5F9VAI:G-T=79W>'EZ@H.$ MA8:'B(F*DI.4E9:7F)F:HJ.DI::GJ*FJLK.TM;:WN+FZPL/$Q<;'R,G*TM/4 MU=;7V-G:XN/DY>;GZ.GJ\O/T]?;W^/GZ_]H`#`,!``(1`Q$`/P#W^BBJ&KZU MIN@:>]_JM[#:6J=9)6QD^@'4GV'-`%#Q?XJL?!_AZXU6\*LR*1!!O"M/)CA% M_P`G`R:\MO?%_B/5_P"SM0U#7%T?0[^VV6FI:.1);PW)/W;G>NX#+"6QM=&$LEK7"@JD9'W2%(RV`=W:J^AHMQ!?Z MKX:TL8<^5XD\'W`_B_B>%6Z'K@=&''!&*`(=!TS6/#E]'I^E2?V3XICCW-:W M$S2V&O(.3(C,IQ@CV&<>C^$_B!8^([J32;RWETKQ!`,3Z;=^1VYQCFJ&C^$8[O3%L&DDNO"TT2W%A'=[X[W3I,@JJ,1N`'."2&7&.0:B^( M_A*ZN=*L?$&AL[^(=!Q-!*W+W**/F1L?>)&3CN8VZ,I]P@`HHHH`****`"BBB@`HHHH`****`"BBB@`HHH MH`****`"BBB@`HHHH`****`"BBB@`HHHH`****`"BBB@#E/'WBX^$]#1K2'[ M5J][(+;3K4#)EE/0D?W1U/X#O6%X?^&C7E]'KOCG4#KVL+RL#\VUH>NU4Z'\ ML>W>N5M]>G\0^(T\0V:Q7?B'4/,M=`LF8,NFVRDJ]S,/X6."<'GMSV[;P7J5 MG9FYL;&19=&M&*7.M74N#?7[N`VPGAAG()SU*J.E`'>````#`%'PEI)5M5UYC`I)XB@',LC8_AV\>^Z@#?\`"7B: MV\7>'+76+:&:!91AXI5(*,.HSW'H1UK;KS^S^(=GX>DM]$\861T"[1`D,O,E MI.J\9CD`X&,9#8QD9K1U[QU:P0V]GX<:#6=9OU/V."WE#H!T,LC`X6,=SWZ# MV`.-O]:N?AK\0Y]&T'3/[8@U\B[CTR&?RWM9R<.W0@(P&><`8/0"N^\*>--* M\6V\@M)1%?VY*W5D[`R0,&*D''!&0<$<=*\Z?1KK3KN]T72[]9_%-^GG^(?$ M4@PEA`1DJI_A)`^5>.!G@8VX_A^\A\/^(M%UC0K"UMO#AF71;1KG*W.I"1P9 M;@$=0I4'YN,<#!/`!]`5Y!=^./%WC?QAJ&@>`Y+.RL=..VYU2X0/ELD?*"", M$@@<'."<@5ZS=^:;*?R/]=Y;>7_O8X_6O&/V;GB_X1[78C_Q]+>*9`>NTI\N M?Q#4`3VGCWQ?X'\8V6@>/FM;RQOR%M]3MT"`$G&3@`8!(W#`(SGD=?8_-C\T MQ>8GF!=Q3/./7'I7BO[20B/AW0UQFY-XWEXZ[=GS?KMK+UWP\NN?'ZTTJ[NK MNW2^TM#>FWF*M+MC)*9[*=BY`_G0![[%/%.A>&5)%!QE&!&?PIIN[80>>;B( M19QYF\;<_6O"K/18OAW\<[#P]I$UQ_8NMVA,]JTI.`1(.O7(*9#=0"1FLCX1 M_#O2?&WAK5/[8N;YH+:\>*WMXYRL<3%%S(!W;H.>.*`/I($$`@Y!J/[1!Y_D M>='YV,^7N&['TZU\Y^%O&FL>&/A3XQL8[IY9](NDM;*<\^7YC%#M]AM+#T)K MGI-+L[WP?ILVA^'?%LGB]G2X?5/L\A20GDD,&/'(PP&>,D\T`?5QEC$JQ&1! M(PR$+#)'KBD2>&61XXY4=T.'56!*_4=J^>/'=GJ-[\3O`<=UGNHXM0FBBG264MN#2A&R>X(;.# MW&:`.F\&ZSJ5S^T%XKL;K4KJ6QM[24Q02SL8X\20_=4G`ZGIZFO8(IHIXQ)# M(DB'HR,"/S%?.VG>%K/Q?^T!XLTW4)[I+-8Y)98[>79YP#Q#8Q'\.2#CU45+ MX2G_`.%=_$KQUIFG/*^F6&ES7B6\C$@L@1US]-Q7/I0!]!O<012)')-&DC_< M5F`+?0=ZY/X@Z5XHU33;)/#&NPZ3+'*;UI&MK^VMV>&)A]P`AL8SU&#@<`<5L?$8:VOP4\(IXBBGCU*.Z MD1A"?%>Q:Y^+?@V*WN[BSGO8HK=KF!R'16D*DKZ'#'\ZR?%_@NV\$?$_P MS8>'-2U&Q76"EO/*LV9%#R"-R&]PV>>A&:`/I%)X9)'CCEC9T^^JL"5^H[4L MLT4$9DFD2-!U9V``_$U\\:YX9M/AO\9/!R^'I[J--0FBCN!++O+AI0CY/?(; MIZC-0:UKECXI^+&N1^)]+UK5](TIGM;:PTV)G5'5MI=]K`C)#'/?CL,4`?1Q MFB6'SFD018W;RPVX]MZK>3/82XL+16`BC2)R M`#D9^\I/&*`+GA[Q7\2O&NM:];Z-J&B6L.EW7DD7,#<@LX7&`W]SFO6M#74[ M71[6+7[RVN-3.?-D@79&Q).`H//`P/>O`_AQ-XUA\2>,O^$1M='G4W_^D_VB M7&#OEV[=K#_:SGVK7\:_VC_PM[X=-K`M?[2(B^T?90PB#>:>%W$G`]Z`/=F= M$QN95R<#)QDT@FC,QA$B>:!N*;AN`]<>E>+?$U0WQR\!`]-\1_\`(U8_BK1% MUC]I&/25O+NSAU*U`NI+:4J[H(68KGL"(P#0!]`13PS[O*E23:=K;&!P?0TL MLT4$9DFD2-!U9V``_$UX#HVC0>`OVBK#1-$FGCTZ]MB989)-V08G.#ZX9`12 M^$--B^,_C+7M5\2SSSZ7I\BQVFGK*R(H8MMSC!&`O)&"2?;%`&YX)UO4+_\` M:`\4VGJ:]@>XACE2)YHUD?[J%@"WT'>O M!_A=I5GH?Q^\4:9I\1BM+:RE2)"Q;:OFP\9/)_&N7LQH-OX]U>T^*5C?IJ-Q M=B2WU$S2*L8#'`P#]P\889P/3K0![1]GUH:U&^(-,FT3QCX@TU9;+2;+5E.HZAK, M1"R16(VJ850#AVDR,C);<#UJ:TU>PCL-/\1ZI9/:^'K,B'POH"#,UW)T$S+W M8YXSD#.>I!;T;QKX#T;QQIPAU&$+=Q*PM;I1\T+'OC(##('RGBO/VT74O"'Q M&TOQ-XRNK/4[.Z8V-O/%&8X]-.;>"_ MU&XCVQV+@/!81G^!!W?IE^N1QQUKR?#,Z'J:ZQX+U%]-O4C\K[+=EI[62/.= MF"2R#//RGCTKT*LOQ%I$FNZ#=Z;#J%UI\LR82ZM9"DD;`Y!!!!QQR.XR*`.. M^'L=QXLGO_&>MPPM+3D37LF1MC)'9CUP^%]1TU+WQ#XD*R>)-6;?<\@BWC'W8E/ M/`&,X]ASC-`'9VT`MK6&`.[B)%3>YRS8&,GWKR;4OAUXI\+>,;OQ+\/[JS\N M^)-UIMWD(23DX[$9R1RI&<#@UZ]6?_;VC_\`06L?_`A/\:`/-=.^'_BCQ5XN MLO$?Q`N;(1V!#6FF6>2@;.?FSGC(!/))P`2`,5@^+GUR/]HNS?P[%9RZDNG` MQQWA(C8;'W`D!;: M7XD0^,VO9OM,5OY"VX4;,;2N<]?XC0!@^%?`VNS^.)/&WC&XM&U-8O)M+2TR M8[=<$=3WP6XY^\3FO-OA*WCW_A'M8B\)Q:2UM+>,CRWC,)(9-H^9<<$8QV/( MZ5]&75[:6,0EO+F&WC)P'FD"#/IDUR'@;POH_P`/-"EACUI;B"_NU=9YV10[ MN`JJI'!R1QZT`96B?"*SL?AMJ/AB^N_.O-3/FW5XJYQ*""A4'DA2!UZ\],\9 M7AK0/BWX6LXM`M+GP_TV"0^8P98PF*FH`\6T#P7\2_A[+-?"6BV$@#SGQWX%UCQ'\0O"FMV!MA: M:5-')/YLA5B%E5R``#G@5G:Y\/O%>B^/;KQ;X&O+/??`F[LKPD*Q."WU!(SU M!!S@XKUNB@#@;O2?&OB#X?:YI^O'25U.^A,5M!9[ECC'^TS$DD_EQ6E\-?#= M]X2\"6&BZBT+74!E+F%BR_-(S#!('8BNLHH`\Y^&/@G6/"6L>*;K4S;^5J=T MLMN(I"QP&D)W<#'#K^M5_BCX`UOQ)JVC>(/#=U!%JFEME4G;`;#!E(.",@YX M/!!_/TZB@#Q#6_A_\2-7UG1?%5S?Z//K-A,I6R4%(8D5@P^;JV3G/X8-='<> M!M:G^.=AXP/V4:9;VYC?]X=Y8PNG"X]6'?I7IE%`'FNI>!=8N_C?IOBZ(VW] MF6T&QPTA$A.QUX&/]H=ZP/\`A7'C7P7XPO\`5?`EYI[V&H,3):7A("9).".X M4DX(.<''U]IHH`\<\+>`/'&@?$Y_$MW=Z5=KJ,+K?R(&79NPVU5X_B10#Z9R M*K^)/!'Q*\;6\&B>()/#OV.*<2_VC"C>:!R,*..QZ8&>.:]KHH`KZ?9QZ=IM MK8PEC%;0I"A;J0H`&?RHJQ10`5F>(="L_$N@7NCWZYM[J,H2.JGJ&'N#@CZ5 MIT4`>?\`PU\37,UK>^%==<_V]H)\F7@DW$(^Y*HZG(QGZ@_Q5;U3QM;/I2ZE M;+)<>'I$>"^O+1F6YL'Z;FCQN4+W_B7@XQ4OBSP!:^(;Z+6=/NYM)\0VXQ!J M%OU..BNO1U_STXKS_5=3U+P]J,M_JBVN@^)TC.^<@G3=J(DY/F>&_%]NP"NW99"O`8\`]F^O-3:1J_CSQEJUSX.U6 MY30)M.A#7]Y:)F:[4G`,1/"!ASN'X8Z5BZ98:AKX:R\/^&K@>'M6MC``XQUY/YUW-47TFU?78M8(?[7%;/:J=WR^6S M*QX]?:M&^\9 MZY<:OJ<.BV,DRZ=?):+`+&207!&PR%I@0L>`YQG^[D\'`ZB?PKIEQ8ZW9R+* M8M9=GN\/R245#M]/E44Q_"=C_;4NJVUS?6<\[(]REM<%([AE&`77IG``)&"1 MUH`R/'Y*W_A,BR:]QJY_T==F7_T>;CYR%]^3VKG]`O18^$(;^S@MTAU+Q1'M ML9(\_8E>X2-H]O\`"X(9N.`6XSUKT>_TFUU*YT^XN`Y>PG^T0[6P`^QDY]1A MS6;-X-TF;4)[S;,AN+N"]DB23$9GA8,K[>Q.!G'7`S0!R\7C'7+_`,016-E> M:8ER^J364VFR6[22VT$>XB=L.#R%'/"_O%QDCFMH^IZWHFD"^CGLVTZ3Q)/: M-;&!C(R2WKH6W[L`AFR!MQ@>_$-CX>\1VN8+.#6]/U%M1:=I([Y&TY4:8NQ" M%BQ!4GY2N=Q["N\/A73&TI=.*R^0M]]O'S\^;YWG9SZ;^WI0!E>#[G7;_5-> MEO\`58IK2WU2:VC@%MM*JJIMPV[@<],'G)SS6%K6WB*WAFL M@O&+AV%M*1[C=$Y_$UVMCX+O$-W>ZAI]A>V&I7#:5+?VD\%A)%#YL;JIC1F8B56W8W`\ M'\J[1O#.E/K-]JS6^Z[OK5;2=BQPT8SQ[9SR?8>E8T7@^S\,^7JVEIJM_?6- MHUM;VS7F1)&W3)S0!)X?\42>)=?W6!0Z1'ID,\F1\WGS'--9O+^.YT[1KEUBLA;[68"!&50^[CEQDX.>3QT'2># M/#:^&-`%JRPB\N)7NKMH5PAE_A'3'U2_O6-P4U`$7=H93Y$ MQ*>62R=SM`'IQGKS0!GC5==TC6M"MM7N+*[BU9G@86\#1F"81F0;26;([N?3_B!?7MLRK/;^%+F6,LN0&652,COR*Z+3?"&G:9>VUT);VY>T MC,5H+NX:46RD8(0'OCC)R<<9Q5B_\.:?J.H3WMPLAFFL)-/?:^!Y+G+#'KD= M:`.2D\0>+@NG1I-ITMUK&E3W5K%';LH@FC1'5"V^?@ M(RJISZ\(*I0^"-!@T74-)6S/V._N&N9UWD'S&((*D,+1-/\16D MVF-I,=T3'9Y68F4JQ'SY4G;WSCICK6^GAA5LA;_VSK199-ZSF].\<8QTP1]0 M>>:B@\%:39SZ=+8F[LS8P^0@@N&7S(]V_:_=ANR?7D^M`'14444`%%%%`!11 M10`4444`%%%%`'@%%%%`!1110`4444`%%%%`!1110`4444`%%%%`!1110`44 M44`%%%%`!1110`4444`%%%%`!1110`4444`%%%%`!1110`4444`%%%%`'__9 ` end GRAPHIC 38 sa972img001.jpg GRAPHIC begin 644 sa972img001.jpg M_]C_X``02D9)1@`!`@```0`!``#_VP!#``@&!@<&!0@'!P<)"0@*#!0-#`L+ M#!D2$P\4'1H?'AT:'!P@)"XG("(L(QP<*#7J#A(6&AXB)BI*3E)66EYB9FJ*CI*6FIZBIJK*SM+6VM[BYNL+#Q,7& MQ\C)RM+3U-76U]C9VN'BX^3EYN?HZ>KQ\O/T]?;W^/GZ_\0`'P$``P$!`0$! M`0$!`0````````$"`P0%!@<("0H+_\0`M1$``@$"!`0#!`<%!`0``0)W``$" M`Q$$!2$Q!A)!40=A<1,B,H$(%$*1H;'!"2,S4O`58G+1"A8D-.$E\1<8&1HF M)R@I*C4V-S@Y.D-$149'2$E*4U155E=865IC9&5F9VAI:G-T=79W>'EZ@H.$ MA8:'B(F*DI.4E9:7F)F:HJ.DI::GJ*FJLK.TM;:WN+FZPL/$Q<;'R,G*TM/4 MU=;7V-G:XN/DY>;GZ.GJ\O/T]?;W^/GZ_]H`#`,!``(1`Q$`/P#W^BBB@`HH MHH`****`"BBB@`HHHH`****`"BBB@`HHHH`****`"BBB@`HHHH`****`"BBB M@`HHHH`***S[R_GAU"VLK:WCEEF1Y"993&H52H.,*Q)^<<8['GID`T**SXM< MTR:&XF6]A\NWE,4C%Q@,#C'Y@CWQ3SK&FK'$YOK<+-L\L^8/GW_,`O&'!90?4=15"6YO;C0;NY@$=O/)"[6HE.-I*_(7ST. M<$CMTK+T+%MJ5Q),(;>U%M%';JUPC,"&G3D\F@#J*I?VG"NJR MV,C)&52)E9G`WLY<;0/4!,_C4$)MXIA(=:>0#^!Y8]I_(`UBO:1W>M7I;RE6 M>[@E^U&X0_NHA&P1`#G)=#G('!ZG`H`ZZBF2S1P('E=44LJ`L<`>E`%VHXIXIU+1.KJ#MW+R,_6L^\ M>YN_[3TV/:DAMU:%]Q7(<,N">QRIY'0,*LZ=!);6QCDX7<3''G/EKV7/?'Z= M.U`%NHKB)YHBB3R0-G[\84D?]]`C]*EJG;:A]IO[JT-M-$;=4;>^W$@8L.,$ MG^'O@\B@"VNX*-Q!;')`P":6BB@`HHHH`****`"BBB@`HHHH`****`"BBB@` MHHHH`****`"BBB@`HHHH`****`"BBB@`HHHH`*\W\4_\C)=_\`_]`6O2*\W\ M4_\`(R7?_`/_`$!:`/2****`"BBB@`HHHH`****`"BBB@`HHHH`****`"BBB M@`HHHH`****`"BBB@`HHHH`****`"BBB@`K(U>TO+Z:WBAMH-L4T'9H(E$<=N&:>UR&D9O+AA5#M7CKO3/09&,X[=-10!Q_]@ZW)'!'*++RX MK40%5F;,I,D;2ECL_P"6@1@?KWR<6H=#U.6>::\DM1)]JDNH2A+!'\E8H^"! MPHW?B`>_'344`J/<1B:.S2VABMXX425F*!)0\F25&XN$7GV[\DC:-JM MT@>Z@MA,9%>;R[AAO"YV(AV_*B$AAQDD<@9KJJ*`.4DT+5%B>&WCLA')/`[E MYG9C$K*SQ9*DG+>8Q8Y)W'CG(W-2LI+V;3]I7RH+H32ANX"-MQ[[RA_"K]%` M',ZAH-[<:N]ZK(\9=RL8N'B(S'&JL649XVR\#M)UJ*YT'5HX+[^SVLTGFAE2 M"1B0("20"`%.?D6%?]G:>O0]710!`ENHL%MMB1H(A'L'S*HQC'(Y'U%4M-T2 M#3;AIHS'N9"GRVT<9Z@]54'MTK4HH`R+*TU!]7EO=1AM>`T=N8IV;RX\C^$H M.6P"3GL!VR8+JVDO-/\`$]K"H:68O&@/=C;1@?SK>JA]CNHKR::UN84CG<22 M)+`7.X*%X(88&%'8\Y^@`+D,JSP1RIG8ZAAD8.#['I45]>1V%F]S*KL%P`B# M+.Q("J/CJR0G*LK!E(RQ'! M`ZT`4M1UN[L[&XVV41O8;?\]X/^_)_^*H`K6&^YO[J_*,D M3JD,(88+*I8E_4`EL?10>]7Y(Q+&T;%@K#!*L5/X$#_OR?_BJ M-EY_SW@_[\G_`.*H`2VL(;1R\;W#$C'[VYDD'Y,Q%1V5I);W>H3R%3]IG#I@ M\A1&BX/XJQ_&I=EY_P`]X/\`OR?_`(JFR1Z@4Q';^*?^ M1DN_^`?^@+0!Z11110`4444`%%%%`!1110`4444`%%%%`!1110`4444`%%%% M`!1110`4444`%%%%`!1110`4444`%%%%`!1110`4444`%%%%`!1110`4444` M%%%%`!1110`4444`%%%%`!1110`4444`%%%%`!1110`4444`%%%%`!1110`4 M444`%%%%`!1110`4444`%%%%`!1110`4444`%%%%`!1110`4444`%>;^*?\` ..D9+O_@'_`*`M%%`'_]D_ ` end GRAPHIC 39 sa972img002.jpg GRAPHIC begin 644 sa972img002.jpg M_]C_X``02D9)1@`!`@```0`!``#_VP!#``@&!@<&!0@'!P<)"0@*#!0-#`L+ M#!D2$P\4'1H?'AT:'!P@)"XG("(L(QP<*#7J#A(6&AXB)BI*3E)66EYB9FJ*CI*6FIZBIJK*SM+6VM[BYNL+#Q,7& MQ\C)RM+3U-76U]C9VN'BX^3EYN?HZ>KQ\O/T]?;W^/GZ_\0`'P$``P$!`0$! M`0$!`0````````$"`P0%!@<("0H+_\0`M1$``@$"!`0#!`<%!`0``0)W``$" M`Q$$!2$Q!A)!40=A<1,B,H$(%$*1H;'!"2,S4O`58G+1"A8D-.$E\1<8&1HF M)R@I*C4V-S@Y.D-$149'2$E*4U155E=865IC9&5F9VAI:G-T=79W>'EZ@H.$ MA8:'B(F*DI.4E9:7F)F:HJ.DI::GJ*FJLK.TM;:WN+FZPL/$Q<;'R,G*TM/4 MU=;7V-G:XN/DY>;GZ.GJ\O/T]?;W^/GZ_]H`#`,!``(1`Q$`/P#W^BBB@`HH MHH`****`"BBB@`HHHH`****`"BBB@`HHHH`****`"BBB@`HHHH`****`"BBB M@`HHHH`*J2SRRW3VEM(DII]XT5PT8@`,>90_0@;^!CDYP?UQ8T M[5[74V9;?S`R(&977:5.]T*GW#1L#7.2V<%U!865C=W.G06[._G272NZ$1&- M`NYFX^?/_`>U.EB>9-,CA:"T66"2"^*W*DQAF5F(.Q"D@]QCUJ0-+-)%+#-%]F(RP,9+-Z$-G`'X'-5+ MNW>=+86958$!"F-L;,@*",=@I?\`'%16.ER6NI_:#@J5F4G>2%!==BJN.`%7 MGW]>P!KT452U;4/[*TRXOC;RW"P1M(R1;FZ[:Z@@)/D2-.T,<EPNJ27]NK,I<` MR#)4`G/Y*W_?)]*`+]%43K.FKY>;Z#]X^Q,./F.0./Q('U(I#K>EJ\R'4+8- M",R+YHRHSMZ?[WR_7CK0!?HJI+J5K'IG]H"026Y0.C)SO!^Z%]2<@`=R145M MK%K+IEI>SR);"XC#[)''RG&2N?4=*`-"BJ)UG352)VOK<+*J/&2X^=7SL(]< MX/Y586ZMVV;9D.]VC7!ZLN=P^HVG\C0!-16:^LVTOEK8S17,CSI%A&R`#R3Q M_LJQ'TJ.]U*^M=1CMH[2U>.2-Y1+)=,FU4V[BP\LXY8#J:`-:BLO_A(-+"VQ M-[`3/+Y"[)`1OV[L?EC\QZBEOM:M;>"Z6WFAFO(8V98`W)8$`+_WTR@^F10! MIT5C:SKDFE3,$M%N(XK26\F(EVLJ1E<@+M().3C)'W3R*L7VO:9IPN!O(X]QZT`:-%5EU&S>$RK=1&,,J%MPQEL;1^.X?F*B36=-D M7M`%ZBF12QSPI-$ZO'(H9&4Y#`\@BGT`%%%%`!11 M10`4444`%%%%`!1110`4444`%%%%`!1110`4444`%%%%`!1110`4444`%%%% M`!7F_BG_`)&2[_X!_P"@+7I%>;^*?^1DN_\`@'_H"T`>D4444`%%%%`!1110 M`4444`%%%%`!1110`4444`%%%%`!1110`4444`%%%%`!1110`4444`%%%%`! M6?#_`,C#>_\`7I;_`/HQ>2,`_?W@$@$@ M#KU-VYM8[HP^;NQ#*)5`/!8`XS^>?J!4]`!1110!'/`EQ"8G,@4]3'(R-^:D M$5GW>D;[![:VDE_>RQ&3S[B20&,."X&XG&5W#\:U**`,_4])BU0Q>:8_W><; MX(Y.N/[P..G:HKG2#-ID.EJR+9L2MSM'EEH^254*`!DX!Z<9[FM6B@#F;GPY M=I65Y'1P&21ANS_!LQSC(YXZQ?\(O,B7MO#%"L5R:HZ3:R:C#''"T=Q=V*PJ_EW>V)HPDBQA98P3N&YB01GYL] M-M=]10!D3:,+M;*VGVI8VJ*PB@D="95P%Y!!"KC(YY)!_AYI1^'9[>X1XS%( MEI]J>S665F/F2E64OD'H?,&>>"#UZ=)10!RL'AF>WB!"0--OLXQNE8^7;P^6 M2H.WDEE?L,@C.,<5SH&O2B%9FLVC6&5)(Q.V)&DE1W).SC/7:HH`YMM)U?[;+>QO:I-<"8E2[%8&*1I&1\OS$ M!&SG'WSU`J&RT'4TNHA.+1+2.*VCC1)6=HQ&Y=N2HW%B(R2<=.G&3U5%`&!J M>@R7^HRWX\HS1+!]E5V.W*,S,&&,8;=CH<8!Z@54_L&_3[0RP6SS";S(Y)+I MSYBF=9&!7;B/*C!P#DX'05U5%`',_P!EZV^IQ32&S\A;XW,BB5LRCRBB_P`/ M&TA..D5YOX MI_Y&2[_X!_Z`M`'I%%%%`!1110`4444`%%%%`!1110`4444`%%%%`!1110`4 M444`%%%%`!1110`4444`%%%%`!1110`4444`%%%%`!1110`4444`%%%%`!11 M10`4444`%%%%`!1110`4444`%%%%`!1110`4444`%%%%`!1110`4444`%%%% M`!1110`4444`%%%%`!1110`4444`%%%%`!1110`4444`%%%%`!1110`5YOXI 0_P"1DN_^`?\`H"T44`?_V3\_ ` end GRAPHIC 40 sa972img003.jpg GRAPHIC begin 644 sa972img003.jpg M_]C_X``02D9)1@`!`@```0`!``#_VP!#``@&!@<&!0@'!P<)"0@*#!0-#`L+ M#!D2$P\4'1H?'AT:'!P@)"XG("(L(QP<*#7J#A(6&AXB)BI*3E)66EYB9FJ*CI*6FIZBIJK*SM+6VM[BYNL+#Q,7& MQ\C)RM+3U-76U]C9VN'BX^3EYN?HZ>KQ\O/T]?;W^/GZ_\0`'P$``P$!`0$! M`0$!`0````````$"`P0%!@<("0H+_\0`M1$``@$"!`0#!`<%!`0``0)W``$" M`Q$$!2$Q!A)!40=A<1,B,H$(%$*1H;'!"2,S4O`58G+1"A8D-.$E\1<8&1HF M)R@I*C4V-S@Y.D-$149'2$E*4U155E=865IC9&5F9VAI:G-T=79W>'EZ@H.$ MA8:'B(F*DI.4E9:7F)F:HJ.DI::GJ*FJLK.TM;:WN+FZPL/$Q<;'R,G*TM/4 MU=;7V-G:XN/DY>;GZ.GJ\O/T]?;W^/GZ_]H`#`,!``(1`Q$`/P#W^BBB@`HH MHH`****`"BBB@`HHHH`****`"BBB@`HHHH`****`"BBB@`HHHH`****`"BBB M@`HHHH`****`"BBB@`HHHH`0D*"20`.23VK.77;!K>*X5IS',P6(BVES(2I8 M;1MR1@$Y''%)XB,@\.:@L0?S)(&C0QJ25+#:#@>F<_A6/=I>S)91:/=-.UND M\\N":L;O,BW1,IW+E6Z@^A^E`#J*P(M9NH;J<7TEN(HK@P*L%O M(\DN(U4VX`@!\8)P5.,Y.X8H`T MZ*S(=66\OK6*TR8G$S2&2)D8>654C#`$'.`3ZT`:-%9Z:YI[W*6XF;SG8)Y9B<,I M*A@&!'RY![XZ$=0:T*`"BBB@`HHHH`****`"BBB@`HHHH`****`"BBB@`HHH MH`****`"BBB@`HHHH`****`"BBB@`HHHH`****`"BBB@`KS?Q3_R,EW_`,`_ M]`6O2*\W\4_\C)=_\`_]`6@#TBBBB@`HHHH`****`"BBB@`HHHH`****`"BB MB@`HHHH`****`"BBB@`HHHH`****`"BBB@`HHHH`****`"BBB@`HHHH`;)%' M*FR1%=?1AD5#]@L_^?2#_OV*L44`9.M)!I^AW]Y#:6IF@MWDC#P@@L%)`(&, MY..,U!I'EW5U>VTT-C<"V*`7$$`56)&2I&3\PX)P?XA6GJ%D+^U%NS[%\V-V MXSN"NK%?H0,?C5E55%"JH4#L!B@"#[!9_P#/I!_W[%31Q1Q)LC147T48%.HH M`JW-I-/('CU"YMUQC9$L9'U^9"?UJRH*H`6+$#!8XR??BEHH`P6T6]@E2:SN M85G_`-*!>1"=OG2*X8#N5"@8.,^HQ5=?#EY;+%%:7%N((+F.6)959LA8?*7= MR,[<*P`ZE>HSQTU%`&+H>C7&F9-U%#%"3! M)"L\\8%Z0I47+B3S,G'."3(I]G]A73T4`WDBDDMW,2(<(L)9D1<]@Y4Y[X/3@#HZ*` M,6'1'ANX)PT1;[=-=SO@[GW*Z(/P5E'_``&MJBB@`HHHH`****`"BBB@`HHH MH`****`"BBB@`HHHH`****`"BBB@`HHHH`****`"BBB@`HHHH`****`"BBB@ M`HHHH`*\W\4_\C)=_P#`/_0%KTBO-_%/_(R7?_`/_0%H`](HHHH`****`"BB MB@`HHHH`****`"BBB@`HHHH`****`"BBB@`HHHH`****`"BBB@`HHHH`**** M`"BBB@`HHHH`****`"BBB@`HHHH`****`"BBB@`HHHH`****`"BBB@`HHHH` M****`"BBB@`HHHH`****`"BBB@`HHHH`****`"BBB@`HHHH`****`"BBB@`H GHHH`****`"BBB@`HHHH`****`"O-_%/_`",EW_P#_P!`6BB@#__9 ` end EX-99 41 ovafpart2.htm PART 2 OF 485B POS nvcsr
    REPORT OF INDEPENDENT REGISTERED PUBLIC ACCOUNTING FIRM
    The Board of Trustees and Shareholders of Oppenheimer Variable Account Funds:
    We have audited the accompanying statement of assets and liabilities of Oppenheimer Balanced Fund/VA (one of the portfolios constituting the Oppenheimer Variable Account Funds ), including the statement of investments, as of December 31, 2010, the related statement of operations for the year then ended, and the statements of changes in net assets and the financial highlights for each of the years in the two-year period then ended. These financial statements and financial highlights are the responsibility of the Fund’s management. Our responsibility is to express an opinion on these financial statements and financial highlights based on our audits. The accompanying financial highlights of Oppenheimer Balanced Fund/VA for the years ended prior to January 1, 2009 were audited by other auditors whose report dated February 11, 2009 expressed an unqualified opinion on those financial highlights.
         We conducted our audits in accordance with the standards of the Public Company Accounting Oversight Board (United States). Those standards require that we plan and perform the audits to obtain reasonable assurance about whether the financial statements and financial highlights are free of material misstatement. An audit includes examining, on a test basis, evidence supporting the amounts and disclosures in the financial statements. Our procedures included confirmation of securities owned as of December 31, 2010, by correspondence with the custodian, transfer agent and brokers, or by other appropriate auditing procedures where replies from brokers were not received. An audit also includes assessing the accounting principles used and significant estimates made by management, as well as evaluating the overall financial statement presentation. We believe that our audits provide a reasonable basis for our opinion.
         In our opinion, the financial statements and financial highlights referred to above present fairly, in all material respects, the financial position of Oppenheimer Balanced Fund/VA as of December 31, 2010, the results of its operations for the year then ended, and the changes in its net assets and the financial highlights for each of the years in the two-year period then ended, in conformity with U.S. generally accepted accounting principles.
    /s/ KPMG llp
    Denver, Colorado
    February 16, 2011


    STATEMENT OF INVESTMENTS December 31, 2010
                     
        Shares     Value  
     
    Common Stocks—49.4%
                   
    Consumer Discretionary—1.9%
                   
    Media—1.9%
                   
    Jupiter Telecommunications Co. Ltd.
        4,393     $ 4,620,793  
     
                 
    Consumer Staples—5.4%
                   
    Food & Staples Retailing—0.6%
                   
    CVS Caremark Corp.
        44,100       1,533,357  
     
                 
    Food Products—2.2%
                   
    Nestle SA
        87,780       5,140,059  
     
                 
    Tobacco—2.6%
                   
    Altria Group, Inc.
        83,010       2,043,706  
    Lorillard, Inc.
        50,660       4,157,160  


                6,200,866  
     
                   
    Energy—4.9%
                   
    Energy Equipment & Services—1.6%
                   
    Halliburton Co.
        49,300       2,012,919  
    Schlumberger Ltd.
        20,400       1,703,400  


                3,716,319  
     
                   
    Oil, Gas & Consumable Fuels—3.3%
                   
    BP plc, ADR
        29,250       1,291,973  
    Chevron Corp.
        56,870       5,189,388  
    CONSOL Energy, Inc.
        31,300       1,525,562  


                8,006,923  
     
                   
    Financials—5.9%
                   
    Diversified Financial Services—2.3%
                   
    JPMorgan Chase & Co.
        132,900       5,637,618  
     
                 
    Insurance—3.6%
                   
    Assurant, Inc.
        51,500       1,983,780  
    Everest Re Group Ltd.
        34,210       2,901,692  
    MetLife, Inc.
        82,200       3,652,968  


                8,538,440  
     
                   
    Health Care—9.8%
                   
    Biotechnology—4 .2%
                   
    Amgen, Inc.1
        46,400       2,547,360  
    Genzyme Corp. (General Division)1
        39,680       2,825,216  
    Gilead Sciences, Inc.1
        77,790       2,819,110  
    Vanda Pharmaceuticals, Inc.1
        199,000       1,882,540  


                10,074,226  
     
                   
    Health Care Providers & Services—1.4%
                   
    Humana, Inc.1
        31,730       1,736,900  
    WellPoint, Inc.1
        30,050       1,708,643  


                3,445,543  
                     
        Shares     Value  
     
    Pharmaceuticals—4.2%
                   
    Merck & Co., Inc.
        113,127     $ 4,077,097  
    Mylan, Inc.1
        281,030       5,938,164  


                10,015,261  
     
                   
    Industrials—1.2%
                   
    Aerospace & Defense—0.1%
                   
    AerCap Holdings NV1
        9,000       127,080  
    Industrial Conglomerates—0.3%
                   
    Tyco International Ltd.
        20,650       855,736  
    Machinery—0.8%
                   
    Navistar International Corp.1
        33,720       1,952,725  
    Information Technology—17.8%
                   
    Communications Equipment—3.0%
                   
    Harris Corp.
        33,050       1,497,165  
    Orbcomm, Inc.1
        375       971  
    QUALCOMM, Inc.
        113,360       5,610,186  


                7,108,322  
     
                   
    Internet Software & Services—4.1%
                   
    eBay, Inc.1
        128,390       3,573,094  
    Google, Inc., Cl. A1
        10,670       6,337,660  


                9,910,754  
     
                   
    IT Services—0.7%
                   
    MasterCard, Inc., Cl. A
        7,300       1,636,003  
    Software—10.0%
                   
    Microsoft Corp.
        73,290       2,046,257  
    Oracle Corp.
        128,700       4,028,310  
    Take-Two Interactive Software, Inc.1
        1,048,576       12,834,570  
    THQ, Inc.1
        853,300       5,170,998  


                24,080,135  
     
                   
    Materials—1.8%
                   
    Chemicals—1.8%
                   
    Celanese Corp., Series A
        46,000       1,893,820  
    Potash Corp. of Saskatchewan, Inc.
        16,200       2,508,246  


                4,402,066  
     
                   
    Metals & Mining—0.0%
                   
    Kaiser Aluminum Corp.
        114       5,710  
    Telecommunication Services—0.0%
                   
    Diversified Telecommunication Services—0.0%
                   
    XO Holdings, Inc.1
        85       58  
    Utilities—0.7%
                   
    Electric Utilities—0.7%
                   
    Edison International, Inc.
        40,500       1,563,300  
     
                 
    Total Common Stocks (Cost $103,841,503)
                118,571,294  

                     
        Principal        
        Amount     Value  
     
    Asset-Backed Securities—3.8%
                   
    Ally Auto Receivables Trust 2010-2,
                   
    Automobile Receivables Nts.,
                   
    Series 2010-2, Cl. A2, 0.89%, 9/17/12
      $ 235,000     $ 235,472  
    Ally Auto Receivables Trust 2010-4,
                   
    Automobile Receivables Nts.,
                   
    Series 2010-4, Cl. A3, 0.91%, 11/17/14
        30,000       29,823  
    Ally Master Owner Trust 2010-1,
                   
    Asset-Backed Certificates,
                   
    Series 2010-1, Cl. A, 2.01%, 1/15/132,3
        240,000       244,477  
    Ally Master Owner Trust 2010-3,
                   
    Asset-Backed Certificates,
                   
    Series 2010-3, Cl. A, 2.88%, 4/15/132
        200,000       204,943  
    AmeriCredit Automobile Receivables
                   
    Trust 2009-1, Automobile
                   
    Receivables-Backed Nts.,
                   
    Series 2009-1, Cl. A3, 3.04%, 10/15/13
        160,000       162,940  
    AmeriCredit Automobile Receivables
                   
    Trust 2010-4, Automobile
                   
    Receivables-Backed Nts.,
                   
    Series 2010-4, Cl. D, 4.20%, 11/8/16
        120,000       118,275  
    AmeriCredit Prime Automobile
                   
    Receivables Trust 2010-1, Automobile
                   
    Receivables Nts., Series 2010-1,
                   
    Cl. A2, 0.97%, 1/15/13
        66,685       66,715  
    AmeriCredit Prime Automobile
                   
    Receivables Trust 2010-2,
                   
    Automobile Receivables Nts.,
                   
    Series 2010-2, Cl. A2, 1.22%, 10/8/13
        100,000       100,320  
    Bank of America Auto Trust 2010-2,
                   
    Automobile Receivables,
                   
    Series 2010-2, Cl. A2, 0.91%, 10/15/12
        150,000       150,301  
    Capital One Multi-Asset
                   
    Execution Trust, Credit Card
                   
    Asset-Backed Certificates,
                   
    Series 2008-A5, Cl. A5, 4.85%, 2/18/14
        260,000       263,252  
    CarMax Auto Owner Trust 2010-3,
                   
    Automobile Asset-Backed Nts.,
                   
    Series 2010-3, Cl. A3, 0.99%, 2/17/15
        65,000       64,644  
    Centre Point Funding LLC,
                   
    Asset-Backed Nts., Series 2010-1A,
                   
    Cl. 1, 5.43%, 7/20/152
        69,920       72,328  
    Chrysler Financial Lease Trust,
                   
    Asset-Backed Nts., Series 2010-A,
                   
    Cl. A2, 1.78%, 6/15/112
        127,849       128,015  
    Citibank Credit Card Issuance Trust,
                   
    Credit Card Receivable Nts.,
                   
    Series 2003-C4, Cl. C4, 5%, 6/10/15
        180,000       189,374  
    Citibank Omni Master Trust, Credit
                   
    Card Receivables, Series 2009-A8,
                   
    Cl. A8, 2.36%, 5/16/162,3
        325,000       329,151  
    CNH Equipment Trust,
                   
    Asset-Backed Certificates:
                   
    Series 2009-B, Cl. A3, 2.97%, 3/15/13
        81,004       81,358  
    Series 2010-A, Cl. A2, 0.81%, 3/25/15
        243,480       243,593  
                     
        Principal        
        Amount     Value  
     
    Asset-Backed Securities Continued
                   
    Countrywide Home Loans,
                   
    Asset-Backed Certificates:
                   
    Series 2002-4, Cl. A1, 1.001%, 2/25/333
      $ 13,799     $ 12,529  
    Series 2005-16,Cl. 2AF2, 5.382%, 5/1/363
        271,497       232,567  
    Series 2005-17, Cl. 1AF2, 5.363%, 5/1/363
        153,866       123,797  
    CWABS Asset-Backed Certificates
                   
    Trust 2006-25, Asset-Backed
                   
    Certificates, Series 2006-25,
                   
    Cl. 2A2, 0.381%, 6/25/473
        480,000       429,750  
    DaimlerChrysler Auto Trust 2007-A,
                   
    Automobile Receivable Nts.,
                   
    Series 2007-A, Cl. A4, 5.28%, 3/8/13
        251,974       258,154  
    DT Auto Owner Trust,
                   
    Automobile Receivable Nts.,
                   
    Series 2009-1,Cl. A1, 2.98%, 10/15/152
        135,196       136,247  
    Ford Credit Auto Lease Trust,
                   
    Automobile Receivable Nts.:
                   
    Series 2010-A, Cl. A, 1.04%, 3/15/132
        130,670       130,788  
    Series 2010-B, Cl. A2, 0.75%, 10/15/124
        245,000       245,000  
    Ford Credit Auto Owner Trust,
                   
    Automobile Receivable Nts.:
                   
    Series 2009-E, Cl. A2, 0.80%, 3/15/12
        241,090       241,214  
    Series 2010-A, Cl. A4, 2.15%, 6/15/15
        350,000       356,622  
    Ford Credit Floorplan Master Owner
                   
    Trust 2009-2, Asset-Backed Nts.,
                   
    Series 2009-2, Cl. A, 1.81%, 9/15/123
        245,000       248,696  
    Ford Credit Floorplan Master Owner
                   
    Trust 2010-1, Asset-Backed Nts.,
                   
    Series 2010-1,Cl. A, 1.91%, 12/15/142,3
        250,000       254,708  
    GE Capital Credit Card Master
                   
    Note Trust, Asset-Backed Nts.,
                   
    Series 2009-2, Cl. A, 3.69%, 7/15/15
        105,000       109,111  
    Harley-Davidson Motorcycle
                   
    Trust 2006-3, Motorcycle
                   
    Contract-Backed Nts.,
                   
    Series 2006-3, Cl. A4, 5.22%, 6/15/13
        210,185       213,927  
    Harley-Davidson Motorcycle
                   
    Trust 2009-2, Motorcycle
                   
    Contract-Backed Nts.,
                   
    Series 2009-2, Cl. A2, 2%, 7/15/12
        18,072       18,083  
    Hertz Vehicle Financing LLC,
                   
    Automobile Receivable Nts.,
                   
    Series 2010-1A, Cl. A1, 2.60%, 2/15/142
        240,000       242,319  
    HSBC Home Equity Loan Trust 2005-3,
                   
    Closed-End Home Equity Loan
                   
    Asset-Backed Certificates,
                   
    Series 2005-3, Cl. A1, 0.521%, 1/20/353
        233,073       223,831  
    HSBC Home Equity Loan Trust 2006-4,
                   
    Closed-End Home Equity Loan
                   
    Asset-Backed Certificates,
                   
    Series 2006-4, Cl. A2V, 0.371%, 3/20/363
        68,743       68,480  
    MBNA Credit Card Master Note Trust,
                   
    Credit Card Receivables,
                   
    Series 2003-C7, Cl. C7, 1.61%, 3/15/163
        255,000       252,182  

                     
        Principal        
        Amount     Value  
     
    Asset-Backed Securities Continued
                   
    Merrill Auto Trust Securitization 2007-1,
                   
    Asset-Backed Nts.,
                   
    Series 2007-1, Cl. A4, 0.32%, 12/15/133
      $ 156,440     $ 156,030  
    Morgan Stanley Resecuritization Trust,
                   
    Automobile Receivable Nts.,
                   
    Series 2010-F, Cl. A, 0.511%, 6/17/112,3
        485,000       483,920  
    Navistar Financial Dealer Note
                   
    Master Owner Trust, Asset-Backed Nts.,
                   
    Series 2010-1, Cl. A, 1.911%, 1/26/152,3
        405,000       405,987  
    Nissan Auto Lease Trust 2010-B,
                   
    Automobile Asset-Backed Nts.,
                   
    Series 2010-B, Cl. A3, 1%, 12/15/13
        220,000       219,733  
    Nissan Master Owner Trust,
                   
    Automobile Receivable Nts.,
                   
    Series 2010-AA, Cl. A, 1.41%, 1/15/132,3
        240,000       242,834  
    RASC Series 2006-KS7 Trust,
                   
    Home Equity Mtg. Asset-Backed
                   
    Pass-Through Certificates,
                   
    Series 2006-KS7, Cl. A2, 0.361%, 9/25/363
        110,085       109,488  
    Santander Drive Auto Receivables
                   
    Trust 2010-2, Automobile
                   
    Receivables Nts.,
                   
    Series 2010-2, Cl. A2, 0.95%, 8/15/13
        225,000       225,301  
    Santander Drive Auto Receivables
                   
    Trust 2010-3, Automobile
                   
    Receivables Nts.,
                   
    Series 2010-3, Cl. C, 3.06%, 11/15/17
        235,000       233,846  
    Volkswagen Auto Lease Trust 2010-A,
                   
    Automobile Receivable Nts.,
                   
    Series 2010-A, Cl. A3, 0.99%, 11/20/13
        215,000       214,643  
    World Financial Network
                   
    Credit Card Master Note Trust,
                   
    Credit Card Receivables,
                   
    Series 2009-A, Cl. A, 4.60%, 9/15/15
        245,000       251,935  
     
                 
    Total Asset-Backed Securities
    (Cost $9,128,365)
                9,026,703  
     
                   
    Mortgage-Backed Obligations—28.2%
                   
    Government Agency—22.9%
                   
    FHLMC/FNMA/FHLB/Sponsored—22.8%
                   
    Federal Home Loan Mortgage Corp.:
                   
    5.50%, 9/1/39
        1,254,824       1,338,203  
    7%, 10/1/37
        1,036,026       1,171,236  
    Federal Home Loan Mortgage Corp.,
                   
    Gtd. Real Estate Mtg. Investment
                   
    Conduit Multiclass Pass-Through Certificates:
                   
    Series 2006-11, Cl. PS, 23.611%, 3/25/363
        242,857       342,927  
    Series 2426, Cl. BG, 6%, 3/15/17
        423,404       459,707  
    Series 2427, Cl. ZM, 6.50%, 3/15/32
        452,949       504,856  
    Series 2626, Cl. TB, 5%, 6/1/33
        695,185       747,297  
    Series 2638, Cl. KG, 4%, 11/1/27
        619,589       625,254  
    Series 2648, Cl. JE, 3%, 2/1/30
        156,599       157,315  
                     
        Principal        
        Amount     Value  
     
    FHLMC/FNMA/FHLB/Sponsored Continued
                   
    Federal Home Loan Mortgage Corp.,
                   
    Gtd. Real Estate Mtg. Investment
                   
    Conduit Multiclass Pass-Through
                   
    Certificates: Continued
                   
    Series 2663, Cl. BA, 4%, 8/1/16
      $ 401,620     $ 409,451  
    Series 2676, Cl. KB, 5%, 2/1/20
        83,277       84,122  
    Series 2686, Cl. CD, 4.50%, 2/1/17
        214,423       218,785  
    Series 2907, Cl. GC, 5%, 6/1/27
        93,049       94,746  
    Series 2911, Cl. CU, 5%, 2/1/28
        274,293       279,252  
    Series 2929, Cl. PC, 5%, 1/1/28
        95,391       96,810  
    Series 2952, Cl. GJ, 4.50%, 12/1/28
        46,059       46,499  
    Series 3019, Cl. MD, 4.75%, 1/1/31
        288,920       296,968  
    Series 3025, Cl. SJ, 23.796%, 8/15/353
        73,546       102,532  
    Series 3094, Cl. HS, 23.429%, 6/15/343
        144,226       189,495  
    Series 3242, Cl. QA, 5.50%, 3/1/30
        151,623       156,205  
    Series 3291, Cl. NA, 5.50%, 10/1/27
        45,991       46,525  
    Series 3306, Cl. PA, 5.50%, 10/1/27
        90,620       91,580  
    Series R001, Cl. AE, 4.375%, 4/1/15
        67,162       68,504  
    Federal Home Loan Mortgage Corp.,
                   
    Interest-Only Stripped
                   
    Mtg.-Backed Security:
                   
    Series 183, Cl. IO, 13.857%, 4/1/275
        184,821       36,101  
    Series 192, Cl. IO, 11.391%, 2/1/285
        52,091       10,396  
    Series 2130, Cl. SC, 51.439%, 3/15/295
        143,725       25,680  
    Series 243, Cl. 6, 2.173%, 12/15/325
        178,613       34,795  
    Series 2527, Cl. SG, 36.64%, 2/15/325
        55,905       2,657  
    Series 2531, Cl. ST, 62.465%, 2/15/305
        828,182       52,229  
    Series 2796, Cl. SD, 68.671%, 7/15/265
        213,166       37,771  
    Series 2802, Cl. AS, 96.397%, 4/15/335
        200,043       17,804  
    Series 2920, Cl. S, 66.453%, 1/15/355
        1,107,932       159,381  
    Series 3110, Cl. SL, 99.999%, 2/15/265
        158,112       20,280  
    Federal Home Loan Mortgage Corp.,
                   
    Principal-Only Stripped Mtg.-Backed
                   
    Security, Series 176,
                   
    Cl. PO, 4.228%, 6/1/266
        51,131       43,117  
    Federal National Mortgage Assn.:
                   
    3.50%, 1/1/26-1/1/417
        3,820,000       3,798,436  
    4%, 1/1/417
        5,645,000       5,616,775  
    4.50%, 1/1/26-1/1/417
        8,112,000       8,361,163  
    5%, 1/1/417
        6,502,000       6,836,242  
    5.50%, 9/25/20
        12,029       13,063  
    5.50%, 1/1/26-1/1/417
        5,949,000       6,367,157  
    6%, 12/1/34-3/1/37
        2,133,786       2,340,847  
    6%, 1/1/417
        1,785,000       1,940,352  
    6%, 11/1/348
        1,037,093       1,137,765  
    6.50%, 1/1/417
        1,780,000       1,978,303  
    7%, 11/1/178
        197,380       211,435  
    7.50%, 1/1/33
        210,293       241,182  
    8.50%, 7/1/32
        5,976       6,732  
    Federal National Mortgage Assn.,
                   
    Gtd. Real Estate Mtg. Investment
                   
    Conduit Multiclass Pass-Through
                   
    Certificates:
                   
    Trust 1998-61, Cl. PL, 6%, 11/25/28
        164,186       181,466  
    Trust 2004-101, Cl. BG, 5%, 1/25/20
        1,000,000       1,069,508  
    Trust 2004-81, Cl. KC, 4.50%, 4/1/17
        307,131       312,182  

                     
        Principal        
        Amount     Value  
     
    FHLMC/FNMA/FHLB/Sponsored Continued
                   
    Federal National Mortgage Assn.,
                   
    Gtd. Real Estate Mtg. Investment
                   
    Conduit Multiclass Pass-Through
                   
    Certificates: Continued
                   
    Trust 2004-9, Cl. AB, 4%, 7/1/17
      $ 248,310     $ 255,003  
    Trust 2005-104, Cl. MC, 5.50%, 12/25/25
        700,000       764,473  
    Trust 2005-12, Cl. JC, 5%, 6/1/28
        261,025       266,808  
    Trust 2005-22, Cl. EC, 5%, 10/1/28
        99,698       102,030  
    Trust 2005-30, Cl. CU, 5%, 4/1/29
        107,828       110,812  
    Trust 2005-69, Cl. LE, 5.50%, 11/1/33
        444,231       475,644  
    Trust 2006-46, Cl. SW, 23.244%, 6/25/363
        182,550       252,872  
    Trust 2006-57, Cl. PA, 5.50%, 8/25/27
        151,066       152,256  
    Trust 2009-36, Cl. FA, 1.201%, 6/25/373
        450,998       459,816  
    Trust 2009-37, Cl. HA, 4%, 4/1/19
        624,544       659,448  
    Trust 2009-70, Cl. PA, 5%, 8/1/35
        693,399       727,539  
    Federal National Mortgage Assn.,
                   
    Interest-Only Stripped Mtg.-Backed Security:
                   
    Trust 2001-65, Cl. S, 47.471%, 11/25/315
        463,072       86,620  
    Trust 2001-81, Cl. S, 37.251%, 1/25/325
        106,444       21,103  
    Trust 2002-47, Cl. NS, 35.776%, 4/25/325
        238,789       44,845  
    Trust 2002-51, Cl. S, 36.064%, 8/25/325
        219,265       41,144  
    Trust 2002-52, Cl. SD, 43.051%, 9/25/325
        265,971       52,794  
    Trust 2002-77, Cl. SH, 47.715%, 12/18/325
        152,104       28,488  
    Trust 2002-84, Cl. SA, 48.085%, 12/25/325
        411,299       70,611  
    Trust 2002-9, Cl. MS, 36.237%, 3/25/325
        160,864       29,098  
    Trust 2003-33, Cl. SP, 49.444%, 5/25/335
        467,455       81,153  
    Trust 2003-4, Cl. S, 44.135%, 2/25/335
        265,437       49,827  
    Trust 2003-46, Cl. IH, 0%, 6/1/335,9
        1,489,043       184,504  
    Trust 2003-89, Cl. XS, 53.849%, 11/25/325
        162,982       12,282  
    Trust 2004-54, Cl. DS, 51.415%, 11/25/305
        219,066       27,885  
    Trust 2005-14, Cl. SE, 41.451%, 3/25/355
        167,490       22,855  
    Trust 2005-40, Cl. SA, 65.702%, 5/25/355
        618,618       103,439  
    Trust 2005-71, Cl. SA, 68.213%, 8/25/255
        668,281       91,276  
    Trust 2005-93, Cl. SI, 17.83%, 10/25/355
        116,055       14,343  
    Trust 2006-60, Cl. DI, 41.33%, 4/25/355
        107,329       15,693  
    Trust 2007-88, Cl. XI, 22.457%, 6/25/375
        670,648       93,534  
    Trust 2008-67, Cl. KS, 34.057%, 8/25/345
        300,406       22,506  
    Trust 222, Cl. 2, 20.46%, 6/1/235
        393,826       73,791  
    Trust 233, Cl. 2, 34.397%, 8/1/235
        369,928       80,430  
    Trust 252, Cl. 2, 32.907%, 11/1/235
        325,262       65,624  
    Trust 319, Cl. 2, 6.206%, 2/1/325
        107,455       22,013  
    Trust 331, Cl. 9, 14.804%, 2/1/335
        307,723       57,046  
    Trust 334, Cl. 17, 22.82%, 2/1/335
        179,299       34,100  
    Trust 339, Cl. 12, 0%, 7/1/335,9
        304,980       53,843  
    Trust 339, Cl. 7, 0%, 7/1/335,9
        1,075,755       183,197  
    Trust 343, Cl. 13, 3.941%, 9/1/335
        280,571       48,674  
    Trust 345, Cl. 9, 3.359%, 1/1/345
        469,020       80,180  
    Trust 351, Cl. 10, 13.574%, 4/1/345
        43,970       7,549  
    Trust 351, Cl. 8, 0%, 4/1/345,9
        137,582       23,654  
    Trust 356, Cl. 10, 0%, 6/1/355,9
        110,493       18,867  
    Trust 356, Cl. 12, 0%, 2/1/355,9
        58,217       9,980  
    Trust 362, Cl. 13, 0.217%, 8/1/355
        416,149       70,142  
    Trust 364, Cl. 16, 0%, 9/1/355,9
        309,155       54,684  
                     
        Principal        
        Amount     Value  
     
    FHLMC/FNMA/FHLB/Sponsored Continued
                   
    Federal National Mortgage Assn.,
                   
    Principal-Only Stripped
                   
    Mtg.-Backed Security,
                   
    Trust 1993-184, Cl. M, 4.788%, 9/25/236
      $ 144,937     $ 129,378  


                54,714,941  
     
                   
    GNMA/Guaranteed—0.1%
                   
    Government National Mortgage Assn., 8%, 4/15/23
        66,784       78,552  
    Government National Mortgage Assn.,
                   
    Interest-Only Stripped
                   
    Mtg.-Backed Security:
                   
    Series 2001-21, Cl. SB, 88.416%, 1/16/275
        252,115       39,077  
    Series 2002-15, Cl. SM, 77.353%, 2/16/325
        288,890       44,728  
    Series 2002-76, Cl. SY, 81.039%, 12/16/265
        653,604       109,577  
    Series 2004-11, Cl. SM, 69.372%, 1/17/305
        219,124       41,566  


                313,500  
     
                   
    Non-Agency—5.3%
                   
    Commercial—3.6%
                   
    Banc of America Commercial
                   
    Mortgage, Inc., Commercial
                   
    Mtg. Pass-Through Certificates:
                   
    Series 2006-1, Cl. AM, 5.421%, 9/1/45
        530,000       539,017  
    Series 2007-1, Cl. A4, 5.451%, 1/1/17
        355,000       370,895  
    Series 2007-1, Cl. AMFX, 5.482%, 1/1/49
        455,000       445,551  
    Bear Stearns ARM Trust 2007-4,
                   
    Mtg. Pass-Through Certificates,
                   
    Series 2007-4, Cl. 22A1, 5.87%, 6/1/473
        277,642       230,000  
    Citigroup, Inc./Deutsche Bank
                   
    2007-CD4 Commercial Mortgage Trust,
                   
    Commercial Mtg. Pass-Through
                   
    Certificates, Series 2007-CD4,
                   
    Cl. A4, 5.322%, 12/1/49
        290,000       301,043  
    Deutsche Alt-B Securities, Inc.,
                   
    Mtg. Pass-Through Certificates,
                   
    Series 2006-AB4,
                   
    Cl. A1A, 6.005%, 10/25/36
        282,819       166,817  
    Deutsche Mortgage & Asset
                   
    Receiving, Commercial Mtg.
                   
    Pass-Through Certificates,
                   
    Series 2010-C1, Cl. A1, 3.156%, 7/1/462
        284,493       285,443  
    Deutsche Mortgage & Asset
                   
    Receiving, Commercial Mtg.
                   
    Pass-Through Certificates,
                   
    Interest-Only Stripped Mtg.-
                   
    Backed Security, Series 2010-C1,
                   
    Cl. XPA, 4.82%, 9/1/204,5
        2,275,000       203,129  
    First Horizon Alternative Mortgage
                   
    Securities Trust 2004-FA2, Mtg.
                   
    Pass-Through Certificates,
                   
    Series 2004-FA2, Cl. 3A1, 6%, 1/25/35
        263,429       264,518  

                     
        Principal        
        Amount     Value  
     
    Commercial Continued
                   
    First Horizon Alternative Mortgage
                   
    Securities Trust 2007-FA2, Mtg.
                   
    Pass-Through Certificates,
                   
    Series 2007-FA2, Cl. 1A1, 5.50%, 4/25/37
      $ 491,268     $ 355,589  
    IndyMac INDX Mortgage Loan
                   
    Trust 2005-AR23, Mtg. Pass-Through
                   
    Certificates, Series 2005-AR23,
                   
    Cl. 6A1, 5.214%, 11/1/353
        369,278       285,361  
    JPMorgan Chase Commercial
                   
    Mortgage Securities Corp.,
                   
    Commercial Mtg. Pass-Through
                   
    Certificates:
                   
    Series 2010-C2, Cl. A2, 3.616%, 11/1/432
        340,000       329,680  
    Series 2007-LDPX, Cl. A2S2, 5.187%, 1/1/494
        140,000       141,428  
    Series 2007-LDPX, Cl. A2S, 5.305%, 1/15/49
        95,000       97,291  
    Series 2007-LDP10, Cl. A3S, 5.317%, 4/1/13
        355,000       362,130  
    Series 2007-LDPX, Cl. A3, 5.42%, 1/15/49
        40,000       41,666  
    Series 2007-LD11, Cl. A2, 5.802%, 6/15/493
        270,000       279,747  
    JPMorgan Chase Commercial
                   
    Mortgage Securities Trust
                   
    2006-LDP7, Commercial Mtg.
                   
    Pass-Through Certificates,
                   
    Series 2006-LDP7, 5.872%, 4/1/453
        515,000       534,949  
    JPMorgan Mortgage Trust 2007-S3,
                   
    Mtg. Pass-Through Certificates,
                   
    Series 2007-S3, Cl. 1A90, 7%, 7/1/37
        377,210       294,574  
    LB-UBS Commercial Mortgage
                   
    Trust 2006-C3, Commercial
                   
    Mtg. Pass-Through Certificates,
                   
    Series 2006-C3, Cl. AM, 5.712%, 3/11/39
        90,000       91,262  
    LB-UBS Commercial Mortgage
                   
    Trust 2007-C1, Commercial
                   
    Mtg. Pass-Through Certificates,
                   
    Series 2007-C1, Cl. A2, 5.318%, 1/15/12
        210,000       215,399  
    Mastr Adjustable Rate Mortgages
                   
    Trust 2004-13, Mtg. Pass-Through
                   
    Certificates, Series 2004-13,
                   
    Cl. 2A2, 2.83%, 4/1/343
        236,800       239,476  
    Mastr Alternative Loan Trust 2004-6,
                   
    Mtg. Pass-Through Certificates,
                   
    Series 2004-6, Cl. 10A1, 6%, 7/25/34
        544,413       543,405  
    Merrill Lynch Mortgage Investors
                   
    Trust 2005-A5, Mtg. Pass-Through
                   
    Certificates, Series 2005-A5,
                   
    Cl. A9, 2.752%, 6/1/353
        311,496       276,396  
    ML-CFC Commercial Mortgage
                   
    Trust 2006-3, Commercial
                   
    Mtg. Pass-Through Certificates,
                   
    Series 2006-3, Cl. AM, 5.456%, 7/12/46
        475,000       480,249  
    NCUA Guaranteed Notes,
                   
    Asset-Backed Nts., Series 2010-R3,
                   
    Cl. 2A, 0.825%, 12/8/203
        380,000       379,525  
                     
        Principal        
        Amount     Value  
     
    Commercial Continued
                   
    Wachovia Bank Commercial Mortgage
                   
    Trust 2007-C34, Commercial
                   
    Mtg. Pass-Through Certificates,
                   
    Series 2007-C34, Cl. A3, 5.678%, 7/1/17
      $ 260,000     $ 271,730  
    WaMu Mortgage Pass-Through
                   
    Certificates 2005-AR14 Trust,
                   
    Mtg. Pass-Through Certificates,
                   
    Series 2005-AR14, Cl. 1A4,
                   
    2.671%, 12/1/353
        174,279       150,187  
    Wells Fargo Commercial Mortgage
                   
    Trust 2010-C1, Commercial
                   
    Mtg. Pass-Through Certificates,
                   
    Series 2010-C1, Cl. A1, 3.349%, 10/1/572
        188,970       189,566  
    Wells Fargo Mortgage-Backed
                   
    Securities 2007-AR8 Trust,
                   
    Mtg. Pass-Through Certificates,
                   
    Series 2007-AR8, Cl. A1, 6.134%, 11/1/373
        259,269       210,482  


                8,576,505  
     
                   
    Multifamily—0.5%
                   
    Citigroup Mortgage Loan Trust, Inc.
                   
    2006-AR3, Mtg. Pass-Through
                   
    Certificates, Series 2006-AR3,
                   
    Cl. 1A2A, 5.77%, 6/1/363
        244,352       227,871  
    GE Capital Commercial
                   
    Mortgage Corp., Commercial
                   
    Mtg. Pass-Through Certificates,
                   
    Series 2001-3, Cl. A2, 6.07%, 6/1/38
        330,000       338,915  
    Wells Fargo Mortgage-Backed
                   
    Securities 2006-AR6 Trust,
                   
    Mtg. Pass-Through Certificates,
                   
    Series 2006-AR6,
                   
    Cl. 3A1, 3.203%, 3/25/363
        604,695       538,743  


                1,105,529  
     
                   
    Other—0.1%
                   
    Greenwich Capital Commercial
                   
    Funding Corp./Commercial
                   
    Mortgage Trust 2007-GG9,
                   
    Commercial Mtg. Pass-Through
                   
    Certificates, Series 2007-GG9,
                   
    Cl. A4, 5.444%, 3/1/39
        320,000       337,624  
    Residential—1.1%
                   
    Banc of America Mortgage
                   
    Securities, Inc., Mtg. Pass-Through
                   
    Certificates, Series 2004-E,
                   
    Cl. 2A6, 2.87%, 6/1/343
        155,264       147,746  
    CHL Mortgage Pass-Through
                   
    Trust 2006-6, Mtg. Pass-Through
                   
    Certificates, Series 2006-6,
                   
    Cl. A3, 6%, 4/1/36
        270,397       247,470  
    Citigroup Commercial Mortgage
                   
    Trust 2008-C7, Commercial
                   
    Mtg. Pass-Through Certificates,
                   
    Series 2008-C7, Cl. A4, 6.293%, 12/1/493
        300,000       322,989  

                     
        Principal        
        Amount     Value  
     
    Residential Continued
                   
    Countrywide Alternative Loan
                   
    Trust 2005-29CB, Mtg. Pass-Through
                   
    Certificates, Series 2005-29CB,
                   
    Cl. A4, 5%, 7/1/35
      $ 790,362     $ 632,155  
    GSR Mortgage Loan Trust 2006-5F,
                   
    Mtg. Pass-Through Certificates,
                   
    Series 2006-5F, Cl. 2A1, 6%, 6/1/36
        273,058       263,102  
    JPMorgan Alternative Loan
                   
    Trust 2006-S4, Mtg. Pass-Through
                   
    Certificates, Series 2006-S4,
                   
    Cl. A6, 5.71%, 12/1/36
        126,415       113,990  
    RALI Series 2003-QS1 Trust,
                   
    Mtg. Asset-Backed Pass-Through
                   
    Certificates, Series 2003-QS1,
                   
    Cl. A2, 5.75%, 1/25/33
        157,665       158,846  
    RALI Series 2006-QS13 Trust,
                   
    Mtg. Asset-Backed Pass-Through
                   
    Certificates, Series 2006-QS13,
                   
    Cl. 1A8, 6%, 9/25/36
        28,707       18,211  
    WaMu Mortgage Pass-Through
                   
    Certificates 2007-HY7 Trust,
                   
    Mtg. Pass-Through Certificates,
                   
    Series 2007-HY7, Cl. 2A1, 5.629%, 7/1/373
        316,555       222,951  
    WaMu Mortgage Pass-Through
                   
    Certificates Series 2007-HY5
                   
    Trust, Mtg. Pass-Through
                   
    Certificates, Series 2007-HY5,
                   
    Cl. 3A1, 5.743%, 5/1/373
        245,189       224,262  
    Wells Fargo Alternative Loan
                   
    2007-PA5 Trust, Mtg.
                   
    Asset-Backed Pass-Through
                   
    Certificates, Series 2007-PA5,
                   
    Cl. 1A1, 6.25%, 11/1/37
        202,463       177,066  
    Wells Fargo Mortgage-Backed
                   
    Securities 2004-R Trust, Mtg.
                   
    Pass-Through Certificates,
                   
    Series 2004-R, Cl. 2A1, 2.872%, 9/1/343
        101,025       98,078  


                2,626,866  
     
                 
    Total Mortgage-Backed Obligations
    (Cost $66,341,678)
                67,674,965  
     
                   
    U.S. Government Obligations—0.5%
                   
    Federal Home Loan Mortgage Corp. Nts.:
                   
    1.75%, 9/10/15
        310,000       305,048  
    5%, 2/16/17
        115,000       129,652  
    5.25%, 4/18/16
        195,000       223,318  
    Federal National Mortgage Assn. Nts.:
                   
    1.625%, 10/26/15
        295,000       287,861  
    4.875%, 12/15/16
        90,000       101,027  
    5%, 3/15/16
        120,000       135,725  
     
                 
    Total U.S. Government Obligations
    (Cost $1,180,417)
                1,182,631  
                     
        Principal        
        Amount     Value  
     
    Non-Convertible Corporate Bonds and Notes—13.4%
                   
    Consumer Discretionary—1.7%
                   
    Auto Components—0.1%
                   
    BorgWarner, Inc., 4.625%
                   
    Sr. Unsec. Unsub. Nts., 9/15/20
      $ 209,000     $ 206,737  
    Diversified Consumer Services—0.1%
                   
    Service Corp. International, 6.75%
                   
    Sr. Unsec. Nts., 4/1/15
        230,000       236,900  
    Hotels, Restaurants & Leisure—0.3%
                   
    Hyatt Hotels Corp., 5.75%
                   
    Sr. Unsec. Unsub. Nts., 8/15/152
        340,000       355,981  
    Marriott International, Inc., 6.20%
                   
    Sr. Unsec. Unsub. Nts., 6/15/16
        255,000       279,127  


                635,108  
     
                   
    Household Durables—0.2%
                   
    Fortune Brands, Inc., 6.375%
                   
    Sr. Unsec. Unsub. Nts., 6/15/14
        173,000       187,637  
    Jarden Corp., 6.125%
                   
    Sr. Unsec. Nts., 11/15/22
        240,000       230,100  
    Whirlpool Corp., 8%
                   
    Sr. Unsec. Nts., 5/1/12
        180,000       194,033  


                611,770  
     
                   
    Leisure Equipment & Products—0.2%
                   
    Mattel, Inc.:
                   
    5.625% Sr. Unsec. Nts., 3/15/13
        215,000       231,267  
    6.125% Sr. Unsec. Nts., 6/15/11
        230,000       234,895  


                466,162  
     
                   
    Media—0.7%
                   
    Comcast Cable Communications
                   
    Holdings, Inc., 9.455%
                   
    Sr. Unsec. Nts., 11/15/22
        138,000       191,311  
    DirecTV Holdings LLC/DirecTV
                   
    Financing Co., Inc., 7.625%
                   
    Sr. Unsec. Unsub. Nts., 5/15/16
        405,000       449,542  
    Interpublic Group of Co., Inc.
                   
    (The), 10% Sr. Unsec. Nts., 7/15/17
        196,000       230,300  
    Lamar Media Corp., 9.75%
                   
    Sr. Unsec. Nts., 4/1/14
        218,000       251,790  
    Time Warner Entertainment
                   
    Co. LP, 8.375% Sr. Nts., 7/15/33
        122,000       154,400  
    Viacom, Inc., 7.875%
                   
    Sr. Unsec. Debs., 7/30/30
        130,000       153,900  
    Virgin Media Secured Finance plc,
                   
    6.50% Sr. Sec. Nts., 1/15/18
        230,000       243,225  


                1,674,468  
     
                   
    Specialty Retail—0.1%
                   
    Staples, Inc., 7.75%
                   
    Sr. Unsec. Unsub. Nts., 4/1/11
        350,000       355,655  

                     
        Principal        
        Amount     Value  
     
    Consumer Staples—0.7%
                   
    Beverages—0.2%
                   
    Anheuser-Busch InBev Worldwide, Inc.,
                   
    7.75% Sr. Unsec. Unsub. Nts., 1/15/192
      $ 340,000     $ 423,737  
    Constellation Brands, Inc., 8.375%
                   
    Sr. Nts., 12/15/14
        220,000       241,450  


                665,187  
     
                   
    Food & Staples Retailing—0.1%
                   
    Delhaize Group, 5.70% Sr. Unsec. Nts., 10/1/402
        148,000       141,370  
    Food Products—0.2%
                   
    Bunge Ltd. Finance Corp.:
                   
    5.35% Sr. Unsec. Unsub. Nts., 4/15/14
        29,000       30,505  
    8.50% Sr. Unsec. Nts., 6/15/19
        155,000       182,024  
    TreeHouse Foods, Inc., 7.75%
                   
    Sr. Unsec. Nts., 3/1/18
        240,000       260,700  


                473,229  
     
                   
    Tobacco—0.2%
                   
    Altria Group, Inc., 10.20%
                   
    Sr. Unsec. Nts., 2/6/39
        255,000       369,635  
    Lorillard Tobacco Co., 8.125%
                   
    Sr. Unsec. Nts., 5/1/40
        142,000       146,014  


                515,649  
     
                   
    Energy—1.4%
                   
    Energy Equipment & Services—0.2%
                   
    Rowan Cos., Inc., 5%
                   
    Sr. Unsec. Nts., 9/1/17
        205,000       207,075  
    Weatherford International Ltd., 6.50%
                   
    Sr. Unsec. Bonds, 8/1/36
        150,000       153,681  


                360,756  
     
                   
    Oil, Gas & Consumable Fuels—1.2%
                   
    Cloud Peak Energy Resources LLC,
                   
    8.25% Sr. Unsec. Unsub. Nts., 12/15/17
        215,000       231,931  
    Energy Transfer Partners LP:
                   
    5.65% Sr. Unsec. Unsub. Nts., 8/1/12
        91,000       96,451  
    7.50% Sr. Unsec. Unsub. Bonds, 7/1/38
        160,000       186,691  
    Enterprise Products Operating LLP,
                   
    7.50% Sr. Unsec. Unsub. Nts., 2/1/11
        195,000       195,865  
    Kaneb Pipe Line Operating Partnership
                   
    LP, 5.875% Sr. Unsec. Nts., 6/1/13
        440,000       476,552  
    Kinder Morgan Energy Partners LP,
                   
    6.50% Sr. Unsec. Unsub. Nts., 9/1/39
        185,000       191,742  
    Nexen, Inc., 6.40% Sr. Unsec. Unsub.
                   
    Bonds, 5/15/37
        121,000       117,601  
    ONEOK Partners LP, 7.10%
                   
    Sr. Unsec. Nts., 3/15/11
        100,000       101,206  
    Range Resources Corp., 8%
                   
    Sr. Unsec. Sub. Nts., 5/15/19
        150,000       164,063  
                     
        Principal        
        Amount     Value  
     
    Oil, Gas & Consumable Fuels Continued
                   
    Ras Laffan Liquefied Natural Gas Co.
                   
    Ltd. III, 5.50% Sr. Sec. Nts., 9/30/142
      $ 140,000     $ 151,481  
    Rockies Express Pipeline LLC:
                   
    3.90% Sr. Unsec. Unsub. Nts., 4/15/152
        255,000       252,464  
    5.625% Sr. Unsec. Unsub. Nts., 4/15/202
        163,000       157,840  
    Southwestern Energy Co., 7.50%
                   
    Sr. Nts., 2/1/18
        225,000       254,813  
    Woodside Finance Ltd., 4.50% Nts., 11/10/142
        335,000       352,421  


                2,931,121  
     
                   
    Financials—5.2%
                   
    Capital Markets—0.9%
                   
    Blackstone Holdings Finance Co. LLC,
                   
    6.625% Sr. Unsec. Nts., 8/15/192
        340,000       350,069  
    Goldman Sachs Capital, Inc. (The),
                   
    6.345% Sub. Bonds, 2/15/34
        255,000       243,693  
    Macquarie Group Ltd., 4.875%
                   
    Sr. Unsec. Nts., 8/10/172
        378,000       370,616  
    Morgan Stanley:
                   
    5.50% Sr. Unsec. Unsub. Nts., 7/24/202
        90,000       91,092  
    5.55% Sr. Unsec. Unsub. Nts.,
                   
    Series F, 4/27/17
        570,000       594,614  
    TD Ameritrade Holding Corp., 2.95%
                   
    Sr. Unsec. Unsub. Nts., 12/1/12
        225,000       230,321  
    UBS AG Stamford, CT, 2.25%
                   
    Sr. Unsec. Nts., 8/12/13
        234,000       236,145  


                2,116,550  
     
                   
    Commercial Banks—1.3%
                   
    ANZ National International Ltd.,
                   
    2.375% Sr. Unsec. Nts., 12/21/122
        230,000       233,660  
    Barclays Bank plc, 6.278%
                   
    Perpetual Bonds10
        510,000       433,500  
    BNP Paribas SA, 5.186% Sub.
                   
    Perpetual Nts.2,10
        245,000       224,788  
    Fifth Third Cap Trust IV, 6.50%
                   
    Jr. Unsec. Sub. Nts., 4/15/37
        322,000       308,315  
    HSBC Finance Capital Trust IX,
                   
    5.911% Nts., 11/30/353
        600,000       558,000  
    Huntington BancShares, Inc.,
                   
    7% Sub. Nts., 12/15/20
        381,000       401,873  
    Lloyds TSB Bank plc, 6.50% Unsec.
                   
    Sub. Nts., 9/14/202
        230,000       211,976  
    Sanwa Bank Ltd. (The),
                   
    7.40% Sub. Nts., 6/15/11
        219,000       223,176  
    Wells Fargo & Co., 7.98%
                   
    Jr. Sub. Perpetual Bonds, Series K10
        476,000       504,560  


                3,099,848  

                     
        Principal    
        Amount   Value
     
    Consumer Finance—0.2%
                   
    American Express Bank FSB, 5.55%
                   
    Sr. Unsec. Nts., 10/17/12
      $ 205,000     $ 219,365  
    Capital One Capital IV, 6.745%
                   
    Sub. Bonds, 2/17/373
        370,000       369,075  
                   
                588,440  
     
                   
    Diversified Financial Services—0.9%
                   
    Bank of America Corp., 5.875%
                   
    Sr. Unsec. Unsub. Nts., 1/5/21
        95,000       98,473  
    Citigroup, Inc.:
                   
    5.375% Sr. Unsec. Nts., 8/9/20
        457,000       475,715  
    6.01% Sr. Unsec. Nts., 1/15/15
        232,000       254,739  
    ING Groep NV, 5.775% Jr. Unsec.
                   
    Sub. Perpetual Bonds10
        255,000       220,575  
    JPMorgan Chase & Co., 7.90%
                   
    Perpetual Bonds, Series 110
        660,000       703,937  
    Merrill Lynch & Co., Inc., 7.75%
                   
    Jr. Sub. Bonds, 5/14/38
        340,000       353,883  
                   
                2,107,322  
     
                   
    Insurance—1.5%
                   
    American International Group, Inc.:
                   
    5.85% Sr. Unsec. Nts., Series G, 1/16/18
        218,000       225,434  
    6.40% Sr. Unsec. Unsub. Nts., 12/15/20
        230,000       241,762  
    CNS Financial Corp., 5.875%
                   
    Sr. Unsec. Unsub. Bonds, 8/15/20
        235,000       234,408  
    Genworth Financial, Inc., 8.625%
                   
    Sr. Unsec. Unsub. Nts., 12/15/16
        207,000       233,068  
    Gulf South Pipeline Co. LP, 5.75%
                   
    Sr. Unsec. Nts., 8/15/122
        212,000       224,952  
    Hartford Financial Services Group, Inc.
                   
    (The), 5.25% Sr. Unsec. Nts., 10/15/11
        242,000       249,184  
    Irish Life & Permanent Group
                   
    Holdings plc, 3.60% Sr. Unsec. Unsub.
                   
    Nts., 1/14/132
        320,000       287,181  
    Lincoln National Corp., 6.05%
                   
    Jr. Unsec. Sub. Bonds, 4/20/67
        455,000       424,288  
    Manulife Financial Corp., 4.90%
                   
    Sr. Unsec. Unsub. Nts., 9/17/20
        135,000       128,720  
    PartnerRe Finance B LLC, 5.50%
                   
    Sr. Unsec. Nts., 6/1/20
        217,000       218,922  
    Prudential Financial, Inc., 3.625%
                   
    Sr. Unsec. Unsub. Nts., 9/17/12
        227,000       235,681  
    RenRe North America Holdings, Inc.,
                   
    5.75% Sr. Unsec. Nts., 3/15/20
        238,000       239,361  
    Swiss Re Capital I LP, 6.854%
                   
    Perpetual Bonds2,10
        442,000       424,441  
    ZFS Finance USA Trust IV, 5.875%
                   
    Sub. Bonds, 5/9/322
        270,000       264,500  
                   
                3,631,902  
                     
        Principal        
        Amount     Value  
     
    Real Estate Investment Trusts—0.4%
                   
    AvalonBay Communities, Inc., 6.625%
                   
    Sr. Unsec. Unsub. Nts., 9/15/11
      $ 100,000     $ 103,799  
    Brandywine Operating Partnership LP,
                   
    5.75% Sr. Unsec. Unsub. Nts., 4/1/12
        123,000       127,404  
    Liberty Property LP, 7.25%
                   
    Sr. Unsec. Unsub. Nts., 3/15/11
        240,000       242,759  
    Mack-Cali Realty LP, 5.25%
                   
    Sr. Unsec. Unsub. Nts., 1/15/12
        93,000       95,443  
    Simon Property Group LP, 5%
                   
    Sr. Unsec. Unsub. Nts., 3/1/12
        225,000       231,262  
    WCI Finance LLC/WEA Finance LLC,
                   
    5.40% Sr. Unsec. Unsub. Nts., 10/1/122
        105,000       111,359  


                912,026  
     
                   
    Health Care—0.6%
                   
    Biotechnology—0.2%
                   
    Celgene Corp., 5.70% Sr. Unsec.
                   
    Nts., 10/15/40
        235,000       228,576  
    Genzyme Corp., 5% Sr. Unsec.
                   
    Nts., 6/15/20
        225,000       236,665  


                465,241  
     
                   
    Health Care Providers & Services—0.3%
                   
    Laboratory Corp. of America Holdings,
                   
    4.625% Nts., 11/15/20
        173,000       171,776  
    Quest Diagnostic, Inc., 5.75%
                   
    Sr. Unsec. Nts., 1/30/40
        252,000       240,873  
    WellPoint, Inc., 5% Sr. Unsec. Unsub.
                   
    Nts., 1/15/11
        220,000       220,234  


                632,883  
     
                   
    Pharmaceuticals—0.1%
                   
    Hospira, Inc., 5.60% Sr. Unsec. Unsub.
                   
    Nts., 9/15/40
        75,000       73,978  
    Mylan, Inc., 6% Sr. Nts., 11/15/182
        245,000       241,325  


                315,303  
     
                   
    Industrials—0.9%
                   
    Aerospace & Defense—0.2%
                   
    Alliant Techsystems, Inc., 6.75%
                   
    Sr. Sub. Nts., 4/1/16
        230,000       239,488  
    BE Aerospace, Inc., 8.50%
                   
    Sr. Unsec. Nts., 7/1/18
        205,000       224,988  


                464,476  
     
                   
    Commercial Services & Supplies—0.3%
                   
    Browning-Ferris Industries, Inc.,
                   
    7.40% Sr. Unsec. Debs., 9/15/35
        78,000       92,576  
    Corrections Corp. of America,
                   
    7.75% Sr. Nts., 6/1/17
        235,000       250,569  

                     
        Principal        
        Amount     Value  
     
    Commercial Services & Supplies
                   
    Continued
                   
    R.R. Donnelley & Sons Co., 5.625%
                   
    Sr. Unsec. Nts., 1/15/12
      $ 230,000     $ 235,589  
    Republic Services, Inc., 6.75%
                   
    Sr. Unsec. Unsub. Nts., 8/15/11
        195,000       201,331  


                780,065  
     
                   
    Industrial Conglomerates—0.2%
                   
    General Electric Capital Corp., 4.25%
                   
    Sr. Unsec. Nts., Series A, 6/15/12
        215,000       223,671  
    Tyco International Ltd./Tyco
                   
    International Finance SA, 6.875%
                   
    Sr. Unsec. Unsub. Nts., 1/15/21
        192,000       231,439  


                455,110  
     
                   
    Machinery—0.1%
                   
    SPX Corp., 7.625% Sr. Unsec.
                   
    Nts., 12/15/14
        265,000       289,513  
    Professional Services—0.1%
                   
    FTI Consulting, Inc.,
                   
    6.75% Sr. Nts., 10/1/202
        240,000       239,400  
    Information Technology—0.6%
                   
    Communications Equipment—0.3%
                   
    Harris Corp., 6.15%
                   
    Sr. Unsec. Nts., 12/15/40
        425,000       436,473  
    Motorola, Inc., 8%
                   
    Sr. Unsec. Nts., 11/1/11
        220,000       231,741  


                668,214  
     
                   
    Electronic Equipment & Instruments—0.1%
                   
    Arrow Electronics, Inc., 3.375%
                   
    Sr. Unsec. Unsub. Nts., 11/1/15
        430,000       417,300  
     
                 
    IT Services—0.1%
                   
    SAIC, Inc., 5.95% Sr. Unsec. Unsub.
                   
    Nts., 12/1/402
        142,000       144,495  
     
                 
    Software—0.1%
                   
    Symantec Corp., 4.20%
                   
    Sr. Unsec. Unsub. Nts., 9/15/20
        303,000       278,512  
     
                 
    Materials—1.1%
                   
    Chemicals—0.5%
                   
    Agrium, Inc., 6.125% Sr. Unsec.
                   
    Nts., 1/15/41
        359,000       381,562  
    Airgas, Inc., 3.25% Sr. Nts., 10/1/15
        198,000       195,807  
    Ashland, Inc., 9.125% Sr. Unsec.
                   
    Nts., 6/1/17
        210,000       243,075  
    CF Industries, Inc., 6.875%
                   
    Sr. Unsec. Unsub. Nts., 5/1/18
        230,000       246,675  
    Potash Corp., 5.625%
                   
    Sr. Unsec. Unsub. Nts., 12/1/40
        140,000       141,803  


                1,208,922  
                     
        Principal        
        Amount     Value  
     
    Containers & Packaging—0.3%
                   
    Ball Corp., 7.125% Sr. Unsec.
                   
    Nts., 9/1/16
      $ 250,000     $ 270,625  
    Sealed Air Corp., 7.875%
                   
    Sr. Nts., 6/15/17
        277,000       305,004  
    Sonoco Products Co., 5.75%
                   
    Sr. Unsec. Unsub. Nts., 11/1/40
        118,000       114,154  


                689,783  
     
                   
    Metals & Mining—0.3%
                   
    Freeport-McMoRan Copper & Gold,
                   
    Inc., 8.375% Sr. Nts., 4/1/17
        330,000       365,510  
    Vale Inco Ltd., 5.70% Sr. Unsec. Unsub.
                   
    Nts., 10/15/15
        14,000       15,097  
    Xstrata Canada Corp.:
                   
    5.375% Sr. Unsec. Unsub. Nts., 6/1/15
        75,000       79,573  
    6% Sr. Unsec. Unsub. Nts., 10/15/15
        132,000       144,534  
    Xstrata Finance Canada Ltd., 5.80%
                   
    Sr. Unsec. Unsub. Bonds, 11/15/162
        35,000       38,441  


                643,155  
     
                   
    Telecommunication Services—0.7%
                   
    Diversified Telecommunication Services—0.6%
                   
    AT&T, Inc., 6.30% Sr. Unsec. Bonds,
                   
    1/15/38
        213,000       225,451  
    British Telecommunications plc,
                   
    9.875% Bonds, 12/15/30
        142,000       189,740  
    Embarq Corp., 6.738%
                   
    Sr. Unsec. Nts., 6/1/13
        225,000       244,535  
    Frontier Communications Corp.,
                   
    8.25% Sr. Unsec. Nts., 4/15/17
        230,000       253,575  
    Qwest Corp., 7.625% Sr. Unsec.
                   
    Unsub. Nts., 6/15/15
        210,000       237,825  
    Telus Corp., 8% Nts., 6/1/11
        101,000       103,765  
    Verizon Communications, Inc., 6.40%
                   
    Sr. Unsec. Nts., 2/15/38
        140,000       155,389  


                1,410,280  
     
                   
    Wireless Telecommunication Services—0.1%
                   
    American Tower Corp., 7%
                   
    Sr. Unsec. Nts., 10/15/17
        162,000       182,908  
    Utilities—0.5%
                   
    Electric Utilities—0.4%
                   
    Allegheny Energy Supply Co. LLC,
                   
    8.25% Bonds, 4/15/122
        202,000       216,789  
    FirstEnergy Solutions Corp., 6.80%
                   
    Sr. Unsec. Nts., 8/15/39
        138,000       134,163  
    Great Plains Energy, Inc., 2.75%
                   
    Sr. Unsec. Unsub. Nts., 8/15/13
        155,000       156,677  
    Northeast Utilities, 7.25% Sr. Unsec.
                   
    Nts., 4/1/12
        230,000       246,038  

                     
        Principal        
        Amount     Value  
     
    Electric Utilities Continued
                   
    Texas-New Mexico Power Co., 9.50%
                   
    Sec. Nts., 4/1/192
      $ 235,000     $ 299,659  


                1,053,326  
     
                   
    Gas Utilities—0.1%
                   
    AmeriGas Partners LP, 7.25%
                   
    Sr. Unsec. Nts., 5/20/15
        224,000       231,274  
     
                 
    Total Non-Convertible Corporate Bonds and Notes (Cost $31,183,263)
                32,300,360  
                     
        Shares     Value  
     
    Investment Companies—19.0%
                   
    JPMorgan U.S. Treasury Plus Money
                   
    Market Fund, Agency Shares, 0.00%11,12
        15,063     $ 15,063  
    Oppenheimer Institutional Money
                   
    Market Fund, Cl. E, 0.21%11,13
        45,755,638       45,755,638  
     
                 
    Total Investment Companies
    (Cost $45,770,701)
                45,770,701  
     
                   
    Total Investments, at Value
    (Cost $257,445,927)
        114.3 %     274,526,654  
    Liabilities in Excess of Other Assets
        (14.3 )     (34,324,857 )
         
    Net Assets
        100.0 %   $ 240,201,797  
         
    Footnotes to Statement of Investments
    1.   Non-income producing security.
     
    2.   Represents securities sold under Rule 144A, which are exempt from registration under the Securities Act of 1933, as amended. These securities have been determined to be liquid under guidelines established by the Board of Trustees. These securities amount to $9,490,443 or 3.95% of the Fund’s net assets as of December 31, 2010.
     
    3.   Represents the current interest rate for a variable or increasing rate security.
     
    4.   Restricted security. The aggregate value of restricted securities as of December 31, 2010 was $589,557, which represents 0.25% of the Fund’s net assets. See Note 6 of the accompanying Notes. Information concerning restricted securities is as follows:
                                     
                                Unrealized  
        Acquisition                     Appreciation  
    Security   Date     Cost     Value     (Depreciation)  
     
    Deutsche Mortgage & Asset Receiving, Commercial Mtg.
    Pass-Through Certificates, Interest-Only Stripped Mtg.-
    Backed Security, Series 2010-C1, Cl. XPA, 4.82%, 9/1/20
        10/27/10     $ 207,598     $ 203,129     $ (4,469 )
    Ford Credit Auto Lease Trust, Automobile Receivable Nts.,
    Series 2010-B, Cl. A2, 0.75%, 10/15/12
        10/21/10       244,995       245,000       5  
    JPMorgan Chase Commercial Mortgage Securities Corp.,
    Commercial Mtg. Pass-Through Certificates,
    Series 2007-LDPX, Cl. A2S2, 5.187%,1/1/49
        7/14/10       138,250       141,428       3,178  
                 
     
              $ 590,843     $ 589,557     $ (1,286 )
                 
    5.   Interest-Only Strips represent the right to receive the monthly interest payments on an underlying pool of mortgage loans. These securities typically decline in price as interest rates decline. Most other fixed income securities increase in price when interest rates decline. The principal amount of the underlying pool represents the notional amount on which current interest is calculated. The price of these securities is typically more sensitive to changes in prepayment rates than traditional mortgage-backed securities (for example, GNMA pass-throughs). Interest rates disclosed represent current yields based upon the current cost basis and estimated timing and amount of future cash flows. These securities amount to $2,812,945 or 1.17% of the Fund’s net assets as of December 31, 2010.
     
    6.   Principal-Only Strips represent the right to receive the monthly principal payments on an underlying pool of mortgage loans. The value of these securities generally increases as interest rates decline and prepayment rates rise. The price of these securities is typically more volatile than that of coupon-bearing bonds of the same maturity. Interest rates disclosed represent current yields based upon the current cost basis and estimated timing of future cash flows. These securities amount to $172,495 or 0.07% of the Fund’s net assets as of December 31, 2010.
     
    7.   When-issued security or delayed delivery to be delivered and settled after December 31, 2010. See Note 1 of the accompanying Notes.
     
    8.   All or a portion of the security position is held in collateralized accounts to cover initial margin requirements on open futures contracts and written options on futures, if applicable. The aggregate market value of such securities is $271,005. See Note 5 of the accompanying Notes.
     
    9.   The current amortization rate of the security’s cost basis exceeds the future interest payments currently estimated to be received. Both the amortization rate and interest payments are contingent on future mortgage pre-payment speeds and are therefore subject to change.
     
    10.   This bond has no contractual maturity date, is not redeemable and contractually pays an indefinite stream of interest. Rate reported represents the current interest rate for this variable rate security.
     
    11.   Rate shown is the 7-day yield as of December 31, 2010.

    12.   Interest rate is less than 0.0005%.
     
    13.   Is or was an affiliate, as defined in the Investment Company Act of 1940, at or during the period ended December 31, 2010, by virtue of the Fund owning at least 5% of the voting securities of the issuer or as a result of the Fund and the issuer having the same investment adviser. Transactions during the period in which the issuer was an affiliate are as follows:
                                     
        Shares     Gross     Gross     Shares  
        December 31, 2009     Additions     Reductions     December 31, 2010  
     
    OFI Liquid Assets Fund, LLC
              474,837       474,837        
    Oppenheimer Institutional Money Market Fund, Cl. E
        30,151,515       103,813,278       88,209,155       45,755,638  
                     
        Value     Income  
     
    OFI Liquid Assets Fund, LLC
      $     $ 8 a
    Oppenheimer Institutional Money Market Fund, Cl. E
        45,755,638       55,153  
         
     
      $ 45,755,638     $ 55,161  
         
    a.   Net of compensation to the securities lending agent and rebates paid to the borrowing counterparties.
    Valuation Inputs
    Various data inputs are used in determining the value of each of the Fund’s investments as of the reporting period end. These data inputs are categorized in the following hierarchy under applicable financial accounting standards:
      1)   Level 1—unadjusted quoted prices in active markets for identical assets or liabilities (including securities actively traded on a securities exchange)
     
      2)   Level 2—inputs other than unadjusted quoted prices that are observable for the asset or liability (such as unadjusted quoted prices for similar assets and market corroborated inputs such as interest rates, prepayment speeds, credit risks, etc.)
     
      3)   Level 3—significant unobservable inputs (including the Manager’s own judgments about assumptions that market participants would use in pricing the asset or liability).
    The table below categorizes amounts that are included in the Fund’s Statement of Assets and Liabilities as of December 31, 2010 based on valuation input level:
                                     
                        Level 3 —        
        Level 1 —     Level 2 —     Significant        
        Unadjusted     Other Significant     Unobservable        
        Quoted Prices     Observable Inputs     Inputs     Value  
     
    Assets Table
                                   
    Investments, at Value:
                                   
    Common Stocks
                                   
    Consumer Discretionary
      $ 4,620,793     $     $     $ 4,620,793  
    Consumer Staples
        12,874,282                   12,874,282  
    Energy
        11,723,242                   11,723,242  
    Financials
        14,176,058                   14,176,058  
    Health Care
        23,535,030                   23,535,030  
    Industrials
        2,935,541                   2,935,541  
    Information Technology
        42,735,214                   42,735,214  
    Materials
        4,407,776                   4,407,776  
    Telecommunication Services
        58                   58  
    Utilities
        1,563,300                   1,563,300  
    Asset-Backed Securities
              9,026,703             9,026,703  
    Mortgage-Backed Obligations
              67,674,965             67,674,965  
    U.S. Government Obligations
              1,182,631             1,182,631  
    Non-Convertible Corporate Bonds and Notes
              32,300,360             32,300,360  
    Investment Companies
        45,770,701                   45,770,701  
         
    Total Investments, at Value
        164,341,995       110,184,659             274,526,654  
    Other Financial Instruments:
                                   
    Futures margins
        52,512                   52,512  
         
    Total Assets
      $ 164,394,507     $ 110,184,659     $     $ 274,579,166  


                        Level 3 —        
        Level 1 —     Level 2 —     Significant        
        Unadjusted     Other Significant     Unobservable        
        Quoted Prices     Observable Inputs     Inputs     Value  
     
    Liabilities Table
                                   
    Other Financial Instruments:
                                   
    Futures margins
      $ (14,250 )   $     $     $ (14,250 )
         
    Total Liabilities
      $ (14,250 )   $     $     $ (14,250 )
         
    Currency contracts and forwards, if any, are reported at their unrealized appreciation/depreciation at measurement date, which represents the change in the contract’s value from trade date. Futures, if any, are reported at their variation margin at measurement date, which represents the amount due to/from the Fund at that date. All additional assets and liabilities included in the above table are reported at their market value at measurement date.
    See the accompanying Notes for further discussion of the methods used in determining value of the Fund’s investments, and a summary of changes to the valuation methodologies, if any, during the reporting period.
    Futures Contracts as of December 31, 2010 are as follows:
                                             
                                        Unrealized  
                Number of     Expiration             Appreciation  
    Contract Description   Buy/Sell     Contracts     Date     Value     (Depreciation)  
     
    U.S. Treasury Long Bonds, 20 yr.
      Buy     45       3/22/11     $ 5,495,625     $ (22,972 )
    U.S. Treasury Nts., 2 yr.
      Sell     37       3/31/11       8,099,531       1,196  
    U.S. Treasury Nts., 5 yr.
      Sell     5       3/31/11       588,594       11,112  
    U.S. Treasury Nts., 10 yr.
      Sell     5       3/22/11       602,188       319  
    U.S. Ultra Bonds
      Buy     2       3/22/11       254,188       2,673  


                                      $ (7,672 )


    STATEMENT OF ASSETS AND LIABILITIES December 31, 2010.
             
    Assets
           
    Investments, at value—see accompanying statement of investments:
           
    Unaffiliated companies (cost $211,690,289)
      $ 228,771,016  
    Affiliated companies (cost $45,755,638)
        45,755,638  


        274,526,654  
    Receivables and other assets:
           
    Investments sold (including $3,511,651 sold on a when-issued or delayed delivery basis)
        3,649,301  
    Interest, dividends and principal paydowns
        815,182  
    Futures margins
        52,512  
    Other
        14,675  
     
         
    Total assets
        279,058,324  
     
           
    Liabilities
           
    Payables and other liabilities:
           
    Investments purchased (including $38,535,628 purchased on a when-issued or delayed delivery basis)
        38,562,101  
    Shares of beneficial interest redeemed
        108,495  
    Distribution and service plan fees
        53,658  
    Shareholder communications
        44,975  
    Transfer and shareholder servicing agent fees
        20,265  
    Futures margins
        14,250  
    Trustees’ compensation
        12,883  
    Other
        39,900  
     
         
    Total liabilities
        38,856,527  
     
           
    Net Assets
      $ 240,201,797  


    Composition of Net Assets
           
    Par value of shares of beneficial interest
      $ 21,026  
    Additional paid-in capital
        292,273,661  
    Accumulated net investment income
        5,128,069  
    Accumulated net realized loss on investments and foreign currency transactions
        (74,298,660 )
    Net unrealized appreciation on investments and translation of assets and liabilities denominated in foreign currencies
        17,077,701  
     
         
    Net Assets
      $ 240,201,797  


    Net Asset Value Per Share
           
    Non-Service Shares:
           
    Net asset value, redemption price per share and offering price per share (based on net assets of $150,621,790 and 13,130,034 shares of beneficial interest outstanding)
      $ 11.47  
    Service Shares:
           
    Net asset value, redemption price per share and offering price per share (based on net assets of $89,580,007 and 7,895,970 shares of beneficial interest outstanding)
      $ 11.35  


    STATEMENT OF OPERATIONS For the Year Ended December 31, 2010
             
    Investment Income
           
    Interest (net of foreign withholding taxes of $1,117)
      $ 4,519,752  
    Dividends:
           
    Unaffiliated companies (net of foreign withholding taxes of $26,938)
        2,054,137  
    Affiliated companies
        55,153  
    Income from investment of securities lending cash collateral—net, affiliated companies
        8  
     
         
    Total investment income
        6,629,050  
     
           
    Expenses
           
    Management fees
        1,780,237  
    Distribution and service plan fees—Service shares
        218,194  
    Transfer and shareholder servicing agent fees:
           
    Non-Service shares
        151,632  
    Service shares
        87,288  
    Shareholder communications:
           
    Non-Service shares
        35,610  
    Service shares
        20,549  
    Custodian fees and expenses
        15,263  
    Trustees’ compensation
        12,419  
    Administration service fees
        1,500  
    Other
        61,602  
     
         
    Total expenses
        2,384,294  
    Less waivers and reimbursements of expenses
        (614,948 )
     
         
    Net expenses
        1,769,346  
     
           
    Net Investment Income
        4,859,704  
     
           
    Realized and Unrealized Gain (Loss)
           
    Net realized gain (loss) on:
           
    Investments from unaffiliated companies
        15,190,576  
    Closing and expiration of futures contracts
        976,981  
    Foreign currency transactions
        (95,048 )
    Short positions
        (31,177 )
    Swap contracts
        4,460  
    Increase from payment by affiliate
        873  
     
         
    Net realized gain
        16,046,665  
    Net change in unrealized appreciation/depreciation on:
           
    Investments
        6,229,756  
    Translation of assets and liabilities denominated in foreign currencies
        1,036,724  
    Futures contracts
        321,322  
    Swap contracts
        35,332  
     
         
    Net change in unrealized appreciation/depreciation
        7,623,134  
     
           
    Net Increase in Net Assets Resulting from Operations
      $ 28,529,503  


    STATEMENTS OF CHANGES IN NET ASSETS
                     
    Year Ended December 31,   2010     2009  
     
    Operations
                   
    Net investment income
      $ 4,859,704     $ 6,170,062  
    Net realized gain (loss)
        16,046,665       (30,890,935 )
    Net change in unrealized appreciation/depreciation
        7,623,134       70,642,719  
         
    Net increase in net assets resulting from operations
        28,529,503       45,921,846  
     
                   
    Dividends and/or Distributions to Shareholders
                   
    Dividends from net investment income:
                   
    Non-Service shares
        (2,184,050 )      
    Service shares
        (1,027,757 )      
         
     
        (3,211,807 )      
     
                   
    Beneficial Interest Transactions
                   
    Net increase (decrease) in net assets resulting from beneficial interest transactions:
                   
    Non-Service shares
        (25,243,141 )     (40,306,895 )
    Service shares
        (8,416,068 )     4,509,086  
         
     
        (33,659,209 )     (35,797,809 )
     
                   
    Net Assets
                   
    Total increase (decrease)
        (8,341,513 )     10,124,037  
    Beginning of period
        248,543,310       238,419,273  
         
    End of period (including accumulated net investment income of $5,128,069 and $3,221,774, respectively)
      $ 240,201,797     $ 248,543,310  


    FINANCIAL HIGHLIGHTS
                                             
    Non-Service Shares    Year Ended December 31,   2010     2009     2008     2007     2006  
     
    Per Share Operating Data
                                           
    Net asset value, beginning of period
      $ 10.30     $ 8.45     $ 16.41     $ 17.69     $ 17.07  
     
    Income (loss) from investment operations:
                                           
    Net investment income1
        .23       .25       .41       .43       .40  
    Net realized and unrealized gain (loss)
        1.09       1.60       (7.03 )     .19       1.38  
         
    Total from investment operations
        1.32       1.85       (6.62 )     .62       1.78  
     
    Dividends and/or distributions to shareholders:
                                           
    Dividends from net investment income
        (.15 )           (.39 )     (.46 )     (.36 )
    Distributions from net realized gain
                    (.95 )     (1.44 )     (.80 )
         
    Total dividends and/or distributions to shareholders
        (.15 )           (1.34 )     (1.90 )     (1.16 )
     
    Net asset value, end of period
      $ 11.47     $ 10.30     $ 8.45     $ 16.41     $ 17.69  


    Total Return, at Net Asset Value2
        12.91 %     21.89 %     (43.47 )%     3.79 %     11.15 %
     
                                           
    Ratios/Supplemental Data
                                           
    Net assets, end of period (in thousands)
      $ 150,622     $ 159,797     $ 169,621     $ 385,948     $ 435,639  
     
    Average net assets (in thousands)
      $ 151,620     $ 159,013     $ 295,669     $ 418,103     $ 456,513  
     
    Ratios to average net assets:3
                                           
    Net investment income
        2.13 %     2.71 %     3.14 %     2.55 %     2.42 %
    Total expenses4
        0.91 %     0.89 %     0.76 %     0.75 %     0.75 %
    Expenses after payments, waivers and/or reimbursements and reduction to custodian expenses
        0.65 %     0.60 %     0.67 %     0.73 %     0.75 %
     
    Portfolio turnover rate5
        54 %     87 %     67 %     68 %     76 %
    1.   Per share amounts calculated based on the average shares outstanding during the period.
     
    2.   Assumes an initial investment on the business day before the first day of the fiscal period, with all dividends and distributions reinvested in additional shares on the reinvestment date, and redemption at the net asset value calculated on the last business day of the fiscal period. Total returns are not annualized for periods less than one full year. Total return information does not reflect expenses that apply at the separate account level or to related insurance products. Inclusion of these charges would reduce the total return figures for all periods shown. Returns do not reflect the deduction of taxes that a shareholder would pay on fund distributions or the redemption of fund shares.
     
    3.   Annualized for periods less than one full year.
     
    4.   Total expenses including indirect expenses from affiliated fund were as follows:
             
    Year Ended December 31, 2010
        0.92 %
    Year Ended December 31, 2009
        0.91 %
    Year Ended December 31, 2008
        0.76 %
    Year Ended December 31, 2007
        0.75 %
    Year Ended December 31, 2006
        0.75 %
    5.   The portfolio turnover rate excludes purchase and sale transactions of To Be Announced (TBA) mortgage-related securities as follows:
                     
        Purchase Transactions     Sale Transactions  
     
    Year Ended December 31, 2010
      $ 412,930,431     $ 414,511,903  
    Year Ended December 31, 2009
      $ 504,698,365     $ 520,212,670  
    Year Ended December 31, 2008
      $ 474,582,075     $ 434,587,487  
    Year Ended December 31, 2007
      $ 296,201,319     $ 315,527,720  
    Year Ended December 31, 2006
      $ 612,825,833     $ 666,549,894  


    Service Shares    Year Ended December 31,   2010     2009     2008     2007     2006  
     
    Per Share Operating Data
                                           
    Net asset value, beginning of period
      $ 10.19     $ 8.38     $ 16.28     $ 17.57     $ 16.97  
     
    Income (loss) from investment operations:
                                           
    Net investment income1
        .20       .22       .37       .38       .36  
    Net realized and unrealized gain (loss)
        1.08       1.59       (6.97 )     .19       1.37  
         
    Total from investment operations
        1.28       1.81       (6.60 )     .57       1.73  
     
    Dividends and/or distributions to shareholders:
                                           
    Dividends from net investment income
        (.12 )           (.35 )     (.42 )     (.33 )
    Distributions from net realized gain
                    (.95 )     (1.44 )     (.80 )
         
    Total dividends and/or distributions to shareholders
        (.12 )           (1.30 )     (1.86 )     (1.13 )
     
    Net asset value, end of period
      $ 11.35     $ 10.19     $ 8.38     $ 16.28     $ 17.57  


    Total Return, at Net Asset Value2
        12.68 %     21.60 %     (43.62 )%     3.49 %     10.86 %
     
                                           
    Ratios/Supplemental Data
                                           
    Net assets, end of period (in thousands)
      $ 89,580     $ 88,746     $ 68,798     $ 121,399     $ 111,363  
     
    Average net assets (in thousands)
      $ 87,280     $ 77,101     $ 100,164     $ 117,012     $ 100,010  
     
    Ratios to average net assets:3
                                           
    Net investment income
        1.87 %     2.42 %     2.90 %     2.30 %     2.17 %
    Total expenses4
        1.16 %     1.15 %     1.01 %     1.00 %     1.01 %
    Expenses after payments, waivers and/or reimbursements and reduction to custodian expenses
        0.90 %     0.85 %     0.92 %     0.98 %     1.01 %
     
    Portfolio turnover rate5
        54 %     87 %     67 %     68 %     76 %
    1.   Per share amounts calculated based on the average shares outstanding during the period.
     
    2.   Assumes an initial investment on the business day before the first day of the fiscal period, with all dividends and distributions reinvested in additional shares on the reinvestment date, and redemption at the net asset value calculated on the last business day of the fiscal period. Total returns are not annualized for periods less than one full year. Total return information does not reflect expenses that apply at the separate account level or to related insurance products. Inclusion of these charges would reduce the total return figures for all periods shown. Returns do not reflect the deduction of taxes that a shareholder would pay on fund distributions or the redemption of fund shares.
     
    3.   Annualized for periods less than one full year.
     
    4.   Total expenses including indirect expenses from affiliated fund were as follows:
             
    Year Ended December 31, 2010
        1.17 %
    Year Ended December 31, 2009
        1.17 %
    Year Ended December 31, 2008
        1.01 %
    Year Ended December 31, 2007
        1.00 %
    Year Ended December 31, 2006
        1.01 %
    5.   The portfolio turnover rate excludes purchase and sale transactions of To Be Announced (TBA) mortgage-related securities as follows:
                     
        Purchase Transactions     Sale Transactions  
     
    Year Ended December 31, 2010
      $ 412,930,431     $ 414,511,903  
    Year Ended December 31, 2009
      $ 504,698,365     $ 520,212,670  
    Year Ended December 31, 2008
      $ 474,582,075     $ 434,587,487  
    Year Ended December 31, 2007
      $ 296,201,319     $ 315,527,720  
    Year Ended December 31, 2006
      $ 612,825,833     $ 666,549,894  


    NOTES TO FINANCIAL STATEMENTS
    1. Significant Accounting Policies
    Oppenheimer Balanced Fund/VA (the “Fund”), is a separate series of Oppenheimer Variable Account Funds, an open end management investment company registered under the Investment Company Act of 1940, as amended. The Fund’s investment objective is to seek high total investment return, which includes current income and capital appreciation. The Fund’s investment adviser is OppenheimerFunds, Inc. (the “Manager”).
         The Fund offers two classes of shares. Both classes are sold at their offering price, which is the net asset value per share, to separate investment accounts of participating insurance companies as an underlying investment for variable life insurance policies, variable annuity contracts or other investment products. The class of shares designated as Service shares is subject to a distribution and service plan. Both classes of shares have identical rights and voting privileges with respect to the Fund in general and exclusive voting rights on matters that affect that class alone. Earnings, net assets and net asset value per share may differ due to each class having its own expenses, such as transfer and shareholder servicing agent fees and shareholder communications, directly attributable to that class.
         The following is a summary of significant accounting policies consistently followed by the Fund.
    Securities Valuation. The Fund calculates the net asset value of its shares as of the close of the New York Stock Exchange (the “Exchange”), normally 4:00 P.M. Eastern time, on each day the Exchange is open for trading.
         Each investment asset or liability of the Fund is assigned a level at measurement date based on the significance and source of the inputs to its valuation. Unadjusted quoted prices in active markets for identical securities are classified as “Level 1,” inputs other than unadjusted quoted prices for an asset that are observable are classified as “Level 2” and significant unobservable inputs, including the Manager’s judgment about the assumptions that a market participant would use in pricing an asset or liability, are classified as “Level 3.” The inputs used for valuing securities are not necessarily an indication of the risks associated with investing in those securities. A table summarizing the Fund’s investments under these levels of classification is included following the Statement of Investments.
         Securities are valued using unadjusted quoted market prices, when available, as supplied primarily by portfolio pricing services approved by the Board of Trustees or dealers.
         Securities traded on a registered U.S. securities exchange are valued based on the last sale price of the security reported on the principal exchange on which it is traded, prior to the time when the Fund’s assets are valued. Securities whose principal exchange is NASDAQ® are valued based on the official closing prices reported by NASDAQ prior to the time when the Fund’s assets are valued. In the absence of a sale, the security is valued at the last sale price on the prior trading day, if it is within the spread of the current day’s closing “bid” and “asked” prices, and if not, at the current day’s closing bid price. A foreign security traded on a foreign exchange is valued based on the last sale price on the principal exchange on which the security is traded, as identified by the portfolio pricing service used by the Manager, prior to the time when the Fund’s assets are valued. In the absence of a sale, the security is valued at the most recent official closing price on the principal exchange on which it is traded.
         Shares of a registered investment company that are not traded on an exchange are valued at that investment company’s net asset value per share.
         U.S. domestic and international debt instruments (including corporate, government, municipal, mortgage-backed, collateralized mortgage obligations and asset-backed securities) and “money market-type” debt instruments with a remaining maturity in excess of sixty days are valued at the mean between the “bid” and “asked” prices utilizing price quotations obtained from independent pricing services or broker-dealers. Such prices are typically determined based upon information obtained from market participants including reported trade data, broker-dealer price quotations and inputs such as benchmark yields and issuer spreads from identical or similar securities.
         “Money market-type” debt instruments with remaining maturities of sixty days or less are valued at cost adjusted by the amortization of discount or premium to maturity (amortized cost), which approximates market value.
         In the absence of a readily available unadjusted quoted market price, including for securities whose values have been materially affected by what the Manager identifies as a significant event occurring before the Fund’s assets are valued but after the close of the securities’ respective exchanges, the Manager, acting through its internal valuation committee, in good faith determines the fair valuation of that asset using consistently applied procedures under the supervision of the Board of Trustees (which reviews those fair valuations by the Manager). Those procedures include certain standardized methodologies to fair value securities. Such methodologies include, but are not limited to, pricing securities initially at cost and subsequently adjusting the value based on: changes in company specific fundamentals, changes in an appropriate securities index, or changes in the value of similar securities which may be adjusted for any discounts related to resale restrictions. When possible, such methodologies use observable market inputs such as unadjusted quoted prices of similar securities, observable interest rates, currency rates and yield curves. The methodologies used for valuing securities are not necessarily an indication of the risks associated with investing in those securities.
         There have been no significant changes to the fair valuation methodologies of the Fund during the period .
    Securities on a When-Issued or Delayed Delivery Basis. The Fund may purchase securities on a “when-issued” basis, and may purchase or sell securities on a “delayed delivery” basis. “When-issued” or “delayed delivery” refers to securities whose terms and indenture are available and for which a market exists, but which are not available for immediate delivery. Delivery and payment for securities that have been purchased by the Fund on a when-issued basis normally takes place within six months and possibly as long as two years or more after the trade date. During this period, such securities do not earn interest, are subject to market fluctuation and may increase or decrease in value prior to their delivery. The purchase of securities on a when-issued basis may increase the volatility of the Fund’s net asset value to the extent the Fund executes such transactions while remaining substantially fully invested. When the Fund engages in when-issued or delayed delivery transactions, it relies on the buyer or seller, as the case may be, to complete the transaction. Their failure to do so may cause the Fund to lose the opportunity to obtain or dispose of the security at a price and yield it considers advantageous. The Fund may also sell securities that it purchased on a when-issued basis or forward commitment prior to settlement of the original purchase.
    As of December 31, 2010, the Fund had purchased securities issued on a when-issued or delayed delivery basis and sold securities issued on a delayed delivery basis as follows:
             
        When-Issued or Delayed Delivery  
        Basis Transactions  
     
    Purchased securities
      $ 38,535,628  
    Sold securities
        3,511,651  
    The Fund may enter into “forward roll” transactions with respect to mortgage-related securities. In this type of transaction, the Fund sells a mortgage-related security to a buyer and simultaneously agrees to repurchase a similar security (same type, coupon and maturity) at a later date at a set price. During the period between the sale and the repurchase, the Fund will not be entitled to receive interest and principal payments on the securities that have been sold. The Fund records the incremental difference between the forward purchase and sale of each forward roll as realized gain (loss) on investments or as fee income in the case of such transactions that have an associated fee in lieu of a difference in the forward purchase and sale price.
         Forward roll transactions may be deemed to entail embedded leverage since the Fund purchases mortgage-related securities with extended settlement dates rather than paying for the securities under a normal settlement cycle. This embedded leverage increases the Fund’s market value of investments relative to its net assets which can incrementally increase the volatility of the Fund’s performance. Forward roll transactions can be replicated over multiple settlement periods.
         Risks of entering into forward roll transactions include the potential inability of the counterparty to meet the terms of the agreement; the potential of the Fund to receive inferior securities at redelivery as compared to the securities sold to the counterparty; and counterparty credit risk.
    Securities Sold Short. The Fund may short sell when-issued securities for future settlement. The value of the open short position is recorded as a liability, and the Fund records an unrealized gain or loss for the change in value of the open short position. The Fund records a realized gain or loss when the short position is closed out.
         As of December 31, 2010, the Fund had no outstanding securities sold short. 

    Investment in Oppenheimer Institutional Money Market Fund. The Fund is permitted to invest daily available cash balances in an affiliated money market fund. The Fund may invest the available cash in Class E shares of Oppenheimer Institutional Money Market Fund (“IMMF”) to seek current income while preserving liquidity. IMMF is a registered open-end management investment company, regulated as a money market fund under the Investment Company Act of 1940, as amended. The Manager is also the investment adviser of IMMF. When applicable, the Fund’s investment in IMMF is included in the Statement of Investments. Shares of IMMF are valued at their net asset value per share. As a shareholder, the Fund is subject to its proportional share of IMMF’s Class E expenses, including its management fee. The Manager will waive fees and/or reimburse Fund expenses in an amount equal to the indirect management fees incurred through the Fund’s investment in IMMF.
    Investment in OFI Liquid Assets Fund, LLC. The Fund is permitted to invest cash collateral received in connection with its securities lending activities. Pursuant to the Fund’s Securities Lending Procedures, the Fund may invest cash collateral in, among other investments, an affiliated money market fund. OFI Liquid Assets Fund, LLC (“LAF”) is a limited liability company whose investment objective is to seek current income and stability of principal. The Manager is also the investment adviser of LAF. LAF is not registered under the Investment Company Act of 1940. However, LAF does comply with the investment restrictions applicable to registered money market funds set forth in Rule 2a-7 adopted under the Investment Company Act. When applicable, the Fund’s investment in LAF is included in the Statement of Investments. Shares of LAF are valued at their net asset value per share. As a shareholder, the Fund is subject to its proportional share of LAF’s expenses, including its management fee of 0.08%.
    Foreign Currency Translation. The Fund’s accounting records are maintained in U.S. dollars. The values of securities denominated in foreign currencies and amounts related to the purchase and sale of foreign securities and foreign investment income are translated into U.S. dollars as of the close of the Exchange, normally 4:00 P.M. Eastern time, on each day the Exchange is open for trading. Foreign exchange rates may be valued primarily using a reliable bank, dealer or service authorized by the Board of Trustees.
         Reported net realized gains and losses from foreign currency transactions arise from sales of portfolio securities, sales and maturities of short-term securities, sales of foreign currencies, exchange rate fluctuations between the trade and settlement dates on securities transactions, and the difference between the amounts of dividends, interest, and foreign withholding taxes recorded on the Fund’s books and the U.S. dollar equivalent of the amounts actually received or paid. Net unrealized appreciation and depreciation on the translation of assets and liabilities denominated in foreign currencies arise from changes in the values of assets and liabilities, including investments in securities at fiscal period end, resulting from changes in exchange rates.
         The effect of changes in foreign currency exchange rates on investments is separately identified from the fluctuations arising from changes in market values of securities held and reported with all other foreign currency gains and losses in the Fund’s Statement of Operations.
    Allocation of Income, Expenses, Gains and Losses. Income, expenses (other than those attributable to a specific class), gains and losses are allocated on a daily basis to each class of shares based upon the relative proportion of net assets represented by such class. Operating expenses directly attributable to a specific class are charged against the operations of that class.
    Federal Taxes. The Fund intends to comply with provisions of the Internal Revenue Code applicable to regulated investment companies and to distribute substantially all of its investment company taxable income, including any net realized gain on investments not offset by capital loss carryforwards, if any, to shareholders. Therefore, no federal income or excise tax provision is required. The Fund files income tax returns in U.S. federal and applicable state jurisdictions. The statute of limitations on the Fund’s tax return filings generally remain open for the three preceding fiscal reporting period ends.
    The tax components of capital shown in the following table represent distribution requirements the Fund must satisfy under the income tax regulations, losses the Fund may be able to offset against income and gains realized in future years and unrealized appreciation or depreciation of securities and other investments for federal income tax purposes.
                             
                        Net Unrealized  
                        Appreciation  
                        Based on Cost of  
                        Securities and  
    Undistributed   Undistributed     Accumulated     Other Investments  
    Net Investment   Long-Term     Loss     for Federal Income  
    Income   Gain     Carryforward1,2,3,4     Tax Purposes  
     
    $5,132,304
      $     $ 73,401,146     $ 16,188,828  
    1.   As of December 31, 2010, the Fund had $73,280,658 of net capital loss carryforwards available to offset future realized capital gains, if any, and thereby reduce future taxable gain distributions. As of December 31, 2010, details of the capital loss carryforwards were as follows:
             
    Expiring        
     
    2016
      $ 28,551,951  
    2017
        44,728,707  
     
         
    Total
      $ 73,280,658  
     
         
    2.   The Fund had $120,488 of straddle losses which were deferred.
     
    3.   During the fiscal year ended December 31, 2010, the Fund utilized $15,850,155 of capital loss carryforward to offset capital gains realized in that fiscal year.
     
    4.   During the fiscal year ended December 31, 2009, the Fund did not utilize any capital loss carryforward.
    Net investment income (loss) and net realized gain (loss) may differ for financial statement and tax purposes. The character of dividends and distributions made during the fiscal year from net investment income or net realized gains may differ from their ultimate characterization for federal income tax purposes. Also, due to timing of dividends and distributions, the fiscal year in which amounts are distributed may differ from the fiscal year in which the income or net realized gain was recorded by the Fund.
    Accordingly, the following amounts have been reclassified for December 31, 2010. Net assets of the Fund were unaffected by the reclassifications.
                     
        Increase     Increase to  
        to Accumulated Net     Accumulated Net Realized  
        Investment Income     Loss on Investments  
         
     
      $ 258,398     $ 258,398  
    The tax character of distributions paid during the years ended December 31, 2010 and December 31, 2009 was as follows:
                     
        Year Ended     Year Ended  
        December 31, 2010     December 31, 2009  
     
    Distributions paid from:
                   
    Ordinary income
      $ 3,211,807     $  
    The aggregate cost of securities and other investments and the composition of unrealized appreciation and depreciation of securities and other investments for federal income tax purposes as of December 31, 2010 are noted in the following table. The primary difference between book and tax appreciation or depreciation of securities and other investments, if applicable, is attributable to the tax deferral of losses or tax realization of financial statement unrealized gain or loss.
             
    Federal tax cost of securities
      $ 258,342,473  
    Federal tax cost of other investments
        (3,540,501 )
     
         
    Total federal tax cost
      $ 254,801,972  


    Gross unrealized appreciation
      $ 29,102,763  
    Gross unrealized depreciation
        (12,913,935 )
     
         
    Net unrealized appreciation
      $ 16,188,828  


    Trustees’ Compensation. The Board of Trustees has adopted a compensation deferral plan for independent trustees that enables trustees to elect to defer receipt of all or a portion of the annual compensation they are entitled to receive from the Fund. For purposes of determining the amount owed to the Trustee under the plan, deferred amounts are treated as though equal dollar amounts had been invested in shares of the Fund or in other Oppenheimer funds selected by the Trustee. The Fund purchases shares of the funds selected for deferral by the Trustee in amounts equal to his or her deemed investment, resulting in a Fund asset equal to the deferred compensation liability. Such assets are included as a component of “Other” within the asset section of the Statement of Assets and Liabilities. Deferral of trustees’ fees under the plan will not affect the net assets of the Fund, and will not materially affect the Fund’s assets, liabilities or net investment income per share. Amounts will be deferred until distributed in accordance with the compensation deferral plan.
    Dividends and Distributions to Shareholders. Dividends and distributions to shareholders, which are determined in accordance with income tax regulations and may differ from U.S. generally accepted accounting principles, are recorded on the ex-dividend date. Income and capital gain distributions, if any, are declared and paid annually or at other times as deemed necessary by the Manager.
    Investment Income. Dividend income is recorded on the ex-dividend date or upon ex-dividend notification in the case of certain foreign dividends where the ex-dividend date may have passed. Non-cash dividends included in dividend income, if any, are recorded at the fair market value of the securities received. Interest income is recognized on an accrual basis. Discount and premium, which are included in interest income on the Statement of Operations, are amortized or accreted daily.
    Custodian Fees. “Custodian fees and expenses” in the Statement of Operations may include interest expense incurred by the Fund on any cash overdrafts of its custodian account during the period. Such cash overdrafts may result from the effects of failed trades in portfolio securities and from cash outflows resulting from unanticipated shareholder redemption activity. The Fund pays interest to its custodian on such cash overdrafts, to the extent they are not offset by positive cash balances maintained by the Fund, at a rate equal to the Federal Funds Rate plus 0.50%. The “Reduction to custodian expenses” line item, if applicable, represents earnings on cash balances maintained by the Fund during the period. Such interest expense and other custodian fees may be paid with these earnings.
    Security Transactions. Security transactions are recorded on the trade date. Realized gains and losses on securities sold are determined on the basis of identified cost.
    Indemnifications. The Fund’s organizational documents provide current and former trustees and officers with a limited indemnification against liabilities arising in connection with the performance of their duties to the Fund. In the normal course of business, the Fund may also enter into contracts that provide general indemnifications. The Fund’s maximum exposure under these arrangements is unknown as this would be dependent on future claims that may be made against the Fund. The risk of material loss from such claims is considered remote.
    Other. The preparation of financial statements in conformity with accounting principles generally accepted in the United States of America requires management to make estimates and assumptions that affect the reported amounts of assets and liabilities and disclosure of contingent assets and liabilities at the date of the financial statements and the reported amounts of increases and decreases in net assets from operations during the reporting period. Actual results could differ from those estimates.
    The Fund has authorized an unlimited number of $0.001 par value shares of beneficial interest of each class. Transactions in shares of beneficial interest were as follows:
                                     
        Year Ended December 31, 2010     Year Ended December 31, 2009  
        Shares     Amount     Shares     Amount  
     
    Non-Service Shares
                                   
    Sold
        272,126     $ 2,909,287       484,890     $ 4,273,547  
    Dividends and/or distributions reinvested
        209,000       2,184,050              
    Redeemed
        (2,866,355 )     (30,336,478 )     (5,041,004 )     (44,580,442 )
         
    Net decrease
        (2,385,229 )   $ (25,243,141 )     (4,556,114 )   $ (40,306,895 )


    Service Shares
                                   
    Sold
        627,983     $ 6,716,376       1,886,160     $ 16,689,571  
    Dividends and/or distributions reinvested
        99,204       1,027,757              
    Redeemed
        (1,542,514 )     (16,160,201 )     (1,382,728 )     (12,180,485 )
         
    Net increase (decrease)
        (815,327 )   $ (8,416,068 )     503,432     $ 4,509,086  
         
    3. Purchases and Sales of Securities
    The aggregate cost of purchases and proceeds from sales of securities, other than short-term obligations and investments in IMMF and LAF, for the year ended December 31, 2010, were as follows:
                     
        Purchases     Sales  
     
    Investment securities
      $ 106,307,480     $ 148,393,656  
    U.S. government and government agency obligations
        2,602,331       2,837,036  
    To Be Announced (TBA) mortgage-related securities
        412,930,431       414,511,903  
    4. Fees and Other Transactions with Affiliates
    Management Fees. Under the investment advisory agreement, the Fund pays the Manager a management fee based on the daily net assets of the Fund at an annual rate as shown in the following table:
             
    Fee Schedule        
     
    Up to $200 million
        0.75 %
    Next $200 million
        0.72  
    Next $200 million
        0.69  
    Next $200 million
        0.66  
    Over $800 million
        0.60  
    Administration Service Fees. The Fund pays the Manager a fee of $1,500 per year for preparing and filing the Fund’s tax returns.
    Transfer Agent Fees. OppenheimerFunds Services (“OFS”), a division of the Manager, acts as the transfer and shareholder servicing agent for the Fund. The Fund pays OFS fees at an annual rate of 0.10% of the daily net assets of each class of shares. For the year ended December 31, 2010, the Fund paid $239,666 to OFS for services to the Fund.
    Distribution and Service Plan for Service Shares. The Fund has adopted a Distribution and Service Plan (the “Plan”) in accordance with Rule 12b-1 under the Investment Company Act of 1940 for Service shares to pay OppenheimerFunds Distributor, Inc. (the “Distributor”), for distribution related services, personal service and account maintenance for the Fund’s Service shares. Under the Plan, payments are made periodically at an annual rate of 0.25% of the daily net assets of Service shares of the Fund. The Distributor currently uses all of those fees to compensate sponsors of the insurance product that offers Fund shares, for providing personal service and maintenance of accounts of their variable contract owners that hold Service shares. These fees are paid out of the Fund’s assets on an on-going basis and increase operating expenses of the Service shares, which results in lower performance compared to the Fund’s shares that are not subject to a service fee. Fees incurred by the Fund under the Plan are detailed in the Statement of Operations.
    Waivers and Reimbursements of Expenses. The Manager has voluntarily agreed to waive a portion of the advisory fee and/or reimburse certain expenses so that the “Expenses after payments, waivers and/or reimbursements and reduction to custodian expenses” will not exceed 0.67% of average annual net assets for Non-Service shares and 0.92% of average annual net assets for Service shares. During the year ended December 31, 2010, the Manager waived fees and/or reimbursed the Fund $343,597 and $197,835 for Non-Service and Service shares, respectively.
         From April 1, 2009 through March 31, 2010, the Manager voluntarily waived the advisory fee by 0.08% of the Fund’s average annual net assets. That voluntary waiver was applied after all other waivers and/or reimbursements. During the year ended December 31, 2010, the Manager waived $48,729.
         The Manager will waive fees and/or reimburse Fund expenses in an amount equal to the indirect management fees incurred through the Fund’s investment in IMMF. During the year ended December 31, 2010, the Manager waived fees and/or reimbursed the Fund $24,787 for IMMF management fees.
         Some of these undertakings may be modified or terminated at any time; some may not be modified or terminated until after one year from the date of the current prospectus, as indicated therein.
         During the year ended December 31, 2010, the Manager voluntarily reimbursed the Fund $873 for certain transactions. The payment is reported separately in the Statement of Operations and increased the Fund’s total returns by less than 0.01%.
    5. Risk Exposures and the Use of Derivative Instruments
    The Fund’s investment objectives not only permit the Fund to purchase investment securities, they also allow the Fund to enter into various types of derivatives contracts, including, but not limited to, futures contracts, forward foreign currency exchange contracts, credit default swaps, interest rate swaps, total return swaps, and purchased and written options. In doing so, the Fund will employ strategies in differing combinations to permit it to increase, decrease, or change the level or types of exposure to market risk factors. Central to those strategies are features inherent to derivatives that make them more attractive for this purpose than equity and debt securities: they require little or no initial cash investment, they can focus exposure on only certain selected risk factors, and they may not require the ultimate receipt or delivery of the underlying security (or securities) to the contract. This may allow the Fund to pursue its objectives more quickly and efficiently than if it were to make direct purchases or sales of securities capable of effecting a similar response to market factors.
    Market Risk Factors. In accordance with its investment objectives, the Fund may use derivatives to increase or decrease its exposure to one or more of the following market risk factors:
    Commodity Risk. Commodity risk relates to the change in value of commodities or commodity indexes as they relate to increases or decreases in the commodities market. Commodities are physical assets that have tangible properties. Examples of these types of assets are crude oil, heating oil, metals, livestock, and agricultural products.
    Credit Risk. Credit risk relates to the ability of the issuer to meet interest and principal payments, or both, as they come due. In general, lower-grade, higher-yield bonds are subject to credit risk to a greater extent than lower-yield, higher-quality bonds.
    Equity Risk. Equity risk relates to the change in value of equity securities as they relate to increases or decreases in the general market.
    Foreign Exchange Rate Risk. Foreign exchange rate risk relates to the change in the U.S. dollar value of a security held that is denominated in a foreign currency. The U.S. dollar value of a foreign currency denominated security will decrease as the dollar appreciates against the currency, while the U.S. dollar value will increase as the dollar depreciates against the currency.
    Interest Rate Risk. Interest rate risk refers to the fluctuations in value of fixed-income securities resulting from the inverse relationship between price and yield. For example, an increase in general interest rates will tend to reduce the market value of already issued fixed-income investments, and a decline in general interest rates will tend to increase their value. In addition, debt securities with longer maturities, which tend to have higher yields, are subject to potentially greater fluctuations in value from changes in interest rates than obligations with shorter maturities.
    Volatility Risk. Volatility risk refers to the magnitude of the movement, but not the direction of the movement, in a financial instrument’s price over a defined time period. Large increases or decreases in a financial instrument’s price over a relative time period typically indicate greater volatility risk, while small increases or decreases in its price typically indicate lower volatility risk.
    The Fund’s actual exposures to these market risk factors during the period are discussed in further detail, by derivative type, below.
    Risks of Investing in Derivatives. The Fund’s use of derivatives can result in losses due to unanticipated changes in the market risk factors and the overall market. In instances where the Fund is using derivatives to decrease, or hedge, exposures to market risk factors for securities held by the Fund, there are also risks that those derivatives may not perform as expected resulting in losses for the combined or hedged positions.
         Derivatives may have little or no initial cash investment relative to their market value exposure and therefore can produce significant gains or losses in excess of their cost. This use of embedded leverage allows the Fund to increase its market value exposure relative to its net assets and can substantially increase the volatility of the Fund’s performance.
         Additional associated risks from investing in derivatives also exist and potentially could have significant effects on the valuation of the derivative and the Fund. Typically, the associated risks are not the risks that the Fund is attempting to increase or decrease exposure to, per its investment objectives, but are the additional risks from investing in derivatives. Examples of these associated risks are liquidity risk, which is the risk that the Fund will not be able to sell the derivative in the open market in a timely manner, and counterparty credit risk, which is the risk that the counterparty will not fulfill its obligation to the Fund. Associated risks can be different for each type of derivative and are discussed by each derivative type in the notes that follow.
    Counterparty Credit Risk. Certain derivative positions are subject to counterparty credit risk, which is the risk that the counterparty will not fulfill its obligation to the Fund. The Fund’s derivative counterparties are financial institutions who are subject to market conditions that may weaken their financial position. The Fund intends to enter into financial transactions with counterparties that the Manager believes to be creditworthy at the time of the transaction.
    Credit Related Contingent Features. The Fund’s agreements with derivative counterparties have several credit related contingent features that if triggered would allow its derivatives counterparties to close out and demand payment or additional collateral to cover their exposure from the Fund. Credit related contingent features are established between the Fund and its derivatives counterparties to reduce the risk that the Fund will not fulfill its payment obligations to its counterparties. These triggering features include, but are not limited to, a percentage decrease in the Fund’s net assets and or a percentage decrease in the Fund’s Net Asset Value or NAV. The contingent features are established within the Fund’s International Swap and Derivatives Association, Inc. master agreements which govern certain positions in swaps, over-the-counter options and swaptions, and forward currency exchange contracts for each individual counterparty. 

    Valuations of derivative instruments as of December 31, 2010 are as follows:
                                     
        Asset Derivatives     Liability Derivatives  
        Statement             Statement        
    Derivatives Not   of Assets             of Assets        
    Accounted for as   and Liabilities             and Liabilities        
    Hedging Instruments   Location     Value     Location     Value  
     
    Interest rate contracts
      Futures margins   $ 52,512 *   Futures margins   $ 14,250 *
    *   Includes only the current day’s variation margin. Prior variation margin movements have been reflected in cash on the Statement of Assets and Liabilities upon receipt or payment.
    The effect of derivative instruments on the Statement of Operations is as follows:
                             
    Amount of Realized Gain or (Loss) Recognized on Derivatives  
    Derivatives Not   Closing and              
    Accounted for as   expiration of futures              
    Hedging Instruments   contracts     Swap contracts     Total  
     
    Credit contracts
      $     $ 4,460     $ 4,460  
    Interest rate contracts
        976,981             976,981  
         
    Total
      $ 976,981     $ 4,460     $ 981,441  
         
                             
    Amount of Change in Unrealized Gain or (Loss) Recognized on Derivatives  
    Derivatives Not                  
    Accounted for as                  
    Hedging Instruments   Futures contracts     Swap contracts     Total  
     
    Credit contracts
      $     $ 35,332     $ 35,332  
    Interest rate contracts
        321,322             321,322  
         
    Total
      $ 321,322     $ 35,332     $ 356,654  
         
    Futures Contracts
    A futures contract is a commitment to buy or sell a specific amount of a financial instrument at a negotiated price on a stipulated future date. The Fund may buy and sell futures contracts and may also buy or write put or call options on these futures contracts.
         Futures contracts traded on a commodities or futures exchange will be valued at the final settlement price or official closing price on the principal exchange as reported by such principal exchange at its trading session ending at, or most recently prior to, the time when the Fund’s assets are valued.
         Upon entering into a futures contract, the Fund is required to deposit either cash or securities (initial margin) in an amount equal to a certain percentage of the contract value. Subsequent payments (variation margin) are made or received by the Fund each day. The variation margin payments are equal to the daily changes in the contract value and are recorded as unrealized gains and losses.
         Futures contracts are reported on a schedule following the Statement of Investments. Securities held in collateralized accounts to cover initial margin requirements on open futures contracts are noted in the Statement of Investments. Cash held by the broker to cover initial margin requirements on open futures contracts and the receivable and/or payable for the daily mark to market for the variation margin are noted in the Statement of Assets and Liabilities. The net change in unrealized appreciation and depreciation is reported in the Statement of Operations. Realized gains (losses) are reported in the Statement of Operations at the closing or expiration of futures contracts.
         The Fund has purchased futures contracts on various bonds and notes to increase exposure to interest rate risk.
         The Fund has sold futures contracts on various bonds and notes to decrease exposure to interest rate risk.
         During the year ended December 31, 2010, the Fund had an average market value of $13,735,596 and $11,462,097 on futures contracts purchased and sold, respectively.
         Additional associated risks of entering into futures contracts (and related options) include the possibility that there may be an illiquid market where the Fund is unable to liquidate the contract or enter into an offsetting position and, if used for hedging purposes, the risk that the price of the contract will correlate imperfectly with the prices of the Fund’s securities.
    Swap Contracts
    The Fund may enter into swap contract agreements with a counterparty to exchange a series of cash flows based on either specified reference rates, or the occurrence of a credit event, over a specified period. Such contracts may include interest rate, equity, debt, index, total return, credit and currency swaps.
         Swaps are marked to market daily using primarily quotations from pricing services, counterparties and brokers. Swap contracts are reported on a schedule following the Statement of Investments. The values of swap contracts are aggregated by positive and negative values and disclosed separately on the Statement of Assets and Liabilities by contracts in unrealized appreciation and depreciation positions. Upfront payments paid or received, if any, affect the value of the respective swap. Therefore, to determine the unrealized appreciation (depreciation) on swaps, upfront payments paid should be subtracted from, while upfront payments received should be added to, the value of contracts reported as an asset on the Statement of Assets and Liabilities. Conversely, upfront payments paid should be added to, while upfront payments received should be subtracted from the value of contracts reported as a liability. The unrealized appreciation (depreciation) related to the change in the valuation of the notional amount of the swap is combined with the accrued interest due to (owed by) the Fund at termination or settlement. The net change in this amount during the period is included on the Statement of Operations. The Fund also records any periodic payments received from (paid to) the counterparty, including at termination, under such contracts as realized gain (loss) on the Statement of Operations.
         Swap contract agreements are exposed to the market risk factor of the specific underlying reference asset. Swap contracts are typically more attractively priced compared to similar investments in related cash securities because they isolate the risk to one market risk factor and eliminate the other market risk factors. Investments in cash securities (for instance bonds) have exposure to multiple risk factors (credit and interest rate risk). Because swaps require little or no initial cash investment, they can expose the Fund to substantial risk in the isolated market risk factor.
         Credit Default Swap Contracts. A credit default swap is a bilateral contract that enables an investor to buy or sell protection on a debt security against a defined-issuer credit event, such as the issuer’s failure to make timely payments of interest or principal on the debt security, bankruptcy or restructuring. The Fund may enter into credit default swaps either by buying or selling protection on a single security or a basket of securities (the “reference asset”).
         The buyer of protection pays a periodic fee to the seller of protection based on the notional amount of debt securities underlying the swap contract. The seller of protection agrees to compensate the buyer of protection for future potential losses as a result of a credit event on the reference asset. The contract effectively transfers the credit event risk of the reference asset from the buyer of protection to the seller of protection.
         The ongoing value of the contract will fluctuate throughout the term of the contract based primarily on the credit risk of the reference asset. If the credit quality of the reference asset improves relative to the credit quality at contract initiation, the buyer of protection may have an unrealized loss greater than the anticipated periodic fee owed. This unrealized loss would be the result of current credit protection being cheaper than the cost of credit protection at contract initiation. If the buyer elects to terminate the contract prior to its maturity, and there has been no credit event, this unrealized loss will become realized. If the contract is held to maturity, and there has been no credit event, the realized loss will be equal to the periodic fee paid over the life of the contract.
         If there is a credit event, the buyer of protection can exercise its rights under the contract and receive a payment from the seller of protection equal to the notional amount of the reference asset less the market value of the reference asset. Upon exercise of the contract the difference between the value of the underlying reference asset and the notional amount is recorded as realized gain (loss) and is included on the Statement of Operations. 

         The Fund has engaged in pairs trades by purchasing protection through a credit default swap referenced to the debt of an issuer, and simultaneously selling protection through a credit default swap referenced to the debt of a different issuer with the intent to realize gains from the pricing differences of the two issuers who are expected to have similar market risks. Pairs trades attempt to gain exposure to credit risk while hedging or offsetting the effects of overall market movements.
         For the year ended December 31, 2010, the Fund had average notional amounts of $758,077 and $758,077 on credit default swaps to buy protection and credit default swaps to sell protection, respectively.
         Additional associated risks to the Fund include counterparty credit risk and liquidity risk.
          As of December 31, 2010, the Fund had no such credit default swaps outstanding.
    6. Restricted Securities
    As of December 31, 2010, investments in securities included issues that are restricted. A restricted security may have a contractual restriction on its resale and is valued under methods approved by the Board of Trustees as reflecting fair value. Securities that are restricted are marked with an applicable footnote on the Statement of Investments. Restricted securities are reported on a schedule following the Statement of Investments.
    7. Securities Lending
    The Fund lends portfolio securities from time to time in order to earn additional income in the form of fees or interest on securities received as collateral or the investment of any cash received as collateral. The loans are secured by collateral (either securities, letters of credit, or cash) in an amount not less than 100% of the market value of the loaned securities during the period of the loan. The market value of the loaned securities is determined at the close of each business day and any additional required collateral is delivered to the Fund on the next business day. If the borrower defaults on its obligation to return the securities loaned because of insolvency or other reasons, the Fund could experience delays and cost in recovering the securities loaned or in gaining access to the collateral. The Fund continues to receive the economic benefit of interest or dividends paid on the securities loaned in the form of a substitute payment received from the borrower and recognizes the gain or loss in the fair value of the securities loaned that may occur during the term of the loan. The Fund has the right under the lending agreement to recover the securities from the borrower on demand.
         As of December 31, 2010, the Fund had no securities on loan.
    8. Pending Litigation
    Since 2009, a number of lawsuits have been pending in federal courts against the Manager, the Distributor, and certain mutual funds (“Defendant Funds”) advised by the Manager and distributed by the Distributor (but not including the Fund). The lawsuits naming the Defendant Funds also name as defendants certain officers and current and former trustees of the respective Defendant Funds. The plaintiffs seek class action status on behalf of purchasers of shares of the respective Defendant Fund during a particular time period. The lawsuits raise claims under federal securities laws alleging that, among other things, the disclosure documents of the respective Defendant Fund contained misrepresentations and omissions, that such Defendant Fund’s investment policies were not followed, and that such Defendant Fund and the other defendants violated federal securities laws and regulations. The plaintiffs seek unspecified damages, equitable relief and an award of attorneys’ fees and litigation expenses.
         In 2009, what are claimed to be derivative lawsuits were filed in state court against the Manager and a subsidiary (but not against the Fund), on behalf of the New Mexico Education Plan Trust. These lawsuits allege breach of contract, breach of fiduciary duty, negligence and violation of state securities laws, and seek compensatory damages, equitable relief and an award of attorneys’ fees and litigation expenses.
         Other lawsuits have been filed since 2008 in various state and federal courts, against the Manager and certain of its affiliates. Those lawsuits were filed by investors who made investments through an affiliate of the Manager, and relate to the alleged investment fraud perpetrated by Bernard Madoffand his firm (“Madoff”) . Those suits allege a variety of claims, including breach of fiduciary duty, fraud, negligent misrepresentation, unjust enrichment, and violation of federal and state securities laws and regulations, among others. They seek unspecified damages, equitable relief and an award of attorneys’ fees and litigation expenses. None of the suits have named the Distributor, any of the Oppenheimer mutual funds or any of their independent Trustees or Directors as defendants. None of the Oppenheimer funds invested in any funds or accounts managed by Madoff.
         The Manager believes that the lawsuits described above are without legal merit and is defending against them vigorously. The Defendant Funds’ Boards of Trustees have also engaged counsel to defend the suits brought against those Funds and the present and former Independent Trustees named in those suits. While it is premature to render any opinion as to the outcome in these lawsuits, or whether any costs that the Defendant Funds may bear in defending the suits might not be reimbursed by insurance, the Manager believes that these suits should not impair the ability of the Manager or the Distributor to perform their respective duties to the Fund, and that the outcome of all of the suits together should not have any material effect on the operations of any of the Oppenheimer funds.
    9. Subsequent Event
    The Regulated Investment Company Modernization Act of 2010 (the “Act”) was signed into law on December 22, 2010. The Act makes changes to a number of tax rules impacting the Fund. Under the Act, future capital losses generated by a fund may be carried over indefinitely, but these losses must be used prior to the utilization of any pre-enactment capital losses. Since pre-enactment capital losses may only be carried forward for eight years, there may be a greater likelihood that all or a portion of a fund’s pre-enactment capital losses will expire unused. In general, the provisions of the Act will be effective for the Fund’s fiscal year ending December 31, 2011. Specific information regarding the impact of the Act on the Fund will be contained within the “Federal Taxes” section of the financial statement notes for the fiscal year ending December 31, 2011.


    REPORT OF INDEPENDENT REGISTERED PUBLIC ACCOUNTING FIRM
    The Board of Trustees and Shareholders of Oppenheimer Variable Account Funds:
    We have audited the accompanying statement of assets and liabilities of Oppenheimer Capital Appreciation Fund/VA (one of the portfolios constituting the Oppenheimer Variable Account Funds), including the statement of investments, as of December 31, 2010, the related statement of operations for the year then ended, and the statements of changes in net assets and the financial highlights for each of the years in the two-year period then ended. These financial statements and financial highlights are the responsibility of the Fund’s management. Our responsibility is to express an opinion on these financial statements and financial highlights based on our audits. The accompanying financial highlights of Oppenheimer Capital Appreciation Fund/VA for the years ended prior to January 1, 2009 were audited by other auditors whose report dated February 11, 2009 expressed an unqualified opinion on those financial highlights.
         We conducted our audits in accordance with the standards of the Public Company Accounting Oversight Board (United States). Those standards require that we plan and perform the audit to obtain reasonable assurance about whether the financial statements and financial highlights are free of material misstatement. An audit includes examining, on a test basis, evidence supporting the amounts and disclosures in the financial statements. Our procedures included confirmation of securities owned as of December 31, 2010, by correspondence with the custodian and transfer agent. An audit also includes assessing the accounting principles used and significant estimates made by management, as well as evaluating the overall financial statement presentation. We believe that our audits provide a reasonable basis for our opinion.
         In our opinion, the financial statements and financial highlights referred to above present fairly, in all material respects, the financial position of Oppenheimer Capital Appreciation Fund/VA as of December 31, 2010, the results of its operations for the year then ended, and the changes in its net assets and the financial highlights for each of the years in the two-year period then ended, in conformity with U.S. generally accepted accounting principles.
    /s/ KPMG llp
    Denver, Colorado
    February 16, 2011


    STATEMENT OF INVESTMENTS December 31, 2010
                     
        Shares     Value  
     
    Common Stocks—100.2%
                   
    Consumer Discretionary—12.4%
                   
    Hotels, Restaurants & Leisure—1.6%
                   
    McDonald’s Corp.
        248,240     $ 19,054,901  
    Internet & Catalog Retail—1.5%
                   
    Amazon.com, Inc.1
        97,124       17,482,320  
    Media—2.0%
                   
    McGraw-Hill Cos., Inc. (The)
        248,450       9,046,065  
    Walt Disney Co. (The)
        407,570       15,287,951  


                24,334,016  
     
                   
    Multiline Retail—0.3%
                   
    Target Corp.
        57,250       3,442,443  
    Specialty Retail—3.1%
                   
    Bed Bath & Beyond, Inc.1
        262,900       12,921,535  
    O’Reilly Automotive, Inc.1
        194,740       11,766,191  
    TJX Cos., Inc. (The)
        273,070       12,121,577  


                36,809,303  
     
                   
    Textiles, Apparel & Luxury Goods—3.9%
                   
    Coach, Inc.
        288,630       15,964,125  
    Nike, Inc., Cl. B
        205,160       17,524,767  
    Polo Ralph Lauren Corp., Cl. A
        119,640       13,270,469  


                46,759,361  
     
                   
    Consumer Staples—9.1%
                   
    Beverages—1.5%
                   
    Brown-Forman Corp., Cl. B
        34,450       2,398,409  
    PepsiCo, Inc.
        240,250       15,695,533  


                18,093,942  
     
                   
    Food & Staples Retailing—1.5%
                   
    Costco Wholesale Corp.
        247,550       17,875,586  
    Food Products—4.8%
                   
    DANONE SA
        235,730       14,811,680  
    General Mills, Inc.
        368,033       13,098,294  
    Nestle SA
        295,586       17,308,378  
    Unilever NV CVA
        368,700       11,479,842  


                56,698,194  
     
                   
    Household Products—1.3%
                   
    Colgate-Palmolive Co.
        198,240       15,932,549  
    Energy—9.6%
                   
    Energy Equipment & Services—3.1%
                   
    Halliburton Co.
        402,720       16,443,058  
    Schlumberger Ltd.
        254,890       21,283,315  


                37,726,373  
     
                   
    Oil, Gas & Consumable Fuels—6.5%
                   
    Chevron Corp.
        173,200       15,804,500  
    ConocoPhillips
        321,330       21,882,573  
    EOG Resources, Inc.
        129,930       11,876,901  
    Occidental Petroleum Corp.
        282,860       27,748,566  


                77,312,540  
     
                   
    Financials—5.7%
                   
    Commercial Banks—2.4%
                   
    U.S. Bancorp
        548,930       14,804,642  
    Wells Fargo & Co.
        452,580       14,025,454  


                28,830,096  
     
                   
    Diversified Financial Services—3.3%
                   
    BM&F BOVESPA SA
        1,269,560       10,041,761  
    CME Group, Inc.
        29,610       9,527,018  
    IntercontinentalExchange, Inc.1
        72,720       8,664,588  
    JPMorgan Chase & Co.
        267,710       11,356,258  


                39,589,625  
     
                   
    Health Care—13.5%
                   
    Biotechnology—1.3%
                   
    Celgene Corp.1
        255,860       15,131,560  
    Health Care Equipment & Supplies—2.1%
                   
    Baxter International, Inc.
        271,150       13,725,613  
    Stryker Corp.
        218,840       11,751,708  


                25,477,321  
     
                   
    Health Care Providers & Services—2.3%
                   
    Express Scripts, Inc.1
        240,780       13,014,159  
    Medco Health Solutions, Inc.1
        232,640       14,253,853  


                27,268,012  
     
                   
    Life Sciences Tools & Services—2.3%
                   
    Mettler-Toledo International, Inc.1
        56,650       8,566,047  
    Thermo Fisher Scientific, Inc.1
        347,210       19,221,546  


                27,787,593  
     
                   
    Pharmaceuticals—5.5%
                   
    Allergan, Inc.
        288,600       19,818,162  
    Bristol-Myers Squibb Co.
        543,080       14,380,758  
    Novo Nordisk AS, Cl. B
        165,769       18,692,680  
    Roche Holding AG
        82,488       12,086,477  


                64,978,077  
     
                   
    Industrials—14.5%
                   
    Aerospace & Defense—2.8%
                   
    Goodrich Corp.
        216,332       19,052,359  
    United Technologies Corp.
        186,350       14,669,472  


                33,721,831  
     
                   
    Air Freight & Logistics—1.3%
                   
    United Parcel Service, Inc., Cl. B
        208,910       15,162,688  

                     
        Shares     Value  
     
    Electrical Equipment—2.9%
                   
    ABB Ltd.
        599,978     $ 13,366,355  
    Emerson Electric Co.
        362,610       20,730,414  


                34,096,769  
     
                   
    Machinery—6.2%
                   
    Caterpillar, Inc.
        210,700       19,734,162  
    Danaher Corp.
        329,280       15,532,138  
    Joy Global, Inc.
        211,607       18,356,907  
    Parker-Hannifin Corp.
        234,330       20,222,679  


                73,845,886  
     
                   
    Road & Rail—1.3%
                   
    Union Pacific Corp.
        170,770       15,823,548  
    Information Technology—30.0%
                   
    Communications Equipment—7.8%
                   
    Cisco Systems, Inc.1
        1,187,670       24,026,564  
    Juniper Networks, Inc.1
        646,920       23,884,286  
    QUALCOMM, Inc.
        915,390       45,302,651  


                93,213,501  
     
                   
    Computers & Peripherals—5.1%
                   
    Apple, Inc.1
        189,280       61,054,157  
    Electronic Equipment & Instruments—1.3%
                   
    Corning, Inc.
        783,180       15,131,038  
    Internet Software & Services—5.9%
                   
    Akamai Technologies, Inc.1
        287,860       13,543,813  
    eBay, Inc.1
        515,230       14,338,851  
    Google, Inc., Cl. A1
        72,920       43,312,292  


                71,194,956  
     
                   
    IT Services—3.5%
                   
    Cognizant Technology Solutions Corp.1
        214,730       15,737,562  
    International Business Machines Corp.
        88,240       12,950,102  
    Visa, Inc., Cl. A
        180,027       12,670,300  


                41,357,964  
     
                   
    Semiconductors & Semiconductor Equipment—1.6%
                   
    Broadcom Corp., Cl. A
        455,600       19,841,380  
    Software—4.8%
                   
    Intuit, Inc.1
        233,840       11,528,312  
    Oracle Corp.
        1,014,540       31,755,102  
    Vmware, Inc., Cl. A1
        155,930       13,863,736  


                57,147,150  
     
                   
    Materials—4.2%
                   
    Chemicals—2.5%
                   
    Ecolab, Inc.
        239,720       12,086,682  
    Praxair, Inc.
        188,212       17,968,600  


                30,055,282  
     
                   
    Metals & Mining—1.7%
                   
    Barrick Gold Corp.
        243,240       12,935,503  
    Freeport-McMoRan Copper & Gold, Inc., Cl. B
        64,150       7,703,774  


                20,639,277  
     
                   
    Telecommunication Services—1.2%
                   
    Wireless Telecommunication Services—1.2%
                   
    NII Holdings, Inc.1
        319,600       14,273,336  
     
                 
    Total Common Stocks
    (Cost $856,088,482)
                1,197,142,575  
     
                   
    Investment Companies—0.0%
                   
    JPMorgan U.S. Treasury Plus Money Market Fund, Agency Shares, 0.00%2,3
        9,530       9,530  
    Oppenheimer Institutional Money Market Fund, Cl. E, 0.21%2,4
        72,534       72,534  
     
                 
    Total Investment Companies
    (Cost $82,064)
                82,064  
     
                   
    Total Investments, at Value
    (Cost $856,170,546)
        100.2 %     1,197,224,639  
    Liabilities in Excess of Other Assets
        (0.2 )     (2,149,238 )


    Net Assets
        100.0 %   $ 1,195,075,401  
         

    Footnotes to Statement of Investments
    1.   Non-income producing security.
     
    2.   Rate shown is the 7-day yield as of December 31, 2010.
     
    3.   Interest rate is less than 0.0005%.
     
    4.   Is or was an affiliate, as defined in the Investment Company Act of 1940, at or during the period ended December 31, 2010, by virtue of the Fund owning at least 5% of the voting securities of the issuer or as a result of the Fund and the issuer having the same investment adviser. Transactions during the period in which the issuer was an affiliate are as follows:
                                     
        Shares     Gross     Gross     Shares  
        December 31, 2009     Additions     Reductions     December 31, 2010  
     
    Oppenheimer Institutional Money Market Fund, Cl. E
        7,898,767       269,513,524       277,339,757       72,534  
                     
        Value     Income  
     
    Oppenheimer Institutional Money Market Fund, Cl. E
      $ 72,534     $ 33,991  
    Valuation Inputs
    Various data inputs are used in determining the value of each of the Fund’s investments as of the reporting period end. These data inputs are categorized in the following hierarchy under applicable financial accounting standards:
    1) Level 1—unadjusted quoted prices in active markets for identical assets or liabilities (including securities actively traded on a securities exchange)
    2) Level 2—inputs other than unadjusted quoted prices that are observable for the asset or liability (such as unadjusted quoted prices for similar assets and market corroborated inputs such as interest rates, prepayment speeds, credit risks, etc.)
    3) Level 3—significant unobservable inputs (including the Manager’s own judgments about assumptions that market participants would use in pricing the asset or liability).
    The table below categorizes amounts that are included in the Fund’s Statement of Assets and Liabilities as of December 31, 2010 based on valuation input level:
                                     
                        Level 3–        
        Level 1–     Level 2–     Significant        
        Unadjusted     Other Significant     Unobservable        
        Quoted Prices     Observable Inputs     Inputs     Value  
     
    Assets Table
                                   
    Investments, at Value:
                                   
    Common Stocks
                                   
    Consumer Discretionary
      $ 147,882,344     $     $     $ 147,882,344  
    Consumer Staples
        108,600,271                   108,600,271  
    Energy
        115,038,913                   115,038,913  
    Financials
        68,419,721                   68,419,721  
    Health Care
        160,642,563                   160,642,563  
    Industrials
        172,650,722                   172,650,722  
    Information Technology
        358,940,146                   358,940,146  
    Materials
        50,694,559                   50,694,559  
    Telecommunication Services
        14,273,336                   14,273,336  
    Investment Companies
        82,064                   82,064  
         
    Total Assets
      $ 1,197,224,639     $     $     $ 1,197,224,639  
         
     
    Liabilities Table
                                   
    Other Financial Instruments:
                                   
    Foreign currency exchange contracts
      $     $ (1,356 )   $     $ (1,356 )
         
    Total Liabilities
      $     $ (1,356 )   $     $ (1,356 )
         
    Currency contracts and forwards, if any, are reported at their unrealized appreciation/depreciation at measurement date, which represents the change in the contract’s value from trade date. Futures, if any, are reported at their variation margin at measurement date, which represents the amount due to/from the Fund at that date. All additional assets and liabilities included in the above table are reported at their market value at measurement date. 

    The table below shows the significant transfers between Level 1 and Level 2. The Fund’s policy is to recognize transfers in and transfers out as of the beginning of the reporting period.
                     
        Transfers into Level 1*     Transfers out of Level 2*  
     
    Assets Table
                   
    Investments, at Value:
                   
    Common Stocks
                   
    Financials
        $ 11,587,906       $ (11,587,906 )
    Industrials
        19,626,598       (19,626,598 )
           
    Total Assets
          $ 31,214,504         $ (31,214,504 )
           
    *   Transferred from Level 2 to Level 1 due to the presence of a readily available unadjusted quoted market price. As of the prior reporting period end, these securities were absent of a readily available unadjusted quoted market price due to a significant event occurring before the Fund’s assets were valued but after the close of the securities’ respective exchanges.
    Foreign Currency Exchange Contracts as of December 31, 2010 are as follows:
                                             
                Contract                      
                Amount     Expiration             Unrealized  
    Counterparty/Contract Description   Buy/Sell     (000’s)     Date     Value     Depreciation  
     
    Deutsche Bank Capital Corp.
                                           
    Danish Krone (DKK)
      Sell     399 DKK     1/3/11     $ 71,482     $ 1,356  
    See the accompanying Notes for further discussion of the methods used in determining value of the Fund’s investments, and a summary of changes to the valuation methodologies, if any, during the reporting period.


    STATEMENT OF ASSETS AND LIABILITIES December 31, 2010
             
    Assets
           
    Investments, at value—see accompanying statement of investments:
           
    Unaffiliated companies (cost $856,098,012)
      $ 1,197,152,105  
    Affiliated companies (cost $72,534)
        72,534  


        1,197,224,639  
     
           
    Receivables and other assets:
           
    Dividends
        2,631,496  
    Shares of beneficial interest sold
        136,457  
    Investments sold
        71,483  
    Other
        37,236  
     
         
    Total assets
        1,200,101,311  
     
           
    Liabilities
           
    Unrealized depreciation on foreign currency exchange contracts
        1,356  
    Payables and other liabilities:
           
    Shares of beneficial interest redeemed
        4,343,554  
    Distribution and service plan fees
        271,331  
    Shareholder communications
        218,390  
    Transfer and shareholder servicing agent fees
        111,056  
    Trustees’ compensation
        34,751  
    Other
        45,472  
     
         
    Total liabilities
        5,025,910  
     
           
    Net Assets
      $ 1,195,075,401  


    Composition of Net Assets
           
    Par value of shares of beneficial interest
      $ 29,715  
    Additional paid-in capital
        1,209,571,625  
    Accumulated net investment income
        1,761,658  
    Accumulated net realized loss on investments and foreign currency transactions
        (357,604,256 )
    Net unrealized appreciation on investments and translation of assets and liabilities denominated in foreign currencies
        341,316,659  
     
         
    Net Assets
      $ 1,195,075,401  


    Net Asset Value Per Share
           
    Non-Service Shares:
           
    Net asset value, redemption price per share and offering price per share (based on net assets of $771,086,429 and 19,112,005 shares of beneficial interest outstanding)
      $ 40.35  
    Service Shares:
           
    Net asset value, redemption price per share and offering price per share (based on net assets of $423,988,972 and 10,602,603 shares of beneficial interest outstanding)
      $ 39.99  


    STATEMENT OF OPERATIONS For the Year Ended December 31, 2010
             
    Investment Income
           
    Dividends:
           
    Unaffiliated companies (net of foreign withholding taxes of $387,126)
      $ 15,344,362  
    Affiliated companies
        33,991  
    Interest
        714  
     
         
    Total investment income
        15,379,067  
     
           
    Expenses
           
    Management fees
        9,268,654  
    Distribution and service plan fees—Service shares
        1,058,768  
    Transfer and shareholder servicing agent fees:
           
    Non-Service shares
        976,827  
    Service shares
        427,935  
    Shareholder communications:
           
    Non-Service shares
        154,704  
    Service shares
        68,283  
    Trustees’ compensation
        54,830  
    Custodian fees and expenses
        40,925  
    Administration service fees
        1,500  
    Other
        109,303  
     
         
    Total expenses
        12,161,729  
    Less waivers and reimbursements of expenses
        (22,303 )
     
         
    Net expenses
        12,139,426  
     
           
    Net Investment Income
        3,239,641  
     
           
    Realized and Unrealized Gain (Loss)
           
    Net realized gain on:
           
    Investments from unaffiliated companies
        85,546,977  
    In-kind redemptions
        72,760,040  
    Foreign currency transactions
        973,183  
     
         
    Net realized gain
        159,280,200  
    Net change in unrealized appreciation/depreciation on:
           
    Investments
        (42,832,009 )
    Translation of assets and liabilities denominated in foreign currencies
        3,890,351  
     
         
    Net change in unrealized appreciation/depreciation
        (38,941,658 )
     
           
    Net Increase in Net Assets Resulting from Operations
      $ 123,578,183  


    STATEMENTS OF CHANGES IN NET ASSETS
                     
    Year Ended December 31,   2010     2009  
     
    Operations
                   
    Net investment income
      $ 3,239,641     $ 2,793,303  
    Net realized gain (loss)
        159,280,200       (43,296,323 )
    Net change in unrealized appreciation/depreciation
        (38,941,658 )     521,300,083  
         
    Net increase in net assets resulting from operations
        123,578,183       480,797,063  
     
                   
    Dividends and/or Distributions to Shareholders
                   
    Dividends from net investment income:
                   
    Non-Service shares
        (1,796,034 )     (2,975,281 )
    Service shares
              (24,236 )
         
     
        (1,796,034 )     (2,999,517 )
     
                   
    Beneficial Interest Transactions
                   
    Net decrease in net assets resulting from beneficial interest transactions:
                   
    Non-Service shares
        (385,079,054 )     (97,375,095 )
    Service shares
        (59,987,624 )     (5,924,734 )
         
     
        (445,066,678 )     (103,299,829 )
     
                   
    Net Assets
                   
    Total increase (decrease)
        (323,284,529 )     374,497,717  
    Beginning of period
        1,518,359,930       1,143,862,213  
         
    End of period (including accumulated net investment income of $1,761,658 and $434,803, respectively)
      $ 1,195,075,401     $ 1,518,359,930  


    FINANCIAL HIGHLIGHTS
                                             
    Non-Service Shares      Year Ended December 31,   2010     2009     2008     2007     2006  
     
    Per Share Operating Data
                                           
    Net asset value, beginning of period
      $ 36.94     $ 25.67     $ 47.18     $ 41.43     $ 38.52  
     
    Income (loss) from investment operations:
                                           
    Net investment income1
        .11       .09       .10       .07       .07  
    Net realized and unrealized gain (loss)
        3.36       11.27       (21.55 )     5.78       2.98  
         
    Total from investment operations
        3.47       11.36       (21.45 )     5.85       3.05  
     
    Dividends and/or distributions to shareholders:
                                           
    Dividends from net investment income
        (.06 )     (.09 )     (.06 )     (.10 )     (.14 )
     
     
    Net asset value, end of period
      $ 40.35     $ 36.94     $ 25.67     $ 47.18     $ 41.43  


    Total Return, at Net Asset Value2
        9.42 %     44.52 %     (45.52 )%     14.15 %     7.95 %
     
                                           
    Ratios/Supplemental Data
                                           
    Net assets, end of period (in thousands)
      $ 771,086     $ 1,074,190     $ 829,931     $ 1,631,791     $ 1,598,967  
     
    Average net assets (in thousands)
      $ 976,242     $ 927,670     $ 1,256,525     $ 1,631,686     $ 1,615,352  
     
    Ratios to average net assets:3
                                           
    Net investment income
        0.31 %     0.29 %     0.25 %     0.15 %     0.17 %
    Total expenses4
        0.79 %     0.78 %     0.66 %     0.65 %     0.67 %
    Expenses after payments, waivers and/or reimbursements and reduction to custodian expenses
        0.79 %     0.78 %     0.66 %     0.65 %     0.67 %
     
    Portfolio turnover rate
        58 %     46 %     67 %     59 %     47 %
    1.   Per share amounts calculated based on the average shares outstanding during the period.
     
    2.   Assumes an initial investment on the business day before the first day of the fiscal period, with all dividends and distributions reinvested in additional shares on the reinvestment date, and redemption at the net asset value calculated on the last business day of the fiscal period. Total returns are not annualized for periods less than one full year. Total return information does not reflect expenses that apply at the separate account level or to related insurance products. Inclusion of these charges would reduce the total return figures for all periods shown. Returns do not reflect the deduction of taxes that a shareholder would pay on fund distributions or the redemption of fund shares.
     
    3.   Annualized for periods less than one full year.
     
    4.   Total expenses including indirect expenses from affiliated fund were as follows:
             
    Year Ended December 31, 2010
        0.79 %
    Year Ended December 31, 2009
        0.78 %
    Year Ended December 31, 2008
        0.66 %
    Year Ended December 31, 2007
        0.65 %
    Year Ended December 31, 2006
        0.67 %

                                             
    Service Shares      Year Ended December 31,   2010     2009     2008     2007     2006  
     
    Per Share Operating Data
                                           
    Net asset value, beginning of period
      $ 36.64     $ 25.42     $ 46.78     $ 41.09     $ 38.23  
     
    Income (loss) from investment operations:
                                           
    Net investment income (loss)1
        .02       .01       2     (.05 )     (.03 )
    Net realized and unrealized gain (loss)
        3.33       11.21       (21.36 )     5.74       2.96  
         
    Total from investment operations
        3.35       11.22       (21.36 )     5.69       2.93  
     
    Dividends and/or distributions to shareholders:
                                           
    Dividends from net investment income
              2           2     (.07 )
     
     
    Net asset value, end of period
      $ 39.99     $ 36.64     $ 25.42     $ 46.78     $ 41.09  


    Total Return, at Net Asset Value3
        9.15 %     44.15 %     (45.66 )%     13.86 %     7.68 %
     
                                           
    Ratios/Supplemental Data
                                           
    Net assets, end of period (in thousands)
      $ 423,989     $ 444,170     $ 313,931     $ 546,887     $ 463,140  
     
    Average net assets (in thousands)
      $ 427,640     $ 368,634     $ 454,558     $ 510,874     $ 426,539  
     
    Ratios to average net assets:4
                                           
    Net investment income (loss)
        0.06 %     0.03 %     0.00 %5     (0.10 )%     (0.08 )%
    Total expenses6
        1.04 %     1.04 %     0.91 %     0.91 %     0.92 %
    Expenses after payments, waivers and/or reimbursements and reduction to custodian expenses
        1.04 %     1.03 %     0.91 %     0.91 %     0.92 %
     
    Portfolio turnover rate
        58 %     46 %     67 %     59 %     47 %
    1.   Per share amounts calculated based on the average shares outstanding during the period.
     
    2.   Less than $0.005 per share.
     
    3.   Assumes an initial investment on the business day before the first day of the fiscal period, with all dividends and distributions reinvested in additional shares on the reinvestment date, and redemption at the net asset value calculated on the last business day of the fiscal period. Total returns are not annualized for periods less than one full year. Total return information does not reflect expenses that apply at the separate account level or to related insurance products. Inclusion of these charges would reduce the total return figures for all periods shown. Returns do not reflect the deduction of taxes that a shareholder would pay on fund distributions or the redemption of fund shares.
     
    4.   Annualized for periods less than one full year.
     
    5.   Less than 0.005%.
     
    6.   Total expenses including indirect expenses from affiliated fund were as follows:
             
    Year Ended December 31, 2010
        1.04 %
    Year Ended December 31, 2009
        1.04 %
    Year Ended December 31, 2008
        0.91 %
    Year Ended December 31, 2007
        0.91 %
    Year Ended December 31, 2006
        0.92 %


    NOTES TO FINANCIAL STATEMENTS
    1. Significant Accounting Policies
    Oppenheimer Capital Appreciation Fund/VA (the “Fund”) is a separate series of Oppenheimer Variable Account Funds, an open-end management investment company registered under the Investment Company Act of 1940, as amended. The Fund’s investment objective is to seek capital appreciation by investing in securities of well-known, established companies. The Fund’s investment adviser is OppenheimerFunds, Inc. (the “Manager”).
         The Fund offers two classes of shares. Both classes are sold at their offering price, which is the net asset value per share, to separate investment accounts of participating insurance companies as an underlying investment for variable life insurance policies, variable annuity contracts or other investment products. The class of shares designated as Service shares is subject to a distribution and service plan. Both classes of shares have identical rights and voting privileges with respect to the Fund in general and exclusive voting rights on matters that affect that class alone. Earnings, net assets and net asset value per share may differ due to each class having its own expenses, such as transfer and shareholder servicing agent fees and shareholder communications, directly attributable to that class.
         The following is a summary of significant accounting policies consistently followed by the Fund.
    Securities Valuation. The Fund calculates the net asset value of its shares as of the close of the New York Stock Exchange (the “Exchange”), normally 4:00 P.M. Eastern time, on each day the Exchange is open for trading.
         Each investment asset or liability of the Fund is assigned a level at measurement date based on the significance and source of the inputs to its valuation. Unadjusted quoted prices in active markets for identical securities are classified as “Level 1,” inputs other than unadjusted quoted prices for an asset that are observable are classified as “Level 2” and significant unobservable inputs, including the Manager’s judgment about the assumptions that a market participant would use in pricing an asset or liability, are classified as “Level 3.” The inputs used for valuing securities are not necessarily an indication of the risks associated with investing in those securities. A table summarizing the Fund’s investments under these levels of classification is included following the Statement of Investments.
         Securities are valued using unadjusted quoted market prices, when available, as supplied primarily by portfolio pricing services approved by the Board of Trustees or dealers.
         Securities traded on a registered U.S. securities exchange are valued based on the last sale price of the security reported on the principal exchange on which it is traded, prior to the time when the Fund’s assets are valued. Securities whose principal exchange is NASDAQ® are valued based on the official closing prices reported by NASDAQ prior to the time when the Fund’s assets are valued. In the absence of a sale, the security is valued at the last sale price on the prior trading day, if it is within the spread of the current day’s closing “bid” and “asked” prices, and if not, at the current day’s closing bid price. A foreign security traded on a foreign exchange is valued based on the last sale price on the principal exchange on which the security is traded, as identified by the portfolio pricing service used by the Manager, prior to the time when the Fund’s assets are valued. In the absence of a sale, the security is valued at the most recent official closing price on the principal exchange on which it is traded.
         Shares of a registered investment company that are not traded on an exchange are valued at that investment company’s net asset value per share.
         U.S. domestic and international debt instruments (including corporate, government, municipal, mortgage-backed, collateralized mortgage obligations and asset-backed securities) and “money market-type” debt instruments with a remaining maturity in excess of sixty days are valued at the mean between the “bid” and “asked” prices utilizing price quotations obtained from independent pricing services or broker-dealers. Such prices are typically determined based upon information obtained from market participants including reported trade data, broker-dealer price quotations and inputs such as benchmark yields and issuer spreads from identical or similar securities.
         Forward foreign currency exchange contracts are valued utilizing current and forward currency rates obtained from independent pricing services.
         “Money market-type” debt instruments with remaining maturities of sixty days or less are valued at cost adjusted by the amortization of discount or premium to maturity (amortized cost), which approximates market value. 

    In the absence of a readily available unadjusted quoted market price, including for securities whose values have been materially affected by what the Manager identifies as a significant event occurring before the Fund’s assets are valued but after the close of the securities’ respective exchanges, the Manager, acting through its internal valuation committee, in good faith determines the fair valuation of that asset using consistently applied procedures under the supervision of the Board of Trustees (which reviews those fair valuations by the Manager). Those procedures include certain standardized methodologies to fair value securities. Such methodologies include, but are not limited to, pricing securities initially at cost and subsequently adjusting the value based on: changes in company specific fundamentals, changes in an appropriate securities index, or changes in the value of similar securities which may be adjusted for any discounts related to resale restrictions. When possible, such methodologies use observable market inputs such as unadjusted quoted prices of similar securities, observable interest rates, currency rates and yield curves. The methodologies used for valuing securities are not necessarily an indication of the risks associated with investing in those securities.
         There have been no significant changes to the fair valuation methodologies of the Fund during the period.
    Investment in Oppenheimer Institutional Money Market Fund. The Fund is permitted to invest daily available cash balances in an affiliated money market fund. The Fund may invest the available cash in Class E shares of Oppenheimer Institutional Money Market Fund (“IMMF”) to seek current income while preserving liquidity. IMMF is a registered open-end management investment company, regulated as a money market fund under the Investment Company Act of 1940, as amended. The Manager is also the investment adviser of IMMF. When applicable, the Fund’s investment in IMMF is included in the Statement of Investments. Shares of IMMF are valued at their net asset value per share. As a shareholder, the Fund is subject to its proportional share of IMMF’s Class E expenses, including its management fee. The Manager will waive fees and/or reimburse Fund expenses in an amount equal to the indirect management fees incurred through the Fund’s investment in IMMF.
    Foreign Currency Translation. The Fund’s accounting records are maintained in U.S. dollars. The values of securities denominated in foreign currencies and amounts related to the purchase and sale of foreign securities and foreign investment income are translated into U.S. dollars as of the close of the Exchange, normally 4:00 P.M. Eastern time, on each day the Exchange is open for trading. Foreign exchange rates may be valued primarily using a reliable bank, dealer or service authorized by the Board of Trustees.
         Reported net realized gains and losses from foreign currency transactions arise from sales of portfolio securities, sales and maturities of short-term securities, sales of foreign currencies, exchange rate fluctuations between the trade and settlement dates on securities transactions, and the difference between the amounts of dividends, interest, and foreign withholding taxes recorded on the Fund’s books and the U.S. dollar equivalent of the amounts actually received or paid. Net unrealized appreciation and depreciation on the translation of assets and liabilities denominated in foreign currencies arise from changes in the values of assets and liabilities, including investments in securities at fiscal period end, resulting from changes in exchange rates.
         The effect of changes in foreign currency exchange rates on investments is separately identified from the fluctuations arising from changes in market values of securities held and reported with all other foreign currency gains and losses in the Fund’s Statement of Operations.
    Allocation of Income, Expenses, Gains and Losses. Income, expenses (other than those attributable to a specific class), gains and losses are allocated on a daily basis to each class of shares based upon the relative proportion of net assets represented by such class. Operating expenses directly attributable to a specific class are charged against the operations of that class.
    Federal Taxes. The Fund intends to comply with provisions of the Internal Revenue Code applicable to regulated investment companies and to distribute substantially all of its investment company taxable income, including any net realized gain on investments not offset by capital loss carryforwards, if any, to shareholders. Therefore, no federal income or excise tax provision is required. The Fund files income tax returns in U.S. federal and applicable state jurisdictions. The statute of limitations on the Fund’s tax return filings generally remain open for the three preceding fiscal reporting period ends.
    The tax components of capital shown in the following table represent distribution requirements the Fund must satisfy under the income tax regulations, losses the Fund may be able to offset against income and gains realized in future years and unrealized appreciation or depreciation of securities and other investments for federal income tax purposes.
                                 
                            Net Unrealized  
                            Appreciation  
                            Based on Cost of  
    Undistributed     Undistributed     Accumulated     Securities and Other  
    Net Investment     Long-Term     Loss     Investments for Federal  
    Income     Gain     Carryforward1,2,3     Income Tax Purposes  
     
    $3,118,651       $—       $352,318,773       $335,891,539  
    1.   As of December 31, 2010, the Fund had $352,318,773 of net capital loss carryforwards available to offset future realized capital gains, if any, and thereby reduce future taxable gain distributions. As of December 31, 2010, details of the capital loss carryforwards were as follows:
             
    Expiring        
     
    2011
      $ 23,369,993  
    2013
        34,677,838  
    2016
        113,637,770  
    2017
        180,633,172  
     
         
    Total
      $ 352,318,773  
     
         
    2.   During the fiscal year ended December 31, 2010, the Fund utilized $72,900,879 of capital loss carryforward to offset capital gains realized in that fiscal year.
     
    3.   During the fiscal year ended December 31, 2009, the Fund did not utilize any capital loss carryforward.
    Net investment income (loss) and net realized gain (loss) may differ for financial statement and tax purposes. The character of dividends and distributions made during the fiscal year from net investment income or net realized gains may differ from their ultimate characterization for federal income tax purposes. Also, due to timing of dividends and distributions, the fiscal year in which amounts are distributed may differ from the fiscal year in which the income or net realized gain was recorded by the Fund.
    Accordingly, the following amounts have been reclassified for December 31, 2010. Net assets of the Fund were unaffected by the reclassifications.
                         
            Reduction     Increase  
            to Accumulated     to Accumulated Net  
    Increase     Net Investment     Realized Loss  
    to Paid-in Capital     Income     on Investments  
     
    $70,658,398       $116,752       $70,541,646  
    The tax character of distributions paid during the years ended December 31, 2010 and December 31, 2009 was as follows:
                     
        Year Ended     Year Ended  
        December 31, 2010     December 31, 2009  
     
    Distributions paid from:
                   
    Ordinary income
        $1,796,034     $2,999,517  
    The aggregate cost of securities and other investments and the composition of unrealized appreciation and depreciation of securities and other investments for federal income tax purposes as of December 31, 2010 are noted in the following table. 

    The primary difference between book and tax appreciation or depreciation of securities and other investments, if applicable, is attributable to the tax deferral of losses or tax realization of financial statement unrealized gain or loss.
             
    Federal tax cost of securities
      $ 861,595,666  
    Federal tax cost of other investments
        (70,126 )
     
         
    Total federal tax cost
      $ 861,525,540  


    Gross unrealized appreciation
      $ 341,183,635  
    Gross unrealized depreciation
        (5,292,096 )
     
         
    Net unrealized appreciation
      $ 335,891,539  
     
         
    Trustees’ Compensation. The Board of Trustees has adopted a compensation deferral plan for independent trustees that enables trustees to elect to defer receipt of all or a portion of the annual compensation they are entitled to receive from the Fund. For purposes of determining the amount owed to the Trustee under the plan, deferred amounts are treated as though equal dollar amounts had been invested in shares of the Fund or in other Oppenheimer funds selected by the Trustee. The Fund purchases shares of the funds selected for deferral by the Trustee in amounts equal to his or her deemed investment, resulting in a Fund asset equal to the deferred compensation liability. Such assets are included as a component of “Other” within the asset section of the Statement of Assets and Liabilities. Deferral of trustees’ fees under the plan will not affect the net assets of the Fund, and will not materially affect the Fund’s assets, liabilities or net investment income per share. Amounts will be deferred until distributed in accordance with the compensation deferral plan.
    Dividends and Distributions to Shareholders. Dividends and distributions to shareholders, which are determined in accordance with income tax regulations and may differ from U.S. generally accepted accounting principles, are recorded on the ex-dividend date. Income and capital gain distributions, if any, are declared and paid annually or at other times as deemed necessary by the Manager.
    Investment Income. Dividend income is recorded on the ex-dividend date or upon ex-dividend notification in the case of certain foreign dividends where the ex-dividend date may have passed. Non-cash dividends included in dividend income, if any, are recorded at the fair market value of the securities received. Interest income is recognized on an accrual basis. Discount and premium, which are included in interest income on the Statement of Operations, are amortized or accreted daily.
    Custodian Fees. “Custodian fees and expenses” in the Statement of Operations may include interest expense incurred by the Fund on any cash overdrafts of its custodian account during the period. Such cash overdrafts may result from the effects of failed trades in portfolio securities and from cash outflows resulting from unanticipated shareholder redemption activity. The Fund pays interest to its custodian on such cash overdrafts, to the extent they are not offset by positive cash balances maintained by the Fund, at a rate equal to the Federal Funds Rate plus 0.50%. The “Reduction to custodian expenses” line item, if applicable, represents earnings on cash balances maintained by the Fund during the period. Such interest expense and other custodian fees may be paid with these earnings.
    Security Transactions. Security transactions are recorded on the trade date. Realized gains and losses on securities sold are determined on the basis of identified cost.
    Indemnifications. The Fund’s organizational documents provide current and former trustees and officers with a limited indemnification against liabilities arising in connection with the performance of their duties to the Fund. In the normal course of business, the Fund may also enter into contracts that provide general indemnifications. The Fund’s maximum exposure under these arrangements is unknown as this would be dependent on future claims that may be made against the Fund. The risk of material loss from such claims is considered remote. 

    Other. The preparation of financial statements in conformity with accounting principles generally accepted in the United States of America requires management to make estimates and assumptions that affect the reported amounts of assets and liabilities and disclosure of contingent assets and liabilities at the date of the financial statements and the reported amounts of increases and decreases in net assets from operations during the reporting period. Actual results could differ from those estimates.
    2. Shares of Beneficial Interest
    The Fund has authorized an unlimited number of $0.001 par value shares of beneficial interest of each class. Transactions in shares of beneficial interest were as follows:
                                     
        Year Ended December 31, 2010     Year Ended December 31, 2009  
        Shares     Amount     Shares     Amount  
     
    Non-Service Shares
                                   
    Sold
        2,554,247     $ 93,160,063       2,978,928     $ 88,352,509  
    Dividends and/or distributions reinvested
        48,307       1,796,034       134,506       2,975,281  
    Redeemed
        (12,572,941 )     (480,035,151 )     (6,361,581 )     (188,702,885 )
         
    Net decrease
        (9,970,387 )   $ (385,079,054 )     (3,248,147 )   $ (97,375,095 )


    Service Shares
                                   
    Sold
        1,613,467     $ 57,695,403       2,097,785     $ 61,332,284  
    Dividends and/or distributions reinvested
                    1,099       24,157  
    Redeemed
        (3,133,549 )     (117,683,027 )     (2,325,106 )     (67,281,175 )
         
    Net decrease
        (1,520,082 )   $ (59,987,624 )     (226,222 )   $ (5,924,734 )
         
    3. Purchases and Sales of Securities
    The aggregate cost of purchases and proceeds from sales of securities, other than short-term obligations and investments in IMMF, for the year ended December 31, 2010, were as follows:
                     
        Purchases     Sales  
     
    Investment securities
      $ 786,778,432     $ 1,200,250,724  
    4. Fees and Other Transactions with Affiliates
    Management Fees. Under the investment advisory agreement, the Fund pays the Manager a management fee based on the daily net assets of the Fund at an annual rate as shown in the following table:
             
    Fee Schedule        
     
    Up to $200 million
        0.75 %
    Next $200 million
        0.72  
    Next $200 million
        0.69  
    Next $200 million
        0.66  
    Over $800 million
        0.60  
    Administration Service Fees. The Fund pays the Manager a fee of $1,500 per year for preparing and filing the Fund’s tax returns.
    Transfer Agent Fees. OppenheimerFunds Services (“OFS”), a division of the Manager, acts as the transfer and shareholder servicing agent for the Fund. The Fund pays OFS fees at an annual rate of 0.10% of the daily net assets of each class of shares. For the year ended December 31, 2010, the Fund paid $1,421,342 to OFS for services to the Fund.
    Distribution and Service Plan for Service Shares. The Fund has adopted a Distribution and Service Plan (the “Plan”) in accordance with Rule 12b-1 under the Investment Company Act of 1940 for Service shares to pay OppenheimerFunds Distributor, Inc. (the “Distributor”), for distribution related services, personal service and account maintenance for the Fund’s Service shares. Under the Plan, payments are made periodically at an annual rate of 0.25% of the daily net assets of Service shares of the Fund. The Distributor currently uses all of those fees to compensate sponsors of the insurance product that offers Fund shares, for providing personal service and maintenance of accounts of their variable contract owners that hold Service shares. These fees are paid out of the Fund’s assets on an on-going basis and increase operating expenses of the Service shares, which results in lower performance compared to the Fund’s shares that are not subject to a service fee. Fees incurred by the Fund under the Plan are detailed in the Statement of Operations.
    Waivers and Reimbursements of Expenses. The Manager has voluntarily agreed to limit the Fund’s total annual operating expenses so that those expenses, as percentages of daily net assets, will not exceed the annual rate of 0.80% for Non-Service shares and 1.05% for Service shares. During the year ended December 31, 2010, the Manager waived fees and/or reimbursed the Fund $5,467 and $2,227 for Non-Service and Service shares, respectively.
         The Manager will waive fees and/or reimburse Fund expenses in an amount equal to the indirect management fees incurred through the Fund’s investment in IMMF. During the year ended December 31, 2010, the Manager waived fees and/or reimbursed the Fund $14,609 for IMMF management fees.
         Some of these undertakings may be modified or terminated at any time; some may not be modified or terminated until after one year from the date of the current prospectus, as indicated therein.
    5. Risk Exposures and the Use of Derivative Instruments
    The Fund’s investment objectives not only permit the Fund to purchase investment securities, they also allow the Fund to enter into various types of derivatives contracts, including, but not limited to, futures contracts, forward foreign currency exchange contracts, credit default swaps, interest rate swaps, total return swaps, and purchased and written options. In doing so, the Fund will employ strategies in differing combinations to permit it to increase, decrease, or change the level or types of exposure to market risk factors. Central to those strategies are features inherent to derivatives that make them more attractive for this purpose than equity and debt securities: they require little or no initial cash investment, they can focus exposure on only certain selected risk factors, and they may not require the ultimate receipt or delivery of the underlying security (or securities) to the contract. This may allow the Fund to pursue its objectives more quickly and efficiently than if it were to make direct purchases or sales of securities capable of effecting a similar response to market factors.
    Market Risk Factors. In accordance with its investment objectives, the Fund may use derivatives to increase or decrease its exposure to one or more of the following market risk factors:
    Commodity Risk. Commodity risk relates to the change in value of commodities or commodity indexes as they relate to increases or decreases in the commodities market. Commodities are physical assets that have tangible properties. Examples of these types of assets are crude oil, heating oil, metals, livestock, and agricultural products.
    Credit Risk. Credit risk relates to the ability of the issuer to meet interest and principal payments, or both, as they come due. In general, lower-grade, higher-yield bonds are subject to credit risk to a greater extent than lower-yield, higher-quality bonds.
    Equity Risk. Equity risk relates to the change in value of equity securities as they relate to increases or decreases in the general market.
    Foreign Exchange Rate Risk. Foreign exchange rate risk relates to the change in the U.S. dollar value of a security held that is denominated in a foreign currency. The U.S. dollar value of a foreign currency denominated security will decrease as the dollar appreciates against the currency, while the U.S. dollar value will increase as the dollar depreciates against the currency.
    Interest Rate Risk. Interest rate risk refers to the fluctuations in value of fixed-income securities resulting from the inverse relationship between price and yield. For example, an increase in general interest rates will tend to reduce the market value of already issued fixed-income investments, and a decline in general interest rates will tend to increase their value. In addition, debt securities with longer maturities, which tend to have higher yields, are subject to potentially greater fluctuations in value from changes in interest rates than obligations with shorter maturities.
    Volatility Risk. Volatility risk refers to the magnitude of the movement, but not the direction of the movement, in a financial instrument’s price over a defined time period. Large increases or decreases in a financial instrument’s price over a relative time period typically indicate greater volatility risk, while small increases or decreases in its price typically indicate lower volatility risk.
    The Fund’s actual exposures to these market risk factors during the period are discussed in further detail, by derivative type, below.
    Risks of Investing in Derivatives. The Fund’s use of derivatives can result in losses due to unanticipated changes in the market risk factors and the overall market. In instances where the Fund is using derivatives to decrease, or hedge, exposures to market risk factors for securities held by the Fund, there are also risks that those derivatives may not perform as expected resulting in losses for the combined or hedged positions.
         Derivatives may have little or no initial cash investment relative to their market value exposure and therefore can produce significant gains or losses in excess of their cost. This use of embedded leverage allows the Fund to increase its market value exposure relative to its net assets and can substantially increase the volatility of the Fund’s performance.
         Additional associated risks from investing in derivatives also exist and potentially could have significant effects on the valuation of the derivative and the Fund. Typically, the associated risks are not the risks that the Fund is attempting to increase or decrease exposure to, per its investment objectives, but are the additional risks from investing in derivatives. Examples of these associated risks are liquidity risk, which is the risk that the Fund will not be able to sell the derivative in the open market in a timely manner, and counterparty credit risk, which is the risk that the counterparty will not fulfill its obligation to the Fund. Associated risks can be different for each type of derivative and are discussed by each derivative type in the notes that follow.
    Counterparty Credit Risk. Certain derivative positions are subject to counterparty credit risk, which is the risk that the counterparty will not fulfill its obligation to the Fund. The Fund’s derivative counterparties are financial institutions who are subject to market conditions that may weaken their financial position. The Fund intends to enter into financial transactions with counterparties that the Manager believes to be creditworthy at the time of the transaction.
    Credit Related Contingent Features. The Fund’s agreements with derivative counterparties have several credit related contingent features that if triggered would allow its derivatives counterparties to close out and demand payment or additional collateral to cover their exposure from the Fund. Credit related contingent features are established between the Fund and its derivatives counterparties to reduce the risk that the Fund will not fulfill its payment obligations to its counterparties. These triggering features include, but are not limited to, a percentage decrease in the Fund’s net assets and or a percentage decrease in the Fund’s Net Asset Value or NAV. The contingent features are established within the Fund’s International Swap and Derivatives Association, Inc. master agreements which govern certain positions in swaps, over-the-counter options and swaptions, and forward currency exchange contracts for each individual counterparty. 

    Valuations of derivative instruments as of December 31, 2010 are as follows:
                     
        Liability Derivatives
    Derivatives Not Accounted   Statement of Assets and    
    for as Hedging Instruments   Liabilities Location   Value
     
    Foreign exchange contracts
      Unrealized depreciation        
     
      on foreign currency        
     
      exchange contracts   $1,356
    The effect of derivative instruments on the Statement of Operations is as follows:
             
    Amount of Realized Gain or (Loss) Recognized on Derivatives
     
    Derivatives Not Accounted for    
    as Hedging Instruments   Foreign currency transactions
     
    Foreign exchange contracts
      $173,812
             
    Amount of Change in Unrealized Gain or (Loss) Recognized on Derivatives
     
    Derivatives Not Accounted for   Translation of assets and liabilities
    as Hedging Instruments   denominated in foreign currencies
     
    Foreign exchange contracts
      $(5,751)
    Foreign Currency Exchange Contracts
    The Fund may enter into foreign currency exchange contracts (“forward contracts”) for the purchase or sale of a foreign currency at a negotiated rate at a future date.
         Forward contracts are reported on a schedule following the Statement of Investments. Forward contracts will be valued daily based upon the closing prices of the forward currency rates determined at the close of the Exchange as provided by a bank, dealer or pricing service. The resulting unrealized appreciation (depreciation) is reported in the Statement of Assets and Liabilities as a receivable or payable and in the Statement of Operations within the change in unrealized appreciation (depreciation). At contract close, the difference between the original cost of the contract and the value at the close date is recorded as a realized gain (loss) in the Statement of Operations.
         The Fund has purchased and sold certain forward foreign currency exchange contracts of different currencies in order to acquire currencies to pay for related foreign securities purchase transactions, or to convert foreign currencies to U.S. dollars from related foreign securities sale transactions. These foreign currency exchange contracts are negotiated at the current spot exchange rate with settlement typically within two business days thereafter.
         The Fund has entered into forward foreign currency exchange contracts with the obligation to purchase specified foreign currencies in the future at a currently negotiated forward rate in order to take a positive investment perspective on the related currency. These forward foreign currency exchange contracts seek to increase exposure to foreign exchange rate risk.
         The Fund has entered into forward foreign currency exchange contracts with the obligation to purchase specified foreign currencies in the future at a currently negotiated forward rate in order to decrease exposure to foreign exchange rate risk associated with foreign currency denominated securities held by the Fund.
         The Fund has entered into forward foreign currency exchange contracts with the obligation to sell specified foreign currencies in the future at a currently negotiated forward rate in order to take a negative investment perspective on the related currency. These forward foreign currency exchange contracts seek to increase exposure to foreign exchange rate risk.
         The Fund has entered into forward foreign currency exchange contracts with the obligation to sell specified foreign currencies in the future at a currently negotiated forward rate in order to decrease exposure to foreign exchange rate risk associated with foreign currency denominated securities held by the Fund.

         During the year ended December 31, 2010, the Fund had average contract amounts on forward foreign currency contracts to buy and sell of $576,973 and $1,253,051, respectively.
         Additional associated risk to the Fund includes counterparty credit risk. Counterparty credit risk arises from the possibility that the counterparty will default.
    6. Pending Litigation
    Since 2009, a number of lawsuits have been pending in federal courts against the Manager, the Distributor, and certain mutual funds (“Defendant Funds”) advised by the Manager and distributed by the Distributor (but not including the Fund). The lawsuits naming the Defendant Funds also name as defendants certain officers and current and former trustees of the respective Defendant Funds. The plaintiffs seek class action status on behalf of purchasers of shares of the respective Defendant Fund during a particular time period. The lawsuits raise claims under federal securities laws alleging that, among other things, the disclosure documents of the respective Defendant Fund contained misrepresentations and omissions, that such Defendant Fund’s investment policies were not followed, and that such Defendant Fund and the other defendants violated federal securities laws and regulations. The plaintiffs seek unspecified damages, equitable relief and an award of attorneys’ fees and litigation expenses.
         In 2009, what are claimed to be derivative lawsuits were filed in state court against the Manager and a subsidiary (but not against the Fund), on behalf of the New Mexico Education Plan Trust. These lawsuits allege breach of contract, breach of fiduciary duty, negligence and violation of state securities laws, and seek compensatory damages, equitable relief and an award of attorneys’ fees and litigation expenses.
         Other lawsuits have been filed since 2008 in various state and federal courts, against the Manager and certain of its affiliates. Those lawsuits were filed by investors who made investments through an affiliate of the Manager, and relate to the alleged investment fraud perpetrated by Bernard Madoff and his firm (“Madoff ”). Those suits allege a variety of claims, including breach of fiduciary duty, fraud, negligent misrepresentation, unjust enrichment, and violation of federal and state securities laws and regulations, among others. They seek unspecified damages, equitable relief and an award of attorneys’ fees and litigation expenses. None of the suits have named the Distributor, any of the Oppenheimer mutual funds or any of their independent Trustees or Directors as defendants. None of the Oppenheimer funds invested in any funds or accounts managed by Madoff.
         The Manager believes that the lawsuits described above are without legal merit and is defending against them vigorously. The Defendant Funds’ Boards of Trustees have also engaged counsel to defend the suits brought against those Funds and the present and former Independent Trustees named in those suits. While it is premature to render any opinion as to the outcome in these lawsuits, or whether any costs that the Defendant Funds may bear in defending the suits might not be reimbursed by insurance, the Manager believes that these suits should not impair the ability of the Manager or the Distributor to perform their respective duties to the Fund, and that the outcome of all of the suits together should not have any material effect on the operations of any of the Oppenheimer funds.
    7. Subsequent Event
    The Regulated Investment Company Modernization Act of 2010 (the “Act”) was signed into law on December 22, 2010. The Act makes changes to a number of tax rules impacting the Fund. Under the Act, future capital losses generated by a fund may be carried over indefinitely, but these losses must be used prior to the utilization of any pre-enactment capital losses. Since pre-enactment capital losses may only be carried forward for eight years, there may be a greater likelihood that all or a portion of a fund’s pre-enactment capital losses will expire unused. In general, the provisions of the Act will be effective for the Fund’s fiscal year ending December 31, 2011. Specific information regarding the impact of the Act on the Fund will be contained within the “Federal Taxes” section of the financial statement notes for the fiscal year ending December 31, 2011.


    REPORT OF INDEPENDENT REGISTERED PUBLIC ACCOUNTING FIRM
    The Board of Trustees and Shareholders of Oppenheimer Variable Account Funds:
    We have audited the accompanying statement of assets and liabilities of Oppenheimer Core Bond Fund/VA (one of the portfolios constituting the Oppenheimer Variable Account Funds), including the statement of investments, as of December 31, 2010, the related statement of operations for the year then ended, and the statements of changes in net assets and the financial highlights for each of the years in the two-year period then ended. These financial statements and financial highlights are the responsibility of the Fund’s management. Our responsibility is to express an opinion on these financial statements and financial highlights based on our audits. The accompanying financial highlights of Oppenheimer Core Bond Fund/VA for the years ended prior to January 1, 2009 were audited by other auditors whose report dated February 11, 2009 expressed an unqualified opinion on those financial highlights.
         We conducted our audits in accordance with the standards of the Public Company Accounting Oversight Board (United States). Those standards require that we plan and perform the audits to obtain reasonable assurance about whether the financial statements and financial highlights are free of material misstatement. An audit includes examining, on a test basis, evidence supporting the amounts and disclosures in the financial statements. Our procedures included confirmation of securities owned as of December 31, 2010, by correspondence with the custodian, transfer agent and brokers, or by other appropriate auditing procedures where replies from brokers were not received. An audit also includes assessing the accounting principles used and significant estimates made by management, as well as evaluating the overall financial statement presentation. We believe that our audits provide a reasonable basis for our opinion.
         In our opinion, the financial statements and financial highlights referred to above present fairly, in all material respects, the financial position of Oppenheimer Core Bond Fund/VA as of December 31, 2010, the results of its operations for the year then ended, and the changes in its net assets and the financial highlights for each of the years in the two-year period then ended, in conformity with U.S. generally accepted accounting principles.
    /s/ KPMG llp
    Denver, Colorado
    February 16, 2011


    STATEMENT OF INVESTMENTS December 31, 2010
                     
        Principal        
        Amount     Value  
     
    Asset-Backed Securities—9.1%
                   
    Ally Auto Receivables Trust 2010-2, Automobile Receivables Nts.,
    Series 2010-2, Cl. A2, 0.89%, 9/17/12
      $ 485,000     $ 485,960  
    Ally Auto Receivables Trust 2010-4, Automobile Receivables Nts.,
    Series 2010-4, Cl. A3, 0.91%, 11/17/14
        280,000       278,349  
    Ally Master Owner Trust 2010-1, Asset-Backed Certificates,
    Series 2010-1, Cl. A, 2.01%, 1/15/131,2
        480,000       488,955  
    Ally Master Owner Trust 2010-3, Asset-Backed Certificates,
    Series 2010-3, Cl. A, 2.88%, 4/15/131
        660,000       676,311  
    AmeriCredit Automobile Receivables Trust 2009-1, Automobile Receivables-Backed Nts., Series 2009-1, Cl. A3, 3.04%, 10/15/13
        35,000       35,643  
    AmeriCredit Automobile Receivables Trust 2010-3, Automobile Receivables-Backed Nts., Series 2010-3, Cl. A2, 0.77%, 12/9/13
        550,000       550,246  
    AmeriCredit Automobile Receivables Trust 2010-4, Automobile Receivables-Backed Nts., Series 2010-4, Cl. D, 4.20%, 11/8/16
        240,000       236,550  
    AmeriCredit Prime Automobile Receivables Trust 2010-1, Automobile Receivables Nts., Series 2010-1, Cl. A2, 0.97%, 1/15/13
        133,371       133,430  
    AmeriCredit Prime Automobile Receivables Trust 2010-2, Automobile Receivables Nts., Series 2010-2, Cl. A2, 1.22%, 10/8/13
        195,000       195,624  
    Argent Securities Trust 2006-M3, Asset-Backed Pass-Through Certificates,
    Series 2006-M3, Cl. A2B, 0.361%, 9/25/362
        20,792       7,793  
    Bank of America Auto Trust 2010-2, Automobile Receivables,
    Series 2010-2, Cl. A2, 0.91%, 10/15/12
        530,000       531,062  
    Capital One Multi-Asset Execution Trust, Credit Card Asset-Backed Certificates,
    Series 2008-A5, Cl. A5, 4.85%, 2/18/14
        550,000       556,880  
    Centre Point Funding LLC, Asset-Backed Nts.,
    Series 2010-1A, Cl. 1, 5.43%, 7/20/151
        135,471       140,136  
    Chrysler Financial Lease Trust, Asset-Backed Nts.,
    Series 2010-A, Cl. A2, 1.78%, 6/15/111
        253,239       253,567  
    Citibank Credit Card Issuance Trust, Credit Card Receivable Nts.,
    Series 2003-C4, Cl. C4, 5%, 6/10/15
        310,000       326,145  
    Citibank Omni Master Trust, Credit Card Receivables,
    Series 2009-A8, Cl. A8, 2.36%, 5/16/161,2
        620,000       627,919  
    CNH Equipment Trust, Asset-Backed Certificates:
                   
    Series 2009-B, Cl. A3, 2.97%, 3/15/13
        156,782       157,468  
    Series 2010-A, Cl. A2, 0.81%, 3/25/15
        467,003       467,219  
    Countrywide Home Loans, Asset-Backed Certificates:
                   
    Series 2002-4, Cl. A1, 1.001%, 2/25/332
        26,188       23,777  
    Series 2005-16, Cl. 2AF2, 5.382%, 5/1/362
        527,911       452,214  
    Series 2005-17, Cl. 1AF2, 5.363%, 5/1/362
        294,910       237,278  
    CWABS Asset-Backed Certificates Trust 2006-25, Asset-Backed Certificates,
    Series 2006-25, Cl. 2A2, 0.381%, 6/25/472
        40,000       35,813  
    DaimlerChrysler Auto Trust 2007-A, Automobile Receivable Nts.,
    Series 2007-A, Cl. A4, 5.28%, 3/8/13
        503,949       516,307  
    DT Auto Owner Trust, Automobile Receivable Nts.,
    Series 2009-1, Cl. A1, 2.98%, 10/15/151
        270,393       272,493  
    First Franklin Mortgage Loan Trust 2006-FF10, Mtg. Pass-Through Certificates,
    Series 2006-FF10, Cl. A3, 0.351%, 7/25/362
        8,728       8,584  
    First Franklin Mortgage Loan Trust 2006-FF9, Mtg. Pass-Through Certificates,
    Series 2006-FF9, Cl. 2A2, 0.371%, 7/7/362
        5,313       5,061  
    Ford Credit Auto Lease Trust, Automobile Receivable Nts.:
                   
    Series 2010-A, Cl. A, 1.04%, 3/15/131
        261,340       261,575  
    Series 2010-B, Cl. A2, 0.75%, 10/15/123
        505,000       505,001  
    Ford Credit Auto Owner Trust, Automobile Receivable Nts.:
                   
    Series 2009-E, Cl. A2, 0.80%, 3/15/12
        467,857       468,098  
    Series 2010-A, Cl. A4, 2.15%, 6/15/15
        670,000       682,676  
    Ford Credit Floorplan Master Owner Trust 2009-2, Asset-Backed Nts.,
    Series 2009-2, Cl. A, 1.81%, 9/15/122
        470,000       477,090  
    Ford Credit Floorplan Master Owner Trust 2010-1, Asset-Backed Nts.,
    Series 2010-1, Cl. A, 1.91%, 12/15/141,2
        490,000       499,227  
    Harley-Davidson Motorcycle Trust 2006-3, Motorcycle Contract-Backed Nts.,
    Series 2006-3, Cl. A4, 5.22%, 6/15/13
        338,508       344,535  

                     
        Principal        
        Amount     Value  
     
    Asset-Backed Securities Continued
                   
    Harley-Davidson Motorcycle Trust 2009-2, Motorcycle Contract-Backed Nts.,
    Series 2009-2, Cl. A2, 2%, 7/15/12
      $ 33,356     $ 33,376  
    Hertz Vehicle Financing LLC, Automobile Receivable Nts.,
    Series 2010-1A, Cl. A1, 2.60%, 2/15/141
        495,000       499,783  
    HSBC Home Equity Loan Trust 2005-3, Closed-End Home Equity Loan Asset-Backed Certificates, Series 2005-3, Cl. A1, 0.521%, 1/20/352
        463,268       444,898  
    HSBC Home Equity Loan Trust 2006-4, Closed-End Home Equity Loan Asset-Backed Certificates, Series 2006-4, Cl. A2V, 0.371%, 3/20/362
        9,548       9,511  
    Mastr Asset-Backed Securities Trust 2006-WMC3, Mtg. Pass-Through Certificates,
    Series 2006-WMC3, Cl. A3, 0.361%, 8/25/362
        67,138       25,045  
    Merrill Auto Trust Securitization 2007-1, Asset-Backed Nts.,
    Series 2007-1, Cl. A4, 0.32%, 12/15/132
        301,902       301,111  
    Morgan Stanley Resecuritization Trust, Automobile Receivable Nts.,
    Series 2010-F, Cl. A, 0.511%, 6/17/111,2
        340,000       339,243  
    Navistar Financial Dealer Note Master Owner Trust, Asset-Backed Nts.,
    Series 2010-1, Cl. A, 1.911%, 1/26/151,2
        790,000       791,926  
    NC Finance Trust, Collateralized Mtg. Obligation Pass-Through Certificates,
    Series 1999-I, Cl. ECFD, 1/25/293,4
        3,370,016       404,402  
    Nissan Auto Lease Trust 2010-B, Automobile Asset-Backed Nts.,
    Series 2010-B, Cl. A3, 1%, 12/15/13
        440,000       439,465  
    Nissan Master Owner Trust, Automobile Receivable Nts.,
    Series 2010-AA, Cl. A, 1.41%, 1/15/131,2
        485,000       490,727  
    RASC Series 2006-KS7 Trust, Home Equity Mtg. Asset-Backed Pass-Through Certificates, Series 2006-KS7, Cl. A2, 0.361%, 9/25/362
        8,256       8,212  
    Santander Drive Auto Receivables Trust 2010-2, Automobile Receivables Nts.,
    Series 2010-2, Cl. A2, 0.95%, 8/15/13
        485,000       485,648  
    Santander Drive Auto Receivables Trust 2010-3, Automobile Receivables Nts.,
    Series 2010-3, Cl. C, 3.06%, 11/15/17
        485,000       482,619  
    Toyota Auto Receivable Owner Trust 2010-B, Automobile Receivable Nts.,
    Series 2010-B, Cl. A2, 0.74%, 7/16/12
        575,000       575,855  
    Volkswagen Auto Lease Trust 2010-A, Automobile Receivable Nts.,
    Series 2010-A, Cl. A3, 0.99%, 11/20/13
        440,000       439,269  
    World Financial Network Credit Card Master Note Trust, Credit Card Receivables,
    Series 2009-A, Cl. A, 4.60%, 9/15/15
        465,000       478,162  
     
                 
    Total Asset-Backed Securities
    (Cost $20,162,819)
                17,188,238  
     
                   
    Mortgage-Backed Obligations—75.9%
                   
    Government Agency—62.8%
                   
    FHLMC/FNMA/FHLB/Sponsored—62.5%
                   
    Federal Home Loan Mortgage Corp.:
                   
    5%, 12/15/34
        27,202       28,721  
    5.50%, 9/1/39
        1,585,041       1,690,362  
    6%, 5/15/18-10/15/29
        3,390,794       3,721,858  
    6.50%, 4/15/18-4/1/34
        744,930       830,301  
    7%, 8/15/16-10/1/37
        430,772       484,671  
    7%, 10/1/315
        471,399       537,618  
    8%, 4/1/16
        240,914       265,089  
    9%, 8/1/22-5/1/25
        79,653       90,199  
    10.50%, 11/14/20
        2,932       3,370  
    Federal Home Loan Mortgage Corp., Gtd. Real Estate Mtg. Investment Conduit Multiclass
    Pass-Through Certificates:
                   
    Series 151, Cl. F, 9%, 5/15/21
        18,409       21,289  
    Series 1674, Cl. Z, 6.75%, 2/15/24
        60,071       67,245  
    Series 2006-11, Cl. PS, 23.611%, 3/25/362
        466,948       659,355  
    Series 2034, Cl. Z, 6.50%, 2/15/28
        7,160       8,021  
    Series 2042, Cl. N, 6.50%, 3/15/28
        20,672       23,804  
    Series 2043, Cl. ZP, 6.50%, 4/15/28
        748,125       777,736  
    Series 2046, Cl. G, 6.50%, 4/15/28
        59,597       63,823  
    Series 2053, Cl. Z, 6.50%, 4/15/28
        8,540       9,657  
    Series 2066, Cl. Z, 6.50%, 6/15/28
        1,091,677       1,223,406  
    Series 2195, Cl. LH, 6.50%, 10/15/29
        716,652       817,040  
    Series 2220, Cl. PD, 8%, 3/15/30
        3,107       3,636  
    Series 2326, Cl. ZP, 6.50%, 6/15/31
        209,156       241,004  
    Series 2461, Cl. PZ, 6.50%, 6/15/32
        971,948       1,083,950  
    Series 2470, Cl. LF, 1.26%, 2/15/322
        9,009       9,211  
    Series 2500, Cl. FD, 0.76%, 3/15/322
        178,918       180,022  
    Series 2526, Cl. FE, 0.66%, 6/15/292
        269,493       270,537  
    Series 2538, Cl. F, 0.86%, 12/15/322
        1,227,874       1,240,157  
    Series 2551, Cl. FD, 0.66%, 1/15/332
        184,696       185,382  
    Series 2638, Cl. KG, 4%, 11/1/27
        1,177,219       1,187,982  
    Series 2648, Cl. JE, 3%, 2/1/30
        303,718       305,106  
    Series 2663, Cl. BA, 4%, 8/1/16
        373,729       381,017  
    Series 2686, Cl. CD, 4.50%, 2/1/17
        319,551       326,051  
    Series 2750, Cl. XG, 5%, 2/1/34
        130,000       135,783  
     
                     
        Principal        
        Amount     Value  
     
    FHLMC/FNMA/FHLB/Sponsored Continued
                   
    Federal Home Loan Mortgage Corp., Gtd. Real Estate Mtg. Investment Conduit
    Multiclass Pass-Through Certificates: Continued
                   
    Series 2890, Cl. PE, 5%, 11/1/34
      $ 130,000     $ 135,762  
    Series 2907, Cl. GC, 5%, 6/1/27
        217,931       221,905  
    Series 2911, Cl. CU, 5%, 2/1/28
        538,138       547,867  
    Series 2929, Cl. PC, 5%, 1/1/28
        218,837       222,094  
    Series 2936, Cl. PE, 5%, 2/1/35
        69,000       72,199  
    Series 2939, Cl. PE, 5%, 2/15/35
        247,000       258,136  
    Series 2952, Cl. GJ, 4.50%, 12/1/28
        105,046       106,051  
    Series 3019, Cl. MD, 4.75%, 1/1/31
        438,539       450,755  
    Series 3025, Cl. SJ, 23.796%, 8/15/352
        93,159       129,874  
    Series 3094, Cl. HS, 23.429%, 6/15/342
        266,263       349,837  
    Series 3242, Cl. QA, 5.50%, 3/1/30
        314,076       323,567  
    Series 3291, Cl. NA, 5.50%, 10/1/27
        92,982       94,062  
    Series 3306, Cl. PA, 5.50%, 10/1/27
        320,845       324,241  
    Series R001, Cl. AE, 4.375%, 4/1/15
        208,022       212,180  
    Federal Home Loan Mortgage Corp., Interest-Only Stripped Mtg.-Backed Security:
                   
    Series 205, Cl. IO, 9.41%, 9/1/296
        23,220       4,877  
    Series 206, Cl. IO, 0%, 12/1/296,7
        290,274       71,906  
    Series 2074, Cl. S, 57.597%, 7/17/286
        4,941       970  
    Series 2079, Cl. S, 73.347%, 7/17/286
        8,629       1,809  
    Series 2130, Cl. SC, 51.625%, 3/15/296
        336,726       60,164  
    Series 243, Cl. 6, 2.173%, 12/15/326
        348,919       67,972  
    Series 2526, Cl. SE, 42.143%, 6/15/296
        12,171       2,173  
    Series 2527, Cl. SG, 40.749%, 2/15/326
        650,286       30,901  
    Series 2531, Cl. ST, 58.869%, 2/15/306
        250,173       15,777  
    Series 2796, Cl. SD, 68.618%, 7/15/266
        555,394       98,411  
    Series 2802, Cl. AS, 96.534%, 4/15/336
        392,608       34,942  
    Series 2819, Cl. S, 53.547%, 6/15/346
        108,890       19,087  
    Series 2920, Cl. S, 66.499%, 1/15/356
        1,977,742       284,507  
    Series 3004, Cl. SB, 99.999%, 7/15/356
        118,947       16,857  
    Series 3110, Cl. SL, 99.999%, 2/15/266
        316,224       40,560  
    Federal Home Loan Mortgage Corp., Principal-Only Stripped Mtg.-Backed Security,
    Series 176, Cl. PO, 4.219%, 6/1/268
        127,827       107,791  
    Federal National Mortgage Assn.:
                   
    3.50%, 1/1/26-1/1/419
        7,785,000       7,740,579  
    4%, 1/1/419
        10,880,000       10,825,600  
    4.50%, 1/1/26-1/1/419
        16,140,000       16,631,401  
    5%, 2/25/22-7/25/22
        21,421       22,742  
    5%, 1/1/419
        13,273,000       13,955,312  
    5.285%, 10/1/36
        233,549       244,802  
    5.50%, 1/1/26-1/1/419
        13,066,000       13,983,208  
    6%, 11/1/34-6/1/35
        3,858,695       4,248,310  
    6%, 1/1/419
        3,215,000       3,494,808  
    6.50%, 3/25/11-1/1/34
        1,249,685       1,367,450  
    6.50%, 8/25/175
        213,824       234,004  
    6.50%, 1/1/419
        2,816,000       3,129,719  
    7%, 11/1/17-7/25/35
        708,621       775,519  
    7.50%, 1/1/33
        13,438       15,412  
    8.50%, 7/1/32
        21,912       24,686  
    Federal National Mortgage Assn., Gtd. Real Estate Mtg. Investment Conduit
    Multiclass Pass-Through Certificates:
                   
    Trust 1989-17, Cl. E, 10.40%, 4/25/19
        16,927       21,032  
    Trust 1993-87, Cl. Z, 6.50%, 6/25/23
        695,596       775,466  
    Trust 1998-58, Cl. PC, 6.50%, 10/25/28
        591,167       652,231  
    Trust 1998-61, Cl. PL, 6%, 11/25/28
        309,056       341,584  
    Trust 1999-54, Cl. LH, 6.50%, 11/25/29
        463,992       512,432  
    Trust 2001-44, Cl. QC, 6%, 9/25/16
        28,924       31,271  
    Trust 2001-51, Cl. OD, 6.50%, 10/25/31
        35,605       40,620  
    Trust 2001-74, Cl. QE, 6%, 12/25/31
        876,487       968,288  
    Trust 2002-12, Cl. PG, 6%, 3/25/17
        14,869       16,133  
    Trust 2003-28, Cl. KG, 5.50%, 4/25/23
        3,964,000       4,335,208  
    Trust 2004-101, Cl. BG, 5%, 1/25/20
        1,975,000       2,112,279  
    Trust 2004-81, Cl. KC, 4.50%, 4/1/17
        234,679       238,539  
    Trust 2004-9, Cl. AB, 4%, 7/1/17
        661,604       679,437  
    Trust 2005-100, Cl. BQ, 5.50%, 11/25/25
        1,160,000       1,249,380  
    Trust 2005-12, Cl. JC, 5%, 6/1/28
        513,807       525,190  
    Trust 2005-22, Cl. EC, 5%, 10/1/28
        202,328       207,062  
    Trust 2005-30, Cl. CU, 5%, 4/1/29
        190,118       195,379  
    Trust 2006-110, Cl. PW, 5.50%, 5/25/28
        47,490       48,408  
    Trust 2006-46, Cl. SW, 23.244%, 6/25/362
        355,768       492,818  
    Trust 2006-50, Cl. KS, 23.244%, 6/25/362
        582,911       795,267  
    Trust 2006-57, Cl. PA, 5.50%, 8/25/27
        320,242       322,765  
    Trust 2009-36, Cl. FA, 1.201%, 6/25/372
        709,683       723,559  
    Federal National Mortgage Assn., Interest-Only Stripped Mtg.-Backed Security:
                   
    Trust 2001-61, Cl. SH, 50.113%, 11/18/316
        35,960       6,735  
    Trust 2001-63, Cl. SD, 41.204%, 12/18/316
        10,970       2,026  
    Trust 2001-65, Cl. S, 47.552%, 11/25/316
        902,242       168,768  
    Trust 2001-68, Cl. SC, 32.641%, 11/25/316
        7,521       1,371  
    Trust 2001-81, Cl. S, 37.52%, 1/25/326
        240,840       47,747  
    Trust 2002-28, Cl. SA, 40.314%, 4/25/326
        6,246       1,083  
    Trust 2002-38, Cl. SO, 58.831%, 4/25/326
        14,936       2,674  
    Trust 2002-39, Cl. SD, 45.877%, 3/18/326
        9,876       1,950  
    Trust 2002-47, Cl. NS, 35.828%, 4/25/326
        621,556       116,728  
    Trust 2002-48, Cl. S, 36.642%, 7/25/326
        10,314       1,893  
    Trust 2002-51, Cl. S, 36.117%, 8/25/326
        570,591       107,070  
    Trust 2002-52, Cl. SD, 42.698%, 9/25/326
        695,123       137,979  
    Trust 2002-52, Cl. SL, 38.254%, 9/25/326
        6,456       1,213  
    Trust 2002-53, Cl. SK, 43.546%, 4/25/326
        34,412       6,722  
    Trust 2002-56, Cl. SN, 39.116%, 7/25/326
        14,063       2,582  
    Trust 2002-60, Cl. SM, 45.772%, 8/25/326
        119,586       17,842  
    Trust 2002-7, Cl. SK, 45.81%, 1/25/326
        55,778       8,550  
    Trust 2002-77, Cl. BS, 40.651%, 12/18/326
        73,919       12,027  
    Trust 2002-77, Cl. IS, 52.767%, 12/18/326
        25,447       4,977  
    Trust 2002-77, Cl. JS, 36.871%, 12/18/326
        120,370       19,100  
    Trust 2002-77, Cl. SA, 38.391%, 12/18/326
        114,356       18,673  
    Trust 2002-77, Cl. SH, 47.759%, 12/18/326
        317,493       59,464  
    Trust 2002-84, Cl. SA, 48.202%, 12/25/326
        803,065       137,869  
    Trust 2002-9, Cl. MS, 36.577%, 3/25/326
        11,952       2,162  
    Trust 2002-90, Cl. SN, 47.493%, 8/25/326
        61,521       9,182  
    Trust 2002-90, Cl. SY, 51.565%, 9/25/326
        40,192       6,185  
    Trust 2003-26, Cl. DI, 8.559%, 4/25/336
        23,580       4,972  
    Trust 2003-33, Cl. SP, 49.559%, 5/25/336
        858,985       149,124  


        Principal        
        Amount     Value  
     
    FHLMC/FNMA/FHLB/Sponsored Continued
                   
    Federal National Mortgage Assn., Interest-Only Stripped Mtg.-Backed Security: Continued
                   
    Trust 2003-4, Cl. S, 44.233%, 2/25/336
      $ 558,979     $ 104,929  
    Trust 2003-89, Cl. XS, 53.473%, 11/25/326
        478,215       36,036  
    Trust 2004-54, Cl. DS, 51.461%, 11/25/306
        487,091       62,003  
    Trust 2005-14, Cl. SE, 41.477%, 3/25/356
        399,494       54,513  
    Trust 2005-40, Cl. SA, 65.797%, 5/25/356
        1,115,101       186,456  
    Trust 2005-40, Cl. SB, 80.731%, 5/25/356
        53,400       8,452  
    Trust 2005-71, Cl. SA, 68.363%, 8/25/256
        1,379,284       188,386  
    Trust 2005-93, Cl. SI, 17.83%, 10/25/356
        1,029,019       127,177  
    Trust 2006-60, Cl. DI, 41.383%, 4/25/356
        287,488       42,034  
    Trust 2008-67, Cl. KS, 34.057%, 8/25/346
        2,800,395       209,805  
    Trust 221, Cl. 2, 32.909%, 5/1/236
        8,585       1,715  
    Trust 222, Cl. 2, 21.249%, 6/1/236
        994,525       186,343  
    Trust 252, Cl. 2, 32.983%, 11/1/236
        850,922       171,681  
    Trust 294, Cl. 2, 11.431%, 2/1/286
        93,434       18,520  
    Trust 301, Cl. 2, 2.60%, 4/1/296
        11,277       2,263  
    Trust 303, Cl. IO, 5.001%, 11/1/296
        146,700       36,363  
    Trust 320, Cl. 2, 9.699%, 4/1/326
        672,824       185,123  
    Trust 321, Cl. 2, 0.909%, 4/1/326
        2,145,325       552,680  
    Trust 324, Cl. 2, 0.035%, 7/1/326
        22,483       4,828  
    Trust 331, Cl. 5, 0%, 2/1/336,7
        30,194       5,422  
    Trust 331, Cl. 9, 14.883%, 2/1/336
        542,709       100,608  
    Trust 334, Cl. 12, 0%, 2/1/336,7
        53,933       9,421  
    Trust 334, Cl. 17, 22.94%, 2/1/336
        378,513       71,988  
    Trust 339, Cl. 12, 0%, 7/1/336,7
        731,423       129,129  
    Trust 339, Cl. 7, 0%, 7/1/336,7
        1,810,011       308,237  
    Trust 343, Cl. 13, 3.941%, 9/1/336
        669,434       116,134  
    Trust 343, Cl. 18, 5.387%, 5/1/346
        193,443       33,564  
    Trust 345, Cl. 9, 3.322%, 1/1/346
        891,758       152,449  
    Trust 351, Cl. 10, 13.571%, 4/1/346
        266,260       45,713  
    Trust 351, Cl. 8, 0%, 4/1/346,7
        418,833       72,009  
    Trust 356, Cl. 10, 0%, 6/1/356,7
        348,841       59,567  
    Trust 356, Cl. 12, 0%, 2/1/356,7
        174,652       29,941  
    Trust 362, Cl. 13, 0.217%, 8/1/356
        615,095       103,675  
    Trust 364, Cl. 15, 0%, 9/1/356,7
        38,231       6,214  
    Trust 364, Cl. 16, 0%, 9/1/356,7
        742,332       131,305  
    Trust 365, Cl. 16, 0%, 3/1/366,7
        1,131,912       215,792  
    Federal National Mortgage Assn., Principal-Only Stripped Mtg.-Backed Security,
    Trust 1993-184, Cl. M, 4.754%, 9/25/238
        306,670       273,750  


                118,259,430  
     
                   
    GNMA/Guaranteed—0.3%
                   
    Government National Mortgage Assn.:
                   
    7%, 12/29/23-3/15/26
        31,252       35,743  
    8.50%, 8/1/17-12/15/17
        116,827       131,447  
    Government National Mortgage Assn., Gtd. Real Estate Mtg. Investment
    Conduit Pass-Through Certificates:
                   
    Series 1999-32, Cl. ZB, 8%, 9/16/29
        84,459       101,662  
    Series 2000-7, Cl. Z, 8%, 1/16/30
        36,181       42,262  
    Government National Mortgage Assn., Interest-Only Stripped Mtg.-Backed Security:
                   
    Series 1998-19, Cl. SB, 61.128%, 7/16/286
        17,912       3,806  
    Series 2001-21, Cl. SB, 88.689%, 1/16/276
        650,598       100,840  
    Series 2002-15, Cl. SM, 77.353%, 2/16/326
        669,738       103,694  
    Series 2004-11, Cl. SM, 69.385%, 1/17/306
        500,369       94,915  


                614,369  
     
                   
    Non-Agency—13.1%
                   
    Commercial—9.9%
                   
    Asset Securitization Corp., Commercial Interest-Only Stripped Mtg.-Backed Security,
    Series 1997-D4, Cl. PS1, 0.174%, 4/14/296
        7,900,610       248,515  
    Banc of America Commercial Mortgage, Inc., Commercial Mtg. Pass-Through Certificates:
                   
    Series 2006-1, Cl. AM, 5.421%, 9/1/45
        1,280,000       1,301,778  
    Series 2007-1, Cl. A4, 5.451%, 1/1/17
        710,000       741,791  
    Series 2007-1, Cl. AMFX, 5.482%, 1/1/49
        900,000       881,309  
    Capital Lease Funding Securitization LP, Interest-Only Corporate-Backed Pass-Through Certificates, Series 1997-CTL1, 0%, 6/22/241,6,7
        5,456,973       253,300  
    CHL Mortgage Pass-Through Trust 2005-17, Mtg. Pass-Through Certificates,
    Series 2005-17, Cl. 1A8, 5.50%, 9/1/35
        75,767       67,227  
    Citigroup, Inc./Deutsche Bank 2007-CD4 Commercial Mortgage Trust, Commercial Mtg. Pass-Through Certificates, Series 2007-CD4, Cl. A2B, 5.205%, 12/11/49
        380,000       390,930  
    Deutsche Mortgage & Asset Receiving, Commercial Mtg. Pass-Through Certificates,
    Series 2010-C1, Cl. A1, 3.156%, 7/1/461
        593,941       595,926  
    Deutsche Mortgage & Asset Receiving, Commercial Mtg. Pass-Through Certificates, Interest-Only Stripped Mtg.-Backed Security, Series 2010-C1, Cl. XPA, 4.82%, 9/1/203,6
        4,765,000       425,456  
     
                     
        Principal        
        Amount     Value  
     
    Commercial Continued
                   
    First Horizon Alternative Mortgage Securities Trust 2004-FA2, Mtg. Pass-Through Certificates, Series 2004-FA2, Cl. 3A1, 6%, 1/25/35
      $ 544,419     $ 546,671  
    First Horizon Alternative Mortgage Securities Trust 2007-FA2, Mtg. Pass-Through Certificates, Series 2007-FA2, Cl. 1A1, 5.50%, 4/25/37
        218,573       158,207  
    First Horizon Mortgage Pass-Through Trust 2007-AR3, Mtg. Pass-Through Certificates, Series 2007-AR3, Cl. 1A1, 6.052%, 11/1/372
        449,542       367,655  
    GE Capital Commercial Mortgage Corp., Commercial Mtg. Obligations,
    Series 2004-C3, Cl. A2, 4.433%, 7/10/39
        7,056       7,097  
    Impac CMB Trust Series 2005-4, Collateralized Asset-Backed Bonds,
    Series 2005-4, Cl. 1A1A, 0.801%, 5/25/352
        619,888       468,810  
    IndyMac INDX Mortgage Loan Trust 2005-AR23, Mtg. Pass-Through Certificates,
    Series 2005-AR23, Cl. 6A1, 5.214%, 11/1/352
        767,364       592,984  
    JPMorgan Chase Commercial Mortgage Securities Corp., Commercial Mtg.
    Pass-Through Certificates:
                   
    Series 2010-C2, Cl. A2, 3.616%, 11/1/431
        710,000       688,449  
    Series 2007-LDPX, Cl. A2S2, 5.187%, 1/1/493
        2,310,000       2,333,562  
    Series 2007-LDPX, Cl. A2S, 5.305%, 1/15/49
        1,640,000       1,679,544  
    JPMorgan Chase Commercial Mortgage Securities Trust 2006-LDP7, Commercial Mtg.
    Pass-Through Certificates, Series 2006-LDP7, 5.872%, 4/1/452
        1,175,000       1,220,516  
    JPMorgan Mortgage Trust 2007-S3, Mtg. Pass-Through Certificates,
    Series 2007-S3, Cl. 1A90, 7%, 7/1/37
        733,464       572,783  
    LB-UBS Commercial Mortgage Trust 2006-C3, Commercial Mtg. Pass-Through Certificates, Series 2006-C3, Cl. AM, 5.712%, 3/11/39
        85,000       86,192  
    LB-UBS Commercial Mortgage Trust 2007-C1, Commercial Mtg. Pass-Through Certificates, Series 2007-C1, Cl. A2, 5.318%, 1/15/12
        465,000       476,955  
    Lehman Brothers Commercial Conduit Mortgage Trust, Interest-Only Stripped Mtg.-Backed Security, Series 1998-C1, Cl. IO, 0%, 2/18/306,7
        3,652,229       83,661  
    Lehman Structured Securities Corp., Commercial Mtg. Pass-Through Certificates,
    Series 2002-GE1, Cl. A, 2.514%, 7/1/241
        163,342       121,406  
    Mastr Alternative Loan Trust 2004-6, Mtg. Pass-Through Certificates,
    Series 2004-6, Cl. 10A1, 6%, 7/25/34
        1,047,699       1,045,760  
    Merrill Lynch Mortgage Investors Trust 2005-A5, Mtg. Pass-Through Certificates,
    Series 2005-A5, Cl. A9, 2.752%, 6/1/352
        591,391       524,751  
    ML-CFC Commercial Mortgage Trust 2006-3, Commercial Mtg. Pass-Through Certificates, Series 2006-3, Cl. AM, 5.456%, 7/12/46
        1,000,000       1,011,051  
    Salomon Brothers Mortgage Securities VII, Inc., Interest-Only Commercial Mtg. Pass-Through Certificates, Series 1999-C1, Cl. X, 0%, 5/18/326,7
        45,455,038       170,775  
    Wachovia Bank Commercial Mortgage Trust 2007-C34, Commercial Mtg. Pass-Through Certificates, Series 2007-C34, Cl. A3, 5.678%, 7/1/17
        520,000       543,460  
    WaMu Mortgage Pass-Through Certificates 2005-AR14 Trust, Mtg. Pass-Through Certificates, Series 2005-AR14, Cl. 1A4, 2.671%, 12/1/352
        408,310       351,867  
    Wells Fargo Commercial Mortgage Trust 2010-C1, Commercial Mtg. Pass-Through Certificates, Series 2010-C1, Cl. A1, 3.349%, 10/1/571
        382,914       384,121  
    Wells Fargo Mortgage-Backed Securities 2007-AR8 Trust, Mtg. Pass-Through Certificates, Series 2007-AR8, Cl. A1, 6.134%, 11/1/372
        552,898       448,859  


                18,791,368  
     
                   
    Multifamily—0.9%
                   
    Citigroup Mortgage Loan Trust, Inc. 2006-AR3, Mtg. Pass-Through Certificates,
    Series 2006-AR3, Cl. 1 A2A, 5.77%, 6/1/362
        499,685       465,983  
    GE Capital Commercial Mortgage Corp., Commercial Mtg. Pass-Through Certificates, Series 2001-3, Cl. A2, 6.07%, 6/1/38
        640,000       657,289  


        Principal        
        Amount     Value  
     
    Multifamily Continued
                   
    Wells Fargo Mortgage-Backed Securities 2006-AR6 Trust, Mtg. Pass-Through Certificates, Series 2006-AR6, Cl. 3A1, 3.203%, 3/25/362
      $ 589,946     $ 525,603  


                1,648,875  
     
                   
    Other—0.0%
                   
    Salomon Brothers Mortgage Securities VI, Inc., Interest-Only Stripped Mtg.-Backed Security, Series 1987-3, Cl. B, 0%, 10/23/176,7
        9       1  
    Salomon Brothers Mortgage Securities VI, Inc., Principal-Only Stripped Mtg.-Backed Security, Series 1987-3, Cl. A, 4.173%, 10/23/178
        1,277       1,247  


                1,248  
     
                   
    Residential—2.3%
                   
    CHL Mortgage Pass-Through Trust 2005-30, Mtg. Pass-Through Certificates,
    Series 2005-30, Cl. A5, 5.50%, 1/1/36
        471,181       455,428  
    CHL Mortgage Pass-Through Trust 2005-J4, Mtg. Pass-Through Certificates,
    Series 2005-J4, Cl. A7, 5.50%, 11/1/35
        39,582       32,566  
    GSR Mortgage Loan Trust 2006-5F, Mtg. Pass-Through Certificates,
    Series 2006-5F, Cl. 2A1, 6%, 6/1/36
        613,494       591,126  
    JPMorgan Alternative Loan Trust 2006-S4, Mtg. Pass-Through Certificates,
    Series 2006-S4, Cl. A6, 5.71%, 12/1/36
        552,479       498,176  
    Merrill Lynch Mortgage Investors Trust 2006-3, Mtg. Pass-Through Certificates,
    Series MLCC 2006-3, Cl. 2A1, 6.025%, 10/25/362
        54,930       50,912  
    RALI Series 2003-QS1 Trust, Mtg. Asset-Backed Pass-Through Certificates,
    Series 2003-QS1, Cl. A2, 5.75%, 1/25/33
        314,306       316,660  
    RALI Series 2006-QS13 Trust:
                   
    Mtg. Asset-Backed Pass-Through Certificates,
    Series 2006-QS13, Cl. 1A5, 6%, 9/25/36
        64,822       41,120  
    Mtg. Asset-Backed Pass-Through Certificates,
    Series 2006-QS13, Cl. 1A8, 6%, 9/25/36
        2,272       1,441  
    RALI Series 2007-QS6 Trust, Mtg. Asset-Backed Pass-Through Certificates,
    Series 2007-QS6, Cl. A28, 5.75%, 4/25/37
        27,853       17,412  
    Structured Adjustable Rate Mortgage Loan Trust, Mtg. Pass-Through Certificates,
    Series 2004-5, Cl. 3A1, 2.602%, 5/1/342
        259,845       245,800  
    WaMu Mortgage Pass-Through Certificates 2007-HY1 Trust, Mtg. Pass-Through Certificates,
    Series 2007-HY1, Cl. 4A1, 5%, 2/1/372
        66,129       52,339  
    WaMu Mortgage Pass-Through Certificates 2007-HY7 Trust, Mtg. Pass-Through Certificates,
    Series 2007-HY7, Cl. 2A1, 5.629%, 7/1/372
        603,739       425,215  
    WaMu Mortgage Pass-Through Certificates Series 2007-HY5 Trust, Mtg. Pass-Through Certificates,
    Series 2007-HY5, Cl. 3A1, 5.743%, 5/1/372
        1,018,966       931,998  
    Wells Fargo Alternative Loan 2007-PA5 Trust, Mtg. Asset-Backed Pass-Through Certificates,
    Series 2007-PA5, Cl. 1A1, 6.25%, 11/1/37
        412,424       360,689  
    Wells Fargo Mortgage-Backed Securities 2004-R Trust, Mtg. Pass-Through Certificates,
    Series 2004-R, Cl. 2A1, 2.872%, 9/1/342
        273,041       265,076  


                4,285,958  
     
                 
    Total Mortgage-Backed Obligations
    (Cost $140,426,578)
                143,601,248  
     
                   
    U.S. Government Obligations—1.6%
                   
    Federal Home Loan Mortgage Corp. Nts.:
                   
    1.75%, 9/10/15
        820,000       806,901  
    5%, 2/16/17
        295,000       332,586  
    5.25%, 4/18/16
        515,000       589,789  
    Federal National Mortgage Assn. Nts.:
                   
    1.625%, 10/26/15
        745,000       726,970  
    4.875%, 12/15/16
        240,000       269,404  
    5%, 3/15/16
        320,000       361,932  
     
                 
    Total U.S. Government Obligations
    (Cost $3,080,620)
                3,087,582  
     
                   
    Corporate Bonds and Notes—35.1%
                   
    Consumer Discretionary—4.6%
                   
    Auto Components—0.2%
                   
    BorgWarner, Inc., 4.625% Sr. Unsec. Unsub. Nts., 9/15/20
        424,000       419,409  
    Diversified Consumer Services—0.3%
                   
    Service Corp. International, 6.75% Sr. Unsec. Nts., 4/1/15
        475,000       489,250  
     
                     
        Principal        
        Amount     Value  
     
    Hotels, Restaurants & Leisure—0.7%
                   
    Hyatt Hotels Corp., 5.75% Sr. Unsec. Unsub. Nts., 8/15/151
      $ 725,000     $ 759,076  
    Marriott International, Inc., 6.20% Sr. Unsec. Unsub. Nts., 6/15/16
        526,000       575,767  


                1,334,843  
     
                   
    Household Durables—0.7%
                   
    Fortune Brands, Inc., 6.375% Sr. Unsec. Unsub. Nts., 6/15/14
        370,000       401,304  
    Jarden Corp., 6.125% Sr. Unsec. Nts., 11/15/22
        489,000       468,829  
    Whirlpool Corp., 8% Sr. Unsec. Nts., 5/1/12
        380,000       409,625  


                1,279,758  
     
                   
    Leisure Equipment & Products—0.5%
                   
    Mattel, Inc.:
                   
    5.625% Sr. Unsec. Nts., 3/15/13
        395,000       424,885  
    6.125% Sr. Unsec. Nts., 6/15/11
        455,000       464,683  


                889,568  
     
                   
    Media—1.8%
                   
    Comcast Cable Communications Holdings, Inc., 9.455% Sr. Unsec. Nts., 11/15/22
        292,000       404,803  
    DirecTV Holdings LLC/ DirecTV Financing Co., Inc., 7.625% Sr. Unsec. Unsub. Nts., 5/15/16
        850,000       943,483  
    Interpublic Group of Co., Inc. (The), 10% Sr. Unsec. Nts., 7/15/17
        405,000       475,875  
    Lamar Media Corp., 9.75% Sr. Unsec. Nts., 4/1/14
        438,000       505,890  
    Time Warner Entertainment Co. LP, 8.375% Sr. Nts., 7/15/33
        257,000       325,251  
    Viacom, Inc., 7.875% Sr. Unsec. Debs., 7/30/30
        270,000       319,638  
    Virgin Media Secured Finance plc, 6.50% Sr. Sec. Nts., 1/15/18
        480,000       507,600  


                3,482,540  
     
                   
    Specialty Retail—0.4%
                   
    Staples, Inc., 7.75% Sr. Unsec. Unsub. Nts., 4/1/11
        680,000       690,987  
    Consumer Staples—1.9%
                   
    Beverages—0.7%
                   
    Anheuser-Busch InBev Worldwide, Inc., 7.75% Sr. Unsec. Unsub. Nts., 1/15/191
        700,000       872,400  
    Constellation Brands, Inc., 8.375% Sr. Nts., 12/15/14
        445,000       488,388  


                1,360,788  
     
                   
    Food & Staples Retailing—0.2%
                   
    Delhaize Group, 5.70% Sr. Unsec. Nts., 10/1/401
        305,000       291,336  
    Food Products—0.5%
                   
    Bunge Ltd. Finance Corp.:
                   
    5.35% Sr. Unsec. Unsub. Nts., 4/15/14
        210,000       220,900  
    8.50% Sr. Unsec. Nts., 6/15/19
        200,000       234,869  
    TreeHouse Foods, Inc., 7.75% Sr. Unsec. Nts., 3/1/18
        470,000       510,538  


                966,307  
     
                   
    Tobacco—0.5%
                   
    Altria Group, Inc., 10.20% Sr. Unsec. Nts., 2/6/39
        515,000       746,518  
    Lorillard Tobacco Co., 8.125% Sr. Unsec. Nts., 5/1/40
        270,000       277,632  


                1,024,150  
     
                   
    Energy—3.6%
                   
    Energy Equipment & Services—0.4%
                   
    Rowan Cos., Inc., 5% Sr. Unsec. Nts., 9/1/17
        400,000       404,049  
    Weatherford International Ltd., 6.50% Sr. Unsec. Bonds, 8/1/36
        308,000       315,559  


                719,608  
     
                   
    Oil, Gas & Consumable Fuels—3.2%
                   
    Cloud Peak Energy Resources LLC, 8.25% Sr. Unsec. Unsub. Nts., 12/15/17
        445,000       480,044  
    Energy Transfer Partners LP:
                   
    5.65% Sr. Unsec. Unsub. Nts., 8/1/12
        179,000       189,723  
    7.50% Sr. Unsec. Unsub. Bonds, 7/1/38
        345,000       402,552  
    Enterprise Products Operating LLP, 7.50% Sr. Unsec. Unsub. Nts., 2/1/11
        515,000       517,284  
    Kaneb Pipe Line Operating Partnership LP, 5.875% Sr. Unsec. Nts., 6/1/13
        840,000       909,780  
    Kinder Morgan Energy Partners LP, 6.50% Sr. Unsec. Unsub. Nts., 9/1/39
        360,000       373,119  
    Nexen, Inc., 6.40% Sr. Unsec. Unsub. Bonds, 5/15/37
        237,000       230,341  
    ONEOK Partners LP, 7.10% Sr. Unsec. Nts., 3/15/11
        206,000       208,485  
    Range Resources Corp., 8% Sr. Unsec. Sub. Nts., 5/15/19
        303,000       331,406  
    Ras Laffan Liquefied Natural Gas Co. Ltd. III, 5.50% Sr. Sec. Nts., 9/30/141
        270,000       292,142  
    Rockies Express Pipeline LLC:
                   
    3.90% Sr. Unsec. Unsub. Nts., 4/15/151
        532,000       526,710  
    5.625% Sr. Unsec. Unsub. Nts., 4/15/201
        326,000       315,680  
    Southwestern Energy Co., 7.50% Sr. Nts., 2/1/18
        465,000       526,613  
    Woodside Finance Ltd., 4.50% Nts., 11/10/141
        702,000       738,506  


                6,042,385  


        Principal        
        Amount     Value  
     
    Financials—13.5%
                   
    Capital Markets—2.3%
                   
    Blackstone Holdings Finance Co. LLC, 6.625% Sr. Unsec. Nts., 8/15/191
      $ 705,000     $ 725,879  
    Goldman Sachs Capital, Inc. (The), 6.345% Sub. Bonds, 2/15/34
        515,000       492,164  
    Macquarie Group Ltd., 4.875% Sr. Unsec. Nts., 8/10/171
        780,000       764,763  
    Morgan Stanley:
                   
    5.50% Sr. Unsec. Unsub. Nts., 7/24/201
        178,000       180,161  
    5.55% Sr. Unsec. Unsub. Nts., Series F, 4/27/17
        1,205,000       1,257,036  
    TD Ameritrade Holding Corp., 2.95% Sr. Unsec. Unsub. Nts., 12/1/12
        475,000       486,233  
    UBS AG Stamford, CT, 2.25% Sr. Unsec. Nts., 8/12/13
        482,000       486,419  


                4,392,655  
     
                   
    Commercial Banks—3.4%
                   
    ANZ National International Ltd., 2.375% Sr. Unsec. Nts., 12/21/121
        475,000       482,559  
    Barclays Bank plc, 6.278% Perpetual Bonds10
        1,050,000       892,500  
    BNP Paribas SA, 5.186% Sub. Perpetual Nts.1,10
        515,000       472,513  
    Fifth Third Cap Trust IV, 6.50% Jr. Unsec. Sub. Nts., 4/15/37
        631,000       604,183  
    HSBC Finance Capital Trust IX, 5.911% Nts., 11/30/352
        1,270,000       1,181,100  
    Huntington BancShares, Inc., 7% Sub. Nts., 12/15/20
        745,000       785,814  
    Lloyds TSB Bank plc, 6.50% Unsec. Sub. Nts., 9/14/201
        493,000       454,366  
    Sanwa Bank Ltd. (The), 7.40% Sub. Nts., 6/15/11
        465,000       473,867  
    Wells Fargo & Co., 7.98% Jr. Sub. Perpetual Bonds, Series K10
        1,010,000       1,070,600  


                6,417,502  
     
                   
    Consumer Finance—0.6%
                   
    American Express Bank FSB, 5.55% Sr. Unsec. Nts., 10/17/12
        415,000       444,081  
    Capital One Capital IV, 6.745% Sub. Bonds, 2/17/372
        780,000       778,050  


                1,222,131  
     
                   
    Diversified Financial Services—2.3%
                   
    Bank of America Corp., 5.875% Sr. Unsec. Unsub. Nts., 1/5/21
        140,000       145,119  
    Citigroup, Inc.:
                   
    5.375% Sr. Unsec. Nts., 8/9/20
        924,000       961,840  
    6.01% Sr. Unsec. Nts., 1/15/15
        480,000       527,046  
    ING Groep NV, 5.775% Jr. Unsec. Sub. Perpetual Bonds10
        535,000       462,775  
    JPMorgan Chase & Co., 7.90% Perpetual Bonds, Series 110
        1,430,000       1,525,197  
    Merrill Lynch & Co., Inc., 7.75% Jr. Sub. Bonds, 5/14/38
        709,000       737,951  


                4,359,928  
     
                   
    Insurance—3.9%
                   
    American International Group, Inc.:
                   
    5.85% Sr. Unsec. Nts., Series G, 1/16/18
        445,000       460,176  
    6.40% Sr. Unsec. Unsub. Nts., 12/15/20
        470,000       494,036  
    CNS Financial Corp., 5.875% Sr. Unsec. Unsub. Bonds, 8/15/20
        460,000       458,842  
    Genworth Financial, Inc., 8.625% Sr. Unsec. Unsub. Nts., 12/15/16
        419,000       471,765  
    Gulf South Pipeline Co. LP, 5.75% Sr. Unsec. Nts., 8/15/121
        455,000       482,799  
    Hartford Financial Services Group, Inc. (The), 5.25% Sr. Unsec. Nts., 10/15/11
        465,000       478,804  
    Irish Life & Permanent Group Holdings plc, 3.60% Sr. Unsec. Unsub. Nts., 1/14/131
        620,000       556,413  
    Lincoln National Corp., 6.05% Jr. Unsec. Sub. Bonds, 4/20/67
        945,000       881,213  
    Manulife Financial Corp., 4.90% Sr. Unsec. Unsub. Nts., 9/17/20
        260,000       247,905  
    PartnerRe Finance B LLC, 5.50% Sr. Unsec. Nts., 6/1/20
        454,000       458,022  
    Prudential Financial, Inc., 3.625% Sr. Unsec. Unsub. Nts., 9/17/12
        465,000       482,783  
    RenRe North America Holdings, Inc., 5.75% Sr. Unsec. Nts., 3/15/20
        480,000       482,745  
    Swiss Re Capital I LP, 6.854% Perpetual Bonds1,10
        926,000       889,213  
    ZFS Finance USA Trust IV, 5.875% Sub. Bonds, 5/9/321
        532,000       521,163  


                7,365,879  
     
                   
    Real Estate Investment Trusts—1.0%
                   
    AvalonBay Communities, Inc., 6.625% Sr. Unsec. Unsub. Nts., 9/15/11
        202,000       209,675  
    Brandywine Operating Partnership LP, 5.75% Sr. Unsec. Unsub. Nts., 4/1/12
        237,000       245,486  
    Liberty Property LP, 7.25% Sr. Unsec. Unsub. Nts., 3/15/11
        465,000       470,345  
    Mack-Cali Realty LP, 5.25% Sr. Unsec. Unsub. Nts., 1/15/12
        180,000       184,728  
    Simon Property Group LP, 5% Sr. Unsec. Unsub. Nts., 3/1/12
        470,000       483,082  
    WCI Finance LLC/WEA Finance LLC, 5.40% Sr. Unsec. Unsub. Nts., 10/1/121
        220,000       233,325  


                1,826,641  
     
                     
        Principal        
        Amount     Value  
     
    Health Care—1.5%
                   
    Biotechnology—0.5%
                   
    Celgene Corp., 5.70% Sr. Unsec. Nts., 10/15/40
      $ 495,000     $ 481,469  
    Genzyme Corp., 5% Sr. Unsec. Nts., 6/15/20
        465,000       489,107  


                970,576  
     
                   
    Health Care Providers & Services—0.7%
                   
    Laboratory Corp. of America Holdings, 4.625% Nts., 11/15/20
        356,000       353,481  
    Quest Diagnostic, Inc., 5.75% Sr. Unsec. Nts., 1/30/40
        520,000       497,040  
    WellPoint, Inc., 5% Sr. Unsec. Unsub. Nts., 1/15/11
        435,000       435,462  


                1,285,983  
     
                   
    Pharmaceuticals—0.3%
                   
    Hospira, Inc., 5.60% Sr. Unsec. Unsub. Nts., 9/15/40
        148,000       145,983  
    Mylan, Inc., 6% Sr. Nts., 11/15/181
        495,000       487,575  


                633,558  
     
                   
    Industrials—2.4%
                   
    Aerospace & Defense—0.5%
                   
    Alliant Techsystems, Inc., 6.75% Sr. Sub. Nts., 4/1/16
        477,000       496,676  
    BE Aerospace, Inc., 8.50% Sr. Unsec. Nts., 7/1/18
        420,000       460,950  


                957,626  
     
                   
    Commercial Services & Supplies—0.8%
                   
    Browning-Ferris Industries, Inc., 7.40% Sr. Unsec. Debs., 9/15/35
        165,000       195,833  
    Corrections Corp. of America, 7.75% Sr. Nts., 6/1/17
        473,000       504,336  
    R.R. Donnelley & Sons Co., 5.625% Sr. Unsec. Nts., 1/15/12
        455,000       466,057  
    Republic Services, Inc., 6.75% Sr. Unsec. Unsub. Nts., 8/15/11
        295,000       304,577  


                1,470,803  
     
                   
    Industrial Conglomerates—0.5%
                   
    General Electric Capital Corp., 4.25% Sr. Unsec. Nts., Series A, 6/15/12
        460,000       478,551  
    Tyco International Ltd./Tyco International Finance SA, 6.875% Sr. Unsec. Unsub. Nts., 1/15/21
        405,000       488,193  


                966,744  
     
                   
    Machinery—0.3%
                   
    SPX Corp., 7.625% Sr. Unsec. Nts., 12/15/14
        510,000       557,175  
    Professional Services—0.3%
                   
    FTI Consulting, Inc., 6.75% Sr. Nts., 10/1/201
        482,000       480,795  
    Information Technology—1.6%
                   
    Communications Equipment—0.7%
                   
    Harris Corp., 6.15% Sr. Unsec. Nts., 12/15/40
        871,000       894,514  
    Motorola, Inc., 8% Sr. Unsec. Nts., 11/1/11
        450,000       474,017  


                1,368,531  
     
                   
    Electronic Equipment & Instruments—0.4%
                   
    Arrow Electronics, Inc., 3.375% Sr. Unsec. Unsub. Nts., 11/1/15
        875,000       849,157  
    IT Services—0.2%
                   
    SAIC, Inc., 5.95% Sr. Unsec. Unsub. Nts., 12/1/401
        282,000       286,955  
    Software—0.3%
                   
    Symantec Corp., 4.20% Sr. Unsec. Unsub. Nts., 9/15/20
        618,000       568,054  
    Materials—2.8%
                   
    Chemicals—1.3%
                   
    Agrium, Inc., 6.125% Sr. Unsec. Nts., 1/15/41
        702,000       746,118  
    Airgas, Inc., 3.25% Sr. Nts., 10/1/15
        417,000       412,382  
    Ashland, Inc., 9.125% Sr. Unsec. Nts., 6/1/17
        440,000       509,300  
    CF Industries, Inc., 6.875% Sr. Unsec. Unsub. Nts., 5/1/18
        480,000       514,800  
    Potash Corp., 5.625% Sr. Unsec. Unsub. Nts., 12/1/40
        285,000       288,670  


                2,471,270  
     
                   
    Containers & Packaging—0.7%
                   
    Ball Corp., 7.125% Sr. Unsec. Nts., 9/1/16
        486,000       526,095  
    Sealed Air Corp., 7.875% Sr. Nts., 6/15/17
        572,000       629,829  
    Sonoco Products Co., 5.75% Sr. Unsec. Unsub. Nts., 11/1/40
        243,000       235,079  


                1,391,003  
     
                   
    Metals & Mining—0.8%
                   
    Freeport-McMoRan Copper & Gold, Inc., 8.375% Sr. Nts., 4/1/17
        698,000       773,110  
    Vale Inco Ltd., 5.70% Sr. Unsec. Unsub. Nts., 10/15/15
        28,000       30,194  
    Xstrata Canada Corp.:
                   
    5.375% Sr. Unsec. Unsub. Nts., 6/1/15
        245,000       259,937  
    6% Sr. Unsec. Unsub. Nts., 10/15/15
        347,000       379,949  


                1,443,190  

                     
        Principal        
        Amount     Value  
     
    Telecommunication Services—1.8%
                   
    Diversified Telecommunication Services—1.6%
                   
    AT&T, Inc., 6.30% Sr. Unsec. Bonds, 1/15/38
      $ 440,000     $ 465,721  
    British Telecommunications plc, 9.875% Bonds, 12/15/30
        298,000       398,186  
    Embarq Corp., 6.738% Sr. Unsec. Nts., 6/1/13
        440,000       478,201  
    Frontier Communications Corp., 8.25% Sr. Unsec. Nts., 4/15/17
        477,000       525,893  
    Qwest Corp., 7.625% Sr. Unsec. Unsub. Nts., 6/15/15
        447,000       506,228  
    Telus Corp., 8% Nts., 6/1/11
        266,000       273,281  
    Verizon Communications, Inc., 6.40% Sr. Unsec. Nts., 2/15/38
        289,000       320,767  


                2,968,277  
     
                   
    Wireless Telecommunication Services—0.2%
                   
    American Tower Corp., 7% Sr. Unsec. Nts., 10/15/17
        337,000       380,495  
    Utilities—1.4%
                   
    Electric Utilities—1.2%
                   
    Allegheny Energy Supply Co. LLC, 8.25% Bonds, 4/15/121
        428,000       459,336  
    FirstEnergy Solutions Corp., 6.80% Sr. Unsec. Nts., 8/15/39
        292,000       283,880  
    Great Plains Energy, Inc., 2.75% Sr. Unsec. Unsub. Nts., 8/15/13
        320,000       323,462  
    Northeast Utilities, 7.25% Sr. Unsec. Nts., 4/1/12
        470,000       502,774  
    Texas-New Mexico Power Co., 9.50% Sec. Nts., 4/1/191
        510,000       650,324  


                2,219,776  
     
                   
    Gas Utilities—0.2%
                   
    AmeriGas Partners LP, 7.25% Sr. Unsec. Nts., 5/20/15
        462,000       477,015  
     
                 
    Total Corporate Bonds and Notes
    (Cost $64,189,945)
                66,322,648  
                     
        Shares          
     
    Investment Companies—14.7%
                   
    JPMorgan U.S. Treasury Plus Money Market Fund, Agency Shares, 0.00%11,12
        1,838,966       1,838,966  
    Oppenheimer Institutional Money Market Fund, Cl. E, 0.21%11,13
        25,899,825       25,899,825  
     
                 
    Total Investment Companies
    (Cost $27,738,791)
                27,738,791  
     
                   
    Total Investments, at Value
    (Cost $255,598,753)
        136.4 %     257,938,507  
    Liabilities in Excess of Other Assets
        (36.4 )     (68,819,104 )
         
     
    Net Assets
        100.0 %   $ 189,119,403  
         
    Footnotes to Statement of Investments
     
    1.   Represents securities sold under Rule 144A, which are exempt from registration under the Securities Act of 1933, as amended. These securities have been determined to be liquid under guidelines established by the Board of Trustees. These securities amount to $19,309,053 or 10.21% of the Fund’s net assets as of December 31, 2010.
     
    2.   Represents the current interest rate for a variable or increasing rate security.
     
    3.   Restricted security. The aggregate value of restricted securities as of December 31, 2010 was $3,668,421, which represents 1.94% of the Fund’s net assets. See Note 6 of the accompanying Notes. Information concerning restricted securities is as follows:
                                     
                                Unrealized  
        Acquisition                     Appreciation  
    Security   Date     Cost     Value     (Depreciation)  
     
    Deutsche Mortgage & Asset Receiving, Commercial Mtg. Pass-Through Certificates, Interest-Only Stripped Mtg.-Backed Security, Series 2010-C1, Cl. XPA, 4.82%, 9/1/20
        10/27/10     $ 434,816     $ 425,456     $ (9,360 )
    Ford Credit Auto Lease Trust, Automobile Receivable Nts., Series 2010-B, Cl. A2, 0.75%, 10/15/12
        10/21/10       504,990       505,001       11  
    JPMorgan Chase Commercial Mortgage Securities Corp., Commercial Mtg. Pass-Through Certificates, Series 2007-LDPX, Cl. A2S2, 5.187%, 1/1/49
        7/14/10       2,281,125       2,333,562       52,437  
    NC Finance Trust, Collateralized Mtg. Obligation Pass-Through Certificates, Series 1999-I, Cl. ECFD, 1/25/29
        8/10/10       3,281,116       404,402       (2,876,714 )
                 
     
              $ 6,502,047     $ 3,668,421     $ (2,833,626 )
                 
     
    Footnotes to Statement of Investments Continued
     
    4.   Issue is in default. See Note 1 of the accompanying Notes.
     
    5.   All or a portion of the security position is held in collateralized accounts to cover initial margin requirements on open futures contracts and written options on futures, if applicable. The aggregate market value of such securities is $575,411. See Note 5 of the accompanying Notes.
     
    6.   Interest-Only Strips represent the right to receive the monthly interest payments on an underlying pool of mortgage loans. These securities typically decline in price as interest rates decline. Most other fixed income securities increase in price when interest rates decline. The principal amount of the underlying pool represents the notional amount on which current interest is calculated. The price of these securities is typically more sensitive to changes in prepayment rates than traditional mortgage-backed securities (for example, GNMA pass-throughs). Interest rates disclosed represent current yields based upon the current cost basis and estimated timing and amount of future cash flows. These securities amount to $7,063,019 or 3.73% of the Fund’s net assets as of December 31, 2010.
     
    7.   The current amortization rate of the security’s cost basis exceeds the future interest payments currently estimated to be received. Both the amortization rate and interest payments are contingent on future mortgage pre-payment speeds and are therefore subject to change.
     
    8.   Principal-Only Strips represent the right to receive the monthly principal payments on an underlying pool of mortgage loans. The value of these securities generally increases as interest rates decline and prepayment rates rise. The price of these securities is typically more volatile than that of coupon-bearing bonds of the same maturity. Interest rates disclosed represent current yields based upon the current cost basis and estimated timing of future cash flows. These securities amount to $382,788 or 0.20% of the Fund’s net assets as of December 31, 2010.
     
    9.   When-issued security or delayed delivery to be delivered and settled after December 31, 2010. See Note 1 of the accompanying Notes.
     
    10.   This bond has no contractual maturity date, is not redeemable and contractually pays an indefinite stream of interest. Rate reported represents the current interest rate for this variable rate security.
     
    11.   Rate shown is the 7-day yield as of December 31, 2010.
     
    12.   Interest rate is less than 0.0005%.
     
    13.   Is or was an affiliate, as defined in the Investment Company Act of 1940, at or during the period ended December 31, 2010, by virtue of the Fund owning at least 5% of the voting securities of the issuer or as a result of the Fund and the issuer having the same investment adviser. Transactions during the period in which the issuer was an affiliate are as follows:
                                     
        Shares     Gross     Gross     Shares  
        December 31, 2009     Additions     Reductions     December 31, 2010  
     
    OFI Liquid Assets Fund, LLC
              1,252,854       1,252,854        
    Oppenheimer Institutional Money Market Fund, Cl. E
        23,853,396       97,238,514       95,192,085       25,899,825  
                     
        Value     Income  
     
    OFI Liquid Assets Fund, LLC
      $     $ 24 a
    Oppenheimer Institutional Money Market Fund, Cl. E
        25,899,825       41,805  
         
     
      $ 25,899,825     $ 41,829  
         
    a.   Net of compensation to the securities lending agent and rebates paid to the borrowing counterparties.
    Valuation Inputs
    Various data inputs are used in determining the value of each of the Fund’s investments as of the reporting period end. These data inputs are categorized in the following hierarchy under applicable financial accounting standards:
      1)   Level 1—unadjusted quoted prices in active markets for identical assets or liabilities (including securities actively traded on a securities exchange)
     
      2)   Level 2—inputs other than unadjusted quoted prices that are observable for the asset or liability (such as unadjusted quoted prices for similar assets and market corroborated inputs such as interest rates, prepayment speeds, credit risks, etc.)
     
      3)   Level 3—significant unobservable inputs (including the Manager’s own judgments about assumptions that market participants would use in pricing the asset or liability).


    The table below categorizes amounts that are included in the Fund’s Statement of Assets and Liabilities as of December 31, 2010 based on valuation input level:
                                     
                        Level 3—        
        Level 1—     Level 2—     Significant        
        Unadjusted     Other Significant     Unobservable        
        Quoted Prices     Observable Inputs     Inputs     Value  
         
    Assets Table
                                   
    Investments, at Value:
                                   
    Asset-Backed Securities
      $     $ 17,188,238     $     $ 17,188,238  
    Mortgage-Backed Obligations
              143,601,248             143,601,248  
    U.S. Government Obligations
              3,087,582             3,087,582  
    Corporate Bonds and Notes
              66,322,648             66,322,648  
    Investment Companies
        27,738,791                   27,738,791  
         
    Total Investments, at Value
        27,738,791       230,199,716             257,938,507  
    Other Financial Instruments:
                                   
    Futures margins
        100,654                   100,654  
         
    Total Assets
      $ 27,839,445     $ 230,199,716     $     $ 258,039,161  
         
    Liabilities Table
                                   
    Other Financial Instruments:
                                   
    Futures margins
      $ (64,245 )   $     $     $ (64,245 )
         
    Total Liabilities
      $ (64,245 )   $     $     $ (64,245 )
         
    Currency contracts and forwards, if any, are reported at their unrealized appreciation/depreciation at measurement date, which represents the change in the contract’s value from trade date. Futures, if any, are reported at their variation margin at measurement date, which represents the amount due to/from the Fund at that date. All additional assets and liabilities included in the above table are reported at their market value at measurement date.
    See the accompanying Notes for further discussion of the methods used in determining value of the Fund’s investments, and a summary of changes to the valuation methodologies, if any, during the reporting period.
    Futures Contracts as of December 31, 2010 are as follows:
                                             
                                        Unrealized  
                Number of     Expiration             Appreciation  
    Contract Description   Buy/Sell     Contracts     Date     Value     (Depreciation)  
     
    U.S. Treasury Long Bonds, 20 yr.
      Buy       82       3/22/11     $ 10,014,250     $ 57,602  
    U.S. Treasury Nts., 2 yr.
      Sell       114       3/31/11       24,955,313       (7,776 )
    U.S. Treasury Nts., 5 yr.
      Sell       11       3/31/11       1,294,906       20,181  
    U.S. Treasury Nts., 10 yr.
      Sell       60       3/22/11       7,226,250       (65,938 )
    U.S. Ultra Bonds
      Buy       5       3/22/11       635,469       10,153  


                                      $ 14,222  


    STATEMENT OF ASSETS AND LIABILITIES December 31, 2010
             
    Assets
           
    Investments, at value—see accompanying statement of investments:
           
    Unaffiliated companies (cost $229,698,928)
      $ 232,038,682  
    Affiliated companies (cost $25,899,825)
        25,899,825  


        257,938,507  
    Receivables and other assets:
           
    Investments sold (including $7,519,105 sold on a when-issued or delayed delivery basis)
        7,768,284  
    Interest, dividends and principal paydowns
        1,372,961  
    Futures margins
        100,654  
    Other
        20,983  
     
         
    Total assets
        267,201,389  
     
           
    Liabilities
           
    Payables and other liabilities:
           
    Investments purchased (including $77,615,627 purchased on a when-issued or delayed delivery basis)
        77,677,043  
    Shares of beneficial interest redeemed
        163,713  
    Futures margins
        64,245  
    Shareholder communications
        52,495  
    Distribution and service plan fees
        36,273  
    Transfer and shareholder servicing agent fees
        16,011  
    Trustees’ compensation
        15,787  
    Other
        56,419  
     
         
    Total liabilities
        78,081,986  
     
           
    Net Assets
      $ 189,119,403  


    Composition of Net Assets
           
    Par value of shares of beneficial interest
      $ 24,539  
    Additional paid-in capital
        272,678,943  
    Accumulated net investment income
        10,595,621  
    Accumulated net realized loss on investments
        (96,533,676 )
    Net unrealized appreciation on investments
        2,353,976  
     
         
    Net Assets
      $ 189,119,403  


    Net Asset Value Per Share
           
    Non-Service Shares:
           
    Net asset value, redemption price per share and offering price per share
    (based on net assets of $132,557,001 and 17,145,808 shares of beneficial interest outstanding)
      $ 7.73  
    Service Shares:
           
    Net asset value, redemption price per share and offering price per share
    (based on net assets of $56,562,402 and 7,393,102 shares of beneficial interest outstanding)
      $ 7.65  


    STATEMENT OF OPERATIONS For the Year Ended December 31, 2010
             
    Investment Income
           
    Interest (net of foreign withholding taxes of $2,319)
      $ 10,291,972  
    Dividends:
           
    Affiliated companies
        41,805  
    Unaffiliated companies
        20  
    Fee income on when-issued securities
        1,319,549  
    Income from investment of securities lending cash collateral, net—affiliated companies
        24  
     
         
    Total investment income
        11,653,370  
     
           
    Expenses
           
    Management fees
        1,161,961  
    Distribution and service plan fees—Service shares
        143,251  
    Transfer and shareholder servicing agent fees:
           
    Non-Service shares
        136,342  
    Service shares
        57,316  
    Shareholder communications:
           
    Non-Service shares
        52,362  
    Service shares
        22,192  
    Trustees’ compensation
        15,554  
    Custodian fees and expenses
        14,503  
    Administration service fees
        1,500  
    Other
        60,384  
     
         
    Total expenses
        1,665,365  
    Less waivers and reimbursements of expenses
        (158,675 )
     
         
    Net expenses
        1,506,690  
     
           
    Net Investment Income
        10,146,680  
     
           
    Realized and Unrealized Gain (Loss)
           
    Net realized gain (loss) on:
           
    Investments from unaffiliated companies
        6,542,835  
    Closing and expiration of futures contracts
        1,687,026  
    Short positions
        (90,347 )
    Swap contracts
        8,330  
     
         
    Net realized gain
        8,147,844  
    Net change in unrealized appreciation/depreciation on:
           
    Investments
        1,899,205  
    Futures contracts
        753,266  
    Swap contracts
        65,987  
     
         
    Net change in unrealized appreciation/depreciation
        2,718,458  
     
           
    Net Increase in Net Assets Resulting from Operations
      $ 21,012,982  


    STATEMENTS OF CHANGES IN NET ASSETS
                     
    Year Ended December 31,   2010     2009  
     
    Operations
                   
    Net investment income
      $ 10,146,680     $ 13,959,437  
    Net realized gain (loss)
        8,147,844       (69,315,102 )
    Net change in unrealized appreciation/depreciation
        2,718,458       69,885,948  
         
    Net increase in net assets resulting from operations
        21,012,982       14,530,283  
     
                   
    Dividends and/or Distributions to Shareholders
                   
    Dividends from net investment income:
                   
    Non-Service shares
        (2,543,053 )      
    Service shares
        (932,463 )      
         
     
        (3,475,516 )      
     
                   
    Beneficial Interest Transactions
                   
    Net decrease in net assets resulting from beneficial interest transactions:
                   
    Non-Service shares
        (17,432,675 )     (29,962,563 )
    Service shares
        (5,299,305 )     (9,685,378 )
         
     
        (22,731,980 )     (39,647,941 )
     
                   
    Net Assets
                   
    Total decrease
        (5,194,514 )     (25,117,658 )
    Beginning of period
        194,313,917       219,431,575  
         
    End of period (including accumulated net investment income of $10,595,621 and $3,511,374, respectively)
      $ 189,119,403     $ 194,313,917  


    FINANCIAL HIGHLIGHTS
                                             
    Non-Service Shares     Year Ended December 31,   2010     2009     2008     2007     2006  
     
    Per Share Operating Data
                                           
    Net asset value, beginning of period
      $ 7.07     $ 6.45     $ 11.06     $ 11.16     $ 11.19  
     
    Income (loss) from investment operations:
                                           
    Net investment income1
        .40       .48       .66       .55       .53  
    Net realized and unrealized gain (loss)
        .40       .14       (4.82 )     (.08 )     .03  
         
    Total from investment operations
        .80       .62       (4.16 )     .47       .56  
     
    Dividends and/or distributions to shareholders:
                                           
    Dividends from net investment income
        (.14 )           (.45 )     (.57 )     (.59 )
     
    Net asset value, end of period
      $ 7.73     $ 7.07     $ 6.45     $ 11.06     $ 11.16  


    Total Return, at Net Asset Value2
        11.42 %     9.61 %     (39.05 )%     4.39 %     5.28 %
     
                                           
    Ratios/Supplemental Data
                                           
    Net assets, end of period (in thousands)
      $ 132,557     $ 137,597     $ 156,339     $ 325,661     $ 367,106  
     
    Average net assets (in thousands)
      $ 136,333     $ 137,631     $ 271,355     $ 345,723     $ 391,750  
     
    Ratios to average net assets:3
                                           
    Net investment income
        5.32 %     7.40 %     6.76 %     5.07 %     4.83 %
    Total expenses4
        0.79 %     0.75 %     0.63 %     0.68 %     0.77 %
    Expenses after payments, waivers and/or reimbursements and reduction to custodian expenses
        0.70 %     0.61 %     0.62 %     0.68 %     0.77 %
     
    Portfolio turnover rate5
        98 %     143 %     51 %     89 %     114 %
    1.   Per share amounts calculated based on the average shares outstanding during the period.
     
    2.   Assumes an initial investment on the business day before the first day of the fiscal period, with all dividends and distributions reinvested in additional shares on the reinvestment date, and redemption at the net asset value calculated on the last business day of the fiscal period. Total returns are not annualized for periods less than one full year. Total return information does not reflect expenses that apply at the separate account level or to related insurance products. Inclusion of these charges would reduce the total return figures for all periods shown. Returns do not reflect the deduction of taxes that a shareholder would pay on fund distributions or the redemption of fund shares.
     
    3.   Annualized for periods less than one full year.
     
    4.   Total expenses including indirect expenses from affiliated fund were as follows:
             
    Year Ended December 31, 2010
        0.80 %
    Year Ended December 31, 2009
        0.76 %
    Year Ended December 31, 2008
        0.63 %
    Year Ended December 31, 2007
        0.68 %
    Year Ended December 31, 2006
        0.77 %
    5.   The portfolio turnover rate excludes purchase and sale transactions of To Be Announced (TBA) mortgage-related securities as follows:
                     
        Purchase Transactions     Sale Transactions  
     
    Year Ended December 31, 2010
      $ 775,240,942     $ 766,486,357  
    Year Ended December 31, 2009
      $ 977,840,247     $ 1,009,549,121  
    Year Ended December 31, 2008
      $ 1,019,711,829     $ 963,377,934  
    Year Ended December 31, 2007
      $ 662,784,931     $ 678,316,693  
    Year Ended December 31, 2006
      $ 1,168,229,255     $ 1,270,329,129  
     
                                             
    Service Shares     Year Ended December 31,   2010     2009     2008     2007     2006  
     
    Per Share Operating Data
                                           
    Net asset value, beginning of period
      $ 6.99     $ 6.41     $ 10.98     $ 11.10     $ 11.15  
     
    Income (loss) from investment operations:
                                           
    Net investment income1
        .37       .46       .63       .52       .49  
    Net realized and unrealized gain (loss)
        .41       .12       (4.77 )     (.08 )     .03  
         
    Total from investment operations
        .78       .58       (4.14 )     .44       .52  
     
    Dividends and/or distributions to shareholders:
                                           
    Dividends from net investment income
        (.12 )           (.43 )     (.56 )     (.57 )
     
    Net asset value, end of period
      $ 7.65     $ 6.99     $ 6.41     $ 10.98     $ 11.10  


    Total Return, at Net Asset Value2
        11.28 %     9.05 %     (39.07 )%     4.09 %     4.93 %
     
                                           
    Ratios/Supplemental Data
                                           
    Net assets, end of period (in thousands)
      $ 56,562     $ 56,717     $ 63,093     $ 103,542     $ 41,191  
     
    Average net assets (in thousands)
      $ 57,313     $ 52,648     $ 101,597     $ 70,116     $ 21,265  
     
    Ratios to average net assets:3
                                           
    Net investment income
        5.06 %     7.16 %     6.55 %     4.85 %     4.56 %
    Total expenses4
        1.04 %     1.01 %     0.88 %     0.92 %     1.06 %
    Expenses after payments, waivers and/or reimbursements and reduction to custodian expenses
        0.95 %     0.86 %     0.87 %     0.92 %     1.06 %
     
    Portfolio turnover rate5
        98 %     143 %     51 %     89 %     114 %
    1.   Per share amounts calculated based on the average shares outstanding during the period.
     
    2.   Assumes an initial investment on the business day before the first day of the fiscal period, with all dividends and distributions reinvested in additional shares on the reinvestment date, and redemption at the net asset value calculated on the last business day of the fiscal period. Total returns are not annualized for periods less than one full year. Total return information does not reflect expenses that apply at the separate account level or to related insurance products. Inclusion of these charges would reduce the total return figures for all periods shown. Returns do not reflect the deduction of taxes that a shareholder would pay on fund distributions or the redemption of fund shares.
     
    3.   Annualized for periods less than one full year.
     
    4.   Total expenses including indirect expenses from affiliated fund were as follows:
             
    Year Ended December 31, 2010
        1.05 %
    Year Ended December 31, 2009
        1.02 %
    Year Ended December 31, 2008
        0.88 %
    Year Ended December 31, 2007
        0.92 %
    Year Ended December 31, 2006
        1.06 %
    5.   The portfolio turnover rate excludes purchase and sale transactions of To Be Announced (TBA) mortgage-related securities as follows:
                     
        Purchase Transactions     Sale Transactions  
     
    Year Ended December 31, 2010
      $ 775,240,942     $ 766,486,357  
    Year Ended December 31, 2009
      $ 977,840,247     $ 1,009,549,121  
    Year Ended December 31, 2008
      $ 1,019,711,829     $ 963,377,934  
    Year Ended December 31, 2007
      $ 662,784,931     $ 678,316,693  
    Year Ended December 31, 2006
      $ 1,168,229,255     $ 1,270,329,129  


    NOTES TO FINANCIAL STATEMENTS
    1. Significant Accounting Policies
    Oppenheimer Core Bond Fund/VA (the “Fund”), is a separate series of Oppenheimer Variable Account Funds, an open-end management investment company registered under the Investment Company Act of 1940, as amended. The Fund’s main investment objective is to seek a high level of current income. As a secondary objective, the Fund seeks capital appreciation when consistent with its primary objective. The Fund’s investment adviser is OppenheimerFunds, Inc. (the “Manager”).
         The Fund offers two classes of shares. Both classes are sold at their offering price, which is the net asset value per share, to separate investment accounts of participating insurance companies as an underlying investment for variable life insurance policies, variable annuity contracts or other investment products. The class of shares designated as Service shares is subject to a distribution and service plan. Both classes of shares have identical rights and voting privileges with respect to the Fund in general and exclusive voting rights on matters that affect that class alone. Earnings, net assets and net asset value per share may differ due to each class having its own expenses, such as transfer and shareholder servicing agent fees and shareholder communications, directly attributable to that class.
    The following is a summary of significant accounting policies consistently followed by the Fund.
    Securities Valuation. The Fund calculates the net asset value of its shares as of the close of the New York Stock Exchange (the “Exchange”), normally 4:00 P.M. Eastern time, on each day the Exchange is open for trading.
         Each investment asset or liability of the Fund is assigned a level at measurement date based on the significance and source of the inputs to its valuation. Unadjusted quoted prices in active markets for identical securities are classified as “Level 1,” inputs other than unadjusted quoted prices for an asset that are observable are classified as “Level 2” and significant unobservable inputs, including the Manager’s judgment about the assumptions that a market participant would use in pricing an asset or liability, are classified as “Level 3.” The inputs used for valuing securities are not necessarily an indication of the risks associated with investing in those securities. A table summarizing the Fund’s investments under these levels of classification is included following the Statement of Investments.
         Securities are valued using unadjusted quoted market prices, when available, as supplied primarily by portfolio pricing services approved by the Board of Trustees or dealers.
         Securities traded on a registered U.S. securities exchange are valued based on the last sale price of the security reported on the principal exchange on which it is traded, prior to the time when the Fund’s assets are valued. Securities whose principal exchange is NASDAQ® are valued based on the official closing prices reported by NASDAQ prior to the time when the Fund’s assets are valued. In the absence of a sale, the security is valued at the last sale price on the prior trading day, if it is within the spread of the current day’s closing “bid” and “asked” prices, and if not, at the current day’s closing bid price. A foreign security traded on a foreign exchange is valued based on the last sale price on the principal exchange on which the security is traded, as identified by the portfolio pricing service used by the Manager, prior to the time when the Fund’s assets are valued. In the absence of a sale, the security is valued at the most recent official closing price on the principal exchange on which it is traded.
         Shares of a registered investment company that are not traded on an exchange are valued at that investment company’s net asset value per share.
         U.S. domestic and international debt instruments (including corporate, government, municipal, mortgage-backed, collateralized mortgage obligations and asset-backed securities) and “money market-type” debt instruments with a remaining maturity in excess of sixty days are valued at the mean between the “bid” and “asked” prices utilizing price quotations obtained from independent pricing services or broker-dealers. Such prices are typically determined based upon information obtained from market participants including reported trade data, broker-dealer price quotations and inputs such as benchmark yields and issuer spreads from identical or similar securities.
         “Money market-type” debt instruments with remaining maturities of sixty days or less are valued at cost adjusted by the amortization of discount or premium to maturity (amortized cost), which approximates market value.
         In the absence of a readily available unadjusted quoted market price, including for securities whose values have been materially affected by what the Manager identifies as a significant event occurring before the Fund’s assets are valued but after the close of the securities’ respective exchanges, the Manager, acting through its internal valuation committee, in good faith determines the fair valuation of that asset using consistently applied procedures under the supervision of the Board of Trustees (which reviews those fair valuations by the Manager). Those procedures include certain standardized methodologies to fair value securities. Such methodologies include, but are not limited to, pricing securities initially at cost and subsequently adjusting the value based on: changes in company specific fundamentals, changes in an appropriate securities index, or changes in the value of similar securities which may be adjusted for any discounts related to resale restrictions. When possible, such methodologies use observable market inputs such as unadjusted quoted prices of similar securities, observable interest rates, currency rates and yield curves. The methodologies used for valuing securities are not necessarily an indication of the risks associated with investing in those securities.
         There have been no significant changes to the fair valuation methodologies of the Fund during the period.
    Securities on a When-Issued or Delayed Delivery Basis. The Fund may purchase securities on a “when-issued” basis, and may purchase or sell securities on a “delayed delivery” basis. “When-issued” or “delayed delivery” refers to securities whose terms and indenture are available and for which a market exists, but which are not available for immediate delivery. Delivery and payment for securities that have been purchased by the Fund on a when-issued basis normally takes place within six months and possibly as long as two years or more after the trade date. During this period, such securities do not earn interest, are subject to market fluctuation and may increase or decrease in value prior to their delivery. The purchase of securities on a when-issued basis may increase the volatility of the Fund’s net asset value to the extent the Fund executes such transactions while remaining substantially fully invested. When the Fund engages in when-issued or delayed delivery transactions, it relies on the buyer or seller, as the case may be, to complete the transaction. Their failure to do so may cause the Fund to lose the opportunity to obtain or dispose of the security at a price and yield it considers advantageous. The Fund may also sell securities that it purchased on a when-issued basis or forward commitment prior to settlement of the original purchase.
    As of December 31, 2010, the Fund had purchased securities issued on a when-issued or delayed delivery basis and sold securities issued on a delayed delivery basis as follows:
             
        When-Issued or Delayed  
        Delivery Basis Transactions  
     
    Purchased securities
      $ 77,615,627  
    Sold securities
        7,519,105  
    The Fund may enter into “forward roll” transactions with respect to mortgage-related securities. In this type of transaction, the Fund sells a mortgage-related security to a buyer and simultaneously agrees to repurchase a similar security (same type, coupon and maturity) at a later date at a set price. During the period between the sale and the repurchase, the Fund will not be entitled to receive interest and principal payments on the securities that have been sold. The Fund records the incremental difference between the forward purchase and sale of each forward roll as realized gain (loss) on investments or as fee income in the case of such transactions that have an associated fee in lieu of a difference in the forward purchase and sale price.
         Forward roll transactions may be deemed to entail embedded leverage since the Fund purchases mortgage-related securities with extended settlement dates rather than paying for the securities under a normal settlement cycle. This embedded leverage increases the Fund’s market value of investments relative to its net assets which can incrementally increase the volatility of the Fund’s performance. Forward roll transactions can be replicated over multiple settlement periods.
         Risks of entering into forward roll transactions include the potential inability of the counterparty to meet the terms of the agreement; the potential of the Fund to receive inferior securities at redelivery as compared to the securities sold to the counterparty; and counterparty credit risk.

    Securities Sold Short. The Fund may short sell when-issued securities for future settlement. The value of the open short position is recorded as a liability, and the Fund records an unrealized gain or loss for the change in value of the open short position. The Fund records a realized gain or loss when the short position is closed out.
         As of December 31, 2010, the Fund had no outstanding securities sold short.
    Credit Risk. The Fund invests in high-yield, non-investment-grade bonds, which may be subject to a greater degree of credit risk. Credit risk relates to the ability of the issuer to meet interest or principal payments or both as they become due. The Fund may acquire securities in default, and is not obligated to dispose of securities whose issuers or underlying obligors subsequently default. Information concerning securities in default as of December 31, 2010 is as follows:
             
    Cost
      $ 3,281,116  
    Market Value
      $ 404,402  
    Market Value as a % of Net Assets
        0.21 %
    Investment in Oppenheimer Institutional Money Market Fund. The Fund is permitted to invest daily available cash balances in an affiliated money market fund. The Fund may invest the available cash in Class E shares of Oppenheimer Institutional Money Market Fund (“IMMF”) to seek current income while preserving liquidity. IMMF is a registered open-end management investment company, regulated as a money market fund under the Investment Company Act of 1940, as amended. The Manager is also the investment adviser of IMMF. When applicable, the Fund’s investment in IMMF is included in the Statement of Investments. Shares of IMMF are valued at their net asset value per share. As a shareholder, the Fund is subject to its proportional share of IMMF’s Class E expenses, including its management fee. The Manager will waive fees and/or reimburse Fund expenses in an amount equal to the indirect management fees incurred through the Fund’s investment in IMMF.
    Investment in OFI Liquid Assets Fund, LLC. The Fund is permitted to invest cash collateral received in connection with its securities lending activities. Pursuant to the Fund’s Securities Lending Procedures, the Fund may invest cash collateral in, among other investments, an affiliated money market fund. OFI Liquid Assets Fund, LLC (“LAF”) is a limited liability company whose investment objective is to seek current income and stability of principal. The Manager is also the investment adviser of LAF. LAF is not registered under the Investment Company Act of 1940. However, LAF does comply with the investment restrictions applicable to registered money market funds set forth in Rule 2a-7 adopted under the Investment Company Act. When applicable, the Fund’s investment in LAF is included in the Statement of Investments. Shares of LAF are valued at their net asset value per share. As a shareholder, the Fund is subject to its proportional share of LAF’s expenses, including its management fee of 0.08%.
    Foreign Currency Translation. The Fund’s accounting records are maintained in U.S. dollars. The values of securities denominated in foreign currencies and amounts related to the purchase and sale of foreign securities and foreign investment income are translated into U.S. dollars as of the close of the Exchange, normally 4:00 P.M. Eastern time, on each day the Exchange is open for trading. Foreign exchange rates may be valued primarily using a reliable bank, dealer or service authorized by the Board of Trustees.
         Reported net realized gains and losses from foreign currency transactions arise from sales of portfolio securities, sales and maturities of short-term securities, sales of foreign currencies, exchange rate fluctuations between the trade and settlement dates on securities transactions, and the difference between the amounts of dividends, interest, and foreign withholding taxes recorded on the Fund’s books and the U.S. dollar equivalent of the amounts actually received or paid. Net unrealized appreciation and depreciation on the translation of assets and liabilities denominated in foreign currencies arise from changes in the values of assets and liabilities, including investments in securities at fiscal period end, resulting from changes in exchange rates.
         The effect of changes in foreign currency exchange rates on investments is separately identified from the fluctuations arising from changes in market values of securities held and reported with all other foreign currency gains and losses in the Fund’s Statement of Operations.
    Allocation of Income, Expenses, Gains and Losses. Income, expenses (other than those attributable to a specific class), gains and losses are allocated on a daily basis to each class of shares based upon the relative proportion of net assets represented by such class. Operating expenses directly attributable to a specific class are charged against the operations of that class.
    Federal Taxes. The Fund intends to comply with provisions of the Internal Revenue Code applicable to regulated investment companies and to distribute substantially all of its investment company taxable income, including any net realized gain on investments not offset by capital loss carryforwards, if any, to shareholders. Therefore, no federal income or excise tax provision is required. The Fund files income tax returns in U.S. federal and applicable state jurisdictions. The statute of limitations on the Fund’s tax return filings generally remain open for the three preceding fiscal reporting period ends.
    The tax components of capital shown in the following table represent distribution requirements the Fund must satisfy under the income tax regulations, losses the Fund may be able to offset against income and gains realized in future years and unrealized appreciation or depreciation of securities and other investments for federal income tax purposes.
                             
                        Net Unrealized  
                        Appreciation Based on Cost  
    Undistributed   Undistributed             of Securities and Other  
    Net Investment   Long-Term     Accumulated Loss     Investments for Federal  
    Income   Gain     Carryforward1,2,3,4,5     Income Tax Purposes  
     
    $10,681,504
      $     $ 96,469,932     $ 2,277,091  
    1.   As of December 31, 2010, the Fund had $95,426,697 of net capital loss carryforwards available to offset future realized capital gains, if any, and thereby reduce future taxable gain distributions. As of December 31, 2010, details of the capital loss carryforwards were as follows:
             
    Expiring        
     
    2013
      $ 226,262  
    2014
        6,107,275  
    2015
        1,245,459  
    2016
        12,777,851  
    2017
        75,069,850  
     
         
    Total
      $ 95,426,697  
     
         
    2.   As of December 31, 2010, the Fund had $1,043,235 of post-October losses available to offset future realized capital gains, if any. Such losses, if unutilized, will expire in 2019.
     
    3.   During the fiscal year ended December 31, 2010, the Fund utilized $8,990,701 of capital loss carryforward to offset capital gains realized in that fiscal year.
     
    4.   During the fiscal year ended December 31, 2009, the Fund did not utilize any capital loss carryforward.
     
    5.   During the fiscal year ended December 31, 2010, $20,894,853 of unused capital loss carryforward expired.
    Net investment income (loss) and net realized gain (loss) may differ for financial statement and tax purposes. The character of dividends and distributions made during the fiscal year from net investment income or net realized gains may differ from their ultimate characterization for federal income tax purposes. Also, due to timing of dividends and distributions, the fiscal year in which amounts are distributed may differ from the fiscal year in which the income or net realized gain was recorded by the Fund.
    Accordingly, the following amounts have been reclassified for December 31, 2010. Net assets of the Fund were unaffected by the reclassifications.
                     
                Reduction to  
        Increase to     Accumulated Net  
    Reduction to   Accumulated Net     Realized Loss  
    Paid-in Capital   Investment Income     on Investments  
     
    $20,894,853
      $ 413,083     $ 20,481,770  
    The tax character of distributions paid during the years ended December 31, 2010 and December 31, 2009 was as follows:
                     
        Year Ended     Year Ended  
        December 31, 2010     December 31, 2009  
     
    Distributions paid from:
                   
    Ordinary income
      $ 3,475,516     $  


    The aggregate cost of securities and other investments and the composition of unrealized appreciation and depreciation of securities and other investments for federal income tax purposes as of December 31, 2010 are noted in the following table. The primary difference between book and tax appreciation or depreciation of securities and other investments, if applicable, is attributable to the tax deferral of losses or tax realization of financial statement unrealized gain or loss.
             
    Federal tax cost of securities
      $ 255,661,416  
    Federal tax cost of other investments
        (22,826,750 )
     
         
    Total federal tax cost
      $ 232,834,666  


    Gross unrealized appreciation
      $ 7,759,279  
    Gross unrealized depreciation
        (5,482,188 )
     
         
    Net unrealized appreciation
      $ 2,277,091  
     
         
    Trustees’ Compensation. The Board of Trustees has adopted a compensation deferral plan for independent trustees that enables trustees to elect to defer receipt of all or a portion of the annual compensation they are entitled to receive from the Fund. For purposes of determining the amount owed to the Trustee under the plan, deferred amounts are treated as though equal dollar amounts had been invested in shares of the Fund or in other Oppenheimer funds selected by the Trustee. The Fund purchases shares of the funds selected for deferral by the Trustee in amounts equal to his or her deemed investment, resulting in a Fund asset equal to the deferred compensation liability. Such assets are included as a component of “Other” within the asset section of the Statement of Assets and Liabilities. Deferral of trustees’ fees under the plan will not affect the net assets of the Fund, and will not materially affect the Fund’s assets, liabilities or net investment income per share. Amounts will be deferred until distributed in accordance with the compensation deferral plan.
    Dividends and Distributions to Shareholders. Dividends and distributions to shareholders, which are determined in accordance with income tax regulations and may differ from U.S. generally accepted accounting principles, are recorded on the ex-dividend date. Income and capital gain distributions, if any, are declared and paid annually or at other times as deemed necessary by the Manager.
    Investment Income. Dividend income is recorded on the ex-dividend date or upon ex-dividend notification in the case of certain foreign dividends where the ex-dividend date may have passed. Non-cash dividends included in dividend income, if any, are recorded at the fair market value of the securities received. Interest income is recognized on an accrual basis. Discount and premium, which are included in interest income on the Statement of Operations, are amortized or accreted daily.
    Custodian Fees. “Custodian fees and expenses” in the Statement of Operations may include interest expense incurred by the Fund on any cash overdrafts of its custodian account during the period. Such cash overdrafts may result from the effects of failed trades in portfolio securities and from cash outflows resulting from unanticipated shareholder redemption activity. The Fund pays interest to its custodian on such cash overdrafts, to the extent they are not offset by positive cash balances maintained by the Fund, at a rate equal to the Federal Funds Rate plus 0.50%. The “Reduction to custodian expenses” line item, if applicable, represents earnings on cash balances maintained by the Fund during the period. Such interest expense and other custodian fees may be paid with these earnings.
    Security Transactions. Security transactions are recorded on the trade date. Realized gains and losses on securities sold are determined on the basis of identified cost.
    Indemnifications. The Fund’s organizational documents provide current and former trustees and officers with a limited indemnification against liabilities arising in connection with the performance of their duties to the Fund. In the normal course of business, the Fund may also enter into contracts that provide general indemnifications. The Fund’s maximum exposure under these arrangements is unknown as this would be dependent on future claims that may be made against the Fund. The risk of material loss from such claims is considered remote.
    Other. The preparation of financial statements in conformity with accounting principles generally accepted in the United States of America requires management to make estimates and assumptions that affect the reported amounts of assets and liabilities and disclosure of contingent assets and liabilities at the date of the financial statements and the reported amounts of increases and decreases in net assets from operations during the reporting period. Actual results could differ from those estimates.
    2. Shares of Beneficial Interest
    The Fund has authorized an unlimited number of $0.001 par value shares of beneficial interest of each class. Transactions in shares of beneficial interest were as follows:
                                     
        Year Ended December 31, 2010     Year Ended December 31, 2009  
        Shares     Amount     Shares     Amount  
     
    Non-Service Shares
                                   
    Sold
        1,228,005     $ 9,215,341       1,228,549     $ 7,870,664  
    Dividends and/or distributions reinvested
        357,672       2,543,053              
    Redeemed
        (3,913,294 )     (29,191,069 )     (5,976,436 )     (37,833,227 )
         
    Net decrease
        (2,327,617 )   $ (17,432,675 )     (4,747,887 )   $ (29,962,563 )


    Service Shares
                                   
    Sold
        1,784,838     $ 13,294,523       1,841,099     $ 11,758,361  
    Dividends and/or distributions reinvested
        132,264       932,463              
    Redeemed
        (2,632,411 )     (19,526,291 )     (3,581,065 )     (21,443,739 )
         
    Net decrease
        (715,309 )   $ (5,299,305 )     (1,739,966 )   $ (9,685,378 )
         
    3. Purchases and Sales of Securities
    The aggregate cost of purchases and proceeds from sales of securities, other than short-term obligations and investments in IMMF and LAF, for the year ended December 31, 2010, were as follows:
                     
        Purchases     Sales  
     
    Investment securities
      $ 143,632,778     $ 154,349,874  
    U.S. government and government agency obligations
        6,781,932       7,419,795  
    To Be Announced (TBA) mortgage-related securities
        775,240,942       766,486,357  
    4. Fees and Other Transactions with Affiliates
    Management Fees. Under the investment advisory agreement, the Fund pays the Manager a management fee based on the daily net assets of the Fund at an annual rate as shown in the following table:
             
    Fee Schedule        
     
    Up to $1 billion
        0.60 %
    Over $1 billion
        0.50  
    Administration Service Fees. The Fund pays the Manager a fee of $1,500 per year for preparing and filing the Fund’s tax returns.
    Transfer Agent Fees. OppenheimerFunds Services (“OFS”), a division of the Manager, acts as the transfer and shareholder servicing agent for the Fund. The Fund pays OFS fees at an annual rate of 0.10% of the daily net assets of each class of shares. For the year ended December 31, 2010, the Fund paid $194,204 to OFS for services to the Fund. 

    Distribution and Service Plan for Service Shares. The Fund has adopted a Distribution and Service Plan (the “Plan”) in accordance with Rule 12b-1 under the Investment Company Act of 1940 for Service shares to pay OppenheimerFunds Distributor, Inc. (the “Distributor”), for distribution related services, personal service and account maintenance for the Fund’s Service shares. Under the Plan, payments are made periodically at an annual rate of 0.25% of the daily net assets of Service shares of the Fund. The Distributor currently uses all of those fees to compensate sponsors of the insurance product that offers Fund shares, for providing personal service and maintenance of accounts of their variable contract owners that hold Service shares. These fees are paid out of the Fund’s assets on an on-going basis and increase operating expenses of the Service shares, which results in lower performance compared to the Fund’s shares that are not subject to a service fee. Fees incurred by the Fund under the Plan are detailed in the Statement of Operations.
    Waivers and Reimbursements of Expenses. The Manager has voluntarily agreed to limit the Fund’s total annual operating expenses so that those expenses, as percentages of daily net assets, will not exceed the annual rate of 0.75% for Non-Service shares and 1.00% for Service shares. During the year ended December 31, 2010, the Manager waived fees and/or reimbursed the Fund $38,287 and $16,296 for Non-Service and Service shares, respectively.
         From April 1, 2009 through March 31, 2010, the Manager voluntarily waived the management fee by 0.18% of the Fund’s average annual net assets. This voluntary waiver was applied after all other waivers and/or reimbursements. During the year ended December 31, 2010, the Manager waived $85,957.
         The Manager will waive fees and/or reimburse Fund expenses in an amount equal to the indirect management fees incurred through the Fund’s investment in IMMF. During the year ended December 31, 2010, the Manager waived fees and/or reimbursed the Fund $18,135 for IMMF management fees.
         Some of these undertakings may be modified or terminated at any time; some may not be modified or terminated until after one year from the date of the current prospectus, as indicated therein.
    5. Risk Exposures and the Use of Derivative Instruments
    The Fund’s investment objectives not only permit the Fund to purchase investment securities, they also allow the Fund to enter into various types of derivatives contracts, including, but not limited to, futures contracts, forward foreign currency exchange contracts, credit default swaps, interest rate swaps, total return swaps, and purchased and written options. In doing so, the Fund will employ strategies in differing combinations to permit it to increase, decrease, or change the level or types of exposure to market risk factors. Central to those strategies are features inherent to derivatives that make them more attractive for this purpose than equity and debt securities: they require little or no initial cash investment, they can focus exposure on only certain selected risk factors, and they may not require the ultimate receipt or delivery of the underlying security (or securities) to the contract. This may allow the Fund to pursue its objectives more quickly and efficiently than if it were to make direct purchases or sales of securities capable of effecting a similar response to market factors.
    Market Risk Factors. In accordance with its investment objectives, the Fund may use derivatives to increase or decrease its exposure to one or more of the following market risk factors:
    Commodity Risk. Commodity risk relates to the change in value of commodities or commodity indexes as they relate to increases or decreases in the commodities market. Commodities are physical assets that have tangible properties. Examples of these types of assets are crude oil, heating oil, metals, livestock, and agricultural products.
    Credit Risk. Credit risk relates to the ability of the issuer to meet interest and principal payments, or both, as they come due. In general, lower-grade, higher-yield bonds are subject to credit risk to a greater extent than lower-yield, higher-quality bonds.
    Equity Risk. Equity risk relates to the change in value of equity securities as they relate to increases or decreases in the general market.
    Foreign Exchange Rate Risk. Foreign exchange rate risk relates to the change in the U.S. dollar value of a security held that is denominated in a foreign currency. The U.S. dollar value of a foreign currency denominated security will decrease as the dollar appreciates against the currency, while the U.S. dollar value will increase as the dollar depreciates against the currency.
    Interest Rate Risk. Interest rate risk refers to the fluctuations in value of fixed-income securities resulting from the inverse relationship between price and yield. For example, an increase in general interest rates will tend to reduce the market value of already issued fixed-income investments, and a decline in general interest rates will tend to increase their value. In addition, debt securities with longer maturities, which tend to have higher yields, are subject to potentially greater fluctuations in value from changes in interest rates than obligations with shorter maturities.
    Volatility Risk. Volatility risk refers to the magnitude of the movement, but not the direction of the movement, in a financial instrument’s price over a defined time period. Large increases or decreases in a financial instrument’s price over a relative time period typically indicate greater volatility risk, while small increases or decreases in its price typically indicate lower volatility risk.
    The Fund’s actual exposures to these market risk factors during the period are discussed in further detail, by derivative type, below.
    Risks of Investing in Derivatives. The Fund’s use of derivatives can result in losses due to unanticipated changes in the market risk factors and the overall market. In instances where the Fund is using derivatives to decrease, or hedge, exposures to market risk factors for securities held by the Fund, there are also risks that those derivatives may not perform as expected resulting in losses for the combined or hedged positions.
         Derivatives may have little or no initial cash investment relative to their market value exposure and therefore can produce significant gains or losses in excess of their cost. This use of embedded leverage allows the Fund to increase its market value exposure relative to its net assets and can substantially increase the volatility of the Fund’s performance.
         Additional associated risks from investing in derivatives also exist and potentially could have significant effects on the valuation of the derivative and the Fund. Typically, the associated risks are not the risks that the Fund is attempting to increase or decrease exposure to, per its investment objectives, but are the additional risks from investing in derivatives. Examples of these associated risks are liquidity risk, which is the risk that the Fund will not be able to sell the derivative in the open market in a timely manner, and counterparty credit risk, which is the risk that the counterparty will not fulfill its obligation to the Fund. Associated risks can be different for each type of derivative and are discussed by each derivative type in the notes that follow.
    Counterparty Credit Risk. Certain derivative positions are subject to counterparty credit risk, which is the risk that the counterparty will not fulfill its obligation to the Fund. The Fund’s derivative counterparties are financial institutions who are subject to market conditions that may weaken their financial position. The Fund intends to enter into financial transactions with counterparties that the Manager believes to be creditworthy at the time of the transaction.
    Credit Related Contingent Features. The Fund’s agreements with derivative counterparties have several credit related contingent features that if triggered would allow its derivatives counterparties to close out and demand payment or additional collateral to cover their exposure from the Fund. Credit related contingent features are established between the Fund and its derivatives counterparties to reduce the risk that the Fund will not fulfill its payment obligations to its counterparties. These triggering features include, but are not limited to, a percentage decrease in the Fund’s net assets and or a percentage decrease in the Fund’s Net Asset Value or NAV. The contingent features are established within the Fund’s International Swap and Derivatives Association, Inc. master agreements which govern certain positions in swaps, over-the-counter options and swaptions, and forward currency exchange contracts for each individual counterparty. 

    Valuations of derivative instruments as of December 31, 2010 are as follows:
                                     
        Asset Derivatives     Liability Derivatives  
        Statement             Statement        
    Derivatives Not   of Assets             of Assets        
    Accounted for as   and Liabilities             and Liabilities        
    Hedging Instruments   Location     Value     Location     Value  
     
    Interest rate contracts
      Futures margins     $ 100,654 *   Futures margins     $ 64,245 *
    *   Includes only the current day’s variation margin. Prior variation margin movements have been reflected in cash on the Statement of Assets and Liabilities upon receipt or payment.
    The effect of derivative instruments on the Statement of Operations is as follows:
                             
    Amount of Realized Gain or (Loss) Recognized on Derivatives  
    Derivatives Not   Closing and              
    Accounted for as   expiration of              
    Hedging Instruments   futures contracts     Swap contracts     Total  
     
    Credit contracts
      $     $ 8,330     $ 8,330  
    Interest rate contracts
        1,687,026             1,687,026  
         
    Total
      $ 1,687,026     $ 8,330     $ 1,695,356  
         
                             
    Amount of Change in Unrealized Gain or (Loss) Recognized on Derivatives  
    Derivatives Not                  
    Accounted for as                  
    Hedging Instruments   Futures contracts     Swap contracts     Total  
     
    Credit contracts
      $     $ 65,987     $ 65,987  
    Interest rate contracts
        753,266             753,266  
         
    Total
      $ 753,266     $ 65,987     $ 819,253  
         
    Futures Contracts
    A futures contract is a commitment to buy or sell a specific amount of a financial instrument at a negotiated price on a stipulated future date. The Fund may buy and sell futures contracts and may also buy or write put or call options on these futures contracts.
         Futures contracts traded on a commodities or futures exchange will be valued at the final settlement price or official closing price on the principal exchange as reported by such principal exchange at its trading session ending at, or most recently prior to, the time when the Fund’s assets are valued.
         Upon entering into a futures contract, the Fund is required to deposit either cash or securities (initial margin) in an amount equal to a certain percentage of the contract value. Subsequent payments (variation margin) are made or received by the Fund each day. The variation margin payments are equal to the daily changes in the contract value and are recorded as unrealized gains and losses.
         Futures contracts are reported on a schedule following the Statement of Investments. Securities held in collateralized accounts to cover initial margin requirements on open futures contracts are noted in the Statement of Investments. Cash held by the broker to cover initial margin requirements on open futures contracts and the receivable and/or payable for the daily mark to market for the variation margin are noted in the Statement of Assets and Liabilities. The net change in unrealized appreciation and depreciation is reported in the Statement of Operations. Realized gains (losses) are reported in the Statement of Operations at the closing or expiration of futures contracts.
         The Fund has purchased futures contracts on various bonds and notes to increase exposure to interest rate risk.
    The Fund has sold futures contracts on various bonds and notes to decrease exposure to interest rate risk.
         During the year ended December 31, 2010, the Fund had an average market value of $25,954,050 and $25,073,744 on futures contracts purchased and sold, respectively.
         Additional associated risks of entering into futures contracts (and related options) include the possibility that there may be an illiquid market where the Fund is unable to liquidate the contract or enter into an offsetting position and, if used for hedging purposes, the risk that the price of the contract will correlate imperfectly with the prices of the Fund’s securities.
    Swap Contracts
    The Fund may enter into swap contract agreements with a counterparty to exchange a series of cash flows based on either specified reference rates, or the occurrence of a credit event, over a specified period. Such contracts may include interest rate, equity, debt, index, total return, credit and currency swaps.
         Swaps are marked to market daily using primarily quotations from pricing services, counterparties and brokers. Swap contracts are reported on a schedule following the Statement of Investments. The values of swap contracts are aggregated by positive and negative values and disclosed separately on the Statement of Assets and Liabilities by contracts in unrealized appreciation and depreciation positions. Upfront payments paid or received, if any, affect the value of the respective swap. Therefore, to determine the unrealized appreciation (depreciation) on swaps, upfront payments paid should be subtracted from, while upfront payments received should be added to, the value of contracts reported as an asset on the Statement of Assets and Liabilities. Conversely, upfront payments paid should be added to, while upfront payments received should be subtracted from the value of contracts reported as a liability. The unrealized appreciation (depreciation) related to the change in the valuation of the notional amount of the swap is combined with the accrued interest due to (owed by) the Fund at termination or settlement. The net change in this amount during the period is included on the Statement of Operations. The Fund also records any periodic payments received from (paid to) the counterparty, including at termination, under such contracts as realized gain (loss) on the Statement of Operations.
         Swap contract agreements are exposed to the market risk factor of the specific underlying reference asset. Swap contracts are typically more attractively priced compared to similar investments in related cash securities because they isolate the risk to one market risk factor and eliminate the other market risk factors. Investments in cash securities (for instance bonds) have exposure to multiple risk factors (credit and interest rate risk). Because swaps require little or no initial cash investment, they can expose the Fund to substantial risk in the isolated market risk factor.
    Credit Default Swap Contracts. A credit default swap is a bilateral contract that enables an investor to buy or sell protection on a debt security against a defined-issuer credit event, such as the issuer’s failure to make timely payments of interest or principal on the debt security, bankruptcy or restructuring. The Fund may enter into credit default swaps either by buying or selling protection on a single security or a basket of securities (the “reference asset”).
         The buyer of protection pays a periodic fee to the seller of protection based on the notional amount of debt securities underlying the swap contract. The seller of protection agrees to compensate the buyer of protection for future potential losses as a result of a credit event on the reference asset. The contract effectively transfers the credit event risk of the reference asset from the buyer of protection to the seller of protection.
         The ongoing value of the contract will fluctuate throughout the term of the contract based primarily on the credit risk of the reference asset. If the credit quality of the reference asset improves relative to the credit quality at contract initiation, the buyer of protection may have an unrealized loss greater than the anticipated periodic fee owed. This unrealized loss would be the result of current credit protection being cheaper than the cost of credit protection at contract initiation. If the buyer elects to terminate the contract prior to its maturity, and there has been no credit event, this unrealized loss will become realized. If the contract is held to maturity, and there has been no credit event, the realized loss will be equal to the periodic fee paid over the life of the contract. 

         If there is a credit event, the buyer of protection can exercise its rights under the contract and receive a payment from the seller of protection equal to the notional amount of the reference asset less the market value of the reference asset. Upon exercise of the contract the difference between the value of the underlying reference asset and the notional amount is recorded as realized gain (loss) and is included on the Statement of Operations.
         The Fund has engaged in pairs trades by purchasing protection through a credit default swap referenced to the debt of an issuer, and simultaneously selling protection through a credit default swap referenced to the debt of a different issuer with the intent to realize gains from the pricing differences of the two issuers who are expected to have similar market risks. Pairs trades attempt to gain exposure to credit risk while hedging or offsetting the effects of overall market movements.
         For the year ended December 31, 2010, the Fund had average notional amounts of $1,415,769 and $1,415,769 on credit default swaps to buy protection and credit default swaps to sell protection, respectively.
         Additional associated risks to the Fund include counterparty credit risk and liquidity risk.
         As of December 31, 2010, the Fund had no such credit default swaps outstanding.
    6. Restricted Securities
    As of December 31, 2010, investments in securities included issues that are restricted. A restricted security may have a contractual restriction on its resale and is valued under methods approved by the Board of Trustees as reflecting fair value. Securities that are restricted are marked with an applicable footnote on the Statement of Investments. Restricted securities are reported on a schedule following the Statement of Investments.
    7. Securities Lending
    The Fund lends portfolio securities from time to time in order to earn additional income in the form of fees or interest on securities received as collateral or the investment of any cash received as collateral. The loans are secured by collateral (either securities, letters of credit, or cash) in an amount not less than 100% of the market value of the loaned securities during the period of the loan. The market value of the loaned securities is determined at the close of each business day and any additional required collateral is delivered to the Fund on the next business day. If the borrower defaults on its obligation to return the securities loaned because of insolvency or other reasons, the Fund could experience delays and cost in recovering the securities loaned or in gaining access to the collateral. The Fund continues to receive the economic benefit of interest or dividends paid on the securities loaned in the form of a substitute payment received from the borrower and recognizes the gain or loss in the fair value of the securities loaned that may occur during the term of the loan. The Fund has the right under the lending agreement to recover the securities from the borrower on demand.
         As of December 31, 2010, the Fund had no securities on loan.
    8. Pending Litigation
    Since 2009, a number of lawsuits have been pending in federal courts against the Manager, the Distributor, and certain mutual funds (“Defendant Funds”) advised by the Manager and distributed by the Distributor (but not including the Fund). The lawsuits naming the Defendant Funds also name as defendants certain officers and current and former trustees of the respective Defendant Funds. The plaintiffs seek class action status on behalf of purchasers of shares of the respective Defendant Fund during a particular time period. The lawsuits raise claims under federal securities laws alleging that, among other things, the disclosure documents of the respective Defendant Fund contained misrepresentations and omissions, that such Defendant Fund’s investment policies were not followed, and that such Defendant Fund and the other defendants violated federal securities laws and regulations. The plaintiffs seek unspecified damages, equitable relief and an award of attorneys’ fees and litigation expenses.
         In 2009, what are claimed to be derivative lawsuits were filed in state court against the Manager and a subsidiary (but not against the Fund), on behalf of the New Mexico Education Plan Trust. These lawsuits allege breach of contract, breach of fiduciary duty, negligence and violation of state securities laws, and seek compensatory damages, equitable relief and an award of attorneys’ fees and litigation expenses.
         Other lawsuits have been filed since 2008 in various state and federal courts, against the Manager and certain of its affiliates. Those lawsuits were filed by investors who made investments through an affiliate of the Manager, and relate to the alleged investment fraud perpetrated by Bernard Madoff and his firm (“Madoff”). Those suits allege a variety of claims, including breach of fiduciary duty, fraud, negligent misrepresentation, unjust enrichment, and violation of federal and state securities laws and regulations, among others. They seek unspecified damages, equitable relief and an award of attorneys’ fees and litigation expenses. None of the suits have named the Distributor, any of the Oppenheimer mutual funds or any of their independent Trustees or Directors as defendants. None of the Oppenheimer funds invested in any funds or accounts managed by Madoff.
         The Manager believes that the lawsuits described above are without legal merit and is defending against them vigorously. The Defendant Funds’ Boards of Trustees have also engaged counsel to defend the suits brought against those Funds and the present and former Independent Trustees named in those suits. While it is premature to render any opinion as to the outcome in these lawsuits, or whether any costs that the Defendant Funds may bear in defending the suits might not be reimbursed by insurance, the Manager believes that these suits should not impair the ability of the Manager or the Distributor to perform their respective duties to the Fund, and that the outcome of all of the suits together should not have any material effect on the operations of any of the Oppenheimer funds.
    9. Subsequent Event
    The Regulated Investment Company Modernization Act of 2010 (the “Act”) was signed into law on December 22, 2010. The Act makes changes to a number of tax rules impacting the Fund. Under the Act, future capital losses generated by a fund may be carried over indefinitely, but these losses must be used prior to the utilization of any pre-enactment capital losses. Since pre-enactment capital losses may only be carried forward for eight years, there may be a greater likelihood that all or a portion of a fund’s pre-enactment capital losses will expire unused. In general, the provisions of the Act will be effective for the Fund’s fiscal year ending December 31, 2011. Specific information regarding the impact of the Act on the Fund will be contained within the “Federal Taxes” section of the financial statement notes for the fiscal year ending December 31, 2011.


    REPORT OF INDEPENDENT REGISTERED PUBLIC ACCOUNTING FIRM
    The Board of Trustees and Shareholders of Oppenheimer Variable Account Funds:
    We have audited the accompanying statement of assets and liabilities of Oppenheimer Global Securities Fund/VA (one of the portfolios constituting the Oppenheimer Variable Account Funds), including the statement of investments, as of December 31, 2010, the related statement of operations for the year then ended, and the statements of changes in net assets and the financial highlights for each of the years in the two-year period then ended. These financial statements and financial highlights are the responsibility of the Fund’s management. Our responsibility is to express an opinion on these financial statements and financial highlights based on our audits. The accompanying financial highlights of Oppenheimer Global Securities Fund/VA for the years ended prior to January 1, 2009 were audited by other auditors whose report dated February 11, 2009 expressed an unqualified opinion on those financial highlights.
         We conducted our audits in accordance with the standards of the Public Company Accounting Oversight Board (United States). Those standards require that we plan and perform the audit to obtain reasonable assurance about whether the financial statements and financial highlights are free of material misstatement. An audit includes examining, on a test basis, evidence supporting the amounts and disclosures in the financial statements. Our procedures included confirmation of securities owned as of December 31, 2010, by correspondence with the custodian and transfer agent. An audit also includes assessing the accounting principles used and significant estimates made by management, as well as evaluating the overall financial statement presentation. We believe that our audits provide a reasonable basis for our opinion.
         In our opinion, the financial statements and financial highlights referred to above present fairly, in all material respects, the financial position of Oppenheimer Global Securities Fund/VA as of December 31, 2010, the results of its operations for the year then ended, and the changes in its net assets and the financial highlights for each of the years in the two-year period then ended, in conformity with U.S. generally accepted accounting principles.
    /s/ KPMG llp
    Denver, Colorado
    February 16, 2011


    STATEMENT OF INVESTMENTS December 31, 2010
                     
        Shares     Value  
     
    Common Stocks—98.7%
                   
    Consumer Discretionary—17.3%
                   
    Automobiles—1.5%
                   
    Bayerische Motoren Werke (BMW) AG
        75,529     $ 5,925,604  
    Bayerische Motoren Werke (BMW) AG, Preference
        705,262       36,336,077  


                42,261,681  
     
                   
    Diversified Consumer Services—0.0%
                   
    Zee Learn Ltd.
        492,103       302,646  
    Hotels, Restaurants & Leisure—3.8%
                   
    Carnival Corp.
        1,090,646       50,289,687  
    Lottomatica SpA
        417,500       5,174,605  
    McDonald’s Corp.
        567,920       43,593,539  
    Shuffle Master, Inc.1
        616,100       7,054,345  


                106,112,176  
     
                   
    Household Durables—1.6%
                   
    Sony Corp.
        1,288,800       46,462,835  
    Media—3.7%
                   
    Grupo Televisa SA, Sponsored GDR1
        1,358,076       35,214,911  
    McGraw-Hill Cos., Inc. (The)
        278,970       10,157,298  
    Walt Disney Co. (The)
        1,179,900       44,258,049  
    Wire & Wireless India Ltd.1
        2,281,600       622,510  
    Zee Entertainment Enterprises Ltd.
        3,936,820       12,964,257  


                103,217,025  
     
                   
    Specialty Retail—3.2%
                   
    Industria de Diseno Textil SA
        481,087       36,020,612  
    Tiffany & Co.
        843,600       52,530,972  


                88,551,584  
     
                   
    Textiles, Apparel & Luxury Goods—3.5%
                   
    Bulgari SpA
        1,732,778       18,721,032  
    LVMH Moet Hennessy Louis Vuitton SA
        319,840       52,613,558  
    Tod’s SpA
        269,399       26,604,020  


                97,938,610  
     
                   
    Consumer Staples—8.3%
                   
    Beverages—3.2%
                   
    Companhia de Bebidas das Americas, Sponsored ADR, Preference
        930,575       28,875,742  
    Fomento Economico Mexicano SA de CV, UBD
        6,736,224       37,662,856  
    Grupo Modelo SA de CV, Series C
        3,411,977       21,203,987  


                87,742,585  
     
                   
    Food & Staples Retailing—1.4%
                   
    Shinsegae Department Store Co.
        10,507       5,684,464  
    Wal-Mart Stores, Inc.
        624,870       33,699,239  


                39,383,703  
     
                   
    Food Products—2.3%
                   
    Nestle SA
        525,225       30,755,154  
    Unilever plc
        1,126,403       34,473,481  


                65,228,635  
    Household Products—1.4%
                   
    Colgate-Palmolive Co.
        478,210       38,433,738  
    Energy—3.7%
                   
    Energy Equipment & Services—2.6%
                   
    Technip SA
        412,260       38,067,652  
    Transocean Ltd.1
        477,252       33,173,787  


                71,241,439  
     
                   
    Oil, Gas & Consumable Fuels—1.1%
                   
    Total SA
        585,890       31,043,174  
    Financials—16.3%
                   
    Capital Markets—4.9%
                   
    3i Group plc
        2,576,148       13,194,023  
    Credit Suisse Group AG
        1,473,595       59,369,330  
    Goldman Sachs Group, Inc. (The)
        179,390       30,166,222  
    UBS AG1
        2,085,366       34,235,688  


                136,965,263  
     
                   
    Commercial Banks—3.7%
                   
    Banco Bilbao Vizcaya Argentaria SA
        2,721,385       27,492,778  
    HSBC Holdings plc
        3,566,173       36,566,487  
    Societe Generale SA, Cl. A
        320,542       17,227,960  
    Sumitomo Mitsui Financial Group, Inc.
        653,300       23,270,644  


                104,557,869  
     
                   
    Consumer Finance—0.7%
                   
    SLM Corp.1
        1,477,640       18,603,488  
    Diversified Financial Services—1.1%
                   
    Investor AB, B Shares
        1,419,138       30,363,453  
    Insurance—5.9%
                   
    AFLAC, Inc.
        479,390       27,051,978  
    Allianz SE
        305,932       36,368,595  
    Dai-ichi Life Insurance Co.
        20,806       33,801,101  
    Fidelity National Financial, Inc., Cl. A
        942,400       12,892,032  
    Prudential plc
        2,843,067       29,609,741  
    XL Group plc
        1,204,570       26,283,717  


                166,007,164  
     
                   
    Health Care—7.1%
                   
    Biotechnology—1.8%
                   
    Amylin Pharmaceuticals, Inc.1
        1,095,038       16,108,009  
    Basilea Pharmaceutica AG1
        19,039       1,323,567  
    Dendreon Corp.1
        207,690       7,252,535  
    Gilead Sciences, Inc.1
        240,500       8,715,720  
    Regeneron Pharmaceuticals, Inc.1
        96,552       3,169,802  
    Theravance, Inc.1
        569,100       14,267,337  


                50,836,970  

                     
        Shares     Value  
     
    Health Care Equipment & Supplies—1.0%
                   
    Zimmer Holdings, Inc.1
        537,690     $ 28,863,199  
    Health Care Providers & Services—2.3%
                   
    Aetna, Inc.
        1,013,500       30,921,885  
    WellPoint, Inc.1
        598,535       34,032,700  


                64,954,585  
     
                   
    Pharmaceuticals—2.0%
                   
    Bayer AG
        355,486       26,150,902  
    Mitsubishi Tanabe Pharma Corp.
        799,000       13,492,167  
    Roche Holding AG
        103,595       15,179,160  


                54,822,229  
     
                   
    Industrials—14.1%
                   
    Aerospace & Defense—2.9%
                   
    Embraer SA, ADR
        886,753       26,070,538  
    European Aeronautic Defense & Space Co.1
        1,386,180       32,305,239  
    Lockheed Martin Corp.
        163,960       11,462,444  
    Raytheon Co.
        256,560       11,888,990  


                81,727,211  
     
                   
    Air Freight & Logistics—0.7%
                   
    TNT NV
        739,827       19,525,588  
    Building Products—1.6%
                   
    Assa Abloy AB, Cl. B
        1,580,496       44,531,605  
    Commercial Services & Supplies—0.7%
                   
    Secom Co. Ltd.
        403,900       19,127,916  
    Electrical Equipment—2.0%
                   
    Emerson Electric Co.
        443,340       25,345,748  
    Nidec Corp.
        173,900       17,584,912  
    Prysmian SpA
        679,000       11,568,760  


                54,499,420  
     
                   
    Industrial Conglomerates—5.5%
                   
    3M Co.
        428,790       37,004,577  
    Koninklijke Philips Electronics NV
        1,160,800       35,553,213  
    Siemens AG
        663,147       82,564,385  


                155,122,175  
     
                   
    Machinery—0.7%
                   
    Fanuc Ltd.
        130,300       20,012,822  
    Information Technology—28.1%
                   
    Communications Equipment—6.1%
                   
    Juniper Networks, Inc.1
        1,583,440       58,460,605  
    Telefonaktiebolaget LM Ericsson, B Shares
        9,698,309       112,303,619  


                170,764,224  
     
                   
    Electronic Equipment & Instruments—4.7%
                   
    Corning, Inc.
        1,383,320       26,725,742  
    Hoya Corp.
        1,035,000       25,138,810  
    Keyence Corp.
        95,274       27,600,006  
    Kyocera Corp.
        161,800       16,520,778  
    Murata Manufacturing Co. Ltd.
        529,800       37,129,720  


                133,115,056  
     
                   
    Internet Software & Services—2.5%
                   
    eBay, Inc.1
        2,500,090       69,577,505  
    IT Services—2.7%
                   
    Automatic Data Processing, Inc.
        571,840       26,464,755  
    Infosys Technologies Ltd.
        630,108       48,514,018  


                74,978,773  
     
                   
    Semiconductors & Semiconductor Equipment—5.1%
                   
    Altera Corp.
        1,528,710       54,391,502  
    Maxim Integrated Products, Inc.
        1,415,335       33,430,213  
    MediaTek, Inc.
        1,531,891       21,858,907  
    Taiwan Semiconductor Manufacturing Co. Ltd.
        13,575,184       33,057,399  


                142,738,021  
     
                   
    Software—7.0%
                   
    Adobe Systems, Inc.1
        1,074,443       33,071,356  
    Intuit, Inc.1
        1,038,730       51,209,389  
    Microsoft Corp.
        1,699,710       47,455,903  
    Nintendo Co. Ltd.
        60,600       17,786,649  
    SAP AG
        912,028       46,221,135  


                195,744,432  
     
                   
    Materials—0.7%
                   
    Chemicals—0.7%
                   
    Linde AG
        120,238       18,333,029  
    Telecommunication Services—2.2%
                   
    Wireless Telecommunication Services—2.2%
                   
    America Movil SAB de CV, ADR, Series L
        121,380       6,959,929  
    KDDI Corp.
        4,772       27,565,809  
    Vodafone Group plc
        10,676,562       27,798,495  


                62,324,233  
     
                   
    Utilities—0.9%
                   
    Electric Utilities—0.9%
                   
    Fortum OYJ
        786,400       23,857,723  


    Total Common Stocks
    (Cost $2,072,185,389)
                2,759,873,784  
     
                     
        Shares     Value  
     
    Investment Companies—1.2%
                   
    JPMorgan U.S. Treasury Plus Money Market Fund, Agency Shares, 0.00%2,3
        720,713     $ 720,713  
    Oppenheimer Institutional Money Market Fund, Cl. E, 0.21%2,4
        32,313,050       32,313,050  
     
                 
    Total Investment Companies
    (Cost $33,033,763)
                33,033,763  
     
    Total Investments, at Value
    (Cost $2,105,219,152)
        99.9 %   $ 2,792,907,547  
    Other Assets
                   
    Net of Liabilities
        0.1       3,927,591  
         
    Net Assets
        100.0 %   $ 2,796,835,138  
         
    Footnotes to Statement of Investments
     
    1.   Non-income producing security.
     
    2.   Rate shown is the 7-day yield as of December 31, 2010.
     
    3.   Interest rate is less than 0.0005%.
     
    4.   Is or was an affiliate, as defined in the Investment Company Act of 1940, at or during the period ended December 31, 2010, by virtue of the Fund owning at least 5% of the voting securities of the issuer or as a result of the Fund and the issuer having the same investment adviser. Transactions during the period in which the issuer was an affiliate are as follows:
                                     
        Shares     Gross     Gross     Shares  
        December 31, 2009     Additions     Reductions     December 31, 2010  
     
    Oppenheimer Institutional Money Market Fund, Cl. E
        30,907,869       307,699,375       306,294,194       32,313,050  
                      
        Value     Income  
     
    Oppenheimer Institutional Money Market Fund, Cl. E
      $ 32,313,050     $ 71,454  
    Valuation Inputs
    Various data inputs are used in determining the value of each of the Fund’s investments as of the reporting period end. These data inputs are categorized in the following hierarchy under applicable financial accounting standards:
      1)   Level 1 — unadjusted quoted prices in active markets for identical assets or liabilities (including securities actively traded on a securities exchange)
     
      2)   Level 2 — inputs other than unadjusted quoted prices that are observable for the asset or liability (such as unadjusted quoted prices for similar assets and market corroborated inputs such as interest rates, prepayment speeds, credit risks, etc.)
     
      3)   Level 3 — significant unobservable inputs (including the Manager’s own judgments about assumptions that market participants would use in pricing the asset or liability).
    The table below categorizes amounts that are included in the Fund’s Statement of Assets and Liabilities as of December 31, 2010 based on valuation input level:
                                     
                        Level 3–        
        Level 1–     Level 2–     Significant        
        Unadjusted     Other Significant     Unobservable        
        Quoted Prices     Observable Inputs     Inputs     Value  
     
    Assets Table
                                   
    Investments, at Value:
                                   
    Common Stocks
                                   
    Consumer Discretionary
      $ 484,846,557     $     $     $ 484,846,557  
    Consumer Staples
        230,788,661                   230,788,661  
    Energy
        102,284,613                   102,284,613  
    Financials
        456,497,237                   456,497,237  
    Health Care
        199,476,983                   199,476,983  
    Industrials
        394,546,737                   394,546,737  
    Information Technology
        652,755,485       134,162,526             786,918,011  
    Materials
        18,333,029                   18,333,029  
    Telecommunication Services
        34,525,738       27,798,495             62,324,233  
    Utilities
              23,857,723             23,857,723  
    Investment Companies
        33,033,763                   33,033,763  
         
    Total Assets
      $ 2,607,088,803     $ 185,818,744     $     $ 2,792,907,547  


    Liabilities Table
                                   
    Other Financial Instruments:
                                   
    Foreign currency exchange contracts
      $     $ (2,260 )   $     $ (2,260 )
         
    Total Liabilities
      $     $ (2,260 )   $     $ (2,260 )
         

    Currency contracts and forwards, if any, are reported at their unrealized appreciation/depreciation at measurement date, which represents the change in the contract’s value from trade date. Futures, if any, are reported at their variation margin at measurement date, which represents the amount due to/from the Fund at that date. All additional assets and liabilities included in the above table are reported at their market value at measurement date.
    The table below shows the significant transfers between Level 1 and Level 2. The Fund’s policy is to recognize transfers in and transfers out as of the beginning of the reporting period.
                                     
        Transfers into     Transfers out     Transfers into     Transfers out  
        Level 1*     of Level 1**     Level 2**     of Level 2*  
     
    Assets Table
                                   
    Investments, at Value:
                                   
    Common Stocks
                                   
    Consumer Discretionary
      $ 107,682,363     $     $     $ (107,682,363 )
    Consumer Staples
        28,024,056                   (28,024,056 )
    Energy
        75,498,991                   (75,498,991 )
    Financials
        273,414,697                   (273,414,697 )
    Health Care
        13,379,033                   (13,379,033 )
    Industrials
        190,599,385                   (190,599,385 )
    Information Technology
        163,218,218       (99,532,566 )     99,532,566       (163,218,218 )
    Telecommunication Services
        28,924,502       (24,532,360 )     24,532,360       (28,924,502 )
         
    Total Assets
      $ 880,741,245     $ (124,064,926 )   $ 124,064,926     $ (880,741,245 )
         
    *   Transferred from Level 2 to Level 1 due to the presence of a readily available unadjusted quoted market price. As of the prior reporting period end, these securities were absent of a readily available unadjusted quoted market price due to a significant event occuring before the Fund’s assets were valued but after the close of the securities’ respective exchanges.
     
    **   Transferred from Level 1 to Level 2 because of the absence of a readily available unadjusted quoted market price due to a significant event occurring before the Fund’s assets were valued but after the close of the securities’ respective exchanges.
    See the accompanying Notes for further discussion of the methods used in determining value of the Fund’s investments, and a summary of changes to the valuation methodologies, if any, during the reporting period.
    Distribution of investments representing geographic holdings, as a percentage of total investments at value, is as follows:
                     
    Geographic Holdings   Value     Percent  
     
    United States
      $ 1,064,758,053       38.1 %
    Japan
        325,494,169       11.7  
    Germany
        251,899,727       9.0  
    Sweden
        187,198,677       6.7  
    France
        171,257,583       6.1  
    United Kingdom
        141,642,227       5.1  
    Switzerland
        140,862,899       5.0  
    Mexico
        101,041,683       3.6  
    Spain
        63,513,390       2.3  
    India
        62,403,431       2.2  
    Italy
        62,068,417       2.2  
    The Netherlands
        55,078,801       2.0  
    Brazil
        54,946,280       2.0  
    Taiwan
        54,916,306       2.0  
    Ireland
        26,283,717       0.9  
    Finland
        23,857,723       0.9  
    Korea, Republic of South
        5,684,464       0.2  
         
    Total
      $ 2,792,907,547       100.0 %
         
    Foreign Currency Exchange Contracts as of December 31, 2010 are as follows:
                                             
                Contract Amount     Expiration             Unrealized  
    Counterparty/Contract Description   Buy/Sell     (000’s)     Date     Value     Depreciation  
     
    Brown Brothers Harriman
                                           
    Swedish Krona (SEK)
      Sell     4,788  SEK     1/5/11     $ 711,836     $ 2,260  


    STATEMENT OF ASSETS AND LIABILITIES December 31, 2010
             
    Assets
           
    Investments, at value—see accompanying statement of investments:
           
    Unaffiliated companies (cost $2,072,906,102)
      $ 2,760,594,497  
    Affiliated companies (cost $32,313,050)
        32,313,050  


        2,792,907,547  
    Receivables and other assets:
           
    Interest and dividends
        3,493,590  
    Investments sold
        3,477,867  
    Other
        227,093  
     
         
    Total assets
        2,800,106,097  
     
           
    Liabilities
           
    Unrealized depreciation on foreign currency exchange contracts
        2,260  
    Payables and other liabilities:
           
    Shares of beneficial interest redeemed
        1,821,252  
    Distribution and service plan fees
        711,545  
    Shareholder communications
        286,508  
    Transfer and shareholder servicing agent fees
        235,897  
    Trustees’ compensation
        50,727  
    Legal, auditing and other professional fees
        36,375  
    Other
        126,395  
     
         
    Total liabilities
        3,270,959  
     
           
    Net Assets
      $ 2,796,835,138  


    Composition of Net Assets
           
    Par value of shares of beneficial interest
      $ 92,604  
    Additional paid-in capital
        2,133,608,934  
    Accumulated net investment income
        23,680,132  
    Accumulated net realized loss on investments and foreign currency transactions
        (48,567,034 )
    Net unrealized appreciation on investments and translation of assets and liabilities denominated in foreign currencies
        688,020,502  
     
         
    Net Assets
      $ 2,796,835,138  


    Net Asset Value Per Share
           
    Non-Service Shares:
           
    Net asset value, redemption price per share and offering price per share
    (based on net assets of $1,410,763,429 and 46,563,559 shares of beneficial interest outstanding)
      $ 30.30  
    Service Shares:
           
    Net asset value, redemption price per share and offering price per share
    (based on net assets of $1,101,584,428 and 36,675,663 shares of beneficial interest outstanding)
      $ 30.04  
    Class 3 Shares:
           
    Net asset value, redemption price per share and offering price per share
    (based on net assets of $202,621,365 and 6,643,369 shares of beneficial interest outstanding)
      $ 30.50  
    Class 4 Shares:
           
    Net asset value, redemption price per share and offering price per share
    (based on net assets of $81,865,916 and 2,721,393 shares of beneficial interest outstanding)
      $ 30.08  


    STATEMENT OF OPERATIONS For the Year Ended December 31, 2010
             
    Investment Income
           
    Dividends:
           
    Unaffiliated companies (net of foreign withholding taxes of $4,749,919)
      $ 51,422,607  
    Affiliated companies
        71,454  
    Interest
        44,489  
     
         
    Total investment income
        51,538,550  
     
           
    Expenses
           
    Management fees
        16,477,772  
    Distribution and service plan fees:
           
    Service shares
        2,487,757  
    Class 4 shares
        191,270  
    Transfer and shareholder servicing agent fees:
           
    Non-Service shares
        1,335,869  
    Service shares
        997,433  
    Class 3 shares
        196,460  
    Class 4 shares
        76,505  
    Shareholder communications:
           
    Non-Service shares
        165,185  
    Service shares
        124,272  
    Class 3 shares
        24,187  
    Class 4 shares
        9,474  
    Custodian fees and expenses
        284,724  
    Trustees’ compensation
        56,368  
    Administration service fees
        1,500  
    Other
        143,515  
     
         
    Total expenses
        22,572,291  
    Less waivers and reimbursements of expenses
        (31,932 )
     
         
    Net expenses
        22,540,359  
     
           
    Net Investment Income
        28,998,191  
     
           
    Realized and Unrealized Gain
           
    Net realized gain on:
           
    Investments from unaffiliated companies (net of foreign capital gains tax of $264,531)
        35,894,050  
    Foreign currency transactions
        25,571,948  
     
         
    Net realized gain
        61,465,998  
    Net change in unrealized appreciation/depreciation on:
           
    Investments
        288,320,153  
    Translation of assets and liabilities denominated in foreign currencies
        9,675,167  
     
         
    Net change in unrealized appreciation/depreciation
        297,995,320  
     
           
    Net Increase in Net Assets Resulting from Operations
      $ 388,459,509  


    STATEMENTS OF CHANGES IN NET ASSETS
                     
    Year Ended December 31,   2010     2009  
     
    Operations
                   
    Net investment income
      $ 28,998,191     $ 31,953,433  
    Net realized gain (loss)
        61,465,998       (65,102,360 )
    Net change in unrealized appreciation/depreciation
        297,995,320       806,598,818  
         
    Net increase in net assets resulting from operations
        388,459,509       773,449,891  
     
                   
    Dividends and/or Distributions to Shareholders
                   
    Dividends from net investment income:
                   
    Non-Service shares
        (19,240,136 )     (27,800,589 )
    Service shares
        (12,039,643 )     (16,163,769 )
    Class 3 shares
        (2,863,873 )     (4,130,611 )
    Class 4 shares
        (934,492 )     (1,262,683 )
         
     
        (35,078,144 )     (49,357,652 )
    Distributions from net realized gain:
                   
    Non-Service shares
              (26,507,538 )
    Service shares
              (17,924,453 )
    Class 3 shares
              (3,946,570 )
    Class 4 shares
              (1,437,851 )
         
     
              (49,816,412 )
     
                   
    Beneficial Interest Transactions
                   
    Net decrease in net assets resulting from beneficial interest transactions:
                   
    Non-Service shares
        (133,425,702 )     (140,936,466 )
    Service shares
        (16,572,723 )     (37,527,816 )
    Class 3 shares
        (29,607,611 )     (22,954,318 )
    Class 4 shares
        (6,420,742 )     (4,666,393 )
         
     
        (186,026,778 )     (206,084,993 )
     
                   
    Net Assets
                   
    Total increase
        167,354,587       468,190,834  
    Beginning of period
        2,629,480,551       2,161,289,717  
         
    End of period (including accumulated net investment income of $23,680,132 and $30,325,856, respectively)
      $ 2,796,835,138     $ 2,629,480,551  


    FINANCIAL HIGHLIGHTS
                                             
    Non-Service Shares   Year Ended December 31,   2010     2009     2008     2007     2006  
     
    Per Share Operating Data
                                           
    Net asset value, beginning of period
      $ 26.50     $ 20.21     $ 36.60     $ 36.79     $ 33.38  
     
    Income (loss) from investment operations:
                                           
    Net investment income1
        .33       .33       .55       .45       .43  
    Net realized and unrealized gain (loss)
        3.85       6.94       (14.46 )     1.69       5.20  
         
    Total from investment operations
        4.18       7.27       (13.91 )     2.14       5.63  
     
    Dividends and/or distributions to shareholders:
                                           
    Dividends from net investment income
        (.38 )     (.50 )     (.46 )     (.50 )     (.36 )
    Distributions from net realized gain
              (.48 )     (2.02 )     (1.83 )     (1.86 )
         
    Total dividends and/or distributions to shareholders
        (.38 )     (.98 )     (2.48 )     (2.33 )     (2.22 )
     
    Net asset value, end of period
      $ 30.30     $ 26.50     $ 20.21     $ 36.60     $ 36.79  


    Total Return, at Net Asset Value2
        15.96 %     39.77 %     (40.19 )%     6.32 %     17.69 %
     
                                           
    Ratios/Supplemental Data
                                           
    Net assets, end of period (in thousands)
      $ 1,410,764     $ 1,364,597     $ 1,150,113     $ 2,193,638     $ 2,297,315  
     
    Average net assets (in thousands)
      $ 1,336,110     $ 1,206,240     $ 1,679,720     $ 2,302,726     $ 2,189,511  
     
    Ratios to average net assets:3
                                           
    Net investment income
        1.22 %     1.51 %     1.95 %     1.21 %     1.27 %
    Total expenses4
        0.76 %     0.75 %     0.65 %     0.65 %     0.66 %
    Expenses after payments, waivers and/or reimbursements and reduction to custodian expenses
        0.76 %     0.75 %     0.65 %     0.65 %     0.66 %
     
    Portfolio turnover rate
        15 %     11 %     19 %     18 %     21 %
    1.   Per share amounts calculated based on the average shares outstanding during the period.
     
    2.   Assumes an initial investment on the business day before the first day of the fiscal period, with all dividends and distributions reinvested in additional shares on the reinvestment date, and redemption at the net asset value calculated on the last business day of the fiscal period. Total returns are not annualized for periods less than one full year. Total return information does not reflect expenses that apply at the separate account level or to related insurance products. Inclusion of these charges would reduce the total return figures for all periods shown. Returns do not reflect the deduction of taxes that a shareholder would pay on fund distributions or the redemption of fund shares.
     
    3.   Annualized for periods less than one full year.
     
    4.   Total expenses including indirect expenses from affiliated fund were as follows:
             
    Year Ended December 31, 2010
        0.76 %
    Year Ended December 31, 2009
        0.75 %
    Year Ended December 31, 2008
        0.65 %
    Year Ended December 31, 2007
        0.65 %
    Year Ended December 31, 2006
        0.66 %
     
                                             
    Service Shares     Year Ended December 31,   2010     2009     2008     2007     2006  
     
    Per Share Operating Data
                                           
    Net asset value, beginning of period
      $ 26.28     $ 20.02     $ 36.27     $ 36.49     $ 33.16  
     
    Income (loss) from investment operations:
                                           
    Net investment income1
        .26       .27       .47       .33       .33  
    Net realized and unrealized gain (loss)
        3.82       6.90       (14.32 )     1.72       5.16  
         
    Total from investment operations
        4.08       7.17       (13.85 )     2.05       5.49  
     
    Dividends and/or distributions to shareholders:
                                           
    Dividends from net investment income
        (.32 )     (.43 )     (.38 )     (.44 )     (.30 )
    Distributions from net realized gain
              (.48 )     (2.02 )     (1.83 )     (1.86 )
         
    Total dividends and/or distributions to shareholders
        (.32 )     (.91 )     (2.40 )     (2.27 )     (2.16 )
     
    Net asset value, end of period
      $ 30.04     $ 26.28     $ 20.02     $ 36.27     $ 36.49  


    Total Return, at Net Asset Value2
        15.70 %     39.36 %     (40.33 )%     6.08 %     17.36 %
     
                                           
    Ratios/Supplemental Data
                                           
    Net assets, end of period (in thousands)
      $ 1,101,584     $ 980,485     $ 772,107     $ 1,300,989     $ 983,558  
     
    Average net assets (in thousands)
      $ 997,627     $ 830,887     $ 1,051,239     $ 1,180,656     $ 750,499  
     
    Ratios to average net assets:3
                                           
    Net investment income
        0.96 %     1.23 %     1.70 %     0.91 %     0.98 %
    Total expenses4
        1.01 %     1.00 %     0.90 %     0.89 %     0.91 %
    Expenses after payments, waivers and/or reimbursements and reduction to custodian expenses
        1.01 %     1.00 %     0.90 %     0.89 %     0.91 %
     
    Portfolio turnover rate
        15 %     11 %     19 %     18 %     21 %
    1.   Per share amounts calculated based on the average shares outstanding during the period.
     
    2.   Assumes an initial investment on the business day before the first day of the fiscal period, with all dividends and distributions reinvested in additional shares on the reinvestment date, and redemption at the net asset value calculated on the last business day of the fiscal period. Total returns are not annualized for periods less than one full year. Total return information does not reflect expenses that apply at the separate account level or to related insurance products. Inclusion of these charges would reduce the total return figures for all periods shown. Returns do not reflect the deduction of taxes that a shareholder would pay on fund distributions or the redemption of fund shares.
     
    3.   Annualized for periods less than one full year.
     
    4.   Total expenses including indirect expenses from affiliated fund were as follows:
             
    Year Ended December 31, 2010
        1.01 %
    Year Ended December 31, 2009
        1.00 %
    Year Ended December 31, 2008
        0.90 %
    Year Ended December 31, 2007
        0.89 %
    Year Ended December 31, 2006
        0.91 %


    Class 3 Shares     Year Ended December 31,   2010     2009     2008     2007     2006  
     
    Per Share Operating Data
                                           
    Net asset value, beginning of period
      $ 26.67     $ 20.34     $ 36.82     $ 36.99     $ 33.55  
     
    Income (loss) from investment operations:
                                           
    Net investment income1
        .33       .33       .56       .45       .43  
    Net realized and unrealized gain (loss)
        3.88       6.98       (14.56 )     1.71       5.23  
         
    Total from investment operations
        4.21       7.31       (14.00 )     2.16       5.66  
     
    Dividends and/or distributions to shareholders:
                                           
    Dividends from net investment income
        (.38 )     (.50 )     (.46 )     (.50 )     (.36 )
    Distributions from net realized gain
              (.48 )     (2.02 )     (1.83 )     (1.86 )
         
    Total dividends and/or distributions to shareholders
        (.38 )     (.98 )     (2.48 )     (2.33 )     (2.22 )
     
    Net asset value, end of period
      $ 30.50     $ 26.67     $ 20.34     $ 36.82     $ 36.99  
    Total Return, at Net Asset Value2
        15.97 %     39.70 %     (40.19 )%     6.34 %     17.69 %


    Ratios/Supplemental Data
                                           
    Net assets, end of period (in thousands)
      $ 202,621     $ 206,356     $ 175,971     $ 361,621     $ 395,901  
     
    Average net assets (in thousands)
      $ 196,495     $ 182,553     $ 269,650     $ 391,270     $ 369,406  
     
    Ratios to average net assets:3
                                           
    Net investment income
        1.22 %     1.49 %     1.95 %     1.22 %     1.26 %
    Total expenses4
        0.76 %     0.75 %     0.65 %     0.65 %     0.66 %
    Expenses after payments, waivers and/or reimbursements and reduction to custodian expenses
        0.76 %     0.75 %     0.65 %     0.65 %     0.66 %
     
    Portfolio turnover rate
        15 %     11 %     19 %     18 %     21 %
    1.   Per share amounts calculated based on the average shares outstanding during the period.
     
    2.   Assumes an initial investment on the business day before the first day of the fiscal period, with all dividends and distributions reinvested in additional shares on the reinvestment date, and redemption at the net asset value calculated on the last business day of the fiscal period. Total returns are not annualized for periods less than one full year. Total return information does not reflect expenses that apply at the separate account level or to related insurance products. Inclusion of these charges would reduce the total return figures for all periods shown. Returns do not reflect the deduction of taxes that a shareholder would pay on fund distributions or the redemption of fund shares.
     
    3.   Annualized for periods less than one full year.
     
    4.   Total expenses including indirect expenses from affiliated fund were as follows:
             
    Year Ended December 31, 2010
        0.76 %
    Year Ended December 31, 2009
        0.75 %
    Year Ended December 31, 2008
        0.65 %
    Year Ended December 31, 2007
        0.65 %
    Year Ended December 31, 2006
        0.66 %
     
                                             
    Class 4 Shares       Year Ended December 31,   2010     2009     2008     2007     2006  
     
    Per Share Operating Data
                                           
    Net asset value, beginning of period
      $ 26.32     $ 20.03     $ 36.28     $ 36.49     $ 33.15  
     
    Income (loss) from investment operations:
                                           
    Net investment income1
        .26       .27       .47       .34       .34  
    Net realized and unrealized gain (loss)
        3.82       6.92       (14.34 )     1.70       5.16  
         
    Total from investment operations
        4.08       7.19       (13.87 )     2.04       5.50  
     
    Dividends and/or distributions to shareholders:
                                           
    Dividends from net investment income
        (.32 )     (.42 )     (.36 )     (.42 )     (.30 )
    Distributions from net realized gain
              (.48 )     (2.02 )     (1.83 )     (1.86 )
         
    Total dividends and/or distributions to shareholders
        (.32 )     (.90 )     (2.38 )     (2.25 )     (2.16 )
     
    Net asset value, end of period
      $ 30.08     $ 26.32     $ 20.03     $ 36.28     $ 36.49  


    Total Return, at Net Asset Value2
        15.67 %     39.38 %     (40.35 )%     6.06 %     17.40 %
     
                                           
    Ratios/Supplemental Data
                                           
    Net assets, end of period (in thousands)
      $ 81,866     $ 78,043     $ 63,099     $ 123,542     $ 114,232  
     
    Average net assets (in thousands)
      $ 76,519     $ 66,965     $ 93,909     $ 122,385     $ 100,973  
     
    Ratios to average net assets:3
                                           
    Net investment income
        0.97 %     1.22 %     1.69 %     0.93 %     1.00 %
    Total expenses4
        1.01 %     1.00 %     0.91 %     0.90 %     0.91 %
    Expenses after payments, waivers and/or reimbursements and reduction to custodian expenses
        1.01 %     1.00 %     0.91 %     0.90 %     0.91 %
     
    Portfolio turnover rate
        15 %     11 %     19 %     18 %     21 %
    1.   Per share amounts calculated based on the average shares outstanding during the period.
     
    2.   Assumes an initial investment on the business day before the first day of the fiscal period, with all dividends and distributions reinvested in additional shares on the reinvestment date, and redemption at the net asset value calculated on the last business day of the fiscal period. Total returns are not annualized for periods less than one full year. Total return information does not reflect expenses that apply at the separate account level or to related insurance products. Inclusion of these charges would reduce the total return figures for all periods shown. Returns do not reflect the deduction of taxes that a shareholder would pay on fund distributions or the redemption of fund shares.
     
    3.   Annualized for periods less than one full year.
     
    4.   Total expenses including indirect expenses from affiliated fund were as follows:
             
    Year Ended December 31, 2010
        1.01 %
    Year Ended December 31, 2009
        1.00 %
    Year Ended December 31, 2008
        0.91 %
    Year Ended December 31, 2007
        0.90 %
    Year Ended December 31, 2006
        0.91 %


    NOTES TO FINANCIAL STATEMENTS
    1. Significant Accounting Policies
    Oppenheimer Global Securities Fund/VA (the “Fund”) is a separate series of Oppenheimer Variable Account Funds, an open-end management investment company registered under the Investment Company Act of 1940, as amended. The Fund’s investment objective is to seek long-term capital appreciation by investing a substantial portion of its assets in securities of foreign issuers, “growth-type” companies, cyclical industries and special situations that are considered to have appreciation possibilities. The Fund’s investment adviser is OppenheimerFunds, Inc. (the “Manager”).
         The Fund offers Non-Service, Service, Class 3 and Class 4 shares. All classes are sold at their offering price, which is the net asset value per share, to separate investment accounts of participating insurance companies as an underlying investment for variable life insurance policies, variable annuity contracts or other investment products. The class of shares being designated as Service shares and Class 4 shares are subject to a distribution and service plan. All classes of shares have identical rights and voting privileges with respect to the Fund in general and exclusive voting rights on matters that affect that class alone. Earnings, net assets and net asset value per share may differ due to each class having its own expenses, such as transfer and shareholder servicing agent fees and shareholder communications, directly attributable to that class. The Fund assesses a 1% fee on the proceeds of Class 3 and Class 4 shares that are redeemed (either by selling or exchanging to another Oppenheimer fund or other investment option offered through your variable life insurance or variable annuity contract) within 60 days of their purchase. The fee, which is retained by the Fund, is accounted for as an addition to paid-in capital.
         The following is a summary of significant accounting policies consistently followed by the Fund.
    Securities Valuation. The Fund calculates the net asset value of its shares as of the close of the New York Stock Exchange (the “Exchange”), normally 4:00 P.M. Eastern time, on each day the Exchange is open for trading.
         Each investment asset or liability of the Fund is assigned a level at measurement date based on the significance and source of the inputs to its valuation. Unadjusted quoted prices in active markets for identical securities are classified as “Level 1,” inputs other than unadjusted quoted prices for an asset that are observable are classified as “Level 2” and significant unobservable inputs, including the Manager’s judgment about the assumptions that a market participant would use in pricing an asset or liability, are classified as “Level 3.” The inputs used for valuing securities are not necessarily an indication of the risks associated with investing in those securities. A table summarizing the Fund’s investments under these levels of classification is included following the Statement of Investments.
         Securities are valued using unadjusted quoted market prices, when available, as supplied primarily by portfolio pricing services approved by the Board of Trustees or dealers.
         Securities traded on a registered U.S. securities exchange are valued based on the last sale price of the security reported on the principal exchange on which it is traded, prior to the time when the Fund’s assets are valued. Securities whose principal exchange is NASDAQ® are valued based on the official closing prices reported by NASDAQ prior to the time when the Fund’s assets are valued. In the absence of a sale, the security is valued at the last sale price on the prior trading day, if it is within the spread of the current day’s closing “bid” and “asked” prices, and if not, at the current day’s closing bid price. A foreign security traded on a foreign exchange is valued based on the last sale price on the principal exchange on which the security is traded, as identified by the portfolio pricing service used by the Manager, prior to the time when the Fund’s assets are valued. In the absence of a sale, the security is valued at the most recent official closing price on the principal exchange on which it is traded.
         Shares of a registered investment company that are not traded on an exchange are valued at that investment company’s net asset value per share.
         U.S. domestic and international debt instruments (including corporate, government, municipal, mortgage-backed, collateralized mortgage obligations and asset-backed securities) and “money market-type” debt instruments with a remaining maturity in excess of sixty days are valued at the mean between the “bid” and “asked” prices utilizing price quotations obtained from independent pricing services or broker-dealers. Such prices are typically determined based upon information obtained from market participants including reported trade data, broker-dealer price quotations and inputs such as benchmark yields and issuer spreads from identical or similar securities.
         Forward foreign currency exchange contracts are valued utilizing current and forward currency rates obtained from independent pricing services.
         “Money market-type” debt instruments with remaining maturities of sixty days or less are valued at cost adjusted by the amortization of discount or premium to maturity (amortized cost), which approximates market value.
         In the absence of a readily available unadjusted quoted market price, including for securities whose values have been materially affected by what the Manager identifies as a significant event occurring before the Fund’s assets are valued but after the close of the securities’ respective exchanges, the Manager, acting through its internal valuation committee, in good faith determines the fair valuation of that asset using consistently applied procedures under the supervision of the Board of Trustees (which reviews those fair valuations by the Manager). Those procedures include certain standardized methodologies to fair value securities. Such methodologies include, but are not limited to, pricing securities initially at cost and subsequently adjusting the value based on: changes in company specific fundamentals, changes in an appropriate securities index, or changes in the value of similar securities which may be adjusted for any discounts related to resale restrictions. When possible, such methodologies use observable market inputs such as unadjusted quoted prices of similar securities, observable interest rates, currency rates and yield curves. The methodologies used for valuing securities are not necessarily an indication of the risks associated with investing in those securities.
         There have been no significant changes to the fair valuation methodologies of the Fund during the period.
    Investment in Oppenheimer Institutional Money Market Fund. The Fund is permitted to invest daily available cash balances in an affiliated money market fund. The Fund may invest the available cash in Class E shares of Oppenheimer Institutional Money Market Fund (“IMMF”) to seek current income while preserving liquidity. IMMF is a registered open-end management investment company, regulated as a money market fund under the Investment Company Act of 1940, as amended. The Manager is also the investment adviser of IMMF. When applicable, the Fund’s investment in IMMF is included in the Statement of Investments. Shares of IMMF are valued at their net asset value per share. As a shareholder, the Fund is subject to its proportional share of IMMF’s Class E expenses, including its management fee. The Manager will waive fees and/or reimburse Fund expenses in an amount equal to the indirect management fees incurred through the Fund’s investment in IMMF.
    Foreign Currency Translation. The Fund’s accounting records are maintained in U.S. dollars. The values of securities denominated in foreign currencies and amounts related to the purchase and sale of foreign securities and foreign investment income are translated into U.S. dollars as of the close of the Exchange, normally 4:00 P.M. Eastern time, on each day the Exchange is open for trading. Foreign exchange rates may be valued primarily using a reliable bank, dealer or service authorized by the Board of Trustees.
         Reported net realized gains and losses from foreign currency transactions arise from sales of portfolio securities, sales and maturities of short-term securities, sales of foreign currencies, exchange rate fluctuations between the trade and settlement dates on securities transactions, and the difference between the amounts of dividends, interest, and foreign withholding taxes recorded on the Fund’s books and the U.S. dollar equivalent of the amounts actually received or paid. Net unrealized appreciation and depreciation on the translation of assets and liabilities denominated in foreign currencies arise from changes in the values of assets and liabilities, including investments in securities at fiscal period end, resulting from changes in exchange rates.
         The effect of changes in foreign currency exchange rates on investments is separately identified from the fluctuations arising from changes in market values of securities held and reported with all other foreign currency gains and losses in the Fund’s Statement of Operations.
    Allocation of Income, Expenses, Gains and Losses. Income, expenses (other than those attributable to a specific class), gains and losses are allocated on a daily basis to each class of shares based upon the relative proportion of net assets represented by such class. Operating expenses directly attributable to a specific class are charged against the operations of that class. 

    Federal Taxes. The Fund intends to comply with provisions of the Internal Revenue Code applicable to regulated investment companies and to distribute substantially all of its investment company taxable income, including any net realized gain on investments not offset by capital loss carryforwards, if any, to shareholders. Therefore, no federal income or excise tax provision is required. The Fund files income tax returns in U.S. federal and applicable state jurisdictions. The statute of limitations on the Fund’s tax return filings generally remain open for the three preceding fiscal reporting period ends.
    The tax components of capital shown in the following table represent distribution requirements the Fund must satisfy under the income tax regulations, losses the Fund may be able to offset against income and gains realized in future years and unrealized appreciation or depreciation of securities and other investments for federal income tax purposes.
                             
                        Net Unrealized  
                        Appreciation  
                        Based on Cost of  
    Undistributed   Undistributed     Accumulated     Securities and Other  
    Net Investment   Long-Term     Loss     Investments for Federal  
    Income   Gain     Carryforward1,2,3     Income Tax Purposes  
     
    $31,700,131
      $     $ 17,214,823     $ 648,698,863  
    1.   As of December 31, 2010, the Fund had $17,214,823 of net capital loss carryforwards available to offset future realized capital gains, if any, and thereby reduce future taxable gain distributions. As of December 31, 2010, details of the capital loss carryforward were as follows:
             
    Expiring    
     
    2017
      $ 17,214,823  
    2.   During the fiscal year ended December 31, 2010, the Fund utilized $61,984,330 of capital loss carryforward to offset capital gains realized in that fiscal year.
     
    3.   During the fiscal year ended December 31, 2009, the Fund did not utilize any capital loss carryforward.
    Net investment income (loss) and net realized gain (loss) may differ for financial statement and tax purposes. The character of dividends and distributions made during the fiscal year from net investment income or net realized gains may differ from their ultimate characterization for federal income tax purposes. Also, due to timing of dividends and distributions, the fiscal year in which amounts are distributed may differ from the fiscal year in which the income or net realized gain was recorded by the Fund.
    Accordingly, the following amounts have been reclassified for December 31, 2010. Net assets of the Fund were unaffected by the reclassifications.
             
    Reduction   Reduction  
    to Accumulated   to Accumulated  
    Net Investment   Net Realized Loss  
    Income   on Investments  
     
    $565,771
      $ 565,771  
    The tax character of distributions paid during the years ended December 31, 2010 and December 31, 2009 was as follows:
                     
        Year Ended     Year Ended  
        December 31, 2010     December 31, 2009  
     
    Distributions paid from:
                   
    Ordinary income
      $ 35,078,144     $ 49,392,292  
    Long-term capital gain
              49,781,772  
         
    Total
      $ 35,078,144     $ 99,174,064  
         
    The aggregate cost of securities and other investments and the composition of unrealized appreciation and depreciation of securities and other investments for federal income tax purposes as of December 31, 2010 are noted in the following table. The primary difference between book and tax appreciation or depreciation of securities and other investments, if applicable, is attributable to the tax deferral of losses or tax realization of financial statement unrealized gain or loss.
             
    Federal tax cost of securities
      $ 2,144,543,051  
    Federal tax cost of other investments
        (711,836 )
     
         
    Total federal tax cost
      $ 2,143,831,215  


    Gross unrealized appreciation
      $ 713,036,000  
    Gross unrealized depreciation
        (64,337,137 )
     
         
    Net unrealized appreciation
      $ 648,698,863  
     
         
    Certain foreign countries impose a tax on capital gains which is accrued by the Fund based on unrealized appreciation, if any, on affected securities. The tax is paid when the gain is realized.
    Trustees’ Compensation. The Board of Trustees has adopted a compensation deferral plan for independent trustees that enables trustees to elect to defer receipt of all or a portion of the annual compensation they are entitled to receive from the Fund. For purposes of determining the amount owed to the Trustee under the plan, deferred amounts are treated as though equal dollar amounts had been invested in shares of the Fund or in other Oppenheimer funds selected by the Trustee. The Fund purchases shares of the funds selected for deferral by the Trustee in amounts equal to his or her deemed investment, resulting in a Fund asset equal to the deferred compensation liability. Such assets are included as a component of “Other” within the asset section of the Statement of Assets and Liabilities. Deferral of trustees’ fees under the plan will not affect the net assets of the Fund, and will not materially affect the Fund’s assets, liabilities or net investment income per share. Amounts will be deferred until distributed in accordance with the compensation deferral plan.
    Dividends and Distributions to Shareholders. Dividends and distributions to shareholders, which are determined in accordance with income tax regulations and may differ from U.S. generally accepted accounting principles, are recorded on the ex-dividend date. Income and capital gain distributions, if any, are declared and paid annually or at other times as deemed necessary by the Manager.
    Investment Income. Dividend income is recorded on the ex-dividend date or upon ex-dividend notification in the case of certain foreign dividends where the ex-dividend date may have passed. Non-cash dividends included in dividend income, if any, are recorded at the fair market value of the securities received. Interest income is recognized on an accrual basis. Discount and premium, which are included in interest income on the Statement of Operations, are amortized or accreted daily.
    Custodian Fees. “Custodian fees and expenses” in the Statement of Operations may include interest expense incurred by the Fund on any cash overdrafts of its custodian account during the period. Such cash overdrafts may result from the effects of failed trades in portfolio securities and from cash outflows resulting from unanticipated shareholder redemption activity. The Fund pays interest to its custodian on such cash overdrafts, to the extent they are not offset by positive cash balances maintained by the Fund, at a rate equal to the Federal Funds Rate plus 0.50%. The “Reduction to custodian expenses” line item, if applicable, represents earnings on cash balances maintained by the Fund during the period. Such interest expense and other custodian fees may be paid with these earnings.
    Security Transactions. Security transactions are recorded on the trade date. Realized gains and losses on securities sold are determined on the basis of identified cost.
    Indemnifications. The Fund’s organizational documents provide current and former trustees and officers with a limited indemnification against liabilities arising in connection with the performance of their duties to the Fund. In the normal course of business, the Fund may also enter into contracts that provide general indemnifications. The Fund’s maximum exposure under these arrangements is unknown as this would be dependent on future claims that may be made against the Fund. The risk of material loss from such claims is considered remote.
    Other. The preparation of financial statements in conformity with accounting principles generally accepted in the United States of America requires management to make estimates and assumptions that affect the reported amounts of assets and liabilities and disclosure of contingent assets and liabilities at the date of the financial statements and the reported amounts of increases and decreases in net assets from operations during the reporting period. Actual results could differ from those estimates.
    2. Shares of Beneficial Interest
    The Fund has authorized an unlimited number of $0.001 par value shares of beneficial interest of each class. Transactions in shares of beneficial interest were as follows:
                                     
        Year Ended December 31, 2010     Year Ended December 31, 2009  
        Shares     Amount     Shares     Amount  
     
    Non-Service Shares
                                   
    Sold
        3,002,141     $ 81,399,571       4,700,539     $ 96,201,259  
    Dividends and/or distributions reinvested
        719,257       19,240,136       3,644,841       54,308,127  
    Redeemed
        (8,659,048 )     (234,065,409 )     (13,740,529 )     (291,445,852 )
         
    Net decrease
        (4,937,650 )   $ (133,425,702 )     (5,395,149 )   $ (140,936,466 )


    Service Shares
                                   
    Sold
        4,081,506     $ 109,511,274       2,545,715     $ 56,464,839  
    Dividends and/or distributions reinvested
        453,129       12,039,643       2,301,703       34,088,222  
    Redeemed
        (5,166,594 )     (138,123,640 )     (6,110,959 )     (128,080,877 )
         
    Net decrease
        (631,959 )   $ (16,572,723 )     (1,263,541 )   $ (37,527,816 )


    Class 3 Shares
                                   
    Sold
        201,269     $ 5,485,318       250,961     $ 5,397,159  
    Dividends and/or distributions reinvested
        106,384       2,863,873       538,120       8,077,181  
    Redeemed
        (1,401,659 )     (37,956,802 )1     (1,702,099 )     (36,428,658 )2
         
    Net decrease
        (1,094,006 )   $ (29,607,611 )     (913,018 )   $ (22,954,318 )


    Class 4 Shares
                                   
    Sold
        83,546     $ 2,267,578       131,734     $ 2,846,292  
    Dividends and/or distributions reinvested
        35,118       934,492       181,977       2,700,534  
    Redeemed
        (362,658 )     (9,622,812 )1     (497,765 )     (10,213,219 )2
         
    Net decrease
        (243,994 )   $ (6,420,742 )     (184,054 )   $ (4,666,393 )
         
    1.   Net of redemption fees of $3,781 and $2,816 for Class 3 and Class 4, respectively.
     
    2.   Net of redemption fees of $5,246 and $4,411 for Class 3 and Class 4, respectively.
    3. Purchases and Sales of Securities
    The aggregate cost of purchases and proceeds from sales of securities, other than short-term obligations and investments in IMMF, for the year ended December 31, 2010, were as follows:
                     
        Purchases     Sales  
     
    Investment securities
      $ 386,662,911     $ 583,878,682  
    4. Fees and Other Transactions with Affiliates
    Management Fees. Under the investment advisory agreement, the Fund pays the Manager a management fee based on the daily net assets of the Fund at an annual rate as shown in the following table:
             
    Fee Schedule    
     
    Up to $200 million
        0.75 %
    Next $200 million
        0.72  
    Next $200 million
        0.69  
    Next $200 million
        0.66  
    Over $800 million
        0.60  
    Administration Service Fees. The Fund pays the Manager a fee of $1,500 per year for preparing and filing the Fund’s tax returns.
    Transfer Agent Fees. OppenheimerFunds Services (“OFS”), a division of the Manager, acts as the transfer and shareholder servicing agent for the Fund. The Fund pays OFS fees at an annual rate of 0.10% of the daily net assets of each class of shares. For the year ended December 31, 2010, the Fund paid $2,593,552 to OFS for services to the Fund.
    Distribution and Service Plan for Service Shares and Class 4 Shares. The Fund has adopted a Distribution and Service Plan (the “Plan”) in accordance with Rule 12b-1 under the Investment Company Act of 1940 for Service shares and Class 4 shares to pay OppenheimerFunds Distributor, Inc. (the “Distributor”), for distribution related services, personal service and account maintenance for the Fund’s Service shares and Class 4 shares. Under the Plan, payments are made periodically at an annual rate of 0.25% of the daily net assets of Service shares and Class 4 shares of the Fund. The Distributor currently uses all of those fees to compensate sponsors of the insurance product that offers Fund shares, for providing personal service and maintenance of accounts of their variable contract owners that hold Service shares and Class 4 shares. These fees are paid out of the Fund’s assets on an on-going basis and increase operating expenses of the Service shares and Class 4 shares, which results in lower performance compared to the Fund’s shares that are not subject to a service fee. Fees incurred by the Fund under the Plan are detailed in the Statement of Operations.
    Waivers and Reimbursements of Expenses. The Manager has voluntarily agreed to limit the Fund’s total annual operating expenses so that those expenses, as percentages of daily net assets, will not exceed the annual rate of 1.00% for Non-Service and Class 3 shares and 1.25% for Service and Class 4 shares.
         The Manager will waive fees and/or reimburse Fund expenses in an amount equal to the indirect management fees incurred through the Fund’s investment in IMMF. During the year ended December 31, 2010, the Manager waived fees and/or reimbursed the Fund $31,932 for IMMF management fees.
         Some of these undertakings may be modified or terminated at any time; some may not be modified or terminated until after one year from the date of the current prospectus, as indicated therein.
    5. Risk Exposures and the Use of Derivative Instruments
    The Fund’s investment objectives not only permit the Fund to purchase investment securities, they also allow the Fund to enter into various types of derivatives contracts, including, but not limited to, futures contracts, forward foreign currency exchange contracts, credit default swaps, interest rate swaps, total return swaps, and purchased and written options. In doing so, the Fund will employ strategies in differing combinations to permit it to increase, decrease, or change the level or types of exposure to market risk factors. Central to those strategies are features inherent to derivatives that make them more attractive for this purpose than equity and debt securities: they require little or no initial cash investment, they can focus exposure on only certain selected risk factors, and they may not require the ultimate receipt or delivery of the underlying security (or securities) to the contract. This may allow the Fund to pursue its objectives more quickly and efficiently than if it were to make direct purchases or sales of securities capable of effecting a similar response to market factors.
    Market Risk Factors. In accordance with its investment objectives, the Fund may use derivatives to increase or decrease its exposure to one or more of the following market risk factors:
    Commodity Risk. Commodity risk relates to the change in value of commodities or commodity indexes as they relate to increases or decreases in the commodities market. Commodities are physical assets that have tangible properties. Examples of these types of assets are crude oil, heating oil, metals, livestock, and agricultural products.
    Credit Risk. Credit risk relates to the ability of the issuer to meet interest and principal payments, or both, as they come due. In general, lower-grade, higher-yield bonds are subject to credit risk to a greater extent than lower-yield, higher-quality bonds.
    Equity Risk. Equity risk relates to the change in value of equity securities as they relate to increases or decreases in the general market.
    Foreign Exchange Rate Risk. Foreign exchange rate risk relates to the change in the U.S. dollar value of a security held that is denominated in a foreign currency. The U.S. dollar value of a foreign currency denominated security will decrease as the dollar appreciates against the currency, while the U.S. dollar value will increase as the dollar depreciates against the currency.
    Interest Rate Risk. Interest rate risk refers to the fluctuations in value of fixed-income securities resulting from the inverse relationship between price and yield. For example, an increase in general interest rates will tend to reduce the market value of already issued fixed-income investments, and a decline in general interest rates will tend to increase their value. In addition, debt securities with longer maturities, which tend to have higher yields, are subject to potentially greater fluctuations in value from changes in interest rates than obligations with shorter maturities.
    Volatility Risk. Volatility risk refers to the magnitude of the movement, but not the direction of the movement, in a financial instrument’s price over a defined time period. Large increases or decreases in a financial instrument’s price over a relative time period typically indicate greater volatility risk, while small increases or decreases in its price typically indicate lower volatility risk.
    The Fund’s actual exposures to these market risk factors during the period are discussed in further detail, by derivative type, below.
    Risks of Investing in Derivatives. The Fund’s use of derivatives can result in losses due to unanticipated changes in the market risk factors and the overall market. In instances where the Fund is using derivatives to decrease, or hedge, exposures to market risk factors for securities held by the Fund, there are also risks that those derivatives may not perform as expected resulting in losses for the combined or hedged positions.
         Derivatives may have little or no initial cash investment relative to their market value exposure and therefore can produce significant gains or losses in excess of their cost. This use of embedded leverage allows the Fund to increase its market value exposure relative to its net assets and can substantially increase the volatility of the Fund’s performance.
         Additional associated risks from investing in derivatives also exist and potentially could have significant effects on the valuation of the derivative and the Fund. Typically, the associated risks are not the risks that the Fund is attempting to increase or decrease exposure to, per its investment objectives, but are the additional risks from investing in derivatives. Examples of these associated risks are liquidity risk, which is the risk that the Fund will not be able to sell the derivative in the open market in a timely manner, and counterparty credit risk, which is the risk that the counterparty will not fulfill its obligation to the Fund. Associated risks can be different for each type of derivative and are discussed by each derivative type in the notes that follow.
    Counterparty Credit Risk. Certain derivative positions are subject to counterparty credit risk, which is the risk that the counterparty will not fulfill its obligation to the Fund. The Fund’s derivative counterparties are financial institutions who are subject to market conditions that may weaken their financial position. The Fund intends to enter into financial transactions with counterparties that the Manager believes to be creditworthy at the time of the transaction.
    Credit Related Contingent Features. The Fund’s agreements with derivative counterparties have several credit related contingent features that if triggered would allow its derivatives counterparties to close out and demand payment or additional collateral to cover their exposure from the Fund. Credit related contingent features are established between the Fund and its derivatives counterparties to reduce the risk that the Fund will not fulfill its payment obligations to its counterparties. These triggering features include, but are not limited to, a percentage decrease in the Fund’s net assets and or a percentage decrease in the Fund’s Net Asset Value or NAV. The contingent features are established within the Fund’s International Swap and Derivatives Association, Inc. master agreements which govern certain positions in swaps, over-the-counter options and swaptions, and forward currency exchange contracts for each individual counterparty.
    Valuations of derivative instruments as of December 31, 2010 are as follows:
                 
        Liability Derivatives  
    Derivatives Not Accounted   Statement of Assets and      
    for as Hedging Instruments   Liabilities Location   Value  
     
    Foreign exchange contracts
      Unrealized depreciation on foreign currency exchange contracts     $2,260  
    The effect of derivative instruments on the Statement of Operations is as follows:
    Amount of Realized Gain or (Loss) Recognized on Derivatives
             
    Derivatives Not Accounted for      
    as Hedging Instruments   Foreign currency transactions  
     
    Foreign exchange contracts
      $ (1,362,614 )
    Amount of Change in Unrealized Gain or (Loss) Recognized on Derivatives
             
    Derivatives Not Accounted for   Translation of assets and liabilities  
    as Hedging Instruments   denominated in foreign currencies  
     
    Foreign exchange contracts
      $ (2,260 )
    Foreign Currency Exchange Contracts
    The Fund may enter into foreign currency exchange contracts (“forward contracts”) for the purchase or sale of a foreign currency at a negotiated rate at a future date.
         Forward contracts are reported on a schedule following the Statement of Investments. Forward contracts will be valued daily based upon the closing prices of the forward currency rates determined at the close of the Exchange as provided by a bank, dealer or pricing service. The resulting unrealized appreciation (depreciation) is reported in the Statement of Assets and Liabilities as a receivable or payable and in the Statement of Operations within the change in unrealized appreciation (depreciation). At contract close, the difference between the original cost of the contract and the value at the close date is recorded as a realized gain (loss) in the Statement of Operations.
         The Fund has purchased and sold certain forward foreign currency exchange contracts of different currencies in order to acquire currencies to pay for related foreign securities purchase transactions, or to convert foreign currencies to U.S. dollars from related foreign securities sale transactions. These foreign currency exchange contracts are negotiated at the current spot exchange rate with settlement typically within two business days thereafter. 

         The Fund has entered into forward foreign currency exchange contracts with the obligation to purchase specified foreign currencies in the future at a currently negotiated forward rate in order to take a positive investment perspective on the related currency. These forward foreign currency exchange contracts seek to increase exposure to foreign exchange rate risk.
         The Fund has entered into forward foreign currency exchange contracts with the obligation to purchase specified foreign currencies in the future at a currently negotiated forward rate in order to decrease exposure to foreign exchange rate risk associated with foreign currency denominated securities held by the Fund.
         The Fund has entered into forward foreign currency exchange contracts with the obligation to sell specified foreign currencies in the future at a currently negotiated forward rate in order to take a negative investment perspective on the related currency. These forward foreign currency exchange contracts seek to increase exposure to foreign exchange rate risk.
         The Fund has entered into forward foreign currency exchange contracts with the obligation to sell specified foreign currencies in the future at a currently negotiated forward rate in order to decrease exposure to foreign exchange rate risk associated with foreign currency denominated securities held by the Fund.
         During the year ended December 31, 2010, the Fund had average contract amounts on forward foreign currency contracts to buy and sell of $2,571,248 and $3,566,990, respectively.
         Additional associated risk to the Fund includes counterparty credit risk. Counterparty credit risk arises from the possibility that the counterparty will default.
    6. Pending Litigation
    Since 2009, a number of lawsuits have been pending federal courts against the Manager, the Distributor, and certain mutual funds (“Defendant Funds”) advised by the Manager and distributed by the Distributor (but not including the Fund). The lawsuits naming the Defendant Funds also name as defendants certain officers and current and former trustees of the respective Defendant Funds. The plaintiffs seek class action status on behalf of purchasers of shares of the respective Defendant Fund during a particular time period. The lawsuits raise claims under federal securities laws alleging that, among other things, the disclosure documents of the respective Defendant Fund contained misrepresentations and omissions, that such Defendant Fund’s investment policies were not followed, and that such Defendant Fund and the other defendants violated federal securities laws and regulations. The plaintiffs seek unspecified damages, equitable relief and an award of attorneys’ fees and litigation expenses.
         In 2009, what are claimed to be derivative lawsuits were filed in state court against the Manager and a subsidiary (but not against the Fund), on behalf of the New Mexico Education Plan Trust. These lawsuits allege breach of contract, breach of fiduciary duty, negligence and violation of state securities laws, and seek compensatory damages, equitable relief and an award of attorneys’ fees and litigation expenses.
         Other lawsuits have been filed since 2008 in various state and federal courts, against the Manager and certain of its affiliates. Those lawsuits were filed by investors who made investments through an affiliate of the Manager, and relate to the alleged investment fraud perpetrated by Bernard Madoff and his firm (“Madoff”). Those suits allege a variety of claims, including breach of fiduciary duty, fraud, negligent misrepresentation, unjust enrichment, and violation of federal and state securities laws and regulations, among others. They seek unspecified damages, equitable relief and an award of attorneys’ fees and litigation expenses. None of the suits have named the Distributor, any of the Oppenheimer mutual funds or any of their independent Trustees or Directors as defendants. None of the Oppenheimer funds invested in any funds or accounts managed by Madoff.
         The Manager believes that the lawsuits described above are without legal merit and is defending against them vigorously. The Defendant Funds’ Boards of Trustees have also engaged counsel to defend the suits brought against those Funds and the present and former Independent Trustees named in those suits. While it is premature to render any opinion as to the outcome in these lawsuits, or whether any costs that the Defendant Funds may bear in defending the suits might not be reimbursed by insurance, the Manager believes that these suits should not impair the ability of the Manager or the Distributor to perform their respective duties to the Fund, and that the outcome of all of the suits together should not have any material effect on the operations of any of the Oppenheimer funds.
    7. Subsequent Event
    The Regulated Investment Company Modernization Act of 2010 (the “Act”) was signed into law on December 22, 2010. The Act makes changes to a number of tax rules impacting the Fund. Under the Act, future capital losses generated by a fund may be carried over indefinitely, but these losses must be used prior to the utilization of any pre-enactment capital losses. Since pre-enactment capital losses may only be carried forward for eight years, there may be a greater likelihood that all or a portion of a fund’s pre-enactment capital losses will expire unused. In general, the provisions of the Act will be effective for the Fund’s fiscal year ending December 31, 2011. Specific information regarding the impact of the Act on the Fund will be contained within the “Federal Taxes” section of the financial statement notes for the fiscal year ending December 31, 2011.
     

    REPORT OF INDEPENDENT REGISTERED PUBLIC ACCOUNTING FIRM
    The Board of Trustees and Shareholders of Oppenheimer Variable Account Funds:
    We have audited the accompanying statement of assets and liabilities of Oppenheimer Global Strategic Income Fund/VA, formerly known as Oppenheimer Strategic Bond Fund/VA (one of the portfolios constituting the Oppenheimer Variable Account Funds), including the statement of investments, as of December 31, 2010, the related statement of operations for the year then ended, and the statements of changes in net assets and the financial highlights for each of the years in the two-year period then ended. These financial statements and financial highlights are the responsibility of the Fund’s management. Our responsibility is to express an opinion on these financial statements and financial highlights based on our audits. The accompanying financial highlights of Oppenheimer Global Strategic Income Fund/VA for the years ended prior to January 1, 2009 were audited by other auditors whose report dated February 11, 2009 expressed an unqualified opinion on those financial highlights.
         We conducted our audits in accordance with the standards of the Public Company Accounting Oversight Board (United States). Those standards require that we plan and perform the audits to obtain reasonable assurance about whether the financial statements and financial highlights are free of material misstatement. An audit includes examining, on a test basis, evidence supporting the amounts and disclosures in the financial statements. Our procedures included confirmation of securities owned as of December 31, 2010, by correspondence with the custodian, transfer agent and brokers, or by other appropriate auditing procedures where replies from brokers were not received. An audit also includes assessing the accounting principles used and significant estimates made by management, as well as evaluating the overall financial statement presentation. We believe that our audits provide a reasonable basis for our opinion.
         In our opinion, the financial statements and financial highlights referred to above present fairly, in all material respects, the financial position of Oppenheimer Global Strategic Income Fund/VA as of December 31, 2010, the results of its operations for the year then ended, and the changes in its net assets and the financial highlights for each of the years in the two-year period then ended, in conformity with U.S. generally accepted accounting principles.
    /s/ KPMG llp
    Denver,Colorado

    February 16, 2011


    STATEMENT OF INVESTMENTS December 31, 2010
                     
        Principal        
        Amount     Value  
     
    Asset-Backed Securities—1.5%
                   
    Ally Auto Receivables Trust 2010-2, Automobile Receivables Nts., Series 2010-2, Cl. A4, 2.09%, 5/15/15
      $ 115,000     $ 116,534  
    Ally Auto Receivables Trust 2010-4, Automobile Receivables Nts., Series 2010-4, Cl. A3, 0.91%, 11/17/14
        140,000       139,175  
    AmeriCredit Automobile Receivables Trust 2010-4, Automobile Receivables-Backed Nts., Series 2010-4, Cl. A3, 1.27%, 4/8/15
        230,000       229,935  
    AmeriCredit Prime Automobile Receivables Trust 2007-1, Automobile Receivables Nts., Series 2007-1, Cl. D, 5.62%, 9/8/14
        1,319,000       1,348,956  
    AmeriCredit Prime Automobile Receivables Trust 2010-1, Automobile Receivables Nts., Series 2010-1, Cl. A2, 0.97%, 1/15/13
        438,219       438,412  
    Argent Securities Trust 2004-W8, Asset-Backed Pass-Through Certificates, Series 2004-W8, Cl. A2, 1.221%, 5/25/341
        924,857       820,857  
    Argent Securities Trust 2006-M3, Asset-Backed Pass-Through Certificates, Series 2006-M3, Cl. A2B, 0.361%, 9/25/361
        367,322       137,673  
    Bank of America Auto Trust 2010-2, Automobile Receivables, Series 2010-2, Cl. A4, 1.94%, 6/15/17
        60,000       60,670  
    Bank of America Credit Card Trust, Credit Card Asset-Backed Certificates, Series 2010-A1, Cl. A1, 0.56%, 9/15/151
        1,140,000       1,140,305  
    BMW Vehicle Owner Trust 2010-A, Asset-Backed Nts., Series 2010-A, Cl. A3, 1.39%, 4/25/14
        850,000       856,676  
    Capital Auto Receivables Asset Trust 2007-1, Automobile Asset-Backed Securities, Series 2007-1, Cl. B, 5.15%, 9/17/12
        262,000       269,828  
    Capital One Auto Finance Trust, Automobile Receivables, Series 2006-C, Cl. A4, 0.29%, 5/15/131
        623,068       619,739  
    Capital One Multi-Asset Execution Trust, Credit Card Asset-Backed Certificates, Series 2008-A5, Cl. A5, 4.85%, 2/18/14
        655,000       663,193  
    CarMax Auto Owner Trust 2010-2, Asset-Backed Certificates, Series 2010-2, Cl. A3, 1.41%, 2/16/15
        100,000       100,714  
    Citibank Omni Master Trust, Credit Card Receivables, Series 2009-A8, Cl. A8, 2.36%, 5/16/161,2
        205,000       207,618  
    Citigroup Mortgage Loan Trust, Inc. 2006-WFH3, Asset-Backed Pass-Through Certificates, Series 2006-W FH3, Cl. A2, 0.361%, 10/25/361
        56,261       56,146  
    CNH Equipment Trust, Asset-Backed Certificates:
                   
    Series 2009-B, Cl. A3, 2.97%, 3/15/13
        329,242       330,683  
    Series 2010-A, Cl. A2, 0.81%, 3/25/15
        1,117,614       1,118,131  
    Countrywide Home Loans, Asset-Backed Certificates:
                   
    Series 2005-16, Cl. 2AF2, 5.382%, 5/1/361
        1,153,863       988,410  
    Series 2005-17, Cl. 1AF2, 5.363%, 5/1/361
        160,277       128,956  
    CWABS Asset-Backed Certificates Trust 2006-25, Asset-Backed Certificates, Series 2006-25, Cl. 2A2, 0.381%, 6/25/471
        1,050,000       940,079  
    CWHEQ Revolving Home Equity Loan Trust, Asset-Backed Certificates:
                   
    Series 2005-G, Cl. 2A, 0.49%, 12/15/351
        191,794       103,979  
    Series 2006-H, Cl. 2A1A, 0.41%, 11/15/361
        72,099       27,100  
    Discover Card Master Trust, Credit Card Receivables, Series 2009-A1, Cl. A1, 1.56%, 12/15/141
        1,130,000       1,145,327  
    Embarcadero Aircraft Securitization Trust, Airplane Receivable Nts., Series 2000-A, Cl. B, 8/15/253,4,5
        1,820,063        
    First Franklin Mortgage Loan Trust 2006-FF10, Mtg. Pass-Through Certificates, Series 2006-FF10, Cl. A3, 0.351%, 7/25/361
        174,552       171,674  
    First Franklin Mortgage Loan Trust 2006-FF9, Mtg. Pass-Through Certificates, Series 2006-FF9, Cl. 2A2, 0.371%, 7/7/361
        76,155       72,537  
    Ford Credit Auto Lease Trust, Automobile Receivable Nts.:
                   
    Series 2010-A, Cl. A, 1.04%, 3/15/132
        601,082       601,624  
    Series 2010-B, Cl. A2, 0.75%, 10/15/124
        620,000       620,001  
    Ford Credit Auto Owner Trust, Automobile Receivable Nts., Series 2010-A, Cl. A4, 2.15%, 6/15/15
        1,635,000       1,665,933  
    GE Capital Credit Card Master Note Trust, Asset-Backed Nts., Series 2009-2, Cl. A, 3.69%, 7/15/15
        1,140,000       1,184,635  
     
                     
        Principal        
        Amount     Value  
     
    Asset-Backed Securities Continued
                   
    GE Equipment Midticket LLC, Asset-Backed Certificates, Series 2010-1, Cl. A2, 0.61%, 1/14/132
      $ 845,000     $ 845,246  
    Harley-Davidson Motorcycle Trust 2010-1, Motorcycle Contract-Backed Nts., Series 2010-1, Cl. A3, 1.16%, 2/15/15
        430,000       429,561  
    Home Equity Mortgage Trust 2005-1, Mtg. Pass-Through Certificates, Series 2005-1, Cl. M6, 5.863%, 6/1/35
        1,046,000       547,293  
    HSBC Home Equity Loan Trust 2005-3, Closed-End Home Equity Loan Asset-Backed Certificates, Series 2005-3, Cl. A1, 0.521%, 1/20/351
        187,034       179,617  
    HSBC Home Equity Loan Trust 2006-4, Closed-End Home Equity Loan Asset-Backed Certificates, Series 2006-4, Cl. A2V, 0.371%, 3/20/361
        168,037       167,395  
    Hyundai Auto Receivables Trust 2010-A, Automobile Receivable Nts., Series 2010-A, Cl. A3, 1.50%, 10/15/14
        625,000       631,456  
    Ice 1 Em CLO Ltd./Ice 1 Em CLO Corp., Sr. Sec. Sub. Term Nts.:
                   
    Series 2007-1A, Cl. B, 2.294%, 8/15/221,4
        7,870,000       4,879,400  
    Series 2007-1A, Cl. C, 3.594%, 8/15/221,4
        5,270,000       2,951,200  
    Series 2007-1A, Cl. D, 5.594%, 8/15/221,4
        5,270,000       2,740,400  
    Mastr Asset-Backed Securities Trust 2006-WMC3, Mtg. Pass-Through Certificates, Series 2006-WMC3, Cl. A3, 0.361%, 8/25/361
        1,256,448       468,690  
    Merrill Auto Trust Securitization 2007-1, Asset-Backed Nts., Series 2007-1, Cl. A4, 0.32%, 12/15/131
        930,408       927,970  
    NC Finance Trust, Collateralized Mtg. Obligation Pass-Through Certificates, Series 1999-I, Cl. ECFD, 1/25/293,4
        66,744       8,009  
    Nissan Auto Lease Trust 2010-B, Automobile Asset-Backed Nts., Series 2010-B, Cl. A3, 1%, 12/15/13
        550,000       549,332  
    Popular ABS Mortgage Pass-Through Trust 2005-6, Mtg. Pass-Through Certificates, Series 2005-6, Cl. A3, 5.68%, 1/25/361
        221,242       203,870  
    RASC Series 2006-KS7 Trust, Home Equity Mtg. Asset-Backed Pass-Through Certificates, Series 2006-KS7, Cl. A2, 0.361%, 9/25/361
        181,640       180,656  
    Santander Drive Auto Receivables Trust 2010-3, Automobile Receivables Nts., Series 2010-3, Cl. A3, 1.20%, 6/16/14
        340,000       340,162  
    Securitized Asset-Backed Receivables LLC Trust 2007-BR2, Asset-Backed Securities, Series 2007-BR2, Cl. A2, 0.491%, 2/25/371
        585,229       281,292  
    SLM Student Loan Trust, Student Loan Receivables, Series 2005-B, Cl. B, 0.702%, 6/15/391
        2,487,000       1,112,964  
    Terwin Mortgage Trust, Home Equity Asset-Backed Securities, Series 2006-4SL, Cl. A1, 4.50%, 5/1/371,2
        183,142       57,477  
    Toyota Auto Receivable Owner Trust 2010-B, Automobile Receivable Nts., Series 2010-B, Cl. A2, 0.74%, 7/16/12
        690,000       691,026  
    Volkswagen Auto Lease Trust 2010-A, Automobile Receivable Nts., Series 2010-A, Cl. A3, 0.99%, 11/20/13
        545,000       544,094  
    Wachovia Auto Owner Trust 2007-A, Automobile Receivable Nts., Series 2007-A, Cl. A4, 5.49%, 4/22/13
        427,957       436,200  
    World Financial Network Credit Card Master Note Trust, Credit Card Receivables, Series 2009-A, Cl. A, 4.60%, 9/15/15
        515,000       529,577  
     
                 
    Total Asset-Backed Securities
    (Cost $46,326,853)
                36,008,387  
     
                   
    Mortgage-Backed Obligations—15.0%
                   
    Government Agency—7.3%
                   
    FHLMC/FNMA/FHLB/Sponsored—7.1%
                   
    Federal Home Loan Mortgage Corp.:
                   
    5%, 9/15/33
        2,002,978       2,114,788  
    5.50%, 9/1/39
        1,725,383       1,840,029  
    6%, 5/15/18-10/15/29
        1,029,043       1,129,696  
    6.50%, 3/15/18-8/15/32
        2,217,132       2,463,754  
    7%, 10/1/31-10/1/37
        586,994       665,008  
    7.50%, 4/25/36
        846,159       970,100  
    Federal Home Loan Mortgage Corp., Gtd. Real Estate Mtg. Investment Conduit Multiclass Pass-Through Certificates:
                   
    Series 1360, Cl. PZ, 7.50%, 9/15/22
        998,520       1,128,313  
    Series 151, Cl. F, 9%, 5/15/21
        27,613       31,934  


        Principal        
        Amount     Value  
     
    FHLMC/FNMA/FHLB/Sponsored Continued
                   
    Federal Home Loan Mortgage Corp., Gtd. Real Estate Mtg. Investment Conduit Multiclass Pass-Through Certificates: Continued
                   
    Series 1674, Cl. Z, 6.75%, 2/15/24
      $ 810,963     $ 907,809  
    Series 1897, Cl. K, 7%, 9/15/26
        1,852,619       2,095,081  
    Series 2006-11, Cl. PS, 23.611%, 3/25/361
        540,909       763,792  
    Series 2043, Cl. ZP, 6.50%, 4/15/28
        665,000       691,321  
    Series 2106, Cl. FG, 0.71%, 12/15/281
        1,284,840       1,289,885  
    Series 2122, Cl. F, 0.71%, 2/15/291
        38,570       38,674  
    Series 2148, Cl. ZA, 6%, 4/15/29
        1,098,083       1,186,349  
    Series 2195, Cl. LH, 6.50%, 10/15/29
        572,940       653,197  
    Series 2326, Cl. ZP, 6.50%, 6/15/31
        80,445       92,694  
    Series 2344, Cl. FP, 1.21%, 8/15/311
        386,159       393,020  
    Series 2368, Cl. PR, 6.50%, 10/15/31
        326,423       358,540  
    Series 2412, Cl. GF, 1.21%, 2/15/321
        767,806       783,048  
    Series 2449, Cl. FL, 0.81%, 1/15/321
        497,318       501,477  
    Series 2451, Cl. FD, 1.26%, 3/15/321
        257,149       262,491  
    Series 2453, Cl. BD, 6%, 5/15/17
        127,957       138,481  
    Series 2461, Cl. PZ, 6.50%, 6/15/32
        1,170,778       1,305,692  
    Series 2464, Cl. FI, 1.26%, 2/15/321
        249,240       253,900  
    Series 2470, Cl. AF, 1.26%, 3/15/321
        441,204       452,958  
    Series 2470, Cl. LF, 1.26%, 2/15/321
        255,061       260,791  
    Series 2471, Cl. FD, 1.26%, 3/15/321
        405,171       413,856  
    Series 2477, Cl. FZ, 0.81%, 6/15/311
        992,636       1,000,531  
    Series 2500, Cl. FD, 0.76%, 3/15/321
        30,050       30,235  
    Series 2517, Cl. GF, 1.26%, 2/15/321
        221,762       226,636  
    Series 2526, Cl. FE, 0.66%, 6/15/291
        59,549       59,780  
    Series 2551, Cl. FD, 0.66%, 1/15/331
        28,574       28,680  
    Series 2676, Cl. KY, 5%, 9/15/23
        3,843,000       4,141,698  
    Series 2750, Cl. XG, 5%, 2/1/34
        6,037,000       6,305,539  
    Series 2907, Cl. GC, 5%, 6/1/27
        979,466       997,325  
    Series 2947, Cl. HE, 5%, 3/1/35
        1,650,000       1,725,340  
    Series 3019, Cl. MD, 4.75%, 1/1/31
        1,031,856       1,060,600  
    Series 3025, Cl. SJ, 23.796%, 8/15/351
        622,692       868,106  
    Series 3094, Cl. HS, 23.429%, 6/15/341
        355,017       466,450  
    Federal Home Loan Mortgage Corp., Interest-Only Stripped Mtg.-Backed Security:
                   
    Series 192, Cl. IO, 11.357%, 2/1/286
        27,993       5,587  
    Series 205, Cl. IO, 9.397%, 9/1/296
        143,448       30,131  
    Series 2074, Cl. S, 57.198%, 7/17/286
        37,881       7,439  
    Series 2079, Cl. S, 73.19%, 7/17/286
        64,879       13,598  
    Series 2136, Cl. SG, 84.946%, 3/15/296
        1,739,359       304,667  
    Series 2399, Cl. SG, 78.061%, 12/15/266
        1,020,053       205,420  
    Series 243, Cl. 6, 2.166%, 12/15/326
        423,687       82,538  
    Series 2437, Cl. SB, 90.668%, 4/15/326
        2,965,552       587,577  
    Series 2526, Cl. SE, 41.061%, 6/15/296
        74,763       13,349  
    Series 2802, Cl. AS, 96.146%, 4/15/336
        514,129       45,757  
    Series 2920, Cl. S, 66.523%, 1/15/356
        644,529       92,718  
    Series 3110, Cl. SL, 17.819%, 2/15/266
        401,065       51,442  
    Federal National Mortgage Assn.:
                   
    3.50%, 1/1/26-1/1/417
        9,580,000       9,524,878  
    4%, 1/1/417
        13,160,000       13,094,200  
    4.50%, 1/1/26-1/1/417
        18,865,000       19,450,101  
    5%, 11/25/21-7/25/33
        2,897,453       3,068,249  
    5%, 1/1/417
        10,235,000       10,761,140  
    5.285%, 10/1/36
        5,407,200       5,667,730  
    5.50%, 4/25/21-1/1/36
        1,153,144       1,240,502  
    5.50%, 1/1/26-1/1/417
        14,678,000       15,711,570  
    6%, 10/25/16-4/1/35
        8,907,567       9,766,931  
    6%, 11/1/16-1/1/417
        2,485,000       2,701,275  
    6.50%, 4/25/17-1/1/34
        2,856,391       3,210,232  
    7%, 11/1/17-6/25/34
        2,906,656       3,302,117  
    7.50%, 2/25/27-3/25/33
        3,172,192       3,637,003  
    8.50%, 7/1/32
        3,209       3,616  
    Federal National Mortgage Assn., Gtd. Real Estate Mtg. Investment Conduit Multiclass Pass-Through Certificates:
                   
    Trust 1999-54, Cl. LH, 6.50%, 11/25/29
        558,684       617,009  
    Trust 2001-51, Cl. OD, 6.50%, 10/25/31
        302,645       345,271  
    Trust 2001-69, Cl. PF, 1.261%, 12/25/311
        579,274       594,231  
    Trust 2001-80, Cl. ZB, 6%, 1/25/32
        659,394       728,732  
    Trust 2002-12, Cl. PG, 6%, 3/25/17
        402,940       437,191  
    Trust 2002-29, Cl. F, 1.261%, 4/25/321
        290,385       297,929  
    Trust 2002-60, Cl. FH, 1.261%, 8/25/321
        586,040       599,804  
    Trust 2002-64, Cl. FJ, 1.261%, 4/25/321
        89,419       91,742  
    Trust 2002-68, Cl. FH, 0.761%, 10/18/321
        202,636       203,981  
    Trust 2002-84, Cl. FB, 1.261%, 12/25/321
        1,197,256       1,228,470  
    Trust 2002-9, Cl. PC, 6%, 3/25/17
        408,457       443,188  
    Trust 2002-9, Cl. PR, 6%, 3/25/17
        500,136       542,663  
    Trust 2002-90, Cl. FH, 0.761%, 9/25/321
        669,868       674,412  
    Trust 2003-11, Cl. FA, 1.261%, 9/25/321
        1,197,283       1,228,499  
    Trust 2003-116, Cl. FA, 0.661%, 11/25/331
        86,715       87,126  
    Trust 2004-101, Cl. BG, 5%, 1/25/20
        1,825,000       1,951,853  
    Trust 2005-100, Cl. BQ, 5.50%, 11/25/25
        571,000       614,997  
    Trust 2005-109, Cl. AH, 5.50%, 12/25/25
        2,160,000       2,327,304  
    Trust 2005-12, Cl. JC, 5%, 6/1/28
        1,137,520       1,162,721  
    Trust 2005-25, Cl. PS, 27.013%, 4/25/351
        565,143       910,965  
    Trust 2005-31, Cl. PB, 5.50%, 4/25/35
        560,000       614,138  
    Trust 2005-71, Cl. DB, 4.50%, 8/25/25
        480,000       511,227  
    Trust 2006-46, Cl. SW, 23.244%, 6/25/361
        937,827       1,299,101  
    Trust 2009-36, Cl. FA, 1.201%, 6/25/371
        485,035       494,519  
     
                     
        Principal        
        Amount     Value  
     
    FHLMC/FNMA/FHLB/Sponsored Continued
                   
    Federal National Mortgage Assn., Interest-Only Stripped Mtg.-Backed Security:
                   
    Trust 2001-61, Cl. SH, 49.191%, 11/18/316
      $ 330,391     $ 61,876  
    Trust 2001-63, Cl. SD, 40.451%, 12/18/316
        78,786       14,549  
    Trust 2001-68, Cl. SC, 32.468%, 11/25/316
        53,903       9,823  
    Trust 2001-81, Cl. S, 37.64%, 1/25/326
        65,521       12,990  
    Trust 2002-28, Cl. SA, 40.121%, 4/25/326
        39,682       6,882  
    Trust 2002-38, Cl. SO, 58.634%, 4/25/326
        210,261       37,638  
    Trust 2002-48, Cl. S, 36.458%, 7/25/326
        62,281       11,430  
    Trust 2002-52, Cl. SL, 38.133%, 9/25/326
        39,874       7,491  
    Trust 2002-56, Cl. SN, 38.919%, 7/25/326
        85,582       15,713  
    Trust 2002-77, Cl. IS, 51.996%, 12/18/326
        358,223       70,056  
    Trust 2002-77, Cl. SH, 47.893%, 12/18/326
        91,171       17,075  
    Trust 2002-9, Cl. MS, 36.451%, 3/25/326
        83,985       15,192  
    Trust 2003-13, Cl. IO, 11.738%, 3/25/336
        668,812       131,349  
    Trust 2003-26, Cl. DI, 8.71%, 4/25/336
        478,222       100,826  
    Trust 2003-33, Cl. SP, 49.764%, 5/25/336
        559,755       97,176  
    Trust 2003-38, Cl. SA, 48.764%, 3/25/236
        913,133       120,284  
    Trust 2003-4, Cl. S, 44.39%, 2/25/336
        167,069       31,362  
    Trust 2004-56, Cl. SE, 17.592%, 10/25/336
        2,352,602       388,385  
    Trust 2005-14, Cl. SE, 41.633%, 3/25/356
        2,162,478       295,079  
    Trust 2005-40, Cl. SA, 66.018%, 5/25/356
        1,816,125       303,674  
    Trust 2005-40, Cl. SB, 96.973%, 5/25/356
        3,050,975       482,872  
    Trust 2005-63, Cl. SA, 78.237%, 10/25/316
        132,250       19,469  
    Trust 2005-71, Cl. SA, 68.612%, 8/25/256
        439,418       60,017  
    Trust 2006-51, Cl. SA, 20.783%, 6/25/366
        11,323,048       1,634,860  
    Trust 2006-60, Cl. DI, 41.559%, 4/25/356
        2,027,751       296,483  
    Trust 2006-90, Cl. SX, 99.999%, 9/25/366
        1,842,616       359,496  
    Trust 2007-88, Cl. XI, 22.457%, 6/25/376
        3,049,353       425,288  
    Trust 214, Cl. 2, 36.506%, 3/1/236
        456,115       90,934  
    Trust 221, Cl. 2, 32.847%, 5/1/236
        51,436       10,275  
    Trust 254, Cl. 2, 26.575%, 1/1/246
        849,756       172,222  
    Trust 2682, Cl. TQ, 99.999%, 10/15/336
        675,929       108,434  
    Trust 2981, Cl. BS, 99.999%, 5/15/356
        1,197,873       178,545  
    Trust 301, Cl. 2, 2.576%, 4/1/296
        206,554       41,446  
    Trust 313, Cl. 2, 29.991%, 6/1/316
        2,205,643       540,997  
    Trust 319, Cl. 2, 3.355%, 2/1/326
        1,004,860       205,854  
    Trust 321, Cl. 2, 6.089%, 4/1/326
        260,983       67,235  
    Trust 324, Cl. 2, 0%, 7/1/326,8
        274,482       58,936  
    Trust 328, Cl. 2, 0%, 12/1/326,8
        695,242       145,796  
    Trust 331, Cl. 5, 0%, 2/1/336,8
        987,672       177,352  
    Trust 332, Cl. 2, 0%, 3/1/336,8
        6,172,065       1,287,855  
    Trust 334, Cl. 12, 0%, 2/1/336,8
        866,402       151,340  
    Trust 339, Cl. 15, 6.971%, 7/1/336
        2,488,197       479,345  
    Trust 345, Cl. 9, 3.342%, 1/1/346
        1,248,565       213,446  
    Trust 351, Cl. 10, 13.858%, 4/1/346
        522,749       89,749  
    Trust 351, Cl. 8, 0%, 4/1/346,8
        853,493       146,739  
    Trust 356, Cl. 10, 0%, 6/1/356,8
        713,466       121,829  
    Trust 356, Cl. 12, 0%, 2/1/356,8
        358,037       61,380  
    Trust 362, Cl. 13, 0.195%, 8/1/356
        425,121       71,655  


                170,133,137  
     
                   
    GNMA/Guaranteed—0.2%
                   
    Government National Mortgage Assn.:
                   
    3.125%, 12/9/251
        5,682       5,850  
    7%, 3/29/28-7/29/28
        254,158       291,429  
    7.50%, 3/1/27
        13,700       15,824  
    8%, 11/29/25-5/29/26
        95,638       110,963  
    Government National Mortgage Assn., Gtd. Real Estate Mtg. Investment Conduit Pass-Through Certificates:
                   
    Series 1999-32, Cl. ZB, 8%, 9/16/29
        1,066,292       1,283,487  
    Series 2000-12,Cl. ZA, 8%, 2/16/30
        2,440,200       2,936,983  
    Government National Mortgage Assn., Interest-Only Stripped Mtg.-Backed Security:
                   
    Series 1998-19, Cl. SB, 60.571%, 7/16/286
        134,493       28,575  
    Series 1998-6, Cl. SA, 74.511%, 3/16/286
        79,110       16,071  
    Series 2001-21, Cl. SB, 89.757%, 1/16/276
        609,086       94,406  


                4,783,588  
     
                   
    Non-Agency—7.7%
                   
    Commercial—3.3%
                   
    Banc of America Commercial Mortgage, Inc., Commercial Mtg. Pass-Through Certificates:
                   
    Series 2007-1, Cl. AMFX, 5.482%, 1/1/49
        4,159,386       4,073,005  
    Series 2008-1, Cl. AM, 6.195%, 2/10/511
        3,415,000       3,387,930  
    CHL Mortgage Pass-Through Trust 2005-17, Mtg. Pass-Through Certificates, Series 2005-17, Cl. 1A8, 5.50%, 9/1/35
        3,542,118       3,142,851  

                     
        Principal        
        Amount     Value  
     
    Commercial Continued
                   
    CHL Mortgage Pass-Through Trust 2005-HYB8, Mtg. Pass-Through Certificates, Series 2005-HYB8, Cl. 4A1, 5.303%, 12/20/351
      $ 181,627     $ 149,041  
    Citigroup, Inc./Deutsche Bank 2007-CD4 Commercial Mortgage Trust, Commercial Mtg. Pass-Through Certificates, Series 2007-CD4, Cl. A4, 5.322%, 12/1/49
        955,000       991,367  
    Deutsche Alt-A Securities, Inc., Mtg. Pass-Through Certificates, Series 2007-RS1, Cl. A2, 0.761%, 1/27/371,4
        1,436,738       400,042  
    Deutsche Alt-B Securities, Inc., Mtg. Pass-Through Certificates:
                   
    Series 2006-AB2, Cl. A1, 5.888%, 6/25/36
        377,592       349,860  
    Series 2006-AB4, Cl. A1A, 6.005%, 10/25/36
        775,422       457,372  
    Deutsche Mortgage & Asset Receiving, Commercial Mtg. Pass-Through Certificates, Series 2010-C1, Cl. A1, 3.156%, 7/1/462
        728,701       731,136  
    Deutsche Mortgage & Asset Receiving, Commercial Mtg. Pass-Through Certificates, Interest-Only Stripped Mtg.-Backed Security, Series 2010-C1, Cl. XPA, 4.82%, 9/1/204,6
        5,825,000       520,100  
    First Horizon Alternative Mortgage Securities Trust 2007-FA2, Mtg. Pass-Through Certificates, Series 2007-FA2, Cl. 1A1, 5.50%, 4/25/37
        670,290       485,168  
    First Horizon Mortgage Pass-Through Trust 2007-AR3, Mtg. Pass-Through Certificates, Series 2007-AR3, Cl. 1A1, 6.052%, 11/1/371
        3,932,141       3,215,876  
    GE Capital Commercial Mortgage Corp., Commercial Mtg. Obligations, Series 2004-C3, Cl. A2, 4.433%, 7/10/39
        301,300       303,031  
    GMAC Commercial Mortgage Securities, Inc., Commercial Mtg. Pass-Through Certificates, Series 1998-C1, Cl. F, 6.975%, 5/15/301
        1,567,000       1,571,717  
    GS Mortgage Securities Corp. II, Commercial Mtg. Obligations, Series 2006-GG8, Cl. A4, 5.56%, 11/1/39
        775,000       823,180  
    Indymac Index Mortgage Loan Trust 2005-AR31, Mtg. Pass-Through Certificates, Series 2005-AR31, Cl. 2 A2, 2.829%, 1/1/361
        176,627       5,583  
    IndyMac INDX Mortgage Loan Trust 2005-AR23, Mtg. Pass-Through Certificates, Series 2005-AR23, Cl. 6A1, 5.214%, 11/1/351
        1,880,436       1,453,115  
    JPMorgan Chase Commercial Mortgage Securities Corp., Commercial Mtg. Pass-Through Certificates:
                   
    Series 2006-LDP9, Cl. A3, 5.336%, 5/1/47
        1,235,000       1,283,622  
    Series 2007-CB18, Cl. A4, 5.44%, 6/1/47
        2,315,000       2,429,495  
    Series 2007-CB18, Cl. AM, 5.466%, 6/1/47
        6,400,000       6,310,392  
    Series 2007-LDP10, Cl. A3S, 5.317%, 4/1/13
        1,405,000       1,433,218  
    Series 2007-LDPX, Cl. A2S, 5.305%, 1/15/49
        990,000       1,013,871  
    Series 2007-LDPX, Cl. A2S2, 5.187%, 1/1/494
        1,390,000       1,404,178  
    Series 2008-C2, Cl. A4, 6.068%, 2/1/51
        7,075,000       7,366,518  
    Series 2008-C2, Cl. AM, 6.57%, 2/1/511
        4,990,000       3,333,949  
    Series 2010-C2, Cl. A2, 3.616%, 11/1/432
        860,000       833,896  
    JPMorgan Chase Commercial Mortgage Securities Trust 2007-LDP11, Commercial Mtg. Pass-Through Certificates, Series 2007-LDP11, Cl. ASB, 5.817%, 6/1/491
        570,000       605,075  
    JPMorgan Mortgage Trust 2006-A7, Mtg. Pass-Through Certificates, Series 2006-A7, Cl. 2A2, 5.723%, 1/1/371
        406,325       304,794  
    LB-UBS Commercial Mortgage Trust 2008-C1, Commercial Mtg. Pass-Through Certificates, Series 2008-C1, Cl. AM, 6.154%, 4/11/411
        2,610,000       2,570,034  
    Lehman Structured Securities Corp., Mtg.-Backed Security, 6%, 5/1/29
        18,190       3,765  
    Mastr Alternative Loan Trust 2004-6, Mtg. Pass-Through Certificates, Series 2004-6, Cl. 10A1, 6%, 7/25/34
        300,481       299,925  
    Morgan Stanley Capital I Trust, Commercial Mtg. Pass-Through Certificates, Series 2006-HQ10, Cl. AM, 5.36%, 11/1/41
        8,500,000       8,480,668  
     
                     
        Principal        
        Amount     Value  
     
    Commercial Continued
                   
    NCUA Guaranteed Notes Trust 2010-C1, Gtd. Nts.:
                   
    Series 2010-C1, Cl. A1, 1.60%, 10/29/20
      $ 569,728     $ 558,699  
    Series 2010-C1, Cl. A2, 2.90%, 10/29/20
        805,000       783,947  
    RALI Series 2005-QA4 Trust, Mtg. Asset-Backed Pass-Through Certificates, Series 2005-QA4, Cl. A32, 3.359%, 4/25/351
        126,239       23,988  
    Residential Asset Securitization Trust 2006-A12, Mtg. Pass-Through Certificates, Series 2006-A12, Cl. 1A, 6.25%, 11/1/36
        817,850       583,135  
    STARM Mortgage Loan Trust 2007-1, Mtg. Pass-Through Certificates, Series 2007-1, Cl. 2A1, 5.834%, 2/1/371
        10,945,672       8,535,599  
    WaMu Mortgage Pass-Through Certificates 2006-AR15 Trust, Mtg. Pass-Through Certificates, Series 2006-AR15, Cl. 1A, 1.168%, 11/1/461
        1,289,895       912,847  
    WaMu Mortgage Pass-Through Certificates 2007-OA3 Trust, Mtg. Pass-Through Certificates, Series 2007-OA3, Cl. 5A, 2.904%, 4/1/471
        915,048       514,858  
    Wells Fargo Commercial Mortgage Trust 2010-C1, Commercial Mtg. Pass-Through Certificates, Series 2010-C1, Cl. A1, 3.349%, 10/1/572
        472,426       473,916  
    Wells Fargo Mortgage-Backed Securities 2004-W Trust, Mtg. Pass-Through Certificates, Series 2004-W, Cl. B2, 2.762%, 11/1/341
        1,071,516       231,394  
    Wells Fargo Mortgage-Backed Securities 2005-AR1 Trust, Mtg. Pass-Through Certificates, Series 2005-AR1, Cl. 1A1, 2.839%, 2/1/351
        4,275,544       3,925,195  
    Wells Fargo Mortgage-Backed Securities 2006-AR8 Trust, Mtg. Pass-Through Certificates, Series 2006-AR8, Cl. 1A3, 2.853%, 4/25/361
        2,692,904       2,561,115  


                78,838,467  
     
                   
    Multifamily—0.2%
                   
    Citigroup Mortgage Loan Trust, Inc. 2006-AR3, Mtg. Pass-Through Certificates, Series 2006-AR3, Cl. 1 A2A, 5.77%, 6/1/361
        1,721,443       1,605,339  
    Wells Fargo Mortgage-Backed Securities 2005-AR15 Trust, Mtg. Pass-Through Certificates, Series 2005-AR15, Cl. 1A2, 5.067%, 9/1/351
        513,316       493,065  
    Wells Fargo Mortgage-Backed Securities 2006-AR6 Trust, Mtg. Pass-Through Certificates, Series 2006-AR6, Cl. 3A1, 3.203%, 3/25/361
        3,849,398       3,429,557  


                5,527,961  
     
                   
    Other—0.2%
                   
    Greenwich Capital Commercial Funding Corp./Commercial Mortgage Trust 2007-GG9, Commercial Mtg. Pass-Through Certificates, Series 2007-GG9, Cl. A4, 5.444%, 3/1/39
        2,315,000       2,442,496  
    National Credit Union Administration, Gtd. Nts., Series 2010-R1, Cl. 1A, 0.655%, 10/7/201
        1,222,883       1,221,355  


                3,663,851  
     
                   
    Residential—4.0%
                   
    Banc of America Commercial Mortgage, Inc., Commercial Mtg. Pass-Through Certificates, Series 2007-4, Cl. AM, 5.809%, 8/1/171
        3,960,000       3,952,184  
    Bear Stearns ARM Trust 2004-2, Mtg. Pass-Through Certificates, Series 2004-2, Cl. 12A2, 3.02%, 5/1/341
        3,594,457       3,252,020  
    Bear Stearns ARM Trust 2004-9, Mtg. Pass-Through Certificates, Series 2004-9, Cl. 23A1, 4.963%, 11/1/341
        1,301,948       1,294,031  
    Chase Mortgage Finance Trust 2007-A1, Multiclass Mtg. Pass-Through Certificates, Series 2007-A1, Cl. 9A1, 3.939%, 2/1/371
        1,658,024       1,672,702  
    CHL Mortgage Pass-Through Trust 2005-J4, Mtg. Pass-Through Certificates, Series 2005-J4, Cl. A7, 5.50%, 11/1/35
        2,087,937       1,717,854  
    CHL Mortgage Pass-Through Trust 2006-6, Mtg. Pass-Through Certificates, Series 2006-6, Cl. A3, 6%, 4/1/36
        1,057,323       967,671  
    CHL Mortgage Pass-Through Trust 2007-HY3, Mtg. Pass-Through Certificates, Series 2007-HY3, Cl. 1A1, 3.789%, 6/1/471
        2,329,464       1,542,523  

                     
        Principal        
        Amount     Value  
     
    Residential Continued
                   
    Citigroup Mortgage Loan Trust, Inc. 2005-2, Mtg. Pass-Through Certificates, Series 2005-2, Cl. 1A3, 4.956%, 5/1/351
      $ 2,881,526     $ 2,572,009  
    Citigroup Mortgage Loan Trust, Inc. 2005-3, Mtg. Pass-Through Certificates, Series 2005-3, Cl. 2A4, 5.138%, 8/1/351
        5,702,365       4,199,422  
    Citigroup, Inc./Deutsche Bank 2007-CD4 Commercial Mortgage Trust, Commercial Mtg. Pass-Through Certificates, Series 2007-CD4, Cl. AMFX, 5.366%, 12/1/49
        5,700,000       5,465,987  
    CitiMortgage Alternative Loan Trust 2006-A5, Real Estate Mtg. Investment Conduit Pass-Through Certificates, Series 2006-A5, Cl. 2A1, 5.50%, 10/1/21
        1,857,171       1,581,294  
    Countrywide Alternative Loan Trust 2006-43CB, Mtg. Pass-Through Certificates, Series 2006-43CB, Cl.1A10, 6%, 2/1/37
        11,180,545       7,730,816  
    GSR Mortgage Loan Trust 2004-5, Mtg. Pass-Through Certificates, Series 2004-5, Cl. 2A1, 2.899%, 5/1/341
        3,522,998       3,029,687  
    GSR Mortgage Loan Trust 2005-AR7, Mtg. Pass-Through Certificates, Series 2005-AR7, Cl. 4A1, 5.317%, 11/1/351
        3,710,312       3,099,159  
    GSR Mortgage Loan Trust 2006-5F, Mtg. Pass-Through Certificates, Series 2006-5F, Cl. 2A1, 6%, 6/1/36
        1,705,726       1,643,534  
    JPMorgan Alternative Loan Trust 2006-S4, Mtg. Pass-Through Certificates, Series 2006-S4, Cl. A6, 5.71%, 12/1/36
        323,060       291,307  
    LB-UBS Commercial Mortgage Trust 2007-C7, Commercial Mtg. Pass-Through Certificates, Series 2007-C7, Cl. AM, 6.166%, 9/11/451
        10,430,000       10,041,479  
    Merrill Lynch Mortgage Investors Trust 2006-3, Mtg. Pass-Through Certificates, Series MLCC 2006-3, Cl. 2A1, 6.025%, 10/25/361
        2,055,691       1,905,341  
    RALI Series 2006-QS13 Trust:
                   
    Mtg. Asset-Backed Pass-Through Certificates, Series 2006-QS13, Cl. 1A5, 6%, 9/25/36
        2,273,091       1,441,938  
    Mtg. Asset-Backed Pass-Through Certificates, Series 2006-QS13, Cl. 1A8, 6%, 9/25/36
        45,436       28,822  
    RALI Series 2007-QS6 Trust, Mtg. Asset-Backed Pass-Through Certificates, Series 2007-QS6, Cl. A28, 5.75%, 4/25/37
        1,086,264       679,047  
    Residential Asset Securitization Trust 2005-A14, Mtg. Pass-Through Certificates, Series 2005-A14, Cl. A1, 5.50%, 12/1/35
        3,658,508       2,962,404  
    Residential Asset Securitization Trust 2005-A6CB, Mtg. Pass-Through Certificates, Series 2005-A6CB, Cl. A7, 6%, 6/1/35
        5,032,914       4,378,582  
    WaMu Mortgage Pass-Through Certificates 2005-AR12 Trust, Mtg. Pass-Through Certificates, Series 2007-AR12, Cl. 1A8, 2.721%, 10/1/351
        2,692,944       2,341,419  
    WaMu Mortgage Pass-Through Certificates 2006-AR10 Trust, Mtg. Pass-Through Certificates, Series 2006-AR10, Cl. 1A2, 5.854%, 9/1/361
        1,877,044       1,718,875  
    WaMu Mortgage Pass-Through Certificates 2007-HY1 Trust, Mtg. Pass-Through Certificates:
                   
    Series 2007-HY1, Cl. 4A1, 5%, 2/1/371
        15,421,297       12,205,478  
    Series 2007-HY1, Cl. 5A1, 5.532%, 2/1/371
        9,399,776       6,864,097  
    WaMu Mortgage Pass-Through Certificates 2007-HY7 Trust, Mtg. Pass-Through Certificates, Series 2007-HY7, Cl. 2A1, 5.629%, 7/1/371
        2,499,806       1,760,622  
    WaMu Mortgage Pass-Through Certificates Series 2007-HY5 Trust, Mtg. Pass-Through Certificates, Series 2007-HY5, Cl. 3A1, 5.743%, 5/1/371
        1,321,472       1,208,684  
    Wells Fargo Mortgage-Backed Securities 2005-AR16 Trust, Mtg. Pass-Through Certificates, Series 2005-AR16, Cl. 2A1, 2.847%, 10/1/351
        1,660,871       1,581,480  
    Wells Fargo Mortgage-Backed Securities 2006-AR8 Trust, Mtg. Pass-Through Certificates, Series 2006-AR8, Cl. 2A1, 2.913%, 4/1/361
        1,894,999       1,661,940  


                94,792,408  
     
                 
    Total Mortgage-Backed Obligations
    (Cost $352,121,044)
                357,739,412  
     
                         
        Principal            
        Amount         Value  
     
    U.S. Government Obligations—3.3%
                       
    Federal Home Loan Mortgage Corp. Nts.:
                       
    1.125%, 7/27/12
      $ 17,545,000         $ 17,709,851  
    5%, 2/16/17
        6,500,000           7,328,159  
    5.125%, 11/17/17
        4,000,000           4,561,536  
    Federal National Mortgage Assn. Nts.:
                       
    1.125%, 7/30/12
        16,180,000           16,327,837  
    4.375%, 10/15/159
        4,000,000           4,407,760  
    5.375%, 6/12/17
        6,500,000           7,494,325  
    U.S. Treasury Bills, 0.165%, 3/3/119,10
        16,800,000           16,796,909  
    U.S. Treasury Bonds:
                       
    STRIPS, 4.201%, 2/15/1110,11
        900,000           899,916  
    STRIPS, 4.833%, 2/15/1610,11
        2,116,000           1,898,027  
     
                     
    Total U.S. Government Obligations
    (Cost $76,908,457)
                    77,424,320  
     
                       
    Foreign Government Obligations—23.3%
                       
    Argentina—1.0%
                       
    Argentina (Republic of) Bonds:
                       
    2.50%, 12/31/381
        6,075,000           2,748,938  
    Series GDP, 0%, 12/15/351,12
        4,930,000           771,545  
    Series VII, 7%, 9/12/13
        2,950,000           2,897,965  
    Argentina (Republic of) Sr. Unsec. Bonds, 0%, 12/15/351,12
        6,980,000     EUR     1,184,584  
    Argentina (Republic of) Sr. Unsec. Nts., 6.976%, 10/3/15
        11,080,000           10,491,837  
    Argentina (Republic of) Sr. Unsec. Unsub. Nts., 7.267%, 12/31/331
        12,572,574     ARP     4,912,389  
    Argentina (Republic of) Sr. Unsecured Nts., 13.625%, 1/30/141
        1,280,000     ARP     312,418  


                    23,319,676  
     
                       
    Australia—0.3%
                       
    Australia (Commonwealth of) Sr. Unsec. Bonds:
                       
    Series 119, 6.25%, 4/15/15
        705,000     AUD     746,279  
    Series 120, 6%, 2/15/17
        390,000     AUD     410,784  
    Queensland Treasury Corp. Sr. Unsec. Unsub. Nts., Series 16, 6%, 4/21/16
        4,850,000     AUD     4,966,767  


                    6,123,830  
     
                       
    Austria—0.1%
                       
    Austria (Republic of) Bonds, 4.35%, 3/15/192
        615,000     EUR     887,430  
    Austria (Republic of) Sr. Unsec. Unsub. Bonds, Series 2, 4.65%, 1/15/18
        645,000     EUR     952,010  


                    1,839,440  
     
                       
    Belgium—0.1%
                       
    Belgium (Kingdom of) Sr. Bonds, Series 40, 5.50%, 9/28/17
        1,905,000     EUR     2,828,655  
    Belize—0.0%
                       
    Belize (Government of) Unsec. Unsub. Bonds, 6%, 2/20/291,4
        830,000           734,550  
    Brazil—2.6%
                       
    Brazil (Federal Republic of) Bonds, 7.125%, 1/20/37
        560,000           670,600  
    Brazil (Federal Republic of) Nota Do Tesouro Nacional Nts.:
                       
    10%, 1/1/17
        61,453,000     BRR     33,934,515  
    10%, 1/1/21
        33,538,000     BRR     17,843,428  
    11.433%, 5/15/4516
        6,470,000     BRR     8,294,389  
    Brazil (Federal Republic of) Sr. Unsec. Unsub. Nts., 5.625%, 1/7/41
        1,930,000           1,925,175  


                    62,668,107  
     
                       
    Canada—0.3%
                       
    Canada (Government of) Nts.:
                       
    3%, 12/1/15
        4,645,000     CAD     4,797,762  
    3.75%, 6/1/19
        1,145,000     CAD     1,213,864  
    4%, 6/1/17
        1,710,000     CAD     1,850,439  


                    7,862,065  
     
                       
    Colombia—0.8%
                       
    Bogota Distrio Capital
                       
    Sr. Bonds, 9.75%, 7/26/282
        3,058,000,000     COP     2,152,370  
    Colombia (Republic of) Bonds:
                       
    7.375%, 9/18/37
        1,445,000           1,719,550  
    12%, 10/22/15
        6,763,000,000     COP     4,710,148  
    Colombia (Republic of) Sr. Nts., 7.375%, 3/18/19
        1,980,000           2,385,900  
    Colombia (Republic of) Sr. Unsec. Bonds, 6.125%, 1/18/41
        3,050,000           3,141,500  
    Colombia (Republic of) Sr. Unsec. Unsub. Bonds, 7.75%, 4/14/21
        4,866,000,000     COP     3,022,242  
    Colombia (Republic of) Unsec. Nts., 7.375%, 1/27/17
        1,340,000           1,587,900  


                    18,719,610  
     
                       
    Denmark—0.0%
                       
    Denmark (Kingdom of) Bonds, 4%, 11/15/19
        4,965,000     DKK     961,735  
    Dominican Republic—0.1%
                       
    Dominican Republic Bonds, 7.50%, 5/6/212
        1,700,000           1,840,250  

                         
        Principal            
        Amount         Value  
     
    Egypt—0.8%
                       
    Egypt (The Arab Republic of) Sr. Unsec. Unsub. Nts.:
                       
    5.75%, 4/29/202
      $ 985,000         $ 1,019,475  
    6.875%, 4/30/402
        1,075,000           1,139,500  
    Egypt (The Arab Republic of) Treasury Bills:
                       
    Series 182, 8.729%, 2/15/1111
        3,925,000     EGP     669,366  
    Series 182, 9.731%, 2/1/1111
        15,350,000     EGP     2,624,876  
    Series 182, 9.819%, 3/22/1111
        7,175,000     EGP     1,210,740  
    Series 182, 10.031%, 1/18/1111
        4,775,000     EGP     819,359  
    Series 273, 9.789%, 4/5/1111
        10,825,000     EGP     1,820,539  
    Series 273, 9.845%, 7/5/1111
        9,600,000     EGP     1,575,458  
    Series 364, 9.008%, 2/8/1111
        10,000,000     EGP     1,708,355  
    Series 364, 9.038%, 3/29/1111
        13,300,000     EGP     2,241,938  
    Series 364, 10.046%, 5/10/1111
        5,775,000     EGP     963,972  
    Series 364, 10.064%, 7/12/1111
        11,725,000     EGP     1,917,810  
    Series 364, 10.508%, 3/8/1111
        4,400,000     EGP     745,154  


                    18,456,542  
     
                       
    Finland—0.0%
                       
    Finland (Republic of) Sr. Unsec. Unsub. Nts., 3.875%, 9/15/17
        400,000     EUR     576,642  
    France—0.0%
                       
    France (Government of) Bonds, 4%, 4/25/60
        390,000     EUR     529,069  
    Germany—0.5%
                       
    Germany (Federal Republic of) Bonds:
                       
    0.50%, 6/15/12
        1,470,000     EUR     1,959,053  
    3.50%, 7/4/19
        2,805,000     EUR     3,936,716  
    Series 07, 4.25%, 7/4/39
        725,000     EUR     1,107,146  
    Series 157, 2.25%, 4/10/15
        2,955,000     EUR     4,040,274  


                    11,043,189  
     
                       
    Ghana—0.1%
                       
    Ghana (Republic of) Bonds, 8.50%, 10/4/172
        2,475,000           2,790,563  
     
                       
    Greece—0.4%
                       
    Hellenic Republic Bonds, 4.30%, 3/20/12
        2,655,000     EUR     3,270,099  
    Hellenic Republic Sr. Unsec. Unsub. Bonds:
                       
    30 yr., 4.50%, 9/20/37
        5,250,000     EUR     3,811,938  
    30 yr., 4.60%, 9/20/40
        2,310,000     EUR     1,671,233  


                    8,753,270  
     
                       
    Hungary—0.2%
                       
    Hungary (Republic of) Bonds:
                       
    Series 17/B, 6.75%, 2/24/17
        299,200,000     HUF     1,360,914  
    Series 19/A, 6.50%, 6/24/19
        675,000,000     HUF     2,942,729  


                    4,303,643  
     
                       
    Indonesia—0.6%
                       
    Indonesia (Republic of) Nts., 6.875%, 1/17/182
        5,325,000           6,230,250  
    Indonesia (Republic of) Sr. Unsec. Nts., 7.75%, 1/17/382
        2,540,000           3,111,500  
    Indonesia (Republic of) Sr. Unsec. Unsub. Bonds:
                       
    5.875%, 3/13/202
        1,670,000           1,841,175  
    6.625% 2/17/372
        1,050,000           1,155,000  
    Indonesia (Republic of) Unsec. Nts., 8.50%, 10/12/352
        2,030,000           2,679,600  


                    15,017,525  
     
                       
    Ireland—0.0%
                       
    Ireland (Republic of) Treasury Nts., 5.90%, 10/18/19
        525,000     EUR     574,895  
    Israel—0.8%
                       
    Israel (State of) Bonds:
                       
    5%, 1/31/20
        31,680,000     ILS     9,136,594  
    6%, 2/28/19
        29,640,000     ILS     9,214,140  


                    18,350,734  
     
                       
    Italy—0.4%
                       
    Italy (Republic of) Bonds:
                       
    3.75%, 3/1/21
        1,795,000     EUR     2,208,939  
    4%, 9/1/20
        2,785,000     EUR     3,529,369  
    5%, 9/1/40
        725,000     EUR     912,465  
    Italy (Republic of) Treasury Bonds, 3.75%, 12/15/13
        2,870,000     EUR     3,882,433  


                    10,533,206  
     
                       
    Japan—2.7%
                       
    Japan (Government of) Bonds, 20 yr., Series 112, 2.10%, 6/20/29
        739,000,000     JPY     9,507,022  
    Japan (Government of) Sr. Unsec. Bonds:
                       
    2 yr., 0.20%, 1/15/12
        826,000,000     JPY     10,176,678  
    5 yr., 0.50%, 12/20/14
        1,278,000,000     JPY     15,856,818  
    10 yr., Series 308, 1.30%, 6/20/20
        835,000,000     JPY     10,507,291  
    Japan (Government of) Sr. Unsec. Unsub. Bonds:
                       
    5 yr., Series 91, 0.40%, 9/20/15
        1,184,000,000     JPY     14,599,847  
    10 yr., Series 311, 0.80%, 9/20/20
        303,000,000     JPY     3,632,231  


                    64,279,887  
     
                       
    Korea, Republic of South—1.2%
                       
    Korea (Republic of) Sr. Unsec. Bonds, Series 2006, 5%, 6/10/20
        11,491,000,000     KRW     10,533,224  
    Korea (Republic of) Sr. Unsec. Monetary Stabilization Bonds:
                       
    Series 1208, 3.81%, 8/2/12
        10,222,000,000     KRW     9,096,490  
    Series 1210, 3.28%, 10/2/12
        4,948,000,000     KRW     4,362,995  
     
                         
        Principal            
        Amount         Value  
     
    Korea, Republic of South Continued
                       
    Korea (Republic of) Sr. Unsec. Unsub. Nts.:
                       
    5.125%, 12/7/16
      $ 1,635,000         $ 1,762,262  
    7.125%, 4/16/19
        2,535,000           3,028,686  


                    28,783,657  
     
                       
    Malaysia—0.1%
                       
    1Malaysia Sukuk Global Bhd Sr. Unsec. Unsub. Nts., 3.928%, 6/4/152
        2,470,000           2,569,136  
    Malaysia (Government of) Bonds, Series 0110, 3.835%, 8/12/15
        3,045,000     MYR     1,004,483  


                    3,573,619  
     
                       
    Mexico—1.8%
                       
    United Mexican States Bonds:
                       
    5.625%, 1/15/17
        3,780,000           4,199,580  
    Series M10, 7.25%, 12/15/161
        6,040,000     MXN     508,827  
    Series M20, 7.50%, 6/3/27
        129,280,000     MXN     10,488,952  
    Series M10, 7.75%, 12/14/17
        6,825,000     MXN     588,718  
    Series M10, 8%, 12/17/15
        44,000,000     MXN     3,806,623  
    Series M10, 8.50%, 12/13/18
        45,520,000     MXN     4,077,693  
    Series M20, 10%, 12/5/24
        181,400,000     MXN     18,347,104  
    United Mexican States Sr. Nts., 5.75%, 10/12/2110
        1,170,000           1,044,225  


                    43,061,722  
     
                       
    New Zealand—0.2%
                       
    New Zealand (Government of) Sr. Unsec. Bonds, Series 415, 6%, 4/15/15
        5,985,000     NZD     4,885,052  
    Norway—0.0%
                       
    Norway (Kingdom of) Bonds, Series 471, 5%, 5/15/15
        1,515,000     NOK     281,362  
    Panama—0.3%
                       
    Panama (Republic of) Bonds:
                       
    7.25%, 3/15/15
        3,120,000           3,619,200  
    8.875%, 9/30/27
        110,000           151,250  
    9.375%, 4/1/29
        1,100,000           1,548,250  
    Panama (Republic of) Unsec. Bonds, 7.125%, 1/29/26
        1,175,000           1,418,813  


                    6,737,513  
     
                       
    Peru—0.2%
                       
    Peru (Republic of) Sr. Unsec. Nts., 7.84%, 8/12/204
        6,530,000     PEN     2,652,722  
    Peru (Republic of) Sr. Unsec. Unsub. Bonds, 5.625%, 11/18/502
        1,580,000           1,469,400  


                    4,122,122  
     
                       
    Philippines—0.0%
                       
    Philippines (Republic of the) Sr. Unsec. Unsub. Nts., 4.95%, 1/31/21
        40,000,000     PHP     965,070  
     
    Poland—1.4%
                       
    Poland (Republic of) Bonds:
                       
    5.25%, 10/25/20
        20,110,000     PLZ     6,446,965  
    Series 0415, 5.50%, 4/25/15
        59,445,000     PLZ     20,245,577  
    Series 1015, 6.25%, 10/24/15
        16,725,000     PLZ     5,857,953  
    Series 1017, 5.25%, 10/25/17
        380,000     PLZ     125,501  


                    32,675,996  
     
                       
    Qatar—0.1%
                       
    Qatar (State of) Sr. Nts., 5.25%, 1/20/202
        1,595,000           1,690,700  
    South Africa—1.8%
                       
    South Africa (Republic of) Bonds:
                       
    5.50%, 3/9/20
        2,860,000           3,056,625  
    Series R208, 6.75%, 3/31/21
        33,370,000     ZAR     4,587,158  
    Series R207, 7.25%, 1/15/20
        115,470,000     ZAR     16,583,455  
    Series R204, 8%, 12/21/18
        44,800,000     ZAR     6,790,578  
    Series R186, 10.50%, 12/21/26
        69,680,000     ZAR     12,625,646  


                    43,643,462  
     
                       
    Spain—0.2%
                       
    Spain (Kingdom of) Bonds, 5.50%, 7/30/17
        2,040,000     EUR     2,814,449  
    Spain (Kingdom of) Sr. Unsub. Bonds, 4.10%, 7/30/18
        1,225,000     EUR     1,531,066  


                    4,345,515  
     
                       
    Sri Lanka—0.1%
                       
    Sri Lanka (Democratic Socialist Republic of) Sr. Unsec. Nts., 6.25%, 10/4/202
        1,330,000           1,354,938  
    Sweden—0.0%
                       
    Sweden (Kingdom of) Bonds, Series 1051, 3.75%, 8/12/17
        4,580,000     SEK     709,807  
    The Netherlands—0.1%
                       
    Netherlands (Kingdom of the) Bonds, 4%, 7/15/18
        990,000     EUR     1,428,068  
    Netherlands (Kingdom of the) Nts., 4.50%, 7/15/17
        750,000     EUR     1,116,253  


                    2,544,321  
     
                       
    Turkey—1.9%
                       
    Turkey (Republic of) Bonds:
                       
    6.75%, 4/3/18
        3,440,000           3,938,800  
    6.875%, 3/17/36
        225,000           252,000  
    7%, 3/11/19
        1,360,000           1,577,600  
    10.50%, 1/15/201
        8,430,000     TRY     6,112,296  
    11%, 8/6/14
        21,440,000     TRY     15,297,662  
    16%, 3/7/121
        5,345,000     TRY     3,823,648  
    Series CPI, 14.047%, 8/14/131
        6,930,000     TRY     6,774,742  
    Turkey (Republic of) Nts.:
                       
    7%, 6/5/20
        1,225,000           1,421,000  
    7.50%, 7/14/17
        1,780,000           2,113,750  
    Turkey (Republic of) Sr. Unsec. Nts., 7.50%, 11/7/19
        2,120,000           2,533,400  

                         
        Principal            
        Amount         Value  
     
    Turkey Continued
                       
    Turkey (Republic of) Unsec. Nts.:
                       
    6.75%, 5/30/40
      $ 1,150,000         $ 1,259,250  
    7.25%, 3/5/38
        1,180,000           1,379,125  


                    46,483,273  
     
                       
    Ukraine—0.4%
                       
    Financing of Infrastructural Projects State Enterprise Gtd. Nts., 8.375%, 11/3/172
        1,980,000           2,079,455  
    Ukraine (Republic of) Bonds, 7.75%, 9/23/202
        2,010,000           2,055,225  
    Ukraine (Republic of) Sr. Unsec. Nts., 6.75%, 11/14/172
        510,000           511,020  
    Ukraine (Republic of) Sr. Unsec. Unsub. Bonds, 6.58%, 11/21/162
        55,000           55,275  
    Ukraine (Republic of) Unsec. Bonds, 6.385%, 6/26/122
        3,650,000           3,740,520  


                    8,441,495  
     
                       
    United Kingdom—0.4%
                       
    United Kingdom Treasury Bonds:
                       
    2.25%, 3/7/14
        1,515,000     GBP     2,412,346  
    4.75%, 3/7/20
        2,015,000     GBP     3,476,239  
    4.75%, 12/7/38
        1,455,000     GBP     2,481,195  


                    8,369,780  
     
                       
    Uruguay—0.4%
                       
    Uruguay (Oriental Republic of) Bonds, 7.625%, 3/21/36
        2,325,000           2,772,563  
    Uruguay (Oriental Republic of) Sr. Nts., 6.875%, 9/28/25
        1,950,000           2,232,750  
    Uruguay (Oriental Republic of) Unsec. Bonds, 8%, 11/18/22
        3,475,000           4,317,688  


                    9,323,001  
     
                       
    Venezuela—0.9%
                       
    Venezuela (Republic of) Bonds:
                       
    9%, 5/7/23
        2,800,000           1,953,000  
    9.25%, 9/15/27
        1,280,000           960,000  
    Venezuela (Republic of) Nts.:
                       
    8.25%, 10/13/24
        1,160,000           759,800  
    8.50%, 10/8/14
        2,690,000           2,286,500  
    Venezuela (Republic of) Sr. Unsec. Unsub. Nts.:
                       
    7.75%, 10/13/19
        2,790,000           1,904,175  
    12.75%, 8/23/22
        390,000           345,150  
    Venezuela (Republic of) Unsec. Bonds:
                       
    7%, 3/31/38
        4,015,000           2,318,663  
    7.65%, 4/21/25
        6,935,000           4,386,388  
    9.375%, 1/13/34
        2,040,000           1,392,300  
    Venezuela (Republic of) Unsec. Nts., 13.625%, 8/15/182
        5,465,000           5,328,375  


                    21,634,351  
     
                     
    Total Foreign Government Obligations
    (Cost $520,545,243)
                    555,733,839  
     
                       
    Loan Participations—0.5%
                       
    Entegra Holdings LLC, Sr. Sec. Credit Facilities 3rd Lien Term Loan:
                       
    Tranche B, 10/19/157,13,14
        3,580,729           2,132,324  
    Tranche B, 3.745%, 10/19/151,13
        5,153,606           3,068,972  
    Tranche B, 3.745%, 10/19/151,7,13
        994,062           591,964  
    Nuveen Investments, Inc., Sr. Sec. Credit Facilities 2nd Lien Term Loan, 12.50%, 7/20/157
        4,916,875           5,331,736  
    Polymer Group, Inc., Sr. Sec. Credit Facilities 1st Lien Term Loan, 0.75%, 10/4/111
        3,065,000            
     
                     
    Total Loan Participations
    (Cost $10,286,281)
                    11,124,996  
     
                       
    Corporate Bonds and Notes—30.1%
                       
    Consumer Discretionary—4.6%
                       
    Auto Components—0.4%
                       
    Goodyear Tire & Rubber Co. (The), 8.25% Sr. Unsec. Unsub. Nts., 8/15/20
        2,390,000           2,485,600  
    Tower Automotive Holdings USA LLC/TA Holdings Finance, Inc., 10.625% Sr. Sec. Nts., 9/1/174
        5,608,000           6,056,640  


                    8,542,240  
     
                       
    Hotels, Restaurants & Leisure—1.9%
                       
    Grupo Posadas SAB de CV, 9.25% Sr. Unsec. Nts., 1/15/152
        1,110,000           1,026,750  
    Harrah’s Operating Co., Inc., 10% Sr. Sec. Nts., 12/15/18
        10,682,000           9,800,735  
    Isle of Capri Casinos, Inc., 7% Sr. Unsec. Sub. Nts., 3/1/14
        2,955,000           2,910,675  
    Landry’s Restaurants, Inc., 11.625% Sr. Sec. Nts., 12/1/15
        2,500,000           2,681,250  
    Mashantucket Pequot Tribe, 8.50% Bonds, Series A, 11/15/152,3,5
        6,335,000           863,144  
    MGM Mirage, Inc.:
                       
    5.875% Sr. Nts., 2/27/14
        1,885,000           1,748,338  
    6.75% Sr. Unsec. Nts., 4/1/13
        4,290,000           4,285,710  
    Mohegan Tribal Gaming Authority:
                       
    6.125% Sr. Unsec. Sub. Nts., 2/15/13
        6,335,000           5,289,725  
    6.875% Sr. Unsec. Sub. Nts., 2/15/15
        1,317,000           819,833  
     
                     
        Principal        
        Amount     Value  
     
    Hotels, Restaurants & Leisure Continued
               
    Mohegan Tribal Gaming Authority: Continued
                   
    8% Sr. Sub. Nts., 4/1/12
      $ 5,065,000     $ 4,254,600  
    11.50% Sr. Sec. Nts., 11/1/172
        2,960,000       2,745,400  
    Penn National Gaming, Inc., 8.75% Sr. Unsec. Sub. Nts., 8/15/19
        2,510,000       2,779,825  
    Premier Cruise Ltd., 11% Sr. Nts., 3/15/082,3,5
        250,000        
    Station Casinos, Inc., 6.50% Sr. Unsec. Sub. Nts., 2/1/143,5
        10,465,000       1,047  
    Travelport LLC, 11.875% Sr. Unsec. Sub. Nts., 9/1/16
        2,545,000       2,513,188  
    Wynn Las Vegas LLC/Wynn Las Vegas Capital Corp., 7.75% Sec. Nts., 8/15/20
        2,545,000       2,767,688  


                44,487,908  
     
                   
    Household Durables—0.4%
                   
    Beazer Homes USA, Inc.:
                   
    6.875% Sr. Unsec. Nts., 7/15/15
        2,910,000       2,829,975  
    9.125% Sr. Nts., 5/15/192
        2,800,000       2,667,000  
    K. Hovnanian Enterprises, Inc., 8.875% Sr. Sub. Nts., 4/1/12
        2,065,000       2,034,025  
    Reynolds Group Issuer, Inc./Reynolds Group Issuer LLC/Reynolds Group Issuer Luxembourg SA:
                   
    8.50% Sr. Nts., 5/15/182
        995,000       1,004,950  
    9% Sr. Nts., 4/15/192
        1,635,000       1,702,444  


                10,238,394  
     
                   
    Leisure Equipment & Products—0.4%
                   
    Eastman Kodak Co., 9.75% Sr. Sec. Nts., 3/1/182
        9,580,000       9,819,500  
    Media—1.5%
                   
    Affinion Group Holdings, Inc., 11.625% Sr. Nts., 11/15/152
        1,770,000       1,845,225  
    Affinion Group, Inc., 7.875% Sr. Nts., 12/15/182
        3,055,000       2,993,900  
    American Media Operations, Inc., 13.50% 2nd Lien Nts., 6/15/183,5
        337       337  
    Belo (A.H.) Corp.:
                   
    7.25% Sr. Unsec. Unsub. Bonds, 9/15/27
        465,000       405,713  
    7.75% Sr. Unsec. Unsub. Debs., 6/1/27
        2,983,000       2,699,615  
    Cengage Learning Acquisitions, Inc., 10.50% Sr. Nts., 1/15/152
        5,325,000       5,524,688  
    Cequel Communications Holdings I LLC, 8.625% Sr. Unsec. Nts., 11/15/172
        1,735,000       1,821,750  
    Clear Channel Communications, Inc., 10.75% Sr. Unsec. Unsub. Nts., 8/1/16
        3,610,000       3,249,000  
    Entravison Communications Corp., 8.75% Sr. Sec. Nts., 8/1/172
        640,000       678,400  
    Fisher Communications, Inc., 8.625% Sr. Unsec. Nts., 9/15/14
        670,000       683,400  
    Gray Television, Inc., 10.50% Sr. Sec. Nts., 6/29/15
        5,365,000       5,432,063  
    Interactive Data Corp., 10.25% Sr. Nts., 8/1/184
        965,000       1,056,675  
    Newport Television LLC/NTV Finance Corp., 12.44% Sr. Nts., 3/15/172,13
        2,495,000       2,357,775  
    Nexstar Broadcasting, Inc., 8.875% Sr. Sec. Nts., 4/15/172
        1,780,000       1,900,150  
    Radio One, Inc., 12.50% Sr. Unsec. Sub. Nts., 5/11/162
        669,750       659,704  
    Sinclair Television Group, Inc., 8.375% Sr. Nts., 10/15/182
        2,630,000       2,728,625  
    Univision Communications, Inc.:
                   
    7.875% Sr. Sec. Nts., 11/1/202
        460,000       485,300  
    8.50% Sr. Unsec. Nts., 5/15/212
        610,000       620,675  
    Visant Corp., 10% Sr. Sec. Nts., 10/1/172
        600,000       639,000  


                35,781,995  
     
                   
    Multiline Retail—0.0%
                   
    Bon-Ton Stores, Inc. (The), 10.25% Sr. Unsec. Unsub. Nts., 3/15/14
        485,000       497,125  
    Consumer Staples—0.8%
                   
    Beverages—0.1%
                   
    AmBev International Finance Co. Ltd., 9.50% Sr. Unsec. Unsub. Nts., 7/24/171
      2,080,000   BRR   1,231,084  
    Food & Staples Retailing—0.0%
                   
    Real Time Data Co., 11% Nts., 5/31/093,4,5,13
        142,981        
    Food Products—0.7%
                   
    American Seafoods Group LLC, 10.75% Sr. Sub. Nts., 5/15/162
        3,850,000       4,119,500  
    Arcor, 7.25% Sr. Unsec. Nts., 11/9/172
        785,000       839,950  
    ASG Consolidated LLC, 14.10% Sr. Nts., 5/15/172,13
        4,340,291       4,188,381  
    Bumble Bee Acquisition Corp., 9% Sr. Sec. Nts., 12/15/172
        2,830,000       2,957,350  
    MHP SA, 10.25% Sr. Unsec. Nts., 4/29/152
        1,493,000       1,580,788  
    Pilgrim’s Pride Corp., 7.875% Sr. Nts., 12/15/182
        2,425,000       2,425,000  
    Southern States Cooperative, Inc., 11.25% Sr. Nts., 5/15/154
        2,540,000       2,705,100  


                18,816,069  

                     
        Principal        
        Amount     Value  
     
    Energy—5.3%
                   
    Energy Equipment & Services—0.5%
                   
    Frac Tech Services LLC/Frac Tech Finance, Inc., 7.125% Sr. Nts., 11/15/182
      $ 765,000     $ 778,388  
    PHI, Inc., 8.625% Sr. Unsec. Nts., 10/15/182
        2,995,000       3,084,850  
    Precision Drilling Corp., 6.625% Sr. Unsec. Nts., 11/15/202
        2,295,000       2,340,900  
    Thermon Industries, Inc., 9.50% Sr. Sec. Nts., 5/1/172
        2,440,000       2,610,800  
    Vantage Drilling Co., 11.50% Sr. Sec. Nts., 8/1/152
        2,565,000       2,795,850  


                11,610,788  
     
                   
    Oil, Gas & Consumable Fuels—4.8%
                   
    Alliance Oil Co. Ltd., 9.875% Sr. Unsec. Nts., 3/11/152
        1,500,000       1,584,300  
    Alon Refining Krotz Springs, Inc., 13.50% Sr. Sec. Nts., 10/15/14
        915,000       882,975  
    Antero Resources Finance Corp., 9.375% Sr. Unsec. Nts., 12/1/17
        2,955,000       3,106,444  
    Atlas Energy Resources LLC, 10.75% Sr. Unsec. Nts., 2/1/18
        4,740,000       5,812,425  
    Atlas Pipeline Partners LP, 8.125% Sr. Unsec. Nts., 12/15/15
        2,285,000       2,364,975  
    ATP Oil & Gas Corp., 11.875% Sr. Sec. Nts., 5/1/152
        8,195,000       7,785,250  
    Berry Petroleum Co., 8.25% Sr. Sub. Nts., 11/1/16
        1,475,000       1,545,063  
    Bill Barrett Corp., 9.875% Sr. Nts., 7/15/16
        2,365,000       2,607,413  
    BreitBurn Energy Partners LP, 8.625% Sr. Unsec. Nts., 10/15/202
        2,805,000       2,833,050  
    Chaparral Energy, Inc.:
                   
    8.875% Sr. Unsec. Nts., 2/1/17
        2,680,000       2,733,600  
    9.875% Sr. Nts., 10/1/202
        2,715,000       2,877,900  
    Crosstex Energy LP/Crosstex Energy Finance Corp., 8.875% Sr. Unsec. Nts., 2/15/18
        795,000       855,619  
    Empresa Nacional del Petroleo, 5.25% Unsec. Nts., 8/10/202
        815,000       817,822  
    Gaz Capital SA:
                   
    6.212% Sr. Unsec. Unsub. Nts., 11/22/162
        1,910,000       2,034,150  
    7.288% Sr. Sec. Nts., 8/16/372
        4,415,000       4,613,675  
    8.125% Nts., 7/31/142
        1,530,000       1,736,550  
    8.146% Sr. Sec. Nts., 4/11/182
        2,680,000       3,115,500  
    8.625% Sr. Sec. Nts., 4/28/342
        1,680,000       2,024,400  
    9.25% Sr. Unsec. Unsub. Nts., 4/23/192
        3,175,000       3,917,315  
    KMG Finance Sub BV:
                   
    7% Sr. Unsec. Nts., 5/5/202
        1,150,000       1,201,750  
    9.125% Nts., 7/2/182
        3,580,000       4,206,500  
    11.75% Sr. Unsec. Nts., 1/23/152
        85,000       105,927  
    Linn Energy LLC, 8.625% Sr. Unsec. Nts., 4/15/202
        4,015,000       4,346,238  
    Lukoil International Finance BV:
                   
    6.125% Sr. Unsec. Nts., 11/9/202
        3,560,000       3,582,072  
    6.656% Sr. Unsec. Unsub. Bonds, 6/7/222
        610,000       620,675  
    7.25% Sr. Unsec. Unsub. Nts., 11/5/192
        595,000       645,575  
    MarkWest Energy Partners LP/MarkWest Energy Finance Corp., 6.75% Sr. Unsec. Nts., 11/1/20
        300,000       301,500  
    Murray Energy Corp., 10.25% Sr. Sec. Nts., 10/15/152
        6,535,000       6,894,425  
    Nak Naftogaz Ukraine, 9.50% Unsec. Nts., 9/30/14
        4,360,000       4,774,200  
    Odebrecht Drilling Norbe VIII/IX Ltd., 6.35% Sr. Sec. Nts., 6/30/212
        1,190,000       1,243,550  
    Pan American Energy LLC, 7.875% Sr. Unsec. Nts., 5/7/212
        2,270,000       2,423,225  
    Pemex Project Funding Master Trust, 6.625% Sr. Unsec. Unsub. Nts., 6/15/38
        1,510,000       1,541,296  
    Petrobras International Finance Co.:
                   
    5.75% Sr. Unsec. Unsub. Nts., 1/20/20
        1,120,000       1,167,676  
    5.875% Sr. Unsec. Nts., 3/1/18
        680,000       727,476  
    7.875% Sr. Unsec. Nts., 3/15/19
        3,040,000       3,608,997  
    Petroleos de Venezuela SA, 5.25% Sr. Unsec. Unsub. Nts., 4/12/17
        860,000       494,500  
    Petroleos Mexicanos:
                   
    5.50% Sr. Unsec. Unsub. Nts., 1/21/21
        1,650,000       1,678,875  
    6% Sr. Unsec. Unsub. Nts., 3/5/20
        1,380,000       1,469,700  
    8% Unsec. Unsub. Nts., 5/3/19
        940,000       1,137,400  
    Petroleum Co. of Trinidad & Tobago Ltd., 9.75% Sr. Unsec. Nts., 8/14/192
        2,380,000       2,867,900  
    Petroleum Export Ltd. Cayman SPV, 5.265% Sr. Nts., Cl. A3, 6/15/112
        348,893       348,296  
    PT Adaro Indonesia, 7.625% Nts., 10/22/192
        2,060,000       2,260,850  
    Quicksilver Resources, Inc., 11.75% Sr. Nts., 1/1/16
        2,260,000       2,644,200  
    Range Resources Corp.:
                   
    7.50% Sr. Unsec. Unsub. Nts., 10/1/17
        1,020,000       1,079,925  
    8% Sr. Unsec. Sub. Nts., 5/15/19
        2,530,000       2,767,188  
     
                         
        Principal            
        Amount         Value  
     
    Oil, Gas & Consumable Fuels Continued
                       
    SandRidge Energy, Inc.:
                       
    8.75% Sr. Unsec. Nts., 1/15/20
      $ 2,925,000         $ 3,020,063  
    9.875% Sr. Unsec. Nts., 5/15/162
        1,290,000           1,370,625  
    Tengizchevroil LLP, 6.124% Nts., 11/15/144
        1,068,156           1,124,235  
    TransCapitalInvest Ltd. for OJSC AK Transneft, 5.67% Sec. Bonds, 3/5/142
        1,700,000           1,804,023  


                    114,707,288  
     
                       
    Financials—4.5%
                       
    Capital Markets—0.8%
                       
    American General Finance, 6.90% Nts., Series J, 12/15/17
        3,375,000           2,742,188  
    Berry Plastics Holding Corp., 10.25% Sr. Unsec. Sub. Nts., 3/1/16
        1,230,000           1,213,088  
    Credit Suisse First Boston International, Export-Import Bank of Ukraine, 7.65% Sr. Sec. Bonds, 9/7/11
        700,000           712,250  
    FoxCo Acquisition Sub LLC, 13.375% Sr. Nts., 7/15/162
        165,000           181,500  
    IPIC GMTN Ltd., 5% Nts., 11/15/202
        1,580,000           1,554,205  
    Nationstar Mortgage LLC/ Nationstar Capital Corp., 10.875% Sr. Nts., 4/1/152
        7,205,000           7,114,938  
    Nuveen Investments, Inc., 5.50% Sr. Unsec. Nts., 9/15/15
        1,095,000           944,438  
    Pinafore LLC/Pinafore, Inc., 9% Sr. Sec. Nts., 10/1/182
        3,005,000           3,260,425  


                    17,723,032  
     
                       
    Commercial Banks—2.3%
                       
    Akbank TAS, 5.125% Sr. Unsec. Nts., 7/22/152
        2,050,000           2,080,750  
    Alfa Bank/Alfa Bond Issuance plc, 7.875% Nts., 9/25/172
        1,610,000           1,646,225  
    Banco BMG SA:
                       
    9.15% Nts., 1/15/164
        2,660,000           2,860,830  
    9.95% Unsec. Unsub. Nts., 11/5/192
        1,150,000           1,227,625  
    Banco Cruzeiro do Sul SA, 8.875% Sub. Nts., 9/22/202
        800,000           800,800  
    Banco de Credito del Peru:
                       
    5.375% Sr. Nts., 9/16/202
        1,200,000           1,188,000  
    6.95% Sub. Nts., 11/7/211,4
        1,510,000           1,585,500  
    9.75% Jr. Sub. Nts., 11/6/694
        800,000           932,000  
    Banco do Brasil SA:
                       
    5.375% Unsec. Sub. Nts., 1/15/212
        1,410,000           1,388,850  
    8.50% Jr. Sub. Perpetual Bonds2,15
        1,500,000           1,734,300  
    Banco PanAmericano SA, 8.50% Sr. Unsec. Sub. Nts., 4/23/202
        900,000           889,200  
    Bank of Scotland plc:
                       
    4.375% Sr. Sec. Nts., 7/13/16
        2,065,000     EUR     2,831,591  
    4.50% Sr. Sec. Nts., 7/13/21
        1,414,000     EUR     1,863,253  
    CIT Group, Inc., 7% Sr. Sec. Bonds, 5/1/17
        5,635,000           5,663,175  
    HSBK Europe BV:
                       
    7.25% Unsec. Unsub. Nts., 5/3/172
        710,000           724,200  
    9.25% Sr. Nts., 10/16/134
        8,420,000           9,240,950  
    ICICI Bank Ltd.:
                       
    5.50% Sr. Unsec. Nts., 3/25/152
        3,050,000           3,177,057  
    6.375% Bonds, 4/30/221,2
        3,060,000           3,075,731  
    Ongko International Finance Co. BV, 10.50% Sec. Nts., 3/29/042,3,5
        90,000            
    PrivatBank JSC/UK SPV Credit Finance plc, 8% Sr. Sec. Nts., 2/6/122
        1,240,000           1,230,700  
    Salisbury International Investments Ltd., 4.439% Sec. Nts., Series 2006-003, Tranche E, 7/20/111,4
        1,100,000           999,460  
    VEB Finance Ltd., 6.902% Sr. Unsec. Unsub. Nts., 7/9/202
        3,530,000           3,706,500  
    VTB Capital SA:
                       
    6.465% Sr. Sec. Unsub. Nts., 3/4/152
        2,350,000           2,458,570  
    6.551% Sr. Unsec. Nts., 10/13/202
        1,560,000           1,540,500  
    6.875% Sr. Sec. Nts., 5/29/182
        705,000           749,063  
    Yapi ve Kredit Bankasi/Unicredit Luxembourg SA, 5.188% Sr. Unsec. Nts., 10/13/154
        1,170,000           1,211,184  


                    54,806,014  
     
                       
    Consumer Finance—0.1%
                       
    JSC Astana Finance, 9.16% Nts., 3/14/123,5
        7,200,000           930,240  
    TMX Finance LLC/TitleMax Finance Corp., 13.25% Sr. Sec. Nts., 7/15/152
        2,410,000           2,663,050  


                    3,593,290  
     
                       
    Diversified Financial Services—0.7%
                       
    Autopistas del Nordeste Cayman Ltd., 9.39% Nts., 1/15/264
        2,809,723           2,542,799  
    BA Covered Bond Issuer, 4.25% Sec. Nts., 4/5/17
        425,000     EUR     577,594  
    Banco Invex SA, 29.174% Mtg.-Backed Certificates, Series 062U, 3/13/341,16
        4,830,734     MXN     1,234,068  
    BM&F BOVESPA SA, 5.50% Sr. Unsec. Nts., 7/16/202
        1,640,000           1,677,005  
    GMAC LLC, 8% Sr. Unsec. Nts., 11/1/31
        2,785,000           3,014,763  

                     
        Principal        
        Amount     Value  
     
    Diversified Financial Services Continued
                   
    ING Groep NV, 5.775% Jr. Unsec. Sub. Perpetual Bonds15
      $ 2,935,000     $ 2,538,775  
    JPMorgan Hipotecaria su Casita:
                   
    7.555% Sec. Nts., 8/26/354
      5,808,600  MXN     458,574  
    27.591% Mtg.-Backed Certificates, Series 06U, 9/25/351
      1,895,532  MXN     307,158  
    Tiers-BSP, 0%/8.60% Collateralized Trust, Cl. A, 6/15/972,17
        6,360,000       3,572,062  
    TNK-BP Finance SA, 7.25% Sr. Unsec. Unsub. Bonds, 2/2/202
        900,000       983,250  


                16,906,048  
     
                   
    Insurance—0.1%
                   
    International Lease Finance Corp.:
                   
    5.875% Unsec. Unsub. Nts., 5/1/13
        1,190,000       1,209,338  
    8.75% Sr. Unsec. Unsub. Nts., 3/15/172
        1,475,000       1,585,625  
    8.875% Sr. Unsec. Nts., 9/1/17
        295,000       319,706  


                3,114,669  
     
                   
    Real Estate Management & Development—0.3%
                   
    Realogy Corp., 10.50% Sr. Unsec. Nts., 4/15/14
        4,515,000       4,458,563  
    Wallace Theater Holdings, Inc., 12.50% Sr. Sec. Nts., 6/15/131,4
        2,230,000       2,280,175  


                6,738,738  
     
                   
    Thrifts & Mortgage Finance—0.2%
                   
    Banco Hipotecario SA, 9.75% Sr. Unsec. Nts., 4/27/162
        785,000       812,475  
    WM Covered Bond Program:
                   
    4% Sec. Mtg. Nts., Series 2, 9/27/16
      2,720,000  EUR     3,701,607  
    4.375% Sec. Nts., 5/19/14
      355,000  EUR     495,717  


                5,009,799  
     
                   
    Health Care—1.4%
                   
    Health Care Equipment & Supplies—0.4%
                   
    Accellent, Inc., 10% Sr. Sub. Nts., 11/1/172
        2,305,000       2,183,988  
    Alere, Inc., 8.625% Sr. Sub. Nts., 10/1/182
        1,040,000       1,058,200  
    Biomet, Inc., 11.625% Sr. Unsec. Sub. Nts., 10/15/17
        1,911,000       2,121,210  
    DJO Finance LLC/DJO Finance Corp., 9.75% Sr. Sub. Nts., 10/15/172
        735,000       760,725  
    Inverness Medical Innovations, Inc., 7.875% Sr. Unsec. Unsub. Nts., 2/1/16
        1,630,000       1,642,225  
    Universal Hospital Services, Inc., 8.50% Sr. Sec. Nts., 6/1/1513
        1,390,000       1,435,175  


                9,201,523  
     
                   
    Health Care Providers & Services—0.8%
                   
    Capella Healthcare, Inc., 9.25% Sr. Unsec. Nts., 7/1/172
        405,000       430,313  
    Catalent Pharma Solutions, Inc., 10.25% Sr. Unsec. Nts., 4/15/1513
        2,603,400       2,642,451  
    Gentiva Health Services, Inc., 11.50% Sr. Unsec. Unsub. Nts., 9/1/18
        2,405,000       2,633,475  
    HCA, Inc., 6.375% Nts., 1/15/15
        2,260,000       2,231,750  
    HEALTHSOUTH Corp.:
                   
    7.25% Sr. Unsec. Nts., 10/1/18
        1,475,000       1,508,188  
    7.75% Sr. Unsec. Nts., 9/15/22
        550,000       569,250  
    inVentiv Health, Inc., 10% Sr. Unsec. Nts., 8/15/182
        1,120,000       1,125,600  
    Multiplan, Inc., 9.875% Sr. Nts., 9/1/182
        1,920,000       2,044,800  
    OnCure Holdings, Inc., 11.75% Sr. Sec. Nts., 5/15/172
        1,095,000       1,040,250  
    Radiation Therapy Services, Inc., 9.875% Sr. Sub. Nts., 4/15/172
        1,065,000       1,067,663  
    UHS Escrow Corp., 7% Sr. Nts., 10/1/182
        225,000       231,750  
    US Oncology, Inc., 9.125% Sr. Sec. Nts., 8/15/17
        1,305,000       1,614,938  
    Vanguard Health Holding Co. II LLC/Vanguard Holding Co. II, Inc., 8% Sr. Nts., 2/1/18
        1,595,000       1,642,850  


                18,783,278  
     
                   
    Health Care Technology—0.0%
                   
    MedAssets, Inc., 8% Sr. Nts., 11/15/182
        920,000       929,200  
    Pharmaceuticals—0.2%
                   
    Mylan, Inc., 6% Sr. Nts., 11/15/182
        810,000       797,850  
    Valeant Pharmaceuticals International, Inc., 6.875% Sr. Unsec. Nts., 12/1/182
        765,000       763,088  
    Warner Chilcott Co. LLC, 7.75% Sr. Nts., 9/15/182
        3,340,000       3,390,100  


                4,951,038  
     
                   
    Industrials—3.3%
                   
    Aerospace & Defense—0.8%
                   
    BE Aerospace, Inc., 6.875% Sr. Nts., 10/1/20
        605,000       627,688  
    DynCorp International, Inc., 10.375% Sr. Unsec. Nts., 7/1/172
        4,910,000       5,057,300  
    Hawker Beechcraft Acquisition Co. LLC, 8.50% Sr. Unsec. Nts., 4/1/15
        7,305,000       5,460,488  
    TransDigm, Inc., 7.75% Sr. Sub. Nts., 12/15/182
        6,480,000       6,739,200  


                17,884,676  
     
                     
        Principal        
        Amount     Value  
     
    Air Freight & Logistics—0.0%
                   
    AMGH Merger Sub, Inc., 9.25% Sr. Sec. Nts., 11/1/182
      $ 770,000     $ 812,350  
     
                   
    Airlines—0.2%
                   
    Delta Air Lines, Inc., 12.25% Sr. Sec. Nts., 3/15/152
        3,845,000       4,354,463  
     
                   
    Building Products—0.3%
                   
    Associated Materials LLC, 9.125% Sr. Sec. Nts., 11/1/172
        1,105,000       1,157,488  
    Ply Gem Industries, Inc., 13.125% Sr. Unsec. Sub. Nts., 7/15/14
        5,190,000       5,540,325  
    Roofing Supply Group LLC/ Roofing Supply Finance, Inc., 8.625% Sr. Sec. Nts., 12/1/172
        1,100,000       1,138,500  


                7,836,313  
     
                   
    Commercial Services & Supplies—0.2%
                   
    West Corp.:
                   
    7.875% Sr. Nts., 1/15/192
        1,220,000       1,244,400  
    8.625% Sr. Unsec. Nts., 10/1/182
        2,665,000       2,838,225  


                4,082,625  
     
                   
    Construction & Engineering—0.2%
                   
    IIRSA Norte Finance Ltd., 8.75% Sr. Nts., 5/30/242
        3,876,077       4,331,516  
    Odebrecht Finance Ltd., 7% Sr. Unsec. Nts., 4/21/202
        780,000       842,400  


                5,173,916  
     
                   
    Industrial Conglomerates—0.1%
                   
    Sequa Corp., 11.75% Sr. Unsec. Nts., 12/1/152
        2,525,000       2,714,375  
     
                   
    Machinery—0.5%
                 
    Cleaver-Brooks, Inc., 12.25% Sr. Sec. Nts., 5/1/162
        2,540,000       2,708,275  
    Manitowoc Co., Inc. (The), 8.50% Sr. Unsec. Nts., 11/1/20
        2,805,000       2,994,338  
    Terex Corp., 8% Sr. Unsec. Sub. Nts., 11/15/17
        5,275,000       5,354,125  
    Thermadyne Holdings Corp., 9% Sr. Sec. Nts., 12/15/172
        1,325,000       1,373,031  


                12,429,769  
     
                   
    Marine—0.2%
                   
    Marquette Transportation Co., 10.875% Sr. Sec. Nts., 1/15/172
        2,930,000       3,003,250  
    Navios Maritime Acquisition Corp., 8.625% Sr. Sec. Nts., 11/1/172
        735,000       755,213  
    Navios Maritime Holdings, Inc.,/ Navios Maritime Finance U.S., Inc., 8.875% Sr. Sec. Nts., 11/1/17
        1,240,000       1,348,500  


                5,106,963  
     
                   
    Professional Services—0.2%
                   
    Altegrity, Inc., 10.50% Sr. Unsec. Sub. Nts., 11/1/152
        3,515,000       3,624,844  
    TransUnion LLC/TransUnion Financing Corp., 11.375% Sr. Unsec. Nts., 6/15/182
        660,000       755,700  


                4,380,544  
     
                   
    Road & Rail—0.4%
                   
    Hertz Corp., 7.50% Sr. Unsec. Nts., 10/15/182
        5,330,000       5,556,525  
    Kazakhstan Temir Zholy Finance BV, 6.375% Sr. Unsec. Nts., 10/6/202
        785,000       823,308  
    Panama Canal Railway Co., 7% Sr. Sec. Nts., 11/1/264
        1,425,760       1,290,313  
    Transnet Ltd., 10.80% Sr. Unsec. Nts., 11/6/23
      10,000,000  ZAR     1,665,411  


                9,335,557  
     
                   
    Trading Companies & Distributors—0.2%
                   
    Ashtead Capital, Inc., 9% Nts., 8/15/164
        1,060,000       1,110,350  
    RSC Equipment Rental, Inc., 10% Sr. Sec. Nts., 7/15/172
        470,000       531,100  
    United Rentals North America, Inc.:
                   
    8.375% Sr. Unsec. Sub. Nts., 9/15/20
        460,000       470,350  
    9.25% Sr. Unsec. Unsub. Nts., 12/15/19
        1,020,000       1,139,850  


                3,251,650  
     
                   
    Transportation Infrastructure—0.0%
                   
    Aeropuertos Argentina 2000 SA, 10.75% Sr. Sec. Nts., 12/1/204
        570,000       595,650  
    Information Technology—2.0%
                   
    Computers & Peripherals—0.2%
                   
    CDW LLC/CDW Finance Corp., 11% Sr. Unsec. Nts., 10/12/15
        1,295,000       1,350,038  
    Seagate HDD Cayman, 6.875% Sr. Unsec. Nts., 5/1/202
        2,740,000       2,630,400  


                3,980,438  
     
                   
    Electronic Equipment & Instruments—0.1%
                   
    RBS Global, Inc./Rexnord Corp., 11.75% Sr. Unsec. Sub. Nts., 8/1/16
        2,955,000       3,184,013  
    Internet Software & Services—0.5%
                   
    Bankrate, Inc., 11.75% Sr. Sec. Nts., 7/15/152
        1,620,000       1,806,300  
    ITC DeltaCom, Inc., 10.50% Sr. Sec. Nts., 4/1/16
        5,135,000       5,609,988  
    Telcordia Technologies, Inc., 11% Sr. Sec. Nts., 5/1/182
        3,970,000       4,009,700  


                11,425,988  

                     
        Principal        
        Amount     Value  
     
    IT Services—0.5%
                   
    Ceridian Corp., 11.25% Sr. Unsec. Nts., 11/15/15
      $ 2,145,000     $ 2,134,275  
    First Data Corp.:
                   
    8.875% Sr. Sec. Nts., 8/15/202
        2,390,000       2,533,400  
    9.875% Sr. Unsec. Nts., 9/24/15
        6,510,000       6,233,325  
    SunGard Data Systems, Inc.:
                   
    7.375% Sr. Unsec. Nts., 11/15/182
        765,000       772,650  
    7.625% Sr. Unsec. Nts., 11/15/202
        765,000       778,388  


                12,452,038  
     
                   
    Semiconductors & Semiconductor Equipment—0.7%
                   
    Advanced Micro Devices, Inc., 7.75% Sr. Unsec. Nts., 8/1/202
        1,340,000       1,396,950  
    Amkor Technology, Inc., 7.375% Sr. Unsec. Nts., 5/1/18
        1,445,000       1,510,025  
    Freescale Semiconductor, Inc.:
                   
    9.25% Sr. Sec. Nts., 4/15/182
        1,710,000       1,889,550  
    10.75% Sr. Unsec. Nts., 8/1/202
        4,430,000       4,850,850  
    NXP BV/NXP Funding LLC:
                   
    7.875% Sr. Sec. Nts., 10/15/14
        1,765,000       1,844,425  
    9.50% Sr. Unsec. Unsub. Nts., 10/15/15
        2,950,000       3,163,875  
    9.75% Sr. Sec. Nts., 8/1/182
        1,125,000       1,271,250  


                15,926,925  
     
                   
    Materials—3.3%
                   
    Chemicals—0.9%
                   
    Braskem Finance Ltd., 7.25% Sr. Unsec. Nts., 6/5/182
        2,135,000       2,252,425  
    Braskem SA, 7% Sr. Unsec. Nts., 5/7/202
        1,150,000       1,193,125  
    Ferro Corp., 7.875% Sr. Unsec. Nts., 8/15/18
        2,650,000       2,809,000  
    Hexion U.S. Finance Corp./Hexion Nova Scotia Finance ULC:
                   
    8.875% Sr. Sec. Nts., 2/1/18
        3,845,000       4,128,569  
    9% Sr. Sec. Nts., 11/15/202
        1,410,000       1,494,600  
    Huntsman International LLC, 8.625% Sr. Sub. Nts., 3/15/212
        300,000       325,500  
    Momentive Performance Materials, Inc.:
                   
    9% Sec. Nts., 1/15/212
        2,815,000       2,976,863  
    11.50% Sr. Unsec. Sub. Nts., 12/1/16
        2,455,000       2,675,950  
    Nalco Co., 6.625% Sr. Nts., 1/15/192
        485,000       498,338  
    Rhodia SA, 6.875% Sr. Nts., 9/15/202
        2,810,000       2,862,688  


                21,217,058  
     
                   
    Construction Materials—0.1%
                   
    CEMEX Espana SA, 9.25% Sr. Sec. Nts., 5/12/202
        872,000       861,100  
    CEMEX Finance LLC, 9.50% Sr. Sec. Bonds, 12/14/162
        1,275,000       1,321,219  
    Rearden G Holdings Eins GmbH, 7.875% Sr. Unsec. Nts., 3/30/202
        990,000       1,049,400  


                3,231,719  
     
                   
    Containers & Packaging—0.3%
                   
    Berry Plastics Corp., 9.75% Sr. Sec. Nts., 1/15/212
        3,830,000       3,810,850  
    Jefferson Smurfit Corp. (Escrow):
                   
    7.50% Sr. Unsec. Unsub. Nts., 6/1/133,5
        920,000       34,500  
    8.25% Sr. Unsec. Nts., 10/1/123,5
        2,560,000       96,000  
    Smurfit-Stone Container Corp. (Escrow):
                   
    8% Sr. Unsec. Unsub. Nts., 3/15/173,5
        1,780,000       84,550  
    8.375% Sr. Nts., 7/1/123,5
        925,000       34,688  
    Solo Cup Co., 8.50% Sr. Sub. Nts., 2/15/14
        3,140,000       2,841,700  


                6,902,288  
     
                   
    Metals & Mining—0.8%
                   
    Alrosa Finance SA, 7.75% Nts., 11/3/202
        1,580,000       1,664,925  
    CSN Islands XI Corp., 6.875% Sr. Unsec. Nts., 9/21/192
        750,000       813,750  
    Edgen Murray Corp., 12.25% Sr. Sec. Nts., 1/15/15
        3,340,000       2,922,500  
    JSC Severstal, 6.70% Nts., 10/25/172
        1,940,000       1,925,450  
    Steel Capital SA for OAO Severstal, 9.75% Sec. Nts., 7/29/132
        2,160,000       2,416,608  
    Vedanta Resources plc, 9.50% Sr. Unsec. Nts., 7/18/182
        7,715,000       8,476,856  


                18,220,089  
     
                   
    Paper & Forest Products—1.2%
                   
    ABI Escrow Corp., 10.25% Sr. Sec. Nts., 10/15/182
        2,255,000       2,480,500  
    Abitibi-Consolidated Co. of Canada (Escrow):
                   
    6% Sr. Unsec. Unsub. Nts., 6/20/133,5
        2,020,000       22,725  
    7.75% Sr. Unsec. Bonds, 6/15/113,5
        1,120,000       12,600  
    8.375% Sr. Unsec. Sub. Nts., 4/1/153,5
        2,705,000       30,431  
    8.85% Unsec. Bonds, 8/1/303,5
        1,010,000       12,625  
    Ainsworth Lumber Co. Ltd., 11% Sr. Unsec. Unsub. Nts., 7/29/152,13
        3,274,875       3,095,117  
    Appleton Papers, Inc., 10.50% Sr. Sec. Nts., 6/15/152
        5,630,000       5,601,850  
    Bowater Pulp & Paper Canada, Inc., 10.60% Sr. Unsec. Nts., 1/15/113,5
        2,760,000       745,200  
     
                     
        Principal        
        Amount     Value  
     
    Paper & Forest Products Continued
                   
    Bowater, Inc. (Escrow):
                   
    6.50% Sr. Unsec. Nts., 6/15/133,5
      $ 3,280,000     $ 147,600  
    9% Sr. Unsec. Nts., 8/1/093,5
        840,000       37,800  
    Catalyst Paper Corp., 11% Sr. Sec. Nts., 12/15/162
        3,611,000       3,421,423  
    Grupo Papelero Scribe SA, 8.875% Sr. Nts., 4/7/202
        1,315,000       1,301,850  
    Mercer International, Inc., 9.50% Sr. Unsec. Nts., 12/1/172
        2,290,000       2,364,425  
    NewPage Corp., 11.375% Sr. Sec. Nts., 12/31/14
        4,165,000       3,935,925  
    Verso Paper Holdings LLC, 11.375% Sr. Unsec. Sub. Nts., Series B, 8/1/16
        5,275,000       5,314,563  


                28,524,634  
     
                   
    Telecommunication Services—2.2%
                   
    Diversified Telecommunication Services—1.3%
                   
    Axtel SAB de CV, 9% Sr. Unsec. Nts., 9/22/192
        2,490,000       2,377,950  
    Broadview Networks Holdings, Inc., 11.375% Sr. Sec. Nts., 9/1/12
        1,485,000       1,459,013  
    Cincinnati Bell, Inc.:
                   
    8.25% Sr. Nts., 10/15/17
        1,310,000       1,303,450  
    8.75% Sr. Unsec. Sub. Nts., 3/15/18
        2,020,000       1,903,850  
    Intelsat Bermuda Ltd.:
                   
    11.25% Sr. Unsec. Nts., 2/4/17
        2,755,000       3,016,725  
    12.50% Sr. Unsec. Nts., 2/4/1713
        1,381,250       1,533,188  
    Intelsat Jackson Holdings SA, 7.25% Sr. Unsec. Nts., 10/15/202
        755,000       766,325  
    Level 3 Financing, Inc., 9.25% Sr. Unsec. Unsub. Nts., 11/1/14
        4,780,000       4,768,050  
    PAETEC Holding Corp., 9.50% Sr. Unsec. Unsub. Nts., 7/15/15
        5,595,000       5,818,800  
    Telemar Norte Leste SA, 5.50% Sr. Unsec. Nts., 10/23/202
        4,162,000       4,026,735  
    Wind Acquisition Finance SA, 7.25% Sr. Sec. Nts., 2/15/182
        1,190,000       1,213,800  
    Windstream Corp., 8.125% Sr. Unsec. Unsub. Nts., 9/1/18
        1,295,000       1,366,225  
    Winstar Communications, Inc., 12.75% Sr. Nts., 4/15/103,5
        250,000        


                29,554,111  
     
                   
    Wireless Telecommunication Services—0.9%
                   
    America Movil SAB de CV:
                   
    6.125% Sr. Unsec. Unsub. Nts., 3/30/40
        925,000       985,569  
    8.46% Sr. Unsec. Unsub. Bonds, 12/18/36
      52,700,000  MXN     3,952,969  
    Cricket Communications, Inc., 7.75% Sr. Unsec. Nts., 10/15/202
        5,335,000       5,094,925  
    MetroPCS Wireless, Inc.:
                   
    6.625% Sr. Unsec. Nts., 11/15/20
        2,755,000       2,631,025  
    7.875% Sr. Unsec. Nts., 9/1/18
        2,520,000       2,627,100  
    MTS International Funding Ltd., 8.625% Sr. Unsec. Nts., 6/22/202
        1,650,000       1,882,980  
    Teligent, Inc., 11.50% Sr. Nts., 12/1/083,5
        500,000        
    VIP Finance Ireland Ltd., 9.125% Bonds, 4/30/182
        4,190,000       4,787,075  


                21,961,643  
     
                   
    Utilities—2.7%
                   
    Electric Utilities—1.5%
                   
    Centrais Eletricas Brasileiras SA, 6.875% Sr. Unsec. Unsub. Nts., 7/30/192
        1,350,000       1,532,250  
    Edison Mission Energy, 7% Sr. Unsec. Nts., 5/15/17
        3,935,000       3,138,163  
    Empresas Publicas de Medellin ESP, 7.625% Sr. Unsec. Nts., 7/29/192
        1,435,000       1,650,250  
    Energy Future Intermediate Holding Co. LLC, 10% Sr. Sec. Nts., 12/1/20
        2,817,000       2,919,181  
    Eskom Holdings Ltd., 10% Nts., Series ES23, 1/25/23
      34,000,000  ZAR     5,632,196  
    Eskom Holdings Ltd., 9.25% Bonds, Series ES18, 4/20/18
      10,000,000  ZAR     1,568,575  
    Israel Electric Corp. Ltd., 7.25% Nts., 1/15/192
        4,550,000       5,015,174  
    Majapahit Holding BV:
                   
    7.75% Nts., 10/17/162
        2,250,000       2,610,000  
    8% Sr. Unsec. Nts., 8/7/192
        1,150,000       1,349,813  
    National Power Corp., 5.875% Unsec. Unsub. Bonds, 12/19/16
      109,600,000  PHP     2,765,272  
    Texas Competitive Electric Holdings Co. LLC:
                   
    10.25% Sr. Unsec. Nts., Series A, 11/1/15
        10,405,000       5,930,850  
    10.25% Sr. Unsec. Nts., Series B, 11/1/15
        1,520,000       858,800  
    TGI International Ltd., 9.50% Nts., 10/3/172
        1,442,000       1,625,855  


                36,596,379  
     
                   
    Energy Traders—1.0%
                   
    Colbun SA, 6% Sr. Unsec. Nts., 1/21/202
        1,640,000       1,711,657  
    Dynegy Holdings, Inc., 8.375% Sr. Unsec. Nts., 5/1/16
        3,215,000       2,419,288  
    Energy Future Holdings Corp., 10% Sr. Sec. Nts., 1/15/202
        3,100,000       3,204,696  

                     
        Principal        
        Amount     Value  
     
    Energy Traders Continued
                   
    Foresight Energy LLC, 9.625% Sr. Unsec. Nts., 8/15/172
      $ 5,395,000     $ 5,772,650  
    GenOn Escrow Corp.:
                   
    9.50% Sr. Unsec. Nts., 10/15/182
        1,505,000       1,503,119  
    9.875% Sr. Nts., 10/15/202
        1,500,000       1,496,250  
    Power Sector Assets & Liabilities Management Corp.:
                   
    7.25% Sr. Gtd. Unsec. Nts., 5/27/192
        1,280,000       1,510,400  
    7.39% Sr. Gtd. Unsec. Nts., 12/2/242
        1,270,000       1,511,300  
    PT Cikarang Listindo/Listindo Capital BV, 9.25% Sr. Nts., 1/29/152
        1,150,000       1,298,161  
    United Maritime Group LLC, 11.75% Sr. Sec. Nts., 6/15/15
        3,645,000       3,672,338  


                24,099,859  
     
                   
    Gas Utilities—0.1%
                   
    Ferrellgas LP/Ferrellgas Finance Corp., 6.50% Sr. Nts., 5/1/212
        2,295,000       2,249,100  
    Water Utilities—0.1%
                   
    Cia de Saneamento Basico do Estado de Sao Paulo, 6.25% Sr. Unsec. Nts., 12/16/202
        1,055,000       1,072,935  
     
                 
    Total Corporate Bonds and Notes
    (Cost $690,263,841)
                716,047,088  
                     
        Shares          
     
    Preferred Stocks—0.5%
                   
    Ally Financial, Inc., 7%, Non-Vtg.2
        7,436       7,028,182  
    AmeriKing, Inc., 13% Cum. Sr. Exchangeable, Non-Vtg.5,13
        4,253        
    Eagle-Picher Holdings, Inc., 11.75% Cum. Exchangeable, Series B, Non-Vtg.5
        5,000        
    Greektown Holdings LLC, Preferred5
        45,600       4,844,088  
    ICG Holdings, Inc., 14.25% Exchangeable, Non-Vtg.5,13
        151        
     
                 
    Total Preferred Stocks
    (Cost $11,475,299)
                11,872,270  
     
                   
    Common Stocks—1.0%
                   
    AbitibiBowater, Inc.5
        116,803       2,764,727  
    American Media Operations, Inc.5
        161,731       2,637,137  
    American Media, Inc.4,5
        1,562        
    Arco Capital Corp. Ltd.4,5
        690,638       1,381,276  
    Charter Communications, Inc., Cl. A5
        64,672       2,518,328  
    Global Aviation Holdings, Inc.5
        100       1,000  
    Greektown Superholdings, Inc.5
        3,450       340,929  
    Kaiser Aluminum Corp.
        229       11,471  
    MHP SA, GDR 2,5
        56,610       968,031  
    Orbcomm, Inc.5
        375       971  
    Premier Holdings Ltd.5
        18,514        
    Smurfit-Stone Container Corp.5
        279,168       7,146,701  
    Visteon Corp. 5
        98,473       6,649,094  
     
                 
    Total Common Stocks
    (Cost $32,033,407)
                24,419,665  
                     
        Units          
     
    Rights, Warrants and Certificates—0.0%
                   
    ASG Warrant Corp. Wts., Strike Price $0.01, Exp. 5/15/184,5
        4,275       534,375  
    Global Aero Logistics, Inc. Wts., Strike Price $10, Exp. 2/28/115
        266       3  
    MediaNews Group, Inc. Wts., Strike Price $0.001, Exp. 3/19/175
        11,668       420  
     
                 
    Total Rights, Warrants and Certificates
    (Cost $191,025)
                534,798  
                     
        Principal          
        Amount          
     
    Structured Securities—6.3%
                   
    Barclays Bank plc:
                   
    Indonesia (Republic of) Total Return Linked Bonds, 10.50%, 8/19/30
      10,440,000,000  IDR     1,284,836  
    Indonesia (Republic of) Total Return Linked Bonds, 10.50%, 8/19/30
      13,870,000,000  IDR     1,706,961  
    Indonesia (Republic of) Total Return Linked Bonds, Series 22, 11%, 9/17/25
      10,380,000,000  IDR     1,346,507  
    Indonesia (Republic of) Total Return Linked Nts., 10%, 9/18/24
      9,240,000,000  IDR     1,123,631  
    Indonesia (Republic of) Total Return Linked Nts., 10%, 9/18/24
      15,630,000,000  IDR     1,900,688  
    Indonesia (Republic of) Total Return Linked Nts., Series 51, 10.50%, 8/19/30
      2,650,000,000  IDR     326,132  
    Indonesia (Republic of) Total Return Linked Nts., Series 51, 11%, 9/17/25
      2,650,000,000  IDR     343,761  
    Citigroup Funding, Inc.:
                   
    Indonesia (Republic of) Credit Linked Nts., 10%, 9/19/24
      12,730,000,000  IDR     1,548,033  
    Indonesia (Republic of) Credit Linked Nts., Series 23, 11%, 9/17/25
      6,920,000,000  IDR     897,671  
    Indonesia (Republic of) Total Return Linked Nts., 11%, 9/17/25
      2,100,000,000  IDR     272,415  
    Instituto Costarricense De Eletricidad Total Return Linked Nts., 2.288%, 10/25/111
        1,960,000       1,968,017  
    Kenya (Republic of) Credit Linked Bonds, Series 5, 14%, 3/9/114
      1,920,000  GHS     1,296,065  
    Ukraine (Republic of) Credit Linked Nts., 5.50%, 9/1/151,4
      19,540,000  UAH     2,116,230  
     
                     
        Principal        
        Amount     Value  
     
    Structured Securities Continued
                   
    Citigroup Global Markets Holdings, Inc.:
                   
    Colombia (Republic of) Credit Linked Bonds, 11.25%, 10/25/184
      3,255,000,000  COP   $ 2,043,672  
    Colombia (Republic of) Credit Linked Nts., 13.37%, 2/26/154,16
      2,199,000,000  COP     2,566,672  
    Colombia (Republic of) Credit Linked Nts., Series 01, 13.37%, 2/26/154,16
      811,000,000  COP     946,599  
    Colombia (Republic of) Credit Linked Nts., Series 02, 13.37%, 2/26/154,16
      1,345,000,000  COP     1,569,883  
    Colombia (Republic of) Total Return Linked Bonds, Series 2, 11%, 7/27/20
      2,665,000,000  COP     1,688,883  
    Dominican Republic Unsec. Credit Linked Nts., 15%, 3/12/124
      49,300,000  DOP     1,356,633  
    Credit Suisse First Boston International:
                   
    Moitk Total Return Linked Nts., 21%, 3/30/115,20
      53,910,000  RUR     5,294  
    Russian Oreniz Total Return Linked Nts., 9.24%, 2/24/121
      105,151,500  RUR     3,240,051  
    Credit Suisse First Boston, Inc. (Nassau Branch), Russian Specialized Construction & Installation Administration Total Return Linked Nts., 5/20/105,20
      97,250,000  RUR     318  
    Credit Suisse Group AG, Russian Moscoblgaz Finance Total Return Linked Nts., 9.25%, 6/27/12
      74,550,000  RUR     2,233,059  
    Credit Suisse International:
                   
    OAO Gazprom Total Return Linked Nts., 13.12%, 6/28/121
      41,550,000  RUR     1,487,378  
    OAO Gazprom Total Return Linked Nts., 13.12%, 6/28/121
      30,880,000  RUR     1,105,421  
    OAO Gazprom Total Return Linked Nts., 13.12%, 6/28/121
      44,460,000  RUR     1,591,548  
    Deutsche Bank AG:
                   
    Arrendadora Capita Corp. SA de CV/Capita Corp. (The) de Mexico SA de CV Credit Linked Nts., 9.09%, 1/7/11
      405,418  MXN     31,432  
    Arrendadora Capita Corp. SA de CV/Capita Corp. (The) de Mexico SA de CV Credit Linked Nts., 9.65%, 1/7/11
      269,791  MXN     20,917  
    Coriolanus Ltd. Sec. Credit Linked Bonds, Series 128, 3.01%, 4/30/254,11
        1,966,981       1,266,194  
    Coriolanus Ltd. Sec. Credit Linked Bonds, 3.064%, 4/30/254,11
        2,506,237       1,613,327  
    Coriolanus Ltd. Sec. Credit Linked Bonds, 3.103%, 4/30/254,11
        2,163,734       1,392,849  
    Deutsche Bank AG: Continued Coriolanus Ltd. Sec. Credit Linked Bonds, 3.138%, 4/30/254,11
        1,934,106       1,245,032  
    Coriolanus Ltd. Sec. Credit Linked Bonds, 3.191%, 4/30/254,11
        2,408,118       1,550,165  
    Coriolanus Ltd. Sec. Credit Linked Bonds, 3.242%, 4/30/254,11
        2,748,501       1,769,278  
    Coriolanus Ltd. Sec. Credit Linked Bonds, 3.269%, 4/30/254,11
        2,195,731       1,413,446  
    Coriolanus Ltd. Sec. Credit Linked Bonds, 3.346%, 4/30/254,11
        2,063,894       1,328,580  
    Coriolanus Ltd. Sec. Credit Linked Nts., 10.855%, 12/31/174,16
      17,990,000  BRR     9,118,855  
    Coriolanus Ltd. Sec. Credit Linked Nts., Series 113, 9%, 4/26/111,4
        655,000       717,618  
    Indonesia (Republic of) Credit Linked Nts., 10.50%, 8/23/30
      40,660,000,000  IDR     5,003,969  
    Indonesia (Republic of) Credit Linked Nts., 12.80%, 6/22/21
      11,690,000,000  IDR     1,747,590  
    Indonesia (Republic of) Credit Linked Nts., Series 02, 12.80%, 6/22/21
      14,700,000,000  IDR     2,197,568  
    Indonesia (Republic of) Credit Linked Nts., Series 03, 11%, 9/17/25
      6,740,000,000  IDR     874,322  
    JSC Gazprom Total Return Linked Nts., 13.12%, 6/28/121
      38,600,000  RUR     1,381,776  
    Opic Reforma I Credit Linked Nts., Cl. 1A, 7.905%, 9/24/141,4
      14,850,000  MXN     1,205,113  
    Opic Reforma I Credit Linked Nts., Cl. 1B, 7.905%, 9/24/141,4
      2,970,000  MXN     241,023  
    Opic Reforma I Credit Linked Nts., Cl. 1C, 7.905%, 9/24/141,4
      4,950,000  MXN     401,704  
    Opic Reforma I Credit Linked Nts., Cl. 1D, 7.905%, 9/24/141,4
      2,475,000  MXN     200,852  
    Opic Reforma I Credit Linked Nts., Cl. 1E, 7.905%, 9/24/141,4
      3,465,000  MXN     281,193  
    Opic Reforma I Credit Linked Nts., Cl. 2A, 8.405%, 5/22/151,4
      1,417,014  MXN     114,994  
    Opic Reforma I Credit Linked Nts., Cl. 2B, 8.405%, 5/22/151,4
      2,479,100  MXN     201,185  
    Opic Reforma I Credit Linked Nts., Cl. 2C, 8.405%, 5/22/151,4
      37,378,810  MXN     3,033,380  
    Opic Reforma I Credit Linked Nts., Cl. 2D, 8.405%, 5/22/151,4
      2,724,116  MXN     221,069  
    Opic Reforma I Credit Linked Nts., Cl. 2E, 8.405%, 5/22/151,4
      1,979,122  MXN     160,610  
    Opic Reforma I Credit Linked Nts., Cl. 2F, 8.405%, 5/22/151,4
      1,263,966  MXN     102,574  
    Opic Reforma I Credit Linked Nts., Cl. 2G, 8.405%, 5/22/151,4
      232,771  MXN     18,890  
    Ukraine (Republic of) 5.5 yr. Total Return Linked Nts., 4.05%, 3/1/11
        885,000       858,848  


        Principal        
        Amount     Value  
     
    Structured Securities Continued
                   
    Deutsche Bank AG: Continued
                   
    Ukraine (Republic of) 6 yr. Total Return Linked Nts., 4.05%, 8/30/11
      $ 885,000     $ 760,472  
    Ukraine (Republic of) 6.5 yr. Total Return Linked Nts., 4.05%, 2/29/12
        885,000       674,441  
    Ukraine (Republic of) 7 yr. Total Return Linked Nts., 4.05%, 8/30/12
        885,000       607,800  
    United Mexican States Credit Linked Nts., 9.52%, 1/7/11
      268,599  MXN     20,825  
    Eirles Two Ltd. Sec. Nts.:
                   
    Series 324, 3.653%, 4/30/121,4
        4,100,000       3,685,900  
    Series 335, 2.103%, 4/30/121,4
        6,300,000       5,993,190  
    Goldman Sachs & Co., Turkey (Republic of) Credit Linked Nts., 14.802%, 3/29/172,11
      21,980,000  TRY     7,535,666  
    Goldman Sachs Capital Markets LP, Colombia (Republic of) Credit Linked Nts., 10.476%, 2/8/374,11
      63,720,800,000  COP     1,954,768  
    Hallertau SPC Credit Linked Nts.:
                   
    Series 2007-01, 2.51%, 12/20/171,4
        6,250,000       5,625,000  
    Series 2008-01, 9.888%, 8/2/104,5,11,20
      14,337,604  BRR     863,711  
    Series 2008-2A, 6.752%, 9/17/131,4
        13,358,125       13,653,340  
    JPMorgan Chase & Co.:
                   
    Colombia (Republic of) Credit Linked Nts., 11%, 7/28/204
      1,315,000,000  COP     833,313  
    Indonesia (Republic of) Credit Linked Bonds, 8.25%, 7/19/212
      13,410,000,000  IDR     1,531,103  
    Indonesia (Republic of) Credit Linked Bonds, Series 04, 11%, 9/17/252
      2,650,000,000  IDR     343,761  
    Indonesia (Republic of) Credit Linked Nts., Series 04, 10.50%, 8/19/302
      6,700,000,000  IDR     824,560  
    Indonesia (Republic of) Total Return Linked Nts., 10.50%, 8/19/302
      1,190,000,000  IDR     146,452  
    Indonesia (Republic of) Total Return Linked Nts., Series 53, 11%, 9/17/252
      2,100,000,000  IDR     272,415  
    JSC Gazprom Credit Linked Nts., Series 4, 13.12%, 6/28/121
      45,990,000  RUR     1,646,318  
    JPMorgan Chase Bank NA:
                   
    Export-Import Bank Total Return Linked Bonds, 6.55%, 3/13/13
      225,000,000  INR     4,806,944  
    Indonesia (Republic of) Credit Linked Nts., Series 2, 10.50%, 8/19/302
      24,100,000,000  IDR     2,965,953  
    Indonesia (Republic of) Credit Linked Nts., Series 2, 11%, 9/17/252
      15,710,000,000  IDR     2,037,922  
    Indonesia (Republic of) Credit Linked Nts., Series 3, 11%, 9/17/252
      7,420,000,000  IDR     962,532  
    Russian Federation Credit Linked Bonds, 10%, 9/30/111,2
      130,790,000  RUR     4,440,930  
    LB Peru Trust II Certificates, Series 1998-A, 2/28/1620
        363,871       36,387  
    Lehman Brothers Treasury Co. BV, Microvest Capital Management LLC Credit Linked Nts., 7.55%, 5/24/124
        2,058,126       1,246,813  
    Merrill Lynch, Colombia (Republic of) Credit Linked Nts., 10%, 11/17/164
      1,784,000,000  COP     999,876  
    Morgan Stanley:
                   
    Peru (Republic of) Credit Linked Nts., 6.25%, 3/23/172
      4,885,000  PEN     1,495,935  
    Russian Federation Total Return Linked Bonds, Series 007, Cl. VR, 5%, 8/22/34
      74,728,733  RUR     1,154,894  
    Morgan Stanley Capital Services, Inc.:
                   
    Brazil (Federal Republic of) Credit Linked Nts., 12.551%, 1/5/222,11
      28,914,000  BRR     2,586,201  
    GISAD Sr. Unsec. Credit Linked Nts., 166.572%, 4/2/1311
      6,386,000  EUR     426,683  
    United Mexican States Credit Linked Nts., 5.64%, 11/20/154
        2,000,000       1,803,200  
    Standard Bank Group Ltd., Ghana (Republic of) Credit Linked Bonds, 10.915%, 3/23/114,11
      1,200,000  GHS     786,057  
    Standard Charter Bank, Kenya (Republic of) Credit Linked Bonds, 14%, 3/9/111,4
      730,000  GHS     492,636  
    UBS AG, Ghana (Republic of) Credit Linked Nts., 14.47%, 12/28/114
      1,222,052  GHS     838,824  
     
                 
    Total Structured Securities
    (Cost $166,068,663)
                149,735,533  
     
                   
    Event-Linked Bonds—1.8%
                   
    Akibare Ltd. Catastrophe Linked Nts., Cl. A, 3.234%, 5/22/121,2
        1,484,000       1,494,388  
    Atlas V Capital Ltd. Catastrophe Linked Nts., Series 2, 11.79%, 2/24/121,2
        644,000       676,071  
    Blue Fin Ltd. Catastrophe Linked Nts., 9.25%, 5/28/131,2
        334,000       341,749  
    Caelus Re Ltd. Catastrophe Linked Nts., 6.50%, 6/7/111,2
        449,000       453,277  
     
                     
        Principal        
        Amount     Value  
     
    Event-Linked Bonds Continued
                   
    Calypso Capital Ltd. Catastrophe Linked Nts., Series 2010-1, Cl. A, 4.514%, 1/10/141,2
      608,000  EUR   $ 809,693  
    East Lane Re II Ltd. Catastrophe Linked Nts., 14.79%, 4/7/111,2
        2,207,000       2,250,974  
    East Lane Re III Ltd. Catastrophe Linked Nts., 10.54%, 3/16/121,2
        2,651,000       2,759,691  
    Fhu-Jin Ltd. Catastrophe Linked Nts., Cl. B, 4.186%, 8/10/111,2
        2,263,000       2,279,746  
    Foundation Re III Ltd. Catastrophe Linked Nts., Series 1-A, 5.75%, 2/3/141,2
        985,000       980,272  
    Lodestone Re Ltd. Catastrophe Linked Nts., Series A-2, 7.25%, 1/8/141
        1,020,000       1,021,352  
    Longpoint Re Ltd. Catastrophe Linked Nts.:
                   
    5.40%, 12/18/131,2
        1,505,000       1,523,512  
    5.40%, 12/24/121,2
        1,287,000       1,306,949  
    Mariah Re Ltd. Catastrophe Linked Nts.:
                   
    6.25%, 1/8/141,2
        311,000       313,939  
    Series 2010, 8.50%, 1/8/171,2
        649,000       650,574  
    Merna Reinsurance II Ltd. Catastrophe Linked Nts., 3.65%, 4/8/131,2
        1,532,000       1,551,610  
    Midori Ltd. Catastrophe Linked Nts., 3.039%, 10/24/121,2
        2,604,000       2,601,656  
    Montana Re Ltd. Catastrophe Linked Nts.:
                   
    9.803%, 1/8/141,2
        1,129,000       1,129,790  
    12.203%, 1/8/141,2
        370,000       370,148  
    16.703%, 1/8/141,2
        541,000       540,973  
    Multicat Mexico 2009 Ltd. Catastrophe Linked Nts.:
                   
    10.372%, 10/19/121,2
        471,000       499,684  
    11.622%, 10/19/121,2
        1,407,000       1,505,771  
    Muteki Ltd. Catastrophe Linked Nts., 4.684%, 5/24/111,2
        1,650,000       1,658,250  
    Redwood Capital XI Ltd. Catastrophe Linked Nts., 6.25%, 1/10/111,2
        1,046,000       1,045,974  
    Residential Reinsurance 2007 Ltd. Catastrophe Linked Nts., Series CL2, 11.796%, 6/6/111,2
        2,035,000       2,093,608  
    Residential Reinsurance Ltd. Catastrophe Linked Nts.:
                   
    6.60%, 6/6/131,2
        710,000       714,562  
    8.90%, 6/6/131,2
        421,000       435,556  
    13%, 6/6/131,2
        421,000       439,503  
    13%, 6/6/131,2
        710,000       723,277  
    Series CL1, 6.377%, 6/6/131,2
        830,000       825,186  
    Series CL2, 7.377%, 6/6/131,2
        467,000       466,510  
    Series CL3, 10.877%, 6/6/131,2
        250,000       249,494  
    Successor X Ltd. Catastrophe Linked Nts.:
                   
    12.887%, 12/13/131,2
        498,000       498,560  
    14.637%, 12/13/131,2
        332,000       332,365  
    16.75%, 4/4/131,2
        1,394,000       1,307,363  
    Vega Capital Ltd. Catastrophe Linked Nts.:
                   
    5.65%, 12/13/131,2
        669,000       670,221  
    Series D, 0%, 6/24/112,11
        3,304,000       6,434,540  
     
                 
    Total Event-Linked Bonds
    (Cost $39,421,616)
                42,956,788  
                                     
        Expiration     Strike                
        Date     Price     Contracts          
     
    Options Purchased—0.0%
                                   
    Polish Zloty (PLZ) Put5
        1/6/11     $ 2.97       117,685,000       284,994  
    Polish Zloty (PLZ) Put5
        1/6/11       3.00       118,900,000       166,044  
    Polish Zloty (PLZ) Put5
        1/14/11       3.00       118,920,000       391,445  
     
                                 
    Total Options Purchased
    (Cost $1,592,838)
                                842,483  
                     
        Shares          
     
    Investment Companies—18.5%
                   
    JPMorgan U.S. Treasury Plus Money Market Fund, Agency Shares, 0.00%12,18
        2,438,711       2,438,711  
    Oppenheimer Institutional Money Market Fund, Cl. E, 0.21%18,19
        83,436,389       83,436,389  
    Oppenheimer Master Event-Linked Bond Fund, LLC19
        1,103,918       12,419,505  
    Oppenheimer Master Loan Fund, LLC19
        29,466,809       341,533,974  
     
                 
    Total Investment Companies
    (Cost $431,488,334)
                439,828,579  
    Total Investments, at Value
    (Cost $2,378,722,901)
        101.8 %     2,424,268,158  
    Liabilities in Excess of Other Assets
        (1.8 )     (42,173,546 )


    Net Assets
        100.0 %   $ 2,382,094,612  


    Footnotes to Statement of Investments
    Principal amount is reported in U.S. Dollars, except for those denoted in the following currencies:
         
    ARP
      Argentine Peso
    AUD
      Australian Dollar
    BRR
      Brazilian Real
    CAD
      Canadian Dollar
    COP
      Colombian Peso
    DKK
      Danish Krone
    DOP
      Dominican Republic Peso
    EGP
      Egyptian Pound
    EUR
      Euro
    GBP
      British Pound Sterling
    GHS
      Ghana Cedi
    HUF
      Hungarian Forint
    IDR
      Indonesia Rupiah
    ILS
      Israeli Shekel
    INR
      Indian Rupee
    JPY
      Japanese Yen
    KRW
      South Korean Won
    MXN
      Mexican Nuevo Peso
    MYR
      Malaysian Ringgit
    NOK
      Norwegian Krone
    NZD
      New Zealand Dollar
    PEN
      Peruvian New Sol
    PHP
      Philippines Peso
    PLZ
      Polish Zloty
    RUR
      Russian Ruble
    SEK
      Swedish Krona
    TRY
      New Turkish Lira
    UAH
      Ukraine Hryvnia
    ZAR
      South African Rand
    1.   Represents the current interest rate for a variable or increasing rate security.
     
    2.   Represents securities sold under Rule 144A, which are exempt from registration under the Securities Act of 1933, as amended. These securities have been determined to be liquid under guidelines established by the Board of Trustees. These securities amount to $508,214,125 or 21.33% of the Fund’s net assets as of December 31, 2010.
     
    3.   Issue is in default. See Note 1 of the accompanying Notes.
     
    4.   Restricted security. The aggregate value of restricted securities as of December 31, 2010 was $133,147,001, which represents 5.59% of the Fund’s net assets.
    See Note 6 of the accompanying Notes. Information concerning restricted securities is as follows:
                                     
                                Unrealized  
        Acquisition                     Appreciation  
    Security   Dates     Cost     Value     (Depreciation)  
     
    Aeropuertos Argentina 2000 SA, 10.75% Sr. Sec. Nts., 12/1/20
        12/15/10     $ 570,000     $ 595,650     $ 25,650  
    American Media, Inc.
        2/2/09       34,604             (34,604 )
    Arco Capital Corp. Ltd.
        2/27/07       10,359,570       1,381,276       (8,978,294 )
    ASG Warrant Corp. Wts., Strike Price $0.01, Exp. 5/15/18
        4/28/10-8/19/10       189,000       534,375       345,375  
    Ashtead Capital, Inc., 9% Nts., 8/15/16
        12/18/09-2/11/10       1,065,330       1,110,350       45,020  
    Autopistas del Nordeste Cayman Ltd., 9.39% Nts., 1/15/26
        11/21/06-10/20/09       2,609,456       2,542,799       (66,657 )
    Banco BMG SA, 9.15% Nts., 1/15/16
        12/15/05-7/31/07       2,661,099       2,860,830       199,731  
    Banco de Credito del Peru, 9.75% Jr. Sub. Nts., 11/6/69
        10/30/09       800,000       932,000       132,000  
    Banco de Credito del Peru, 6.95% Sub. Nts., 11/7/21
        10/31/06-11/18/09       1,502,244       1,585,500       83,256  
    Belize (Government of) Unsec. Unsub. Bonds, 6%, 2/20/29
        2/9/10-3/3/10       538,279       734,550       196,271  
    Citigroup Funding, Inc., Kenya (Republic of) Credit Linked Bonds, Series 5, 14%, 3/9/11
        9/28/10       1,362,380       1,296,065       (66,315 )
    Citigroup Funding, Inc., Ukraine (Republic of) Credit Linked Nts., 5.50%, 9/1/15
        9/7/10       2,016,865       2,116,230       99,365  
    Citigroup Global Markets Holdings, Inc., Colombia (Republic of) Credit Linked Bonds, 11.25%, 10/25/18
        12/9/08       1,373,150       2,043,672       670,522  
    Citigroup Global Markets Holdings, Inc., Colombia (Republic of) Credit Linked Nts., 13.37%, 2/26/15
        7/18/08       1,905,640       2,566,672       661,032  
    Citigroup Global Markets Holdings, Inc., Colombia (Republic of) Credit Linked Nts., Series 01, 13.37%, 2/26/15
        7/31/08       711,003       946,599       235,596  
    Citigroup Global Markets Holdings, Inc., Colombia (Republic of) Credit Linked Nts., Series 02, 13.37%, 2/26/15
        8/8/08       1,188,111       1,569,883       381,772  
    Citigroup Global Markets Holdings, Inc., Dominican Republic Unsec. Credit Linked Nts., 15%, 3/12/12
        3/7/07       1,479,820       1,356,633       (123,187 )
    Deutsche Alt-A Securities, Inc., Mtg. Pass-Through Certificates, Series 2007-RS1, Cl. A2, 0.761%, 1/27/37
        5/29/08       1,038,846       400,042       (638,804 )
    Deutsche Bank AG, Coriolanus Ltd. Sec. Credit Linked Bonds, 3.346%, 4/30/25
        4/16/09       1,302,929       1,328,580       25,651  
    Deutsche Bank AG, Coriolanus Ltd. Sec. Credit Linked Bonds, 3.269%, 4/30/25
        8/18/09       1,395,976       1,413,446       17,470  
    Deutsche Bank AG, Coriolanus Ltd. Sec. Credit Linked Bonds, 3.242%, 4/30/25
        9/25/09       1,751,716       1,769,278       17,562  
    Deutsche Bank AG, Coriolanus Ltd. Sec. Credit Linked Bonds, 3.191%, 4/30/25
        12/17/09       1,542,421       1,550,165       7,744  
    Deutsche Bank AG, Coriolanus Ltd. Sec. Credit Linked Bonds, 3.138%, 4/30/25
        3/30/10       1,245,315       1,245,032       (283 )
    Deutsche Bank AG, Coriolanus Ltd. Sec. Credit Linked Bonds, 3.103%, 4/30/25
        5/18/10       1,398,472       1,392,849       (5,623 )
     
                                     
                                Unrealized  
        Acquisition                     Appreciation  
    Security   Dates     Cost     Value     (Depreciation)  
     
    Deutsche Bank AG, Coriolanus Ltd. Sec. Credit Linked Bonds, 3.064%, 4/30/25
        7/16/10     $ 1,626,190     $ 1,613,327     $ (12,863 )
    Deutsche Bank AG, Coriolanus Ltd. Sec. Credit Linked Bonds, Series 128, 3.01%, 4/30/25
        10/8/10       1,284,012       1,266,194       (17,818 )
    Deutsche Bank AG, Coriolanus Ltd. Sec. Credit Linked Nts., Series 113, 9%, 4/26/11
        12/8/08       653,473       717,618       64,145  
    Deutsche Bank AG, Coriolanus Ltd. Sec. Credit Linked Nts., 10.855%, 12/31/17
        9/19/07       7,651,611       9,118,855       1,467,244  
    Deutsche Bank AG, Opic Reforma I Credit Linked Nts., Cl. 1A, 7.905%, 9/24/14
        12/27/07       1,364,764       1,205,113       (159,651 )
    Deutsche Bank AG, Opic Reforma I Credit Linked Nts., Cl. 1B, 7.905%, 9/24/14
        6/12/08       286,334       241,023       (45,311 )
    Deutsche Bank AG, Opic Reforma I Credit Linked Nts., Cl. 1C, 7.905%, 9/24/14
        8/12/08       487,085       401,704       (85,381 )
    Deutsche Bank AG, Opic Reforma I Credit Linked Nts., Cl. 1D, 7.905%, 9/24/14
        8/6/09       189,935       200,852       10,917  
    Deutsche Bank AG, Opic Reforma I Credit Linked Nts., Cl. 1E, 7.905%, 9/24/14
        9/10/09       259,017       281,193       22,176  
    Deutsche Bank AG, Opic Reforma I Credit Linked Nts., Cl. 2A, 8.405%, 5/22/15
        5/21/08       136,622       114,994       (21,628 )
    Deutsche Bank AG, Opic Reforma I Credit Linked Nts., Cl. 2B, 8.405%, 5/22/15
        6/12/08       239,007       201,185       (37,822 )
    Deutsche Bank AG, Opic Reforma I Credit Linked Nts., Cl. 2C, 8.405%, 5/22/15
        6/18/08       3,626,317       3,033,380       (592,937 )
    Deutsche Bank AG, Opic Reforma I Credit Linked Nts., Cl. 2D, 8.405%, 5/22/15
        7/8/08       264,086       221,069       (43,017 )
    Deutsche Bank AG, Opic Reforma I Credit Linked Nts., Cl. 2E, 8.405%, 5/22/15
        7/15/08       192,185       160,610       (31,575 )
    Deutsche Bank AG, Opic Reforma I Credit Linked Nts., Cl. 2F, 8.405%, 5/22/15
        8/8/08       124,426       102,574       (21,852 )
    Deutsche Bank AG, Opic Reforma I Credit Linked Nts., Cl. 2G, 8.405%, 5/22/15
        8/22/08       22,959       18,890       (4,069 )
    Deutsche Mortgage & Asset Receiving, Commercial Mtg. Pass-Through Certificates, Interest-Only Stripped Mtg. Backed Security, Series 2010-C1, Cl. XPA, 4.82%, 9/1/20
        10/27/10       531,543       520,100       (11,443 )
    Eirles Two Ltd. Sec. Nts., Series 324, 3.653%, 4/30/12
        4/17/07       4,103,577       3,685,900       (417,677 )
    Eirles Two Ltd. Sec. Nts., Series 335, 2.103%, 4/30/12
        9/17/07       6,230,062       5,993,190       (236,872 )
    Embarcadero Aircraft Securitization Trust, Airplane Receivable Nts., Series 2000-A, Cl. B, 8/15/25
        8/17/00       1,820,063             (1,820,063 )
    Ford Credit Auto Lease Trust, Automobile Receivable Nts., Series 2010-B, Cl. A2, 0.75%, 10/15/12
        10/21/10       619,988       620,001       13  
    Goldman Sachs Capital Markets LP, Colombia (Republic of) Credit Linked Nts., 10.476%, 2/8/37
        1/18/07       5,278,228       1,954,768       (3,323,460 )
    Hallertau SPC Credit Linked Nts., Series 2007-01, 2.51%, 12/20/17
        12/13/07       6,250,000       5,625,000       (625,000 )
    Hallertau SPC Credit Linked Nts., Series 2008-01, 9.888%, 8/2/10
        4/18/08-10/1/08       7,188,001       863,711       (6,324,290 )
    Hallertau SPC Credit Linked Nts., Series 2008-2A, 6.752%, 9/17/13
        10/23/08       13,478,173       13,653,340       175,167  
    HSBK Europe BV, 9.25% Sr. Nts., 10/16/13
        4/9/08-1/11/10       8,540,143       9,240,950       700,807  
    Ice 1 Em CLO Ltd./Ice 1 Em CLO Corp., Sr. Sec. Sub. Term Nts., Series 2007-1A, Cl. B, 2.294%, 8/15/22
        11/6/07       6,952,926       4,879,400       (2,073,526 )
    Ice 1 Em CLO Ltd./Ice 1 Em CLO Corp., Sr. Sec. Sub. Term Nts., Series 2007-1A, Cl. C, 3.594%, 8/15/22
        6/8/07       5,270,000       2,951,200       (2,318,800 )
    Ice 1 Em CLO Ltd./Ice 1 Em CLO Corp., Sr. Sec. Sub. Term Nts., Series 2007-1A, Cl. D, 5.594%, 8/15/22
        6/8/07       5,270,000       2,740,400       (2,529,600 )
    Interactive Data Corp., 10.25% Sr. Nts., 8/1/18
        7/20/10       965,000       1,056,675       91,675  
    JPMorgan Chase & Co., Colombia (Republic of) Credit Linked Nts., 11%, 7/28/20
        8/24/10       917,005       833,313       (83,692 )
    JPMorgan Chase Commercial Mortgage Securities Corp., Commercial Mtg. Pass-Through Certificates, Series 2007-LDPX, Cl. A2S2, 5.187%, 1/1/49
        7/14/10       1,372,625       1,404,178       31,553  
    JPMorgan Hipotecaria su Casita, 7.555% Sec. Nts., 8/26/35
        3/21/07       526,714       458,574       (68,140 )
    Lehman Brothers Treasury Co. BV, Microvest Capital Management LLC Credit Linked Nts., 7.55%, 5/24/12
        6/20/07       2,067,984       1,246,813       (821,171 )
    Merrill Lynch, Colombia (Republic of) Credit Linked Nts., 10%, 11/17/16
        10/20/06       762,393       999,876       237,483  
    Morgan Stanley Capital Services, Inc., United Mexican States Credit Linked Nts., 5.64%, 11/20/15
        11/3/05       2,000,000       1,803,200       (196,800 )
    NC Finance Trust, Collateralized Mtg. Obligation Pass-Through Certificates, Series 1999-I, Cl. ECFD, 1/25/29
        8/10/10       66,025       8,009       (58,016 )
    Panama Canal Railway Co., 7% Sr. Sec. Nts., 11/1/26
        10/29/07-2/28/08       1,399,291       1,290,313       (108,978 )
    Peru (Republic of) Sr. Unsec. Nts., 7.84%, 8/12/20
        11/10/10       2,674,159       2,652,722       (21,437 )
    Real Time Data Co., 11% Nts., 5/31/09
        6/30/99-5/31/01       110,538             (110,538 )


                                Unrealized  
        Acquisition                     Appreciation  
    Security   Dates     Cost     Value     (Depreciation)  
     
    Salisbury International Investments Ltd., 4.439% Sec. Nts., Series 2006-003, Tranche E, 7/20/11
        7/12/06     $ 1,100,000     $ 999,460     $ (100,540 )
    Southern States Cooperative, Inc., 11.25% Sr. Nts., 5/15/15
        9/22/10-9/23/10       2,700,941       2,705,100       4,159  
    Standard Bank Group Ltd., Ghana (Republic of) Credit Linked Bonds, 10.915%, 3/23/11
        9/22/10       820,477       786,057       (34,420 )
    Standard Charter Bank, Kenya (Republic of) Credit Linked Bonds, 14%, 3/9/11
        9/23/10       514,654       492,636       (22,018 )
    Tengizchevroil LLP, 6.124% Nts., 11/15/14
        4/29/05-3/16/10       1,110,357       1,124,235       13,878  
    Tower Automotive Holdings USA LLC/TA Holdings Finance, Inc., 10.625% Sr. Sec. Nts., 9/1/17
        8/13/10-12/31/10       5,487,635       6,056,640       569,005  
    UBS AG, Ghana (Republic of) Credit Linked Nts., 14.47%, 12/28/11
        12/22/06       1,335,951       838,824       (497,127 )
    Wallace Theater Holdings, Inc., 12.50% Sr. Sec. Nts., 6/15/13
        9/30/10-10/6/10       2,267,713       2,280,175       12,462  
    Yapi ve Kredit Bankasi/Unicredit Luxembourg SA, 5.188% Sr. Unsec. Nts., 10/13/15
        10/4/10       1,170,000       1,211,184       41,184  
                 
     
              $ 159,352,415     $ 133,147,001     $ (26,205,414 )
                 
    5.   Non-income producing security.
     
    6.   Interest-Only Strips represent the right to receive the monthly interest payments on an underlying pool of mortgage loans. These securities typically decline in price as interest rates decline. Most other fixed income securities increase in price when interest rates decline. The principal amount of the underlying pool represents the notional amount on which current interest is calculated. The price of these securities is typically more sensitive to changes in prepayment rates than traditional mortgage-backed securities (for example, GNMA pass-throughs). Interest rates disclosed represent current yields based upon the current cost basis and estimated timing and amount of future cash flows. These securities amount to $11,548,074 or 0.48% of the Fund’s net assets as of December 31, 2010.
     
    7.   When-issued security or delayed delivery to be delivered and settled after December 31, 2010. See Note 1 of the accompanying Notes.
     
    8.   The current amortization rate of the security’s cost basis exceeds the future interest payments currently estimated to be received. Both the amortization rate and interest payments are contingent on future mortgage pre-payment speeds and are therefore subject to change.
     
    9.   All or a portion of the security position is held in collateral accounts to cover the Fund’s obligations under certain derivative contracts. The aggregate market value of such securities is $2,608,409 See Note 5 of the accompanying Notes.
     
    10.   All or a portion of the security position is held in collateralized accounts to cover initial margin requirements on open futures contracts and written options on futures, if applicable. The aggregate market value of such securities is $10,692,420. See Note 5 of the accompanying Notes.
     
    11.   Zero coupon bond reflects effective yield on the date of purchase.
     
    12.   Interest rate is less than 0.0005%.
     
    13.   Interest or dividend is paid-in-kind, when applicable.
     
    14.   This Senior Loan will settle after December 31, 2010, at which time the interest rate will be determined.
     
    15.   This bond has no contractual maturity date, is not redeemable and contractually pays an indefinite stream of interest. Rate reported represents the current interest rate for this variable rate security.
     
    16.   Denotes an inflation-indexed security: coupon and principal are indexed to a consumer price index.
     
    17.   Denotes a step bond: a zero coupon bond that converts to a fixed or variable interest rate at a designated future date.
     
    18.   Rate shown is the 7-day yield as of December 31, 2010.
     
    19.   Is or was an affiliate, as defined in the Investment Company Act of 1940, at or during the period ended December 31, 2010, by virtue of the Fund owning at least 5% of the voting securities of the issuer or as a result of the Fund and the issuer having the same investment adviser. Transactions during the period in which the issuer was an affiliate are as follows:
                                     
        Shares     Gross     Gross     Shares  
        December 31, 2009     Additions     Reductions     December 31, 2010  
     
    OFI Liquid Assets Fund, LLC
        37,599,500       37,255,066       74,854,566        
    Oppenheimer Institutional Money Market Fund, Cl. E
        76,771,099       2,814,490,231       2,807,824,941       83,436,389  
    Oppenheimer Master Event-Linked Bond Fund, LLC
        1,404,749             300,831       1,103,918  
    Oppenheimer Master Loan Fund, LLC
        33,609,439       19,048,496       23,191,126       29,466,809  
     
                             
                        Realized  
        Value     Income     Gain (Loss)  
     
    OFI Liquid Assets Fund, LLC
      $     $ 36,907 a   $  
    Oppenheimer Institutional Money Market Fund, Cl. E
        83,436,389       298,773        
    Oppenheimer Master Event-Linked Bond Fund, LLC
        12,419,505       1,165,940 b     (91,384 )b
    Oppenheimer Master Loan Fund, LLC
        341,533,974       33,499,603 c     11,177,915 c
         
     
      $ 437,389,868     $ 35,001,223     $ 11,086,531  
         
    a.   Net of compensation to the securities lending agent and rebates paid to the borrowing counterparties.
     
    b.   Represents the amount allocated to the Fund from Oppenheimer Master Event-Linked Bond Fund, LLC.
     
    c.   Represents the amount allocated to the Fund from Oppenheimer Master Loan Fund, LLC.
    20. The reference asset underlying the structured security is in default. See Note 1 of the accompanying Notes.
    Valuation Inputs
    Various data inputs are used in determining the value of each of the Fund’s investments as of the reporting period end. These data inputs are categorized in the following hierarchy under applicable financial accounting standards:
    1) Level 1—unadjusted quoted prices in active markets for identical assets or liabilities (including securities actively traded on a securities exchange)
    2) Level 2—inputs other than unadjusted quoted prices that are observable for the asset or liability (such as unadjusted quoted prices for similar assets and market corroborated inputs such as interest rates, prepayment speeds, credit risks, etc.) 3)
    3) Level 3—significant unobservable inputs (including the Manager’s own judgments about assumptions that market participants would use in pricing the asset or liability).
    The table below categorizes amounts that are included in the Fund’s Statement of Assets and Liabilities as of December 31, 2010 based on valuation input level:
                                     
                        Level 3 –        
        Level 1 –     Level 2 –     Significant        
        Unadjusted     Other Significant     Unobservable        
        Quoted Prices     Observable Inputs     Inputs     Value  
     
    Assets Table
                                   
    Investments, at Value:
                                   
    Asset-Backed Securities
      $     $ 25,207,452     $ 10,800,935     $ 36,008,387  
    Mortgage-Backed Obligations
              356,158,118       1,581,294       357,739,412  
    U.S. Government Obligations
              77,424,320             77,424,320  
    Foreign Government Obligations
              555,733,839             555,733,839  
    Loan Participations
              11,124,996             11,124,996  
    Corporate Bonds and Notes
              714,302,091       1,744,997       716,047,088  
    Preferred Stocks
              7,028,182       4,844,088       11,872,270  
    Common Stocks
        13,410,229       6,649,094       4,360,342       24,419,665  
    Rights, Warrants and Certificates
              534,375       423       534,798  
    Structured Securities
              148,446,721       1,288,812       149,735,533  
    Event-Linked Bonds
              42,956,788             42,956,788  
    Options Purchased
              842,483             842,483  
    Investment Companies
        439,828,579                   439,828,579  
         
    Total Investments, at Value
        453,238,808       1,946,408,459       24,620,891       2,424,268,158  
    Other Financial Instruments:
                                   
    Appreciated swaps, at value
              4,207,790             4,207,790  
    Depreciated swaps, at value
              213,971             213,971  
    Futures margins
        1,746,212                   1,746,212  
    Foreign currency exchange contracts
              4,596,926             4,596,926  
         
    Total Assets
      $ 454,985,020     $ 1,955,427,146     $ 24,620,891     $ 2,435,033,057  
         
    Liabilities Table
                                   
    Other Financial Instruments:
                                   
    Appreciated swaps, at value
      $     $ (656,155 )   $     $ (656,155 )
    Depreciated swaps, at value
              (8,160,199 )           (8,160,199 )
    Futures margins
        (609,835 )                 (609,835 )
    Foreign currency exchange contracts
              (13,070,372 )           (13,070,372 )
         
    Total Liabilities
      $ (609,835 )   $ (21,886,726 )   $     $ (22,496,561 )


    Currency contracts and forwards, if any, are reported at their unrealized appreciation/depreciation at measurement date, which represents the change in the contract’s value from trade date. Futures, if any, are reported at their variation margin at measurement date, which represents the amount due to/from the Fund at that date. All additional assets and liabilities included in the above table are reported at their market value at measurement date.
    See the accompanying Notes for further discussion of the methods used in determining value of the Fund’s investments, and a summary of changes to the valuation methodologies, if any, during the reporting period.
    The table below shows the significant transfers between Level 2 and Level 3. The Fund’s policy is to recognize transfers in and transfers out as of the beginning of the reporting period.
                     
        Transfers out of     Transfers into  
        Level 2*     Level 3*  
     
    Assets Table
                   
    Investments, at Value:
                   
    Common Stocks
                   
    Consumer Discretionary
      $ (16 )   $ 16  
    Financials
        (1,726,595 )     1,726,595  
    Asset-Backed Securities
        (9,465,000 )     9,465,000  
    Mortgage-Backed Obligations
        (1,581,294 )     1,581,294  
    Corporate Bonds and Notes
        (902,993 )     902,993  
    Structured Securities
        (32,500 )     32,500  
         
    Total Assets
      $ (13,708,398 )   $ 13,708,398  
         
    *   Transferred from Level 2 to Level 3 because of the lack of observable market data due to a decrease in market activity for these securities.
    The following is a reconciliation of assets in which significant unobservable inputs (level 3) were used in determining fair value:
                                                             
                        Change in     Accretion/                    
                        Unrealized     (Amortization)     Net     Transfers in     Value as of  
        Value as of     Realized     Appreciation/     of Premium/     Purchases     and/or out     December 31,  
        December 31, 2009     Gain (Loss)     Depreciation     Discount1     (Sales)     of Level 3     2010  
     
    Assets Table
                                                           
    Investments, at Value:
                                                           
    Asset-Backed Securities
      $ 1,445,549     $     $ 1,201,850     $ 6,973     $ (1,318,437 )   $ 9,465,000     $ 10,800,935  
    Mortgage-Backed Obligations
                    45,749       41,375       (712,696 )     2,206,866       1,581,294  
    Foreign Government Obligations
        290,296                               (290,296 )      
    Corporate Bonds and Notes
              (3,162,655 )     3,262,017             731,723       913,912       1,744,997  
    Preferred Stocks
                    284,088             4,560,000             4,844,088  
    Common Stocks
        2,168       1,168       (3,885,767 )           6,516,162       1,726,611       4,360,342  
    Rights, Warrants and Certificates
        3             420                         423  
    Structured Securities
        7,574,561       (1,894,128 )     851,452       (90,646 )     (5,475,222 )     322,795       1,288,812  
         
    Total Assets
      $ 9,312,577     $ (5,055,615 )   $ 1,759,809     $ (42,298 )   $ 4,301,530     $ 14,344,888     $ 24,620,891  
         
    1.   Included in net investment income.
    Distribution of investments representing geographic holdings, as a percentage of total investments at value, is as follows:
                     
    Geographic Holdings   Value     Percent  
     
    United States
      $ 1,437,863,268       59.3 %
    Brazil
        120,230,627       5.0  
    Mexico
        72,780,616       3.0  
    Japan
        72,313,927       3.0  
    Russia
        68,443,986       2.8  
    Turkey
        57,737,556       2.4  
    South Africa
        52,509,644       2.2  
    Indonesia
        52,195,131       2.1  
    Colombia
        34,599,381       1.4  
    Poland
        33,518,479       1.4  
    Supranational
        33,410,175       1.4  
    Korea, Republic of South
        28,783,657       1.2  
    Argentina
        27,990,976       1.1  
    Peru
        25,270,331       1.0  
    Israel
        23,365,908       1.0  
    Ukraine
        22,725,255       0.9  
    Venezuela
        22,128,851       0.9  
    Canada
        21,256,301       0.9  
    India
        19,536,588       0.8  
    Egypt
        18,804,838       0.8  
    Kazakhstan
        18,357,110       0.8  
    Philippines
        15,949,104       0.7  
    United Kingdom
        13,064,624       0.5  
    Italy
        11,747,006       0.5  
    The Netherlands
        11,362,646       0.5  
    Germany
        11,043,189       0.5  
    Uruguay
        9,323,001       0.4  
    Greece
        8,753,270       0.4  
    Panama
        8,027,826       0.3  
    Ghana
        6,204,145       0.3  
    Australia
        6,123,830       0.2  
    Dominican Republic
        5,739,682       0.2  
    New Zealand
        4,885,052       0.2  
    Spain
        4,345,515       0.2  
    Hungary
        4,303,643       0.2  
    Ireland
        3,964,995       0.2  
    Malaysia
        3,573,619       0.1  
    France
        3,391,757       0.1  
    Bermuda
        3,016,725       0.1  
    Trinidad & Tobago
        2,867,900       0.1  
    Belgium
        2,828,655       0.1  
    Cayman Islands
        2,630,400       0.1  
    Chile
        2,529,479       0.1  
    Costa Rica
        1,968,017       0.1  
    Austria
        1,839,440       0.1  
    Qatar
        1,690,700       0.1  
    United Arab Emirates
        1,554,205       0.1  
    Luxembourg
        1,533,188       0.1  
    Sri Lanka
        1,354,938       0.1  
    Denmark
        961,735        
    European Union
        809,693        


    Geographic Holdings Continued   Value     Percent  
     
    Marshall Islands
      $ 755,213       %
    Belize
        734,550        
    Sweden
        709,807        
    Finland
        576,642        
    Norway
        281,362        
         
    Total
      $ 2,424,268,158       100.0 %
         
    Foreign Currency Exchange Contracts as of December 31, 2010 are as follows:
                                                     
                Contract                            
    Counterparty/           Amount     Expiration             Unrealized     Unrealized  
    Contract Description   Buy/Sell     (000's)     Dates     Value     Appreciation     Depreciation  
     
    Banc of America:
                                                   
    Argentine Peso (ARP)
      Buy   24,885  ARP     1/18/11-3/29/11     $ 6,213,506     $ 57,953     $  
    Chinese Renminbi (Yuan) (CNY)
      Buy   49,300  CNY     6/7/11       7,489,117       186,615       2,035  
    Euro (EUR)
      Sell   6,205  EUR     4/6/11       8,288,880       201,980        
    Indian Rupee (INR)
      Buy   213,500  INR     1/13/11       4,763,295       4,044        
    Indonesia Rupiah (IDR)
      Buy   4,439,000  IDR     1/10/11       491,894       11       1,163  
    Malaysian Ringgit (MYR)
      Buy   24,210  MYR     2/18/11       7,825,923       164,046        
    Philippines Peso (PHP)
      Sell   207,000  PHP     1/13/11       4,725,650             44,510  
    South Korean Won (KRW)
      Buy   4,514,000  KRW     1/24/11       3,971,706             10,825  
    South Korean Won (KRW)
      Sell   8,450,000  KRW     1/24/11       7,434,851             121,999  
    Swedish Krona (SEK)
      Buy   7,500  SEK     2/22/11       1,113,091       20,688        
                                         
     
                                        635,337       180,532  
    Bank Paribas Asia—FGN
                                                   
    Swedish Krona (SEK)
      Buy   130,565  SEK     2/9/11       19,386,336             396,765  
    Barclay’s Capital:
                                                   
    Australian Dollar (AUD)
      Buy   3,300  AUD     2/4/11       3,359,514       18,825        
    British Pound Sterling (GBP)
      Sell   710  GBP     2/22/11       1,106,496       2,481        
    Colombian Peso (COP)
      Buy   1,906,000  COP     7/5/11       999,474             6,331  
    Euro (EUR)
      Buy   1,650  EUR     2/22/11       2,204,566       24,421        
    Hong Kong Dollar (HKD)
      Buy   36,300  HKD     1/3/11       4,670,270       6,618        
    Hong Kong Dollar (HKD)
      Sell   36,300  HKD     2/28/11       4,672,444             6,634  
    Hungarian Forint (HUF)
      Buy   795,000  HUF     2/10/11       3,804,889             182,072  
    Japanese Yen (JPY)
      Sell   294,000  JPY     1/7/11       3,621,435             130,988  
    Norwegian Krone (NOK)
      Buy   6,900  NOK     2/22/11       1,179,427       29,789        
    South African Rand (ZAR)
      Buy   272,300  ZAR     2/9/11       41,091,691       1,452,996        
                                         
     
                                        1,535,130       326,025  
    Citigroup:
                                                   
    Chilean Peso (CLP)
      Buy   1,474,000  CLP     2/3/11-2/4/11       3,140,691             9,902  
    Chilean Peso (CLP)
      Sell   242,000  CLP     1/7/11-1/14/11       516,784       281       228  
    Colombian Peso (COP)
      Buy   1,270,000  COP     7/5/11       665,966             7,774  
    Euro (EUR)
      Sell   21,860  EUR     1/7/11-5/10/11       29,207,099       12,535       496,557  
    Swiss Franc (CHF)
      Sell   4,680  CHF     1/14/11       5,006,322             318,447  
                                         
     
                                        12,816       832,908  
    Citigroup EM:
                                                   
    Chilean Peso (CLP)
      Buy   248,000  CLP     1/14/11       529,308       8,300        
    Colombian Peso (COP)
      Sell   9,047,000  COP     2/18/11       4,756,668       27,929        
    Indian Rupee (INR)
      Buy   334,700  INR     3/3/11       7,401,392       53,423        
    Indonesia Rupiah (IDR)
      Buy   26,941,000  IDR     2/18/11       2,967,740             13,119  
    Mexican Nuevo Peso (MXN)
      Buy   135,490  MXN     1/18/11       10,957,419             62,263  
                                         
     
                                        89,652       75,382  
     
                                                     
    Counterparty/           Amount     Expiration             Unrealized     Unrealized  
    Contract Description   Buy/Sell     (000's)     Dates     Value     Appreciation     Depreciation  
     
    Credit Suisse:
                                                   
    British Pound Sterling (GBP)
      Buy   1,400  GBP     3/22/11     $ 2,181,324     $     $ 3,558  
    Chilean Peso (CLP)
      Sell   822,000  CLP     1/6/11       1,755,549             16,786  
    Euro (EUR)
      Sell   7,725  EUR     2/10/11       10,321,928       373,671        
    Hungarian Forint (HUF)
      Buy   924,000  HUF     2/10/11       4,422,286       14,241       189,417  
    Japanese Yen (JPY)
      Sell   424,000  JPY     1/12/11       5,223,058             66,695  
    New Turkish Lira (TRY)
      Buy   64,385  TRY     2/9/11-2/10/11       41,500,542             3,517,940  
    Polish Zloty (PLZ)
      Buy   1,900  PLZ     2/2/11       640,428             16,852  
    South African Rand (ZAR)
      Buy   6,760  ZAR     1/7/11       1,025,084       45,307        
    Swedish Krona (SEK)
      Buy   11,200  SEK     2/22/11       1,662,216       30,251        
    Swedish Krona (SEK)
      Sell   10,100  SEK     2/22/11       1,498,963             27,280  
    Swiss Franc (CHF)
      Buy   2,070  CHF     2/22/11       2,215,391       60,827        
    Swiss Franc (CHF)
      Sell   3,450  CHF     2/22/11       3,692,318             135,618  
                                         
     
                                        524,297       3,974,146  
    Credit Suisse EM:
                                                   
    Chilean Peso (CLP)
      Buy   822,000  CLP     1/6/11       1,755,549       64,365        
    Egyptian Pounds (EGP)
      Buy   26,900  EGP     1/10/11       4,622,998       9,487        
                                         
     
                                        73,852        
    Deutsche Bank Capital Corp.:
                                                   
    Australian Dollar (AUD)
      Sell   611  AUD     1/7/11       624,336             39,853  
    British Pound Sterling (GBP)
      Sell   1,520  GBP     1/7/11       2,369,687             3,807  
    Canadian Dollar (CAD)
      Buy   1,420  CAD     2/22/11       1,426,593       16,884        
    Canadian Dollar (CAD)
      Sell   6,020  CAD     1/7/11-2/22/11       6,050,305             119,576  
    Kazakhstan Tenge (KZT)
      Buy   186,200  KZT     2/28/11       1,265,856             5,134  
    Swiss Franc (CHF)
      Sell   587  CHF     1/7/11       627,869             42,128  
                                         
     
                                        16,884       210,498  
    Deutsche Bank EM:
                                                   
    Kazakhstan Tenge (KZT)
      Sell   186,200  KZT     2/28/11       1,265,856             11,984  
    Russian Ruble (RUR)
      Sell   5,140  RUR     1/12/11       168,095       3,238        
                                         
     
                                        3,238       11,984  
    Goldman Sachs EM:
                                                   
    Brazilian Real (BRR)
      Buy   9,190  BRR     2/2/11       5,493,407       77,969        
    Brazilian Real (BRR)
      Sell   27,615  BRR     2/2/11       16,507,120             149,758  
    Mexican Nuevo Peso (MXN)
      Buy   154,990  MXN     2/16/11       12,507,742       11,026       46,944  
    Mexican Nuevo Peso (MXN)
      Sell   41,400  MXN     2/2/11       3,344,612             136,304  
    South African Rand (ZAR)
      Buy   14,640  zAR     2/1/11       2,211,585       8,325        
                                         
     
                                        97,320       333,006  
    HSBC EM:
                                                   
    Brazilian Real (BRR)
      Sell   10,650  BRR     2/2/11       6,366,136             6,028  
    Israeli Shekel (ILS)
      Sell   23,900  ILS     1/31/11       6,731,952             180,417  
                                         
     
                                              186,445  
    JP Morgan Chase:
                                                   
    Chilean Peso (CLP)
      Buy   230,000  CLP     1/7/11       491,172       14,241        
    Euro (EUR)
      Buy   28,135  EUR     2/9/11       37,593,366             2,016,494  
    Euro (EUR)
      Sell   6,870  EUR     2/10/11       9,179,501       326,714        
    Malaysian Ringgit (MYR)
      Buy   5,070  MYR     2/10/11-2/18/11       1,638,887       53       3,213  
    Mexican Nuevo Peso (MXN)
      Buy   34,800  MXN     2/22/11       2,807,067       25,293        
    New Taiwan Dollar (TWD)
      Sell   150,000  TWD     1/12/11       5,146,558             154,047  
    Norwegian Krone (NOK)
      Buy   114,030  NOK     2/9/11       19,503,430             216,415  
     
                                                     
                Contract                            
    Counterparty/           Amount     Expiration             Unrealized     Unrealized  
    Contract Description   Buy/Sell     (000’s)     Dates     Value     Appreciation     Depreciation  
     
    JP Morgan Chase: Continued
                                                   
    Norwegian Krone (NOK)
      Sell   6,900  NOK     2/22/11     $ 1,179,427     $     $ 29,225  
    Philippines Peso (PHP)
      Buy   73,000  PHP     1/4/11       1,666,362       7,648        
    Singapore Dollar (SGD)
      Buy   560  SGD     5/10/11       436,371       1,538        
                                         
     
                                        375,487       2,419,394  
    JP Morgan EM:
                                                   
    Argentine Peso (ARP)
      Buy   6,735  ARP     3/29/11       1,662,120       37,271        
    Chinese Renminbi (Yuan) (CNY)
      Buy   51,890  CNY     6/7/11-6/20/11       7,882,693       217,015        
    Indonesia Rupiah (IDR)
      Buy   54,365,000  IDR     1/13/11       6,021,467       6,975        
    Malaysian Ringgit (MYR)
      Buy   25,260  MYR     2/18/11       8,165,337       136,859        
    Malaysian Ringgit (MYR)
      Sell   1,350  MYR     2/10/11       436,578       669        
    Philippines Peso (PHP)
      Buy   361,000  PHP     3/4/11       8,239,940       59,564        
    Philippines Peso (PHP)
      Sell   73,000  PHP     1/4/11       1,666,362             15,152  
                                         
     
                                        458,353       15,152  
    Morgan Stanley & Co., Inc.
                                                   
    Kazakhstan Tenge (KZT)
      Buy   186,000  KZT     2/28/11       1,264,496             6,430  
    Morgan Stanley EM:
                                                   
    Indian Rupee (INR)
      Buy   334,700  INR     2/1/11       7,441,346       17,591        
    Kazakhstan Tenge (KZT)
      Sell   186,000  KZT     2/28/11       1,264,496             4,760  
                                         
     
                                        17,591       4,760  
    Nomura Securities:
                                                   
    Japanese Yen (JPY)
      Buy   986,000  JPY     3/22/11       12,154,886       72,516        
    Japanese Yen (JPY)
      Sell   146,000  JPY     2/22/11       1,799,264             63,425  
    New Zealand Dollar (NZD)
      Buy   1,190  NZD     2/22/11       923,304       50,429        
    New Zealand Dollar (NZD)
      Sell   2,140  NZD     2/22/11       1,660,396             90,706  
    Norwegian Krone (NOK)
      Buy   113,920  NOK     2/9/11       19,484,616             245,379  
    Polish Zloty (PLZ)
      Buy   109,800  PLZ     2/9/11       36,994,345             2,384,770  
    Polish Zloty (PLZ)
      Sell   9,080  PLZ     2/2/11       3,060,571             11,698  
    South African Rand (ZAR)
      Buy   11,140  ZAR     2/1/11       1,682,859       6,942        
                                         
     
                                        129,887       2,795,978  
    RBS Greenwich Capital:
                                                   
    Euro (EUR)
      Sell   610  EUR     2/17/11       815,039       15,781        
    Swedish Krona (SEK)
      Buy   130,565  SEK     2/9/11       19,386,336             390,696  
    Swiss Franc (CHF)
      Buy   595  CHF     5/10/11       637,477       19,616        
                                         
     
                                        35,397       390,696  
    Standard NY EM
                                                   
    South African Rand (ZAR)
      Sell   31,290  ZAR     2/1/11       4,726,810             349,502  
    State Street:
                                                   
    Australian Dollar (AUD)
      Buy   5,110  AUD     2/22/11       5,191,188       197,747        
    Australian Dollar (AUD)
      Sell   1,630  AUD     2/22/11       1,655,897             63,078  
    British Pound Sterling (GBP)
      Sell   700  GBP     2/22/11       1,090,912       294       2,679  
    Hong Kong Dollar (HKD)
      Sell   36,300  HKD     1/3/11       4,670,270       14,266        
    Polish Zloty (PLZ)
      Buy   22,045  PLZ     2/2/11       7,430,647             252,947  
    South African Rand (ZAR)
      Buy   33,300  ZAR     2/1/11       5,030,449       379,378        
    South African Rand (ZAR)
      Sell   21,300  ZAR     2/1/11       3,217,675             242,065  
                                         
     
                                        591,685       560,769  
                                         
    Total unrealized appreciation and depreciation
                                      $ 4,596,926     $ 13,070,372  
                                         
    Futures Contracts as of December 31, 2010 are as follows:
                                             
                                        Unrealized  
                Number of     Expiration             Appreciation  
    Contract Description   Buy/Sell     Contracts     Date     Value     (Depreciation)  
     
    DAX Index
      Buy     20       3/18/11     $ 4,628,306     $ (48,874 )
    Euro-Bundesobligation
      Buy     68       3/8/11       11,386,795       (67,146 )
    Japan (Government of) Bonds, 10 yr.
      Buy     3       3/10/11       5,195,591       17,242  
    Japan (Government of) E-Mini Bonds, 10 yr.
      Sell     35       3/9/11       6,061,522       (1,076 )
    NASDAQ 100 E-Mini Index
      Buy     213       3/18/11       9,440,160       6,965  
    New Financial Times Stock Exchange 100 Index
      Buy     9       3/18/11       826,894       9,228  
    New Financial Times Stock Exchange 100 Index
      Sell     72       3/18/11       6,615,154       (73,880 )
    NIKKEI 225 Index
      Buy     13       3/10/11       817,404       (4,768 )
    NIKKEI 225 Index
      Sell     64       3/10/11       8,048,282       (1,962 )
    Standard & Poor’s 500 E-Mini
      Sell     520       3/18/11       32,578,000       (421,876 )
    U.S. Treasury Long Bonds, 20 yr.
      Buy     416       3/22/11       50,804,000       (1,309,384 )
    U.S. Treasury Long Bonds, 20 yr.
      Sell     312       3/22/11       38,103,000       976,754  
    U.S. Treasury Nts., 2 yr.
      Buy     6       3/31/11       1,313,438       1,106  
    U.S. Treasury Nts., 2 yr.
      Sell     529       3/31/11       115,801,406       169,758  
    U.S. Treasury Nts., 5 yr.
      Buy     196       3/31/11       23,072,875       (293,804 )
    U.S. Treasury Nts., 5 yr.
      Sell     30       3/31/11       3,531,563       61,111  
    U.S. Treasury Nts., 10 yr.
      Buy     2,303       3/22/11       277,367,563       (7,532,469 )
    U.S. Treasury Nts., 10 yr.
      Sell     91       3/22/11       10,959,813       134,290  
    U.S. Ultra Bonds
      Buy     35       3/22/11       4,448,281       112,718  
    United Kingdom Long Gilt
      Buy     7       3/29/11       1,304,069       1,180  


                                      $ (8,264,887 )
     
                                         
    Credit Default Swap Contracts as of December 31, 2010 are as follows:
                                                             
                        Pay/             Upfront                
        Buy/Sell     Notional     Receive             Payment             Unrealized  
    Reference Entity/   Credit     Amount     Fixed     Termination     Received/             Appreciation  
    Swap Counterparty   Protection     (000's)     Rate     Date     (Paid)     Value     (Depreciation)  
     
    American General Finance
                                                           
    JPMorgan Chase Bank NA, NY Branch
      Sell   $ 4,670       1.00 %     12/20/15     $ 296,045     $ (256,722 )   $ 39,323  
                                         
     
      Total     4,670                       296,045       (256,722 )     39,323  
    Bolivarian Republic of Venezuela
                                                           
    Credit Suisse International
      Buy     850       5.00       9/20/15       (222,771 )     168,728       (54,043 )
                                         
     
      Total     850                       (222,771 )     168,728       (54,043 )
    Campbell Soup Co.
                                                           
    Credit Suisse International
      Buy     4,670       1.00       12/20/15       136,545       (125,893 )     10,652  
                                         
     
      Total     4,670                       136,545       (125,893 )     10,652  
    Caterpillar, Inc.
                                                           
    Morgan Stanley Capital Services, Inc.
      Sell     4,670       1.00       12/20/15       (56,045 )     45,243       (10,802 )
                                         
     
      Total     4,670                       (56,045 )     45,243       (10,802 )
    Cisco Systems, Inc.
                                                           
    Barclays Bank plc
      Buy     4,730       1.00       12/20/15       112,601       (113,730 )     (1,129 )
                                         
     
      Total     4,730                       112,601       (113,730 )     (1,129 )
    Development Bank of Kazakhstan JSC
                                                           
    Credit Suisse International
      Sell     4,440       3.75       2/20/13             184,535       184,535  
                                         
     
      Total     4,440                             184,535       184,535  
    Fortune Brands, Inc.
                                                           
    Credit Suisse International
      Sell     4,670       1.00       12/20/15       186,630       (187,055 )     (425 )
                                         
     
      Total     4,670                       186,630       (187,055 )     (425 )
     
                                                             
                        Pay/             Upfront                
        Buy/Sell     Notional     Receive             Payment             Unrealized  
    Reference Entity/   Credit     Amount     Fixed     Termination     Received/             Appreciation  
    Swap Counterparty   Protection     (000's)     Rate     Date     (Paid)     Value     (Depreciation)  
     
    Istanbul Bond Co. SA for Finansbank AS
                                                           
    Morgan Stanley & Co. International Ltd.
      Sell   $ 3,100       1.30 %     3/24/13     $     $ (192,617 )   $ (192,617 )
                                       
     
      Total     3,100                             (192,617 )     (192,617 )
    Lockheed Martin Corp.
                                                           
    Credit Suisse International
      Buy     4,730       1.00       12/20/15       155,246       (150,630 )     4,616  
                                       
     
      Total     4,730                       155,246       (150,630 )     4,616  
    Markit CDX Emerging Market Index, Series 14:
                                                           
    Barclays Bank plc
      Buy     9,200       5.00       12/20/15       1,201,878       (1,324,291 )     (122,413 )
    Goldman Sachs International
      Buy     6,200       5.00       12/20/15       825,461       (892,457 )     (66,996 )
    Merrill Lynch International
      Buy     7,600       5.00       12/20/15       1,011,856       (1,093,979 )     (82,123 )
                                       
     
      Total     23,000                       3,039,195       (3,310,727 )     (271,532 )
    McKesson Corp.
                                                           
    Morgan Stanley Capital Services, Inc.
      Buy     4,670       1.00       12/20/15       120,354       (125,745 )     (5,391 )
                                       
     
      Total     4,670                       120,354       (125,745 )     (5,391 )
    Morgan Stanley
                                                           
    Credit Suisse International
      Buy     16,500       1.00       9/20/11       7,792       137,049       144,841  
                                       
     
      Total     16,500                       7,792       137,049       144,841  
    Raytheon Co.
                                                           
    Citibank NA, New York
      Buy     4,730       1.00       12/20/15       123,354       (122,910 )     444  
                                       
     
      Total     4,730                       123,354       (122,910 )     444  
    Republic of Peru:
                                                           
    Barclays Bank plc
      Buy     3,270       1.76       12/20/14             (73,381 )     (73,381 )
    Citibank NA, New York
      Buy     10,000       1.00       9/20/15       11,275       41,070       52,345  
    Deutsche Bank AG
      Buy     1,900       1.71       12/20/16             (63,879 )     (63,879 )
    JPMorgan Chase Bank NA, London Branch
      Buy     4,900       1.74       12/20/14             (106,228 )     (106,228 )
    Citibank NA, New York
      Sell     1,570       5.10       3/20/13             (36,847 )     (36,847 )
                                       
     
      Total     21,640                       11,275       (239,265 )     (227,990 )
    SLM Corp.:
                                                           
    Citibank NA, New York
      Sell     3,720       5.00       12/20/15       (35,247 )     207,929       172,682  
    UBS AG
      Sell     1,010       5.00       12/20/15       (9,570 )     56,454       46,884  
                                       
     
      Total     4,730                       (44,817 )     264,383       219,566  
    Xerox Corp.
                                                           
    Citibank NA, New York
      Sell     4,670       1.00       12/20/15       58,192       (58,681 )     (489 )
                                       
     
      Total     4,670                       58,192       (58,681 )     (489 )
                                         
                        Grand Total Buys       3,483,591       (3,846,276 )     (362,685 )
                                         
                        Grand Total Sells       440,005       (237,761 )     202,244  
                                         
                Total Credit Default Swaps     $ 3,923,596     $ (4,084,037 )   $ (160,441 )
                                         
     
    The table that follows shows the undiscounted maximum potential payment by the Fund related to selling credit protection in credit default swaps:
                             
    Type of Reference   Total Maximum Potential             Reference Asset  
    Asset on which the   Payments for Selling Credit             Rating Range**  
    Fund Sold Protection   Protection (Undiscounted)     Amount Recoverable*     (unaudited)  
     
    Investment Grade Single Name Corporate Debt
      $ 23,410,000     $     A to BBB-
    Investment Grade Sovereign Debt
        7,540,000           BBB to BBB-
    Non-Investment Grade Sovereign Debt
        1,570,000             B-  
                 
    Total
      $ 32,520,000     $          
                 
    *   The Fund has no amounts recoverable from related purchased protection. In addition, the Fund has no recourse provisions under the credit derivatives and holds no collateral which can offset or reduce potential payments under a triggering event.
     
    **   The period end reference asset security ratings, as rated by any rating organization, are included in the equivalent Standard & Poor’s rating category. The reference asset rating represents the likelihood of a potential credit event on the reference asset which would result in a related payment by the Fund.
    Interest Rate Swap Contracts as of December 31, 2010 are as follows:
                                             
        Notional                          
    Interest Rate/   Amount     Paid by     Received by     Termination        
    Swap Counterparty   (000's)     the Fund     the Fund     Date     Value  
     
    BZDI:
                                           
    Banco Santander SA, Inc.
      9,870  BRR   BZDI       12.320 %     1/2/17     $ 107,315  
    Goldman Sachs Group, Inc. (The)
      10,600  BRR   BZDI       11.390       1/5/15       (95,659 )
    Goldman Sachs Group, Inc. (The)
      5,190  BRR   BZDI       12.800       1/2/17       163,191  
    Goldman Sachs Group, Inc. (The)
      9,900  BRR   BZDI       11.420       1/3/14       (76,668 )
    JPMorgan Chase Bank NA
      15,800  BRR   BZDI       13.900       1/2/17       880,146  
     
                                       
    Total
      51,360  BRR                             978,325  
     
    MXN TIIE BANXICO:
                                           
    Bank of America Merrill Lynch
      87,500  MXN   MXN TIIE BANXICO       5.875       12/6/12       (8,675 )
    Bank of America Merrill Lynch
      220,000  MXN   MXN TIIE BANXICO       5.735       11/29/12       (32,311 )
    Bank of America Merrill Lynch
      134,500  MXN   MXN TIIE BANXICO       5.750       12/5/12       (17,628 )
    Goldman Sachs Group, Inc. (The)
      216,900  MXN   MXN TIIE BANXICO       5.880       12/14/12       (18,500 )
     
                                       
    Total
      658,900  MXN                             (77,114 )
     
    Six-Month AUD BBR BBSW
                                           
     
                      Six-Month                  
    Westpac Banking Corp.
      12,810  AUD     5.660 %   AUD BBR BBSW       8/6/20       338,077  
     
    Six-Month CZK PRIBOR PRBO:
                                           
     
                      Six-Month CZK                  
    Barclays Bank plc
      183,000  CZK     3.200     PRIBOR PRBO       12/21/15       (13,999 )
     
                      Six-Month CZK                  
    Morgan Stanley
      173,300  CZK     3.060     PRIBOR PRBO       12/16/15       9,579  
     
                                       
    Total
      356,300  CZK                             (4,420 )
     
    Six-Month EUR EURIBOR:
                                           
     
              Six-Month EUR                          
    Barclays Bank plc
      7,120  EUR   EURIBOR       3.580       12/21/15       22,312  
     
              Six-Month EUR                          
    Morgan Stanley
      6,910  EUR   EURIBOR       3.410       12/16/15       (5,640 )
     
                                       
    Total
      14,030  EUR                             16,672  
     
    Six-Month GBP BBA LIBOR
                                           
     
              Six-Month GBP                          
    Barclays Bank plc
      7,360  GBP   BBA LIBOR       3.328       8/3/20       (50,934 )
     
                                         
        Notional                  
    Interest Rate/   Amount     Paid by     Received by   Termination    
    Swap Counterparty   (000’s)     the Fund     the Fund   Date   Value  
     
    Six-Month JPY BBA LIBOR:
                                       
    Citibank NA
        553,000  JPY     1.391 %   Six-Month JPY
    BBA LIBOR
      10/6/19   $ (132,950 )
    JPMorgan Chase Bank NA
        290,000  JPY     1.077     Six-Month JPY
    BBA LIBOR
      8/7/20     50,778  
    JPMorgan Chase Bank NA
        168,000  JPY     1.563     Six-Month JPY
    BBA LIBOR
      11/9/19     (69,827 )
     
                                     
    Total
        1,011,000  JPY                         (151,999 )
     
    Three-Month USD BBA LIBOR
                                       
     
              Three-Month USD                      
    Barclays Bank plc
        11,800     BBA LIBOR       2.500 % 9/2/20     (698,620 )
     
                                     
                        Total Interest Rate Swaps   $ 349,987  


    Notional amount is reported in U.S. Dollars (USD), except for those denoted in the following currencies:
    AUD
      Australian Dollar
    BRR
      Brazilian Real
    CZK
      Czech Koruna
    EUR
      Euro
    GBP
      British Pound Sterling
    JPY
      Japanese Yen
    MXN
      Mexican Nuevo Peso
     
       
    Abbreviations/Definitions are as follows:
    BANIXCO
      Banco de Mexico
    BBA LIBOR
      British Bankers’ Association London-Interbank Offered Rate
    BBR BBSW
      Bank Bill Swap Reference Rate (Australian Financial Market)
    BZDI
      Brazil Interbank Deposit Rate
    EURIBOR
      Euro Interbank Offered Rate
    PRIBOR PRBO
      Prague Interbank Offering Rate
    TIIE
      Interbank Equilibrium Interest Rate
    Total Return Swap Contracts as of December 31, 2010 are as follows:
                                 
        Notional                  
    Reference Entity/   Amount     Paid by   Received by   Termination    
    Swap Counterparty   (000’s)     the Fund   the Fund   Date   Value  
     
    Consumer Staples
    Select Sector Index:
                               
    Morgan Stanley
      $ 1,846     One-Month USD BBA LIBOR plus 15 basis points and if negative, the absolute value of the Total Return of the Consumer Staples Select Sector Index   If positive, the Total Return of the Consumer Staples Select Sector Index   3/9/11   $ 52,661  
    Morgan Stanley
        1     One-Month USD BBA LIBOR plus 15 basis points and if negative, the absolute value of the Total Return of the Consumer Staples Select Sector Index   If positive, the Total Return of the Consumer Staples Select Sector Index   9/14/11     23  
     
                             
                    Reference Entity Total
        52,684  
     
                                 
        Notional                  
    Reference Entity/   Amount     Paid by   Received by   Termination    
    Swap Counterparty   (000’s)     the Fund   the Fund   Date   Value  
     
    Custom Basket of Securities:                
    Citibank NA
        1,892  CHF   One-Month CHF BBA LIBOR plus 30 basis points and if negative, the absolute value of the Total Return of a custom basket of securities   If positive, the Total Return of a custom basket of securities   1/12/11   $ 5,268  
    Citibank NA
        3,165  EUR   One-Month EURIBOR plus 30 basis points and if negative, the absolute value of the Total Return of a custom basket of securities   If positive, the Total Return of a custom basket of securities   1/12/11     59,948  
    Citibank NA
        1,584  GBP   One-Month GBP BBA LIBOR plus 30 basis points and if negative, the absolute value of the Total Return of a custom basket of securities   If positive, the Total Return of a custom basket of securities   1/12/11     98,892  
    Citibank NA
        5,259  SEK   One-Month SEK STIBOR SIDE plus 30 basis points and if negative, the absolute value of the Total Return of a custom basket of securities   If positive, the Total Return of a custom basket of securities   1/12/11     8,653  
    Citibank NA, New York
        1,122,840  JPY   One-Month JPY BBA LIBOR plus 53 basis points and if negative, the absolute value of the Total Return of a custom basket of securities   If positive, the Total Return of a custom basket of securities   4/14/11     269,894  
    Goldman Sachs Group, Inc. (The)
        23,340     One-Month USD BBA LIBOR plus 18 basis points and if negative, the absolute value of the Total Return of a custom basket of securities   If positive, the Total Return of a custom basket of securities   9/9/11     238,401  
    Morgan Stanley
        4,577  GBP   One-Month GBP BBA LIBOR plus 50 basis points and if negative, the absolute value of the Total Return of a custom basket of securities   If positive, the Total Return of a custom basket of securities   1/14/11     265,117  
     
                             
                    Reference Entity Total     946,173  
     
                                 
        Notional                  
    Reference Entity/   Amount     Paid by   Received by   Termination    
    Swap Counterparty   (000’s)     the Fund   the Fund   Date   Value  
     
    Energy Select Sector Index
                               
    Morgan Stanley
      $ 1,671     One-Month USD BBA LIBOR plus 10 basis points and if negative, the absolute value of the Total Return of the Energy Select Sector Index   If positive, the Total Return of the Energy Select Sector Index   10/13/11   $ 88,131  
    Health Care Select Sector Index
                               
    UBS AG
        1,965     One-Month USD BBA LIBOR plus 8 basis points and if negative, the absolute value of the Total Return of the Health Care Select Sector Index   If positive, the Total Return of the Health Care Select Sector Index   11/4/11     46,623  
    MSCI Daily TR Gross EAFE USD Index:
                               
    Citibank NA
        791     If positive, the Total Return of the MSCI Daily Gross EAFE USD Index   One-Month USD BBA LIBOR plus 15 basis points and if negative, the absolute value of the Total Return of the MSCI Daily Gross EAFE USD Index   10/7/11     (63,220 )
    Goldman Sachs Group, Inc. (The)
        120     If positive, the Total Return of the MSCI Daily Gross EAFE USD Index   One-Month USD LIBOR minus 5 basis points and if negative, the absolute value of the Total Return of the MSCI Daily Gross EAFE USD Index   7/8/11     (4,883 )
    Goldman Sachs Group, Inc. (The)
        1,655     If positive, the Total Return of the MSCI Daily Gross EAFE USD Index   One-Month USD BBA LIBOR plus 10 basis points and if negative, the absolute value of the Total Return of the MSCI Daily Gross EAFE USD Index   5/11/11     (50,163 )
    Goldman Sachs Group, Inc. (The)
        563     If positive, the Total Return of the MSCI Daily Gross EAFE USD Index   One-Month USD LIBOR minus 5 basis points and if negative, the absolute value of the Total Return of the MSCI Daily Gross EAFE USD Index   7/8/11     (25,164 )
     
                                 
        Notional                  
    Reference Entity/   Amount     Paid by   Received by   Termination    
    Swap Counterparty   (000’s)     the Fund   the Fund   Date   Value  
     
    MSCI Daily TR Gross EAFE USD Index: Continued
                               
    UBS AG
        6,935     If positive, the Total Return of the MSCI Daily Gross EAFE USD Index   One-Month USD BBA LIBOR minus 10 basis points and if negative, the absolute value of the Total Return of the MSCI Daily Gross EAFE USD Index   10/7/11   $ (441,086 )
     
                             
                    Reference Entity Total     (584,516 )
     
                               
    MSCI Daily TR Gross Europe Euro Index:
                               
    Citibank NA
        1,881  EUR   If positive, the Total Return of the MSCI Daily Gross Europe Euro Index   One-Month EURIBOR minus 60 basis points and if negative, the absolute value of the Total Return of the MSCI Daily Gross Europe Euro Index   1/12/11     (17,868 )
    Goldman Sachs Group, Inc. (The)
        358  EUR   If positive, the Total Return of the MSCI Daily Gross Europe Euro Index   One-Month Europe EURIBOR minus 3 basis points and if negative, the absolute value of the Total Return of the MSCI Daily Gross Europe Euro Index   1/17/11     (1,971 )
    Morgan Stanley
        3,840  EUR   If positive, the Total Return of the MSCI Daily Gross Europe Euro Index   One-Month EURIBOR minus 30 basis points and if negative, the absolute value of the Total Return of the MSCI Daily Gross Europe Euro Index   1/12/11     (71,763 )
     
                             
                    Reference Entity Total     (91,602 )
     
                               
    MSCI Daily TR Italy USD Index:
                               
    Goldman Sachs Group, Inc. (The)
      $ 315     One-Month USD BBA LIBOR minus 25 basis points and if negative, the absolute value of the Total Return of the MSCI Daily Italy USD Index   If positive, the Total Return of the MSCI Daily Italy USD Index   3/4/11     18,845  
    Goldman Sachs Group, Inc. (The)
        1,724     One-Month USD BBA LIBOR minus 25 basis points and if negative, the absolute value of the Total Return of the MSCI Daily Italy USD Index   If positive, the Total Return of the MSCI Daily Italy USD Index   3/4/11     95,818  
     
                                 
        Notional                  
    Reference Entity/   Amount     Paid by   Received by   Termination    
    Swap Counterparty   (000’s)     the Fund   the Fund   Date   Value  
     
    MSCI Daily TR Italy USD Index: Continued
                               
    Goldman Sachs Group, Inc. (The)
      $ 475     One-Month USD BBA LIBOR minus 25 basis points and if negative, the absolute value of the Total Return of the MSCI Daily Italy USD Index   If positive, the Total Return of the MSCI Daily Italy USD Index   3/4/11   $ 28,834  
     
                             
                    Reference Entity Total     143,497  
    MSCI Daily TR Net Emerging Markets Korea Price Return Index
                               
    UBS AG
        2,177     One-Month USD BBA LIBOR plus 30 basis points and if negative, the absolute value of the Total Return of the MSCI Daily Net Emerging Markets Korea Price Return Index   If positive, the Total Return of the MSCI Daily Net Emerging Markets Korea Price Return Index   8/8/11     212,645  
    MSCI Daily TR Net Hong Kong USD Index
                               
    UBS AG
        2,405     One-Month USD BBA LIBOR plus 46 basis points and if negative, the absolute value of the Total Return of the MSCI Daily Net Hong Kong USD Index   If positive, the Total Return of the MSCI Daily Net Hong Kong USD Index   12/7/11     (52,257 )
    MSCI Daily TR Net Japan USD Index
                               
    Deutsche Bank AG
        2,385     One-Month USD BBA LIBOR plus 20 basis points and if negative, the absolute value of the Total Return of the MSCI Daily Net Japan USD Index   If positive, the Total Return of the MSCI Daily Net Japan USD Index   12/12/11     129,314  
    MSCI Daily TR Net Singapore USD Index
                               
    Morgan Stanley
        2,406     One-Month USD BBA LIBOR plus 39 basis points and if negative, the absolute value of the Total Return of the MSCI Daily Net Singapore USD Index   If positive, the Total Return of the MSCI Daily Net Singapore USD Index   12/7/11     52,062  
    Ordinary shares of Novo Nordisk AS
                               
    Citibank NA
        1,065  DKK   One-Month DKK BBA LIBOR plus 30 basis points and if negative, the absolute value of the Total Return of the ordinary shares of Novo Nordisk AS   If positive, the absolute value of the ordinary shares of Novo Nordisk AS   4/11/11     17,299  
     
                                 
        Notional                  
    Reference Entity/   Amount     Paid by   Received by   Termination    
    Swap Counterparty   (000’s)     the Fund   the Fund   Date   Value  
     
    S&P 500 Value Index
                               
    Goldman Sachs Group, Inc. (The)
      $ 5,844     If positive, the Total Return of the S&P 500 Value Index   One-Month USD LIBOR minus 35 basis points and if negative, the absolute value of the Total Return of the S&P 500 Value Index   12/8/11   $ (275,967 )
    S&P 600 Smallcap Index
                               
    UBS AG
        5,884     One-Month USD BBA LIBOR minus 16 basis points and if negative, the absolute value of the Total Return of the S&P 600 Smallcap Index   If positive, the Total Return of the S&P 600 Smallcap Index   12/8/11     217,847  
     
                             
                    Total of Total Return Swaps   $ 901,933  


    Notional amount is reported in U.S. Dollars (USD), except for those denoted in the following currencies:
    CHF
      Swiss Franc
    DKK
      Danish Krone
    EUR
      Euro
    GBP
      British Pounds Sterling
    JPY
      Japanese Yen
    SEK
      Swedish Krona
     
       
    Abbreviations are as follows:
    BBA LIBOR
      British Bankers’ Association London-Interbank Offered Rate
    EAFE
      Europe, Australasia, Far East
    EURIBOR
      Euro Interbank Offered Rate
    LIBOR
      London-Interbank Offered Rate
    MSCI
      Morgan Stanley Capital International
    S&P
      Standard & Poor’s
    TR
      Total Return
    Currency Swaps as of December 31, 2010 are as follows:
                             
        Notional                
    Reference Entity/   Amount   Paid by   Received by   Termination    
    Swap Counterparty   (000’s)   the Fund   the Fund   Date   Value  
     
    Each of JSC “Rushydro” (Open Joint Stock Company, Federal Hydrogeneration Company) and OJSC Saratovskaya HPP and any Successor(s) to these Reference Entities
                           
    Morgan Stanley Capital Services, Inc.
      271,430 RUR   Three-Month USD
    BBA LIBOR
      7.75% from debt obligations of JSC Rushydro and OJSC Saratovskaya HPP   12/26/13   $ (1,564,189 )
         
    Notional amount is reported in U.S. Dollars (USD), except for those denoted in the following currency:
    RUR
      Russian Ruble
     
       
    Abbreviations definitions is as follows:
    BBA LIBOR
      British Bankers’ Association London-Interbank Offered Rate


    Volatility Swaps as of December 31, 2010 are as follows:
                                 
        Notional                
    Reference Entity/   Amount   Paid by   Received by   Termination    
    Swap Counterparty   (000’s)   the Fund   the Fund   Date   Value  
     
    AUD/JPY Exchange Rate
                               
    Citibank NA
      13 AUD   The Historic Volatility of the mid AUD/JPY spot exchange rate during the Observation Period     12.15 %   2/7/11   $ 2,771  
    CHF/SEK Exchange Rate:
                               
    Citibank NA
      13 CHF   The Historic Volatility of the mid CHF/SEK spot exchange rate during the Observation Period     10.30     1/14/11     (1,391 )
    Credit Suisse International
      12 CHF   The Historic Volatility of the mid CHF/SEK spot exchange rate during the Observation Period     10.00     1/18/11     (13,254 )
    Credit Suisse International
      12 CHF   The Historic Volatility of the mid CHF/SEK spot exchange rate during the Observation Period     9.95     1/18/11     (10,637 )
    Credit Suisse International
      13 CHF   The Historic Volatility of the mid CHF/SEK spot exchange rate during the Observation Period     10.55     1/13/11     1,499  
    Deutsche Bank AG
      12 CHF   The Historic Volatility of the mid CHF/SEK spot exchange rate during the Observation Period     10.55     1/18/11     (11,173 )
    Deutsche Bank AG
      13 CHF   The Historic Volatility of the mid CHF/SEK spot exchange rate during the Observation Period     11.60     1/10/11     16,294  
     
                             
                Reference Entity Total     (18,662 )
     
                               
    EUR/NZD Exchange Rate:
                               
    Bank of America Merrill Lynch
      10 EUR   The Historic Volatility of the mid EUR/NZD spot exchange rate during the Observation Period     9.30     1/10/11     (7,465 )
    Citibank NA
      10 EUR   The Historic Volatility of the mid EUR/NZD spot exchange rate during the Observation Period     9.50     1/10/11     (9,832 )
    Credit Suisse International
      10 EUR   The Historic Volatility of the mid EUR/NZD spot exchange rate during the Observation Period     10.01     1/6/11     (1,781 )
    Deutsche Bank AG
      10 EUR   The Historic Volatility of the mid EUR/NZD spot exchange rate during the Observation Period     9.60     1/7/11     (8,507 )
     
                             
                Reference Entity Total     (27,585 )
     
                                     
        Notional                
    Reference Entity/   Amount   Paid by   Received by     Termination    
    Swap Counterparty   (000’s)   the Fund   the Fund     Date   Value  
     
    USD/SEK Exchange Rate:
                                   
    Bank of America Merrill Lynch
        13     The Historic Volatility of the mid USD/SEK spot exchange rate during the Observation Period     13.20 %   1/28/11   $ 5,376  
    Bank of America Merrill Lynch
        13     The Historic Volatility of the mid USD/SEK spot exchange rate during the Observation Period     13.40     1/27/11     12,253  
    Credit Suisse International
        13     The Historic Volatility of the mid USD/SEK spot exchange rate during the Observation Period     13.70     1/21/11     20,254  
    Credit Suisse International
        13     The Historic Volatility of the mid USD/SEK spot exchange rate during the Observation Period     13.00     1/24/11     6,514  
    Credit Suisse International
        13     The Historic Volatility of the mid USD/SEK spot exchange rate during the Observation Period     12.90     2/3/11     (16,739 )
    Credit Suisse International
        13     The Historic Volatility of the mid USD/SEK spot exchange rate during the Observation Period     14.00     1/20/11     27,651  
    Credit Suisse International
        13     The Historic Volatility of the mid USD/SEK spot exchange rate during the Observation Period     12.95     1/31/11     (9,539 )
    Deutsche Bank AG
        13     The Historic Volatility of the mid USD/SEK spot exchange rate during the Observation Period     13.00     1/31/11     (11,049 )
    Deutsche Bank AG
        13     The Historic Volatility of the mid USD/SEK spot exchange rate during the Observation Period     13.50     1/24/11     10,468  
     
                                 
                    Reference Entity Total     45,189  
     
                                 
                    Total Volatility Swaps   $ 1,713  


    Notional amount is reported in U.S. Dollars (USD), except for those denoted in the following currencies:
     
       
    AUD
      Australian Dollar
    CHF
      Swiss Franc
    EUR
      Euro
    JPY
      Japanese Yen
    NZD
      New Zealand Dollar
    SEK
      Swedish Krona


    Swap Summary as of December 31, 2010 is as follows:
    The following table aggregates, as of period end, the amount receivable from/(payable to) each counterparty with whom the Fund has entered into a swap agreement. Swaps are individually disclosed in the preceding tables.
                         
            Notional        
        Swap Type from   Amount        
    Swap Counterparty   Fund Perspective   (000’s)     Value  
     
    Banco Santander SA, Inc.
      Interest Rate     9,870  BRR   $ 107,315  
    Bank of America Merrill Lynch:
                       
     
      Interest Rate     442,000  MXN     (58,614 )
     
      Volatility     10  EUR     (7,465 )
     
      Volatility     26       17,629  


                    (48,450 )
    Barclays Bank plc:
                       
     
      Credit Default Buy Protection     17,200       (1,511,402 )
     
      Interest Rate     183,000  CZK     (13,999 )
     
      Interest Rate     7,120  EUR     22,312  
     
      Interest Rate     7,360  GBP     (50,934 )
     
      Interest Rate     11,800       (698,620 )


                    (2,252,643 )
    Citibank NA:
                       
     
      Interest Rate     553,000  JPY     (132,950 )
     
      Total Return     1,892  CHF     5,268  
     
      Total Return     1,065  DKK     17,299  
     
      Total Return     5,046  EUR     42,080  
     
      Total Return     1,584  GBP     98,892  
     
      Total Return     5,259  SEK     8,653  
     
      Total Return     791       (63,220 )
     
      Volatility     13  AUD     2,771  
     
      Volatility     13  CHF     (1,391 )
     
      Volatility     10  EUR     (9,832 )


                    (32,430 )
    Citibank NA, New York:
                       
     
      Credit Default Buy Protection     14,730       (81,840 )
     
      Credit Default Sell Protection     9,960       112,401  
     
      Total Return     1,122,840  JPY     269,894  


                    300,455  
    Credit Suisse International:
                       
     
      Credit Default Buy Protection     26,750       29,254  
     
      Credit Default Sell Protection     9,110       (2,520 )
     
      Volatility     37  CHF     (22,392 )
     
      Volatility     10  EUR     (1,781 )
     
      Volatility     65       28,141  


                    30,702  
    Deutsche Bank AG:
                       
     
      Credit Default Buy Protection     1,900       (63,879 )
     
      Total Return     2,385       129,314  
     
      Volatility     25  CHF     5,121  
     
      Volatility     10  EUR     (8,507 )
     
      Volatility     26       (581 )


                    61,468  
    Goldman Sachs Group, Inc. (The):
                       
     
      Interest Rate     25,690  BRR     (9,136 )
     
      Interest Rate     216,900  MXN     (18,500 )
     
      Total Return     358  EUR     (1,971 )
     
      Total Return     34,036       25,721  


                    (3,886 )
    Goldman Sachs International
      Credit Default Buy Protection     6,200       (892,457 )
    JPMorgan Chase Bank NA:
                       
     
      Interest Rate     15,800  BRR     880,146  
     
      Interest Rate     458,000  JPY     (19,049 )


                    861,097  
     
                         
            Notional        
        Swap Type from   Amount        
    Swap Counterparty   Fund Perspective   (000’s)     Value  
     
    JPMorgan Chase Bank NA, London Branch
      Credit Default Buy Protection   $ 4,900     $ (106,228 )
    JPMorgan Chase Bank NA, NY Branch
      Credit Default Sell Protection     4,670       (256,722 )
    Merrill Lynch International
      Credit Default Buy Protection     7,600       (1,093,979 )
    Morgan Stanley:
                       
     
      Interest Rate     173,300  CZK     9,579  
     
      Interest Rate     6,910  EUR     (5,640 )
     
      Total Return     3,840  EUR     (71,763 )
     
      Total Return     4,577  GBP     265,117  
     
      Total Return     5,924       192,877  


                    390,170  
    Morgan Stanley & Co. International Ltd.
      Credit Default Sell Protection     3,100       (192,617 )
    Morgan Stanley Capital Services, Inc.:
                       
     
      Credit Default Buy Protection     4,670       (125,745 )
     
      Credit Default Sell Protection     4,670       45,243  
     
      Currency     271,430  RUR     (1,564,189 )


                    (1,644,691 )
    UBS AG:
                       
     
      Credit Default Sell Protection     1,010       56,454  
     
      Total Return     19,366       (16,228 )
     
                    40,226  
     
                     
    Westpac Banking Corp.
      Interest Rate     12,810  AUD     338,077  


          Total Swaps     $ (4,394,593 )


    Notional amount is reported in U.S.Dollars (USD), except for those denoted in the following currencies:
    AUD
      Australian Dollar
    BRR
      Brazilian Real
    CHF
      Swiss Franc
    CZK
      Czech Koruna
    DKK
      Danish Krone
    EUR
      Euro
    GBP
      British Pound Sterling
    JPY
      Japanese Yen
    MXN
      Mexican Nuevo Peso
    RUR
      Russian Ruble
    SEK
      Swedish Krona


    STATEMENT OF ASSETS AND LIABILITIES December 31, 2010
             
    Assets
           
    Investments, at value—see accompanying statement of investments:
           
    Unaffiliated companies
    (cost $1,949,673,278)
      $ 1,986,878,290  
    Affiliated companies
    (cost $429,049,623)
        437,389,868  


        2,424,268,158  
    Cash—foreign currencies
    (cost $787,100)
        788,782  
    Unrealized appreciation on foreign currency exchange contracts
        4,596,926  
    Appreciated swaps, at value (net upfront payments paid $25,750)
        4,207,790  
    Depreciated swaps, at value (upfront payments paid $278,816)
        213,971  
    Receivables and other assets:
           
    Interest, dividends and principal paydowns
        31,404,070  
    Shares of beneficial interest sold
        12,555,765  
    Investments sold (including $8,024,024 sold on a when-issued or delayed delivery basis)
        9,300,568  
    Closed foreign currency contracts
        2,052,229  
    Futures margins
        1,746,212  
    Other
        48,449  
     
         
    Total assets
        2,491,182,920  
     
           
    Liabilities
           
    Unrealized depreciation on foreign currency exchange contracts
        13,070,372  
    Appreciated swaps, at value (upfront payments received $711,190)
        656,155  
    Depreciated swaps, at value (upfront payments received $3,516,972)
        8,160,199  
    Payables and other liabilities:
           
    Investments purchased (including $80,598,752 purchased on a when-issued or delayed delivery basis)
        81,460,360  
    Closed foreign currency contracts
        2,446,688  
    Distribution and service plan fees
        1,054,043  
    Shares of beneficial interest redeemed
        852,291  
    Futures margins
        609,835  
    Shareholder communications
        290,984  
    Transfer and shareholder servicing agent fees
        198,661  
    Foreign capital gains tax
        59,775  
    Trustees’ compensation
        37,125  
    Other
        191,820  
     
         
    Total liabilities
        109,088,308  
     
           
    Net Assets
      $ 2,382,094,612  


    Composition of Net Assets
           
    Par value of shares of beneficial interest
      $ 421,868  
    Additional paid-in capital
        2,277,058,848  
    Accumulated net investment income
        5,967,605  
    Accumulated net realized gain on investments and foreign currency transactions
        70,418,191  
    Net unrealized appreciation on investments and translation of assets and liabilities denominated in foreign currencies
        28,228,100  


    Net Assets
      $ 2,382,094,612  


    Net Asset Value Per Share
           
    Non-Service Shares:
           
    Net asset value, redemption price per share and offering price per share
    (based on net assets of $711,754,539 and 127,577,947 shares of beneficial interest outstanding)
      $ 5.58  
    Service Shares:
           
    Net asset value, redemption price per share and offering price per share
    (based on net assets of $1,670,340,073 and 294,290,027 shares of beneficial interest outstanding)
      $ 5.68  


    STATEMENT OF OPERATIONS For the Year Ended December 31, 2010
             
    Allocation of Income and Expenses from master funds1
           
    Net investment income allocated from Oppenheimer Master Event-Linked Bond Fund, LLC:
           
    Interest
      $ 1,163,541  
    Dividends
        2,399  
    Expenses2
        (82,531 )
     
         
    Net investment income allocated from Oppenheimer Master Event-Linked Bond Fund, LLC
        1,083,409  
    Net investment income allocated from Oppenheimer Master Loan Fund, LLC:
           
    Interest
        33,462,757  
    Dividends
        36,846  
    Expenses3
        (1,266,974 )
     
         
    Net investment income allocated from Oppenheimer Master Loan Fund, LLC
        32,232,629  
     
         
    Total allocation of net investment income from master funds
        33,316,038  
     
           
    Investment Income
           
    Interest (net of foreign withholding taxes of $317,603)
      $ 192,345,595  
    Dividends:
           
    Unaffiliated companies
        103,748  
    Affiliated companies
        298,773  
    Fee income on when-issued securities
        1,798,776  
    Income from investment of securities lending cash collateral, net affiliated companies
        36,907  
     
         
    Total investment income
        194,583,799  
     
           
    Expenses
           
    Management fees
        17,980,400  
    Distribution and service plan fees — Service shares
        6,223,086  
    Transfer and shareholder servicing agent fees:
           
    Non-Service shares
        738,529  
    Service shares
        2,489,526  
    Shareholder communications:
           
    Non-Service shares
        138,144  
    Service shares
        414,524  
    Custodian fees and expenses
        433,373  
    Trustees’ compensation
        86,931  
    Administration service fees
        1,500  
    Other
        271,561  
     
         
    Total expenses
        28,777,574  
    Less waivers and reimbursements of expenses
        (1,357,650 )
     
         
    Net expenses
        27,419,924  
     
           
    Net Investment Income
        200,479,913  

             
    Realized and Unrealized Gain (Loss)
           
    Net realized gain (loss) on:
           
    Investments from unaffiliated companies (including premiums on options exercised)
      $ 133,639,673  
    Closing and expiration of option contracts written
        2,845,386  
    Closing and expiration of futures contracts
        59,951,528  
    Foreign currency transactions
        (25,566,426 )
    Short positions
        (117,061 )
    Swap contracts
        11,894,798  
    Increase from payment by affiliate
        7,302  
    Net realized gain (loss) allocated from:
           
    Oppenheimer Master Event-Linked Bond Fund, LLC
        (91,384 )
    Oppenheimer Master Loan Fund, LLC
        11,177,915  
     
         
    Net realized gain
        193,741,731  
    Net change in unrealized appreciation/depreciation on:
           
    Investments (net of foreign capital gains tax of $59,775)
        29,994,171  
    Translation of assets and liabilities denominated in foreign currencies
        (12,612,946 )
    Futures contracts
        4,914,034  
    Option contracts written
        (11,637 )
    Swap contracts
        (13,046,067 )
    Unfunded purchase agreements
        354,545  
    Net change in unrealized appreciation/deprecation allocated from:
           
    Oppenheimer Master Event-Linked Bond Fund, LLC
        291,009  
    Oppenheimer Master Loan Fund, LLC
        1,506,228  
     
         
    Net change in unrealized appreciation/depreciation
        11,389,337  
     
           
    Net Increase in Net Assets Resulting from Operations
      $ 405,610,981  
     
         
    1.   The Fund invests in certain affiliated mutual funds that expect to be treated as partnerships for tax purposes. See Note 1 of accompanying Notes.
     
    2.   Net of expense waivers and/or reimbursements of $1,197.
     
    3.   Net of expense waivers and/or reimbursements of $18,160.

    STATEMENTS OF CHANGES IN NET ASSETS
                     
    Year Ended December 31,   2010     2009  
     
    Operations
                   
    Net investment income
      $ 200,479,913     $ 229,320,159  
    Net realized gain (loss)
        193,741,731       (159,435,499 )
    Net change in unrealized appreciation/depreciation
        11,389,337       592,195,964  
         
    Net increase in net assets resulting from operations
        405,610,981       662,080,624  
     
                   
    Dividends and/or Distributions to Shareholders
                   
    Dividends from net investment income:
                   
    Non-Service shares
        (66,430,241 )     (3,468,223 )
    Service shares
        (313,790,173 )     (7,263,543 )
         
     
        (380,220,414 )     (10,731,766 )
     
                   
    Distributions from net realized gain:
                   
    Non-Service shares
              (522,726 )
    Service shares
              (2,276,448 )
         
     
              (2,799,174 )
     
                   
    Beneficial Interest Transactions
                   
    Net increase (decrease) in net assets resulting from beneficial interest transactions:
                   
    Non-Service shares
        (81,259,481 )     (5,135,048 )
    Service shares
        (1,976,534,500 )     312,198,649  
         
     
        (2,057,793,981 )     307,063,601  
     
                   
    Net Assets
                   
    Total increase (decrease)
        (2,032,403,414 )     955,613,285  
    Beginning of period
        4,414,498,026       3,458,884,741  
         
    End of period (including accumulated net investment income of $5,967,605 and $241,824,892, respectively)
      $ 2,382,094,612     $ 4,414,498,026  


    FINANCIAL HIGHLIGHTS
                                             
    Non-Service Shares Year Ended December 31,   2010     2009     2008     2007     2006  
     
    Per Share Operating Data
                                           
    Net asset value, beginning of period
      $ 5.30     $ 4.49     $ 5.56     $ 5.26     $ 5.11  
     
    Income (loss) from investment operations:
                                           
    Net investment income1
        .34       .30       .30       .28       .26  
    Net realized and unrealized gain (loss)
        .40       .53       (1.04 )     .21       .11  
         
    Total from investment operations
        .74       .83       (.74 )     .49       .37  
     
    Dividends and/or distributions to shareholders:
                                           
    Dividends from net investment income
        (.46 )     (.02 )     (.27 )     (.19 )     (.22 )
    Distributions from net realized gain
              2       (.06 )            
         
    Total dividends and distributions to shareholders
        (.46 )     (.02 )     (.33 )     (.19 )     (.22 )
     
    Net asset value, end of period
      $ 5.58     $ 5.30     $ 4.49     $ 5.56     $ 5.26  


    Total Return, at Net Asset Value3
        14.97 %     18.83 %     (14.21 )%     9.69 %     7.49 %
     
                                           
    Ratios/Supplemental Data
                                           
    Net assets, end of period (in thousands)
      $ 711,755     $ 757,772     $ 648,570     $ 734,611     $ 606,632  
     
    Average net assets (in thousands)
      $ 737,071     $ 681,926     $ 753,062     $ 664,668     $ 564,248  
     
    Ratios to average net assets:4,5
                                           
    Net investment income
        6.47 %     6.20 %     5.78 %     5.34 %     5.05 %
    Total expenses6
        0.75 %     0.67 %     0.59 %     0.59 %     0.64 %
    Expenses after payments, waivers and/or reimbursements and reduction to custodian expenses
        0.71 %     0.64 %     0.57 %     0.57 %     0.63 %
     
    Portfolio turnover rate7
        99 %     110 %     86 %     76 %     93 %
    1.   Per share amounts calculated based on the average shares outstanding during the period.
     
    2.   Less than $0.005 per share.
     
    3.   Assumes an initial investment on the business day before the first day of the fiscal period, with all dividends and distributions reinvested in additional shares on the reinvestment date, and redemption at the net asset value calculated on the last business day of the fiscal period. Total returns are not annualized for periods less than one full year. Total return information does not reflect expenses that apply at the separate account level or to related insurance products. Inclusion of these charges would reduce the total return figures for all periods shown. Returns do not reflect the deduction of taxes that a shareholder would pay on fund distributions or the redemption of fund shares.
     
    4.   Annualized for periods less than one full year.
     
    5.   Includes the Fund’s share of the allocated expenses and/or net investment income from the master funds.
     
    6.   Total expenses including all affiliated fund expenses were as follows:
             
    Year Ended December 31, 2010
        0.75 %
    Year Ended December 31, 2009
        0.68 %
    Year Ended December 31, 2008
        0.60 %
    Year Ended December 31, 2007
        0.61 %
    Year Ended December 31, 2006
        0.64 %
    7.   The portfolio turnover rate excludes purchase and sale transactions of To Be Announced (TBA) mortgage-related securities as follows:
                     
        Purchase Transactions     Sale Transactions  
     
    Year Ended December 31, 2010
      $ 1,034,550,699     $ 1,085,289,655  
    Year Ended December 31, 2009
      $ 1,909,574,925     $ 1,836,038,328  
    Year Ended December 31, 2008
      $ 634,319,548     $ 594,845,589  
    Year Ended December 31, 2007
      $ 1,061,009,472     $ 1,120,098,096  
    Year Ended December 31, 2006
      $ 742,785,501     $ 749,719,239  
     
                                             
    Service Shares Year Ended December 31,   2010     2009     2008     2007     2006  
     
    Per Share Operating Data
                                           
    Net asset value, beginning of period
      $ 5.38     $ 4.56     $ 5.65     $ 5.34     $ 5.19  
     
    Income (loss) from investment operations:
                                           
    Net investment income1
        .33       .29       .29       .28       .25  
    Net realized and unrealized gain (loss)
        .42       .54       (1.06 )     .22       .11  
         
    Total from investment operations
        .75       .83       (.77 )     .50       .36  
     
    Dividends and/or distributions to shareholders:
                                           
    Dividends from net investment income
        (.45 )     (.01 )     (.26 )     (.19 )     (.21 )
    Distributions from net realized gain
              2       (.06 )            
         
    Total dividends and distributions to shareholders
        (.45 )     (.01 )     (.32 )     (.19 )     (.21 )
     
    Net asset value, end of period
      $ 5.68     $ 5.38     $ 4.56     $ 5.65     $ 5.34  


    Total Return, at Net Asset Value3
        14.77 %     18.41 %     (14.49 )%     9.55 %     7.23 %
     
                                           
    Ratios/Supplemental Data
                                           
    Net assets, end of period (in thousands)
      $ 1,670,340     $ 3,656,726     $ 2,810,315     $ 2,876,016     $ 1,396,188  
     
    Average net assets (in thousands)
      $ 2,485,427     $ 3,143,836     $ 3,152,967     $ 2,075,028     $ 1,016,582  
     
    Ratios to average net assets:4,5
                                           
    Net investment income
        6.15 %     5.95 %     5.54 %     5.08 %     4.83 %
    Total expenses6
        0.99 %     0.92 %     0.84 %     0.84 %     0.89 %
    Expenses after payments, waivers and/or reimbursements and reduction to custodian expenses
        0.95 %     0.89 %     0.82 %     0.82 %     0.88 %
     
    Portfolio turnover rate7
        99 %     110 %     86 %     76 %     93 %
    1.   Per share amounts calculated based on the average shares outstanding during the period.
     
    2.   Less than $0.005 per share.
     
    3.   Assumes an initial investment on the business day before the first day of the fiscal period, with all dividends and distributions reinvested in additional shares on the reinvestment date, and redemption at the net asset value calculated on the last business day of the fiscal period. Total returns are not annualized for periods less than one full year. Total return information does not reflect expenses that apply at the separate account level or to related insurance products. Inclusion of these charges would reduce the total return figures for all periods shown. Returns do not reflect the deduction of taxes that a shareholder would pay on fund distributions or the redemption of fund shares.
     
    4.   Annualized for periods less than one full year.
     
    5.   Includes the Fund’s share of the allocated expenses and/or net investment income from the master funds.
     
    6.   Total expenses including all affiliated fund expenses were as follows:
             
    Year Ended December 31, 2010
        0.99 %
    Year Ended December 31, 2009
        0.93 %
    Year Ended December 31, 2008
        0.85 %
    Year Ended December 31, 2007
        0.86 %
    Year Ended December 31, 2006
        0.89 %
    7.   The portfolio turnover rate excludes purchases and sales of To Be Announced (TBA) mortgage-related securities as follows:
                     
        Purchase Transactions     Sale Transactions  
     
    Year Ended December 31, 2010
      $ 1,034,550,699     $ 1,085,289,655  
    Year Ended December 31, 2009
      $ 1,909,574,925     $ 1,836,038,328  
    Year Ended December 31, 2008
      $ 634,319,548     $ 594,845,589  
    Year Ended December 31, 2007
      $ 1,061,009,472     $ 1,120,098,096  
    Year Ended December 31, 2006
      $ 742,785,501     $ 749,719,239  


    NOTES TO FINANCIAL STATEMENTS
    1. Significant Accounting Policies
    Oppenheimer Global Strategic Income Fund/VA (the “Fund”), formerly known as Oppenheimer Strategic Bond Fund/VA, is a separate series of Oppenheimer Variable Account Funds, an open-end management investment company registered under the Investment Company Act of 1940, as amended. The Fund’s investment objective is to seek a high level of current income principally derived from interest on debt securities. The Fund’s investment adviser is OppenheimerFunds, Inc. (the “Manager”).
         The Fund offers two classes of shares. Both classes are sold at their offering price, which is the net asset value per share, to separate investment accounts of participating insurance companies as an underlying investment for variable life insurance policies, variable annuity contracts or other investment products. The class of shares designated as Service shares is subject to a distribution and service plan. Both classes of shares have identical rights and voting privileges with respect to the Fund in general and exclusive voting rights on matters that affect that class alone. Earnings, net assets and net asset value per share may differ due to each class having its own expenses, such as transfer and shareholder servicing agent fees and shareholder communications, directly attributable to that class.
         The following is a summary of significant accounting policies consistently followed by the Fund.
    Securities Valuation. The Fund calculates the net asset value of its shares as of the close of the New York Stock Exchange (the “Exchange”), normally 4:00 P.M. Eastern time, on each day the Exchange is open for trading.
         Each investment asset or liability of the Fund is assigned a level at measurement date based on the significance and source of the inputs to its valuation. Unadjusted quoted prices in active markets for identical securities are classified as “Level 1,” inputs other than unadjusted quoted prices for an asset that are observable are classified as “Level 2” and significant unobservable inputs, including the Manager’s judgment about the assumptions that a market participant would use in pricing an asset or liability, are classified as “Level 3.” The inputs used for valuing securities are not necessarily an indication of the risks associated with investing in those securities. A table summarizing the Fund’s investments under these levels of classification is included following the Statement of Investments.
         Securities are valued using unadjusted quoted market prices, when available, as supplied primarily by portfolio pricing services approved by the Board of Trustees or dealers.
         Securities traded on a registered U.S. securities exchange are valued based on the last sale price of the security reported on the principal exchange on which it is traded, prior to the time when the Fund’s assets are valued. Securities whose principal exchange is NASDAQ® are valued based on the official closing prices reported by NASDAQ prior to the time when the Fund’s assets are valued. In the absence of a sale, the security is valued at the last sale price on the prior trading day, if it is within the spread of the current day’s closing “bid” and “asked” prices, and if not, at the current day’s closing bid price. A foreign security traded on a foreign exchange is valued based on the last sale price on the principal exchange on which the security is traded, as identified by the portfolio pricing service used by the Manager, prior to the time when the Fund’s assets are valued. In the absence of a sale, the security is valued at the most recent official closing price on the principal exchange on which it is traded.
         Shares of a registered investment company that are not traded on an exchange are valued at that investment company’s net asset value per share.
         U.S. domestic and international debt instruments (including corporate, government, municipal, mortgage-backed, collateralized mortgage obligations and asset-backed securities) and “money market-type” debt instruments with a remaining maturity in excess of sixty days are valued at the mean between the “bid” and “asked” prices utilizing price quotations obtained from independent pricing services or broker-dealers. Such prices are typically determined based upon information obtained from market participants including reported trade data, broker-dealer price quotations and inputs such as benchmark yields and issuer spreads from identical or similar securities.
         Structured securities are valued utilizing price quotations obtained from broker-dealers or independent pricing services. Values are determined based upon market inputs which typically include the price of underlying financial instruments, stock market indices, foreign currencies, interest rate spreads, commodities, or the occurrence of other specific events.
         Event-linked bonds are valued at the mean between the “bid” and “asked” prices utilizing price quotations obtained from independent pricing services or broker-dealers. Prices are determined based upon information obtained from market participants including reported trade data and broker-dealer price quotations.
         Swap contracts are valued utilizing price quotations obtained from broker-dealer counterparties or independent pricing services. Values are determined based on relevant market information on the underlying reference assets which may include credit spreads, credit event probabilities, index values, individual security values, forward interest rates, variable interest rates, volatility measures and forward currency rates.
         Forward foreign currency exchange contracts are valued utilizing current and forward currency rates obtained from independent pricing services.
         “Money market-type” debt instruments with remaining maturities of sixty days or less are valued at cost adjusted by the amortization of discount or premium to maturity (amortized cost), which approximates market value.
         In the absence of a readily available unadjusted quoted market price, including for securities whose values have been materially affected by what the Manager identifies as a significant event occurring before the Fund’s assets are valued but after the close of the securities’ respective exchanges, the Manager, acting through its internal valuation committee, in good faith determines the fair valuation of that asset using consistently applied procedures under the supervision of the Board of Trustees (which reviews those fair valuations by the Manager). Those procedures include certain standardized methodologies to fair value securities. Such methodologies include, but are not limited to, pricing securities initially at cost and subsequently adjusting the value based on: changes in company specific fundamentals, changes in an appropriate securities index, or changes in the value of similar securities which may be adjusted for any discounts related to resale restrictions. When possible, such methodologies use observable market inputs such as unadjusted quoted prices of similar securities, observable interest rates, currency rates and yield curves. The methodologies used for valuing securities are not necessarily an indication of the risks associated with investing in those securities.
         There have been no significant changes to the fair valuation methodologies of the Fund during the period.
    Structured Securities. The Fund invests in structured securities whose market values, interest rates and/or redemption prices are linked to the performance of underlying foreign currencies, interest rate spreads, stock market indices, prices of individual securities, commodities or other financial instruments or the occurrence of other specific events. The structured securities are often leveraged, increasing the volatility of each note’s market value relative to the change in the underlying linked financial element or event. Fluctuations in value of these securities are recorded as unrealized gains and losses in the accompanying Statement of Operations. The Fund records a realized gain or loss when a structured security is sold or matures.
    Event-Linked Bonds. The Fund may invest in “event-linked” bonds. Event-linked bonds, which are sometimes referred to as “catastrophe” bonds, are fixed income securities for which the return of principal and payment of interest is contingent on the non-occurrence of a specific trigger event, such as a hurricane, earthquake, or other occurrence that leads to physical or economic loss. If the trigger event occurs prior to maturity, the Fund may lose all or a portion of its principal in addition to interest otherwise due from the security. Event-linked bonds may expose the Fund to certain other risks, including issuer default, adverse regulatory or jurisdictional interpretations, liquidity risk and adverse tax consequences. The Fund records the net change in market value of event-linked bonds on the Statement of Operations as a change in unrealized appreciation or depreciation on investments. The Fund records a realized gain or loss on the Statement of Operations upon the sale or maturity of such securities.
    Securities on a When-Issued or Delayed Delivery Basis. The Fund may purchase securities on a “when-issued” basis, and may purchase or sell securities on a “delayed delivery” basis. “When-issued” or “delayed delivery” refers to securities whose terms and indenture are available and for which a market exists, but which are not available for immediate delivery. Delivery and payment for securities that have been purchased by the Fund on a when-issued basis normally takes place within six months and possibly as long as two years or more after the trade date. During this period, such securities do not earn interest, are subject to market fluctuation and may increase or decrease in value prior to their delivery. The purchase of securities on a when-issued basis may increase the volatility of the Fund’s net asset value to the extent the Fund executes such transactions while remaining substantially fully invested. When the Fund engages in when-issued or delayed delivery transactions, it relies on the buyer or seller, as the case may be, to complete the transaction. Their failure to do so may cause the Fund to lose the opportunity to obtain or dispose of the security at a price and yield it considers advantageous. The Fund may also sell securities that it purchased on a when-issued basis or forward commitment prior to settlement of the original purchase.
    As of December 31, 2010, the Fund had purchased securities issued on a when-issued or delayed delivery basis and sold securities issued on a delayed delivery basis as follows:
             
        When-Issued or Delayed  
        Delivery Basis Transactions  
     
    Purchased securities
      $ 80,598,752  
    Sold securities
        8,024,024  
    The Fund may enter into “forward roll” transactions with respect to mortgage-related securities. In this type of transaction, the Fund sells a mortgage-related security to a buyer and simultaneously agrees to repurchase a similar security (same type, coupon and maturity) at a later date at a set price. During the period between the sale and the repurchase, the Fund will not be entitled to receive interest and principal payments on the securities that have been sold. The Fund records the incremental difference between the forward purchase and sale of each forward roll as realized gain (loss) on investments or as fee income in the case of such transactions that have an associated fee in lieu of a difference in the forward purchase and sale price.
         Forward roll transactions may be deemed to entail embedded leverage since the Fund purchases mortgage-related securities with extended settlement dates rather than paying for the securities under a normal settlement cycle. This embedded leverage increases the Fund’s market value of investments relative to its net assets which can incrementally increase the volatility of the Fund’s performance. Forward roll transactions can be replicated over multiple settlement periods.
         Risks of entering into forward roll transactions include the potential inability of the counterparty to meet the terms of the agreement; the potential of the Fund to receive inferior securities at redelivery as compared to the securities sold to the counterparty; and counterparty credit risk.
    Securities Sold Short. The Fund may short sell when-issued securities for future settlement. The value of the open short position is recorded as a liability, and the Fund records an unrealized gain or loss for the change in value of the open short position. The Fund records a realized gain or loss when the short position is closed out.
         As of December 31, 2010 the Fund had no outstanding securities sold short.
    Credit Risk. The Fund invests in high-yield, non-investment-grade bonds, which may be subject to a greater degree of credit risk. Credit risk relates to the ability of the issuer to meet interest or principal payments or both as they become due. The Fund may acquire securities in default, and is not obligated to dispose of securities whose issuers or underlying obligors subsequently default. Information concerning securities in default as of December 31, 2010 is as follows:
             
    Cost
      $ 31,574,515  
    Market Value
      $ 3,967,206  
    Market Value as a % of Net Assets
        0.17 %
    Investment in Oppenheimer Institutional Money Market Fund. The Fund is permitted to invest daily available cash balances in an affiliated money market fund. The Fund may invest the available cash in Class E shares of Oppenheimer Institutional Money Market Fund (“IMMF”) to seek current income while preserving liquidity. IMMF is a registered open-end management investment company, regulated as a money market fund under the Investment Company Act of 1940, as amended. The Manager is also the investment adviser of IMMF. When applicable, the Fund’s investment in IMMF is included in the Statement of Investments. Shares of IMMF are valued at their net asset value per share. As a shareholder, the Fund is subject to its proportional share of IMMF’s Class E expenses, including its management fee. The Manager will waive fees and/or reimburse Fund expenses in an amount equal to the indirect management fees incurred through the Fund’s investment in IMMF.
    Investment in OFI Liquid Assets Fund, LLC. The Fund is permitted to invest cash collateral received in connection with its securities lending activities. Pursuant to the Fund’s Securities Lending Procedures, the Fund may invest cash collateral in, among other investments, an affiliated money market fund. OFI Liquid Assets Fund, LLC (“LAF”) is a limited liability company whose investment objective is to seek current income and stability of principal. The Manager is also the investment adviser of LAF. LAF is not registered under the Investment Company Act of 1940. However, LAF does comply with the investment restrictions applicable to registered money market funds set forth in Rule 2a-7 adopted under the Investment Company Act. When applicable, the Fund’s investment in LAF is included in the Statement of Investments. Shares of LAF are valued at their net asset value per share. As a shareholder, the Fund is subject to its proportional share of LAF’s expenses, including its management fee of 0.08%.
    Investment in Oppenheimer master funds. The Fund is permitted to invest in entities sponsored and/or advised by the Manager or an affiliate. Certain of these entities in which the Fund invests are mutual funds registered under the Investment Company Act of 1940 that expect to be treated as partnerships for tax purposes, specifically Oppenheimer Master Loan Fund, LLC and Oppenheimer Master Event-Linked Bond Fund, LLC (the “master funds”). Each master fund has its own investment risks, and those risks can affect the value of the Fund’s investments and therefore the value of the Fund’s shares. To the extent that the Fund invests more of its assets in one master fund than in another, the Fund will have greater exposure to the risks of that master fund.
         The investment objective of Oppenheimer Master Loan Fund, LLC is to seek as high a level of current income and preservation of capital as is consistent with investing primarily in loans and other debt securities. The investment objective of Oppenheimer Master Event-Linked Bond Fund, LLC is to seek a high level of current income principally derived from interest on debt securities. The Fund’s investments in the master funds are included in the Statement of Investments. The Fund recognizes income and gain/(loss) on its investments in each master fund according to its allocated pro-rata share, based on its relative proportion of total outstanding master fund shares held, of the total net income earned and the net gain/(loss) realized on investments sold by the master funds. As a shareholder, the Fund is subject to its proportional share of the master funds’ expenses, including their management fee. The Manager will waive fees and/or reimburse Fund expenses in an amount equal to the indirect management fees incurred through the Fund’s investment in the master funds.
    Foreign Currency Translation. The Fund’s accounting records are maintained in U.S. dollars. The values of securities denominated in foreign currencies and amounts related to the purchase and sale of foreign securities and foreign investment income are translated into U.S. dollars as of the close of the Exchange, normally 4:00 P.M. Eastern time, on each day the Exchange is open for trading. Foreign exchange rates may be valued primarily using a reliable bank, dealer or service authorized by the Board of Trustees.
         Reported net realized gains and losses from foreign currency transactions arise from sales of portfolio securities, sales and maturities of short-term securities, sales of foreign currencies, exchange rate fluctuations between the trade and settlement dates on securities transactions, and the difference between the amounts of dividends, interest, and foreign withholding taxes recorded on the Fund’s books and the U.S. dollar equivalent of the amounts actually received or paid. Net unrealized appreciation and depreciation on the translation of assets and liabilities denominated in foreign currencies arise from changes in the values of assets and liabilities, including investments in securities at fiscal period end, resulting from changes in exchange rates.
         The effect of changes in foreign currency exchange rates on investments is separately identified from the fluctuations arising from changes in market values of securities held and reported with all other foreign currency gains and losses in the Fund’s Statement of Operations. 

    Allocation of Income, Expenses, Gains and Losses. Income, expenses (other than those attributable to a specific class), gains and losses are allocated on a daily basis to each class of shares based upon the relative proportion of net assets represented by such class. Operating expenses directly attributable to a specific class are charged against the operations of that class.
    Federal Taxes. The Fund intends to comply with provisions of the Internal Revenue Code applicable to regulated investment companies and to distribute substantially all of its investment company taxable income, including any net realized gain on investments not offset by capital loss carryforwards, if any, to shareholders. Therefore, no federal income or excise tax provision is required. The Fund files income tax returns in U.S. federal and applicable state jurisdictions. The statute of limitations on the Fund’s tax return filings generally remain open for the three preceding fiscal reporting period ends.
    The tax components of capital shown in the following table represent distribution requirements the Fund must satisfy under the income tax regulations, losses the Fund may be able to offset against income and gains realized in future years and unrealized appreciation or depreciation of securities and other investments for federal income tax purposes.
                             
                        Net Unrealized  
                        Appreciation  
                        Based on Cost of  
                        Securities and  
    Undistributed   Undistributed     Accumulated     Other Investments  
    Net Investment   Long-Term     Loss     for Federal Income  
    Income   Gain     Carryforward1,2,3,4     Tax Purposes  
     
    $69,476,241
      $ 29,075,393     $ 42,891,185     $ 51,983,802  
    1.   As of December 31, 2010, the Fund had $42,644,008 of post-October losses available to offset future realized capital gains, if any. Such losses, if unutilized, will expire in 2019.
     
    2.   The Fund had $247,177 of straddle losses which were deferred.
     
    3.   During the fiscal year ended December 31, 2010, the Fund utilized $161,264,243 of capital loss carryforward to offset capital gains realized in that fiscal year.
     
    4.   During the fiscal year ended December 31, 2009, the Fund did not utilize any capital loss carryforward.
    Net investment income (loss) and net realized gain (loss) may differ for financial statement and tax purposes. The character of dividends and distributions made during the fiscal year from net investment income or net realized gains may differ from their ultimate characterization for federal income tax purposes. Also, due to timing of dividends and distributions, the fiscal year in which amounts are distributed may differ from the fiscal year in which the income or net realized gain was recorded by the Fund.
    Accordingly, the following amounts have been reclassified for December 31, 2010. Net assets of the Fund were unaffected by the reclassifications.
                     
        Reduction     Increase  
        to Accumulated     to Accumulated Net  
    Increase to   Net Investment     Realized Gain  
    Paid-in Capital   Income     on Investments5  
     
    $10,644,059
      $ 56,116,786     $ 45,472,727  
    5.   $10,424,041, all of which was long-term capital gain, was distributed in connection with Fund share redemptions.
    The tax character of distributions paid during the years ended December 31, 2010 and December 31, 2009 was as follows:
                     
        Year Ended     Year Ended  
        December 31, 2010     December 31, 2009  
     
    Distributions paid from:
                   
    Ordinary income
      $ 380,220,414     $ 13,530,940  
    The aggregate cost of securities and other investments and the composition of unrealized appreciation and depreciation of securities and other investments for federal income tax purposes as of December 31, 2010 are noted in the following table. The primary difference between book and tax appreciation or depreciation of securities and other investments, if applicable, is attributable to the tax deferral of losses or tax realization of financial statement unrealized gain or loss.
             
    Federal tax cost of securities
      $ 2,368,504,118  
    Federal tax cost of other investments
        422,724,985  
     
         
    Total federal tax cost
      $ 2,791,229,103  


    Gross unrealized appreciation
      $ 175,594,942  
    Gross unrealized depreciation
        (123,611,140 )
     
         
    Net unrealized appreciation
      $ 51,983,802  
     
         
    Certain foreign countries impose a tax on capital gains which is accrued by the Fund based on unrealized appreciation, if any, on affected securities. The tax is paid when the gain is realized.
    Trustees’ Compensation. The Board of Trustees has adopted a compensation deferral plan for independent trustees that enables trustees to elect to defer receipt of all or a portion of the annual compensation they are entitled to receive from the Fund. For purposes of determining the amount owed to the Trustee under the plan, deferred amounts are treated as though equal dollar amounts had been invested in shares of the Fund or in other Oppenheimer funds selected by the Trustee. The Fund purchases shares of the funds selected for deferral by the Trustee in amounts equal to his or her deemed investment, resulting in a Fund asset equal to the deferred compensation liability. Such assets are included as a component of “Other” within the asset section of the Statement of Assets and Liabilities. Deferral of trustees’ fees under the plan will not affect the net assets of the Fund, and will not materially affect the Fund’s assets, liabilities or net investment income per share. Amounts will be deferred until distributed in accordance with the compensation deferral plan.
    Dividends and Distributions to Shareholders. Dividends and distributions to shareholders, which are determined in accordance with income tax regulations and may differ from U.S. generally accepted accounting principles, are recorded on the ex-dividend date. Income and capital gain distributions, if any, are declared and paid annually or at other times as deemed necessary by the Manager.
    Investment Income. Dividend income is recorded on the ex-dividend date or upon ex-dividend notification in the case of certain foreign dividends where the ex-dividend date may have passed. Non-cash dividends included in dividend income, if any, are recorded at the fair market value of the securities received. Interest income is recognized on an accrual basis. Discount and premium, which are included in interest income on the Statement of Operations, are amortized or accreted daily.
    Custodian Fees. “Custodian fees and expenses” in the Statement of Operations may include interest expense incurred by the Fund on any cash overdrafts of its custodian account during the period. Such cash overdrafts may result from the effects of failed trades in portfolio securities and from cash outflows resulting from unanticipated shareholder redemption activity. The Fund pays interest to its custodian on such cash overdrafts, to the extent they are not offset by positive cash balances maintained by the Fund, at a rate equal to the Federal Funds Rate plus 0.50%. The “Reduction to custodian expenses” line item, if applicable, represents earnings on cash balances maintained by the Fund during the period. Such interest expense and other custodian fees may be paid with these earnings.
    Security Transactions. Security transactions are recorded on the trade date. Realized gains and losses on securities sold are determined on the basis of identified cost.
    Indemnifications. The Fund’s organizational documents provide current and former trustees and officers with a limited indemnification against liabilities arising in connection with the performance of their duties to the Fund. In the normal course of business, the Fund may also enter into contracts that provide general indemnifications. The Fund’s maximum exposure under these arrangements is unknown as this would be dependent on future claims that may be made against the Fund. The risk of material loss from such claims is considered remote. 

    Other. The preparation of financial statements in conformity with accounting principles generally accepted in the United States of America requires management to make estimates and assumptions that affect the reported amounts of assets and liabilities and disclosure of contingent assets and liabilities at the date of the financial statements and the reported amounts of increases and decreases in net assets from operations during the reporting period. Actual results could differ from those estimates.
    2. Shares of Beneficial Interest
    The Fund has authorized an unlimited number of $0.001 par value shares of beneficial interest of each class. Transactions in shares of beneficial interest were as follows:
                                     
        Year Ended December 31, 2010     Year Ended December 31, 2009  
        Shares     Amount     Shares     Amount  
     
    Non-Service Shares
                                   
    Sold
        13,659,013     $ 73,616,257       24,677,592     $ 117,209,141  
    Dividends and/or distributions reinvested
        13,002,895       66,430,241       952,494       3,990,949  
    Redeemed
        (42,045,616 )     (221,305,979 )     (27,020,460 )     (126,335,138 )
         
    Net decrease
        (15,383,708 )   $ (81,259,481 )     (1,390,374 )   $ (5,135,048 )


    Service Shares
                                   
    Sold
        39,118,559     $ 211,931,885       88,989,960     $ 433,996,423  
    Dividends and/or distributions reinvested
        60,274,068       313,790,173       2,234,190       9,539,991  
    Redeemed
        (484,576,971 )     (2,502,256,558 )     (28,146,787 )     (131,337,765 )
         
    Net increase (decrease)
        (385,184,344 )   $ (1,976,534,500 )     63,077,363     $ 312,198,649  
         
    3. Purchases and Sales of Securities
    The aggregate cost of purchases and proceeds from sales of securities, other than short-term obligations and investments in IMMF, LAF and the master funds, for the year ended December 31, 2010, were as follows:
                     
        Purchases     Sales  
     
    Investment securities
      $ 2,121,150,554     $ 3,364,220,703  
    U.S. government and government agency obligations
        107,549,007       105,042,838  
    To Be Announced (TBA) mortgage-related securities
        1,034,550,699       1,085,289,655  
    4. Fees and Other Transactions with Affiliates
    Management Fees. Under the investment advisory agreement, the Fund pays the Manager a management fee based on the daily net assets of the Fund at an annual rate as shown in the following table:
             
    Fee Schedule        
     
    Up to $200 million
        0.75 %
    Next $200 million
        0.72  
    Next $200 million
        0.69  
    Next $200 million
        0.66  
    Next $200 million
        0.60  
    Over $1 billion
        0.50  
    Administration Service Fees. The Fund pays the Manager a fee of $1,500 per year for preparing and filing the Fund’s tax returns.
    Transfer Agent Fees. OppenheimerFunds Services (“OFS”), a division of the Manager, acts as the transfer and shareholder servicing agent for the Fund. The Fund pays OFS fees at an annual rate of 0.10% of the daily net assets of each class of shares. For the year ended December 31, 2010, the Fund paid $3,402,620 to OFS for services to the Fund.
    Distribution and Service Plan for Service Shares. The Fund has adopted a Distribution and Service Plan (the “Plan”) in accordance with Rule 12b-1 under the Investment Company Act of 1940 for Service shares to pay OppenheimerFunds Distributor, Inc. (the “Distributor”), for distribution related services, personal service and account maintenance for the Fund’s Service shares. Under the Plan, payments are made periodically at an annual rate of 0.25% of the daily net assets of Service shares of the Fund. The Distributor currently uses all of those fees to compensate sponsors of the insurance product that offers Fund shares, for providing personal service and maintenance of accounts of their variable contract owners that hold Service shares. These fees are paid out of the Fund’s assets on an on-going basis and increase operating expenses of the Service shares, which results in lower performance compared to the Fund’s shares that are not subject to a service fee. Fees incurred by the Fund under the Plan are detailed in the Statement of Operations.
    Waivers and Reimbursements of Expenses. The Manager has voluntarily agreed to limit the Fund’s total annual operating expenses so that those expenses, as percentages of daily net assets, will not exceed the annual rate of 0.75% for Non-Service shares and 1.00% for Service shares. During the year ended December 31, 2010, the Manager waived fees and/or reimbursed the Fund $46,695 for Service shares.
         The Manager will waive fees and/or reimburse Fund expenses in an amount equal to the indirect management fees incurred through the Fund’s investments in IMMF and the master funds. During the year ended December 31, 2010, the Manager waived fees and/or reimbursed the Fund $1,310,955 for management fees.
         Some of these undertakings may be modified or terminated at any time; some may not be modified or terminated until after one year from the date of the current prospectus, as indicated therein.
         During the year ended December 31, 2010, the Manager voluntarily reimbursed the Fund $7,302 for certain transactions. The payment is reported separately in the Statement of Operations and increased the Fund’s total returns by less than 0.01%.
    5. Risk Exposures and the Use of Derivative Instruments
    The Fund’s investment objectives not only permit the Fund to purchase investment securities, they also allow the Fund to enter into various types of derivatives contracts, including, but not limited to, futures contracts, forward foreign currency exchange contracts, credit default swaps, interest rate swaps, total return swaps, and purchased and written options. In doing so, the Fund will employ strategies in differing combinations to permit it to increase, decrease, or change the level or types of exposure to market risk factors. Central to those strategies are features inherent to derivatives that make them more attractive for this purpose than equity and debt securities: they require little or no initial cash investment, they can focus exposure on only certain selected risk factors, and they may not require the ultimate receipt or delivery of the underlying security (or securities) to the contract. This may allow the Fund to pursue its objectives more quickly and efficiently than if it were to make direct purchases or sales of securities capable of effecting a similar response to market factors.
    Market Risk Factors. In accordance with its investment objectives, the Fund may use derivatives to increase or decrease its exposure to one or more of the following market risk factors:
    Commodity Risk. Commodity risk relates to the change in value of commodities or commodity indexes as they relate to increases or decreases in the commodities market. Commodities are physical assets that have tangible properties. Examples of these types of assets are crude oil, heating oil, metals, livestock, and agricultural products.
        Credit Risk. Credit risk relates to the ability of the issuer to meet interest and principal payments, or both, as they come due. In general, lower-grade, higher-yield bonds are subject to credit risk to a greater extent than lower-yield, higher-quality bonds.
        Equity Risk. Equity risk relates to the change in value of equity securities as they relate to increases or decreases in the general market.
        Foreign Exchange Rate Risk. Foreign exchange rate risk relates to the change in the U.S. dollar value of a security held that is denominated in a foreign currency. The U.S. dollar value of a foreign currency denominated security will decrease as the dollar appreciates against the currency, while the U.S. dollar value will increase as the dollar depreciates against the currency.

        Interest Rate Risk. Interest rate risk refers to the fluctuations in value of fixed-income securities resulting from the inverse relationship between price and yield. For example, an increase in general interest rates will tend to reduce the market value of already issued fixed-income investments, and a decline in general interest rates will tend to increase their value. In addition, debt securities with longer maturities, which tend to have higher yields, are subject to potentially greater fluctuations in value from changes in interest rates than obligations with shorter maturities.
        Volatility Risk. Volatility risk refers to the magnitude of the movement, but not the direction of the movement, in a financial instrument’s price over a defined time period. Large increases or decreases in a financial instrument’s price over a relative time period typically indicate greater volatility risk, while small increases or decreases in its price typically indicate lower volatility risk.
    The Fund’s actual exposures to these market risk factors during the period are discussed in further detail, by derivative type, below.
    Risks of Investing in Derivatives. The Fund’s use of derivatives can result in losses due to unanticipated changes in the market risk factors and the overall market. In instances where the Fund is using derivatives to decrease, or hedge, exposures to market risk factors for securities held by the Fund, there are also risks that those derivatives may not perform as expected resulting in losses for the combined or hedged positions.
         Derivatives may have little or no initial cash investment relative to their market value exposure and therefore can produce significant gains or losses in excess of their cost. This use of embedded leverage allows the Fund to increase its market value exposure relative to its net assets and can substantially increase the volatility of the Fund’s performance.
         Additional associated risks from investing in derivatives also exist and potentially could have significant effects on the valuation of the derivative and the Fund. Typically, the associated risks are not the risks that the Fund is attempting to increase or decrease exposure to, per its investment objectives, but are the additional risks from investing in derivatives. Examples of these associated risks are liquidity risk, which is the risk that the Fund will not be able to sell the derivative in the open market in a timely manner, and counterparty credit risk, which is the risk that the counterparty will not fulfill its obligation to the Fund. Associated risks can be different for each type of derivative and are discussed by each derivative type in the notes that follow.
        Counterparty Credit Risk. Certain derivative positions are subject to counterparty credit risk, which is the risk that the counterparty will not fulfill its obligation to the Fund. The Fund’s derivative counterparties are financial institutions who are subject to market conditions that may weaken their financial position. The Fund intends to enter into financial transactions with counterparties that the Manager believes to be creditworthy at the time of the transaction. As of December 31, 2010, the maximum amount of loss that the Fund would incur if the counterparties to its derivative transactions failed to perform would be $11,913,399, which represents gross payments to be received by the Fund on these derivative contracts were they to be unwound as of period end. To reduce this risk the Fund has entered into master netting arrangements, established within the Fund’s International Swap and Derivatives Association, Inc. master agreements, which allow the Fund to net unrealized appreciation and depreciation for certain positions in swaps, over-the-counter options, swaptions, and forward currency exchange contracts for each individual counterparty. The amount of loss that the Fund would incur taking into account these master netting arrangements would be $1,348,498 as of December 31, 2010. In addition, the Fund may require that certain counterparties post cash and/or securities in collateral accounts to cover their net payment obligations for those derivative contracts subject to International Swap and Derivatives Association, Inc. master agreements. If the counterparty fails to perform under these contracts and agreements, the cash and/or securities will be made available to the Fund.
          As of December 31, 2010, the Fund has required certain counterparties to post collateral of $3,829,349.
        Credit Related Contingent Features. The Fund’s agreements with derivative counterparties have several credit related contingent features that if triggered would allow its derivatives counterparties to close out and demand payment or additional collateral to cover their exposure from the Fund. Credit related contingent features are established between the Fund and its derivatives counterparties to reduce the risk that the Fund will not fulfill its payment obligations to its counterparties. These triggering features include, but are not limited to, a percentage decrease in the Fund’s net assets and or a percentage decrease in the Fund’s Net Asset Value or NAV. The contingent features are established within the
     
        Fund’s International Swap and Derivatives Association, Inc. master agreements which govern certain positions in swaps, over-the-counter options and swaptions, and forward currency exchange contracts for each individual counterparty.
               As of December 31, 2010, the aggregate fair value of derivative instruments with credit related contingent features in a net liability position was $11,185,271 for which the Fund has posted collateral of $2,608,409. If a contingent feature would have been triggered as of December 31, 2010, the Fund could have been required to pay this amount in cash to its counterparties. If the Fund fails to perform under these contracts and agreements, the cash and/or securities posted as collateral will be made available to the counterparty. Cash posted as collateral for these contracts, if any, is reported on the Statement of Assets and Liabilities; securities posted as collateral, if any, are reported on the Statement of Investments.
    Valuations of derivative instruments as of December 31, 2010 are as follows:
                                     
        Asset Derivatives     Liability Derivatives
        Statement           Statement      
    Derivatives Not   of Assets           of Assets      
    Accounted for as   and Liabilities           and Liabilities      
    Hedging Instruments   Location   Value     Location   Value  
     
    Credit contracts
      Appreciated swaps,           Appreciated swaps,        
     
      at value   $ 627,037     at value   $ 656,155  
    Credit contracts
      Depreciated swaps,           Depreciated swaps,        
     
      at value     213,971     at value     4,268,890  
    Equity contracts
      Appreciated swaps,           Depreciated swaps,        
     
      at value     1,906,275     at value     1,004,342  
    Foreign exchange contracts
                      Depreciated swaps,        
     
                      at value     1,564,189  
    Interest rate contracts
      Appreciated swaps,           Depreciated swaps,        
     
      at value     1,571,398     at value     1,221,411  
    Volatility contracts
      Appreciated swaps,           Depreciated swaps,        
     
      at value     103,080     at value     101,367  
    Equity contracts
      Futures margins     81,657 *   Futures margins     41,542 *
    Interest rate contracts
      Futures margins     1,664,555 *   Futures margins     568,293 *
    Foreign exchange contracts
      Unrealized appreciation
    on foreign currency
              Unrealized depreciation
    on foreign currency
           
     
      exchange contracts     4,596,926     exchange contracts     13,070,372  
    Foreign exchange contracts
      Investments, at value     842,483 **                
     
                               
    Total
              $ 11,607,382             $ 22,496,561  
     
                               
    *   Includes only the current day’s variation margin. Prior variation margin movements have been reflected in cash on the Statement of Assets and Liabilities upon receipt or payment.
     
    **   Amounts relate to purchased options.
         The effect of derivative instruments on the Statement of Operations is as follows:
                                                     
    Amount of Realized Gain or (Loss) Recognized on Derivatives  
        Investments from                                
        unaffiliated     Closing and                          
        companies     expiration     Closing and                    
    Derivatives Not   (including     of option     expiration of     Foreign              
    Accounted for as   premiums on     contracts     futures     currency              
    Hedging Instruments   options exercised)*     written     contracts     transactions     Swap contracts     Total  
     
    Credit contracts
      $     $     $     $     $ (9,993,530 )   $ (9,993,530 )
    Equity contracts
                    (4,207,258 )           3,436,375       (770,883 )
    Foreign exchange contracts
        (6,616,013 )     2,845,386             23,651,271       1,077,321       20,957,965  
    Interest rate contracts
        (7,684,568 )           64,158,786             17,583,191       74,057,409  
    Volatility contracts
                                (208,559 )     (208,559 )
         
    Total
      $ (14,300,581 )   $ 2,845,386     59,951,528     $ 23,651,271     $ 11,894,798     $ 84,042,402  
         
    *   Includes purchased option contracts, purchased swaption contracts and written option contracts exercised, if any.


    Amount of Change in Unrealized Gain or (Loss) Recognized on Derivatives
                                Translation of              
                                assets and              
                                liabilities              
    Derivatives Not           Option             denominated              
    Accounted for as           contracts     Futures     in foreign              
    Hedging Instruments   Investments*     written     contracts     currencies     Swap contracts     Total  
     
    Credit contracts
      $     $     $     $     $ (5,263,513 )   $ (5,263,513 )
    Equity contracts
                    (37,459 )           (264,287 )     (301,746 )
    Foreign exchange contracts
        7,057,466       (11,637 )           (26,101,974 )     465,690       (18,590,455 )
    Interest rate contracts
                    4,951,493             (7,985,670 )     (3,034,177 )
    Volatility contracts
                                1,713       1,713  
         
    Total
      $ 7,057,466     $ (11,637 )   $ 4,914,034     $ (26,101,974 )   $ (13,046,067 )   $ (27,188,178 )
         
    *   Includes purchased option contracts and purchased swaption contracts, if any.
    Foreign Currency Exchange Contracts
    The Fund may enter into foreign currency exchange contracts (“forward contracts”) for the purchase or sale of a foreign currency at a negotiated rate at a future date.
         Forward contracts are reported on a schedule following the Statement of Investments. Forward contracts will be valued daily based upon the closing prices of the forward currency rates determined at the close of the Exchange as provided by a bank, dealer or pricing service. The resulting unrealized appreciation (depreciation) is reported in the Statement of Assets and Liabilities as a receivable or payable and in the Statement of Operations within the change in unrealized appreciation (depreciation). At contract close, the difference between the original cost of the contract and the value at the close date is recorded as a realized gain (loss) in the Statement of Operations.
         The Fund has purchased and sold certain forward foreign currency exchange contracts of different currencies in order to acquire currencies to pay for related foreign securities purchase transactions, or to convert foreign currencies to U.S. dollars from related foreign securities sale transactions. These foreign currency exchange contracts are negotiated at the current spot exchange rate with settlement typically within two business days thereafter.
         The Fund has entered into forward foreign currency exchange contracts with the obligation to purchase specified foreign currencies in the future at a currently negotiated forward rate in order to take a positive investment perspective on the related currency. These forward foreign currency exchange contracts seek to increase exposure to foreign exchange rate risk.
         The Fund has entered into forward foreign currency exchange contracts with the obligation to purchase specified foreign currencies in the future at a currently negotiated forward rate in order to decrease exposure to foreign exchange rate risk associated with foreign currency denominated securities held by the Fund.
         The Fund has entered into forward foreign currency exchange contracts with the obligation to sell specified foreign currencies in the future at a currently negotiated forward rate in order to take a negative investment perspective on the related currency. These forward foreign currency exchange contracts seek to increase exposure to foreign exchange rate risk.
         The Fund has entered into forward foreign currency exchange contracts with the obligation to sell specified foreign currencies in the future at a currently negotiated forward rate in order to decrease exposure to foreign exchange rate risk associated with foreign currency denominated securities held by the Fund.
         During the year ended December 31, 2010, the Fund had average contract amounts on forward foreign currency contracts to buy and sell of $391,435,404 and $304,958,369, respectively.
         Additional associated risk to the Fund includes counterparty credit risk. Counterparty credit risk arises from the possibility that the counterparty will default.
    Futures Contracts
    A futures contract is a commitment to buy or sell a specific amount of a financial instrument at a negotiated price on a stipulated future date. The Fund may buy and sell futures contracts and may also buy or write put or call options on these futures contracts.
         Futures contracts traded on a commodities or futures exchange will be valued at the final settlement price or official closing price on the principal exchange as reported by such principal exchange at its trading session ending at, or most recently prior to, the time when the Fund’s assets are valued.
         Upon entering into a futures contract, the Fund is required to deposit either cash or securities (initial margin) in an amount equal to a certain percentage of the contract value. Subsequent payments (variation margin) are made or received by the Fund each day. The variation margin payments are equal to the daily changes in the contract value and are recorded as unrealized gains and losses.
         Futures contracts are reported on a schedule following the Statement of Investments. Securities held in collateralized accounts to cover initial margin requirements on open futures contracts are noted in the Statement of Investments. Cash held by the broker to cover initial margin requirements on open futures contracts and the receivable and/or payable for the daily mark to market for the variation margin are noted in the Statement of Assets and Liabilities. The net change in unrealized appreciation and depreciation is reported in the Statement of Operations. Realized gains (losses) are reported in the Statement of Operations at the closing or expiration of futures contracts.
         The Fund has purchased futures contracts on various bonds and notes to increase exposure to interest rate risk.
         The Fund has sold futures contracts on various bonds and notes to decrease exposure to interest rate risk.
         The Fund has purchased futures contracts on various equity indexes to increase exposure to equity risk.
         The Fund has sold futures contracts on various equity indexes to decrease exposure to equity risk.
         During the year ended December 31, 2010, the Fund had an average market value of $997,966,693 and $386,162,073 on futures contracts purchased and sold, respectively.
         Additional associated risks of entering into futures contracts (and related options) include the possibility that there may be an illiquid market where the Fund is unable to liquidate the contract or enter into an offsetting position and, if used for hedging purposes, the risk that the price of the contract will correlate imperfectly with the prices of the Fund’s securities.
    Option Activity
    The Fund may buy and sell put and call options, or write put and call options. When an option is written, the Fund receives a premium and becomes obligated to sell or purchase the underlying security at a fixed price, upon exercise of the option.
         Options are valued daily based upon the last sale price on the principal exchange on which the option is traded. The difference between the premium received or paid, and market value of the option, is recorded as unrealized appreciation or depreciation. The net change in unrealized appreciation or depreciation is reported in the Statement of Operations. When an option is exercised, the cost of the security purchased or the proceeds of the security sale are adjusted by the amount of premium received or paid. Upon the expiration or closing of the option transaction, a gain or loss is reported in the Statement of Operations.
         The Fund has purchased call options on currencies to increase exposure to foreign exchange rate risk. A purchased call option becomes more valuable as the price of the underlying financial instrument appreciates relative to the strike price.
         The Fund has purchased put options on currencies to decrease exposure to foreign exchange rate risk. A purchased put option becomes more valuable as the price of the underlying financial instrument depreciates relative to the strike price.
         The Fund has purchased call options on individual equity securities and, or, equity indexes to increase exposure to equity risk. A purchased call option becomes more valuable as the price of the underlying financial instrument appreciates relative to the strike price.
         The Fund has purchased put options on individual equity securities and, or, equity indexes to decrease exposure to equity risk. A purchased put option becomes more valuable as the price of the underlying financial instrument depreciates relative to the strike price. 

         The Fund has purchased call options on treasury futures to increase exposure to interest rate risk. A purchased call options becomes more valuable as the price of the underlying financial instruments appreciates relative to the strike price.
         During the year ended December 31, 2010, the Fund had an average market value of $1,357,121 and $552,097 on purchased call options and purchased put options, respectively.
         Options written, if any, are reported in a schedule following the Statement of Investments and as a liability in the Statement of Assets and Liabilities. Securities held in collateralized accounts to cover potential obligations with respect to outstanding written options are noted in the Statement of Investments.
         The risk in writing a call option is that the Fund gives up the opportunity for profit if the market price of the security increases and the option is exercised. The risk in writing a put option is that the Fund may incur a loss if the market price of the security decreases and the option is exercised. The risk in buying an option is that the Fund pays a premium whether or not the option is exercised. The Fund also has the additional risk that there may be an illiquid market where the Fund is unable to close the contract.
         The Fund has written put options on currencies to increase exposure to foreign exchange rate risk. A written put option becomes more valuable as the price of the underlying financial instrument appreciates relative to the strike price.
         The Fund has written call options on currencies to decrease exposure to foreign exchange rate risk. A written call option becomes more valuable as the price of the underlying financial instrument depreciates relative to the strike price.
         During the year ended December 31, 2010, the Fund had an average market value of $93,102 and $36,113 on written call options and written put options, respectively.
         Additional associated risks to the Fund include counterparty credit risk for over-the-counter options and liquidity risk.
    Written option activity for the year ended December 31, 2010 was as follows:
                                     
        Call Options     Put Options  
        Number of     Amount of     Number of     Amount of  
        Contracts     Premiums     Contracts     Premiums  
     
    Options outstanding as of December 31, 2009
            $       108,600,000     $ 106,195  
    Options written
        4,682,735,000       2,624,848       2,621,035,000       2,230,086  
    Options closed or expired
        (3,021,700,000 )     (1,679,267 )     (1,782,935,000 )     (1,166,119 )
    Options exercised
        (1,661,035,000 )     (945,581 )     (946,700,000 )     (1,170,162 )
         
    Options outstanding as of December 31, 2010
            $           $  
         
    Swap Contracts
         The Fund may enter into swap contract agreements with a counterparty to exchange a series of cash flows based on either specified reference rates, or the occurrence of a credit event, over a specified period. Such contracts may include interest rate, equity, debt, index, total return, credit and currency swaps.
         Swaps are marked to market daily using primarily quotations from pricing services, counterparties and brokers. Swap contracts are reported on a schedule following the Statement of Investments. The values of swap contracts are aggregated by positive and negative values and disclosed separately on the Statement of Assets and Liabilities by contracts in unrealized appreciation and depreciation positions. Upfront payments paid or received, if any, affect the value of the respective swap. Therefore, to determine the unrealized appreciation (depreciation) on swaps, upfront payments paid should be subtracted from, while upfront payments received should be added to, the value of contracts reported as an asset on the Statement of Assets and Liabilities. Conversely, upfront payments paid should be added to, while upfront payments received should be subtracted from the value of contracts reported as a liability. The unrealized appreciation (depreciation) related to the change in the valuation of the notional amount of the swap is combined with the accrued interest due to (owed by) the Fund at termination or settlement. The net change in this amount during the period is included on the Statement of Operations. The Fund also records any periodic payments received from (paid to) the counterparty, including at termination, under such contracts as realized gain (loss) on the Statement of Operations.
         Swap contract agreements are exposed to the market risk factor of the specific underlying reference asset. Swap contracts are typically more attractively priced compared to similar investments in related cash securities because they isolate the risk to one market risk factor and eliminate the other market risk factors. Investments in cash securities (for instance bonds) have exposure to multiple risk factors (credit and interest rate risk). Because swaps require little or no initial cash investment, they can expose the Fund to substantial risk in the isolated market risk factor.
          Credit Default Swap Contracts. A credit default swap is a bilateral contract that enables an investor to buy or sell protection on a debt security against a defined-issuer credit event, such as the issuer’s failure to make timely payments of interest or principal on the debt security, bankruptcy or restructuring. The Fund may enter into credit default swaps either by buying or selling protection on a single security, sovereign debt, or a basket of securities (the “reference asset”).
     
               The buyer of protection pays a periodic fee to the seller of protection based on the notional amount of debt securities underlying the swap contract. The seller of protection agrees to compensate the buyer of protection for future potential losses as a result of a credit event on the reference asset. The contract effectively transfers the credit event risk of the reference asset from the buyer of protection to the seller of protection.
     
              The ongoing value of the contract will fluctuate throughout the term of the contract based primarily on the credit risk of the reference asset. If the credit quality of the reference asset improves relative to the credit quality at contract initiation, the buyer of protection may have an unrealized loss greater than the anticipated periodic fee owed. This unrealized loss would be the result of current credit protection being cheaper than the cost of credit protection at contract initiation. If the buyer elects to terminate the contract prior to its maturity, and there has been no credit event, this unrealized loss will become realized. If the contract is held to maturity, and there has been no credit event, the realized loss will be equal to the periodic fee paid over the life of the contract.
     
               If there is a credit event, the buyer of protection can exercise its rights under the contract and receive a payment from the seller of protection equal to the notional amount of the reference asset less the market value of the reference asset. Upon exercise of the contract the difference between the value of the underlying reference asset and the notional amount is recorded as realized gain (loss) and is included on the Statement of Operations.
     
               The Fund has sold credit protection through credit default swaps to increase exposure to the credit risk of individual securities and/or, indexes that are either unavailable or considered to be less attractive in the bond market.
     
               The Fund has purchased credit protection through credit default swaps to decrease exposure to the credit risk of individual securities and/or, indexes.
     
               For the year ended December 31, 2010, the Fund had average notional amounts of $47,818,154 and $155,346,954 on credit default swaps to buy protection and credit default swaps to sell protection, respectively.
     
               Additional associated risks to the Fund include counterparty credit risk and liquidity risk.
        Interest Rate Swap Contracts. An interest rate swap is an agreement between counterparties to exchange periodic payments based on interest rates. One cash flow stream will typically be a floating rate payment based upon a specified interest rate while the other is typically a fixed interest rate.
               The Fund has entered into interest rate swaps in which it pays a floating interest rate and receives a fixed interest rate in order to increase exposure to interest rate risk. Typically, if relative interest rates rise, payments made by the Fund under a swap agreement will be greater than the payments received by the Fund.
     
               The Fund has entered into interest rate swaps in which it pays a fixed interest rate and receives a floating interest rate in order to decrease exposure to interest rate risk. Typically, if relative interest rates rise, payments received by the Fund under the swap agreement will be greater than the payments made by the Fund.
     
               For the December 31, 2010, the Fund had average notional amounts of $59,856,494 and $162,928,645 on interest rate swaps which pay a fixed rate and interest rate swaps which receive a fixed rate, respectively.
     
               Additional associated risks to the Fund include counterparty credit risk and liquidity risk.
        Total Return Swap Contracts. A total return swap is an agreement between counterparties to exchange periodic payments based on asset or non-asset references. One cash flow is typically based on a non-asset reference (such as an interest rate or index) and the other on the total return of a reference asset (such as a security or a basket of securities). The total return of the reference asset typically includes appreciation or depreciation on the reference asset, plus any interest or dividend payments.

         Total return swap contracts are exposed to the market risk factor of the specific underlying financial instrument or index. Total return swaps are less standard in structure than other types of swaps and can isolate and/or, include multiple types of market risk factors including equity risk, credit risk, and interest rate risk.

         The Fund has entered into total return swaps on various equity securities or indexes to increase exposure to equity risk. These equity risk related total return swaps require the Fund to pay a floating reference interest rate, or an amount equal to the negative price movement of securities or an index multiplied by the notional amount of the contract. The Fund will receive payments equal to the positive price movement of the same securities or index multiplied by the notional amount of the contract.
         The Fund has entered into total return swaps on various equity securities or indexes to decrease exposure to equity risk. These equity risk related total return swaps require the Fund to pay an amount equal to the positive price movement of securities or an index multiplied by the notional amount of the contract. The Fund will receive payments of a floating reference interest rate or an amount equal to the negative price movement of the same securities or index multiplied by the notional amount of the contract.
         For the year ended December 31, 2010, the Fund had average notional amounts of $7,104,778,237 and $32,460,703 on total return swaps which are long the reference asset and total return swaps which are short the reference asset, respectively.
         Additional associated risks to the Fund include counterparty credit risk and liquidity risk.
         Currency Swaps. A currency swap is an agreement between counterparties to exchange different currencies equivalent to the notional value at contract inception and reverse the exchange of the same notional values of those currencies at contract termination. The contract may also include periodic exchanges of cash flows based on a specified index or interest rate.
         The Fund has entered into currency swap contracts with the obligation to pay an interest rate on various foreign currency notional amounts and receive an interest rate on the dollar notional amount in order to take a negative investment perspective on the related currencies for which the Fund receives a payment. These currency swap contracts seek to decrease exposure to foreign exchange rate risk.
         For the year ended December 31, 2010, the Fund had average notional amounts of $9,313,666 on currency swaps.
         Additional associated risks to the Fund include counterparty credit risk and liquidity risk.
         Volatility Swap Contracts. A volatility swap is an agreement between counterparties to exchange periodic payments based on the measured volatility of a reference security, index, currency or other reference investment over a specified time frame. One cash flow is typically based on the volatility of the reference investment as measured by changes in its price or level while the other cash flow is based on an interest rate or the measured volatility of a different reference investment. The appreciation or depreciation on a volatility swap will typically depend on the magnitude of the reference investment’s volatility, or size of the movement, rather than general directional increases or decreases in its price.
         Volatility swaps are less standard in structure than other types of swaps and provide pure, or isolated, exposure to volatility risk of the specific underlying reference investment. Volatility swaps are typically used to speculate on future volatility levels, to trade the spread between realized and expected volatility, or to decrease the volatility exposure of investments held by the Fund.
         The Fund has entered into volatility swaps to increase exposure to the volatility risk of various reference investments. These types of volatility swaps require the fund to pay the measured volatility and receive a fixed interest payment over the period of the contract. If the measured volatility of the related reference investment increases over the period, the swaps will depreciate in value. Conversely, if the measured volatility of the related reference investment decreases over the period, the swaps will appreciate in value.
    The Fund has entered into volatility swaps to decrease exposure to the volatility risk of various reference investments. These types of volatility swaps require the fund to pay a fixed interest payment and receive the measured volatility over the period of the contract. If the measured volatility of the related reference investment increases over the period, the swaps will appreciate in value. Conversely, if the measured volatility of the related reference investment decreases over the period, the swaps will depreciate in value.
         For the year ended December 31, 2010, the Fund had average notional amounts of $66,351 and $204,577 on volatility swaps which pay volatility and volatility swaps which receive volatility, respectively.
         Additional associated risks to the Fund include counterparty credit risk and liquidity risk.
    6. Restricted Securities
    As of December 31, 2010, investments in securities included issues that are restricted. A restricted security may have a contractual restriction on its resale and is valued under methods approved by the Board of Directors as reflecting fair value. Securities that are restricted are marked with an applicable footnote on the Statement of Investments. Restricted securities are reported on a schedule following the Statement of Investments.
    7. Securities Lending
    The Fund lends portfolio securities from time to time in order to earn additional income in the form of fees or interest on securities received as collateral or the investment of any cash received as collateral. The loans are secured by collateral (either securities, letters of credit, or cash) in an amount not less than 100% of the market value of the loaned securities during the period of the loan. The market value of the loaned securities is determined at the close of each business day and any additional required collateral is delivered to the Fund on the next business day. If the borrower defaults on its obligation to return the securities loaned because of insolvency or other reasons, the Fund could experience delays and cost in recovering the securities loaned or in gaining access to the collateral. The Fund continues to receive the economic benefit of interest or dividends paid on the securities loaned in the form of a substitute payment received from the borrower and recognizes the gain or loss in the fair value of the securities loaned that may occur during the term of the loan. The Fund has the right under the lending agreement to recover the securities from the borrower on demand.
         As of December 31, 2010, the Fund had no securities on loan.
    8. Unfunded Purchase Agreements
    Pursuant to the terms of certain indenture agreements, the Fund has unfunded purchase agreements of $8,676,183 at December 31, 2010. The following agreements are subject to funding based on the borrower’s discretion. The Fund is obligated to fund these agreements at the time of the request by the borrower. These agreements have been excluded from the Statement of Investments.
    As of December 31, 2010, the Fund had unfunded purchase agreements as follows:
                     
        Commitment     Unfunded  
        Termination Date     Amount  
     
    Deutsche Bank AG, Opic Reforma I Credit Linked Nts.
        10/23/13     $ 8,676,183  


    9. Pending Litigation
    Since 2009, a number of lawsuits have been pending in federal courts against the Manager, the Distributor, and certain mutual funds (“Defendant Funds”) advised by the Manager and distributed by the Distributor (but not including the Fund). The lawsuits naming the Defendant Funds also name as defendants certain officers and current and former trustees of the respective Defendant Funds. The plaintiffs seek class action status on behalf of purchasers of shares of the respective Defendant Fund during a particular time period. The lawsuits raise claims under federal securities laws alleging that, among other things, the disclosure documents of the respective Defendant Fund contained misrepresentations and omissions, that such Defendant Fund’s investment policies were not followed, and that such Defendant Fund and the other defendants violated federal securities laws and regulations. The plaintiffs seek unspecified damages, equitable relief and an award of attorneys’ fees and litigation expenses.
         In 2009, what are claimed to be derivative lawsuits were filed in state court against the Manager and a subsidiary (but not against the Fund), on behalf of the New Mexico Education Plan Trust. These lawsuits allege breach of contract, breach of fiduciary duty, negligence and violation of state securities laws, and seek compensatory damages, equitable relief and an award of attorneys’ fees and litigation expenses.
         Other lawsuits have been filed since 2008 in various state and federal courts, against the Manager and certain of its affiliates. Those lawsuits were filed by investors who made investments through an affiliate of the Manager, and relate to the alleged investment fraud perpetrated by Bernard Madoff and his firm (“Madoff”). Those suits allege a variety of claims, including breach of fiduciary duty, fraud, negligent misrepresentation, unjust enrichment, and violation of federal and state securities laws and regulations, among others. They seek unspecified damages, equitable relief and an award of attorneys’ fees and litigation expenses. None of the suits have named the Distributor, any of the Oppenheimer mutual funds or any of their independent Trustees or Directors as defendants. None of the Oppenheimer funds invested in any funds or accounts managed by Madoff.
         The Manager believes that the lawsuits described above are without legal merit and is defending against them vigorously. The Defendant Funds’ Boards of Trustees have also engaged counsel to defend the suits brought against those Funds and the present and former Independent Trustees named in those suits. While it is premature to render any opinion as to the outcome in these lawsuits, or whether any costs that the Defendant Funds may bear in defending the suits might not be reimbursed by insurance, the Manager believes that these suits should not impair the ability of the Manager or the Distributor to perform their respective duties to the Fund, and that the outcome of all of the suits together should not have any material effect on the operations of any of the Oppenheimer funds.
    10. Subsequent Event
    The Regulated Investment Company Modernization Act of 2010 (the “Act”) was signed into law on December 22, 2010. The Act makes changes to a number of tax rules impacting the Fund. Under the Act, future capital losses generated by a fund may be carried over indefinitely, but these losses must be used prior to the utilization of any pre-enactment capital losses. Since pre-enactment capital losses may only be carried forward for eight years, there may be a greater likelihood that all or a portion of a fund’s pre-enactment capital losses will expire unused. In general, the provisions of the Act will be effective for the Fund’s fiscal year ending December 31, 2011. Specific information regarding the impact of the Act on the Fund will be contained within the “Federal Taxes” section of the financial statement notes for the fiscal year ending December 31, 2011.


    REPORT OF INDEPENDENT REGISTERED PUBLIC ACCOUNTING FIRM
    The Board of Trustees and Shareholders of Oppenheimer Variable Account Funds:
    We have audited the accompanying statement of assets and liabilities of Oppenheimer High Income Fund/VA (one of the portfolios constituting the Oppenheimer Variable Account Funds), including the statement of investments, as of December 31, 2010, the related statement of operations for the year then ended, and the statements of changes in net assets and the financial highlights for each of the years in the two-year period then ended. These financial statements and financial highlights are the responsibility of the Fund’s management. Our responsibility is to express an opinion on these financial statements and financial highlights based on our audits. The accompanying financial highlights of Oppenheimer High Income Fund/VA for the years ended prior to January 1, 2009 were audited by other auditors whose report dated February 11, 2009 expressed an unqualified opinion on those financial highlights.
         We conducted our audits in accordance with the standards of the Public Company Accounting Oversight Board (United States). Those standards require that we plan and perform the audits to obtain reasonable assurance about whether the financial statements and financial highlights are free of material misstatement. An audit includes examining, on a test basis, evidence supporting the amounts and disclosures in the financial statements. Our procedures included confirmation of securities owned as of December 31, 2010, by correspondence with the custodian, transfer agent and brokers, or by other appropriate auditing procedures where replies from brokers were not received. An audit also includes assessing the accounting principles used and significant estimates made by management, as well as evaluating the overall financial statement presentation. We believe that our audits provide a reasonable basis for our opinion.
         In our opinion, the financial statements and financial highlights referred to above present fairly, in all material respects, the financial position of Oppenheimer High Income Fund/VA as of December 31, 2010, the results of its operations for the year then ended, and the changes in its net assets and the financial highlights for each of the years in the two-year period then ended, in conformity with U.S. generally accepted accounting principles.
    /s/ KPMG llp
    Denver, Colorado
    February 16, 2011


    STATEMENT OF INVESTMENTS December 31, 2010
                     
        Principal        
        Amount     Value  
     
    Corporate Bonds and Notes—87.2%
                   
    Consumer Discretionary—18.8%
                   
    Auto Components—1.5%
                   
    Goodyear Tire & Rubber Co. (The), 8.25% Sr. Unsec. Unsub. Nts., 8/15/20
      $ 570,000     $ 592,800  
    Tower Automotive Holdings USA LLC/TA Holdings Finance, Inc., 10.625% Sr. Sec. Nts., 9/1/171
        1,389,000       1,500,120  


                2,092,920  
     
                   
    Hotels, Restaurants & Leisure—7.8%
                   
    Equinox Holdings, Inc., 9.50% Sr. Sec. Nts., 2/1/162
        350,000       371,438  
    Harrah’s Operating Co., Inc., 10% Sr. Sec. Nts., 12/15/18
        2,658,000       2,438,690  
    Isle of Capri Casinos, Inc., 7% Sr. Unsec. Sub. Nts., 3/1/14
        705,000       694,425  
    Landry’s Restaurants, Inc., 11.625% Sr. Sec. Nts., 12/1/15
        455,000       487,988  
    Mashantucket Pequot Tribe, 8.50% Bonds, Series A, 11/15/152,3,4
        1,505,000       205,056  
    MGM Mirage, Inc.:
                   
    5.875% Sr. Nts., 2/27/14
        430,000       398,825  
    6.75% Sr. Unsec. Nts., 4/1/13
        965,000       964,035  
    Mohegan Tribal Gaming Authority:
                   
    6.125% Sr. Unsec. Sub. Nts., 2/15/13
        1,550,000       1,294,250  
    6.875% Sr. Unsec. Sub. Nts., 2/15/15
        322,000       200,445  
    8% Sr. Sub. Nts., 4/1/12
        1,260,000       1,058,400  
    11.50% Sr. Sec. Nts., 11/1/172
        675,000       626,063  
    Penn National Gaming, Inc., 8.75% Sr. Unsec. Sub. Nts., 8/15/19
        605,000       670,038  
    Station Casinos, Inc., 6.50% Sr. Unsec. Sub. Nts., 2/1/143,4
        2,595,000       260  
    Travelport LLC, 11.875% Sr. Unsec. Sub. Nts., 9/1/16
        750,000       740,625  
    Wynn Las Vegas LLC/Wynn Las Vegas Capital Corp., 7.75% Sec. Nts., 8/15/20
        605,000       657,938  


                10,808,476  
     
                   
    Household Durables—1.8%
                   
    Beazer Homes USA, Inc.:
                   
    6.875% Sr. Unsec. Nts., 7/15/15
        690,000       671,025  
    9.125% Sr. Nts., 5/15/192
        690,000       657,225  
    K. Hovnanian Enterprises, Inc., 8.875% Sr. Sub. Nts., 4/1/12
        490,000       482,650  
    Reynolds Group Issuer, Inc./Reynolds Group Issuer LLC/Reynolds Group Issuer
    Luxembourg SA:
                   
    9% Sr. Nts., 4/15/192
        325,000       338,406  
    8.50% Sr. Nts., 5/15/182
        320,000       323,200  


                2,472,506  
     
                   
    Leisure Equipment & Products—1.7%
                   
    Eastman Kodak Co., 9.75% Sr. Sec. Nts., 3/1/182
        2,355,000       2,413,875  
    Media—5.9%
                   
    Affinion Group Holdings, Inc., 11.625% Sr. Nts., 11/15/152
        420,000       437,850  
    Affinion Group, Inc., 7.875% Sr. Nts., 12/15/182
        760,000       744,800  
    American Media Operations, Inc., 13.50% 2nd Lien Nts., 6/15/183,4
        2,031       2,031  
    Belo (A.H.) Corp.:
                   
    7.25% Sr. Unsec. Unsub. Bonds, 9/15/27
        115,000       100,338  
    7.75% Sr. Unsec. Unsub. Debs., 6/1/27
        719,000       650,695  
    Cengage Learning Acquisitions, Inc.:
                   
    10.50% Sr. Nts., 1/15/152
        825,000       855,938  
    13.25% Sr. Sub. Nts., 7/15/152
        355,000       376,300  
    Clear Channel Communications, Inc., 10.75% Sr. Unsec. Unsub. Nts., 8/1/16
        745,000       670,500  
    Entravison Communications Corp., 8.75% Sr. Sec. Nts., 8/1/172
        155,000       164,300  
    Gray Television, Inc., 10.50% Sr. Sec. Nts., 6/29/15
        1,270,000       1,285,875  
    Interactive Data Corp., 10.25% Sr. Nts., 8/1/181
        230,000       251,850  
    Newport Television LLC/NTV Finance Corp., 12.44% Sr. Nts., 3/15/172,5
        615,000       581,175  
    Nexstar Broadcasting, Inc., 8.875% Sr. Sec. Nts., 4/15/172
        485,000       517,738  
    Radio One, Inc., 12.50% Sr. Unsec. Sub. Nts., 5/11/162
        133,000       131,005  
    Sinclair Television Group, Inc., 8.375% Sr. Nts., 10/15/182
        650,000       674,375  
    Univision Communications, Inc.:
                   
    7.875% Sr. Sec. Nts., 11/1/202
        115,000       121,325  
    8.50% Sr. Unsec. Nts., 5/15/212
        150,000       152,625  
    Visant Corp., 10% Sr. Sec. Nts., 10/1/172
        145,000       154,425  
    WMG Holdings Corp., 9.50% Sr. Unsec. Nts., 12/15/14
        360,000       346,500  


                8,219,645  
     
                   
    Multiline Retail—0.1%
                   
    Bon-Ton Stores, Inc. (The), 10.25% Sr. Unsec. Unsub. Nts., 3/15/14
        115,000       117,875  
    Consumer Staples—2.8%
                   
    Food & Staples Retailing—0.0%
                   
    Real Time Data Co., 11% Nts., 5/31/091,3,4,5
        476,601        
    Food Products—2.8%
                   
    American Seafoods Group LLC, 10.75% Sr. Sub. Nts., 5/15/162
        925,000       989,750  
     
                     
        Principal        
        Amount     Value  
     
    Food Products Continued
                   
    ASG Consolidated LLC, 14.10% Sr. Nts., 5/15/172,5
      $ 1,040,591     $ 1,004,170  
    Bumble Bee Acquisition Corp., 9% Sr. Sec. Nts., 12/15/172
        695,000       726,275  
    Pilgrim’s Pride Corp., 7.875% Sr. Nts., 12/15/182
        595,000       595,000  
    Southern States Cooperative, Inc., 11.25% Sr. Nts., 5/15/151
        595,000       633,675  


                3,948,870  
     
                   
    Energy—11.2%
                   
    Energy Equipment & Services—2.5%
                   
    Frac Tech Services LLC/Frac Tech Finance, Inc., 7.125% Sr. Nts., 11/15/182
        190,000       193,325  
    Global Geophysical Services, Inc., 10.50% Sr. Unsec. Nts., 5/1/17
        640,000       640,000  
    PHI, Inc., 8.625% Sr. Unsec. Nts., 10/15/182
        705,000       726,150  
    Precision Drilling Corp., 6.625% Sr. Unsec. Nts., 11/15/202
        565,000       576,300  
    Thermon Industries, Inc., 9.50% Sr. Sec. Nts., 5/1/172
        575,000       615,250  
    Vantage Drilling Co., 11.50% Sr. Sec. Nts., 8/1/152
        605,000       659,450  


                3,410,475  
     
                   
    Oil, Gas & Consumable Fuels—8.7%
                   
    Alon Refining Krotz Springs, Inc., 13.50% Sr. Sec. Nts., 10/15/14
        200,000       193,000  
    Antero Resources Finance Corp., 9.375% Sr. Unsec. Nts., 12/1/17
        645,000       678,056  
    Atlas Energy Resources LLC, 10.75% Sr. Unsec. Nts., 2/1/18
        1,090,000       1,336,613  
    Atlas Pipeline Partners LP, 8.125% Sr. Unsec. Nts., 12/15/15
        355,000       367,425  
    ATP Oil & Gas Corp., 11.875% Sr. Sec. Nts., 5/1/152
        1,965,000       1,866,750  
    Berry Petroleum Co., 8.25% Sr. Sub. Nts., 11/1/16
        220,000       230,450  
    Bill Barrett Corp., 9.875% Sr. Nts., 7/15/16
        585,000       644,963  
    BreitBurn Energy Partners LP, 8.625% Sr. Unsec. Nts., 10/15/202
        665,000       671,650  
    Chaparral Energy, Inc.:
                   
    8.875% Sr. Unsec. Nts., 2/1/17
        640,000       652,800  
    9.875% Sr. Nts., 10/1/202
        640,000       678,400  
    Crosstex Energy LP/Crosstex Energy Finance Corp., 8.875% Sr. Unsec. Nts., 2/15/18
        75,000       80,719  
    Linn Energy LLC, 8.625% Sr. Unsec. Nts., 4/15/202
        1,145,000       1,239,463  
    MarkWest Energy Partners LP/MarkWest Energy Finance Corp., 6.75% Sr. Unsec. Nts., 11/1/20
        70,000       70,350  
    Murray Energy Corp., 10.25% Sr. Sec. Nts., 10/15/152
        1,575,000       1,661,625  
    Quicksilver Resources, Inc., 11.75% Sr. Nts., 1/1/16
        615,000       719,550  
    Range Resources Corp., 8% Sr. Unsec. Sub. Nts., 5/15/19
        95,000       103,906  
    SandRidge Energy, Inc.:
                   
    8.75% Sr. Unsec. Nts., 1/15/20
        560,000       578,200  
    9.875% Sr. Unsec. Nts., 5/15/162
        305,000       324,063  


                12,097,983  
     
                   
    Financials—6.8%
                   
    Capital Markets—3.2%
                   
    American General Finance, 6.90% Nts., Series J, 12/15/17
        535,000       434,688  
    Berry Plastics Holding Corp., 10.25% Sr. Unsec. Sub. Nts., 3/1/16
        300,000       295,875  
    Nationstar Mortgage LLC/Nationstar Capital Corp., 10.875% Sr. Nts., 4/1/152
        2,475,000       2,444,063  
    Nuveen Investments, Inc., 5.50% Sr. Unsec. Nts., 9/15/15
        535,000       461,438  
    Pinafore LLC/Pinafore, Inc., 9% Sr. Sec. Nts., 10/1/182
        715,000       775,775  


                4,411,839  
     
                   
    Commercial Banks—0.5%
                   
    CIT Group, Inc., 7% Sr. Sec. Bonds, 5/1/17
        645,000       648,225  
    Consumer Finance—0.4%
                   
    TMX Finance LLC/TitleMax Finance Corp., 13.25% Sr. Sec. Nts., 7/15/152
        570,000       629,850  
    Diversified Financial Services—0.7%
                   
    GMAC LLC, 8% Sr. Unsec. Nts., 11/1/31
        375,000       405,938  
    ING Groep NV, 5.775% Jr. Unsec. Sub. Perpetual Bonds6
        695,000       601,175  


                1,007,113  
     
                   
    Insurance—0.8%
                   
    International Lease Finance Corp.:
                   
    5.875% Unsec. Unsub. Nts., 5/1/13
        205,000       208,331  
    8.625% Sr. Nts., 9/15/152
        410,000       441,775  
    8.75% Sr. Unsec. Unsub. Nts., 3/15/172
        350,000       376,250  
    8.875% Sr. Unsec. Nts., 9/1/17
        70,000       75,863  


                1,102,219  

                     
        Principal        
        Amount     Value  
     
    Real Estate Management & Development—1.2%
                   
    Realogy Corp., 10.50% Sr. Unsec. Nts., 4/15/14
      $ 1,085,000     $ 1,071,438  
    Wallace Theater Holdings, Inc., 12.50% Sr. Sec. Nts., 6/15/131,7
        530,000       541,925  


                1,613,363  
     
                   
    Health Care—6.1%
                   
    Health Care Equipment & Supplies—2.1%
                   
    Accellent, Inc., 10% Sr. Sub. Nts., 11/1/172
        570,000       540,075  
    Alere, Inc., 8.625% Sr. Sub. Nts., 10/1/182
        245,000       249,288  
    Biomet, Inc.:
                   
    10.375% Sr. Unsec. Nts., 10/15/175
        460,000       504,850  
    11.625% Sr. Unsec. Sub. Nts., 10/15/17
        275,000       305,250  
    DJO Finance LLC/DJO Finance Corp., 9.75% Sr. Sub. Nts., 10/15/172
        520,000       538,200  
    Inverness Medical Innovations, Inc., 7.875% Sr. Unsec. Unsub. Nts., 2/1/16
        385,000       387,888  
    Universal Hospital Services, Inc., 8.50% Sr. Sec. Nts., 6/1/155
        350,000       361,375  


                2,886,926  
     
                   
    Health Care Providers & Services—3.0%
                   
    Capella Healthcare, Inc., 9.25% Sr. Unsec. Nts., 7/1/172
        95,000       100,938  
    Catalent Pharma Solutions, Inc., 10.25% Sr. Unsec. Nts., 4/15/155
        495,151       502,578  
    Gentiva Health Services, Inc., 11.50% Sr. Unsec. Unsub. Nts., 9/1/18
        575,000       629,625  
    HCA, Inc., 6.375% Nts., 1/15/15
        380,000       375,250  
    HEALTHSOUTH Corp.:
                   
    7.25% Sr. Unsec. Nts., 10/1/18
        350,000       357,875  
    7.75% Sr. Unsec. Nts., 9/15/22
        130,000       134,550  
    inVentiv Health, Inc., 10% Sr. Unsec. Nts., 8/15/182
        600,000       603,000  
    Multiplan, Inc., 9.875% Sr. Nts., 9/1/182
        460,000       489,900  
    OnCure Holdings, Inc., 11.75% Sr. Sec. Nts., 5/15/172
        265,000       251,750  
    Radiation Therapy Services, Inc., 9.875% Sr. Sub. Nts., 4/15/172
        235,000       235,588  
    UHS Escrow Corp., 7% Sr. Nts., 10/1/182
        55,000       56,650  
    Vanguard Health Holding Co. II LLC/ Vanguard Holding Co. II, Inc., 8% Sr. Nts., 2/1/18
        375,000       386,250  


                4,123,954  
     
                   
    Health Care Technology—0.2%
                   
    MedAssets, Inc., 8% Sr. Nts., 11/15/182
        225,000       227,250  
    Pharmaceuticals—0.8%
                   
    Mylan, Inc., 6% Sr. Nts., 11/15/182
        200,000       197,000  
    Valeant Pharmaceuticals International, Inc., 6.875% Sr. Unsec. Nts., 12/1/182
        190,000       189,525  
    Warner Chilcott Co. LLC, 7.75% Sr. Nts., 9/15/182
        800,000       812,000  


                1,198,525  
     
                   
    Industrials—12.8%
                   
    Aerospace & Defense—3.7%
                   
    BE Aerospace, Inc., 6.875% Sr. Nts., 10/1/20
        140,000       145,250  
    DynCorp International, Inc., 10.375% Sr. Unsec. Nts., 7/1/172
        1,210,000       1,246,300  
    Hawker Beechcraft Acquisition Co. LLC, 8.50% Sr. Unsec. Nts., 4/1/15
        1,435,000       1,072,663  
    TransDigm, Inc., 7.75% Sr. Sub. Nts., 12/15/182
        1,585,000       1,648,400  
    Triumph Group, Inc., 8.625% Sr. Unsec. Nts., 7/15/18
        895,000       982,263  


                5,094,876  
     
                   
    Air Freight & Logistics—0.4%
                   
    AMGH Merger Sub, Inc., 9.25% Sr. Sec. Nts., 11/1/182
        510,000       538,050  
    Airlines—0.7%
                   
    Delta Air Lines, Inc., 12.25% Sr. Sec. Nts., 3/15/152
        915,000       1,036,238  
    Building Products—1.2%
                   
    Associated Materials LLC, 9.125% Sr. Sec. Nts., 11/1/172
        265,000       277,588  
    Ply Gem Industries, Inc., 13.125% Sr. Unsec. Sub. Nts., 7/15/14
        1,225,000       1,307,688  
    Roofing Supply Group LLC/Roofing Supply Finance, Inc., 8.625% Sr. Sec. Nts., 12/1/172
        75,000       77,625  


                1,662,901  
     
                   
    Commercial Services & Supplies—0.7%
                   
    American Pad & Paper Co., 13% Sr. Sub. Nts., Series B, 11/15/053,4
        200,000        
    West Corp.:
                   
    7.875% Sr. Nts., 1/15/192
        305,000       311,100  
    8.625% Sr. Unsec. Nts., 10/1/182
        635,000       676,275  


                987,375  
     
                   
    Industrial Conglomerates—0.5%
                   
    Sequa Corp., 11.75% Sr. Unsec. Nts., 12/1/152
        600,000       645,000  
    Machinery—2.1%
                   
    Cleaver-Brooks, Inc., 12.25% Sr. Sec. Nts., 5/1/162
        590,000       629,088  
     
                     
        Principal        
        Amount     Value  
     
    Machinery Continued
                   
    Manitowoc Co., Inc. (The), 8.50% Sr. Unsec. Nts., 11/1/20
      $ 685,000     $ 731,238  
    Terex Corp., 8% Sr. Unsec. Sub. Nts., 11/15/17
        1,260,000       1,278,900  
    Thermadyne Holdings Corp., 9% Sr. Sec. Nts., 12/15/172
        335,000       347,144  


                2,986,370  
     
                   
    Marine—0.7%
                   
    Marquette Transportation Co., 10.875% Sr. Sec. Nts., 1/15/172
        725,000       743,125  
    Navios Maritime Acquisition Corp., 8.625% Sr. Sec. Nts., 11/1/172
        175,000       179,813  


                922,938  
     
                   
    Professional Services—0.7%
                   
    Altegrity, Inc., 10.50% Sr. Unsec. Sub. Nts., 11/1/152
        855,000       881,719  
    TransUnion LLC/TransUnion Financing Corp., 11.375% Sr. Unsec. Nts., 6/15/182
        150,000       171,750  


                1,053,469  
     
                   
    Road & Rail—1.6%
                   
    Hertz Corp., 7.50% Sr. Unsec. Nts., 10/15/182
        1,265,000       1,318,763  
    Western Express, Inc., 12.50% Sr. Sec. Nts., 4/15/152
        1,020,000       907,800  


                2,226,563  
     
                   
    Trading Companies & Distributors—0.5%
                   
    Ashtead Capital, Inc., 9% Nts., 8/15/161
        220,000       230,450  
    United Rentals North America, Inc.:
                   
    8.375% Sr. Unsec. Sub. Nts., 9/15/20
        115,000       117,588  
    9.25% Sr. Unsec. Unsub. Nts., 12/15/19
        275,000       307,313  


                655,351  
     
                   
    Information Technology—7.7%
                   
    Computers & Peripherals—0.7%
                   
    CDW LLC/CDW Finance Corp., 11% Sr. Unsec. Nts., 10/12/15
        310,000       323,175  
    Seagate HDD Cayman, 6.875% Sr. Unsec. Nts., 5/1/202
        650,000       624,000  


                947,175  
     
                   
    Electronic Equipment & Instruments—0.5%
                   
    RBS Global, Inc./Rexnord Corp., 11.75% Sr. Unsec. Sub. Nts., 8/1/16
        660,000       711,150  
    Internet Software & Services—1.9%
                   
    Bankrate, Inc., 11.75% Sr. Sec. Nts., 7/15/152
        370,000       412,550  
    ITC DeltaCom, Inc., 10.50% Sr. Sec. Nts., 4/1/16
        1,245,000       1,360,163  
    Telcordia Technologies, Inc., 11% Sr. Sec. Nts., 5/1/182
        945,000       954,450  


                2,727,163  
     
                   
    IT Services—2.0%
                   
    Ceridian Corp., 11.25% Sr. Unsec. Nts., 11/15/15
        535,000       532,325  
    First Data Corp.:
                   
    8.875% Sr. Sec. Nts., 8/15/202
        570,000       604,200  
    9.875% Sr. Unsec. Nts., 9/24/15
        1,260,000       1,206,450  
    SunGard Data Systems, Inc.:
                   
    7.375% Sr. Unsec. Nts., 11/15/182
        190,000       191,900  
    7.625% Sr. Unsec. Nts., 11/15/202
        190,000       193,325  


                2,728,200  
     
                   
    Semiconductors & Semiconductor Equipment—2.6%
                   
    Advanced Micro Devices, Inc., 7.75% Sr. Unsec. Nts., 8/1/202
        315,000       328,388  
    Amkor Technology, Inc., 7.375% Sr. Unsec. Nts., 5/1/18
        345,000       360,525  
    Freescale Semiconductor, Inc.:
                   
    9.25% Sr. Sec. Nts., 4/15/182
        395,000       436,475  
    10.75% Sr. Unsec. Nts., 8/1/202
        1,065,000       1,166,175  
    NXP BV/NXP Funding LLC:
                   
    7.875% Sr. Sec. Nts., 10/15/14
        375,000       391,875  
    9.50% Sr. Unsec. Unsub. Nts., 10/15/15
        625,000       670,313  
    9.75% Sr. Sec. Nts., 8/1/182
        255,000       288,150  


                3,641,901  
     
                   
    Materials—9.8%
                   
    Chemicals—3.5%
                   
    Ferro Corp., 7.875% Sr. Unsec. Nts., 8/15/18
        635,000       673,100  
    Hexion U.S. Finance Corp./Hexion Nova Scotia Finance ULC:
                   
    8.875% Sr. Sec. Nts., 2/1/18
        950,000       1,020,063  
    9% Sr. Sec. Nts., 11/15/202
        350,000       371,000  
    Huntsman International LLC:
                   
    8.625% Sr. Sub. Nts., 3/15/212
        70,000       75,950  
    8.625% Sr. Unsec. Sub. Nts., 3/15/20
        860,000       939,550  
    Momentive Performance Materials, Inc.:
                   
    9% Sec. Nts., 1/15/212
        695,000       734,963  
    11.50% Sr. Unsec. Sub. Nts., 12/1/16
        605,000       659,450  
    Nalco Co., 6.625% Sr. Nts., 1/15/192
        120,000       123,300  
    Rhodia SA, 6.875% Sr. Nts., 9/15/202
        230,000       234,313  


                4,831,689  
     
                   
    Containers & Packaging—1.2%
                   
    Berry Plastics Corp., 9.75% Sr. Sec. Nts., 1/15/212
        940,000       935,300  
    Jefferson Smurfit Corp. (Escrow):
                   
    7.50% Sr. Unsec. Unsub. Nts., 6/1/133,4
        205,000       7,688  
    8.25% Sr. Unsec. Nts., 10/1/123,4
        595,000       22,313  

                     
        Principal        
        Amount     Value  
     
    Containers & Packaging Continued
                   
    Smurfit-Stone Container Corp. (Escrow):
                   
    8% Sr. Unsec. Unsub. Nts., 3/15/173,4
      $ 395,000     $ 18,763  
    8.375% Sr. Nts., 7/1/123,4
        205,000       7,688  
    Solo Cup Co., 8.50% Sr. Sub. Nts., 2/15/14
        755,000       683,275  


                1,675,027  
     
                   
    Metals & Mining—0.5%
                   
    Edgen Murray Corp., 12.25% Sr. Sec. Nts., 1/15/15
        770,000       673,750  
    Paper & Forest Products—4.6%
                   
    ABI Escrow Corp., 10.25% Sr. Sec. Nts., 10/15/182
        535,000       588,500  
    Abitibi-Consolidated Co. of Canada (Escrow):
                   
    6% Sr. Unsec. Unsub. Nts., 6/20/133,4
        445,000       5,006  
    7.75% Sr. Unsec. Bonds, 6/15/113,4
        225,000       2,531  
    8.375% Sr. Unsec. Sub. Nts., 4/1/153,4
        615,000       6,919  
    8.85% Unsec. Bonds, 8/1/303,4
        220,000       2,750  
    Ainsworth Lumber Co. Ltd., 11% Sr. Unsec. Unsub. Nts., 7/29/152,5
        794,375       750,684  
    Appleton Papers, Inc., 10.50% Sr. Sec. Nts., 6/15/152
        1,265,000       1,258,675  
    Bowater Pulp & Paper Canada, Inc., 10.60% Sr. Unsec. Nts., 1/15/113,4
        315,000       85,050  
    Bowater, Inc. (Escrow):
                   
    6.50% Sr. Unsec. Nts., 6/15/133,4
        725,000       32,625  
    9% Sr. Unsec. Nts., 8/1/093,4
        185,000       8,325  
    Catalyst Paper Corp., 11% Sr. Sec. Nts., 12/15/162
        847,000       802,533  
    Mercer International, Inc., 9.50% Sr. Unsec. Nts., 12/1/172
        570,000       588,525  
    NewPage Corp., 11.375% Sr. Sec. Nts., 12/31/14
        1,085,000       1,025,325  
    Verso Paper Holdings LLC, 11.375% Sr. Unsec. Sub. Nts., Series B, 8/1/16
        1,310,000       1,319,825  


                6,477,273  
     
                   
    Telecommunication Services—5.7%
                   
    Diversified Telecommunication Services—3.4%
                   
    Broadview Networks Holdings, Inc., 11.375% Sr. Sec. Nts., 9/1/12
        340,000       334,050  
    Cincinnati Bell, Inc.:
                   
    8.25% Sr. Nts., 10/15/17
        305,000       303,475  
    8.75% Sr. Unsec. Sub. Nts., 3/15/18
        325,000       306,313  
    Intelsat Bermuda Ltd.:
                   
    11.25% Sr. Unsec. Nts., 2/4/17
        635,000       695,325  
    12.50% Sr. Unsec. Nts., 2/4/175
        318,750       353,813  
    Intelsat Jackson Holdings SA, 7.25% Sr. Unsec. Nts., 10/15/202
        175,000       177,625  
    Level 3 Financing, Inc., 9.25% Sr. Unsec. Unsub. Nts., 11/1/14
        1,125,000       1,122,188  
    PAETEC Holding Corp., 9.50% Sr. Unsec. Unsub. Nts., 7/15/15
        1,085,000       1,128,400  
    Windstream Corp., 8.125% Sr. Unsec. Unsub. Nts., 9/1/18
        305,000       321,775  
    Winstar Communications, Inc., 12.75% Sr. Nts., 4/15/103,4
        1,000,000       1  


                4,742,965  
     
                   
    Wireless Telecommunication Services—2.3%
                   
    Cricket Communications, Inc., 7.75% Sr. Unsec. Nts., 10/15/202
        1,310,000       1,251,050  
    MetroPCS Wireless, Inc.:
                   
    6.625% Sr. Unsec. Nts., 11/15/20
        680,000       649,400  
    7.875% Sr. Unsec. Nts., 9/1/18
        1,165,000       1,214,513  
    Teligent, Inc., 11.50% Sr. Nts., 12/1/083,4
        400,000        


                3,114,963  
     
                   
    Utilities—5.5%
                   
    Electric Utilities—2.1%
                   
    Edison Mission Energy, 7% Sr. Unsec. Nts., 5/15/17
        945,000       753,638  
    Energy Future Intermediate Holding Co. LLC, 10% Sr. Sec. Nts., 12/1/20
        682,000       706,738  
    Texas Competitive Electric Holdings Co. LLC:
                   
    10.25% Sr. Unsec. Nts., Series A, 11/1/15
        2,110,000       1,202,700  
    10.25% Sr. Unsec. Nts., Series B, 11/1/15
        290,000       163,850  


                2,826,926  
     
                   
    Energy Traders—3.0%
                   
    Dynegy Holdings, Inc., 8.375% Sr. Unsec. Nts., 5/1/16
        770,000       579,425  
    Energy Future Holdings Corp., 10% Sr. Sec. Nts., 1/15/202
        625,000       646,108  
    Foresight Energy LLC, 9.625% Sr. Unsec. Nts., 8/15/172
        1,295,000       1,385,650  
    GenOn Escrow Corp.:
                   
    9.50% Sr. Unsec. Nts., 10/15/182
        355,000       354,556  
    9.875% Sr. Nts., 10/15/202
        355,000       354,113  
    United Maritime Group LLC, 11.75% Sr. Sec. Nts., 6/15/15
        875,000       881,563  


                4,201,415  
     
                   
    Gas Utilities—0.4%
                   
    Ferrellgas LP/Ferrellgas Finance Corp., 6.50% Sr. Nts., 5/1/212
        570,000       558,600  


    Total Corporate Bonds and Notes
    (Cost $119,574,530)
                121,099,217  
     
                     
        Shares     Value  
     
    Preferred Stocks—2.1%
                   
    Ally Financial, Inc., 7%, Non-Vtg.2
        1,822     $ 1,722,075  
    AmeriKing, Inc., 13% Cum. Sr. Exchangeable, Non-Vtg.4,5
        13,764        
    Eagle-Picher Holdings, Inc., 11.75% Cum. Exchangeable, Series B, Non-Vtg.4
        8,000        
    Greektown Holdings LLC, Preferred4
        11,550       1,226,957  
    ICG Holdings, Inc., 14.25% Exchangeable, Non-Vtg.4,5
        342        


    Total Preferred Stocks (Cost $3,770,026)
                2,949,032  
     
                   
    Common Stocks—4.1%
                   
    AbitibiBowater, Inc.4
        25,726       608,934  
    American Media Operations, Inc.4
        58,065       946,791  
    American Media, Inc.1,4
        9,424       1  
    Charter Communications, Inc., Cl. A4
        26,844       1,045,305  
    Global Aviation Holdings, Inc.4
        300       3,000  
    Greektown Superholdings, Inc.4
        874       86,369  
    Kaiser Aluminum Corp.
        458       22,941  
    Orbcomm, Inc.4
        1,127       2,919  
    Smurfit-Stone Container Corp.4
        67,428       1,726,157  
    Visteon Corp.4
        18,823       1,270,967  


    Total Common Stocks (Cost $6,607,940)
                5,713,384  
                     
        Units          
     
    Rights, Warrants and Certificates—0.1%
                   
    ASG Warrant Corp. Wts., Strike Price $0.01, Exp. 5/15/181,4
        1,030       128,750  
    Global Aero Logistics, Inc. Wts., Strike Price $10, Exp. 2/28/114
        570       6  
    MediaNews Group, Inc. Wts., Strike Price $0.001, Exp. 3/19/17
        11,017       397  


    Total Rights, Warrants and Certificates
    (Cost $53,389)
                129,153  
                     
        Principal        
        Amount     Value  
     
    Loan Participations—1.9%
                   
    Entegra Holdings LLC, Sr. Sec. Credit Facilities 3rd Lien Term Loan:
                   
    Tranche B, 10/19/155,8,9
      $ 853,848     $ 508,467  
    Tranche B, 3.745%, 10/19/155,7
        459,727       273,767  
    Tranche B, 3.745%, 10/19/155,7,8
        1,054,641       628,039  
    Nuveen Investments, Inc., Sr. Sec. Credit Facilities 2nd Lien Term Loan, 12.50%, 7/20/158
        1,116,875       1,211,111  
    Polymer Group, Inc., Sr. Sec. Credit Facilities 1st Lien Term Loan, 0.75%, 10/4/117
        760,000        


    Total Loan Participations
    (Cost $2,405,869)
                2,621,384  
                     
        Shares          
     
    Investment Companies—3.0%
                   
    JPMorgan U.S. Treasury Plus Money Market Fund, Agency Shares, 0.00%10,11
        91,595       91,595  
    Oppenheimer Institutional Money Market Fund, Cl. E, 0.21%10,12
        4,033,152       4,033,152  
             
     
    Total Investment Companies
    (Cost $4,124,747)
                4,124,747  
     
                   
    Total Investments, at Value
    (Cost $136,536,501)
        98.4 %     136,636,917  
    Other Assets Net of Liabilities
        1.6       2,246,095  
         
    Net Assets
        100.0 %   $ 138,883,012  
         
    Footnotes to Statement of Investments
    1.   Restricted security. The aggregate value of restricted securities as of December 31, 2010 was $3,286,771, which represents 2.37% of the Fund’s net assets. See Note 6 of the accompanying Notes. Information concerning restricted securities is as follows:
                                 
                            Unrealized  
        Acquisition                   Appreciation  
    Security   Date   Cost     Value     (Depreciation)  
     
    American Media, Inc.
      2/2/09   $ 208,776     $ 1     $ (208,775 )
    ASG Warrant Corp. Wts., Strike Price $0.01, Exp. 5/15/18
      4/28/10-8/19/10     49,050       128,750       79,700  
    Ashtead Capital, Inc., 9% Nts., 8/15/16
      12/18/09-1/25/10     221,070       230,450       9,380  
    Interactive Data Corp., 10.25% Sr. Nts., 8/1/18
      7/20/10     230,000       251,850       21,850  
    Real Time Data Co., 11% Nts., 5/31/09
      6/30/99-5/31/01     365,810             (365,810 )
    Southern States Cooperative, Inc., 11.25% Sr. Nts., 5/15/15
      4/28/10-9/23/10     599,122       633,675       34,553  
    Tower Automotive Holdings USA LLC/TA Holdings Finance, Inc., 10.625% Sr. Sec. Nts., 9/1/17
      8/13/10-12/31/10     1,363,564       1,500,120       136,556  
    Wallace Theater Holdings, Inc., 12.50% Sr. Sec. Nts., 6/15/13
      9/30/10-10/6/10     538,963       541,925       2,962  
             
     
          $ 3,576,355     $ 3,286,771     $ (289,584 )
             

    2.   Represents securities sold under Rule 144A, which are exempt from registration under the Securities Act of 1933, as amended. These securities have been determined to be liquid under guidelines established by the Board of Trustees. These securities amount to $61,282,528 or 44.13% of the Fund’s net assets as of December 31, 2010.
     
    3.   Issue is in default. See Note 1 of the accompanying Notes.
     
    4.   Non-income producing security.
     
    5.   Interest or dividend is paid-in-kind, when applicable.
     
    6.   This bond has no contractual maturity date, is not redeemable and contractually pays an indefinite stream of interest. Rate reported represents the current interest rate for this variable rate security.
     
    7.   Represents the current interest rate for a variable or increasing rate security.
     
    8.   When-issued security or delayed delivery to be delivered and settled after December 31, 2010. See Note 1 of the accompanying Notes.
     
    9.   This Senior Loan will settle after December 31, 2010, at which time the interest rate will be determined.
     
    10.   Rate shown is the 7-day yield as of December 31, 2010.
     
    11.   Interest rate is less than 0.0005%.
     
    12.   Is or was an affiliate, as defined in the Investment Company Act of 1940, at or during the period ended December 31, 2010, by virtue of the Fund owning at least 5% of the voting securities of the issuer or as a result of the Fund and the issuer having the same investment adviser. Transactions during the period in which the issuer was an affiliate are as follows:
                                     
        Shares     Gross     Gross     Shares  
        December 31, 2009     Additions     Reductions     December 31, 2010  
     
    Oppenheimer Institutional Money Market Fund, Cl. E
        2,092,310       101,210,463       99,269,621       4,033,152  
                     
        Value     Income  
     
    Oppenheimer Institutional Money Market Fund, Cl. E
      $ 4,033,152     $ 14,983  
    Valuation Inputs
    Various data inputs are used in determining the value of each of the Fund’s investments as of the reporting period end. These data inputs are categorized in the following hierarchy under applicable financial accounting standards:
      1)   Level 1—unadjusted quoted prices in active markets for identical assets or liabilities (including securities actively traded on a securities exchange)
     
      2)   Level 2—inputs other than unadjusted quoted prices that are observable for the asset or liability (such as unadjusted quoted prices for similar assets and market corroborated inputs such as interest rates, prepayment speeds, credit risks, etc.)
     
      3)   Level 3—significant unobservable inputs (including the Manager’s own judgments about assumptions that market participants would use in pricing the asset or liability).
    The table below categorizes amounts that are included in the Fund’s Statement of Assets and Liabilities as of December 31, 2010 based on valuation input level:
                                           
                        Level 3—        
        Level 1—     Level 2—     Significant        
        Unadjusted     Other Significant     Unobservable        
        Quoted Prices     Observable Inputs     Inputs     Value  
     
    Assets Table
                                   
    Investments, at Value:
                                   
    Corporate Bonds and Notes
      $     $ 121,012,135     $ 87,082     $ 121,099,217  
    Preferred Stocks
              1,722,075       1,226,957       2,949,032  
    Common Stocks
                                   
    Consumer Discretionary
        1,045,305       1,270,967       1,033,161       3,349,433  
    Industrials
                    3,000       3,000  
    Information Technology
        2,919                   2,919  
    Materials
        2,358,032                   2,358,032  
    Rights, Warrants and Certificates
              128,750       403       129,153  
    Loan Participations
              2,621,384             2,621,384  
    Investment Companies
        4,124,747                   4,124,747  
         
    Total Assets
      $ 7,531,003     $ 126,755,311     $ 2,350,603     $ 136,636,917  
         
    Currency contracts and forwards, if any, are reported at their unrealized appreciation/depreciation at measurement date, which represents the change in the contract’s value from trade date. Futures, if any, are reported at their variation margin at measurement date, which represents the amount due to/from the Fund at that date. All additional assets and liabilities included in the above table are reported at their market value at measurement date.
    The following is a reconciliation of assets in which significant unobservable inputs (level 3) were used in determining fair value:
                                                             
                        Change in     Accretion/                      
                        unrealized     (amortization)             Transfers in        
        Value as of     Realized     appreciation/     of premium/     Net purchases     and/or out of     Value as of  
        December 31, 2009     gain     depreciation     discount1     (sales)     Level 3     December 31, 2010  
     
    Assets Table
                                                           
    Investments, at Value:
                                                           
    Corporate Bonds and Notes
      $     $     $ 1,657     $ 2     $ 85,413     $ 10     $ 87,082  
    Preferred Stocks
                    71,957             1,155,000             1,226,957  
    Common Stocks
                                                           
    Consumer Discretionary
                    (1,699,466 )           2,732,533       94       1,033,161  
    Industrials
        4,647       1,647       (1,647 )             (1,647 )           3,000  
    Rights, Warrants and Certificates
        6                                 397       403  
         
    Total Assets
      $ 4,653     $ 1,647     $ (1,627,499 )   $ 2     $ 3,971,299     $ 501     $ 2,350,603  
         
    1.   Included in net investment income.
    See the accompanying Notes for further discussion of the methods used in determining value of the Fund’s investments, and a summary of changes to the valuation methodologies, if any, during the reporting period.


    STATEMENT OF ASSETS AND LIABILITIES December 31, 2010
             
    Assets
           
    Investments, at value—see accompanying statement of investments:
           
    Unaffiliated companies (cost $132,503,349)
      $ 132,603,765  
    Affiliated companies (cost $4,033,152)
        4,033,152  


        136,636,917  
     
           
    Receivables and other assets:
           
    Interest, dividends and principal paydowns
        2,816,907  
    Investments sold (including $84,766 sold on a when-issued or delayed delivery basis)
        322,890  
    Shares of beneficial interest sold
        2,394  
    Other
        13,549  
     
         
    Total assets
        139,792,657  
     
           
    Liabilities
           
    Payables and other liabilities:
           
    Investments purchased (including $504,501 purchased on a when-issued or delayed delivery basis)
        673,444  
    Shares of beneficial interest redeemed
        61,684  
    Shareholder communications
        57,067  
    Distribution and service plan fees
        45,053  
    Legal, auditing and other professional fees
        33,382  
    Trustees’ compensation
        11,822  
    Transfer and shareholder servicing agent fees
        11,652  
    Other
        15,541  
     
         
    Total liabilities
        909,645  
     
           
    Net Assets
      $ 138,883,012  


    Composition of Net Assets
           
    Par value of shares of beneficial interest
      $ 65,125  
    Additional paid-in capital
        356,247,273  
    Accumulated net investment income
        11,799,334  
    Accumulated net realized loss on investments
        (229,329,136 )
    Net unrealized appreciation on investments
        100,416  
     
         
    Net Assets
      $ 138,883,012  


    Net Asset Value Per Share
           
    Non-Service Shares:
           
    Net asset value, redemption price per share and offering price per share (based on net assets of $61,563,410 and 28,967,138 shares of beneficial interest outstanding)
      $ 2.13  
    Service Shares:
           
    Net asset value, redemption price per share and offering price per share (based on net assets of $63,712,946 and 29,839,916 shares of beneficial interest outstanding)
      $ 2.14  
    Class 3 Shares:
           
    Net asset value, redemption price per share and offering price per share (based on net assets of $6,033,911 and 2,816,850 shares of beneficial interest outstanding)
      $ 2.14  
    Class 4 Shares:
           
    Net asset value, redemption price per share and offering price per share (based on net assets of $7,572,745 and 3,501,523 shares of beneficial interest outstanding)
      $ 2.16  


    STATEMENT OF OPERATIONS For the Year Ended December 31, 2010
             
    Investment Income
           
    Interest
      $ 13,110,036  
    Dividends:
           
    Unaffiliated companies
        38,472  
    Affiliated companies
        14,983  
     
         
    Total investment income
        13,163,491  
     
           
    Expenses
           
    Management fees
        1,018,717  
    Distribution and service plan fees:
           
    Service shares
        159,158  
    Class 4 shares
        18,190  
    Transfer and shareholder servicing agent fees:
           
    Non-Service shares
        59,600  
    Service shares
        63,670  
    Class 3 shares
        5,280  
    Class 4 shares
        7,278  
    Shareholder communications:
           
    Non-Service shares
        35,306  
    Service shares
        37,424  
    Class 3 shares
        3,268  
    Class 4 shares
        4,292  
    Custodian fees and expenses
        15,607  
    Trustees’ compensation
        10,286  
    Administration service fees
        1,500  
    Other
        72,842  
     
         
    Total expenses
        1,512,418  
    Less waivers and reimbursements of expenses
        (405,850 )
     
         
    Net expenses
        1,106,568  
     
           
    Net Investment Income
        12,056,923  
     
           
    Realized and Unrealized Gain (Loss)
           
    Net realized gain (loss) on:
           
    Investment from unaffiliated companies
        7,123,512  
    Swap contracts
        (845,604 )
    Increase from payment by affiliate
        429  
     
         
    Net realized gain
        6,278,337  
    Net change in unrealized appreciation/depreciation on:
           
    Investments
        (1,066,033 )
    Swap contracts
        816,702  
     
         
    Net change in unrealized appreciation/depreciation
        (249,331 )
     
           
    Net Increase in Net Assets Resulting from Operations
      $ 18,085,929  


    STATEMENTS OF CHANGES IN NET ASSETS
                     
    Year Ended December 31,   2010     2009  
     
    Operations
                   
    Net investment income
      $ 12,056,923     $ 13,178,458  
    Net realized gain (loss)
        6,278,337       (120,834,824 )
    Net change in unrealized appreciation/depreciation
        (249,331 )     134,090,272  
         
    Net increase in net assets resulting from operations
        18,085,929       26,433,906  
     
                   
    Dividends and/or Distributions to Shareholders
                   
    Dividends from net investment income:
                   
    Non-Service shares
        (3,674,586 )      
    Service shares
        (3,877,767 )      
    Class 3 shares
        (304,126 )      
    Class 4 shares
        (385,856 )      
         
     
        (8,242,335 )      
     
                   
    Beneficial Interest Transactions
                   
    Net increase (decrease) in net assets resulting from beneficial interest transactions:
                   
    Non-Service shares
        (10,126,348 )     (54,571,861 )
    Service shares
        (5,260,981 )     7,675,335  
    Class 3 shares
        929,124       2,128,095  
    Class 4 shares
        (118,291 )     1,786,116  
         
     
        (14,576,496 )     (42,982,315 )
     
                   
    Net Assets
                   
    Total decrease
        (4,732,902 )     (16,548,409 )
    Beginning of period
        143,615,914       160,164,323  
         
    End of period (including accumulated net investment income of $11,799,334 and $10,001,371, respectively)
      $ 138,883,012     $ 143,615,914  


    FINANCIAL HIGHLIGHTS
                                             
    Non-Service Shares    Year Ended December 31,   2010     2009     2008     2007     2006  
     
    Per Share Operating Data
                                           
    Net asset value, beginning of period
      $ 1.98     $ 1.58     $ 7.95     $ 8.55     $ 8.44  
     
    Income (loss) from investment operations:
                                           
    Net investment income1
        .18       .17       .54       .57       .58  
    Net realized and unrealized gain (loss)
        .10       .23       (6.44 )     (.56 )     .17  
         
    Total from investment operations
        .28       .40       (5.90 )     .01       .75  
     
    Dividends and/or distributions to shareholders:
                                           
    Dividends from net investment income
        (.13 )           (.47 )     (.61 )     (.64 )
     
    Net asset value, end of period
      $ 2.13     $ 1.98     $ 1.58     $ 7.95     $ 8.55  


    Total Return, at Net Asset Value2
        14.81 %     25.32 %     (78.67 )%     (0.10 )%     9.42 %
     
                                           
    Ratios/Supplemental Data
                                           
    Net assets, end of period (in thousands)
      $ 61,563     $ 67,385     $ 111,040     $ 294,819     $ 361,445  
     
    Average net assets (in thousands)
      $ 59,598     $ 71,782     $ 211,186     $ 335,702     $ 365,154  
     
    Ratios to average net assets:3
                                           
    Net investment income
        9.01 %     9.78 %     9.30 %     6.96 %     7.05 %
    Total expenses4
        0.98 %     0.94 %     0.80 %     0.75 %     0.74 %
    Expenses after payments, waivers and/or reimbursements and reduction to custodian expenses
        0.69 %     0.57 %     0.78 %     0.74 %     0.74 %
     
    Portfolio turnover rate
        132 %     128 %     53 %5     67 %5     57 %
    1.   Per share amounts calculated based on the average shares outstanding during the period.
     
    2.   Assumes an initial investment on the business day before the first day of the fiscal period, with all dividends and distributions reinvested in additional shares on the reinvestment date, and redemption at the net asset value calculated on the last business day of the fiscal period. Total returns are not annualized for periods less than one full year. Total return information does not reflect expenses that apply at the separate account level or to related insurance products. Inclusion of these charges would reduce the total return figures for all periods shown. Returns do not reflect the deduction of taxes that a shareholder would pay on fund distributions or the redemption of fund shares.
     
    3.   Annualized for periods less than one full year.
     
    4.   Total expenses including indirect expenses from affiliated fund were as follows:
             
    Year Ended December 31, 2010
        0.98 %
    Year Ended December 31, 2009
        0.96 %
    Year Ended December 31, 2008
        0.80 %
    Year Ended December 31, 2007
        0.76 %
    Year Ended December 31, 2006
        0.74 %
    5.   The portfolio turnover rate excludes purchase and sale transactions of To Be Announced (TBA) mortgage-related securities as follows:
                     
        Purchase Transactions     Sale Transactions  
     
    Year Ended December 31, 2008
      $ 40,240,084     $ 41,196,921  
    Year Ended December 31, 2007
      $ 30,798,147     $ 24,096,458  


    Service Shares    Year Ended December 31,   2010     2009     2008     2007     2006  
     
    Per Share Operating Data
                                           
    Net asset value, beginning of period
      $ 1.99     $ 1.58     $ 7.89     $ 8.50     $ 8.39  
     
    Income (loss) from investment operations:
                                           
    Net investment income1
        .17       .16       .54       .55       .56  
    Net realized and unrealized gain (loss)
        .10       .25       (6.40 )     (.57 )     .17  
         
    Total from investment operations
        .27       .41       (5.86 )     (.02 )     .73  
     
    Dividends and/or distributions to shareholders:
                                           
    Dividends from net investment income
        (.12 )           (.45 )     (.59 )     (.62 )
     
    Net asset value, end of period
      $ 2.14     $ 1.99     $ 1.58     $ 7.89     $ 8.50  


    Total Return, at Net Asset Value2
        14.44 %     25.95 %     (78.57 )%     (0.47 )%     9.23 %
     
                                           
    Ratios/Supplemental Data
                                           
    Net assets, end of period (in thousands)
      $ 63,713     $ 64,440     $ 43,375     $ 157,333     $ 173,299  
     
    Average net assets (in thousands)
      $ 63,661     $ 54,202     $ 116,236     $ 169,569     $ 160,703  
     
    Ratios to average net assets:3
                                           
    Net investment income
        8.76 %     9.60 %     9.13 %     6.71 %     6.80 %
    Total expenses4
        1.23 %     1.21 %     1.05 %     1.01 %     1.00 %
    Expenses after payments, waivers and/or reimbursements and reduction to custodian expenses
        0.94 %     0.80 %     1.03 %     1.00 %     1.00 %
     
    Portfolio turnover rate
        132 %     128 %     53 %5     67 %5     57 %
    1.   Per share amounts calculated based on the average shares outstanding during the period.
     
    2.   Assumes an initial investment on the business day before the first day of the fiscal period, with all dividends and distributions reinvested in additional shares on the reinvestment date, and redemption at the net asset value calculated on the last business day of the fiscal period. Total returns are not annualized for periods less than one full year. Total return information does not reflect expenses that apply at the separate account level or to related insurance products. Inclusion of these charges would reduce the total return figures for all periods shown. Returns do not reflect the deduction of taxes that a shareholder would pay on fund distributions or the redemption of fund shares.
     
    3.   Annualized for periods less than one full year.
     
    4.   Total expenses including indirect expenses from affiliated fund were as follows:
             
    Year Ended December 31, 2010
        1.23 %
    Year Ended December 31, 2009
        1.23 %
    Year Ended December 31, 2008
        1.05 %
    Year Ended December 31, 2007
        1.02 %
    Year Ended December 31, 2006
        1.00 %
    5.   The portfolio turnover rate excludes purchase and sale transactions of To Be Announced (TBA) mortgage-related securities as follows:
                     
        Purchase Transactions     Sale Transactions  
     
    Year Ended December 31, 2008
      $ 40,240,084     $ 41,196,921  
    Year Ended December 31, 2007
      $ 30,798,147     $ 24,096,458  
     
                                     
    Class 3 Shares    Year Ended December 31,   2010     2009     2008     20071  
     
    Per Share Operating Data
                                   
    Net asset value, beginning of period
      $ 1.99     $ 1.57     $ 7.98     $ 8.26  
     
    Income (loss) from investment operations:
                                   
    Net investment income2
        .18       .17       .56       .37  
    Net realized and unrealized gain (loss)
        .10       .25       (6.50 )     (.65 )
         
    Total from investment operations
        .28       .42       (5.94 )     (.28 )
     
    Dividends and/or distributions to shareholders:
                                   
    Dividends from net investment income
        (.13 )           (.47 )      
     
    Net asset value, end of period
      $ 2.14     $ 1.99     $ 1.57     $ 7.98  


    Total Return, at Net Asset Value3
        14.69 %     26.75 %     (78.89 )%     (3.39 )%
     
                                   
    Ratios/Supplemental Data
                                   
    Net assets, end of period (in thousands)
      $ 6,034     $ 4,684     $ 1,582     $ 4,921  
     
    Average net assets (in thousands)
      $ 5,279     $ 3,568     $ 5,292     $ 3,750  
     
    Ratios to average net assets:4
                                   
    Net investment income
        8.97 %     9.86 %     9.29 %     6.90 %
    Total expenses5
        0.99 %     0.97 %     0.80 %     0.76 %
    Expenses after payments, waivers and/or reimbursements and reduction to custodian expenses
        0.69 %     0.53 %     0.78 %     0.75 %
     
    Portfolio turnover rate
        132 %     128 %     53 %6     67 %6
    1.   For the period from May 1, 2007 (inception of offering) to December 31, 2007.
     
    2.   Per share amounts calculated based on the average shares outstanding during the period.
     
    3.   Assumes an initial investment on the business day before the first day of the fiscal period, with all dividends and distributions reinvested in additional shares on the reinvestment date, and redemption at the net asset value calculated on the last business day of the fiscal period. Total returns are not annualized for periods less than one full year. Total return information does not reflect expenses that apply at the separate account level or to related insurance products. Inclusion of these charges would reduce the total return figures for all periods shown. Returns do not reflect the deduction of taxes that a shareholder would pay on fund distributions or the redemption of fund shares.
     
    4.   Annualized for periods less than one full year.
     
    5.   Total expenses including indirect expenses from affiliated fund were as follows:
             
    Year Ended December 31, 2010
        0.99 %
    Year Ended December 31, 2009
        0.99 %
    Year Ended December 31, 2008
        0.80 %
    Period Ended December 31, 2007
        0.77 %
    6.   The portfolio turnover rate excludes purchase and sale transactions of To Be Announced (TBA) mortgage-related securities as follows:
                     
        Purchase Transactions     Sale Transactions  
     
    Year Ended December 31, 2008
      $ 40,240,084     $ 41,196,921  
    Period Ended December 31, 2007
      $ 30,798,147     $ 24,096,458  

                                     
    Class 4 Shares    Year Ended December 31,   2010     2009     2008     20071  
     
    Per Share Operating Data
                                   
    Net asset value, beginning of period
      $ 2.01     $ 1.59     $ 7.97     $ 8.26  
     
    Income (loss) from investment operations:
                                   
    Net investment income2
        .18       .16       .54       .36  
    Net realized and unrealized gain (loss)
        .09       .26       (6.46 )     (.65 )
         
    Total from investment operations
        .27       .42       (5.92 )     (.29 )
     
    Dividends and/or distributions to shareholders:
                                   
    Dividends from net investment income
        (.12 )           (.46 )      
     
    Net asset value, end of period
      $ 2.16     $ 2.01     $ 1.59     $ 7.97  


    Total Return, at Net Asset Value3
        14.27 %     26.42 %     (78.63 )%     (3.51 )%
     
                                   
    Ratios/Supplemental Data
                                   
    Net assets, end of period (in thousands)
      $ 7,573     $ 7,107     $ 4,167     $ 9,476  
     
    Average net assets (in thousands)
      $ 7,278     $ 6,285     $ 10,658     $ 7,201  
     
    Ratios to average net assets:4
                                   
    Net investment income
        8.74 %     9.62 %     9.00 %     6.61 %
    Total expenses5
        1.23 %     1.19 %     1.07 %     1.05 %
    Expenses after payments, waivers and/or reimbursements and reduction to custodian expenses
        0.94 %     0.80 %     1.05 %     1.04 %
     
    Portfolio turnover rate
        132 %     128 %     53 %6     67 %6
    1.   For the period from May 1, 2007 (inception of offering) to December 31, 2007.
     
    2.   Per share amounts calculated based on the average shares outstanding during the period.
     
    3.   Assumes an initial investment on the business day before the first day of the fiscal period, with all dividends and distributions reinvested in additional shares on the reinvestment date, and redemption at the net asset value calculated on the last business day of the fiscal period. Total returns are not annualized for periods less than one full year. Total return information does not reflect expenses that apply at the separate account level or to related insurance products. Inclusion of these charges would reduce the total return figures for all periods shown. Returns do not reflect the deduction of taxes that a shareholder would pay on fund distributions or the redemption of fund shares.
     
    4.   Annualized for periods less than one full year.
     
    5.   Total expenses including indirect expenses from affiliated fund were as follows:
             
    Year Ended December 31, 2010
        1.23 %
    Year Ended December 31, 2009
        1.21 %
    Year Ended December 31, 2008
        1.07 %
    Period Ended December 31, 2007
        1.06 %
    6.   The portfolio turnover rate excludes purchase and sale transactions of To Be Announced (TBA) mortgage-related securities as follows:
                     
        Purchase Transactions     Sale Transactions  
     
    Year Ended December 31, 2008
      $ 40,240,084     $ 41,196,921  
    Period Ended December 31, 2007
      $ 30,798,147     $ 24,096,458  


    NOTES TO FINANCIAL STATEMENTS
    1. Significant Accounting Policies
    Oppenheimer High Income Fund/VA (the “Fund”) is a separate series of Oppenheimer Variable Account Funds, an open-end management investment company registered under the Investment Company Act of 1940, as amended. The Fund’s investment objective is to seek a high level of current income from investment in high-yield, fixed-income securities. The Fund’s investment adviser is OppenheimerFunds, Inc. (the “Manager”).
         The Fund offers Non-Service, Service, Class 3 and Class 4 shares. All classes are sold at their offering price, which is the net asset value per share, to separate investment accounts of participating insurance companies as an underlying investment for variable life insurance policies, variable annuity contracts or other investment products. The class of shares being designated as Service shares and Class 4 shares are subject to a distribution and service plan. All classes of shares have identical rights and voting privileges with respect to the Fund in general and exclusive voting rights on matters that affect that class alone. Earnings, net assets and net asset value per share may differ due to each class having its own expenses, such as transfer and shareholder servicing agent fees and shareholder communications, directly attributable to that class. The Fund assesses a 1% fee on the proceeds of Class 3 and Class 4 shares that are redeemed (either by selling or exchanging to another Oppenheimer fund or other investment option offered through your variable life insurance or variable annuity contract) within 60 days of their purchase. The fee, which is retained by the Fund, is accounted for as an addition to paid-in capital.
         The following is a summary of significant accounting policies consistently followed by the Fund.
    Securities Valuation. The Fund calculates the net asset value of its shares as of the close of the New York Stock Exchange (the “Exchange”), normally 4:00 P.M. Eastern time, on each day the Exchange is open for trading.
         Each investment asset or liability of the Fund is assigned a level at measurement date based on the significance and source of the inputs to its valuation. Unadjusted quoted prices in active markets for identical securities are classified as “Level 1,” inputs other than unadjusted quoted prices for an asset that are observable are classified as “Level 2” and significant unobservable inputs, including the Manager’s judgment about the assumptions that a market participant would use in pricing an asset or liability, are classified as “Level 3.” The inputs used for valuing securities are not necessarily an indication of the risks associated with investing in those securities. A table summarizing the Fund’s investments under these levels of classification is included following the Statement of Investments.
         Securities are valued using unadjusted quoted market prices, when available, as supplied primarily by portfolio pricing services approved by the Board of Trustees or dealers.
         Securities traded on a registered U.S. securities exchange are valued based on the last sale price of the security reported on the principal exchange on which it is traded, prior to the time when the Fund’s assets are valued. Securities whose principal exchange is NASDAQ® are valued based on the official closing prices reported by NASDAQ prior to the time when the Fund’s assets are valued. In the absence of a sale, the security is valued at the last sale price on the prior trading day, if it is within the spread of the current day’s closing “bid” and “asked” prices, and if not, at the current day’s closing bid price. A foreign security traded on a foreign exchange is valued based on the last sale price on the principal exchange on which the security is traded, as identified by the portfolio pricing service used by the Manager, prior to the time when the Fund’s assets are valued. In the absence of a sale, the security is valued at the most recent official closing price on the principal exchange on which it is traded.
         Shares of a registered investment company that are not traded on an exchange are valued at that investment company’s net asset value per share.
         U.S. domestic and international debt instruments (including corporate, government, municipal, mortgage-backed, collateralized mortgage obligations and asset-backed securities) and “money market-type” debt instruments with a remaining maturity in excess of sixty days are valued at the mean between the “bid” and “asked” prices utilizing price quotations obtained from independent pricing services or broker-dealers. Such prices are typically determined based upon information obtained from market participants including reported trade data, broker-dealer price quotations and inputs such as benchmark yields and issuer spreads from identical or similar securities. 

    “Money market-type” debt instruments with remaining maturities of sixty days or less are valued at cost adjusted by the amortization of discount or premium to maturity (amortized cost), which approximates market value.
         In the absence of a readily available unadjusted quoted market price, including for securities whose values have been materially affected by what the Manager identifies as a significant event occurring before the Fund’s assets are valued but after the close of the securities’ respective exchanges, the Manager, acting through its internal valuation committee, in good faith determines the fair valuation of that asset using consistently applied procedures under the supervision of the Board of Trustees (which reviews those fair valuations by the Manager). Those procedures include certain standardized methodologies to fair value securities. Such methodologies include, but are not limited to, pricing securities initially at cost and subsequently adjusting the value based on: changes in company specific fundamentals, changes in an appropriate securities index, or changes in the value of similar securities which may be adjusted for any discounts related to resale restrictions. When possible, such methodologies use observable market inputs such as unadjusted quoted prices of similar securities, observable interest rates, currency rates and yield curves. The methodologies used for valuing securities are not necessarily an indication of the risks associated with investing in those securities.
         There have been no significant changes to the fair valuation methodologies of the Fund during the period.
    Securities on a When-Issued or Delayed Delivery Basis. The Fund may purchase securities on a “when-issued” basis, and may purchase or sell securities on a “delayed delivery” basis. “When-issued” or “delayed delivery” refers to securities whose terms and indenture are available and for which a market exists, but which are not available for immediate delivery. Delivery and payment for securities that have been purchased by the Fund on a when-issued basis normally takes place within six months and possibly as long as two years or more after the trade date. During this period, such securities do not earn interest, are subject to market fluctuation and may increase or decrease in value prior to their delivery. The purchase of securities on a when-issued basis may increase the volatility of the Fund’s net asset value to the extent the Fund executes such transactions while remaining substantially fully invested. When the Fund engages in when-issued or delayed delivery transactions, it relies on the buyer or seller, as the case may be, to complete the transaction. Their failure to do so may cause the Fund to lose the opportunity to obtain or dispose of the security at a price and yield it considers advantageous. The Fund may also sell securities that it purchased on a when-issued basis or forward commitment prior to settlement of the original purchase.
    As of December 31, 2010, the Fund had purchased securities issued on a when-issued or delayed delivery basis and sold securities issued on a delayed delivery basis as follows:
             
        When-Issued or Delayed  
        Delivery Basis Transactions  
     
    Purchased securities
      $ 504,501  
    Sold securities
        84,766  
    Credit Risk. The Fund invests in high-yield, non-investment-grade bonds, which may be subject to a greater degree of credit risk. Credit risk relates to the ability of the issuer to meet interest or principal payments or both as they become due. The Fund may acquire securities in default, and is not obligated to dispose of securities whose issuers or underlying obligors subsequently default. Information concerning securities in default as of December 31, 2010 is as follows:
             
    Cost
      $ 4,625,679  
    Market Value
      $ 407,006  
    Market Value as a % of Net Assets
        0.29 %
    Investment in Oppenheimer Institutional Money Market Fund. The Fund is permitted to invest daily available cash balances in an affiliated money market fund. The Fund may invest the available cash in Class E shares of Oppenheimer Institutional Money Market Fund (“IMMF”) to seek current income while preserving liquidity. IMMF is a registered open-end management investment company, regulated as a money market fund under the Investment Company Act of 1940, as amended. The Manager is also the investment adviser of IMMF. When applicable, the Fund’s investment in IMMF is included in the Statement of Investments. Shares of IMMF are valued at their net asset value per share. As a shareholder, the Fund is subject to its proportional share of IMMF’s Class E expenses, including its management fee. The Manager will waive fees and/or reimburse Fund expenses in an amount equal to the indirect management fees incurred through the Fund’s investment in IMMF.
    Allocation of Income, Expenses, Gains and Losses. Income, expenses (other than those attributable to a specific class), gains and losses are allocated on a daily basis to each class of shares based upon the relative proportion of net assets represented by such class. Operating expenses directly attributable to a specific class are charged against the operations of that class.
    Federal Taxes. The Fund intends to comply with provisions of the Internal Revenue Code applicable to regulated investment companies and to distribute substantially all of its investment company taxable income, including any net realized gain on investments not offset by capital loss carryforwards, if any, to shareholders. Therefore, no federal income or excise tax provision is required. The Fund files income tax returns in U.S. federal and applicable state jurisdictions. The statute of limitations on the Fund’s tax return filings generally remain open for the three preceding fiscal reporting period ends.
    The tax components of capital shown in the following table represent distribution requirements the Fund must satisfy under the income tax regulations, losses the Fund may be able to offset against income and gains realized in future years and unrealized appreciation or depreciation of securities and other investments for federal income tax purposes.
                             
                        Net Unrealized  
                        Depreciation Based on Cost  
    Undistributed   Undistributed     Accumulated     of Securities and Other  
    Net Investment   Long-Term     Loss     Investments for Federal  
    Income   Gain     Carryforward1,2,3,4     Income Tax Purposes  
     
    $12,095,248
      $     $ 229,091,469     $ 244,167  
    1.   As of December 31, 2010, the Fund had $229,091,469 of net capital loss carryforwards available to offset future realized capital gains, if any, and thereby reduce future taxable gain distributions. As of December 31, 2010, details of the capital loss carryforwards were as follows:
             
    Expiring        
     
    2011
      $ 8,529,303  
    2012
        128,504  
    2016
        48,495,519  
    2017
        171,938,143  
     
         
    Total
      $ 229,091,469  
     
         
    2.   During the fiscal year ended December 31, 2010, the Fund utilized $4,432,223 of capital loss carryforward to offset capital gains realized in that fiscal year.
     
    3.   During the fiscal year ended December 31, 2009, the Fund did not utilize any capital loss carryforward.
     
    4.   During the fiscal year ended December 31, 2010, $51,629,168 of unused capital loss carryforward expired.
    Net investment income (loss) and net realized gain (loss) may differ for financial statement and tax purposes. The character of dividends and distributions made during the fiscal year from net investment income or net realized gains may differ from their ultimate characterization for federal income tax purposes. Also, due to timing of dividends and distributions, the fiscal year in which amounts are distributed may differ from the fiscal year in which the income or net realized gain was recorded by the Fund.
    Accordingly, the following amounts have been reclassified for December 31, 2010. Net assets of the Fund were unaffected by the reclassifications.
                     
                Reduction  
        Reduction     to Accumulated  
    Reduction   to Accumulated Net     Net Realized  
    to Paid-in Capital   Investment Income     Loss on Investments  
     
    $51,628,739
      $ 2,016,625     $ 53,645,364  


    The tax character of distributions paid during the years ended December 31, 2010 and December 31, 2009 was as follows:
                     
        Year Ended     Year Ended  
        December 31, 2010     December 31, 2009  
     
    Distributions paid from:
                   
    Ordinary income
      $ 8,242,335     $  
    The aggregate cost of securities and other investments and the composition of unrealized appreciation and depreciation of securities and other investments for federal income tax purposes as of December 31, 2010 are noted in the following table. The primary difference between book and tax appreciation or depreciation of securities and other investments, if applicable, is attributable to the tax deferral of losses or tax realization of financial statement unrealized gain or loss.
             
    Federal tax cost of securities
      $ 136,854,827  
    Federal tax cost of other investments
        26,257  
     
         
    Total federal tax cost
      $ 136,881,084  


    Gross unrealized appreciation
      $ 11,479,090  
    Gross unrealized depreciation
        (11,723,257 )
     
         
    Net unrealized depreciation
      $ (244,167 )
     
         
    Trustees’ Compensation. The Board of Trustees has adopted a compensation deferral plan for independent trustees that enables trustees to elect to defer receipt of all or a portion of the annual compensation they are entitled to receive from the Fund. For purposes of determining the amount owed to the Trustee under the plan, deferred amounts are treated as though equal dollar amounts had been invested in shares of the Fund or in other Oppenheimer funds selected by the Trustee. The Fund purchases shares of the funds selected for deferral by the Trustee in amounts equal to his or her deemed investment, resulting in a Fund asset equal to the deferred compensation liability. Such assets are included as a component of “Other” within the asset section of the Statement of Assets and Liabilities. Deferral of trustees’ fees under the plan will not affect the net assets of the Fund, and will not materially affect the Fund’s assets, liabilities or net investment income per share. Amounts will be deferred until distributed in accordance with the compensation deferral plan.
    Dividends and Distributions to Shareholders. Dividends and distributions to shareholders, which are determined in accordance with income tax regulations and may differ from U.S. generally accepted accounting principles, are recorded on the ex-dividend date. Income and capital gain distributions, if any, are declared and paid annually or at other times as deemed necessary by the Manager.
    Investment Income. Dividend income is recorded on the ex-dividend date or upon ex-dividend notification in the case of certain foreign dividends where the ex-dividend date may have passed. Non-cash dividends included in dividend income, if any, are recorded at the fair market value of the securities received. Interest income is recognized on an accrual basis. Discount and premium, which are included in interest income on the Statement of Operations, are amortized or accreted daily.
    Custodian Fees. “Custodian fees and expenses” in the Statement of Operations may include interest expense incurred by the Fund on any cash overdrafts of its custodian account during the period. Such cash overdrafts may result from the effects of failed trades in portfolio securities and from cash outflows resulting from unanticipated shareholder redemption activity. The Fund pays interest to its custodian on such cash overdrafts, to the extent they are not offset by positive cash balances maintained by the Fund, at a rate equal to the Federal Funds Rate plus 0.50%. The “Reduction to custodian expenses” line item, if applicable, represents earnings on cash balances maintained by the Fund during the period. Such interest expense and other custodian fees may be paid with these earnings.
    Security Transactions. Security transactions are recorded on the trade date. Realized gains and losses on securities sold are determined on the basis of identified cost.
    Indemnifications. The Fund’s organizational documents provide current and former trustees and officers with a limited indemnification against liabilities arising in connection with the performance of their duties to the Fund. In the normal course of business, the Fund may also enter into contracts that provide general indemnifications. The Fund’s maximum exposure under these arrangements is unknown as this would be dependent on future claims that may be made against the Fund. The risk of material loss from such claims is considered remote.
    Other. The preparation of financial statements in conformity with accounting principles generally accepted in the United States of America requires management to make estimates and assumptions that affect the reported amounts of assets and liabilities and disclosure of contingent assets and liabilities at the date of the financial statements and the reported amounts of increases and decreases in net assets from operations during the reporting period. Actual results could differ from those estimates.
    2. Shares of Beneficial Interest
    The Fund has authorized an unlimited number of $0.001 par value shares of beneficial interest of each class. Transactions in shares of beneficial interest were as follows:
                                     
        Year Ended December 31, 2010     Year Ended December 31, 2009  
        Shares     Amount     Shares     Amount  
     
    Non-Service Shares
                                   
    Sold
        11,152,476     $ 21,983,381       20,776,611     $ 33,067,312  
    Dividends and/or distributions reinvested
        1,954,567       3,674,586              
    Redeemed
        (18,147,101 )     (35,784,315 )     (56,972,656 )     (87,639,173 )
         
    Net decrease
        (5,040,058 )   $ (10,126,348 )     (36,196,045 )   $ (54,571,861 )


    Service Shares
                                   
    Sold
        2,939,505     $ 5,849,488       10,597,049     $ 17,230,535  
    Dividends and/or distributions reinvested
        2,040,930       3,877,767              
    Redeemed
        (7,528,455 )     (14,988,236 )     (5,702,302 )     (9,555,200 )
         
    Net increase (decrease)
        (2,548,020 )   $ (5,260,981 )     4,894,747     $ 7,675,335  


    Class 3 Shares
                                   
    Sold
        2,054,702     $ 4,093,320       2,785,296     $ 4,527,494  
    Dividends and/or distributions reinvested
        160,066       304,126              
    Redeemed
        (1,747,107 )     (3,468,322 )1     (1,445,037 )     (2,399,399 )2
         
    Net increase
        467,661     $ 929,124       1,340,259     $ 2,128,095  


    Class 4 Shares
                                   
    Sold
        1,725,510     $ 3,440,558       3,615,090     $ 5,889,866  
    Dividends and/or distributions reinvested
        200,967       385,856              
    Redeemed
        (1,958,189 )     (3,944,705 )1     (2,698,668 )     (4,103,750 )2
         
    Net increase (decrease)
        (31,712 )   $ (118,291 )     916,422     $ 1,786,116  
         
    1.   Net of redemption fees of $3,684 and $7,734 for Class 3 and Class 4 shares, respectively.
     
    2.   Net of redemption fees of $3,548 and $4,585 for Class 3 and Class 4 shares, respectively.
    3. Purchases and Sales of Securities
    The aggregate cost of purchases and proceeds from sales of securities, other than short-term obligations and investments in IMMF, for the year ended December 31, 2010, were as follows:
                     
        Purchases     Sales  
     
    Investment securities
      $ 145,915,009     $ 141,635,036  


    4. Fees and Other Transactions with Affiliates
    Management Fees. Under the investment advisory agreement, the Fund pays the Manager a management fee based on the daily net assets of the Fund at an annual rate as shown in the following table:
             
    Fee Schedule        
     
    Up to $200 million
        0.75 %
    Next $200 million
        0.72  
    Next $200 million
        0.69  
    Next $200 million
        0.66  
    Next $200 million
        0.60  
    Over $1 billion
        0.50  
    Administration Service Fees. The Fund pays the Manager a fee of $1,500 per year for preparing and filing the Fund’s tax returns.
    Transfer Agent Fees. OppenheimerFunds Services (“OFS”), a division of the Manager, acts as the transfer and shareholder servicing agent for the Fund. The Fund pays OFS fees at an annual rate of 0.10% of the daily net assets of each class of shares. For the year ended December 31, 2010, the Fund paid $136,311 to OFS for services to the Fund.
    Distribution and Service Plan for Service Shares and Class 4 Shares. The Fund has adopted a Distribution and Service Plan (the “Plan”) in accordance with Rule 12b-1 under the Investment Company Act of 1940 for Service shares and Class 4 shares to pay OppenheimerFunds Distributor, Inc. (the “Distributor”), for distribution related services, personal service and account maintenance for the Fund’s Service shares and Class 4 shares. Under the Plan, payments are made periodically at an annual rate of 0.25% of the daily net assets of Service shares and Class 4 shares of the Fund. The Distributor currently uses all of those fees to compensate sponsors of the insurance product that offers Fund shares, for providing personal service and maintenance of accounts of their variable contract owners that hold Service shares and Class 4 shares. These fees are paid out of the Fund’s assets on an on-going basis and increase operating expenses of the Service shares and Class 4 shares, which results in lower performance compared to the Fund’s shares that are not subject to a service fee. Fees incurred by the Fund under the Plan are detailed in the Statement of Operations.
    Waivers and Reimbursements of Expenses. From April 1, 2009 through March 31, 2010, the Manager voluntarily waived its advisory fee by 0.26% of the Fund’s average annual net assets. This voluntary waiver was applied after all other waivers and/or reimbursements. During the year ended December 31, 2010, the Manager waived $87,865.
         The Manager has voluntarily agreed to limit the Fund’s total annual operating expenses so that those expenses, as percentages of daily net assets, will not exceed the annual rate of 0.75% for Non-Service and Class 3 shares and 1.00% for Service and Class 4 shares. During the year ended December 31, 2010, the Manager waived fees and/or reimbursed the Fund $136,885, $145,405, $12,356 and $16,771 for Non-Service, Service, Class 3 and Class 4 shares, respectively.
         The Manager will waive fees and/or reimburse Fund expenses in an amount equal to the indirect management fees incurred through the Fund’s investment in IMMF. During the year ended December 31, 2010, the Manager waived fees and/or reimbursed the Fund $6,568 for IMMF management fees.
         Some of these undertakings may be modified or terminated at any time; some may not be modified or terminated until after one year from the date of the current prospectus, as indicated therein.
         During the year ended December 31, 2010, the Manager voluntarily reimbursed the Fund $429 for certain transactions. The payment is reported separately in the Statement of Operations and increased the Fund’s total returns by less than 0.01%.
    5. Risk Exposures and the Use of Derivative Instruments
    The Fund’s investment objectives not only permit the Fund to purchase investment securities, they also allow the Fund to enter into various types of derivatives contracts, including, but not limited to, futures contracts, forward foreign currency exchange contracts, credit default swaps, interest rate swaps, total return swaps, and purchased and written options. In doing so, the Fund will employ strategies in differing combinations to permit it to increase, decrease, or change the level or types of exposure to market risk factors. Central to those strategies are features inherent to derivatives that make them more attractive for this purpose than equity and debt securities: they require little or no initial cash investment, they can focus exposure on only certain selected risk factors, and they may not require the ultimate receipt or delivery of the underlying security (or securities) to the contract. This may allow the Fund to pursue its objectives more quickly and efficiently than if it were to make direct purchases or sales of securities capable of effecting a similar response to market factors.
    Market Risk Factors. In accordance with its investment objectives, the Fund may use derivatives to increase or decrease its exposure to one or more of the following market risk factors:
    Commodity Risk. Commodity risk relates to the change in value of commodities or commodity indexes as they relate to increases or decreases in the commodities market. Commodities are physical assets that have tangible properties. Examples of these types of assets are crude oil, heating oil, metals, livestock, and agricultural products.
    Credit Risk. Credit risk relates to the ability of the issuer to meet interest and principal payments, or both, as they come due. In general, lower-grade, higher-yield bonds are subject to credit risk to a greater extent than lower-yield, higher-quality bonds.
    Equity Risk. Equity risk relates to the change in value of equity securities as they relate to increases or decreases in the general market.
    Foreign Exchange Rate Risk. Foreign exchange rate risk relates to the change in the U.S. dollar value of a security held that is denominated in a foreign currency. The U.S. dollar value of a foreign currency denominated security will decrease as the dollar appreciates against the currency, while the U.S. dollar value will increase as the dollar depreciates against the currency.
    Interest Rate Risk. Interest rate risk refers to the fluctuations in value of fixed-income securities resulting from the inverse relationship between price and yield. For example, an increase in general interest rates will tend to reduce the market value of already issued fixed-income investments, and a decline in general interest rates will tend to increase their value. In addition, debt securities with longer maturities, which tend to have higher yields, are subject to potentially greater fluctuations in value from changes in interest rates than obligations with shorter maturities.
    Volatility Risk. Volatility risk refers to the magnitude of the movement, but not the direction of the movement, in a financial instrument’s price over a defined time period. Large increases or decreases in a financial instrument’s price over a relative time period typically indicate greater volatility risk, while small increases or decreases in its price typically indicate lower volatility risk.
         The Fund’s actual exposures to these market risk factors during the period are discussed in further detail, by derivative type, below.
    Risks of Investing in Derivatives. The Fund’s use of derivatives can result in losses due to unanticipated changes in the market risk factors and the overall market. In instances where the Fund is using derivatives to decrease, or hedge, exposures to market risk factors for securities held by the Fund, there are also risks that those derivatives may not perform as expected resulting in losses for the combined or hedged positions.
         Derivatives may have little or no initial cash investment relative to their market value exposure and therefore can produce significant gains or losses in excess of their cost. This use of embedded leverage allows the Fund to increase its market value exposure relative to its net assets and can substantially increase the volatility of the Fund’s performance.
         Additional associated risks from investing in derivatives also exist and potentially could have significant effects on the valuation of the derivative and the Fund. Typically, the associated risks are not the risks that the Fund is attempting to increase or decrease exposure to, per its investment objectives, but are the additional risks from investing in derivatives. Examples of these associated risks are liquidity risk, which is the risk that the Fund will not be able to sell the derivative in the open market in a timely manner, and counterparty credit risk, which is the risk that the counterparty will not fulfill its obligation to the Fund. Associated risks can be different for each type of derivative and are discussed by each derivative type in the notes that follow. 

    Counterparty Credit Risk. Certain derivative positions are subject to counterparty credit risk, which is the risk that the counterparty will not fulfill its obligation to the Fund. The Fund’s derivative counterparties are financial institutions who are subject to market conditions that may weaken their financial position. The Fund intends to enter into financial transactions with counterparties that the Manager believes to be creditworthy at the time of the transaction.
    Credit Related Contingent Features. The Fund’s agreements with derivative counterparties have several credit related contingent features that if triggered would allow its derivatives counterparties to close out and demand payment or additional collateral to cover their exposure from the Fund. Credit related contingent features are established between the Fund and its derivatives counterparties to reduce the risk that the Fund will not fulfill its payment obligations to its counterparties. These triggering features include, but are not limited to, a percentage decrease in the Fund’s net assets and or a percentage decrease in the Fund’s Net Asset Value or NAV. The contingent features are established within the Fund’s International Swap and Derivatives Association, Inc. master agreements which govern certain positions in swaps, over-the-counter options and swaptions, and forward currency exchange contracts for each individual counterparty.
    The effect of derivative instruments on the Statement of Operations is as follows:
             
    Amount of Realized Gain or (Loss) Recognized on Derivatives
    Derivatives Not Accounted      
    for as Hedging Instruments   Swap contracts  
     
    Credit contracts
      $ (845,604 )
             
    Amount of Change in Unrealized Gain or (Loss) Recognized on Derivatives
    Derivatives Not Accounted      
    for as Hedging Instruments   Swap contracts  
     
    Credit contracts
      $ 816,702  
    Swap Contracts
    The Fund may enter into swap contract agreements with a counterparty to exchange a series of cash flows based on either specified reference rates, or the occurrence of a credit event, over a specified period. Such contracts may include interest rate, equity, debt, index, total return, credit and currency swaps.
         Swaps are marked to market daily using primarily quotations from pricing services, counterparties and brokers. Swap contracts are reported on a schedule following the Statement of Investments. The values of swap contracts are aggregated by positive and negative values and disclosed separately on the Statement of Assets and Liabilities by contracts in unrealized appreciation and depreciation positions. Upfront payments paid or received, if any, affect the value of the respective swap. Therefore, to determine the unrealized appreciation (depreciation) on swaps, upfront payments paid should be subtracted from, while upfront payments received should be added to, the value of contracts reported as an asset on the Statement of Assets and Liabilities. Conversely, upfront payments paid should be added to, while upfront payments received should be subtracted from the value of contracts reported as a liability. The unrealized appreciation (depreciation) related to the change in the valuation of the notional amount of the swap is combined with the accrued interest due to (owed by) the Fund at termination or settlement. The net change in this amount during the period is included on the Statement of Operations. The Fund also records any periodic payments received from (paid to) the counterparty, including at termination, under such contracts as realized gain (loss) on the Statement of Operations.
         Swap contract agreements are exposed to the market risk factor of the specific underlying reference asset. Swap contracts are typically more attractively priced compared to similar investments in related cash securities because they isolate the risk to one market risk factor and eliminate the other market risk factors. Investments in cash securities (for instance bonds) have exposure to multiple risk factors (credit and interest rate risk). Because swaps require little or no initial cash investment, they can expose the Fund to substantial risk in the isolated market risk factor.
    Credit Default Swap Contracts. A credit default swap is a bilateral contract that enables an investor to buy or sell protection on a debt security against a defined-issuer credit event, such as the issuer’s failure to make timely payments of interest or principal on the debt security, bankruptcy or restructuring. The Fund may enter into credit default swaps either by buying or selling protection on a single security or a basket of securities (the “reference asset”).
         The buyer of protection pays a periodic fee to the seller of protection based on the notional amount of debt securities underlying the swap contract. The seller of protection agrees to compensate the buyer of protection for future potential losses as a result of a credit event on the reference asset. The contract effectively transfers the credit event risk of the reference asset from the buyer of protection to the seller of protection.
         The ongoing value of the contract will fluctuate throughout the term of the contract based primarily on the credit risk of the reference asset. If the credit quality of the reference asset improves relative to the credit quality at contract initiation, the buyer of protection may have an unrealized loss greater than the anticipated periodic fee owed. This unrealized loss would be the result of current credit protection being cheaper than the cost of credit protection at contract initiation. If the buyer elects to terminate the contract prior to its maturity, and there has been no credit event, this unrealized loss will become realized. If the contract is held to maturity, and there has been no credit event, the realized loss will be equal to the periodic fee paid over the life of the contract.
         If there is a credit event, the buyer of protection can exercise its rights under the contract and receive a payment from the seller of protection equal to the notional amount of the reference asset less the market value of the reference asset. Upon exercise of the contract the difference between the value of the underlying reference asset and the notional amount is recorded as realized gain (loss) and is included on the Statement of Operations.
         The Fund has sold credit protection through credit default swaps to increase exposure to the credit risk of individual securities and/or, indexes that are either unavailable or considered to be less attractive in the bond market.
         The Fund has purchased credit protection through credit default swaps to decrease exposure to the credit risk of individual securities and/or, indexes.
         For the year ended December 31, 2010, the Fund had average notional amounts of $506,154 and $1,066,154 on credit default swaps to buy protection and credit default swaps to sell protection, respectively.
         Additional associated risks to the Fund include counterparty credit risk and liquidity risk.
         As of December 31, 2010, the Fund had no such credit default swaps outstanding.
    6. Restricted Securities
    As of December 31, 2010, investments in securities included issues that are restricted. A restricted security may have a contractual restriction on its resale and is valued under methods approved by the Board of Trustees as reflecting fair value. Securities that are restricted are marked with an applicable footnote on the Statement of Investments. Restricted securities are reported on a schedule following the Statement of Investments.
    7. Pending Litigation
    Since 2009, a number of lawsuits have been pending in federal courts against the Manager, the Distributor, and certain mutual funds (“Defendant Funds”) advised by the Manager and distributed by the Distributor (but not including the Fund). The lawsuits naming the Defendant Funds also name as defendants certain officers and current and former trustees of the respective Defendant Funds. The plaintiffs seek class action status on behalf of purchasers of shares of the respective Defendant Fund during a particular time period. The lawsuits raise claims under federal securities laws alleging that, among other things, the disclosure documents of the respective Defendant Fund contained misrepresentations and omissions, that such Defendant Fund’s investment policies were not followed, and that such Defendant Fund and the other defendants violated federal securities laws and regulations. The plaintiffs seek unspecified damages, equitable relief and an award of attorneys’ fees and litigation expenses. 

         In 2009, what are claimed to be derivative lawsuits were filed in state court against the Manager and a subsidiary (but not against the Fund), on behalf of the New Mexico Education Plan Trust. These lawsuits allege breach of contract, breach of fiduciary duty, negligence and violation of state securities laws, and seek compensatory damages, equitable relief and an award of attorneys’ fees and litigation expenses.
         Other lawsuits have been filed since 2008 in various state and federal courts, against the Manager and certain of its affiliates. Those lawsuits were filed by investors who made investments through an affiliate of the Manager, and relate to the alleged investment fraud perpetrated by Bernard Madoff and his firm (“Madoff”). Those suits allege a variety of claims, including breach of fiduciary duty, fraud, negligent misrepresentation, unjust enrichment, and violation of federal and state securities laws and regulations, among others. They seek unspecified damages, equitable relief and an award of attorneys’ fees and litigation expenses. None of the suits have named the Distributor, any of the Oppenheimer mutual funds or any of their independent Trustees or Directors as defendants. None of the Oppenheimer funds invested in any funds or accounts managed by Madoff.
         The Manager believes that the lawsuits described above are without legal merit and is defending against them vigorously. The Defendant Funds’ Boards of Trustees have also engaged counsel to defend the suits brought against those Funds and the present and former Independent Trustees named in those suits. While it is premature to render any opinion as to the outcome in these lawsuits, or whether any costs that the Defendant Funds may bear in defending the suits might not be reimbursed by insurance, the Manager believes that these suits should not impair the ability of the Manager or the Distributor to perform their respective duties to the Fund, and that the outcome of all of the suits together should not have any material effect on the operations of any of the Oppenheimer funds.
    8. Subsequent Event
    The Regulated Investment Company Modernization Act of 2010 (the “Act”) was signed into law on December 22, 2010. The Act makes changes to a number of tax rules impacting the Fund. Under the Act, future capital losses generated by a fund may be carried over indefinitely, but these losses must be used prior to the utilization of any pre-enactment capital losses. Since pre-enactment capital losses may only be carried forward for eight years, there may be a greater likelihood that all or a portion of a fund’s pre-enactment capital losses will expire unused. In general, the provisions of the Act will be effective for the Fund’s fiscal year ending December 31, 2011. Specific information regarding the impact of the Act on the Fund will be contained within the “Federal Taxes” section of the financial statement notes for the fiscal year ending December 31, 2011.


    REPORT OF INDEPENDENT REGISTERED PUBLIC ACCOUNTING FIRM
    The Board of Trustees and Shareholders of Oppenheimer Variable Account Funds:
    We have audited the accompanying statement of assets and liabilities of Oppenheimer Main Street Fund/VA, (one of the portfolios constituting the Oppenheimer Variable Account Funds), including the statement of investments, as of December 31, 2010, and the related statement of operations for the year then ended, and the statements of changes in net assets and the financial highlights for each of the years in the two-year period then ended. These financial statements and financial highlights are the responsibility of the Fund’s management. Our responsibility is to express an opinion on these financial statements and financial highlights based on our audits. The accompanying financial highlights of Oppenheimer Main Street Fund/VA for the years ended prior to January 1, 2009 were audited by other auditors whose report dated February 11, 2009 expressed an unqualified opinion on those financial highlights.
         We conducted our audits in accordance with the standards of the Public Company Accounting Oversight Board (United States). Those standards require that we plan and perform the audit to obtain reasonable assurance about whether the financial statements and financial highlights are free of material misstatement. An audit includes examining, on a test basis, evidence supporting the amounts and disclosures in the financial statements. Our procedures included confirmation of securities owned as of December 31, 2010, by correspondence with the custodian and transfer agent. An audit also includes assessing the accounting principles used and significant estimates made by management, as well as evaluating the overall financial statement presentation. We believe that our audits provide a reasonable basis for our opinion.
         In our opinion, the financial statements and financial highlights referred to above present fairly, in all material respects, the financial position of Oppenheimer Main Street Fund/VA as of December 31, 2010, and the results of its operations for the year then ended, and the changes in its net assets and the financial highlights for each of the years in the two-year period then ended, in conformity with U.S. generally accepted accounting principles.
     
    /s/ KPMG llp

    Denver, Colorado
    February 16, 2011


    STATEMENT OF INVESTMENTS December 31, 2010

                     
        Shares     Value  
     
    Common Stocks—98.8%
                   
    Consumer Discretionary—12.2%
                   
    Automobiles—3.0%
                   
    Ford Motor Co.1
        2,943,130     $ 49,415,153  
    Hotels, Restaurants & Leisure—4.4%
                   
    Hyatt Hotels Corp., Cl. A1
        606,168       27,738,248  
    McDonald’s Corp.
        580,416       44,552,732  


                72,290,980  
     
                   
    Media—2.9%
                   
    McGraw-Hill Cos., Inc. (The)
        999,921       36,407,124  
    Washington Post Co. (The), Cl. B
        25,568       11,237,136  


                47,644,260  
     
                   
    Multiline Retail—0.5%
                   
    Target Corp.
        150,100       9,025,513  
    Specialty Retail—1.4%
                   
    AutoZone, Inc.1
        87,760       23,922,498  
    Consumer Staples—9.2%
                   
    Food Products—5.0%
                   
    General Mills, Inc.
        1,006,930       35,836,639  
    Mead Johnson Nutrition Co., Cl. A
        457,252       28,463,937  
    Sara Lee Corp.
        1,053,540       18,447,485  


                82,748,061  
     
                   
    Tobacco—4.2%
                   
    Philip Morris International, Inc.
        1,185,519       69,388,427  
    Energy—11.4%
                   
    Oil, Gas & Consumable Fuels—11.4%
                   
    Chevron Corp.
        717,269       65,450,796  
    Enterprise Products Partners LP
        547,170       22,767,744  
    Noble Energy, Inc.
        228,690       19,685,635  
    Occidental Petroleum Corp.
        665,820       65,316,942  
    Plains All American Pipeline LP
        234,811       14,743,783  


                187,964,900  
     
                   
    Financials—18.9%
                   
    Capital Markets—3.5%
                   
    Goldman Sachs Group, Inc. (The)
        140,110       23,560,898  
    State Street Corp.
        754,342       34,956,208  


                58,517,106  
     
                   
    Commercial Banks—7.0%
                   
    CIT Group, Inc.1
        1,343,720       63,289,212  
    Wells Fargo & Co.
        1,675,020       51,908,870  


                115,198,082  
     
                   
    Diversified Financial Services—4.7%
                   
    Bank of America Corp.
        2,739,710       36,547,731  
    Citigroup, Inc.1
        8,723,030       41,259,932  


                77,807,663  
     
                   
    Insurance—3.7%
                   
    AFLAC, Inc.
        582,660       32,879,504  
    Progressive Corp.
        1,382,750       27,475,243  


                60,354,747  
     
                   
    Health Care—11.4%
                   
    Biotechnology—1.9%
                   
    Celgene Corp.1
        412,762       24,410,745  
    Human Genome Sciences, Inc.1
        300,230       7,172,495  


                31,583,240  
     
                   
    Health Care Equipment & Supplies—1.1%
                   
    Medtronic, Inc.
        497,120       18,438,181  
    Health Care Providers & Services—2.9%
                   
    Express Scripts, Inc.1
        342,170       18,494,289  
    WellPoint, Inc.1
        512,490       29,140,181  


                47,634,470  
     
                   
    Pharmaceuticals—5.5%
                   
    Abbott Laboratories
        644,650       30,885,182  
    Merck & Co., Inc.
        1,043,188       37,596,496  
    Perrigo Co.
        72,610       4,598,391  
    Teva Pharmaceutical Industries Ltd., Sponsored ADR
        342,210       17,839,407  


                90,919,476  
     
                   
    Industrials—10.2%
                   
    Aerospace & Defense—2.2%
                   
    Boeing Co. (The)
        235,310       15,356,331  
    Precision Castparts Corp.
        146,860       20,444,381  


                35,800,712  
     
                   
    Air Freight & Logistics—2.9%
                   
    United Parcel Service, Inc., Cl. B
        662,320       48,071,186  
    Commercial Services & Supplies—1.7%
                   
    Republic Services, Inc.
        952,124       28,430,420  
    Construction & Engineering—0.9%
                   
    KBR, Inc.
        513,924       15,659,264  
    Industrial Conglomerates—2.5%
                   
    Tyco International Ltd.
        993,210       41,158,622  
     
                     
        Shares     Value  
     
    Information Technology—18.8%
                   
    Communications Equipment—3.1%
                   
    QUALCOMM, Inc.
        1,035,171     $ 51,230,613  
    Computers & Peripherals—4.9%
                   
    Apple, Inc.1
        221,572       71,470,264  
    Western Digital Corp.1
        290,070       9,833,373  


                81,303,637  
     
                   
    Internet Software & Services—5.5%
                   
    eBay, Inc.1
        1,723,975       47,978,224  
    Google, Inc., Cl. A1
        72,530       43,080,644  


                91,058,868  
     
                   
    Semiconductors & Semiconductor Equipment—1.2%
                   
    Marvell Technology Group Ltd.1
        1,028,970       19,087,394  
    Software—4.1%
                   
    Check Point Software Technologies Ltd.1
        660,080       30,535,301  
    Microsoft Corp.
        1,348,697       37,655,620  


                68,190,921  
     
                   
    Materials—1.6%
                   
    Chemicals—1.6%
                   
    Praxair, Inc.
        280,970       26,824,206  
    Telecommunication Services—2.1%
                   
    Wireless Telecommunication Services—2.1%
                   
    America Movil SAB de CV, ADR, Series L
        600,686       34,443,335  
    Utilities—3.0%
                   
    Energy Traders—3.0%
                   
    AES Corp. (The)1
        4,129,100       50,292,438  


    Total Common Stocks
    (Cost $1,262,449,085)
                1,634,404,373  
     
                   
    Investment Companies—1.3%
                   
    JPMorgan U.S. Treasury Plus Money Market Fund, Agency Shares, 0.00%2,3
        23,091       23,091  
    Oppenheimer Institutional Money Market Fund, Cl. E, 0.21%2,4
        21,709,488       21,709,488  
     
                 
    Total Investment Companies
    (Cost $21,732,579)
                21,732,579  
     
                   
    Total Investments, at Value
    (Cost $1,284,181,664)
        100.1 %     1,656,136,952  
    Liabilities in Excess of Other Assets
        (0.1 )     (961,284 )
         
    Net Assets
        100.0 %   $ 1,655,175,668  
         
    Footnotes to Statement of Investments
    1.   Non-income producing security.
     
    2.   Rate shown is the 7-day yield as of December 31, 2010.
     
    3.   Interest rate is less than 0.0005%.
     
    4.   Is or was an affiliate, as defined in the Investment Company Act of 1940, at or during the period ended December 31, 2010, by virtue of the Fund owning at least 5% of the voting securities of the issuer or as a result of the Fund and the issuer having the same investment adviser. Transactions during the period in which the issuer was an affiliate are as follows:
                                     
        Shares     Gross     Gross     Shares  
        December 31, 2009     Additions     Reductions     December 31, 2010  
     
    Oppenheimer Institutional Money Market Fund, Cl. E
        2,607,806       511,917,457       492,815,775       21,709,488  
                     
        Value     Income  
     
    Oppenheimer Institutional Money Market Fund, Cl. E
      $ 21,709,488     $ 33,536  
    Valuation Inputs
    Various data inputs are used in determining the value of each of the Fund’s investments as of the reporting period end. These data inputs are categorized in the following hierarchy under applicable financial accounting standards:
      1)   Level 1—unadjusted quoted prices in active markets for identical assets or liabilities (including securities actively traded on a securities exchange)
     
      2)   Level 2—inputs other than unadjusted quoted prices that are observable for the asset or liability (such as unadjusted quoted prices for similar assets and market corroborated inputs such as interest rates, prepayment speeds, credit risks, etc.)
     
      3)   Level 3—significant unobservable inputs (including the Manager’s own judgments about assumptions that market participants would use in pricing the asset or liability).


    The table below categorizes amounts that are included in the Fund’s Statement of Assets and Liabilities as of December 31, 2010 based on valuation input level:
                                     
                        Level 3—        
        Level 1—     Level 2—     Significant        
        Unadjusted     Other Significant     Unobservable        
        Quoted Prices     Observable Inputs     Inputs     Value  
     
    Assets Table
                                   
    Investments, at Value:
                                   
    Common Stocks
                                   
    Consumer Discretionary
      $ 202,298,404     $     $     $ 202,298,404  
    Consumer Staples
        152,136,488                   152,136,488  
    Energy
        187,964,900                   187,964,900  
    Financials
        311,877,598                   311,877,598  
    Health Care
        188,575,367                   188,575,367  
    Industrials
        169,120,204                   169,120,204  
    Information Technology
        310,871,433                   310,871,433  
    Materials
        26,824,206                   26,824,206  
    Telecommunication Services
        34,443,335                   34,443,335  
    Utilities
        50,292,438                   50,292,438  
    Investment Companies
        21,732,579                   21,732,579  
         
    Total Assets
      $ 1,656,136,952     $     $     $ 1,656,136,952  
         
    Currency contracts and forwards, if any, are reported at their unrealized appreciation/depreciation at measurement date, which represents the change in the contract’s value from trade date. Futures, if any, are reported at their variation margin at measurement date, which represents the amount due to/from the Fund at that date. All additional assets and liabilities included in the above table are reported at their market value at measurement date.
    See the accompanying Notes for further discussion of the methods used in determining value of the Fund’s investments, and a summary of changes to the valuation methodologies, if any, during the reporting period.


    STATEMENT OF ASSETS AND LIABILITIES December 31, 2010
             
    Assets
           
    Investments, at value—see accompanying statement of investments:
           
    Unaffiliated companies (cost $1,262,472,176)
      $ 1,634,427,464  
    Affiliated companies (cost $21,709,488)
        21,709,488  


        1,656,136,952  
    Receivables and other assets:
           
    Dividends
        1,763,886  
    Other
        36,024  
     
         
    Total assets
        1,657,936,862  
     
           
    Liabilities
           
    Payables and other liabilities:
           
    Shares of beneficial interest redeemed
        1,577,129  
    Distribution and service plan fees
        725,708  
    Shareholder communications
        242,543  
    Transfer and shareholder servicing agent fees
        140,481  
    Trustees’ compensation
        33,381  
    Other
        41,952  
     
         
    Total liabilities
        2,761,194  
     
           
    Net Assets
      $ 1,655,175,668  


    Composition of Net Assets
           
    Par value of shares of beneficial interest
      $ 79,736  
    Additional paid-in capital
        1,706,470,152  
    Accumulated net investment income
        13,277,741  
    Accumulated net realized loss on investments
        (436,607,249 )
    Net unrealized appreciation on investments
        371,955,288  
     
         
    Net Assets
      $ 1,655,175,668  


    Net Asset Value Per Share
           
    Non-Service Shares:
           
    Net asset value, redemption price per share and offering price per share (based on net assets of $469,720,321 and 22,491,840 shares of beneficial interest outstanding)
      $ 20.88  
    Service Shares:
           
    Net asset value, redemption price per share and offering price per share (based on net assets of $1,185,455,347 and 57,243,945 shares of beneficial interest outstanding)
      $ 20.71  


    STATEMENT OF OPERATIONS For the Year Ended December 31, 2010
             
    Investment Income
           
    Dividends:
           
    Unaffiliated companies (net of foreign withholding taxes of $57,358)
      $ 28,062,673  
    Affiliated companies
        33,536  
    Interest
        796  
     
         
    Total investment income
        28,097,005  
     
           
    Expenses
           
    Management fees
        10,730,968  
    Distribution and service plan fees—Service shares
        2,959,203  
    Transfer and shareholder servicing agent fees:
           
    Non-Service shares
        454,922  
    Service shares
        1,193,556  
    Shareholder communications:
           
    Non-Service shares
        68,705  
    Service shares
        177,846  
    Trustees’ compensation
        61,017  
    Custodian fees and expenses
        9,526  
    Administration service fees
        1,500  
    Other
        121,559  
     
         
    Total expenses
        15,778,802  
    Less waivers and reimbursements of expenses
        (25,541 )
     
         
    Net expenses
        15,753,261  
     
           
    Net Investment Income
        12,343,744  
     
           
    Realized and Unrealized Gain
           
    Net realized gain on investments from unaffiliated companies
        122,769,693  
    Net change in unrealized appreciation/depreciation on investments
        110,123,026  
     
           
    Net Increase in Net Assets Resulting from Operations
      $ 245,236,463  


    STATEMENTS OF CHANGES IN NET ASSETS
                     
    Year Ended December 31,   2010     2009  
     
    Operations
                   
    Net investment income
      $ 12,343,744     $ 17,132,592  
    Net realized gain (loss)
        122,769,693       (277,476,159 )
    Net change in unrealized appreciation/depreciation
        110,123,026       638,505,737  
         
    Net increase in net assets resulting from operations
        245,236,463       378,162,170  
     
                   
    Dividends and/or Distributions to Shareholders
                   
    Dividends from net investment income:
                   
    Non-Service shares
        (5,119,114 )     (8,430,011 )
    Service shares
        (11,011,249 )     (16,363,358 )
         
     
        (16,130,363 )     (24,793,369 )
     
                   
    Beneficial Interest Transactions
                   
    Net decrease in net assets resulting from beneficial interest transactions:
                   
    Non-Service shares
        (66,941,748 )     (56,849,676 )
    Service shares
        (135,835,930 )     (120,134,918 )
         
     
        (202,777,678 )     (176,984,594 )
     
                   
    Net Assets
                   
    Total increase
        26,328,422       176,384,207  
    Beginning of period
        1,628,847,246       1,452,463,039  
         
    End of period (including accumulated net investment income of $13,277,741 and $17,048,397, respectively)
      $ 1,655,175,668     $ 1,628,847,246  


    FINANCIAL HIGHLIGHTS
                                             
    Non-Service Shares Year Ended December 31,   2010     2009     2008     2007     2006  
     
    Per Share Operating Data
                                           
    Net asset value, beginning of period
      $ 18.18     $ 14.56     $ 25.61     $ 24.78     $ 21.79  
     
    Income (loss) from investment operations:
                                           
    Net investment income1
        .17       .21       .29       .33       .27  
    Net realized and unrealized gain (loss)
        2.73       3.71       (9.64 )     .75       2.98  
         
    Total from investment operations
        2.90       3.92       (9.35 )     1.08       3.25  
     
    Dividends and/or distributions to shareholders:
                                           
    Dividends from net investment income
        (.20 )     (.30 )     (.32 )     (.25 )     (.26 )
    Distributions from net realized gain
                    (1.38 )            
         
    Total dividends and/or distributions to shareholders
        (.20 )     (.30 )     (1.70 )     (.25 )     (.26 )
     
    Net asset value, end of period
      $ 20.88     $ 18.18     $ 14.56     $ 25.61     $ 24.78  


    Total Return, at Net Asset Value2
        16.11 %     28.29 %     (38.47 )%     4.43 %     15.03 %
     
                                           
    Ratios/Supplemental Data
                                           
    Net assets, end of period (in thousands)
      $ 469,720     $ 474,637     $ 432,360     $ 907,727     $ 1,046,146  
     
    Average net assets (in thousands)
      $ 454,937     $ 430,517     $ 670,994     $ 1,006,655     $ 1,054,522  
     
    Ratios to average net assets3
                                           
    Net investment income
        0.93 %     1.35 %     1.42 %     1.28 %     1.19 %
    Total expenses4
        0.78 %     0.78 %     0.66 %     0.65 %     0.66 %
    Expenses after payments, waivers and/or reimbursements and reduction to custodian expenses
        0.78 %     0.78 %     0.66 %     0.65 %     0.66 %
     
    Portfolio turnover rate
        45 %     128 %     132 %     111 %     100 %
    1.   Per share amounts calculated based on the average shares outstanding during the period.
     
    2.   Assumes an initial investment on the business day before the first day of the fiscal period, with all dividends and distributions reinvested in additional shares on the reinvestment date, and redemption at the net asset value calculated on the last business day of the fiscal period. Total returns are not annualized for periods less than one full year. Total return information does not reflect expenses that apply at the separate account level or to related insurance products. Inclusion of these charges would reduce the total return figures for all periods shown. Returns do not reflect the deduction of taxes that a shareholder would pay on fund distributions or the redemption of fund shares.
     
    3.   Annualized for periods less than one full year.
     
    4.   Total expenses including indirect expenses from affiliated fund were as follows:
             
    Year Ended December 31, 2010
        0.78 %
    Year Ended December 31, 2009
        0.78 %
    Year Ended December 31, 2008
        0.66 %
    Year Ended December 31, 2007
        0.65 %
    Year Ended December 31, 2006
        0.66 %


    FINANCIAL HIGHLIGHTS
                                             
    Service Shares Year Ended December 31,   2010     2009     2008     2007     2006  
     
    Per Share Operating Data
                                           
    Net asset value, beginning of period
      $ 18.04     $ 14.42     $ 25.38     $ 24.58     $ 21.63  
     
    Income (loss) from investment operations:
                                           
    Net investment income1
        .13       .17       .24       .26       .22  
    Net realized and unrealized gain (loss)
        2.70       3.70       (9.56 )     .75       2.95  
         
    Total from investment operations
        2.83       3.87       (9.32 )     1.01       3.17  
     
    Dividends and/or distributions to shareholders:
                                           
    Dividends from net investment income
        (.16 )     (.25 )     (.26 )     (.21 )     (.22 )
    Distributions from net realized gain
                    (1.38 )            
         
    Total dividends and/or distributions to shareholders
        (.16 )     (.25 )     (1.64 )     (.21 )     (.22 )
     
    Net asset value, end of period
      $ 20.71     $ 18.04     $ 14.42     $ 25.38     $ 24.58  


    Total Return, at Net Asset Value2
        15.83 %     27.99 %     (38.63 )%     4.15 %     14.76 %
     
                                           
    Ratios/Supplemental Data
                                           
    Net assets, end of period (in thousands)
      $ 1,185,456     $ 1,154,210     $ 1,020,103     $ 1,464,690     $ 1,099,293  
     
    Average net assets (in thousands)
      $ 1,193,630     $ 1,029,909     $ 1,268,430     $ 1,315,488     $ 810,181  
     
    Ratios to average net assets:3
                                           
    Net investment income
        0.68 %     1.10 %     1.20 %     1.03 %     0.95 %
    Total expenses4
        1.03 %     1.03 %     0.91 %     0.90 %     0.91 %
    Expenses after payments, waivers and/or reimbursements and reduction to custodian expenses
        1.03 %     1.03 %     0.91 %     0.90 %     0.91 %
     
    Portfolio turnover rate
        45 %     128 %     132 %     111 %     100 %
    1.   Per share amounts calculated based on the average shares outstanding during the period.
     
    2.   Assumes an initial investment on the business day before the first day of the fiscal period, with all dividends and distributions reinvested in additional shares on the reinvestment date, and redemption at the net asset value calculated on the last business day of the fiscal period. Total returns are not annualized for periods less than one full year. Total return information does not reflect expenses that apply at the separate account level or to related insurance products. Inclusion of these charges would reduce the total return figures for all periods shown. Returns do not reflect the deduction of taxes that a shareholder would pay on fund distributions or the redemption of fund shares.
     
    3.   Annualized for periods less than one full year.
     
    4.   Total expenses including indirect expenses from affiliated fund were as follows:
             
    Year Ended December 31, 2010
        1.03 %
    Year Ended December 31, 2009
        1.03 %
    Year Ended December 31, 2008
        0.91 %
    Year Ended December 31, 2007
        0.90 %
    Year Ended December 31, 2006
        0.91 %


    NOTES TO FINANCIAL STATEMENTS
    1. Significant Accounting Policies
    Oppenheimer Main Street Fund/VA (the “Fund”), is a separate series of Oppenheimer Variable Account Funds, an open-end management investment company registered under the Investment Company Act of 1940, as amended. The Fund’s investment objective is to seek high total return. The Fund’s investment adviser is OppenheimerFunds, Inc. (the “Manager”).
         The Fund offers two classes of shares. Both classes are sold at their offering price, which is the net asset value per share, to separate investment accounts of participating insurance companies as an underlying investment for variable life insurance policies, variable annuity contracts or other investment products. The class of shares designated as Service shares is subject to a distribution and service plan. Both classes of shares have identical rights and voting privileges with respect to the Fund in general and exclusive voting rights on matters that affect that class alone. Earnings, net assets and net asset value per share may differ due to each class having its own expenses, such as transfer and shareholder servicing agent fees and shareholder communications, directly attributable to that class.
         The following is a summary of significant accounting policies consistently followed by the Fund.
    Securities Valuation. The Fund calculates the net asset value of its shares as of the close of the New York Stock Exchange (the “Exchange”), normally 4:00 P.M. Eastern time, on each day the Exchange is open for trading.
         Each investment asset or liability of the Fund is assigned a level at measurement date based on the significance and source of the inputs to its valuation. Unadjusted quoted prices in active markets for identical securities are classified as “Level 1,” inputs other than unadjusted quoted prices for an asset that are observable are classified as “Level 2” and significant unobservable inputs, including the Manager’s judgment about the assumptions that a market participant would use in pricing an asset or liability, are classified as “Level 3.” The inputs used for valuing securities are not necessarily an indication of the risks associated with investing in those securities. A table summarizing the Fund’s investments under these levels of classification is included following the Statement of Investments.
         Securities are valued using unadjusted quoted market prices, when available, as supplied primarily by portfolio pricing services approved by the Board of Trustees or dealers.
         Securities traded on a registered U.S. securities exchange are valued based on the last sale price of the security reported on the principal exchange on which it is traded, prior to the time when the Fund’s assets are valued. Securities whose principal exchange is NASDAQ® are valued based on the official closing prices reported by NASDAQ prior to the time when the Fund’s assets are valued. In the absence of a sale, the security is valued at the last sale price on the prior trading day, if it is within the spread of the current day’s closing “bid” and “asked” prices, and if not, at the current day’s closing bid price. A foreign security traded on a foreign exchange is valued based on the last sale price on the principal exchange on which the security is traded, as identified by the portfolio pricing service used by the Manager, prior to the time when the Fund’s assets are valued. In the absence of a sale, the security is valued at the most recent official closing price on the principal exchange on which it is traded.
         Shares of a registered investment company that are not traded on an exchange are valued at that investment company’s net asset value per share.
         U.S. domestic and international debt instruments (including corporate, government, municipal, mortgage-backed, collateralized mortgage obligations and asset-backed securities) and “money market-type” debt instruments with a remaining maturity in excess of sixty days are valued at the mean between the “bid” and “asked” prices utilizing price quotations obtained from independent pricing services or broker-dealers. Such prices are typically determined based upon information obtained from market participants including reported trade data, broker-dealer price quotations and inputs such as benchmark yields and issuer spreads from identical or similar securities.
         “Money market-type” debt instruments with remaining maturities of sixty days or less are valued at cost adjusted by the amortization of discount or premium to maturity (amortized cost), which approximates market value.
         In the absence of a readily available unadjusted quoted market price, including for securities whose values have been materially affected by what the Manager identifies as a significant event occurring before the Fund’s assets are valued but after the close of the securities’ respective exchanges, the Manager, acting through its internal valuation committee, in good faith determines the fair valuation of that asset using consistently applied procedures under the supervision of the Board of Trustees (which reviews those fair valuations by the Manager). Those procedures include certain standardized methodologies to fair value securities. Such methodologies include, but are not limited to, pricing securities initially at cost and subsequently adjusting the value based on: changes in company specific fundamentals, changes in an appropriate securities index, or changes in the value of similar securities which may be adjusted for any discounts related to resale restrictions. When possible, such methodologies use observable market inputs such as unadjusted quoted prices of similar securities, observable interest rates, currency rates and yield curves. The methodologies used for valuing securities are not necessarily an indication of the risks associated with investing in those securities.
         There have been no significant changes to the fair valuation methodologies of the Fund during the period.
    Investment in Oppenheimer Institutional Money Market Fund. The Fund is permitted to invest daily available cash balances in an affiliated money market fund. The Fund may invest the available cash in Class E shares of Oppenheimer Institutional Money Market Fund (“IMMF”) to seek current income while preserving liquidity. IMMF is a registered open-end management investment company, regulated as a money market fund under the Investment Company Act of 1940, as amended. The Manager is also the investment adviser of IMMF. When applicable, the Fund’s investment in IMMF is included in the Statement of Investments. Shares of IMMF are valued at their net asset value per share. As a shareholder, the Fund is subject to its proportional share of IMMF’s Class E expenses, including its management fee. The Manager will waive fees and/or reimburse Fund expenses in an amount equal to the indirect management fees incurred through the Fund’s investment in IMMF.
    Foreign Currency Translation. The Fund’s accounting records are maintained in U.S. dollars. The values of securities denominated in foreign currencies and amounts related to the purchase and sale of foreign securities and foreign investment income are translated into U.S. dollars as of the close of the Exchange, normally 4:00 P.M. Eastern time, on each day the Exchange is open for trading. Foreign exchange rates may be valued primarily using a reliable bank, dealer or service authorized by the Board of Trustees.
         Reported net realized gains and losses from foreign currency transactions arise from sales of portfolio securities, sales and maturities of short-term securities, sales of foreign currencies, exchange rate fluctuations between the trade and settlement dates on securities transactions, and the difference between the amounts of dividends, interest, and foreign withholding taxes recorded on the Fund’s books and the U.S. dollar equivalent of the amounts actually received or paid. Net unrealized appreciation and depreciation on the translation of assets and liabilities denominated in foreign currencies arise from changes in the values of assets and liabilities, including investments in securities at fiscal period end, resulting from changes in exchange rates.
         The effect of changes in foreign currency exchange rates on investments is separately identified from the fluctuations arising from changes in market values of securities held and reported with all other foreign currency gains and losses in the Fund’s Statement of Operations.
    Allocation of Income, Expenses, Gains and Losses. Income, expenses (other than those attributable to a specific class), gains and losses are allocated on a daily basis to each class of shares based upon the relative proportion of net assets represented by such class. Operating expenses directly attributable to a specific class are charged against the operations of that class.
    Federal Taxes. The Fund intends to comply with provisions of the Internal Revenue Code applicable to regulated investment companies and to distribute substantially all of its investment company taxable income, including any net realized gain on investments not offset by capital loss carryforwards, if any, to shareholders. Therefore, no federal income or excise tax provision is required. The Fund files income tax returns in U.S. federal and applicable state jurisdictions. The statute of limitations on the Fund’s tax return filings generally remain open for the three preceding fiscal reporting period ends.
    The tax components of capital shown in the following table represent distribution requirements the Fund must satisfy under the income tax regulations, losses the Fund may be able to offset against income and gains realized in future years and unrealized appreciation or depreciation of securities and other investments for federal income tax purposes.
                             
                        Net Unrealized  
                        Appreciation  
                        Based on Cost of  
    Undistributed   Undistributed     Accumulated     Securities and Other  
    Net Investment   Long-Term     Loss     Investments for Federal  
    Income   Gain     Carryforward1,2,3     Income Tax Purposes  
     
    $10,058,130
        $            —       $   431,808,304     $ 370,409,328  
    1.   As of December 31, 2010, the Fund had $431,808,304 of net capital loss carryforwards available to offset future realized capital gains, if any, and thereby reduce future taxable gain distributions. As of December 31, 2010, details of the capital loss carryforwards were as follows:
             
    Expiring        
     
    2016
      $ 99,612,647  
    2017
        332,195,657  
     
         
    Total
      $ 431,808,304  
     
         
    2.   During the fiscal year ended December 31, 2010, the Fund utilized $118,380,559 of capital loss carryforward to offset capital gains realized in that fiscal year.
     
    3.   During the fiscal year ended December 31, 2009, the Fund did not utilize any capital loss carryforward.
    Net investment income (loss) and net realized gain (loss) may differ for financial statement and tax purposes. The character of dividends and distributions made during the fiscal year from net investment income or net realized gains may differ from their ultimate characterization for federal income tax purposes. Also, due to timing of dividends and distributions, the fiscal year in which amounts are distributed may differ from the fiscal year in which the income or net realized gain was recorded by the Fund.
    Accordingly, the following amounts have been reclassified for December 31, 2010. Net assets of the Fund were unaffected by the reclassifications.
                     
                Increase  
        Increase     to Accumulated Net  
    Reduction   to Accumulated Net     Realized Loss  
    to Paid-in Capital   Investment Income     on Investments  
     
    $                 86
      $ 15,963     $ 15,877  
    The tax character of distributions paid during the years ended December 31, 2010 and December 31, 2009 was as follows:
                     
        Year Ended     Year Ended  
        December 31, 2010     December 31, 2009  
     
    Distributions paid from:
                   
    Ordinary income
      $ 16,130,363     $ 24,793,369  
    The aggregate cost of securities and other investments and the composition of unrealized appreciation and depreciation of securities and other investments for federal income tax purposes as of December 31, 2010 are noted in the following table. The primary difference between book and tax appreciation or depreciation of securities and other investments, if applicable, is attributable to the tax deferral of losses or tax realization of financial statement unrealized gain or loss.
             
    Federal tax cost of securities
      $ 1,285,727,624  
     
         
    Gross unrealized appreciation
      $ 374,188,913  
    Gross unrealized depreciation
        (3,779,585 )
     
         
    Net unrealized appreciation
      $ 370,409,328  


    Trustees’ Compensation. The Board of Trustees has adopted a compensation deferral plan for independent trustees that enables trustees to elect to defer receipt of all or a portion of the annual compensation they are entitled to receive from the Fund. For purposes of determining the amount owed to the Trustee under the plan, deferred amounts are treated as though equal dollar amounts had been invested in shares of the Fund or in other Oppenheimer funds selected by the Trustee. The Fund purchases shares of the funds selected for deferral by the Trustee in amounts equal to his or her deemed investment, resulting in a Fund asset equal to the deferred compensation liability. Such assets are included as a component of “Other” within the asset section of the Statement of Assets and Liabilities. Deferral of trustees’ fees under the plan will not affect the net assets of the Fund, and will not materially affect the Fund’s assets, liabilities or net investment income per share. Amounts will be deferred until distributed in accordance with the compensation deferral plan.
    Dividends and Distributions to Shareholders. Dividends and distributions to shareholders, which are determined in accordance with income tax regulations and may differ from U.S. generally accepted accounting principles, are recorded on the ex-dividend date. Income and capital gain distributions, if any, are declared and paid annually or at other times as deemed necessary by the Manager.
    Investment Income. Dividend income is recorded on the ex-dividend date or upon ex-dividend notification in the case of certain foreign dividends where the ex-dividend date may have passed. Non-cash dividends included in dividend income, if any, are recorded at the fair market value of the securities received. Interest income is recognized on an accrual basis. Discount and premium, which are included in interest income on the Statement of Operations, are amortized or accreted daily.
    Custodian Fees. “Custodian fees and expenses” in the Statement of Operations may include interest expense incurred by the Fund on any cash overdrafts of its custodian account during the period. Such cash overdrafts may result from the effects of failed trades in portfolio securities and from cash outflows resulting from unanticipated shareholder redemption activity. The Fund pays interest to its custodian on such cash overdrafts, to the extent they are not offset by positive cash balances maintained by the Fund, at a rate equal to the Federal Funds Rate plus 0.50%. The “Reduction to custodian expenses” line item, if applicable, represents earnings on cash balances maintained by the Fund during the period. Such interest expense and other custodian fees may be paid with these earnings.
    Security Transactions. Security transactions are recorded on the trade date. Realized gains and losses on securities sold are determined on the basis of identified cost.
    Indemnifications. The Fund’s organizational documents provide current and former trustees and officers with a limited indemnification against liabilities arising in connection with the performance of their duties to the Fund. In the normal course of business, the Fund may also enter into contracts that provide general indemnifications. The Fund’s maximum exposure under these arrangements is unknown as this would be dependent on future claims that may be made against the Fund. The risk of material loss from such claims is considered remote.
    Other. The preparation of financial statements in conformity with accounting principles generally accepted in the United States of America requires management to make estimates and assumptions that affect the reported amounts of assets and liabilities and disclosure of contingent assets and liabilities at the date of the financial statements and the reported amounts of increases and decreases in net assets from operations during the reporting period. Actual results could differ from those estimates.

    2. Shares of Beneficial Interest
    The Fund has authorized an unlimited number of $0.001 par value shares of beneficial interest of each class. Transactions in shares of beneficial interest were as follows:
                                     
        Year Ended December 31, 2010     Year Ended December 31, 2009  
        Shares     Amount     Shares     Amount  
     
    Non-Service Shares
                                   
    Sold
        2,851,462     $ 52,574,153       2,817,732     $ 41,817,781  
    Dividends and/or distributions reinvested
        279,275       5,119,114       776,960       8,430,011  
    Redeemed
        (6,743,462 )     (124,635,015 )     (7,176,221 )     (107,097,468 )
         
    Net decrease
        (3,612,725 )   $ (66,941,748 )     (3,581,529 )   $ (56,849,676 )


    Service Shares
                                   
    Sold
        7,702,331     $ 136,115,255       8,552,121     $ 117,291,434  
    Dividends and/or distributions reinvested
        604,682       11,011,249       1,515,498       16,352,225  
    Redeemed
        (15,049,192 )     (282,962,434 )     (16,800,298 )     (253,778,577 )
         
    Net decrease
        (6,742,179 )   $ (135,835,930 )     (6,732,679 )   $ (120,134,918 )
         
    3. Purchases and Sales of Securities
    The aggregate cost of purchases and proceeds from sales of securities, other than short-term obligations and investments in IMMF, for the year ended December 31, 2010, were as follows:
                     
        Purchases     Sales  
     
    Investment securities
      $ 729,725,493     $ 941,031,383  
    4. Fees and Other Transactions with Affiliates
    Management Fees. Under the investment advisory agreement, the Fund pays the Manager a management fee based on the daily net assets of the Fund at an annual rate as shown in the following table:
             
    Fee Schedule        
     
    Up to $200 million
        0.75 %
    Next $200 million
        0.72  
    Next $200 million
        0.69  
    Next $200 million
        0.66  
    Over $800 million
        0.60  
    Administration Service Fees. The Fund pays the Manager a fee of $1,500 per year for preparing and filing the Fund’s tax returns.
    Transfer Agent Fees. OppenheimerFunds Services (“OFS”), a division of the Manager, acts as the transfer and shareholder servicing agent for the Fund. The Fund pays OFS fees at an annual rate of 0.10% of the daily net assets of each class of shares. For the year ended December 31, 2010, the Fund paid $1,647,091 to OFS for services to the Fund.
    Distribution and Service Plan for Service Shares. The Fund has adopted a Distribution and Service Plan (the “Plan”) in accordance with Rule 12b-1 under the Investment Company Act of 1940 for Service shares to pay OppenheimerFunds Distributor, Inc. (the “Distributor”), for distribution related services, personal service and account maintenance for the Fund’s Service shares. Under the Plan, payments are made periodically at an annual rate of 0.25% of the daily net assets of Service shares of the Fund. The Distributor currently uses all of those fees to compensate sponsors of the insurance product that offers Fund shares, for providing personal service and maintenance of accounts of their variable contract owners that hold Service shares. These fees are paid out of the Fund’s assets on an on-going basis and increase operating expenses of the Service shares, which results in lower performance compared to the Fund’s shares that are not subject to a service fee. Fees incurred by the Fund under the Plan are detailed in the Statement of Operations.
    Waivers and Reimbursements of Expenses. The Manager has voluntarily agreed to limit the Fund’s total annual operating expenses so that those expenses, as percentages of daily net assets, will not exceed the annual rate of 0.80% for Non-Service shares and 1.05% for Service shares. During the year ended December 30, 2010, the Manager waived and/or reimbursed the Fund $2,971 and $7,176 for Non-Service and Service shares, respectively.
         The Manager will waive fees and/or reimburse Fund expenses in an amount equal to the indirect management fees incurred through the Fund’s investment in IMMF. During the year ended December 31, 2010, the Manager waived fees and/or reimbursed the Fund $15,394 for IMMF management fees.
         Some of these undertakings may be modified or terminated at any time; some may not be modified or terminated until after one year from the date of the current prospectus, as indicated therein.
    5. Pending Litigation
    Since 2009, a number of lawsuits have been pending in federal courts against the Manager, the Distributor, and certain mutual funds (“Defendant Funds”) advised by the Manager and distributed by the Distributor (but not including the Fund). The lawsuits naming the Defendant Funds also name as defendants certain officers and current and former trustees of the respective Defendant Funds. The plaintiffs seek class action status on behalf of purchasers of shares of the respective Defendant Fund during a particular time period. The lawsuits raise claims under federal securities laws alleging that, among other things, the disclosure documents of the respective Defendant Fund contained misrepresentations and omissions, that such Defendant Fund’s investment policies were not followed, and that such Defendant Fund and the other defendants violated federal securities laws and regulations. The plaintiffs seek unspecified damages, equitable relief and an award of attorneys’ fees and litigation expenses.
         In 2009, what are claimed to be derivative lawsuits were filed in state court against the Manager and a subsidiary (but not against the Fund), on behalf of the New Mexico Education Plan Trust. These lawsuits allege breach of contract, breach of fiduciary duty, negligence and violation of state securities laws, and seek compensatory damages, equitable relief and an award of attorneys’ fees and litigation expenses.
         Other lawsuits have been filed since 2008 in various state and federal courts, against the Manager and certain of its affiliates. Those lawsuits were filed by investors who made investments through an affiliate of the Manager, and relate to the alleged investment fraud perpetrated by Bernard Madoff and his firm (“Madoff ”). Those suits allege a variety of claims, including breach of fiduciary duty, fraud, negligent misrepresentation, unjust enrichment, and violation of federal and state securities laws and regulations, among others. They seek unspecified damages, equitable relief and an award of attorneys’ fees and litigation expenses. None of the suits have named the Distributor, any of the Oppenheimer mutual funds or any of their independent Trustees or Directors as defendants. None of the Oppenheimer funds invested in any funds or accounts managed by Madoff.
         The Manager believes that the lawsuits described above are without legal merit and is defending against them vigorously. The Defendant Funds’ Boards of Trustees have also engaged counsel to defend the suits brought against those Funds and the present and former Independent Trustees named in those suits. While it is premature to render any opinion as to the outcome in these lawsuits, or whether any costs that the Defendant Funds may bear in defending the suits might not be reimbursed by insurance, the Manager believes that these suits should not impair the ability of the Manager or the Distributor to perform their respective duties to the Fund, and that the outcome of all of the suits together should not have any material effect on the operations of any of the Oppenheimer funds. 

    6. Subsequent Event
    The Regulated Investment Company Modernization Act of 2010 (the “Act”) was signed into law on December 22, 2010. The Act makes changes to a number of tax rules impacting the Fund. Under the Act, future capital losses generated by a fund may be carried over indefinitely, but these losses must be used prior to the utilization of any pre-enactment capital losses. Since pre-enactment capital losses may only be carried forward for eight years, there may be a greater likelihood that all or a portion of a fund’s pre-enactment capital losses will expire unused. In general, the provisions of the Act will be effective for the Fund’s fiscal year ending December 31, 2011. Specific information regarding the impact of the Act on the Fund will be contained within the “Federal Taxes” section of the financial statement notes for the fiscal year ending December 31, 2011.


    REPORT OF INDEPENDENT REGISTERED PUBLIC ACCOUNTING FIRM
    The Board of Trustees and Shareholders of Oppenheimer Variable Account Funds:
    We have audited the accompanying statement of assets and liabilities of Oppenheimer Main Street Small Cap Fund/VA (one of the portfolios constituting the Oppenheimer Variable Account Funds), including the statement of investments, as of December 31, 2010, the related statement of operations for the year then ended, and the statements of changes in net assets and the financial highlights for each of the years in the two-year period then ended. These financial statements and financial highlights are the responsibility of the Fund’s management. Our responsibility is to express an opinion on these financial statements and financial highlights based on our audits. The accompanying financial highlights of Oppenheimer Main Street Small Cap Fund/VA for the years ended prior to January 1, 2009 were audited by other auditors whose report dated February 11, 2009 expressed an unqualified opinion on those financial highlights.
         We conducted our audits in accordance with the standards of the Public Company Accounting Oversight Board (United States). Those standards require that we plan and perform the audit to obtain reasonable assurance about whether the financial statements and financial highlights are free of material misstatement. An audit includes examining, on a test basis, evidence supporting the amounts and disclosures in the financial statements. Our procedures included confirmation of securities owned as of December 31, 2010, by correspondence with the custodian and transfer agent. An audit also includes assessing the accounting principles used and significant estimates made by management, as well as evaluating the overall financial statement presentation. We believe that our audits provide a reasonable basis for our opinion.
         In our opinion, the financial statements and financial highlights referred to above present fairly, in all material respects, the financial position of Oppenheimer Main Street Small Cap Fund/VA as of December 31, 2010, the results of its operations for the year then ended, and the changes in its net assets and the financial highlights for each of the years in the two-year period then ended, in conformity with U.S. generally accepted accounting principles.
    /s/ KPMG llp
    Denver, Colorado
    February 16, 2011


    STATEMENT OF INVESTMENTS December 31, 2010
                     
        Shares     Value  
     
    Common Stocks—97.3%
                   
    Consumer Discretionary—13.4%
                   
    Auto Components—0.9%
                   
    American Axle & Manufacturing Holdings, Inc.1
        61,550     $ 791,533  
    Cooper Tire & Rubber Co.
        75,740       1,785,949  
    Dana Holding Corp.1
        302,470       5,205,509  
    Federal-Mogul Corp.1
        15,830       326,890  
    Fuel Systems Solutions, Inc.1
        23,920       702,770  


                8,812,651  
     
                   
    Distributors—0.4%
                   
    Core-Mark Holding Co., Inc.1
        2,620       93,246  
    Pool Corp.
        165,170       3,722,932  


                3,816,178  
     
                   
    Diversified Consumer Services—1.5%
                   
    Bridgepoint Education, Inc.1
        28,190       535,610  
    Capella Education Co.1
        121,010       8,056,846  
    Career Education Corp.1
        87,440       1,812,631  
    CPI Corp.
        12,700       286,385  
    Hillenbrand, Inc.
        21,160       440,340  
    ITT Educational Services, Inc.1
        23,220       1,478,882  
    Lincoln Educational Services Corp.
        51,440       797,834  
    Pre-Paid Legal Services, Inc.1
        18,431       1,110,468  
    Sotheby’s
        320       14,400  


                14,533,396  
     
                   
    Hotels, Restaurants & Leisure—2.1%
                   
    AFC Enterprises, Inc.1
        35,172       488,891  
    Bally Technologies, Inc.1
        221,520       9,345,929  
    Bob Evans Farms, Inc.
        10,460       344,762  
    Brinker International, Inc.
        79,430       1,658,498  
    CEC Entertainment, Inc.1
        51,839       2,012,908  
    Cracker Barrel Old Country Store, Inc.
        79,010       4,327,378  
    Papa John’s International, Inc.1
        56,588       1,567,488  
    Ruby Tuesday, Inc.1
        2,030       26,512  
    Speedway Motorsports, Inc.
        34,599       530,057  


                20,302,423  
     
                   
    Household Durables—0.3%
                   
    American Greetings Corp., Cl. A
        61,530       1,363,505  
    CSS Industries, Inc.
        11,820       243,610  
    Helen of Troy Ltd.1
        21,700       645,358  
    Kid Brands, Inc.1
        42,230       361,067  


                2,613,540  
     
                   
    Internet & Catalog Retail—0.0%
                   
    NutriSystem, Inc.
        8,400       176,652  
    Leisure Equipment & Products—0.4%
                   
    Eastman Kodak Co.1
        38,770       207,807  
    JAKKS Pacific, Inc.1
        57,740       1,052,023  
    Polaris Industries, Inc.
        20,010       1,561,180  
    Sturm, Ruger & Co., Inc.
        81,600       1,247,664  


                4,068,674  
     
                   
    Media—1.9%
                   
    China MediaExpress Holdings, Inc.1
        46,010       728,798  
    Dex One Corp.1
        24,460       182,472  
    Gannett Co., Inc.
        120,920       1,824,683  
    Harte—Hanks, Inc.
        745       9,514  
    Imax Corp.1
        295,080       8,276,994  
    Journal Communications, Inc.1
        54,900       277,245  
    Lee Enterprises, Inc.1
        144,280       354,929  
    McClatchy Co., Cl. A1
        91,210       425,951  
    Meredith Corp.
        16,210       561,677  
    National CineMedia, Inc.
        980       19,512  
    Scholastic Corp.
        53,860       1,591,024  
    Sinclair Broadcast Group, Inc., Cl. A
        152,583       1,248,129  
    Valassis Communications, Inc.1
        46,560       1,506,216  
    Wiley (John) & Sons, Inc., Cl. A
        13,840       626,122  


                17,633,266  
     
                   
    Multiline Retail—0.5%
                   
    Big Lots, Inc.1
        51,927       1,581,696  
    Bon-Ton Stores, Inc.1
        2,210       27,979  
    Dillard’s, Inc., Cl. A
        61,340       2,327,240  
    Retail Ventures, Inc.1
        21,780       355,014  


                4,291,929  
     
                   
    Specialty Retail—3.4%
                   
    Aeropostale, Inc.1
        64,725       1,594,824  
    AnnTaylor Stores Corp.1
        8,520       233,363  
    Books-A-Million, Inc.
        24,410       141,578  
    Cato Corp., Cl. A
        75,964       2,082,173  
    Children’s Place Retail Stores, Inc.1
        162,680       8,075,435  
    Collective Brands, Inc.1
        18,150       382,965  
    Dress Barn, Inc. (The)1
        5,350       141,347  
    DSW, Inc., Cl. A1
        42,150       1,648,065  
    Express, Inc.
        36,000       676,800  
    Finish Line, Inc. (The), Cl. A
        95,260       1,637,519  
    Jos. A. Banks Clothiers, Inc.1
        28,735       1,158,595  
    Kirkland’s, Inc.1
        97,513       1,368,107  
    Men’s Wearhouse, Inc. (The)
        17,970       448,891  

                     
        Shares     Value  
     
    Specialty Retail Continued
                   
    Rent-A-Center, Inc.
        68,830     $ 2,221,832  
    Select Comfort Corp.1
        75,260       687,124  
    Signet Jewelers Ltd.1
        48,750       2,115,750  
    Stage Stores, Inc.
        22,569       391,346  
    Tractor Supply Co.
        161,750       7,843,258  


                32,848,972  
     
                   
    Textiles, Apparel & Luxury Goods—2.0%
                   
    Carter’s, Inc.1
        460       13,575  
    Deckers Outdoor Corp.1
        11,830       943,324  
    Fossil, Inc.1
        77,697       5,476,085  
    Perry Ellis International, Inc.1
        35,299       969,664  
    Phillips/Van Heusen Corp.
        112,660       7,098,707  
    Timberland Co., Cl. A1
        81,215       1,997,077  
    True Religion Apparel, Inc.1
        20,980       467,015  
    Warnaco Group, Inc. (The)1
        32,370       1,782,616  


                18,748,063  
     
                   
    Consumer Staples—2.1%
                   
    Beverages—0.2%
                   
    Cott Corp.1
        177,900       1,602,879  
    Food & Staples Retailing—0.1%
                   
    Nash Finch Co.
        21,730       923,742  
    Spartan Stores, Inc.
        530       8,984  
    Weis Markets, Inc.
        2,960       119,377  


                1,052,103  
     
                   
    Food Products—1.2%
                   
    B&G Foods, Inc., Cl. A
        10,930       150,069  
    Cal-Maine Foods, Inc.
        33,260       1,050,351  
    Corn Products International, Inc.
        39,380       1,811,480  
    Flowers Foods, Inc.
        6,930       186,486  
    Fresh Del Monte Produce, Inc.
        21,068       525,647  
    Overhill Farms, Inc.1
        39,140       226,229  
    TreeHouse Foods, Inc.1
        150,896       7,709,277  


                11,659,539  
     
                   
    Household Products—0.2%
                   
    Central Garden & Pet Co., Cl. A1
        147,304       1,455,364  
    Personal Products—0.4%
                   
    China Sky One Medical, Inc.1
        18,100       126,157  
    Herbalife Ltd.
        28,770       1,967,005  
    Inter Parfums, Inc.
        10,030       189,066  
    Nu Skin Asia Pacific, Inc., Cl. A
        13,670       413,654  
    Prestige Brands Holdings, Inc.1
        102,300       1,222,485  


                3,918,367  
     
                   
    Energy—5.4%
                   
    Energy Equipment & Services—1.5%
                   
    Acergy SA, Sponsored ADR
        95,963       2,335,739  
    Atwood Oceanics, Inc.1
        42,930       1,604,294  
    Bolt Technology Corp.1
        22,510       296,457  
    Cal Dive International, Inc.1
        78,710       446,286  
    Compagnie Generale de Geophysique-Veritas, Sponsored ADR1
        29,660       907,299  
    Complete Production Services, Inc.1
        50,390       1,489,025  
    Hornbeck Offshore Services, Inc.1
        7,840       163,699  
    North American Energy Partners, Inc.1
        1,420       17,409  
    Oil States International, Inc.1
        36,440       2,335,440  
    Precision Drilling Corp.1
        145,820       1,412,996  
    Seacor Holdings, Inc.
        10,620       1,073,576  
    Superior Energy Services, Inc.1
        45,610       1,595,894  
    Tetra Technologies, Inc.1
        57,190       678,845  
    TGC Industries, Inc.1
        54,530       207,214  


                14,564,173  
     
                   
    Oil, Gas & Consumable Fuels—3.9%
                   
    Bill Barrett Corp.1
        40,540       1,667,410  
    Callon Petroleum Co.1
        67,740       401,021  
    Cloud Peak Energy, Inc.1
        84,210       1,956,198  
    Contango Oil & Gas Co.1
        10,980       636,071  
    CVR Energy, Inc.1
        60,654       920,728  
    Dominion Resources Black Warrior Trust
        16,510       255,080  
    Gran Tierra Energy, Inc.1
        124,730       1,004,077  
    Green Plains Renewable Energy, Inc.1
        6,470       72,852  
    Holly Corp.
        335,440       13,675,889  
    James River Coal Co.1
        36,700       929,611  
    MarkWest Energy Partners LP
        135,078       5,850,228  
    PAA Natural Gas Storage LP
        115,900       2,890,546  
    Pengrowth Energy Trust
        132,480       1,703,693  
    Petrobras Argentina SA, ADR
        13,540       357,185  
    PetroQuest Energy, Inc.1
        95,510       719,190  
    PrimeEnergy Corp.1
        6,384       123,786  
    Stone Energy Corp.1
        76,330       1,701,396  
    Teekay Offshore Partners LP
        28,840       800,310  
    VAALCO Energy, Inc.1
        68,890       493,252  
    W&T Offshore, Inc.
        51,380       918,161  


                37,076,684  
     
                   
    Financials—20.8%
                   
    Capital Markets—1.8%
                   
    American Capital Ltd.1
        28,100       212,436  
    Calamos Asset Management, Inc., Cl. A
        19,920       278,880  

                     
        Shares     Value  
     
    Capital Markets Continued
                   
    Federated Investors, Inc., Cl. B
        49,430     $ 1,293,583  
    Gladstone Investment Corp.
        50,130       383,495  
    Investment Technology Group, Inc.1
        300       4,911  
    Janus Capital Group, Inc.
        103,430       1,341,487  
    Knight Capital Group, Inc., Cl. A1
        138,886       1,915,238  
    MF Global Holdings Ltd.1
        558,794       4,671,518  
    Oppenheimer Holdings, Inc., Cl. A, Non-Vtg.
        2,920       76,533  
    optionsXpress Holdings, Inc.
        148,190       2,322,137  
    Rodman & Renshaw Capital Group, Inc.1
        43,600       116,848  
    Solar Capital Ltd.
        20,660       511,955  
    Stifel Financial Corp.1
        51,460       3,192,578  
    Triangle Capital Corp.
        14,430       274,170  
    Waddell & Reed Financial, Inc., Cl. A
        13,740       484,885  


                17,080,654  
     
                   
    Commercial Banks—2.2%
                   
    Alliance Financial Corp.
        7,080       229,038  
    Banco Latinoamericano de Exportaciones SA, Cl. E
        42,780       789,719  
    Banco Macro SA, ADR
        35,245       1,769,299  
    BBVA Banco Frances SA, ADR
        43,363       503,011  
    CapitalSource, Inc.
        226,640       1,609,144  
    Century Bancorp, Inc., Cl. A
        10,780       288,796  
    City Holding Co.
        9,680       350,706  
    First Midwest Bancorp, Inc.
        142,760       1,644,595  
    FirstMerit Corp.
        126,310       2,499,675  
    Grupo Financiero Galicia SA1
        290       4,440  
    IBERIABANK Corp.
        101,622       6,008,909  
    International Bancshares Corp.
        20,909       418,807  
    National Bankshares, Inc.
        8,237       259,383  
    Northrim BanCorp, Inc.
        15,070       291,152  
    Synovus Financial Corp.
        822,410       2,171,162  
    Westamerica Bancorporation
        46,720       2,591,558  


                21,429,394  
     
                   
    Consumer Finance—1.3%
                   
    Advance America Cash Advance Centers, Inc.
        178,500       1,006,740  
    Cash America International, Inc.
        54,987       2,030,670  
    Credit Acceptance Corp.1
        17,720       1,112,284  
    EZCORP, Inc., Cl. A1
        81,450       2,209,739  
    First Cash Financial Services, Inc.1
        67,402       2,088,788  
    Nelnet, Inc., Cl. A
        77,576       1,837,775  
    World Acceptance Corp.1
        36,018       1,901,750  


                12,187,746  
     
                   
    Diversified Financial Services—1.3%
                   
    Encore Capital Group, Inc.1
        40,700       954,415  
    Life Partners Holdings, Inc.
        58,747       1,123,830  
    MSCI, Inc., Cl. A1
        275,740       10,742,830  


                12,821,075  
     
                   
    Insurance—5.8%
                   
    Allied World Assurance Holdings Ltd.
        27,841       1,654,869  
    American Equity Investment Life Holding Co.
        117,950       1,480,273  
    American Safety Insurance Holdings Ltd.1
        15,930       340,583  
    Amerisafe, Inc.1
        43,408       759,640  
    AmTrust Financial Services, Inc.
        93,278       1,632,365  
    Arch Capital Group Ltd.1
        25,190       2,217,980  
    Argo Group International Holdings Ltd.
        36,110       1,352,320  
    Aspen Insurance Holdings Ltd.
        57,090       1,633,916  
    Berkley (W.R.) Corp.
        83,810       2,294,718  
    Brown & Brown, Inc.
        100,760       2,412,194  
    Delphi Financial Group, Inc., Cl. A
        10,290       296,764  
    EMC Insurance Group, Inc.
        11,130       251,983  
    Endurance Specialty Holdings Ltd.
        47,350       2,181,415  
    Enstar Group Ltd.1
        10,950       926,151  
    FBL Financial Group, Inc., Cl. A
        37,810       1,084,013  
    First American Financial Corp.
        15,780       235,753  
    Flagstone Reinsurance Holdings SA
        84,540       1,065,204  
    FPIC Insurance Group, Inc.1
        35,080       1,296,557  
    Hanover Insurance Group, Inc.
        33,660       1,572,595  
    Harleysville Group, Inc.
        20,410       749,863  
    Horace Mann Educators Corp.
        65,849       1,187,916  
    Infinity Property & Casualty Corp.
        38,714       2,392,525  
    Maiden Holdings Ltd.
        46,030       361,796  
    MBIA, Inc.1
        20,990       251,670  
    Meadowbrook Insurance Group, Inc.
        89,200       914,300  
    Mercury General Corp.
        35,720       1,536,317  
    Montpelier Re Holdings Ltd.
        88,180       1,758,309  
    National Financial Partners Corp.1
        40,990       549,266  
    National Interstate Corp.
        9,690       207,366  
    National Western Life Insurance Co., Cl. A
        2,630       438,474  
    Navigators Group, Inc. (The)1
        13,300       669,655  
    OneBeacon Insurance Group Ltd.
        51,490       780,588  
    Platinum Underwriters Holdings Ltd.
        45,740       2,056,928  
    Primerica, Inc.
        37,320       905,010  
    ProAssurance Corp.1
        33,122       2,007,193  
    Protective Life Corp.
        66,960       1,783,814  
    RLI Corp.
        6,960       365,887  

                     
        Shares     Value  
     
    Insurance Continued
                   
    Safety Insurance Group, Inc.
        41,049     $ 1,952,701  
    Selective Insurance Group, Inc.
        29,740       539,781  
    StanCorp Financial Group, Inc.
        36,662       1,654,923  
    Symetra Financial Corp.
        94,120       1,289,444  
    Torchmark Corp.
        52,110       3,113,051  
    Unitrin, Inc.
        65,970       1,618,904  
    Validus Holdings Ltd.
        52,962       1,621,167  


                55,396,141  
     
                   
    Real Estate Investment Trusts—6.4%
                   
    Associated Estates Realty Corp.
        22,170       338,979  
    Brandywine Realty Trust
        269,230       3,136,530  
    BRE Properties, Inc., Cl. A
        35,980       1,565,130  
    CBL & Associates Properties, Inc.
        108,210       1,893,675  
    Chatham Lodging Trust
        59,950       1,034,138  
    Colonial Properties Trust
        12,350       222,918  
    Digital Realty Trust, Inc.
        196,640       10,134,826  
    Entertainment Properties Trust
        11,020       509,675  
    Essex Property Trust, Inc.
        14,190       1,620,782  
    Extra Space Storage, Inc.
        83,310       1,449,594  
    Getty Realty Corp.
        4,440       138,883  
    Hatteras Financial Corp.
        194,690       5,893,266  
    Home Properties of New York, Inc.
        29,070       1,613,094  
    LaSalle Hotel Properties
        190,110       5,018,904  
    Mid-America Apartment Communities, Inc.
        116,369       7,388,268  
    Pebblebrook Hotel Trust
        25,870       525,678  
    PS Business Parks, Inc.
        17,820       992,930  
    Sabra Health Care REIT, Inc.
        14,473       266,303  
    Saul Centers, Inc.
        200       9,470  
    Sovran Self Storage, Inc.
        570       20,982  
    Starwood Property Trust, Inc.
        229,630       4,932,452  
    Strategic Hotels & Resorts, Inc.1
        475,940       2,517,723  
    Tanger Factory Outlet Centers, Inc.
        138,970       7,113,874  
    Taubman Centers, Inc.
        32,640       1,647,667  
    U-Store-It Real Estate Investment Trust
        106,660       1,016,470  
    Urstadt Biddle Properties, Inc., Cl. A
        5,090       99,001  


                61,101,212  
     
                   
    Real Estate Management & Development—0.3%
                   
    Campus Crest Communities, Inc.
        179,420       2,515,468  
    Thrifts & Mortgage Finance—1.7%
                   
    BofI Holding, Inc.1
        15,070       233,736  
    Federal Agricultural Mortgage Corp., Non-Vtg.
        1,470       23,990  
    First Defiance Financial Corp.1
        30,150       358,785  
    First Niagara Financial Group, Inc.
        372,310       5,204,894  
    MGIC Investment Corp.1
        538,510       5,487,417  
    People’s United Financial, Inc.
        219,300       3,072,393  
    Radian Group, Inc.
        185,790       1,499,325  
    Viewpoint Financial Group
        17,150       200,484  


                16,081,024  
     
                   
    Health Care—11.3%
                   
    Biotechnology—0.5%
                   
    Cubist Pharmaceuticals, Inc.1
        68,310       1,461,834  
    Human Genome Sciences, Inc.1
        58,940       1,408,077  
    Indevus Pharmaceuticals, Inc.1
        2,500       25  
    Myriad Genetics, Inc.1
        17,820       407,009  
    PDL BioPharma, Inc.
        225,762       1,406,497  
    Targacept, Inc.1
        2,150       56,975  


                4,740,417  
     
                   
    Health Care Equipment & Supplies—3.1%
                   
    Atrion Corp.
        4,218       756,962  
    China Medical Technologies, Inc., Sponsored ADR1
        32,200       361,928  
    Cooper Cos., Inc. (The)
        20,490       1,154,407  
    Cyberonics, Inc.1
        1,370       42,497  
    Dexcom, Inc.1
        182,740       2,494,401  
    Greatbatch, Inc.1
        164,690       3,977,264  
    Haemonetics Corp.1
        4,860       307,055  
    Hill-Rom Holdings, Inc.
        17,977       707,754  
    ICU Medical, Inc.1
        9,420       343,830  
    Immucor, Inc.1
        1,170       23,201  
    Integra LifeSciences Holdings1
        99,170       4,690,741  
    Invacare Corp.
        60,311       1,818,980  
    Kensey Nash Corp.1
        34,758       967,315  
    Kinetic Concepts, Inc.1
        40,524       1,697,145  
    Orthofix International NV1
        81,060       2,350,740  
    Sirona Dental Systems, Inc.1
        37,850       1,581,373  
    Steris Corp.
        43,360       1,580,906  
    Teleflex, Inc.
        4,200       226,002  
    Utah Medical Products, Inc.
        8,370       223,228  
    Volcano Corp.1
        143,260       3,912,431  
    Young Innovations, Inc.
        9,350       299,294  


                29,517,454  
     
                   
    Health Care Providers & Services—3.9%
                   
    Air Methods Corp.1
        3,920       220,578  
    Allied Healthcare International, Inc.1
        83,460       209,485  
    Almost Family, Inc.1
        20,210       776,468  

                     
        Shares     Value  
     
    Health Care Providers & Services Continued
                   
    Amedisys, Inc.1
        29,250     $ 979,875  
    AMERIGROUP Corp.1
        36,420       1,599,566  
    AmSurg Corp.1
        78,610       1,646,880  
    Chemed Corp.
        25,110       1,594,736  
    Continucare Corp.1
        79,680       372,902  
    CorVel Corp.1
        5,500       265,925  
    Emergency Medical Services LP, Cl. A1
        11,260       727,509  
    Ensign Group, Inc. (The)
        22,250       553,358  
    Gentiva Health Services, Inc.1
        46,546       1,238,124  
    Health Management Associates, Inc., Cl. A1
        808,980       7,717,669  
    HEALTHSOUTH Corp.1
        2,450       50,740  
    Healthspring, Inc.1
        72,938       1,935,045  
    Healthways, Inc.1
        9,620       107,359  
    HMS Holdings Corp.1
        65,490       4,241,787  
    Kindred Healthcare, Inc.1
        22,340       410,386  
    LHC Group, Inc.1
        53,190       1,595,700  
    LifePoint Hospitals, Inc.1
        44,521       1,636,147  
    Lincare Holdings, Inc.
        59,236       1,589,302  
    Magellan Health Services, Inc.1
        42,420       2,005,618  
    MEDNAX, Inc.1
        13,380       900,340  
    Metropolitan Health Networks, Inc.1
        113,320       506,540  
    NovaMed, Inc.1
        18,630       214,804  
    Owens & Minor, Inc.
        5,730       168,634  
    PharMerica Corp.1
        19,160       219,382  
    Providence Service Corp.1
        13,620       218,873  
    PSS World Medical, Inc.1
        8,570       193,682  
    Triple-S Management Corp., Cl. B1
        40,327       769,439  
    U.S. Physical Therapy, Inc.1
        33,605       666,051  
    Universal American Corp.
        65,130       1,331,909  
    Universal Health Services, Inc., Cl. B
        392       17,021  


                36,681,834  
     
                   
    Health Care Technology—0.9%
                   
    Allscripts Healthcare Solutions, Inc.1
        258,096       4,973,510  
    SXC Health Solutions Corp.1
        81,990       3,514,091  


                8,487,601  


    Life Sciences Tools & Services—0.3%
                   
    Bio-Rad Laboratories, Inc., Cl. A1
        2,710       281,434  
    Bruker Corp.1
        65,520       1,087,632  
    Cambrex Corp.1
        89,970       465,145  
    eResearch Technology, Inc.1
        48,910       359,489  
    Harvard Bioscience, Inc.1
        65,210       266,709  
    ICON plc, Sponsored ADR1
        31,830       697,077  


                3,157,486  
     
                   
    Pharmaceuticals—2.6%
                   
    Endo Pharmaceuticals Holdings, Inc.1
        54,072       1,930,911  
    Hi-Tech Pharmacal Co., Inc.1
        25,280       630,736  
    Impax Laboratories, Inc.1
        71,090       1,429,620  
    Medicis Pharmaceutical Corp., Cl. A
        57,576       1,542,461  
    Par Pharmaceutical Cos., Inc.1
        44,970       1,731,795  
    Perrigo Co.
        96,940       6,139,210  
    Questcor Pharmaceuticals, Inc.1
        143,318       2,111,074  
    Salix Pharmaceuticals Ltd.1
        161,710       7,593,902  
    Valeant Pharmaceuticals International, Inc.
        20,620       583,340  
    ViroPharma, Inc.1
        81,930       1,419,028  


                25,112,077  
     
                   
    Industrials—15.8%
                   
    Aerospace & Defense—2.0%
                   
    BE Aerospace, Inc.1
        206,178       7,634,771  
    Ceradyne, Inc.1
        66,470       2,095,799  
    Cubic Corp.
        34,370       1,620,546  
    Ducommun, Inc.
        15,720       342,382  
    Esterline Technologies Corp.1
        850       58,302  
    Gencorp, Inc.1
        190,600       985,402  
    LMI Aerospace, Inc.1
        4,770       76,272  
    National Presto Industries, Inc.
        15,191       1,974,982  
    Spirit Aerosystems Holdings, Inc., Cl. A1
        162,060       3,372,469  
    Teledyne Technologies, Inc.1
        10,890       478,833  


                18,639,758  
     
                   
    Air Freight & Logistics—0.8%
                   
    Atlas Air Worldwide Holdings, Inc.1
        29,400       1,641,402  
    Hub Group, Inc., Cl. A1
        176,000       6,184,640  


                7,826,042  
                     
    Airlines—1.0%
                   
    Alaska Air Group, Inc.1 
        32,180       1,824,284  
    Copa Holdings SA, Cl. A
        5,540       325,974  
    Hawaiian Holdings, Inc.1
        199,818       1,566,573  
    JetBlue Airways Corp.1
        246,420       1,628,836  
    Pinnacle Airlines Corp.1
        34,120       269,548  
    Republic Airways Holdings, Inc.1
        119,350       873,642  
    United Continental Holdings, Inc.1
        68,060       1,621,189  
    US Airways Group, Inc.1
        119,370       1,194,894  


                9,304,940  
     
                   
    Building Products—0.1%
                   
    Quanex Building Products Corp.
        20,490       388,695  
    Smith (A.O.) Corp.
        22,015       838,331  


                1,227,026  
     
                     
        Shares     Value  
     
    Commercial Services & Supplies—1.6%
                   
    APAC Teleservices, Inc.1
        31,260     $ 189,748  
    Brink’s Co. (The)
        31,530       847,526  
    Consolidated Graphics, Inc.1
        31,090       1,505,689  
    Deluxe Corp.
        98,936       2,277,507  
    Ennis, Inc.
        45,910       785,061  
    G&K Services, Inc., Cl. A
        20,480       633,037  
    M&F Worldwide Corp.1
        28,072       648,463  
    R.R. Donnelley & Sons Co.
        80,010       1,397,775  
    Team, Inc.1
        15,110       365,662  
    UniFirst Corp.
        22,134       1,218,477  
    Waste Connections, Inc.
        205,305       5,652,047  


                15,520,992  
     
                   
    Construction & Engineering—1.4%
                   
    Aecom Technology Corp.1
        132,549       3,707,396  
    Baker (Michael) Corp.1
        24,133       750,536  
    Chicago Bridge & Iron Co. NV1
        60,540       1,991,766  
    Great Lakes Dredge & Dock Co.
        156,190       1,151,120  
    KBR, Inc.
        50,850       1,549,400  
    MasTec, Inc.1
        32,320       471,549  
    Sterling Construction Co., Inc.1
        27,750       361,860  
    Tutor Perini Corp.
        165,573       3,544,918  


                13,528,545  
     
                   
    Electrical Equipment—1.7%
                   
    Advanced Battery Technologies, Inc.1
        23,770       91,515  
    AZZ, Inc.
        25,850       1,034,259  
    Brady Corp., Cl. A
        16,770       546,870  
    Franklin Electric Co., Inc.
        5,820       226,514  
    Fushi Copperweld, Inc.1
        20,480       181,862  
    Generac Holdings, Inc.1
        178,290       2,882,949  
    Hubbell, Inc., Cl. B
        29,630       1,781,652  
    Lihua International, Inc.1
        41,910       471,068  
    Powell Industries, Inc.1
        45,950       1,510,836  
    Regal-Beloit Corp.
        78,410       5,234,652  
    Thomas & Betts Corp.1
        44,749       2,161,377  


                16,123,554  
     
                   
    Industrial Conglomerates—0.2%
                   
    Seaboard Corp.
        440       876,040  
    Tredegar Corp.
        54,094       1,048,342  


                1,924,382  
     
                   
    Machinery—3.4%
                   
    Alamo Group, Inc.
        12,750       354,705  
    Blount International, Inc.1
        10,540       166,110  
    Briggs & Stratton Corp.
        65,510       1,289,892  
    China Yuchai International Ltd.
        45,490       1,441,578  
    Crane Co.
        11,110       456,288  
    Duoyuan Global Water, Inc., ADR1
        23,230       296,647  
    Duoyuan Printing, Inc.1
        77,210       226,225  
    EnPro Industries, Inc.1
        97,763       4,063,030  
    Freightcar America, Inc.
        74,440       2,154,294  
    Gardner Denver, Inc.
        83,936       5,776,476  
    L.B. Foster Co., Cl. A1
        1,590       65,095  
    NACCO Industries, Inc., Cl. A
        3,695       400,427  
    Oshkosh Corp.1
        53,770       1,894,855  
    Robbins & Myers, Inc.
        24,590       879,830  
    Sauer-Danfoss, Inc.1
        8,910       251,708  
    Terex Corp.1
        98,820       3,067,373  
    Timken Co.
        44,100       2,104,893  
    Toro Co. (The)
        36,770       2,266,503  
    TriMas Corp.1
        3,900       79,794  
    Twin Disc, Inc.
        1,410       42,103  
    Valmont Industries, Inc.
        180       15,971  
    Wabtec Corp.
        90,170       4,769,091  
    Watts Water Technologies, Inc., Cl. A
        4,330       158,435  


                32,221,323  
     
                   
    Marine—0.3%
                   
    Diana Shipping, Inc.1
        99,720       1,198,634  
    Excel Maritime Carriers Ltd.1
        123,180       693,503  
    Safe Bulkers, Inc.
        118,040       1,045,834  


                2,937,971  
     
                   
    Professional Services—1.4%
                   
    CBIZ, Inc.1
        170,700       1,065,168  
    Dolan Co. (The)1
        91,910       1,279,387  
    FTI Consulting, Inc.1
        15,670       584,178  
    GP Strategies Corp.1
        32,050       328,192  
    Korn-Ferry International1
        124,790       2,883,897  
    Navigant Consulting, Inc.1
        8,560       78,752  
    Robert Half International, Inc.
        238,490       7,297,794  


                13,517,368  
     
                   
    Road & Rail—1.6%
                   
    Amerco1
        16,640       1,598,106  
    Avis Budget Group, Inc.1
        1,080       16,805  
    Genesee & Wyoming, Inc., Cl. A1
        63,471       3,360,789  
    Guangshen Railway Co. Ltd., Sponsored ADR
        2,020       39,491  
    Heartland Express, Inc.
        21,700       347,634  
    Old Dominion Freight Line, Inc.1
        292,570       9,359,314  


                14,722,139  

                     
        Shares     Value  
     
    Trading Companies & Distributors—0.3%
                   
    Aircastle Ltd.
        73,190     $ 764,836  
    Applied Industrial Technologies, Inc.
        51,480       1,672,070  
    DXP Enterprises, Inc.1
        14,327       343,848  
    Fly Leasing Ltd., ADR
        20,920       285,767  


                3,066,521  
     
                   
    Information Technology—19.6%
                   
    Communications Equipment—2.3%
                   
    Arris Group, Inc.1
        142,340       1,597,055  
    Black Box Corp.
        24,145       924,512  
    Blue Coat Systems, Inc.1
        392,988       11,738,552  
    Comtech Telecommunications Corp.
        33,190       920,359  
    InterDigital, Inc.1
        50,780       2,114,479  
    Ituran Location & Control Ltd.
        18,131       316,205  
    Plantronics, Inc.
        49,994       1,860,777  
    Polycom, Inc.1
        60,650       2,364,137  


                21,836,076  
     
                   
    Computers & Peripherals—0.9%
                   
    China Digital TV Holding Co. Ltd., ADR
        39,250       278,283  
    QLogic Corp.1
        72,210       1,229,014  
    Rimage Corp.1
        13,880       206,951  
    STEC, Inc.1
        580       10,237  
    Synaptics, Inc.1
        65,800       1,933,204  
    Western Digital Corp.1
        134,640       4,564,296  


                8,221,985  
    Electronic Equipment & Instruments—1.6%
                   
    Anixter International, Inc.
        28,040       1,674,829  
    AVX Corp.
        109,270       1,686,036  
    Brightpoint, Inc.1
        23,200       202,536  
    Celestica, Inc.1
        40,090       388,873  
    Coherent, Inc.1
        19,880       897,383  
    Dolby Laboratories, Inc., Cl. A1
        61,457       4,099,182  
    Insight Enterprises, Inc.1
        91,966       1,210,273  
    KEMET Corp.1
        46,880       683,510  
    Littlefuse, Inc.
        950       44,707  
    MTS Systems Corp.
        320       11,987  
    Multi-Fineline Electronix, Inc.1
        50,632       1,341,242  
    Newport Corp.1
        5,190       90,150  
    Park Electrochemical Corp.
        830       24,900  
    Power-One, Inc.1
        57,960       591,192  
    Spectrum Control, Inc.1
        29,910       448,351  
    Vishay Intertechnology, Inc.1
        131,960       1,937,173  


                15,332,324  
     
                   
    Internet Software & Services—1.7%
                   
    AOL, Inc.1
        64,030       1,518,151  
    EarthLink, Inc.
        214,238       1,842,447  
    j2 Global Communications, Inc.1
        240,155       6,952,487  
    Open Text Corp.1
        23,520       1,083,331  
    Saba Software, Inc.1
        20,520       125,582  
    Sohu.com, Inc.1
        27,420       1,740,896  
    United Online, Inc.
        187,092       1,234,807  
    ValueClick, Inc.1
        128,250       2,055,848  
    Web.com Group, Inc.1
        8,800       74,360  


                16,627,909  
     
                   
    IT Services—3.0%
                   
    Acxiom Corp.1
        92,730       1,590,320  
    Broadridge Financial Solutions, Inc.
        79,458       1,742,514  
    CACI International, Inc., Cl. A1
        101,150       5,401,410  
    Cass Information Systems, Inc.
        2,570       97,506  
    Convergys Corp.1
        87,987       1,158,789  
    CSG Systems International, Inc.1
        79,831       1,511,999  
    DST Systems, Inc.
        35,994       1,596,334  
    Euronet Worldwide, Inc.1
        6,730       117,371  
    Forrester Research, Inc.
        1,750       61,758  
    Global Cash Access, Inc.1
        156,125       498,039  
    Henry (Jack) & Associates, Inc.
        4,770       139,046  
    ManTech International Corp.1
        10,700       442,231  
    Maximus, Inc.
        24,110       1,581,134  
    NeuStar, Inc., Cl. A1
        338,888       8,828,032  
    Patni Computer Systems Ltd., ADR
        54,670       1,169,391  
    Satyam Computer Services Ltd., ADR1
        890       2,599  
    Syntel, Inc.
        3,350       160,097  
    TeleTech Holdings, Inc.1
        109,396       2,252,464  
    Unisys Corp.1
        18,650       482,849  


                28,833,883  
    Office Electronics—0.0%
                   
    Zebra Technologies Corp., Cl. A1
        11,550       438,785  
    Semiconductors & Semiconductor Equipment—5.5%
                   
    Amkor Technology, Inc.1
        101,360       749,050  
    ASM International NV1
        10,300       360,706  
    Atheros Communications, Inc.1
        172,060       6,180,395  
    ATMI, Inc.1
        20,030       399,398  
    Cabot Microelectronics Corp.1
        24,650       1,021,743  
    China Sunergy Co. Ltd., ADR1
        188,620       788,432  
    Cypress Semiconductor Corp.1
        11,260       209,211  
    Entegris, Inc.1
        30,680       229,180  
    Fairchild Semiconductor International, Inc., Cl. A1
        147,940       2,309,343  
     
                     
        Shares     Value  
     
    Semiconductors & Semiconductor Equipment Continued
                   
    GT Solar International, Inc.1
        215,840     $ 1,968,461  
    Himax Technologies, Inc., ADR
        209,760       495,034  
    Integrated Device Technology, Inc.1
        2,250       14,985  
    JA Solar Holdings Co. Ltd., ADS1
        181,380       1,255,150  
    Kulicke & Soffa Industries, Inc.1
        83,620       602,064  
    Lattice Semiconductor Corp.1
        203,320       1,232,119  
    Micrel, Inc.
        108,507       1,409,506  
    Microsemi Corp.1
        900       20,610  
    Netlogic Microsystems, Inc.1
        186,290       5,851,369  
    ON Semiconductor Corp.1
        44,000       434,720  
    Photronics, Inc.1
        35,760       211,342  
    PMC-Sierra, Inc.1
        70,990       609,804  
    RF Micro Devices, Inc.1
        269,360       1,979,796  
    Semtech Corp.1
        275,959       6,247,712  
    Skyworks Solutions, Inc.1
        214,610       6,144,284  
    Solarfun Power Holdings Co. Ltd., Sponsored ADR1
        87,350       713,650  
    Spansion, Inc., Cl. A1
        6,920       143,244  
    Standard Microsystems Corp.1
        4,470       128,870  
    Teradyne, Inc.1
        136,270       1,913,231  
    Tessera Technologies, Inc.1
        45,549       1,008,910  
    Varian Semiconductor Equipment Associates, Inc.1
        163,279       6,036,425  
    Veeco Instruments, Inc.1
        41,210       1,770,382  


                52,439,126  
     
                   
    Software—4.6%
                   
    Actuate Corp.1
        128,940       734,958  
    Blackboard, Inc.1
        82,060       3,389,078  
    Changyou.com Ltd., ADR1
        45,590       1,299,771  
    Check Point Software Technologies Ltd.1
        154,074       7,127,463  
    Compuware Corp.1
        185,758       2,167,796  
    Concur Technologies, Inc.1
        56,300       2,923,659  
    FactSet Research Systems, Inc.
        81,652       7,655,692  
    Fair Isaac Corp.
        70,821       1,655,087  
    Giant Interactive Group, Inc., ADR
        76,210       542,615  
    Lawson Software, Inc.1
        51,760       478,780  
    Manhattan Associates, Inc.1
        63,855       1,950,132  
    MicroStrategy, Inc., Cl. A1
        14,216       1,215,042  
    Monotype Imaging Holdings, Inc.1
        30,030       333,333  
    Net 1 UEPS Technologies, Inc.1
        112,530       1,379,618  
    NetScout Systems, Inc.1
        740       17,027  
    Perfect World Co. Ltd.1
        41,920       991,408  
    Pervasive Software, Inc.1
        43,660       225,286  
    Quest Software, Inc.1
        83,310       2,311,019  
    Shanda Games Ltd., Sponsored ADR1
        197,100       1,269,324  
    TIBCO Software, Inc.1
        283,116       5,580,216  
    Websense, Inc.1
        22,060       446,715  


                43,694,019  
     
                   
    Materials—5.1%
                   
    Chemicals—1.9%
                   
    Arch Chemicals, Inc.
        7,210       273,475  
    Contango ORE, Inc.1
        1,098       11,529  
    Cytec Industries, Inc.
        128,511       6,818,794  
    Hawkins, Inc.
        27,000       1,198,800  
    Innophos Holdings, Inc.
        58,370       2,105,990  
    Innospec, Inc.1
        16,760       341,904  
    KMG Chemicals, Inc.
        19,380       321,127  
    Koppers Holdings, Inc.
        15,056       538,704  
    Minerals Technologies, Inc.
        27,464       1,796,420  
    NewMarket Corp.
        9,340       1,152,276  
    OM Group, Inc.1
        26,210       1,009,347  
    Solutia, Inc.1
        20,930       483,064  
    Stepan Co.
        8,980       684,905  
    W.R. Grace & Co.1
        51,690       1,815,870  
    Westlake Chemical Corp.
        3,140       136,496  


                18,688,701  
     
                   
    Construction Materials—0.6%
                   
    Eagle Materials, Inc.
        204,250       5,770,063  
    Containers & Packaging—1.1%
                   
    Boise, Inc.
        150,010       1,189,579  
    Packaging Corp. of America
        287,110       7,418,922  
    Rock-Tenn Co., Cl. A
        29,379       1,584,997  
    Silgan Holdings, Inc.
        2,740       98,119  


                10,291,617  
     
                   
    Metals & Mining—0.8%
                   
    Compass Minerals International, Inc.
        82,690       7,381,736  
    Gulf Resources, Inc.1
        16,250       173,713  
    Redcorp Ventures Ltd., Legend Shares1,2
        666,400       3,351  


                7,558,800  
     
                   
    Paper & Forest Products—0.7%
                   
    Buckeye Technologies, Inc.
        95,950       2,015,910  
    Clearwater Paper Corp.1
        16,330       1,278,639  
    Domtar Corp.
        22,050       1,674,036  
    Glatfelter
        75,380       924,913  
    KapStone Paper & Packing Corp.1
        62,410       954,873  


                6,848,371  


        Shares     Value  
     
    Telecommunication Services—0.6%
                   
    Diversified Telecommunication Services—0.2%
                   
    Cincinnati Bell, Inc.1
        263,752     $ 738,506  
    IDT Corp., Cl. B
        25,790       661,514  
    Neutral Tandem, Inc.1
        10,440       150,754  
    Nortel Inversora SA, Sponsored ADR1
        16,050       479,895  
    Telecom Corp. of New Zealand Ltd., Sponsored ADR
        47,360       397,824  


                2,428,493  
     
                   
    Wireless Telecommunication Services—0.4%
                   
    Cellcom Israel Ltd.
        42,590       1,392,267  
    NTELOS Holdings Corp.
        27,818       529,933  
    USA Mobility, Inc.
        91,762       1,630,611  


                3,552,811  
     
                   
    Utilities—3.2%
                   
    Electric Utilities—1.1%
                   
    Companhia Paranaense de Energia-Copel, Sponsored ADR
        78,851       1,984,680  
    El Paso Electric Co.1
        52,150       1,435,690  
    Empresa Distribuidora y Comercializadora Norte SA, ADR1
        32,790       448,567  
    UIL Holdings Corp.
        450       13,482  
    UniSource Energy Corp.
        28,970       1,038,285  
    Westar Energy, Inc.
        230,860       5,808,438  


                10,729,142  
    Energy Traders—1.0%
                   
    AES Corp. (The)1
        809,390       9,858,370  
    Gas Utilities—0.6%
                   
    Atmos Energy Corp.
        51,290       1,600,248  
    Chesapeake Utilities Corp.
        6,110       253,687  
    Nicor, Inc.
        290       14,477  
    Southwest Gas Corp.
        53,120       1,947,910  
    UGI Corp.
        46,380       1,464,680  


                5,281,002  
     
    Multi-Utilities—0.1%
                   
    Integrys Energy Group, Inc.
        23,110       1,121,066  
    Vectren Corp.
        5,410       137,306  


                1,258,372  
     
                   
    Water Utilities—0.4%
                   
    Aqua America, Inc.
        159,150       3,577,664  
     
                 
    Total Common Stocks (Cost $694,239,797)
                929,312,510  
     
                   
    Investment Companies—2.6%
                   
    Ares Capital Corp.
        429,060       7,070,909  
    BlackRock Kelso Capital Corp.
        119,670       1,323,550  
    Gladstone Capital Corp.
        81,658       940,700  
    Hercules Technology Growth Capital, Inc.
        18,977       196,602  
    JPMorgan U.S. Treasury Plus Money Market Fund, Agency Shares, 0.00%3,5
        133,735       133,735  
    MCG Capital Corp.
        98,070       683,548  
    Oppenheimer Institutional Money Market Fund, Cl. E, 0.21%3,4
        13,940,550       13,940,550  
    TICC Capital Corp.
        63,270       709,257  
     
                 
    Total Investment Companies (Cost $22,847,404)
                24,998,851  
    Total Investments, at Value (Cost $717,087,201)
        99.9 %     954,311,361  
    Other Assets Net of Liabilities
        0.1       975,118  
     
               
    Net Assets
        100.0 %   $ 955,286,479  
     
               
    Footnotes to Statement of Investments
         
    1.   Non-income producing security.
     
    2.   Represents securities sold under Rule 144A, which are exempt from registration under the Securities Act of 1933, as amended. These securities have been determined to be liquid under guidelines established by the Board of Trustees. These securities amount to $3,351 or less than 0.005% of the Fund’s net assets as of December 31, 2010.
     
    3.   Rate shown is the 7-day yield as of December 31, 2010.
     
    4.   Is or was an affiliate, as defined in the Investment Company Act of 1940, at or during the period ended December 31, 2010, by virtue of the Fund owning at least 5% of the voting securities of the issuer or as a result of the Fund and the issuer having the same investment adviser. Transactions during the period in which the issuer was an affiliate are as follows:
                                     
        Shares     Gross     Gross     Shares  
        December 31, 2009     Additions     Reductions     December 31, 2010  
     
    Oppenheimer Institutional Money Market Fund, Cl. E
        6,595,140       301,135,286       293,789,876       13,940,550  
                     
        Value     Income  
     
    Oppenheimer Institutional Money Market Fund, Cl. E
      $ 13,940,550     $ 22,622  
    5. Interest rate is less than 0.0005%
    Valuation Inputs
    Various data inputs are used in determining the value of each of the Fund’s investments as of the reporting period end. These data inputs are categorized in the following hierarchy under applicable financial accounting standards:
    1) Level 1—unadjusted quoted prices in active markets for identical assets or liabilities (including securities actively traded on a securities exchange)
    2) Level 2—inputs other than unadjusted quoted prices that are observable for the asset or liability (such as unadjusted quoted prices for similar assets and market corroborated inputs such as interest rates, prepayment speeds, credit risks, etc.)
    3) Level 3—significant unobservable inputs (including the Manager’s own judgments about assumptions that market participants would use in pricing the asset or liability).
    The table below categorizes amounts that are included in the Fund’s Statement of Assets and Liabilities as of December 31, 2010 based on valuation input level:
                                 
                    Level 3—    
        Level 1—   Level 2—   Significant    
        Unadjusted   Other Significant   Unobservable    
        Quoted Prices   Observable Inputs   Inputs   Value
     
    Assets Table
                               
    Investments, at Value:
                               
    Common Stocks
                               
    Consumer Discretionary
      $ 127,845,744     $—   $   $ 127,845,744  
    Consumer Staples
        19,688,252               19,688,252  
    Energy
        51,640,857               51,640,857  
    Financials
        198,612,714               198,612,714  
    Health Care
        107,696,844         25       107,696,869  
    Industrials
        150,560,561               150,560,561  
    Information Technology
        187,424,107               187,424,107  
    Materials
        49,154,201         3,351       49,157,552  
    Telecommunication Services
        5,981,304               5,981,304  
    Utilities
        30,704,550               30,704,550  
    Investment Companies
        24,998,851               24,998,851  
         
    Total Assets
      $ 954,307,985     $—   $ 3,376     $ 954,311,361  
         
    Currency contracts and forwards, if any, are reported at their unrealized appreciation/depreciation at measurement date, which represents the change in the contract’s value from trade date. Futures, if any, are reported at their variation margin at measurement date, which represents the amount due to/from the Fund at that date. All additional assets and liabilities included in the above table are reported at their market value at measurement date.
    See the accompanying Notes for further discussion of the methods used in determining value of the Fund’s investments, and a summary of changes to the valuation methodologies, if any, during the reporting period.


    STATEMENT OF ASSETS AND LIABILITIES December 31, 2010
             
    Assets
           
    Investments, at value—see accompanying statement of investments:
           
    Unaffiliated companies (cost $703,146,651)
      $ 940,370,811  
    Affiliated companies (cost $13,940,550)
        13,940,550  


        954,311,361  
    Receivables and other assets:
           
    Investments sold
        1,322,757  
    Dividends
        1,021,613  
    Other
        16,412  
     
         
    Total assets
        956,672,143  
     
           
    Liabilities
           
    Payables and other liabilities:
           
    Distribution and service plan fees
        514,331  
    Shares of beneficial interest redeemed
        430,145  
    Shareholder communications
        259,995  
    Transfer and shareholder servicing agent fees
        80,536  
    Due to custodian
        48,330  
    Trustees’ compensation
        13,793  
    Other
        38,534  
     
         
    Total liabilities
        1,385,664  
     
           
    Net Assets
      $ 955,286,479  
     
           
    Composition of Net Assets
           
    Par value of shares of beneficial interest
      $ 54,530  
    Additional paid-in capital
        929,224,523  
    Accumulated net investment income
        4,175,047  
    Accumulated net realized loss on investments
        (215,391,781 )
    Net unrealized appreciation on investments and translation of assets and liabilities denominated in foreign currencies
        237,224,160  
     
         
    Net Assets
      $ 955,286,479  
     
           
    Net Asset Value Per Share
           
    Non-Service Shares:
           
    Net asset value, redemption price per share and offering price per share (based on net assets of $95,575,915 and 5,412,628 shares of beneficial interest outstanding)
      $ 17.66  
    Service Shares:
           
    Net asset value, redemption price per share and offering price per share (based on net assets of $859,710,564 and 49,117,021 shares of beneficial interest outstanding)
      $ 17.50  


    STATEMENT OF OPERATIONS For the Year Ended December 31, 2010
             
    Investment Income
           
    Dividends:
           
    Unaffiliated companies (net of foreign withholding taxes of $50,417)
      $ 12,241,751  
    Affiliated companies
        22,622  
    Interest
        415  
     
         
    Total investment income
        12,264,788  
     
           
    Expenses
           
    Management fees
        5,732,969  
    Distribution and service plan fees—Service shares
        1,818,061  
    Transfer and shareholder servicing agent fees:
           
    Non-Service shares
        88,009  
    Service shares
        729,536  
    Shareholder communications:
           
    Non-Service shares
        31,214  
    Service shares
        260,274  
    Trustees’ compensation
        32,378  
    Custodian fees and expenses
        4,471  
    Administration service fees
        1,500  
    Other
        79,527  
     
         
    Total expenses
        8,777,939  
    Less waivers and reimbursements of expenses
        (411,578 )
     
         
    Net expenses
        8,366,361  
     
           
    Net Investment Income
        3,898,427  
     
           
    Realized and Unrealized Gain
           
    Net realized gain on investments from unaffiliated companies
        52,686,058  
    Net change in unrealized appreciation/depreciation on:
           
    Investments
        128,458,193  
    Translation of assets and liabilities denominated in foreign currencies
        16,517  
     
         
    Net change in unrealized appreciation/depreciation
        128,474,710  
     
           
    Net Increase in Net Assets Resulting from Operations
      $ 185,059,195  


    STATEMENTS OF CHANGES IN NET ASSETS
                     
    Year Ended December 31,   2010     2009  
     
    Operations
                   
    Net investment income
      $ 3,898,427     $ 3,381,265  
    Net realized gain (loss)
        52,686,058       (133,188,329 )
    Net change in unrealized appreciation/depreciation
        128,474,710       346,221,405  
         
    Net increase in net assets resulting from operations
        185,059,195       216,414,341  
     
                   
    Dividends and/or Distributions to Shareholders
                   
    Dividends from net investment income:
                   
    Non-Service shares
        (548,102 )     (605,525 )
    Service shares
        (2,854,368 )     (4,276,612 )
         
     
        (3,402,470 )     (4,882,137 )
     
                   
    Beneficial Interest Transactions
                   
    Net increase (decrease) in net assets resulting from beneficial interest transactions:
                   
    Non-Service shares
        (4,150,760 )     894,228  
    Service shares
        33,619,248       (78,387,647 )
         
     
        29,468,488       (77,493,419 )
     
                   
    Net Assets
                   
    Total increase
        211,125,213       134,038,785  
    Beginning of period
        744,161,266       610,122,481  
         
    End of period (including accumulated net investment income of $4,175,047 and $3,373,950, respectively)
      $ 955,286,479     $ 744,161,266  


    FINANCIAL HIGHLIGHTS
                                             
    Non-Service Shares   Year Ended December 31,   2010     2009     2008     2007     2006  
     
    Per Share Operating Data
                                           
    Net asset value, beginning of period
      $ 14.40     $ 10.65     $ 18.20     $ 19.15     $ 17.18  
     
    Income (loss) from investment operations:
                                           
    Net investment income1
        .10       .08       .12       .09       .08  
    Net realized and unrealized gain (loss)
        3.25       3.78       (6.73 )     (.30 )     2.46  
         
    Total from investment operations
        3.35       3.86       (6.61 )     (.21 )     2.54  
     
    Dividends and/or distributions to shareholders:
                                           
    Dividends from net investment income
        (.09 )     (.11 )     (.08 )     (.06 )     (.03 )
    Distributions from net realized gain
                    (.86 )     (.68 )     (.54 )
         
    Total dividends and/or distributions to shareholders
        (.09 )     (.11 )     (.94 )     (.74 )     (.57 )
     
    Net asset value, end of period
      $ 17.66     $ 14.40     $ 10.65     $ 18.20     $ 19.15  


    Total Return, at Net Asset Value2
        23.41 %     37.20 %     (37.83 )%     (1.21 )%     15.00 %
     
                                           
    Ratios/Supplemental Data
                                           
    Net assets, end of period (in thousands)
      $ 95,576     $ 81,814     $ 58,478     $ 93,939     $ 81,405  
     
    Average net assets (in thousands)
      $ 88,063     $ 69,585     $ 80,406     $ 94,815     $ 62,659  
     
    Ratios to average net assets:3
                                           
    Net investment income
        0.68 %     0.71 %     0.80 %     0.48 %     0.46 %
    Total expenses4
        0.85 %     0.91 %     0.75 %     0.73 %     0.77 %
    Expenses after payments, waivers and/or reimbursements and reduction to custodian expenses
        0.80 %     0.82 %     0.75 %     0.73 %     0.77 %
     
    Portfolio turnover rate
        73 %     140 %     130 %     115 %     110 %
    1.   Per share amounts calculated based on the average shares outstanding during the period.
     
    2.   Assumes an initial investment on the business day before the first day of the fiscal period, with all dividends and distributions reinvested in additional shares on the reinvestment date, and redemption at the net asset value calculated on the last business day of the fiscal period. Total returns are not annualized for periods less than one full year. Total return information does not reflect expenses that apply at the separate account level or to related insurance products. Inclusion of these charges would reduce the total return figures for all periods shown. Returns do not reflect the deduction of taxes that a shareholder would pay on fund distributions or the redemption of fund shares.
     
    3.   Annualized for periods less than one full year.
     
    4.   Total Expenses including indirect expenses from affiliated fund were as follows:
             
    Year Ended December 31, 2010
        0.85 %
    Year Ended December 31, 2009
        0.91 %
    Year Ended December 31, 2008
        0.75 %
    Year Ended December 31, 2007
        0.73 %
    Year Ended December 31, 2006
        0.77 %


    Service Shares   Year Ended December 31,   2010     2009     2008     2007     2006  
     
    Per Share Operating Data
                                           
    Net asset value, beginning of period
      $ 14.28     $ 10.54     $ 18.03     $ 18.98     $ 17.06  
     
    Income (loss) from investment operations:
                                           
    Net investment income1
        .07       .05       .08       .05       .04  
    Net realized and unrealized gain (loss)
        3.21       3.76       (6.67 )     (.29 )     2.42  
         
    Total from investment operations
        3.28       3.81       (6.59 )     (.24 )     2.46  
     
    Dividends and/or distributions to shareholders:
                                           
    Dividends from net investment income
        (.06 )     (.07 )     (.04 )     (.03 )     2  
    Distributions from net realized gain
                    (.86 )     (.68 )     (.54 )
         
    Total dividends and/or distributions to shareholders
        (.06 )     (.07 )     (.90 )     (.71 )     (.54 )
     
    Net asset value, end of period
      $ 17.50     $ 14.28     $ 10.54     $ 18.03     $ 18.98  


    Total Return, at Net Asset Value3
        23.06 %     36.88 %     (38.00 )%     (1.39 )%     14.66 %
     
                                           
    Ratios/Supplemental Data
                                           
    Net assets, end of period (in thousands)
      $ 859,710     $ 662,347     $ 551,644     $ 821,642     $ 636,430  
     
    Average net assets (in thousands)
      $ 730,069     $ 612,651     $ 769,150     $ 766,102     $ 479,456  
     
    Ratios to average net assets:4
                                           
    Net investment income
        0.45 %     0.47 %     0.52 %     0.23 %     0.23 %
    Total expenses5
        1.10 %     1.15 %     0.99 %     0.97 %     1.00 %
    Expenses after payments, waivers and/or reimbursements and reduction to custodian expenses
        1.05 %     1.07 %     0.99 %     0.97 %     1.00 %
     
    Portfolio turnover rate
        73 %     140 %     130 %     115 %     110 %
    1.   Per share amounts calculated based on the average shares outstanding during the period.
     
    2.   Less than $0.005 per share.
     
    3.   Assumes an initial investment on the business day before the first day of the fiscal period, with all dividends and distributions reinvested in additional shares on the reinvestment date, and redemption at the net asset value calculated on the last business day of the fiscal period. Total returns are not annualized for periods less than one full year. Total return information does not reflect expenses that apply at the separate account level or to related insurance products. Inclusion of these charges would reduce the total return figures for all periods shown. Returns do not reflect the deduction of taxes that a shareholder would pay on fund distributions or the redemption of fund shares.
     
    4.   Annualized for periods less than one full year.
     
    5.   Total expenses including indirect expenses from affiliated fund were as follows:
             
    Year Ended December 31, 2010
        1.10 %
    Year Ended December 31, 2009
        1.15 %
    Year Ended December 31, 2008
        0.99 %
    Year Ended December 31, 2007
        0.97 %
    Year Ended December 31, 2006
        1.00 %


    NOTES TO FINANCIAL STATEMENTS
    1. Significant Accounting Policies
    Oppenheimer Main Street Small Cap Fund/VA (the “Fund”) is a separate series of Oppenheimer Variable Account Funds, an open-end management investment company registered under the Investment Company Act of 1940, as amended. The Fund’s investment objective is to seek capital appreciation. The Fund’s investment adviser is OppenheimerFunds, Inc. (the “Manager”).
         The Fund offers two classes of shares. Both classes are sold at their offering price, which is the net asset value per share, to separate investment accounts of participating insurance companies as an underlying investment for variable life insurance policies, variable annuity contracts or other investment products. The class of shares designated as Service shares is subject to a distribution and service plan. Both classes of shares have identical rights and voting privileges with respect to the Fund in general and exclusive voting rights on matters that affect that class alone. Earnings, net assets and net asset value per share may differ due to each class having its own expenses, such as transfer and shareholder servicing agent fees and shareholder communications, directly attributable to that class.
         The following is a summary of significant accounting policies consistently followed by the Fund.
    Securities Valuation. The Fund calculates the net asset value of its shares as of the close of the New York Stock Exchange (the “Exchange”), normally 4:00 P.M. Eastern time, on each day the Exchange is open for trading.
         Each investment asset or liability of the Fund is assigned a level at measurement date based on the significance and source of the inputs to its valuation. Unadjusted quoted prices in active markets for identical securities are classified as “Level 1,” inputs other than unadjusted quoted prices for an asset that are observable are classified as “Level 2” and significant unobservable inputs, including the Manager’s judgment about the assumptions that a market participant would use in pricing an asset or liability, are classified as “Level 3.” The inputs used for valuing securities are not necessarily an indication of the risks associated with investing in those securities. A table summarizing the Fund’s investments under these levels of classification is included following the Statement of Investments.
         Securities are valued using unadjusted quoted market prices, when available, as supplied primarily by portfolio pricing services approved by the Board of Trustees or dealers.
         Securities traded on a registered U.S. securities exchange are valued based on the last sale price of the security reported on the principal exchange on which it is traded, prior to the time when the Fund’s assets are valued. Securities whose principal exchange is NASDAQ® are valued based on the official closing prices reported by NASDAQ prior to the time when the Fund’s assets are valued. In the absence of a sale, the security is valued at the last sale price on the prior trading day, if it is within the spread of the current day’s closing “bid” and “asked” prices, and if not, at the current day’s closing bid price. A foreign security traded on a foreign exchange is valued based on the last sale price on the principal exchange on which the security is traded, as identified by the portfolio pricing service used by the Manager, prior to the time when the Fund’s assets are valued. In the absence of a sale, the security is valued at the most recent official closing price on the principal exchange on which it is traded.
         Shares of a registered investment company that are not traded on an exchange are valued at that investment company’s net asset value per share.
         U.S. domestic and international debt instruments (including corporate, government, municipal, mortgage-backed, collateralized mortgage obligations and asset-backed securities) and “money market-type” debt instruments with a remaining maturity in excess of sixty days are valued at the mean between the “bid” and “asked” prices utilizing price quotations obtained from independent pricing services or broker-dealers. Such prices are typically determined based upon information obtained from market participants including reported trade data, broker-dealer price quotations and inputs such as benchmark yields and issuer spreads from identical or similar securities.
         “Money market-type” debt instruments with remaining maturities of sixty days or less are valued at cost adjusted by the amortization of discount or premium to maturity (amortized cost), which approximates market value.
         In the absence of a readily available unadjusted quoted market price, including for securities whose values have been materially affected by what the Manager identifies as a significant event occurring before the Fund’s assets are valued but after the close of the securities’ respective exchanges, the Manager, acting through its internal valuation committee, in good faith determines the fair valuation of that asset using consistently applied procedures under the supervision of the Board of Trustees (which reviews those fair valuations by the Manager). Those procedures include certain standardized methodologies to fair value securities. Such methodologies include, but are not limited to, pricing securities initially at cost and subsequently adjusting the value based on: changes in company specific fundamentals, changes in an appropriate securities index, or changes in the value of similar securities which may be adjusted for any discounts related to resale restrictions. When possible, such methodologies use observable market inputs such as unadjusted quoted prices of similar securities, observable interest rates, currency rates and yield curves. The methodologies used for valuing securities are not necessarily an indication of the risks associated with investing in those securities.
         There have been no significant changes to the fair valuation methodologies of the Fund during the period.
    Investment in Oppenheimer Institutional Money Market Fund. The Fund is permitted to invest daily available cash balances in an affiliated money market fund. The Fund may invest the available cash in Class E shares of Oppenheimer Institutional Money Market Fund (“IMMF”) to seek current income while preserving liquidity. IMMF is a registered open-end management investment company, regulated as a money market fund under the Investment Company Act of 1940, as amended. The Manager is also the investment adviser of IMMF. When applicable, the Fund’s investment in IMMF is included in the Statement of Investments. Shares of IMMF are valued at their net asset value per share. As a shareholder, the Fund is subject to its proportional share of IMMF’s Class E expenses, including its management fee. The Manager will waive fees and/or reimburse Fund expenses in an amount equal to the indirect management fees incurred through the Fund’s investment in IMMF.
    Foreign Currency Translation. The Fund’s accounting records are maintained in U.S. dollars. The values of securities denominated in foreign currencies and amounts related to the purchase and sale of foreign securities and foreign investment income are translated into U.S. dollars as of the close of the Exchange, normally 4:00 P.M. Eastern time, on each day the Exchange is open for trading. Foreign exchange rates may be valued primarily using a reliable bank, dealer or service authorized by the Board of Trustees.
         Reported net realized gains and losses from foreign currency transactions arise from sales of portfolio securities, sales and maturities of short-term securities, sales of foreign currencies, exchange rate fluctuations between the trade and settlement dates on securities transactions, and the difference between the amounts of dividends, interest, and foreign withholding taxes recorded on the Fund’s books and the U.S. dollar equivalent of the amounts actually received or paid. Net unrealized appreciation and depreciation on the translation of assets and liabilities denominated in foreign currencies arise from changes in the values of assets and liabilities, including investments in securities at fiscal period end, resulting from changes in exchange rates.
         The effect of changes in foreign currency exchange rates on investments is separately identified from the fluctuations arising from changes in market values of securities held and reported with all other foreign currency gains and losses in the Fund’s Statement of Operations.
    Allocation of Income, Expenses, Gains and Losses. Income, expenses (other than those attributable to a specific class), gains and losses are allocated on a daily basis to each class of shares based upon the relative proportion of net assets represented by such class. Operating expenses directly attributable to a specific class are charged against the operations of that class.
    Federal Taxes. The Fund intends to comply with provisions of the Internal Revenue Code applicable to regulated investment companies and to distribute substantially all of its investment company taxable income, including any net realized gain on investments not offset by capital loss carryforwards, if any, to shareholders. Therefore, no federal income or excise tax provision is required. The Fund files income tax returns in U.S. federal and applicable state jurisdictions. The statute of limitations on the Fund’s tax return filings generally remain open for the three preceding fiscal reporting period ends.
    The tax components of capital shown in the following table represent distribution requirements the Fund must satisfy under the income tax regulations, losses the Fund may be able to offset against income and gains realized in future years and unrealized appreciation or depreciation of securities and other investments for federal income tax purposes.
                             
                        Net Unrealized  
                        Appreciation Based  
                        on Cost of Securities  
    Undistributed   Undistributed     Accumulated     and Other Investments  
    Net Investment   Long-Term     Loss     for Federal Income  
    Income   Gain     Carryforward1,2,3     Tax Purposes  
     
    $3,393,342
      $     $ 207,226,042     $ 229,859,904  
    1.   As of December 31, 2010, the Fund had $207,226,042 of net capital loss carryforwards available to offset future realized capital gains, if any, and thereby reduce future taxable gain distributions. As of December 31, 2010, details of the capital loss carryforwards were as follows:
             
    Expiring        
     
    2016
      $ 45,463,528  
    2017
        161,762,514  
     
         
    Total
      $ 207,226,042  
     
         
    2.   During the fiscal year ended December 31, 2010, the Fund utilized $46,413,192 of capital loss carryforward to offset capital gains realized in that fiscal year.
     
    3.   During the fiscal year ended December 31, 2009, the Fund did not utilize any capital loss carryforward.
    Net investment income (loss) and net realized gain (loss) may differ for financial statement and tax purposes. The character of dividends and distributions made during the fiscal year from net investment income or net realized gains may differ from their ultimate characterization for federal income tax purposes. Also, due to timing of dividends and distributions, the fiscal year in which amounts are distributed may differ from the fiscal year in which the income or net realized gain was recorded by the Fund.
    Accordingly, the following amounts have been reclassified for December 31, 2010. Net assets of the Fund were unaffected by the reclassifications.
             
        Increase to  
    Increase to   Accumulated Net  
    Accumulated Net   Realized Loss  
    Investment Income   on Investments  
     
    $305,140
      $ 305,140  
    The tax character of distributions paid during the years ended December 31, 2010 and December 31, 2009 was as follows:
                     
        Year Ended     Year Ended  
        December 31, 2010     December 31, 2009  
     
    Distributions paid from:
                   
    Ordinary income
      $ 3,402,470     $ 4,882,137  
    The aggregate cost of securities and other investments and the composition of unrealized appreciation and depreciation of securities and other investments for federal income tax purposes as of December 31, 2010 are noted in the following table. The primary difference between book and tax appreciation or depreciation of securities and other investments, if applicable, is attributable to the tax deferral of losses or tax realization of financial statement unrealized gain or loss.
             
    Federal tax cost of securities
      $ 724,451,457  
     
         
    Gross unrealized appreciation
      $ 236,867,825  
    Gross unrealized depreciation
        (7,007,921 )
     
         
    Net unrealized appreciation
      $ 229,859,904  


    Trustees’ Compensation. The Board of Trustees has adopted a compensation deferral plan for independent trustees that enables trustees to elect to defer receipt of all or a portion of the annual compensation they are entitled to receive from the Fund. For purposes of determining the amount owed to the Trustee under the plan, deferred amounts are treated as though equal dollar amounts had been invested in shares of the Fund or in other Oppenheimer funds selected by the Trustee. The Fund purchases shares of the funds selected for deferral by the Trustee in amounts equal to his or her deemed investment, resulting in a Fund asset equal to the deferred compensation liability. Such assets are included as a component of “Other” within the asset section of the Statement of Assets and Liabilities. Deferral of trustees’ fees under the plan will not affect the net assets of the Fund, and will not materially affect the Fund’s assets, liabilities or net investment income per share. Amounts will be deferred until distributed in accordance with the compensation deferral plan.
    Dividends and Distributions to Shareholders. Dividends and distributions to shareholders, which are determined in accordance with income tax regulations and may differ from U.S. generally accepted accounting principles, are recorded on the ex-dividend date. Income and capital gain distributions, if any, are declared and paid annually or at other times as deemed necessary by the Manager.
    Investment Income. Dividend income is recorded on the ex-dividend date or upon ex-dividend notification in the case of certain foreign dividends where the ex-dividend date may have passed. Non-cash dividends included in dividend income, if any, are recorded at the fair market value of the securities received. Interest income is recognized on an accrual basis. Discount and premium, which are included in interest income on the Statement of Operations, are amortized or accreted daily.
    Custodian Fees. “Custodian fees and expenses” in the Statement of Operations may include interest expense incurred by the Fund on any cash overdrafts of its custodian account during the period. Such cash overdrafts may result from the effects of failed trades in portfolio securities and from cash outflows resulting from unanticipated shareholder redemption activity. The Fund pays interest to its custodian on such cash overdrafts, to the extent they are not offset by positive cash balances maintained by the Fund, at a rate equal to the Federal Funds Rate plus 0.50%. The “Reduction to custodian expenses” line item, if applicable, represents earnings on cash balances maintained by the Fund during the period. Such interest expense and other custodian fees may be paid with these earnings.
    Security Transactions. Security transactions are recorded on the trade date. Realized gains and losses on securities sold are determined on the basis of identified cost.
    Indemnifications. The Fund’s organizational documents provide current and former trustees and officers with a limited indemnification against liabilities arising in connection with the performance of their duties to the Fund. In the normal course of business, the Fund may also enter into contracts that provide general indemnifications. The Fund’s maximum exposure under these arrangements is unknown as this would be dependent on future claims that may be made against the Fund. The risk of material loss from such claims is considered remote.
    Other. The preparation of financial statements in conformity with accounting principles generally accepted in the United States of America requires management to make estimates and assumptions that affect the reported amounts of assets and liabilities and disclosure of contingent assets and liabilities at the date of the financial statements and the reported amounts of increases and decreases in net assets from operations during the reporting period. Actual results could differ from those estimates.
    2. Shares of Beneficial Interest
    The Fund has authorized an unlimited number of $0.001 par value shares of beneficial interest of each class. Transactions in shares of beneficial interest were as follows:
                                     
        Year Ended December 31, 2010     Year Ended December 31, 2009  
        Shares     Amount     Shares     Amount  
     
    Non-Service Shares
                                   
    Sold
        2,793,780     $ 42,429,352       3,169,215     $ 36,433,519  
    Dividends and/or distributions reinvested
        36,202       548,102       83,752       605,525  
    Redeemed
        (3,098,803 )     (47,128,214 )     (3,063,138 )     (36,144,816 )
         
    Net increase (decrease)
        (268,821 )   $ (4,150,760 )     189,829     $ 894,228  


    Service Shares
                                   
    Sold
        11,844,155     $ 173,858,907       14,093,981     $ 149,861,179  
    Dividends and/or distributions reinvested
        189,911       2,854,368       592,905       4,262,989  
    Redeemed
        (9,301,032 )     (143,094,027 )     (20,638,747 )     (232,511,815 )
         
    Net increase (decrease)
        2,733,034     $ 33,619,248       (5,951,861 )   $ (78,387,647 )
         
    3. Purchases and Sales of Securities
    The aggregate cost of purchases and proceeds from sales of securities, other than short-term obligations and investments in IMMF, for the year ended December 31, 2010, were as follows:
                     
        Purchases     Sales  
     
    Investment securities
      $ 610,839,072     $ 589,808,446  
    4. Fees and Other Transactions with Affiliates
    Management Fees. Under the investment advisory agreement, the Fund pays the Manager a management fee based on the daily net assets of the Fund at an annual rate as shown in the following table:
             
    Fee Schedule        
     
    Up to $200 million
        0.75 %
    Next $200 million
        0.72  
    Next $200 million
        0.69  
    Next $200 million
        0.66  
    Over $800 million
        0.60  
    Administration Service Fees. The Fund pays the Manager a fee of $1,500 per year for preparing and filing the Fund’s tax returns.
    Transfer Agent Fees. OppenheimerFunds Services (“OFS”), a division of the Manager, acts as the transfer and shareholder servicing agent for the Fund. The Fund pays OFS fees at an annual rate of 0.10% of the daily net assets of each class of shares. For the year ended December 31, 2010, the Fund paid $798,923 to OFS for services to the Fund.
    Distribution and Service Plan for Service Shares. The Fund has adopted a Distribution and Service Plan (the “Plan”) in accordance with Rule 12b-1 under the Investment Company Act of 1940 for Service shares to pay OppenheimerFunds Distributor, Inc. (the “Distributor”), for distribution related services, personal service and account maintenance for the Fund’s Service shares. Under the Plan, payments are made periodically at an annual rate of 0.25% of the daily net assets of Service shares of the Fund. The Distributor currently uses all of those fees to compensate sponsors of the insurance product that offers Fund shares, for providing personal service and maintenance of accounts of their variable contract owners that hold Service shares. These fees are paid out of the Fund’s assets on an on-going basis and increase operating expenses of the Service shares, which results in lower performance compared to the Fund’s shares that are not subject to a service fee. Fees incurred by the Fund under the Plan are detailed in the Statement of Operations.
    Waivers and Reimbursements of Expenses. The Manager has voluntarily agreed to limit the Fund’s total annual operating expenses so that those expenses, as percentages of daily net assets, will not exceed the annual rate of 0.80% for Non-Service shares and 1.05% for Service shares. During the year ended December 31, 2010, the Manager waived fees and/or reimbursed the Fund $44,175 and $357,636 for Non-Service and Service shares, respectively.
         The Manager will waive fees and/or reimburse Fund expenses in an amount equal to the indirect management fees incurred through the Fund’s investment in IMMF. During the year ended December 31, 2010, the Manager waived fees and/or reimbursed the Fund $9,767 for IMMF management fees.
         Some of these undertakings may be modified or terminated at any time; some may not be modified or terminated until after one year from the date of the current prospectus, as indicated therein.
    5. Pending Litigation
    Since 2009, a number of lawsuits have been pending in federal courts against the Manager, the Distributor, and certain mutual funds (“Defendant Funds”) advised by the Manager and distributed by the Distributor (but not including the Fund). The lawsuits naming the Defendant Funds also name as defendants certain officers and current and former trustees of the respective Defendant Funds. The plaintiffs seek class action status on behalf of purchasers of shares of the respective Defendant Fund during a particular time period. The lawsuits raise claims under federal securities laws alleging that, among other things, the disclosure documents of the respective Defendant Fund contained misrepresentations and omissions, that such Defendant Fund’s investment policies were not followed, and that such Defendant Fund and the other defendants violated federal securities laws and regulations. The plaintiffs seek unspecified damages, equitable relief and an award of attorneys’ fees and litigation expenses.
         In 2009, what are claimed to be derivative lawsuits were filed in state court against the Manager and a subsidiary (but not against the Fund), on behalf of the New Mexico Education Plan Trust. These lawsuits allege breach of contract, breach of fiduciary duty, negligence and violation of state securities laws, and seek compensatory damages, equitable relief and an award of attorneys’ fees and litigation expenses.
         Other lawsuits have been filed since 2008 in various state and federal courts, against the Manager and certain of its affiliates. Those lawsuits were filed by investors who made investments through an affiliate of the Manager, and relate to the alleged investment fraud perpetrated by Bernard Madoff and his firm (“Madoff”). Those suits allege a variety of claims, including breach of fiduciary duty, fraud, negligent misrepresentation, unjust enrichment, and violation of federal and state securities laws and regulations, among others. They seek unspecified damages, equitable relief and an award of attorneys’ fees and litigation expenses. None of the suits have named the Distributor, any of the Oppenheimer mutual funds or any of their independent Trustees or Directors as defendants. None of the Oppenheimer funds invested in any funds or accounts managed by Madoff.
         The Manager believes that the lawsuits described above are without legal merit and is defending against them vigorously. The Defendant Funds’ Boards of Trustees have also engaged counsel to defend the suits brought against those Funds and the present and former Independent Trustees named in those suits. While it is premature to render any opinion as to the outcome in these lawsuits, or whether any costs that the Defendant Funds may bear in defending the suits might not be reimbursed by insurance, the Manager believes that these suits should not impair the ability of the Manager or the Distributor to perform their respective duties to the Fund, and that the outcome of all of the suits together should not have any material effect on the operations of any of the Oppenheimer funds.
    6. Subsequent Event
    The Regulated Investment Company Modernization Act of 2010 (the “Act”) was signed into law on December 22, 2010. The Act makes changes to a number of tax rules impacting the Fund. Under the Act, future capital losses generated by a fund may be carried over indefinitely, but these losses must be used prior to the utilization of any pre-enactment capital losses. Since pre-enactment capital losses may only be carried forward for eight years, there may be a greater likelihood that all or a portion of a fund’s pre-enactment capital losses will expire unused. In general, the provisions of the Act will be effective for the Fund’s fiscal year ending December 31, 2011. Specific information regarding the impact of the Act on the Fund will be contained within the “Federal Taxes” section of the financial statement notes for the fiscal year ending December 31, 2011.


    REPORT OF INDEPENDENT REGISTERED PUBLIC ACCOUNTING FIRM
    The Board of Trustees and Shareholders of Oppenheimer Variable Account Funds:
    We have audited the accompanying statement of assets and liabilities of Oppenheimer Money Fund/VA (one of the portfolios constituting the Oppenheimer Variable Account Funds), including the statement of investments, as of December 31, 2010, the related statement of operations for the year then ended, and the statements of changes in net assets and the financial highlights for each of the years in the two-year period then ended. These financial statements and financial highlights are the responsibility of the Fund’s management. Our responsibility is to express an opinion on these financial statements and financial highlights based on our audits. The accompanying financial highlights of Oppenheimer Money Fund/VA for the years ended prior to January 1, 2009 were audited by other auditors whose report dated February 11, 2009 expressed an unqualified opinion on those financial highlights.
         We conducted our audits in accordance with the standards of the Public Company Accounting Oversight Board (United States). Those standards require that we plan and perform the audit to obtain reasonable assurance about whether the financial statements and financial highlights are free of material misstatement. An audit includes examining, on a test basis, evidence supporting the amounts and disclosures in the financial statements. Our procedures included confirmation of securities owned as of December 31, 2010, by correspondence with the custodian. An audit also includes assessing the accounting principles used and significant estimates made by management, as well as evaluating the overall financial statement presentation. We believe that our audits provide a reasonable basis for our opinion.
         In our opinion, the financial statements and financial highlights referred to above present fairly, in all material respects, the financial position of Oppenheimer Money Fund/VA as of December 31, 2010, the results of its operations for the year then ended, and the changes in its net assets and the financial highlights for each of the years in the two-year period then ended, in conformity with U.S. generally accepted accounting principles.
    /s/ KPMG llp
    Denver, Colorado
    February 16, 2011

    STATEMENT OF INVESTMENTS December 31, 2010
                                     
        Maturity     Final Legal     Principal        
        Date*     Maturity Date**     Amount     Value  
     
    Certificates of Deposit—22.4%
                                   
    Yankee Certificates of Deposit—22.4%
                                   
    Bank of Montreal, Chicago:
                                   
    0.25%
        1/27/11       1/27/11     $ 2,000,000     $ 2,000,000  
    0.25%
        1/28/11       1/28/11       3,000,000       3,000,000  
    Barclays Bank plc, New York, 0.44%1
        1/19/11       7/19/11       4,000,000       4,000,000  
    BNP Paribas, New York, 0.50%
        6/30/11       6/30/11       1,000,000       1,000,000  
    Rabobank Nederland NV, New York:
                                   
    0.288%1
        1/31/11       7/29/11       2,000,000       2,000,000  
    0.332%1
        1/12/11       5/12/11       3,000,000       3,000,000  
    0.361%1
        1/25/11       6/27/11       2,000,000       2,000,000  
    Royal Bank of Canada, New York:
                                   
    0.37%1
        1/3/11       11/10/11       3,500,000       3,500,000  
    0.39%1
        1/3/11       8/16/11       3,000,000       3,000,000  
    Societe Generale, New York, 0.34%
        2/2/11       2/2/11       3,000,000       3,000,013  
    Svenska Handelsbanken, New York:
                                   
    0.27%
        2/4/11       2/4/11       2,000,000       2,000,000  
    0.29%
        2/22/11       2/22/11       2,000,000       2,000,000  
    0.29%
        3/3/11       3/3/11       3,000,000       3,000,051  
     
                                 
    Total Certificates of Deposit (Cost $33,500,064)
                                33,500,064  
     
                                   
    Direct Bank Obligations—17.8%
                                   
    Barclays US Funding LLC, 0.30%
        3/1/11       3/1/11       3,000,000       2,998,525  
    Commonwealth Bank of Australia, 0.27%2
        2/9/11       2/9/11       5,400,000       5,398,450  
    Credit Agricole North America, Inc., 0.30%
        1/20/11       1/20/11       5,600,000       5,599,124  
    Credit Suisse, New York Branch, 0.23%
        1/5/11       1/5/11       2,000,000       1,999,949  
    ING (US) Funding LLC, 0.28%
        2/2/11       2/2/11       3,500,000       3,499,129  
    Nordea North America, Inc., 0.29%
        3/15/11       3/15/11       2,700,000       2,698,412  
    Societe Generale North America, Inc.:
                                   
    0.30%
        1/20/11       1/20/11       2,400,000       2,399,620  
    0.30%
        1/28/11       1/28/11       2,000,000       1,999,550  
     
                                 
    Total Direct Bank Obligations (Cost $26,592,759)
                                26,592,759  
     
                                   
    Short-Term Notes—46.5%
                                   
    Capital Markets—3.9%
                                   
    BNP Paribas Finance, Inc.:
                                   
    0.39%
        3/23/11       3/23/11       2,550,000       2,547,762  
    0.46%
        6/17/11       6/17/11       3,300,000       3,292,958  


                                5,840,720  
    Leasing & Factoring—4.9%
                                   
    Toyota Motor Credit Corp.:
                                   
    0.33%
        4/5/11       4/5/11       5,000,000       4,995,692  
    0.35%
        4/12/11       4/12/11       2,250,000       2,247,791  


                                7,243,483  
    Municipal—12.2%
                                   
    Carroll Cnty., KY Solid Waste Disposal Revenue Bonds, North America Stainless Project, Series 2006, 0.39%1
        1/7/11       1/7/11       4,300,000       4,300,000  
    Chicago, IL Industrial Development Revenue Bonds, Freedman Seating Co. Project, Series 1998, 0.50%1
        1/7/11       1/7/11       1,275,000       1,275,000  
    Health Care Revenue Bonds, SFO Associates Project, Series 1994, 0.34%1
        1/7/11       1/7/11       1,900,000       1,900,000  
    IL Finance Authority, Freedman Seating Co. Project, Series 2005, 0.50%1
        1/7/11       1/7/11       1,440,000       1,440,000  
     
                                     
        Maturity     Final Legal     Principal        
        Date*     Maturity Date**     Amount     Value  
     
    Municipal Continued
                                   
    IN Health Facilities Financing Authority Hospital Revenue Bonds, Deaconess Hospital Obligation Project, Series 2004B, 0.31%1
        1/7/11       1/7/11     $ 4,130,000     $ 4,130,000  
    Miami-Dade Cnty., FL Industrial Development Authority Bonds, Airbus Service Co., Inc. Project, Series 98, 0.38%1
        1/7/11       1/7/11       1,000,000       1,000,000  
    San Antonio, TX Industrial Development Authority Revenue Bonds, Tindall Corp. Project, 0.34%1
        1/7/11       1/7/11       3,300,000       3,300,000  
    Valdosta-Lowndes Cnty., GA Industrial Authority, Steeda Autosports, Inc. Project, Series 2008, 0.50%1
        1/7/11       1/7/11       945,000       945,000  


                                18,290,000  
    Oil, Gas & Consumable Fuels—2.7%
                                   
    Total Capital Canada, 0.47%2
        1/19/11       1/19/11       4,000,000       3,999,040  
    Personal Products—3.0%
                                   
    Reckitt Benckiser Treasury Services plc:
                                   
    0.27%2
        1/6/11       1/6/11       2,500,000       2,499,906  
    0.28%2
        1/7/11       1/7/11       2,000,000       1,999,907  


                                4,499,813  
    Receivables Finance—8.0%
                                   
    Falcon Asset Securitization Co. LLC:
                                   
    0.27%2
        1/24/11       1/24/11       1,700,000       1,699,707  
    0.27%2
        2/1/11       2/1/11       3,000,000       2,999,303  
    Gemini Securitization Corp., 0.27%2
        1/7/11       1/7/11       1,500,000       1,499,933  
    Mont Blanc Capital Corp., 0.28%2
        1/19/11       1/19/11       2,000,000       1,999,720  
    Old Line Funding Corp., 0.27%2
        2/3/11       2/3/11       1,256,000       1,255,689  
    Thunder Bay Funding LLC, 0.27%2
        2/22/11       2/22/11       2,500,000       2,499,025  


                                11,953,377  
    Special Purpose Financial—11.8%
                                   
    Crown Point Capital Co.:
                                   
    0.35%
        1/4/11       1/4/11       5,000,000       4,999,854  
    0.35%
        1/10/11       1/10/11       1,000,000       999,913  
    FCAR Owner Trust I:
                                   
    0.30%
        1/13/11       1/13/11       2,400,000       2,399,760  
    0.31%
        2/1/11       2/1/11       2,000,000       1,999,466  
    Lexington Parker Capital Co. LLC:
                                   
    0.35%2
        1/5/11       1/5/11       5,000,000       4,999,806  
    0.35%2
        1/12/11       1/12/11       2,300,000       2,299,754  


                                17,698,553  
     
                                 
    Total Short-Term Notes (Cost $69,524,986)
                                69,524,986  
     
                                   
    U.S. Government Agencies—3.3%
                                   
    Federal Home Loan Bank:
                                   
    0.40%
        11/28/11       11/28/11       2,000,000       2,000,000  
    0.45%
        12/16/11       12/16/11       2,000,000       2,000,000  
    0.50%
        12/28/11       12/28/11       1,000,000       1,000,000  
     
                                 
    Total U.S. Government Agencies (Cost $5,000,000)
                                5,000,000  
     
                                   
    U.S. Government Obligations—5.9%
                                   
    U.S. Treasury Nts.:
                                   
    0.875%
        2/28/11       2/28/11       1,800,000       1,801,455  
    0.875%
        3/31/11       3/31/11       1,000,000       1,001,065  
    0.875%
        4/30/11       4/30/11       1,000,000       1,001,110  
    1.125%
        12/15/11       12/15/11       3,000,000       3,022,204  
    4.875%
        7/31/11       7/31/11       1,000,000       1,025,930  

                                     
        Maturity     Final Legal     Principal        
        Date*     Maturity Date**     Amount     Value  
     
    U.S. Government Obligations Continued
                                   
    U.S. Treasury Nts.: Continued
                                   
    5.125%
        6/30/11       6/30/11     $ 1,000,000     $ 1,023,181  
     
                                 
    Total U.S. Government Obligations (Cost $8,874,945)
                                8,874,945  
     
                                   
    Repurchase Agreements—4.2%
                                   
    Repurchase agreement (Principal Amount/Value $6,300,000, with a maturity value of $6,300,105) with JPMorgan Chase Bank, 0.20%, dated 12/31/10, to be repurchased at $6,300,105 on 1/3/11, collateralized by Government National Mortgage Assn., Principal-Only Stripped Mtg.-Backed Security, 0%, 4/20/40, with a value of $6,429,158 (Cost $6,300,000)
        1/3/11       1/3/11       6,300,000       6,300,000  
     
                                   
    Total Investments, at Value (Cost $149,792,754)
                        100.1 %     149,792,754  
    Liabilities in Excess of Other Assets
                        (0.1 )     (95,599 )
                         
    Net Assets
                        100.0 %   $ 149,697,155  
                         
    Footnotes to Statement of Investments
     
    Short-term notes and direct bank obligations are generally traded on a discount basis; the interest rate shown is the discount rate received by the Fund at the time of purchase. Other securities normally bear interest at the rates shown.
     
    *   The Maturity Date represents the date used to calculate the Fund’s weighted average maturity as determined under Rule 2a-7.
     
    **   If different from the Maturity Date, the Final Legal Maturity date includes any maturity date extensions, which may be affected at the option of the issuer, or unconditional payments of principal by the issuer which may be affected at the option of the Fund, and represents the date used to calculate the Fund’s weighted average life.
     
    1.   Represents the current interest rate for a variable or increasing rate security.
     
    2.   Security issued in an exempt transaction without registration under the Securities Act of 1933. Such securities amount to $33,150,240 or 22.14% of the Fund’s net assets, and have been determined to be liquid pursuant to guidelines adopted by the Board of Trustees.
    Valuation Inputs
    Various data inputs are used in determining the value of each of the Fund’s investments as of the reporting period end. These data inputs are categorized in the following hierarchy under applicable financial accounting standards:
      1)   Level 1—unadjusted quoted prices in active markets for identical assets or liabilities (including securities actively traded on a securities exchange)
      2)   Level 2—inputs other than unadjusted quoted prices that are observable for the asset or liability (such as unadjusted quoted prices for similar assets and market corroborated inputs such as interest rates, prepayment speeds, credit risks, etc.)
      3)   Level 3—significant unobservable inputs (including the Manager’s own judgments about assumptions that market participants would use in pricing the asset or liability).
    The table below categorizes amounts that are included in the Fund’s Statement of Assets and Liabilities as of December 31, 2010 based on valuation input level:
                                     
                        Level 3—        
        Level 1—     Level 2—     Significant        
        Unadjusted     Other Significant     Unobservable        
        Quoted Prices     Unobservable Inputs     Inputs     Value  
     
    Assets Table
                                   
    Investments, at Value:
                                   
    Certificates of Deposit
      $     $ 33,500,064     $     $ 33,500,064  
    Direct Bank Obligations
              26,592,759             26,592,759  
    Short-Term Notes
              69,524,986             69,524,986  
    U.S. Government Agencies
              5,000,000             5,000,000  
    U.S. Government Obligations
              8,874,945             8,874,945  
    Repurchase Agreements
              6,300,000             6,300,000  
         
    Total Assets
      $     $ 149,792,754     $     $ 149,792,754  
         
    Currency contracts and forwards, if any, are reported at their unrealized appreciation/depreciation at measurement date, which represents the change in the contract’s value from trade date. Futures, if any, are reported at their variation margin at measurement date, which represents the amount due to/from the Fund at that date. All additional assets and liabilities included in the above table are reported at their market value at measurement date.
    See the accompanying Notes for further discussion of the methods used in determining value of the Fund’s investments, and a summary of changes to the valuation methodologies, if any, during the reporting period.


    STATEMENT OF ASSETS AND LIABILITIES December 31, 2010
             
    Assets
           
    Investments, at value (cost $149,792,754)—see accompanying statement of investments
      $ 149,792,754  
    Cash
        117,456  
    Receivables and other assets:
           
    Interest
        53,199  
    Shares of beneficial interest sold
        2,369  
    Other
        9,424  
     
         
    Total assets
        149,975,202  
     
           
    Liabilities
           
    Payables and other liabilities:
           
    Shares of beneficial interest redeemed
        216,038  
    Legal, auditing and other professional fees
        20,458  
    Shareholder communications
        17,865  
    Transfer and shareholder servicing agent fees
        12,878  
    Trustees’ compensation
        6,928  
    Dividends
        524  
    Other
        3,356  
     
         
    Total liabilities
        278,047  
     
           
    Net Assets
      $ 149,697,155  


    Composition of Net Assets
           
    Par value of shares of beneficial interest
      $ 149,697  
    Additional paid-in capital
        149,547,458  
     
         
    Net Assets—applicable to 149,697,155 shares of beneficial interest outstanding
      $ 149,697,155  


    Net Asset Value, Redemption Price Per Share and Offering Price Per Share
      $ 1.00  


    STATEMENT OF OPERATIONS For the Year Ended December 31, 2010
             
    Investment Income
           
    Interest
      $ 585,547  
     
           
    Expenses
           
    Management fees
        739,544  
    Transfer and shareholder servicing agent fees
        164,341  
    Legal, auditing and other professional fees
        36,254  
    Shareholder communications
        33,196  
    Trustees’ compensation
        17,308  
    Custodian fees and expenses
        1,852  
    Administration service fees
        1,500  
    Other
        15,759  
     
         
    Total expenses
        1,009,754  
    Less waivers and reimbursements of expenses
        (435,558 )
     
         
    Net expenses
        574,196  
     
           
    Net Investment Income
        11,351  
     
           
    Net Realized Gain on Investments
        68  
     
           
    Net Increase in Net Assets Resulting from Operations
      $ 11,419  


    STATEMENTS OF CHANGES IN NET ASSETS
                     
    Year Ended December 31,   2010     2009  
     
    Operations
                   
    Net investment income
      $ 11,351     $ 765,680  
    Net realized gain
        68       10,354  
         
    Net increase in net assets resulting from operations
        11,419       776,034  
     
                   
    Dividends and/or Distributions to Shareholders
                   
    Dividends from net investment income
        (46,794 )     (765,999 )
     
                   
    Beneficial Interest Transactions
                   
    Net decrease in net assets resulting from beneficial interest transactions
        (31,222,151 )     (62,411,738 )
     
                   
    Net Assets
                   
    Total decrease
        (31,257,526 )     (62,401,703 )
    Beginning of period
        180,954,681       243,356,384  
         
    End of period
      $ 149,697,155     $ 180,954,681  


    FINANCIAL HIGHLIGHTS
                                             
    Year Ended December 31,   2010     2009     2008     2007     2006  
     
    Per Share Operating Data
                                           
    Net asset value, beginning of period
      $ 1.00     $ 1.00     $ 1.00     $ 1.00     $ 1.00  
     
    Income from investment operations-net investment income and net realized gain1
        2      2      .03       .05       .05  
     
    Dividends and/or distributions to shareholders:
                                           
    Dividends from net investment income
        2      2      (.03 )     (.05 )     (.05 )
    Distributions from net realized gain
                          2      2 
         
    Total dividends and/or distributions to shareholders
        2      2      (.03 )     (.05 )     (.05 )
     
    Net asset value, end of period
      $ 1.00     $ 1.00     $ 1.00     $ 1.00     $ 1.00  


    Total Return3
        0.03 %     0.32 %     2.78 %     4.98 %     4.71 %
     
                                           
    Ratios/Supplemental Data
                                           
    Net assets, end of period (in thousands)
      $ 149,697     $ 180,955     $ 243,356     $ 189,749     $ 171,521  
     
    Average net assets (in thousands)
      $ 164,258     $ 218,079     $ 212,564     $ 181,271     $ 171,118  
     
    Ratios to average net assets:4
                                           
    Net investment income
        0.01 %     0.35 %     2.72 %     4.86 %     4.61 %
    Total expenses
        0.61 %     0.57 %     0.50 %     0.50 %     0.49 %
    Expenses after payments, waivers and/or reimbursements and reduction to custodian expenses
        0.35 %     0.48 %     0.50 %     0.50 %     0.49 %
    1.   Per share amounts calculated based on the average shares outstanding during the period.
     
    2.   Less than $0.005 per share.
     
    3.   Assumes an initial investment on the business day before the first day of the fiscal period, with all dividends and distributions reinvested in additional shares on the reinvestment date, and redemption at the net asset value calculated on the last business day of the fiscal period. Total returns are not annualized for periods less than one full year. Total return information does not reflect expenses that apply at the separate account level or to related insurance products. Inclusion of these charges would reduce the total return figures for all periods shown. Returns do not reflect the deduction of taxes that a shareholder would pay on fund distributions or the redemption of fund shares.
     
    4.   Annualized for periods less than one full year.


    NOTES TO FINANCIAL STATEMENTS
    1. Significant Accounting Policies
    Oppenheimer Money Fund/VA (the “Fund”) is a separate series of Oppenheimer Variable Account Funds, an open-end management investment company registered under the Investment Company Act of 1940, as amended. The Fund’s investment objective is to seek maximum current income from investments in “money market” securities consistent with low capital risk and the maintenance of liquidity. The Fund’s investment adviser is OppenheimerFunds, Inc. (the “Manager”).
         The following is a summary of significant accounting policies consistently followed by the Fund.
    Securities Valuation. Securities are valued at cost adjusted by the amortization of discount or premium to maturity (amortized cost), which approximates market value. If amortized cost is determined not to approximate market value, the fair value of the portfolio securities will be determined under procedures approved by the Fund’s Board of Trustees.
         Each investment asset or liability of the Fund is assigned a level at measurement date based on the significance and source of the inputs to its valuation. Unadjusted quoted prices in active markets for identical securities are classified as “Level 1,” inputs other than unadjusted quoted prices for an asset that are observable are classified as “Level 2” and significant unobservable inputs, including the Manager’s judgment about the assumptions that a market participant would use in pricing an asset or liability, are classified as “Level 3.” The inputs used for valuing securities are not necessarily an indication of the risks associated with investing in those securities. A table summarizing the Fund’s investments under these levels of classification is included following the Statement of Investments.
         In the absence of a readily available unadjusted quoted market price, including for securities whose values have been materially affected by what the Manager identifies as a significant event occurring before the Fund’s assets are valued but after the close of the securities’ respective exchanges, the Manager, acting through its internal valuation committee, in good faith determines the fair valuation of that asset using consistently applied procedures under the supervision of the Board of Trustees (which reviews those fair valuations by the Manager). Those procedures include certain standardized methodologies to fair value securities. Such methodologies include, but are not limited to, pricing securities initially at cost and subsequently adjusting the value based on: changes in company specific fundamentals, changes in an appropriate securities index, or changes in the value of similar securities which may be adjusted for any discounts related to resale restrictions. When possible, such methodologies use observable market inputs such as unadjusted quoted prices of similar securities, observable interest rates, currency rates and yield curves. The methodologies used for valuing securities are not necessarily an indication of the risks associated with investing in those securities.
         There have been no significant changes to the fair valuation methodologies of the Fund during the period.
    Repurchase Agreements. The Fund requires its custodian bank to take possession, to have legally segregated in the Federal Reserve Book Entry System or to have segregated within the custodian’s vault, all securities held as collateral for repurchase agreements. The market value of the collateral is required to be sufficient to cover payments of interest and principal. If the seller of the agreement defaults and the value of the collateral declines, or if the seller enters an insolvency proceeding, realization of the value of the collateral by the Fund may be delayed or limited.
    Federal Taxes. The Fund intends to comply with provisions of the Internal Revenue Code applicable to regulated investment companies and to distribute substantially all of its investment company taxable income to shareholders. Therefore, no federal income or excise tax provision is required. The Fund files income tax returns in U.S. federal and applicable state jurisdictions. The statute of limitations on the Fund’s tax return filings generally remain open for the three preceding fiscal reporting period ends.
    The tax components of capital shown in the following table represent distribution requirements the Fund must satisfy under the income tax regulations, losses the Fund may be able to offset against income and gains realized in future years for federal income tax purposes.
                             
    Undistributed Net         Undistributed     Accumulated Loss  
    Investment Income         Long-Term Gains     Carryforward1,2  
     
    $ 10,084    
     
      $     $  

    1.   During the fiscal year ended December 31, 2010, the Fund did not utilize any capital loss carryforwards.
     
    2.   During the fiscal year ended December 31, 2009, the Fund did not utilize any capital loss carryforwards.
    Net investment income (loss) and net realized gain (loss) may differ for financial statement and tax purposes. The character of dividends and distributions made during the fiscal year from net investment income or net realized gains may differ from their ultimate characterization for federal income tax purposes. Also, due to timing of dividends and distributions, the fiscal year in which amounts are distributed may differ from the fiscal year in which the income or net realized gain was recorded by the Fund.
    Accordingly, the following amounts have been reclassified for December 31, 2010. Net assets of the Fund were unaffected by the reclassifications.
                     
                Reduction to  
        Reduction to     Accumulated Net  
    Reduction to   Accumulated     Realized Gain  
    Paid-in Capital   Net Investment Loss     on Investments  
     
    $26,088
      $ 35,443     $ 9,355  
    The tax character of distributions paid during the years ended December 31, 2010 and December 31, 2009 was as follows:
                     
        Year Ended     Year Ended  
        December 31, 2010     December 31, 2009  
     
    Distributions paid from:
                   
    Ordinary income
      $ 46,794     $ 765,999  
    Trustees’ Compensation. The Board of Trustees has adopted a compensation deferral plan for independent trustees that enables trustees to elect to defer receipt of all or a portion of the annual compensation they are entitled to receive from the Fund. For purposes of determining the amount owed to the Trustee under the plan, deferred amounts are treated as though equal dollar amounts had been invested in shares of the Fund or in other Oppenheimer funds selected by the Trustee. The Fund purchases shares of the funds selected for deferral by the Trustee in amounts equal to his or her deemed investment, resulting in a Fund asset equal to the deferred compensation liability. Such assets are included as a component of “Other” within the asset section of the Statement of Assets and Liabilities. Deferral of trustees’ fees under the plan will not affect the net assets of the Fund, and will not materially affect the Fund’s assets, liabilities or net investment income per share. Amounts will be deferred until distributed in accordance with the compensation deferral plan.
    Dividends and Distributions to Shareholders. Dividends and distributions to shareholders, which are determined in accordance with income tax regulations and may differ from U.S. generally accepted accounting principles, are recorded on the ex-dividend date. Income distributions, if any, are declared daily and paid monthly. Capital gain distributions, if any, are declared and paid annually but may be paid at other times to maintain the net asset value per share at $1.00.

    Investment Income. Interest income is recognized on an accrual basis. Discount and premium, which are included in interest income on the Statement of Operations, are amortized or accreted daily.
    Custodian Fees. “Custodian fees and expenses” in the Statement of Operations may include interest expense incurred by the Fund on any cash overdrafts of its custodian account during the period. Such cash overdrafts may result from the effects of failed trades in portfolio securities and from cash outflows resulting from unanticipated shareholder redemption activity. The Fund pays interest to its custodian on such cash overdrafts, to the extent they are not offset by positive cash balances maintained by the Fund, at a rate equal to the Federal Funds Rate plus 0.50%. The “Reduction to custodian expenses” line item, if applicable, represents earnings on cash balances maintained by the Fund during the period. Such interest expense and other custodian fees may be paid with these earnings.
    Security Transactions. Security transactions are recorded on the trade date. Realized gains and losses on securities sold are determined on the basis of identified cost.
    Indemnifications. The Fund’s organizational documents provide current and former trustees and officers with a limited indemnification against liabilities arising in connection with the performance of their duties to the Fund. In the normal course of business, the Fund may also enter into contracts that provide general indemnifications. The Fund’s maximum exposure under these arrangements is unknown as this would be dependent on future claims that may be made against the Fund. The risk of material loss from such claims is considered remote.
    Other. The preparation of financial statements in conformity with accounting principles generally accepted in the United States of America requires management to make estimates and assumptions that affect the reported amounts of assets and liabilities and disclosure of contingent assets and liabilities at the date of the financial statements and the reported amounts of increases and decreases in net assets from operations during the reporting period. Actual results could differ from those estimates.
    2. Shares of Beneficial Interest
    The Fund has authorized an unlimited number of $0.001 par value shares of beneficial interest. Transactions in shares of beneficial interest were as follows:
                                     
        Year Ended December 31, 2010     Year Ended December 31, 2009  
        Shares     Amount     Shares     Amount  
     
    Sold
        64,871,083     $ 64,871,083       66,197,591     $ 66,197,591  
    Dividends and/or distributions reinvested
        46,794       46,794       765,999       765,999  
    Redeemed
        (96,140,028 )     (96,140,028 )     (129,375,328 )     (129,375,328 )
         
    Net decrease
        (31,222,151 )   $ (31,222,151 )     (62,411,738 )   $ (62,411,738 )
         
    3. Fees and Other Transactions with Affiliates
    Management Fees. Under the investment advisory agreement, the Fund pays the Manager a management fee based on the daily net assets of the Fund at an annual rate as shown in the following table:
             
    Fee Schedule        
     
    Up to $500 million
        0.450 %
    Next $500 million
        0.425  
    Next $500 million
        0.400  
    Over $1.5 billion
        0.375  
    Administration Service Fees. The Fund pays the Manager a fee of $1,500 per year for preparing and filing the Fund’s tax returns.
    Transfer Agent Fees. OppenheimerFunds Services (“OFS”), a division of the Manager, acts as the transfer and shareholder servicing agent for the Fund. The Fund pays OFS fees at an annual rate of 0.10% of its daily net assets. For the year ended December 31, 2010, the Fund paid $167,034 to OFS for services to the Fund.
    Waivers and Reimbursements of Expenses. The Manager has voluntarily undertaken to waive fees and/or reimburse expenses to the extent necessary to assist the Fund in attempting to maintain a positive yield. There is no guarantee that the Fund will maintain a positive yield. During the year ended December 31, 2010, the Manager waived fees and/or reimbursed the Fund $435,558.
         The Manager has voluntarily agreed to limit the Fund’s total annual operating expenses so that those expenses, as a percentage of daily net assets, will not exceed the annual rate of 0.50%.
         Some of these undertakings may be modified or terminated at any time; some may not be modified or terminated until after one year from the date of the current prospectus, as indicated therein.
    4. Pending Litigation
    Since 2009, a number of lawsuits have been pending in federal courts against the Manager, the Distributor, and certain mutual funds (“Defendant Funds”) advised by the Manager and distributed by the Distributor (but not including the Fund). The lawsuits naming the Defendant Funds also name as defendants certain officers and current and former trustees of the respective Defendant Funds. The plaintiffs seek class action status on behalf of purchasers of shares of the respective Defendant Fund during a particular time period. The lawsuits raise claims under federal securities laws alleging that, among other things, the disclosure documents of the respective Defendant Fund contained misrepresentations and omissions, that such Defendant Fund’s investment policies were not followed, and that such Defendant Fund and the other defendants violated federal securities laws and regulations. The plaintiffs seek unspecified damages, equitable relief and an award of attorneys’ fees and litigation expenses.
         In 2009, what are claimed to be derivative lawsuits were filed in state court against the Manager and a subsidiary (but not against the Fund), on behalf of the New Mexico Education Plan Trust. These lawsuits allege breach of contract, breach of fiduciary duty, negligence and violation of state securities laws, and seek compensatory damages, equitable relief and an award of attorneys’ fees and litigation expenses.
         Other lawsuits have been filed since 2008 in various state and federal courts, against the Manager and certain of its affiliates. Those lawsuits were filed by investors who made investments through an affiliate of the Manager, and relate to the alleged investment fraud perpetrated by Bernard Madoff and his firm (“Madoff ”). Those suits allege a variety of claims, including breach of fiduciary duty, fraud, negligent misrepresentation, unjust enrichment, and violation of federal and state securities laws and regulations, among others. They seek unspecified damages, equitable relief and an award of attorneys’ fees and litigation expenses. None of the suits have named the Distributor, any of the Oppenheimer mutual funds or any of their independent Trustees or Directors as defendants. None of the Oppenheimer funds invested in any funds or accounts managed by Madoff.
         The Manager believes that the lawsuits described above are without legal merit and is defending against them vigorously. The Defendant Funds’ Boards of Trustees have also engaged counsel to defend the suits brought against those Funds and the present and former Independent Trustees named in those suits. While it is premature to render any opinion as to the outcome in these lawsuits, or whether any costs that the Defendant Funds may bear in defending the suits might not be reimbursed by insurance, the Manager believes that these suits should not impair the ability of the Manager or the Distributor to perform their respective duties to the Fund, and that the outcome of all of the suits together should not have any material effect on the operations of any of the Oppenheimer funds.
    5. Subsequent Event
    The Regulated Investment Company Modernization Act of 2010 (the “Act”) was signed into law on December 22, 2010. The Act makes changes to a number of tax rules impacting the Fund. Under the Act, future capital losses generated by a fund may be carried over indefinitely, but these losses must be used prior to the utilization of any pre-enactment capital losses. Since pre-enactment capital losses may only be carried forward for eight years, there may be a greater likelihood that all or a portion of a fund’s pre-enactment capital losses will expire unused. In general, the provisions of the Act will be effective for the Fund’s fiscal year ending December 31, 2011. Specific information regarding the impact of the Act on the Fund will be contained within the “Federal Taxes” section of the financial statement notes for the fiscal year ending December 31, 2011.


    REPORT OF INDEPENDENT REGISTERED PUBLIC ACCOUNTING FIRM
    The Board of Trustees and Shareholders of Oppenheimer Variable Account Funds:
    We have audited the accompanying statement of assets and liabilities of Oppenheimer Small- & Mid-Cap Growth Fund/VA formerly known as Oppenheimer MidCap Fund/VA, (one of the portfolios constituting the Oppenheimer Variable Account Funds), including the statement of investments, as of December 31, 2010, the related statement of operations for the year then ended, and the statements of changes in net assets and the financial highlights for each of the years in the two-year period then ended. These financial statements and financial highlights are the responsibility of the Fund’s management. Our responsibility is to express an opinion on these financial statements and financial highlights based on our audits. The accompanying financial highlights of Oppenheimer Small- & Mid-Cap Growth Fund/VA for the years ended prior to January 1, 2009 were audited by other auditors whose report dated February 11, 2009 expressed an unqualified opinion on those financial highlights.
         We conducted our audits in accordance with the standards of the Public Company Accounting Oversight Board (United States). Those standards require that we plan and perform the audit to obtain reasonable assurance about whether the financial statements and financial highlights are free of material misstatement. An audit includes examining, on a test basis, evidence supporting the amounts and disclosures in the financial statements. Our procedures included confirmation of securities owned as of December 31, 2010, by correspondence with the custodian and transfer agent. An audit also includes assessing the accounting principles used and significant estimates made by management, as well as evaluating the overall financial statement presentation. We believe that our audits provide a reasonable basis for our opinion.
         In our opinion, the financial statements and financial highlights referred to above present fairly, in all material respects, the financial position of Oppenheimer Small- & Mid-Cap Growth Fund/VA as of December 31, 2010, the results of its operations for the year then ended, and the changes in its net assets and the financial highlights for each of the years in the two-year period then ended, in conformity with U.S. generally accepted accounting principles.
    /s/ KPMG llp
    Denver, Colorado
    February 16, 2011
     
     
    STATEMENT T OF INVESTMENTS December 31, 2010
                     
        Shares     Value  
     
    Common Stocks—100.8%
                   
    Consumer Discretionary—22.2%
                   
    Auto Components—1.7%
                   
    BorgWarner, Inc.1
        102,250     $ 7,398,810  
    TRW Automotive Holdings Corp.1
        62,000       3,267,400  


                10,666,210  
     
                   
    Diversified Consumer Services—0.7%
                   
    Sotheby’s
        104,470       4,701,150  
     
                 
    Hotels, Restaurants & Leisure—4.6%
                   
    Cheesecake Factory, Inc. (The)1
        174,630       5,354,156  
    Chipotle Mexican Grill, Inc., Cl. A1
        41,971       8,925,553  
    Panera Bread Co., Cl. A1
        85,790       8,682,806  
    Starwood Hotels & Resorts Worldwide, Inc.
        107,310       6,522,302  


                29,484,817  
     
                   
    Internet & Catalog Retail—2.0%
                   
    E-Commerce China Dangdang, Inc.,
                   
    Sponsored ADR1
        53,150       1,438,771  
    NetFlix.com, Inc.1
        16,800       2,951,760  
    Priceline.com, Inc.1
        20,640       8,246,712  


                12,637,243  
     
                   
    Leisure Equipment & Products—0.9%
                   
    Hasbro, Inc.
        128,660       6,070,179  
     
                 
    Media—2.6%
                   
    Discovery Communications, Inc.1
        187,590       7,822,503  
    Scripps Networks Interactive, Cl. A
        116,780       6,043,365  
    Valassis Communications, Inc.1
        99,480       3,218,178  


                17,084,046  
     
                   
    Multiline Retail—2.6%
                   
    Dollar Tree, Inc.1
        181,305       10,167,584  
    Nordstrom, Inc.
        161,040       6,824,875  


                16,992,459  
     
                   
    Specialty Retail—4.8%
                   
    Dick’s Sporting Goods, Inc.1
        89,680       3,363,000  
    Guess?, Inc.
        64,130       3,034,632  
    O’Reilly Automotive, Inc.1
        112,260       6,782,749  
    Tiffany & Co.
        116,440       7,250,719  
    Tractor Supply Co.
        146,910       7,123,666  
    Ulta Salon, Cosmetics & Fragrance, Inc.1
        95,800       3,257,200  


                30,811,966  
     
                   
    Textiles, Apparel & Luxury Goods—2.3%
                   
    Fossil, Inc.1
        67,390       4,749,647  
    Phillips/Van Heusen Corp.
        97,770       6,160,488  
    Under Armour, Inc., Cl. A1
        71,840       3,939,706  


                14,849,841  
     
                   
    Consumer Staples—4.9%
                   
    Beverages—1.1%
                   
    Hansen Natural Corp.1
        138,900       7,261,692  
     
                 
    Food & Staples Retailing—1.5%
                   
    Fresh Market, Inc. (The)1
        47,370       1,951,644  
    Whole Foods Market, Inc.1
        151,450       7,661,856  


                9,613,500  
     
                   
    Food Products—0.5%
                   
    TreeHouse Foods, Inc.1
        65,610       3,352,015  
    Personal Products—1.8%
                   
    Estee Lauder Cos., Inc. (The), Cl. A
        88,680       7,156,476  
    Nu Skin Asia Pacific, Inc., Cl. A
        137,690       4,166,499  


                11,322,975  
     
                   
    Energy—5.9%
                   
    Energy Equipment & Services—2.9%
                   
    Complete Production Services, Inc.1
        113,150       3,343,583  
    Core Laboratories NV
        66,600       5,930,730  
    Dril-Quip, Inc.1
        52,930       4,113,720  
    Superior Energy Services, Inc.1
        161,930       5,665,931  


                19,053,964  
     
                   
    Oil, Gas & Consumable Fuels—3.0%
                   
    Concho Resources, Inc.1
        140,560       12,322,895  
    Whiting Petroleum Corp.1
        59,410       6,962,258  


                19,285,153  
     
                   
    Financials—5.7%
                   
    Capital Markets—1.4%
                   
    Affiliated Managers Group, Inc.1
        53,390       5,297,356  
    Stifel Financial Corp.1
        62,200       3,858,888  


                9,156,244  
     
                   
    Commercial Banks—2.2%
                   
    East West Bancorp, Inc.
        257,580       5,035,689  
    First Republic Bank1
        80,240       2,336,589  
    Signature Bank1
        141,500       7,075,000  


                14,447,278  
     
                   
    Diversified Financial Services—1.1%
                   
    MSCI, Inc., Cl. A1
        175,280       6,828,909  
     
                 
    Real Estate Management & Development—1.0%
                   
    Jones Lang LaSalle, Inc.
        74,290       6,234,417  

                     
        Shares     Value  
     
    Health Care—14.6%
                   
    Biotechnology—2.5%
                   
    Alexion Pharmaceuticals, Inc.1
        143,200     $ 11,534,760  
    United Therapeutics Corp.1
        71,170       4,499,367  


                16,034,127  
     
                   
    Health Care Equipment & Supplies—2.5%
                   
    Edwards Lifesciences Corp.1
        117,380       9,488,999  
    ResMed, Inc.1
        192,840       6,679,978  


                16,168,977  
     
                   
    Health Care Providers & Services—4.0%
                   
    AmerisourceBergen Corp.
        153,700       5,244,244  
    Catalyst Health Solutions, Inc.1
        95,690       4,448,628  
    Emergency Medical Services LP, Cl. A1
        60,030       3,878,538  
    Health Management Associates, Inc., Cl. A1
        454,040       4,331,542  
    HMS Holdings Corp.1
        119,560       7,743,901  


                25,646,853  
     
                   
    Health Care Technology—1.8%
                   
    Cerner Corp.1
        52,110       4,936,901  
    SXC Health Solutions Corp.1
        158,100       6,776,166  


                11,713,067  
     
                   
    Life Sciences Tools & Services—1.3%
                   
    Illumina, Inc.1
        54,190       3,432,395  
    Waters Corp.1
        65,330       5,076,794  


                8,509,189  
     
                   
    Pharmaceuticals—2.5%
                   
    Nektar Therapeutics1
        203,640       2,616,774  
    Perrigo Co.
        90,580       5,736,431  
    Salix Pharmaceuticals Ltd.1
        35,300       1,657,688  
    Valeant Pharmaceuticals International, Inc.
        216,310       6,119,410  


                16,130,303  
     
                   
    Industrials—15.1%
                   
    Aerospace & Defense—2.7%
                   
    BE Aerospace, Inc.1
        192,730       7,136,792  
    DigitalGlobe, Inc.1
        77,970       2,472,429  
    TransDigm Group, Inc.1
        104,850       7,550,249  


                17,159,470  
     
                   
    Commercial Services & Supplies—0.8%
                   
    Stericycle, Inc.1
        67,440       5,457,245  
     
                 
    Electrical Equipment—4.1%
                   
    AMETEK, Inc.
        183,945       7,219,841  
    Polypore International, Inc.1
        100,780       4,104,769  
    Rockwell Automation, Inc.
        119,950       8,601,615  
    Roper Industries, Inc.
        82,480       6,303,946  


                26,230,171  
     
                   
    Machinery—4.5%
                   
    CNH Global NV1
        101,790       4,859,455  
    Gardner Denver, Inc.
        100,661       6,927,490  
    Joy Global, Inc.
        38,090       3,304,308  
    Parker-Hannifin Corp.
        101,440       8,754,272  
    WABCO Holdings, Inc.1
        84,310       5,137,008  


                28,982,533  
     
                   
    Road & Rail—1.3%
                   
    Kansas City Southern, Inc.1
        175,870       8,417,138  
     
                 
    Trading Companies & Distributors—1.7%
                   
    MSC Industrial Direct Co., Inc., Cl. A
        119,530       7,732,396  
    WESCO International, Inc.1
        62,640       3,307,392  


                11,039,788  
     
                   
    Information Technology—24.6%
                   
    Communications Equipment—2.8%
                   
    F5 Networks, Inc.1
        80,370       10,460,959  
    Riverbed Technology, Inc.1
        208,660       7,338,572  


                17,799,531  
     
                   
    Computers & Peripherals—0.9%
                   
    NetApp, Inc.1
        102,100       5,611,416  
     
                 
    Electronic Equipment & Instruments—1.0%
                   
    Dolby Laboratories, Inc., Cl. A1
        47,280       3,153,576  
    Trimble Navigation Ltd.1
        80,830       3,227,542  


                6,381,118  
     
                   
    Internet Software & Services—3.2%
                   
    Akamai Technologies, Inc.1
        156,740       7,374,617  
    Rackspace Hosting, Inc.1
        221,020       6,942,238  
    SINA Corp.1
        92,240       6,347,957  


                20,664,812  
     
                   
    IT Services—2.2%
                   
    Cognizant Technology Solutions Corp.1
        91,060       6,673,787  
    Syntel, Inc.
        62,600       2,991,654  
    Teradata Corp.1
        113,310       4,663,840  


                14,329,281  
     
                   
    Semiconductors & Semiconductor Equipment—6.3%
                   
    Atheros Communications, Inc.1
        136,530       4,904,158  
    Atmel Corp.1
        439,590       5,415,749  
    Broadcom Corp., Cl. A
        104,070       4,532,249  
    Cavium Networks, Inc.1
        155,850       5,872,428  
     
                     
        Shares     Value  
     
    Semiconductors & Semiconductor Equipment Continued
                   
    Netlogic Microsystems, Inc.1
        242,790     $ 7,626,034  
    Silicon Laboratories, Inc.1
        71,180       3,275,704  
    Skyworks Solutions, Inc.1
        315,140       9,022,458  


                40,648,780  
     
                   
    Software—8.2%
                   
    Citrix Systems, Inc.1
        115,400       7,894,514  
    Concur Technologies, Inc.1
        118,380       6,147,473  
    Fortinet, Inc.1
        138,780       4,489,533  
    Informatica Corp.1
        148,320       6,530,530  
    Red Hat, Inc.1
        178,930       8,168,155  
    Rovi Corp.1
        117,470       7,284,315  
    Salesforce.com, Inc.1
        58,560       7,729,920  
    TIBCO Software, Inc.1
        232,570       4,583,955  


                52,828,395  
     
                   
    Materials—5.7%
                   
    Chemicals—3.7%
                   
    Albemarle Corp.
        164,950       9,200,911  
    Lubrizol Corp. (The)
        44,730       4,780,742  
    Rockwood Holdings, Inc.1
        60,370       2,361,674  
    Solutia, Inc.1
        336,690       7,770,805  


                24,114,132  
     
                   
    Containers & Packaging—0.8%
                   
    Rock-Tenn Co., Cl. A
        97,250       5,246,638  
     
                   
    Metals & Mining—1.2%
                   
    Silver Wheaton Corp.1
        190,650       7,442,976  
     
                   
    Telecommunication Services—2.1%
                   
    Wireless Telecommunication Services—2.1%
                   
    NII Holdings, Inc.1
        192,490       8,596,603  
    SBA Communications Corp.1
        122,980       5,034,796  


                13,631,399  
     
                 
    Total Common Stocks (Cost $463,471,713)
                650,041,397  
     
                   
    Investment Companies—0.4%
                   
    JPMorgan U.S. Treasury Plus Money Market Fund, Agency Shares, 0.00%2,3
        49,708       49,708  
    Oppenheimer Institutional Money Market Fund, Cl. E, 0.21%3,4
        2,477,343       2,477,343  
     
                 
    Total Investment Companies
    (Cost $2,527,051)
                2,527,051  
     
                   
    Total Investments, at Value
    (Cost $465,998,764)
        101.2 %     652,568,448  
    Liabilities in Excess of Other Assets
        (1.2 )     (8,027,040 )
         
    Net Assets
        100.0 %   $ 644,541,408  
         
    Footnotes to Statement of Investments
    1.   Non-income producing security.
     
    2.   Interest rate is less than 0.0005%.
     
    3.   Rate shown is the 7-day yield as of December 31, 2010.
     
    4.   Is or was an affiliate, as defined in the Investment Company Act of 1940, at or during the period ended December 31, 2010, by virtue of the Fund owning at least 5% of the voting securities of the issuer or as a result of the Fund and the issuer having the same investment adviser. Transactions during the period in which the issuer was an affiliate are as follows:
                                     
        Shares     Gross     Gross     Shares  
        December 31, 2009     Additions     Reductions     December 31, 2010  
     
    Oppenheimer Institutional Money Market Fund, Cl. E
        10,877,341       247,300,053       255,700,051       2,477,343  
                                     
                        Value     Income  
     
    Oppenheimer Institutional Money Market Fund, Cl. E
                      $ 2,477,343     $ 28,145  


    Valuation Inputs
    Various data inputs are used in determining the value of each of the Fund’s investments as of the reporting period end. These data inputs are categorized in the following hierarchy under applicable financial accounting standards:
    1) Level 1—unadjusted quoted prices in active markets for identical assets or liabilities (including securities actively traded on a securities exchange)
    2) Level 2—inputs other than unadjusted quoted prices that are observable for the asset or liability (such as unadjusted quoted prices for similar assets and market corroborated inputs such as interest rates, prepayment speeds, credit risks, etc.)
    3) Level 3—significant unobservable inputs (including the Manager’s own judgments about assumptions that market participants would use in pricing the asset or liability).
    The table below categorizes amounts that are included in the Fund’s Statement of Assets and Liabilities as of December 31, 2010 based on valuation input level:
                                     
                        Level 3–        
        Level 1–     Level 2–     Significant        
        Unadjusted     Other Significant     Unobservable        
        Quoted Prices     Observable Inputs     Inputs     Value  
     
    Assets Table
                                   
    Investments, at Value:
                                   
    Common Stocks
                                   
    Consumer Discretionary
      $ 143,297,911     $     $     $ 143,297,911  
    Consumer Staples
        31,550,182                   31,550,182  
    Energy
        38,339,117                   38,339,117  
    Financials
        36,666,848                   36,666,848  
    Health Care
        94,202,516                   94,202,516  
    Industrials
        97,286,345                   97,286,345  
    Information Technology
        158,263,333                   158,263,333  
    Materials
        36,803,746                   36,803,746  
    Telecommunication Services
        13,631,399                   13,631,399  
    Investment Companies
        2,527,051                   2,527,051  
         
    Total Assets
      $ 652,568,448     $     $     $ 652,568,448  
         
    Currency contracts and forwards, if any, are reported at their unrealized appreciation/depreciation at measurement date, which represents the change in the contract’s value from trade date. Futures, if any, are reported at their variation margin at measurement date, which represents the amount due to/from the Fund at that date. All additional assets and liabilities included in the above table are reported at their market value at measurement date.
    See the accompanying Notes for further discussion of the methods used in determining value of the Fund’s investments, and a summary of changes to the valuation methodologies, if any, during the reporting period.

    STATEMENT OF ASSETS AND LIABILITIES December 31, 2010
             
    Assets
           
    Investments, at value—see accompanying statement of investments:
           
    Unaffiliated companies (cost $463,521,421)
      $ 650,091,105  
    Affiliated companies (cost $2,477,343)
        2,477,343  


        652,568,448  
     
           
    Receivables and other assets:
           
    Investments sold
        1,198,279  
    Shares of beneficial interest sold
        132,479  
    Dividends
        83,825  
    Other
        22,974  
     
         
    Total assets
        654,006,005  
     
           
    Liabilities
           
    Payables and other liabilities:
           
    Shares of beneficial interest redeemed
        9,246,382  
    Shareholder communications
        97,054  
    Transfer and shareholder servicing agent fees
        55,532  
    Trustees’ compensation
        20,834  
    Distribution and service plan fees
        18,742  
    Other
        26,053  
     
         
    Total liabilities
        9,464,597  
     
           
    Net Assets
      $ 644,541,408  


    Composition of Net Assets
           
    Par value of shares of beneficial interest
      $ 13,863  
    Additional paid-in capital
        760,866,762  
    Accumulated net investment loss
        (20,834 )
    Accumulated net realized loss on investments
        (302,888,067 )
    Net unrealized appreciation on investments
        186,569,684  
     
         
    Net Assets
      $ 644,541,408  


    Net Asset Value Per Share
           
    Non-Service Shares:
           
    Net asset value, redemption price per share and offering price per share (based on net assets of $611,872,248 and 13,144,426 shares of beneficial interest outstanding)
      $ 46.55  
    Service Shares:
           
    Net asset value, redemption price per share and offering price per share (based on net assets of $32,669,160 and 718,702 shares of beneficial interest outstanding)
      $ 45.46  


    STATEMENT OF OPERATIONS For the Year Ended December 31, 2010
             
    Investment Income
           
    Dividends:
           
    Unaffiliated companies (net of foreign withholding taxes of $37,216)
      $ 2,675,622  
    Affiliated companies
        28,145  
    Interest
        281  
     
         
    Total investment income
        2,704,048  
     
           
    Expenses
           
    Management fees
        4,152,994  
    Distribution and service plan fees—Service shares
        68,751  
    Transfer and shareholder servicing agent fees:
           
    Non-Service shares
        548,533  
    Service shares
        27,541  
    Shareholder communications:
           
    Non-Service shares
        90,387  
    Service shares
        4,600  
    Trustees’ compensation
        25,838  
    Custodian fees and expenses
        3,435  
    Administration service fees
        1,500  
    Other
        63,015  
     
         
    Total expenses
        4,986,594  
    Less waivers and reimbursements of expenses
        (551,229 )
     
         
    Net expenses
        4,435,365  
     
           
    Net Investment Loss
        (1,731,317 )
     
           
    Realized and Unrealized Gain
           
    Net realized gain on investments from unaffiliated companies
        74,149,150  
    Net change in unrealized appreciation/depreciation on investments
        71,236,219  
     
           
    Net Increase in Net Assets Resulting from Operations
      $ 143,654,052  


    STATEMENTS OF CHANGES IN NET ASSETS
                     
    Year Ended December 31,   2010     2009  
     
    Operations
                   
    Net investment loss
      $ (1,731,317 )   $ (925,079 )
    Net realized gain (loss)
        74,149,150       (78,545,847 )
    Net change in unrealized appreciation/depreciation
        71,236,219       224,373,833  
         
    Net increase in net assets resulting from operations
        143,654,052       144,902,907  
     
                   
    Beneficial Interest Transactions
                   
    Net decrease in net assets resulting from beneficial interest transactions:
                   
    Non-Service shares
        (72,544,702 )     (52,496,797 )
    Service shares
        (348,697 )     (2,261,210 )
         
     
        (72,893,399 )     (54,758,007 )
     
                   
    Net Assets
                   
    Total increase
        70,760,653       90,144,900  
    Beginning of period
        573,780,755       483,635,855  
         
    End of period (including accumulated net investment income (loss) of $(20,834) and $37,265, respectively)
      $ 644,541,408     $ 573,780,755  


    FINANCIAL HIGHLIGHTS
                                             
    Non-Service Shares   Year Ended December 31,   2010     2009     2008     2007     2006  
     
    Per Share Operating Data
                                           
    Net asset value, beginning of period
      $ 36.52     $ 27.54     $ 54.07     $ 50.85     $ 49.39  
     
    Income (loss) from investment operations:
                                           
    Net investment loss1
        (.11 )     (.05 )     (.13 )     (.02 )     (.02 )
    Net realized and unrealized gain (loss)
        10.14       9.03       (26.40 )     3.24       1.48  
         
    Total from investment operations
        10.03       8.98       (26.53 )     3.22       1.46  
     
    Net asset value, end of period
      $ 46.55     $ 36.52     $ 27.54     $ 54.07     $ 50.85  


    Total Return, at Net Asset Value2
        27.46 %     32.61 %     (49.07 )%     6.33 %     2.96 %
     
                                           
    Ratios/Supplemental Data
                                           
    Net assets, end of period (in thousands)
      $ 611,872     $ 547,683     $ 461,684     $ 1,002,442     $ 1,054,809  
     
    Average net assets (in thousands)
      $ 548,739     $ 478,968     $ 754,170     $ 1,045,592     $ 1,135,831  
     
    Ratios to average net assets:3
                                           
    Net investment loss
        (0.29 )%     (0.17 )%     (0.30 )%     (0.04 )%     (0.04 )%
    Total expenses4
        0.85 %     0.86 %     0.71 %     0.69 %     0.69 %
    Expenses after payments, waivers and/or reimbursements and reduction to custodian expenses
        0.76 %     0.71 %     0.68 %     0.69 %     0.69 %
     
    Portfolio turnover rate
        95 %     102 %     78 %     112 %     56 %
    1.   Per share amounts calculated based on the average shares outstanding during the period.
     
    2.   Assumes an initial investment on the business day before the first day of the fiscal period, with all dividends and distributions reinvested in additional shares on the reinvestment date, and redemption at the net asset value calculated on the last business day of the fiscal period. Total returns are not annualized for periods less than one full year. Total return information does not reflect expenses that apply at the separate account level or to related insurance products. Inclusion of these charges would reduce the total return figures for all periods shown. Returns do not reflect the deduction of taxes that a shareholder would pay on fund distributions or the redemption of fund shares.
     
    3.   Annualized for periods less than one full year.
     
    4.   Total expenses including indirect expenses from affiliated fund were as follows:
             
    Year Ended December 31, 2010
        0.85 %
    Year Ended December 31, 2009
        0.86 %
    Year Ended December 31, 2008
        0.71 %
    Year Ended December 31, 2007
        0.69 %
    Year Ended December 31, 2006
        0.69 %
     
                                             
    Service Shares   Year Ended December 31,   2010     2009     2008     2007     2006  
     
    Per Share Operating Data
                                           
    Net asset value, beginning of period
      $ 35.75     $ 27.03     $ 53.22     $ 50.19     $ 48.87  
     
    Income (loss) from investment operations:
                                           
    Net investment loss1
        (.20 )     (.13 )     (.24 )     (.17 )     (.16 )
    Net realized and unrealized gain (loss)
        9.91       8.85       (25.95 )     3.20       1.48  
         
    Total from investment operations
        9.71       8.72       (26.19 )     3.03       1.32  
     
    Net asset value, end of period
      $ 45.46     $ 35.75     $ 27.03     $ 53.22     $ 50.19  


    Total Return, at Net Asset Value2
        27.16 %     32.26 %     (49.21 )%     6.04 %     2.70 %
     
                                           
    Ratios/Supplemental Data
                                           
    Net assets, end of period (in thousands)
      $ 32,669     $ 26,098     $ 21,952     $ 47,270     $ 47,131  
     
    Average net assets (in thousands)
      $ 27,552     $ 22,605     $ 35,815     $ 49,421     $ 44,273  
     
    Ratios to average net assets:3
                                           
    Net investment loss
        (0.53 )%     (0.44 )%     (0.57 )%     (0.31 )%     (0.33 )%
    Total expenses4
        1.10 %     1.12 %     0.98 %     0.96 %     0.97 %
    Expenses after payments, waivers and/or reimbursements and reduction to custodian expenses
        1.01 %     0.97 %     0.95 %     0.96 %     0.97 %
     
    Portfolio turnover rate
        95 %     102 %     78 %     112 %     56 %
    1.   Per share amounts calculated based on the average shares outstanding during the period.
     
    2.   Assumes an initial investment on the business day before the first day of the fiscal period, with all dividends and distributions reinvested in additional shares on the reinvestment date, and redemption at the net asset value calculated on the last business day of the fiscal period. Total returns are not annualized for periods less than one full year. Total return information does not reflect expenses that apply at the separate account level or to related insurance products. Inclusion of these charges would reduce the total return figures for all periods shown. Returns do not reflect the deduction of taxes that a shareholder would pay on fund distributions or the redemption of fund shares.
     
    3.   Annualized for periods less than one full year.
     
    4.   Total expenses including indirect expenses from affiliated fund were as follows:
             
    Year Ended December 31, 2010
        1.10 %
    Year Ended December 31, 2009
        1.12 %
    Year Ended December 31, 2008
        0.98 %
    Year Ended December 31, 2007
        0.96 %
    Year Ended December 31, 2006
        0.97 %


    NOTES TO FINANCIAL STATEMENTS
    1. Significant Accounting Policies
    Oppenheimer Small- & Mid-Cap Growth Fund/VA (the “Fund”), formerly known as Oppenheimer MidCap Fund/VA, is a separate series of Oppenheimer Variable Account Funds, an open-end management investment company registered under the Investment Company Act of 1940, as amended. The Fund’s investment objective is to seek capital appreciation by investing in “growth type” companies. The Fund’s investment adviser is OppenheimerFunds, Inc. (the “Manager”).
         The Fund offers two classes of shares. Both classes are sold at their offering price, which is the net asset value per share, to separate investment accounts of participating insurance companies as an underlying investment for variable life insurance policies, variable annuity contracts or other investment products. The class of shares designated as Service shares is subject to a distribution and service plan. Both classes of shares have identical rights and voting privileges with respect to the Fund in general and exclusive voting rights on matters that affect that class alone. Earnings, net assets and net asset value per share may differ due to each class having its own expenses, such as transfer and shareholder servicing agent fees and shareholder communications, directly attributable to that class.
         The following is a summary of significant accounting policies consistently followed by the Fund.
    Securities Valuation. The Fund calculates the net asset value of its shares as of the close of the New York Stock Exchange (the “Exchange”), normally 4:00 P.M. Eastern time, on each day the Exchange is open for trading.
         Each investment asset or liability of the Fund is assigned a level at measurement date based on the significance and source of the inputs to its valuation. Unadjusted quoted prices in active markets for identical securities are classified as “Level 1,” inputs other than unadjusted quoted prices for an asset that are observable are classified as “Level 2” and significant unobservable inputs, including the Manager’s judgment about the assumptions that a market participant would use in pricing an asset or liability, are classified as “Level 3.” The inputs used for valuing securities are not necessarily an indication of the risks associated with investing in those securities. A table summarizing the Fund’s investments under these levels of classification is included following the Statement of Investments.
         Securities are valued using unadjusted quoted market prices, when available, as supplied primarily by portfolio pricing services approved by the Board of Trustees or dealers.
         Securities traded on a registered U.S. securities exchange are valued based on the last sale price of the security reported on the principal exchange on which it is traded, prior to the time when the Fund’s assets are valued. Securities whose principal exchange is NASDAQ® are valued based on the official closing prices reported by NASDAQ prior to the time when the Fund’s assets are valued. In the absence of a sale, the security is valued at the last sale price on the prior trading day, if it is within the spread of the current day’s closing “bid” and “asked” prices, and if not, at the current day’s closing bid price. A foreign security traded on a foreign exchange is valued based on the last sale price on the principal exchange on which the security is traded, as identified by the portfolio pricing service used by the Manager, prior to the time when the Fund’s assets are valued. In the absence of a sale, the security is valued at the most recent official closing price on the principal exchange on which it is traded.
         Shares of a registered investment company that are not traded on an exchange are valued at that investment company’s net asset value per share.
         U.S. domestic and international debt instruments (including corporate, government, municipal, mortgage-backed, collateralized mortgage obligations and asset-backed securities) and “money market-type” debt instruments with a remaining maturity in excess of sixty days are valued at the mean between the “bid” and “asked” prices utilizing price quotations obtained from independent pricing services or broker-dealers. Such prices are typically determined based upon information obtained from market participants including reported trade data, broker-dealer price quotations and inputs such as benchmark yields and issuer spreads from identical or similar securities.
         “Money market-type” debt instruments with remaining maturities of sixty days or less are valued at cost adjusted by the amortization of discount or premium to maturity (amortized cost), which approximates market value.
         In the absence of a readily available unadjusted quoted market price, including for securities whose values have been materially affected by what the Manager identifies as a significant event occurring before the Fund’s assets are valued but after the close of the securities’ respective exchanges, the Manager, acting through its internal valuation committee, in good faith determines the fair valuation of that asset using consistently applied procedures under the supervision of the Board of Trustees (which reviews those fair valuations by the Manager). Those procedures include certain standardized methodologies to fair value securities. Such methodologies include, but are not limited to, pricing securities initially at cost and subsequently adjusting the value based on: changes in company specific fundamentals, changes in an appropriate securities index, or changes in the value of similar securities which may be adjusted for any discounts related to resale restrictions. When possible, such methodologies use observable market inputs such as unadjusted quoted prices of similar securities, observable interest rates, currency rates and yield curves. The methodologies used for valuing securities are not necessarily an indication of the risks associated with investing in those securities.
         There have been no significant changes to the fair valuation methodologies of the Fund during the period.
    Investment in Oppenheimer Institutional Money Market Fund. The Fund is permitted to invest daily available cash balances in an affiliated money market fund. The Fund may invest the available cash in Class E shares of Oppenheimer Institutional Money Market Fund (“IMMF”) to seek current income while preserving liquidity. IMMF is a registered open-end management investment company, regulated as a money market fund under the Investment Company Act of 1940, as amended. The Manager is also the investment adviser of IMMF. When applicable, the Fund’s investment in IMMF is included in the Statement of Investments. Shares of IMMF are valued at their net asset value per share. As a shareholder, the Fund is subject to its proportional share of IMMF’s Class E expenses, including its management fee. The Manager will waive fees and/or reimburse Fund expenses in an amount equal to the indirect management fees incurred through the Fund’s investment in IMMF.
    Foreign Currency Translation. The Fund’s accounting records are maintained in U.S. dollars. The values of securities denominated in foreign currencies and amounts related to the purchase and sale of foreign securities and foreign investment income are translated into U.S. dollars as of the close of the Exchange, normally 4:00 P.M. Eastern time, on each day the Exchange is open for trading. Foreign exchange rates may be valued primarily using a reliable bank, dealer or service authorized by the Board of Trustees.
         Reported net realized gains and losses from foreign currency transactions arise from sales of portfolio securities, sales and maturities of short-term securities, sales of foreign currencies, exchange rate fluctuations between the trade and settlement dates on securities transactions, and the difference between the amounts of dividends, interest, and foreign withholding taxes recorded on the Fund’s books and the U.S. dollar equivalent of the amounts actually received or paid. Net unrealized appreciation and depreciation on the translation of assets and liabilities denominated in foreign currencies arise from changes in the values of assets and liabilities, including investments in securities at fiscal period end, resulting from changes in exchange rates.
         The effect of changes in foreign currency exchange rates on investments is separately identified from the fluctuations arising from changes in market values of securities held and reported with all other foreign currency gains and losses in the Fund’s Statement of Operations.
    Allocation of Income, Expenses, Gains and Losses. Income, expenses (other than those attributable to a specific class), gains and losses are allocated on a daily basis to each class of shares based upon the relative proportion of net assets represented by such class. Operating expenses directly attributable to a specific class are charged against the operations of that class.
    Federal Taxes. The Fund intends to comply with provisions of the Internal Revenue Code applicable to regulated investment companies and to distribute substantially all of its investment company taxable income, including any net realized gain on investments not offset by capital loss carryforwards, if any, to shareholders. Therefore, no federal income or excise tax provision is required. The Fund files income tax returns in U.S. federal and applicable state jurisdictions. The statute of limitations on the Fund’s tax return filings generally remain open for the three preceding fiscal reporting period ends. 

    The tax components of capital shown in the following table represent distribution requirements the Fund must satisfy under the income tax regulations, losses the Fund may be able to offset against income and gains realized in future years and unrealized appreciation or depreciation of securities and other investments for federal income tax purposes.
                             
                        Net Unrealized Appreciation  
                        Based on Cost  
    Undistributed   Undistributed     Accumulated     of Securities and Other  
    Net Investment   Long-Term     Loss     Investments for Federal  
    Income   Gain     Carryforward1,2,3,4     Income Tax Purposes  
     
    $—
      $     $ 301,034,992     $ 184,716,600  
    1.   As of December 31, 2010, the Fund had $301,034,992 of net capital loss carryforwards available to offset future realized capital gains, if any, and thereby reduce future taxable gain distributions. As of December 31, 2010, details of the capital loss carryforward were as follows:
             
    Expiring        
     
    2017
      $ 301,034,992  
    2.   During the fiscal year ended December 31, 2010, the Fund utilized $72,390,451 of capital loss carryforward to offset capital gains realized in that fiscal year.
     
    3.   During the fiscal year ended December 31, 2009, the Fund did not utilize any capital loss carryforward.
     
    4.   During the fiscal year ended December 31, 2010, $157,834,371 of unused capital loss carryforward expired.
    Net investment income (loss) and net realized gain (loss) may differ for financial statement and tax purposes. The character of dividends and distributions made during the fiscal year from net investment income or net realized gains may differ from their ultimate characterization for federal income tax purposes. Also, due to timing of dividends and distributions, the fiscal year in which amounts are distributed may differ from the fiscal year in which the income or net realized gain was recorded by the Fund.
    Accordingly, the following amounts have been reclassified for December 31, 2010. Net assets of the Fund were unaffected by the reclassifications.
                     
                Reduction  
        Reduction     to Accumulated  
    Reduction   to Accumulated Net     Net Realized  
    to Paid-in Capital   Investment Loss     Loss on Investments  
     
    $159,508,986
      $ 1,673,218     $ 157,835,768  
    No distributions were paid during the years ended December 31, 2010 and December 31, 2009.
    The aggregate cost of securities and other investments and the composition of unrealized appreciation and depreciation of securities and other investments for federal income tax purposes as of December 31, 2010 are noted in the following table. The primary difference between book and tax appreciation or depreciation of securities and other investments, if applicable, is attributable to the tax deferral of losses or tax realization of financial statement unrealized gain or loss.
             
    Federal tax cost of securities
      $ 467,851,848  


    Gross unrealized appreciation
      $ 185,300,459  
    Gross unrealized depreciation
        (583,859 )
     
         
    Net unrealized appreciation
      $ 184,716,600  
     
         
    Trustees’ Compensation. The Board of Trustees has adopted a compensation deferral plan for independent trustees that enables trustees to elect to defer receipt of all or a portion of the annual compensation they are entitled to receive from the Fund. For purposes of determining the amount owed to the Trustee under the plan, deferred amounts are treated as though equal dollar amounts had been invested in shares of the Fund or in other Oppenheimer funds selected by the Trustee. The Fund purchases shares of the funds selected for deferral by the Trustee in amounts equal to his or her deemed investment, resulting in a Fund asset equal to the deferred compensation liability. Such assets are included as a component of “Other” within the asset section of the Statement of Assets and Liabilities. Deferral of trustees’ fees under the plan will not affect the net assets of the Fund, and will not materially affect the Fund’s assets, liabilities or net investment income per share. Amounts will be deferred until distributed in accordance with the compensation deferral plan.
    Dividends and Distributions to Shareholders. Dividends and distributions to shareholders, which are determined in accordance with income tax regulations and may differ from U.S. generally accepted accounting principles, are recorded on the ex-dividend date. Income and capital gain distributions, if any, are declared and paid annually or at other times as deemed necessary by the Manager.
    Investment Income. Dividend income is recorded on the ex-dividend date or upon ex-dividend notification in the case of certain foreign dividends where the ex-dividend date may have passed. Non-cash dividends included in dividend income, if any, are recorded at the fair market value of the securities received. Interest income is recognized on an accrual basis. Discount and premium, which are included in interest income on the Statement of Operations, are amortized or accreted daily.
    Custodian Fees. “Custodian fees and expenses” in the Statement of Operations may include interest expense incurred by the Fund on any cash overdrafts of its custodian account during the period. Such cash overdrafts may result from the effects of failed trades in portfolio securities and from cash outflows resulting from unanticipated shareholder redemption activity. The Fund pays interest to its custodian on such cash overdrafts, to the extent they are not offset by positive cash balances maintained by the Fund, at a rate equal to the Federal Funds Rate plus 0.50%. The “Reduction to custodian expenses” line item, if applicable, represents earnings on cash balances maintained by the Fund during the period. Such interest expense and other custodian fees may be paid with these earnings.
    Security Transactions. Security transactions are recorded on the trade date. Realized gains and losses on securities sold are determined on the basis of identified cost.
    Indemnifications. The Fund’s organizational documents provide current and former trustees and officers with a limited indemnification against liabilities arising in connection with the performance of their duties to the Fund. In the normal course of business, the Fund may also enter into contracts that provide general indemnifications. The Fund’s maximum exposure under these arrangements is unknown as this would be dependent on future claims that may be made against the Fund. The risk of material loss from such claims is considered remote.
    Other. The preparation of financial statements in conformity with accounting principles generally accepted in the United States of America requires management to make estimates and assumptions that affect the reported amounts of assets and liabilities and disclosure of contingent assets and liabilities at the date of the financial statements and the reported amounts of increases and decreases in net assets from operations during the reporting period. Actual results could differ from those estimates.
    2. Shares of Beneficial Interest
    The Fund has authorized an unlimited number of $0.001 par value shares of beneficial interest of each class. Transactions in shares of beneficial interest were as follows:
                                     
        Year Ended December 31, 2010     Year Ended December 31, 2009  
        Shares     Amount     Shares     Amount  
     
    Non-Service Shares
                                   
    Sold
        660,517     $ 26,701,795       730,850     $ 22,021,499  
    Redeemed
        (2,513,826 )     (99,246,497 )     (2,496,465 )     (74,518,296 )
         
    Net decrease
        (1,853,309 )   $ (72,544,702 )     (1,765,615 )   $ (52,496,797 )


    Service Shares
                                   
    Sold
        170,363     $ 6,822,078       97,563     $ 2,820,902  
    Redeemed
        (181,692 )     (7,170,775 )     (179,541 )     (5,082,112 )
         
    Net decrease
        (11,329 )   $ (348,697 )     (81,978 )   $ (2,261,210 )
         

    3. Purchases and Sales of Securities
    The aggregate cost of purchases and proceeds from sales of securities, other than short-term obligations and investments in IMMF, for the year ended December 31, 2010, were as follows:
                     
        Purchases   Sales  
     
    Investment securities
      $ 536,304,551     $ 597,025,225  
    4. Fees and Other Transactions with Affiliates
    Management Fees. Under the investment advisory agreement, the Fund pays the Manager a management fee based on the daily net assets of the Fund at an annual rate as shown in the following table:
             
    Fee Schedule        
     
    Up to $200 million
        0.75 %
    Next $200 million
        0.72  
    Next $200 million
        0.69  
    Next $200 million
        0.66  
    Next $700 million
        0.60  
    Over $1.5 billion
        0.58  
    Administration Service Fees. The Fund pays the Manager a fee of $1,500 per year for preparing and filing the Fund’s tax returns.
    Transfer Agent Fees. OppenheimerFunds Services (“OFS”), a division of the Manager, acts as the transfer and shareholder servicing agent for the Fund. The Fund pays OFS fees at an annual rate of 0.10% of the daily net assets of each class of shares. For the year ended December 31, 2010, the Fund paid $568,665 to OFS for services to the Fund.
    Distribution and Service Plan for Service Shares. The Fund has adopted a Distribution and Service Plan (the “Plan”) in accordance with Rule 12b-1 under the Investment Company Act of 1940 for Service shares to pay OppenheimerFunds Distributor, Inc. (the “Distributor”), for distribution related services, personal service and account maintenance for the Fund’s Service shares. Under the Plan, payments are made periodically at an annual rate of 0.25% of the daily net assets of Service shares of the Fund. The Distributor currently uses all of those fees to compensate sponsors of the insurance product that offers Fund shares, for providing personal service and maintenance of accounts of their variable contract owners that hold Service shares. These fees are paid out of the Fund’s assets on an on-going basis and increase operating expenses of the Service shares, which results in lower performance compared to the Fund’s shares that are not subject to a service fee. Fees incurred by the Fund under the Plan are detailed in the Statement of Operations.
    Waivers and Reimbursements of Expenses. From April 1, 2009 through March 31, 2010, the Manager voluntarily waived its advisory fee by 0.09% of the Fund’s average annual net assets. Effective April 1, 2010 through August 31, 2010, the Manager voluntarily agreed to waive its advisory fee by 0.05% of the Fund’s average daily net assets. During the year ended December 31, 2010, the Manager waived $243,506 in advisory fees as a result of these voluntary arrangements. These voluntary undertakings were applied after all other waivers and/or reimbursements.
         The Manager has voluntarily agreed to limit the Fund’s total annual operating expenses so that those expenses, as percentages of daily net assets, will not exceed the annual rate of 0.80% for Non-Service shares and 1.05% for Service shares. During the year ended December 31, 2010, the Manager waived fees and/or reimbursed the Fund $282,216 and $14,086 for Non-Service and Service shares, respectively.
         The Manager will waive fees and/or reimburse Fund expenses in an amount equal to the indirect management fees incurred through the Fund’s investment in IMMF. During the year ended December 31, 2010, the Manager waived fees and/or reimbursed the Fund $11,421 for IMMF management fees.
         Some of these undertakings may be modified or terminated at any time; some may not be modified or terminated until after one year from the date of the current prospectus, as indicated therein.
     
    5. Pending Litigation
    Since 2009, a number of lawsuits have been pending in federal courts against the Manager, the Distributor, and certain mutual funds (“Defendant Funds”) advised by the Manager and distributed by the Distributor (but not including the Fund). The lawsuits naming the Defendant Funds also name as defendants certain officers and current and former trustees of the respective Defendant Funds. The plaintiffs seek class action status on behalf of purchasers of shares of the respective Defendant Fund during a particular time period. The lawsuits raise claims under federal securities laws alleging that, among other things, the disclosure documents of the respective Defendant Fund contained misrepresentations and omissions, that such Defendant Fund’s investment policies were not followed, and that such Defendant Fund and the other defendants violated federal securities laws and regulations. The plaintiffs seek unspecified damages, equitable relief and an award of attorneys’ fees and litigation expenses.
         In 2009, what are claimed to be derivative lawsuits were filed in state court against the Manager and a subsidiary (but not against the Fund), on behalf of the New Mexico Education Plan Trust. These lawsuits allege breach of contract, breach of fiduciary duty, negligence and violation of state securities laws, and seek compensatory damages, equitable relief and an award of attorneys’ fees and litigation expenses.
         Other lawsuits have been filed since 2008 in various state and federal courts, against the Manager and certain of its affiliates. Those lawsuits were filed by investors who made investments through an affiliate of the Manager, and relate to the alleged investment fraud perpetrated by Bernard Madoff and his firm (“Madoff ”). Those suits allege a variety of claims, including breach of fiduciary duty, fraud, negligent misrepresentation, unjust enrichment, and violation of federal and state securities laws and regulations, among others. They seek unspecified damages, equitable relief and an award of attorneys’ fees and litigation expenses. None of the suits have named the Distributor, any of the Oppenheimer mutual funds or any of their independent Trustees or Directors as defendants. None of the Oppenheimer funds invested in any funds or accounts managed by Madoff.
         The Manager believes that the lawsuits described above are without legal merit and is defending against them vigorously. The Defendant Funds’ Boards of Trustees have also engaged counsel to defend the suits brought against those Funds and the present and former Independent Trustees named in those suits. While it is premature to render any opinion as to the outcome in these lawsuits, or whether any costs that the Defendant Funds may bear in defending the suits might not be reimbursed by insurance, the Manager believes that these suits should not impair the ability of the Manager or the Distributor to perform their respective duties to the Fund, and that the outcome of all of the suits together should not have any material effect on the operations of any of the Oppenheimer funds.
    6. Subsequent Event
    The Regulated Investment Company Modernization Act of 2010 (the “Act”) was signed into law on December 22, 2010. The Act makes changes to a number of tax rules impacting the Fund. Under the Act, future capital losses generated by a fund may be carried over indefinitely, but these losses must be used prior to the utilization of any pre-enactment capital losses. Since pre-enactment capital losses may only be carried forward for eight years, there may be a greater likelihood that all or a portion of a fund’s pre-enactment capital losses will expire unused. In general, the provisions of the Act will be effective for the Fund’s fiscal year ending December 31, 2011. Specific information regarding the impact of the Act on the Fund will be contained within the “Federal Taxes” section of the financial statement notes for the fiscal year ending December 31, 2011.


    REPORT OF INDEPENDENT REGISTERED PUBLIC ACCOUNTING FIRM
    The Board of Trustees and Shareholders of Oppenheimer Variable Account Funds:
    We have audited the accompanying statement of assets and liabilities of Oppenheimer Value Fund/VA, (one of the portfolios constituting the Oppenheimer Variable Account Funds), including the statement of investments, as of December 31, 2010, and the related statement of operations for the year then ended, and the statements of changes in net assets and the financial highlights for each of the years in the two-year period then ended. These financial statements and financial highlights are the responsibility of the Fund’s management. Our responsibility is to express an opinion on these financial statements and financial highlights based on our audits. The accompanying financial highlights of Oppenheimer Value Fund/VA for the years ended prior to January 1, 2009 were audited by other auditors whose report dated February 11, 2009 expressed an unqualified opinion on those financial highlights.
         We conducted our audits in accordance with the standards of the Public Company Accounting Oversight Board (United States). Those standards require that we plan and perform the audit to obtain reasonable assurance about whether the financial statements and financial highlights are free of material misstatement. An audit includes examining, on a test basis, evidence supporting the amounts and disclosures in the financial statements. Our procedures included confirmation of securities owned as of December 31, 2010, by correspondence with the custodian, transfer agent and brokers, or by other appropriate auditing procedures where replies from brokers were not received. An audit also includes assessing the accounting principles used and significant estimates made by management, as well as evaluating the overall financial statement presentation. We believe that our audits provide a reasonable basis for our opinion.
         In our opinion, the financial statements and financial highlights referred to above present fairly, in all material respects, the financial position of Oppenheimer Value Fund/VA as of December 31, 2010, and the results of its operations for the year then ended, and the changes in its net assets and the financial highlights for each of the years in the two-year period then ended, in conformity with U.S. generally accepted accounting principles.
    /s/ KPMG llp
    Denver, Colorado
    February 16, 2011
     

    STATEMENT OF INVESTMENTS December 31, 2010
                     
        Shares     Value  
     
    Common Stocks—96.3%
                   
    Consumer Discretionary—10.7%
                   
    Auto Components—1.8%
                   
    Lear Corp.1
        1,350     $ 133,259  
    Household Durables—1.8%
                   
    Mohawk Industries, Inc.1
        2,360       133,954  
    Media—5.6%
                   
    Comcast Corp., Cl. A
        6,010       132,040  
    Time Warner Cable, Inc.
        1,610       106,308  
    Viacom, Inc., Cl. B
        4,470       177,057  


                415,405  
     
                   
    Multiline Retail—1.5%
                   
    Target Corp.
        1,870       112,443  
    Consumer Staples—5.9%
                   
    Beverages—2.8%
                   
    Coca-Cola Co. (The)
        3,110       204,545  
    Food & Staples Retailing—1.5%
                   
    Walgreen Co.
        2,934       114,309  
    Household Products—1.6%
                   
    Church & Dwight Co., Inc.
        1,730       119,405  
    Energy—11.7%
                   
    Energy Equipment & Services—3.2%
                   
    Halliburton Co.
        5,840       238,447  
    Oil, Gas & Consumable Fuels—8.5%
                   
    Chevron Corp.
        3,500       319,375  
    CONSOL Energy, Inc.
        1,640       79,934  
    Exxon Mobil Corp.
        2,014       147,264  
    Royal Dutch Shell plc, ADR
        1,200       80,136  


                626,709  
     
                   
    Financials—22.9%
                   
    Capital Markets—4.0%
                   
    E*TRADE Financial Corp.1
        2,301       36,816  
    Goldman Sachs Group, Inc. (The)
        460       77,354  
    State Street Corp.
        3,860       178,872  


                293,042  
     
                   
    Commercial Banks—8.6%
                   
    CIT Group, Inc.1
        3,110       146,481  
    Comerica, Inc.
        2,440       103,066  
    PNC Financial Services Group, Inc.
        1,760       106,867  
    U.S. Bancorp
        4,430       119,477  
    Wells Fargo & Co.
        5,100       158,049  


                633,940  
     
                   
    Diversified Financial Services—3.9%
                   
    JPMorgan Chase & Co.
        6,890       292,274  
     
                   
    Insurance—6.4%
                   
    ACE Ltd.
        2,380       148,155  
    CNO Financial Group, Inc.1
        6,660       45,155  
    MetLife, Inc.
        4,940       219,534  
    Prudential Financial, Inc.
        1,060       62,233  


                475,077  
     
                   
    Health Care—13.6%
                   
    Biotechnology—3.6%
                   
    Amgen, Inc.1
        2,530       138,897  
    Gilead Sciences, Inc.1
        3,440       124,666  


                263,563  
     
                   
    Health Care Providers & Services—3.6%
                   
    Humana, Inc.1
        2,440       133,566  
    WellPoint, Inc.1
        2,360       134,190  


                267,756  
     
                   
    Pharmaceuticals—6.4%
                   
    Merck & Co., Inc.
        5,800       209,032  
    Pfizer, Inc.
        15,169       265,609  


                474,641  
     
                   
    Industrials—10.6%
                   
    Aerospace & Defense—1.1%
                   
    AerCap Holdings NV1
        5,890       83,167  
    Airlines—1.3%
                   
    United Continental Holdings, Inc.1
        3,960       94,327  
    Electrical Equipment—0.8%
                   
    Babcock & Wilcox Co.1
        2,240       57,322  
    Industrial Conglomerates—1.4%
                   
    Tyco International Ltd.
        2,440       101,114  
    Machinery—4.0%
                   
    Ingersoll-Rand plc
        3,730       175,646  
    Navistar International Corp.1
        2,063       119,468  


                295,114  
     
                   
    Road & Rail—2.0%
                   
    Norfolk Southern Corp.
        2,420       152,020  
    Information Technology—6.2%
                   
    Communications Equipment—3.1%
                   
    Harris Corp.
        3,250       147,221  
    QUALCOMM, Inc.
        1,650       81,659  


                228,880  
     
                   
    Office Electronics—1.1%
                   
    Xerox Corp.
        6,890       79,373  
    Software—2.0%
                   
    Microsoft Corp.
        5,430       151,606  
     
                     
        Shares     Value  
     
    Materials—4.7%
                   
    Chemicals—3.7%
                   
    Celanese Corp., Series A
        3,770     $ 155,211  
    Potash Corp. of Saskatchewan, Inc.
        740       114,574  


                269,785  
     
                   
    Metals & Mining—1.0%
                   
    Allegheny Technologies, Inc.
        1,370       75,597  
    Telecommunication Services—4.0%
                   
    Diversified Telecommunication Services—3.0%
                   
    AT&T, Inc.
        7,592       223,053  
    Wireless Telecommunication Services—1.0%
                   
    Vodafone Group plc, Sponsored ADR
        2,630       69,511  
    Utilities—6.0%
                   
    Electric Utilities—5.6%
                   
    American Electric Power Co., Inc.
        1,950       70,161  
    Edison International, Inc.
        4,330       167,138  
    Entergy Corp.
        2,500       177,075  


                414,374  
     
                   
    Multi-Utilities—0.4%
                   
    NiSource, Inc.
        1,750       30,835  
     
                 
    Total Common Stocks (Cost $5,840,217)
                7,124,847  
     
                   
    Investment Companies—3.8%
                   
    JPMorgan U.S. Treasury Plus Money Market Fund, Agency Shares, 0.00%2,3
        51,310       51,310  
    Oppenheimer Institutional Money Market Fund, Cl. E, 0.21%2,4
        230,823       230,823  


    Total Investment Companies
    (Cost $282,133)
                282,133  
     
                   
    Total Investments, at Value
    (Cost $6,122,350)
        100.1 %     7,406,980  
    Liabilities in Excess of Other Assets
        (0.1 )     (3,789 )


    Net Assets
        100.0 %   $ 7,403,191  
         
    Footnotes to Statement of Investments
    1.   Non-income producing security.
     
    2.   Rate shown is the 7-day yield as of December 31, 2010.
     
    3.   Interest rate is less than 0.0005%.
     
    4.   Is or was an affiliate, as defined in the Investment Company Act of 1940, at or during the period ended December 31, 2010, by virtue of the Fund owning at least 5% of the voting securities of the issuer or as a result of the Fund and the issuer having the same investment adviser. Transactions during the period in which the issuer was an affiliate are as follows:
                                     
        Shares     Gross     Gross     Shares  
        December 31, 2009     Additions     Reductions     December 31, 2010  
     
    Oppenheimer Institutional Money Market Fund, Cl. E
        340,073       4,624,129       4,733,379       230,823  
                     
        Value     Income  
     
    Oppenheimer Institutional Money Market Fund, Cl. E
      $ 230,823     $ 560  
    Valuation Inputs
    Various data inputs are used in determining the value of each of the Fund’s investments as of the reporting period end. These data inputs are categorized in the following hierarchy under applicable financial accounting standards:
    1)   Level 1—unadjusted quoted prices in active markets for identical assets or liabilities (including securities actively traded on a securities exchange)
    2)   Level 2—inputs other than unadjusted quoted prices that are observable for the asset or liability (such as unadjusted quoted prices for similar assets and market corroborated inputs such as interest rates, prepayment speeds, credit risks, etc.)
    3)   Level 3—significant unobservable inputs (including the Manager’s own judgments about assumptions that market participants would use in pricing the asset or liability).
    The table below categorizes amounts that are included in the Fund’s Statement of Assets and Liabilities as of December 31, 2010 based on valuation input level:
                                     
                        Level 3 –        
        Level 1 –     Level 2 –     Significant        
        Unadjusted     Other Significant     Unobservable        
        Quoted Prices     Observable Inputs     Inputs     Value  
     
    Assets Table
                                   
    Investments, at Value:
                                   
    Common Stocks
                                   
    Consumer Discretionary
      $ 795,061     $     $     $ 795,061  
    Consumer Staples
        438,259                   438,259  
    Energy
        865,156                   865,156  
    Financials
        1,694,333                   1,694,333  
    Health Care
        1,005,960                   1,005,960  
    Industrials
        783,064                   783,064  
    Information Technology
        459,859                   459,859  
    Materials
        345,382                   345,382  
    Telecommunication Services
        292,564                   292,564  
    Utilities
        445,209                   445,209  
    Investment Companies
        282,133                   282,133  
         
    Total Assets
      $ 7,406,980     $     $     $ 7,406,980  
         
    Currency contracts and forwards, if any, are reported at their unrealized appreciation/depreciation at measurement date, which represents the change in the contract’s value from trade date. Futures, if any, are reported at their variation margin at measurement date, which represents the amount due to/from the Fund at that date. All additional assets and liabilities included in the above table are reported at their market value at measurement date.
    See the accompanying Notes for further discussion of the methods used in determining value of the Fund’s investments, and a summary of changes to the valuation methodologies, if any, during the reporting period.


    STATEMENT OF ASSETS AND LIABILITIES December 31, 2010
             
    Assets
           
    Investments, at value—see accompanying statement of investments:
           
    Unaffiliated companies (cost $5,891,527)
      $ 7,176,157  
    Affiliated companies (cost $230,823)
        230,823  


        7,406,980  
     
           
    Receivables and other assets:
           
    Shares of beneficial interest sold
        40,353  
    Dividends
        6,292  
    Other
        6,236  
     
         
    Total assets
        7,459,861  
     
           
    Liabilities
           
    Payables and other liabilities:
           
    Legal, auditing and other professional fees
        20,589  
    Shareholder communications
        14,788  
    Investments purchased
        8,334  
    Trustees’ compensation
        4,406  
    Distribution and service plan fees
        4,309  
    Shares of beneficial interest redeemed
        1,260  
    Transfer and shareholder servicing agent fees
        609  
    Other
        2,375  
     
         
    Total liabilities
        56,670  
     
           
    Net Assets
      $ 7,403,191  


    Composition of Net Assets
           
    Par value of shares of beneficial interest
      $ 726  
    Additional paid-in capital
        8,010,434  
    Accumulated net investment income
        60,637  
    Accumulated net realized loss on investments
        (1,953,236 )
    Net unrealized appreciation on investments
        1,284,630  
     
         
    Net Assets
      $ 7,403,191  


    Net Asset Value Per Share
           
    Non-Service Shares:
           
    Net asset value, redemption price per share and offering price per share
    (based on net assets of $92,048 and 10,836 shares of beneficial interest outstanding)
      $ 8.49  
    Service Shares:
           
    Net asset value, redemption price per share and offering price per share
    (based on net assets of $7,311,143 and 714,794 shares of beneficial interest outstanding)
      $ 10.23  


    STATEMENT OF OPERATIONS For the Year Ended December 31, 2010
             
    Investment Income
           
    Dividends:
           
    Unaffiliated companies (net of foreign withholding taxes of $801)
      $ 124,863  
    Affiliated companies
        560  
    Interest
        3  
     
         
    Total investment income
        125,426  
     
           
    Expenses
           
    Management fees
        52,993  
    Distribution and service plan fees—Service shares
        17,522  
    Transfer and shareholder servicing agent fees:
           
    Non-Service shares
        57  
    Service shares
        7,009  
    Shareholder communications:
           
    Non-Service shares
        270  
    Service shares
        24,190  
    Legal, auditing and other professional fees
        28,401  
    Trustees’ compensation
        7,802  
    Administration service fees
        1,500  
    Custodian fees and expenses
        100  
    Other
        6,818  
     
         
    Total expenses
        146,662  
    Less waivers and reimbursements of expenses
        (81,418 )
     
         
    Net expenses
        65,244  
     
           
    Net Investment Income
        60,182  
     
           
    Realized and Unrealized Gain
           
    Net realized gain on investments from unaffiliated companies
        524,533  
    Net change in unrealized appreciation/depreciation on investments
        356,769  
     
           
    Net Increase in Net Assets Resulting from Operations
      $ 941,484  


    STATEMENTS OF CHANGES IN NET ASSETS
                     
    Year Ended December 31,   2010     2009  
     
    Operations
                   
    Net investment income
      $ 60,182     $ 60,719  
    Net realized gain (loss)
        524,533       (236,784 )
    Net change in unrealized appreciation/depreciation
        356,769       1,768,926  
         
    Net increase in net assets resulting from operations
        941,484       1,592,861  
     
                   
    Dividends and/or Distributions to Shareholders
                   
    Dividends from net investment income:
                   
    Non-Service shares
        (479 )     (103 )
    Service shares
        (64,271 )     (9,896 )
         
     
        (64,750 )     (9,999 )
     
                   
    Beneficial Interest Transactions
                   
    Net increase (decrease) in net assets resulting from beneficial interest transactions:
                   
    Non-Service shares
        42,114       23,026  
    Service shares
        (1,058,473 )     1,240,784  
         
     
        (1,016,359 )     1,263,810  
     
                   
    Net Assets
                   
    Total increase (decrease)
        (139,625 )     2,846,672  
    Beginning of period
        7,542,816       4,696,144  
         
    End of period (including accumulated net investment income of $60,637 and $53,310, respectively)
      $ 7,403,191     $ 7,542,816  


    FINANCIAL HIGHLIGHTS
                                             
    Non-Service Shares     Year Ended December 31,   2010     2009     2008     2007     2006  
     
    Per Share Operating Data
                                           
    Net asset value, beginning of period
      $ 7.22     $ 4.99     $ 11.73     $ 11.58     $ 11.16  
     
    Income (loss) from investment operations:
                                           
    Net investment income (loss)1
        .11       .11       .12       .10       (.03 )
    Net realized and unrealized gain (loss)
        1.24       2.14       (4.44 )     .59       1.61  
         
    Total from investment operations
        1.35       2.25       (4.32 )     .69       1.58  
     
    Dividends and/or distributions to shareholders:
                                           
    Dividends from net investment income
        (.08 )     (.02 )     (2.42 )     (.10 )     (.01 )
    Distributions from net realized gain
                          (.44 )     (1.15 )
         
    Total dividends and/or distributions to shareholders
        (.08 )     (.02 )     (2.42 )     (.54 )     (1.16 )


    Net asset value, end of period
      $ 8.49     $ 7.22     $ 4.99     $ 11.73     $ 11.58  


    Total Return, at Net Asset Value2
        18.85 %     45.08 %     (36.43 )%     5.89 %     14.03 %
     
                                           
    Ratios/Supplemental Data
                                           
    Net assets, end of period (in thousands)
      $ 92     $ 38     $ 6     $ 1,728     $ 2,657  
     
    Average net assets (in thousands)
      $ 57     $ 20     $ 857     $ 2,753     $ 2,695  
     
    Ratios to average net assets:3
                                           
    Net investment income (loss)
        1.46 %     1.75 %     1.07 %     0.80 %     (0.29 )%
    Total expenses4
        2.05 %     2.30 %     1.48 %     1.49 %     2.14 %
    Expenses after payments, waivers and/or reimbursements and reduction to custodian expenses
        0.57 %     0.85 %     1.25 %     1.25 %     2.14 %
     
    Portfolio turnover rate
        109 %     122 %     175 %     142 %     124 %
    1.   Per share amounts calculated based on the average shares outstanding during the period.
     
    2.   Assumes an initial investment on the business day before the first day of the fiscal period, with all dividends and distributions reinvested in additional shares on the reinvestment date, and redemption at the net asset value calculated on the last business day of the fiscal period. Total returns are not annualized for periods less than one full year. Total return information does not reflect expenses that apply at the separate account level or to related insurance products. Inclusion of these charges would reduce the total return figures for all periods shown. Returns do not reflect the deduction of taxes that a shareholder would pay on fund distributions or the redemption of fund shares.
     
    3.   Annualized for periods less than one full year.
     
    4.   Total expenses including indirect expenses from affiliated fund were as follows:
             
    Year Ended December 31, 2010
        2.05 %
    Year Ended December 31, 2009
        2.31 %
    Year Ended December 31, 2008
        1.48 %
    Year Ended December 31, 2007
        1.49 %
    Year Ended December 31, 2006
        2.14 %
     
                                             
    Service Shares     Year Ended December 31,   2010     2009     2008     2007     20061  
     
    Per Share Operating Data
                                           
    Net asset value, beginning of period
      $ 8.99     $ 6.79     $ 11.75     $ 11.57     $ 11.89  
     
    Income (loss) from investment operations:
                                           
    Net investment income (loss)2
        .08       .09       .08       .06       (.05 )
    Net realized and unrealized gain (loss)
        1.24       2.12       (4.97 )     .60       .88  
         
    Total from investment operations
        1.32       2.21       (4.89 )     .66       .83  
     
    Dividends and/or distributions to shareholders:
                                           
    Dividends from net investment income
        (.08 )     (.01 )     (.07 )     (.04 )      
    Distributions from net realized gain
                          (.44 )     (1.15 )
         
    Total dividends and/or distributions to shareholders
        (.08 )     (.01 )     (.07 )     (.48 )     (1.15 )


    Net asset value, end of period
      $ 10.23     $ 8.99     $ 6.79     $ 11.75     $ 11.57  


    Total Return, at Net Asset Value3
        14.81 %     32.57 %     (41.62 )%     5.70 %     6.81 %
     
                                           
    Ratios/Supplemental Data
                                           
    Net assets, end of period (in thousands)
      $ 7,311     $ 7,505     $ 4,690     $ 6,481     $ 455  
     
    Average net assets (in thousands)
      $ 7,008     $ 5,501     $ 5,561     $ 3,527     $ 268  
     
    Ratios to average net assets:4
                                           
    Net investment income (loss)
        0.85 %     1.10 %     0.84 %     0.49 %     (1.30 )%
    Total expenses5
        2.08 %     2.17 %     2.13 %     1.63 %     2.89 %
    Expenses after payments, waivers and/or reimbursements and reduction to custodian expenses
        0.93 %     1.15 %     1.50 %     1.50 %     2.88 %
     
    Portfolio turnover rate
        109 %     122 %     175 %     142 %     124 %
    1.   For the period from September 18, 2006 (inception of offering) to December 31, 2006.
     
    2.   Per share amounts calculated based on the average shares outstanding during the period.
     
    3.   Assumes an initial investment on the business day before the first day of the fiscal period, with all dividends and distributions reinvested in additional shares on the reinvestment date, and redemption at the net asset value calculated on the last business day of the fiscal period. Total returns are not annualized for periods less than one full year. Total return information does not reflect expenses that apply at the separate account level or to related insurance products. Inclusion of these charges would reduce the total return figures for all periods shown. Returns do not reflect the deduction of taxes that a shareholder would pay on fund distributions or the redemption of fund shares.
     
    4.   Annualized for periods less than one full year.
     
    5.   Total expenses including indirect expenses from affiliated fund were as follows:
             
    Year Ended December 31, 2010
        2.08 %
    Year Ended December 31, 2009
        2.18 %
    Year Ended December 31, 2008
        2.13 %
    Year Ended December 31, 2007
        1.63 %
    Period Ended December 31, 2006
        2.89 %


    NOTES TO FINANCIAL STATEMENTS
    1. Significant Accounting Policies
    Oppenheimer Value Fund/VA (the “Fund”) is a separate series of Oppenheimer Variable Account Funds, an open-end management investment company registered under the Investment Company Act of 1940, as amended. The Fund’s investment objective is to seek long-term growth of capital by investing primarily in common stocks with low price earnings ratios and better-than-anticipated earnings. Realization of current income is a secondary consideration. The Fund’s investment adviser is OppenheimerFunds, Inc. (the “Manager”).
         The Fund offers two classes of shares. Both classes are sold at their offering price, which is the net asset value per share, to separate investment accounts of participating insurance companies as an underlying investment for variable life insurance policies, variable annuity contracts or other investment products. The class of shares designated as Service shares is subject to a distribution and service plan. Both classes of shares have identical rights and voting privileges with respect to the Fund in general and exclusive voting rights on matters that affect that class alone. Earnings, net assets and net asset value per share may differ due to each class having its own expenses, such as transfer and shareholder servicing agent fees and shareholder communications, directly attributable to that class.
         The following is a summary of significant accounting policies consistently followed by the Fund.
    Securities Valuation. The Fund calculates the net asset value of its shares as of the close of the New York Stock Exchange (the “Exchange”), normally 4:00 P.M. Eastern time, on each day the Exchange is open for trading.
         Each investment asset or liability of the Fund is assigned a level at measurement date based on the significance and source of the inputs to its valuation. Unadjusted quoted prices in active markets for identical securities are classified as “Level 1,” inputs other than unadjusted quoted prices for an asset that are observable are classified as “Level 2” and significant unobservable inputs, including the Manager’s judgment about the assumptions that a market participant would use in pricing an asset or liability, are classified as “Level 3.” The inputs used for valuing securities are not necessarily an indication of the risks associated with investing in those securities. A table summarizing the Fund’s investments under these levels of classification is included following the Statement of Investments.
         Securities are valued using unadjusted quoted market prices, when available, as supplied primarily by portfolio pricing services approved by the Board of Trustees or dealers.
         Securities traded on a registered U.S. securities exchange are valued based on the last sale price of the security reported on the principal exchange on which it is traded, prior to the time when the Fund’s assets are valued. Securities whose principal exchange is NASDAQ® are valued based on the official closing prices reported by NASDAQ prior to the time when the Fund’s assets are valued. In the absence of a sale, the security is valued at the last sale price on the prior trading day, if it is within the spread of the current day’s closing “bid” and “asked” prices, and if not, at the current day’s closing bid price. A foreign security traded on a foreign exchange is valued based on the last sale price on the principal exchange on which the security is traded, as identified by the portfolio pricing service used by the Manager, prior to the time when the Fund’s assets are valued. In the absence of a sale, the security is valued at the most recent official closing price on the principal exchange on which it is traded.
         Shares of a registered investment company that are not traded on an exchange are valued at that investment company’s net asset value per share.
         U.S. domestic and international debt instruments (including corporate, government, municipal, mortgage-backed, collateralized mortgage obligations and asset-backed securities) and “money market-type” debt instruments with a remaining maturity in excess of sixty days are valued at the mean between the “bid” and “asked” prices utilizing price quotations obtained from independent pricing services or broker-dealers. Such prices are typically determined based upon information obtained from market participants including reported trade data, broker-dealer price quotations and inputs such as benchmark yields and issuer spreads from identical or similar securities.
         “Money market-type” debt instruments with remaining maturities of sixty days or less are valued at cost adjusted by the amortization of discount or premium to maturity (amortized cost), which approximates market value.
         In the absence of a readily available unadjusted quoted market price, including for securities whose values have been materially affected by what the Manager identifies as a significant event occurring before the Fund’s assets are valued but after the close of the securities’ respective exchanges, the Manager, acting through its internal valuation committee, in good faith determines the fair valuation of that asset using consistently applied procedures under the supervision of the Board of Trustees (which reviews those fair valuations by the Manager). Those procedures include certain standardized methodologies to fair value securities. Such methodologies include, but are not limited to, pricing securities initially at cost and subsequently adjusting the value based on: changes in company specific fundamentals, changes in an appropriate securities index, or changes in the value of similar securities which may be adjusted for any discounts related to resale restrictions. When possible, such methodologies use observable market inputs such as unadjusted quoted prices of similar securities, observable interest rates, currency rates and yield curves. The methodologies used for valuing securities are not necessarily an indication of the risks associated with investing in those securities.
         There have been no significant changes to the fair valuation methodologies of the Fund during the period.
    Investment in Oppenheimer Institutional Money Market Fund. The Fund is permitted to invest daily available cash balances in an affiliated money market fund. The Fund may invest the available cash in Class E shares of Oppenheimer Institutional Money Market Fund (“IMMF”) to seek current income while preserving liquidity. IMMF is a registered open-end management investment company, regulated as a money market fund under the Investment Company Act of 1940, as amended. The Manager is also the investment adviser of IMMF. When applicable, the Fund’s investment in IMMF is included in the Statement of Investments. Shares of IMMF are valued at their net asset value per share. As a shareholder, the Fund is subject to its proportional share of IMMF’s Class E expenses, including its management fee. The Manager will waive fees and/or reimburse Fund expenses in an amount equal to the indirect management fees incurred through the Fund’s investment in IMMF.
    Foreign Currency Translation. The Fund’s accounting records are maintained in U.S. dollars. The values of securities denominated in foreign currencies and amounts related to the purchase and sale of foreign securities and foreign investment income are translated into U.S. dollars as of the close of the Exchange, normally 4:00 P.M. Eastern time, on each day the Exchange is open for trading. Foreign exchange rates may be valued primarily using a reliable bank, dealer or service authorized by the Board of Trustees.
         Reported net realized gains and losses from foreign currency transactions arise from sales of portfolio securities, sales and maturities of short-term securities, sales of foreign currencies, exchange rate fluctuations between the trade and settlement dates on securities transactions, and the difference between the amounts of dividends, interest, and foreign withholding taxes recorded on the Fund’s books and the U.S. dollar equivalent of the amounts actually received or paid. Net unrealized appreciation and depreciation on the translation of assets and liabilities denominated in foreign currencies arise from changes in the values of assets and liabilities, including investments in securities at fiscal period end, resulting from changes in exchange rates.
         The effect of changes in foreign currency exchange rates on investments is separately identified from the fluctuations arising from changes in market values of securities held and reported with all other foreign currency gains and losses in the Fund’s Statement of Operations.
    Allocation of Income, Expenses, Gains and Losses. Income, expenses (other than those attributable to a specific class), gains and losses are allocated on a daily basis to each class of shares based upon the relative proportion of net assets represented by such class. Operating expenses directly attributable to a specific class are charged against the operations of that class. 

    Federal Taxes. The Fund intends to comply with provisions of the Internal Revenue Code applicable to regulated investment companies and to distribute substantially all of its investment company taxable income, including any net realized gain on investments not offset by capital loss carryforwards, if any, to shareholders. Therefore, no federal income or excise tax provision is required. The Fund files income tax returns in U.S. federal and applicable state jurisdictions. The statute of limitations on the Fund’s tax return filings generally remain open for the three preceding fiscal reporting period ends.
    The tax components of capital shown in the following table represent distribution requirements the Fund must satisfy under the income tax regulations, losses the Fund may be able to offset against income and gains realized in future years and unrealized appreciation or depreciation of securities and other investments for federal income tax purposes.
                             
                        Net Unrealized  
                        Appreciation  
                        Based on Cost of  
                        Securities and  
    Undistributed   Undistributed     Accumulated     Other Investments  
    Net Investment   Long-Term     Loss     for Federal Income  
    Income   Gain     Carryforward1,2,3     Tax Purposes  
     
    $67,313
      $     $ 1,856,867     $ 1,185,989  
    1.   As of December 31, 2010, the Fund had $1,856,867 of net capital loss carryforwards available to offset future realized capital gains, if any, and thereby reduce future taxable gain distributions. As of December 31, 2010, details of the capital loss carryforwards were as follows:
             
    Expiring        
     
    2016
      $ 856,985  
    2017
        999,882  
     
         
    Total
      $ 1,856,867  
     
         
    2.   During the fiscal year ended December 31, 2010, the Fund utilized $446,612 of capital loss carryforward to offset capital gains realized in that fiscal year.
     
    3.   During the fiscal year ended December 31, 2009, the Fund did not utilize any capital loss carryforward.
    Net investment income (loss) and net realized gain (loss) may differ for financial statement and tax purposes. The character of dividends and distributions made during the fiscal year from net investment income or net realized gains may differ from their ultimate characterization for federal income tax purposes. Also, due to timing of dividends and distributions, the fiscal year in which amounts are distributed may differ from the fiscal year in which the income or net realized gain was recorded by the Fund.
    Accordingly, the following amounts have been reclassified for December 31, 2010. Net assets of the Fund were unaffected by the reclassifications.
             
        Increase to  
    Increase to   Accumulated Net  
    Accumulated   Net Realized  
    Net Investment   Loss on  
    Income   Investments  
     
    $11,895
      $ 11,895  
    The tax character of distributions paid during the years ended December 31, 2010 and December 31, 2009 was as follows:
                     
        Year Ended     Year Ended  
        December 31, 2010     December 31, 2009  
     
    Distributions paid from:
                   
    Ordinary income
      $ 64,750     $ 9,999  
    The aggregate cost of securities and other investments and the composition of unrealized appreciation and depreciation of securities and other investments for federal income tax purposes as of December 31, 2010 are noted in the following table. The primary difference between book and tax appreciation or depreciation of securities and other investments, if applicable, is attributable to the tax deferral of losses or tax realization of financial statement unrealized gain or loss.
             
    Federal tax cost of securities
      $ 6,220,991  
     
         
    Gross unrealized appreciation
      $ 1,217,740  
    Gross unrealized depreciation
        (31,751 )
     
         
    Net unrealized appreciation
      $ 1,185,989  
     
         
    Trustees’ Compensation. The Board of Trustees has adopted a compensation deferral plan for independent trustees that enables trustees to elect to defer receipt of all or a portion of the annual compensation they are entitled to receive from the Fund. For purposes of determining the amount owed to the Trustee under the plan, deferred amounts are treated as though equal dollar amounts had been invested in shares of the Fund or in other Oppenheimer funds selected by the Trustee. The Fund purchases shares of the funds selected for deferral by the Trustee in amounts equal to his or her deemed investment, resulting in a Fund asset equal to the deferred compensation liability. Such assets are included as a component of “Other” within the asset section of the Statement of Assets and Liabilities. Deferral of trustees’ fees under the plan will not affect the net assets of the Fund, and will not materially affect the Fund’s assets, liabilities or net investment income per share. Amounts will be deferred until distributed in accordance with the compensation deferral plan.
    Dividends and Distributions to Shareholders. Dividends and distributions to shareholders, which are determined in accordance with income tax regulations and may differ from U.S. generally accepted accounting principles, are recorded on the ex-dividend date. Income and capital gain distributions, if any, are declared and paid annually or at other times as deemed necessary by the Manager.
    Investment Income. Dividend income is recorded on the ex-dividend date or upon ex-dividend notification in the case of certain foreign dividends where the ex-dividend date may have passed. Non-cash dividends included in dividend income, if any, are recorded at the fair market value of the securities received. Interest income is recognized on an accrual basis. Discount and premium, which are included in interest income on the Statement of Operations, are amortized or accreted daily.
    Custodian Fees. “Custodian fees and expenses” in the Statement of Operations may include interest expense incurred by the Fund on any cash overdrafts of its custodian account during the period. Such cash overdrafts may result from the effects of failed trades in portfolio securities and from cash outflows resulting from unanticipated shareholder redemption activity. The Fund pays interest to its custodian on such cash overdrafts, to the extent they are not offset by positive cash balances maintained by the Fund, at a rate equal to the Federal Funds Rate plus 0.50%. The “Reduction to custodian expenses” line item, if applicable, represents earnings on cash balances maintained by the Fund during the period. Such interest expense and other custodian fees may be paid with these earnings.
    Security Transactions. Security transactions are recorded on the trade date. Realized gains and losses on securities sold are determined on the basis of identified cost.
    Indemnifications. The Fund’s organizational documents provide current and former trustees and officers with a limited indemnification against liabilities arising in connection with the performance of their duties to the Fund. In the normal course of business, the Fund may also enter into contracts that provide general indemnifications. The Fund’s maximum exposure under these arrangements is unknown as this would be dependent on future claims that may be made against the Fund. The risk of material loss from such claims is considered remote.
    Other. The preparation of financial statements in conformity with accounting principles generally accepted in the United States of America requires management to make estimates and assumptions that affect the reported amounts of assets and liabilities and disclosure of contingent assets and liabilities at the date of the financial statements and the reported amounts of increases and decreases in net assets from operations during the reporting period. Actual results could differ from those estimates.
    2. Shares of Beneficial Interest
    The Fund has authorized an unlimited number of $0.001 par value shares of beneficial interest of each class. Transactions in shares of beneficial interest were as follows:
                                     
        Year Ended December 31, 2010     Year Ended December 31, 2009  
        Shares     Amount     Shares     Amount  
     
    Non-Service Shares
                                   
    Sold
        6,745     $ 50,146       4,808     $ 27,757  
    Dividends and/or distributions reinvested
        65       479       14       103  
    Redeemed
        (1,196 )     (8,511 )     (846 )     (4,834 )
         
    Net increase
        5,614     $ 42,114       3,976     $ 23,026  


    Service Shares
                                   
    Sold
        108,649     $ 1,008,324       326,123     $ 2,582,040  
    Dividends and/or distributions reinvested
        7,063       64,271       1,092       9,896  
    Redeemed
        (235,966 )     (2,131,068 )     (182,945 )     (1,351,152 )
         
    Net increase (decrease)
        (120,254 )   $ (1,058,473 )     144,270     $ 1,240,784  
         
    3. Purchases and Sales of Securities
    The aggregate cost of purchases and proceeds from sales of securities, other than short-term obligations and investments in IMMF, for the year ended December 31, 2010, were as follows:
                     
        Purchases     Sales  
     
    Investment securities
      $ 7,375,086     $ 8,387,433  
    4. Fees and Other Transactions with Affiliates
    Management Fees. Under the investment advisory agreement, the Fund pays the Manager a management fee based on the daily net assets of the Fund at an annual rate as shown in the following table:
             
    Fee Schedule        
     
    Up to $200 million
        0.75 %
    Next $200 million
        0.72  
    Next $200 million
        0.69  
    Next $200 million
        0.66  
    Over $800 million
        0.60  
    Administration Service Fees. The Fund pays the Manager a fee of $1,500 per year for preparing and filing the Fund’s tax returns.
    Transfer Agent Fees. OppenheimerFunds Services (“OFS”), a division of the Manager, acts as the transfer and shareholder servicing agent for the Fund. The Fund pays OFS fees at an annual rate of 0.10% of the daily net assets of each class of shares. For the year ended December 31, 2010, the Fund paid $7,095 to OFS for services to the Fund.
    Distribution and Service Plan for Service Shares. The Fund has adopted a Distribution and Service Plan (the “Plan”) in accordance with Rule 12b-1 under the Investment Company Act of 1940 for Service shares to pay OppenheimerFunds Distributor, Inc. (the “Distributor”), for distribution related services, personal service and account maintenance for the Fund’s Service shares. Under the Plan, payments are made periodically at an annual rate of 0.25% of the daily net assets of Service shares of the Fund. The Distributor currently uses all of those fees to compensate sponsors of the insurance product that offers Fund shares, for providing personal service and maintenance of accounts of their variable contract owners that hold Service shares. These fees are paid out of the Fund’s assets on an on-going basis and increase operating expenses of the Service shares, which results in lower performance compared to the Fund’s shares that are not subject to a service fee. Fees incurred by the Fund under the Plan are detailed in the Statement of Operations.
    Waivers and Reimbursements of Expenses. The Manager has voluntarily agreed to limit the Fund’s total annual operating expenses so that those expenses, as percentages of daily net assets, will not exceed the annual rate of 0.80% for Non-Service shares and 1.05% for Service shares. During the year ended December 31, 2010, the Manager waived fees and/or reimbursed the Fund $844 and $80,322 for Non-Service and Service shares, respectively.
         The Manager will waive fees and/or reimburse Fund expenses in an amount equal to the indirect management fees incurred through the Fund’s investment in IMMF. During the year ended December 31, 2010, the Manager waived fees and/or reimbursed the Fund $252 for IMMF management fees.
         Some of these undertakings may be modified or terminated at any time; some may not be modified or terminated until after one year from the date of the current prospectus, as indicated therein.
    5. Risk Exposures and the Use of Derivative Instruments
    The Fund’s investment objectives not only permit the Fund to purchase investment securities, they also allow the Fund to enter into various types of derivatives contracts, including, but not limited to, futures contracts, forward foreign currency exchange contracts, credit default swaps, interest rate swaps, total return swaps, and purchased and written options. In doing so, the Fund will employ strategies in differing combinations to permit it to increase, decrease, or change the level or types of exposure to market risk factors. Central to those strategies are features inherent to derivatives that make them more attractive for this purpose than equity and debt securities: they require little or no initial cash investment, they can focus exposure on only certain selected risk factors, and they may not require the ultimate receipt or delivery of the underlying security (or securities) to the contract. This may allow the Fund to pursue its objectives more quickly and efficiently than if it were to make direct purchases or sales of securities capable of effecting a similar response to market factors.
    Market Risk Factors. In accordance with its investment objectives, the Fund may use derivatives to increase or decrease its exposure to one or more of the following market risk factors:
    Commodity Risk. Commodity risk relates to the change in value of commodities or commodity indexes as they relate to increases or decreases in the commodities market. Commodities are physical assets that have tangible properties. Examples of these types of assets are crude oil, heating oil, metals, livestock, and agricultural products.
    Credit Risk. Credit risk relates to the ability of the issuer to meet interest and principal payments, or both, as they come due. In general, lower-grade, higher-yield bonds are subject to credit risk to a greater extent than lower-yield, higher-quality bonds.
    Equity Risk. Equity risk relates to the change in value of equity securities as they relate to increases or decreases in the general market.
    Foreign Exchange Rate Risk. Foreign exchange rate risk relates to the change in the U.S. dollar value of a security held that is denominated in a foreign currency. The U.S. dollar value of a foreign currency denominated security will decrease as the dollar appreciates against the currency, while the U.S. dollar value will increase as the dollar depreciates against the currency.
    Interest Rate Risk. Interest rate risk refers to the fluctuations in value of fixed-income securities resulting from the inverse relationship between price and yield. For example, an increase in general interest rates will tend to reduce the market value of already issued fixed-income investments, and a decline in general interest rates will tend to increase their value. In addition, debt securities with longer maturities, which tend to have higher yields, are subject to potentially greater fluctuations in value from changes in interest rates than obligations with shorter maturities. 

    Volatility Risk. Volatility risk refers to the magnitude of the movement, but not the direction of the movement, in a financial instrument’s price over a defined time period. Large increases or decreases in a financial instrument’s price over a relative time period typically indicate greater volatility risk, while small increases or decreases in its price typically indicate lower volatility risk.
    The Fund’s actual exposures to these market risk factors during the period are discussed in further detail, by derivative type, below.
    Risks of Investing in Derivatives. The Fund’s use of derivatives can result in losses due to unanticipated changes in the market risk factors and the overall market. In instances where the Fund is using derivatives to decrease, or hedge, exposures to market risk factors for securities held by the Fund, there are also risks that those derivatives may not perform as expected resulting in losses for the combined or hedged positions.
         Derivatives may have little or no initial cash investment relative to their market value exposure and therefore can produce significant gains or losses in excess of their cost. This use of embedded leverage allows the Fund to increase its market value exposure relative to its net assets and can substantially increase the volatility of the Fund’s performance.
         Additional associated risks from investing in derivatives also exist and potentially could have significant effects on the valuation of the derivative and the Fund. Typically, the associated risks are not the risks that the Fund is attempting to increase or decrease exposure to, per its investment objectives, but are the additional risks from investing in derivatives. Examples of these associated risks are liquidity risk, which is the risk that the Fund will not be able to sell the derivative in the open market in a timely manner, and counterparty credit risk, which is the risk that the counterparty will not fulfill its obligation to the Fund. Associated risks can be different for each type of derivative and are discussed by each derivative type in the notes that follow.
    Counterparty Credit Risk. Certain derivative positions are subject to counterparty credit risk, which is the risk that the counterparty will not fulfill its obligation to the Fund. The Fund’s derivative counterparties are financial institutions who are subject to market conditions that may weaken their financial position. The Fund intends to enter into financial transactions with counterparties that the Manager believes to be creditworthy at the time of the transaction.
    Credit Related Contingent Features. The Fund’s agreements with derivative counterparties have several credit related contingent features that if triggered would allow its derivatives counterparties to close out and demand payment or additional collateral to cover their exposure from the Fund. Credit related contingent features are established between the Fund and its derivatives counterparties to reduce the risk that the Fund will not fulfill its payment obligations to its counterparties. These triggering features include, but are not limited to, a percentage decrease in the Fund’s net assets and or a percentage decrease in the Fund’s Net Asset Value or NAV. The contingent features are established within the Fund’s International Swap and Derivatives Association, Inc. master agreements which govern certain positions in swaps, over-the-counter options and swaptions, and forward currency exchange contracts for each individual counterparty.
    The effect of derivative instruments on the Statement of Operations is as follows:
    Amount of Realized Gain or (Loss) Recognized on Derivatives
             
    Derivatives Not Accounted   Investments from  
    for as Hedging Instruments   unaffiliated companies*  
     
    Equity contracts
      $ (1,267 )
    *   Includes purchased option contracts, purchased swaption contracts and written option contracts exercised, if any.
    Option Activity
    The Fund may buy and sell put and call options, or write put and call options. When an option is written, the Fund receives a premium and becomes obligated to sell or purchase the underlying security at a fixed price, upon exercise of the option.
         Options are valued daily based upon the last sale price on the principal exchange on which the option is traded. The difference between the premium received or paid, and market value of the option, is recorded as unrealized appreciation or depreciation. The net change in unrealized appreciation or depreciation is reported in the Statement of Operations. When an option is exercised, the cost of the security purchased or the proceeds of the security sale are adjusted by the amount of premium received or paid. Upon the expiration or closing of the option transaction, a gain or loss is reported in the Statement of Operations.
         The Fund has purchased put options on individual equity securities and, or, equity indexes to decrease exposure to equity risk. A purchased put option becomes more valuable as the price of the underlying financial instrument depreciates relative to the strike price.
         During the year ended December 31, 2010, the Fund had an average market value of $101 on purchased put options.
         Options written, if any, are reported in a schedule following the Statement of Investments and as a liability in the Statement of Assets and Liabilities. Securities held in collateralized accounts to cover potential obligations with respect to outstanding written options are noted in the Statement of Investments.
         The risk in writing a call option is that the Fund gives up the opportunity for profit if the market price of the security increases and the option is exercised. The risk in writing a put option is that the Fund may incur a loss if the market price of the security decreases and the option is exercised. The risk in buying an option is that the Fund pays a premium whether or not the option is exercised. The Fund also has the additional risk that there may be an illiquid market where the Fund is unable to close the contract.
    Additional associated risks to the Fund include counterparty credit risk for over-the-counter options and liquidity risk. As of December 31, 2010, the Fund did not hold any outstanding written options.
    6. Pending Litigation
    Since 2009, a number of lawsuits have been pending in federal courts against the Manager, the Distributor, and certain mutual funds (“Defendant Funds”) advised by the Manager and distributed by the Distributor (but not including the Fund). The lawsuits naming the Defendant Funds also name as defendants certain officers and current and former trustees of the respective Defendant Funds. The plaintiffs seek class action status on behalf of purchasers of shares of the respective Defendant Fund during a particular time period. The lawsuits raise claims under federal securities laws alleging that, among other things, the disclosure documents of the respective Defendant Fund contained misrepresentations and omissions, that such Defendant Fund’s investment policies were not followed, and that such Defendant Fund and the other defendants violated federal securities laws and regulations. The plaintiffs seek unspecified damages, equitable relief and an award of attorneys’ fees and litigation expenses.
         In 2009, what are claimed to be derivative lawsuits were filed in state court against the Manager and a subsidiary (but not against the Fund), on behalf of the New Mexico Education Plan Trust. These lawsuits allege breach of contract, breach of fiduciary duty, negligence and violation of state securities laws, and seek compensatory damages, equitable relief and an award of attorneys’ fees and litigation expenses.
         Other lawsuits have been filed since 2008 in various state and federal courts, against the Manager and certain of its affiliates. Those lawsuits were filed by investors who made investments through an affiliate of the Manager, and relate to the alleged investment fraud perpetrated by Bernard Madoff and his firm (“Madoff “). Those suits allege a variety of claims, including breach of fiduciary duty, fraud, negligent misrepresentation, unjust enrichment, and violation of federal and state securities laws and regulations, among others. They seek unspecified damages, equitable relief and an award of attorneys’ fees and litigation expenses. None of the suits have named the Distributor, any of the Oppenheimer mutual funds or any of their independent Trustees or Directors as defendants. None of the Oppenheimer funds invested in any funds or accounts managed by Madoff.

         The Manager believes that the lawsuits described above are without legal merit and is defending against them vigorously. The Defendant Funds’ Boards of Trustees have also engaged counsel to defend the suits brought against those Funds and the present and former Independent Trustees named in those suits. While it is premature to render any opinion as to the outcome in these lawsuits, or whether any costs that the Defendant Funds may bear in defending the suits might not be reimbursed by insurance, the Manager believes that these suits should not impair the ability of the Manager or the Distributor to perform their respective duties to the Fund, and that the outcome of all of the suits together should not have any material effect on the operations of any of the Oppenheimer funds.
    7. Subsequent Event
    The Regulated Investment Company Modernization Act of 2010 (the “Act”) was signed into law on December 22, 2010. The Act makes changes to a number of tax rules impacting the Fund. Under the Act, future capital losses generated by a fund may be carried over indefinitely, but these losses must be used prior to the utilization of any pre-enactment capital losses. Since pre-enactment capital losses may only be carried forward for eight years, there may be a greater likelihood that all or a portion of a fund’s pre-enactment capital losses will expire unused. In general, the provisions of the Act will be effective for the Fund’s fiscal year ending December 31, 2011. Specific information regarding the impact of the Act on the Fund will be contained within the “Federal Taxes” section of the financial statement notes for the fiscal year ending December 31, 2011.
     

    Oppenheimer Variable Account Funds

    Website
    www.oppenheimerfunds.com

    Investment Adviser
    OppenheimerFunds, Inc.
    Two World Financial Center
    225 Liberty Street, 11th Floor
    New York, New York 10281-1008

    Distributor
    OppenheimerFunds Distributor, Inc.
    Two World Financial Center
    225 Liberty Street, 11th Floor
    New York, New York 10281-1008

    Transfer Agent
    OppenheimerFunds Services
    P.O. Box 5270
    Denver, Colorado 80217
    1.800.CALL OPP (225.5677)

    Custodian Bank
    JPMorgan Chase Bank
    4 Chase Metro Tech Center
    Brooklyn, New York 11245

    Independent Registered Public Accounting Firm
    KPMG LLP
    707 Seventeenth Street
    Denver, Colorado 80202

    Counsel to the Funds & Independent Directors
    K&L Gates LLP
    70 West Madison Street, Suite 3100
    Chicago, Illinois 60602

    PX0610.001.0411


    OPPENHEIMER VARIABLE ACCOUNT FUNDS

    FORM N-1A

    PART C

    OTHER INFORMATION

    Item 28. Exhibits

    (a)      Nineteenth Amended and Restated Declaration of Trust dated 4/29/11: Filed herewith.

    (b)     Amended By-Laws dated 10/24/00: Previously filed with Registrant’s Post-Effective Amendment No. 36 (4/17/01), and incorporated herein by reference.

    (c)     (i)     Oppenheimer Small- & Mid-Cap Growth Fund/VA Non-Service Class Specimen Share Certificate: Previously filed with Registrant’s Post-Effective Amendment No. 37 (4/24/02), and incorporated herein by reference.

    (ii)     

    Oppenheimer Small- & Mid-Cap Growth Fund/VA Service Class Specimen Share Certificate: Previously filed with Registrant’s Post-Effective Amendment No. 37 (4/24/02), and incorporated herein by reference.


    (iii)     

    Oppenheimer Balanced Fund/VA Non-Service Class Specimen Share Certificate: Previously filed with Registrant’s Post-Effective Amendment No. 45 (04/28/05), and incorporated herein by reference.


    (iv)     

    Oppenheimer Balanced Fund/VA Service Class Specimen Share Certificate: Previously filed with Registrant’s Post-Effective Amendment No. 45 (04/28/05), and incorporated herein by reference.


    (v)     

    Oppenheimer Capital Appreciation Fund/VA Non-Service Class Specimen Share Certificate: Previously filed with Registrant’s Post-Effective Amendment No. 37 (4/24/02), and incorporated herein by reference.


    (vi)     

    Oppenheimer Capital Appreciation Fund/VA Service Class Specimen Share Certificate: Previously filed with Registrant’s Post-Effective Amendment No. 37 (4/24/02), and incorporated herein by reference.


    (vii)     

    Oppenheimer Core Bond Fund/VA Non-Service Class Specimen Share Certificate: Previously filed with Registrant’s Post-Effective Amendment No. 45 (04/28/05), and incorporated herein by reference.


    (viii)     

    Oppenheimer Core Bond Fund/VA Service Class Specimen Share Certificate: Previously filed with Registrant’s Post-Effective Amendment No. 45 (04/28/05), and incorporated herein by reference.


    (ix)     

    Oppenheimer Global Securities Fund/VA Non-Service Class Specimen Share Certificate: Previously filed with Registrant’s Post-Effective Amendment No. 37 (4/24/02), and incorporated herein by reference.


    (x)     

    Oppenheimer Global Securities Fund/VA Service Class Specimen Share Certificate: Previously filed with Registrant’s Post-Effective Amendment No. 37 (4/24/02), and incorporated herein by reference.


    (xi)     

    Oppenheimer Global Securities Fund/VA Class 3 Specimen Share Certificate: Previously filed with Registrant’s Post-Effective Amendment No. 40 (2/11/03), and incorporated herein by reference.


    (xii)     

    Oppenheimer Global Securities Fund/VA Class 4 Specimen Share Certificate: Previously filed with Registrant’s Post-Effective Amendment No. 42 (2/11/04), and incorporated herein by reference.


    (xiii)     

    Oppenheimer High Income Fund/VA Non-Service Class Specimen Share Certificate: Previously filed with Registrant’s Post-Effective Amendment No. 37 (4/24/02), and incorporated herein by reference.


    (xiv)     

    Oppenheimer High Income Fund/VA Service Class Specimen Share Certificate: Previously filed with Registrant’s Post-Effective Amendment No. 37 (4/24/02), and incorporated herein by reference.


    (xv)     

    Oppenheimer Main Street Fund/VA Non-Service Class Specimen Share Certificate: Previously filed with Registrant’s Post-Effective Amendment No. 41 (4/28/03) and incorporated herein by reference.


    (xvi)     

    Oppenheimer Main Street Fund/VA Service Class Specimen Share Certificate: Previously filed with Registrant’s Post-Effective Amendment No. 41 (4/28/03) and incorporated herein by reference.


    (xvii)     

    Oppenheimer Main Street Small- & Mid-Cap Fund/VA Non-Service Class Specimen Share Certificate: Previously filed with Registrant’s Post-Effective Amendment No. 37 (4/24/02), and incorporated herein by reference.


    (xviii)     

    Oppenheimer Main Street Small- & Mid-Cap Fund/VA Service Class Specimen Share Certificate: Previously filed with Registrant’s Post-Effective Amendment No. 37 (4/24/02), and incorporated herein by reference.


    (xix)     

    Oppenheimer Money Fund/VA Non-Service Class Specimen Share Certificate: Previously filed with Registrant’s Post-Effective Amendment No. 37 (4/24/02), and incorporated herein by reference.


    (xx)     

    Oppenheimer Money Fund/VA Service Class Specimen Share Certificate: Previously filed with Registrant’s Post-Effective Amendment No. 37 (4/24/02), and incorporated herein by reference.


    (xxi)     

    Oppenheimer Global Strategic Income Fund/VA Non-Service Class Specimen Share Certificate: Previously filed with Registrant’s Post-Effective Amendment No. 37 (4/24/02), and incorporated herein by reference.


    (xxii)     

    Oppenheimer Global Strategic Income Fund/VA Service Class Specimen Share Certificate: Previously filed with Registrant’s Post-Effective Amendment No. 37 (4/24/02), and incorporated herein by reference.


    (xxiii)     

    Oppenheimer Value Fund/VA Service Class Specimen Share Certificate: Previously filed with Registrant’s Post-Effective Amendment No. 38 (10/08/02), and incorporated herein by reference.


    (d)     (i)     Amended and Restated Investment Advisory Agreement for Oppenheimer Small- & Mid-Cap Fund/VA dated 1/1/05: Previously filed with Registrant’s Post-Effective Amendment No. 44 (2/25/05), and incorporated herein by reference.

    (ii)     Amended and Restated Investment Advisory Agreement for Oppenheimer Balanced Fund/VA dated 1/1/05: Previously filed with Registrant’s Post-Effective Amendment No. 44 (2/25/05), and incorporated herein by reference.

    (iii)     Amended and Restated Investment Advisory Agreement for Oppenheimer Core Bond Fund/VA dated 1/1/05: Previously filed with Registrant’s Post-Effective Amendment No. 44 (2/25/05), and incorporated herein by reference.

    (iv)     Amendment No. 1 to the Amended and Restated investment Advisory Agreement for Oppenheimer Core Bond Fund/VA dated 4/10/07: Previously filed with Registrant’s Post-Effective Amendment No. 52 (4/24/07), and incorporated herein by reference.

    (v)     Amended and Restated Investment Advisory Agreement for Oppenheimer Capital Appreciation Fund/VA dated 1/1/05: Previously filed with Registrant’s Post-Effective Amendment No. 44 (2/25/05), and incorporated herein by reference.

    (vi)     Amended and Restated Investment Advisory Agreement for Oppenheimer Global Securities Fund/VA dated 1/1/05: Previously filed with Registrant’s Post-Effective Amendment No. 44 (2/25/05), and incorporated herein by reference.

    (vii)     Amended and Restated Investment Advisory Agreement for Oppenheimer High Income Fund/VA dated 1/1/05: Previously filed with Registrant’s Post-Effective Amendment No. 44 (2/25/05), and incorporated herein by reference.

    (viii)     Amended and Restated Investment Advisory Agreement for Oppenheimer Main Street Fund/VA dated 1/1/05: Previously filed with Registrant’s Post-Effective Amendment No. 44 (2/25/05), and incorporated herein by reference.

    (ix)     Amended and Restated Investment Advisory Agreement for Oppenheimer Main Street Small- & Mid-Cap Fund/VA dated 1/1/05: Previously filed with Registrant’s Post-Effective Amendment No. 44 (2/25/05), and incorporated herein by reference.

    (x)     Amended and Restated Investment Advisory Agreement for Oppenheimer Money Fund/VA dated 1/1/05: Previously filed with Registrant’s Post-Effective Amendment No. 44 (2/25/05), and incorporated herein by reference.

    (xi)     Amended and Restated Investment Advisory Agreement for Oppenheimer Global Strategic Income Fund/VA dated 1/1/05: Previously filed with Registrant’s Post-Effective Amendment No. 44 (2/25/05), and incorporated herein by reference.

    (xii)     Amended and Restated Investment Advisory Agreement for Oppenheimer Value Fund/VA dated 1/1/05: Previously filed with Registrant’s Post-Effective Amendment No. 44 (2/25/05), and incorporated herein by reference.

    (xiii)     Investment Advisory Agreement for Oppenheimer Global Strategic Income Fund/VA (Cayman) Ltd. dated 10/28/10: Filed herewith.

    (xiv)     Sub-Advisory Agreement for Oppenheimer Global Strategic Income Fund/VA (Cayman) Ltd. dated 10/28/10: Filed herewith.

    (e)     (i)     General Distributors Agreement for Service shares of Oppenheimer Small- & Mid-Cap Growth Fund/VA dated 5/1/98: Filed with Post-Effective Amendment No. 32 (4/29/98), and incorporated herein by reference.

    (ii)     

    General Distributors Agreement for Service shares of Oppenheimer Core Bond Fund/VA dated 5/1/98: Filed with Post-Effective Amendment No. 32 (4/29/98), and incorporated herein by reference.


    (iii)     

    General Distributors Agreement for Service shares of Oppenheimer Capital Appreciation Fund/VA dated 5/1/98: Filed with Post-Effective Amendment No. 32 (4/29/98), and incorporated herein by reference.


    (iv)     

    General Distributors Agreement for Service shares of Oppenheimer Global Securities Fund/VA dated 5/1/98: Filed with Post-Effective Amendment No. 32 (4/29/98), and incorporated herein by reference.


    (v)     

    General Distributors Agreement for Service shares of Oppenheimer High Income Fund/VA dated 5/1/98: Filed with Post-Effective Amendment No. 32 (4/29/98), and incorporated herein by reference.


    (vi)     

    General Distributors Agreement for Service shares of Oppenheimer Main Street Fund/VA dated 5/1/98: Filed with Post-Effective Amendment 32 (4/29/98), and incorporated herein by reference.


    (vii)     

    General Distributors Agreement for Service shares of Oppenheimer Main Street Small- & Mid-Cap Fund/VA dated 5/1/98: Filed with Post-Effective Amendment No. 32 (4/29/98), and incorporated herein by reference.


    (viii)     

    General Distributors Agreement for Service shares of Oppenheimer Money Fund/VA dated 5/1/98: Filed with Post-Effective Amendment No. 32 (4/29/98), and incorporated herein by reference.


    (ix)     

    General Distributors Agreement for Service shares of Oppenheimer Global Strategic Income Fund/VA dated 5/1/98: Filed with Post-Effective Amendment No. 32 (4/29/98), and incorporated herein by reference.


    (x)     

    General Distributors Agreement for Service shares of Oppenheimer Value Fund/VA dated 10/22/02: Filed with Registrant’s Post-Effective Amendment No. 39 (12/20/02) and incorporated herein by reference.


    (xi)     

    Form of Participation Agreement: Previously filed with Registrant’s Post-Effective Amendment No. 52 (4/24/07), and incorporated herein by reference.


    (f)     Form of Oppenheimer Funds Compensation Deferral Plan, as Amended and Restated Effective January 1, 2008: Previously filed with Post-Effective Amendment No. 2 to the Registration Statement of Oppenheimer Portfolio Series Fixed Income Active Allocation Fund (Reg. No. 333-146105), (5/29/09), and incorporated herein by reference.

    (g)      (i)     Global Custody Agreement dated August 16, 2002, as amended: Previously filed with Post-Effective Amendment No. 51 to the Registration Statement of Oppenheimer Capital Appreciation Fund (Reg. No. 2-69719), (10/23/06), and incorporated herein by reference.

    (ii)     Amendment dated September 28, 2010 to the Global Custody Agreement: Previously filed with Post-Effective Amendment No. 18 to the Registration Statement of Oppenheimer Main Street Small- & Mid-Cap Fund (Reg. No. 333-78269), (10/28/10), and incorporated herein by reference.

    (h)     Not applicable.
     
    (i)     (i)     Opinion and Consent of Counsel dated 3/14/85: Previously filed with Registrant’s Pre-Effective Amendment No. 1 (3/20/85), refiled with Registrant’s Post-Effective Amendment No. 27 (4/27/95) pursuant to Item 102 of Regulation S-T, and incorporated herein by reference.

    (ii)     

    Opinion and Consent of Counsel dated 4/28/86: Previously filed with Registrant’s Post-Effective Amendment No. 5 (8/12/86), refiled with Registrant’s Post-Effective Amendment No. 27 (4/27/95) pursuant to Item 102 of Regulation S-T, and incorporated herein by reference.


    (iii)     

    Opinion and Consent of Counsel dated 7/31/86: Previously filed with Registrant’s Post-Effective Amendment No. 5 (8/12/86), refiled with Registrant’s Post-Effective Amendment No. 27 (4/27/95) pursuant to Item 102 of Regulation S-T, and incorporated herein by reference.


    (iv)     

    Opinion and Consent of Counsel dated 1/21/87: Previously filed with Registrant’s Post-Effective Amendment No. 7 (2/6/87), refiled with Registrant’s Post-Effective Amendment No. 27 (4/27/95), pursuant to Item 102 of Regulation S-T, and incorporated herein by reference.


    (v)     

    Opinion and Consent of Counsel dated July 31, 1990: Previously filed with Registrant’s Post-Effective Amendment No. 15 (9/19/90), refiled with Registrant’s Post-Effective Amendment No. 27 (4/27/95) pursuant to Item 102 of Regulation S-T, and incorporated herein by reference.


    (vi)     

    Opinion and Consent of Counsel dated April 23, 1993: Previously filed with Registrant’s Post-Effective Amendment No. 22 (4/30/93), refiled with Registrant’s Post-Effective Amendment No. 27 (4/27/95) pursuant to Item 102 of Regulation S-T, and incorporated herein by reference.


    (vii)     

    Opinion and Consent of Counsel dated April 18, 1995: Filed with Post-Effective Amendment No. 29 (4/22/96), and incorporated herein by reference.


    (viii)     

    Opinion and Consent of Counsel dated May 1, 1998: Previously filed with Registrant’s Post-Effective Amendment No. 35 (4/26/00), and incorporated herein by reference.


    (ix)     

    Opinion and Consent of Counsel dated 12/20/02: Previously filed with Registrant’s Post-Effective Amendment No. 45 (04/28/05), and incorporated herein by reference.


    (j)     Independent Registered Public Accounting Firm’s Consent: Filed herewith.

    (k)     Not applicable.
     

    (l)     Investment Letter dated 3/14/85 from Monarch Life Insurance Company to Registrant: Previously filed with Registrant’s Post-Effective Amendment No. 37 (4/24/02), and incorporated herein by reference.

    (m)     (i)     Amended and Restated Distribution and Service Plan and Agreement for Service shares of Oppenheimer Small- & Mid-Cap Growth Fund/VA dated 10/28/05: Previously filed with Registrant’s Post-Effective Amendment No. 48 (04/28/06), and incorporated herein by reference.

    (ii)     

    Amended and Restated Distribution and Service Plan and Agreement for Service shares of Oppenheimer Balanced Fund/VA dated 10/28/05: Previously filed with Registrant’s Post-Effective Amendment No. 48 (04/28/06), and incorporated herein by reference.


    (iii)     

    Amended and Restated Distribution and Service Plan and Agreement for Service shares of Oppenheimer Capital Appreciation Fund/VA dated 10/28/05: Previously filed with Registrant’s Post-Effective Amendment No. 48 (04/28/06), and incorporated herein by reference.


    (iv)     

    Amended and Restated Distribution and Service Plan and Agreement for Service shares of Oppenheimer Core Bond Fund/VA dated 10/28/05: Previously filed with Registrant’s Post-Effective Amendment No. 48 (04/28/06), and incorporated herein by reference.


    (v)     

    Amended and Restated Distribution and Service Plan and Agreement for Service shares of Oppenheimer Global Securities Fund/VA dated 10/28/05: Previously filed with Registrant’s Post-Effective Amendment No. 48 (04/28/06), and incorporated herein by reference.


    (vi)     

    Amended and Restated Service Plan and Agreement for Class 4 shares of Oppenheimer Global Securities Fund/VA dated 10/28/05: Previously filed with Registrant’s Post-Effective Amendment No. 48 (04/28/06), and incorporated herein by reference.


    (vii)     

    Amended and Restated Distribution and Service Plan and Agreement for Service shares of Oppenheimer High Income Fund/VA dated 10/28/05: Previously filed with Registrant’s Post-Effective Amendment No. 48 (04/28/06), and incorporated herein by reference.


    (viii)     

    Amended and Restated Service Plan and Agreement for Class 4 shares of Oppenheimer High Income Fund/VA dated 4/30/06: Previously filed with Registrant’s Post-Effective Amendment No. 52 (4/24/07), and incorporated herein by reference.


    (ix)     

    Amended and Restated Distribution and Service Plan and Agreement for Service shares of Oppenheimer Main Street Fund/VA dated 10/28/05: Previously filed with Registrant’s Post-Effective Amendment No. 48 (04/28/06), and incorporated herein by reference.


    (x)     

    Amended and Restated Distribution and Service Plan and Agreement for Service shares of Oppenheimer Main Street Small- & Mid-Cap Fund/VA dated 10/28/05: Previously filed with Registrant’s Post-Effective Amendment No. 48 (04/28/06), and incorporated herein by reference.


    (xi)     

    Amended and Restated Distribution and Service Plan and Agreement for Service shares of Oppenheimer Money Fund/VA dated 10/28/05: Previously filed with Registrant’s Post-Effective Amendment No. 48 (04/28/06), and incorporated herein by reference.


    (xii)     

    Amended and Restated Distribution and Service Plan and Agreement for Service shares of Oppenheimer Global Strategic Income Fund/VA dated 10/28/05: Previously filed with Registrant’s Post-Effective Amendment No. 48 (04/28/06), and incorporated herein by reference.


    (xiii)     

    Amended and Restated Distribution and Service Plan and Agreement for Service shares of Oppenheimer Value Fund /VA dated 10/28/05: Previously filed with Registrant’s Post-Effective Amendment No. 48 (04/28/06), and incorporated herein by reference.


    (n)     Oppenheimer Funds Multiple Class Plan under Rule 18f-3 updated through 9/17/09:  Previously filed with Post-Effective Amendment No. 16 to the Registration Statement of Oppenheimer Main Street Cap Fund (Reg. No. 333-78269), 10/2/09, and incorporated herein by reference.

    (o)  Powers of Attorney dated February 23, 2011 for all Trustees/Directors and Officers: Previously filed with Pre-Effective Amendment No. 1 to the Registration Statement of Oppenheimer Short Duration Fund (Reg. No. 333-171815), (3/15/11), and incorporated herein by reference.

    (p)     Amended and Restated Code of Ethics of the Oppenheimer Funds dated November 30, 2007, as revised January 18, 2011 under Rule 17j-1 of the Investment Company Act of 1940: Previously filed with Post-Effective Amendment No. 99 to the Registration Statement of Oppenheimer Equity Fund, Inc., (Reg. No. 2-11052), (3/28/11), and incorporated herein by reference.

    Item 29. - Persons Controlled by or Under Common Control with the Fund

    None.
     

    Item 30. - Indemnification

    Reference is made to the provisions of Article Seven of Registrant's Amended and Restated Declaration of Trust filed as Exhibit 23(a) to this Registration Statement, and incorporated herein by reference.
     

    Insofar as indemnification for liabilities arising under the Securities Act of 1933 may be permitted to trustees, officers and controlling persons of Registrant pursuant to the foregoing provisions or otherwise, Registrant has been advised that in the opinion of the Securities and Exchange Commission such indemnification is against public policy as expressed in the Securities Act of 1933 and is, therefore, unenforceable. In the event that a claim for indemnification against such liabilities (other than the payment by Registrant of expenses incurred or paid by a trustee, officer or controlling person of Registrant in the successful defense of any action, suit or proceeding) is asserted by such trustee, officer or controlling person, Registrant will, unless in the opinion of its counsel the matter has been settled by controlling precedent, submit to a court of appropriate jurisdiction the question whether such indemnification by it is against public policy as expressed in the Securities Act of 1933 and will be governed by the final adjudication of such issue.

    Item 31. - Business and Other Connections of the Investment Adviser

    (a)     OppenheimerFunds, Inc. is the investment adviser of the Registrant; it and certain subsidiaries and affiliates act in the same capacity to other investment companies, including without limitation those described in Parts A and B hereof and listed in Item 31(b) below.
     
    (b)     There is set forth below information as to any other business, profession, vocation or employment of a substantial nature in which each officer and director of OppenheimerFunds, Inc. is, or at any time during the past two fiscal years has been, engaged for his/her own account or in the capacity of director, officer, employee, partner or trustee.
     

    Name and Current Position with OppenheimerFunds, Inc.

    Other Business and Connections During the Past Two Years

    Timothy L. Abbuhl,

    Senior Vice President

    Treasurer of Centennial Asset Management Corporation; Vice President of OFI Institutional Asset Management, Inc., Trinity Investment Management Corporation and OFI Trust Company; Assistant Treasurer of Oppenheimer Acquisition Corp.; Vice President and Assistant Treasurer of OppenheimerFunds Distributor, Inc.

    Patrick Adams
    Vice President

    None

    Robert Agan,
    Senior Vice President

    Senior Vice President of Shareholder Financial Services, Inc., OFI Institutional Asset Management, Inc. and Shareholders Services, Inc.; Vice President of OppenheimerFunds Distributor, Inc., Centennial Asset Management Corporation and OFI Private Investments Inc.

    Obianyo Akunwafor,
    Vice President

    None.

    Carl Algermissen,
    Vice President & Senior Counsel

    Assistant Secretary of Centennial Asset Management Corporation.

    Ramesh Allu,
    Vice President

    Formerly VP of Business Solutions at Equant Solutions (July 2008 – July 2010).

    Michael Amato,
    Vice President

    None

    Nicole Andersen,
    Assistant Vice President

    None

    Konstantin Andreev,
    Assistant Vice President

    None

    Raymond Anello,
    Vice President

    Formerly Portfolio Manager of Dividend Strategy/Sector Analyst for Energy/Utilities at RS Investments (June 2007– April 2009).

    Janette Aprilante,
    Vice President & Secretary

    Secretary (since December 2001) of: Centennial Asset Management Corporation, OppenheimerFunds Distributor, Inc., HarbourView Asset Management Corporation (since June 2003), Oppenheimer Real Asset Management, Inc., Shareholder Financial Services, Inc., Shareholder Services, Inc., Trinity Investment Management Corporation (since January 2005), OppenheimerFunds Legacy Program, OFI Private Investments Inc. (since June 2003) and OFI Institutional Asset Management, Inc. (since June 2003). Assistant Secretary of OFI Trust Company (since December 2001).

    Daryl Armstrong,
    Vice President

    None

    Hany S. Ayad,
    Vice President

    None

    Paul Aynsley,
    Vice President

    None

    James F. Bailey,
    Senior Vice President

    Senior Vice President of Shareholder Services, Inc. (since March 2006).

    Robert Baker,
    Vice President

    None

    John Michael Banta,
    Assistant Vice President

    None

    Anthony Barbato,
    Assistant Vice President

    None

    Michael Barnes,
    Assistant Vice President

    None

    Adam Bass,
    Assistant Vice President

    None

    Kevin Baum,
    Senior Vice President

    None

    Jeff Baumgartner,
    Vice President

    Vice President of HarbourView Asset Management Corporation.

    Kathleen Beichert,
    Senior Vice President

    Vice President of OppenheimerFunds Distributor, Inc.

    Joseph Bejarano,
    Assistant Vice President

    None

    Emanuele Bergagnini,
    Vice President

    Assistant Vice President of OFI Institutional Asset Management, Inc.

    Robert Bertucci,
    Assistant Vice President: Rochester Division

    None

    Rajeev Bhaman,
    Senior Vice President

    Vice President of OFI Institutional Asset Management, Inc.

    Ross Bielak,
    Assistant Vice President

    Formerly a senior manager at Sapient Corporation (April 2004 – January 2010).

    Adam Bierstedt,
    Assistant Vice President

    Formerly a manager in the Business Controller Group at OppenheimerFunds, Inc. (February 2006 – January 2010).

    Craig Billings,
    Vice President

    None

    Mark Binning,
    Assistant Vice President

    None

    Donal Bishnoi,
    Assistant Vice President

    None

    Beth Bleimehl,
    Assistant Vice President

    None

    Lisa I. Bloomberg,
    Senior Vice President & Deputy General Counsel

    Assistant Secretary of Oppenheimer Real Asset Management, Inc.

    Veronika Boesch,
    Vice President

    None

    Chad Boll,
    Vice President

    None

    Michelle Borre Massick,
    Vice President

    None

    Lori E. Bostrom,
    Senior Vice President & Deputy General Counsel

    Assistant Secretary of OppenheimerFunds Legacy Program.

    John Boydell,
    Vice President

    None

    Richard Britton,
    Vice President

    None

    Jack Brown,
    Vice President

    Assistant Secretary of HarbourView Asset Management Corporation.

    Roger Buckley,
    Assistant Vice President

    None

    Joy Budzinski,
    Vice President

    None

    Carla Buffulin,
    Vice President

    None

    Stephanie Bullington,
    Vice President

    None

    Julie Burke,
    Vice President

    None

    Lisa Burke,
    Assistant Vice President

    Previously a Manager and OppenheimerFunds, Inc.

    Mark Burns,
    Vice President

    None

    JoAnne Butler,
    Assistant Vice President

    None

    Christine Calandrella,
    Assistant Vice President

    None

    Michael Camarella,
    Vice President

    None

    Edward Campbell,
    Assistant Vice President

    Formerly a Manager at OppenheimerFunds, Inc. (February 2007 – January 2011).

    Debra Casey,
    Vice President

    None

    Herman Chan,
    Vice President

    None

    Ronald Chibnik,
    Vice President

    None

    Patrick Sheng Chu,
    Assistant Vice President

    None

    Jennifer Clark,
    Assistant Vice President

    Assistant Vice President at Shareholder Financial Services, Inc., Shareholder Services, Inc., and OFI Private Investments Inc.

    H.C. Digby Clements,
    Senior Vice President:
    Rochester Division

    None

    Thomas Closs,
    Assistant Vice President

    None

    Darrin Clough,
    Assistant Vice President

    Formerly an Intermediate/Senior Analyst (April 2009 – June 2010) and Senior Analyst at OppenheimerFunds, Inc.

    David Cole,
    Assistant Vice President

    None

    Tamara Colorado,
    Vice President

    None

    Eric Compton,
    Vice President

    None

    Scott Cottier,
    Vice President:
    Rochester Division

    None

    William Couch,
    Assistant Vice President

    None

    Stephanie Colca,
    Assistant Vice President

    None.

    Geoffrey Craddock
    Executive Vice President

    Formerly Senior Vice President and Head of Market Risk Management for CIBC.

    Terry Crady,
    Assistant Vice President

    Formerly IT Development Manager at OppenheimerFunds, Inc.

    Roger W. Crandall,
    Director

    President, Director and Chief Executive Officer of Massachusetts Mutual Life Insurance Company; Chairman of the Board & Class A Director of Oppenheimer Acquisition Corp.

    Lisa Crotty,
    Assistant Vice President

    None

    Jerry Cubbin,
    Vice President

    Formerly a Consultant at National Australia Bank, (May 2009 – October 2009), and a Consultant at Magnitude Capital, (November 2008 – May 2009).

    George Curry,
    Vice President

    Vice President of OppenheimerFunds Distributor, Inc.

    Rushan Dagli,
    Vice President

    Vice President of OFI Private Investments Inc., Shareholder Financial Services, Inc. and Shareholder Services, Inc.

    John Damian,
    Senior Vice President

    Vice President of OFI Institutional Asset Management, Inc.

    Robert Dawson,
    Assistant Vice President

    None

    John Delano,
    Vice President

    None

    Madeline Delianides,
    Vice President

    None

    Kendra Delisa,
    Assistant Vice President

    None

    Alessio de Longis,
    Vice President

    None

    Brendan Deasy,
    Vice President

    None

    Damaris De Los Santos,
    Assistant Vice President

    None

    Richard Demarco,
    Assistant Vice President

    None

    Mark Demitry,
    Vice President

    None

    Robin Dey,
    Vice President

    None

    Craig P. Dinsell,
    Executive Vice President

    None

    Randall C. Dishmon,
    Vice President

    None

    Ryan Dolan,
    Assistant Vice President

    None

    Steven D. Dombrower,
    Vice President

    Senior Vice President of OFI Private Investments Inc.; Vice President of OppenheimerFunds Distributor, Inc.

    Alicia Dopico,
    Vice President

    None

    Andrew Doyle,
    Senior Vice President

    Formerly First Vice President, head of Global Wealth Management Rewards and Information Services at Bank of America (March 2006 – March 2009).

    Thomas Doyle,
    Assistant Vice President

    None

    Adam Drvenkar,
    Assistant Vice President

    None

    Robert Dunphy,
    Vice President

    Formerly Intermediate Analyst at OppenheimerFunds, Inc (August 2004 – May 2009).

    Brian Dvorak,
    Vice President

    None

    Taylor Edwards,
    Vice President & Associate Counsel

    None

    Peter Elder,
    Vice President

    None

    Peter Ellman,
    Assistant Vice President

    None

    Christopher Emanuel,
    Vice President

    None

    Daniel R. Engstrom,
    Vice President

    None

    James Robert Erven,
    Assistant Vice President

    None

    Dana Espinel,
    Assistant Vice President

    Senior Meetings Events Manager at Wolters Kluwer (May 2007 – October 2010)

    George R. Evans,
    Senior Vice President & Director of Equities

    None

    Kathy Faber,
    Assistant Vice President

    None

    David Falicia,
    Assistant Vice President

    Assistant Secretary (as of July 2004) of HarbourView Asset Management Corporation.

    Matthew Farkas,
    Vice President and Senior Counsel

    None

    Kristie Feinberg,
    Vice President and Assistant Treasurer

    Assistant Treasurer of Oppenheimer Acquisition Corp., Centennial Asset Management Corp., OFI Trust Company; Vice President of OFI Institutional Asset Management, Inc.; Treasurer of OppenheimerFunds Legacy Program, OFI Private Investments Inc.; Oppenheimer Real Asset Management, Inc. and HarbourView Asset Management Corporation.

    Emmanuel Ferreira,
    Vice President

    None

    Steven Fling,
    Assistant Vice President

    None

    Colleen M. Franca,
    Vice President

    None

    Debbie Francis,
    Assistant Vice President

    None

    Dominic Freud,
    Vice President

    None

    Marcus Franz,
    Vice President

    None

    Arthur Gabinet,
    Executive Vice President and General Counsel

    Executive Vice President (since May 2010) and General Counsel (since January 2011) of the Manager; General Counsel of the Distributor (since January 2011); General Counsel of Centennial Asset Management Corporation (since January 2011); Executive Vice President and General Counsel of HarbourView Asset Management Corporation (since January 2011); Assistant Secretary (since January 2011) and Director (since January 2011) of OppenheimerFunds International Ltd. and OppenheimerFunds plc; Vice President and Director of Oppenheimer Partnership Holdings, Inc. (since January 2011); Director of Oppenheimer Real Asset Management, Inc. (since January 2011); Executive Vice President and General Counsel of Shareholder Financial Services, Inc. and Shareholder Services, Inc. (since January 2011); Executive Vice President and General Counsel of OFI Private Investments, Inc. (since January 2011); Vice President of OppenheimerFunds Legacy Program (since January 2011); Vice President of Oppenheimer Acquisition Corp (since February 2011); Executive Vice President and General Counsel of OFI Institutional Asset Management, Inc. (since January 2011); General Counsel, Asset Management of the Manager (May 2010-December 2010); (Principal, The Vanguard Group (November 2005-April 2010).

    Hazem Gamal,
    Vice President

    None

    Charles Gapay,
    Assistant Vice President

    None

    Anthony W. Gennaro, Jr.,
    Vice President

    Formerly a sector manager for media, internet and telecom and a co-portfolio manager for mid-cap portfolios with the RS Core Equity Team of RS Investment Management Co. LLC (October 2006 – April 2009.); Vice President of OFI Institutional Asset Management, Inc.

    Timothy Gerlach,
    Assistant Vice President

    None

    Charles Gilbert,
    Assistant Vice President

    None

    Alan C. Gilston,
    Vice President

    Director of OFI Trust Company

    Edward Gizzi,
    Vice President
    and Assistant Counsel

    Associate at Willkie Farr & Gallagher, LLP (February 2006 – October 2010).

    William F. Glavin, Jr., Chairman, Chief Executive Officer, President and Director

    Formerly Executive Vice President and co-Chief Operating Officer of MassMutual Financial Group; Director of OFI Institutional Asset Management, Inc. Tremont Group Holdings, Inc. and Oppenheimer Real Asset Management, Inc.; Chief Executive Officer, President & Management Director of Oppenheimer Acquisition Corp.

    Jill E. Glazerman,
    Senior Vice President

    None

    Kevin Glenn,
    Vice President

    None

    Manind Govil,
    Senior Vice President

    Formerly portfolio manager with RS Investment Management Co. LLC (October 2006 – May 2009); Senior Vice President of OFI Institutional Asset Management, Inc.

    Raquel Granahan,
    Senior Vice President

    Senior Vice President of OFI Private Investments Inc.; Vice President of OppenheimerFunds Distributor, Inc., and OppenheimerFunds Legacy Program.

    Robert B. Grill,
    Senior Vice President

    None

    Samuel Groban,
    Assistant Vice President

    None

    Selin Gulcelik,
    Vice President

    None

    Marilyn Hall,
    Vice President

    None

    Cheryl Hampton,
    Vice President

    Formerly Vice President and Director of Mutual Fund and Hedge Fund Operations at Calamos Advisors LLC (March 2007 – September 2009).

    Kelly Haney,
    Assistant Vice President

    None

    Jason Harubin,
    Assistant Vice President

    None

    Steve Hauenstein,
    Assistant Vice President

    None

    Molly Hausmann,
    Assistant Vice President

    None

    Thomas B. Hayes,
    Vice President

    None

    Heidi Heikenfeld,
    Vice President

    None

    Lori Heinel
    Senior Vice President

    Formerly a managing director and head of investment solutions at Citi Private Bank

    Nicholas Henry,
    Assistant Vice President

    Formerly a Product Analyst at OppenheimerFunds, Inc. (June 2007 – February 2011).

    Philipp Hensler,
    Executive Vice President

    Formerly CEO, Chairman and Managing Director at DWS Investment Distributors, Inc.; Director, Chairman of the Board & President of OppenheimerFunds Distributor, Inc; Chairman, Chief Executive Officer & Director of Centennial Asset Management, Inc.

    Kenneth Herold,
    Assistant Vice President

    None

    Robert Herz,
    Vice President

    Formerly a Managing Director at John W. Bristol & Co., Inc. (May 2003 – January 2011).

    Benjamin Hetrick,
    Assistant Vice President

    None

    Joseph Higgins,
    Vice President

    Vice President of OFI Institutional Asset Management, Inc and OFI Private Investments Inc.

    Todd Hiller,
    Vice President

    None

    Dorothy F. Hirshman,
    Vice President

    None

    Daniel Hoelscher,
    Assistant Vice President

    None

    Craig Holloway,
    Vice President

    None

    Lucienne Howell,
    Vice President

    None

    Brian Hourihan,
    Senior Vice President & Deputy General Counsel

    Assistant Secretary of OFI Trust Company, Oppenheimer Real Asset Management, Inc., OFI Private Investments Inc., HarbourView Asset Management Corporation, OFI Institutional Asset Management, Inc. (since April 2006) and Trinity Investment Management Corporation; Secretary of OFI Trust Company.

    Edward Hrybenko,
    Senior Vice President

    Vice President of OppenheimerFunds Distributor, Inc.

    Jason Hubersberger,
    Vice President

    None

    Douglas Huffman,
    Assistant Vice President

    None

    Margaret Hui,
    Vice President

    Vice President of HarbourView Asset Management Corporation.

    Dana Hunter,
    Assistant Vice President

    None

    John Huttlin,
    Vice President

    Senior Vice President (Director of the International Division) (since January 2004) of OFI Institutional Asset Management, Inc.; Director (since June 2003) of OppenheimerFunds International Distributor Limited.

    Kelly Bridget Ireland,
    Vice President

    None

    Kathleen T. Ives,
    Senior Vice President, Deputy General Counsel & Assistant Secretary

    Vice President and Assistant Secretary of OppenheimerFunds Distributor, Inc. and Shareholder Services, Inc.; Assistant Secretary of Centennial Asset Management Corporation, HarbourView Asset Management Corporation, OppenheimerFunds Legacy Program and Shareholder Financial Services, Inc.

    Frank V. Jennings,
    Senior Vice President

    None

    Lisa Kadehjian,
    Vice President

    None

    Rezo Kanovich,
    Vice President

    None

    Amee Kantesaria,
    Vice President, Assistant Secretary and Assistant Counsel

    Assistant Secretary of Oppenheimer Acquisition Corp.

    Cem Karacadag,
    Vice President

    None

    Thomas W. Keffer,
    Senior Vice President

    Senior Vice President of OppenheimerFunds Distributor, Inc.

    Sean Keller,
    Vice President

    None

    James Kennedy,
    Senior Vice President

    None

    John Kiernan,
    Vice President & Associate Counsel

    None

    Robert Kinsey,
    Vice President

    None

    Audrey Kiszla,
    Vice President

    None

    Daniel Kohn,
    Vice President

    None

    Samuel Koren,
    Vice President and Deputy General Counsel

    None

    Martin S. Korn,
    Senior Vice President

    None

    Michael Kotlarz,
    Vice President

    None

    Lisa A. Krahl,
    Assistant Vice President

    None

    Brian Kramer,
    Vice President

    Assistant Treasurer of Oppenheimer Acquisition Corp.

    Magnus Krantz,
    Vice President

    Formerly an Analyst at RS Investments (December 2005 – May 2009).

    Alexander Kurinets,
    Assistant Vice President

    None

    Gloria LaFond,
    Assistant Vice President

    None

    Lisa Lamentino,
    Vice President

    None

    Eric Larson,
    Vice President

    Formerly Senior Equity Trader at RS Investments (October 2006 – May 2009).

    Gayle Leavitt,
    Vice President

    None

    John Lech,
    Vice President

    None

    Helena Lee,
    Assistant Vice President

    Previously an associate at Citigroup (October 2006 – February 2011).

    Johnny C. Lee,
    Vice President & Assistant Counsel

    None

    Victor Lee,
    Vice President

    None

    Young-Sup Lee,
    Vice President

    None.

    Randy Legg,
    Vice President & Senior
    Counsel

    None

    Michael Leskinen,
    Vice President

    None

    Michael S. Levine,
    Vice President

    None

    Brian Levitt,
    Vice President

    None

    Justin Leverenz,
    Senior Vice President

    None

    William M. Levey,
    Assistant Vice President
    & Assistant Counsel

    Formerly an attorney at Seward & Kissel LLP (September 2005 – April 2009).

    Gang Li,
    Vice President

    None

    Shanquan Li,
    Vice President

    None

    Julie A. Libby,
    Senior Vice President

    President and Chief Operating Officer of OFI Private Investments Inc.

    Mitchell J. Lindauer,
    Vice President & Assistant General Counsel

    None

    William Linden,
    Vice President

    None

    Jay Lisowski,
    Vice President

    None

    Justin Livengood,
    Vice President

    None

    Christina Loftus,
    Vice President

    None

    David P. Lolli,
    Assistant Vice President

    None

    Daniel G. Loughran,
    Senior Vice President:
    Rochester Division

    None

    Misha Lozovik,
    Vice President

    None

    Dongyan Ma,
    Assistant Vice President

    None

    Amrish Makwana,
    Assistant Vice President

    Previously a Vice President at Loomis Sayles & Co. (November 2004 – March 2007).

    Dana Mangnuson,
    Assistant Vice President

    None

    Daniel Martin,
    Assistant Vice President

    None

    Kenneth Martin,
    Vice President

    Formerly a Compliance Officer at Merrill Lynch & Co. (May 2007 – August 2009).

    William T. Mazzafro,
    Vice President

    None

    Melissa Mazer,
    Vice President

    None

    Neil McCarthy,
    Vice President

    Vice President of OFI Institutional Asset Management, Inc and OFI Private Investments Inc.

    Elizabeth McCormack,
    Vice President

    Vice President and Assistant Secretary of HarbourView Asset Management Corporation; Vice President of OFI Institutional Asset Management, Inc., and OFI Trust Company.

    Joseph McDonnell,
    Vice President

    None

    Annika McGovern,
    Assistant Vice President

    None

    Joseph McGovern,
    Vice President

    None

    Benedict Mclaughlin,
    Assistant Vice President

    Formerly a management associate at Citigroup (January 2007 – January 2010).

    William McNamara,
    Vice President

    Vice President of OFI Private Investments Inc.

    Michael Medev,
    Assistant Vice President

    None

    Krishna Memani,
    Senior Vice President and Director of Fixed Income

    Senior Vice President of OFI Institutional Asset Management, Inc.

    Jay Mewhirter,
    Vice President

    None

    Andrew J. Mika,
    Senior Vice President

    None

    Jan Miller,
    Assistant Vice President

    None

    Scott Miller,
    Vice President

    None

    Rejeev Mohammed,
    Assistant Vice President

    None

    David Moore,
    Vice President

    None

    Sarah Morrison,
    Assistant Vice President

    None

    Jill Mulcahy,
    Vice President:
    Rochester Division

    None

    Suzanne Murphy,
    Vice President

    Vice President of OFI Private Investments Inc.

    Thomas J. Murray,
    Vice President

    None

    Christina Nasta,
    Senior Vice President

    Vice President of OppenheimerFunds Distributor, Inc.

    Amie Nelson,
    Vice President

    None

    Derek Newman,
    Vice President and Assistant Counsel

    Formerly an associate at Dechert LLP

    Paul Newman,
    Assistant Vice President

    None

    James B. O’Connell,
    Assistant Vice President

    None

    Patricia O’Connor,
    Assistant Vice President

    None

    Matthew O’Donnell,
    Vice President

    None

    Lisa Ogren,
    Assistant Vice President

    None

    Tony Oh,
    Vice President

    None

    Kristina Olson,
    Senior Vice President

    None

    Kristin Pak,
    Vice President

    None

    Lerae A. Palumbo,
    Assistant Vice President

    None

    Phillip Parrotta,
    Senior Vice President

    None

    Kim Pascalau,
    Vice President

    Assistant Vice President of Shareholder Services, Inc. and Shareholder Financial Services, Inc.

    Robert H. Pemble,
    Vice President

    None

    Lori L. Penna,
    Vice President

    None

    Nadia Persaud,
    Assistant Vice President and Assistant Counsel

    Formerly an associate at Sidley Austin, LLP.

    Brian Petersen,
    Vice President

    Assistant Treasurer of OppenheimerFunds Legacy Program.

    Marmeline Petion-Midy,
    Vice President

    None

    David Pfeffer,
    Executive Vice President, Chief Financial Officer, Treasurer & Director

    Management Director and Treasurer of Oppenheimer Acquisition Corp.; Director of OppenheimerFunds Distributor, Inc., OFI Private Investments Inc. and Oppenheimer Real Asset Management, Inc.; Director & Executive Vice President OFI Institutional Asset Management, Inc. and Trinity Investment Management Corporation; Senior Vice President of OFI Trust Company; Director & President of HarbourView Asset Management Corporation; Director of Shareholder Services, Inc., Centennial Asset Management Corporation, Tremont Group Holdings, Inc. and Shareholder Financial Services, Inc.

    James F. Phillips,
    Senior Vice President

    None

    Gary Pilc,
    Vice President

    None

    Christine Polak,
    Vice President

    None

    Sergei Polevikov,
    Assistant Vice President

    None

    Jeffrey Portnoy,
    Assistant Vice President

    None

    Stacy Pottinger,
    Vice President

    None

    Christopher Proctor,
    Vice President

    None

    John Ptasinski,
    Assistant Vice President

    Formerly a Senior Manager at Jeppesen Sanderson, and Boeing Company (November 2003 – January 2011)

    Ellen Puckett,
    Assistant Vice President

    None

    Charlie Pulire,
    Assistant Vice President

    Formerly a Portfolio Analyst at Oppenheimer Funds, Inc. (February 2007 – December 2010).

    Jodi Pullman,
    Assistant Vice President

    None

    Paul Quarles,
    Assistant Vice President

    None

    Michael E. Quinn,
    Vice President

    None

    Julie S. Radtke,
    Vice President

    None

    Benjamin Ram,
    Vice President

    Sector manager at RS Investment Management Co. LLC (October 2006 – May 2009) and Portfolio Manager Mid Cap Strategies; Vice President of OFI Institutional Asset Management, Inc.

    Norma J. Rapini,
    Assistant Vice President:

    Rochester Division

    None

    Amber Reilly,
    Assistant Vice President

    Manager (October 2008 – May 2009) at Newsday Media Group.

    Jill Reiter,
    Assistant Vice President

    None

    Barbara Reinhard,
    Senior Vice President

    Formerly deputy Chief Investment Strategist at Morgan Stanley Smith Barney.

    Jill Reiter,
    Assistant Vice President

    None

    Maria Ribeiro De Castro,
    Vice President

    None

    Grace Roberts,
    Vice President

    None

    Benjamin Rockmuller,
    Vice President

    None

    Antoinette Rodriguez,
    Vice President

    None

    Lucille Rodriguez,
    Assistant Vice President

    None

    Michael Rollings,
    Director

    Executive Vice President and Chief Financial Officer of Massachusetts Mutual Life Insurance Company; Class A Director of Oppenheimer Acquisition Corp.

    Stacey Roode,
    Senior Vice President

    Senior Vice President of OppenheimerFunds Legacy Program, Shareholder Financial Services, Inc. and Shareholder Services, Inc.

    Erica Rualo,
    Vice President

    None

    Adrienne Ruffle,
    Vice President & Associate Counsel

    Assistant Secretary of OppenheimerFunds Legacy Program and OFI Private Investments Inc.

    Gerald Rutledge,
    Vice President

    None

    Sean Ryan,
    Assistant Vice President and Assistant Counsel

    None

    Gary Salerno,
    Assistant Vice President

    None

    Valerie Sanders,
    Vice President

    None

    Carlos Santiago
    Assistant Vice President

    None

    Kurt Savallo,
    Assistant Vice President

    Formerly Senior Business Analyst at OppenheimerFunds, Inc.

    Mary Beth Schellhorn,
    Assistant Vice President

    None

    Ellen P. Schoenfeld,
    Vice President

    None

    Patrick Schneider,
    Vice President

    None

    Scott A. Schwegel,
    Assistant Vice President

    None

    Allan P. Sedmak,
    Assistant Vice President

    None

    Matthew Severski,
    Assistant Vice President

    Formerly Lead IS Engineer at OppenheimerFunds, Inc. (August 2006 – May 2009).

    Jennifer L. Sexton,
    Vice President

    Senior Vice President of OFI Private Investments Inc.

    Asutosh Shah,
    Vice President

    None

    Kamal Shah,
    Vice President

    None

    Tammy Sheffer,
    Senior Vice President

    None

    Richard Shepley,
    Vice President

    Managing Director at Deutsche Asset Management (January 1998 – March 2010).

    William Sheppard,
    Vice President

    None

    Mary Dugan Sheridan,
    Vice President

    None

    Nicholas Sherwood,
    Assistant Vice President

    None

    Joel Simon,
    Vice President

    Formerly Assistant Vice President at OppenheimerFunds, Inc. (1999

    2009).

    David C. Sitgreaves,
    Assistant Vice President

    None

    Jan Smith,
    Assistant Vice President

    Formerly Manager at OppenheimerFunds Inc. (May 2005 – June 2009).

    Louis Sortino,
    Vice President:
    Rochester Division

    None

    Keith J. Spencer,
    Senior Vice President

    None

    Brett Stein,
    Vice President

    None

    Richard A. Stein,
    Vice President:
    Rochester Division

    None

    Arthur P. Steinmetz,

    Executive Vice President & Chief Investment Officer

    Director and Senior Vice President of HarbourView Asset Management Corporation; Vice President of OFI Institutional Asset Management, Inc.; Director & President of Oppenheimer Real Asset Management, Inc.

    Jennifer Stevens,
    Vice President

    None

    Benjamin Stewart,
    Assistant Vice President

    None

    Wayne Strauss,
    Vice President

    None

    Peter Strzalkowski,
    Vice President

    Vice President of HarbourView Asset Management, Inc.

    Agata Strzelichowski,
    Assistant Vice President

    None

    Amy Sullivan,
    Assistant Vice President

    Assistant Secretary of HarbourView Asset Management, Inc.

    Michael Sussman,
    Vice President

    Vice President of OppenheimerFunds Distributor, Inc.

    Kanishka Surana,
    Vice President

    Partner and Director of Analytics at Ogilvy and Mather (May 2009 – July 2010); Manager at Gerson and Lehrman Group (October 2007 – May 2009).

    Kelly Thomas,
    Assistant Vice President

    None

    Igor Tishin,
    Vice President

    Formerly an employee at Troika Dialog USA (February 2005 – January 2011).

    Matthew Torpey,
    Vice President

    None

    Melinda Trujillo,
    Vice President

    None

    Leonid Tsvayg,
    Assistant Vice President

    None

    Keith Tucker,
    Vice President

    None

    Angela Uttaro,
    Vice President: Rochester Division

    None

    Julie Van Cleave,
    Vice President

    None

    Mark S. Vandehey,
    Senior Vice President & Chief Compliance Officer

    Vice President and Chief Compliance Officer of OppenheimerFunds Distributor, Inc., Centennial Asset Management Corporation and Shareholder Services, Inc.; Chief Compliance Officer of HarbourView Asset Management Corporation, Oppenheimer Real Asset Management, Inc., Shareholder Financial Services, Inc., Trinity Investment Management Corporation, OppenheimerFunds Legacy Program, OFI Private Investments Inc. and OFI Trust Company and OFI Institutional Asset Management, Inc.

    Maureen Van Norstrand,
    Vice President

    None

    Nancy Vann,
    Vice President & Associate Counsel

    None

    Raman Vardharaj,
    Vice President

    Formerly a sector manager and a senior quantitative analyst at RS Investment Management Co. LLC (October 2006 – May 2009); Vice President of OFI Institutional Asset Management, Inc.

    Rene Vecka,
    Vice President:

    Rochester Division

    None

    Elaine Villas
    Assistant Vice President

    None

    Ryan Virag,
    Assistant Vice President

    None

    Jake Vogelaar,
    Assistant Vice President

    None

    Phillip F. Vottiero,
    Senior Vice President

    None

    Mark Wachter,
    Vice President

    None

    Darren Walsh,
    Executive Vice President

    President and Director of Shareholder Financial Services, Inc. and Shareholder Services, Inc.

    Eliot Walsh,
    Assistant Vice President

    None

    Richard Walsh,
    Vice President

    Vice President of OFI Private Investments.

    Samuel Wang,

    Vice President

    Director (January 2010 – October 2010) and Vice President (November 2005 – December 2009) of Global Communications and Public Affairs at Citigroup, Inc.

    Elizabeth Ward,
    Director

    Senior Vice President and Chief Enterprise Risk Officer of Massachusetts Mutual Life Insurance Company; Class A Director of Oppenheimer Acquisition Corp.

    Thomas Waters,
    Vice President

    Vice President of OFI Institutional Asset Management, Inc.

    Margaret Weaver,
    Vice President

    None

    Jerry A. Webman,
    Senior Vice President

    Senior Vice President of HarbourView Asset Management Corporation.

    Christopher D. Weiler,
    Vice President:
    Rochester Division

    None

    Adam Weiner,
    Vice President

    None

    Christine Wells,
    Vice President

    None

    Joseph J. Welsh,
    Senior Vice President

    Vice President of HarbourView Asset Management Corporation; Vice President of OFI Institutional Asset Management, Inc.

    Adam Wilde,
    Assistant Vice President

    Assistant Secretary of HarbourView Asset Management Corporation

    Mitchell Williams,
    Vice President

    None

    Martha Willis,
    Executive Vice President

    Formerly Executive Vice President of Investment Product Management at Fidelity Investments; Director of OFI Private Investments Inc., Centennial Asset Management Corporation; President & Director of OppenheimerFunds Legacy Program.

    Troy Willis,

    Vice President,
    Rochester Division

    None

    Brian W. Wixted,

    Senior Vice President

    Treasurer of HarbourView Asset Management Corporation; OppenheimerFunds International Ltd., Oppenheimer Real Asset Management, Inc., Shareholder Services, Inc., Shareholder Financial Services, Inc., OFI Institutional Asset Management, Inc., OppenheimerFunds plc and OppenheimerFunds Legacy Program; Senior Vice President of OFI Private Investments Inc.; Treasurer and Chief Financial Officer of OFI Trust Company; Assistant Treasurer of Oppenheimer Acquisition Corp.

    Carol E. Wolf,
    Senior Vice President

    Senior Vice President of HarbourView Asset Management Corporation; Vice President of OFI Institutional Asset Management, Inc. and Centennial Asset Management Corporation; serves on the Board of the Colorado Ballet.

    Oliver Wolff,
    Assistant Vice President

    Assistant Secretary of HarbourView Asset Management Corporation.

    Caleb C. Wong,
    Vice President

    Vice President of OFI Institutional Asset Management, Inc.

    Sookhee Yee,
    Assistant Vice President

    Vice President at Merrill Lynch Bank and Trust, FSB (February 2002 – May 2009).

    Edward C. Yoensky,
    Assistant Vice President

    None

    Geoff Youell,
    Assistant Vice President

    None

    Robert G. Zack,
    Executive Vice President

    Vice President, Secretary and General Counsel of OAC (since November 2001); Executive Vice President (since January 2004) and General Counsel (from March 2002 to December 2010) of the Manager; General Counsel of the Distributor (from December 2001 to December 2010); General Counsel of Centennial Asset Management Corporation (from December 2001 to December 2010); Senior Vice President and General Counsel of HarbourView Asset Management Corporation (from December 2001 to December 2010); Assistant Secretary (from September 1997 to December 2010) and Director (from November 2001 to December 2010) of OppenheimerFunds International Ltd. and OppenheimerFunds plc; Vice President and Director of Oppenheimer Partnership Holdings, Inc. (from December 2002 to December 2010); Director of Oppenheimer Real Asset Management, Inc. (from November 2001 to December 2010); Senior Vice President, General Counsel and Director of Shareholder Financial Services, Inc. and Shareholder Services, Inc. (from December 2001 to December 2010); Senior Vice President, General Counsel and Director of OFI Private Investments, Inc. (from November 2001 to December 2010); Executive Vice President, General Counsel and Director of OFI Trust Company (since November 2001); Vice President OppenheimerFunds Legacy Program (from June 2003 to December 2010); Senior Vice President and General Counsel of OFI Institutional Asset Management, Inc. (from November 2001 to December 2010).

    Anna Zatulovskaya,
    Assistant Vice President

    None

    Sara Zervos,

    Senior Vice President

    None

    Ronald Zibelli, Jr.
    Vice President

    None

    Matthew Ziehl,
    Vice President

    Formerly a portfolio manager with RS Investment Management Co. LLC (from October 2006 – May 2009).

    The Oppenheimer Funds include the following:

    Limited Term New York Municipal Fund (a series of Rochester Portfolio Series)
    Oppenheimer Absolute Return Fund
    Oppenheimer AMT-Free Municipals
    Oppenheimer AMT-Free New York Municipals
    Oppenheimer Balanced Fund
    Oppenheimer California Municipal Fund
    Oppenheimer Capital Appreciation Fund
    Oppenheimer Capital Income Fund
    Oppenheimer Cash Reserves
    Oppenheimer Champion Income Fund
    Oppenheimer Commodity Strategy Total Return Fund
    Oppenheimer Core Bond Fund (a series of Oppenheimer Integrity Funds)
    Oppenheimer Corporate Bond Fund
    Oppenheimer Currency Opportunities Fund
    Oppenheimer Developing Markets Fund
    Oppenheimer Discovery Fund
    Oppenheimer Emerging Markets Debt Fund
    Oppenheimer Equity Fund, Inc.
    Oppenheimer Equity Income Fund, Inc.
    Oppenheimer Global Fund
    Oppenheimer Global Opportunities Fund
    Oppenheimer Global Strategic Income Fund
    Oppenheimer Global Value Fund
    Oppenheimer Gold & Special Minerals Fund
    Oppenheimer International Bond Fund
    Oppenheimer Institutional Money Market Fund
    Oppenheimer International Diversified Fund
    Oppenheimer International Growth Fund
    Oppenheimer International Small Company Fund
    Oppenheimer Limited Term California Municipal Fund
    Oppenheimer Limited-Term Government Fund
    Oppenheimer Limited Term Municipal Fund (a series of Oppenheimer Municipal Fund)
    Oppenheimer Main Street Fund (a series of Oppenheimer Main Street Funds, Inc.)
    Oppenheimer Main Street Select Fund
    Oppenheimer Main Street Small- & Mid-Cap Fund
    Oppenheimer Master Event-Linked Bond Fund, LLC
    Oppenheimer Master Loan Fund, LLC
    Oppenheimer Master Inflation Protected Securities Fund, LLC
    Oppenheimer Master International Value Fund, LLC
    Oppenheimer Money Market Fund, Inc.
    Oppenheimer Multi-State Municipal Trust (3 series):
         Oppenheimer New Jersey Municipal Fund
         Oppenheimer Pennsylvania Municipal Fund
         Oppenheimer Rochester National Municipals
    Oppenheimer Portfolio Series (4 series)
         Active Allocation Fund
         Equity Investor Fund
         Conservative Investor Fund
         Moderate Investor Fund
    Oppenheimer Portfolio Series Fixed Income Active Allocation Fund
    Oppenheimer Principal Protected Main Street Fund III (a series of Oppenheimer Principal Protected Trust III)
    Oppenheimer Quest For Value Funds (3 series)
         Oppenheimer Global Allocation Fund

         Oppenheimer Quest Opportunity Value Fund
         Oppenheimer Small- & Mid-Cap Value Fund
    Oppenheimer Quest International Value Fund
    Oppenheimer Real Estate Fund
    Oppenheimer Rising Dividends Fund
    Oppenheimer Rochester Arizona Municipal Fund
    Oppenheimer Rochester Intermediate Term Municipal Fund
    Oppenheimer Rochester Maryland Municipal Fund
    Oppenheimer Rochester Massachusetts Municipal Fund
    Oppenheimer Rochester Michigan Municipal Fund
    Oppenheimer Rochester Minnesota Municipal Fund
    Oppenheimer Rochester North Carolina Municipal Fund
    Oppenheimer Rochester Ohio Municipal Fund
    Oppenheimer Rochester Short Term Municipal Fund
    Oppenheimer Rochester Virginia Municipal Fund
    Oppenheimer Select Value Fund
    Oppenheimer Senior Floating Rate Fund
    Oppenheimer Series Fund, Inc. (1 series):
         Oppenheimer Value Fund
    Oppenheimer Small- & Mid-Cap Growth Fund
    Oppenheimer Short Duration Fund
         Oppenheimer Transition 2010 Fund
         Oppenheimer Transition 2015 Fund
         Oppenheimer Transition 2020 Fund
         Oppenheimer Transition 2025 Fund
         Oppenheimer Transition 2030 Fund
         Oppenheimer Transition 2040 Fund
         Oppenheimer Transition 2050 Fund
    Oppenheimer U.S. Government Trust
    Oppenheimer Variable Account Funds (11 series):
         Oppenheimer Balanced Fund/VA
         Oppenheimer Capital Appreciation Fund/VA
         Oppenheimer Core Bond Fund/VA
         Oppenheimer Global Securities Fund/VA
         Oppenheimer Global Strategic Income Fund/VA
         Oppenheimer High Income Fund/VA
         Oppenheimer Main Street Fund/VA
         Oppenheimer Main Street Small Cap Fund/VA
         Oppenheimer Money Fund/VA
         Oppenheimer Small- & Mid-Cap Growth Fund/VA
         Oppenheimer Value Fund/VA
    Panorama Series Fund, Inc. (3 series):
         Growth Portfolio
         Oppenheimer International Growth Fund/VA
         Total Return Portfolio
    Rochester Fund Municipals

    The address of the Oppenheimer funds listed above, Shareholder Financial Services, Inc., Shareholder Services, Inc., Centennial Asset Management Corporation, and OppenheimerFunds Legacy Program is 6803 South Tucson Way, Centennial, Colorado 80112-3924.

    The address of OppenheimerFunds, Inc., OppenheimerFunds Distributor, Inc., HarbourView Asset Management Corporation, Oppenheimer Acquisition Corp., OFI Private Investments Inc., OFI Institutional Asset Management, Inc. Oppenheimer Real Asset Management, Inc. and OFI Trust Company is Two World Financial Center, 225 Liberty Street, 11th Floor, New York, New York 10281-1008.

    The address of OppenheimerFunds International Ltd. is 70 Sir John Rogerson’s Quay, Dublin 2, Ireland.

    The address of Trinity Investment Management Corporation is 301 North Spring Street, Bellefonte, Pennsylvania 16823.

    Item 32. Principal Underwriter

    (a)     OppenheimerFunds Distributor, Inc. is the Distributor of the Registrant's shares. It is also the Distributor of each of the other registered open-end investment companies for which OppenheimerFunds, Inc. is the investment adviser, as described in Part A and Part B of this Registration Statement and listed in Item 31(b) above (except Panorama Series Fund, Inc.) and for MassMutual Institutional Funds.
     
    (b)     The directors and officers of the Registrant's principal underwriter are:


    Name & Principal
    Business Address

    Position & Office
    with Underwriter

    Position and Office
    with Registrant

    Timothy Abbhul(1)

    Vice President and Treasurer

    None

    Robert Agan(1)

    Vice President

    None

    Anthony Allocco(2)

    Assistant Vice President

    None

    Janette Aprilante(2)

    Secretary

    None

    James Austin(1)

    Vice President

    None

    James Barker
    1723 W. Nelson Street
    Chicago, IL 60657

    Vice President

    None

    Cesar Bastidas(2)

    Assistant Vice President

    None

    Kathleen Beichert(1)

    Senior Vice President

    None

    Rocco Benedetto(2)

    Vice President

    None

    Christopher Bergeron

    Vice President

    None

    Rick Bettridge

    11504 Flowering Plum Lane

    Highland, UT 84003

    Vice President

    None

    Adam Bilmes(2)

    Assistant Vice President

    None

    William Borders(2)

    Assistant Vice President

    None

    David A. Borrelli
    105 Black Calla Ct.
    San Ramon, CA 94583

    Vice President

    None

    Jeffrey R. Botwinick

    4431 Twin Pines Drive
    Manlius, NY 13104

    Vice President

    None

    Sarah Bourgraf(1)

    Vice President

    None

    Bryan Bracchi

    1124 Hampton Dr.
    Allen, TX
    75013

    Vice President

    None

    Joshua Broad(2)

    Vice President

    None

    Ken Brodsky(2)

    Vice President

    None

    Kevin E. Brosmith
    5 Deer Path

    South Natlick, MA 01760

    Senior Vice President

    None

    Jeffrey W. Bryan
    1048 Malaga Avenue
    Coral Gables, FL 33134

    Vice President

    None

    Ross Burkstaller

    211 Tulane Drive SE

    Albuquerque, NM 87106

    Vice President

    None

    Michael Butler(2)

    Assistant Vice President

    None

    Tracy Cairoli(2)

    Vice President

    None

    Robert Caruso
    15 Deforest Road
    Wilton, CT 06897

    Vice President

    None

    Donelle Chisolm(2)

    Vice President

    None

    Andrew Chronofsky

    Vice President

    None

    Angelanto Ciaglia(2)

    Vice President

    None

    Nicholas Cirbo(1)

    Vice President

    None

    Kevin Clark(2)

    Assistant Vice President

    None

    Melissa Clayton(2)

    Vice President

    None

    John Corcoran(2)

    Vice President

    None

    Craig Colby(2)

    Vice President

    None

    Rodney Constable(1)

    Vice President

    None

    Cameron Cowden(2)

    Vice President

    None

    Neev Crane
    1530 Beacon Street, Apt. #1403
    Brookline, MA 02446

    Vice President

    None

    Scott Curran(2)

    Vice President

    None

    Michael Daley
    40W387 Oliver Wendell Holmes St
    St. Charles, IL 60175

    Vice President

    None

    John Davis(2)

    Vice President

    None

    Stephen J. Demetrovits(2)

    Vice President

    None

    Brian Dietrich(1)

    Assistant Vice President

    None

    Steven Dombrower
    13 Greenbrush Court
    Greenlawn, NY 11740

    Vice President

    None

    Ryan Duffy(2)

    Vice President

    None

    Robert Dunphy(2)

    Vice President

    None

    Beth Arthur Du Toit(1)

    Vice President

    None

    Paul Eck

    3055 Forest Ridge Court
    Fairlawn, OH 44333

    Vice President

    None     

    Paul Eisenhardt(2)

    Senior Vice President

    None

    Kent M. Elwell
    35 Crown Terrace
    Yardley, PA 19067

    Vice President

    None

    Rick Ernzen(2)

    Vice President

    None

    Dana Espinel(2)

    Assistant Vice President

    None

    Gregg A. Everett
    4328 Auston Way
    Palm Harbor, FL 34685-4017

    Vice President

    None

    George R. Fahey

    9511 Silent Hills Lane
    Lone Tree, CO 80124

    Senior Vice President

    None

    Eric C. Fallon
    10 Worth Circle
    Newton, MA 02458

    Vice President

    None

    Kristie Feinberg(2)

    Assistant Treasurer

    None

    Joseph Fernandez
    1717 Richbourg Park Drive
    Brentwood, TN 37027

    Vice President

    None

    Michael Ferrer(2)

    Vice President

    None

    Mark J. Ferro
    104 Beach 221
    st
    Street
    Breezy Point, NY 11697

    Senior Vice President

    None

    Eric P. Fishel
    725 Boston Post Rd., #12
    Sudbury, MA 01776

    Vice President

    None

    David Flaherty(2)

    Assistant Vice President

    None

    Patrick W. Flynn
    14083 East Fair Avenue
    Englewood, CO 80111

    Senior Vice President

    None

    John (“J”) Fortuna(2)

    Vice President

    None

    Jayme D. Fowler
    3818 Cedar Springs Road, #101-349
    Dallas, TX 75219

    Vice President

    None

    Diane Frankenfield(2)

    Senior Vice President

    None

    Jerry Fraustro(2)

    Vice President

    None

    William Friebel

    2919 St. Albans Forest Circle
    Glencoe, MO 63038

    Vice President

    None

    Alyson Frost(2)

    Assistant Vice President

    None

    Greg Fulginite(2)

    Vice President

    None

    Arthur S. Gabinet(2)

    General Counsel

    Secretary

    William Gahagan(2)

    Vice President

    None

    Charlotte Gardner(1)

    Vice President

    None

    David Goldberg(2)

    Assistant Vice President

    None

    Michael Gottesman
    255 Westchester Way
    Birmingham, MI 48009

    Vice President

    None

    Raquel Granahan(2)

    Senior Vice President

    None

    Robert Grill(2)

    Senior Vice President

    None

    Eric Grossjung
    4002 N. 194
    th
    Street
    Elkhorn, NE 68022

    Vice President

    None

    Michael D. Guman
    3913 Pleasant Avenue
    Allentown, PA 18103

    Vice President

    None

    James E. Gunter

    603 Withers Circle
    Wilmington, DE 19810

    Vice President

    None

    Kevin J. Healy(2)

    Vice President

    None

    Kenneth Henry(2)

    Vice President

    None

    Philipp Hensler(2)

    Chairman, Chief Executive Officer & Director

    None

    Wendy G. Hetson(2)

    Vice President

    None

    Jennifer Hoelscher(1)

    Assistant Vice President

    None

    Eric Holquist(2)

    Vice President

    None

    Edward Hrybenko(2)

    Senior Vice President

    None

    Amy Huber(1)

    Assistant Vice President

    None

    Brian F. Husch
    37 Hollow Road
    Stonybrook, NY 11790

    Vice President

    None

    Keith Hylind(2)

    Vice President

    None

    Vincent Iacono(2)

    Vice President

    None

    Kathleen T. Ives(1)

    Vice President & Assistant Secretary

    Assistant Secretary

    Shonda Rae Jaquez(2)

    Vice President

    None

    Brian Johnson(1)

    Vice President

    None

    Eric K. Johnson

    8588 Colonial Drive
    Lone Tree, CO 80124

    Senior Vice President

    None

    Thomas Keffer(2)

    Senior Vice President

    Vice President and Chief Business Officer

    Scott Kelley(1)

    Vice President

    None

    Brian Kiley(2)

    Vice President

    None

    Richard Klein
    4820 Fremont Avenue South

    Minneapolis, MN 55419

    Senior Vice President

    None

    Brent A. Krantz

    61500 Tam McArthur Loop
    Bend, OR 97702

    Senior Vice President

    None

    Eric Kristenson(2)

    Vice President

    None

    Lamar Kunes(2)

    Vice President

    None

    David T. Kuzia

    10258 S. Dowling Way

    Highlands Ranch, CO 80126

    Vice President

    None

    John Laudadio(2)

    Vice President

    None

    Jesse Levitt(2)

    Vice President

    None

    Julie Libby(2)

    Senior Vice President

    None

    Eric J. Liberman

    27 Tappan Ave., Unit West
    Sleepy Hollow, NY 10591

    Vice President

    None

    Lorna Lindquist(2)

    Vice President

    None

    Malissa Lischin(2)

    Assistant Vice President

    None

    Christina Loftus(2)

    Senior Vice President

    None

    Thomas Loncar

    1401 North Taft Street, Apt. 726
    Arlington, VA 22201

    Vice President

    None

    Peter Maddox(2)

    Vice President

    None

    Michael Malik
    546 Idylberry Road
    San Rafael, CA 94903

    Vice President

    None

    Joseph Marich(2)

    Vice President

    None

    Steven C. Manns

    1627 N. Hermitage Avenue
    Chicago, IL 60622

    Vice President

    None

    Todd A. Marion

    24 Midland Avenue
    Cold Spring Harbor, NY 11724

    Vice President

    None

    LuAnn Mascia(2)

    Vice President

    None

    Anthony Mazzariello(2)

    Vice President

    None

    Derren McDaniel(1)

    Vice President

    None

    Michael McDonald

    11749 S Cormorant Circle

    Parker, CO 80134

    Vice President

    None

    John C. McDonough
    533 Valley Road

    New Canaan, CT 06840

    President and Director

    None

    Brian McGinty(1)

    Vice President

    None

    Kent C. McGowan
    9510 190
    th Place SW

    Edmonds, WA 98020

    Vice President

    None

    Brian F. Medina

    3009 Irving Street

    Denver, CO 80211

    Vice President

    None

    Toller Miller(1)

    Vice President

    None

    Clint Modler(1)

    Vice President

    None

    Joseph Moran(2)

    Senior Vice President

    None

    Robert Moser

    9650 East Aspen Hill Circle

    Lone Tree, CO 80124

    Vice President

    None

    David W. Mountford

    7820 Banyan Terrace
    Tamarac, FL 33321

    Vice President

    None

    James Mugno(2)

    Vice President

    None

    Matthew Mulcahy(2)

    Vice President

    None

    Wendy Jean Murray
    32 Carolin Road
    Upper Montclair, NJ 07043

    Vice President

    None

    Kimberly Mustin(2)

    Senior Vice President

    None

    John S. Napier

    17 Hillcrest Ave.

    Darien, CT 06820

    Senior Vice President

    None

    Christina Nasta(2)

    Senior Vice President

    None

    Kevin P. Neznek(2)

    Senior Vice President

    None

    Christopher Nicholson(2)

    Vice President

    None

    Chad Noel

    Vice President

    None

    Timothy O’Connell(2)

    Vice President

    None

    Janet Oleary(2)

    Vice President

    None

    Alan Panzer6755 Ridge Mill Lane
    Atlanta, GA 30328

    Vice President

    None

    Anthony Parisi

    Vice President

    None

    Maria Paster(2)

    Assistant Vice President

    None

    Ashley Patten(1)

    Vice President

    None

    Brian C. Perkes
    6 Lawton Ct.

    Frisco, TX 75034

    Vice President

    None

    Charles K. Pettit(2)

    Vice President

    None

    David Pfeffer(2)

    Director

    None

    Andrew Phillips(1)

    Assistant Vice President

    None

    Cheryl Pipia(2)

    Senior Vice President

    None

    Aaron Pisani(1)

    Vice President

    None

    Rachel Powers(1)

    Vice President

    None

    Nicole Pretzel(2)

    Vice President

    None

    Minnie Ra
    100 Dolores Street, #203

    Carmel, CA 93923

    Vice President

    None

    Dustin Raring
    27 Blakemore Drive
    Ladera Ranch, CA 92797

    Vice President

    None

    Michael A. Raso

    3 Vine Place

    Larchmont, NY 10538

    Vice President

    None

    Richard E. Rath
    46 Mt. Vernon Ave.
    Alexandria, VA 22301

    Vice President

    None

    William J. Raynor(4)

    Vice President

    None

    Dennis Robinson(1)

    Vice President

    None

    Ian M. Roche
    7070 Bramshill Circle
    Bainbridge, OH 44023

    Vice President

    None

    Michael Rock

    9016 Stourbridge Drive
    Huntersville, NC 28078

    Vice President

    None

    Stacy Roode(1)

    Vice President

    None

    Thomas Sabow
    6617 Southcrest Drive
    Edina, MN 55435

    Vice President

    None

    Mark Santero(2)

    Senior Vice President

    None

    John Saunders
    2251 Chantilly Ave.
    Winter Park, FL 32789

    Vice President

    None

    Thomas Schmitt

    40 Rockcrest Rd

    Manhasset, NY 11030

    Vice President

    None

    William Schories
    3 Hill Street
    Hazlet, NJ 07730

    Vice President

    None

    Jennifer Sexton(2)

    Vice President

    None

    Eric Sharp
    862 McNeill Circle

    Woodland, CA 95695

    Vice President

    None

    Kenneth Shell(1)

    Vice President

    None

    Debbie A. Simon
    55 E. Erie St., #4404

    Chicago, IL 60611

    Vice President

    None

    Bryant Smith

    Vice President

    None

    Christopher M. Spencer
    2353 W 118
    th
    Terrace
    Leawood, KS 66211

    Vice President

    None

    John A. Spensley

    375 Mallard Court
    Carmel, IN 46032

    Vice President

    None

    Michael Staples

    4255 Jefferson St Apt 328

    Kansas City, MO 64111

    Vice President

    None

    Alfred St. John(2)

    Vice President

    None

    Matthew Steckler(2)

    Vice President

    None

    Bryan Stein
    8 Longwood Rd.
    Voorhees, NJ 08043

    Vice President

    None

    Brian C. Summe
    2479 Legends Way

    Crestview Hills, KY 41017

    Vice President

    None

    Michael Sussman(2)

    Vice President

    None

    George T. Sweeney
    5 Smokehouse Lane

    Hummelstown, PA 17036

    Senior Vice President

    None

    Leon Tallon(2)

    Vice President

    None

    Brian Taylor

    Vice President

    None

    James Taylor(2)

    Assistant Vice President

    None

    Paul Temple(2)

    Vice President

    None

    Troy Testa

    Vice President

    None

    David G. Thomas
    16628 Elk Run Court

    Leesburg, VA 20176

    Vice President

    None

    Cenk Toroslu(1)

    Vice President

    None

    Wesley Vance(2)

    Vice President

    None

    Mark S. Vandehey(1)

    Vice President and Chief Compliance Officer

    Vice President and Chief Compliance Officer

    Vincent Vermette(2)

    Vice President

    None

    Teresa Ward(1)

    Vice President

    None

    Janeanne Weickum(1)

    Vice President

    None

    Michael J. Weigner
    4905 W. San Nicholas Street

    Tampa, FL 33629

    Vice President

    None

    Donn Weise
    3249 Earlmar Drive

    Los Angeles, CA 90064

    Vice President

    None

    Chris G. Werner

    98 Crown Point Place

    Castle Rock, CO 80108

    Vice President

    None

    Ryan Wilde(1)

    Vice President

    None

    Julie Wimer(2)

    Assistant Vice President

    None

    Peter Winters
    911 N. Organce Ave, Apt. 514
    Orlando, FL 32801

    Vice President

    None

    Patrick Wisneski(1)

    Vice President

    None

    Meredith Wolff(2)

    Vice President

    None

    Cary Patrick Wozniak
    18808 Bravata Court
    San Diego, CA 92128

    Vice President

    None

    David Zicchinella(2)

    Assistant Vice President

    None

    Steven Zito(1)

    Vice President

    None

    (1)6803 South Tucson Way, Centennial, CO 80112-3924

    (2)Two World Financial Center, 225 Liberty Street, 11th Floor, New York, NY 10281-1008
    (3)
    350 Linden Oaks, Rochester, NY 14623

    (4)Independence Wharf, 470 Atlantic Avenue, 11th Floor, Boston, MA 02210

    (c)     Not applicable.

    Item 33. Location of Accounts and Records

    The accounts, books and other documents required to be maintained by Registrant pursuant to Section 31(a) of the Investment Company Act of 1940 and rules promulgated thereunder are in the possession of OppenheimerFunds, Inc. at its offices at 6803 South Tucson Way, Centennial, Colorado 80112-3924.

    Item 34. Management Services

    Not applicable.
     

    Item 35. Undertakings

    The financial statements of Oppenheimer Global Strategic Income Fund/VA (Cayman) Ltd., the wholly-owned subsidiary of Oppenheimer Global Strategic Income Fund/VA, will be updated each time the financial statements of Oppenheimer Global Strategic Income Fund/VA are updated.

    The books and records of the Fund’s wholly-owned subsidiary will be made available to inspection to the same extent as the Fund’s.


    SIGNATURES

    Pursuant to the requirements of the Securities Act of 1933 and the Investment Company Act of 1940, the Registrant certifies that it meets all the requirements for effectiveness of this Registration Statement pursuant to Rule 485(b) under the Securities Act of 1933 and has duly caused this Registration Statement to be signed on its behalf by the undersigned, thereunto duly authorized, in the City of New York and State of New York on the 27th day of April, 2011. 
     

                                                                                                 Oppenheimer Variable Account Funds

                                                                                                 By:     William F. Glavin, Jr.*               

                                                                                                           William F. Glavin, Jr., President
                                                                                                           Principal Executive Officer and Trustee

    Pursuant to the requirements of the Securities Act of 1933, this Registration Statement has been signed below by the following persons in the capacities on the dates indicated: 

    Signatures

    Title

    Date


    William L. Armstrong*

    Chairman of the Board of Trustees

    April 27, 2011

    William L. Armstrong


    William F. Glavin, Jr.*

    President, Principal

    April 27, 2011

    William F. Glavin, Jr.

    Executive Officer and Trustee


    Brian W. Wixted*

    Treasurer, Principal

    April 27, 2011

    Brian W. Wixted

    Financial and Accounting Officer


    George C. Bowen*

    Trustee

    April 27, 2011

    George C. Bowen


    Edward L. Cameron*

    Trustee

    April 27, 2011

    Edward L. Cameron


    Jon S. Fossel*

    Trustee

    April 27, 2011

    Jon S. Fossel


    Sam Freedman*

    Trustee

    April 27, 2011

    Sam Freedman


    Beverly L. Hamilton*

    Trustee

    April 27, 2011

    Beverly L. Hamilton


    Robert J. Malone*

    Trustee

    April 27, 2011

    Robert J. Malone


    F. William Marshall, Jr.*

    Trustee

    April 27, 2011

    F. William Marshall, Jr.


    *By:     /s/ Mitchell J. Lindauer     
                Mitchell J. Lindauer, Attorney-in-Fact


    OPPENHEIMER VARIABLE ACCOUNT FUNDS

    Post-Effective Amendment No. 60
     
    Registration No. 2-93177
     
    EXHIBIT INDEX


    Exhibit No.     Description

    28(a)               Nineteenth Amended and Restated Declaration of Trust dated 4/29/11

    28(d)(xii)         Investment Advisory Agreement for Oppenheimer Global Strategic Income Fund/VA (Cayman) Ltd. dated 10/28/10

    28(d)(xiii)        Sub-Advisory Agreement for Oppenheimer Global Strategic Income Fund/VA (Cayman) Ltd. dated 10/28/10

    28(j)               Independent Registered Public Accounting Firm’s Consent


    EX-99.A 42 exhibit28a.htm

    NINETEENTH AMENDED AND RESTATED DECLARATION OF TRUST

    OF

    OPPENHEIMER VARIABLE ACCOUNT FUNDS

    This NINETEENTH AMENDED AND RESTATED DECLARATION OF TRUST, is made as of the 29th day of April 2011, by and among the individuals executing this Nineteenth Amended and Restated Declaration of Trust as the Trustees.

    WHEREAS, (i) by Declaration of Trust dated August 28, 1984, the Trustees established a Trust initially named Oppenheimer Variable Life Funds, a trust fund under the laws of the Commonwealth of Massachusetts, for the investment and reinvestment of funds contributed thereto, (ii) by the First Restated Declaration of Trust dated March 11, 1986, the Trustees amended and restated said Declaration of Trust to create two new Series of Shares, (iii) by the Second Restated Declaration of Trust dated August 15, 1986, the Trustees further amended and restated said Declaration of Trust to change the Trust’s name to Oppenheimer Variable Account Funds and to make certain other changes, (iv) by the Third Restated Declaration of Trust dated October 21, 1986, the Trustees amended and restated said Declaration of Trust to create a new Series of Shares, (v) by the Fourth Restated Declaration of Trust dated June 4, 1990, the Trustees amended and restated said Declaration of Trust to create a new Series of Shares, (vi) by the Fifth Restated Declaration of Trust dated February 25, 1993, the Trustees amended and restated said Declaration of Trust to create a new Series of Shares, (vii) by the Sixth Restated Declaration of Trust dated February 28, 1995, the Trustees amended and restated said Declaration of Trust to create a new Series of Shares, (viii) by the Seventh Restated Declaration of Trust dated December 16, 1997, the Trustees amended and restated said Declaration of Trust to create two new Series of Shares, (ix) by the Eighth Restated Declaration of Trust dated May 1, 1998, the Trustees amended and restated said Declaration of Trust to create a new class of Shares for each Series and to change the names of two Series, (x) by the Ninth Restated Declaration of Trust dated May 1, 1999, the Trustees amended and restated such Declaration of Trust to change the names of all ten Series, (xi) by the Tenth Restated Declaration of Trust dated May 1, 2000, the Trustees amended and restated such Declaration of Trust to change the name of the Class previously designated as “Class 2” to “Service Shares”, (xii) by the Eleventh Restated Declaration of Trust dated September 20, 2000, such Declaration of Trust was amended and restated to incorporate changes approved at the Shareholder meeting held September 20, 2000, and (xiii) by the Twelfth Amended and Restated Declaration of Trust dated May 1, 2001, the Trustees changed the name of one Series, (xiv) by the Thirteenth Amended and Restated Declaration of Trust dated August 27, 2002, the Trustees amended and restated such Declaration of Trust to create a new Series and to change the registered agent for service of process and the address of the Trust, (xv) by the Fourteenth Amended and Restated Declaration of Trust dated May 1, 2003, the Trustees amended and restated such Declaration of Trust to create a new class of shares and to change the name of the Series “Oppenheimer Main Street Growth & Income Fund/VA” to “Oppenheimer Main Street Fund/VA, (xvi) by the Fifteenth Amended and Restated Declaration of Trust dated May 1, 2004, the Trustees changed the name of one series “Oppenheimer Multiple Strategies Fund/VA” to “Oppenheimer Balanced Fund/VA” and created a new (fourth) class of shares, (xvii) by the Sixteenth Amended and Restated Declaration of Trust dated April 29, 2005, the Trustees changed the name of one Series “Oppenheimer Bond Fund/VA” to “Oppenheimer Core Bond Fund/VA,” (xviii) by the Seventeenth Amended and Restated Declaration of Trust dated April 30, 2006, the Trustees changed the name of one Series “Oppenheimer Aggressive Growth Fund/VA” to “Oppenheimer MidCap Fund/VA,” and (xix) by the Eighteenth Amended and Restated Declaration of Trust dated April 30, 2010, the Trustees changed the name of two Series “Oppenheimer MidCap Fund/VA” to “Oppenheimer Small- & Mid-Cap Growth Fund/VA” and “Oppenheimer Strategic Bond Fund/VA” to “Oppenheimer Global Strategic Income Fund/VA.”

    WHEREAS, the Trustees desire to further amend such Declaration of Trust, as amended and restated, to change the name of one Series “Oppenheimer Main Street Small Cap Fund/VA” to “Oppenheimer Small- & Mid-Cap Fund/VA.”

    NOW, THEREFORE, the Trustees declare that all money and property held or delivered to the Trust shall be held and managed under this Nineteenth Amended and Restated Declaration of Trust IN TRUST as herein set forth below.

    ARTICLE FIRSTNAME

    This Trust shall be known as OPPENHEIMER VARIABLE ACCOUNT FUNDS. The address of Oppenheimer Variable Account Funds is 6803 South Tucson Way, Centennial, Colorado 80112-3924. The Registered Agent of Service for Process is CT Corporation System, 155 Federal Street, Suite 700, Boston, MA 02110.

    ARTICLE SECONDDEFINITIONS

    Whenever used herein, unless otherwise required by the context or specifically provided:

    1.     All terms used in this Declaration of Trust that are defined in the 1940 Act (defined below) shall have the meanings given to them in the 1940 Act.

    2.     “1940 Act” refers to the Investment Company Act of 1940 and the Rules and Regulations of the Commission thereunder, all as amended from time to time.

    3.     “Board” or “Board of Trustees” or the “Trustees” means the Board of Trustees of the Trust.

    4.     “By-Laws” means the By-Laws of the Trust as amended from time to time.

    5.     “Class” means a class of a series of shares of the Trust established and designated under or in accordance with the provisions of Article FOURTH.

    6.     

    “Commission” means the Securities and Exchange Commission.


    7.     

    “Declaration of Trust” shall mean this Nineteenth Amended and Restated Declaration of Trust as it may be amended or restated from time to time.


    8.     

    “Majority Vote of Shareholders” shall mean, with respect to any matter on which the Shares of the Trust or of a Series or Class thereof, as the case may be, may be voted, the “vote of a majority of the outstanding voting securities” (as defined in the 1940 Act or the rules and regulations of the Commission thereunder) of the Trust or such Series or Class, as the case may be.


    9.     “Net asset value” means, with respect to any Share of any Series, (i) in the case of a Share of a Series whose Shares are not divided into Classes, the quotient obtained by dividing the value of the net assets of that Series (being the value of the assets belonging to that Series less the liabilities belonging to that Series) by the total number of Shares of that Series outstanding, and (ii) in the case of a Share of a Class of Shares of a Series whose Shares are divided into Classes, the quotient obtained by dividing the value of the net assets of that Series allocable to such Class (being the value of the assets belonging to that Series allocable to such Class less the liabilities belonging to such Class) by the total number of Shares of such Class outstanding; all determined in accordance with the methods and procedures, including without limitation those with respect to rounding, established by the Trustees from time to time.

    10.     “Series” refers to series of shares of the Trust established and designated under or in accordance with the provisions of Article FOURTH.

    11.     “Shareholder” means a record owner of Shares of the Trust.

    12.     “Shares” refers to the transferable units of interest into which the beneficial interest in the Trust or any Series or Class of the Trust (as the context may require) shall be divided from time to time and includes fractions of Shares as well as whole Shares.

    13.     “Trust” refers to the Massachusetts business trust created by this Declaration of Trust, as amended or restated from time to time.

    14.     “Trustees” refers to the individual trustees in their capacity as trustees hereunder of the Trust and their successor or successors for the time being in office as such trustees.

    ARTICLE THIRDPURPOSE OF TRUST

    The purpose or purposes for which the Trust is formed and the business or objects to be transacted, carried on and promoted by it are as follows:

    1.     To hold, invest or reinvest its funds, and in connection therewith to hold part or all of its funds in cash, and to purchase or otherwise acquire, hold for investment or otherwise, sell, lend, pledge, mortgage, write options on, lease, sell short, assign, negotiate, transfer, exchange or otherwise dispose of or turn to account or realize upon, securities (which term “securities” shall for the purposes of this Declaration of Trust, without limitation of the generality thereof, be deemed to include any stocks, shares, bonds, financial futures contracts, indexes, debentures, notes, mortgages or other obligations, and any certificates, receipts, warrants or other instruments representing rights to receive, purchase or subscribe for the same, or evidencing or representing any other rights or interests therein, or in any property or assets) created or issued by any issuer (which term “issuer” shall for the purposes of this Declaration of Trust, without limitation of the generality thereof, be deemed to include any persons, firms, associations, corporations, syndicates, business trusts, partnerships, investment companies, combinations, organizations, governments, or subdivisions thereof) and in financial instruments (whether they are considered as securities or commodities); and to exercise, as owner or holder of any securities or financial instruments, all rights, powers and privileges in respect thereof; and to do any and all acts and things for the preservation, protection, improvement and enhancement in value of any or all such securities or financial instruments.

    2.     To borrow money and pledge assets in connection with any of the objects or purposes of the Trust, and to issue notes or other obligations evidencing such borrowings, to the extent permitted by the 1940 Act and by the Trust’s fundamental investment policies under the 1940 Act.

    3.     To issue and sell its Shares in such Series and Classes and amounts and on such terms and conditions, for such purposes and for such amount or kind of consideration (including without limitation thereto, securities) now or hereafter permitted by the laws of the Commonwealth of Massachusetts and by this Declaration of Trust, as the Trustees may determine.

    4.     To purchase or otherwise acquire, hold, dispose of, resell, transfer, reissue, redeem or cancel its Shares, or to classify or reclassify any unissued Shares or any Shares previously issued and reacquired of any Series or Class into one or more Series or Classes that may have been established and designated from time to time, all without the vote or consent of the Shareholders of the Trust, in any manner and to the extent now or hereafter permitted by this Declaration of Trust.

    5.     To conduct its business in all its branches at one or more offices in New York, Colorado and elsewhere in any part of the world, without restriction or limit as to extent.

    6.     To carry out all or any of the foregoing objects and purposes as principal or agent, and alone or with associates or to the extent now or hereafter permitted by the laws of Massachusetts, as a member of, or as the owner or holder of any securities or other instruments of, or share of interest in, any issuer, and in connection therewith or make or enter into such deeds or contracts with any issuers and to do such acts and things and to exercise such powers, as a natural person could lawfully make, enter into, do or exercise.

    7.     To do any and all such further acts and things and to exercise any and all such further powers as may be necessary, incidental, relative, conducive, appropriate or desirable for the accomplishment, carrying out or attainment of all or any of the foregoing purposes or objects.

    The foregoing objects and purposes shall, except as otherwise expressly provided, be in no way limited or restricted by reference to, or inference from, the terms of any other clause of this or any other Article of this Declaration of Trust, and shall each be regarded as independent and construed as powers as well as objects and purposes, and the enumeration of specific purposes, objects and powers shall not be construed to limit or restrict in any manner the meaning of general terms or the general powers of the Trust now or hereafter conferred by the laws of the Commonwealth of Massachusetts nor shall the expression of one thing be deemed to exclude another, though it be of a similar or dissimilar nature, not expressed; provided, however, that the Trust shall not carry on any business, or exercise any powers, in any state, territory, district or country except to the extent that the same may lawfully be carried on or exercised under the laws thereof.

    ARTICLE FOURTHSHARES

    1.     The beneficial interest in the Trust shall be divided into Shares, all with $.001 par value per share, but the Trustees shall have the authority from time to time, without obtaining shareholder approval, to create one or more Series of Shares in addition to the Series specifically established and designated in part 3 of this Article FOURTH, and to divide the shares of any Series into two or more Classes pursuant to part 2 of this Article FOURTH, all as they deem necessary or desirable, to establish and designate such Series and Classes, and to fix and determine the relative rights and preferences as between the different Series of Shares or Classes as to right of redemption and the price, terms and manner of redemption, liabilities and expenses to be borne by any Series or Class, special and relative rights as to dividends and other distributions and on liquidation, sinking or purchase fund provisions, conversion on liquidation, conversion rights, and conditions under which the several Series or Classes shall have individual voting rights or no voting rights. Except as established by the Trustees with respect to such Series or Classes, pursuant to the provisions of this Article FOURTH, and except as otherwise provided herein, all Shares of the different Series and Classes of a Series, if any, shall be identical.

    (a)     The number of authorized Shares and the number of Shares of each Series and each Class of a Series that may be issued is unlimited, and the Trustees may issue Shares of any Series or Class of any Series for such consideration and on such terms as they may determine (or for no consideration if pursuant to a Share dividend or split-up), or may reduce the number of issued Shares of a Series or Class in proportion to the relative net asset value of the Shares of such Series or Class, all without action or approval of the Shareholders. All Shares when so issued on the terms determined by the Trustees shall be fully paid and non-assessable. The Trustees may classify or reclassify any unissued Shares or any Shares previously issued and reacquired of any Series into one or more Series or Classes of Series that may be established and designated from time to time. The Trustees may hold as treasury Shares (of the same or some other Series), reissue for such consideration and on such terms as they may determine, or cancel, at their discretion from time to time, any Shares reacquired by the Trust.

    (b)     The establishment and designation of any Series or any Class of any Series in addition to that established and designated in part 3 of this Article FOURTH shall be effective upon either (i) the execution by a majority of the Trustees of an instrument setting forth such establishment and designation and the relative rights and preferences of such Series or such Class of such Series, whether directly in such instrument or by reference to, or approval of, another document that sets forth such relative rights and preferences of the Series or any Class of any Series including, without limitation, any registration statement of the Trust, (ii) upon the execution of an instrument in writing by an officer of the Trust pursuant to the vote of a majority of the Trustees, or (iii) as otherwise provided in either such instrument. At any time that there are no Shares outstanding of any particular Series or Class previously established and designated, the Trustees may by an instrument executed by a majority of their number or by an officer of the Trust pursuant to a vote of a majority of the Trustees abolish that Series or Class and the establishment and designation thereof. Each instrument referred to in this paragraph shall be an amendment to this Declaration of Trust, and the Trustees may make any such amendment without shareholder approval.

    (c)     Any Trustee, officer or other agent of the Trust, and any organization in which any such person is interested may acquire, own, hold and dispose of Shares of any Series or Class of any Series of the Trust to the same extent as if such person were not a Trustee, officer or other agent of the Trust; and the Trust may issue and sell or cause to be issued and sold and may purchase Shares of any Series or Class of any Series to or from any such person or any such organization subject only to the general limitations, restrictions or other provisions applicable to the sale or purchase of Shares of such Series or Class generally.

    2.     (a)     Classes. The Trustees shall have the exclusive authority from time to time, without obtaining shareholder approval, to divide the Shares of any Series into two or more Classes as they deem necessary or desirable, and to establish and designate such Classes. In such event, each Class of a Series shall represent interests in the designated Series of the Trust and have such voting, dividend, liquidation and other rights as may be established and designated by the Trustees. Expenses and liabilities related directly or indirectly to the Shares of a Class of a Series may be borne solely by such Class (as shall be determined by the Trustees) and, as provided in this Article FOURTH. The bearing of expenses and liabilities solely by a Class of Shares of a Series shall be appropriately reflected (in the manner determined by the Trustees) in the net asset value, dividend and liquidation rights of the Shares of such Class of a Series. The division of the Shares of a Series into Classes and the terms and conditions pursuant to which the Shares of the Classes of a Series will be issued must be made in compliance with the 1940 Act. No division of Shares of a Series into Classes shall result in the creation of a Class of Shares having a preference as to dividends or distributions or a preference in the event of any liquidation, termination or winding up of the Trust, to the extent such a preference is prohibited by Section 18 of the 1940 Act as to the Trust. The fact that a Series shall have initially been established and designated without any specific establishment or designation of Classes (i.e., that all Shares of such Series are initially of a single Class), or that a Series shall have more than one established and designated Class, shall not limit the authority of the Trustees to establish and designate separate Classes, or one or more additional Classes, of said Series without approval of the holders of the initial Class thereof, or previously established and designated Class or Classes thereof.

    (b)     Class Differences. The relative rights and preferences of the Classes of any Series may differ in such other respects as the Trustees may determine to be appropriate in their sole discretion, provided that such differences are set forth in the instrument establishing and designating such Classes and executed by a majority of the Trustees (or by an instrument executed by an officer of the Trust pursuant to a vote of a majority of the Trustees).

    The relative rights and preferences of each Class of Shares shall be the same in all respects except that, and unless and until the Board of Trustees shall determine otherwise: (i) when a vote of Shareholders is required under this Declaration of Trust or when a meeting of Shareholders is called by the Board of Trustees, the Shares of a Class shall vote exclusively on matters that affect that Class only; (ii) the expenses and liabilities related to a Class shall be borne solely by such Class (as determined and allocated to such Class by the Trustees from time to time in a manner consistent with parts 2 and 3 of this Article FOURTH); and (iii) pursuant to part 10 of Article NINTH, the Shares of each Class shall have such other rights and preferences as are set forth from time to time in the then effective prospectus and/or statement of additional information relating to the Shares. Dividends and distributions on each Class of Shares may differ from the dividends and distributions on any other such Class, and the net asset value of each Class of Shares may differ from the net asset value of any other such Class.

    3.     Establishment and Designation of Series: The Trustees have previously established and designated eleven Series of Shares: (i) by the Declaration of Trust dated August 28, 1984, “Oppenheimer Money Fund/VA,” “Oppenheimer Bond Fund/VA” (the said “Oppenheimer Bond Fund/VA” is hereby renamed “Oppenheimer Core Bond Fund/VA” by the Sixteenth Amended and Restated Declaration of Trust) and “Oppenheimer Growth Fund,” (the said “Oppenheimer Growth Fund” having subsequently been renamed “Oppenheimer Capital Appreciation Fund/VA by the Ninth Restated Declaration of Trust dated May 1, 1999); (ii) by the First Restated Declaration of Trust dated March 11, 1986, “Oppenheimer High Income Fund/VA” and “Oppenheimer Capital Appreciation Fund” (the said “Oppenheimer Capital Appreciation Fund” having subsequently been renamed “Oppenheimer Aggressive Growth Fund/VA” by the Eighth Restated Declaration of Trust dated May 1, 1998 and further renamed “Oppenheimer MidCap Fund/VA” by the Seventeenth Amended and Restated Declaration of Trust dated April 30, 2006 and further renamed “Oppenheimer Small- & Mid-Cap Growth Fund/VA” by the Eighteenth Amended and Restated Declaration of Trust dated April 30, 2010); (iii) “Oppenheimer Multiple Strategies Fund/VA,” established by the Third Restated Declaration of Trust dated October 21, 1986 (the said “Oppenheimer Multiple Strategies Fund/VA” having subsequently been renamed “Oppenheimer Balanced Fund/VA” by the Fifteenth Restated Declaration of Trust dated May 1, 2004); (iv) “Oppenheimer Global Securities Fund/VA” established by the Fourth Restated Declaration of Trust dated June 4, 1990; (v) “Oppenheimer Strategic Bond Fund/VA” established by the Fifth Restated Declaration of Trust dated February 25, 1993 (the said “Oppenheimer Strategic Bond Fund/VA” having subsequently been renamed “Oppenheimer Global Strategic Income Fund/VA” by the Eighteenth Amended and Restated Declaration of Trust dated April 30, 2010); (vi) by the Sixth Restated Declaration of Trust dated February 28, 1995, “Oppenheimer Growth & Income Fund” (the said “Oppenheimer Growth & Income Fund” having subsequently been renamed “Oppenheimer Main Street Growth & Income Fund/VA” by the Ninth Restated Declaration of Trust dated May 1, 1999) and further renamed “Oppenheimer Main Street Fund/VA” by the Fourteenth Restated Declaration of Trust dated May 1, 2003); (vii) by the Seventh Restated Declaration of Trust dated December 16, 1997, “Oppenheimer Discovery Fund” (the said “Oppenheimer Discovery Fund” having been subsequently renamed “Oppenheimer Small Cap Growth Fund” by the Eighth Restated Declaration of Trust dated May 1, 1998 and further renamed “Oppenheimer Main Street Small Cap Fund/VA” by the Twelfth Restated Declaration of Trust dated May 1, 2001 and further renamed “Oppenheimer Main Street Small- & Mid-Cap Fund/VA” by this Nineteenth Amended and Restated Declaration of Trust dated April 29, 2011); and (viii) “Oppenheimer Value Fund/VA” established by the Thirteenth Amended and Restated Declaration of Trust dated August 27, 2002. By the Ninth Restated Declaration of Trust dated May 1, 2000, all shares then established and designated were renamed by adding the designation “/VA” to them.

    Establishment and Designation of Classes: The Shares of Oppenheimer Money Fund/VA, Oppenheimer High Income Fund/VA, Oppenheimer Bond Fund/VA, Oppenheimer Global Securities Fund/VA, Oppenheimer Aggressive Growth Fund/VA, Oppenheimer Capital Appreciation Fund/VA, Oppenheimer Multiple Strategies Fund/VA, Oppenheimer Strategic Bond Fund/VA, Oppenheimer Main Street Growth & Income Fund/VA, Oppenheimer Main Street Small Cap Fund/VA and Oppenheimer Value Fund/VA have previously been divided into three Classes as follows: (i) one class of the Shares of each Series authorized since the establishment and designation of that Series has no class designation other than the name of the Series set forth above; (ii) one class of the Shares of each Series as established and designated upon the division of the Shares of each Series into two Classes by the Eighth Restated Declaration of Trust dated May 1, 1998 ( “Class 2 shares”) and renamed “Service Shares” by the Tenth Restated Declaration of Trust dated May 1, 2000 and Service Shares subsequently established and designated by later amendments to this Declaration of Trust; and (iii) one class of the Shares of each Series, as established and designated by the Fourteenth Amended and Restated Declaration of Trust dated May 1, 2003, known as the Class 3 Shares.

         The Trustees of the Trust established and designated a new fourth class of Shares of each Series, by the Fifteenth Amended and Restated Declaration of Trust dated May 1, 2004, known as the Class 4 Shares.

    Termination of Series and Classes: The Trustees terminated the Series of Shares, “Oppenheimer Real Asset Fund,” that was established by the SEVENTH Restated Declaration of Trust dated December 16, 1997, for which no shares were ever issued.

    Further Actions: Actions previously taken by the Trustees to establish and designate Series and Classes of Shares and the rights and preferences thereof shall not limit the authority of the Trustees set forth in parts 1 and 2 of this ARTICLE FOURTH to establish and designate any further Series or Classes of Shares.

    Rights and Preferences: In addition to the rights and preferences described in parts 1 and 2 of this ARTICLE FOURTH with respect to Series and Classes, the Series and Classes established hereby shall have the relative rights and preferences described in this part 3 of this ARTICLE FOURTH. The Shares of any further Series or Classes that may from time to time be established and designated by the Trustees shall (unless the Trustees otherwise determine with respect to some further Series or Classes at the time of establishing and designating the same) have the following relative rights and preferences:

    (a)     Assets Belonging to Series or Class. All consideration received by the Trust for the issue or sale of Shares of a particular Series or any Class thereof, together with all assets in which such consideration is invested or reinvested, all income, earnings, profits, and proceeds thereof, including any proceeds derived from the sale, exchange or liquidation of such assets, and any funds or payments derived from any reinvestment of such proceeds in whatever form the same may be, shall irrevocably belong to that Series (and may be allocated to any Classes thereof) for all purposes, subject only to the rights of creditors, and shall be so recorded upon the books of account of the Trust. Such consideration, assets, income, earnings, profits, and proceeds thereof, including any proceeds derived from the sale, exchange or liquidation of such assets, and any funds or payments derived from any reinvestment of such proceeds, in whatever form the same may be, together with any General Items allocated to that Series as provided in the following sentence, are herein referred to as “assets belonging to” that Series. In the event that there are any assets, income, earnings, profits, and proceeds thereof, funds, or payments which are not readily identifiable as belonging to any particular Series (collectively “General Items”), the Trustees shall allocate such General Items to and among any one or more of the Series established and designated from time to time in such manner and on such basis as they, in their sole discretion, deem fair and equitable; and any General Items so allocated to a particular Series shall belong to that Series (and be allocable to any Classes thereof). Each such allocation by the Trustees shall be conclusive and binding upon the Shareholders of all Series (and any Classes thereof) for all purposes. No Shareholder or former Shareholder of any Series or Class shall have a claim on or any right to any assets allocated or belonging to any other Series or Class.

    (b)     (1)     Liabilities Belonging to Series. The liabilities, expenses, costs, charges and reserves attributable to each Series shall be charged and allocated to the assets belonging to each particular Series. Any general liabilities, expenses, costs, charges and reserves of the Trust which are not identifiable as belonging to any particular Series shall be allocated and charged by the Trustees to and among any one or more of the Series established and designated from time to time in such manner and on such basis as the Trustees in their sole discretion deem fair and equitable. The liabilities, expenses, costs, charges and reserves allocated and so charged to each Series are herein referred to as “liabilities belonging to” that Series. Each allocation of liabilities, expenses, costs, charges and reserves by the Trustees shall be conclusive and binding upon the shareholders of all Series for all purposes.

    (2)     Liabilities Belonging to a Class. If a Series is divided into more than one Class, the liabilities, expenses, costs, charges and reserves attributable to a Class shall be charged and allocated to the Class to which such liabilities, expenses, costs, charges or reserves are attributable. Any general liabilities, expenses, costs, charges or reserves belonging to the Series which are not identifiable as belonging to any particular Class shall be allocated and charged by the Trustees to and among any one or more of the Classes established and designated from time to time in such manner and on such basis as the Trustees in their sole discretion deem fair and equitable. The liabilities, expenses, costs, charges and reserves allocated and so charged to each Class are herein referred to as “liabilities belonging to” that Class. Each allocation of liabilities, expenses, costs, charges and reserves by the Trustees shall be conclusive and binding upon the holders of all Classes for all purposes.

    (c)     Dividends. Dividends and distributions on Shares of a particular Series or Class may be paid to the holders of Shares of that Series or Class, with such frequency as the Trustees may determine, which may be daily or otherwise pursuant to a standing resolution or resolutions adopted only once or with such frequency as the Trustees may determine, from such of the income, capital gains accrued or realized, and capital and surplus, from the assets belonging to that Series, or in the case of a Class, belonging to such Series and being allocable to such Class, as the Trustees may determine, after providing for actual and accrued liabilities belonging to such Series or Class. All dividends and distributions on Shares of a particular Series or Class shall be distributed pro rata to the Shareholders of such Series or Class in proportion to the number of Shares of such Series or Class held by such Shareholders at the date and time of record established for the payment of such dividends or distributions, except that in connection with any dividend or distribution program or procedure the Trustees may determine that no dividend or distribution shall be payable on Shares as to which the Shareholder’s purchase order and/or payment have not been received by the time or times established by the Trustees under such program or procedure. Such dividends and distributions may be made in cash or Shares of that Series or Class or a combination thereof as determined by the Trustees or pursuant to any program that the Trustees may have in effect at the time for the election by each Shareholder of the mode of the making of such dividend or distribution to that Shareholder. Any such dividend or distribution paid in Shares will be paid at the net asset value thereof as determined in accordance with part 13 of Article SEVENTH. Notwithstanding anything in this Declaration of Trust to the contrary, the Trustees may at any time declare and distribute a dividend of stock or other property pro rata among the Shareholders of a particular Series or Class at the date and time of record established for the payment of such dividends or distributions.

    (d)     Liquidation. In the event of the liquidation or dissolution of the Trust or any Series or Class thereof, the Shareholders of each Series and all Classes of each Series that have been established and designated and are being liquidated and dissolved shall be entitled to receive, as a Series or Class, when and as declared by the Trustees, the excess of the assets belonging to that Series or, in the case of a Class, belonging to that Series and allocable to that Class, over the liabilities belonging to that Series or Class. Upon the liquidation or dissolution of the Trust or any Series or Class pursuant to this part 3(d) of this Article FOURTH the Trustees shall make provisions for the payment of all outstanding obligations, taxes and other liabilities, accrued or contingent, of the Trust or that Series or Class. The assets so distributable to the Shareholders of any particular Class and Series shall be distributed among such Shareholders in proportion to the relative net asset value of such Shares. The liquidation of the Trust or any particular Series or Class thereof may be authorized at any time by vote of a majority of the Trustees or instrument executed by a majority of their number then in office, provided the Trustees find that it is in the best interest of the Shareholders of such Series or Class or as otherwise provided in this Declaration of Trust or the instrument establishing such Series or Class. The Trustees shall provide written notice to affected shareholders of a termination effected under this part 3(d) of this Article FOURTH.

    (e)     Transfer. All Shares of each particular Series or Class shall be transferable, but transfers of Shares of a particular Class and Series will be recorded on the Share transfer records of the Trust applicable to such Series or Class of that Series, as kept by the Trust or by any transfer or similar agent, as the case may be, only at such times as Shareholders shall have the right to require the Trust to redeem Shares of such Series or Class of that Series and at such other times as may be permitted by the Trustees.

    (f)     Equality. Except as provided herein or in the instrument designating and establishing any Series or Class, all Shares of a particular Series or Class shall represent an equal proportionate interest in the assets belonging to that Series, or in the case of a Class, belonging to that Series and allocable to that Class, (subject to the liabilities belonging to that Series or that Class), and each Share of any particular Series or Class shall be equal to each other Share of that Series or Class; but the provisions of this sentence shall not restrict any distinctions permissible under this Article FOURTH that may exist with respect to Shares of the different Classes of a Series. The Trustees may from time to time divide or combine the Shares of any particular Class or Series into a greater or lesser number of Shares of that Class or Series provided that such division or combination does not change the proportionate beneficial interest in the assets belonging to that Series or allocable to that Class or in any way affect the rights of Shares of any other Class or Series.

    (g)     Fractions. Any fractional Share of any Class or Series, if any such fractional Share is outstanding, shall carry proportionately all the rights and obligations of a whole Share of that Class and Series, including those rights and obligations with respect to voting, receipt of dividends and distributions, redemption of Shares, and liquidation of the Trust.

    (h)     Conversion Rights. Subject to compliance with the requirements of the 1940 Act, the Trustees shall have the authority to provide that (i) holders of Shares of any Series shall have the right to exchange said Shares into Shares of one or more other Series of Shares, (ii) holders of shares of any Class shall have the right to exchange said Shares into Shares of one or more other Classes of the same or a different Series, and/or (iii) the Trust shall have the right to carry out exchanges of the aforesaid kind, in each case in accordance with such requirements and procedures as may be established by the Trustees.

    (i)     Ownership of Shares. The ownership of Shares shall be recorded on the books of the Trust or of a transfer or similar agent for the Trust, which books shall be maintained separately for the Shares of each Class and Series that has been established and designated. No certification certifying the ownership of Shares need be issued except as the Trustees may otherwise determine from time to time. The Trustees may make such rules as they consider appropriate for the issuance of Share certificates, the use of facsimile signatures, the transfer of Shares and similar matters. The record books of the Trust as kept by the Trust or any transfer or similar agent, as the case may be, shall be conclusive as to who are the Shareholders and as to the number of Shares of each Class and Series held from time to time by each such Shareholder.

    (j)     Investments in the Trust. The Trustees may accept investments in the Trust from such persons and on such terms and for such consideration, not inconsistent with the provisions of the 1940 Act, as they from time to time authorize or determine. Such investments may be in the form of cash, securities or other property in which the appropriate Series is authorized to invest, hold or own, valued as provided in part 13, Article SEVENTH. The Trustees may authorize any distributor, principal underwriter, custodian, transfer agent or other person to accept orders for the purchase or sale of Shares that conform to such authorized terms and to reject any purchase or sale orders for Shares whether or not conforming to such authorized terms.

    ARTICLE FIFTHSHAREHOLDERS’ VOTING POWERS AND MEETINGS

    The following provisions are hereby adopted with respect to voting Shares of the Trust and certain other rights:

    1.     The Shareholders shall have the power to vote only (a) for the election of Trustees when that issue is submitted to Shareholders, or removal of Trustees to the extent and as provided in Article SIXTH, (b) with respect to the amendment of this Declaration of Trust to the extent and as provided in part 12, Article NINTH, (c) with respect to transactions with respect to the Trust, a Series or Class as provided in part 4(a), Article NINTH, (d) to the same extent as the shareholders of a Massachusetts business corporation, as to whether or not a court action, proceeding or claim should be brought or maintained derivatively or as a class action on behalf of the Trust, any Series, Class or the Shareholders, (e) with respect to those matters relating to the Trust as may be required by the 1940 Act or required by law, by this Declaration of Trust, or the By-Laws of the Trust or any registration statement of the Trust filed with the Commission or any State, or as the Trustees may consider desirable, and (f) with respect to any other matter which the Trustees, in their sole discretion, shall submit to the Shareholders.

    2.     The Trust will not hold shareholder meetings unless required by the 1940 Act, the provisions of this Declaration of Trust, or any other applicable law. The Trustees may call a meeting of shareholders from time to time.

    3.     As to each matter submitted to a vote of Shareholders, each Shareholder shall be entitled to one vote for each whole Share and to a proportionate fractional vote for each fractional Share standing in such Shareholder’s name on the books of the Trust irrespective of the Series thereof or the Class thereof and all Shares of all Series and Classes shall vote together as a single Class; provided, however, that (i) as to any matter with respect to which a separate vote of one or more Series or Classes thereof is required by the 1940 Act or the provisions of the writing establishing and designating the Series or Class, such requirements as to a separate vote by such Series or Class thereof shall apply in lieu of all Shares of all Series and Classes thereof voting together as a single Class; and (ii) as to any matter which affects only the interests of one or more particular Series or Classes thereof, only the holders of Shares of the one or more affected Series or Classes thereof shall be entitled to vote, and each such Series or Class shall vote as a separate Class. All Shares of a Series shall have identical voting rights, and all Shares of a Class of a Series shall have identical voting rights. Shares may be voted in person or by proxy. Proxies may be given by or on behalf of a Shareholder orally or in writing or pursuant to any computerized, telephonic, or mechanical data gathering process.

    4.     Except as required by the 1940 Act or other applicable law, the presence in person or by proxy of one-third of the Shares entitled to vote shall be a quorum for the transaction of business at a Shareholders’ meeting, provided, however, that if any action to be taken by the Shareholders of a Series or Class requires an affirmative vote of a majority, or more than a majority, of the Shares outstanding and entitled to vote, then with respect to voting on that particular issue the presence in person or by proxy of the holders of a majority of the Shares outstanding and entitled to vote at such a meeting shall constitute a quorum for the transaction of business with respect to such issue. Any number less than a quorum shall be sufficient for adjournments. If at any meeting of the Shareholders there shall be less than a quorum present with respect to a particular issue to be voted on, such meeting may be adjourned, without further notice, with respect to such issue from time to time until a quorum shall be present with respect to such issue, but voting may take place with respect to issues for which a quorum is present. Any meeting of Shareholders, whether or not a quorum is present, may be adjourned with respect to any one or more items of business for any lawful purpose, provided that no meeting shall be adjourned for more than six months beyond the originally scheduled date. Any adjourned session or sessions may be held, within a reasonable time after the date for the original meeting without the necessity of further notice. A majority of the Shares voted at a meeting at which a quorum is present shall decide any questions and a plurality shall elect a Trustee, except when a different vote is required by any provision of the 1940 Act or other applicable law or by this Declaration of Trust or By-Laws.

    5.     Each Shareholder, upon request to the Trust in proper form determined by the Trust, shall be entitled to require the Trust to redeem from the net assets of that Series all or part of the Shares of such Series and Class standing in the name of such Shareholder. The method of computing such net asset value, the time at which such net asset value shall be computed and the time within which the Trust shall make payment therefor, shall be determined as hereinafter provided in Article SEVENTH of this Declaration of Trust. Notwithstanding the foregoing, the Trustees, when permitted or required to do so by the 1940 Act, may suspend the right of the Shareholders to require the Trust to redeem Shares.

    6.     No Shareholder shall, as such holder, have any right to purchase or subscribe for any Shares of the Trust which it may issue or sell, other than such right, if any, as the Trustees, in their discretion, may determine.

    7.     All persons who shall acquire Shares shall acquire the same subject to the provisions of the Declaration of Trust.

    8.     Cumulative voting for the election of Trustees shall not be allowed.

    ARTICLE SIXTHTHE TRUSTEES

    1.     The persons who shall act as Trustees until their successors are duly chosen and qualify are the trustees executing this Declaration of Trust or any counterpart thereof. However, the By-Laws of the Trust may fix the number of Trustees at a number greater or lesser than the number of initial Trustees and may authorize the Trustees to increase or decrease the number of Trustees, to fill any vacancies on the Board which may occur for any reason including any vacancies created by any such increase in the number of Trustees, to set and alter the terms of office of the Trustees and to lengthen or lessen their own terms of office or make their terms of office of indefinite duration, all subject to the 1940 Act, as amended from time to time, and to this Article SIXTH. Unless otherwise provided by the By-Laws of the Trust, the Trustees need not be Shareholders.

    2.     A Trustee at any time may be removed either with or without cause by resolution duly adopted by the affirmative vote of the holders of two-thirds of the outstanding Shares, present in person or by proxy at any meeting of Shareholders called for such purpose; such a meeting shall be called by the Trustees when requested in writing to do so by the record holders of not less than ten per centum of the outstanding Shares. A Trustee may also be removed by the Board of Trustees, as provided in the By-Laws of the Trust.

    3.     The Trustees shall make available a list of names and addresses of all Shareholders as recorded on the books of the Trust, upon receipt of the request in writing signed by not less than ten Shareholders (who have been shareholders for at least six months) holding in the aggregate shares of the Trust valued at not less than $25,000 at current offering price (as defined in the then effective Prospectus and/or Statement of Additional Information relating to the Shares under the Securities Act of 1933, as amended from time to time) or holding not less than 1% in amount of the entire amount of Shares issued and outstanding; such request must state that such Shareholders wish to communicate with other Shareholders with a view to obtaining signatures to a request for a meeting to take action pursuant to part 2 of this Article SIXTH and be accompanied by a form of communication to the Shareholders. The Trustees may, in their discretion, satisfy their obligation under this part 3 by either making available the Shareholder list to such Shareholders at the principal offices of the Trust, or at the offices of the Trust’s transfer agent, during regular business hours, or by mailing a copy of such communication and form of request, at the expense of such requesting Shareholders, to all other Shareholders, and the Trustees may also take such other action as may be permitted under Section 16(c) of the 1940 Act.

    ARTICLE SEVENTHPOWERS OF TRUSTEES

    The following provisions are hereby adopted for the purpose of defining, limiting and regulating the powers of the Trust, the Trustees and the Shareholders.

    1.     As soon as any Trustee is duly elected by the Shareholders or the Trustees and shall have accepted this Trust, the Trust estate shall vest in the new Trustee or Trustees, together with the continuing Trustees, without any further act or conveyance, and he or she shall be deemed a Trustee hereunder.

    2.     The death, declination, resignation, retirement, removal, or incapacity of the Trustees, or any one of them, shall not operate to annul or terminate the Trust or any Series but the Trust shall continue in full force and effect pursuant to the terms of this Declaration of Trust.

    3.     The assets of the Trust shall be held separate and apart from any assets now or hereafter held in any capacity other than as Trustee hereunder by the Trustees or any successor Trustees. All of the assets of the Trust shall at all times be considered as vested in the Trustees. No Shareholder shall have, as a holder of beneficial interest in the Trust, any authority, power or right whatsoever to transact business for or on behalf of the Trust, or on behalf of the Trustees, in connection with the property or assets of the Trust, or in any part thereof.

    4.     The Trustees in all instances shall act as principals, and are and shall be free from the control of the Shareholders. The Trustees shall have full power and authority to do any and all acts and to make and execute, and to authorize the officers and agents of the Trust to make and execute, any and all contracts and instruments that they may consider necessary or appropriate in connection with the management of the Trust. Except as otherwise provided herein or in the 1940 Act, the Trustees shall not in any way be bound or limited by present or future laws or customs in regard to Trust investments, but shall have full authority and power to make any and all investments which they, in their uncontrolled discretion and to the same extent as if the Trustees were the sole owners of the assets of the Trust and the business in their own right, shall deem proper to accomplish the purpose of this Trust. Subject to any applicable limitation in this Declaration of Trust or by the By-Laws of the Trust, and in addition to the powers otherwise granted herein, the Trustees shall have power and authority:

    (a)     to adopt By-Laws not inconsistent with this Declaration of Trust providing for the conduct of the business of the Trust, including meetings of the Shareholders and Trustees, and other related matters, and to amend and repeal them to the extent that they do not reserve that right to the Shareholders;

    (b)     to elect and remove such officers and appoint and terminate such officers as they consider appropriate with or without cause, and to appoint and terminate agents and consultants and hire and terminate employees, any one or more of the foregoing of whom may be a Trustee, and may provide for the compensation of all of the foregoing; to appoint and designate from among the Trustees or other qualified persons such committees as the Trustees may determine and to terminate any such committee and remove any member of such committee;

    (c)     to employ as custodian of any assets of the Trust one or more banks, trust companies, companies that are members of a national securities exchange, or any other entity qualified and eligible to act as a custodian under the 1940 Act, as modified by or interpreted by any applicable order or orders of the Commission or any rules or regulations adopted or interpretive releases of the Commission thereunder, subject to any conditions set forth in this Declaration of Trust or in the By-Laws, and may authorize such depository or custodian to employ subcustodians or agents;

    (d)     to retain one or more transfer agents and shareholder servicing agents, or both, and may authorize such transfer agents or servicing agents to employ sub-agents;

    (e)     to provide for the distribution of Shares either through a principal underwriter or the Trust itself or both or otherwise;

    (f)     to set record dates by resolution of the Trustees or in the manner provided for in the By-Laws of the Trust;

    (g)     to delegate such authority as they consider desirable to any officers of the Trust and to any investment adviser, manager, custodian or underwriter, or other agent or independent contractor;

    (h)     to vote or give assent, or exercise any rights of ownership, with respect to stock or other securities or property held in Trust hereunder; and to execute and deliver powers of attorney to or otherwise authorize by standing policies adopted by the Trustees, such person or persons as the Trustees shall deem proper, granting to such person or persons such power and discretion with relation to securities or property as the Trustees shall deem proper;

    (i)     to exercise powers and rights of subscription or otherwise which in any manner arise out of ownership of securities held in trust hereunder;

    (j)     to hold any security or property in a form not indicating any trust, whether in bearer, unregistered or other negotiable form, either in its own name or in the name of a custodian, subcustodian or a nominee or nominees or otherwise;

    (k)     to consent to or participate in any plan for the reorganization, consolidation or merger of any corporation or concern, any security of which is held in the Trust; to consent to any contract, lease, mortgage, purchase, or sale of property by such corporation or concern, and to pay calls or subscriptions with respect to any security or instrument held in the Trust;

    (l)     to join with other holders of any security or instrument in acting through a committee, depositary, voting trustee or otherwise, and in that connection to deposit any security or instrument with, or transfer any security to, any such committee, depositary or trustee, and to delegate to them such power and authority with relation to any security (whether or not so deposited or transferred) as the Trustees shall deem proper, and to agree to pay, and to pay, such portion of the expenses and compensation of such committee, depositary or trustee as the Trustees shall deem proper;

    (m)     to sue or be sued in the name of the Trust;

    (n)     to compromise, arbitrate, or otherwise adjust claims in favor of or against the Trust or any matter in controversy including, but not limited to, claims for taxes;

    (o)     to make, by resolutions adopted by the Trustees or in the manner provided in the By-Laws, distributions of income and of capital gains to Shareholders;

    (p)     to borrow money and to pledge, mortgage or hypothecate the assets of the Trust or any part thereof, to the extent and in the manner permitted by the 1940 Act;

    (q)     to enter into investment advisory or management contracts, subject to the 1940 Act, with any one or more corporations, partnerships, trusts, associations or other persons;

    (r)     to make loans of cash and/or securities or other assets of the Trust;

    (s)     to change the name of the Trust or any Class or Series of the Trust as they consider appropriate without prior shareholder approval;

    (t)     to establish officers’ and Trustees’ fees or compensation and fees or compensation for committees of the Trustees to be paid by the Trust or each Series thereof in such manner and amount as the Trustees may determine;

    (u)     to invest all or any portion of the Trust’s assets in any one or more registered investment companies, including investment by means of transfer of such assets in exchange for an interest or interests in such investment company or investment companies or by any other means approved by the Trustees;

    (v)     to determine whether a minimum and/or maximum value should apply to accounts holding shares, to fix such values and establish the procedures to cause the involuntary redemption of accounts that do not satisfy such criteria; and

    (w)     to enter into joint ventures, general or limited partnerships and any other combinations or associations;

    (x)     to endorse or guarantee the payment of any notes or other obligations of any person; to make contracts of guaranty or suretyship, or otherwise assume liability for payment thereof;

    (y)     to purchase and pay for entirely out of Trust property such insurance and/or bonding as they may deem necessary or appropriate for the conduct of the business, including, without limitation, insurance policies insuring the assets of the Trust and payment of distributions and principal on its portfolio investments, and insurance policies insuring the Shareholders, Trustees, officers, employees, agents, consultants, investment advisers, managers, administrators, distributors, principal underwriters, or independent contractors, or any thereof (or any person connected therewith), of the Trust individually against all claims and liabilities of every nature arising by reason of holding, being or having held any such office or position, or by reason of any action alleged to have been taken or omitted by any such person in any such capacity, including any action taken or omitted that may be determined to constitute negligence, whether or not the Trust would have the power to indemnify such person against such liability;

    (z)     to pay pensions for faithful service, as deemed appropriate by the Trustees, and to adopt, establish and carry out pension, profit-sharing, share bonus, share purchase, savings, thrift and other retirement, incentive and benefit plans, trusts and provisions, including the purchasing of life insurance and annuity contracts as a means of providing such retirement and other benefits, for any or all of the Trustees, officers, employees and agents of the Trust;

    (aa)     to adopt on behalf of the Trust or any Series with respect to any Class thereof a plan of distribution and related agreements thereto pursuant to the terms of Rule 12b-1 of the 1940 Act and to make payments from the assets of the Trust or the relevant Series or Class pursuant to said Rule 12b-1 Plan;

    (bb)     to operate as and carry on the business of an investment company and to exercise all the powers necessary and appropriate to the conduct of such operations;

    (cc)     to issue, sell, repurchase, redeem, retire, cancel, acquire, hold, resell, reissue, dispose of, and otherwise deal in Shares and, subject to the provisions set forth in Article FOURTH and part 4, Article FIFTH, to apply to any such repurchase, redemption, retirement, cancellation or acquisition of Shares any funds or property of the Trust, or the particular Series of the Trust, with respect to which such Shares are issued;

         (dd)     in general to carry on any other business in connection with or incidental to any of the foregoing powers, to do everything necessary, suitable or proper for the accomplishment of any purpose or the attainment of any object or the furtherance of any power herein before set forth, either alone or in association with others, and to do every other act or thing incidental or appurtenant to or growing out of or connected with the aforesaid business or purposes, objects or powers.

    The foregoing clauses shall be construed both as objects and powers, and the foregoing enumeration of specific powers shall not be held to limit or restrict in any manner the general powers of the Trustees. Any action by one or more of the Trustees in their capacity as such hereunder shall be deemed an action on behalf of the Trust or the applicable Series and not an action in an individual capacity.

    5.     No one dealing with the Trustees shall be under any obligation to make any inquiry concerning the authority of the Trustees, or to see to the application of any payments made or property transferred to the Trustees or upon their order.

    6.     (a)     The Trustees shall have no power to bind any Shareholder personally or to call upon any Shareholder for the payment of any sum of money or assessment whatsoever other than such as the Shareholder may at any time personally agree to pay by way of subscription to any Shares or otherwise. This paragraph shall not limit the right of the Trustees to assert claims against any shareholder based upon the acts or omissions of such shareholder or for any other reason.

    (b)     Whenever this Declaration of Trust calls for or permits any action to be taken by the Trustees hereunder, such action shall mean that taken by the Board of Trustees by vote of the majority of a quorum of Trustees as set forth from time to time in the By-Laws of the Trust or as required by the 1940 Act.

    (c)     The Trustees shall possess and exercise any and all such additional powers as are reasonably implied from the powers herein contained such as may be necessary or convenient in the conduct of any business or enterprise of the Trust, to do and perform anything necessary, suitable, or proper for the accomplishment of any of the purposes, or the attainment of any one or more of the objects, herein enumerated, or which shall at any time appear conducive to or expedient for the protection or benefit of the Trust, and to do and perform all other acts and things necessary or incidental to the purposes herein before set forth, or that may be deemed necessary by the Trustees. Without limiting the generality of the foregoing, except as otherwise provided herein or in the 1940 Act, the Trustees shall not in any way be bound or limited by present or future laws or customs in regard to trust investments, but shall have full authority and power to make any and all investments that they, in their discretion, shall deem proper to accomplish the purpose of this Trust.

    (d)     The Trustees shall have the power, to the extent not inconsistent with the 1940 Act, to determine conclusively whether any moneys, securities, or other properties of the Trust are, for the purposes of this Trust, to be considered as capital or income and in what manner any expenses or disbursements are to be borne as between capital and income whether or not in the absence of this provision such moneys, securities, or other properties would be regarded as capital or income and whether or not in the absence of this provision such expenses or disbursements would ordinarily be charged to capital or to income.

    7.     The By-Laws of the Trust may divide the Trustees into classes and prescribe the tenure of office of the several classes, but no class of Trustee shall be elected for a period shorter than that from the time of the election following the division into classes until the next meeting of Trustees and thereafter for a period shorter than the interval between meetings of Trustees or for a period longer than five years, and the term of office of at least one class shall expire each year.

    8.     The Shareholders shall, for any lawful purpose, have the right to inspect the records, documents, accounts and books of the Trust, subject to reasonable regulations of the Trustees, not contrary to Massachusetts law, as to whether and to what extent, and at what times and places, and under what conditions and regulations, such right shall be exercised.

    9.     Any officer elected or appointed by the Trustees or by the Shareholders or otherwise, may be removed at any time, with or without cause.

    10.     The Trustees shall have power to hold their meetings, to have an office or offices and, subject to the provisions of the laws of Massachusetts, to keep the books of the Trust outside of said Commonwealth at such places as may from time to time be designated by them. Action may be taken by the Trustees without a meeting by unanimous written consent or by telephone or similar method of communication.

    11.     Securities held by the Trust shall be voted in person or by proxy by the President or a Vice-President, or such officer or officers of the Trust or such other agent of the Trust as the Trustees shall designate or otherwise authorize by standing policies adopted by the Trustees for the purpose, or by a proxy or proxies thereunto duly authorized by the Trustees.

    12.     (a)     Subject to the provisions of the 1940 Act, any Trustee, officer or employee, individually, or any partnership or association of which any Trustee, officer or employee may be a member, or any corporation or association of which any Trustee, officer or employee may be an officer, partner, director, trustee, employee or stockholder, or otherwise may have an interest, may be a party to, or may be pecuniarily or otherwise interested in, any contract or transaction of the Trust, and in the absence of fraud no contract or other transaction shall be thereby affected or invalidated; provided that in such case a Trustee, officer or employee or a partnership, corporation or association of which a Trustee, officer or employee is a member, officer, director, trustee, employee or stockholder is so interested, such fact shall be disclosed or shall have been known to the Trustees including those Trustees who are not so interested and who are neither “interested” nor “affiliated” persons as those terms are defined in the 1940 Act, or a majority thereof; and any Trustee who is so interested, or who is also a director, officer, partner, trustee, employee or stockholder of such other corporation or a member of such partnership or association which is so interested, may be counted in determining the existence of a quorum at any meeting of the Trustees which shall authorize any such contract or transaction, and may vote thereat to authorize any such contract or transaction, with like force and effect as if he were not so interested.

    (b)     Specifically, but without limitation of the foregoing, the Trust may enter into a management or investment advisory contract or underwriting contract and other contracts with, and may otherwise do business with any manager or investment adviser for the Trust and/or principal underwriter of the Shares of the Trust or any subsidiary or affiliate of any such manager or investment adviser and/or principal underwriter and may permit any such firm or corporation to enter into any contracts or other arrangements with any other firm or corporation relating to the Trust notwithstanding that the Trustees of the Trust may be composed in part of partners, directors, officers or employees of any such firm or corporation, and officers of the Trust may have been or may be or become partners, directors, officers or employees of any such firm or corporation, and in the absence of fraud the Trust and any such firm or corporation may deal freely with each other, and no such contract or transaction between the Trust and any such firm or corporation shall be invalidated or in any way affected thereby, nor shall any Trustee or officer of the Trust be liable to the Trust or to any Shareholder or creditor thereof or to any other person for any loss incurred by it or him solely because of the existence of any such contract or transaction; provided that nothing herein shall protect any director or officer of the Trust against any liability to the Trust or to its security holders to which he would otherwise be subject by reason of willful misfeasance, bad faith, gross negligence or reckless disregard of the duties involved in the conduct of his office.

    (c)     As used in this paragraph the following terms shall have the meanings set forth below:

    (i)     the term “indemnitee” shall mean any present or former Trustee, officer or employee of the Trust, any present or former Trustee, partner, Director or officer of another trust, partnership, corporation or association whose securities are or were owned by the Trust or of which the Trust is or was a creditor and who served or serves in such capacity at the request of the Trust, and the heirs, executors, administrators, successors and assigns of any of the foregoing; however, whenever conduct by an indemnitee is referred to, the conduct shall be that of the original indemnitee rather than that of the heir, executor, administrator, successor or assignee;

    (ii)     the term “covered proceeding” shall mean any threatened, pending or completed action, suit or proceeding, whether civil, criminal, administrative or investigative, to which an indemnitee is or was a party or is threatened to be made a party by reason of the fact or facts under which he or it is an indemnitee as defined above;

    (iii)     the term “disabling conduct” shall mean willful misfeasance, bad faith, gross negligence or reckless disregard of the duties involved in the conduct of the office in question;

    (iv)     the term “covered expenses” shall mean expenses (including attorney’s fees), judgments, fines and amounts paid in settlement actually and reasonably incurred by an indemnitee in connection with a covered proceeding; and

    (v)     the term “adjudication of liability” shall mean, as to any covered proceeding and as to any indemnitee, an adverse determination as to the indemnitee whether by judgment, order, settlement, conviction or upon a plea of nolo contendere or its equivalent.

    (d)     The Trust shall not indemnify any indemnitee for any covered expenses in any covered proceeding if there has been an adjudication of liability against such indemnitee expressly based on a finding of disabling conduct.

    (e)     Except as set forth in paragraph (d) above, the Trust shall indemnify any indemnitee for covered expenses in any covered proceeding, whether or not there is an adjudication of liability as to such indemnitee, such indemnification by the Trust to be to the fullest extent now or hereafter permitted by any applicable law unless the By-laws limit or restrict the indemnification to which any indemnitee may be entitled. The Board of Trustees may adopt by-law provisions to implement subparagraphs (c), (d) and (e) hereof.

    (f)     Nothing herein shall be deemed to affect the right of the Trust and/or any indemnitee to acquire and pay for any insurance covering any or all indemnities to the extent permitted by applicable law or to affect any other indemnification rights to which any indemnitee may be entitled to the extent permitted by applicable law. Such rights to indemnification shall not, except as otherwise provided by law, be deemed exclusive of any other rights to which such indemnitee may be entitled under any statute, By-Law, contract or otherwise.

    13.     The Trustees are empowered, in their absolute discretion, to establish the bases or times, or both, for determining the net asset value per Share of any Class and Series in accordance with the 1940 Act and to authorize the voluntary purchase by any Class and Series, either directly or through an agent, of Shares of any Class and Series upon such terms and conditions and for such consideration as the Trustees shall deem advisable in accordance with the 1940 Act.

    14.     Payment of the net asset value per Share of any Class and Series properly surrendered to it for redemption shall be made by the Trust within seven days, or as specified in any applicable law or regulation, after tender of such stock or request for redemption to the Trust for such purpose together with any additional documentation that may be reasonably required by the Trust or its transfer agent to evidence the authority of the tenderor to make such request, plus any period of time during which the right of the holders of the shares of such Class of that Series to require the Trust to redeem such shares has been suspended. Any such payment may be made in portfolio securities of such Class of that Series and/or in cash, as the Trustees shall deem advisable, and no Shareholder shall have a right, other than as determined by the Trustees, to have Shares redeemed in kind.

    15.     The Trust shall have the right, at any time, without prior notice to the Shareholder to redeem Shares of the Class and Series held by a Shareholder held in any account registered in the name of such Shareholder for its current net asset value, for any reason, including, but not limited to, (i) the determination that such redemption is necessary to reimburse either that Series or Class of the Trust or the distributor (i.e., principal underwriter) of the Shares for any loss either has sustained by reason of the failure of such Shareholder to make timely and good payment for Shares purchased or subscribed for by such Shareholder, regardless of whether such Shareholder was a Shareholder at the time of such purchase or subscription, (ii) the failure of a Shareholder to supply a tax identification number if required to do so, (iii) the failure of a Shareholder to pay when due for the purchase of Shares issued to him and subject to and upon such terms and conditions as the Trustees may from time to time prescribe, (iv) pursuant to authorization by a Shareholder to pay fees or make other payments to one or more third parties, including, without limitation, any affiliate of the investment adviser of the Trust or any Series thereof, or (v) if the aggregate net asset value of all Shares of such Shareholder (taken at cost or value, as determined by the Board) has been reduced below an amount established by the Board of Trustees from time to time as the minimum amount required to be maintained by Shareholders.

    ARTICLE EIGHTHLICENSE

    The name “Oppenheimer” included in the name of the Trust and of any Series shall be used pursuant to a royalty-free, non-exclusive license from OppenheimerFunds, Inc. (“OFI”), incidental to and as part of any one or more advisory, management or supervisory contracts which may be entered into by the Trust with OFI. Such license shall allow OFI to inspect and subject to the control of the Board of Trustees to control the nature and quality of services offered by the Trust under such name. The license may be terminated by OFI upon termination of such advisory, management or supervisory contracts or without cause upon 60 days’ written notice, in which case neither the Trust nor any Series or Class shall have any further right to use the name “Oppenheimer” in its name or otherwise and the Trust, the Shareholders and its officers and Trustees shall promptly take whatever action may be necessary to change its name and the names of any Series or Classes accordingly.

    ARTICLE NINTH - MISCELLANEOUS:

    1.     In case any Shareholder or former Shareholder shall be held to be personally liable solely by reason of his being or having been a Shareholder and not because of his acts or omissions or for some other reason, the Shareholder or former Shareholder (or the Shareholders’ heirs, executors, administrators or other legal representatives or in the case of a corporation or other entity, its corporate or other general successor) shall be entitled out of the Trust estate to be held harmless from and indemnified against all loss and expense arising from such liability. The Trust shall, upon request by the Shareholder, assume the defense of any such claim made against any Shareholder for any act or obligation of the Trust and satisfy any judgment thereon.

    2.     It is hereby expressly declared that a trust is created hereby and not a partnership, joint stock association, corporation, bailment, or any other form of a legal relationship other than a trust, as contemplated in Massachusetts General Laws Chapter 182. No individual Trustee hereunder shall have any power to bind the Trust unless so authorized by the Trustees, or to personally bind the Trust’s officers or any Shareholder. All persons extending credit to, doing business with, contracting with or having or asserting any claim against the Trust or the Trustees shall look only to the assets of the appropriate Series for payment under any such credit, transaction, contract or claim; and neither the Shareholders nor the Trustees, nor any of their agents, whether past, present or future, shall be personally liable therefor; notice of such disclaimer and agreement thereto shall be given in each agreement, obligation or instrument entered into or executed by Trust or the Trustees. There is hereby expressly disclaimed Shareholder and Trustee liability for the acts and obligations of the Trust. Nothing in this Declaration of Trust shall protect a Trustee or officer against any liability to which such Trustee or officer would otherwise be subject by reason of willful misfeasance, bad faith, gross negligence or reckless disregard of the duties involved in the conduct of the office of Trustee or of such officer hereunder.

    3.     The exercise by the Trustees of their powers and discretion hereunder in good faith and with reasonable care under the circumstances then prevailing, shall be binding upon everyone interested. Subject to the provisions of part 2 of this Article NINTH, the Trustees shall not be liable for errors of judgment or mistakes of fact or law. Subject to the foregoing, (a) Trustees shall not be responsible or liable in any event for any neglect or wrongdoing of any officer, agent, employee, consultant, adviser, administrator, distributor or principal underwriter, custodian or transfer, dividend disbursing, Shareholder servicing or accounting agent of the Trust, nor shall any Trustee be responsible for the act or omission of any other Trustee; (b) the Trustees may take advice of counsel or other experts with respect to the meaning and operations of this Declaration of Trust, applicable laws, contracts, obligations, transactions or any other business the Trust may enter into, and subject to the provisions of part 2 of this Article NINTH, shall be under no liability for any act or omission in accordance with such advice or for failing to follow such advice; and (c) in discharging their duties, the Trustees, when acting in good faith, shall be entitled to rely upon the books of account of the Trust and upon written reports made to the Trustees by any officer appointed by them, any independent public accountant, and (with respect to the subject matter of the contract involved) any officer, partner or responsible employee of a party who has been appointed by the Trustees or with whom the Trust has entered into a contract pursuant to Article SEVENTH. The Trustees shall not be required to give any bond as such, nor any surety if a bond is required.

    4.     This Trust shall continue without limitation of time but subject to the provisions of sub-sections (a) and (b) of this part 4.

    (a)     

    Subject to applicable Federal and State law, and except as otherwise provided in part 5 of this Article NINTH, the Trustees, with the Majority Vote of Shareholders of an affected Series or Class, may sell and convey all or substantially all the assets of that Series or Class (which sale may be subject to the retention of assets for the payment of liabilities and expenses and may be in the form of a statutory merger to the extent permitted by applicable law) to another issuer or to another Series or Class of the Trust for a consideration which may be or include securities of such issuer or may merge or consolidate with any other corporation, association, trust, or other organization or may sell, lease, or exchange all or a portion of the Trust property or Trust property allocated or belonging to such Series or Class, upon such terms and conditions and for such consideration when and as authorized by such vote. Such transactions may be effected through share-for-share exchanges, transfers or sale of assets, shareholder in-kind redemptions and purchases, exchange offers, or any other method approved by the Trustees. Upon making provision for the payment of liabilities, by assumption by such issuer or otherwise, the Trustees shall distribute the remaining proceeds among the holders of the outstanding Shares of the Series or Class, the assets of which have been so transferred, in proportion to the relative net asset value of such Shares.


    (b)     Upon completion of the distribution of the remaining proceeds or the remaining assets as provided in sub-section (a) hereof or pursuant to part 3(d) of Article FOURTH, as applicable, the Series the assets of which have been so transferred shall terminate, and if all the assets of the Trust have been so transferred, the Trust shall terminate and the Trustees shall be discharged of any and all further liabilities and duties hereunder and the right, title and interest of all parties shall be canceled and discharged.

    5.     Subject to applicable Federal and state law, the Trustees may without the vote or consent of Shareholders cause to be organized or assist in organizing one or more corporations, trusts, partnerships, limited liability companies, associations, or other organization, under the laws of any jurisdiction, to take over all or a portion of the Trust property or all or a portion of the Trust property allocated or belonging to such Series or Class or to carry on any business in which the Trust shall directly or indirectly have any interest, and to sell, convey and transfer the Trust property or the Trust property allocated or belonging to such Series or Class to any such corporation, trust, limited liability company, partnership, association, or organization in exchange for the shares or securities thereof or otherwise, and to lend money to, subscribe for the shares or securities of, and enter into any contracts with any such corporation, trust, partnership, limited liability company, association, or organization or any corporation, partnership, limited liability company, trust, association, or organization in which the Trust or such Series or Class holds or is about to acquire shares or any other interest. Subject to applicable Federal and state law, the Trustees may also cause a merger or consolidation between the Trust or any successor thereto or any Series or Class thereof and any such corporation, trust, partnership, limited liability company, association, or other organization. Nothing contained herein shall be construed as requiring approval of shareholders for the Trustees to organize or assist in organizing one or more corporations, trusts, partnerships, limited liability companies, associations, or other organizations and selling, conveying, or transferring the Trust property or a portion of the Trust property to such organization or entities; provided, however, that the Trustees shall provide written notice to the affected Shareholders of any transaction whereby, pursuant to this part 5, Article NINTH, the Trust or any Series or Class thereof sells, conveys, or transfers all or a substantial portion of its assets to another entity or merges or consolidates with another entity. Such transactions may be effected through share-for-share exchanges, transfer or sale of assets, shareholder in-kind redemptions and purchases, exchange offers, or any other approved by the Trustees.

    6.     The original or a copy of this instrument and of each restated declaration of trust or instrument supplemental hereto shall be kept at the office of the Trust where it may be inspected by any Shareholder. A copy of this instrument and of each supplemental or restated declaration of trust shall be filed with the Secretary of the Commonwealth of Massachusetts, as well as any other governmental office where such filing may from time to time be required. Anyone dealing with the Trust may rely on a certificate by an officer of the Trust as to whether or not any such supplemental or restated declarations of trust have been made and as to any matters in connection with the Trust hereunder, and, with the same effect as if it were the original, may rely on a copy certified by an officer of the Trust to be a copy of this instrument or of any such supplemental or restated declaration of trust. In this instrument or in any such supplemental or restated declaration of trust, references to this instrument, and all expressions like “herein”, “hereof” and “hereunder” shall be deemed to refer to this instrument as amended or affected by any such supplemental or restated declaration of trust. This instrument may be executed in any number of counterparts, each of which shall be deemed an original.

    7.     The Trust set forth in this instrument is created under and is to be governed by and construed and administered according to the laws of the Commonwealth of Massachusetts. The Trust shall be of the type commonly called a Massachusetts business trust, and without limiting the provisions hereof, the Trust may exercise all powers which are ordinarily exercised by such a trust.

    8.     In the event that any person advances the organizational expenses of the Trust, such advances shall become an obligation of the Trust subject to such terms and conditions as may be fixed by, and on a date fixed by, or determined with criteria fixed by the Board of Trustees, to be amortized over a period or periods to be fixed by the Board.

    9.     Whenever any action is taken under this Declaration of Trust including action which is required or permitted by the 1940 Act or any other applicable law, such action shall be deemed to have been properly taken if such action is in accordance with the construction of the 1940 Act or such other applicable law then in effect as expressed in “no action” letters of the staff of the Commission or any release, rule, regulation or order under the 1940 Act or any decision of a court of competent jurisdiction, notwithstanding that any of the foregoing shall later be found to be invalid or otherwise reversed or modified by any of the foregoing.

    10.     Any action which may be taken by the Board of Trustees under this Declaration of Trust or its By-Laws may be taken by the description thereof in the then effective prospectus and/or statement of additional information relating to the Shares under the Securities Act of 1933 or in any proxy statement of the Trust rather than by formal resolution of the Board.

    11.     Whenever under this Declaration of Trust, the Board of Trustees is permitted or required to place a value on assets of the Trust, such action may be delegated by the Board, and/or determined in accordance with a formula determined by the Board, to the extent permitted by the 1940 Act.

    12.     The Trustee may, without the vote or consent of the Shareholders, amend or otherwise supplement this Declaration of Trust by executing or authorizing an officer of the Trust to execute on their behalf a Restated Declaration of Trust or a Declaration of Trust supplemental hereto, which thereafter shall form a part hereof, provided, however, that none of the following amendments shall be effective unless also approved by a Majority Vote of Shareholders: (i) any amendment to parts 1, 3 and 4, Article FIFTH; (ii) any amendment to this part 12, Article NINTH; (iii) any amendment to part 1, Article NINTH; and (iv) any amendment to part 4(a), Article NINTH that would change the voting rights of Shareholders contained therein. Any amendment required to be submitted to the Shareholders that, as the Trustees determine, shall affect the Shareholders of any Series or Class shall, with respect to the Series or Class so affected, be authorized by vote of the Shareholders of that Series or Class and no vote of Shareholders of a Series or Class not affected by the amendment with respect to that Series or Class shall be required. Notwithstanding anything else herein, any amendment to Article NINTH, part 1 shall not limit the rights to indemnification or insurance provided therein with respect to action or omission or indemnities or Shareholder indemnities prior to such amendment.

         13.     The captions used herein are intended for convenience of reference only, and shall not modify or affect in any manner the meaning or interpretation of any of the provisions of this Agreement. As used herein, the singular shall include the plural, the masculine gender shall include the feminine and neuter, and the neuter gender shall include the masculine and feminine, unless the context otherwise requires.

    IN WITNESS WHEREOF, the undersigned have executed this instrument as of this 26th day of April 2011.

    /s/ William L. Armstrong

    /s/ Sam Freedman

    William L. Armstrong

    Sam Freedman

    23 Sedgwick Drive

    355 Adams Street

    Cherry Hills Village, Colorado 80226

    Denver, Colorado 80206


    /s/ Richard F. Grabish

    /s/ Beverly L. Hamilton

    Richard F. Grabish

    Beverly L. Hamilton

    4079 Little Valley Drive

    69 Byron Dr.

    Estes Park, Colorado 80517

    Avon, Connecticut 06001


    /s/ George C. Bowen

    /s/ Robert J. Malone

    George C. Bowen

    Robert J. Malone

    10573 Lieter Place

    1991 East Alameda Avenue, #6

    Lone Tree, Colorado 80124

    Denver, Colorado 80209


    /s/ Edward Cameron

    /s/ F. William Marshall Jr.

    Edward Cameron

    F. William Marshall Jr.

    8171 Bay Colony Drive #203

    330 South Road

    Naples, Florida 34108

    Chebeague Island, Maine 04017


    /s/ Jon S. Fossel

    /s/ William F. Glavin, Jr.

    Jon S. Fossel

    William F. Glavin, Jr.

    1120 Jack Creek Road

    400 Chambers Street, Apt. 19D

    Ennis, Montana 59729

    New York, New York 10282

    IN WITNESS WHEREOF, the undersigned, acting as Attorney-in-Fact, has executed this instrument on behalf of the Trustees as of this 26th day of April 2011.


                                                                                                    /s/ Kathleen T. Ives

    Kathleen T. Ives

    Attorney-in-Fact

    EX-99.D 43 exhibit28dxii.htm

    INVESTMENT ADVISORY AGREEMENT

    AGREEMENT made the 28th day of October, 2010, by and between OPPENHEIMER GLOBAL STRATEGIC INCOME FUND/VA (CAYMAN) LTD. (hereinafter referred to as the "Fund"), and OPPENHEIMERFUNDS, INC. (hereinafter referred to as "OFI" or the “Investment Adviser”).

    WHEREAS, the Fund is an exempt company organised under the laws of the Cayman Islands, and OFI is an investment adviser registered as such with the Securities and Exchange Commission under the Investment Advisers Act of 1940;

    WHEREAS, the Fund desires that OFI shall act as its investment adviser pursuant to this Agreement;

    NOW, THEREFORE, in consideration of the mutual promises and covenants hereinafter set forth, it is agreed by and between the parties, as follows:

    1.     General Provision.
     

    The Fund hereby appoints OFI and OFI hereby undertakes to act as the investment adviser of the Fund and to perform for the Fund such other duties and functions as are hereinafter set forth. OFI shall, in all matters, give to the Fund and the Fund’s board of directors (“Board of Directors”) the benefit of its best judgment, effort, advice and recommendations and shall, at all times conform to, and use its best efforts to enable the Fund to conform to (i) the provisions of Cayman Island law and the Investment Company Act of 1940 (“Investment Company Act”) and any rules or regulations thereunder; (ii) the provisions of the Memorandum of Association and Articles of Association of the Fund as amended from time to time; (iii) policies and determinations of the Board of Directors of the Fund; (iv) the fundamental policies and investment restrictions of the Fund as communicated to OFI in writing by the Fund in effect from time to time. The appropriate officers and employees of OFI shall be available upon reasonable notice for consultation with any of the Directors and officers of the Fund with respect to any matters dealing with the business and affairs of the Fund including the valuation of portfolio securities of the Fund which are either not registered for public sale or not traded on any securities market. OFI shall provide these services pursuant to the policies and procedures applicable to the investment management of the U. S. registered investment company that is the sole shareholder of the Fund (the “Controlling Fund”) to the extent such policies and procedures are in the judgment of OFI relevant to the Fund and are permitted by Cayman Island law.

    2.     

    Authority of OFI.


    In connection with its obligations hereunder, OFI will have the authority for and in the name of the Fund, subject to the overall direction and control of the Fund's board of directors, to:

    (a)     invest and reinvest the Fund's assets, on margin or otherwise, in securities and other financial instruments of United States and foreign entities, including, without limitation, capital stock; shares of beneficial interest; partnership interests and similar financial instruments; bonds, notes and debentures (whether subordinated, convertible or otherwise); currencies; commodities; interest rate, currency, commodity, equity and other derivative products, including, without limitation, (i) futures contracts (and options thereon) relating to stock indices, currencies, United States Government securities and securities of foreign governments, other financial instruments and all other commodities, (ii) swaps, options, warrants, caps, collars, floors and forward rate agreements, (iii) spot and forward currency transactions and (iv) agreements relating to or securing such transactions; equipment lease certificates; equipment trust certificates; loans; accounts and notes receivable and payable held by trade or other creditors; trade acceptances; contract and other claims; executory contracts; participations; mutual funds, exchange traded funds and similar financial instruments; money market funds; obligations of the United States or any state thereof, foreign governments and instrumentalities of any of them; commercial paper; certificates of deposit; bankers' acceptances; choses in action; trust receipts; and any other obligations and instruments or evidences of indebtedness of whatever kind or nature; in each case, of any person, corporation, government or other entity whatsoever, whether or not publicly traded or readily marketable (all such items being called herein a "Security" or "Securities"), and to sell Securities short and cover such sales. OFI shall delegate all investment discretion with respect to futures contracts, option on futures contracts, or other instruments regulated by the Commodity Futures Trading Commission to Oppenheimer Real Asset Management, Inc., except in situations in which OFI would be permitted to act as a commodities trading advisor to a U.S. registered investment company under applicable law or regulation;

    (b)     provide research and analysis and direct the formulation of investment policies and strategies for the Fund;

    (c)     acquire a long position or a short position with respect to any Security and to make purchases or sales increasing, decreasing or liquidating such position or changing from a long position to a short position or from a short position to a long position, without any limitation as to the frequency of the fluctuation in such positions or as to the frequency of the changes in the nature of such positions;

    (d)     purchase Securities and hold them for investment;

    (e)     enter into contracts for or in connection with investments in Securities;

    (f)     invest in other pooled investment vehicles for any purpose, which investments shall be subject in each case to the terms and conditions of the respective governing document for such vehicle;

    (g)     possess, transfer, mortgage, pledge or otherwise deal in, and exercise all rights, powers, privileges and other incidents of ownership or possession with respect to, Securities and other property and funds held or owned by the Fund;

    (h)     lend, either with or without security, any Securities, funds or other properties of the Fund, including by entering into reverse repurchase agreements, and, from time to time, without limit as to the amount, borrow or raise funds, including by entering into repurchase agreements, and secure the payment of obligations of the Fund by mortgage upon, or pledge or hypothecation of, all or any part of the property of the Fund;

    (i)     open, maintain and close accounts, including futures, margin and custodial accounts, with brokers, including brokers affiliated with OFI, which power shall include the authority to issue all instructions and authorisations to brokers regarding the Securities and/or money therein; to pay, or authorise the payment and reimbursement of, commissions that may be in excess of the lowest rates available that are paid to brokers who execute transactions for the account of the Fund and who supply, or pay for (or rebate a portion of the Fund's brokerage commissions to the Fund for payment of) the cost of, brokerage, research or execution services utilised by the Fund, OFI and its affiliates, members, partners, officers and employees (collectively, excluding OFI, "Affiliates"); provided that the Fund does not pay a rate of commissions in excess of what is competitively available from comparable brokerage firms for comparable services, taking into account various factors, including commission rates, reliability, financial responsibility, strength of the broker and ability of the broker to efficiently execute transactions, the broker's facilities, and the broker's provision or payment of the costs of research and other services or property that are of benefit to the Fund, OFI and Affiliates;

    (j)     open, maintain and close accounts, including custodial accounts, with banks, including banks located outside the United States, and draw checks or other orders for the payment of monies as authorised by the Board of Directors of the Fund;

    (k)     combine purchase or sale orders on behalf of the Fund with orders for other accounts to whom OFI or any of its affiliates provide investment services ("Other Accounts") and allocate the Securities or other assets so purchased or sold, on an average-price basis or by any other method of fair allocation, among such accounts;

    (l)     enter into arrangements with brokers to open "average price" accounts wherein orders placed during a trading day are placed on behalf of the Fund and Other Accounts and are allocated among such accounts using an average price;

    (m)      organise one or more corporations or other entities formed to hold record title, as nominee for the Fund (whether alone or together with the Other Accounts), to Securities or funds of the Fund as authorised by the Board of Directors;

    (n)     cause the Fund to engage in agency, agency cross and principal transactions with affiliates to the extent permitted by applicable securities laws;

    (o)     supply the administrator of, or other service providers to, the Fund with such information and instructions as may be necessary to enable such person or persons to perform their duties in accordance with the applicable agreements;

    (p)     engage personnel, whether part-time or full-time, and subadvisors, attorneys, independent accountants, or such other persons as OFI may deem necessary or advisable;

    (q)     authorise any employee or other agent of OFI or any employee or other agent of the Fund to act for and on behalf of the Fund in all matters incidental to the foregoing; and

    (r)     do any and all acts on behalf of the Fund as it may deem necessary or advisable in connection with the maintenance and administration of the Fund, and exercise all rights of the Fund, with respect to its interest in any person, including, without limitation, the voting of Securities (including voting of proxies), participation in arrangements with creditors, the institution and settlement or compromise of suits and administrative proceedings and other like or similar matters.

    3.     

    Liability.


    The Investment Adviser will be liable to the Fund and, without duplication, to the Controlling Fund, as a third party beneficiary hereof, for the losses to the Fund or the Controlling Fund which are the direct result of the Investment Adviser's bad faith, gross negligence, wilful default or breach of the express terms of this Agreement. Except as set forth in the foregoing sentence, neither the Investment Adviser nor its officers, employees or agents shall be liable hereunder for any act or omission or for any error of judgment in managing the Fund. The Investment Adviser shall not be responsible for any special, indirect or consequential damages, or any loss incurred by reasons of any act or omission of the Fund or any broker, dealer or custodian used hereunder or any authorised representative of the foregoing. Notwithstanding the foregoing, nothing herein shall in any way constitute a waiver or limitation of any rights which the Fund may have under the federal securities or other applicable law.

    4.     Other Duties of OFI.
     

    OFI shall, at its own expense, provide and supervise the activities of all administrative and clerical personnel as shall be required to provide effective corporate administration for the Fund, including but not limited to:

    a)     

    Maintenance of a database of all transactions, open position, portfolio and account/fund information.


    b)     

    Preparation and maintenance of portfolio valuation reports and records based upon the daily activity reflecting cost and market valuations, realized gains and losses, and unrealized gains and losses on open position in accordance with the Memorandum of Association and Articles of Association of the Fund.


    c)     

    Co-ordination of the receipt of account statements from all custodians such as brokers and other clearing organizations and reconcile portfolio positions and cash balances in all such accounts.


    d)     

    Preparation and calculation of a daily net asset value of the fund in accordance with the Memorandum and Articles of Association of the Fund.


    e)     

    Liaising with auditors, as appointed by the Fund from time to time, and the preparation of the Fund’s annual financial statements.


    OFI shall, at its own expense, provide such officers for the Fund as the Board of Directors may request.

    5.     Allocation of Expenses.
     

    All other costs and expenses of the Fund not expressly assumed by OFI under this Agreement shall be paid by the Fund, including, but not limited to: (i) interest and taxes; (ii) brokerage commissions; (iii) insurance premiums for fidelity and other coverage requisite to its operations; (iv) compensation and expenses of its directors other than those affiliated with OFI; (v) legal and audit expenses; (vi) custodian and transfer agent fees and expenses; (vii) expenses incident to the redemption of its shares; (viii) expenses incident to the issuance of its shares against payment therefor by or on behalf of the subscribers thereto; (ix) fees and expenses, other than as hereinabove provided, incident to its status as a Cayman Island exempt company; (x) expenses of printing and mailing reports, notices and proxy materials to shareholders of the Fund; (xi) except as noted above, all other expenses incidental to holding meetings of the Fund's shareholders; and (xii) such extraordinary non-recurring expenses as may arise, including litigation, affecting the Fund and any legal obligation which the Fund may have to indemnify its officers and trustees with respect thereto. Any officers or employees of OFI or any entity controlling, controlled by or under common control with OFI who also serve as officers, directors or employees of the Fund shall not receive any compensation from the Fund for their services.

    6.     Compensation of OFI.
     

    The Fund agrees to pay OFI and OFI agrees to accept as full compensation for the performance of all functions and duties on its part to be performed pursuant to the provisions hereof, a fee computed on the aggregate net asset value of the shares of the Fund as of the close of each business day and payable monthly at the following annual rate:

    0.75% of the first $200 million of net assets;

    0.72% of the next $200 million;

    0.69% of the next $200 million;

    0.66% of the next $200 million;

    0.60% of the next $200 million; and

    0.50% of net assets in excess of $1 billion

    7.     Portfolio Transactions and Brokerage.
     

    (a) OFI is authorised, in arranging the purchase and sale of the Fund's portfolio investments, to employ or deal with such members of securities or commodities exchanges, brokers, dealers or futures commission merchants (hereinafter "broker-dealers"), including "affiliated" broker-dealers (as that term is defined in the Investment Company Act), as may, in its best judgment, implement the policy of the Fund to obtain the "best execution" (prompt and reliable execution at the most favorable security price obtainable) of the Fund's portfolio transactions as well as to obtain, consistent with the provisions of subparagraph (c) of this paragraph 7, the benefit of such investment information or research as will be of significant assistance to the performance by OFI of its investment management functions.

    (b) OFI shall select broker-dealers to effect the Fund's portfolio transactions on the basis of its estimate of their ability to obtain best execution of particular and related portfolio transactions. The abilities of a broker-dealer to obtain best execution of particular portfolio transaction(s) will be judged by OFI on the basis of all relevant factors and considerations including, insofar as feasible, the execution capabilities required by the transaction or transactions; the ability and willingness of the broker-dealer to facilitate the Fund's portfolio transactions by participating therein for its own account; the importance to the Fund of speed, efficiency or confidentiality; the broker-dealer's apparent familiarity with sources from or to whom particular securities might be purchased or sold; as well as any other matters relevant to the selection of a broker-dealer for particular and related transactions of the Fund.

    (c) OFI shall have discretion, in the interests of the Fund, to allocate brokerage on the Fund's portfolio transactions to broker-dealers, other than an affiliated broker-dealer, qualified to obtain best execution of such transactions who provide brokerage and/or research services (as such services are defined in Section 28(e)(3) of the U. S. Securities Exchange Act of 1934) for the Fund and/or other accounts for which OFI exercises "investment discretion" (as that term is defined in Section 3(a)(35) of the U. S. Securities Exchange Act of 1934) and to cause the Fund to pay such broker-dealers a commission for effecting a portfolio transaction for the Fund that is in excess of the amount of commission another broker-dealer adequately qualified to effect such transaction would have charged for effecting that transaction, if OFI determines, in good faith, that such commission is reasonable in relation to the value of the brokerage and/or research services provided by such broker-dealer, viewed in terms of either that particular transaction or the overall responsibilities of OFI with respect to the accounts as to which it exercises investment discretion. In reaching such determination, OFI will not be required to place or attempt to place a specific dollar value on the brokerage and/or research services provided or being provided by such broker-dealer. In demonstrating that such determinations were made in good faith, OFI shall be prepared to show that all commissions were allocated for purposes contemplated by this Agreement and that the total commissions paid by the Fund over a representative period selected by the Fund's trustees were reasonable in relation to the benefits to the Fund.

    (d) OFI shall have no duty or obligation to seek advance competitive bidding for the most favorable commission rate applicable to any particular portfolio transactions or to select any broker-dealer on the basis of its purported or "posted" commission rate but will, to the best of its ability, endeavor to be aware of the current level of the charges of eligible broker-dealers and to minimise the expense incurred by the Fund for effecting its portfolio transactions to the extent consistent with the interests and policies of the Fund as established by the determinations of the Board of Directors of the Fund and the provisions of this paragraph 7.

    (e)     The Fund recognises that an affiliated broker-dealer: (i) may act as one of the Fund's regular brokers for the Fund so long as it is lawful for it so to act; (ii) may be a major recipient of brokerage commissions paid by the Fund; and (iii) may effect portfolio transactions for the Fund only if the commissions, fees or other remuneration received or to be received by it are determined in accordance with procedures contemplated by any rule, regulation or order adopted under the Investment Company Act for determining the permissible level of such commissions.

    8.     

    Duration.


         This Agreement will take effect on the date first set forth above. Unless earlier terminated pursuant to paragraph 9 hereof, this Agreement shall remain in effect from year to year, so long as OFI remains the investment adviser for the Fund and for the Controlling Fund.

    9.     Termination.
     

    This Agreement shall terminate automatically and immediately in the event that the Investment Advisory Agreement between OFI and the Controlling Fund is terminated. This Agreement may also be terminated (i) by OFI at any time without penalty upon sixty days' written notice to the Fund (which notice may be waived by the Fund); or (ii) by the Fund or the Controlling Fund at any time without penalty upon sixty days' written notice to OFI (which notice may be waived by OFI) provided that such termination by the Fund or the Controlling Fund, as the case may be, shall be directed or approved by the vote of a majority of all of the directors of the Fund or the Controlling Fund, as the case may be, then in office or by the vote of the holders of a "majority" of the outstanding voting securities (as defined in the Investment Company Act) of the Fund or the Controlling Fund, as the case may be.

    10.     Notice.

    Any notice under this Agreement shall be in writing, addressed and delivered or mailed, postage prepaid, to the other party, with a copy to the Fund, at the addresses below or such other address as such other party may designate for the receipt of such notice.
     

              If to OFI:

         OppenheimerFunds, Inc.
         2 World Financial Center, 11th Floor
         New York, New York 10281
         Attention: Arthur S. Gabinet, General Counsel

    If to the Fund:

         Oppenheimer Global Strategic Income Fund/VA (Cayman) Ltd.

         c/o M&C Corporate Services Limited
         Ugland House, South Church Street
         P.O. Box 309GT
         George Town, Grand Cayman
         Cayman Islands
         British West Indies

    If to any party, copy to:

         Oppenheimer Global Strategic Income Fund/VA
         6803 South Tucson Way
         Englewood, Colorado 80112
         Attention: Arthur S. Gabinet, General Counsel

    11.     Assignment or Amendment.
     

    This Agreement may not be amended or the rights of OFI hereunder sold, transferred, pledged or otherwise in any manner encumbered without the affirmative vote or written consent of the holders of the "majority" of the outstanding voting securities of the Fund. This Agreement shall automatically and immediately terminate in the event of its "assignment," as defined in the Investment Company Act.

    12.     

    Governing Law


         This Agreement shall be governed by, and construed in accordance, with the laws of the Colorado.

    13.     Definitions.
     

    The terms and provisions of the Agreement shall be interpreted and defined in a manner consistent with the provisions and definitions contained in the Investment Company Act.

    OPPENHEIMER GLOBAL STRATEGIC INCOME FUND/VA (CAYMAN) LTD.

    By: /s/ Brian W. Wixted

        Brian W. Wixted, Director


    OPPENHEIMERFUNDS, INC.

    By: /s/ Andy Mika     

          Name: Andy Mika
          Title: Senior Vice President

    EX-99.D 44 exhibit28dxiii.htm

    SUB-ADVISORY AGREEMENT

    THIS AGREEMENT dated as of October 28, 2010, by and between OppenheimerFunds, Inc. ("OFI"), a United States registered investment advisor, and Oppenheimer Real Asset Management, Inc. ("ORAMI"), a United States registered investment advisor and a registered commodity trading advisor (the "Sub-Advisor") with respect to Oppenheimer Global Strategic Income Fund/VA (Cayman) Ltd. ("the Fund"), an exempt company organized under the laws of the Cayman Islands.

    WHEREAS, the Directors of the Fund have appointed OFI as the investment advisor for the Fund, pursuant to the terms of an Investment Advisory Agreement dated October 28, 2010 (the "Advisory Agreement");

    WHEREAS, OFI desire to appoint the Sub-Advisor as sub-advisor for the Fund and the Sub-Advisor is willing to act in such capacity upon the terms herein set forth;

    NOW, THEREFORE, in consideration of the premises and of the mutual covenants herein contained, the parties hereto, intending to be legally bound, hereby agree as follows:

    1.     

    General Provision.


    OFI hereby appoints the Sub-Advisor and the Sub-Advisor hereby undertakes to act as the investment sub-advisor of the Fund to provide investment advice and to perform for the Fund such other duties and functions as are hereinafter set forth. The Sub-Advisor shall, in all matters, give to the Fund and the Fund's board of directors (the “Board of Directors”), directly or through OFI, the benefit of the Sub-Advisor's best judgment, effort, advice and recommendations and shall, at all times conform to, and use its best efforts to enable the Fund to conform to (i) the provisions of Cayman Islands law and the Investment Company Act of 1940 (“Investment Company Act”) and any rules or regulations thereunder to the extent not prohibited by Cayman Islands law; (ii) the provisions of the Memorandum of Association and Articles of Association of the Fund as amended from time to time; (iii) policies and determinations of the Board of Directors of the Fund; (iv) the fundamental policies and investment restrictions of the Fund as communicated in writing to the Sub-Advisor from time to time. The appropriate officers and employees of the Sub-Advisor shall be available upon reasonable notice for consultation with OFI or any of the Directors and officers of the Fund with respect to any matters dealing with the business and affairs of the Fund including the valuation of portfolio securities of the Fund which are either not registered for public sale or not traded on any securities market. The Sub-Advisor shall provide these services pursuant to the policies and procedures applicable to the investment management of the U. S. registered investment company that is the sole shareholder of the Fund (the “Controlling Fund”) to the extent such policies and procedures are in the judgment of OFI relevant to the Fund and are permitted by Cayman Island law.Capitalized terms used herein without definition shall, as the context requires, have the meaning ascribed to them in the Advisory Agreement.

    2.     

    Authority of the Sub-Advisor.


    In connection with its obligations hereunder, the Sub-Advisor will have the authority for and in the name of the Fund, subject to the overall direction and control of the Fund's Board of Directors, to:

    (a)     invest and reinvest the Fund's assets, on margin or otherwise, in securities and other financial instruments of United States and foreign entities, including, without limitation, capital stock; shares of beneficial interest; partnership interests and similar financial instruments; bonds, notes and debentures (whether subordinated, convertible or otherwise); currencies; commodities; interest rate, currency, commodity, equity and other derivative products, including, without limitation, (i) futures contracts (and options thereon) relating to stock indices, currencies, United States Government securities and securities of foreign governments, other financial instruments and all other commodities, (ii) swaps, options, warrants, caps, collars, floors and forward rate agreements, (iii) spot and forward currency transactions and (iv) agreements relating to or securing such transactions; equipment lease certificates; equipment trust certificates; loans; accounts and notes receivable and payable held by trade or other creditors; trade acceptances; contract and other claims; executory contracts; participations; mutual funds, exchange traded funds and similar financial instruments; money market funds; obligations of the United States or any state thereof, foreign governments and instrumentalities of any of them; commercial paper; certificates of deposit; bankers' acceptances; choses in action; trust receipts; and any other obligations and instruments or evidences of indebtedness of whatever kind or nature; in each case, of any person, corporation, government or other entity whatsoever, whether or not publicly traded or readily marketable (all such items being called herein a "Security" or "Securities"), and to sell Securities short and cover such sales;

    (b)     provide research and analysis and direct the formulation of investment policies and strategies for the Fund;

    (c)     acquire a long position or a short position with respect to any Security and to make purchases or sales increasing, decreasing or liquidating such position or changing from a long position to a short position or from a short position to a long position, without any limitation as to the frequency of the fluctuation in such positions or as to the frequency of the changes in the nature of such positions;

    (d)     purchase Securities and hold them for investment;

    (e)     enter into contracts for or in connection with investments in Securities;

    (f)     invest in other pooled investment vehicles for any purpose, which investments shall be subject in each case to the terms and conditions of the respective governing document for such vehicle;

    (g)     possess, transfer, mortgage, pledge or otherwise deal in, and exercise all rights, powers, privileges and other incidents of ownership or possession with respect to, Securities and other property and funds held or owned by the Fund;

    (h)     lend, either with or without security, any Securities, funds or other properties of the Fund, including by entering into reverse repurchase agreements, and, from time to time, without limit as to the amount, borrow or raise funds, including by entering into repurchase agreements, and secure the payment of obligations of the Fund by mortgage upon, or pledge or hypothecation of, all or any part of the property of the Fund;

    (i)     open, maintain and close accounts, including futures, margin and custodial accounts, with brokers, including brokers affiliated with the Sub-Advisor, which power shall include the authority to issue all instructions and authorisations to brokers regarding the Securities and/or money therein; to pay, or authorise the payment and reimbursement of, commissions that may be in excess of the lowest rates available that are paid to brokers who execute transactions for the account of the Fund and who supply, or pay for (or rebate a portion of the Fund's brokerage commissions to the Fund for payment of) the cost of, brokerage, research or execution services utilised by the Fund, OFI and its affiliates, members, partners, officers and employees (collectively, excluding the Sub-Advisor, "Affiliates"); provided that the Fund does not pay a rate of commissions in excess of what is competitively available from comparable brokerage firms for comparable services, taking into account various factors, including commission rates, reliability, financial responsibility, strength of the broker and ability of the broker to efficiently execute transactions, the broker's facilities, and the broker's provision or payment of the costs of research and other services or property that are of benefit to the Fund, OFI and Affiliates;

    (j)     open, maintain and close accounts, including custodial accounts, with banks, including banks located outside the United States, and draw checks or other orders for the payment of monies as authorised by the Board of Directors;

    (k)     combine purchase or sale orders on behalf of the Fund with orders for other accounts to whom the Sub-Advisor or any of its affiliates provide investment services ("Other Accounts") and allocate the Securities or other assets so purchased or sold, on an average-price basis or by any other method of fair allocation, among such accounts;

    (l)     enter into arrangements with brokers to open "average price" accounts wherein orders placed during a trading day are placed on behalf of the Fund and Other Accounts and are allocated among such accounts using an average price;

    (m)      organise one or more corporations or other entities formed to hold record title, as nominee for the Fund (whether alone or together with the Other Accounts), to Securities or funds of the Fund as authorized by the Board of Directors;

    (n)     cause the Fund to engage in agency, agency cross and principal transactions with affiliates to the extent permitted by applicable securities laws;

    (o)     supply the administrator of, or other service providers to, the Fund with such information and instructions as may be necessary to enable such person or persons to perform their duties in accordance with the applicable agreements;

    (p)     engage personnel, whether part-time or full-time, and sub-advisors, attorneys, independent accountants, or such other persons as the Sub-Advisor may deem necessary or advisable;

    (q)     authorise any employee or other agent of the Sub-Advisor or any employee or other agent of the Fund to act for and on behalf of the Fund in all matters incidental to the foregoing; and

    (r)     

    do any and all acts on behalf of the Fund as it may deem necessary or advisable in connection with the maintenance and administration of the Fund, and exercise all rights of the Fund, with respect to its interest in any person, including, without limitation, the voting of Securities (including voting of proxies), participation in arrangements with creditors, the institution and settlement or compromise of suits and administrative proceedings and other like or similar matters.

    3.     

    Liability.


    The Sub-Adviser will be liable to the Fund and, without duplication, to the Controlling Fund, as third party beneficiaries hereof, for the losses to the Fund or the Controlling Fund which are the direct result of the Sub-Adviser’s bad faith, gross negligence, wilful default or breach of the express terms of this Agreement. Except as set forth in the foregoing sentence, neither the Sub-Advisor nor its officers, employees or agents shall be liable hereunder for any act or omission or for any error of judgment in managing the Fund. The Sub-Advisor shall not be responsible for any special, indirect or consequential damages, or any loss incurred by reasons of any act or omission of the Fund or any broker, dealer or custodian used hereunder or any authorised representative of the foregoing. Notwithstanding the foregoing, nothing herein shall in any way constitute a waiver or limitation of any rights which the Fund may have under the federal securities or other applicable law.

    4.     

    Duties of OFI.


    OFI shall provide the Sub-Advisor with the following information about the Fund:

    (a)     cash flow estimates on request;

    (b)     notice of the Fund's "investable funds" by 11:00 a.m. each business day;

    (c)     as they are modified, from time to time, current versions of the documents and policies referred to in subparagraphs (ii), (iii) and (iv) of paragraph 1, above.

    5.     

    Compensation of the Sub-Advisor.


    OFI agrees to pay the Sub-Advisor and the Sub-Advisor agrees to accept as full compensation for the performance of all functions and duties on its part to be performed pursuant to the provisions hereof, a fee computed on the aggregate net asset value of the Fund as of the close of each business day and payable monthly by the tenth business day of the following month, at the following annual rate:

    0.375% of the first $200 million of net assets;

    0.36% of the next $200 million;
    0.345% of the next $200 million;
    0.33% of the next $200 million;
    0.30% of the next $200 million; and
    0.25% of net assets in excess of $1 billion

    6.     

    Portfolio Transactions and Brokerage.


    (a)     The Sub-Advisor is authorised, in arranging the purchase and sale of the Fund's portfolio investments, to employ or deal with such members of securities or commodities exchanges, brokers or dealers or futures commission merchants (hereinafter "broker-dealers"), including "affiliated" broker-dealers, as that term is defined in the Investment Company Act, as may, in its best judgment, implement the policy of the Fund to obtain the "best execution" (prompt and reliable execution at the most favorable security price obtainable) of the Fund's portfolio transactions.

    (b)     The Sub-Advisor may effect the purchase and sale of securities (which are otherwise publicly traded) in private transactions on such terms and conditions as are customary in such transactions, may use a broker in such to effect said transactions, and may enter into a contract in which the broker acts either as principal or as agent.

    (c)     The Sub-Advisor shall select broker-dealers to effect the Fund's portfolio transactions on the basis of its estimate of their ability to obtain best execution of particular and related portfolio transactions. The abilities of a broker-dealer to obtain best execution of particular portfolio transaction(s) will be judged by the Sub-Advisor on the basis of all relevant factors and considerations including, insofar as feasible, the execution capabilities required by the transaction or transactions; the ability and willingness of the broker-dealer to facilitate the Fund's portfolio transactions by participating therein for its own account; the importance to the Fund of speed, efficiency or confidentiality; the broker-dealer's apparent familiarity with sources from or to whom particular securities might be purchased or sold; as well as any other matters relevant to the selection of a broker-dealer for particular and related transactions of the Fund.

    (d)     The Sub-Advisor shall have discretion, in the interests of the Fund, to allocate brokerage on the Fund's portfolio transactions to broker-dealers, other than affiliated broker-dealers, qualified to obtain best execution of such transactions who provide brokerage and/or research services (as such services are defined in Section 28(e)(3) of the U.S. Securities Exchange Act of 1934) for the Fund and/or other accounts for which the Sub-Advisor exercises "investment discretion" (as that term is defined in Section 3(a)(35) of the U.S. Securities Exchange Act of 1934) and to cause the Fund to pay such broker-dealers a commission for effecting a portfolio transaction for the Fund that is in excess of the amount of commission another broker-dealer adequately qualified to effect such transaction would have charged for effecting that transaction, if the Sub-Advisor determines, in good faith, that such commission is reasonable in relation to the value of the brokerage and/or research services provided by such broker-dealer, viewed in terms of either that particular transaction or the overall responsibilities of the Sub-Advisor with respect to the accounts as to which it exercises investment discretion. In reaching such determination, the Sub-Advisor will not be required to place or attempt to place a specific dollar value on the brokerage and/or research services provided or being provided by such broker-dealer. In demonstrating that such determinations were made in good faith, the Sub-Advisor shall be prepared to show that all commissions were allocated for purposes contemplated by this Agreement and that the total commissions paid by the Fund over a representative period selected by the Directors were reasonable in relation to the benefits to the Fund.

    (e)     The Sub-Advisor shall have no duty or obligation to seek advance competitive bidding for the most favorable commission rate applicable to any particular portfolio transactions or to select any broker-dealer on the basis of its purported or "posted" commission rate but will, to the best of its ability, endeavor to be aware of the current level of the charges of eligible broker-dealers and to minimise the expense incurred by the Fund for effecting its portfolio transactions to the extent consistent with the interests and policies of the Fund as established by the determinations of the Board of Directors and the provisions of this paragraph 6.

    7.     

    Duration.


    This Agreement will take effect on the date first set forth above. Unless earlier terminated pursuant to paragraph 8 hereof, this Agreement shall remain in effect so long as OFI remains the investment advisor for the Fund and for the Controlling Fund.
     

    8.     

    Termination.


    This Agreement shall terminate automatically in the event of its assignment, in the event the Fund terminates the Advisory Agreement or in the event that the Investment Advisory Agreement between OFI and the Controlling Fund is terminated. This Agreement may also be terminated: (i) for cause or with the consent of the parties, the Fund and the Controlling Fund; (ii) by OFI or the Sub-Advisor at any time without penalty upon sixty days' written notice to the other party, the Fund and the Controlling Fund; or (iii) by the Fund or the Controlling Fund at any time without penalty upon sixty days' written notice to OFI and the Sub-Advisor provided that such termination by the Fund or the Controlling Fund, as the case may be, shall be directed or approved by the vote of a majority of all of the directors of the Fund or the Controlling Fund, as the case may be, then in office or by the vote of the holders of a "majority" of the outstanding voting securities (as defined in the U.S. Investment Company Act) of the Fund or the Controlling Fund, as the case may be.

    9.     

    Notice.


    Any notice under this Agreement shall be in writing, addressed and delivered or mailed, postage prepaid, to the other party, with a copy to the Fund, at the addresses below or such other address as such other party may designate for the receipt of such notice.
     

              If to OFI:

         OppenheimerFunds, Inc.
         2 World Financial Center, 11
    th Floor

         New York, New York 10281

         Attention: Arthur S. Gabinet, General Counsel

    If to the Sub-Advisor:

         Oppenheimer Real Asset Management, Inc.
         2 World Financial Center, 11
    th Floor
         New York, New York 10281

         Attention: Arthur S. Gabinet, General Counsel


    If to the Fund:

         Oppenheimer Global Strategic Income Fund/VA (Cayman) Ltd.

         c/o M&C Corporate Services Limited
         Ugland House, South Church Street
         P.O. Box 309GT
         George Town, Grand Cayman
         Cayman Islands
         British West Indies

    If to any party, copy to:

         Oppenheimer Global Strategic Income Fund/VA

         6803 South Tucson Way
         Englewood, Colorado 80112
        
    Attention: Arthur S. Gabinet, General Counsel

    IN WITNESS WHEREOF, OFI and the Sub-Advisor have caused this Agreement to be executed on the day and year first above written.

    Pursuant to an exemption from the Commodity Futures Trading Commission in connection with accounts of qualified eligible clients, ANY brochure or account document is not required to be, and has not been, filed with the Commission. The Commodity Futures Trading Commission does not pass upon the merits of participating in a trading program or upon the adequacy or accuracy of commodity trading advisor disclosure. Consequently, the Commodity Futures Trading Commission has not reviewed or approved this trading program or ANY brochure or account document.

                          OPPENHEIMERFUNDS, INC.

                          By: /s/ Andy Mika

    Name: Andy Mika
    Title: Senior Vice President


                          OPPENHEIMER REAL ASSET MANAGEMENT, INC.

                          By: /s/ Arthur Steinmetz

    Name: Arthur Steinmetz
    Title: Director and President

    EX-99.J 45 consent.htm

    CONSENT OF INDEPENDENT REGISTERED PUBLIC ACCOUNTING FIRM

    The Board of Trustees and Shareholders of Oppenheimer Variable Account Funds:
     

    We consent to the use in this Registration Statement of Oppenheimer Global Strategic Income Fund/VA, formerly known as Oppenheimer Strategic Bond Fund/VA; Oppenheimer Main Street Small- & Mid-Cap Fund/VA, formerly known as Oppenheimer Main Street Small Cap Fund/VA, Oppenheimer Small- & Mid-Cap Growth Fund/VA; Oppenheimer Global Securities Fund/VA; Oppenheimer Capital Appreciation Fund/VA; Oppenheimer Core Bond Fund/VA; Oppenheimer High Income Fund/VA; Oppenheimer Money Fund/VA; Oppenheimer Value Fund/VA; Oppenheimer Balanced Fund/VA; and Oppenheimer Main Street Fund/VA (Funds of the Oppenheimer Variable Account Funds) (the Funds), of our reports dated February 16, 2011, relating to the financial statements and financial highlights of the Funds, appearing in the Statement of Additional Information, which is part of such Registration Statement, and to the references to our firm under the headings “Financial Highlights” appearing in the Prospectuses, which are also part of such Registration Statement and “Independent Registered Public Accounting Firm” appearing in the Statement of Additional Information.

                                                      /s/ KPMG LLP
                                                      KPMG LLP
     
    Denver, Colorado

    April 25, 2011


    COVER 46 filename46.htm

    OppenheimerFunds, Inc.
    Two World Financial Center
    225 Liberty Street, 11th Floor
    New York, New York 10281-1008

    April 27, 2011

    VIA EDGAR

    Securities and Exchange Commission
    Mail Stop 0-7, Filer Support
    6432 General Green Way
    Alexandria, VA 22312
     

    Re:     Oppenheimer Variable Account Funds
       Post-Effective Amendment No. 60
    under the Securities Act
       and Amendment No. 55
    under the Investment Company Act
       File Nos. 2-93177; 811-4180                                                  

    To the Securities and Exchange Commission: 

    On behalf of Oppenheimer Balanced Fund/VA, Oppenheimer Capital Appreciation Fund/VA, Oppenheimer Core Bond Fund/VA, Oppenheimer Global Securities Fund/VA, Oppenheimer Global Strategic Income Fund/VA, Oppenheimer High Income Fund/VA, Oppenheimer Main Street Fund/VA, Oppenheimer Main Street Small Cap Fund/VA, Oppenheimer Money Fund/VA, Oppenheimer Small- & Mid-Cap Growth Fund/VA and Oppenheimer Value Fund/VA, each a series of Oppenheimer Variable Account Funds (the “Funds”), transmitted herewith for filing with the Securities and Exchange Commission (the “Commission”) under the Securities Act of 1933, as amended (the “Securities Act”) and the Investment Company Act of 1940, as amended (the “Investment Company Act”), is an amendment to the Funds’ Registration Statement on Form N-1A (the “Registration Statement”), including the exhibits thereto, which amendment constitutes Post-Effective Amendment No. 60 to the Registration Statement under the Securities Act and Amendment No. 55 to the Registration Statement under the Investment Company Act (the “Amendment”).

    The Amendment for the Funds, other than Oppenheimer Global Strategic Income Fund/VA and Oppenheimer Main Street Small Cap Fund/VA, has been tagged to indicate paragraphs of each Fund’s Prospectus that include changes from Post-Effective Amendment No. 56 to the Registration Statement, which was filed with the Commission on April 28, 2010. The Amendment for Oppenheimer Global Strategic Income Fund/VA has been tagged to indicate paragraphs of the Prospectus that include changes from Post-Effective Amendment No. 57, which was filed with the Commission on February 16, 2011. The Amendment for Oppenheimer Main Street Small Cap Fund/VA’s Prospectus and the Funds’ Statement of Additional Information have been tagged to indicate paragraphs of the Prospectus and Statement of Additional Information that include changes from Post-Effective Amendment No. 59, which was filed with the Commission on February 28, 2011. This filing is being made to include the (i) audited financial statements of the Funds for the fiscal year ended December 31, 2010, together with a copy of a signed Independent Registered Public Accounting Firm's consent, (ii) certain exhibits, and (iii) non-material changes permitted by Rule 485(b) under the Securities Act.

    On February 16, 2011, Oppenheimer Global Strategic Income Fund/VA filed an amendment under Rule 485(a) for the purpose of adding disclosure about the Fund’s investment in a wholly-owned subsidiary. On February 28, 2011, Oppenheimer Main Street Small Cap Fund/VA filed an amendment under Rule 485(a) for the purpose of adding a portfolio manager and making certain changes to the investment policy and a corresponding change of the Fund's name to Oppenheimer Main Street Small- & Mid-Cap Fund/VA. Today's filing incorporates the revisions in response to comments received from the Commission staff. A letter responding to the Staff’s comments is also included as part of this filing.

    Pursuant to Rule 485(b)(4) under the Securities Act, the undersigned counsel, who prepared or reviewed the Amendment, hereby represents to the Commission that, to our knowledge, the Amendment does not contain disclosures which would render it ineligible to become effective pursuant to paragraph (b) of Rule 485. This filing is intended to become effective under Rule 485(b) on April 29, 2011, as indicated on the facing page.

    The Securities and Exchange Commission Staff is requested to address any comments or questions you may have on this filing to:

    Taylor V. Edwards, Esq.
    Vice President & Associate Counsel
    OppenheimerFunds, Inc.
    Two World Financial Center
    225 Liberty Street, 16th Floor
    New York, New York 10281-1008
    212-323-0310

    tedwards@oppenheimerfunds.com

    Very truly yours,

    /s/ Adrienne Ruffle

    Adrienne Ruffle

    Vice President and Associate Counsel

    Tel.: 212.323.5231

    Fax: 212.323.4070

    aruffle@oppenheimerfunds.com


    Attachments 

    cc:     K&L Gates LLP

    KPMG LLP
             Gloria LaFond

    Nancy S. Vann

    CORRESP 47 filename47.htm

    OppenheimerFunds, Inc.
    Two World Financial Center
    225 Liberty Street, 11th Floor
    New York, New York 10281-1008

    April 27, 2011

    Via Electronic Transmission

    Mr. Michael Kosoff, Esq.
    U.S. Securities and Exchange Commission

    Division of Investment Management
    100 F Street, NE
    Washington, DC 20549

    Re:          Registration Statement on Form N-1A
          Oppenheimer Variable Account Funds
          (SEC File Nos. 002-93177; 811-04108)

    Dear Mr. Kosoff:

    We have reviewed your comments on Post-Effective Amendment Nos. 57 and 59 to the registration statement on Form N-1A (the “Registration Statement”) for the Oppenheimer Variable Account Funds (the “Fund”) filed with the Securities and Exchange Commission (the “SEC”) on February 16, 2011 and February 28, 2011, respectively. For your convenience, we have included each of your comments in italics, followed by our response. The captions used below correspond to the captions the Fund uses in its Registration Statement and defined terms have the meanings defined therein.

    General

    1.     Please remember, consistent with the guidance offered by the SEC staff in its July 30, 2010 letter to the Investment Company Institute, to make disclosure regarding derivatives specific and tailored to the Fund.

    Derivative disclosure has been revised to make it specific to each of the Fund’s series.

    2.     Please remember that the Fund must make XBRL filings.

    The Fund will file a post-effective amendment to provide interactive data, consistent with the SEC’s requirements.

    3.     Please revise the Edgar filings so that <R> tags are not publicly visible.

    The Edgar filing has been prepared so that the <R> tags are not publicly visible.

    4.     Fee Table footnotes: The term “voluntary” should be deleted from the sentence “This voluntary expense limitation may not be amended or withdrawn until one year after the date of this prospectus.”

    The disclosure has been revised as requested.

    5.     Portfolio Turnover: Please remove the reference to taxable accounts.

    The disclosure has been revised as requested. References to taxable accounts have been deleted from the Portfolio Turnover section.

    Global Strategic Income Fund/VA Prospectus

    Cover Page

    6.      Please list all classes on the cover page of the prospectus.

    All of the share classes are listed on the cover page of the prospectus.

    Fee Table

    7.     Management fee line item: Remove the phrase “of the Fund and of the Subsidiary” from the line item and revise the footnote to indicate that the Management Fee reflects management expenses from the Fund and the Subsidiary.

    The disclosure has been revised as requested.

    8.     If the management fee paid by the Fund is expected to be materially different from the prior fiscal year, restate the management fee and indicate that it is based on estimated or current operating expenses in a footnote.

    The management fee paid by the Fund is not expected to be materially different from the prior fiscal year, even given the impact of the Subsidiary.

    9.     Other Expenses of the Subsidiary: Footnote this line item to indicate it is based on estimated amounts.

    The disclosure has been revised as requested.

    10.     Acquired Fund Fees and Expenses: To the extent that the Subsidiary materially contributes to expenses in this line item, include a footnote to indicate that these expenses reflect estimated amounts from the Subsidiary.

    No estimated amounts are expected to apply to Acquired Fund Fees and Expenses from the Subsidiary’s investments.

    11.     Fee Waiver footnote: Two waivers are indicated in the disclosure. Confirm that each of these waivers contribute to the expense waived in the line item.

    Each of the waivers described in the footnote contribute to the expenses waived in the line item. The waiver relating to the Fund’s investments in certain other Oppenheimer-advised funds, namely Oppenheimer Institutional Money Market Fund, Oppenheimer Master Loan Fund, LLC and Oppenheimer Master Event-Linked Bond Fund, LLC, constitutes 0.04% of expenses waived, and the waiver relating to management fees from the Subsidiary constitutes 0.04% of expenses waived, for a total of 0.08% of expenses waived as indicated in the line item.

    Principal Investment Strategies

    12.     Revise the principal investment strategies to indicate that a substantial portion of the Fund’s assets will be invested outside of the United States, since the Fund has “global” in its name.

    The disclosure has been revised as requested. The following disclosure has been added to the section:

    “Under normal market conditions, the Fund will invest a substantial portion of its assets in a number of different countries, including the U.S. The Fund is not required to allocate its investments in any set percentages in any particular countries.”

    13.     Please revise the description of the Subsidiary to clarify that the Subsidiary is looked-through for purposes of its complying with the investment restrictions and compliance policies and procedures of the Fund.

    The disclosure has been revised as requested. The following disclosure now replaces the fifth sentence of the last paragraph of this section:
    “The Fund applies its investment restrictions and compliance policies and procedures, on a look-through basis, to the Subsidiary.”

    Principal Risks

    14.     Add government securities risk, mortgage related securities risk, and high portfolio turnover risk

    We believe that a summary of the risks of investing in government securities and mortgage-related securities is covered by the existing disclosure under “Main Risks of Debt Securities” and “Fixed-Income Market Risks.” Consistent with Item 4(b)(1) of Form N-1A, these risks have been summarized but are further expanded in response to Item 9(c). In addition, we believe that high portfolio turnover risk is adequately addressed by the Portfolio Turnover disclosure included in response to Item 3 of Form N-1A.

    The Fund’s Past Performance

    15.     Delete the description of the primary index, as Instruction 2(b) to Item 4 of Form N-1A only permits information about an additional index in the narrative description preceding the performance table.

    The disclosure has been revised as requested. Only the secondary index is described in the narrative preceding the performance table.

    The Price of Fund Shares

    16.     Clarify how assets of the Subsidiary are valued.

    The disclosure has been revised as requested. The following disclosure has been added to this section:
    Pricing of the Subsidiary. The valuation procedures described above for the Fund are the same used in valuing the Subsidiary’s portfolio investments and shares of the Subsidiary.”

    Main Street Small- & Mid-Cap Fund®/VA

    Edgar Filing

    17.     Please update this Fund's "Series" and "Class" identifiers in the Edgar filing system to reflect the Fund's new name.

    The Fund’s Series and Class identifiers have been updated as requested.

    Prospectus

    Fee Table

    18.     In the paragraph titled "Portfolio Turnover" please remove the zero preceding the portfolio turnover percentage figure.

    We have corrected this typographical error as requested.

    Principal Risks

    19.     In the section "Main Risks of Foreign Investments" please remove the sentence regarding emerging markets if investing in emerging markets is not a principal strategy.

    Although investments in emerging markets is not a principal strategy of the Fund, they are included in the Fund's portfolio. We regard those risks as being greater than the risks of other foreign investments and therefore feel that they may at times constitute "principal" risks of the Fund and should be included in the summary section of the Prospectus.

    20.     If Master Limited Partnerships are a principal strategy of the Fund, please include the risks of those investments in the section "Principal Risks."

    We do not consider Master Limited Partnerships to be a principal investment strategy. We have deleted the reference to those securities in the "Principal Strategies" section.

    About the Fund's Investments

    21.     If Master Limited Partnerships are a principal strategy of the Fund, please move that disclosure to the section "Principal Investment Strategies and Risks."

    We do not consider Master Limited Partnerships to be a principal investment strategy. We have left that disclosure in the "Other Investment Strategies and Risks" section.

    22.     Please explain supplementally why "Price Arbitrage" is a principal risk of the Fund. If it is a principal risk, please include that disclosure in the Item 4 section "Principal Risks."

    We do not consider "Price Arbitrage" a principal risk of this Fund and have therefore moved that disclosure to the "Other Investment Strategies and Risks" section.

    Statement of Additional Information

    Disclosure of Portfolio Holdings

    23.     Disclose the length of lag time, if any, between the date of portfolio holdings information and the date of disclosure of that information to the listed entities with whom the Fund has disclosure arrangements.

    The SAI contains the following information, under “Portfolio Holdings Disclosure Policies,” which we believe adequately discloses the length of lag time:

    portfolio holdings information of the Fund may be provided, under limited circumstances, to brokers or dealers with whom the Fund trades and entities that provide investment coverage or analytical information regarding the Fund’s portfolio, provided that there is a legitimate investment reason for providing the information to the broker, dealer or other entity. Month-end portfolio holdings information may, under this procedure, be provided to vendors providing research information or analytics to the Fund, with at least a 15-day delay after the month end, but in certain cases may be provided to a broker or analytical vendor with a 1- 2 day lag to facilitate the provision of requested investment information to the Manager to facilitate a particular trade or portfolio manager’s investment process for the Fund. Any third party receiving such information must first sign the Manager’s portfolio holdings non-disclosure agreement as a pre-condition to receiving this information.

    Board of Trustees and Oversight Committees

    24.     Disclose why the Fund has determined that its leadership structure is appropriate, as per N-1A item 17(b)(1).

    The following disclosure has been added to the SAI as requested:

    The Board has determined that its leadership structure is appropriate in light of the characteristics and circumstances of the Trust because it allocates areas of responsibility among the committees in a manner that enhances the Board's oversight.

    25.     With respect to risk oversight, the SAI states that the Board relies on information from various parties. Disclose the effect of this on board oversight structure, per N-1A Item 17(b)(1).

    Release No. 33-9098 makes clear that the disclosure requirement referenced “gives companies the flexibility to describe how the board administers its risk oversight function, such as through the whole board, or through a separate risk committee or the audit committee.” In light of the rule and the guidance in the Release, the following disclosure, contained in the first paragraph under “Board of Trustees and Oversight Committees,” has been revised to add the information underlined therein:
     
    The Board meets periodically throughout the year to oversee the Fund’s activities, including to review its performance, oversee potential conflicts that could affect the Fund, and review the actions of the Manager. With respect to its oversight of risk, the Board,
    through its committees, relies on reports and information received from various parties, including the Manager, internal auditors, the Fund’s Chief Compliance Officer, the Fund’s outside auditors and Fund counsel.

    26.     Confirm, supplementally, that the board structure of the offshore subsidiary complies with section 16 of the Investment Company Act of 1940.

    The offshore subsidiary is not a registered investment company under the Investment Company Act of 1940, and therefore is not subject to the provisions of Section 16. However, as sole shareholder of the wholly-owned subsidiary, the Fund elected the directors.

    Brokerage Policies of the Fund

    27.     Update the “Compensation of the Portfolio Managers” section for 2010.

    The section has been updated as requested.

    Payments to Fund Intermediaries

    28.     Remove the first bullet from under the second paragraph as sales loads do not apply to the Funds.

    The bullet regarding an initial front end-sales charge has been removed as requested.

    How to Buy Shares – Determination of Net Asset Values Per Share

    29.     Please clarify the kind of event that is likely to effect a materials change in the value of a security.

    The Prospectus, under the section “THE PRICE OF FUND SHARES-Fair Value Pricing,” provides examples of the kinds of events that the Manager believes may effect a material change in the value of a security. Consistent with General Instruction C.2(b), we do not believe further clarification is warranted in the SAI.

    How to Buy Shares – Securities Valuation

    30.     Please explain how the value of the subsidiary and its underlying investments are measured.

    The following disclosure has been added to this section:
    Valuation of the Subsidiary and its Underlying Investments. The securities valuation procedures for the Fund are the same used in valuing the Subsidiary’s portfolio investments and shares of the Subsidiary.”

    Part C

    31.     Include as an exhibit the investment advisory agreement between the Manager and the Subsidiary.

    The advisory agreement between the Manager and the Subsidiary has been included as an exhibit as requested.

    32.     Revise the list of exhibits to reflect the proper name of Oppenheimer Global Strategic Income Fund.

    The Part C has been revised as requested.

    33.     Provide an undertaking that the Subsidiary’s financial statements will be updated each time the Fund’s financial statements are updated.

    The Part C has been revised to reflect the Manager’s undertaking that the Subsidiary’s financial statements will be updated each time the Fund’s financial statements are updated.

    34.     Provide disclosure that the books and records of the Subsidiary will be available to inspection to the same extent as he Fund’s.

    The Part C has been revised accordingly.

    35.     Confirm that the Subsidiary’s directors have consented to service of process in the U.S. via the same agent as the Fund.

    We confirm that the Subsidiary’s directors have consented to service of process in the U.S. via the same agent as the Fund.

    * * * **

    The Fund will file a post-effective amendment reflecting these changes.

    The undersigned hereby acknowledges that (i) should the Commission or the staff, acting pursuant to delegated authority, declare the filing effective, it does not foreclose the Commission from taking any action with respect to the filing; (ii) the action of the Commission or the staff, acting pursuant to delegated authority, in declaring the filing effective, does not relieve the Registrant from its full responsibility for the adequacy and accuracy of the disclosure in the filing; and (iii) the Registrant may not assert this action as defense in any proceeding initiated by the Commission or any person under the federal securities laws of the United States.

    Please direct any questions you may have regarding the amendment or this letter to:

    Taylor V. Edwards
    Vice President & Associate Counsel
    OppenheimerFunds, Inc.
    Two World Financial Center
    225 Liberty Street, 16th Floor
    New York, New York 10281-1008
    212-323-0310
    tedwards@oppenheimerfunds.com

    Sincerely,
     

    /s/ Taylor V. Edwards           

    Taylor V. Edwards, Esq.

    Vice President & Associate Counsel

    cc:     K&L Gates LLP

             Gloria LaFond

             Arthur S. Gabinet, Esq.
             Kathleen Ives, Esq.

             Nancy S. Vann, Esq.

             Edward Gizzi, Esq.