UNITED STATES
SECURITIES AND EXCHANGE COMMISSION
WASHINGTON, D.C. 20549
FORM 10-K
x | Annual Report Pursuant to Section 13 or 15(d) of the Securities Exchange Act of 1934 |
For the year ended December 31, 2016
¨ | Transition Report Pursuant to Section 13 or 15(d) of the Securities Exchange Act of 1934 |
For the transition period from to
Commission File Number 1-9810
OWENS & MINOR, INC.
(Exact name of registrant as specified in its charter)
Virginia | 54-1701843 | |
(State or other jurisdiction of incorporation or organization) | (I.R.S. Employer Identification No.) | |
9120 Lockwood Boulevard, Mechanicsville, Virginia | 23116 | |
(Address of principal executive offices) | (Zip Code) | |
Registrant’s telephone number, including area code (804) 723-7000
Securities registered pursuant to Section 12(b) of the Act:
Title of each class | Name of each exchange on which registered | |
Common Stock, $2 par value | New York Stock Exchange | |
3.875% Senior Notes due 2021 | Not Listed | |
4.375% Senior Notes due 2024 | Not Listed | |
Securities registered pursuant to Section 12(g) of the Act: None
Indicate by check mark if the registrant is a well-known seasoned issuer (as defined in Rule 405 of the Securities Act). Yes x No ¨
Indicate by check mark if the registrant is not required to file reports pursuant to Section 13 or Section 15(d) of the Act. Yes ¨ No x
Indicate by check mark whether the registrant (1) has filed all reports required to be filed by Section 13 or 15(d) of the Securities Exchange Act of 1934 during the preceding 12 months (or for such shorter period that the registrant was required to file such reports), and (2) has been subject to such filing requirements for the past 90 days. Yes x No ¨
Indicate by check mark whether the registrant has submitted electronically and posted on its corporate Website, if any, every Interactive Data File required to be submitted and posted pursuant to Rule 405 of Regulation S-T (§232.405 of this chapter) during the preceding 12 months (or for such shorter period that the registrant was required to submit and post such files). Yes x No ¨
Indicate by check mark if disclosure of delinquent filers pursuant to Item 405 of Regulation S-K (§229.405 of this chapter) is not contained herein, and will not be contained, to the best of registrant’s knowledge, in definitive proxy or information statements incorporated by reference in Part III of this Form 10-K or any amendment to this Form 10-K. ¨
Indicate by check mark whether the registrant is a large accelerated filer, an accelerated filer, or a non-accelerated filer or a smaller reporting company. See the definitions of “large accelerated filer,” “accelerated filer” and “smaller reporting company” in Rule 12b-2 of the Exchange Act.
Large accelerated filer | x | Accelerated filer | ¨ | |||
Non-accelerated filer | ¨ | Smaller reporting company | ¨ | |||
Indicate by check mark whether the registrant is a shell company (as defined in Rule 12b-2 of the Exchange Act). Yes ¨ No x
The aggregate market value of Common Stock held by non-affiliates (based upon the closing sales price) was approximately $2,336,644,396 as of June 30, 2016.
The number of shares of the Company’s common stock outstanding as of February 13, 2017 was 61,038,220 shares.
Documents Incorporated by Reference
The proxy statement for the annual meeting of shareholders to be held on May 5, 2017, is incorporated by reference for Item 5 of Part II and Part III.
1
Form 10-K Table of Contents
Item No. | Page | |||
1 | ||||
1A. | ||||
1B. | ||||
2 | ||||
3 | ||||
4 | Mine Safety Disclosures | |||
5 | ||||
6 | ||||
7 | ||||
7A. | ||||
8 | ||||
9 | ||||
9A. | ||||
9B. | ||||
10 | ||||
11 | ||||
12 | ||||
13 | ||||
14 | ||||
15 | ||||
Corporate Officers can be found at the end of this Form 10-K.
Part I
Item 1. Business
General
Owens & Minor, Inc. and subsidiaries (we, us or our), a Fortune 500 company headquartered in Richmond, Virginia, is a leading global healthcare services company that connects the world of medical products to the point of care. We provide vital supply chain assistance to the providers of healthcare services and the manufacturers of healthcare products, supplies and devices. With fully developed networks in the United States and Europe, we are equipped to serve a customer base ranging from hospitals, integrated healthcare systems, group purchasing organizations, and the U.S. federal government, to manufacturers of life-science and medical devices and supplies, including pharmaceuticals in Europe. The description of our business should be read in conjunction with the consolidated financial statements and supplementary data included in this Form 10-K.
Founded in 1882, Owens & Minor was incorporated in 1926 in Richmond, Virginia. We focus our operations on healthcare logistics services and provide our customers with a service portfolio that covers procurement, inventory management, delivery and sourcing of products for the healthcare market. Through organic growth and acquisitions over many years, we significantly expanded and strengthened our company, achieving national scale in the United States healthcare market. In 2012, through the acquisition of the Movianto Group (Movianto), we entered into third-party logistics services for the pharmaceutical, biotechnology and medical device industries in the European market, leveraging an existing platform that also expands our ability to serve our United States-based manufacturer customers on an international level.
In the fourth quarter of 2014, we completed the acquisitions of Medical Action Industries Inc. (Medical Action), a leading producer of surgical kits and procedure trays for the healthcare market, and ArcRoyal, a privately held surgical kitting company based in Ireland. These acquisitions further expanded our capabilities to offer our provider and manufacturer customers a range of kitting services, including the ability to combine instruments and supplies into sterilized custom procedure trays used in a variety of clinical procedures, such as cardiac and orthopedic procedures, and sterilized minor procedure kits and trays which are used in a wide variety of minor surgical and medical procedures, such as I.V. start kits and suture removal. This approach enables healthcare providers to track and manage the supply chain for products, supplies and instruments used in clinical settings.
In 2016, we have made certain changes to the leadership team, organizational structure, budgeting and financial reporting processes which drive changes to segment reporting. These changes align our operations into three distinct business units: Domestic, International and Clinical & Procedural Solutions (CPS). Domestic is our U.S. distribution, logistics and value-added services business, while International is our European distribution, logistics and value-added services business. CPS provides product-related solutions, including surgical and procedural kitting and sourcing. Furthermore, the basis for segment reporting shifts from the geography of the end customer to the business unit selling the product or providing the service. This includes intercompany transactions as well. Beginning with the first quarter of 2016, we report our financial results using this three segment structure and have recast prior year segment results on the same basis. Financial information by segment and geographic area appears in Note 20, “Segment Information,” of the Notes to Consolidated Financial Statements included in this annual report.
The Domestic Segment
Healthcare product volumes in the United States are dependent on the rates of utilization of medical/surgical procedures by consumers, which are subject to fluctuation according to the condition of the domestic economy and other factors such as changes in regulation affecting reimbursement. Aside from consumer-driven activity, the healthcare industry is also experiencing growing demand for advanced logistics and inventory management services from healthcare providers and manufacturers that are focused on achieving more efficient and cost-effective supply-chain operations.
In the United States, healthcare supply distributors contract with group purchasing organizations (GPOs) that negotiate distribution contracts on behalf of their healthcare provider members and also contract directly with healthcare providers and manufacturers for their services. Healthcare providers are increasingly consolidating into larger, more sophisticated networks that are actively seeking reductions in the total cost of delivering healthcare products. These healthcare providers face complex financial challenges, including managing the cost of purchasing, receiving, storing and tracking supplies.
3
Economic trends have also driven significant consolidation within the healthcare products distribution and logistics industry due to the competitive advantages enjoyed by larger organizations. Among these advantages are the ability to serve customers in widespread geographic locations, purchase inventory in large volume, develop more sophisticated technology platforms and decision-support systems and provide expertise to healthcare providers and manufacturers to help reduce supply chain costs.
We offer a comprehensive portfolio of products and services to healthcare providers and manufacturers in the United States. Our portfolio of medical and surgical supplies includes branded products purchased in large volume from manufacturers and our own proprietary private-label products, which are internally sourced through our sourcing capabilities abroad or through a select group of manufacturers. We store our products at our distribution centers and provide delivery of these products, along with related services, to healthcare providers around the nation.
Most supplies are delivered using a leased fleet and almost all of our delivery personnel are our teammates, ensuring a consistent level of performance and customer service. In situations where they are more cost-effective and timely, we use contract carriers and parcel delivery services. We customize product deliveries, whether the orders are “just-in-time,” “low-unit-of-measure,” pallets, or truckloads. We also customize delivery schedules according to customers’ needs to increase their efficiency in receiving and storing products. We have deployed low-unit-of-measure automated picking modules in our larger distribution centers to maximize efficiency, and our distribution center teammates use voice-pick technology to enhance speed and accuracy in performing certain warehousing processes.
We also offer additional services to healthcare providers including supplier management, analytics, inventory management, outsourced resource management, clinical supply management and business process consulting. These value-add services help providers improve their process for contracting with vendors, purchasing supplies and streamlining inventory. These services include our operating room-focused inventory management program that helps healthcare providers manage suture and endo-mechanical inventory, as well as our customizable surgical supply service that includes the kitting and delivery of surgical supplies in procedure-based totes to coincide with the healthcare providers' surgical schedule.
The majority of our distribution arrangements compensate us on a cost-plus percentage basis, under which a negotiated percentage mark-up is added to the contract cost of the product agreed to by the customer and the supplier. We price our services for certain other arrangements under activity-based pricing models. In these cases, pricing depends upon the type, level and/or complexity of services that we provide to customers, and in some cases we do not take title to the product (although we maintain certain custodial risks). As a result, this fee-for-service pricing model aligns the fees we charge with the cost of the services provided, which is a component of distribution, selling and administrative expenses, rather than with the cost of the product, which is a component of cost of goods sold.
We offer a variety of programs and services dedicated to providing logistics and marketing solutions to our manufacturer customers as well. These programs and services are designed to help manufacturers increase market share, drive sales growth, and achieve operational efficiencies. Manufacturer programs are generally negotiated on an annual basis and provide for enhanced levels of support that are aligned with the manufacturer’s annual objectives and growth goals. We have contractual arrangements with manufacturers participating in these programs that provide performance-based incentives to us, as well as cash discounts for prompt payment. Program incentives can be earned on a monthly, quarterly or annual basis.
All of our distribution and logistics services utilize a common infrastructure of distribution centers, equipment, technology, and delivery methods (internal fleet, common carrier or parcel services). We operate a network of 41 distribution centers located throughout the continental United States, which are strategically located to efficiently serve our provider and manufacturer customers. A significant investment in information technology supports our business including warehouse management systems, customer service and ordering functions, demand forecasting programs, electronic commerce, data warehousing, decision support and supply-chain management.
4
The International Segment
Our International segment includes our European distribution and logistics business. We provide contract logistics services to the pharmaceutical, biotechnology and medical device industries, offering a broad range of supply chain logistics services to manufacturers. Our warehousing and transportation offerings include storage, controlled-substance handling, cold-chain, emergency and export delivery, inventory management and pick & pack services. Our other services include order-to-cash, re-labeling, customer service and returns management.
Client logistics contracts in our International segment are generally for three-year terms with rolling automatic one- year extension periods. The tendering or competitive bidding process typically takes 12 to 18 months from the initial client request for proposal until becoming operational. We offer significant flexibility to tailor contracts to specific client requirements, and benefit from the expansion of clients into additional European countries. Pricing may be activity-based, with fees determined by clients’ particular requirements for warehousing, handling and delivery services, or it may be based on buy-sell wholesaler arrangements for product distribution.
Our International segment has a network of 20 logistics centers in 11 European countries, including Belgium, Czech Republic, Denmark, France, Germany, Netherlands, Poland, Slovakia, Spain, Switzerland and the United Kingdom. To serve our clients, we use a fleet of leased and owned trucks, including cold-chain delivery trucks. The majority of our drivers are our International teammates, although contract carriers and parcel services are used in situations where they are more cost-effective and timely.
Clinical & Procedural Solutions (CPS)
Our CPS segment provides product-related solutions, helping manufacturers and healthcare providers source, assemble and deliver procedure kits efficiently and effectively to the point-of-care. Our facilities in the U.S. and Ireland offer the combining of instruments and supplies into kits and trays which are assembled and delivered based on the specifications of U.S. based provider customers, as well as manufacturers and providers across Europe. These custom procedure trays (CPT) serve a wide number of surgical specialties, including robotics, orthopedics, cardiology, cath labs, gastric, laproscopic and labor and delivery. We also offer minor procedure kits, which give complete cost-saving solutions for the delivery of procedure-specific components, with more than 1,200 possible configurations assembled to meet the industry's most stringent standards. We operate two kitting facilities in the U.S and one in Ireland. For sterilized kits and trays, we utilize one or more third-party sterilization contractors.
Through our global sourcing services, based in Ireland with teams in Asia and the U.S., we work with a wide range of manufacturers around the world to offer an expanding portfolio of proprietary products and sourcing services for manufacturers and provider customers. Our full range of sourcing services include: manufacturing capacity management, container load optimization, customs compliance assurance and more. We offer our own proprietary brands of products across a wide spectrum of categories, including patient care, O.R. protection, and labor and delivery. By offering a single brand for thousands of regularly purchased items, we can increase efficiency and support product standardization initiatives.
Our CPS products are typically purchased pursuant to purchase orders or supply agreements in which the purchaser specifies whether such products are to be supplied through a distributor or directly. This segment may sell on an intercompany basis to our other segments when we are the designated distributor, to other third-party distributors or directly to healthcare providers and manufacturers.
5
Our Customers
We currently provide distribution, kitting, outsourced resource management and/or consulting services to thousands of healthcare provider customers. These customers include multi-facility networks of healthcare providers offering a broad spectrum of healthcare services to a particular market or markets (IDNs) as well as smaller, independent hospitals in the United States. In addition to contracting with healthcare providers at the IDN level and through GPOs, we also contract with other types of healthcare providers including surgery centers, physicians’ practices and smaller networks of hospitals that have joined together to negotiate terms. We have contracts to provide distribution services to the members of a number of national GPOs, including Vizient (formerly Novation, LLC and MedAssets Inc.), Premier, Inc. (Premier) and HealthTrust Purchasing Group (HPG). In 2016, we renewed the distribution agreements with two of these GPOs to continue our status as an authorized distributor for their member healthcare providers and allow us to compete with other authorized distributors for the business of individual members. Below is a summary of these agreements:
GPO | Year of Renewal | Term | Sales to Members as a % of Consolidated Net Revenue in 2016 | |||
Vizient | 2016 | 3 years | 48% | |||
Premier | 2016 | 5 years | 20% | |||
HPG | 2013 | 5 years | 14% | |||
We have our own independent relationships with most of our hospital customers through separate contractual commitments that may or may not be based upon the terms of our agreement with the GPO. As a result, the termination or expiration of an agreement with a particular GPO would not necessarily mean that we would lose the members of such GPO as our customers.
Our supplier and manufacturer customers represent the largest and most influential healthcare manufacturers in the industry. We have long-term relationships with these important companies in the healthcare supply chain and have long provided traditional distribution services to them. We currently have relationships with approximately 1,100 supplier and manufacturer customers. In the Domestic segment, sales of products supplied by Medtronic accounted for approximately 13% of our consolidated net revenue for 2016. Sales of products supplied by Becton Dickinson were approximately 9% of our consolidated net revenue for 2016. Sales of products supplied by Johnson & Johnson were approximately 9% of our consolidated net revenue for 2016.
In Europe, we serve a diverse customer base of approximately 500 manufacturer clients, including pharmaceutical, biotechnology and medical device manufacturers.
Asset Management
In the healthcare supply distribution industry, a significant investment in inventory and accounts receivable is required to meet the rapid delivery requirements of customers and provide high-quality service. As a result, efficient asset management is essential to our profitability. We continually work to refine our processes to optimize inventory and collect accounts receivable.
Inventory
We are focused in our efforts to optimize inventory and continually consolidate products and collaborate with supply-chain partners on inventory productivity initiatives. When we convert large-scale, multi-state IHN customers to our distribution network, an additional investment in inventory in advance of expected sales is generally required. We actively monitor inventory for obsolescence and use inventory turnover and other operational metrics to measure our performance in managing inventory.
6
Accounts Receivable
In the normal course of business, we provide credit to our U.S. and European customers and use credit management techniques to evaluate customers’ creditworthiness and facilitate collection. These techniques may include performing initial and ongoing credit evaluations of customers based primarily on financial information provided by them and from sources available to the general public. We also use third-party information from sources such as credit reporting agencies, banks and other credit references. We actively manage our accounts receivable to minimize credit risk, days sales outstanding (DSO) and accounts receivable carrying costs. Our ability to accurately invoice and ship product to customers enhances our collection results and drives our positive DSO performance. We also have arrangements with certain customers under which they make deposits on account, either because they do not meet our standards for creditworthiness or in order to obtain more favorable pricing.
Competition
The industries in which we operate are highly competitive in the United States and Europe. The U.S. sector includes Owens & Minor, Inc., as well as two major nationwide manufacturers who also provide distribution services, Cardinal Health, Inc. and privately-held Medline, Inc. In addition, we compete with a number of regional and local distributors and customer self-distribution models. Major logistics competitors serving healthcare manufacturers in the United States and in Europe include United Parcel Service, FedEx Corporation, Deutsche Post DHL and Alloga, as well as local competitors in specific countries.
Regulation
The medical/surgical supply distribution, healthcare logistics and healthcare services industries in the United States are subject to regulation by federal, state and local government agencies. Each of our distribution centers is licensed to distribute medical and surgical supplies, as well as certain pharmaceutical and related products, and each of our CPS kitting facilities is licensed to perform kit assembly operations. We must comply with laws and regulations, including those governing operations, storage, transportation, manufacturing, sales, safety and security standards for each of our distribution centers and kitting facilities, of the Food and Drug Administration, the Centers for Medicare and Medicaid Services, the Drug Enforcement Agency, the Department of Transportation, the Environmental Protection Agency, the Department of Homeland Security, the Occupational Safety and Health Administration, and state boards of pharmacy, or similar state licensing boards and regulatory agencies. We are also subject to various federal and state laws intended to protect the privacy of health or other personal information and to prevent healthcare fraud and abuse. We believe we are in material compliance with all statutes and regulations applicable to our operations.
Our operations outside the U.S. are subject to local, country and European-wide regulations, including those promulgated by the European Medicines Agency (EMA) and the Medical Devices Directive. In addition, quality requirements are imposed by healthcare industry manufacturers and pharmaceutical companies which audit our operations on a regular basis. Each of our logistics centers in Europe is licensed to distribute medicinal, medical and surgical supplies, as well as certain pharmaceutical and related products, according to the country-specific requirements. Our logistics centers in Europe are able to store ambient, cold-chain or deep frozen products, are licensed to distribute narcotic and other pharmaceutical products included in clinical trials and are licensed for secondary packaging activities for medicinal products. Movianto is also ISO 9001:2008 certified across the entire enterprise. Our Ireland-based CPS kitting facility is licensed to assemble kits and sell them in the markets we serve and operates in compliance with the requirements of ISO 9001:2008 and ISO/EU 13485:2012 standards. We believe we are in material compliance with all applicable statutes and regulations, as well as prevailing industry best practices, in the conduct of our European business operations.
Employees
At the end of 2016, we employed approximately 5,600 full- and part-time teammates in the U.S. and 2,300 outside of the U.S. Most of our teammates outside the U.S. are covered by collective bargaining agreements. We continue to have positive relationships with teammates and European works councils.
Available Information
We make our Forms 10-K, Forms 10-Q and Forms 8-K (and all amendments to these reports) available free of charge through the SEC Filings link in the Investor Relations content section on our website located at www.owens-minor.com as soon as reasonably practicable after they are filed with or furnished to the SEC. Information included on our website is not incorporated by reference into this Annual Report on Form 10-K.
7
You may read and copy any materials we file with the SEC at the SEC’s Public Reference Room at 100 F Street, NE, Washington, DC 20549. You may obtain information on the operation of the Public Reference Room by calling the SEC at 1-800-SEC-0330. The SEC also maintains an Internet site that contains reports, proxy and information statements, and other information regarding the company (http://www.sec.gov).
Additionally, we have adopted a written Code of Honor that applies to all of our directors, officers and teammates, including our principal executive officer and senior financial officers. This Code of Honor (including any amendments to or waivers of a provision thereof) and our Corporate Governance Guidelines are available on our website at www.owens-minor.com.
Item 1A. Risk Factors
Set forth below are certain risk factors that we currently believe could materially and adversely affect our business, financial condition and results of operations. These risk factors are in addition to those mentioned in other parts of this report and are not all of the risks that we face. We could also be affected by risks that we currently are not aware of or that we currently do not consider material to our business.
We face competition and accelerating pricing pressure.
The medical/surgical supply distribution industry in the United States is highly competitive and characterized by pricing pressure which accelerated in 2016 and put further margin pressure on our business. We expect this margin pressure to continue through 2017. We compete with other national distributors and a number of regional and local distributors, as well as customer self-distribution models and, to a lesser extent, certain third-party logistics companies. Competitive factors within the medical/surgical supply distribution industry include market pricing, total delivered product cost, product availability, the ability to fill and invoice orders accurately, delivery time, range of services provided, efficient product sourcing, inventory management, information technology, electronic commerce capabilities, and the ability to meet customer-specific requirements. Our success is dependent on the ability to compete on the above factors, while managing internal costs and expenses. These competitive pressures could have a material adverse effect on our results of operations.
In addition, in recent years, the healthcare industry in the United States has experienced and continues to experience significant consolidation in response to cost containment legislation and general market pressures to reduce costs. This consolidation of our customers and suppliers generally gives them greater bargaining power to reduce the pricing available to them, which may adversely impact our results of operations and financial condition.
The healthcare third-party logistics business in both the United States and Europe also is characterized by intense competition from a number of international, regional and local companies, including large conventional logistics companies and internet based non-traditional competitors that are moving into the healthcare and pharmaceutical distribution business. This competitive market places continuous pricing pressure on us from customers and manufacturers that could adversely affect our results of operations and financial condition if we are unable to continue to increase our revenues and to offset margin reductions caused by pricing pressures through cost control measures.
We have significant concentration in and dependence on Group Purchasing Organizations and certain healthcare provider customers.
In 2016, our top ten customers in the United States represented approximately 27% of our consolidated net revenue. In addition, in 2016, approximately 81% of our consolidated net revenue was from sales to member hospitals under contract with our largest group purchasing organizations (GPO): Vizient, Premier and HPG. We could lose a significant healthcare provider customer or GPO relationship if an existing contract expires without being replaced or is terminated by the customer or GPO prior to its expiration. For example, in April 2016, we announced the loss of our largest IDN customer which had accounted for approximately $525 million of revenue in 2015. Although the termination of our relationship with a given GPO would not necessarily result in the loss of all of the member hospitals as customers, any such termination of a GPO relationship, or a significant individual healthcare provider customer relationship, could have a material adverse effect on our results of operations and financial condition.
Our operating earnings are partially dependent on certain significant domestic suppliers.
In the United States, we distribute products from nearly 1,100 suppliers and are dependent on these suppliers for the continuing supply of products. In 2016, sales of products of our ten largest domestic suppliers accounted for approximately 56% of consolidated net revenue. In the Domestic segment, sales of products supplied by Medtronic, Becton Dickinson and Johnson & Johnson accounted for approximately 13%, 9% and 9% of our consolidated net revenue for 2016, respectively. We
8
rely on suppliers to provide agreeable purchasing and delivery terms and performance incentives. Our ability to sustain adequate operating earnings has been, and will continue to be, partially dependent upon our ability to obtain favorable terms and incentives from suppliers, as well as suppliers continuing use of third-party distributors to sell and deliver their products. A change in terms by a significant supplier, or the decision of such a supplier to distribute its products directly to healthcare providers rather than through third-party distributors, could have a material adverse effect on our results of operations and financial condition.
Our inability to adequately integrate acquisitions could have a material adverse effect on our operations.
In connection with our growth strategy, we from time to time acquire other businesses that we believe will expand or complement our existing businesses and operations. The integration of acquisitions involves a number of significant risks, which may include but are not limited to, the following:
• | Expenses and difficulties in the transition and integration of operations and systems; |
• | Retention of current customers and the ability to obtain new customers; |
• | The assimilation and retention of personnel, including management personnel, in the acquired businesses; |
• | Accounting, tax, regulatory and compliance issues that could arise; |
• | Difficulties in implementing uniform controls, procedures and policies in our acquired companies, or in remediating control deficiencies in acquired companies not formerly subject to the Sarbanes-Oxley Act of 2002; |
• | Unanticipated expenses incurred or charges to earnings based on unknown circumstances or liabilities; |
• | Failure to realize the synergies and other benefits we expect from the acquisition at the pace we anticipate; |
• | General economic conditions in the markets in which the acquired businesses operate; and |
• | Difficulties encountered in conducting business in markets where we have limited experience and expertise. |
If we are unable to successfully complete and integrate our strategic acquisitions in a timely manner, our business, growth strategies and results of operations could be adversely affected.
Our global operations increase the extent of our exposure to the economic, political, currency and other risks of international operations.
Our global operations involve issues and risks, including but not limited to the following, any of which could have an adverse effect on our business and results of operations:
• | Lack of familiarity with and expertise in conducting business in foreign markets; |
• | Foreign currency fluctuations and exchange risk; |
• | Unexpected changes in foreign regulations or conditions relating to labor, economic or political environment, and social norms or requirements; |
• | Adverse tax consequences and difficulties in repatriating cash generated or held abroad; |
• | Local economic environments, such as in the European markets served by Movianto and ArcRoyal, including recession, inflation, indebtedness, currency volatility and competition; and |
• | Changes in trade protection laws and other laws affecting trade and investment, including import/export regulations in both the United States and foreign countries. |
Our operations are also subject to risks of violation of laws that prohibit improper payments to and bribery of government officials and other individuals and organizations. These laws include the U.S. Foreign Corrupt Practices Act, the U.K. Bribery Act and other similar laws and regulations in foreign jurisdictions, any violation of which could result in substantial liability and a loss of reputation in the marketplace. Failure to comply with these laws also could subject us to civil and criminal penalties that could adversely affect our business and results of operations.
Changing conditions in the United States healthcare industry may impact our results of operations.
We, along with our customers and suppliers, are subject to extensive federal and state regulations relating to healthcare as well as the policies and practices of the private healthcare insurance industry. In recent years, there have been a number of government and private initiatives to reduce healthcare costs and government spending. These changes have included an increased reliance on managed care; reductions in Medicare and Medicaid reimbursement levels; consolidation of competitors, suppliers and customers; a shift in healthcare provider venues from acute care settings to clinics, physician offices and home care; and the development of larger, more sophisticated purchasing groups. All of these changes place additional financial pressure on healthcare provider customers, who in turn seek to reduce the costs and pricing of products and services provided by us. We expect the healthcare industry to continue to change significantly and these potential changes, which may include a reduction in government support of healthcare services, adverse changes in legislation or regulations, and further reductions in
9
healthcare reimbursement practices, could have a material adverse effect on our business, results of operations and financial condition.
We are subject to stringent regulatory and licensing requirements.
We must comply with numerous laws and regulations in the United States, Europe, Asia and other countries where we operate. We also are required to hold permits and licenses and to comply with the operational and security standards of various governmental bodies and agencies. Any failure to comply with these laws and regulations or any failure to maintain the necessary permits, licenses or approvals, or to comply with the required standards, could disrupt our operations and/or adversely affect our results of operations and financial condition. In addition, we are subject to various federal and state laws intended to prevent healthcare fraud and abuse. The requirements of these fraud and abuse laws are complicated and subject to interpretation and may be applied by a regulator, prosecutor or judge in a manner that could have a material adverse effect on our business, results of operations and financial condition.
Additionally, our business relies on the secure transmission and storage of sensitive information relating to our customers, company and workforce, and, in certain instances, patient-identifiable health information. We are subject to state, federal and foreign laws that regulate the confidentiality of such information, how that information may be used, and the circumstances under which such information may be released. Regulations currently in place, including regulations governing electronic health data transmissions, continue to evolve and are often unclear and difficult to apply. Our failure to maintain the confidentiality of information in accordance with applicable regulatory requirements could expose us to claims, damages, fines and penalties and/or costs for remediation and, as a result, have a material adverse effect on our business and financial condition.
Products we source, assemble and sell may be subject to recalls and product liability claims.
Certain of the products that we sell and distribute are sourced and sold under one or more private labels or are assembled by us into custom trays and minor procedure kits. If these products do not function as designed, are inappropriately designed or are not properly produced, we may have to withdraw such products from the market and/or be subject to product liability claims. Although we maintain insurance against product liability and defense costs in amounts believed to be reasonable, there is no assurance that we can successfully defend any such claims or that the insurance we carry will be sufficient. A successful claim against us in excess of insurance coverage could have a material adverse impact on our business, financial condition and results of operations.
General economic conditions may adversely affect demand for our products and services.
Poor or deteriorating economic conditions in the United States and the other countries in which we conduct business could adversely affect the demand for healthcare services and consequently, the demand for our products and services. Poor economic conditions also could lead our suppliers to offer less favorable terms of purchase to distributors, which would negatively affect our profitability. These and other possible consequences of financial and economic decline could have a material adverse effect on our business, results of operations and financial condition.
Our results of operations may suffer upon the bankruptcy, insolvency, or other credit failure of a customer that has a substantial amount owed to us.
We provide credit in the normal course of business to customers. We perform initial and ongoing credit evaluations of customers and maintain reserves for credit losses. The bankruptcy, insolvency or other credit failure of one or more customers with substantial balances due to us could have a material adverse effect on our results of operations and financial condition.
Our operations depend on the proper functioning of information systems, and our business could be adversely affected if we experience a cyber-attack or other systems breach.
We rely on information systems to receive, process, analyze and manage data in distributing thousands of inventory items to customers from numerous distribution and logistics centers. These systems are also relied upon for billings to and collections from customers, as well as the purchase of and payment for inventory and related transactions from our suppliers. In addition, the success of our long-term growth strategy is dependent upon the ability to continually monitor and upgrade our information systems to provide better service to customers. Our business and results of operations may be materially adversely affected if systems are interrupted or damaged by unforeseen events (including cyber-attacks) or fail to operate for an extended period of time, or if we fail to appropriately enhance our systems to support growth and strategic initiatives.
Our distribution and logistics services include acting as the primary billing, order-to-cash and collections function for many of our customers. These services rely on the performance and uptime of our information systems. If our information
10
systems are interrupted, damaged or fail to operate, our customers could be negatively impacted which could have a material adverse effect on our results of operations.
We could be subject to adverse changes in the tax laws or challenges to our tax positions.
We operate throughout the United States and Europe as well as in China. As a result, we are subject to the tax laws and regulations of the United States federal, state and local governments and of various foreign jurisdictions. From time to time, legislative and regulatory initiatives are proposed, including but not limited to proposals to repeal LIFO (last-in, first-out) treatment of domestic inventory or changes in tax accounting methods for inventory, import tarriffs and taxes, or other tax items, that could adversely affect our tax positions, tax rate or cash payments for taxes.
Our business and operations depend on the proper functioning of critical facilities and distribution networks.
Damage or disruption to our distribution capabilities due to weather, natural disaster, fire, terrorism, pandemic, strikes, the financial and/or operational instability of key suppliers, geo-political events or other reasons could impair our ability to distribute our products and conduct our business. To the extent that we are unable, or it is not financially feasible, to mitigate the likelihood or potential impact of such events, or to manage effectively such events if they occur, there could be a material adverse effect on our business, financial condition or results of operations.
We operate within the European Union, including in the United Kingdom and therefore may be affected by United Kingdom's withdrawal from the European Union.
We operate within the European Union (the “E.U.”), including the United Kingdom (the “U.K.”). On June 23, 2016, the U.K. held a referendum in which voters approved an exit from the E.U., commonly referred to as “Brexit”. As a result of the referendum, it is expected that the British government will begin negotiating the terms of the U.K.’s withdrawal from the E.U. A withdrawal could, among other outcomes, disrupt the free movement of goods, services and people between the U.K. and the E.U., and disrupt trade between the U.K. and the E.U. Given the lack of comparable precedent and recent occurrence of these events, we are monitoring the situation but it is unclear what financial, trade and legal implications the withdrawal of the U.K. from the E.U. would have and how such withdrawal may affect our operations or financial performance.
Item 1B. Unresolved Staff Comments
None.
Item 2. Properties
Our Domestic segment operated 41 distribution centers as well as office and warehouse space across the United States as of December 31, 2016. We leased all of the centers from unaffiliated third parties with the exception of one location which we own. We also leased small offices for sales and consulting personnel across the United States. In addition, we leased space on a temporary basis from time to time to meet our inventory storage needs.
At December 31, 2016, our International segment properties spanned 11 European countries and included 20 logistics centers (18 leased and two owned) and seven transport depots, of which we leased six and owned one. We also leased office space in the United Kingdom and Ireland.
At December 31, 2016, our CPS segment operated two kitting facilities in the United States (one leased and one owned) and one in Europe. We also leased offices in China, Malaysia and Ireland.
We own our corporate headquarters building, and adjacent acreage, in Mechanicsville, Virginia, a suburb of Richmond, Virginia.
We regularly assess our business needs and make changes to the capacity and location of distribution and logistics centers. We believe that our facilities are adequate to carry on our business as currently conducted. A number of leases are scheduled to terminate within the next several years. We believe that, if necessary, we could find facilities to replace these leased premises without suffering a material adverse effect on our business.
Item 3. Legal Proceedings
We are subject to various legal actions that are ordinary and incidental to our business, including contract disputes, employment, workers’ compensation, product liability, regulatory and other matters. We establish reserves from time to time based upon periodic assessment of the potential outcomes of pending matters. In addition, we believe that any potential liability arising from employment, product liability, workers’ compensation and other personal injury litigation matters would be adequately covered by our insurance coverage, subject to policy limits, applicable deductibles and insurer solvency. While the outcome of legal actions cannot be predicted with certainty, we believe, based on current knowledge and the advice of counsel, that the outcome of these currently pending matters, individually or in the aggregate, will not have a material adverse effect on our financial condition or results of operations.
Part II
11
Item 4. Mine Safety Disclosures
Not applicable.
Item 5. Market for Registrant’s Common Equity, Related Stockholder Matters, and Issuer Purchases of Equity Securities
Owens & Minor, Inc.’s common stock trades on the New York Stock Exchange under the symbol OMI. As of February 13, 2017, there were approximately 3,180 common shareholders of record. We believe there are an estimated additional 41,075 beneficial holders of our common stock. See Selected Quarterly Financial Information in Item 15 of this report for high and low closing sales prices of our common stock and quarterly cash dividends per common share and Item 7, Management’s Discussion and Analysis of Financial Condition and Results of Operations, for a discussion of our dividend payments.
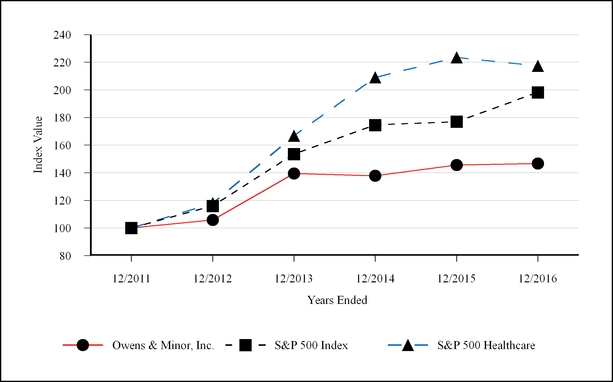
5-Year Total Shareholder Return
The following performance graph compares the performance of our common stock to the Standard & Poor's Composite- 500 Index (S&P 500 Index) and the Standard & Poor's Composite-500 Healthcare Index (S&P 500 Healthcare Index), an independently prepared index that includes more than 50 companies in the healthcare industry. This graph assumes that the value of the investment in the common stock and each index was $100 on December 31, 2011, and that all dividends were reinvested.
Base Period | Years Ended | ||||||||||||||||||||||
Company Name / Index | 12/2011 | 12/2012 | 12/2013 | 12/2014 | 12/2015 | 12/2016 | |||||||||||||||||
Owens & Minor, Inc. | $ | 100.00 | $ | 105.8 | $ | 139.5 | $ | 137.9 | $ | 145.5 | $ | 146.8 | |||||||||||
S&P 500 Index | 100.00 | 116.0 | 153.6 | 174.6 | 177.0 | 198.2 | |||||||||||||||||
S&P 500 Healthcare | 100.00 | 117.9 | 166.8 | 209.0 | 223.4 | 217.4 | |||||||||||||||||
12
Share Repurchase Program. In February 2014, our Board of Directors authorized a share repurchase program of up to $100 million of our outstanding common stock to be executed at the discretion of management over a three-year period, expiring in February 2017. The program was intended to offset shares issued in conjunction with our stock incentive plan and return capital to shareholders. The authorized repurchases under this program were completed in December 2016.
In October 2016, our Board of Directors authorized a new share repurchase program of up to $100 million of the company’s outstanding common stock to be executed at the discretion of management over a three-year period. The new authorization took effect in December 2016 upon the completion of the previous authorization. The timing of repurchases and the exact number of shares of common stock to be purchased will depend upon market conditions and other factors and may be suspended or discontinued at any time. Purchases under the share repurchase program are made either pursuant to 10b5-1 plans entered into by the company from time to time and/or during the company’s scheduled quarterly trading windows for officers and directors.
During the year ended December 31, 2016, we repurchased in open-market transactions and retired approximately 2.0 million shares at an average price per share of $34.72.
The following table summarizes share repurchase activity by month during the fourth quarter of 2016.
Period | Total number of shares purchased | Average price paid per share | Total number of shares purchased as part of a publicly announced programs | Maximum dollar value of shares that may yet be purchased under the programs | |||||||||
October | 189,720 | $ | 33.68 | 189,720 | $ | 14,956,747 | |||||||
November | 351,156 | $ | 33.08 | 351,156 | $ | 3,340,746 | |||||||
December | 126,389 | $ | 34.57 | 126,389 | $ | 98,971,148 | |||||||
Total | 667,265 | 667,265 | |||||||||||
13
Item 6. Selected Consolidated Financial Data
(in thousands, except ratios and per share data)
At or for the years ended December 31, | ||||||||||||||||||||
2016 (1) | 2015 (2) | 2014 (3) | 2013 (4) | 2012 (5) | ||||||||||||||||
Summary of Operations: | ||||||||||||||||||||
Net revenue | $ | 9,723,431 | $ | 9,772,946 | $ | 9,440,182 | $ | 9,071,532 | $ | 8,868,324 | ||||||||||
Net income | $ | 108,787 | $ | 103,409 | $ | 66,503 | $ | 110,882 | $ | 109,003 | ||||||||||
Per Common Share: | ||||||||||||||||||||
Net income per share—basic | $ | 1.76 | $ | 1.65 | $ | 1.06 | $ | 1.76 | $ | 1.72 | ||||||||||
Net income per share—diluted | $ | 1.76 | $ | 1.65 | $ | 1.06 | $ | 1.76 | $ | 1.72 | ||||||||||
Cash dividends | $ | 1.02 | $ | 1.01 | $ | 1.00 | $ | 0.96 | $ | 0.88 | ||||||||||
Stock price at year end | $ | 35.29 | $ | 35.98 | $ | 35.11 | $ | 36.56 | $ | 28.51 | ||||||||||
Summary of Financial Position: | ||||||||||||||||||||
Total assets | $ | 2,717,752 | $ | 2,773,776 | $ | 2,729,963 | $ | 2,322,134 | $ | 2,213,764 | ||||||||||
Cash and cash equivalents | $ | 185,488 | $ | 161,020 | $ | 56,772 | $ | 101,905 | $ | 97,888 | ||||||||||
Total debt | $ | 569,387 | $ | 573,522 | $ | 609,173 | $ | 215,831 | $ | 216,995 | ||||||||||
Total Owens & Minor, Inc. shareholders’ equity | $ | 960,038 | $ | 992,590 | $ | 990,838 | $ | 1,023,913 | $ | 972,526 | ||||||||||
Selected Ratios: | ||||||||||||||||||||
Gross margin as a percent of revenue | 12.21 | % | 12.43 | % | 12.39 | % | 12.31 | % | 10.43 | % | ||||||||||
Distribution, selling and administrative expenses as a percent of revenue | 9.98 | % | 10.17 | % | 10.42 | % | 10.08 | % | 8.14 | % | ||||||||||
Operating earnings as a percent of revenue | 2.05 | % | 2.05 | % | 1.69 | % | 2.18 | % | 2.22 | % | ||||||||||
Days sales outstanding (DSO) (6) | 23.1 | 21.0 | 22.1 | 22.1 | 20.8 | |||||||||||||||
Average annual inventory turnover (7) | 9.2 | 9.4 | 10.1 | 10.4 | 10.1 | |||||||||||||||
____________________________
(1) We incurred charges of $24.7 million ($17.8 million after tax, or $0.29 per diluted common share) associated with acquisition-related and exit and realignment activities in 2016. See Notes 3 and 9 of Notes to Consolidated Financial Statements.
(2) We incurred charges of $28.4 million ($23.4 million after tax, or $0.37 per diluted common share) associated with acquisition-related and exit and realignment activities in 2015. We also recognized a gain of $1.5 million ($1.5 million after tax, or $0.02 per diluted common share) associated with the partial recovery of a 2014 contract claim settlement. See Notes 3 and 9 of Notes to Consolidated Financial Statements.
(3) We incurred charges of $42.8 million ($35.3 million after tax, or $0.56 per common share) associated with acquisition-related and exit and realignment activities in 2014, a loss on estimated contract claim settlement of $3.9 million ($3.9 million after tax, or $0.06 per common share), a net gain of $3.7 million ($4.7 million after tax, or $0.07 per common share) associated with fair value adjustments related to purchase accounting, and a loss on early retirement of debt of $14.9 million ($9.1 million after tax or $0.14 per common share). See Notes 3 and 9 of Notes to Consolidated Financial Statements.
(4) We incurred charges of $12.4 million ($8.9 million after tax, or $0.14 per common share) associated with acquisition-related and exit and realignment activities in 2013. See Notes 3 and 9 of Notes to Consolidated Financial Statements.
(5) We incurred charges of $10.2 million ($8.2 million after tax, or $0.13 per common share) associated with acquisition-related and exit and realignment activities in 2012. See Notes 3 and 9 of Notes to Consolidated Financial Statements.
(6) Based on year end accounts receivable and net revenue for the fourth quarter of the year.
(7) Based on average annual inventory and cost of goods sold for the respective year.
14
Item 7. Management’s Discussion and Analysis of Financial Condition and Results of Operations
Management’s discussion and analysis of financial condition and results of operations is intended to assist the reader in the understanding and assessment of significant changes and trends related to the results of operations of the Company together with its subsidiaries. The discussion and analysis presented below refers to, and should be read in conjunction with, the consolidated financial statements and accompanying notes included in Item 8 of Part II of this Annual Report on Form 10-K.
Overview
Owens & Minor, Inc., along with its subsidiaries, (we, us, or our) is a leading global healthcare services company. In 2016, we have made certain changes to the leadership team, organizational structure, budgeting and financial reporting processes which drive changes to segment reporting. These changes align our operations into three distinct business units: Domestic, International and Clinical & Procedural Solutions (CPS). Domestic is our U.S. distribution, logistics and value-added services business, while International is our European distribution, logistics and value-added services business. CPS provides product-related solutions, including surgical and procedural kitting and sourcing. Furthermore, the basis for segment reporting shifts from the geography of the end customer to the business unit selling the product or providing the service. This includes intercompany transactions as well. Beginning with the first quarter of 2016, we report our financial results using this three segment structure and have recast prior year segment results on the same basis. Segment financial information is provided in Note 20 of Notes to Consolidated Financial Statements included in this annual report.
Financial Highlights.
The following table provides a reconciliation of reported operating earnings, net income and diluted net income per common share to non-GAAP measures used by management:
For the years ended December 31, | |||||||||||
(Dollars in thousands, except per share data) | 2016 | 2015 | 2014 | ||||||||
Operating earnings, as reported (GAAP) | $ | 199,599 | $ | 200,359 | $ | 159,536 | |||||
Acquisition-related and exit and realignment charges (1) | 24,675 | 28,404 | 42,801 | ||||||||
Fair value adjustments related to purchase accounting (2) | — | — | (3,706 | ) | |||||||
Other (3) | — | (1,500 | ) | 3,907 | |||||||
Operating earnings, adjusted (non-GAAP) (Adjusted Operated Earnings) | $ | 224,274 | $ | 227,263 | $ | 202,538 | |||||
Operating Earnings as a percent of revenue (GAAP) | 2.05 | % | 2.05 | % | 1.69 | % | |||||
Adjusted Operating Earnings as a percent of revenue (non-GAAP) | 2.31 | % | 2.33 | % | 2.15 | % | |||||
Net income as reported (GAAP) | $ | 108,787 | $ | 103,409 | $ | 66,503 | |||||
Acquisition-related and exit and realignment charges, (1) | 24,675 | 28,404 | 42,801 | ||||||||
Income tax expense (benefit) (5) | (6,835 | ) | (5,003 | ) | (7,499 | ) | |||||
Fair value adjustments related to purchase accounting (2) | — | — | (3,706 | ) | |||||||
Income tax expense (benefit) (5) | — | — | (997 | ) | |||||||
Other (3) | — | (1,500 | ) | 3,907 | |||||||
Income tax expense (benefit) (5) | — | — | — | ||||||||
Loss on early retirement of debt (4) | — | — | 14,890 | ||||||||
Income tax expense (benefit) (5) | — | — | (5,798 | ) | |||||||
Net income, adjusted (non-GAAP) (Adjusted Net Income) | $ | 126,627 | $ | 125,310 | $ | 110,101 | |||||
Net income per diluted common share, as reported (GAAP) | $ | 1.76 | $ | 1.65 | $ | 1.06 | |||||
Acquisition-related and exit and realignment charges (1) | 0.29 | 0.37 | 0.56 | ||||||||
Fair value adjustments related to purchase accounting (2) | — | — | (0.07 | ) | |||||||
Other (3) | — | (0.02 | ) | 0.06 | |||||||
Loss on early retirement of debt (4) | — | — | 0.14 | ||||||||
Net income per diluted common share, adjusted (non-GAAP) (Adjusted EPS) | $ | 2.05 | $ | 2.00 | $ | 1.76 | |||||
15
Net income per diluted share was $1.76 for the year ended December 31, 2016, an improvement of $0.11 compared to 2015. Adjusted EPS (non-GAAP) was $2.05 for the year ended December 31, 2016, an improvement of $0.05 over the prior year. Domestic segment operating earnings were $165.5 million for 2016, compared to $162.9 million for 2015. Results for the year reflected a continued focus on expense control initiatives, offset by the previously announced exit of a large customer and lower income from manufacturer product price changes compared to prior year. We expect revenue and gross margin to continue to be negatively affected by this customer exit as well as other competitive dynamics. The International segment operating earnings were $5.6 million, an improvement of $2.4 million compared to prior year. The increase was a result of improved operational efficiency. CPS operating earnings of $53.8 million in 2016 declined compared to prior year by $8.1 million as a result of lower revenues compared to prior year and production challenges in capacity and workforce availability which may continue into 2017.
Use of Non-GAAP Measures
Adjusted operating earnings, adjusted net income and adjusted EPS are an alternative view of performance used by management, and we believe that investors' understanding of our performance is enhanced by disclosing these performance measures. In general, the measures exclude items and charges that (i) management does not believe reflect our core business and relate more to strategic, multi-year corporate activities; or (ii) relate to activities or actions that may have occurred over multiple or in prior periods without predictable trends. Management uses these non-GAAP financial measures internally to evaluate our performance, evaluate the balance sheet, engage in financial and operational planning and determine incentive compensation.
Management provides these non-GAAP financial measures to investors as supplemental metrics to assist readers in assessing the effects of items and events on our financial and operating results and in comparing our performance to that of our competitors. However, the non-GAAP financial measures used by us may be calculated differently from, and therefore may not be comparable to, similarly titled measures used by other companies.
The non-GAAP financial measures disclosed by us should not be considered a substitute for, or superior to, financial measures calculated in accordance with GAAP, and the financial results calculated in accordance with GAAP and reconciliations to those financial statements set forth above should be carefully evaluated.
The following items have been excluded in our non-GAAP financial measures:
(1) Acquisition-related charges, pre-tax, were $1.2 million in 2016, $9.8 million in 2015 and $16.1 million in 2014. The current year amount related primarily to costs incurred to settle certain obligations and address other on-going matters associated with the acquisitions of ArcRoyal and Medical Action which were partially offset on a year-to-date basis by the first quarter gain on the sale of property acquired with Medical Action. Charges in 2015 consisted primarily of costs to continue the integration of Medical Action and ArcRoyal which were acquired in the fourth quarter of 2014 including certain severance and contractual payments to the former owner and costs to transition information technology and other administrative functions. Charges in 2014 consisted primarily of transaction costs incurred to perform due diligence and analysis related to these acquisitions, as well as costs to resolve certain contingencies with the former Movianto owner.
Exit and realignment charges (income), pre-tax, were $23.5 million in 2016, $18.6 million in 2015 and $26.7 million in 2014. Charges in 2016 were associated with severance activities (including our voluntary employee separation program in the first quarter of 2016), and other costs associated with our strategic organizational realignment which include information technology asset write-offs, certain professional fees and costs to streamline administrative functions and processes in the United States and Europe. Similar charges in 2015 and 2014 also included the consolidation of distribution and logistics centers and closure of offsite warehouses in the United States and Europe. Further information regarding these items is included in Note 9 of Notes to Consolidated Financial Statements. We expect to incur additional charges in 2017 as we continue to reposition the company.
(2) The fourth quarter of 2014 included a gain of $6.7 million (pretax) recorded in other operating income, net from a fair value adjustment to contingent consideration related to the 2012 Movianto acquisition purchase price, offset by the incremental charge to cost of goods sold of $3.0 million (pretax) from purchase accounting impacts related to the sale of acquired inventory that was written up to fair value in connection with the 2014 acquisitions.
(3) The fourth quarter of 2015 included an insurance recovery of $1.5 million related to a contract settlement in the United Kingdom for which $3.9 million was expensed in 2014. Both the 2015 recovery and the 2014 settlement expense were recorded in other operating income, net.
(4) In 2014, we repaid our 2016 Notes and recorded a net loss on the early retirement of $14.9 million (pretax), which includes the redemption premium offset by the recognition of a gain on previously settled interest rate swaps.
16
(5) These charges have been tax effected in the preceding table by determining the income tax rate depending on the amount of charges incurred in different tax jurisdictions and the deductibility of those charges for income tax purposes.
More information about these charges is provided in Notes 3, 9 and 10 of Notes to Consolidated Financial Statements included in this annual report.
Results of Operations
2016 compared to 2015
Net revenue. | For the years ended December 31, | Change | ||||||||||||
(Dollars in thousands) | 2016 | 2015 | $ | % | ||||||||||
Domestic | $ | 9,191,574 | $ | 9,176,855 | $ | 14,719 | 0.2 | % | ||||||
International | 343,674 | 372,638 | (28,964 | ) | (7.8 | )% | ||||||||
CPS | 539,580 | 561,812 | (22,232 | ) | (4.0 | )% | ||||||||
Inter-segment | (351,397 | ) | (338,359 | ) | (13,038 | ) | 3.9 | % | ||||||
Net revenue | $ | 9,723,431 | $ | 9,772,946 | $ | (49,515 | ) | (0.5 | )% | |||||
Consolidated net revenue declined in 2016 primarily as a result of the previously announced exit of a large domestic customer and unfavorable foreign exchange impacts. We expect revenue for 2017 to be negatively impacted by this customer exit as well. In the Domestic segment, growth with our other large healthcare provider customers contributed to the year over year change. In the International segment, excluding the impact of a U.K.-based customer exit in 2015 and the negative impact of foreign exchange, revenues increased 0.8% compared to last year. The decline in CPS revenue is largely attributed to a short-term customer contract in late 2015 which did not recur in the current year and production challenges in capacity and workforce availability which may continue into 2017.
Cost of goods sold. | For the years ended December 31, | Change | ||||||||||||
(Dollars in thousands) | 2016 | 2015 | $ | % | ||||||||||
Cost of goods sold | $ | 8,536,121 | $ | 8,558,373 | $ | (22,252 | ) | (0.3 | )% | |||||
Cost of goods sold includes the cost of the product (net of supplier incentives and cash discounts) and all costs incurred for shipments of products from manufacturers to our distribution centers for all customer arrangements where we are the primary obligor, bear risk of general and physical inventory loss and carry all credit risk associated with sales. These are sometimes referred to as distribution or buy/sell contracts. Cost of goods sold also includes direct and certain indirect labor, material and overhead costs associated with our CPS business. There is no cost of goods sold associated with our fee-for-service arrangements. As a result of the factors discussed above which affected sales activity, cost of goods sold decreased from prior year by $22.3 million.
Gross margin. | For the years ended December 31, | Change | ||||||||||||
(Dollars in thousands) | 2016 | 2015 | $ | % | ||||||||||
Gross margin | $ | 1,187,310 | $ | 1,214,573 | $ | (27,263 | ) | (2.2 | )% | |||||
As a % of net revenue | 12.21 | % | 12.43 | % | ||||||||||
The decrease in gross margin compared to the prior year was largely attributable to lower income from manufacturer product price changes, the previously announced exit of a large domestic customer in September 2016 and the unfavorable impact of foreign currency translation of $11.9 million. The exit of a U.K.-based customer in July 2015 also negatively affected the year-to-date comparison. With increasing customer cost pressures and competitive dynamics in healthcare, we believe the current trend of increased gross margin pressure will continue.
We value Domestic segment inventory under the LIFO method. Had inventory been valued under the first-in, first-out (FIFO) method, gross margin as a percentage of net revenue would have been 1 basis point lower in 2016 and the same in 2015.
17
Operating expenses. | For the years ended December 31, | Change | ||||||||||||
(Dollars in thousands) | 2016 | 2015 | $ | % | ||||||||||
Distribution, selling & administrative expenses | $ | 970,424 | $ | 993,783 | $ | (23,359 | ) | (2.4 | )% | |||||
As a % of net revenue | 9.98 | % | 10.17 | % | ||||||||||
Other operating income, net | $ | (7,388 | ) | $ | (7,973 | ) | $ | 585 | (7.3 | )% | ||||
Distribution, selling and administrative (DS&A) expenses include labor and warehousing costs associated with our distribution and logistics services and all costs associated with our fee-for-service arrangements. Shipping and handling costs are included in DS&A expenses and include costs to store, move, and prepare products for shipment, as well as costs to deliver products to customers. The costs to convert new customers to our information systems are included in DS&A and are generally incurred prior to the recognition of revenues from the new customers. Depreciation and amortization, previously reported as a separate financial statement line item in the consolidated statements of income is now included in distribution, selling and administrative expenses for all periods presented.
The decrease in DS&A expenses compared to prior year reflected the decreased sales activity in the year, benefits of cost control initiatives, lower fuel costs and improved operational efficiency as well as favorable foreign currency translation impacts of $12.3 million.
The decrease in other operating income, net was attributed primarily to foreign currency transactional losses in 2016.
A discussion of the acquisition-related and exit and realignment charges is included above in the Overview section.
Interest expense, net. | For the years ended December 31, | Change | ||||||||||||
(Dollars in thousands) | 2016 | 2015 | $ | % | ||||||||||
Interest expense, net | $ | 27,057 | $ | 27,149 | $ | (92 | ) | (0.3 | )% | |||||
Effective interest rate | 4.93 | % | 4.78 | % | ||||||||||
Interest expense was consistent with prior year.
Income taxes. | For the years ended December 31, | Change | ||||||||||||
(Dollars in thousands) | 2016 | 2015 | $ | % | ||||||||||
Income tax provision | $ | 63,755 | $ | 69,801 | $ | (6,046 | ) | (8.7 | )% | |||||
Effective tax rate | 37.0 | % | 40.3 | % | ||||||||||
The change in the effective tax rate compared to 2015 resulted from a higher percentage of the company's pretax income earned in lower tax rate jurisdictions compared to prior year and the non-deductibility of certain prior year acquisition-related charges for income tax purposes.
2015 compared to 2014
Net revenue. | For the years ended December 31, | Change | ||||||||||||
(Dollars in thousands) | 2015 | 2014 | $ | % | ||||||||||
Domestic | $ | 9,176,855 | $ | 8,910,733 | $ | 266,122 | 3.0 | % | ||||||
International | 372,638 | 481,402 | (108,764 | ) | (22.6 | )% | ||||||||
CPS | 561,812 | 294,358 | 267,454 | 90.9 | % | |||||||||
Inter-segment | (338,359 | ) | (246,311 | ) | (92,048 | ) | 37.4 | % | ||||||
Net revenue | $ | 9,772,946 | $ | 9,440,182 | $ | 332,764 | 3.5 | % | ||||||
18
Consolidated net revenue improved in the year ended December 31, 2015 largely as a result of growth in our Domestic segment. The continued trend of growth in our existing large healthcare provider customer accounts and new business exceeded declines from smaller customers and lost business when compared to prior year. Domestic segment growth rates are impacted by ongoing market trends including healthcare utilization rates. CPS revenues in 2015 benefitted from a full year of activity from the fourth quarter 2014 acquisitions of Medical Action and ArcRoyal. The decrease in the International segment was largely driven by unfavorable foreign currency translation impacts of $52.5 million in 2015. On a constant currency basis, excluding the late 2014 transition of a customer from a buy/sell to a fee-for-service arrangement, International segment revenues declined approximately 3.5% for the year ended December 31, 2015, compared to prior year. This decline was largely a result of the previously announced exit from a U.K. customer contract, as well as other lost business.
Cost of goods sold. | For the years ended December 31, | Change | ||||||||||||
(Dollars in thousands) | 2015 | 2014 | $ | % | ||||||||||
Cost of goods sold | $ | 8,558,373 | $ | 8,270,216 | $ | 288,157 | 3.5 | % | ||||||
Cost of goods sold includes the cost of the product (net of supplier incentives and cash discounts) and all costs incurred for shipments of products from manufacturers to our distribution centers for all customer arrangements where we are the primary obligor, bear risk of general and physical inventory loss and carry all credit risk associated with sales. These are sometimes referred to as distribution or buy/sell contracts. Beginning in the fourth quarter of 2014, cost of goods sold also includes direct and certain indirect labor, material and overhead costs associated with our CPS operations. There is no cost of goods sold associated with our fee-for-service business. As a result of the increase in sales activity, cost of goods sold increased from the prior year by $288.2 million.
Gross margin. | For the years ended December 31, | Change | ||||||||||||
(Dollars in thousands) | 2015 | 2014 | $ | % | ||||||||||
Gross margin | $ | 1,214,573 | $ | 1,169,966 | $ | 44,607 | 3.8 | % | ||||||
As a % of net revenue | 12.43 | % | 12.39 | % | ||||||||||
The improvement in gross margin for the year ended December 31, 2015, compared to the prior year was largely attributable to revenue growth in the Domestic segment, higher benefits from certain manufacturer product price changes compared to prior year and the full year activity from the late 2014 acquisitions. These benefits were unfavorably affected by $40.6 million from foreign currency translation.
We value Domestic segment inventory under the LIFO method. Had inventory been valued under the first-in, first-out (FIFO) method, gross margin as a percentage of net revenue would have been the same in 2015 and higher by 8 basis points in 2014.
Operating expenses. | For the years ended December 31, | Change | ||||||||||||
(Dollars in thousands) | 2015 | 2014 | $ | % | ||||||||||
Distribution, selling & administrative expenses | $ | 993,783 | $ | 984,102 | $ | 9,681 | 1.0 | % | ||||||
As a % of net revenue | 10.17 | % | 10.42 | % | ||||||||||
Other operating income, net | $ | (7,973 | ) | $ | (16,473 | ) | $ | 8,500 | (51.6 | )% | ||||
Distribution, selling and administrative (DS&A) expenses include labor and warehousing costs associated with our distribution and logistics services and all costs associated with our fee-for-service arrangements. Shipping and handling costs are included in DS&A expenses and include costs to store, move, and prepare products for shipment, as well as costs to deliver products to customers. The costs to convert new customers to our information systems are included in DS&A and are generally incurred prior to the recognition of revenues from the new customers. Depreciation and amortization, previously reported as a separate financial statement line item in the consolidated statements of income is now included in distribution, selling and administrative expenses for all periods presented.
19
The change in DS&A expenses compared to the prior year was largely attributable to increased expenses associated with incremental sales activity, higher accrued incentive compensation and full year impacts from the late 2014 acquisitions. These impacts were largely offset by benefits from cost control initiatives, lower fuel costs compared to prior year and favorable foreign currency translation impacts of $37.6 million, all of which contributed to a 27 basis point reduction in DS&A expenses as a percentage of net revenue compared to 2014. The Domestic segment also incurred $3.7 million for the year ended December 31, 2015, in costs associated with the recruitment and transition of our new chief executive officer.
The decrease in other operating income, net for the year ended December 31, 2015 compared to 2014 was primarily related to 1) the prior year benefit of $5.3 million from the settlement of a direct purchaser anti-trust class action lawsuit, as well as a gain on the sale of an investment, 2) the prior year gain of $6.7 million from a fair value adjustment to contingent consideration related to the Movianto acquisition purchase price, offset by 3) a prior year loss of $3.9 million related to the settlement of a contract claim in the United Kingdom, of which $1.5 million was recovered through insurance in 2015 and 4) an increase in 2015 of expenses associated with on-going legal matters.
A discussion of the acquisition-related and exit and realignment charges is included above in the Overview section.
Interest expense, net. | For the years ended December 31, | Change | ||||||||||||
(Dollars in thousands) | 2015 | 2014 | $ | % | ||||||||||
Interest expense, net | $ | 27,149 | $ | 18,163 | $ | 8,986 | 49.5 | % | ||||||
Effective interest rate | 4.78 | % | 5.38 | % | ||||||||||
The changes in interest expense and effective interest rate in the year ended December 31, 2015 compared to 2014 was the result of the new Senior Notes issued on September 16, 2014.
Income taxes. | For the years ended December 31, | Change | ||||||||||||
(Dollars in thousands) | 2015 | 2014 | $ | % | ||||||||||
Income tax provision | $ | 69,801 | $ | 59,980 | $ | 9,821 | 16.4 | % | ||||||
Effective tax rate | 40.3 | % | 47.4 | % | ||||||||||
The change in the effective tax rate compared to 2014, including income taxes on acquisition-related and exit and realignment charges, resulted from a higher percentage of the company's pretax income earned in lower tax rate jurisdictions compared to prior year and the non-deductibility of certain acquisition-related charges for income tax purposes.
20
Financial Condition, Liquidity and Capital Resources
Financial condition. We monitor operating working capital through days sales outstanding (DSO) and merchandise inventory turnover. We estimate a hypothetical increase (decrease) in DSO of one day would result in a decrease (increase) in our cash balances, an increase (decrease) in borrowings against our revolving credit facility, or a combination thereof of approximately $26 million.
The majority of our cash and cash equivalents are held in cash depository accounts with major banks in the United States and Europe or invested in high-quality, short-term liquid investments. Changes in our working capital can vary in the normal course of business based upon the timing of inventory purchases, collection of accounts receivable, and payment to suppliers.
December 31, | Change | |||||||||||||
(Dollars in thousands) | 2016 | 2015 | $ | % | ||||||||||
Cash and cash equivalents | $ | 185,488 | $ | 161,020 | $ | 24,468 | 15.2 | % | ||||||
Accounts and notes receivable, net of allowances | $ | 606,084 | $ | 587,935 | $ | 18,149 | 3.1 | % | ||||||
Days sales outstanding (1) | 23.1 | 21.0 | ||||||||||||
Merchandise inventories | $ | 916,311 | $ | 940,775 | $ | (24,464 | ) | (2.6 | )% | |||||
Inventory turnover (2) | 9.2 | 9.4 | ||||||||||||
Accounts payable | $ | 750,750 | $ | 710,609 | $ | 40,141 | 5.6 | % | ||||||
(1) Based on year end accounts receivable and net revenue for the fourth quarter
(2) Based on average annual inventory and costs of goods sold for the years ended December 31, 2016 and 2015
Liquidity and capital expenditures. The following table summarizes our consolidated statements of cash flows:
For the years ended December 31, | |||||||||||
(Dollars in thousands) | 2016 | 2015 | 2014 | ||||||||
Net cash provided by (used for): | |||||||||||
Operating activities | $ | 186,934 | $ | 269,597 | $ | (3,761 | ) | ||||
Investing activities | (24,746 | ) | (36,473 | ) | (317,251 | ) | |||||
Financing activities | (141,943 | ) | (124,233 | ) | 278,560 | ||||||
Effect of exchange rate changes on cash | 4,223 | (4,643 | ) | (2,681 | ) | ||||||
Increase (decrease) in cash and cash equivalents | $ | 24,468 | $ | 104,248 | $ | (45,133 | ) | ||||
Cash provided by (used for) operating activities in 2016, 2015 and 2014 reflected improvements in net income, changes in working capital, including the effects of a customer exit in 2016, and the timing of payments to vendors in 2014.
Cash used for investing activities in 2016 and 2015 included capital expenditures of $30.1 million and $36.6 million for our strategic and operational efficiency initiatives, particularly initiatives relating to information technology enhancements and optimizing our distribution network. Cash used for investing activities in 2016 was partially offset by $5.4 million in proceeds from the sale of property. Cash used for investing activities in 2014 included cash paid for the acquisitions of Medical Action and ArcRoyal of approximately $261.6 million plus assumed third-party debt (capital lease obligations) of $13.4 million and capital expenditures of $70.8 million primarily related to distribution center and logistics facility moves and modifications and information technology initiatives.
Cash used in financing activities included dividend payments of $63.4 million, $63.7 million and $63.1 million and repurchases of common stock under our share repurchase programs for $71.0 million, $20.0 million and $9.9 million in the years ended December 31, 2016, 2015 and 2014. Financing activities in 2015 also included the repayment of $33.7 million in borrowings on our Amended Credit Agreement. In 2014, cash provided by financing activities included proceeds from borrowings of $581.4 million offset by the repayment of long-term debt of $217.4 million.
21
Capital resources. Our sources of liquidity include cash and cash equivalents and a revolving credit facility. On September 17, 2014, we amended our existing Credit Agreement with Wells Fargo Bank, N.A., JPMorgan Chase Bank, N.A., Bank of America, N.A. and a syndicate of financial institutions (the Amended Credit Agreement) increasing our borrowing capacity from $350 million to $450 million and extending the term through 2019. Under the Amended Credit Agreement, we have the ability to request two one -year extensions and to request an increase in aggregate commitments by up to $200 million. The interest rate on the Amended Credit Agreement, which is subject to adjustment quarterly, is based on the London Interbank Offered Rate (LIBOR), the Federal Funds Rate or the Prime Rate, plus an adjustment based on the better of our debt ratings or leverage ratio (Credit Spread) as defined by the Amended Credit Agreement. We are charged a commitment fee of between 12.5 and 25.0 basis points on the unused portion of the facility. The terms of the Amended Credit Agreement limit the amount of indebtedness that we may incur and require us to maintain ratios for leverage and interest coverage, including on a pro forma basis in the event of an acquisition. We may utilize the revolving credit facility for long-term strategic growth, capital expenditures, working capital and general corporate purposes. If we were unable to access the revolving credit facility, it could impact our ability to fund these needs. Based on our leverage ratio at December 31, 2016, the interest rate under the credit facility is LIBOR plus 1.375%.
At December 31, 2016, we had no borrowings and letters of credit of approximately $4.9 million outstanding under the Amended Credit Agreement, leaving $445 million available for borrowing. We also have a $1.1 million and a $1.2 million letter of credit outstanding as of December 31, 2016 and 2015, respectively, which supports our facilities leased in Europe.
On September 16, 2014, we issued $275 million of 3.875% senior notes due 2021 (the “2021 Notes”) and $275 million of 4.375% senior notes due 2024 (the “2024 Notes”). The 2021 Notes were sold at 99.5% of the principal amount with an effective yield of 3.951%. The 2024 Notes were sold at 99.6% of the principal amount with an effective yield of 4.422%. Interest on the 2021 Notes and 2024 Notes is payable semiannually in arrears, commencing on March 15, 2015 and December 15, 2014, respectively. We have the option to redeem the 2021 Notes and 2024 Notes in part or in whole prior to maturity at a redemption price equal to the greater of 100% of the principal amount or the present value of the remaining scheduled payments discounted at the Treasury Rate plus 30 basis points. We have $3.5 million of deferred costs associated with the issuance of the 2021 Notes and 2024 Notes which were unamortized as of December 31, 2016.
We used a portion of the proceeds from the 2021 Notes and the 2024 Notes to complete the Medical Action and ArcRoyal acquisitions in the fourth quarter of 2014 for a combined purchase price of $261.6 million, net of cash acquired, and including debt assumed of $13.4 million (capitalized lease obligations). We also used a portion of the proceeds in 2014 to fund the early retirement of all of our 2016 Notes, which included the payment of a $17.4 million redemption premium. We recorded a net loss on the early retirement of our 2016 Notes of $14.9 million, which included the redemption premium offset by the recognition of a gain on previously settled interest rate swaps.
We paid quarterly cash dividends on our outstanding common stock at the rate of $0.255 per share during 2016, $0.2525 per share during 2015 and $0.25 per share during 2014. In February 2017, the Board of Directors approved the first quarter dividend of $0.2575 per common share, an increase of 1.0% compared to 2016. We anticipate continuing to pay quarterly cash dividends in the future. However, the payment of future dividends remains within the discretion of the Board of Directors and will depend upon our results of operations, financial condition, capital requirements and other factors.
In February 2014, the Board of Directors authorized a share repurchase program of up to $100 million of our outstanding common stock to be executed at the discretion of management over a three-year period, expiring in February 2017. The authorized repurchases under this program were completed in December 2016.
In October 2016, our Board of Directors authorized a new share repurchase program of up to $100 million of the company’s outstanding common stock to be executed at the discretion of management over a three -year period. The new authorization took effect in December 2016 upon the completion of the previous authorization. The timing of repurchases and the exact number of shares of common stock to be purchased will depend upon market conditions and other factors and may be suspended or discontinued at any time.
During 2016, we repurchased approximately 2.0 million shares for $71.0 million under the two programs described above. At December 31, 2016, the remaining amount authorized for repurchase was $99.0 million.
We believe available financing sources, including cash generated by operating activities and borrowings under the Amended Credit Agreement, will be sufficient to fund our working capital needs, capital expenditures, long-term strategic growth, payments under long-term debt and lease arrangements, payments of quarterly cash dividends, share repurchases and other cash requirements. While we believe that we will have the ability to meet our financing needs in the foreseeable future, changes in economic conditions may impact (i) the ability of financial institutions to meet their contractual commitments to us, (ii) the ability of our customers and suppliers to meet their obligations to us or (iii) our cost of borrowing.
22
We earn a portion of our operating earnings in foreign jurisdictions outside the U.S., which we consider to be indefinitely reinvested. Accordingly, no U.S. federal and state income taxes and withholding taxes have been provided on these earnings. Our cash, cash-equivalents, short-term investments, and marketable securities held by our foreign subsidiaries totaled $82.1 million and $46.0 million as of December 31, 2016 and 2015. We do not intend, nor do we foresee a need, to repatriate these funds or other assets held outside the U.S. In the future, should we require more capital to fund discretionary activities in the U.S. than is generated by our domestic operations and is available through our borrowings, we could elect to repatriate cash or other assets from foreign jurisdictions that have previously been considered to be indefinitely reinvested.
Off-Balance Sheet Arrangements
We do not have guarantees or other off-balance sheet financing arrangements, including variable interest entities, which we believe could have a material impact on financial condition or liquidity.
Contractual Obligations
The following is a summary of our significant contractual obligations as of December 31, 2016:
(Dollars in thousands) | Payments due by period | ||||||||||||||||||
Contractual obligations | Total | Less than 1 year | 1-3 years | 4-5 years | After 5 years | ||||||||||||||
Long-term debt (1) | $ | 696,868 | $ | 22,688 | $ | 45,375 | $ | 317,711 | $ | 311,094 | |||||||||
Purchase obligations (2) | 30,086 | 30,086 | — | — | — | ||||||||||||||
Operating leases (2) | 261,371 | 59,249 | 96,852 | 54,929 | 50,341 | ||||||||||||||
Capital lease obligations (1) | 34,812 | 6,625 | 9,121 | 4,764 | 14,302 | ||||||||||||||
Unrecognized tax benefits, net (3) | 10,725 | — | — | — | — | ||||||||||||||
Other long-term liabilities (4) | 81,032 | 3,468 | 6,842 | 6,769 | 63,953 | ||||||||||||||
Total contractual obligations | $ | 1,114,894 | $ | 122,116 | $ | 158,190 | $ | 384,173 | $ | 439,690 | |||||||||
(1) See Note 10 of Notes to Consolidated Financial Statements. Debt is assumed to be held to maturity with interest paid at the stated rate in effect at December 31, 2016.
(2) See Note 18 of Notes to Consolidated Financial Statements.
(3) We cannot reasonably estimate the timing of cash settlement for the liability associated with unrecognized tax benefits.
(4) Other long-term liabilities include estimated minimum required payments for our unfunded retirement plan for certain officers. See Note 13 of Notes to Consolidated Financial Statements. Certain long-term liabilities, including deferred tax liabilities and post-retirement benefit obligations, are excluded as we cannot reasonably estimate the timing of payments for these items.
Critical Accounting Policies
Our consolidated financial statements and accompanying notes have been prepared in accordance with U.S. generally accepted accounting principles. The preparation of the financial statements requires us to make estimates and assumptions that affect the reported amounts and related disclosures. We continually evaluate the accounting policies and estimates used to prepare the financial statements.
Critical accounting policies are defined as those policies that relate to estimates that require us to make assumptions about matters that are highly uncertain at the time the estimate is made and could have a material impact on our results due to changes in the estimate or the use of different assumptions that could reasonably have been used. Our estimates are generally based on historical experience and various other assumptions that are judged to be reasonable in light of the relevant facts and circumstances. Because of the uncertainty inherent in such estimates, actual results may differ. We believe our critical accounting policies and estimates include allowances for losses on accounts and notes receivable, inventory valuation, accounting for goodwill and long-lived assets, self-insurance liabilities, supplier incentives, and business combinations.
23
Allowances for losses on accounts and notes receivable. We maintain valuation allowances based upon the expected collectability of accounts and notes receivable. The allowances include specific amounts for accounts that are likely to be uncollectible, such as customer bankruptcies and disputed amounts, and general allowances for accounts that may become uncollectible. These allowances are estimated based on a number of factors, including industry trends, current economic conditions, creditworthiness of customers, age of the receivables, changes in customer payment patterns, and historical experience. At December 31, 2016, accounts and notes receivable were $606.1 million, net of allowances of $13.5 million. An unexpected bankruptcy or other adverse change in the financial condition of a customer could result in increases in these allowances, which could have a material effect on the results of operations.
Inventory valuation. Merchandise inventories are valued at the lower of cost or market, with cost determined using the last-in, first-out (LIFO) method for inventories in the U.S. and the first-in, first-out (FIFO) method for inventories outside of the U.S. An actual valuation of inventory under the LIFO method is made only at the end of the year based on the inventory levels and costs at that time. LIFO calculations are required for interim reporting purposes and are based on estimates of the expected mix of products in year-end inventory. In addition, inventory valuation includes estimates of allowances for obsolescence and variances between actual inventory on-hand and perpetual inventory records that can arise throughout the year. These estimates are based on factors such as the age of inventory and historical trends. At December 31, 2016, the carrying value of inventory was $916.3 million, which is $115.4 million lower than the value of inventory had it all been accounted for on a FIFO basis.
Goodwill and long-lived assets. Goodwill represents the excess of consideration paid over the fair value of identifiable net assets acquired. Long-lived assets, which are a component of identifiable net assets, include intangible assets with finite useful lives, property and equipment, and computer software costs. Intangible assets with finite useful lives consist primarily of customer relationships and non-compete agreements acquired through business combinations. Certain assumptions and estimates are employed in determining the fair value of identifiable net assets acquired.
We evaluate goodwill for impairment annually and whenever events occur or changes in circumstance indicate that the carrying amount of goodwill may not be recoverable. In performing the impairment test, we perform qualitative assessments based on macroeconomic conditions, structural changes in the industry, estimated financial performance, and other relevant information. If necessary, we perform a quantitative analysis to estimate the fair value of the reporting unit using valuation techniques, including comparable multiples of the reporting unit's earnings before interest, taxes, depreciation and amortization (EBITDA) and discounted cash flows. The EBITDA multiples are based on an analysis of current enterprise valuations and recent acquisition prices of similar companies, if available. Goodwill totaled $414.9 million at December 31, 2016.
Long-lived assets, which exclude goodwill, are evaluated for impairment whenever events or changes in circumstances indicate that the carrying amount of long-lived assets may not be recoverable. We assess long-lived assets for potential impairment by comparing the carrying value of an asset, or group of related assets, to its estimated undiscounted future cash flows. At December 31, 2016, long-lived assets included property and equipment of $191.7 million, net of accumulated depreciation; intangible assets of $82.5 million, net of accumulated amortization; and computer software costs of $59.2 million, net of accumulated amortization.
We did not record any material impairment losses related to goodwill or long-lived assets in 2016. However, the impairment review of goodwill and long-lived assets requires the extensive use of accounting judgment, estimates and assumptions. The application of alternative assumptions could produce materially different results.
Self-insurance liabilities. We are self-insured for most employee healthcare, workers’ compensation and automobile liability costs; however, we maintain insurance for individual losses exceeding certain limits. Liabilities are estimated for healthcare costs using current and historical claims data. Liabilities for workers’ compensation and automobile liability claims are estimated using historical claims data and loss development factors. If the underlying facts and circumstances of existing claims change or historical trends are not indicative of future trends, then we may be required to record additional expense that could have a material effect on the results of operations. Self-insurance liabilities recorded in our consolidated balance sheets for employee healthcare, workers’ compensation and automobile liability costs totaled $14.2 million at December 31, 2016 and $14.5 million at December 31, 2015.
Supplier incentives. We have contractual arrangements with certain suppliers that provide incentives, including operational efficiency and performance-based incentives, on a monthly, quarterly or annual basis. These incentives are recognized as a reduction in cost of goods sold as targets become probable of achievement. Supplier incentives receivable are recorded for interim and annual reporting purposes and are based on our estimate of the amounts which are expected to be realized. If we do not achieve required targets under certain programs as estimated, it could have a material adverse effect on our results of operations.
24
Business Combinations. We allocate the fair value of purchase consideration to the tangible assets acquired, liabilities assumed and intangible assets acquired based on their estimated fair values. The excess of the fair value of purchase consideration over the fair values of these identifiable assets and liabilities is recorded as goodwill. When determining the fair values of assets acquired and liabilities assumed, management makes significant estimates and assumptions, especially with respect to intangible assets.
Critical estimates in valuing certain intangible assets include but are not limited to future expected cash flows from customer relationships and discount rates. Our estimates of fair value are based upon assumptions believed to be reasonable, but which are inherently uncertain and unpredictable and, as a result, actual results may differ from estimates.
Recent Accounting Pronouncements
For a discussion of recent accounting pronouncements, see Note 1 of Notes to the Consolidated Financial Statements.
Item 7A. Quantitative and Qualitative Disclosures About Market Risk
We are exposed to market risk from changes in interest rates related to our revolving credit facility. We had no outstanding borrowings and $4.9 million in letters of credit under the facility at December 31, 2016. A hypothetical increase in interest rates of 100 basis points would result in a potential reduction in future pre-tax earnings of approximately $0.1 million per year for every $10 million of outstanding borrowings under the revolving credit facility.
Due to the nature and pricing of our Domestic segment distribution services, we are exposed to potential volatility in fuel prices. Our strategies for helping to mitigate our exposure to changing domestic fuel prices have included entering into leases for trucks with improved fuel efficiency. We benchmark our domestic diesel fuel purchase prices against the U.S. Weekly Retail On-Highway Diesel Prices (benchmark) as quoted by the U.S. Energy Information Administration. The benchmark averaged $2.31 per gallon in 2016, decreased 15% from $2.71 per gallon in 2015. Based on our fuel consumption in 2016, we estimate that every 10 cents per gallon increase in the benchmark would reduce our Domestic segment operating earnings by approximately $0.3 million.
In the normal course of business, we are exposed to foreign currency translation and transaction risks. Our business transactions outside of the United States are primarily denominated in the Euro and British Pound. We may use foreign currency forwards, swaps and options, where possible, to manage our risk related to certain foreign currency fluctuations. However, we believe that our foreign currency transaction risks are low since our revenues and expenses are typically denominated in the same currency.
Item 8. Financial Statements and Supplementary Data
See Item 15. Exhibits and Financial Statement Schedules.
Item 9. Changes in and Disagreements with Accountants on Accounting and Financial Disclosure
None.
25
Item 9A. Controls and Procedures
We carried out an evaluation, with the participation of management, including our principal executive officer and principal financial officer, of the effectiveness of our disclosure controls and procedures (pursuant to Rule 13a-15(e) under the Securities Exchange Act of 1934, as amended) as of the end of the period covered by this report. Based upon that evaluation, the principal executive officer and principal financial officer concluded that our disclosure controls and procedures were effective as of December 31, 2016.
There has been no change in our internal control over financial reporting during our last fiscal quarter (our fourth quarter in the case of an annual report) ended December 31, 2016, that has materially affected, or is reasonably likely to materially affect, our internal control over financial reporting.
Item 9B. Other Information
None.
26
Management’s Report on Internal Control over Financial Reporting
Management is responsible for establishing and maintaining adequate internal control over financial reporting, as such term is defined in Exchange Act Rules 13a-15(f), for Owens & Minor, Inc. (the company). Under the supervision and with the participation of management, including the company’s principal executive officer and principal financial officer, we conducted an evaluation of the effectiveness of our internal control over financial reporting as of December 31, 2016, based on the framework in Internal Control—Integrated Framework (2013) issued by the Committee of Sponsoring Organizations of the Treadway Commission (COSO).
Based on our evaluation under the COSO framework, management concluded that the company’s internal control over financial reporting was effective as of December 31, 2016.
The effectiveness of the company’s internal control over financial reporting as of December 31, 2016, has been audited by KPMG LLP, an independent registered public accounting firm, as stated in their report which is included in this annual report.
/s/ Paul C. Phipps
Paul C. Phipps
President & Chief Executive Officer
/s/ Richard A. Meier
Richard A. Meier
Executive Vice President, Chief Financial Officer &
President, International
27
Report of Independent Registered Public Accounting Firm
The Board of Directors and Shareholders
Owens & Minor, Inc.:
We have audited Owens & Minor, Inc.’s (the Company) internal control over financial reporting as of December 31, 2016, based on criteria established in Internal Control - Integrated Framework (2013) issued by the Committee of Sponsoring Organizations of the Treadway Commission (COSO). Owens & Minor, Inc.’s management is responsible for maintaining effective internal control over financial reporting and for its assessment of the effectiveness of internal control over financial reporting, included in the accompanying Management’s Report on Internal Control over Financial Reporting appearing in Part II of the Company’s December 31, 2016 annual report on Form 10-K. Our responsibility is to express an opinion on the Company’s internal control over financial reporting based on our audit.
We conducted our audit in accordance with the standards of the Public Company Accounting Oversight Board (United States). Those standards require that we plan and perform the audit to obtain reasonable assurance about whether effective internal control over financial reporting was maintained in all material respects. Our audit included obtaining an understanding of internal control over financial reporting, assessing the risk that a material weakness exists, and testing and evaluating the design and operating effectiveness of internal control based on the assessed risk. Our audit also included performing such other procedures as we considered necessary in the circumstances. We believe that our audit provides a reasonable basis for our opinion.
A company’s internal control over financial reporting is a process designed to provide reasonable assurance regarding the reliability of financial reporting and the preparation of financial statements for external purposes in accordance with generally accepted accounting principles. A company’s internal control over financial reporting includes those policies and procedures that (1) pertain to the maintenance of records that, in reasonable detail, accurately and fairly reflect the transactions and dispositions of the assets of the company; (2) provide reasonable assurance that transactions are recorded as necessary to permit preparation of financial statements in accordance with generally accepted accounting principles, and that receipts and expenditures of the company are being made only in accordance with authorizations of management and directors of the company; and (3) provide reasonable assurance regarding prevention or timely detection of unauthorized acquisition, use, or disposition of the company’s assets that could have a material effect on the financial statements.
Because of its inherent limitations, internal control over financial reporting may not prevent or detect misstatements. Also, projections of any evaluation of effectiveness to future periods are subject to the risk that controls may become inadequate because of changes in conditions, or that the degree of compliance with the policies or procedures may deteriorate.
In our opinion, Owens & Minor, Inc. maintained, in all material respects, effective internal control over financial reporting as of December 31, 2016, based on criteria established in Internal Control - Integrated Framework (2013) issued by the Committee of Sponsoring Organizations of the Treadway Commission (COSO).
We also have audited, in accordance with the standards of the Public Company Accounting Oversight Board (United States), the consolidated balance sheets of Owens & Minor, Inc. and subsidiaries as of December 31, 2016 and 2015, and the related consolidated statements of income, comprehensive income, changes in shareholders’ equity, and cash flows for each of the years in the three-year period ended December 31, 2016, and our report dated February 17, 2017, expressed an unqualified opinion on those consolidated financial statements.
/s/ KPMG LLP
Richmond, Virginia
February 17, 2017
28
Part III
Items 10-14.
Information required by Items 10-14 can be found under Corporate Officers at the end of the electronic filing of this Form 10-K and the registrant’s 2017 Proxy Statement pursuant to instructions (1) and G(3) of the General Instructions to Form 10-K.
Because our common stock is listed on the New York Stock Exchange (NYSE), our Chief Executive Officer is required to make, and he has made, an annual certification to the NYSE stating that he was not aware of any violation by of the corporate governance listing standards of the NYSE. Our Chief Executive Officer made his annual certification to that effect to the NYSE as of May 25, 2016. In addition, we have filed, as exhibits to this Annual Report on Form 10-K, the certifications of our principal executive officer and principal financial officer required under Sections 906 and 302 of the Sarbanes-Oxley Act of 2002 to be filed with the Securities and Exchange Commission regarding the quality of our public disclosure.
29
Part IV
Item 15. Exhibits and Financial Statement Schedules
a) The following documents are filed as part of this report:
Page | |
Consolidated Statements of Income for the Years Ended December 31, 2016, 2015 and 2014 | |
Consolidated Statements of Comprehensive Income for the Years Ended December 31, 2016, 2015, and 2014 | |
Consolidated Balance Sheets as of December 31, 2016 and 2015 | |
Consolidated Statements of Cash Flows for the Years Ended December 31, 2016, 2015 and 2014 | |
Consolidated Statements of Changes in Shareholders' Equity for the Years Ended December 31, 2016, 2015 and 2014 | |
Notes to Consolidated Financial Statements | |
Report of Independent Registered Public Accounting Firm | |
Selected Quarterly Financial Information (unaudited) | |
b) Exhibits:
See Index to Exhibits on page 66.
30
OWENS & MINOR, INC. AND SUBSIDIARIES
CONSOLIDATED STATEMENTS OF INCOME
(in thousands, except per share data)
Year ended December 31, | 2016 | 2015 | 2014 | ||||||||
Net revenue | $ | 9,723,431 | $ | 9,772,946 | $ | 9,440,182 | |||||
Cost of goods sold | 8,536,121 | 8,558,373 | 8,270,216 | ||||||||
Gross margin | 1,187,310 | 1,214,573 | 1,169,966 | ||||||||
Distribution, selling and administrative expenses | 970,424 | 993,783 | 984,102 | ||||||||
Acquisition-related and exit and realignment charges | 24,675 | 28,404 | 42,801 | ||||||||
Other operating income, net | (7,388 | ) | (7,973 | ) | (16,473 | ) | |||||
Operating earnings | 199,599 | 200,359 | 159,536 | ||||||||
Loss on early retirement of debt | — | — | 14,890 | ||||||||
Interest expense, net | 27,057 | 27,149 | 18,163 | ||||||||
Income before income taxes | 172,542 | 173,210 | 126,483 | ||||||||
Income tax provision | 63,755 | 69,801 | 59,980 | ||||||||
Net income | $ | 108,787 | $ | 103,409 | $ | 66,503 | |||||
Net income attributable to Owens & Minor, Inc. per common share: | |||||||||||
Basic | $ | 1.76 | $ | 1.65 | $ | 1.06 | |||||
Diluted | $ | 1.76 | $ | 1.65 | $ | 1.06 | |||||
Cash dividends per common share | $ | 1.02 | $ | 1.01 | $ | 1.00 | |||||
See accompanying notes to consolidated financial statements.
31
OWENS & MINOR, INC. AND SUBSIDIARIES
CONSOLIDATED STATEMENTS OF COMPREHENSIVE INCOME
(in thousands)
Year ended December 31, | 2016 | 2015 | 2014 | ||||||||
Net income | $ | 108,787 | $ | 103,409 | $ | 66,503 | |||||
Other comprehensive income (loss), net of tax: | |||||||||||
Currency translation adjustments (net of income tax of $0 in 2016, 2015 and 2014) | (15,017 | ) | (27,581 | ) | (29,539 | ) | |||||
Change in unrecognized net periodic pension costs (net of income tax of $343 in 2016, $90 in 2015, and $2,361 in 2014) | (727 | ) | (159 | ) | (3,844 | ) | |||||
Other (net of income tax of $0 in 2016 and 2015, $72 in 2014) | 86 | (84 | ) | (186 | ) | ||||||
Other comprehensive income (loss) | (15,658 | ) | (27,824 | ) | (33,569 | ) | |||||
Comprehensive income | $ | 93,129 | $ | 75,585 | $ | 32,934 | |||||
See accompanying notes to consolidated financial statements.
32
OWENS & MINOR, INC. AND SUBSIDIARIES
CONSOLIDATED BALANCE SHEETS
(in thousands, except per share data)
December 31, | 2016 | 2015 | |||||
Assets | |||||||
Current assets | |||||||
Cash and cash equivalents | $ | 185,488 | $ | 161,020 | |||
Accounts and notes receivable, net | 606,084 | 587,935 | |||||
Merchandise inventories | 916,311 | 940,775 | |||||
Other current assets | 254,156 | 284,970 | |||||
Total current assets | 1,962,039 | 1,974,700 | |||||
Property and equipment, net | 191,718 | 208,930 | |||||
Goodwill, net | 414,936 | 419,619 | |||||
Intangible assets, net | 82,511 | 95,250 | |||||
Other assets, net | 66,548 | 75,277 | |||||
Total assets | $ | 2,717,752 | $ | 2,773,776 | |||
Liabilities and equity | |||||||
Current liabilities | |||||||
Accounts payable | $ | 750,750 | $ | 710,609 | |||
Accrued payroll and related liabilities | 45,051 | 45,907 | |||||
Other current liabilities | 238,837 | 307,073 | |||||
Total current liabilities | 1,034,638 | 1,063,589 | |||||
Long-term debt, excluding current portion | 564,583 | 568,495 | |||||
Deferred income taxes | 90,383 | 86,326 | |||||
Other liabilities | 68,110 | 62,776 | |||||
Total liabilities | 1,757,714 | 1,781,186 | |||||
Commitments and contingencies | |||||||
Equity | |||||||
Common stock, par value $2 per share; authorized—200,000 shares; issued and outstanding—61,031 shares and 62,803 shares | 122,062 | 125,606 | |||||
Paid-in capital | 219,955 | 211,943 | |||||
Retained earnings | 685,504 | 706,866 | |||||
Accumulated other comprehensive income (loss) | (67,483 | ) | (51,825 | ) | |||
Total equity | 960,038 | 992,590 | |||||
Total liabilities and equity | $ | 2,717,752 | $ | 2,773,776 | |||
See accompanying notes to consolidated financial statements.
33
OWENS & MINOR, INC. AND SUBSIDIARIES
CONSOLIDATED STATEMENTS OF CASH FLOWS
(in thousands)
Year ended December 31, | 2016 | 2015 | 2014 | ||||||||
Operating activities: | |||||||||||
Net income | $ | 108,787 | $ | 103,409 | $ | 66,503 | |||||
Adjustments to reconcile net income to cash provided by (used for) operating activities : | |||||||||||
Depreciation and amortization | 55,393 | 65,982 | 63,407 | ||||||||
Share-based compensation expense | 12,042 | 11,306 | 8,207 | ||||||||
Deferred income tax expense (benefit) | 4,218 | (6,101 | ) | (3,385 | ) | ||||||
Provision for losses on accounts and notes receivable | 377 | (24 | ) | 448 | |||||||
Loss on early retirement of debt | — | — | 14,890 | ||||||||
Changes in operating assets and liabilities: | |||||||||||
Accounts and notes receivable | (25,244 | ) | 18,333 | (17,803 | ) | ||||||
Merchandise inventories | 22,589 | (69,727 | ) | (57,329 | ) | ||||||
Accounts payable | 43,430 | 114,011 | (52,148 | ) | |||||||
Net change in other assets and liabilities | (37,559 | ) | 30,177 | (25,828 | ) | ||||||
Other, net | 2,901 | 2,231 | (723 | ) | |||||||
Cash provided by (used for) operating activities | 186,934 | 269,597 | (3,761 | ) | |||||||
Investing activities: | |||||||||||
Acquisitions, net of cash acquired | — | — | (248,536 | ) | |||||||
Additions to computer software and intangible assets | (9,819 | ) | (16,085 | ) | (22,384 | ) | |||||
Additions to property and equipment | (20,302 | ) | (20,531 | ) | (48,424 | ) | |||||
Proceeds from sale of property and equipment | 5,375 | 143 | 156 | ||||||||
Proceeds from investment sale | — | — | 1,937 | ||||||||
Cash used for investing activities | (24,746 | ) | (36,473 | ) | (317,251 | ) | |||||
Financing activities: | |||||||||||
Proceeds from issuance of debt | — | — | 547,693 | ||||||||
Proceeds from (repayment of) revolving credit facility | — | (33,700 | ) | 33,700 | |||||||
Repayment of debt | — | — | (217,352 | ) | |||||||
Cash dividends paid | (63,382 | ) | (63,651 | ) | (63,104 | ) | |||||
Repurchases of common stock | (71,028 | ) | (20,000 | ) | (9,934 | ) | |||||
Financing costs paid | — | — | (5,391 | ) | |||||||
Proceeds from exercise of stock options | — | — | 1,180 | ||||||||
Excess tax benefits related to share-based compensation | 761 | 646 | 582 | ||||||||
Purchase of noncontrolling interest | — | — | (1,500 | ) | |||||||
Other, net | (8,294 | ) | (7,528 | ) | (7,314 | ) | |||||
Cash (used for) provided by financing activities | (141,943 | ) | (124,233 | ) | 278,560 | ||||||
Effect of exchange rate changes on cash and cash equivalents | 4,223 | (4,643 | ) | (2,681 | ) | ||||||
Net increase (decrease) in cash and cash equivalents | 24,468 | 104,248 | (45,133 | ) | |||||||
Cash and cash equivalents at beginning of year | 161,020 | 56,772 | 101,905 | ||||||||
Cash and cash equivalents at end of year | $ | 185,488 | $ | 161,020 | $ | 56,772 | |||||
See accompanying notes to consolidated financial statements.
34
OWENS & MINOR, INC. AND SUBSIDIARIES
CONSOLIDATED STATEMENTS OF CHANGES IN SHAREHOLDERS’ EQUITY
(in thousands, except per share data)
Owens & Minor, Inc. Shareholders’ Equity | ||||||||||||||||||||||||||
Common Shares Outstanding | Common Stock ($2 par value) | Paid-In Capital | Retained Earnings | Accumulated Other Comprehensive Income (Loss) | Noncontrolling Interest | Total Equity | ||||||||||||||||||||
Balance, December 31, 2013 | 63,096 | $ | 126,193 | $ | 196,605 | $ | 691,547 | $ | 9,568 | $ | 1,130 | $ | 1,025,043 | |||||||||||||
Net income | 66,503 | 66,503 | ||||||||||||||||||||||||
Other comprehensive income | (33,569 | ) | (33,569 | ) | ||||||||||||||||||||||
Dividends declared ($1.00 per share) | (62,934 | ) | (62,934 | ) | ||||||||||||||||||||||
Shares repurchased and retired | (291 | ) | (583 | ) | (9,351 | ) | (9,934 | ) | ||||||||||||||||||
Share-based compensation expense, exercises and other | 265 | 530 | 7,024 | 7,554 | ||||||||||||||||||||||
Purchase of noncontrolling interest | (695 | ) | (1,130 | ) | (1,825 | ) | ||||||||||||||||||||
Balance, December 31, 2014 | 63,070 | 126,140 | 202,934 | 685,765 | (24,001 | ) | — | 990,838 | ||||||||||||||||||
Net income | 103,409 | 103,409 | ||||||||||||||||||||||||
Other comprehensive loss | (27,824 | ) | (27,824 | ) | ||||||||||||||||||||||
Dividends declared ($1.01 per share) | (63,483 | ) | (63,483 | ) | ||||||||||||||||||||||
Shares repurchased and retired | (587 | ) | (1,175 | ) | (18,825 | ) | (20,000 | ) | ||||||||||||||||||
Share-based compensation expense, exercises and other | 320 | 641 | 9,009 | 9,650 | ||||||||||||||||||||||
Balance, December 31, 2015 | 62,803 | 125,606 | 211,943 | 706,866 | (51,825 | ) | — | 992,590 | ||||||||||||||||||
Net income | 108,787 | 108,787 | ||||||||||||||||||||||||
Other comprehensive loss | (15,658 | ) | (15,658 | ) | ||||||||||||||||||||||
Dividends declared ($1.02 per share) | (63,212 | ) | (63,212 | ) | ||||||||||||||||||||||
Shares repurchased and retired | (2,045 | ) | (4,091 | ) | (66,937 | ) | (71,028 | ) | ||||||||||||||||||
Share-based compensation expense, exercises and other | 273 | 547 | 8,012 | 8,559 | ||||||||||||||||||||||
Balance, December 31, 2016 | 61,031 | $ | 122,062 | $ | 219,955 | $ | 685,504 | $ | (67,483 | ) | $ | — | $ | 960,038 | ||||||||||||
See accompanying notes to consolidated financial statements.
35
OWENS & MINOR, INC. AND SUBSIDIARIES
Notes to Consolidated Financial Statements
(in thousands, except per share data, unless otherwise indicated)
Note 1—Summary of Significant Accounting Policies
Owens & Minor, Inc. and subsidiaries (we, us or our), is a Fortune 500 company headquartered in Richmond, Virginia. We are a leading global healthcare services company that connects the world of medical products to the point of care by providing vital supply chain assistance to the providers of healthcare services and the manufacturers of healthcare products, supplies, and devices in the United States and Europe. We serve our customers with a service portfolio that covers procurement, inventory management, delivery and sourcing for the healthcare market. With fully developed networks in the United States and Europe, we are equipped to serve a customer base ranging from hospitals, integrated healthcare systems, group purchasing organizations, and the U.S. federal government, to manufacturers of life-science and medical devices and supplies, including pharmaceuticals in Europe.
In 2016, we have made certain changes to the leadership team, organizational structure, budgeting and financial reporting processes which drive changes to segment reporting. These changes align our operations into three distinct business units: Domestic, International and Clinical & Procedural Solutions (CPS). Domestic is our U.S. distribution, logistics and value-added services business, while International is our European distribution, logistics and value-added services business. CPS provides product-related solutions, including surgical and procedural kitting and sourcing. Furthermore, the basis for segment reporting shifts from the geography of the end customer to the business unit selling the product or providing the service. This includes intercompany transactions as well. Beginning with the first quarter of 2016, we report our financial results using this three segment structure and have recast prior year segment results on the same basis.
Basis of Presentation. The consolidated financial statements include the accounts of Owens & Minor, Inc. and the subsidiaries it controls, in conformity with U.S generally accepted accounting principles (GAAP). All significant intercompany accounts and transactions have been eliminated.
Reclassifications. Certain prior year amounts have been reclassified to conform to current year presentation. Depreciation and amortization, previously reported as a separate financial statement line item in the consolidated statements of income is now included in distribution, selling and administrative expenses for all periods presented.
Use of Estimates. The preparation of the consolidated financial statements in conformity with GAAP requires us to make assumptions and estimates that affect reported amounts and related disclosures. Estimates are used for, but are not limited to, the allowances for losses on accounts and notes receivable, inventory valuation allowances, supplier incentives, depreciation and amortization, goodwill valuation, valuation of intangible assets and other long-lived assets, valuation of property held for sale, self-insurance liabilities, tax liabilities, defined benefit obligations, share-based compensation and other contingencies. Actual results may differ from these estimates.
Cash and Cash Equivalents. Cash and cash equivalents includes cash and marketable securities with an original maturity or maturity at acquisition of three months or less. Cash and cash equivalents are stated at cost. Nearly all of our cash and cash equivalents are held in cash depository accounts in major banks in the United States and Europe.
Book overdrafts represent the amount of outstanding checks issued in excess of related bank balances and are included in accounts payable in our consolidated balance sheets, as they are similar to trade payables and are not subject to finance charges or interest. Changes in book overdrafts are classified as operating activities in our consolidated statements of cash flows.
Accounts and Notes Receivable, Net. Accounts receivable from customers are recorded at the invoiced amount. We assess finance charges on overdue accounts receivable that are recognized as other operating income based on their estimated ultimate collectability. We have arrangements with certain customers under which they make deposits on account. Customer deposits in excess of outstanding receivable balances are classified as other current liabilities.
We maintain valuation allowances based upon the expected collectability of accounts and notes receivable. Our allowances include specific amounts for accounts that are likely to be uncollectible, such as customer bankruptcies and disputed amounts and general allowances for accounts that may become uncollectible. Allowances are estimated based on a number of factors, including industry trends, current economic conditions, creditworthiness of customers, age of the receivables, changes in customer payment patterns, and historical experience. Account balances are charged off against the allowance after all means of collection have been exhausted and the potential for recovery is considered remote.
36
Financing Receivables and Payables. We have an order-to-cash program in our International segment under which we invoice manufacturers’ customers and remit collected amounts to the manufacturers. We retain credit risk for certain uncollected receivables under this program where contractually obligated. We continually monitor the expected collectability in this program and maintain valuation allowances when it is likely that an amount may be or may become uncollectible. Allowances are estimated based on a number of factors including creditworthiness of customers, age of the receivables and historical experience. We write off uncollected receivables under this program when collection is no longer being pursued. At December 31, 2016 and 2015, the allowance for uncollectible accounts as part of this program was $0.1 million. Fees charged for this program are included in net revenue. Product pricing and related product risks are retained by the manufacturer. Balances receivable and related amounts payable under this program are classified in other current assets and other current liabilities in the consolidated balance sheets.
Merchandise Inventories. Merchandise inventories are valued at the lower of cost or market, with cost determined by the last-in, first-out (LIFO) method for inventories in the U.S. Cost of inventories outside the U.S. is determined using the first-in, first out (FIFO) method.
Property and Equipment. Property and equipment are stated at cost less accumulated depreciation or, if acquired under capital leases, at the lower of the present value of minimum lease payments or fair market value at the inception of the lease less accumulated amortization. Depreciation and amortization expense for financial reporting purposes is computed on a straight-line method over the estimated useful lives of the assets or, for capital leases and leasehold improvements, over the term of the lease, if shorter. During 2015 we changed the useful lives of certain warehouse assets from eight years to 15 to better align with our current business practices. The cost basis of these assets was $12.9 million at December 31, 2015 and the change in useful lives reduced total depreciation expense by $0.9 million for the year ended December 31, 2015. In general, the estimated useful lives for computing depreciation and amortization are four to 15 years for warehouse equipment, five to 40 years for buildings and building improvements, and three to eight years for computers, furniture and fixtures, and office and other equipment. Straight-line and accelerated methods of depreciation are used for income tax purposes. Normal maintenance and repairs are expensed as incurred, and renovations and betterments are capitalized.
Leases. We have entered into non-cancelable agreements to lease most of our office and warehouse facilities with remaining terms generally ranging from one to 30 years. We also lease most of our transportation and material handling equipment for terms generally ranging from three to ten years. Certain information technology assets embedded in an outsourcing agreement are accounted for as capital leases. Leases are classified as operating leases or capital leases at their inception. Rent expense for leases with rent holidays or pre-determined rent increases are recognized on a straight-line basis over the lease term. Incentives and allowances for leasehold improvements are deferred and recognized as a reduction of rent expense over the lease term.
Goodwill. We evaluate goodwill for impairment annually, as of October 1, and whenever events occur or changes in circumstance indicate that the carrying amount of goodwill may not be recoverable. In connection with our new three segment structure, goodwill has been reallocated based on the relative fair value of the underlying reporting units. We performed an interim impairment analysis in the first quarter of 2016 as a result of this change and noted no impairment. We review goodwill first by performing a qualitative assessment to determine if it is more likely than not that the fair value of a reporting unit exceeds its carrying value. If not, we then perform a quantitative assessment by first comparing the carrying amount to the fair value of the reporting unit. If the fair value of the reporting unit is determined to be less than its carrying value, a second step is performed to measure the goodwill impairment loss as the excess of the carrying value of the reporting unit’s goodwill over the estimated fair value of its goodwill. We estimate the fair value of the reporting unit using valuation techniques which can include comparable multiples of the unit’s earnings before interest, taxes, depreciation and amortization (EBITDA) and present value of expected cash flows. The EBITDA multiples are based on an analysis of current enterprise values and recent acquisition prices of similar companies, if available.
Intangible Assets. Intangible assets acquired through purchases or business combinations are stated at fair value at the acquisition date and net of accumulated amortization in the consolidated balance sheets. Intangible assets, consisting primarily of customer relationships, customer contracts, non-competition agreements, trademarks, and tradenames are amortized over their estimated useful lives. In determining the useful life of an intangible asset, we consider our historical experience in renewing or extending similar arrangements. Customer relationships are generally amortized over 10 to 15 years and other intangible assets are amortized generally for periods between one and 15 years, based on their pattern of economic benefit or on a straight-line basis.
37
Computer Software. We develop and purchase software for internal use. Software development costs incurred during the application development stage are capitalized. Once the software has been installed and tested, and is ready for use, additional costs incurred in connection with the software are expensed as incurred. Capitalized computer software costs are amortized over the estimated useful life of the software, usually between three and ten years. Capitalized computer software costs are included in other assets, net, in the consolidated balance sheets. Unamortized software at December 31, 2016 and 2015 was $59.2 million and $68.4 million. Depreciation and amortization expense includes $12.9 million, $15.4 million and $16.4 million of software amortization for the years ended December 31, 2016, 2015 and 2014. Additional amortization of $4.5 million in 2015 and $6.0 million in 2014 related to the accelerated amortization of an information system which was replaced in the International segment is included in acquisition-related and exit and realignment charges in the consolidated statements of income.
Long-Lived Assets. Long-lived assets, which include property and equipment, finite-lived intangible assets, and unamortized software costs, are evaluated for impairment whenever events or changes in circumstances indicate that the carrying amount of long-lived assets may not be recoverable. We assess long-lived assets for potential impairment by comparing the carrying value of an asset, or group of related assets, to their estimated undiscounted future cash flows.
Self-Insurance Liabilities. We are self-insured for most employee healthcare, workers’ compensation and automobile liability costs; however, we maintain insurance for individual losses exceeding certain limits. Liabilities are estimated for healthcare costs using current and historical claims data. Liabilities for workers’ compensation and automobile liability claims are estimated using historical claims data and loss development factors. If the underlying facts and circumstances of existing claims change or historical trends are not indicative of future trends, then we may be required to record additional expense or reductions to expense. Self-insurance liabilities are included in other accrued liabilities on the consolidated balance sheets.
Revenue Recognition. Revenue is recognized when persuasive evidence of an arrangement exists, delivery has occurred or services have been rendered, the price or fee is fixed or determinable, and collectability is reasonably assured. Under most of our distribution contracts, we record revenue at the time shipment is completed as title passes to the customer when the product is received by the customer.
Revenue for activity-based fees and other services is recognized as work is performed and as amounts are earned. Depending on the specific contractual provisions and nature of the deliverable, revenue from services may be recognized on a straight-line basis over the term of the service, on a proportional performance model, based on level of effort, or when final deliverables have been provided. Additionally, we generate fees from arrangements that include performance targets related to cost-saving initiatives for customers that result from our supply-chain management services. Achievement against performance targets, measured in accordance with contractual terms, may result in additional fees paid to us or, if performance targets are not achieved, we may be obligated to refund or reduce a portion of our fees or to provide credits toward future purchases by the customer. For these arrangements, all contingent revenue is deferred and recognized as the performance target is achieved and the applicable contingency is released. When we determine that a loss is probable under a contract, the estimated loss is accrued.
We allocate revenue for arrangements with multiple deliverables meeting the criteria for a separate unit of accounting using the relative selling price method and recognize revenue for each deliverable in accordance with applicable revenue recognition criteria.
In most cases, we record revenue gross, as we are the primary obligor in our sales arrangements, bear the risk of general and physical inventory loss and carry all credit risk associated with sales. When we act as an agent in a sales arrangement and do not bear a significant portion of these risks, primarily for our third-party logistics business, we record revenue net of product cost. Sales taxes collected from customers and remitted to governmental authorities are excluded from revenues.
Cost of Goods Sold. Cost of goods sold includes the cost of the product (net of supplier incentives and cash discounts) and all costs incurred for shipments of products from manufacturers to our distribution centers for all customer arrangements where we are the primary obligor, bear the risk of general and physical inventory loss and carry all credit risk associated with sales. Cost of goods sold also includes direct and certain indirect labor, material and overhead costs associated with our CPS business. We have contractual arrangements with certain suppliers that provide incentives, including cash discounts for prompt payment, operational efficiency and performance-based incentives. These incentives are recognized as a reduction in cost of goods sold as targets become probable of achievement.
In situations where we act as an agent in a sales arrangement and do not bear a significant portion of these risks, primarily for our third-party logistics business, there is no cost of goods sold and all costs to provide the service to the customer are recorded in selling, general and administrative expenses.
38
As a result of different practices of categorizing costs and different business models throughout our industry, our gross margins may not necessarily be comparable to other distribution companies.
Distribution, Selling and Administrative (DS&A) Expenses. DS&A expenses include shipping and handling costs, labor, depreciation, amortization and other costs for selling and administrative functions associated with our distribution and logistics services and all costs associated with our fee-for-service arrangements.
Shipping and Handling. Shipping and handling costs are included in DS&A expenses on the consolidated statements of income and include costs to store, to move, and to prepare products for shipment, as well as costs to deliver products to customers. Shipping and handling costs totaled $558.9 million, $548.6 million and $576.8 million for the years ended December 31, 2016, 2015 and 2014, respectively. Third-party shipping and handling costs billed to customers, which are included in net revenue, are immaterial for all periods presented.
Share-Based Compensation. We account for share-based payments to employees at fair value and recognize the related expense in selling, general and administrative expenses over the service period for awards expected to vest.
Derivative Financial Instruments. We are directly and indirectly affected by changes in certain market conditions, which may adversely impact our financial performance and are referred to as “market risks.” When deemed appropriate, we use derivatives as a risk management tool to mitigate the potential impact of certain market risks, primarily foreign currency exchange risk. We use forward contracts, which are agreements to buy or sell a quantity of a commodity at a predetermined future date, and at a predetermined rate or price. We do not enter into derivative financial instruments for trading purposes. All derivatives are carried at fair value in our consolidated balance sheets, which is determined by using observable market inputs (Level 2). The cash flow impact of the our derivative instruments is primarily included in our consolidated statements of cash flows in net cash provided by operating activities.
Income Taxes. We account for income taxes under the asset and liability method. Deferred tax assets and liabilities are recognized for the future tax consequences attributable to differences between the financial statement carrying amounts of existing assets and liabilities and their respective tax bases and operating loss and tax credit carryforwards. Deferred tax assets and liabilities are measured using enacted tax rates expected to apply to taxable income in the years in which those temporary differences are expected to be recovered or settled. The effect on deferred tax assets and liabilities of a change in tax rates is recognized in income in the period that includes the enactment date. Valuation allowances are provided if it is more likely than not that a deferred tax asset will not be realized. When we have claimed tax benefits that may be challenged by a tax authority, an estimate of the effect of these uncertain tax positions is recorded. It is our policy to provide for uncertain tax positions and the related interest and penalties based upon an assessment of whether a tax benefit is more likely than not to be sustained upon examination by tax authorities. To the extent that the tax outcome of these uncertain tax positions changes, based on our assessment, such changes in estimate may impact the income tax provision in the period in which such determination is made.
We earn a portion of our operating earnings in foreign jurisdictions outside the United States, which we consider to be indefinitely reinvested. Accordingly, no United States federal and state income taxes and withholding taxes have been provided on these earnings. Our cash, cash-equivalents, short-term investments, and marketable securities held by our foreign subsidiaries totaled $82.1 million and $46.0 million as of December 31, 2016 and 2015. We do not intend, nor do we foresee a need, to repatriate these funds or other assets held outside the U.S. In the future, should we require more capital to fund activities in the U.S. than is generated by our domestic operations and is available through our borrowings, we could elect to repatriate cash or other assets from foreign jurisdictions that have previously been considered to be indefinitely reinvested. Upon distribution of these assets, we could be subject to additional U.S. federal and state income taxes and withholding taxes payable to foreign jurisdictions, where applicable.
Fair Value Measurements. Fair value is determined based on assumptions that a market participant would use in pricing an asset or liability. The assumptions used are in accordance with a three-tier hierarchy, defined by GAAP, that draws a distinction between market participant assumptions based on (i) observable inputs such as quoted prices in active markets (Level 1), (ii) inputs other than quoted prices in active markets that are observable either directly or indirectly (Level 2) and (iii) unobservable inputs that require the use of present value and other valuation techniques in the determination of fair value (Level 3).
39
The carrying amounts of cash and cash equivalents, accounts receivable and accounts payable reported in the consolidated balance sheets approximate fair value due to the short-term nature of these instruments. Property held for sale is reported at estimated fair value less selling costs with fair value determined based on recent sales prices for comparable properties in similar locations (Level 2). The fair value of long-term debt is estimated based on quoted market prices or dealer quotes for the identical liability when traded as an asset in an active market (Level 1) or, if quoted market prices or dealer quotes are not available, on the borrowing rates currently available for loans with similar terms, credit ratings, and average remaining maturities (Level 2). See Notes 7, 10 and 11 for the fair value of property held for sale, debt instruments and derivatives.
Acquisition-Related and Exit and Realignment Charges. We present costs incurred in connection with acquisitions in acquisition-related and exit and realignment charges in our consolidated statements of income. Acquisition-related charges consist primarily of transaction costs incurred to perform due diligence and to analyze, negotiate and consummate an acquisition, costs to perform post-closing activities to establish the organizational structure, and costs to transition the acquired company’s information technology and other operations and administrative functions from the former owner.
Costs associated with exit and realignment activities are recorded at their fair value when incurred. Liabilities are established at the cease-use date for remaining operating lease and other contractual obligations, net of estimated sub-lease income. The net lease termination cost is discounted using a credit-adjusted risk-free rate of interest. We evaluate these assumptions quarterly and adjust the liability accordingly. The current portion of accrued lease and other contractual termination costs is included in other current liabilities on the consolidated balance sheets, and the non-current portion is included in other liabilities. Severance benefits are recorded when payment is considered probable and reasonably estimable.
Income Per Share. Basic and diluted income per share are calculated pursuant to the two-class method, under which unvested share-based payment awards containing nonforfeitable rights to dividends are participating securities.
Foreign Currency Translation. Our foreign subsidiaries generally consider their local currency to be their functional currency. Assets and liabilities of these foreign subsidiaries are translated into U.S. dollars at period-end exchange rates and revenues and expenses are translated at average exchange rates during the period. Cumulative currency translation adjustments are included in accumulated other comprehensive income (loss) in shareholders’ equity. Gains and losses on intercompany foreign currency transactions that are long-term in nature and which we do not intend to settle in the foreseeable future are also recognized in other comprehensive income (loss) in shareholders’ equity. Realized gains and losses from foreign currency transactions are recorded in other operating income, net in the consolidated statements of income and were not material to our consolidated results of operations in 2016, 2015 and 2014.
Business Combinations. We account for acquired businesses using the acquisition method of accounting, which requires that the assets acquired and liabilities assumed be recorded at the date of acquisition at their respective fair values. Any excess of the purchase price over the estimated fair values of the net assets acquired is recorded as goodwill.
Recent Accounting Pronouncements. During 2016, we adopted Accounting Standard Updates (ASU’s) issued by the Financial Accounting Standards Board (FASB).
On January 1, 2016, we adopted ASU 2015-03, Interest-Imputation of Interest: Simplifying the Presentation of Debt Issuance Costs, which requires that our $3.5 million in debt issuance costs at December 31, 2016 related to a recognized debt liability be presented in the balance sheet as a direct deduction from the carrying amount of that debt liability, consistent with debt discounts. As a result of this adoption, we have also presented $4.1 million in debt issuance costs from our December 31, 2015 balance sheet in a manner that conforms to the new presentation. The adoption of this standard did not affect our results of operations or cash flows in either the current or prior interim or annual periods.
In February 2016, the Financial Accounting Standards Board (FASB) issued ASU No. 2016-02, Leases which requires lessees to put most leases on their balance sheets but recognize the expenses on their income statements in a manner similar to current practice. The new standard states that a lessee will recognize a lease liability for the obligation to make lease payments and a right-of-use (ROU) asset for the right to use the underlying asset for the lease term. Expense related to leases determined to be operating leases will be recognized on a straight-line basis, while those determined to be financing leases will be recognized following a front-loaded expense profile in which interest and amortization are presented separately in the income statement. This guidance is effective for fiscal years beginning after December 15, 2018, including interim periods within that reporting period. Early adoption is permitted and should be applied using a modified retrospective approach. We expect this standard will have a material effect on our financial statements. While we are continuing to assess the effect of adoption, we currently believe the most significant changes relate to the recognition of new ROU assets and lease liabilities on our balance sheet for office and warehouse facilities operating leases.
In March 2016, the FASB issued ASU No. 2016-09, Improvements to Employee Share-Based Payment Accounting. The amendments in this updated guidance will change several aspects of the accounting for shared-based payment transactions.
40
The guidance requires all income tax effects of share-based awards to be recognized in the income statement as awards vest or are settled. Additionally, the guidance increases the amount employers can withhold in shares to cover employee income taxes without requiring liability classification and allows a policy election for accounting for forfeitures. This guidance is effective for us beginning January 1, 2017. We expect the adoption of this new guidance will not have a material impact on our financial statements.
In May 2014, the FASB issued an ASU, Revenue from Contracts with Customers. The amended guidance eliminates industry specific guidance and applies to all companies. Revenue will be recognized when an entity satisfies a performance obligation by transferring control of a promised good or service to a customer in an amount that reflects the consideration to which the entity expects to be entitled for that good or service. Revenue from a contract that contains multiple performance obligations is allocated to each performance obligation generally on a relative standalone selling price basis. Amended guidance was issued on: principal versus agent considerations, shipping and handling activities that occur after the customer has obtained control of a good as an activity to fulfill the promise to transfer the good, clarification on how an entity should evaluate the collectibility threshold and when an entity can recognize nonrefundable consideration received as revenue if an arrangement does not meet the standard’s contract criteria. The amended guidance also requires additional quantitative and qualitative disclosures. These amended standards are all effective for us beginning January 1, 2018 and allow for either full retrospective adoption or modified retrospective adoption (cumulative effect). We plan to adopt the new guidance in the first quarter of 2018 and have not determined the method we will use for adoption or the effect the standards will have on our ongoing financial reporting.
Note 2—Significant Risks and Uncertainties
Many of our hospital customers in the U.S. are represented by group purchasing organizations (GPOs) that contract with us for services on behalf of the GPO members. GPOs representing a significant portion of our business are Vizient (formerly Novation, LLC and MedAssets Inc.), Premier, Inc. (Premier) and Health Trust Purchasing Group (HPG). Members of these GPOs have incentives to purchase from their primary selected distributor; however, they operate independently and are free to negotiate directly with distributors and manufacturers. For 2016, 2015 and 2014, net revenue from hospitals under contract with these GPOs represented the following approximate percentages of our net revenue annually: Vizient—48% to 54%; Premier—20% to 22%; and HPG—10% to 14%.
Net revenue from sales of product supplied by Medtronic represented approximately 13% and Johnson & Johnson represented approximately 9% of our net revenue annually for each of the previous three years. Net revenue from sales of product supplied by Becton Dickinson represented approximately 9% of our net revenue for 2016.
Note 3—Acquisitions
On October 1, 2014, we completed the acquisition of Medical Action Industries Inc., (Medical Action), a leading producer of surgical kits and procedure trays, which has enabled an expansion of our capabilities in the assembly of kits, packs and trays for the healthcare market.
On November 1, 2014, we acquired ArcRoyal, a privately held surgical kitting company based in Ireland (ArcRoyal). The transaction expanded our capabilities in the assembly of kits, packs and trays in the European healthcare market.
The combined consideration for these two acquisitions was $261.6 million, net of cash acquired, and including debt assumed of $13.4 million (capitalized lease obligations).
The purchase price was allocated to the underlying assets acquired and liabilities assumed based upon our preliminary estimate of their fair values at the date of acquisition, with certain exceptions permitted under GAAP. The combined purchase price exceeded the preliminary estimated fair value of the net tangible and identifiable intangible assets by $150.6 million, which was allocated to goodwill. The following table presents, in the aggregate, the estimated fair value of the assets acquired and liabilities assumed recognized as of the acquisition date.
Preliminary Fair Value Estimated as of Acquisition Date | Measurement Period Adjustments Recorded in 2015 | Fair Value as of Acquisition Date | ||||||||
Assets acquired: | ||||||||||
Current assets | $ | 90,608 | $ | (229 | ) | $ | 90,379 | |||
Property and equipment | 34,048 | (2,502 | ) | 31,546 | ||||||
Goodwill | 150,492 | 121 | 150,613 | |||||||
Intangible assets | 77,623 | — | 77,623 | |||||||
Total assets | 352,771 | (2,610 | ) | 350,161 | ||||||
Liabilities assumed: | ||||||||||
Current liabilities | 64,736 | (1,187 | ) | 63,549 | ||||||
Noncurrent liabilities | 26,426 | (1,423 | ) | 25,003 | ||||||
Total liabilities | 91,162 | (2,610 | ) | 88,552 | ||||||
Fair value of net assets acquired, net of cash | $ | 261,609 | $ | — | $ | 261,609 | ||||
We are amortizing the fair value of acquired intangible assets, primarily customer relationships, over their weighted average useful lives of 14 years.
Goodwill of $150.6 million held in the CPS segment consists largely of expected opportunities to expand our kitting capabilities. None of the goodwill recognized is expected to be deductible for income tax purposes.
Pro forma results of operations for these acquisitions have not been presented because the effects on revenue and net income were not material to our historic consolidated financial statements.
41
We recognized pre-tax acquisition-related expenses of $1.2 million, $9.8 million and $16.1 million for the years ended December 31, 2016, 2015 and 2014. The current year amount related primarily to costs incurred to settle certain obligations and address other on-going matters associated with the acquisitions of ArcRoyal and Medical Action which were partially offset on a year-to-date basis by the first quarter gain on the sale of property acquired with Medical Action. Charges in 2015 consisted primarily of costs to continue the integration of Medical Action and ArcRoyal which were acquired in the fourth quarter of 2014 including certain severance and contractual payments to the former owner and costs to transition information technology and other administrative functions. Charges in 2014 consisted primarily of transaction costs incurred to perform due diligence and analysis related to these acquisitions, as well as costs to resolve certain contingencies with the former Movianto owner.
Note 4—Accounts and Notes Receivable, Net
Allowances for losses on accounts and notes receivable of $13.5 million and $13.2 million have been applied as reductions of accounts receivable at December 31, 2016 and 2015. Write-offs of accounts and notes receivable were $0.9 million, $1.2 million and $3.1 million for 2016, 2015 and 2014.
Note 5—Merchandise Inventories
At December 31, 2016 and 2015 we had inventory of $916.3 million and $940.8 million, of which $902.2 million and $927.7 million were valued under LIFO. If LIFO inventories had been valued on a current cost or first-in, first-out (FIFO) basis, they would have been greater by $115.4 million and $116.4 million as of December 31, 2016 and 2015. At December 31, 2016 and 2015, included in our inventory was $19.7 million and $22.3 million in raw materials, $10.8 million and $10.6 million in work in process and the remainder was finished goods.
Note 6—Financing Receivables and Payables
At December 31, 2016 and 2015, we had financing receivables of $156.5 million and $198.5 million and related payables of $110.0 million and $148.5 million outstanding under our order-to-cash program, which were included in other current assets and other current liabilities, respectively, in the consolidated balance sheets.
Note 7—Property and Equipment
Property and equipment consists of the following:
December 31, | 2016 | 2015 | |||||
Warehouse equipment | $ | 167,889 | $ | 168,599 | |||
Computer equipment | 51,513 | 53,566 | |||||
Building and improvements | 72,780 | 75,229 | |||||
Leasehold improvements | 60,360 | 60,522 | |||||
Land and improvements | 17,311 | 17,386 | |||||
Furniture and fixtures | 14,668 | 14,517 | |||||
Office equipment and other | 8,596 | 8,216 | |||||
393,117 | 398,035 | ||||||
Accumulated depreciation | (201,399 | ) | (189,105 | ) | |||
Property and equipment, net | $ | 191,718 | $ | 208,930 | |||
The gross value of assets recorded under capital leases was $36.4 million and $38.7 million with associated accumulated depreciation of $16.4 million and $13.7 million as of December 31, 2016 and 2015, respectively. Depreciation expense for property and equipment and assets under capital leases was $32.5 million, $36.3 million and $35.5 million for the years ended December 31, 2016, 2015 and 2014.
Property held for sale in our Domestic segment was $3.8 million and $5.6 million at December 31, 2015 and 2014 and was included in other current assets, net, in the consolidated balance sheets. We had no property held for sale at December 31, 2016.
42
Note 8—Goodwill and Intangible Assets
In connection with our new three segment structure, goodwill has been reallocated based on the relative fair value of the underlying reporting units. We performed an interim impairment analysis in the first quarter of 2016 as a result of this change and noted no impairment. The following table summarizes the changes in the carrying amount of goodwill through December 31, 2016:
Domestic | International | CPS | Consolidated | ||||||||||||
Carrying amount of goodwill, December 31, 2015 | $ | 180,006 | $ | 23,426 | 216,187 | $ | 419,619 | ||||||||
Currency translation adjustments | — | (4,035 | ) | (648 | ) | (4,683 | ) | ||||||||
Carrying amount of goodwill, December 31, 2016 | $ | 180,006 | $ | 19,391 | $ | 215,539 | $ | 414,936 | |||||||
Intangible assets at December 31, 2016 and 2015 were as follows:
2016 | 2015 | ||||||||||||||
Customer Relationships | Other Intangibles | Customer Relationships | Other Intangibles | ||||||||||||
Gross intangible assets | $ | 118,223 | $ | 4,045 | $ | 121,888 | $ | 4,621 | |||||||
Accumulated amortization | (38,429 | ) | (1,328 | ) | (29,872 | ) | (1,387 | ) | |||||||
Net intangible assets | $ | 79,794 | $ | 2,717 | $ | 92,016 | $ | 3,234 | |||||||
Weighted average useful life | 14 years | 5 years | 14 years | 5 years | |||||||||||
At December 31, 2016, $11.7 million in net intangible assets were held in the Domestic segment, $10.8 million in the International segment, and $60.1 million in CPS. Amortization expense for intangible assets was $10.0 million for 2016, $9.8 million for 2015 and $5.5 million for 2014.
Based on the current carrying value of intangible assets subject to amortization, estimated amortization expense is $9.5 million for 2017, $8.9 million for 2018, $8.8 million for 2019, $8.7 million for 2020 and $8.3 million for 2021.
Note 9—Exit and Realignment Costs
We periodically incur exit and realignment and other charges associated with optimizing our operations which include the closure and consolidation of certain distribution and logistics centers, administrative offices and warehouses in the United States and Europe. These charges also include costs associated with our strategic organizational realignment which include management changes, certain professional fees, and costs to streamline administrative functions and processes.
Exit and realignment charges by segment for the years ended December 31, 2016, 2015 and 2014 were as follows:
Year ended December 31, | 2016 | 2015 | 2014 | ||||||||
Domestic segment | $ | 14,304 | $ | 7,318 | $ | 7,223 | |||||
International segment | 7,491 | 11,312 | 19,490 | ||||||||
CPS | 1,669 | — | — | ||||||||
Total exit and realignment charges | $ | 23,464 | $ | 18,630 | $ | 26,713 | |||||
43
The following table summarizes the activity related to exit and realignment cost accruals through December 31, 2016:
Lease Obligations | Severance and Other | Total | |||||||||
Accrued exit and realignment charges, January 1, 2014 | $ | 2,434 | $ | 475 | $ | 2,909 | |||||
Provision for exit and realignment activities | 5,592 | 6,338 | 11,930 | ||||||||
Change in estimate | (1,260 | ) | — | (1,260 | ) | ||||||
Cash payments, net of sublease income | (3,191 | ) | (3,926 | ) | (7,117 | ) | |||||
Accrued exit and realignment charges, December 31, 2014 | 3,575 | 2,887 | 6,462 | ||||||||
Provision for exit and realignment activities | 1,118 | 3,965 | 5,083 | ||||||||
Change in estimate | (3,002 | ) | (875 | ) | (3,877 | ) | |||||
Cash payments, net of sublease income | (1,205 | ) | (4,137 | ) | (5,342 | ) | |||||
Accrued exit and realignment charges, December 31, 2015 | 486 | 1,840 | 2,326 | ||||||||
Provision for exit and realignment activities | — | 11,823 | 11,823 | ||||||||
Change in estimate | — | (261 | ) | (261 | ) | ||||||
Cash payments, net of sublease income | (486 | ) | (11,164 | ) | (11,650 | ) | |||||
Accrued exit and realignment charges, December 31, 2016 | $ | — | $ | 2,238 | $ | 2,238 | |||||
In addition to the exit and realignment accruals in the preceding table, we also incurred $11.9 million of costs that were expensed as incurred for the year ended December 31, 2016, including $3.6 million in professional services fees, $3.0 million in asset write-downs, $2.9 million in information system costs, $0.9 million in labor costs, $0.7 million in other facility costs and $0.8 million in other costs.
We incurred $17.4 million of costs that were expensed as incurred for the year ended December 31, 2015, including $4.6 million in facility costs, $4.5 million in accelerated amortization of an information system that was replaced, $3.8 million in professional services fees, $3.0 million in information systems costs, $1.4 million in labor costs and $0.1 million in other costs.
We incurred $16.0 million of costs that were expensed as incurred for the year ended December 31, 2014, including $6.0 million in accelerated amortization of an information system that was replaced, $3.3 million in facility costs, $2.9 million in labor costs, $1.8 million in information systems costs, $1.3 million in professional services fees and $0.7 million in other costs.
We do not expect significant additional costs in 2017 for activities that were initiated through December 31, 2016; however, we anticipate new actions will be taken in 2017 that will incur costs similar to prior years.
Note 10—Debt
Debt consists of the following:
2016 | 2015 | ||||||||||||||
December 31, | Carrying Amount | Estimated Fair Value | Carrying Amount | Estimated Fair Value | |||||||||||
3.875% Senior Notes, $275 million par value, maturing September 2021 | $ | 272,394 | $ | 274,450 | $ | 271,928 | $ | 273,680 | |||||||
4.375% Senior Notes, $275 million par value, maturing December 2024 | 272,444 | 269,995 | 272,054 | 272,828 | |||||||||||
Capital leases | 24,549 | 24,549 | 29,539 | 29,539 | |||||||||||
Total debt | 569,387 | 568,994 | 573,521 | 576,047 | |||||||||||
Less current maturities | (4,804 | ) | (4,804 | ) | (5,026 | ) | (5,026 | ) | |||||||
Long-term debt | $ | 564,583 | $ | 564,190 | $ | 568,495 | $ | 571,021 | |||||||
44
On September 16, 2014, we issued $275 million of 3.875% senior notes due 2021 (the “2021 Notes”) and $275 million of 4.375% senior notes due 2024 (the “2024 Notes”). The 2021 Notes were sold at 99.5% of the principal amount with an effective yield of 3.951%. The 2024 Notes were sold at 99.6% of the principal with an effective yield of 4.422%. Interest on the 2021 Notes and 2024 Notes is payable semiannually in arrears, commencing on March 15, 2015 and December 15, 2014, respectively. We have the option to redeem the 2021 Notes and 2024 Notes in part or in whole prior to maturity at a redemption price equal to the greater of 100% of the principal amount or the present value of the remaining scheduled payments discounted at the Treasury Rate plus 30 basis points. We have $3.5 million of deferred costs associated with the issuance of the 2021 Notes and 2024 Notes which were unamortized as of December 31, 2016.
In 2014, we used a portion of the net proceeds from the 2021 Notes and the 2024 Notes to fund the early retirement of all of our $200 million of 6.35% senior notes due in 2016 (2016 Notes), which included the payment of a $17.4 million redemption premium. We recorded a net loss on the early retirement of our 2016 Notes of $14.9 million, which includes the redemption premium offset by the recognition of a gain on previously settled interest rate swaps.
On September 17, 2014, we amended our existing Credit Agreement, increasing our borrowing capacity from $350 million to $450 million and extending the term through September 2019 (the Amended Credit Agreement). Under the Amended Credit Agreement, we have the ability to request two one-year extensions and to request an increase in aggregate commitments by up to $200 million. The interest rate on the Amended Credit Agreement, which is subject to adjustment quarterly, is based on the London Interbank Offered Rate (LIBOR), the Federal Funds Rate or the Prime Rate, plus an adjustment based on the better of our debt ratings or leverage ratio (Credit Spread) as defined by the Amended Credit Agreement. We are charged a commitment fee of between 12.5 and 25.0 basis points on the unused portion of the facility. The terms of the Amended Credit Agreement limit the amount of indebtedness that we may incur and require us to maintain ratios for leverage and interest coverage, including on a pro forma basis in the event of an acquisition. Based on our leverage ratio at December 31, 2016, the interest rate under the credit facility is LIBOR plus 1.375%.
At December 31, 2016 we had no borrowings and letters of credit of approximately $4.9 million outstanding under the Amended Credit Agreement, leaving $445 million available for borrowing. We also have a $1.1 million and $1.2 million letter of credit outstanding as of December 31, 2016 and 2015, which supports our facilities leased in Europe.
The Amended Credit Agreement and Senior Notes contain cross-default provisions which could result in the acceleration of payments due in the event of default of either agreement. We believe we were in compliance with our debt covenants at December 31, 2016.
Cash payments for interest during 2016, 2015 and 2014 were $27.9 million, $27.7 million and $18.5 million.
We enter into long-term non-cancellable leases for certain warehouse equipment and vehicles which, for accounting purposes, are classified as capital leases. We also operate a kitting facility acquired with Medical Action which is subject to a long-term capital lease. As of December 31, 2016, we were obligated under capital leases for minimum annual rental payments as follows:
Year | |||
2017 | $ | 6,625 | |
2018 | 5,433 | ||
2019 | 3,688 | ||
2020 | 2,624 | ||
2021 | 2,139 | ||
Thereafter | 14,303 | ||
Total minimum lease payments | 34,812 | ||
Less: Amounts representing interest | (10,263 | ) | |
Present value of total minimum lease payments | 24,549 | ||
Less: Current portion of capital lease obligations | (4,804 | ) | |
Long-term portion of capital lease obligations | $ | 19,745 | |
45
Note 11—Derivative Financial Instruments
We are directly and indirectly affected by changes in certain market conditions, which may adversely impact our financial performance. These are referred to as “market risks.” When deemed appropriate, we use derivatives as a risk management tool to mitigate the potential impact of certain market risks. The primary market risk managed through the use of derivative instruments is foreign currency exchange risk.
We use forward contracts which are agreements to buy or sell a quantity of a currency or commodity at a predetermined future date, and at a predetermined rate or price. We do not enter into derivative financial instruments for trading purposes.
At December 31, 2016 we did not have any derivatives outstanding. The total notional value of our foreign currency derivatives as of December 31, 2015 was $2.0 million. The notional amounts of the derivative instruments do not necessarily represent the amounts exchanged by the parties and, therefore, are not a direct measure of our exposure to the financial risks described above. The amounts are calculated by reference to the notional amounts and by other terms of the derivative, such as foreign currency exchange rates. We determine the fair value of our derivatives based on quoted market prices. We do not view the fair value of our derivatives in isolation, but rather in relation to the fair values or cash flows of the underlying exposure. Our derivatives are straightforward over-the-counter instruments with liquid markets.
All derivatives are carried at fair value in our consolidated balance sheets in other assets and other liabilities line items. In 2016, 2015 and 2014, we did not have any derivatives designated as hedging instruments and all gains and losses resulting from changes in the fair value of derivative instruments were immediately recognized into earnings. At December 31, 2015 the fair value of our foreign currency contracts included in other assets on the consolidated balance sheet was $0.4 million. The impact from changes in the fair value of these foreign currency derivatives included in other operating income, net was $0.4 million expense for 2016, $0.3 million expense for 2015 and $0.2 million income for 2014. We consider the risk of counterparty default to be minimal.
Note 12—Share-Based Compensation
We maintain a share-based compensation plan (the Plan) that is administered by the Compensation and Benefits Committee of the Board of Directors. The Plan allows us to award or grant to officers, directors and employees incentive, non-qualified and deferred compensation stock options, stock appreciation rights (SARs), performance shares, and restricted and unrestricted stock. We use authorized and unissued common shares for grants of restricted stock or for stock option exercises. At December 31, 2016 approximately 2.3 million common shares were available for issuance under the Plan.
Restricted stock awarded under the Plan generally vests over one, three or five years. Certain restricted stock grants contain accelerated vesting provisions, based on the satisfaction of certain performance criteria related to the achievement of certain financial and operational results. Performance shares awarded under the Plan are issuable as restricted stock upon meeting performance goals and generally have a total performance and vesting period of three years. Stock options awarded under the Plan are generally subject to graded vesting over three years and expire seven to ten years from the date of grant. The options are granted at a price equal to fair market value at the date of grant. We did not grant any stock options in 2016, 2015, or 2014.
We recognize the fair value of stock-based compensation awards, which is based upon the market price of the underlying common stock at the grant date, on a straight-line basis over the estimated requisite service period, which may be based on a service condition, a performance condition, or a combination of both. The fair value of performance shares as of the date of grant is estimated assuming that performance goals will be achieved at target levels. If such goals are not probable of being met, or are probable of being met at different levels, recognized compensation cost is adjusted to reflect the change in estimated fair value of restricted stock to be issued at the end of the performance period.
Total share-based compensation expense for December 31, 2016, 2015 and 2014, was $12.0 million, $11.3 million and $8.2 million, with recognized tax benefits of $4.5 million, $4.4 million and $3.2 million. Unrecognized compensation cost related to nonvested restricted stock awards, net of estimated forfeitures, was $19.2 million at December 31, 2016. This amount is expected to be recognized over a weighted-average period of 2.4 years, based on the maximum remaining vesting period required under the awards, and the amount that would be recognized over a shorter period based on accelerated vesting provisions, is approximately $0.7 million. Unrecognized compensation cost related to nonvested performance share awards as of December 31, 2016 was $0.8 million and will be recognized primarily in 2017 if the related performance targets are met.
46
The following table summarizes the activity and value of nonvested restricted stock and performance share awards for the years ended December 31, 2016, 2015 and 2014,:
2016 | 2015 | 2014 | ||||||||||||||||||
Number of Shares | Weighted Average Grant-date Value Per Share | Number of Shares | Weighted Average Grant-date Value Per Share | Number of Shares | Weighted Average Grant-date Value Per Share | |||||||||||||||
Nonvested awards at beginning of year | 1,104 | $ | 40.02 | 814 | $ | 33.29 | 738 | $ | 30.81 | |||||||||||
Granted | 572 | 34.75 | 545 | 34.25 | 371 | 33.69 | ||||||||||||||
Vested | (337 | ) | 32.65 | (195 | ) | 29.90 | (201 | ) | 31.01 | |||||||||||
Forfeited | (248 | ) | 34.06 | (60 | ) | 33.27 | (94 | ) | 30.89 | |||||||||||
Nonvested awards at end of year | 1,091 | 44.15 | 1,104 | 40.02 | 814 | 33.29 | ||||||||||||||
The total value of restricted stock vesting during the years ended December 31, 2016, 2015 and 2014, was $11.0 million, $5.8 million and $6.2 million.
The following table summarizes the activity and terms of outstanding options at December 31, 2016, and for each of the years in the three-year period then ended:
Number of Options | Weighted Average Exercise Price Per Share | Weighted Average Remaining Contractual Life (years) | Aggregate Intrinsic Value | ||||||||||
Options outstanding at December 31, 2013 | 64 | $ | 23.33 | ||||||||||
Exercised | (49 | ) | 24.21 | ||||||||||
Forfeited | — | — | |||||||||||
Options outstanding at December 31, 2014 | 15 | 20.49 | |||||||||||
Exercised | (15 | ) | 20.49 | ||||||||||
Forfeited | — | — | |||||||||||
Options outstanding at December 31, 2015 | — | — | |||||||||||
Exercised | — | — | |||||||||||
Forfeited | — | — | |||||||||||
Options outstanding at December 31, 2016 | — | $ | — | — | $ | — | |||||||
The total intrinsic value of stock options exercised during the years ended December 31, 2016, 2015 and 2014, was $0.0 million, $0.2 million and $0.5 million. No options were granted in 2016, 2015 or 2014. No options were outstanding as of December 31, 2016.
Note 13—Retirement Plans
Savings and Retirement Plans. We maintain a voluntary 401(k) savings and retirement plan covering substantially all full-time and certain part-time employees in the United States who have completed one month of service and have attained age 18. We match a certain percentage of each employee’s contribution. The plan also provides for a discretionary contribution by us to the plan for all eligible employees of 1% of their salary, subject to certain limits, and discretionary profit-sharing contributions. We may increase or decrease our contributions at our discretion, on a prospective basis. We incurred $12.5 million, $12.3 million, and $10.8 million of expense related to this plan in 2016, 2015 and 2014. We also maintain defined contribution plans in some of the European countries in which we operate. Expenses related to these plans were not material in 2016, 2015 and 2014.
U.S. Retirement Plans. We have a noncontributory, unfunded retirement plan for certain officers and other key employees in the United States (U.S. Retirement Plan). In February 2012, our Board of Directors amended the U.S. Retirement Plan to freeze benefit levels and modify vesting provisions under the plan effective as of March 31, 2012.
47
The following table sets forth the U.S. Retirement Plan’s financial status and the amounts recognized in our consolidated balance sheets:
December 31, | 2016 | 2015 | |||||
Change in benefit obligation | |||||||
Benefit obligation, beginning of year | $ | 51,023 | $ | 49,055 | |||
Interest cost | 1,980 | 1,806 | |||||
Actuarial (gain) loss | 2,616 | 1,855 | |||||
Benefits paid | (3,568 | ) | (1,693 | ) | |||
Benefit obligation, end of year | $ | 52,051 | $ | 51,023 | |||
Change in plan assets | |||||||
Fair value of plan assets, beginning of year | $ | — | $ | — | |||
Employer contribution | 3,568 | 1,693 | |||||
Benefits paid | (3,568 | ) | (1,693 | ) | |||
Fair value of plan assets, end of year | $ | — | $ | — | |||
Funded status, end of year | $ | (52,051 | ) | $ | (51,023 | ) | |
Amounts recognized in the consolidated balance sheets | |||||||
Other current liabilities | $ | (3,405 | ) | $ | (2,977 | ) | |
Other liabilities | (48,644 | ) | (48,023 | ) | |||
Accumulated other comprehensive loss | 18,071 | 17,102 | |||||
Net amount recognized | $ | (33,978 | ) | $ | (33,898 | ) | |
Accumulated benefit obligation | $ | 52,051 | $ | 51,023 | |||
Weighted average assumptions used to determine benefit obligation | |||||||
Discount rate | 3.75 | % | 4.00 | % | |||
Rate of increase in compensation levels | N/A | N/A | |||||
Plan benefit obligations of the U.S. Retirement Plan were measured as of December 31, 2016 and 2015. Plan benefit obligations are determined using assumptions developed at the measurement date. The weighted average discount rate, which is used to calculate the present value of plan liabilities, is an estimate of the interest rate at which the plan liabilities could be effectively settled at the measurement date. When estimating the discount rate, we review yields available on high-quality, fixed-income debt instruments and use a yield curve model from which the discount rate is derived by applying the projected benefit payments under the plan to points on a published yield curve.
The components of net periodic benefit cost for the U.S. Retirement Plan, which is included in distribution, selling, and administrative expenses in the consolidated statements of income, were as follows:
Year ended December 31, | 2016 | 2015 | 2014 | ||||||||
Interest cost | $ | 1,980 | $ | 1,806 | $ | 1,849 | |||||
Recognized net actuarial loss | 1,646 | 1,606 | 816 | ||||||||
Net periodic benefit cost | $ | 3,626 | $ | 3,412 | $ | 2,665 | |||||
Weighted average assumptions used to determine net periodic benefit cost | |||||||||||
Discount rate | 4.00 | % | 3.75 | % | 4.50 | % | |||||
Rate of increase in future compensation levels | N/A | N/A | N/A | ||||||||
Amounts recognized for the U.S. Retirement Plan as a component of accumulated other comprehensive loss as of the end of the year that have not been recognized as a component of the net periodic benefit cost are presented in the following table. We expect to recognize approximately $1.8 million of the net actuarial loss reported in the following table as of December 31, 2016, as a component of net periodic benefit cost during 2017.
48
Year ended December 31, | 2016 | 2015 | |||||
Net actuarial loss | $ | (18,071 | ) | $ | (17,102 | ) | |
Deferred tax benefit | 7,048 | 6,663 | |||||
Amounts included in accumulated other comprehensive income (loss), net of tax | $ | (11,023 | ) | $ | (10,439 | ) | |
As of December 31, 2016, the expected benefit payments required for each of the next five years and the five-year period thereafter for the U.S. Retirement Plan were as follows:
Year | |||
2017 | $ | 3,374 | |
2018 | 3,269 | ||
2019 | 3,034 | ||
2020 | 2,968 | ||
2021 | 2,825 | ||
2022-2026 | 12,423 | ||
International Retirement Plans. Certain of our foreign subsidiaries have defined benefit pension plans covering substantially all of their respective employees. As of December 31, 2016 and 2015, the accumulated benefit obligation under these plans was $2.0 million and $1.9 million. We recorded $0.1 million, $0.1 million and $0.2 million in net periodic benefit cost in distribution, selling and administrative expenses for the years ended December 31, 2016, 2015 and 2014.
Note 14—Income Taxes
The components of income (loss) before income taxes consist of the following:
Year ended December 31, | 2016 | 2015 | 2014 | ||||||||
Income (loss) before income taxes: | |||||||||||
U.S. | $ | 150,942 | $ | 167,444 | $ | 155,132 | |||||
Foreign | 21,600 | 5,766 | (28,649 | ) | |||||||
Income before income taxes | $ | 172,542 | $ | 173,210 | $ | 126,483 | |||||
The income tax provision consists of the following:
Year ended December 31, | 2016 | 2015 | 2014 | ||||||||
Current tax provision (benefit): | |||||||||||
Federal | $ | 46,846 | $ | 60,757 | $ | 52,178 | |||||
State | 8,512 | 11,431 | 9,801 | ||||||||
Foreign | 4,179 | 3,714 | 1,386 | ||||||||
Total current tax provision | 59,537 | 75,902 | 63,365 | ||||||||
Deferred tax provision (benefit): | |||||||||||
Federal | 5,303 | (4,744 | ) | 282 | |||||||
State | 885 | (376 | ) | 295 | |||||||
Foreign | (1,970 | ) | (981 | ) | (3,962 | ) | |||||
Total deferred tax provision | 4,218 | (6,101 | ) | (3,385 | ) | ||||||
Total income tax provision | $ | 63,755 | $ | 69,801 | $ | 59,980 | |||||
49
A reconciliation of the federal statutory rate to our effective income tax rate is shown below:
Year ended December 31, | 2016 | 2015 | 2014 | |||||
Federal statutory rate | 35.0 | % | 35.0 | % | 35.0 | % | ||
Increases (decreases) in the rate resulting from: | ||||||||
State income taxes, net of federal income tax impact | 3.7 | % | 4.1 | % | 5.2 | % | ||
Foreign income taxes | (4.3 | )% | (2.8 | )% | 1.7 | % | ||
Valuation allowance | 0.5 | % | 1.2 | % | 3.2 | % | ||
Other | 2.1 | % | 2.8 | % | 2.3 | % | ||
Effective income tax rate | 37.0 | % | 40.3 | % | 47.4 | % | ||
The tax effects of temporary differences that give rise to significant portions of the deferred tax assets and deferred tax liabilities are presented below:
December 31, | 2016 | 2015 | |||||
Deferred tax assets: | |||||||
Employee benefit plans | $ | 35,540 | $ | 36,903 | |||
Accrued liabilities not currently deductible | 15,693 | 15,268 | |||||
Finance charges | 3,803 | 6,128 | |||||
Capital leases | 6,607 | 7,363 | |||||
Allowance for losses on accounts and notes receivable | 4,069 | 3,852 | |||||
Net operating loss carryforwards | 12,722 | 12,395 | |||||
Other | 4,183 | 2,475 | |||||
Total deferred tax assets | 82,617 | 84,384 | |||||
Less: valuation allowances | (12,332 | ) | (10,798 | ) | |||
Net deferred tax assets | 70,285 | 73,586 | |||||
Deferred tax liabilities: | |||||||
Merchandise inventories | 71,035 | 67,013 | |||||
Goodwill | 37,854 | 36,613 | |||||
Property and equipment | 14,910 | 14,651 | |||||
Computer software | 15,363 | 17,870 | |||||
Insurance | 368 | 268 | |||||
Intangible assets | 18,887 | 22,048 | |||||
Other | 230 | 206 | |||||
Total deferred tax liabilities | 158,647 | 158,669 | |||||
Net deferred tax liability | $ | (88,362 | ) | $ | (85,083 | ) | |
The valuation allowances relate to deferred tax assets in various state and non-U.S. jurisdictions. Based on management’s judgments using available evidence about historical and expected future taxable earnings, management believes it is more likely than not that we will realize the benefit of the existing deferred tax assets, net of valuation allowances, at December 31, 2016. The valuation allowances primarily relate to net operating loss carryforwards in non-U.S. jurisdictions which have various expiration dates ranging from five years to an unlimited carryforward period.
It is our intention to permanently reinvest the earnings of our non-U.S. subsidiaries in those operations. As of December 31, 2016, we have not made a provision for U.S. or additional foreign withholding taxes on investments in foreign subsidiaries that are permanently reinvested. Quantification of the deferred tax liability, if any, associated with permanently reinvested earnings is not practicable.
Cash payments for income taxes, including interest, for 2016, 2015 and 2014 were $74.1 million, $52.4 million and $81.6 million.
50
At December 31, 2016 and 2015, the liability for unrecognized tax benefits was $10.7 million and $7.7 million. A reconciliation of the changes in unrecognized tax benefits from the beginning to the end of the reporting period is as follows:
2016 | 2015 | ||||||
Unrecognized tax benefits at January 1, | $ | 7,657 | $ | 6,684 | |||
Increases for positions taken during current period | 2,322 | 1,968 | |||||
Increases for positions taken during prior periods | 1,135 | 481 | |||||
Decreases for positions taken during prior periods | (242 | ) | (1,476 | ) | |||
Lapse of statute of limitations | (21 | ) | — | ||||
Settlements with taxing authorities | (126 | ) | — | ||||
Unrecognized tax benefits at December 31, | $ | 10,725 | $ | 7,657 | |||
Included in the liability for unrecognized tax benefits at December 31, 2016 and 2015, were $4.7 million and $4.1 million of tax positions for which the ultimate deductibility is highly certain but for which there is uncertainty about the timing of such deductibility. These tax positions are temporary differences which do not impact the annual effective tax rate under deferred tax accounting. Any change in the deductibility period of these tax positions would impact the timing of cash payments to taxing jurisdictions. Unrecognized tax benefits of $4.8 million and $3.0 million at December 31, 2016 and 2015, would impact our effective tax rate if recognized.
We recognize accrued interest and penalties related to unrecognized tax benefits in income tax expense. Accrued interest at December 31, 2016 and 2015 was $0.4 million and $0.2 million. We recognized $0.2 million in interest income in 2016, $0.1 million in interest expense in 2015 and $0.1 million of interest expense in 2014. There were no penalties accrued at December 31, 2016 and 2015 or recognized in 2016, 2015 and 2014.
We file income tax returns in the U.S. federal and various state and foreign jurisdictions. Our U.S. federal income tax returns for the years 2014 and 2015 are subject to examination. Our income tax returns for U.S. state and local jurisdictions are generally open for the years 2013 through 2015; however, certain returns may be subject to examination for differing periods. The former owner is contractually obligated to indemnify us for all income tax liabilities incurred by the Movianto business prior to its acquisition on August 31, 2012.
Note 15—Net Income per Common Share
The following table summarizes the calculation of net income per share attributable to common shareholders for the years ended December 31, 2016, 2015 and 2014:
Year ended December 31, | 2016 | 2015 | 2014 | ||||||||
Numerator: | |||||||||||
Net income | $ | 108,787 | $ | 103,409 | $ | 66,503 | |||||
Less: income allocated to unvested restricted shares | (1,147 | ) | (925 | ) | (597 | ) | |||||
Net income attributable to common shareholders—basic | 107,640 | 102,484 | 65,906 | ||||||||
Add: undistributed income attributable to unvested restricted shares—basic | 297 | 235 | 18 | ||||||||
Less: undistributed income attributable to unvested restricted shares—diluted | (297 | ) | (235 | ) | (18 | ) | |||||
Net income attributable to common shareholders—diluted | $ | 107,640 | $ | 102,484 | $ | 65,906 | |||||
Denominator: | |||||||||||
Weighted average shares outstanding—basic | 61,093 | 62,116 | 62,220 | ||||||||
Dilutive shares—stock options | — | 1 | 6 | ||||||||
Weighted average shares outstanding—diluted | 61,093 | 62,117 | 62,226 | ||||||||
Net income attributable to common shareholders: | |||||||||||
Basic | $ | 1.76 | $ | 1.65 | $ | 1.06 | |||||
Diluted | $ | 1.76 | $ | 1.65 | $ | 1.06 | |||||
51
Note 16—Shareholders’ Equity
We had a shareholder rights agreement that expired on April 30, 2014 and was not renewed or replaced. All Rights attendant to outstanding shares of our common stock under the agreement also expired on April 30, 2014.
In February 2014 our Board of Directors authorized a share repurchase program of up to $100 million of our outstanding common stock to be executed at the discretion of management over a three -year period, expiring in February 2017. The program was intended, in part, to offset shares issued in conjunction with our stock incentive plans and return capital to shareholders. The authorized repurchases under this program were completed in December 2016.
In October 2016, our Board of Directors authorized a new share repurchase program of up to $100 million of the company’s outstanding common stock to be executed at the discretion of management over a three -year period. The new authorization took effect in December 2016 upon the completion of the previous authorization. The timing of repurchases and the exact number of shares of common stock to be purchased will depend upon market conditions and other factors and may be suspended or discontinued at any time. Purchases under the share repurchase program are made either pursuant to 10b5-1 plans entered into by the company from time to time and/or during the company’s scheduled quarterly trading windows for officers and directors.
During the year ended December 31, 2016, we repurchased in open-market transactions and retired approximately 2.0 million shares of our common stock for an aggregate of $71.0 million, or an average price per share of $34.72. As of December 31, 2016, we have $99.0 million in remaining authorization available under the repurchase program. We have elected to allocate any excess of share repurchase price over par value to retained earnings.
During the year ended December 31, 2015, we repurchased in open-market transactions and retired approximately 0.6 million shares of our common stock for an aggregate of $20.0 million, or an average price per share of $34.04.
During the year ended December 31, 2014, we repurchased in open-market transactions and retired approximately 0.3 million shares of our common stock for an aggregate of $9.9 million, or an average price per share of $34.31.
During 2014, we purchased the remaining outside stockholder's interest in a consolidated subsidiary that was partially owned for $1.5 million. Therefore we do not present a noncontrolling interest as a component of shareholders' equity as of December 31, 2016 or 2015. The noncontrolling interest in net income was not material in 2014.
Note 17 — Accumulated Other Comprehensive Income
The following tables show the changes in accumulated other comprehensive income (loss) by component for the years ended December 31, 2016, 2015 and 2014:
Retirement Plans | Currency Translation Adjustments | Other | Total | ||||||||||||
Accumulated other comprehensive income (loss), December 31, 2015 | $ | (10,482 | ) | $ | (41,228 | ) | $ | (115 | ) | $ | (51,825 | ) | |||
Other comprehensive income (loss) before reclassifications | (2,716 | ) | (15,017 | ) | 86 | (17,647 | ) | ||||||||
Income tax | 869 | — | — | 869 | |||||||||||
Other comprehensive income (loss) before reclassifications, net of tax | (1,847 | ) | (15,017 | ) | 86 | (16,778 | ) | ||||||||
Amounts reclassified from accumulated other comprehensive income (loss) | 1,646 | — | — | 1,646 | |||||||||||
Income tax | (526 | ) | — | — | (526 | ) | |||||||||
Amounts reclassified from accumulated other comprehensive income (loss), net of tax | 1,120 | — | — | 1,120 | |||||||||||
Other comprehensive income (loss) | (727 | ) | (15,017 | ) | 86 | (15,658 | ) | ||||||||
Accumulated other comprehensive income (loss), December 31, 2016 | $ | (11,209 | ) | $ | (56,245 | ) | $ | (29 | ) | $ | (67,483 | ) | |||
52
Retirement Plans | Currency Translation Adjustments | Other | Total | ||||||||||||
Accumulated other comprehensive income (loss), December 31, 2014 | $ | (10,323 | ) | $ | (13,647 | ) | $ | (31 | ) | $ | (24,001 | ) | |||
Other comprehensive income (loss) before reclassifications | (1,855 | ) | (27,581 | ) | (84 | ) | (29,520 | ) | |||||||
Income tax | 670 | — | — | 670 | |||||||||||
Other comprehensive income (loss) before reclassifications, net of tax | (1,185 | ) | (27,581 | ) | (84 | ) | (28,850 | ) | |||||||
Amounts reclassified from accumulated other comprehensive income (loss) | 1,606 | — | — | 1,606 | |||||||||||
Income tax | (580 | ) | — | — | (580 | ) | |||||||||
Amounts reclassified from accumulated other comprehensive income (loss), net of tax | 1,026 | — | — | 1,026 | |||||||||||
Other comprehensive income (loss) | (159 | ) | (27,581 | ) | (84 | ) | (27,824 | ) | |||||||
Accumulated other comprehensive income (loss), December 31, 2015 | $ | (10,482 | ) | $ | (41,228 | ) | $ | (115 | ) | $ | (51,825 | ) | |||
Retirement Plans | Currency Translation Adjustments | Other | Total | ||||||||||||
Accumulated other comprehensive income (loss), December 31, 2013 | $ | (6,479 | ) | $ | 15,892 | $ | 155 | $ | 9,568 | ||||||
Other comprehensive income (loss) before reclassifications | (7,021 | ) | (29,539 | ) | (73 | ) | (36,633 | ) | |||||||
Income tax | 2,671 | — | — | 2,671 | |||||||||||
Other comprehensive income before reclassifications, net of tax | (4,350 | ) | (29,539 | ) | (73 | ) | (33,962 | ) | |||||||
Amounts reclassified from accumulated other comprehensive income (loss) | 816 | — | (185 | ) | 631 | ||||||||||
Income tax | (310 | ) | — | 72 | (238 | ) | |||||||||
Amounts reclassified from accumulated other comprehensive income (loss), net of tax | 506 | — | (113 | ) | 393 | ||||||||||
Other comprehensive income (loss) | (3,844 | ) | (29,539 | ) | (186 | ) | (33,569 | ) | |||||||
Accumulated other comprehensive income (loss), December 31, 2014 | $ | (10,323 | ) | $ | (13,647 | ) | $ | (31 | ) | $ | (24,001 | ) | |||
We include amounts reclassified out of accumulated other comprehensive income related to defined benefit pension plans as a component of net periodic pension cost recorded in selling, general and administrative expenses. For the years ended December 31, 2016, 2015 and 2014 we reclassified $1.6 million, $1.6 million and $0.8 million of actuarial net losses.
Note 18—Commitments and Contingencies
We have a contractual commitment to outsource information technology operations, including the management and operation of our information technology systems and distributed services processing, as well as application support, development and enhancement services. This agreement expires in October 2017, with two optional one year extensions. The commitment is cancelable with 180 days notice and payment of a termination fee based upon certain costs which would be incurred by the vendor as a direct result of the early termination.
We pay scheduled fees under the agreement, which can vary based on changes in the Consumer Price Index and the level of support required. Assuming no early termination of the contract, our estimated remaining annual obligations under this agreement are $29.8 million in 2017. We paid $35.8 million, $35.9 million and $36.6 million under this contract in 2016, 2015 and 2014.
53
We have entered into non-cancelable agreements to lease most of our office and warehouse facilities with remaining terms generally ranging from one to 20 years. Certain leases include renewal options, generally for five-year increments. We also lease most of our transportation and material handling equipment for terms generally ranging from three to ten years. At December 31, 2016, future minimum annual payments under non-cancelable lease agreements with original terms in excess of one year, and including payments required under operating leases for facilities we have vacated, are as follows:
Total | |||
2017 | $ | 59,249 | |
2018 | 53,684 | ||
2019 | 43,168 | ||
2020 | 32,146 | ||
2021 | 22,783 | ||
Thereafter | 50,341 | ||
Total minimum payments | $ | 261,371 | |
Rent expense for all operating leases for the years ended December 31, 2016, 2015 and 2014, was $70.0 million, $70.8 million and $77.8 million.
Note 19—Legal Proceedings
We are subject to various legal actions that are ordinary and incidental to our business, including contract disputes, employment, workers’ compensation, product liability, regulatory and other matters. We have insurance coverage for employment, product liability, workers’ compensation and other personal injury litigation matters, subject to policy limits, applicable deductibles and insurer solvency. We establish reserves from time to time based upon periodic assessment of the potential outcomes of pending matters.
Based on current knowledge and the advice of counsel, we believe that the accrual as of December 31, 2016 for currently pending matters considered probable of loss, which is not material, is sufficient. In addition, we believe that other currently pending matters are not reasonably likely to result in a material loss, as payment of the amounts claimed is remote, the claims are insignificant, individually and in the aggregate, or the claims are expected to be adequately covered by insurance.
Note 20—Segment Information
We periodically evaluate our application of accounting guidance for reportable segments and disclose information about reportable segments based on the way management organizes the enterprise for making operating decisions and assessing performance. We report our business under three segments: Domestic, International and CPS. The Domestic segment includes our United States distribution, logistics and value-added services business. The International segment consists of our European distribution, logistics and value-added services business. CPS provides product-related solutions, including surgical and procedural kitting and sourcing.
We evaluate the performance of our segments based on their operating earnings excluding acquisition-related and exit and realignment charges, certain purchase price fair value adjustments, and other substantive items that, either as a result of their nature or size, would not be expected to occur as part of our normal business operations on a regular basis. Segment assets exclude inter-segment account balances as we believe their inclusion would be misleading or not meaningful. We believe all inter-segment sales are at prices that approximate market.
54
The following tables present financial information by segment:
Year ended December 31, | 2016 | 2015 | 2014 | ||||||||
Net revenue: | |||||||||||
Segment net revenue | |||||||||||
Domestic | $ | 9,191,574 | $ | 9,176,855 | $ | 8,910,733 | |||||
International | 343,674 | 372,638 | 481,402 | ||||||||
CPS | 539,580 | 561,812 | 294,358 | ||||||||
Total segment net revenue | 10,074,828 | 10,111,305 | 9,686,493 | ||||||||
Inter-segment net revenue | |||||||||||
CPS | (351,397 | ) | (338,359 | ) | (246,311 | ) | |||||
Total inter-segment net revenue | (351,397 | ) | (338,359 | ) | (246,311 | ) | |||||
Consolidated net revenue | $ | 9,723,431 | $ | 9,772,946 | $ | 9,440,182 | |||||
Operating earnings (loss): | |||||||||||
Domestic | $ | 165,495 | $ | 162,944 | $ | 165,769 | |||||
International | 5,596 | 3,198 | (6,808 | ) | |||||||
CPS | 53,799 | 61,932 | 46,527 | ||||||||
Inter-segment eliminations | (616 | ) | (811 | ) | (2,950 | ) | |||||
Acquisition-related and exit and realignment charges (1) | (24,675 | ) | (28,404 | ) | (42,801 | ) | |||||
Fair value adjustments related to purchase accounting | — | — | 3,706 | ||||||||
Other (2) | — | 1,500 | (3,907 | ) | |||||||
Consolidated operating earnings | $ | 199,599 | $ | 200,359 | $ | 159,536 | |||||
Depreciation and amortization: | |||||||||||
Domestic | $ | 29,469 | $ | 34,425 | $ | 35,499 | |||||
International | 17,117 | 18,903 | 19,837 | ||||||||
CPS | 8,807 | 8,180 | 1,790 | ||||||||
Consolidated depreciation and amortization | $ | 55,393 | $ | 61,508 | $ | 57,126 | |||||
Capital expenditures: | |||||||||||
Domestic | $ | 14,333 | $ | 17,310 | $ | 52,529 | |||||
International | 12,874 | 18,158 | 18,279 | ||||||||
CPS | 2,914 | 1,148 | — | ||||||||
Consolidated capital expenditures | $ | 30,121 | $ | 36,616 | $ | 70,808 | |||||
(1) The years ended December 31, 2015 and 2014 included $4.5 million and $6.0 million, respectively of accelerated amortization related to an information system that was replaced.
(2) Contract claim settlement for $3.9 million with a customer in the U.K. in 2014, of which $1.5 million was recovered through insurance in 2015.
55
December 31, | 2016 | 2015 | |||||
Total assets: | |||||||
Domestic | $ | 1,778,481 | $ | 1,785,676 | |||
International | 352,898 | 406,787 | |||||
CPS | 400,885 | 420,293 | |||||
Segment assets | 2,532,264 | 2,612,756 | |||||
Cash and cash equivalents | 185,488 | 161,020 | |||||
Consolidated total assets | $ | 2,717,752 | $ | 2,773,776 | |||
The following tables present information by geographic area. Net revenues were attributed to geographic areas based on the locations from which we ship products or provide services. International operations consist primarily of Movianto’s operations in the United Kingdom, Germany, France, and other European countries.
Year ended December 31, | 2016 | 2015 | 2014 | ||||||||
Net revenue: | |||||||||||
United States | $ | 9,338,543 | $ | 9,356,140 | $ | 8,951,852 | |||||
United Kingdom | 169,874 | 192,818 | 253,527 | ||||||||
Ireland | 41,214 | 44,168 | 6,928 | ||||||||
France | 38,761 | 44,592 | 54,656 | ||||||||
Germany | 47,514 | 46,848 | 47,682 | ||||||||
Other European countries | 87,525 | 88,380 | 125,537 | ||||||||
Consolidated net revenue | $ | 9,723,431 | $ | 9,772,946 | $ | 9,440,182 | |||||
December 31, | 2016 | 2015 | |||||
Long-lived assets: | |||||||
United States | $ | 217,985 | $ | 237,641 | |||
Germany | 39,734 | 43,917 | |||||
United Kingdom | 32,349 | 41,594 | |||||
Ireland | 21,567 | 24,316 | |||||
France | 5,173 | 5,397 | |||||
Other European countries | 16,643 | 19,718 | |||||
Consolidated long-lived assets | $ | 333,451 | $ | 372,583 | |||
Note 21—Condensed Consolidating Financial Information
The following tables present condensed consolidating financial information for: Owens & Minor, Inc. (O&M); the guarantors of Owens & Minor, Inc.’s 2021 Notes and 2024 Notes, on a combined basis; and the non-guarantor subsidiaries of the 2021 Notes and 2024 Notes, on a combined basis. The guarantor subsidiaries are 100% owned by Owens & Minor, Inc. Separate financial statements of the guarantor subsidiaries are not presented because the guarantees by our guarantor subsidiaries are full and unconditional, as well as joint and several, and we believe the condensed consolidating financial information is more meaningful in understanding the financial position, results of operations and cash flows of the guarantor subsidiaries.
56
Condensed Consolidating Financial Information
Year ended December 31, 2016 | Owens & Minor, Inc. | Guarantor Subsidiaries | Non-guarantor Subsidiaries | Eliminations | Consolidated | ||||||||||||||
Statements of Income | |||||||||||||||||||
Net revenue | $ | — | $ | 9,190,660 | $ | 697,559 | $ | (164,788 | ) | $ | 9,723,431 | ||||||||
Cost of goods sold | — | 8,330,960 | 370,594 | (165,433 | ) | 8,536,121 | |||||||||||||
Gross margin | — | 859,700 | 326,965 | 645 | 1,187,310 | ||||||||||||||
Distribution, selling and administrative expenses | 1,127 | 670,800 | 298,497 | — | 970,424 | ||||||||||||||
Acquisition-related and exit and realignment charges | — | 15,611 | 9,064 | — | 24,675 | ||||||||||||||
Other operating (income) expense, net | — | (5,066 | ) | (2,322 | ) | — | (7,388 | ) | |||||||||||
Operating (loss) earnings | (1,127 | ) | 178,355 | 21,726 | 645 | 199,599 | |||||||||||||
Interest expense (income), net | 28,901 | (4,744 | ) | 2,900 | — | 27,057 | |||||||||||||
Income (loss) before income taxes | (30,028 | ) | 183,099 | 18,826 | 645 | 172,542 | |||||||||||||
Income tax (benefit) provision | — | 61,545 | 2,210 | — | 63,755 | ||||||||||||||
Equity in earnings of subsidiaries | 138,815 | — | — | (138,815 | ) | — | |||||||||||||
Net income (loss) | 108,787 | 121,554 | 16,616 | (138,170 | ) | 108,787 | |||||||||||||
Other comprehensive income (loss), net of tax | (15,658 | ) | (640 | ) | (15,017 | ) | 15,657 | (15,658 | ) | ||||||||||
Comprehensive income (loss) | $ | 93,129 | $ | 120,914 | $ | 1,599 | $ | (122,513 | ) | $ | 93,129 | ||||||||
Year ended December 31, 2015 | Owens & Minor, Inc. | Guarantor Subsidiaries | Non-guarantor Subsidiaries | Eliminations | Consolidated | ||||||||||||||
Statements of Income | |||||||||||||||||||
Net revenue | $ | — | $ | 9,176,855 | $ | 751,442 | $ | (155,351 | ) | $ | 9,772,946 | ||||||||
Cost of goods sold | — | 8,305,734 | 410,009 | (157,370 | ) | 8,558,373 | |||||||||||||
Gross margin | — | 871,121 | 341,433 | 2,019 | 1,214,573 | ||||||||||||||
Distribution, selling and administrative expenses | 1,229 | 684,021 | 308,533 | — | 993,783 | ||||||||||||||
Acquisition-related and exit and realignment charges | — | 8,877 | 19,527 | — | 28,404 | ||||||||||||||
Other operating (income) expense, net | — | (2,621 | ) | (5,352 | ) | — | (7,973 | ) | |||||||||||
Operating (loss) earnings | (1,229 | ) | 180,844 | 18,725 | 2,019 | 200,359 | |||||||||||||
Interest expense (income), net | 27,457 | (3,371 | ) | 3,063 | — | 27,149 | |||||||||||||
Income (loss) before income taxes | (28,686 | ) | 184,215 | 15,662 | 2,019 | 173,210 | |||||||||||||
Income tax (benefit) provision | (9,837 | ) | 71,807 | 7,831 | — | 69,801 | |||||||||||||
Equity in earnings of subsidiaries | 122,258 | — | — | (122,258 | ) | — | |||||||||||||
Net income (loss) | 103,409 | 112,408 | 7,831 | (120,239 | ) | 103,409 | |||||||||||||
Other comprehensive income (loss), net of tax | (27,824 | ) | (243 | ) | (27,581 | ) | 27,824 | (27,824 | ) | ||||||||||
Comprehensive income (loss) | $ | 75,585 | $ | 112,165 | $ | (19,750 | ) | $ | (92,415 | ) | $ | 75,585 | |||||||
57
Year ended December 31, 2014 | Owens & Minor, Inc. | Guarantor Subsidiaries | Non-guarantor Subsidiaries | Eliminations | Consolidated | ||||||||||||||
Statements of Income | |||||||||||||||||||
Net revenue | $ | — | $ | 8,910,274 | $ | 626,044 | $ | (96,136 | ) | $ | 9,440,182 | ||||||||
Cost of goods sold | — | 8,051,350 | 311,947 | (93,081 | ) | 8,270,216 | |||||||||||||
Gross margin | — | 858,924 | 314,097 | (3,055 | ) | 1,169,966 | |||||||||||||
Distribution, selling and administrative expenses | 954 | 659,453 | 323,695 | — | 984,102 | ||||||||||||||
Acquisition-related and exit and realignment charges | — | 15,065 | 27,736 | — | 42,801 | ||||||||||||||
Other operating (income) expense, net | — | (10,261 | ) | (6,212 | ) | — | (16,473 | ) | |||||||||||
Operating (loss) earnings | (954 | ) | 194,667 | (31,122 | ) | (3,055 | ) | 159,536 | |||||||||||
Loss on early retirement of debt | 14,890 | — | — | — | 14,890 | ||||||||||||||
Interest expense (income), net | 15,737 | 1,520 | 906 | — | 18,163 | ||||||||||||||
Income (loss) before income taxes | (31,581 | ) | 193,147 | (32,028 | ) | (3,055 | ) | 126,483 | |||||||||||
Income tax (benefit) provision | (1,700 | ) | 65,983 | (4,303 | ) | — | 59,980 | ||||||||||||
Equity in earnings of subsidiaries | 96,384 | — | — | (96,384 | ) | — | |||||||||||||
Net income (loss) | 66,503 | 127,164 | (27,725 | ) | (99,439 | ) | 66,503 | ||||||||||||
Other comprehensive income (loss), net of tax | (33,569 | ) | (3,846 | ) | (29,539 | ) | 33,385 | (33,569 | ) | ||||||||||
Comprehensive income (loss) | $ | 32,934 | $ | 123,318 | $ | (57,264 | ) | $ | (66,054 | ) | $ | 32,934 | |||||||
58
Condensed Consolidating Financial Information
December 31, 2016 | Owens & Minor, Inc. | Guarantor Subsidiaries | Non-guarantor Subsidiaries | Eliminations | Consolidated | ||||||||||||||
Balance Sheets | |||||||||||||||||||
Assets | |||||||||||||||||||
Current assets | |||||||||||||||||||
Cash and cash equivalents | $ | 38,015 | $ | 61,266 | $ | 86,207 | $ | — | $ | 185,488 | |||||||||
Accounts and notes receivable, net | — | 526,170 | 90,016 | (10,102 | ) | 606,084 | |||||||||||||
Merchandise inventories | — | 856,566 | 61,505 | (1,760 | ) | 916,311 | |||||||||||||
Other current assets | 106 | 86,907 | 167,143 | — | 254,156 | ||||||||||||||
Total current assets | 38,121 | 1,530,909 | 404,871 | (11,862 | ) | 1,962,039 | |||||||||||||
Property and equipment, net | — | 97,725 | 93,993 | — | 191,718 | ||||||||||||||
Goodwill, net | — | 180,006 | 234,930 | — | 414,936 | ||||||||||||||
Intangible assets, net | — | 11,655 | 70,856 | — | 82,511 | ||||||||||||||
Due from O&M and subsidiaries | — | 573,395 | — | (573,395 | ) | — | |||||||||||||
Advances to and investments in consolidated subsidiaries | 2,044,963 | — | — | (2,044,963 | ) | — | |||||||||||||
Other assets, net | — | 49,887 | 16,661 | — | 66,548 | ||||||||||||||
Total assets | $ | 2,083,084 | $ | 2,443,577 | $ | 821,311 | $ | (2,630,220 | ) | $ | 2,717,752 | ||||||||
Liabilities and equity | |||||||||||||||||||
Current liabilities | |||||||||||||||||||
Accounts payable | $ | — | $ | 683,189 | $ | 75,512 | $ | (7,951 | ) | $ | 750,750 | ||||||||
Accrued payroll and related liabilities | — | 32,814 | 12,237 | — | 45,051 | ||||||||||||||
Other current liabilities | 7,106 | 93,327 | 138,404 | — | 238,837 | ||||||||||||||
Total current liabilities | 7,106 | 809,330 | 226,153 | (7,951 | ) | 1,034,638 | |||||||||||||
Long-term debt, excluding current portion | 544,838 | 3,219 | 16,526 | — | 564,583 | ||||||||||||||
Due to O&M and subsidiaries | 571,102 | — | 48,044 | (619,146 | ) | — | |||||||||||||
Intercompany debt | — | 138,890 | — | (138,890 | ) | — | |||||||||||||
Deferred income taxes | — | 70,280 | 20,103 | — | 90,383 | ||||||||||||||
Other liabilities | — | 60,578 | 7,532 | — | 68,110 | ||||||||||||||
Total liabilities | 1,123,046 | 1,082,297 | 318,358 | (765,987 | ) | 1,757,714 | |||||||||||||
Equity | — | ||||||||||||||||||
Common stock | 122,062 | — | — | — | 122,062 | ||||||||||||||
Paid-in capital | 219,955 | 174,614 | 583,872 | (758,486 | ) | 219,955 | |||||||||||||
Retained earnings (deficit) | 685,504 | 1,196,341 | (42,032 | ) | (1,154,309 | ) | 685,504 | ||||||||||||
Accumulated other comprehensive income (loss) | (67,483 | ) | (9,675 | ) | (38,887 | ) | 48,562 | (67,483 | ) | ||||||||||
Total equity | 960,038 | 1,361,280 | 502,953 | (1,864,233 | ) | 960,038 | |||||||||||||
Total liabilities and equity | $ | 2,083,084 | $ | 2,443,577 | $ | 821,311 | $ | (2,630,220 | ) | $ | 2,717,752 | ||||||||
59
Condensed Consolidating Financial Information
December 31, 2015 | Owens & Minor, Inc. | Guarantor Subsidiaries | Non-guarantor Subsidiaries | Eliminations | Consolidated | ||||||||||||||
Balance Sheets | |||||||||||||||||||
Assets | |||||||||||||||||||
Current assets | |||||||||||||||||||
Cash and cash equivalents | $ | 103,284 | $ | 5,614 | $ | 52,122 | $ | — | $ | 161,020 | |||||||||
Accounts and notes receivable, net | — | 507,673 | 89,895 | (9,633 | ) | 587,935 | |||||||||||||
Merchandise inventories | — | 883,232 | 59,930 | (2,387 | ) | 940,775 | |||||||||||||
Other current assets | 104 | 72,683 | 212,183 | — | 284,970 | ||||||||||||||
Total current assets | 103,388 | 1,469,202 | 414,130 | (12,020 | ) | 1,974,700 | |||||||||||||
Property and equipment, net | — | 103,219 | 105,711 | — | 208,930 | ||||||||||||||
Goodwill, net | — | 180,006 | 239,613 | — | 419,619 | ||||||||||||||
Intangible assets, net | — | 13,731 | 81,519 | — | 95,250 | ||||||||||||||
Due from O&M and subsidiaries | — | 518,473 | — | (518,473 | ) | — | |||||||||||||
Advances to and investments in consolidated subsidiaries | 1,967,176 | — | — | (1,967,176 | ) | — | |||||||||||||
Other assets, net | — | 57,409 | 17,868 | — | 75,277 | ||||||||||||||
Total assets | $ | 2,070,564 | $ | 2,342,040 | $ | 858,841 | $ | (2,497,669 | ) | $ | 2,773,776 | ||||||||
Liabilities and equity | |||||||||||||||||||
Current liabilities | |||||||||||||||||||
Accounts payable | $ | — | $ | 662,909 | $ | 56,073 | $ | (8,373 | ) | $ | 710,609 | ||||||||
Accrued payroll and related liabilities | — | 32,094 | 13,813 | — | 45,907 | ||||||||||||||
Other current liabilities | 6,924 | 109,137 | 191,012 | — | 307,073 | ||||||||||||||
Total current liabilities | 6,924 | 804,140 | 260,898 | (8,373 | ) | 1,063,589 | |||||||||||||
Long-term debt, excluding current portion | 543,982 | 4,527 | 19,986 | — | 568,495 | ||||||||||||||
Due to O&M and subsidiaries | 527,068 | — | 70,089 | (597,157 | ) | — | |||||||||||||
Intercompany debt | — | 138,890 | — | (138,890 | ) | — | |||||||||||||
Deferred income taxes | — | 67,562 | 18,764 | — | 86,326 | ||||||||||||||
Other liabilities | — | 57,573 | 5,203 | — | 62,776 | ||||||||||||||
Total liabilities | 1,077,974 | 1,072,692 | 374,940 | (744,420 | ) | 1,781,186 | |||||||||||||
Equity | — | ||||||||||||||||||
Common stock | 125,606 | — | — | — | 125,606 | ||||||||||||||
Paid-in capital | 211,943 | 174,612 | 583,873 | (758,485 | ) | 211,943 | |||||||||||||
Retained earnings (deficit) | 706,866 | 1,104,787 | (58,648 | ) | (1,046,139 | ) | 706,866 | ||||||||||||
Accumulated other comprehensive income (loss) | (51,825 | ) | (10,051 | ) | (41,324 | ) | 51,375 | (51,825 | ) | ||||||||||
Total equity | 992,590 | 1,269,348 | 483,901 | (1,753,249 | ) | 992,590 | |||||||||||||
Total liabilities and equity | $ | 2,070,564 | $ | 2,342,040 | $ | 858,841 | $ | (2,497,669 | ) | $ | 2,773,776 | ||||||||
60
Condensed Consolidating Financial Information
Year ended December 31, 2016 | Owens & Minor, Inc. | Guarantor Subsidiaries | Non-guarantor Subsidiaries | Eliminations | Consolidated | ||||||||||||||
Statements of Cash Flows | |||||||||||||||||||
Operating activities: | |||||||||||||||||||
Net income (loss) | $ | 108,787 | $ | 121,554 | $ | 16,616 | $ | (138,170 | ) | $ | 108,787 | ||||||||
Adjustments to reconcile net income to cash (used for) provided by operating activities: | |||||||||||||||||||
Equity in earnings of subsidiaries | (138,815 | ) | — | — | 138,815 | — | |||||||||||||
Depreciation and amortization | — | 29,589 | 25,804 | — | 55,393 | ||||||||||||||
Share-based compensation expense | — | 12,042 | — | — | 12,042 | ||||||||||||||
Provision for losses on accounts and notes receivable | — | 84 | 293 | — | 377 | ||||||||||||||
Deferred income tax (benefit) expense | — | 6,245 | (2,027 | ) | — | 4,218 | |||||||||||||
Changes in operating assets and liabilities: | |||||||||||||||||||
Accounts and notes receivable | — | (18,581 | ) | (6,358 | ) | (305 | ) | (25,244 | ) | ||||||||||
Merchandise inventories | — | 26,666 | (3,449 | ) | (628 | ) | 22,589 | ||||||||||||
Accounts payable | — | 20,280 | 22,862 | 288 | 43,430 | ||||||||||||||
Net change in other assets and liabilities | 180 | (26,397 | ) | (11,342 | ) | — | (37,559 | ) | |||||||||||
Other, net | 854 | 999 | 1,048 | — | 2,901 | ||||||||||||||
Cash provided by (used for) operating activities of continuing operations | (28,994 | ) | 172,481 | 43,447 | — | 186,934 | |||||||||||||
Investing activities: | |||||||||||||||||||
Additions to computer software and intangible assets | — | (4,004 | ) | (5,815 | ) | — | (9,819 | ) | |||||||||||
Additions to property and equipment | — | (10,329 | ) | (9,973 | ) | — | (20,302 | ) | |||||||||||
Proceeds from sale of property and equipment | — | 125 | 5,250 | — | 5,375 | ||||||||||||||
Cash used for investing activities of continuing operations | — | (14,208 | ) | (10,538 | ) | — | (24,746 | ) | |||||||||||
Financing activities: | |||||||||||||||||||
Change in intercompany advances | 101,424 | (100,308 | ) | (1,116 | ) | — | — | ||||||||||||
Cash dividends paid | (63,382 | ) | — | — | — | (63,382 | ) | ||||||||||||
Repurchases of common stock | (71,028 | ) | — | — | — | (71,028 | ) | ||||||||||||
Excess tax benefits related to share-based compensation | 761 | — | — | — | 761 | ||||||||||||||
Other, net | (4,050 | ) | (2,313 | ) | (1,931 | ) | — | (8,294 | ) | ||||||||||
Cash provided by (used for) financing activities | (36,275 | ) | (102,621 | ) | (3,047 | ) | — | (141,943 | ) | ||||||||||
Effect of exchange rates on cash and cash equivalents | — | — | 4,223 | — | 4,223 | ||||||||||||||
Net increase (decrease) in cash and cash equivalents | (65,269 | ) | 55,652 | 34,085 | — | 24,468 | |||||||||||||
Cash and cash equivalents at beginning of year | 103,284 | 5,614 | 52,122 | — | 161,020 | ||||||||||||||
Cash and cash equivalents at end of year | $ | 38,015 | $ | 61,266 | $ | 86,207 | $ | — | $ | 185,488 | |||||||||
61
Condensed Consolidating Financial Information
Year ended December 31, 2015 | Owens & Minor, Inc. | Guarantor Subsidiaries | Non-guarantor Subsidiaries | Eliminations | Consolidated | ||||||||||||||
Statements of Cash Flows | |||||||||||||||||||
Operating activities: | |||||||||||||||||||
Net income (loss) | $ | 103,409 | $ | 112,408 | $ | 7,831 | $ | (120,239 | ) | $ | 103,409 | ||||||||
Adjustments to reconcile net income to cash (used for) provided by operating activities: | |||||||||||||||||||
Equity in earnings of subsidiaries | (122,258 | ) | — | — | 122,258 | — | |||||||||||||
Depreciation and amortization | — | 34,497 | 31,485 | — | 65,982 | ||||||||||||||
Share-based compensation expense | — | 11,306 | — | — | 11,306 | ||||||||||||||
Provision for losses on accounts and notes receivable | — | 202 | (226 | ) | — | (24 | ) | ||||||||||||
Deferred income tax (benefit) expense | — | (5,267 | ) | (834 | ) | — | (6,101 | ) | |||||||||||
Changes in operating assets and liabilities: | |||||||||||||||||||
Accounts and notes receivable | — | 12,076 | (27,274 | ) | 33,531 | 18,333 | |||||||||||||
Merchandise inventories | — | (66,317 | ) | (1,277 | ) | (2,133 | ) | (69,727 | ) | ||||||||||
Accounts payable | — | 95,624 | 13,418 | 4,969 | 114,011 | ||||||||||||||
Net change in other assets and liabilities | 666 | 61,454 | 6,443 | (38,386 | ) | 30,177 | |||||||||||||
Other, net | 855 | 920 | 456 | — | 2,231 | ||||||||||||||
Cash provided by (used for) operating activities of continuing operations | (17,328 | ) | 256,903 | 30,022 | — | 269,597 | |||||||||||||
Investing activities: | |||||||||||||||||||
Additions to computer software and intangible assets | — | (13,688 | ) | (2,397 | ) | — | (16,085 | ) | |||||||||||
Additions to property and equipment | — | (3,621 | ) | (16,910 | ) | — | (20,531 | ) | |||||||||||
Proceeds from sale of property and equipment | — | 87 | 56 | — | 143 | ||||||||||||||
Cash used for investing activities of continuing operations | — | (17,222 | ) | (19,251 | ) | — | (36,473 | ) | |||||||||||
Financing activities: | |||||||||||||||||||
Proceeds from (repayment of) revolver | — | (33,700 | ) | — | — | (33,700 | ) | ||||||||||||
Change in intercompany advances | 183,688 | (201,851 | ) | 18,163 | — | — | |||||||||||||
Cash dividends paid | (63,651 | ) | — | — | — | (63,651 | ) | ||||||||||||
Repurchases of common stock | (20,000 | ) | — | — | — | (20,000 | ) | ||||||||||||
Excess tax benefits related to share-based compensation | 646 | — | — | — | 646 | ||||||||||||||
Other, net | (2,084 | ) | (2,428 | ) | (3,016 | ) | — | (7,528 | ) | ||||||||||
Cash provided by (used for) financing activities | 98,599 | (237,979 | ) | 15,147 | — | (124,233 | ) | ||||||||||||
Effect of exchange rates on cash and cash equivalents | — | — | (4,643 | ) | — | (4,643 | ) | ||||||||||||
Net increase (decrease) in cash and cash equivalents | 81,271 | 1,702 | 21,275 | — | 104,248 | ||||||||||||||
Cash and cash equivalents at beginning of year | 22,013 | 3,912 | 30,847 | — | 56,772 | ||||||||||||||
Cash and cash equivalents at end of year | $ | 103,284 | $ | 5,614 | $ | 52,122 | $ | — | $ | 161,020 | |||||||||
62
Condensed Consolidating Financial Information
Year ended December 31, 2014 | Owens & Minor, Inc. | Guarantor Subsidiaries | Non-guarantor Subsidiaries | Eliminations | Consolidated | |||||||||||||||
Statements of Cash Flows | ||||||||||||||||||||
Operating activities: | ||||||||||||||||||||
Net income (loss) | $ | 66,503 | $ | 127,164 | $ | (27,725 | ) | $ | (99,439 | ) | $ | 66,503 | ||||||||
Adjustments to reconcile net income to cash provided by (used for) operating activities: | ||||||||||||||||||||
Equity in earnings of subsidiaries | (96,384 | ) | — | — | 96,384 | — | ||||||||||||||
Depreciation and amortization | 2 | 35,879 | 27,526 | — | 63,407 | |||||||||||||||
Loss on early retirement of debt | 14,890 | — | — | — | 14,890 | |||||||||||||||
Share-based compensation expense | — | 8,369 | (162 | ) | — | 8,207 | ||||||||||||||
Provision for losses on accounts and notes receivable | — | (36 | ) | 484 | — | 448 | ||||||||||||||
Deferred income tax (benefit) expense | — | 1,292 | (4,677 | ) | — | (3,385 | ) | |||||||||||||
Changes in operating assets and liabilities: | — | — | — | |||||||||||||||||
Accounts and notes receivable | — | (24,440 | ) | 6,185 | 452 | (17,803 | ) | |||||||||||||
Merchandise inventories | — | (65,916 | ) | 8,308 | 279 | (57,329 | ) | |||||||||||||
Accounts payable | — | (28,580 | ) | (24,613 | ) | 1,045 | (52,148 | ) | ||||||||||||
Net change in other assets and liabilities | (455 | ) | (12,341 | ) | (14,311 | ) | 1,279 | (25,828 | ) | |||||||||||
Other, net | (1,161 | ) | (9 | ) | 447 | — | (723 | ) | ||||||||||||
Cash provided by (used for) operating activities | (16,605 | ) | 41,382 | (28,538 | ) | — | (3,761 | ) | ||||||||||||
Investing activities: | ||||||||||||||||||||
Acquisitions, net of cash acquired | — | — | (248,536 | ) | — | (248,536 | ) | |||||||||||||
Additions to computer software and intangible assets | — | (18,054 | ) | (4,330 | ) | — | (22,384 | ) | ||||||||||||
Additions to property and equipment | — | (34,475 | ) | (13,949 | ) | — | (48,424 | ) | ||||||||||||
Proceeds from the sale of investments | — | 1,937 | — | — | 1,937 | |||||||||||||||
Proceeds from sale of property and equipment | — | 156 | — | — | 156 | |||||||||||||||
Cash used for investing activities of continuing operations | — | (50,436 | ) | (266,815 | ) | — | (317,251 | ) | ||||||||||||
Financing activities: | — | |||||||||||||||||||
Proceeds from issuance of debt | 547,693 | — | — | — | 547,693 | |||||||||||||||
Proceeds from revolver | — | 33,700 | — | — | 33,700 | |||||||||||||||
Repayment of debt | (217,352 | ) | — | — | — | (217,352 | ) | |||||||||||||
Change in intercompany advances | (287,275 | ) | (21,106 | ) | 308,381 | — | — | |||||||||||||
Cash dividends paid | (63,104 | ) | — | — | — | (63,104 | ) | |||||||||||||
Repurchases of common stock | (9,934 | ) | — | — | — | (9,934 | ) | |||||||||||||
Financing costs paid | (4,780 | ) | (611 | ) | — | — | — | (5,391 | ) | |||||||||||
Excess tax benefits related to share-based compensation | 582 | — | — | — | 582 | |||||||||||||||
Proceeds from exercise of stock options | 1,180 | — | — | — | 1,180 | |||||||||||||||
Purchase of noncontrolling interest | — | — | (1,500 | ) | — | (1,500 | ) | |||||||||||||
Other, net | (2,783 | ) | (1,029 | ) | (3,502 | ) | — | (7,314 | ) | |||||||||||
Cash provided by (used for) financing activities | (35,773 | ) | 10,954 | 303,379 | — | 278,560 | ||||||||||||||
Effect of exchange rate changes on cash and cash equivalents | — | — | (2,681 | ) | — | (2,681 | ) | |||||||||||||
Net increase (decrease) in cash and cash equivalents | (52,378 | ) | 1,900 | 5,345 | — | (45,133 | ) | |||||||||||||
Cash and cash equivalents at beginning of year | 74,391 | 2,012 | 25,502 | — | 101,905 | |||||||||||||||
Cash and cash equivalents at end of year | $ | 22,013 | $ | 3,912 | $ | 30,847 | $ | — | $ | 56,772 | ||||||||||
63
Report of Independent Registered Public Accounting Firm
The Board of Directors and Shareholders
Owens & Minor, Inc.:
We have audited the accompanying consolidated balance sheets of Owens & Minor, Inc. and subsidiaries (the Company) as of December 31, 2016 and 2015, and the related consolidated statements of income, comprehensive income, changes in shareholders’ equity, and cash flows for each of the years in the three-year period ended December 31, 2016. These consolidated financial statements are the responsibility of the Company’s management. Our responsibility is to express an opinion on these consolidated financial statements based on our audits.
We conducted our audits in accordance with the standards of the Public Company Accounting Oversight Board (United States). Those standards require that we plan and perform the audit to obtain reasonable assurance about whether the financial statements are free of material misstatement. An audit includes examining, on a test basis, evidence supporting the amounts and disclosures in the financial statements. An audit also includes assessing the accounting principles used and significant estimates made by management, as well as evaluating the overall financial statement presentation. We believe that our audits provide a reasonable basis for our opinion.
In our opinion, the consolidated financial statements referred to above present fairly, in all material respects, the financial position of Owens & Minor, Inc. and subsidiaries as of December 31, 2016 and 2015, and the results of their operations and their cash flows for each of the years in the three-year period ended December 31, 2016, in conformity with U.S. generally accepted accounting principles.
We also have audited, in accordance with the standards of the Public Company Accounting Oversight Board (United States), Owens & Minor, Inc.’s internal control over financial reporting as of December 31, 2016, based on criteria established in Internal Control - Integrated Framework (2013) issued by the Committee of Sponsoring Organizations of the Treadway Commission (COSO), and our report dated February 17, 2017, expressed an unqualified opinion on the effectiveness of the Company’s internal control over financial reporting.
/s/ KPMG LLP
Richmond, Virginia
February 17, 2017
64
SELECTED QUARTERLY FINANCIAL INFORMATION
(unaudited)
Year Ended December 31, 2016 | |||||||||||||||
1st | 2nd | 3rd | 4th | ||||||||||||
(in thousands, except per share data) | Quarter (1) | Quarter (2) | Quarter (3) | Quarter (4) | |||||||||||
Net revenue | $ | 2,455,793 | $ | 2,483,686 | $ | 2,415,601 | $ | 2,368,361 | |||||||
Gross margin | $ | 296,636 | $ | 299,420 | $ | 296,275 | $ | 294,980 | |||||||
Net income | $ | 24,135 | $ | 27,716 | $ | 29,831 | $ | 27,105 | |||||||
Net income attributable to Owens & Minor, Inc. per common share: | |||||||||||||||
Basic | $ | 0.39 | $ | 0.45 | $ | 0.48 | $ | 0.45 | |||||||
Diluted | $ | 0.39 | $ | 0.45 | $ | 0.48 | $ | 0.45 | |||||||
Cash dividends per common share | $ | 0.255 | $ | 0.255 | $ | 0.255 | $ | 0.255 | |||||||
Market price: | |||||||||||||||
High | $ | 40.51 | $ | 41.20 | $ | 38.01 | $ | 35.77 | |||||||
Low | $ | 32.95 | $ | 35.21 | $ | 33.29 | $ | 31.94 | |||||||
Year Ended December 31, 2015 | |||||||||||||||
(in thousands, except per share data) | 1st Quarter (5) | 2nd Quarter (6) | 3rd Quarter (7) | 4th Quarter (8) | |||||||||||
Net revenue | $ | 2,391,196 | $ | 2,422,167 | $ | 2,471,669 | $ | 2,487,914 | |||||||
Gross margin | $ | 297,601 | $ | 298,337 | $ | 306,354 | $ | 312,282 | |||||||
Net income | $ | 18,940 | $ | 24,226 | $ | 28,176 | $ | 32,068 | |||||||
Net income attributable to Owens & Minor, Inc. per common share: | |||||||||||||||
Basic | $ | 0.30 | $ | 0.39 | $ | 0.45 | $ | 0.51 | |||||||
Diluted | $ | 0.30 | $ | 0.39 | $ | 0.45 | $ | 0.51 | |||||||
Cash dividends per common share | $ | 0.2525 | $ | 0.2525 | $ | 0.2525 | $ | 0.2525 | |||||||
Market price: | |||||||||||||||
High | $ | 36.35 | $ | 36.17 | $ | 35.55 | $ | 39.29 | |||||||
Low | $ | 32.99 | $ | 32.77 | $ | 31.91 | $ | 31.89 | |||||||
_____________________________
(1) We incurred charges of $10.5 million ($7.1 million after tax, or $0.11 per diluted share) in the first quarter of 2016 associated with acquisition-related and exit and realignment activities.
(2) We incurred charges of $6.8 million ($4.5 million after tax, or $0.07 per diluted common share) in the second quarter of 2016 associated with acquisition-related and exit and realignment activities.
(3) We incurred charges of $2.7 million ($1.7 million after tax, or $0.03 per diluted common share) in the third quarter of 2016 associated with acquisition-related and exit and realignment activities.
(4) We incurred charges of $4.7 million ($4.5 million after tax, or $0.07 per diluted common share) in the fourth quarter of 2016 associated with acquisition-related and exit and realignment activities.
(5) We incurred charges of $9.9 million ($8.6 million after tax, or $0.14 per diluted common share) in the first quarter of 2015 associated with acquisition-related and exit and realignment activities.
(6) We incurred charges of $5.7 million ($4.9 million after tax, or $0.07 per diluted common share) in the second quarter of 2015 associated with acquisition-related and exit and realignment activities.
(7) We incurred charges of $6.1 million ($5.4 million after tax, or $0.09 per diluted common share) in the third quarter of 2015 associated with acquisition-related and exit and realignment activities.
(8) We incurred charges of $6.6 million ($4.6 million after tax, or $0.07 per diluted common share) in the fourth quarter of 2015 associated with acquisition-related and exit and realignment activities, and a gain of $1.5 million ($1.5 million after tax, or $0.02 per diluted common share) associated with the partial recovery of a 2014 claim settlement.
65
Index to Exhibits
3.1 | Amended and Restated Articles of Incorporation of Owens & Minor, Inc. (incorporated herein by reference to our Current Report on Form 8-K, Exhibit 3.1, dated July 29, 2008) | |
3.2 | Amended and Restated Bylaws of Owens & Minor, Inc. as adopted February 5, 2015 (incorporated herein by reference to our Current Report on Form 8-K, Exhibit 3.1, dated February 10, 2015) | |
4.1 | Indenture, dated September 16, 2014, by and among Owens & Minor, Inc., Owens and Minor Distribution, Inc., Owens & Minor Medical, Inc. and U.S. Bank National Association, as trustee (incorporated herein by reference to our Current Report on Form 8-K, Exhibit 4.1, dated September 17, 2014) | |
4.2 | First Supplemental Indenture, dated September 16, 2014, by and among Owens & Minor, Inc., Owens and Minor Distribution, Inc., Owens & Minor Medical, Inc. and U.S. Bank National Association, as trustee (incorporated herein by reference to our Current Report on Form 8-K, Exhibit 4.2, dated September 17, 2014) | |
4.3 | Form of Global Note for the 3.875% Senior Notes due 2021 (incorporated herein by reference to our Current Report on Form 8-K, Exhibit A of Exhibit 4.2, dated September 17, 2014) | |
4.4 | Form of Global Note for the 4.375% Senior Notes due 2024 (incorporated herein by reference to our Current Report on Form 8-K, Exhibit B of Exhibit 4.2, dated September 17, 2014) | |
10.1 | Form of Director Restricted Stock Grant Agreement (incorporated herein by reference to our Quarterly Report on Form 10-Q, Exhibit 10.3, for the quarter ended March 31, 2008)* | |
10.2 | Form of Director Restricted Stock Agreement under the 2015 Plan (incorporated herein by reference to our Quarterly Report on Form 10-Q, Exhibit 10.3, for the quarter ended March 31, 2016)* | |
10.3 | Owens & Minor, Inc. Directors’ Deferred Compensation Plan, as amended and restated effective January 1, 2005 (incorporated herein by reference to our Quarterly Report on Form 10-Q, Exhibit 10.3, for the quarter ended September 30, 2008)* | |
10.4 | Deferral Election Form for Owens & Minor, Inc. Directors’ Deferred Compensation Plan (incorporated herein by reference to our Annual Report on Form 10-K, Exhibit 10.9, for the year ended December 31, 2010)* | |
10.5 | Form of Owens & Minor, Inc. Executive Severance Agreement effective January 1, 2011 (incorporated herein by reference to our Annual Report on Form 10-K, Exhibit 10.10, for the year ended December 31, 2010)* | |
10.6 | Owens & Minor, Inc. Supplemental Executive Retirement Plan, as amended and restated effective January 1, 2005 (“SERP”) (incorporated herein by reference to our Quarterly Report on Form 10-Q, Exhibit 10.1, for the quarter ended September 30, 2008)* | |
10.7 | Resolutions of the Board of Directors of the Company amending the SERP (incorporated herein by reference to our Annual Report on Form 10-K, Exhibit 10.12, for the year ended December 31, 2011)* | |
10.8 | Amendment effective March 1, 2016 of the Company’s SERP (incorporated herein by reference to our Quarterly Report on Form 10-Q, Exhibit 10.6, for the quarter ended March 31, 2016)* | |
10.9 | Amendment effective March 1, 2016 of Exhibit II of the Company’s SERP (incorporated herein by reference to our Quarterly Report on Form 10-Q, Exhibit 10.7, for the quarter ended March 31, 2016)* | |
10.10 | Owens & Minor, Inc. Amended and Restated Management Equity Ownership Program and Stock Ownership Rewards Program (incorporated herein by reference to our Annual Report on Form 10-K, Exhibit 10.15, for the year ended December 31, 2009)* | |
10.11 | Amendment to MEOP effective January 1, 2014 (incorporated herein by reference to our Annual Report on Form 10-K, Exhibit 10.10, for the year ended December 31, 2013)* | |
10.12 | Owens & Minor, Inc. Executive Deferred Compensation and Retirement Plan effective January 1, 2013 (incorporated herein by reference to our Quarterly Report on Form 10-Q, Exhibit 10.1, for the quarter ended March 31, 2013)* | |
66
10.13 | Owens & Minor, Inc. 2005 Stock Incentive Plan, as amended (incorporated herein by reference to our Registration Statement on Form S-8, Registration No. 333-124965)* | |
10.14 | Resolution of the Board of Directors of the Company amending the Owens & Minor, Inc. 2005 Stock Incentive Plan (incorporated herein by reference to our Annual Report on Form 10-K, Exhibit 10.21, for the year ended December 31, 2007)* | |
10.15 | Amendment to Owens & Minor, Inc. 2005 Stock Incentive Plan (incorporated herein by reference to our Quarterly Report on Form 10-Q, Exhibit 10.4, for the quarter ended March 31, 2008)* | |
10.16 | Amendment to Owens & Minor, Inc. 2005 Stock Incentive Plan (incorporated herein by reference to our definitive Proxy Statement filed pursuant to Section 14(a) of the Securities Exchange Act on March 17, 2010 (File No. 001-09810))* | |
10.17 | Form of Owens & Minor, Inc. Restricted Stock Grant Agreement under 2005 Stock Incentive Plan (incorporated herein by reference to our Quarterly Report on Form 10-Q, Exhibit 10.2, for the quarter ended March 31, 2008)* | |
10.18 | Form of Owens & Minor, Inc. Restricted Stock Agreement under the 2015 Stock Incentive Plan (incorporated herein by reference to our Quarterly Report on Form 10-Q, Exhibit 10.2, for the quarter ended March 31, 2016)* | |
10.19 | Form of Owens & Minor, Inc. Restricted Stock Unit Agreement under the Company’s 2015 Stock Incentive Plan (incorporated herein by reference to our Quarterly Report on Form 10-Q, Exhibit 10.1, for the quarter ended March 31, 2016)* | |
10.20 | Form of Performance Share Award Agreement under the 2005 Stock Incentive Plan (incorporated herein by reference to our Quarterly Report on Form 10-Q, Exhibit 10.1, for the quarter ended March 31, 2014)* | |
10.21 | Form of 2016 Performance Share Award Agreement under the 2015 Stock Incentive Plan (incorporated herein by reference to our Quarterly Report on Form 10-Q, Exhibit 10.4, for the quarter ended March 31, 2016)* | |
10.22 | Form of Performance Share Award Agreement for grant to James L. Bierman on September 2, 2014 (incorporated herein by reference to our Annual Report on Form 10-K, Exhibit 10.26, for the year ended December 31, 2014)* | |
10.23 | Form of 2015 Annual Executive Incentive Program (incorporated herein by reference to our Quarterly Report on Form 10-Q, Exhibit 10.5, for the quarter ended June 30, 2015) * | |
10.24 | Form of 2016 Executive Incentive Program (incorporated herein by reference to our Quarterly Report on Form 10-Q, Exhibit 10.5, for the quarter ended March 31, 2016) * | |
10.25 | Owens & Minor, Inc. Officer Severance Policy (incorporated herein by reference to our Quarterly Report on Form 10-Q, Exhibit 10.4, for the quarter ended June 30, 2015)* | |
10.26 | Policy on Recoupment of Executive Incentive Compensation (incorporated herein by reference to our Annual Report on Form 10-K, Exhibit 10.36, for the year ended December 31, 2009)* | |
10.27 | Owens & Minor, Inc. 2015 Stock Incentive Plan (incorporated herein by reference to our Registration Statement on Form S-8, Registration Number 333-203826)* | |
10.28 | Agreement dated February 14, 2015 Regarding the Retirement of James L. Bierman (incorporated herein by reference to our Quarterly Report on Form 10-Q, Exhibit 10.1, for the quarter ended June 30, 2015)* | |
10.29 | Employment Term Sheet Effective May 20, 2015 for P. Cody Phipps (incorporated herein by reference to our Quarterly Report on Form 10-Q, Exhibit 10.2, for the quarter ended June 30, 2015)* | |
10.30 | Restricted Stock Grant Agreement dated July 1, 2015 between the Company and P. Cody Phipps (incorporated herein by reference to our Quarterly Report on Form 10-Q, Exhibit 10.3, for the quarter ended June 30, 2015)* | |
10.31 | Credit Agreement dated as of June 5, 2012 by and among Owens & Minor Distribution, Inc. and Owens & Minor Medical, Inc. (as Borrowers), Owens & Minor, Inc. and certain of its domestic subsidiaries (as Guarantors), Wells Fargo Bank, N.A. (as Administrative Agent), JPMorgan Chase Bank, N.A. (as Syndication Agent) and a syndicate of banks as specified on the signature pages thereof (incorporated herein by reference to our Current Report on Form 8-K, Exhibit 10.1, dated June 8, 2012) | |
67
10.32 | First Amendment dated as of September 17, 2014 by and among Owens & Minor Distribution, Inc. and Owens & Minor Medical, Inc. ( as Borrowers), Owens & Minor, Inc. and certain of its domestic subsidiaries (as Guarantors) and Wells Fargo Bank, N.A. ( as Administrative Agent), to the Credit Agreement dated as of June 5, 2012 by and among the Borrowers, the Guarantors, a syndicate of financial institutions party thereto, the Administrative Agent, and the other agents party thereto (incorporated herein by reference to our Current Report on Form 8-K, Exhibit 10.1, dated September 18, 2014) | |
10.3 | Share Purchase Agreement dated August 31, 2012 between Celesio AG, Admenta Deutschland GmbH, Admenta Denmark ApS, Admenta France S.A. and OCP Portugal Produtos Farmaceuticos, S.A. (as Sellers) and O&M-Movianto Nederland B.V., O&M-Movianto UK Holdings Ltd, O&M-Movianto France Holdings SAS (as Purchasers) and Owens & Minor, Inc. (as Purchasers’ Guarantor) (incorporated herein by reference to our Current Report on Form 8-K, Exhibit10.1, dated September 4, 2012) | |
10.34 | Agreement and Plan of Merger, dated as of June 24, 2014, by and among Owens & Minor Inc., Mongoose Merger Sub Inc. and Medical Action Industries Inc. (incorporated herein by reference to our Current Report on Form 8-K, Exhibit 10.1, dated June 25, 2014) | |
11.1 | Calculation of Net Income per Common Share. Information related to this item is in Part II, Item 8, Notes to Consolidated Financial Statements, Note 15-Net Income per Common Share | |
21.1 | Subsidiaries of Registrant | |
23.1 | Consent of KPMG LLP, independent registered public accounting firm | |
31.1 | Certification of Chief Executive Officer pursuant to Rule 13(a)-14(a) under the Securities Exchange Act of 1934, as adopted pursuant to Section 302 of the Sarbanes-Oxley Act of 2002 | |
31.2 | Certification of Chief Financial Officer pursuant to Rule 13(a)-14(a) under the Securities Exchange Act of 1934, as adopted pursuant to Section 302 of the Sarbanes-Oxley Act of 2002 | |
32.1 | Certification of Chief Executive Officer Pursuant to 18 U.S.C. Section 1350, as Adopted Pursuant to Section 906 of the Sarbanes-Oxley Act of 2002 | |
32.2 | Certification of Chief Financial Officer Pursuant to 18 U.S.C. Section 1350, as Adopted Pursuant to Section 906 of the Sarbanes-Oxley Act of 2002 | |
101.INS | XBRL Instance Document | |
101.SCH | XBRL Taxonomy Extension Schema Document | |
101.CAL | XBRL Taxonomy Extension Calculation Linkbase Document | |
101.DEF | XBRL Taxonomy Definition Linkbase Document | |
101.LAB | XBRL Taxonomy Extension Label Linkbase Document | |
101.PRE | XBRL Taxonomy Extension Presentation Linkbase Document | |
* Management contract or compensatory plan or arrangement.
68
SIGNATURES
Pursuant to the requirements of Section 13 or 15(d) of the Securities Exchange Act of 1934, the registrant has duly caused this report to be signed on its behalf by the undersigned, thereunto duly authorized, on the 17th day of February, 2017.
OWENS & MINOR, INC. | |
/s/ Paul. C. Phipps | |
Paul C. Phipps President & Chief Executive Officer | |
Pursuant to the requirements of the Securities Exchange Act of 1934, this report has been signed below by the following persons on behalf of the registrant and in the capacities indicated on the 17th day of February, 2017:
/s/ Paul C. Phipps | /s/ Martha H. Marsh | |
Paul C. Phipps | Martha H. Marsh | |
President & Chief Executive Officer | Director | |
/s/ Craig R. Smith | /s/ Eddie N. Moore, Jr. | |
Craig R. Smith | Eddie N. Moore, Jr. | |
Chairman of the Board | Director | |
/s/ Richard A. Meier | /s/ James E. Rogers | |
Richard A. Meier | James E. Rogers | |
Executive Vice President, Chief Financial Officer & President, International | Director | |
/s/ Stuart M. Essig | /s/ David S. Simmons | |
Stuart M. Essig | David S. Simmons | |
Director | Director | |
/s/ John W. Gerdelman | /s/ Robert C. Sledd | |
John W. Gerdelman | Robert C. Sledd | |
Director | Director | |
/s/ Barbara B. Hill | /s/ Anne Marie Whittemore | |
Barbara B. Hill | Anne Marie Whittemore | |
Director | Lead Director | |
/s/ Lemuel E. Lewis | ||
Lemuel E. Lewis | ||
Director | ||
69
Corporate Officers
P. Cody Phipps (55)
President & Chief Executive Officer
President & Chief Executive Officer since joining Owens & Minor in July 2015. Mr. Phipps was also appointed to the board of directors at the same time. He most recently served as President & Chief Executive Officer of Essendant (formerly United Stationers Inc.), where he was also a member of the board of directors. After joining the company in 2003 as Senior Vice President, Operations, he was appointed President, United Stationers Supply, in 2006. Previously, he was a Partner at McKinsey & Company, Inc., where he co-founded and led its Service Strategy and Operations Initiative. During his tenure at McKinsey, Mr. Phipps provided consulting services to a range of corporate clients across a diverse set of industries, including retail, manufacturing and healthcare. Mr. Phipps serves on the board of directors of RR Donnelley.
Richard A. Meier (57)
Executive Vice President, Chief Financial Officer & President, International
President, International since August 2015, and Executive Vice President & Chief Financial Officer since joining Owens & Minor in March 2013. Mr. Meier served from 2010 to 2012 as Executive Vice President & Chief Financial Officer of Teleflex, Inc., a global provider of specialty medical devices. Prior to that, he served as President & Chief Operating Officer of Advanced Medical Optics, Inc., from 2007 to 2009, and as Chief Operating Officer & Chief Financial Officer, and in a variety of other operations roles from 2002 through 2007. Previously Mr. Meier served as Chief Financial Officer and in various other roles at ICN Pharmaceuticals (now Velant Pharmaceutical Inc.). He also served for a number of years at Schroders & Co (now J.P. Morgan); Smith Barney (now CitiBank); and Manufacturers Hanover (now J.P. Morgan). Mr. Meier currently serves as Lead Director and Chair of Audit Committee of BioMarin Pharmaceuticals. He was a Director of Staar Surgical until June, 2016.
Rony C. Kordahi (53)
Executive Vice President, North American Operations
Executive Vice President, North American Operations since joining Owens & Minor in April 2016. Previously, Mr. Kordahi served as Vice President, Integrated Supply Chain Operations for Climate, Controls & Security-Americas, a division of United Technologies Corporation (UTC) from 2008 to 2016. Prior to joining UTC, Kordahi served for four years at Lennox International Inc., as General Manager of Parts & Supplies, North America, where he led the Lennox HVAC aftermarket business in North America. From 2000 to 2004, Kordahi was the Chief Technology Officer for Heatcraft Refrigeration Australia, in Sydney, Australia.
Charles C. Colpo (59)
Senior Vice President, Owens & Minor Europe Operations
Senior Vice President, Owens & Minor Europe Operations since May 2016. Mr. Colpo was assigned to operational oversight of Owens & Minor Europe in 2014. He served as Senior Vice President, Strategic Relationships from August 2013 to May 2016. From March 2012 until August 2013, Mr. Colpo served as Senior Vice President, Operations. Prior to that, Mr. Colpo served as Executive Vice President & Chief Operating Officer from 2010 to 2012. Mr. Colpo served as Executive Vice President, Administration from 2008 until 2010 and as Senior Vice President, Operations, from 1999 until 2008. He has been with the company since 1981.
70
Erika T. Davis (53)
Senior Vice President, Chief Administrative Officer
Senior Vice President, Chief Administrative Officer since October 2016. From August 2015 to October 2016, Ms. Davis served as Senior Vice President & Corporate Chief of Staff. Prior to that Ms. Davis served as Senior Vice President, Administration & Operations from August 2013 to August 2015. Prior to that, Ms. Davis served as Senior Vice President, Human Resources, from 2001 until August 2013. Ms. Davis has been with the company since 1993.
Geoffrey T. Marlatt (48)
Senior Vice President, Manufacturer Services
Senior Vice President, Manufacturer Services since September 2014. From 2012 to 2014, Mr. Marlatt served as Regional Vice President, Provider Services, West Region. Prior to that, Mr. Marlatt served as Vice President, OM Solutions from 2006 to 2012. Before joining Owens & Minor in 2006, Mr. Marlatt held leadership positions with McKesson, Johnson & Johnson Ethicon, Medtronic and the Global Healthcare Exchange.
Stephen R. Olive (52)
Senior Vice President, Chief Information Officer
Senior Vice President, Chief Information Officer since joining Owens & Minor in 2016. Previously, Mr. Olive was Senior Vice President, Global Chief Information Officer of Royal Philips in Amsterdam from 2014 to 2016. Steve served for two years as Senior Vice President, Chief Information Officer for Philips Healthcare in Massachusetts from 2012 to 2014.
Nicholas J. Pace (46)
Senior Vice President, General Counsel & Corporate Secretary
Senior Vice President, General Counsel & Corporate Secretary since joining Owens & Minor in January 2016. Prior to joining the company, Mr. Pace served as Executive Vice President, General Counsel & Secretary of Landmark Health, LLC from July-December 2015. From January 2014 to July 2015, he served in simultaneous roles of Senior Vice President, Strategy & General Counsel of Landmark Health, LLC and Executive Vice President, Corporate Development & General Counsel of Avalon Health Services, LLC, two healthcare companies sponsored by the private equity firm Francisco Partners. From March to October 2013, Mr. Pace served as Executive Vice President, Operations & Compliance for Health Diagnostic Laboratory, Inc., which filed for Chapter 11 bankruptcy protection in June 2015. Prior to that role, he served as Executive Vice President, General Counsel & Secretary of Amerigroup Corporation, where he worked from 2006-2013.
Jay Romans (66)
Senior Vice President, Human Resources
Senior Vice President, Human Resources, since joining Owens & Minor in September 2015. Before joining Owens & Minor, Mr. Romans served as a director for TruePoint, an international consulting firm, from 2012 to 2015. Prior to that, Mr. Romans was Senior Vice President People and Corporate Officer, of Waste Management Corporation from 2007 to 2012. During his career, Mr. Romans has served in leadership roles with a number of well-known companies, including Amoco Oil Company and Becton Dickinson Corporation. Mr. Romans also founded and ran his own human resources consulting firm.
Numbers inside parentheses indicate age.
71