Item 1: Report to Shareholders
 |
| Small-Cap Stock Fund | June 30, 2007 |
The views and opinions in this report were current as of June 30, 2007. They are not guarantees of performance or investment results and should not be taken as investment advice. Investment decisions reflect a variety of factors, and the managers reserve the right to change their views about individual stocks, sectors, and the markets at any time. As a result, the views expressed should not be relied upon as a forecast of the fund’s future investment intent. The report is certified under the Sarbanes-Oxley Act, which requires mutual funds and other public companies to affirm that, to the best of their knowledge, the information in their financial reports is fairly and accurately stated in all material respects.
REPORTS ON THE WEB
Sign up for our E-mail Program, and you can begin to receive updated fund reports and prospectuses online rather than through the mail. Log in to your account at troweprice.com for more information.
Manager’s Letter
Fellow Shareholders
The year has gotten off to a solid start for the market indices. In the first half of 2007, the small-cap Russell 2000 Index rose a respectable 6.45%, marginally trailing the large-cap S&P 500 Stock Index’s 6.96% return. We are currently experiencing a period of significant merger and acquisition (M&A) activity driven by a combination of excess global liquidity, cheap financing, a benign economic outlook, and a strong desire by corporate and private-equity managers to put idle funds to work. Private-equity managers, in particular, are awash in capital. They are eager to place investment dollars in attractive companies, and small-caps are benefiting. Meanwhile, corporate managements are struggling in a slowing domestic economy to find significant areas for continued growth.
HIGHLIGHTS
• A favorable global economy and corporate deals helped power small-cap stocks to strong gains in the first half of 2007.
• The fund generated a solid gain in the six months ended June 30, outpacing the small-cap Russell 2000 Index.
• Takeovers generally helped fund performance but eliminated stocks from the portfolio; nevertheless, we continued to find companies the market appeared to be overlooking.
• We think the cycle of small-cap outperformance relative to large-caps has ended but believe that our blend of growth and value will serve us well over time when measured against the Russell 2000.
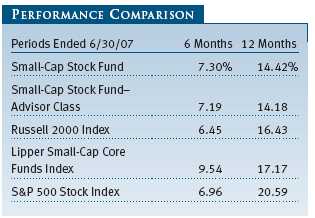
The Small-Cap Stock Fund rose 7.30% over the half year, slightly ahead of the unmanaged small- and large-cap indices. (Returns for the Advisor Class shares reflect their different fee structure.) We saw more M&A activity in our fund in the first half of 2007 than in all of 2006. These takeovers, combined with solid stock selection and appropriate group weightings, drove our strong performance relative to the Russell 2000 Index. The fund trailed its Lipper peer group index.
Underweighting materials and energy and overweighting financials caused much of the underperformance. The balance came from negative stock selection in materials, health care, and consumer discretionary. Our weakness in materials is not surprising—we find it challenging to find companies that meet our investment criteria in the volatile metals and mining industries.
For the trailing 12-month period, both the fund and the Russell 2000 Index lagged the large-cap S&P 500. As we’ve written before, we think the lengthy and extended run of small-cap stock outperformance ended during 2006. As a result, we believe investors would be well served to hold no more than a market weighting in small-cap shares and that large-cap blue chip shares represent the better value now.
INVESTMENT REVIEW
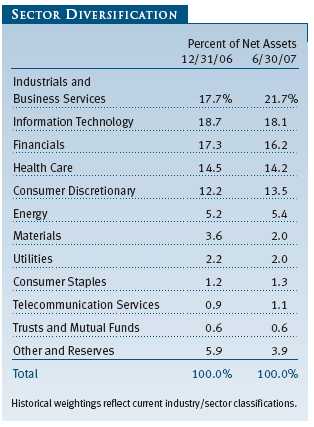
The top-performing sectors in the small-cap market thus far in 2007 included materials, energy, and industrials and business services, which rose 22%, 15%, and 15% respectively. Poorly performing segments included financials and utilities, which declined 6% and 4% in the half. We were underweight materials relative to the Russell 2000 Index, but we were overweight energy and significantly overweight industrials and business services. We were also underweight both the financial and utility segments. Consequently, both stock selection and group weightings combined to lead to our index-topping performance for the first half of the year.
Our best performance came in the financials sector where both stock selection and group weightings combined to add almost two percentage points of outperformance. Our leading contributor here was Ohio Casualty, which rose on news that it agreed to be acquired by Liberty Mutual Group at a 33% premium to its then trading price. Chairman and CEO Dan Carmichael has done a magnificent job, first in turning around an underperforming franchise, and then in achieving an attractive exit strategy for shareholders. We can only hope this fine management team turns up at another financial company in the future. Asset managers have performed well thus far in 2007, and Affiliated Managers Group was our next largest contributor in the segment. AMG, which sports solid fundamentals, is also benefiting from investor interest in alternative equity managers. AMG’s partially owned AQR subsidiary has captured investor attention following the recent successful initial public offerings of Fortress and Blackstone. (Please see the portfolio of investments for a complete listing of holdings and the amount each represents in the portfolio.)
In other merger news, Investors Financial Services agreed to be acquired by State Street, driving the share price up more than 40% in the first half. Chittenden was also the subject of an attractive takeover offer from People’s United Financial at a 31% premium over its recent trading price. In yet another deal, Bristol West Holdings agreed to be acquired by the Farmers Insurance Group, which sought to add Bristol’s attractive nonstandard auto business. Finally, Assured Guaranty rose after Moody’s placed the firm’s credit rating under review for an upgrade. This upgrade would end the firm’s split AAA/AA status and expand the number of asset classes this financial guaranty firm could underwrite.
In a reversal from last year, we benefited from underweighting financials. Our decision to underweight the extended real estate investment trust segment was especially helpful, as was our lighter exposure to thrift and mortgage companies.
The industrials and business services sector was a strong performer, and both stock selection and our heavier exposure aided fund results. Among key contributors, Armor Holdings, a military vehicle manufacturer, rose after the firm agreed to be acquired by BAE Industries. Baldor Electric climbed as investors remained excited about its purchase of Rockwell’s Reliance Electric division. Reliance’s small-motors operation is a perfect fit with Baldor, and Reliance’s large motor operation gives Baldor an attractive entry into the large-horsepower motor business for the energy and mining markets. Harsco rose as strong first-quarter results at its access division (scaffolding) and significant track-maintenance equipment orders from China piqued investor interest. Finally, EGL’s stock price increased after the firm agreed to be acquired by CEVA Logistics.
Energy was the Russell 2000’s third-best performing sector, and, fortunately, we were well represented in the area. Our top contributor in the space, Forest Oil, benefited from completing its acquisition of Houston Exploration, which we estimate should increase Forest’s production by over 60%. More importantly, this should restock the cupboard with another opportunity for Forest’s management to decrease costs and improve capital allocation. Bill Barrett also rose as its shares reacted to strength in commodity prices. Shareholders are also gaining a better appreciation for the firm’s new focused resource development program spearheaded by Bill Barrett veteran Joe Jaggers.
Other major contributors in the first half included Sunrise Senior Living, Toro, and Belden. Sunrise remains under the cloud of an SEC investigation and had to delay financial filings but it continues to report sound fundamentals. The company is wrapping up a review of its joint venture accounting and is moving toward getting current on its SEC filings. The investigation, an obvious concern to investors, led to an unsustainably wide gap between Sunrise’s private and public market value. As the firm moves to resolve its reporting issues, the shares should close the gap. Toro continues to execute well. Its culture of continuous improvement is driving sustainable attractive returns for shareholders. The company’s fiscal second-quarter earnings were solid, and operating margins hit an all-time high. Since 2002 its return on equity has increased from 10% to more than 33%. Increased returns, share repurchases, and strong fundamentals have combined to drive excellent appreciation. Finally, Belden’s new management led by John Stroup, formerly of Danaher, has done an excellent job of turning the firm around, consistently meeting or exceeding expectations in recent quarters. John has recently directed the purchase of three firms, driving Belden toward signal transmissions solutions and away from its roots in the slower group cable business.
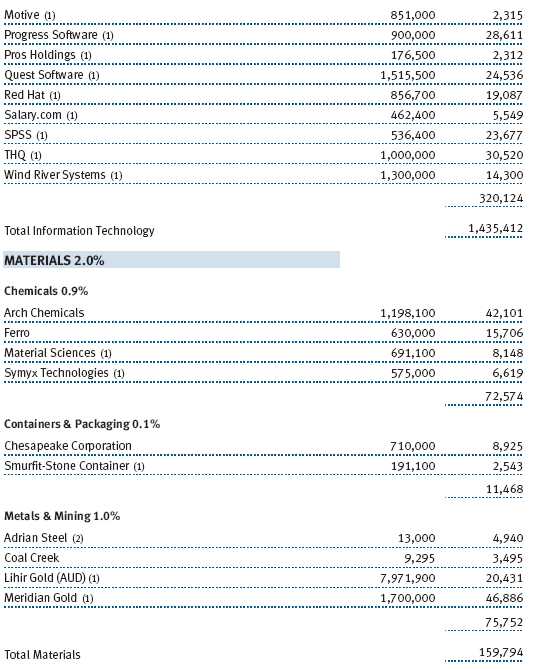
The materials sector remained a challenge for us. The segment once again posted eye-popping returns, largely due to stellar gains in the metals and mining segment and, to a lesser degree, a rally in commodity chemical shares. We have been underweight the metals area because the softer fundamentals in the steel business don’t appear to justify the industry’s lofty premium. Stock selection in the sector was also poor as precious metals producer Meridian Gold was essentially flat along with weaker gold prices. Symyx also dipped as the company announced that 2007 revenues would be below expectations.
Poor stock selection in technology also weighed on fund performance. Global Payments, a major holding, fell after the payment-processing firm reported a disappointing forward guidance as lower volumes and challenged pricing have slowed growth. Semiconductor firm Conexant Systems also declined. The company is seeing a slower-than-expected ramp up in its products tied to set-top boxes for satellite TV, but we remain constructive on the position. CACI International slipped on fears the government will trim its intelligence spending for outside contractors in the upcoming fiscal year.
Stock selection in consumer discretionary also detracted significantly. As we will discuss later in the letter, we have initiated several modest positions in the homebuilding area. While these stocks are out of favor, they are approaching attractive valuation levels. Two of these firms, Meritage and Standard Pacific, declined from already depressed prices, hurting fund results. Bookseller Borders is in the midst of a turnaround under a new management team and fell due to disappointing sales trends. Earnings were below expectations on declining same-store sales and new investment spending to reposition the stores. Panera Bread declined as a small shortfall in sales led to a big drop in earnings. May comparable sales, while growing, were below the firm’s projections. The casual dining sector remains challenged, and Panera reduced earnings guidance for the year.
Other significant decliners included Citizens Republic Bancorp, ResMed, and ESCO Technologies. Citizens executed poorly on its dilutive merger with Republic. The company missed operating earnings in the first quarter and guided estimates lower for the second quarter due to problems uncovered in the Republic real estate portfolio. The trend unfortunately continued when it preannounced further loan losses tied to the legacy Republic portfolio. We are monitoring the situation closely and plan an upcoming meeting with the bank’s chief lending officer. ResMed fell as the firm’s fiscal third-quarter earnings trailed expectations on a product recall issue and competitive pricing pressure. Fundamentals remain solid, though, as U.S. revenue growth stayed strong. ESCO declined after the firm announced that a major customer, PG&E, plans to undergo a technology review of its automated meter and gas reading implementation. ESCO won this large contract several years ago and is scheduled to deliver 400,000 units. The delay will affect the balance of PG&E’s implementation and jeopardize ESCO’s 2008 earnings estimates. We remain convinced that ESCO’s solution is best in class and think this decision will lead to a delay in product installation rather than a cancellation of the contract.
PORTFOLIO STRATEGY
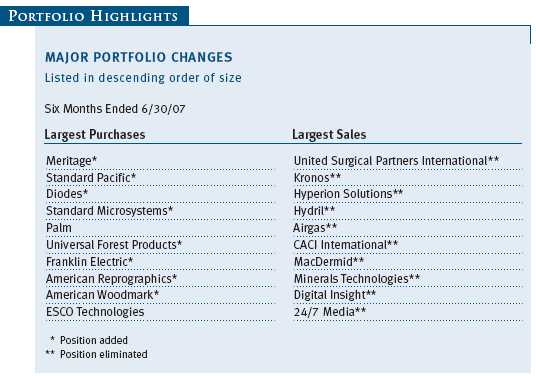
Technology was our largest area of investment in the first half. We continue to find attractive opportunities, and though our absolute dollars of investment were large—over $200 million—we were largely reinvesting proceeds from recent M&A activity in the sector. Three unique investment opportunities deserve greater focus and serve to illustrate our investment process.
Our third-largest purchase was Diodes, a well-managed discrete semiconductor company that has a history of market share gains. The company’s products include “niche-y,” slower-growing components such as diodes, rectifiers, and transistors, and analog and mixed-signal devices—a large but highly fragmented corner of the semiconductor market that attracts less competitive interest because of its slower growth rate of 3% to 4% a year. No single player has even 10% of this market. Hence, there is room for an aggressive consolidator. Internal growth, acquisitions, and margin enhancement have allowed the firm to grow 20% per year—faster than the discrete semi market every year since 2000. Diodes has suffered only one down year in the process. Like most of the industry, Diodes’ revenues peaked in 2000 during the last cycle. However, unlike most competitors, Diodes matched its 2000 peak by 2002. By 2005, revenues were 85% above the previous peak level. The firm is innovative in package sizing, developing micro-packaged components with an unwavering focus on customer service. It is also quite profitable, and we believe operating margins can improve from an already attractive 18% to a level in the mid-20’s. Given this stellar track record, you’d expect to pay a big price/ earnings (P/E) multiple; however, the stock dropped to a below-market P/E ratio, providing a very attractive entry point.
Our next major technology investment was Standard Microsystems, a silicon-based integrated circuits company that serves the consumer electronics, “infotainment,” computer, and networking industries. Longtime investors in the fund will recall our extremely successful “10-bagger” investment in Harman International Industries. Standard Microsystems makes semiconductors based on the MOST networking standard used by the Harman infotainment auto/audio/navigation systems. The company has a new product cycle that should enable it to gain market share, and that translates to attractive earnings gains. The firm’s new CEO came from Dover Corp. and is well known and respected by our analyst. Standard Microsystems is well capitalized with over $3 per share in cash. In short, we see the firm as attractive and well managed with a visible catalyst in its new product cycle that should enable margins and revenues to expand. As integrated auto/audio navigation systems become ubiquitous in the coming years, Standard Microsystems should do well as a sole source supplier.
Another interesting technology investment is Palm, the maker of the Treo smart phone. Palm pioneered the PDA market in the ’90s and was an early entrant into the smart phone market now dominated by Research in Motion, the maker of Blackberry. Palm attracted our attention last year when the firm reacquired control of its operating system, thus giving Palm a valuable integrated IP solution for the handset market—an asset that most major handset makers do not possess. We purchased our position in late 2006 and early 2007. We were later delighted when an additional investment catalyst arose in the second quarter of this year. Elevation Partners, a well-known private-equity firm, teamed with two Apple executives, including Jon Rubenstein of iPod fame, to make a major investment in Palm. Elevation is taking a 25% stake and Palm, which has substantial excess cash, will improve returns by paying a $9 per share special dividend. Palm has a great platform in the one billion unit handset market, and we are very excited by the addition of Jon Rubenstein and believe this already successful investment could add significant value for our shareholders in the coming years.
Our largest area of net investment in 2007 to date is in the much unloved —indeed, I would say much hated—homebuilding sector. We have slowly added positions but remain slightly underweight in the household durables sector. Thus far we’ve been early and, as noted above, these investments detracted from our first-half performance. However, we take a long-term perspective and believe the investments will pay off down the road. Why invest in the industry now? After all, everybody knows we are in a housing bear market with declining prices and significant excess inventories. The environment is horrible, the spring selling season failed to materialize, and further balance-sheet risk remains. However, we think much of the bad news is already priced into the stocks. A hopeful sign has already emerged: Homebuyer traffic is nearly flat year over year. Buyers, though hesitant, still exist. Trends actually improved from October 2006 to February 2007 before being derailed by the well-publicized meltdown in the subprime mortgage market. However, we believe basic demand remains intact. Public homebuilders took large impairment charges for property held during the December 2006 quarter. March charges were more moderate, though some risk still exists for June. The stock prices suggest that investors are anticipating a major hit, and the shares currently sell well below book value. At these prices, contrarian value investors have historically been well rewarded.
Currently, our investments in Meritage and Standard Pacific are selling at roughly two-thirds of book value—a huge discount that we believe is unwarranted. The mean 20-year historical valuation for homebuilders is 1.55 times book, which offers us greater than 100% upside should valuations return to norms.
Our top purchase, Meritage, is a unique small homebuilder that controls 85% of its land holdings through option contracts, which helps manage risk. CEO Steve Hilton has been in place since founding the predecessor company in the early 1990s. The firm’s debt-to-capital ratio is healthy, and we believe negative sentiment is too strong. Currently 31% of the outstanding shares are sold “short,” implying price gains will come very quickly at the first sign the environment is improving. We are confident patient investors should be rewarded. Our second-largest purchase, Standard Pacific, is a well-managed small homebuilder also trading at a deep discount to book value. Management has been in place for over 20 years and has navigated through similar environments in the past. While the company has slightly more debt than Meritage, we believe this will not present a significant challenge given its realistic deleveraging plan and sound debt structure. Like Meritage, it builds in some of the strongest job growth markets in the country—California, Texas, and Arizona. Slower housing starts—currently down 40% year over year—combined with job growth will, over time, right-size the market supply. Patient investors should be rewarded.
ON THE SELL SIDE
M&A activity has been on a real tear since 2006, and the first half of 2007 was even more frenzied. The fund had more than 20 holdings taken over during the past six months, more than in all of 2006. While many of these transactions were concentrated in our smaller holdings, several large holdings gained significantly through takeovers, including Armor Holdings, Ohio Casualty, and Chittenden. Our top three sales were largely driven by M&A activity. United Surgical Partners International agreed to be acquired by the private-equity firm Welsh Carson at a 14.4 % premium to the previous day’s closing price. United Surgical is an ambulatory surgery company facing some challenges as the government tweaks reimbursement rates for outpatient surgery procedures. We were intrigued by the company’s long-term growth prospects and were saddened to lose the holding. While the deal price was acceptable, we felt greater value could have been realized down the road through continued growth in the sector. Our third-largest sale, Hyperion Solutions, agreed to be acquired by Oracle at a 21% premium to the prior market close. Hyperion is a good fit with Oracle, and we believe Oracle offered a fair and attractive price for the shares.
Our second-largest sale, Kronos, was ultimately purchased by Hellman and Freidman. We were concerned that Kronos was struggling to grow as its core software market matured and its most recent new product cycles approached maturity. Thus, we were well down the sales road when the M&A transaction was announced, which unfortunately meant we left a bit of money on the table.
Airgas was an extremely successful long-term investment as the firm profited from rolling up the packaged gas industry. The company announced a major acquisition to purchase Linde’s gas production assets. To us, this represented a subtle and less attractive change to its business model. Airgas is adding significantly lower-returning assets to its balance sheet, potentially reducing returns to shareholders over time. If anyone can make this work, CEO Peter McCausland and Airgas can, but given the shares’ strong appreciation and larger cap size, we decided to sell.
With slower growth, a lessening of government intelligence outsourcing, rising labor costs, and more dependence on acquired growth, we concluded the time was right to eliminate CACI International. The company’s end markets have been tarnished for the past two years by congressional bickering and budget delays as well as diversion of funds to the war in Iraq. The firm’s core intelligence markets are now slowing from the rapid growth experienced after 9/11.
OUTLOOK
Small-cap stocks have underperformed large-caps for the last six and 12 months. As we’ve previously written, we believe the cycle of small-cap outperformance began to lose momentum as early as 2005 when the asset class lagged the strong rise of the large-cap Russell 1000 Index. By some measures, a strong rally in early 2006 drove small-cap stock valuations to all-time highs relative to large-caps and enabled the Russell 2000 to outperform in calendar year 2006. We’ve seen no similar surge in 2007.
The warning signs we’ve noted remain firmly in place. On an absolute basis, small-cap valuations are at the high end of recent ranges. Relative to large-caps, small-caps still trade at a P/E premium that, while down from the 2006 peak, remains above historic levels. Small-caps tend to trade at a discount to large, well-established companies due to less liquidity and greater perceived risk. They undoubtedly will again. Currently, earnings growth for small-caps continues to lag large-cap shares, presenting us with another major headwind to outperformance. Rising bond yields, evident late in the quarter, are another challenge. As more competitive rates are offered, investors tend to exit higher-yielding equity sectors for the safety of bonds. We saw this in the second quarter as real estate investment trusts and utilities declined. Moreover, rising rates may also bring an end to the easy liquidity and cheap credit that have helped fuel the strong M&A rally that has been so helpful to small-cap investors.
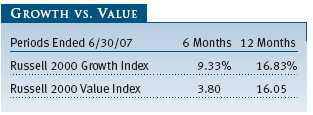
Small-caps remain vulnerable to any sudden shock to investor confidence, such as poor economic news, a financial crisis, or a major terrorist event on U.S. soil. Investors can quickly shift from risk-seeking to risk-avoidance. As we’ve said previously, when the cycle definitively ends and funds flow out of the small-cap sector, we believe active managers will significantly outperform the index. We continue to believe that our investors should reduce exposure to the small-cap sector as large-cap shares, particularly blue chip stocks, look attractive. We remain convinced, however, that our blend of growth and value will serve us well when measured against the Russell 2000. We continue to be grateful for your support.
Respectfully submitted,

Greg A. McCrickard
President of the fund and chairman of its Investment Advisory Committee
July 23, 2007
The committee chairman has day-to-day responsibility for managing the portfolio and works with committee members in developing and executing the fund’s investment program.
SUPPLEMENT TO PROSPECTUS DATED MAY
1, 2007
ERRATUM
Effective May 1, 2007, the fund’s operating policy that sets forth the percentage of the fund’s “total bond assets” that may be invested in noninvestment-grade securities is hereby corrected to remove the word “bond” and refer to “total assets” instead.
RISKS OF STOCK INVESTING
As with all stock and bond mutual funds, the fund’s share price can fall because of weakness in the stock or bond markets, a particular industry, or specific holdings. The financial markets can decline for many reasons, including adverse political or economic developments, changes in investor psychology, or heavy institutional selling. The prospects for an industry or company may deteriorate because of a variety of factors, including disappointing earnings or changes in the competitive environment. In addition, the investment manager’s assessment of companies held in a fund may prove incorrect, resulting in losses or poor performance even in rising markets. Investing in small companies involves greater risk than is customarily associated with larger companies. Stocks of small companies are subject to more abrupt or erratic price movements than larger-company stocks. Small companies often have limited product lines, markets, or financial resources, and their managements may lack depth and experience. Such companies seldom pay significant dividends that could cushion returns in a falling market.
GLOSSARY
Lipper indexes: Fund benchmarks that consist of a small number of the largest mutual funds in a particular category as tracked by Lipper Inc.
Market capitalization: The total value of a company’s publicly traded shares.
Price/book value ratio: A valuation measure calculated by dividing the price of a stock by a company’s book value per share. Book value is the net worth, or liquidating value, of a business and is calculated by subtracting all liabilities, including debt and preferred stocks, from total assets, and dividing by the number of shares of common stock outstanding.
Price/earnings ratio (P/E): A valuation measure calculated by dividing the price of a stock by its current or projected (forward) earnings per share. This ratio gives investors an idea of how much they are paying for current or future earnings power.
Price/sales ratio: A valuation measure calculated by dividing the price of a stock by its current or projected (forward) sales (or revenues) per share.
Return on equity (ROE): Calculated by dividing a company’s net income by shareholders’ equity, ROE measures how much a company earns on each dollar that common stock investors have put into that company. ROE indicates how effectively and efficiently a company and its management are using stockholder investments.
Russell 2000 Growth Index: Market-weighted total return index that measures the performance of companies within the Russell 2000 Index having higher price/book value ratios and higher forecasted growth rates.
Russell 2000 Index: Consists of the smallest 2,000 companies in the Russell 3000 Index. Performance is reported on a total-return basis.
Russell 2000 Value Index: Market-weighted total return index that measures the performance of companies within the Russell 2000 Index having lower price/book value ratios and lower forecasted growth rates.
S&P 500 Stock Index: An unmanaged index that tracks the stocks of 500 primarily large-cap U.S. companies.

Performance and Expenses
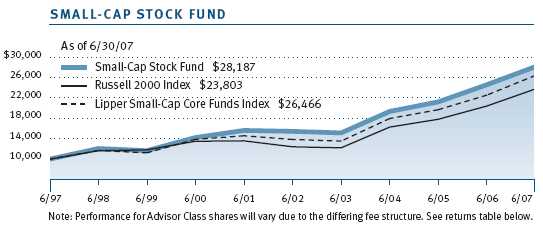
| GROWTH OF $10,000 |
This chart shows the value of a hypothetical $10,000 investment in the fund over the past 10 fiscal year periods or since inception (for funds lacking 10-year records). The result is compared with benchmarks, which may include a broad-based market index and a peer group average or index. Market indexes do not include expenses, which are deducted from fund returns as well as mutual fund averages and indexes.
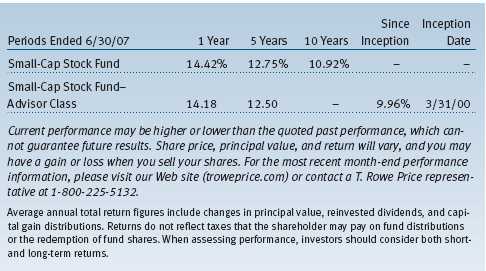
| AVERAGE ANNUAL COMPOUND TOTAL RETURN |
This table shows how the fund would have performed each year if its actual (or cumulative) returns had been earned at a constant rate.

| FUND EXPENSE EXAMPLE |
As a mutual fund shareholder, you may incur two types of costs: (1) transaction costs, such as redemption fees or sales loads, and (2) ongoing costs, including management fees, distribution and service (12b-1) fees, and other fund expenses. The following example is intended to help you understand your ongoing costs (in dollars) of investing in the fund and to compare these costs with the ongoing costs of investing in other mutual funds. The example is based on an investment of $1,000 invested at the beginning of the most recent six-month period and held for the entire period.
Please note that the fund has two share classes: The original share class (“investor class”) charges no distribution and service (12b-1) fee. Advisor Class shares are offered only through unaffiliated brokers and other financial intermediaries and charge a 0.25% 12b-1 fee. Each share class is presented separately in the table.
Actual Expenses
The first line of the following table (“Actual”) provides information about actual account values and expenses based on the fund’s actual returns. You may use the information in this line, together with your account
balance, to estimate the expenses that you paid over the period. Simply divide your account value by $1,000 (for example, an $8,600 account value divided by $1,000 = 8.6), then multiply the result by the number in the first line under
the heading “Expenses Paid During Period” to estimate the expenses you paid on your account during this period.
Hypothetical Example for Comparison Purposes
The information on the second line of the table (“Hypothetical”) is based on hypothetical account values and expenses derived from the fund’s actual expense ratio and an assumed 5% per year rate of return before expenses
(not the fund’s actual return). You may compare the ongoing costs of investing in the fund with other funds by contrasting this 5% hypothetical example and the 5% hypothetical examples that appear in the shareholder reports of the other funds.
The hypothetical account values and expenses may not be used to estimate the actual ending account balance or expenses you paid for the period.
Note: T. Rowe Price charges an annual small-account maintenance fee of $10, generally for accounts with less than $2,000 ($500 for UGMA/UTMA). The fee is waived for any investor whose T. Rowe Price mutual fund accounts total $25,000 or more, accounts employing automatic investing, and IRAs and other retirement plan accounts that utilize a prototype plan sponsored by T. Rowe Price (although a separate custodial or administrative fee may apply to such accounts). This fee is not included in the accompanying table. If you are subject to the fee, keep it in mind when you are estimating the ongoing expenses of investing in the fund and when comparing the expenses of this fund with other funds.
You should also be aware that the expenses shown in the table highlight only your ongoing costs and do not reflect any transaction costs, such as redemption fees or sales loads. Therefore, the second line of the table is useful in
comparing ongoing costs only and will not help you determine the relative total costs of owning different funds. To the extent a fund charges transaction costs, however, the total cost of owning that fund is higher.

Unaudited
The accompanying notes are an integral part of these financial statements.
Unaudited
The accompanying notes are an integral part of these financial statements.
Unaudited


The accompanying notes are an integral part of these financial statements.
Unaudited
The accompanying notes are an integral part of these financial statements.
Unaudited

The accompanying notes are an integral part of these financial statements.
Unaudited

The accompanying notes are an integral part of these financial statements.
Unaudited
| NOTES TO FINANCIAL STATEMENTS |
NOTE 1 - SIGNIFICANT ACCOUNTING POLICIES
T. Rowe Price Small-Cap Stock Fund, Inc. (the fund), is registered under the Investment Company Act of 1940 (the 1940 Act) as a diversified, open-end management investment company. The fund seeks to provide long-term capital growth by investing primarily in stocks of small companies. The fund has two classes of shares: the Small-Cap Stock Fund original share class, referred to in this report as the Investor Class, offered since June 1, 1956, and Small-Cap Stock Fund—Advisor Class (Advisor Class), offered since March 31, 2000. Advisor Class shares are sold only through unaffiliated brokers and other unaffiliated financial intermediaries that are compensated by the class for distribution, shareholder servicing, and/or certain administrative services under a Board-approved Rule 12b-1 plan. Each class has exclusive voting rights on matters related solely to that class, separate voting rights on matters that relate to both classes, and, in all other respects, the same rights and obligations as the other class.
The accompanying financial statements were prepared in accordance with accounting principles generally accepted in the United States of America, which require the use of estimates made by fund management. Fund management believes that estimates and security valuations are appropriate; however, actual results may differ from those estimates, and the security valuations reflected in the financial statements may differ from the value the fund ultimately realizes upon sale of the securities.
Valuation The fund values its investments and computes its net asset value per share at the close of the New York Stock Exchange (NYSE), normally 4 p.m. ET, each day that the NYSE is open for business. Equity securities listed or regularly traded on a securities exchange or in the over-the-counter (OTC) market are valued at the last quoted sale price or, for certain markets, the official closing price at the time the valuations are made, except for OTC Bulletin Board securities, which are valued at the mean of the latest bid and asked prices. A security that is listed or traded on more than one exchange is valued at the quotation on the exchange determined to be the primary market for such security. Listed securities not traded on a particular day are valued at the mean of the latest bid and asked prices for domestic securities and the last quoted sale price for international securities. Debt securities with original maturities of less than one year are valued at amortized cost in local currency, which approximates fair value when combined with accrued interest.
Investments in mutual funds are valued at the mutual fund’s closing net asset value per share on the day of valuation. Financial futures contracts are valued at closing settlement prices.
Other investments, including restricted securities, and those for which the above valuation procedures are inappropriate or are deemed not to reflect fair value are stated at fair value as determined in good faith by the T. Rowe Price Valuation Committee, established by the fund’s Board of Directors.
Most foreign markets close before the close of trading on the NYSE. If the fund determines that developments between the close of a foreign market and the close of the NYSE will, in its judgment, materially affect the value of some or all of its portfolio securities, which in turn will affect the fund’s share price, the fund will adjust the previous closing prices to reflect the fair value of the securities as of the close of the NYSE, as determined in good faith by the T. Rowe Price Valuation Committee, established by the fund’s Board of Directors. A fund may also fair value securities in other situations, such as when a particular foreign market is closed but the fund is open. In deciding whether to make fair value adjustments, the fund reviews a variety of factors, including developments in foreign markets, the performance of U.S. securities markets, and the performance of instruments trading in U.S. markets that represent foreign securities and baskets of foreign securities. The fund uses outside pricing services to provide it with closing market prices and information used for adjusting those prices. The fund cannot predict when and how often it will use closing prices and when it will adjust those prices to reflect fair value. As a means of evaluating its fair value process, the fund routinely compares closing market prices, the next day’s opening prices in the same markets, and adjusted prices.
Currency Translation Assets, including investments, and liabilities denominated in foreign currencies are translated into U.S. dollar values each day at the prevailing exchange rate, using the mean of the bid and asked prices of such currencies against U.S. dollars as quoted by a major bank. Purchases and sales of securities, income, and expenses are translated into U.S. dollars at the prevailing exchange rate on the date of the transaction. The effect of changes in foreign currency exchange rates on realized and unrealized security gains and losses is reflected as a component of security gains and losses.
Class Accounting The Advisor Class pays distribution, shareholder servicing, and/or certain administrative expenses in the form of Rule 12b-1 fees, in an amount not exceeding 0.25% of the class’s average daily net assets. Shareholder servicing, prospectus, and shareholder report expenses incurred by each class are charged directly to the class to which they relate. Expenses common to both classes, investment income, and realized and unrealized gains and losses are allocated to the classes based upon the relative daily net assets of each class.
Rebates and Credits Subject to best execution, the fund may direct certain security trades to brokers who have agreed to rebate a portion of the related brokerage commission to the fund in cash. Commission rebates are reflected as realized gain on securities in the accompanying financial statements and totaled $53,000 for the six months ended June 30, 2007. Additionally, the fund earns credits on temporarily uninvested cash balances at the custodian that reduce the fund’s custody charges. Custody expense in the accompanying financial statements is presented before reduction for credits, which are reflected as expenses paid indirectly.
Investment Transactions, Investment Income, and Distributions Income and expenses are recorded on the accrual basis. Premiums and discounts on debt securities are amortized for financial reporting purposes. Dividends received from mutual fund investments are reflected as dividend income; capital gain distributions are reflected as realized gain/loss. Dividend income and capital gain distributions are recorded on the ex-dividend date. Investment transactions are accounted for on the trade date. Any income tax-related interest and penalties would be classified as income tax expense. Realized gains and losses are reported on the identified cost basis. Payments (“variation margin”) made or received to settle the daily fluctuations in the value of futures contracts are recorded as unrealized gains or losses until the contracts are closed. Unsettled variation margin on futures contracts is reflected as other assets or liabilities, and unrealized gains and losses on futures contracts are reflected as the change in net unrealized gain or loss in the accompanying financial statements. Distributions to shareholders are recorded on the ex-dividend date. Income distributions are declared and paid by each class on an annual basis. Capital gain distributions, if any, are declared and paid by the fund, typically on an annual basis.
New Accounting Pronouncements Effective June 29, 2007, the fund adopted Financial Accounting Standards Board (“FASB”) Interpretation No. 48 (“FIN 48”), Accounting for Uncertainty in Income Taxes, a clarification of FASB Statement No. 109, Accounting for Income Taxes. FIN 48 establishes financial accounting and disclosure requirements for recognition and measurement of tax positions taken or expected to be taken on an income tax return. The adoption of FIN 48 had no impact on the fund’s net assets or results of operations.
In September 2006, the FASB released the Statement of Financial Accounting Standard No. 157 (“FAS 157”), Fair Value Measurements. FAS 157 clarifies the definition of fair value and establishes the framework for measuring fair value, as well as proper disclosure of this methodology in the financial statements. It will be effective for the fund’s fiscal year beginning January 1, 2008. Management is evaluating the effects of FAS 157; however, it is not expected to have a material impact on the fund’s net assets or results of operations.
NOTE 2 - INVESTMENT TRANSACTIONS
Consistent with its investment objective, the fund engages in the following practices to manage exposure to certain risks or to enhance performance. The investment objective, policies, program, and risk factors of the fund are described more fully in the fund’s prospectus and Statement of Additional Information.
Restricted Securities The fund may invest in securities that are subject to legal or contractual restrictions on resale. Although certain of these securities may be readily sold, for example, under Rule 144A, others may be illiquid, their sale may involve substantial delays and additional costs, and prompt sale at an acceptable price may be difficult.
Futures Contracts During the six months ended June 30, 2007, the fund was a party to futures contracts, which provide for the future sale by one party and purchase by another of a specified amount of a specific financial instrument at an agreed upon price, date, time, and place. Risks arise from possible illiquidity of the futures market and from movements in security values.
Other Purchases and sales of portfolio securities, other than short-term securities, aggregated $704,768,000 and $842,456,000, respectively, for the six months ended June 30, 2007.
NOTE 3 - FEDERAL INCOME TAXES
No provision for federal income taxes is required since the fund intends to continue to qualify as a regulated investment company under Subchapter M of the Internal Revenue Code and distribute to shareholders all of its taxable income and gains. Federal income tax regulations differ from generally accepted accounting principles; therefore, distributions determined in accordance with tax regulations may differ in amount or character from net investment income and realized gains for financial reporting purposes. Financial reporting records are adjusted for permanent book/tax differences to reflect tax character. Financial records are not adjusted for temporary differences. The amount and character of tax-basis distributions and composition of net assets are finalized at fiscal year-end; accordingly, tax-basis balances have not been determined as of June 30, 2007.
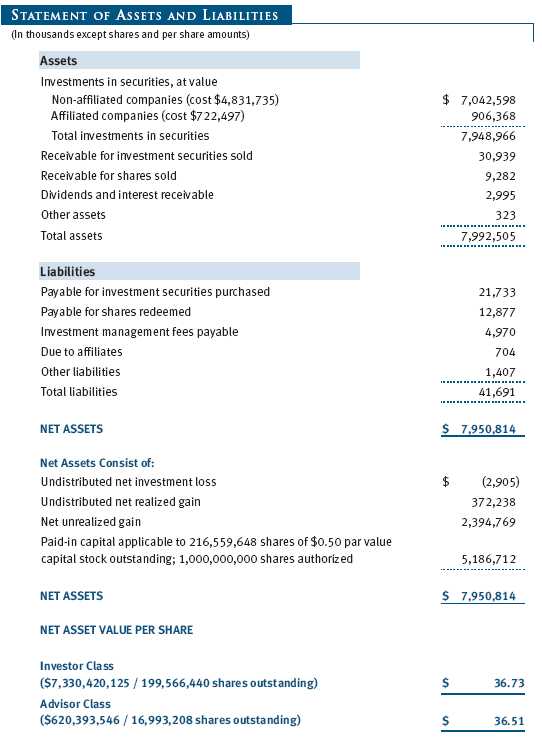
At June 30, 2007, the cost of investments for federal income tax purposes was $5,554,232,000. Net unrealized gain aggregated $2,394,769,000 at period-end, of which $2,690,212,000 related to appreciated investments and $295,443,000 related to depreciated investments.
NOTE 4 - RELATED PARTY TRANSACTIONS
The fund is managed by T. Rowe Price Associates, Inc. (the manager or Price Associates), a wholly owned subsidiary of T. Rowe Price Group, Inc. The investment management agreement between the fund and the manager provides for an annual investment management fee, which is computed daily and paid monthly. The fee consists of an individual fund fee, equal to 0.45% of the fund’s average daily net assets, and a group fee. The group fee rate is calculated based on the combined net assets of certain mutual funds sponsored by Price Associates (the group) applied to a graduated fee schedule, with rates ranging from 0.48% for the first $1 billion of assets to 0.285% for assets in excess of $220 billion. The fund’s group fee is determined by applying the group fee rate to the fund’s average daily net assets. At June 30, 2007, the effective annual group fee rate was 0.30%.
In addition, the fund has entered into service agreements with Price Associates and two wholly owned subsidiaries of Price Associates (collectively, Price). Price Associates computes the daily share prices and provides certain other administrative services to the fund. T. Rowe Price Services, Inc., provides shareholder and administrative services in its capacity as the fund’s transfer and dividend disbursing agent. T. Rowe Price Retirement Plan Services, Inc., provides subaccounting and recordkeeping services for certain retirement accounts invested in the Investor Class. For the six months ended June 30, 2007, expenses incurred pursuant to these service agreements were $55,000 for Price Associates, $755,000 for T. Rowe Price Services, Inc., and $1,515,000 for T. Rowe Price Retirement Plan Services, Inc. The total amount payable at period-end pursuant to these service agreements is reflected as Due to Affiliates in the accompanying financial statements.
Additionally, the fund is one of several mutual funds in which certain college savings plans managed by Price Associates may invest. As approved by the fund’s Board of Directors, shareholder servicing costs associated with each college savings plan are borne by the fund in proportion to the average daily value of its shares owned by the college savings plan. For the six months ended June 30, 2007, the fund was charged $153,000 for shareholder servicing costs related to the college savings plans, of which $133,000 was for services provided by Price. The amount payable at period-end pursuant to this agreement is reflected as Due to Affiliates in the accompanying financial statements. At June 30, 2007, approximately 2% of the outstanding shares of the Investor Class were held by college savings plans.
The fund is also one of several mutual funds sponsored by Price Associates (underlying Price funds) in which the T. Rowe Price Retirement Funds (Retirement Funds) may invest. The Retirement Funds do not invest in the underlying Price funds for the purpose of exercising management or control. Pursuant to a special servicing agreement, expenses associated with the operation of the Retirement Funds are borne by each underlying Price fund to the extent of estimated savings to it and in proportion to the average daily value of its shares owned by the Retirement Funds. Expenses allocated under this agreement are reflected as shareholder servicing expense in the accompanying financial statements. For the six months ended June 30, 2007, the fund was allocated $463,000 of Retirement Funds’ expenses, of which $364,000 related to services provided by Price. The amount payable at period-end pursuant to this agreement is reflected as Due to Affiliates in the accompanying financial statements. At June 30, 2007, approximately 7% of the outstanding shares of the Investor Class were held by the Retirement Funds.
The fund may invest in the T. Rowe Price Reserve Investment Fund and the T. Rowe Price Government Reserve Investment Fund (collectively, the T. Rowe Price Reserve Investment Funds), open-end management investment companies managed by Price Associates and affiliates of the fund. The T. Rowe Price Reserve Investment Funds are offered as cash management options to mutual funds, trusts, and other accounts managed by Price Associates and/or its affiliates, and are not available for direct purchase by members of the public. The T. Rowe Price Reserve Investment Funds pay no investment management fees.
As of June 30, 2007, T. Rowe Price Group, Inc., and/or its wholly owned subsidiaries owned 140,096 shares of the Investor Class, representing less than 1% of the fund’s net assets.
| INFORMATION ON PROXY VOTING POLICIES, PROCEDURES, AND RECORDS |
A description of the policies and procedures used by T. Rowe Price funds and portfolios to determine how to vote proxies relating to portfolio securities is available in each fund’s Statement of Additional Information, which you may request by calling 1-800-225-5132 or by accessing the SEC’s Web site, www.sec.gov. The description of our proxy voting policies and procedures is also available on our Web site, www.troweprice.com. To access it, click on the words “Company Info” at the top of our homepage for individual investors. Then, in the window that appears, click on the “Proxy Voting Policy” navigation button in the top left corner.
Each fund’s most recent annual proxy voting record is available on our Web site and through the SEC’s Web site. To access it through our Web site, follow the directions above, then click on the words “Proxy Voting Record” at the bottom of the Proxy Voting Policy page.
| HOW TO OBTAIN QUARTERLY PORTFOLIO HOLDINGS |
The fund files a complete schedule of portfolio holdings with the Securities and Exchange Commission for the first and third quarters of each fiscal year on Form N-Q. The fund’s Form N-Q is available electronically on the SEC’s Web site (www.sec.gov); hard copies may be reviewed and copied at the SEC’s Public Reference Room, 450 Fifth St. N.W., Washington, DC 20549. For more information on the Public Reference Room, call 1-800-SEC-0330.
| APPROVAL OF INVESTMENT MANAGEMENT AGREEMENT |
On March 7, 2007, the fund’s Board of Directors (Board) unanimously approved the investment advisory contract (Contract) between the fund and its investment manager, T. Rowe Price Associates, Inc. (Manager). The Board considered a variety of factors in connection with its review of the Contract, also taking into account information provided by the Manager during the course of the year, as discussed below:
Services Provided by the Manager
The Board considered the nature, quality, and extent of the services provided to the fund by the Manager. These services included, but were not limited to, management of the fund’s portfolio and a variety of related activities, as
well as financial and administrative services, reporting, and communications. The Board also reviewed the background and experience of the Manager’s senior management team and investment personnel involved in the management of the fund. The
Board concluded that it was satisfied with the nature, quality, and extent of the services provided by the Manager.
Investment Performance of the Fund
The Board reviewed the fund’s average annual total return over the 1-, 3-, 5-, and 10-year periods as well as the fund’s year-by-year returns and compared these returns with previously agreed upon comparable performance
measures and market data, including those supplied by Lipper and Morningstar, which are independent providers of mutual fund data. On the basis of this evaluation and the Board’s ongoing review of investment results, the Board concluded that
the fund’s performance was satisfactory.
Costs, Benefits, Profits, and Economies of Scale
The Board reviewed detailed information regarding the revenues received by the Manager under the Contract and other benefits that the Manager (and its affiliates) may have realized from its relationship with the fund, including research
received under “soft dollar” agreements. The Board noted that soft dollars were not used to pay for third-party, non-broker research. The Board also received information on the estimated costs incurred and profits realized by the Manager
and its affiliates from advising T. Rowe Price mutual funds, as well as estimates of the gross profits realized from managing the fund in particular. The Board concluded that the Manager’s profits were reasonable in light of the services
provided to the fund. The Board also considered whether the fund or other funds benefit under the fee levels set forth in the Contract from any economies of scale realized by the Manager. Under the Contract, the fund pays a fee to the Manager
composed of two components—a group fee rate based on the aggregate assets of certain T. Rowe Price mutual funds (including the fund) that declines at certain asset levels and an individual fund fee rate that is assessed on the assets of the
fund. The Board concluded that the advisory fee structure for the fund continued to provide for a reasonable sharing of benefits from any economies of scale with the fund’s investors.
Fees
The Board reviewed the fund’s management fee rate, operating expenses, and total expense ratio (for the Investor Class and the Advisor Class) and compared them with fees and expenses of other comparable funds based on information
and data supplied by Lipper. The information provided to the Board indicated that the fund’s management fee rate was generally at or below the median for comparable funds. The information also indicated that the fund’s expense ratio (for
both classes) was below the median for comparable funds. The Board also reviewed the fee schedules for comparable privately managed accounts of the Manager and its affiliates. Management informed the Board that the Manager’s responsibilities
for privately managed accounts are more limited than its responsibilities for the fund and other T. Rowe Price mutual funds that it or its affiliates advise. On the basis of the information provided, the Board concluded that the fees paid by the
fund under the Contract were reasonable.
Approval of the Contract
As noted, the Board approved the continuation of the Contract. No single factor was considered in isolation or to be determinative to the decision. Rather, the Board concluded, in light of a weighting and balancing of all factors
considered, that it was in the best interests of the fund to approve the continuation of the Contract, including the fees to be charged for services thereunder.
A code of ethics, as defined in Item 2 of Form N-CSR, applicable to its principal executive officer, principal financial officer, principal accounting officer or controller, or persons performing similar functions is filed as an exhibit to the registrant’s annual Form N-CSR. No substantive amendments were approved or waivers were granted to this code of ethics during the registrant’s most recent fiscal half-year.
Item 3. Audit Committee Financial Expert.
Disclosure required in registrant’s annual Form N-CSR.
Item 4. Principal Accountant Fees and Services.
Disclosure required in registrant’s annual Form N-CSR.
Item 5. Audit Committee of Listed Registrants.
Not applicable.
Item 6. Schedule of Investments.
Not applicable. The complete schedule of investments is included in Item 1 of this Form N-CSR.
Item 7. Disclosure of Proxy Voting Policies and Procedures for Closed-End Management Investment Companies.
Not applicable.
Item 8. Portfolio Managers of Closed-End Management Investment Companies.
Not applicable.
Item 9. Purchases of Equity Securities by Closed-End Management Investment Company and Affiliated Purchasers.
Not applicable.
Item 10. Submission of Matters to a Vote of Security Holders.
Not applicable.
Item 11. Controls and Procedures.
(a) The registrant’s principal executive officer and principal financial officer have evaluated the registrant’s disclosure controls and procedures within 90 days of this filing and have concluded that the registrant’s disclosure controls and procedures were effective, as of that date, in ensuring that information required to be disclosed by the registrant in this Form N-CSR was recorded, processed, summarized, and reported timely.
(b) The registrant’s principal executive officer and principal financial officer are aware of no change in the registrant’s internal control over financial reporting that occurred during the registrant’s second fiscal quarter covered by this report that has materially affected, or is reasonably likely to materially affect, the registrant’s internal control over financial reporting.
Item 12. Exhibits.
(a)(1) The registrant’s code of ethics pursuant to Item 2 of Form N-CSR is filed with the registrant’s annual Form N-CSR.
(2) Separate certifications by the registrant's principal executive officer and principal financial officer, pursuant to Section 302 of the Sarbanes-Oxley Act of 2002 and required by Rule 30a-2(a) under the Investment Company Act of 1940, are attached.
(3) Written solicitation to repurchase securities issued by closed-end companies: not applicable.
(b) A certification by the registrant's principal executive officer and principal financial officer, pursuant to Section 906 of the Sarbanes-Oxley Act of 2002 and required by Rule 30a-2(b) under the Investment Company Act of 1940, is attached.
|
SIGNATURES
|
|
| Pursuant to the requirements of the Securities Exchange Act of 1934 and the Investment | |
| Company Act of 1940, the registrant has duly caused this report to be signed on its behalf by the | |
| undersigned, thereunto duly authorized. | |
| T. Rowe Price Small-Cap Stock Fund, Inc. | |
| By | /s/ Edward C. Bernard |
| Edward C. Bernard | |
| Principal Executive Officer | |
| Date | August 17, 2007 |
| Pursuant to the requirements of the Securities Exchange Act of 1934 and the Investment | |
| Company Act of 1940, this report has been signed below by the following persons on behalf of | |
| the registrant and in the capacities and on the dates indicated. | |
| By | /s/ Edward C. Bernard |
| Edward C. Bernard | |
| Principal Executive Officer | |
| Date | August 17, 2007 |
| By | /s/ Joseph A. Carrier |
| Joseph A. Carrier | |
| Principal Financial Officer | |
| Date | August 17, 2007 |