
Semiannual Report
September 30, 2023
MFS® Municipal Series Trust

For the states of:
Alabama, Arkansas, California, Georgia, Maryland,
and Massachusetts
MSTA-SEM
MFS® Municipal Series Trust
For the states of: Alabama, Arkansas, California,
Georgia, Maryland, and Massachusetts
Portfolio Composition
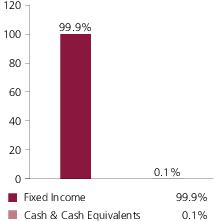
MFS Alabama Municipal Bond
Fund

| (a) | For all securities other than those specifically described below, ratings are assigned to underlying securities utilizing ratings from Moody’s, Fitch, and Standard & Poor’s rating agencies and applying the following hierarchy: If all three agencies provide a rating, the middle rating (after dropping the highest and lowest ratings) is assigned; if two of the three agencies rate a security, the lower of the two is assigned. If none of the 3 rating agencies above assign a rating, but the security is rated by DBRS Morningstar, then the DBRS Morningstar rating is assigned. If none of the 4 rating agencies listed above rate the security, but the security is rated by the Kroll Bond Rating Agency (KBRA), then the KBRA rating is assigned. Ratings are shown in the S&P and Fitch scale (e.g., AAA). Securities rated BBB or higher are considered investment grade. All ratings are subject to change. Not Rated includes fixed income securities and fixed income derivatives that have not been rated by any rating agency. The fund may or may not have held all of these instruments on this date. The fund is not rated by these agencies. |
| (d) | Duration is a measure of how much a bond’s price is likely to fluctuate with general changes in interest rates, e.g., if rates rise 1.00%, a bond with a 5-year duration is likely to lose about 5.00% of its value due to the interest rate move. The Average Duration calculation reflects the impact of the equivalent exposure of derivative positions, if any. |
| (i) | For purposes of this presentation, the components include the value of securities, and reflect the impact of the equivalent exposure of derivative positions, if any. These amounts may be negative from time to time. Equivalent exposure is a calculated amount that translates the derivative position into a reasonable approximation of the amount of the underlying asset that the portfolio would have to hold at a given point in time to have the same price sensitivity that results from the portfolio’s ownership of the derivative contract. When dealing with derivatives, equivalent exposure is a more representative measure of the potential impact of a position on portfolio performance than value. The bond component will include any accrued interest amounts. |
| (m) | In determining each instrument’s effective maturity for purposes of calculating the fund’s dollar-weighted average effective maturity, MFS uses the instrument’s stated maturity or, if applicable, an earlier date on which MFS believes it is probable that a maturity-shortening feature (such as a put, pre-refunding or prepayment) will cause the instrument to be repaid. Such an earlier date can be substantially shorter than the instrument’s stated maturity. |
| (o) | Less than 0.1%. |
Cash & Cash
Equivalents includes any cash, investments in money market funds, short-term securities, and other assets less liabilities. Please see the Statements of Assets and Liabilities for additional information related to the
fund’s cash position and other assets and liabilities.
Percentages are based
on net assets as of September 30, 2023.
The portfolio is
actively managed and current holdings may be different.
1
Portfolio Composition - continued
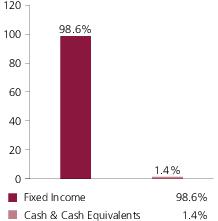
MFS Arkansas Municipal Bond
Fund
| (a) | For all securities other than those specifically described below, ratings are assigned to underlying securities utilizing ratings from Moody’s, Fitch, and Standard & Poor’s rating agencies and applying the following hierarchy: If all three agencies provide a rating, the middle rating (after dropping the highest and lowest ratings) is assigned; if two of the three agencies rate a security, the lower of the two is assigned. If none of the 3 rating agencies above assign a rating, but the security is rated by DBRS Morningstar, then the DBRS Morningstar rating is assigned. If none of the 4 rating agencies listed above rate the security, but the security is rated by the Kroll Bond Rating Agency (KBRA), then the KBRA rating is assigned. Ratings are shown in the S&P and Fitch scale (e.g., AAA). Securities rated BBB or higher are considered investment grade. All ratings are subject to change. Not Rated includes fixed income securities and fixed income derivatives that have not been rated by any rating agency. The fund may or may not have held all of these instruments on this date. The fund is not rated by these agencies. |
| (d) | Duration is a measure of how much a bond’s price is likely to fluctuate with general changes in interest rates, e.g., if rates rise 1.00%, a bond with a 5-year duration is likely to lose about 5.00% of its value due to the interest rate move. The Average Duration calculation reflects the impact of the equivalent exposure of derivative positions, if any. |
| (i) | For purposes of this presentation, the components include the value of securities, and reflect the impact of the equivalent exposure of derivative positions, if any. These amounts may be negative from time to time. Equivalent exposure is a calculated amount that translates the derivative position into a reasonable approximation of the amount of the underlying asset that the portfolio would have to hold at a given point in time to have the same price sensitivity that results from the portfolio’s ownership of the derivative contract. When dealing with derivatives, equivalent exposure is a more representative measure of the potential impact of a position on portfolio performance than value. The bond component will include any accrued interest amounts. |
| (m) | In determining each instrument’s effective maturity for purposes of calculating the fund’s dollar-weighted average effective maturity, MFS uses the instrument’s stated maturity or, if applicable, an earlier date on which MFS believes it is probable that a maturity-shortening feature (such as a put, pre-refunding or prepayment) will cause the instrument to be repaid. Such an earlier date can be substantially shorter than the instrument’s stated maturity. |
| (o) | Less than 0.1%. |
Cash & Cash
Equivalents includes any cash, investments in money market funds, short-term securities, and other assets less liabilities. Please see the Statements of Assets and Liabilities for additional information related to the
fund’s cash position and other assets and liabilities.
Percentages are based
on net assets as of September 30, 2023.
The portfolio is
actively managed and current holdings may be different.
2
Portfolio Composition - continued
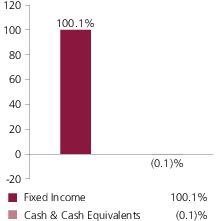
MFS California Municipal Bond
Fund
| (a) | For all securities other than those specifically described below, ratings are assigned to underlying securities utilizing ratings from Moody’s, Fitch, and Standard & Poor’s rating agencies and applying the following hierarchy: If all three agencies provide a rating, the middle rating (after dropping the highest and lowest ratings) is assigned; if two of the three agencies rate a security, the lower of the two is assigned. If none of the 3 rating agencies above assign a rating, but the security is rated by DBRS Morningstar, then the DBRS Morningstar rating is assigned. If none of the 4 rating agencies listed above rate the security, but the security is rated by the Kroll Bond Rating Agency (KBRA), then the KBRA rating is assigned. Ratings are shown in the S&P and Fitch scale (e.g., AAA). Securities rated BBB or higher are considered investment grade. All ratings are subject to change. Not Rated includes fixed income securities and fixed income derivatives that have not been rated by any rating agency. The fund may or may not have held all of these instruments on this date. The fund is not rated by these agencies. |
| (d) | Duration is a measure of how much a bond’s price is likely to fluctuate with general changes in interest rates, e.g., if rates rise 1.00%, a bond with a 5-year duration is likely to lose about 5.00% of its value due to the interest rate move. The Average Duration calculation reflects the impact of the equivalent exposure of derivative positions, if any. |
| (i) | For purposes of this presentation, the components include the value of securities, and reflect the impact of the equivalent exposure of derivative positions, if any. These amounts may be negative from time to time. Equivalent exposure is a calculated amount that translates the derivative position into a reasonable approximation of the amount of the underlying asset that the portfolio would have to hold at a given point in time to have the same price sensitivity that results from the portfolio’s ownership of the derivative contract. When dealing with derivatives, equivalent exposure is a more representative measure of the potential impact of a position on portfolio performance than value. The bond component will include any accrued interest amounts. |
| (m) | In determining each instrument’s effective maturity for purposes of calculating the fund’s dollar-weighted average effective maturity, MFS uses the instrument’s stated maturity or, if applicable, an earlier date on which MFS believes it is probable that a maturity-shortening feature (such as a put, pre-refunding or prepayment) will cause the instrument to be repaid. Such an earlier date can be substantially shorter than the instrument’s stated maturity. |
| (o) | Less than 0.1%. |
Cash & Cash
Equivalents includes any cash, investments in money market funds, short-term securities, and other assets less liabilities. Please see the Statements of Assets and Liabilities for additional information related to the
fund’s cash position and other assets and liabilities.
Percentages are based
on net assets as of September 30, 2023.
The portfolio is
actively managed and current holdings may be different.
3
Portfolio Composition - continued
MFS Georgia Municipal Bond
Fund

| (a) | For all securities other than those specifically described below, ratings are assigned to underlying securities utilizing ratings from Moody’s, Fitch, and Standard & Poor’s rating agencies and applying the following hierarchy: If all three agencies provide a rating, the middle rating (after dropping the highest and lowest ratings) is assigned; if two of the three agencies rate a security, the lower of the two is assigned. If none of the 3 rating agencies above assign a rating, but the security is rated by DBRS Morningstar, then the DBRS Morningstar rating is assigned. If none of the 4 rating agencies listed above rate the security, but the security is rated by the Kroll Bond Rating Agency (KBRA), then the KBRA rating is assigned. Ratings are shown in the S&P and Fitch scale (e.g., AAA). Securities rated BBB or higher are considered investment grade. All ratings are subject to change. Not Rated includes fixed income securities and fixed income derivatives that have not been rated by any rating agency. The fund may or may not have held all of these instruments on this date. The fund is not rated by these agencies. |
| (d) | Duration is a measure of how much a bond’s price is likely to fluctuate with general changes in interest rates, e.g., if rates rise 1.00%, a bond with a 5-year duration is likely to lose about 5.00% of its value due to the interest rate move. The Average Duration calculation reflects the impact of the equivalent exposure of derivative positions, if any. |
| (i) | For purposes of this presentation, the components include the value of securities, and reflect the impact of the equivalent exposure of derivative positions, if any. These amounts may be negative from time to time. Equivalent exposure is a calculated amount that translates the derivative position into a reasonable approximation of the amount of the underlying asset that the portfolio would have to hold at a given point in time to have the same price sensitivity that results from the portfolio’s ownership of the derivative contract. When dealing with derivatives, equivalent exposure is a more representative measure of the potential impact of a position on portfolio performance than value. The bond component will include any accrued interest amounts. |
| (m) | In determining each instrument’s effective maturity for purposes of calculating the fund’s dollar-weighted average effective maturity, MFS uses the instrument’s stated maturity or, if applicable, an earlier date on which MFS believes it is probable that a maturity-shortening feature (such as a put, pre-refunding or prepayment) will cause the instrument to be repaid. Such an earlier date can be substantially shorter than the instrument’s stated maturity. |
| (o) | Less than 0.1%. |
Cash & Cash
Equivalents includes any cash, investments in money market funds, short-term securities, and other assets less liabilities. Please see the Statements of Assets and Liabilities for additional information related to the
fund’s cash position and other assets and liabilities.
Percentages are based
on net assets as of September 30, 2023.
The portfolio is
actively managed and current holdings may be different.
4
Portfolio Composition - continued
MFS Maryland Municipal Bond
Fund

| (a) | For all securities other than those specifically described below, ratings are assigned to underlying securities utilizing ratings from Moody’s, Fitch, and Standard & Poor’s rating agencies and applying the following hierarchy: If all three agencies provide a rating, the middle rating (after dropping the highest and lowest ratings) is assigned; if two of the three agencies rate a security, the lower of the two is assigned. If none of the 3 rating agencies above assign a rating, but the security is rated by DBRS Morningstar, then the DBRS Morningstar rating is assigned. If none of the 4 rating agencies listed above rate the security, but the security is rated by the Kroll Bond Rating Agency (KBRA), then the KBRA rating is assigned. Ratings are shown in the S&P and Fitch scale (e.g., AAA). Securities rated BBB or higher are considered investment grade. All ratings are subject to change. Not Rated includes fixed income securities and fixed income derivatives that have not been rated by any rating agency. The fund may or may not have held all of these instruments on this date. The fund is not rated by these agencies. |
| (d) | Duration is a measure of how much a bond’s price is likely to fluctuate with general changes in interest rates, e.g., if rates rise 1.00%, a bond with a 5-year duration is likely to lose about 5.00% of its value due to the interest rate move. The Average Duration calculation reflects the impact of the equivalent exposure of derivative positions, if any. |
| (i) | For purposes of this presentation, the components include the value of securities, and reflect the impact of the equivalent exposure of derivative positions, if any. These amounts may be negative from time to time. Equivalent exposure is a calculated amount that translates the derivative position into a reasonable approximation of the amount of the underlying asset that the portfolio would have to hold at a given point in time to have the same price sensitivity that results from the portfolio’s ownership of the derivative contract. When dealing with derivatives, equivalent exposure is a more representative measure of the potential impact of a position on portfolio performance than value. The bond component will include any accrued interest amounts. |
| (m) | In determining each instrument’s effective maturity for purposes of calculating the fund’s dollar-weighted average effective maturity, MFS uses the instrument’s stated maturity or, if applicable, an earlier date on which MFS believes it is probable that a maturity-shortening feature (such as a put, pre-refunding or prepayment) will cause the instrument to be repaid. Such an earlier date can be substantially shorter than the instrument’s stated maturity. |
| (o) | Less than 0.1%. |
Cash & Cash
Equivalents includes any cash, investments in money market funds, short-term securities, and other assets less liabilities. Please see the Statements of Assets and Liabilities for additional information related to the
fund’s cash position and other assets and liabilities.
Percentages are based
on net assets as of September 30, 2023.
The portfolio is
actively managed and current holdings may be different.
5
Portfolio Composition - continued
MFS Massachusetts Municipal
Bond Fund
| (a) | For all securities other than those specifically described below, ratings are assigned to underlying securities utilizing ratings from Moody’s, Fitch, and Standard & Poor’s rating agencies and applying the following hierarchy: If all three agencies provide a rating, the middle rating (after dropping the highest and lowest ratings) is assigned; if two of the three agencies rate a security, the lower of the two is assigned. If none of the 3 rating agencies above assign a rating, but the security is rated by DBRS Morningstar, then the DBRS Morningstar rating is assigned. If none of the 4 rating agencies listed above rate the security, but the security is rated by the Kroll Bond Rating Agency (KBRA), then the KBRA rating is assigned. Ratings are shown in the S&P and Fitch scale (e.g., AAA). Securities rated BBB or higher are considered investment grade. All ratings are subject to change. Not Rated includes fixed income securities and fixed income derivatives that have not been rated by any rating agency. The fund may or may not have held all of these instruments on this date. The fund is not rated by these agencies. |
| (d) | Duration is a measure of how much a bond’s price is likely to fluctuate with general changes in interest rates, e.g., if rates rise 1.00%, a bond with a 5-year duration is likely to lose about 5.00% of its value due to the interest rate move. The Average Duration calculation reflects the impact of the equivalent exposure of derivative positions, if any. |
| (i) | For purposes of this presentation, the components include the value of securities, and reflect the impact of the equivalent exposure of derivative positions, if any. These amounts may be negative from time to time. Equivalent exposure is a calculated amount that translates the derivative position into a reasonable approximation of the amount of the underlying asset that the portfolio would have to hold at a given point in time to have the same price sensitivity that results from the portfolio’s ownership of the derivative contract. When dealing with derivatives, equivalent exposure is a more representative measure of the potential impact of a position on portfolio performance than value. The bond component will include any accrued interest amounts. |
| (m) | In determining each instrument’s effective maturity for purposes of calculating the fund’s dollar-weighted average effective maturity, MFS uses the instrument’s stated maturity or, if applicable, an earlier date on which MFS believes it is probable that a maturity-shortening feature (such as a put, pre-refunding or prepayment) will cause the instrument to be repaid. Such an earlier date can be substantially shorter than the instrument’s stated maturity. |
| (o) | Less than 0.1%. |
Cash & Cash
Equivalents includes any cash, investments in money market funds, short-term securities, and other assets less liabilities. Please see the Statements of Assets and Liabilities for additional information related to the
fund’s cash position and other assets and liabilities.
Percentages are based
on net assets as of September 30, 2023.
The portfolio is
actively managed and current holdings may be different.
6
Expense Tables
Fund expenses borne by the
shareholders during the period, April 1, 2023 through September 30, 2023
As a shareholder of the funds,
you incur two types of costs: (1) transaction costs, including sales charges (loads) on certain purchase or redemption payments, and (2) ongoing costs, including management fees; distribution and service (12b-1) fees;
and other fund expenses. These examples are intended to help you understand your ongoing costs (in dollars) of investing in the funds and to compare these costs with the ongoing costs of investing in other mutual
funds.
These examples are based on an
investment of $1,000 invested at the beginning of the period and held for the entire period April 1, 2023 through September 30, 2023.
Actual Expenses
The first line for each share
class in the following tables provides information about actual account values and actual expenses. You may use the information in this line, together with the amount you invested, to estimate the expenses that you
paid over the period. Simply divide your account value by $1,000 (for example, an $8,600 account value divided by $1,000 = 8.6), then multiply the result by the number in the first line under the heading entitled
“Expenses Paid During Period” to estimate the expenses you paid on your account during this period.
Hypothetical Example for
Comparison Purposes
The second line for each share
class in the following tables provides information about hypothetical account values and hypothetical expenses based on each fund’s actual expense ratio and an assumed rate of return of 5% per year before
expenses, which is not each fund’s actual return. The hypothetical account values and expenses may not be used to estimate the actual ending account balance or expenses you paid for the period. You may use this
information to compare the ongoing costs of investing in each fund and other funds. To do so, compare this 5% hypothetical example with the 5% hypothetical examples that appear in the shareholder reports of the other
funds.
Please note that the expenses
shown in the tables are meant to highlight your ongoing costs only and do not reflect any transactional costs, such as sales charges (loads). Therefore, the second line for each share class in the tables is useful in
comparing ongoing costs only, and will not help you determine the relative total costs of owning different funds. In addition, if these transactional costs were included, your costs would have been higher.
MFS ALABAMA MUNICIPAL BOND
FUND
| Share Class | Annualized Expense Ratio | Beginning Account Value 4/01/23 | Ending Account Value 9/30/23 | Expenses Paid During Period (p) 4/01/23-9/30/23 | |
| A | Actual | 0.90% | $1,000.00 | $952.25 | $4.39 |
| Hypothetical (h) | 0.90% | $1,000.00 | $1,020.50 | $4.55 | |
| B | Actual | 1.65% | $1,000.00 | $948.70 | $8.04 |
| Hypothetical (h) | 1.65% | $1,000.00 | $1,016.75 | $8.32 | |
| I | Actual | 0.65% | $1,000.00 | $952.65 | $3.17 |
| Hypothetical (h) | 0.65% | $1,000.00 | $1,021.75 | $3.29 | |
| R6 | Actual | 0.58% | $1,000.00 | $952.97 | $2.83 |
| Hypothetical (h) | 0.58% | $1,000.00 | $1,022.10 | $2.93 |
| (h) | 5% class return per year before expenses. |
| (p) | “Expenses Paid During Period” are equal to each class’s annualized expense ratio, as shown above, multiplied by the average account value over the period, multiplied by 183/366 (to reflect the one-half year period). Expenses paid do not include any applicable sales charges (loads). If these transaction costs had been included, your costs would have been higher. |
7
Expense Tables - continued
MFS ARKANSAS MUNICIPAL BOND
FUND
| Share Class | Annualized Expense Ratio | Beginning Account Value 4/01/23 | Ending Account Value 9/30/23 | Expenses Paid During Period (p) 4/01/23-9/30/23 | |
| A | Actual | 0.70% | $1,000.00 | $947.29 | $3.41 |
| Hypothetical (h) | 0.70% | $1,000.00 | $1,021.50 | $3.54 | |
| B | Actual | 1.45% | $1,000.00 | $943.83 | $7.05 |
| Hypothetical (h) | 1.45% | $1,000.00 | $1,017.75 | $7.31 | |
| I | Actual | 0.60% | $1,000.00 | $948.34 | $2.92 |
| Hypothetical (h) | 0.60% | $1,000.00 | $1,022.00 | $3.03 | |
| R6 | Actual | 0.53% | $1,000.00 | $948.68 | $2.58 |
| Hypothetical (h) | 0.53% | $1,000.00 | $1,022.35 | $2.68 |
MFS CALIFORNIA MUNICIPAL BOND
FUND
| Share Class | Annualized Expense Ratio | Beginning Account Value 4/01/23 | Ending Account Value 9/30/23 | Expenses Paid During Period (p) 4/01/23-9/30/23 | |
| A | Actual | 0.69% | $1,000.00 | $962.33 | $3.39 |
| Hypothetical (h) | 0.69% | $1,000.00 | $1,021.55 | $3.49 | |
| B | Actual | 1.44% | $1,000.00 | $958.73 | $7.05 |
| Hypothetical (h) | 1.44% | $1,000.00 | $1,017.80 | $7.26 | |
| C | Actual | 1.59% | $1,000.00 | $956.37 | $7.78 |
| Hypothetical (h) | 1.59% | $1,000.00 | $1,017.05 | $8.02 | |
| I | Actual | 0.59% | $1,000.00 | $962.60 | $2.89 |
| Hypothetical (h) | 0.59% | $1,000.00 | $1,022.05 | $2.98 | |
| R6 | Actual | 0.52% | $1,000.00 | $961.80 | $2.55 |
| Hypothetical (h) | 0.52% | $1,000.00 | $1,022.40 | $2.63 |
MFS GEORGIA MUNICIPAL BOND
FUND
| Share Class | Annualized Expense Ratio | Beginning Account Value 4/01/23 | Ending Account Value 9/30/23 | Expenses Paid During Period (p) 4/01/23-9/30/23 | |
| A | Actual | 0.90% | $1,000.00 | $954.38 | $4.40 |
| Hypothetical (h) | 0.90% | $1,000.00 | $1,020.50 | $4.55 | |
| B | Actual | 1.65% | $1,000.00 | $951.06 | $8.05 |
| Hypothetical (h) | 1.65% | $1,000.00 | $1,016.75 | $8.32 | |
| I | Actual | 0.65% | $1,000.00 | $956.09 | $3.18 |
| Hypothetical (h) | 0.65% | $1,000.00 | $1,021.75 | $3.29 | |
| R6 | Actual | 0.60% | $1,000.00 | $956.35 | $2.93 |
| Hypothetical (h) | 0.60% | $1,000.00 | $1,022.00 | $3.03 |
| (h) | 5% class return per year before expenses. |
| (p) | “Expenses Paid During Period” are equal to each class’s annualized expense ratio, as shown above, multiplied by the average account value over the period, multiplied by 183/366 (to reflect the one-half year period). Expenses paid do not include any applicable sales charges (loads). If these transaction costs had been included, your costs would have been higher. |
8
Expense Tables - continued
MFS MARYLAND MUNICIPAL BOND
FUND
| Share Class | Annualized Expense Ratio | Beginning Account Value 4/01/23 | Ending Account Value 9/30/23 | Expenses Paid During Period (p) 4/01/23-9/30/23 | |
| A | Actual | 0.83% | $1,000.00 | $958.66 | $4.06 |
| Hypothetical (h) | 0.83% | $1,000.00 | $1,020.85 | $4.19 | |
| B | Actual | 1.58% | $1,000.00 | $955.08 | $7.72 |
| Hypothetical (h) | 1.58% | $1,000.00 | $1,017.10 | $7.97 | |
| I | Actual | 0.58% | $1,000.00 | $959.35 | $2.84 |
| Hypothetical (h) | 0.58% | $1,000.00 | $1,022.10 | $2.93 | |
| R6 | Actual | 0.51% | $1,000.00 | $959.68 | $2.50 |
| Hypothetical (h) | 0.51% | $1,000.00 | $1,022.45 | $2.58 |
MFS MASSACHUSETTS MUNICIPAL BOND
FUND
| Share Class | Annualized Expense Ratio | Beginning Account Value 4/01/23 | Ending Account Value 9/30/23 | Expenses Paid During Period (p) 4/01/23-9/30/23 | |
| A | Actual | 0.82% | $1,000.00 | $957.94 | $4.01 |
| Hypothetical (h) | 0.82% | $1,000.00 | $1,020.90 | $4.14 | |
| B | Actual | 1.57% | $1,000.00 | $955.42 | $7.68 |
| Hypothetical (h) | 1.57% | $1,000.00 | $1,017.15 | $7.92 | |
| I | Actual | 0.57% | $1,000.00 | $960.14 | $2.79 |
| Hypothetical (h) | 0.57% | $1,000.00 | $1,022.15 | $2.88 | |
| R6 | Actual | 0.50% | $1,000.00 | $960.50 | $2.45 |
| Hypothetical (h) | 0.50% | $1,000.00 | $1,022.50 | $2.53 |
| (h) | 5% class return per year before expenses. |
| (p) | “Expenses Paid During Period” are equal to each class’s annualized expense ratio, as shown above, multiplied by the average account value over the period, multiplied by 183/366 (to reflect the one-half year period). Expenses paid do not include any applicable sales charges (loads). If these transaction costs had been included, your costs would have been higher. |
9
Portfolio of Investments
9/30/23 (unaudited)
The Portfolio of Investments is
a complete list of all securities owned by your fund. It is categorized by broad-based asset classes.
MFS Alabama Municipal Bond
Fund
| Issuer | Shares/Par | Value ($) | ||
| Municipal Bonds – 97.2% | ||||
| Airport Revenue – 0.1% | ||||
| Denver, CO, City & County Airport System Rev., “A”, 4.125%, 11/15/2047 | $ | 55,000 | $47,938 | |
| Denver, CO, City & County Airport System Rev., “A”, 4.125%, 11/15/2053 | 50,000 | 42,424 | ||
| $90,362 | ||||
| General Obligations - General Purpose – 15.0% | ||||
| Arab, AL, General Obligation Warrants, “A”, AGM, 3%, 12/01/2046 | $ | 1,120,000 | $771,508 | |
| Birmingham, AL, General Obligation Warrants, “B”, 5%, 12/01/2043 | 245,000 | 248,847 | ||
| Birmingham-Jefferson, AL, Civic Center Authority Rev., “A”, 5.25%, 5/31/2053 | 750,000 | 763,801 | ||
| Bridgeview, IL, Stadium and Redevelopment Projects, Taxable, AAC, 5.14%, 12/01/2036 | 160,000 | 138,124 | ||
| Chicago, IL, General Obligation, “A”, 5.5%, 1/01/2035 | 40,000 | 41,634 | ||
| Chicago, IL, General Obligation, “A”, 5.5%, 1/01/2040 | 270,000 | 276,281 | ||
| Chicago, IL, General Obligation, “F”, 5.5%, 1/01/2042 | 110,000 | 109,061 | ||
| Commonwealth of Puerto Rico, General Obligation Restructured Bonds, Capital Appreciation, Series 2022A, 0%, 7/01/2024 | 5,121 | 4,947 | ||
| Commonwealth of Puerto Rico, General Obligation Restructured Bonds, Capital Appreciation, Series 2022A, 0%, 7/01/2033 | 40,508 | 23,874 | ||
| Commonwealth of Puerto Rico, General Obligation Restructured Bonds, Series 2022A, 5.625%, 7/01/2027 | 34,739 | 35,648 | ||
| Commonwealth of Puerto Rico, General Obligation Restructured Bonds, Series 2022A, 5.625%, 7/01/2029 | 34,176 | 35,314 | ||
| Commonwealth of Puerto Rico, General Obligation Restructured Bonds, Series 2022A, 5.75%, 7/01/2031 | 115,194 | 120,299 | ||
| Commonwealth of Puerto Rico, General Obligation Restructured Bonds, Series 2022A, 4%, 7/01/2033 | 31,477 | 28,214 | ||
| Commonwealth of Puerto Rico, General Obligation Restructured Bonds, Series 2022A, 4%, 7/01/2035 | 57,199 | 49,709 | ||
| Commonwealth of Puerto Rico, General Obligation Restructured Bonds, Series 2022A, 4%, 7/01/2037 | 24,283 | 20,384 | ||
| Commonwealth of Puerto Rico, General Obligation Restructured Bonds, Series 2022A, 4%, 7/01/2041 | 33,016 | 26,545 | ||
| Commonwealth of Puerto Rico, General Obligation Restructured Bonds, Series 2022A, 4%, 7/01/2046 | 121,336 | 93,548 | ||
| Fort Payne, AL, General Obligation Warrants, “A”, AGM, 5%, 5/01/2047 | 750,000 | 756,634 | ||
| Jasper, AL, General Obligation Warrants, 5%, 3/01/2032 (Prerefunded 3/01/2024) | 500,000 | 501,924 | ||
| Mobile County, AL, General Obligation Warrants, 5%, 8/01/2036 | 500,000 | 518,341 | ||
| Montevallo, AL, American Village Public Educational Building Authority Refunding Rev. (Alabama Veterans Living Legacy Project), 4%, 12/01/2034 | 655,000 | 599,823 | ||
| Montevallo, AL, American Village Public Educational Building Authority Refunding Rev. (Alabama Veterans Living Legacy Project), 4%, 12/01/2035 | 250,000 | 228,823 | ||
| Oxford, AL, General Obligation Warrants, “A”, 5%, 7/01/2052 | 1,000,000 | 1,011,444 | ||
| Pike Road, AL, General Obligation, 5%, 2/29/2048 | 500,000 | 514,240 | ||
| Pike Road, AL, General Obligation, 5%, 2/29/2052 | 500,000 | 512,165 | ||
| State of Illinois, General Obligation, 5.5%, 5/01/2039 | 120,000 | 125,194 | ||
| State of Illinois, General Obligation, “B”, 5.5%, 5/01/2047 | 55,000 | 57,057 | ||
| State of Illinois, General Obligation, “C”, 4%, 10/01/2040 | 170,000 | 148,757 | ||
| State of Illinois, General Obligation, “C”, 4%, 10/01/2041 | 100,000 | 86,591 | ||
| Texas Cedar Port Navigation & Improvement District, Unlimited Tax, 4.5%, 8/31/2048 | 70,000 | 63,186 | ||
| Texas Cedar Port Navigation & Improvement District, Unlimited Tax, 4.5%, 8/31/2052 | 30,000 | 26,728 | ||
| Trussville, AL, General Obligation Warrants, “A”, 4%, 8/01/2041 | 750,000 | 677,560 | ||
| Vestavia Hills, AL, General Obligation Warrants, 4%, 8/01/2038 | 1,000,000 | 933,074 | ||
| $9,549,279 | ||||
| General Obligations - Schools – 5.4% | ||||
| Chicago, IL, Board of Education, Unlimited Tax General Obligation Dedicated Rev., “A”, 4%, 12/01/2047 | $ | 255,000 | $198,088 | |
| Huntsville, AL, School Warrants, “C”, 5%, 11/01/2030 (Prerefunded 11/01/2023) | 1,000,000 | 1,000,786 | ||
| Little Rock, AR, School District & Construction, “A”, BAM, 3%, 2/01/2048 | 625,000 | 425,396 | ||
| Mobile County, AL, Board of School Commissioners, Special Tax School Warrants, 4%, 3/01/2039 | 1,000,000 | 914,554 | ||
| Mobile County, AL, Board of School Commissioners, Special Tax School Warrants, “B”, BAM, 4.125%, 3/01/2047 | 1,000,000 | 888,356 | ||
| $3,427,180 | ||||
| Healthcare Revenue - Hospitals – 10.5% | ||||
| Alabama DCH Health Care Authority, “A”, 4%, 6/01/2046 | $ | 1,000,000 | $812,762 | |
| Alabama DCH Health Care Authority, Health Care Facilities Rev., 5%, 6/01/2033 | 500,000 | 501,973 | ||
10
Portfolio of Investments (unaudited) –
continued
| Issuer | Shares/Par | Value ($) | ||
| Municipal Bonds – continued | ||||
| Healthcare Revenue - Hospitals – continued | ||||
| Alabama Health Care Authority (Baptist Health), “A”, 5%, 11/15/2037 | $ | 875,000 | $886,067 | |
| Alabama Special Care Facilities Financing Authority Rev. (Daughters of Charity), ETM, AAC, 5%, 11/01/2025 | 270,000 | 281,617 | ||
| Birmingham, AL, Special Care Facilities Financing Authority Health Care Rev. (Children's Hospital), 5%, 6/01/2031 | 750,000 | 755,233 | ||
| Colorado Health Facilities Authority Rev. (CommonSpirit Health), “A-2”, 4%, 8/01/2049 | 15,000 | 12,082 | ||
| East Alabama Health Care Authority, Health Care Facilities Rev., “A”, 4%, 9/01/2048 | 500,000 | 404,956 | ||
| Harris County, TX, Cultural Education Facilities Finance Corp., Hospital Rev. (Memorial Hermann Health System), “A”, 4.125%, 7/01/2052 | 430,000 | 365,714 | ||
| Mobile, AL, Infirmary Health System Special Care Facilities Financing Authority Rev. (Infirmary Health System, Inc.), “A”, 4%, 2/01/2040 | 1,000,000 | 854,108 | ||
| North Carolina Medical Care Commission, Health Care Facilities Rev. (Rex Healthcare), “A”, 4%, 7/01/2049 | 520,000 | 431,010 | ||
| Spartanburg County, SC, Regional Health Services District Hospital Rev., “A”, 4%, 4/15/2043 | 425,000 | 360,198 | ||
| UAB Medicine Finance Authority Rev., “B”, 5%, 9/01/2035 | 1,000,000 | 1,017,239 | ||
| $6,682,959 | ||||
| Healthcare Revenue - Long Term Care – 1.7% | ||||
| Birmingham, AL, Special Care Facilities Financing Authority Rev. (Methodist Home for the Aging), 5.75%, 6/01/2045 | $ | 250,000 | $201,886 | |
| Pell City, AL, Special Care Facilities Financing Authority Rev. (Noland Health Services, Inc.), “A”, 4%, 12/01/2038 | 1,000,000 | 872,996 | ||
| $1,074,882 | ||||
| Industrial Revenue - Environmental Services – 0.3% | ||||
| Muscle Shoals, Sheffield, and Tuscumbia, AL, Solid Waste Disposal Authority Rev. (Cherokee Industrial Landfill Project), “A”, 6%, 5/01/2040 (z) | $ | 300,000 | $225,000 | |
| Industrial Revenue - Other – 0.8% | ||||
| Mobile County, AL, Limited Obligation Warrants (Gomesa Project), 4%, 11/01/2045 (n) | $ | 500,000 | $409,770 | |
| Port Beaumont, TX, Navigation District, Dock & Wharf Facility Rev. (Jefferson Gulf Coast Energy Project), “A”, 3.625%, 1/01/2035 (n) | 100,000 | 77,307 | ||
| $487,077 | ||||
| Miscellaneous Revenue - Other – 1.7% | ||||
| Alabama Stadium Trace Village Improvement District Development Incentive Anticipation, 3.625%, 3/01/2036 | $ | 230,000 | $176,889 | |
| California Infrastructure & Economic Development Bank Rev. (Brightline West Passenger Rail), “A”, 3.65%, 1/01/2050 (Put Date 1/31/2024) (n) | 375,000 | 372,709 | ||
| Matching Fund Special Purpose Securitization Corp., “A”, 5%, 10/01/2026 | 35,000 | 35,133 | ||
| New York Liberty Development Corp., Liberty Rev. (3 World Trade Center Project), “1”, 5%, 11/15/2044 (n) | 260,000 | 240,200 | ||
| Pennsylvania Economic Development Financing Authority, Private Activity Rev. (PennDOT Major Bridges Package One Project), AGM, 5%, 12/31/2057 | 275,000 | 264,885 | ||
| $1,089,816 | ||||
| Multi-Family Housing Revenue – 2.8% | ||||
| Alabama Housing Finance Authority, Multi-Family Housing Rev. (Maryvale Place Project), “F”, HUD Section 8, 4%, 10/01/2025 (Put Date 4/01/2025) | $ | 1,000,000 | $985,231 | |
| New Hampshire National Finance Authority Municipal Certificates, “1-A”, 4.375%, 9/20/2036 | 220,418 | 204,104 | ||
| New Mexico Mortgage Finance Authority, Multifamily Housing Rev. (Mountain View II & III Apartments Project), HUD Section 8, 5%, 2/01/2042 (Put Date 9/01/2025) | 75,000 | 75,548 | ||
| New Mexico Mortgage Finance Authority, Multifamily Housing Rev. (Santa Fe Apartment & Sangre de Cristo Project), HUD Section 8, 5%, 2/01/2042 (Put Date 6/01/2025) | 120,000 | 120,568 | ||
| New York, NY, Housing Development Corp., Multi-Family Housing Rev. (Sustainable Development Bonds), “G”, FHA, 2.45%, 11/01/2045 | 585,000 | 369,732 | ||
| $1,755,183 | ||||
| Port Revenue – 1.6% | ||||
| Alabama Port Authority Docks Facilities Refunding Rev., “A”, AGM, 5%, 10/01/2035 | $ | 1,000,000 | $1,008,285 | |
| Sales & Excise Tax Revenue – 8.9% | ||||
| Cherokee County, AL, Board of Education Special Tax School Warrants (Sales Tax), 5%, 12/01/2048 | $ | 1,000,000 | $1,009,765 | |
| Chicago, IL, Metropolitan Pier & Exposition Authority Refunding Bonds (McCormick Place Expansion Project), Capital Appreciation, “B-1”, AGM, 0%, 6/15/2044 | 820,000 | 279,724 | ||
| Guam Government Business Privilege Tax Refunding, “F”, 5%, 1/01/2030 | 5,000 | 4,985 | ||
| Guam Government Business Privilege Tax Refunding, “F”, 5%, 1/01/2031 | 5,000 | 4,967 | ||
| Guam Government Business Privilege Tax Refunding, “F”, 4%, 1/01/2042 | 60,000 | 48,557 | ||
| Jefferson County, AL, Cooper Green Mercy Health Services Authority Rev., “A”, 5.25%, 9/01/2052 | 810,000 | 806,855 | ||
11
Portfolio of Investments (unaudited) –
continued
| Issuer | Shares/Par | Value ($) | ||
| Municipal Bonds – continued | ||||
| Sales & Excise Tax Revenue – continued | ||||
| Jefferson County, AL, Limited Obligation Refunding Warrants, 4%, 9/15/2042 | $ | 1,000,000 | $870,206 | |
| Lawrence County, AL, Board of Education Special Tax School Warrants, AGM, 4%, 1/31/2042 | 1,000,000 | 899,784 | ||
| Puerto Rico Sales Tax Financing Corp., Restructured Sales Tax Rev., “2019A-1”, 4.55%, 7/01/2040 | 16,000 | 14,721 | ||
| Puerto Rico Sales Tax Financing Corp., Restructured Sales Tax Rev., “2019A-1”, 4.75%, 7/01/2053 | 57,000 | 50,392 | ||
| Puerto Rico Sales Tax Financing Corp., Restructured Sales Tax Rev., “2019A-1”, 5%, 7/01/2058 | 650,000 | 587,979 | ||
| Puerto Rico Sales Tax Financing Corp., Restructured Sales Tax Rev., “2019A-2”, 4.329%, 7/01/2040 | 142,000 | 127,184 | ||
| Puerto Rico Sales Tax Financing Corp., Restructured Sales Tax Rev., “2019A-2”, 4.329%, 7/01/2040 | 58,000 | 51,948 | ||
| Puerto Rico Sales Tax Financing Corp., Restructured Sales Tax Rev., “2019A-2”, 4.784%, 7/01/2058 | 401,000 | 350,010 | ||
| Puerto Rico Sales Tax Financing Corp., Restructured Sales Tax Rev., Capital Appreciation, “2019A-1”, 0%, 7/01/2027 | 26,000 | 22,139 | ||
| Puerto Rico Sales Tax Financing Corp., Restructured Sales Tax Rev., Capital Appreciation, “2019A-1”, 0%, 7/01/2029 | 4,000 | 3,110 | ||
| Puerto Rico Sales Tax Financing Corp., Restructured Sales Tax Rev., Capital Appreciation, “2019A-1”, 0%, 7/01/2031 | 247,000 | 174,982 | ||
| Puerto Rico Sales Tax Financing Corp., Restructured Sales Tax Rev., Capital Appreciation, “2019A-1”, 0%, 7/01/2033 | 237,000 | 151,858 | ||
| Puerto Rico Sales Tax Financing Corp., Restructured Sales Tax Rev., Capital Appreciation, “2019A-1”, 0%, 7/01/2046 | 465,000 | 119,872 | ||
| Wisconsin Public Finance Authority Limited Obligation Grant Rev. (American Dream at Meadowlands Project), “A”, 6.25%, 8/01/2027 (a)(d)(n) | 100,000 | 76,375 | ||
| $5,655,413 | ||||
| Single Family Housing - State – 0.9% | ||||
| Connecticut Housing Finance Authority Rev. (Housing Mortgage Finance Program), “C-1”, 4%, 11/15/2047 | $ | 130,000 | $128,048 | |
| Maryland Community Development Administration, Department of Housing & Community Development Residential Rev., “A”, GNMA, 4.45%, 9/01/2043 | 385,000 | 359,945 | ||
| Maryland Community Development Administration, Department of Housing & Community Development Residential Rev., “A”, GNMA, 4.5%, 9/01/2046 | 130,000 | 120,083 | ||
| $608,076 | ||||
| State & Local Agencies – 1.3% | ||||
| Alabama Public Health Care Authority Lease Rev. (Department of Public Health Facilities), 5%, 9/01/2030 | $ | 280,000 | $283,270 | |
| Bessemer, AL, Public Educational Building Authority Rev. (DHR Building Project), “A”, AGM, 5%, 7/01/2030 | 210,000 | 210,119 | ||
| Pennsylvania Public School Building Authority, School Lease Rev. (School District of Philadelphia Project), “A”, AGM, 5%, 6/01/2033 | 350,000 | 358,918 | ||
| $852,307 | ||||
| Student Loan Revenue – 0.8% | ||||
| Iowa Student Loan Liquidity Corp. Rev., “B”, 3%, 12/01/2039 | $ | 5,000 | $4,616 | |
| Iowa Student Loan Liquidity Corp. Rev., “B”, 3.5%, 12/01/2044 | 90,000 | 65,445 | ||
| Minnesota Office of Higher Education Supplemental Student Loan Program Rev., 2.65%, 11/01/2038 | 40,000 | 34,853 | ||
| New Jersey Higher Education Student Assistance Authority, Senior Student Loan Rev., “B”, 4%, 12/01/2041 | 415,000 | 392,564 | ||
| $497,478 | ||||
| Tax - Other – 6.4% | ||||
| Birmingham-Jefferson, AL, Civic Center Authority, “A”, 4%, 7/01/2043 | $ | 750,000 | $647,219 | |
| Birmingham-Jefferson, AL, Civic Center Authority, “B”, 5%, 7/01/2043 | 500,000 | 498,704 | ||
| Chicago, IL, Board of Education, Dedicated Capital Improvement Tax Bond, 5%, 4/01/2045 | 45,000 | 44,419 | ||
| Chicago, IL, Board of Education, Dedicated Capital Improvement Tax Bond, 5.75%, 4/01/2048 | 125,000 | 130,862 | ||
| Guam Government Limited Obligation Rev., “A”, 5%, 12/01/2036 | 30,000 | 29,285 | ||
| Guam Government Limited Obligation Rev., “A”, 5%, 12/01/2046 | 85,000 | 74,538 | ||
| Jefferson County, AL, Board of Education, 4%, 2/01/2042 | 805,000 | 719,703 | ||
| St. Clair County, AL, Board of Education, Special Tax School Warrants (15 Mill Moody Tax), “A”, BAM, 4.125%, 2/01/2048 | 500,000 | 441,798 | ||
| St. Clair County, AL, Board of Education, Special Tax School Warrants (15 Mill Moody Tax), “A”, BAM, 4.25%, 2/01/2052 | 500,000 | 443,931 | ||
| Tuscaloosa, AL, Board of Education, School Tax Warrants, 5%, 8/01/2036 (Prerefunded 8/01/2026) | 1,000,000 | 1,034,225 | ||
| $4,064,684 | ||||
| Tobacco – 0.6% | ||||
| Buckeye, OH, Tobacco Settlement Financing Authority Senior Asset-Backed Refunding, 2020B-2, “2”, 5%, 6/01/2055 | $ | 185,000 | $159,361 | |
| Golden State, CA, Tobacco Securitization Corp., Tobacco Settlement Rev., Taxable, “B-1”, 3.85%, 6/01/2050 | 255,000 | 231,299 | ||
| $390,660 | ||||
| Toll Roads – 0.3% | ||||
| Virginia Small Business Financing Authority Senior Lien Rev. (Elizabeth River Crossings Opco LLC Project), 3%, 1/01/2041 | $ | 250,000 | $179,979 | |
12
Portfolio of Investments (unaudited) –
continued
| Issuer | Shares/Par | Value ($) | ||
| Municipal Bonds – continued | ||||
| Transportation - Special Tax – 3.4% | ||||
| Jefferson County, AL, Transportation Infrastructure Bank, Limited Obligation Rev., “B”, AGM, 5%, 8/15/2035 | $ | 1,000,000 | $1,048,881 | |
| Jefferson County, AL, Transportation Infrastructure Bank, Limited Obligation Rev., “B”, AGM, 5%, 8/15/2036 | 1,000,000 | 1,039,299 | ||
| New Jersey Transportation Trust Fund Authority, “A”, 5%, 12/15/2039 | 45,000 | 46,163 | ||
| New Jersey Transportation Trust Fund Authority, “CC”, 5.5%, 6/15/2050 | 40,000 | 42,145 | ||
| $2,176,488 | ||||
| Universities - Colleges – 14.3% | ||||
| Alabama Community College System Board of Trustees Rev. (Bishop State Community College), BAM, 4%, 1/01/2044 | $ | 300,000 | $265,160 | |
| Alabama Community College System Board of Trustees Rev. (Bishop State Community College), BAM, 4%, 1/01/2049 | 1,000,000 | 848,931 | ||
| Auburn University, AL, General Fee Rev., “A”, 5%, 6/01/2048 | 1,500,000 | 1,520,685 | ||
| Homewood, AL, Educational Building Authority Facilities Rev. (Samford University), “A”, 5%, 12/01/2034 | 500,000 | 511,492 | ||
| Jacksonville, AL, Public Educational Building Authority Higher Education Facilities Rev. (Jacksonville State University Foundation), “A”, 5%, 7/01/2036 | 580,000 | 584,044 | ||
| Jacksonville, AL, Public Educational Building Authority Higher Education Facilities Rev. (Jacksonville State University Foundation), “A”, AGM, 5.25%, 8/01/2048 | 750,000 | 764,942 | ||
| Massachusetts Development Finance Agency Rev. (Suffolk University), 4%, 7/01/2051 | 345,000 | 261,163 | ||
| Puerto Rico Industrial, Tourist, Educational, Medical & Environmental Control Facilities Financing Authority, Educational Facilities Rev. (University Plaza Project), NPFG, 5%, 7/01/2033 | 60,000 | 58,177 | ||
| University of Alabama in Huntsville, General Fee Rev., “B2”, 5%, 9/01/2035 | 755,000 | 793,091 | ||
| University of Alabama in Huntsville, General Fee Rev., “B2”, 5%, 9/01/2036 | 475,000 | 496,034 | ||
| University of North Alabama, General Fee Rev., “B”, BAM, 5%, 11/01/2039 | 1,000,000 | 1,029,119 | ||
| University of South Alabama, Facilities Rev., BAM, 5%, 10/01/2036 | 500,000 | 509,054 | ||
| University of South Alabama, Facilities Rev., “A”, BAM, 5%, 4/01/2049 | 750,000 | 744,590 | ||
| University of West Alabama, General Fee Rev., AGM, 4%, 1/01/2040 | 770,000 | 685,445 | ||
| $9,071,927 | ||||
| Utilities - Investor Owned – 0.8% | ||||
| Mobile, AL, Industrial Development Board Pollution Control Rev. (Alabama Power Co. Barry Plant Project), “C”, 3.78%, 6/01/2034 (Put Date 6/16/2026) | $ | 500,000 | $490,968 | |
| Utilities - Municipal Owned – 0.6% | ||||
| Puerto Rico Electric Power Authority Refunding Rev., “DDD”, 5%, 7/01/2020 (a)(d) | $ | 5,000 | $1,250 | |
| Puerto Rico Electric Power Authority Refunding Rev., “DDD”, 5%, 7/01/2021 (a)(d) | 70,000 | 17,500 | ||
| Puerto Rico Electric Power Authority Refunding Rev., “DDD”, 5%, 7/01/2022 (a)(d) | 115,000 | 28,750 | ||
| Puerto Rico Electric Power Authority Refunding Rev., “VV”, NPFG, 5.25%, 7/01/2034 | 15,000 | 14,793 | ||
| Puerto Rico Electric Power Authority Rev., “A”, 5%, 7/01/2029 (a)(d) | 180,000 | 45,000 | ||
| Puerto Rico Electric Power Authority Rev., “A”, 5%, 7/01/2042 (a)(d) | 30,000 | 7,500 | ||
| Puerto Rico Electric Power Authority Rev., “AAA”, 5.25%, 7/01/2021 (a)(d) | 15,000 | 3,750 | ||
| Puerto Rico Electric Power Authority Rev., “AAA”, 5.25%, 7/01/2030 (a)(d) | 5,000 | 1,250 | ||
| Puerto Rico Electric Power Authority Rev., “CCC”, 5.25%, 7/01/2027 (a)(d) | 65,000 | 16,250 | ||
| Puerto Rico Electric Power Authority Rev., “DDD”, AGM, 3.65%, 7/01/2024 | 50,000 | 49,482 | ||
| Puerto Rico Electric Power Authority Rev., “SS”, AGM, 4.375%, 7/01/2030 | 15,000 | 14,370 | ||
| Puerto Rico Electric Power Authority Rev., “TT”, 5%, 7/01/2021 (a)(d) | 40,000 | 10,000 | ||
| Puerto Rico Electric Power Authority Rev., “TT”, 5%, 7/01/2023 (a)(d) | 30,000 | 7,500 | ||
| Puerto Rico Electric Power Authority Rev., “TT”, 5%, 7/01/2027 (a)(d) | 5,000 | 1,250 | ||
| Puerto Rico Electric Power Authority Rev., “TT”, 5%, 7/01/2037 (a)(d) | 95,000 | 23,750 | ||
| Puerto Rico Electric Power Authority Rev., “UU”, AGM, 4.25%, 7/01/2027 | 70,000 | 67,947 | ||
| Puerto Rico Electric Power Authority Rev., “WW”, 5.375%, 7/01/2022 (a)(d) | 5,000 | 1,250 | ||
| Puerto Rico Electric Power Authority Rev., “WW”, 5.25%, 7/01/2025 (a)(d) | 15,000 | 3,750 | ||
| Puerto Rico Electric Power Authority Rev., “ZZ”, 5%, 7/01/2018 (a)(d) | 40,000 | 10,000 | ||
| Puerto Rico Electric Power Authority Rev., “ZZ”, 5.25%, 7/01/2023 (a)(d) | 50,000 | 12,500 | ||
| Puerto Rico Electric Power Authority Rev., “ZZ”, 5.25%, 7/01/2024 (a)(d) | 15,000 | 3,750 | ||
| Puerto Rico Electric Power Authority Rev., “ZZ”, 5.25%, 7/01/2026 (a)(d) | 55,000 | 13,750 | ||
| Puerto Rico Electric Power Authority Rev., Taxable, “EEE”, 6.05%, 7/01/2032 (a)(d) | 40,000 | 10,000 | ||
| $365,342 | ||||
| Utilities - Other – 5.3% | ||||
| Alabama Southeast Energy Authority Commodity Supply Rev. (Project No.6), 5%, 1/01/2054 (Put Date 6/01/2030) | $ | 500,000 | $505,044 | |
| Black Belt Energy Gas District, AL, Gas Project Rev. (Project No. 8), “A”, 4%, 12/01/2052 (Put Date 12/01/2029) | 180,000 | 168,123 | ||
13
Portfolio of Investments (unaudited) –
continued
| Issuer | Shares/Par | Value ($) | ||
| Municipal Bonds – continued | ||||
| Utilities - Other – continued | ||||
| Black Belt Energy Gas District, AL, Gas Project Rev., “A”, 4%, 6/01/2051 (Put Date 12/01/2031) | $ | 210,000 | $198,004 | |
| Black Belt Energy Gas District, AL, Gas Project Rev., “C-1”, 5.25%, 2/01/2053 (Put Date 6/01/2029) | 425,000 | 431,272 | ||
| California Community Choice Financing Authority, Clean Energy Project Rev., “C”, 5.25%, 1/01/2054 (Put Date 10/01/2031) | 410,000 | 409,033 | ||
| Southeast Alabama Energy Authority Commodity Supply Rev. (Project No. 2), “A”, 4%, 12/01/2051 (Put Date 12/01/2031) | 1,000,000 | 930,086 | ||
| Southeast Alabama Energy Authority Commodity Supply Rev. (Project No. 5), “A”, 5.25%, 1/01/2054 (Put Date 7/01/2029) | 360,000 | 362,336 | ||
| Tennessee Energy Acquisition Corp., Gas Project Rev., “A-1”, 5%, 5/01/2053 (Put Date 5/01/2028) | 360,000 | 359,163 | ||
| $3,363,061 | ||||
| Water & Sewer Utility Revenue – 13.7% | ||||
| Auburn, AL, Waterworks Board Water Rev., 5%, 9/01/2036 (Prerefunded 9/01/2025) | $ | 1,000,000 | $1,020,793 | |
| Birmingham, AL, Waterworks Board Water Rev., 5%, 1/01/2036 (Prerefunded 1/01/2028) | 750,000 | 793,782 | ||
| Cullman, AL, Utilities Board Water Rev., “A”, AGM, 5%, 9/01/2035 | 1,000,000 | 1,006,582 | ||
| Gadsden, AL, Waterworks and Sewer Rev., AGM, 4%, 6/01/2033 | 1,000,000 | 979,329 | ||
| Guam Waterworks Authority Rev. (Water and Wastewater System), 5%, 7/01/2036 | 45,000 | 45,003 | ||
| Guam Waterworks Authority Rev. (Water and Wastewater System), 5%, 1/01/2046 | 120,000 | 113,097 | ||
| Guam Waterworks Authority Rev. (Water and Wastewater System), “A”, 5%, 7/01/2029 | 45,000 | 45,078 | ||
| Guam Waterworks Authority Rev. (Water and Wastewater System), “A”, 5%, 7/01/2035 | 45,000 | 45,027 | ||
| Guam Waterworks Authority Rev. (Water and Wastewater System), “A”, 5%, 1/01/2050 | 95,000 | 88,041 | ||
| Jefferson County, AL, Senior Lien Sewer Rev., Current Interest Warrants, “A”, AGM, 5%, 10/01/2044 | 750,000 | 736,256 | ||
| Limestone County, AL, Water & Sewer Authority Rev., 5%, 12/01/2045 | 1,000,000 | 1,018,483 | ||
| Madison, AL, Water & Wastewater Board Rev., 3%, 12/01/2050 | 1,000,000 | 666,149 | ||
| Michigan Finance Authority Local Government Loan Program Rev. (Detroit Water and Sewerage Department Sewage Disposal System Rev. Refunding Second Lien Local Project), “C-7”, NPFG, 5%, 7/01/2032 | 15,000 | 15,085 | ||
| Michigan Finance Authority Local Government Loan Program Rev. (Detroit Water and Sewerage Department Water Supply System Rev. Refunding Second Lien Local Project), “D-6”, NPFG, 5%, 7/01/2036 | 20,000 | 20,044 | ||
| Michigan Finance Authority Local Government Loan Program Rev. (Detroit Water and Sewerage Department Water Supply System Rev. Refunding Senior Lien Local Project), “D-1”, AGM, 5%, 7/01/2035 | 10,000 | 10,047 | ||
| Michigan Finance Authority Local Government Loan Program Rev. (Detroit Water and Sewerage Department Water Supply System Rev. Refunding Senior Lien Local Project), “D-1”, AGM, 5%, 7/01/2037 | 20,000 | 20,054 | ||
| Montgomery, AL, Water Works and Sanitary Sewer Board, Water and Sewer Rev., 5%, 9/01/2048 | 500,000 | 514,240 | ||
| Orange Beach, AL, Water Sewer & Fire Protection Authority Water Rev., 4%, 5/15/2047 | 1,000,000 | 854,925 | ||
| Prichard, AL, Water Works & Sewer Board Rev., 4%, 11/01/2044 | 700,000 | 489,432 | ||
| Texas Water Development Board State Water Implementation Rev., “A”, 5%, 10/15/2058 (w) | 200,000 | 205,607 | ||
| $8,687,054 | ||||
| Total Municipal Bonds (Identified Cost, $68,363,973) | $61,793,460 | |||
| Bonds – 0.3% | ||||
| Consumer Services – 0.3% | ||||
| Toll Road Investors Partnership II LP, Capital Appreciation, NPFG, 0%, 2/15/2025 (n) | $ | 136,000 | $122,460 | |
| Toll Road Investors Partnership II LP, Capital Appreciation, NPFG, 0%, 2/15/2043 (n) | 189,099 | 62,164 | ||
| Total Bonds (Identified Cost, $200,659) | $184,624 | |||
| Contingent Value Instruments – 0.1% | ||||
| General Obligations - General Purpose – 0.1% | ||||
| Commonwealth of Puerto Rico, General Obligation Contingent Value Instrument, 11/01/2043 (Identified Cost, $88,426) | $ | 149,038 | $77,313 | |
| Investment Companies (h) – 1.9% | ||||
| Money Market Funds – 1.9% | ||||
| MFS Institutional Money Market Portfolio, 5.4% (v) (Identified Cost, $1,199,599) | 1,199,500 | $1,199,740 | ||
| Other Assets, Less Liabilities – 0.5% | 348,065 | |||
| Net Assets – 100.0% | $63,603,202 | |||
See Portfolio Footnotes and Notes to
Financial Statements
14
Portfolio of Investments (unaudited) –
continued
MFS Arkansas Municipal Bond
Fund
| Issuer | Shares/Par | Value ($) | ||
| Municipal Bonds – 98.2% | ||||
| Airport Revenue – 0.3% | ||||
| Wayne County, MI, Airport Authority Rev. (Detroit Metropolitan Wayne County Airport), “B”, 5%, 12/01/2044 | $ | 95,000 | $93,727 | |
| Wayne County, MI, Airport Authority Rev. (Detroit Metropolitan Wayne County Airport), “B”, BAM, 5%, 12/01/2039 | 105,000 | 104,994 | ||
| Wayne County, MI, Airport Authority Rev. (Detroit Metropolitan Wayne County Airport), “C”, 5%, 12/01/2039 | 80,000 | 79,827 | ||
| Wayne County, MI, Airport Authority Rev. (Detroit Metropolitan Wayne County Airport), “C”, 5%, 12/01/2044 | 125,000 | 123,166 | ||
| $401,714 | ||||
| General Obligations - General Purpose – 4.4% | ||||
| Arkansas Higher Education, General Obligation, 4%, 6/01/2029 | $ | 2,000,000 | $1,948,184 | |
| Bridgeview, IL, Stadium and Redevelopment Projects, Taxable, AAC, 5.14%, 12/01/2036 | 375,000 | 323,728 | ||
| Chicago, IL, General Obligation, “A”, 5.5%, 1/01/2035 | 80,000 | 83,268 | ||
| Chicago, IL, General Obligation, “A”, 5.5%, 1/01/2040 | 550,000 | 562,794 | ||
| Chicago, IL, General Obligation, “F”, 5.5%, 1/01/2042 | 225,000 | 223,080 | ||
| Commonwealth of Puerto Rico, General Obligation Restructured Bonds, Capital Appreciation, Series 2022A, 0%, 7/01/2024 | 9,759 | 9,427 | ||
| Commonwealth of Puerto Rico, General Obligation Restructured Bonds, Capital Appreciation, Series 2022A, 0%, 7/01/2033 | 77,204 | 45,501 | ||
| Commonwealth of Puerto Rico, General Obligation Restructured Bonds, Series 2022A, 5.625%, 7/01/2027 | 66,209 | 67,941 | ||
| Commonwealth of Puerto Rico, General Obligation Restructured Bonds, Series 2022A, 5.625%, 7/01/2029 | 65,135 | 67,305 | ||
| Commonwealth of Puerto Rico, General Obligation Restructured Bonds, Series 2022A, 5.75%, 7/01/2031 | 63,265 | 66,069 | ||
| Commonwealth of Puerto Rico, General Obligation Restructured Bonds, Series 2022A, 4%, 7/01/2033 | 59,992 | 53,773 | ||
| Commonwealth of Puerto Rico, General Obligation Restructured Bonds, Series 2022A, 4%, 7/01/2035 | 111,025 | 96,486 | ||
| Commonwealth of Puerto Rico, General Obligation Restructured Bonds, Series 2022A, 4%, 7/01/2037 | 46,282 | 38,851 | ||
| Commonwealth of Puerto Rico, General Obligation Restructured Bonds, Series 2022A, 4%, 7/01/2041 | 62,925 | 50,593 | ||
| Commonwealth of Puerto Rico, General Obligation Restructured Bonds, Series 2022A, 4%, 7/01/2046 | 216,442 | 166,873 | ||
| Little Rock, AR, Library Construction Refunding, 4%, 3/01/2036 | 1,500,000 | 1,486,603 | ||
| State of Illinois, General Obligation, 5.5%, 5/01/2039 | 120,000 | 125,194 | ||
| State of Illinois, General Obligation, 5.75%, 5/01/2045 | 115,000 | 119,890 | ||
| State of Illinois, General Obligation, “B”, 5.5%, 5/01/2047 | 115,000 | 119,302 | ||
| State of Illinois, General Obligation, “C”, 4%, 10/01/2040 | 345,000 | 301,888 | ||
| State of Illinois, General Obligation, “C”, 4%, 10/01/2041 | 210,000 | 181,840 | ||
| $6,138,590 | ||||
| General Obligations - Schools – 8.9% | ||||
| Benton County, AR, Bentonville School District No. 6 Construction Refunding, “B”, 4%, 6/01/2037 | $ | 1,500,000 | $1,398,525 | |
| Benton County, AR, Bentonville School District No. 6 Construction Refunding, “B”, 4%, 6/01/2047 | 1,000,000 | 858,577 | ||
| Benton County, AR, Bentonville School District No. 6 Construction, “G”, 2.25%, 6/01/2046 | 1,000,000 | 587,354 | ||
| Crittenden County, AR, Community College District, 4.6%, 2/01/2035 | 285,000 | 280,369 | ||
| Crittenden County, AR, Community College District, 4.7%, 2/01/2040 | 625,000 | 607,437 | ||
| Crittenden County, AR, Earle Special School District Refunding and Construction, 4%, 2/01/2048 | 2,060,000 | 1,763,004 | ||
| Fort Smith, AR, School District No. 100 Construction, “B”, 2.75%, 2/01/2045 | 1,370,000 | 925,490 | ||
| Greene County, AR, Tech School District No. T-1, Construction Refunding, 3.75%, 4/01/2041 | 1,100,000 | 934,216 | ||
| Greene County, AR, Tech School District No. T-1, Construction Refunding, 3.75%, 4/01/2042 | 1,000,000 | 828,798 | ||
| Johnson County, AR, Clarksville School District No. 17 Refunding, 0.5%, 12/01/2024 | 350,000 | 329,510 | ||
| Little Rock, AR, School District & Construction of Pulaski County, 3%, 2/01/2030 | 1,030,000 | 930,223 | ||
| Little Rock, AR, School District & Construction, “A”, BAM, 3%, 2/01/2048 | 755,000 | 513,879 | ||
| North Little Rock, AR, School District No. 1, 2%, 2/01/2027 | 2,000,000 | 1,821,153 | ||
| North Little Rock, AR, School District No. 1, 2%, 2/01/2038 | 865,000 | 579,436 | ||
| $12,357,971 | ||||
| Healthcare Revenue - Hospitals – 12.6% | ||||
| Arkansas Development Finance Authority, Health Care Rev. (Baptist Health), 5%, 12/01/2047 | $ | 2,000,000 | $1,949,144 | |
| Arkansas Development Finance Authority, Health Care Rev. (Baptist Health), “A”, 5%, 12/01/2029 | 1,000,000 | 1,014,250 | ||
| Arkansas Development Finance Authority, Health Care Rev. (Baptist Memorial Health Care Corp.), “B-1”, 5%, 9/01/2034 | 740,000 | 749,779 | ||
| Arkansas Development Finance Authority, Health Care Rev. (Baptist Memorial Health Care Corp.), “B-1”, 5%, 9/01/2044 | 2,000,000 | 1,887,521 | ||
| Arkansas Development Finance Authority, Healthcare Facilities Rev. (Carti Surgery Center Project), “B”, 4.25%, 7/01/2041 | 750,000 | 609,765 | ||
| Arkansas Development Finance Authority, Healthcare Facilities Rev. (Carti Surgery Center Project), “B”, 4%, 7/01/2052 | 1,250,000 | 863,149 | ||
| Arkansas Development Finance Authority, Hospital Rev. (Washington Regional Medical Center), 5%, 2/01/2038 | 1,900,000 | 1,801,227 | ||
| Arkansas Development Finance Authority, Hospital Rev. (Washington Regional Medical Center), 4%, 2/01/2042 | 990,000 | 802,012 | ||
| Arkansas Development Finance Authority, Hospital Rev. (Washington Regional Medical Center), “A”, 5%, 2/01/2033 | 1,645,000 | 1,646,105 | ||
| Batesville, AK, Public Facilities Board, Hospital Rev. (White River Health System, Inc.), 5%, 6/01/2027 | 500,000 | 506,279 | ||
15
Portfolio of Investments (unaudited) –
continued
| Issuer | Shares/Par | Value ($) | ||
| Municipal Bonds – continued | ||||
| Healthcare Revenue - Hospitals – continued | ||||
| Colorado Health Facilities Authority Rev. (CommonSpirit Health), “A-2”, 4%, 8/01/2049 | $ | 30,000 | $24,164 | |
| Conway, AR, Hospital Rev. (Conway Regional Medical Center), “A”, 4%, 8/01/2038 | 1,000,000 | 837,713 | ||
| Doylestown, PA, Hospital Authority Rev., “A”, 4%, 6/30/2045 | 20,000 | 14,257 | ||
| Harris County, TX, Cultural Education Facilities Finance Corp., Hospital Rev. (Memorial Hermann Health System), “A”, 4.125%, 7/01/2052 | 810,000 | 688,903 | ||
| Montgomery County, MD, Rev. (Trinity Health Credit Group), 5%, 12/01/2045 | 300,000 | 300,557 | ||
| Pulaski, AR, Hospital Rev. (Arkansas Children's Hospital), 4.25%, 3/01/2048 | 1,000,000 | 880,773 | ||
| Springdale, AR, Public Facilities Board Hospital Rev. (Children's Northwest Project), 5%, 3/01/2040 | 2,820,000 | 2,823,968 | ||
| $17,399,566 | ||||
| Industrial Revenue - Other – 1.7% | ||||
| Lowell, AR, Industrial Development Rev. (Arkansas Democrat-Gazette), VRDN, 3.2%, 9/30/2036 | $ | 2,000,000 | $2,000,000 | |
| Port Beaumont, TX, Navigation District, Dock & Wharf Facility Rev. (Jefferson Gulf Coast Energy Project), “A”, 2.875%, 1/01/2041 (n) | 170,000 | 105,612 | ||
| Port Beaumont, TX, Navigation District, Dock & Wharf Facility Rev. (Jefferson Gulf Coast Energy Project), “A”, 4%, 1/01/2050 (n) | 390,000 | 261,752 | ||
| $2,367,364 | ||||
| Industrial Revenue - Paper – 0.1% | ||||
| Valparaiso, IN, Exempt Facilities Rev. (Pratt Paper LLC Project), 7%, 1/01/2044 | $ | 100,000 | $100,652 | |
| Miscellaneous Revenue - Other – 2.8% | ||||
| Bryant, AR, Capital Improvement Rev., 4.2%, 2/01/2050 | $ | 1,000,000 | $857,137 | |
| Fayetteville, AR, Hotel, Motel and Restaurant Rev., BAM, 5%, 11/01/2034 | 2,000,000 | 2,020,283 | ||
| Matching Fund Special Purpose Securitization Corp., “A”, 5%, 10/01/2026 | 60,000 | 60,229 | ||
| New York Liberty Development Corp., Liberty Rev. (3 World Trade Center Project), “1”, 5%, 11/15/2044 (n) | 375,000 | 346,442 | ||
| Pennsylvania Economic Development Financing Authority, Private Activity Rev. (PennDOT Major Bridges Package One Project), AGM, 5%, 12/31/2057 | 560,000 | 539,402 | ||
| $3,823,493 | ||||
| Multi-Family Housing Revenue – 0.3% | ||||
| New Hampshire National Finance Authority Municipal Certificates, “1-A”, 4.375%, 9/20/2036 | $ | 433,939 | $401,821 | |
| Sales & Excise Tax Revenue – 17.8% | ||||
| Bentonville, AR, Sales & Use Tax Refunding Improvement, “B”, 3%, 11/01/2034 | $ | 1,000,000 | $859,152 | |
| Bentonville, AR, Sales & Use Tax Refunding Improvement, “B”, 3%, 11/01/2035 | 1,000,000 | 841,785 | ||
| Bentonville, AR, Sales & Use Tax Refunding Improvement, “B”, 3%, 11/01/2036 | 785,000 | 642,145 | ||
| Cabot, AR, Sales & Use Tax Refunding and Improvements, “B”, 4%, 12/01/2029 | 250,000 | 252,024 | ||
| Chicago, IL, Metropolitan Pier & Exposition Authority Refunding Bonds (McCormick Place Expansion Project), Capital Appreciation, “B-1”, AGM, 0%, 6/15/2044 | 1,585,000 | 540,686 | ||
| Conway, AR, Sales & Use Tax Rev., Capital Improvement, 4.5%, 5/01/2030 | 850,000 | 850,162 | ||
| Conway, AR, Sales & Use Tax Rev., Capital Improvement, 4.5%, 5/01/2035 | 1,150,000 | 1,150,084 | ||
| Forrest City, AR, Sales & Use Tax , 3%, 11/01/2032 | 350,000 | 307,267 | ||
| Forrest City, AR, Sales & Use Tax , 3%, 11/01/2033 | 370,000 | 321,570 | ||
| Forrest City, AR, Sales & Use Tax , 3%, 11/01/2034 | 380,000 | 326,062 | ||
| Forrest City, AR, Sales & Use Tax , 3%, 11/01/2036 | 400,000 | 328,438 | ||
| Guam Government Business Privilege Tax Refunding, “F”, 5%, 1/01/2030 | 10,000 | 9,970 | ||
| Guam Government Business Privilege Tax Refunding, “F”, 5%, 1/01/2031 | 10,000 | 9,935 | ||
| Guam Government Business Privilege Tax Refunding, “F”, 4%, 1/01/2042 | 110,000 | 89,022 | ||
| Guam Government Business Privilege Tax Rev., “D”, 5%, 11/15/2031 | 415,000 | 409,014 | ||
| Madison County, AR, Sales & Use Tax, 4.375%, 11/30/2043 (w) | 1,000,000 | 931,403 | ||
| Madison County, AR, Sales & Use Tax, 4.625%, 11/30/2048 (w) | 500,000 | 470,644 | ||
| Massachusetts Bay Transportation Authority, Sales Tax Rev., “A-1”, 5.25%, 7/01/2029 | 1,000,000 | 1,096,757 | ||
| Mississippi County, AR, 4%, 6/01/2036 | 650,000 | 609,554 | ||
| Mountain View, AK, Sales and Use Tax Rev., BAM, 3%, 11/01/2031 | 335,000 | 296,311 | ||
| Mountain View, AK, Sales and Use Tax Rev., BAM, 3%, 11/01/2034 | 415,000 | 354,056 | ||
| Mountain View, AK, Sales and Use Tax Rev., BAM, 3%, 11/01/2035 | 425,000 | 354,250 | ||
| Phillips County, AR, Sales & Use Tax, BAM, 3.75%, 9/01/2038 | 1,170,000 | 1,062,565 | ||
| Puerto Rico Sales Tax Financing Corp., Restructured Sales Tax Rev., “2019A-1”, 4.55%, 7/01/2040 | 36,000 | 33,123 | ||
| Puerto Rico Sales Tax Financing Corp., Restructured Sales Tax Rev., “2019A-1”, 4.75%, 7/01/2053 | 122,000 | 107,856 | ||
| Puerto Rico Sales Tax Financing Corp., Restructured Sales Tax Rev., “2019A-1”, 5%, 7/01/2058 | 2,108,000 | 1,906,862 | ||
16
Portfolio of Investments (unaudited) –
continued
| Issuer | Shares/Par | Value ($) | ||
| Municipal Bonds – continued | ||||
| Sales & Excise Tax Revenue – continued | ||||
| Puerto Rico Sales Tax Financing Corp., Restructured Sales Tax Rev., “2019A-2”, 4.329%, 7/01/2040 | $ | 235,000 | $210,481 | |
| Puerto Rico Sales Tax Financing Corp., Restructured Sales Tax Rev., “2019A-2”, 4.329%, 7/01/2040 | 120,000 | 107,480 | ||
| Puerto Rico Sales Tax Financing Corp., Restructured Sales Tax Rev., “2019A-2”, 4.536%, 7/01/2053 | 2,000 | 1,706 | ||
| Puerto Rico Sales Tax Financing Corp., Restructured Sales Tax Rev., “2019A-2”, 4.784%, 7/01/2058 | 62,000 | 54,116 | ||
| Puerto Rico Sales Tax Financing Corp., Restructured Sales Tax Rev., Capital Appreciation, “2019A-1”, 0%, 7/01/2024 | 3,000 | 2,904 | ||
| Puerto Rico Sales Tax Financing Corp., Restructured Sales Tax Rev., Capital Appreciation, “2019A-1”, 0%, 7/01/2027 | 66,000 | 56,198 | ||
| Puerto Rico Sales Tax Financing Corp., Restructured Sales Tax Rev., Capital Appreciation, “2019A-1”, 0%, 7/01/2029 | 12,000 | 9,330 | ||
| Puerto Rico Sales Tax Financing Corp., Restructured Sales Tax Rev., Capital Appreciation, “2019A-1”, 0%, 7/01/2031 | 593,000 | 420,098 | ||
| Puerto Rico Sales Tax Financing Corp., Restructured Sales Tax Rev., Capital Appreciation, “2019A-1”, 0%, 7/01/2033 | 568,000 | 363,946 | ||
| Puerto Rico Sales Tax Financing Corp., Restructured Sales Tax Rev., Capital Appreciation, “2019A-1”, 0%, 7/01/2046 | 2,189,000 | 564,298 | ||
| Rogers, AR, Sales & Use Tax Rev., 4%, 11/01/2032 | 1,060,000 | 1,047,833 | ||
| Rogers, AR, Sales & Use Tax Rev., 4%, 11/01/2033 | 2,495,000 | 2,456,821 | ||
| Rogers, AR, Sales & Use Tax Rev., “B”, 5%, 11/01/2036 | 2,000,000 | 2,031,994 | ||
| Springdale, AR, Sales & Use Tax Refunding & Improvement, Taxable, “B”, BAM, 4.125%, 8/01/2050 | 2,000,000 | 1,751,835 | ||
| Springdale, AR, Sales & Use Tax Rev., BAM, 5%, 4/01/2037 | 1,000,000 | 1,004,777 | ||
| Wisconsin Public Finance Authority Limited Obligation Grant Rev. (American Dream at Meadowlands Project), “A”, 6.25%, 8/01/2027 (a)(d)(n) | 280,000 | 213,850 | ||
| Wisconsin Public Finance Authority Limited Obligation Grant Rev., Taxable (American Dream at Meadowlands Project), ”A“, 5.625%, 8/01/2024 (a)(d)(n) | 200,000 | 152,750 | ||
| $24,611,114 | ||||
| Secondary Schools – 0.6% | ||||
| Arkansas Development Finance Authority, Charter School Capital Improvement Rev. (LISA Academy Project), 4.5%, 7/01/2039 | $ | 750,000 | $660,781 | |
| District of Columbia Rev. (Rocketship D.C.), “A”, 5%, 6/01/2039 (n) | 250,000 | 224,118 | ||
| $884,899 | ||||
| Single Family Housing - State – 0.7% | ||||
| Maryland Community Development Administration, Department of Housing & Community Development Residential Rev., “A”, GNMA, 4.45%, 9/01/2043 | $ | 825,000 | $771,310 | |
| Maryland Community Development Administration, Department of Housing & Community Development Residential Rev., “A”, GNMA, 4.5%, 9/01/2046 | 275,000 | 254,023 | ||
| $1,025,333 | ||||
| State & Local Agencies – 2.5% | ||||
| Arkansas Development Finance Authority Rev. (Donaghey Plaza Project), 5%, 6/01/2034 | $ | 2,605,000 | $2,606,814 | |
| North Carolina Turnpike Authority, Triangle Expressway System Appropriation Rev., Capital Appreciation, 0%, 1/01/2044 | 2,360,000 | 834,158 | ||
| $3,440,972 | ||||
| Student Loan Revenue – 0.1% | ||||
| Iowa Student Loan Liquidity Corp. Rev., “B”, 3%, 12/01/2039 | $ | 10,000 | $9,232 | |
| Iowa Student Loan Liquidity Corp. Rev., “B”, 3.5%, 12/01/2044 | 185,000 | 134,525 | ||
| $143,757 | ||||
| Tax - Other – 4.3% | ||||
| Chicago, IL, Board of Education, Dedicated Capital Improvement Tax Bond, 5%, 4/01/2045 | $ | 90,000 | $88,839 | |
| Chicago, IL, Board of Education, Dedicated Capital Improvement Tax Bond, 5.75%, 4/01/2048 | 260,000 | 272,193 | ||
| Fayetteville, AR, Liberty Improvement Bonds, 4%, 1/01/2037 | 2,000,000 | 1,839,074 | ||
| Little Rock, AR, Hotel & Restaurant Gross Receipts Tax Rev., 5%, 7/01/2034 | 3,000,000 | 3,022,809 | ||
| Triborough Bridge & Tunnel Authority Rev., NY, Payroll Mobility Tax (MTA Bridges and Tunnels), ”C-3“, 3%, 5/15/2051 | 890,000 | 598,995 | ||
| Wisconsin Public Finance Authority Limited Obligation PILOT Rev. (American Dream at Meadowlands Project), 7%, 12/01/2050 | 100,000 | 88,977 | ||
| $5,910,887 | ||||
| Tax Assessment – 0.0% | ||||
| Brunswick, MD, Special Obligation Refunding (Brunswick Crossing Special Taxing District), 4%, 7/01/2029 | $ | 15,000 | $14,316 | |
| Brunswick, MD, Special Obligation Refunding (Brunswick Crossing Special Taxing District), 5%, 7/01/2036 | 13,000 | 12,700 | ||
| $27,016 | ||||
17
Portfolio of Investments (unaudited) –
continued
| Issuer | Shares/Par | Value ($) | ||
| Municipal Bonds – continued | ||||
| Tobacco – 2.7% | ||||
| Arkansas Development Finance Authority, Tobacco Settlement Rev. (Cancer Research Center Project), Capital Appreciation, AAC, 0%, 7/01/2027 | $ | 2,470,000 | $2,103,864 | |
| Arkansas Development Finance Authority, Tobacco Settlement Rev. (Cancer Research Center Project), Capital Appreciation, AAC, 0%, 7/01/2028 | 500,000 | 407,887 | ||
| Buckeye, OH, Tobacco Settlement Financing Authority Senior Asset-Backed Refunding, 2020A-2, “1”, 4%, 6/01/2048 | 185,000 | 156,266 | ||
| Buckeye, OH, Tobacco Settlement Financing Authority Senior Asset-Backed Refunding, 2020B-2, “2”, 5%, 6/01/2055 | 750,000 | 646,057 | ||
| Golden State, CA, Tobacco Securitization Corp., Tobacco Settlement Rev., Taxable, “B-1”, 3.85%, 6/01/2050 | 495,000 | 448,992 | ||
| $3,763,066 | ||||
| Toll Roads – 1.2% | ||||
| Metropolitan Washington, D.C., Airport Authority, Dulles Toll Road Rev. (Dulles Metrorail and Capital Improvement Projects), “A”, AGM, 4%, 10/01/2052 | $ | 1,000,000 | $860,931 | |
| Texas Private Activity Surface Transportation Corp., Senior Lien Rev. (NTE Mobility Partners Segments 3 LLC Segments 3A & 3B Facility), 7%, 12/31/2038 | 230,000 | 230,437 | ||
| Texas Private Activity Surface Transportation Corp., Senior Lien Rev. (NTE Mobility Partners Segments 3 LLC Segments 3A & 3B Facility), 6.75%, 6/30/2043 | 180,000 | 180,288 | ||
| Virginia Small Business Financing Authority Senior Lien Rev. (Elizabeth River Crossings Opco LLC Project), 3%, 1/01/2041 | 500,000 | 359,958 | ||
| $1,631,614 | ||||
| Transportation - Special Tax – 1.9% | ||||
| New Jersey Economic Development Authority Rev. (NJ Transit Transportation Project), 4%, 11/01/2044 | $ | 1,015,000 | $903,830 | |
| New Jersey Transportation Trust Fund Authority, “A”, 5%, 12/15/2039 | 125,000 | 128,231 | ||
| New Jersey Transportation Trust Fund Authority, Transportation Program, “BB”, 4%, 6/15/2044 | 1,775,000 | 1,563,660 | ||
| $2,595,721 | ||||
| Universities - Colleges – 15.0% | ||||
| Arkansas State University, Housing System Rev. (Jonesboro Campus), 4.5%, 3/01/2031 | $ | 2,500,000 | $2,500,853 | |
| Arkansas State University, Student Fee Rev. (Jonesboro Campus), “C”, AGM, 4.5%, 3/01/2027 | 545,000 | 545,159 | ||
| Arkansas Technology University Student Fee Rev., “A”, BAM, 5%, 12/01/2042 | 500,000 | 500,320 | ||
| Arkansas Technology University Student Fee Rev., “A”, BAM, 4.5%, 12/01/2047 | 500,000 | 457,736 | ||
| Arkansas Technology University Student Fee Rev., “A”, BAM, 4.5%, 12/01/2052 | 1,000,000 | 903,973 | ||
| Board of Trustees of the University of Arkansas, Various Facilities Rev. (Fayetteville Campus), “A”, 5%, 11/01/2047 | 2,000,000 | 2,041,846 | ||
| Board of Trustees of the University of Arkansas, Various Facilities Rev. (UAMS Campus), “A”, 5%, 12/01/2045 | 1,705,000 | 1,740,561 | ||
| Board of Trustees of the University of Arkansas, Various Facilities Rev. (UAMS Northwest Arkansas), “A”, 5%, 4/01/2040 | 500,000 | 519,593 | ||
| Board of Trustees of the University of Arkansas, Various Facilities Rev. (UAMS Northwest Arkansas), “A”, 5%, 4/01/2047 | 2,000,000 | 2,034,569 | ||
| Board of Trustees of the University of Arkansas, Various Facilities Rev. (UAMS Northwest Arkansas), “A”, 5%, 4/01/2052 | 500,000 | 506,518 | ||
| Board of Trustees of the University of Arkansas, Various Facilities Rev. (UAPB Campus), 5%, 12/01/2047 | 1,000,000 | 1,018,567 | ||
| Board of Trustees of the University of Arkansas, Various Facilities Rev. (UAPB Campus), 4%, 12/01/2052 | 1,000,000 | 838,946 | ||
| Connecticut Health & Educational Facilities Authority Rev. (Connecticut College Issue), “M”, 3%, 7/01/2047 | 1,120,000 | 740,348 | ||
| Massachusetts Development Finance Agency Rev. (Suffolk University), 4%, 7/01/2051 | 620,000 | 469,337 | ||
| Puerto Rico Industrial, Tourist, Educational, Medical & Environmental Control Facilities Financing Authority, Higher Education Rev. (University of Sacred Heart), 4.375%, 10/01/2031 | 60,000 | 60,045 | ||
| Puerto Rico Industrial, Tourist, Educational, Medical & Environmental Control Facilities Financing Authority, Higher Education Rev. (University of Sacred Heart), 5%, 10/01/2042 | 65,000 | 65,126 | ||
| Pulaski, AR, Student Tuition & Fee Rev. (Technical College), BAM, 5%, 9/01/2030 | 1,000,000 | 1,012,580 | ||
| Red River, TX, Education Finance Corp., Higher Education Rev. (Houston Baptist University Project), 5.5%, 10/01/2046 | 340,000 | 334,394 | ||
| University of Arkansas Facilities Rev. (Fayetteville Campus), “A”, 5%, 11/01/2043 | 1,500,000 | 1,527,242 | ||
| University of Arkansas Facilities Rev. (UAMS Campus), 5%, 11/01/2025 | 2,000,000 | 2,001,255 | ||
| University of Central Arkansas Student Fee Rev., “A”, AGM, 5%, 11/01/2038 | 500,000 | 509,568 | ||
| University of Central Arkansas Student Fee Rev., “A”, AGM, 4%, 11/01/2048 | 550,000 | 456,434 | ||
| $20,784,970 | ||||
| Utilities - Electric Power – 0.3% | ||||
| Texas Municipal Power Agency, Transmission System Rev., AGM, 2%, 9/01/2033 | $ | 625,000 | $461,133 | |
| Utilities - Municipal Owned – 3.0% | ||||
| Benton, AR, Public Utility Rev., AGM, 5%, 9/01/2030 | $ | 1,000,000 | $1,021,050 | |
| Benton, AR, Public Utility Rev., AGM, 5%, 9/01/2035 | 1,000,000 | 1,016,435 | ||
| Conway, AR, Electric Improvement Rev., “A”, 4%, 12/01/2043 | 1,915,000 | 1,691,347 | ||
18
Portfolio of Investments (unaudited) –
continued
| Issuer | Shares/Par | Value ($) | ||
| Municipal Bonds – continued | ||||
| Utilities - Municipal Owned – continued | ||||
| Puerto Rico Electric Power Authority Refunding Rev., “DDD”, 5%, 7/01/2020 (a)(d) | $ | 15,000 | $3,750 | |
| Puerto Rico Electric Power Authority Refunding Rev., “DDD”, 5%, 7/01/2021 (a)(d) | 155,000 | 38,750 | ||
| Puerto Rico Electric Power Authority Refunding Rev., “DDD”, 5%, 7/01/2022 (a)(d) | 260,000 | 65,000 | ||
| Puerto Rico Electric Power Authority Refunding Rev., “VV”, NPFG, 5.25%, 7/01/2034 | 15,000 | 14,793 | ||
| Puerto Rico Electric Power Authority Rev., “A”, 5%, 7/01/2029 (a)(d) | 410,000 | 102,500 | ||
| Puerto Rico Electric Power Authority Rev., “A”, 5%, 7/01/2042 (a)(d) | 65,000 | 16,250 | ||
| Puerto Rico Electric Power Authority Rev., “AAA”, 5.25%, 7/01/2021 (a)(d) | 30,000 | 7,500 | ||
| Puerto Rico Electric Power Authority Rev., “AAA”, 5.25%, 7/01/2030 (a)(d) | 15,000 | 3,750 | ||
| Puerto Rico Electric Power Authority Rev., “CCC”, 5.25%, 7/01/2027 (a)(d) | 145,000 | 36,250 | ||
| Puerto Rico Electric Power Authority Rev., “TT”, 5%, 7/01/2021 (a)(d) | 60,000 | 15,000 | ||
| Puerto Rico Electric Power Authority Rev., “TT”, 5%, 7/01/2023 (a)(d) | 70,000 | 17,500 | ||
| Puerto Rico Electric Power Authority Rev., “TT”, 5%, 7/01/2027 (a)(d) | 10,000 | 2,500 | ||
| Puerto Rico Electric Power Authority Rev., “TT”, 5%, 7/01/2037 (a)(d) | 210,000 | 52,500 | ||
| Puerto Rico Electric Power Authority Rev., “WW”, 5.375%, 7/01/2022 (a)(d) | 10,000 | 2,500 | ||
| Puerto Rico Electric Power Authority Rev., “WW”, 5.25%, 7/01/2025 (a)(d) | 25,000 | 6,250 | ||
| Puerto Rico Electric Power Authority Rev., “ZZ”, 5%, 7/01/2018 (a)(d) | 95,000 | 23,750 | ||
| Puerto Rico Electric Power Authority Rev., “ZZ”, 5.25%, 7/01/2023 (a)(d) | 110,000 | 27,500 | ||
| Puerto Rico Electric Power Authority Rev., “ZZ”, 5.25%, 7/01/2024 (a)(d) | 35,000 | 8,750 | ||
| Puerto Rico Electric Power Authority Rev., “ZZ”, 5.25%, 7/01/2026 (a)(d) | 95,000 | 23,750 | ||
| Puerto Rico Electric Power Authority Rev., Taxable, “EEE”, 6.05%, 7/01/2032 (a)(d) | 80,000 | 20,000 | ||
| $4,217,375 | ||||
| Utilities - Other – 3.3% | ||||
| Alabama Southeast Energy, Cooperative District Energy Supply Rev., “A-1”, 5.5%, 11/01/2053 (Put Date 1/01/2031) | $ | 1,005,000 | $1,032,898 | |
| California Community Choice Financing Authority, Clean Energy Project Rev., “C”, 5.25%, 1/01/2054 (Put Date 10/01/2031) | 815,000 | 813,078 | ||
| Osceola, AR, Utility & Improvement Refunding Rev., “A”, BAM, 4.25%, 7/31/2053 | 1,500,000 | 1,310,970 | ||
| Southeast Alabama Energy Authority Commodity Supply Rev. (Project No. 5), “A”, 5.25%, 1/01/2054 (Put Date 7/01/2029) | 755,000 | 759,900 | ||
| Tennessee Energy Acquisition Corp., Gas Project Rev., “A-1”, 5%, 5/01/2053 (Put Date 5/01/2028) | 725,000 | 723,315 | ||
| $4,640,161 | ||||
| Water & Sewer Utility Revenue – 13.7% | ||||
| Benton County, AR, Washington Regional Public Water Authority Rev., BAM, 4%, 10/01/2052 | $ | 500,000 | $428,210 | |
| Conway, AR, Wastewater Improvement Rev., “A”, 4%, 10/01/2039 | 525,000 | 459,422 | ||
| Fort Smith, AR, Water and Sewer and Construction Rev., 5%, 10/01/2035 | 3,850,000 | 3,987,515 | ||
| Fort Smith, AR, Water and Sewer Refunding Rev., BAM, 5%, 10/01/2028 | 1,370,000 | 1,410,486 | ||
| Fort Smith, AR, Water and Sewer Rev., BAM, 5%, 10/01/2029 | 1,000,000 | 1,028,698 | ||
| Guam Waterworks Authority Rev. (Water and Wastewater System), 5%, 7/01/2036 | 85,000 | 85,005 | ||
| Guam Waterworks Authority Rev. (Water and Wastewater System), 5%, 1/01/2046 | 500,000 | 471,237 | ||
| Guam Waterworks Authority Rev. (Water and Wastewater System), “A”, 5%, 7/01/2029 | 245,000 | 245,422 | ||
| Guam Waterworks Authority Rev. (Water and Wastewater System), “A”, 5%, 7/01/2035 | 245,000 | 245,148 | ||
| Guam Waterworks Authority Rev. (Water and Wastewater System), “A”, 5%, 1/01/2050 | 200,000 | 185,349 | ||
| Hot Springs, AR, Construction Wastewater Rev., “B”, BAM, 2.75%, 12/01/2047 | 1,000,000 | 653,593 | ||
| Hot Springs, AR, Construction Wastewater Rev., “B”, BAM, 2.75%, 12/01/2050 | 1,000,000 | 632,999 | ||
| Hot Springs, AR, Wastewater Rev., “C”, BAM, 4.5%, 12/01/2052 | 2,000,000 | 1,876,838 | ||
| Hot Springs, AR, Waterworks & Construction Refunding Rev., BAM, 4.25%, 10/01/2047 | 1,500,000 | 1,359,174 | ||
| Hot Springs, AR, Waterworks Rev., BAM, 4%, 10/01/2035 | 1,125,000 | 1,107,122 | ||
| Hot Springs, AR, Waterworks Rev., BAM, 4%, 10/01/2039 | 1,000,000 | 922,963 | ||
| Hot Springs, AR, Waterworks Rev., BAM, 4%, 10/01/2041 | 500,000 | 452,147 | ||
| Hot Springs, AR, Waterworks Rev., BAM, 3.75%, 10/01/2043 | 1,750,000 | 1,487,261 | ||
| Malvern, AR, Water and Sewer Refunding and Construction Rev., BAM, 3.7%, 8/01/2043 | 750,000 | 614,230 | ||
| Michigan Finance Authority Local Government Loan Program Rev. (Detroit Water and Sewerage Department Sewage Disposal System Rev. Refunding Second Lien Local Project), “C-7”, NPFG, 5%, 7/01/2032 | 50,000 | 50,285 | ||
| Michigan Finance Authority Local Government Loan Program Rev. (Detroit Water and Sewerage Department Water Supply System Rev. Refunding Second Lien Local Project), “D-6”, NPFG, 5%, 7/01/2036 | 65,000 | 65,143 | ||
| Michigan Finance Authority Local Government Loan Program Rev. (Detroit Water and Sewerage Department Water Supply System Rev. Refunding Senior Lien Local Project), “D-1”, AGM, 5%, 7/01/2035 | 30,000 | 30,143 | ||
| Michigan Finance Authority Local Government Loan Program Rev. (Detroit Water and Sewerage Department Water Supply System Rev. Refunding Senior Lien Local Project), “D-1”, AGM, 5%, 7/01/2037 | 75,000 | 75,203 | ||
| Texarkana, AR, Public Facilities Board, Waterworks & Sewer Facilities Rev., AGM, 4%, 8/31/2040 | 550,000 | 505,788 | ||
19
Portfolio of Investments (unaudited) –
continued
| Issuer | Shares/Par | Value ($) | ||
| Municipal Bonds – continued | ||||
| Water & Sewer Utility Revenue – continued | ||||
| Texarkana, AR, Public Facilities Board, Waterworks & Sewer Facilities Rev., AGM, 4%, 8/31/2043 | $ | 685,000 | $624,392 | |
| $19,003,773 | ||||
| Total Municipal Bonds (Identified Cost, $150,890,857) | $136,132,962 | |||
| Bonds – 0.3% | ||||
| Consumer Services – 0.3% | ||||
| Toll Road Investors Partnership II LP, Capital Appreciation, NPFG, 0%, 2/15/2025 (n) | $ | 245,000 | $220,608 | |
| Toll Road Investors Partnership II LP, Capital Appreciation, NPFG, 0%, 2/15/2043 (n) | 472,747 | 155,409 | ||
| Total Bonds (Identified Cost, $410,593) | $376,017 | |||
| Contingent Value Instruments – 0.1% | ||||
| General Obligations - General Purpose – 0.1% | ||||
| Commonwealth of Puerto Rico, General Obligation Contingent Value Instrument, 11/01/2043 (Identified Cost, $168,530) | $ | 284,049 | $147,350 | |
| Investment Companies (h) – 0.6% | ||||
| Money Market Funds – 0.6% | ||||
| MFS Institutional Money Market Portfolio, 5.4% (v) (Identified Cost, $905,852) | 905,826 | $906,007 | ||
| Other Assets, Less Liabilities – 0.8% | 1,102,339 | |||
| Net Assets – 100.0% | $138,664,675 | |||
See Portfolio Footnotes and Notes to
Financial Statements
20
Portfolio of Investments (unaudited) –
continued
MFS California Municipal Bond
Fund
| Issuer | Shares/Par | Value ($) | ||
| Municipal Bonds – 97.1% | ||||
| Airport Revenue – 8.2% | ||||
| California Municipal Finance Authority Rev. (LINXS APM Project), “A”, 5%, 12/31/2047 | $ | 2,190,000 | $2,132,322 | |
| Fresno, CA, Airport Revenue, “A”, BAM, 4.25%, 7/01/2044 | 1,000,000 | 909,107 | ||
| Fresno, CA, Airport Revenue, “A”, BAM, 5%, 7/01/2053 | 1,000,000 | 989,760 | ||
| Long Beach, CA, Senior Airport Rev., “C”, AGM, 5%, 6/01/2042 | 1,000,000 | 998,306 | ||
| Long Beach, CA, Senior Airport Rev., “C”, AGM, 5.25%, 6/01/2047 | 1,500,000 | 1,526,879 | ||
| Los Angeles, CA, Department of Airports Refunding Rev. (Los Angeles International), “A”, 5.25%, 5/15/2042 | 2,000,000 | 2,061,799 | ||
| Los Angeles, CA, Department of Airports Refunding Rev. (Los Angeles International), “A”, 4.125%, 5/15/2043 | 500,000 | 447,512 | ||
| Los Angeles, CA, Department of Airports Rev. (Los Angeles International), “H”, 4%, 5/15/2047 | 3,000,000 | 2,601,165 | ||
| Los Angeles, CA, Department of Airports Rev. (Los Angeles International), “A”, 4%, 5/15/2049 | 5,000,000 | 4,251,048 | ||
| Los Angeles, CA, Department of Airports Rev. (Los Angeles International), “C”, 5%, 5/15/2038 | 1,935,000 | 1,949,742 | ||
| Los Angeles, CA, Department of Airports Rev. (Los Angeles International), “D”, 5%, 5/15/2037 | 1,305,000 | 1,328,235 | ||
| Los Angeles, CA, Department of Airports Rev. (Los Angeles International), “D”, 5%, 5/15/2038 | 1,305,000 | 1,320,053 | ||
| Sacramento County, CA, Airport System Rev., “B”, 5%, 7/01/2038 | 2,000,000 | 2,014,751 | ||
| Sacramento County, CA, Airport System Rev., “C”, 5%, 7/01/2039 | 1,000,000 | 1,004,149 | ||
| Sacramento County, CA, Special Facilities Airport Rev. (Cessna Aircraft Co. Project), VRDN, 3.95%, 10/31/2028 | 5,275,000 | 5,275,000 | ||
| San Diego County, CA, Regional Airport Authority Rev., “B”, 5%, 7/01/2042 | 665,000 | 659,873 | ||
| San Diego County, CA, Regional Airport Authority Rev., “B”, 5%, 7/01/2047 | 665,000 | 652,117 | ||
| San Francisco, CA, City & County Airport Commission, International Airport Rev., “A”, 4%, 4/30/2052 | 2,500,000 | 2,057,033 | ||
| San Francisco, CA, City & County Airports Commission, International Airport Rev., “A”, 5%, 5/01/2044 | 2,605,000 | 2,597,022 | ||
| San Francisco, CA, City & County Airports Commission, International Airport Rev., “B”, 5%, 5/01/2046 | 3,000,000 | 2,988,336 | ||
| San Jose, CA, Airport Rev., “A”, 5%, 3/01/2035 | 1,000,000 | 1,017,043 | ||
| San Jose, CA, Airport Rev., “A”, 5%, 3/01/2047 | 2,000,000 | 1,961,603 | ||
| $40,742,855 | ||||
| General Obligations - General Purpose – 3.2% | ||||
| Bridgeview, IL, Stadium and Redevelopment Projects, Taxable, AAC, 5.14%, 12/01/2036 | $ | 1,080,000 | $932,337 | |
| Chicago, IL, General Obligation, “A”, 5%, 1/01/2025 | 810,000 | 816,300 | ||
| Commonwealth of Puerto Rico, General Obligation Restructured Bonds, Capital Appreciation, Series 2022A, 0%, 7/01/2024 | 35,723 | 34,509 | ||
| Commonwealth of Puerto Rico, General Obligation Restructured Bonds, Capital Appreciation, Series 2022A, 0%, 7/01/2033 | 282,606 | 166,558 | ||
| Commonwealth of Puerto Rico, General Obligation Restructured Bonds, Series 2022A, 5.625%, 7/01/2027 | 242,360 | 248,701 | ||
| Commonwealth of Puerto Rico, General Obligation Restructured Bonds, Series 2022A, 5.625%, 7/01/2029 | 238,428 | 246,370 | ||
| Commonwealth of Puerto Rico, General Obligation Restructured Bonds, Series 2022A, 5.75%, 7/01/2031 | 497,583 | 519,636 | ||
| Commonwealth of Puerto Rico, General Obligation Restructured Bonds, Series 2022A, 4%, 7/01/2033 | 219,601 | 196,836 | ||
| Commonwealth of Puerto Rico, General Obligation Restructured Bonds, Series 2022A, 4%, 7/01/2035 | 383,721 | 333,473 | ||
| Commonwealth of Puerto Rico, General Obligation Restructured Bonds, Series 2022A, 4%, 7/01/2037 | 169,415 | 142,213 | ||
| Commonwealth of Puerto Rico, General Obligation Restructured Bonds, Series 2022A, 4%, 7/01/2041 | 230,339 | 185,196 | ||
| Commonwealth of Puerto Rico, General Obligation Restructured Bonds, Series 2022A, 4%, 7/01/2046 | 765,550 | 590,224 | ||
| San Francisco, CA, City & County General Obligation Refunding Bonds, 2020-R1, 5%, 6/14/2024 | 2,500,000 | 2,525,331 | ||
| San Francisco, CA, City & County General Obligation Refunding Bonds, 2021-R2, 5%, 6/14/2024 | 2,440,000 | 2,464,723 | ||
| State of California, Various Purpose General Obligation, 4%, 3/01/2036 | 2,200,000 | 2,185,477 | ||
| State of California, Various Purpose General Obligation, 5.25%, 10/01/2050 | 3,000,000 | 3,190,947 | ||
| State of Illinois, General Obligation, 5.5%, 5/01/2039 | 440,000 | 459,044 | ||
| State of Illinois, General Obligation, 5.75%, 5/01/2045 | 410,000 | 427,434 | ||
| $15,665,309 | ||||
| General Obligations - Schools – 14.5% | ||||
| Alvord, CA, Unified School District (Election of 2007), General Obligation, “A”, BAM, 4%, 8/01/2048 | $ | 2,000,000 | $1,790,111 | |
| Beverly Hills, CA, Unified School District (Election of 2008), Capital Appreciation, 0%, 8/01/2029 | 4,335,000 | 3,466,567 | ||
| Garden Grove, CA, Unified School District (Election 2016), General Obligation, BAM, 4%, 8/01/2046 | 3,000,000 | 2,732,664 | ||
| Garvey, CA, School District (Election of 2004), Capital Appreciation, AGM, 0%, 8/01/2031 | 2,120,000 | 1,505,751 | ||
| Imperial County, CA, Community College District Rev., BAM, 4%, 8/01/2040 | 465,000 | 429,843 | ||
| Imperial County, CA, Community College District Rev., Capital Appreciation, “C”, BAM, 0%, 8/01/2034 | 500,000 | 307,071 | ||
| Kern County, CA, Sierra Sands Unified School District (Election of 2006), Capital Appreciation, AGM, 0%, 11/01/2033 | 1,260,000 | 774,583 | ||
| Lake Tahoe, CA, Unified School District (Election of 2008), Convertible Capital Appreciation, AGM, 0% to 8/01/2032, 6.375% to 8/01/2045 | 1,590,000 | 1,131,452 | ||
| Los Angeles County, CA, Mt. San Antonio Community College District (Election of 2018), “A”, 4%, 8/01/2049 | 875,000 | 796,825 | ||
| Los Angeles, CA, Paramount Unified School District, General Obligation, “C”, BAM, 3%, 8/01/2045 | 1,750,000 | 1,256,540 | ||
| Marin County, CA, Community College District (Election of 2016), “B”, 4%, 8/01/2039 (Prerefunded 2/15/2027) | 2,000,000 | 2,043,400 | ||
21
Portfolio of Investments (unaudited) –
continued
| Issuer | Shares/Par | Value ($) | ||
| Municipal Bonds – continued | ||||
| General Obligations - Schools – continued | ||||
| Marin County, CA, Community College District (Election of 2016), “B”, 4%, 8/01/2040 (Prerefunded 2/15/2027) | $ | 1,000,000 | $1,021,700 | |
| Marin County, CA, San Rafael City Elementary School District Rev., “B”, 4%, 8/01/2047 | 2,595,000 | 2,377,680 | ||
| Mendocino Lake, CA, Community College District Rev. (Election of 2006), Capital Appreciation, “B”, AGM, 0%, 8/01/2032 | 1,570,000 | 1,082,106 | ||
| Modesto, CA, Elementary School District, General Obligation, “B”, 3%, 8/01/2046 | 170,000 | 120,649 | ||
| Modesto, CA, Elementary School District, General Obligation, “B”, 3%, 8/01/2050 | 105,000 | 71,770 | ||
| Moorpark, CA, Unified School District (Election of 2008), Capital Appreciation, “A”, AGM, 0%, 8/01/2033 | 500,000 | 323,378 | ||
| Moreland, CA, School District (Election of 2002), Capital Appreciation, “B”, FGIC, 0%, 8/01/2028 | 1,440,000 | 1,190,944 | ||
| Mount Diablo, CA, Unified School District (Election of 2010), Convertible Capital Appreciation, “A”, AGM, 5.5% to 8/01/2019, 6% to 8/01/2030 | 3,000,000 | 3,102,311 | ||
| Mount San Antonio, CA, Community College District Rev. (Election of 2008), Convertible Capital Appreciation, “A”, 0% to 8/01/2028, 6.25% to 8/01/2043 | 5,000,000 | 4,462,374 | ||
| Napa Valley, CA, Unified School District (Election of 2006), Capital Appreciation, “A”, 0%, 8/01/2029 | 3,385,000 | 2,659,366 | ||
| Oakland, CA, Unified School District Rev., AGM, 5%, 8/01/2028 | 830,000 | 848,756 | ||
| Oakland, CA, Unified School District Rev., AGM, 5%, 8/01/2030 | 830,000 | 848,515 | ||
| Oxnard, CA, School District (Ventura County), “A”, BAM, 5%, 8/01/2045 | 2,590,000 | 2,655,856 | ||
| Oxnard, CA, Union High School District, General Obligation, “C”, 4%, 8/01/2038 | 400,000 | 389,556 | ||
| Oxnard, CA, Union High School District, General Obligation, “C”, 4%, 8/01/2039 | 1,045,000 | 1,010,202 | ||
| Oxnard, CA, Union High School District, General Obligation, “C”, 4%, 8/01/2040 | 1,000,000 | 959,394 | ||
| Placer & Nevada Counties, CA, Tahoe-Truckee Unified School District (Election of 2014) (School Facilities Improvement District No. 1), “B”, 5%, 8/01/2033 | 500,000 | 521,878 | ||
| Placer & Nevada Counties, CA, Tahoe-Truckee Unified School District (Election of 2014) (School Facilities Improvement District No. 1), “B”, 5%, 8/01/2034 | 1,400,000 | 1,461,383 | ||
| Placer & Nevada Counties, CA, Tahoe-Truckee Unified School District (Election of 2014) (School Facilities Improvement District No. 1), “B”, 5%, 8/01/2035 | 1,105,000 | 1,150,604 | ||
| Pomona, CA, Unified School District, General Obligation, “F”, BAM, 3%, 8/01/2048 | 90,000 | 62,089 | ||
| San Diego, CA, Community College District (Election of 2002), 6%, 8/01/2033 (Prerefunded 8/01/2027) | 2,000,000 | 2,190,262 | ||
| San Diego, CA, La Mesa-Spring Valley School District, General Obligation, “B”, 4%, 7/31/2051 | 2,000,000 | 1,776,422 | ||
| San Diego, CA, San Ysidro School District (Measure U Election of 2020), General Obligation, “B”, AGM, 4%, 8/01/2045 | 2,190,000 | 1,970,805 | ||
| San Diego, CA, San Ysidro School District (Measure U Election of 2020), General Obligation, “B”, AGM, 4%, 8/01/2045 | 1,850,000 | 1,664,835 | ||
| San Diego, CA, Unified School District (Election of 2008), Capital Appreciation, “G”, 0%, 7/01/2034 (Prerefunded 1/01/2024) | 1,235,000 | 699,227 | ||
| San Diego, CA, Unified School District (Election of 2012), General Obligation, “I”, BAM, 4%, 7/01/2047 | 2,145,000 | 2,013,194 | ||
| San Luis Obispo, CA, Lucia Mar Unified School District, General Obligation, “D”, 4%, 8/01/2049 | 2,235,000 | 2,028,253 | ||
| Santa Clara County, CA, Mountain View Whisman School District General Obligation, Election of 2020, “B”, 4.25%, 9/01/2045 | 5,750,000 | 5,547,803 | ||
| Santa Maria Bonita, CA, School District (Election of 2014), General Obligation, BAM, 4%, 8/01/2042 | 1,000,000 | 926,974 | ||
| Santa Maria Bonita, CA, School District (Election of 2014), General Obligation, BAM, 4%, 8/01/2044 | 1,250,000 | 1,147,890 | ||
| South Monterey County, CA, Joint Union High School District (Election of 2018), “A-1”, AGM, 4%, 8/01/2049 | 2,480,000 | 2,212,151 | ||
| Stanislaus County, CA, CERES Unified School District, Capital Appreciation, BAM, 0%, 8/01/2046 | 2,775,000 | 828,641 | ||
| Stanislaus County, CA, CERES Unified School District, Capital Appreciation, BAM, 0%, 8/01/2047 | 3,035,000 | 853,421 | ||
| Sweetwater, CA, Union High School District, “C”, 4%, 8/01/2043 | 2,000,000 | 1,837,706 | ||
| West Contra Costa, CA, Unified School District (Election of 2020), General Obligation, “A-1”, AGM, 3%, 8/01/2046 | 3,365,000 | 2,388,785 | ||
| Yolo County, CA, Davis Joint Unified School District, General Obligation, BAM, 3%, 8/01/2043 | 1,250,000 | 920,215 | ||
| $71,561,902 | ||||
| Healthcare Revenue - Hospitals – 13.3% | ||||
| California Health Facilities Financing Authority Rev. (Cedars-Sinai Health System), “A”, 5%, 8/15/2051 | $ | 5,000,000 | $5,106,094 | |
| California Health Facilities Financing Authority Rev. (Children's Hospital Los Angeles), “A”, 5%, 8/15/2042 | 2,550,000 | 2,484,954 | ||
| California Health Facilities Financing Authority Rev. (El Camino Hospital), 5%, 2/01/2037 | 1,000,000 | 1,018,883 | ||
| California Health Facilities Financing Authority Rev. (Marshall Medical Center), 5%, 11/01/2033 | 750,000 | 763,720 | ||
| California Health Facilities Financing Authority Rev. (Sutter Health), “A”, 5%, 11/15/2038 | 1,000,000 | 1,039,915 | ||
| California Municipal Finance Authority Rev. (Community Health Centers of the Central Coast, Inc.), “A”, 5%, 12/01/2036 (n) | 175,000 | 166,302 | ||
| California Municipal Finance Authority Rev. (Community Health Centers of the Central Coast, Inc.), “A”, 5%, 12/01/2046 (n) | 750,000 | 670,617 | ||
| California Municipal Finance Authority Rev. (Community Medical Centers), “A”, 5%, 2/01/2036 | 1,275,000 | 1,279,185 | ||
| California Municipal Finance Authority Rev. (Community Medical Centers), “A”, 5%, 2/01/2037 | 850,000 | 846,769 | ||
| California Municipal Finance Authority Rev. (Community Medical Centers), “A”, 5%, 2/01/2042 | 425,000 | 424,133 | ||
| California Municipal Finance Authority Rev. (Eisenhower Medical Center), “A”, 5%, 7/01/2042 | 2,000,000 | 1,912,266 | ||
| California Municipal Finance Authority Rev. (Eisenhower Medical Center), “A”, 5%, 7/01/2047 | 1,000,000 | 930,115 | ||
| California Municipal Finance Authority Rev. (Eisenhower Medical Center), “B”, 4%, 7/01/2047 | 1,685,000 | 1,325,418 | ||
| California Municipal Finance Authority Rev. (NorthBay Healthcare Group), 5%, 11/01/2028 | 205,000 | 205,727 | ||
| California Municipal Finance Authority Rev. (NorthBay Healthcare Group), 5%, 11/01/2029 | 165,000 | 165,346 | ||
22
Portfolio of Investments (unaudited) –
continued
| Issuer | Shares/Par | Value ($) | ||
| Municipal Bonds – continued | ||||
| Healthcare Revenue - Hospitals – continued | ||||
| California Municipal Finance Authority Rev. (NorthBay Healthcare Group), 5%, 11/01/2030 | $ | 85,000 | $85,114 | |
| California Municipal Finance Authority Rev. (NorthBay Healthcare Group), 5%, 11/01/2035 | 315,000 | 310,462 | ||
| California Municipal Finance Authority Rev. (NorthBay Healthcare Group), 5%, 11/01/2044 | 415,000 | 352,350 | ||
| California Municipal Finance Authority Rev. (NorthBay Healthcare Group), “A”, 5.25%, 11/01/2047 | 1,500,000 | 1,285,987 | ||
| California Municipal Finance Authority, COP (Palomar Health), “A”, AGM, 5.25%, 11/01/2052 | 4,000,000 | 4,126,020 | ||
| California Public Finance Authority Rev. (Henry Mayo Newhall Hospital), 5%, 10/15/2047 | 2,545,000 | 2,388,756 | ||
| California Public Finance Authority Rev. (Hoag Memorial Hospital Presbyterian), “A”, 4%, 7/15/2051 | 2,000,000 | 1,730,275 | ||
| California Statewide Communities Development Authority Rev. (Adventist Health System/West), “A”, 5%, 3/01/2042 | 4,000,000 | 3,974,846 | ||
| California Statewide Communities Development Authority Rev. (Emante Health), “A”, 4%, 4/01/2039 | 1,600,000 | 1,397,530 | ||
| California Statewide Communities Development Authority Rev. (Emante Health), “A”, 4%, 4/01/2040 | 650,000 | 559,718 | ||
| California Statewide Communities Development Authority Rev. (Emante Health), “A”, 4%, 4/01/2045 | 2,000,000 | 1,721,728 | ||
| California Statewide Communities Development Authority Rev. (Enloe Medical Center), “A”, AGM, 5.375%, 8/15/2057 | 5,000,000 | 5,232,350 | ||
| California Statewide Communities Development Authority Rev. (John Muir Health), “A”, 5%, 12/01/2053 | 1,000,000 | 1,000,063 | ||
| California Statewide Communities Development Authority Rev. (John Muir Health), “A”, 5%, 12/01/2057 | 2,000,000 | 1,988,020 | ||
| California Statewide Communities Development Authority Rev. (Loma Linda University Medical Center), “A”, 5%, 12/01/2041 (n) | 1,405,000 | 1,303,145 | ||
| California Statewide Communities Development Authority Rev. (Loma Linda University Medical Center), “A”, 5%, 12/01/2046 (n) | 200,000 | 182,376 | ||
| California Statewide Communities Development Authority Rev. (Loma Linda University Medical Center), “A”, 5.5%, 12/01/2054 | 1,650,000 | 1,605,175 | ||
| California Statewide Communities Development Authority Rev. (Loma Linda University Medical Center), “A”, 5.25%, 12/01/2056 (n) | 1,955,000 | 1,790,204 | ||
| California Statewide Communities Development Authority Rev. (Marin General Hospital), “A”, 5%, 8/01/2036 | 635,000 | 639,219 | ||
| California Statewide Communities Development Authority Rev. (Marin General Hospital), “A”, 5%, 8/01/2037 | 455,000 | 454,786 | ||
| California Statewide Communities Development Authority Rev. (Marin General Hospital), “A”, 5%, 8/01/2038 | 430,000 | 423,669 | ||
| California Statewide Communities Development Authority Rev. (Redlands Community Hospital), 5%, 10/01/2046 | 1,925,000 | 1,882,028 | ||
| California Statewide Communities Development Authority, Hospital Rev. (Methodist Hospital of Southern California), 5%, 1/01/2038 | 1,500,000 | 1,474,034 | ||
| Doylestown, PA, Hospital Authority Rev., “A”, 5%, 6/30/2049 (Prerefunded 7/01/2029) | 5,000 | 5,368 | ||
| Doylestown, PA, Hospital Authority Rev., “A”, 5%, 7/01/2049 | 65,000 | 52,884 | ||
| Palomar Health, CA, Refunding Rev., AGM, 5%, 11/01/2047 | 2,000,000 | 2,014,458 | ||
| Tulare County, CA, Sierra View Local Health Care District Rev., 4%, 7/01/2024 | 235,000 | 233,716 | ||
| Tulare County, CA, Sierra View Local Health Care District Rev., 4%, 7/01/2025 | 290,000 | 286,289 | ||
| Tulare County, CA, Sierra View Local Health Care District Rev., 4%, 7/01/2026 | 300,000 | 295,214 | ||
| Tulare County, CA, Sierra View Local Health Care District Rev., 5%, 7/01/2028 | 665,000 | 686,528 | ||
| Tulare County, CA, Sierra View Local Health Care District Rev., 5%, 7/01/2029 | 635,000 | 656,994 | ||
| University of California Regents, Medical Center Pooled Rev., “P”, 4%, 5/15/2053 | 5,000,000 | 4,477,831 | ||
| Upland, CA (San Antonio Regional Hospital), COP, 4%, 1/01/2042 | 1,000,000 | 813,877 | ||
| Upland, CA (San Antonio Regional Hospital), COP, 5%, 1/01/2047 | 1,000,000 | 971,594 | ||
| Washington Township, CA, Health Care District Rev., “A”, 5%, 7/01/2031 | 325,000 | 331,900 | ||
| Washington Township, CA, Health Care District Rev., “A”, 5%, 7/01/2042 | 1,000,000 | 895,389 | ||
| $65,969,341 | ||||
| Healthcare Revenue - Long Term Care – 2.6% | ||||
| ABAG Finance Authority for Non-Profit Corps., CA, Rev. (Eskaton Properties, Inc.), 5%, 11/15/2035 | $ | 1,270,000 | $1,184,461 | |
| California Health Facilities Financing Authority Rev. (Northern California Presbyterian Homes and Services, Inc.), 5%, 7/01/2039 | 1,000,000 | 1,010,651 | ||
| California Health Facilities Financing Authority Rev. (ON LOK Senior Health Services), 5%, 8/01/2040 | 650,000 | 638,896 | ||
| California Health Facilities Financing Authority Rev. (ON LOK Senior Health Services), 5%, 8/01/2050 | 1,000,000 | 932,637 | ||
| California Health Facilities Financing Authority Rev. (ON LOK Senior Health Services), 5%, 8/01/2055 | 1,000,000 | 921,459 | ||
| California Public Finance Authority, Senior Living Refunding Rev. (Enso Village Project), “A”, 5%, 11/15/2036 (n) | 775,000 | 724,633 | ||
| California Public Finance Authority, Senior Living Refunding Rev. (Enso Village Project), “A”, 5%, 11/15/2046 (n) | 1,250,000 | 1,065,599 | ||
| California Statewide Communities Development Authority Rev. (899 Charleston Project), “A”, 5.25%, 11/01/2044 (n) | 1,405,000 | 1,091,155 | ||
| California Statewide Communities Development Authority Rev. (Front Porch Communities and Services), “A”, 4%, 4/01/2039 | 500,000 | 446,566 | ||
| California Statewide Communities Development Authority Rev. (Front Porch Communities and Services), “A”, 4%, 4/01/2040 | 500,000 | 441,583 | ||
| California Statewide Communities Development Authority Rev. (Front Porch Communities and Services), “A”, 4%, 4/01/2042 | 735,000 | 637,853 | ||
| California Statewide Communities Development Authority Rev. (Front Porch Communities and Services), “A”, 5%, 4/01/2047 | 1,835,000 | 1,794,887 | ||
| California Statewide Communities Development Authority, Insured Rev. (Viamonte Senior Living 1 Project), “A”, 4%, 7/01/2038 | 435,000 | 421,235 | ||
| California Statewide Communities Development Authority, Insured Rev. (Viamonte Senior Living 1 Project), “A”, 4%, 7/01/2039 | 430,000 | 409,494 | ||
| California Statewide Communities Development Authority, Insured Rev. (Viamonte Senior Living 1 Project), “A”, 4%, 7/01/2040 | 435,000 | 410,627 | ||
| California Statewide Communities Development Authority, Insured Rev. (Viamonte Senior Living 1 Project), “A”, 4%, 7/01/2043 | 980,000 | 900,598 | ||
| $13,032,334 | ||||
23
Portfolio of Investments (unaudited) –
continued
| Issuer | Shares/Par | Value ($) | ||
| Municipal Bonds – continued | ||||
| Industrial Revenue - Environmental Services – 2.9% | ||||
| California Municipal Finance Authority, Solid Waste Disposal Rev. (Republic Services, Inc. Project), “A”, 4.7%, 6/30/2041 | $ | 2,750,000 | $2,749,945 | |
| California Municipal Finance Authority, Solid Waste Disposal Rev. (Waste Management, Inc. Project), “A”, 4.125%, 10/01/2041 (Put Date 10/01/2025) | 3,000,000 | 2,978,195 | ||
| California Municipal Finance Authority, Solid Waste Disposal Rev. (Waste Management, Inc. Project), “A”, 2.4%, 10/01/2044 (Put Date 10/01/2029) | 3,000,000 | 2,620,178 | ||
| California Municipal Finance Authority, Solid Waste Disposal Rev. (Waste Management, Inc. Project), “A”, 0.7%, 12/01/2044 (Put Date 12/01/2023) | 3,000,000 | 2,977,609 | ||
| California Pollution Control Financing Authority, Solid Waste Refunding Rev. (Republic Services, Inc. Project), “B”, 3.75%, 7/31/2024 (Put Date 11/01/2023) (n) | 3,000,000 | 2,998,676 | ||
| $14,324,603 | ||||
| Industrial Revenue - Other – 0.1% | ||||
| Port Beaumont, TX, Navigation District, Dock & Wharf Facility Rev. (Jefferson Gulf Coast Energy Project), “A”, 3.625%, 1/01/2035 (n) | $ | 500,000 | $386,536 | |
| Miscellaneous Revenue - Other – 2.7% | ||||
| California Infrastructure & Economic Development Bank Rev. (Academy of Motion Picture Arts and Sciences Obligated Group), “A”, 5%, 11/01/2035 | $ | 830,000 | $831,498 | |
| California Infrastructure & Economic Development Bank Rev. (Brightline West Passenger Rail), “A”, 3.65%, 1/01/2050 (Put Date 1/31/2024) (n) | 4,300,000 | 4,273,732 | ||
| Long Beach, CA, Marina Rev. (Alamitos Bay Marina Project), 5%, 5/15/2031 | 1,335,000 | 1,341,336 | ||
| Matching Fund Special Purpose Securitization Corp., “A”, 5%, 10/01/2026 | 205,000 | 205,781 | ||
| San Francisco, CA, City & County Airports Commission, International Airport Rev., Special Facilities Lease Rev. (SFO Fuel Co. LLC), 5%, 1/01/2040 | 1,510,000 | 1,515,245 | ||
| San Luis Obispo, CA, Public Financing Authority, Lease Rev. (Cultural Arts District Parking Project), 5%, 11/30/2053 | 5,000,000 | 5,182,576 | ||
| $13,350,168 | ||||
| Multi-Family Housing Revenue – 6.9% | ||||
| California Community Housing Agency, Essential Housing Rev. (Aster), “A-1”, 4%, 2/01/2056 (n) | $ | 2,200,000 | $1,695,543 | |
| California Community Housing Agency, Essential Housing Rev. (Aster), “A-2”, 4%, 2/01/2043 (n) | 2,900,000 | 2,295,020 | ||
| California Community Housing Agency, Essential Housing Rev. (Fountains at Emerald Park), “A-1”, 3%, 8/01/2056 (n) | 3,000,000 | 1,846,821 | ||
| California Housing Finance Agency Municipal Certificates, “A”, 4%, 3/20/2033 | 2,818,116 | 2,681,044 | ||
| California Housing Finance Agency Municipal Certificates, “A”, 4.375%, 9/20/2036 | 1,995,698 | 1,820,190 | ||
| California Housing Finance Agency, Affordable Housing Rev., “A-1”, 4.125%, 7/31/2038 | 800,000 | 750,536 | ||
| California Municipal Finance Authority, Multi-Family Housing Rev. (CityView Apartments), “A”, 4%, 11/01/2036 (n) | 4,000,000 | 3,486,264 | ||
| California Municipal Finance Authority, Multi-Family Tax-Exempt Mortgage-Backed (Greenfield Commons I), “A”, 5.28%, 8/31/2046 | 3,300,000 | 3,133,396 | ||
| California Municipal Special Finance Agency VIII, Essential Housing Rev. (Elan Huntington Beach), “A-2”, 4%, 8/01/2047 (n) | 2,900,000 | 2,227,169 | ||
| California Municipal Special Finance Agency XII, Essential Housing Rev. (Allure Apartments), “A-1”, 3.25%, 2/01/2057 (n) | 2,000,000 | 1,285,153 | ||
| California Municipal Special Finance Agency, Essential Housing Rev. (Solana at Grand), “A-1”, 4%, 8/01/2056 (n) | 3,000,000 | 2,319,453 | ||
| California Statewide Communities Development Authority, Essential Housing Rev. (Oceanaire-Long Beach), “A-2”, 4%, 9/01/2056 (n) | 3,000,000 | 2,049,926 | ||
| California Statewide Communities Development Authority, Essential Housing Rev. (Orange Portfolio), “B”, 4%, 3/01/2057 (n) | 2,000,000 | 1,325,373 | ||
| Los Angeles County, CA, Development Authority, Multi-Family Housing Rev. (West Los Angeles VA - Building 156 & 157 Apartments), “C”, 3.75%, 12/01/2046 (Put Date 12/01/2026) | 2,750,000 | 2,669,989 | ||
| Los Angeles County, CA, Development Authority, Multi-Family Housing Rev. (West Los Angeles VA Campus Building 402 Apartments), 3.375%, 1/01/2046 (Put Date 7/01/2026) | 3,600,000 | 3,440,186 | ||
| New Hampshire National Finance Authority Municipal Certificates, “1-A”, 4.375%, 9/20/2036 | 1,339,662 | 1,240,507 | ||
| $34,266,570 | ||||
| Parking – 0.3% | ||||
| Stockton, CA, Public Financing Authority Parking Rev., 5%, 3/01/2047 | $ | 1,625,000 | $1,434,644 | |
| Sales & Excise Tax Revenue – 2.7% | ||||
| Guam Government Business Privilege Tax Refunding, “F”, 5%, 1/01/2030 | $ | 30,000 | $29,911 | |
| Guam Government Business Privilege Tax Refunding, “F”, 5%, 1/01/2031 | 40,000 | 39,739 | ||
| Guam Government Business Privilege Tax Refunding, “F”, 4%, 1/01/2042 | 390,000 | 315,622 | ||
| Puerto Rico Sales Tax Financing Corp., Restructured Sales Tax Rev., “2019A-1”, 4.55%, 7/01/2040 | 114,000 | 104,889 | ||
| Puerto Rico Sales Tax Financing Corp., Restructured Sales Tax Rev., “2019A-1”, 4.75%, 7/01/2053 | 382,000 | 337,712 | ||
| Puerto Rico Sales Tax Financing Corp., Restructured Sales Tax Rev., “2019A-1”, 5%, 7/01/2058 | 4,615,000 | 4,174,652 | ||
| Puerto Rico Sales Tax Financing Corp., Restructured Sales Tax Rev., “2019A-2”, 4.329%, 7/01/2040 | 944,000 | 845,506 | ||
| Puerto Rico Sales Tax Financing Corp., Restructured Sales Tax Rev., “2019A-2”, 4.329%, 7/01/2040 | 385,000 | 344,830 | ||
| Puerto Rico Sales Tax Financing Corp., Restructured Sales Tax Rev., “2019A-2”, 4.536%, 7/01/2053 | 9,000 | 7,677 | ||
24
Portfolio of Investments (unaudited) –
continued
| Issuer | Shares/Par | Value ($) | ||
| Municipal Bonds – continued | ||||
| Sales & Excise Tax Revenue – continued | ||||
| Puerto Rico Sales Tax Financing Corp., Restructured Sales Tax Rev., “2019A-2”, 4.784%, 7/01/2058 | $ | 2,826,000 | $2,466,657 | |
| Puerto Rico Sales Tax Financing Corp., Restructured Sales Tax Rev., Capital Appreciation, “2019A-1”, 0%, 7/01/2024 | 6,000 | 5,808 | ||
| Puerto Rico Sales Tax Financing Corp., Restructured Sales Tax Rev., Capital Appreciation, “2019A-1”, 0%, 7/01/2027 | 171,000 | 145,604 | ||
| Puerto Rico Sales Tax Financing Corp., Restructured Sales Tax Rev., Capital Appreciation, “2019A-1”, 0%, 7/01/2029 | 31,000 | 24,104 | ||
| Puerto Rico Sales Tax Financing Corp., Restructured Sales Tax Rev., Capital Appreciation, “2019A-1”, 0%, 7/01/2031 | 1,566,000 | 1,109,398 | ||
| Puerto Rico Sales Tax Financing Corp., Restructured Sales Tax Rev., Capital Appreciation, “2019A-1”, 0%, 7/01/2033 | 1,524,000 | 976,503 | ||
| Puerto Rico Sales Tax Financing Corp., Restructured Sales Tax Rev., Capital Appreciation, “2019A-1”, 0%, 7/01/2046 | 4,034,000 | 1,039,918 | ||
| Wisconsin Public Finance Authority Limited Obligation Grant Rev. (American Dream at Meadowlands Project), “A”, 6.25%, 8/01/2027 (a)(d)(n) | 960,000 | 733,200 | ||
| Wisconsin Public Finance Authority Limited Obligation Grant Rev., Taxable (American Dream at Meadowlands Project), ”A“, 5.625%, 8/01/2024 (a)(d)(n) | 555,000 | 423,881 | ||
| $13,125,611 | ||||
| Secondary Schools – 4.5% | ||||
| California Infrastructure & Economic Development Bank Rev. (Colburn School), 1.75%, 8/01/2055 (Put Date 8/01/2026) | $ | 1,000,000 | $912,987 | |
| California Infrastructure & Economic Development Bank, Senior National Charter School Revolving Rev. (Equitable School), “B”, 4%, 11/01/2050 | 500,000 | 405,136 | ||
| California Infrastructure & Economic Development Bank, Senior National Charter School Revolving Rev. (Equitable School), “B”, 4.125%, 11/01/2052 | 3,075,000 | 2,519,777 | ||
| California Municipal Finance Authority, Charter School Lease Rev. (Palmdale Aerospace Academy Project), “A”, 5%, 7/01/2038 (n) | 970,000 | 910,168 | ||
| California Municipal Finance Authority, Education Rev. (American Heritage Education Foundation Project), “A”, 5%, 6/01/2046 | 750,000 | 669,718 | ||
| California School Finance Authority, Charter School Refunding Rev. (Aspire Public Schools), 5%, 8/01/2041 (Prerefunded 8/01/2025) (n) | 50,000 | 51,122 | ||
| California School Finance Authority, Charter School Refunding Rev. (Aspire Public Schools), 5%, 8/01/2041 (n) | 450,000 | 427,918 | ||
| California School Finance Authority, Charter School Refunding Rev. (Partnerships to Uplift Communities Project), 5.25%, 8/01/2038 | 500,000 | 480,540 | ||
| California School Finance Authority, Charter School Refunding Rev. (Partnerships to Uplift Communities Project), 5.5%, 8/01/2043 | 550,000 | 532,546 | ||
| California School Finance Authority, Charter School Refunding Rev. (Partnerships to Uplift Communities Project), 5.5%, 8/01/2047 | 525,000 | 497,623 | ||
| California School Finance Authority, Charter School Rev. (Aspire Public Schools - Obligated Group), 5%, 8/01/2040 (n) | 415,000 | 397,548 | ||
| California School Finance Authority, Charter School Rev. (Aspire Public Schools - Obligated Group), 5%, 8/01/2045 (n) | 415,000 | 384,489 | ||
| California School Finance Authority, Charter School Rev. (Aspire Public Schools - Obligated Group), “A”, 5%, 8/01/2040 (n) | 525,000 | 502,922 | ||
| California School Finance Authority, Charter School Rev. (Aspire Public Schools - Obligated Group), “A”, 5%, 8/01/2050 (n) | 1,000,000 | 905,349 | ||
| California School Finance Authority, Charter School Rev. (Downtown College Prep - Obligated Group), 5%, 6/01/2046 (n) | 1,000,000 | 899,745 | ||
| California School Finance Authority, Charter School Rev. (Social Bonds - Fenton Charter Public Schools Obligated Group), “A”, 5%, 7/01/2040 (n) | 1,125,000 | 1,056,158 | ||
| California School Finance Authority, Charter School Rev. (Social Bonds - Fenton Charter Public Schools Obligated Group), “A”, 5%, 7/01/2058 (n) | 625,000 | 543,071 | ||
| California School Finance Authority, Educational Facilities Rev. (New Designs Charter School Adams Campus Project), “A”, 5%, 6/01/2030 (n) | 1,100,000 | 1,098,693 | ||
| California School Finance Authority, Educational Facilities Rev. (New Designs Charter School Adams Campus Project), “A”, 5%, 6/01/2050 (n) | 2,120,000 | 1,859,915 | ||
| California School Finance Authority, School Facility Rev. (Alliance for College-Ready Public Schools Projects), “A”, 5%, 7/01/2030 (n) | 1,245,000 | 1,250,139 | ||
| California School Finance Authority, School Facility Rev. (Green Dot Public Schools California Projects), “A”, 5%, 8/01/2038 (n) | 870,000 | 841,417 | ||
| California School Finance Authority, School Facility Rev. (Green Dot Public Schools California Projects), “A”, 5%, 8/01/2048 (n) | 870,000 | 789,257 | ||
| California School Finance Authority, School Facility Rev. (KIPP LA Projects), “A”, 5%, 7/01/2034 | 530,000 | 532,124 | ||
| California School Finance Authority, School Facility Rev. (KIPP LA Projects), “A”, 5%, 7/01/2037 (n) | 505,000 | 506,283 | ||
| California School Finance Authority, School Facility Rev. (KIPP LA Projects), “A”, 5.125%, 7/01/2044 | 470,000 | 461,790 | ||
| California School Finance Authority, School Facility Rev. (KIPP LA Projects), “A”, 5%, 7/01/2047 (n) | 745,000 | 700,429 | ||
| California School Finance Authority, School Facility Rev. (KIPP SoCal Projects), “A”, 5%, 7/01/2049 (n) | 1,050,000 | 979,679 | ||
| California Statewide Communities Development Authority, School Facility Rev. (Alliance for College-Ready Public Schools), “A”, 6.375%, 7/01/2047 | 1,270,000 | 1,270,629 | ||
| $22,387,172 | ||||
| Single Family Housing - Other – 0.2% | ||||
| California Department of Veterans Affairs, Home Purchase Rev., “A”, 5.5%, 12/01/2052 | $ | 1,000,000 | $1,041,410 | |
| State & Local Agencies – 3.7% | ||||
| Fresno, CA, Joint Powers Financing Authority Rev., Lease Revenue Refunding Rev. (Master Lease Projects), “A”, AGM, 5%, 4/01/2037 | $ | 800,000 | $825,236 | |
| Indio, CA, Public Financing Authority Lease Rev., “A”, BAM, 5.25%, 11/01/2047 | 3,735,000 | 3,889,861 | ||
| North Lake Tahoe, CA, Public Financing Authority Lease Rev. (Health and Human Services Center), 5.5%, 12/01/2047 | 4,425,000 | 4,772,796 | ||
25
Portfolio of Investments (unaudited) –
continued
| Issuer | Shares/Par | Value ($) | ||
| Municipal Bonds – continued | ||||
| State & Local Agencies – continued | ||||
| Ontario, CA, Public Financing Authority Lease Rev. (Civic Center Improvements), “A”, 5%, 11/01/2037 | $ | 300,000 | $323,475 | |
| Ontario, CA, Public Financing Authority Lease Rev. (Civic Center Improvements), “A”, 5%, 11/01/2038 | 500,000 | 535,865 | ||
| Ontario, CA, Public Financing Authority Lease Rev. (Civic Center Improvements), “A”, 5%, 11/01/2039 | 700,000 | 745,978 | ||
| Ontario, CA, Public Financing Authority Lease Rev. (Civic Center Improvements), “A”, 5%, 11/01/2040 | 900,000 | 951,980 | ||
| Santa Clara County, CA, Financing Authority Lease Rev. (Capital Facilities), “A”, 3%, 5/01/2039 | 5,270,000 | 4,201,593 | ||
| Victorville, CA, Electric Rev., “A”, 5%, 5/01/2034 | 500,000 | 541,884 | ||
| Victorville, CA, Electric Rev., “A”, 5%, 5/01/2035 | 725,000 | 782,632 | ||
| Victorville, CA, Electric Rev., “A”, 5%, 5/01/2036 | 590,000 | 632,330 | ||
| $18,203,630 | ||||
| Student Loan Revenue – 0.0% | ||||
| Minnesota Office of Higher Education Supplemental Student Loan Program Rev., 2.65%, 11/01/2038 | $ | 275,000 | $239,617 | |
| Tax - Other – 1.1% | ||||
| Chicago, IL, Board of Education, Dedicated Capital Improvement Tax Bond, 5%, 4/01/2045 | $ | 315,000 | $310,935 | |
| Chicago, IL, Board of Education, Dedicated Capital Improvement Tax Bond, 5.75%, 4/01/2048 | 735,000 | 769,468 | ||
| Guam Government Limited Obligation Rev., “A”, 5%, 12/01/2036 | 170,000 | 165,946 | ||
| Guam Government Limited Obligation Rev., “A”, 5%, 12/01/2046 | 500,000 | 438,458 | ||
| Irvine, CA, Financial Authority Special Tax Rev. (Irvine Great Park Infrastructure Project), BAM, 4%, 9/01/2058 | 4,000,000 | 3,548,987 | ||
| Wisconsin Public Finance Authority Limited Obligation PILOT Rev. (American Dream at Meadowlands Project), 6.5%, 12/01/2037 (n) | 100,000 | 88,665 | ||
| Wisconsin Public Finance Authority Limited Obligation PILOT Rev. (American Dream at Meadowlands Project), 7%, 12/01/2050 | 305,000 | 271,379 | ||
| $5,593,838 | ||||
| Tax Assessment – 6.7% | ||||
| California Statewide Communities Development Authority Rev. (Infrastructure Program), “A”, 5%, 9/02/2048 | $ | 940,000 | $916,068 | |
| California Statewide Communities Development Authority Rev. (Infrastructure Program), “B”, 5%, 9/02/2039 | 1,000,000 | 995,707 | ||
| California Statewide Communities Development Authority Rev. (Infrastructure Program), “B”, 5%, 9/02/2044 | 1,000,000 | 982,930 | ||
| California Statewide Communities Development Authority Rev. (Infrastructure Program), “B”, 4%, 9/02/2050 | 505,000 | 378,348 | ||
| California Statewide Communities Development Authority Rev. (Infrastructure Program), “C”, 4%, 9/02/2040 | 1,985,000 | 1,613,764 | ||
| California Statewide Communities Development Authority Rev. (Infrastructure Program), “C”, 5%, 9/02/2044 | 500,000 | 480,925 | ||
| California Statewide Communities Development Authority Rev. (Infrastructure Program), “C”, 5%, 9/02/2049 | 500,000 | 470,376 | ||
| Huntington Beach, CA, Community Facilities District Special Tax (Grand Coast Resort), 5.125%, 9/01/2031 | 1,000,000 | 1,000,425 | ||
| Lake Elsinore, CA, Public Financing Authority Rev., 5%, 9/01/2035 | 920,000 | 931,802 | ||
| Lee Lake, CA, Public Financing Authority, Senior Lien Rev., “A”, 5.125%, 9/01/2035 | 1,000,000 | 1,001,081 | ||
| Newport Beach, CA, Limited Obligation Improvement Bonds, “A”, 4.125%, 9/01/2038 | 575,000 | 528,076 | ||
| Newport Beach, CA, Limited Obligation Improvement Bonds, “A”, 5%, 9/01/2043 | 650,000 | 649,140 | ||
| North Natomas, CA, Community Facilities District Special Tax, “4-E”, 5.25%, 9/01/2033 | 765,000 | 767,154 | ||
| Pittsburg, CA, Redevelopment Successor Agency, Tax Allocation (Los Medanos Community Development Project), AGM, 5%, 8/01/2028 | 650,000 | 654,587 | ||
| Pittsburg, CA, Redevelopment Successor Agency, Tax Allocation (Los Medanos Community Development Project), AGM, 5%, 8/01/2029 | 1,350,000 | 1,359,302 | ||
| Rancho Cucamonga, CA, Community Facilities District Special Tax, 5.25%, 9/01/2033 | 1,000,000 | 1,000,598 | ||
| Rancho Cucamonga, CA, Redevelopment Agency, Tax Allocation Refunding (Successor Agency to the Rancho Redevelopment Project Area), AGM, 5%, 9/01/2032 | 2,625,000 | 2,651,924 | ||
| River Islands, CA, Public Finance Authority Improvement Area No. 1, Special Tax Community Facilities District No. 2003-1, “A-1”, AGM, 4.25%, 9/01/2047 | 5,000,000 | 4,733,846 | ||
| River Islands, CA, Public Finance Authority, Special Tax Community Facilities District No. 2016-1, AGM, 4.25%, 9/01/2042 | 1,000,000 | 957,537 | ||
| River Islands, CA, Public Finance Authority, Special Tax Community Facilities District No. 2016-1, AGM, 4.5%, 9/01/2047 | 2,550,000 | 2,495,108 | ||
| Riverside County, CA, Jurupa Valley Redevelopment Project Rev., “B”, AGM, 5%, 10/01/2030 | 890,000 | 908,317 | ||
| Riverside County, CA, Jurupa Valley Redevelopment Project Rev., “B”, AGM, 5%, 10/01/2031 | 1,095,000 | 1,116,225 | ||
| Riverside County, CA, Redevelopment Agency, Tax Allocation, “A”, AGM, 5%, 10/01/2034 | 1,385,000 | 1,397,217 | ||
| San Francisco, CA, City & County Development Special Tax District No. 2020-1 (Mission Rock Facilities & Services), “A”, 4%, 9/01/2026 (n) | 100,000 | 97,363 | ||
| San Francisco, CA, City & County Development Special Tax District No. 2020-1 (Mission Rock Facilities & Services), “A”, 4%, 9/01/2051 (n) | 1,600,000 | 1,168,109 | ||
| San Francisco, CA, City & County Redevelopment Successor Agency, Tax Allocation (Mission Bay South Redevelopment Project), “A”, 5%, 8/01/2043 | 750,000 | 753,780 | ||
| San Joaquin, CA, Area Flood Control Agency, Levee Construction & Maintenance Assessment District, “A”, AGM, 4%, 9/30/2048 | 835,000 | 743,414 | ||
| San Joaquin, CA, Area Flood Control Agency, Levee Construction & Maintenance Assessment District, “A”, AGM, 4.125%, 9/30/2053 | 1,000,000 | 890,476 | ||
26
Portfolio of Investments (unaudited) –
continued
| Issuer | Shares/Par | Value ($) | ||
| Municipal Bonds – continued | ||||
| Tax Assessment – continued | ||||
| Transbay Joint Powers Authority, CA, Senior Tax Allocation, “B”, 5%, 10/01/2033 | $ | 300,000 | $303,750 | |
| Transbay Joint Powers Authority, CA, Senior Tax Allocation, “B”, 5%, 10/01/2034 | 300,000 | 303,055 | ||
| Transbay Joint Powers Authority, CA, Senior Tax Allocation, “B”, 5%, 10/01/2035 | 250,000 | 251,104 | ||
| Transbay Joint Powers Authority, CA, Senior Tax Allocation, “B”, 5%, 10/01/2038 | 600,000 | 581,992 | ||
| $33,083,500 | ||||
| Tobacco – 3.6% | ||||
| Buckeye, OH, Tobacco Settlement Financing Authority Senior Asset-Backed Refunding, 2020B-2, “2”, 5%, 6/01/2055 | $ | 1,365,000 | $1,175,824 | |
| California County Tobacco Securitization Agency Settlement (Gold Country Settlement Funding Corp.), Capital Appreciation, “B-2”, 0%, 6/01/2055 | 5,000,000 | 830,775 | ||
| California County Tobacco Securitization Agency Settlement (Los Angeles County Securitization Corp.), “A”, 4%, 6/01/2049 | 3,515,000 | 2,952,037 | ||
| California County Tobacco Securitization Agency Settlement (Los Angeles County Securitization Corp.), “A”, 5%, 6/01/2049 | 535,000 | 524,652 | ||
| California County Tobacco Securitization Agency Settlement (Sonoma County Securitization Corp.), “B-1”, 5%, 6/01/2049 | 465,000 | 456,006 | ||
| California County Tobacco Securitization Agency Settlement (Sonoma County Securitization Corp.), Capital Appreciation, “B-2”, 0%, 6/01/2055 | 10,000,000 | 1,661,549 | ||
| Golden State, CA, Tobacco Securitization Corp., Tobacco Settlement Rev., “A-1”, 5%, 6/01/2051 | 4,000,000 | 4,061,337 | ||
| Golden State, CA, Tobacco Securitization Corp., Tobacco Settlement Rev., Taxable, “B-1”, 3.85%, 6/01/2050 | 1,615,000 | 1,464,892 | ||
| Tobacco Securitization Authority of Southern California (San Diego County Tobacco Asset Securitization Corp.), “A”, 5%, 6/01/2036 | 250,000 | 259,797 | ||
| Tobacco Securitization Authority of Southern California (San Diego County Tobacco Asset Securitization Corp.), “A”, 5%, 6/01/2048 | 4,250,000 | 4,259,317 | ||
| $17,646,186 | ||||
| Toll Roads – 0.2% | ||||
| Bay Area Toll Authority, California Toll Bridge Rev., “S-7”, 4%, 4/01/2034 | $ | 855,000 | $858,887 | |
| Transportation - Special Tax – 0.1% | ||||
| New Jersey Transportation Trust Fund Authority, “A”, 5%, 12/15/2039 | $ | 500,000 | $512,926 | |
| Universities - Colleges – 4.6% | ||||
| California Educational Facilities Authority Rev. (Art Center College of Design), “A”, 5%, 12/01/2036 | $ | 2,060,000 | $2,073,592 | |
| California Educational Facilities Authority Rev. (Chapman University), “B”, 4%, 4/01/2047 | 1,000,000 | 844,327 | ||
| California Educational Facilities Authority Rev. (Loma Linda University), “A”, 5%, 4/01/2036 | 425,000 | 433,870 | ||
| California Educational Facilities Authority Rev. (Loma Linda University), “A”, 5%, 4/01/2037 | 1,265,000 | 1,285,718 | ||
| California Educational Facilities Authority Rev. (Loyola Marymount University), “B”, 5%, 10/01/2038 | 630,000 | 646,145 | ||
| California Educational Facilities Authority Rev. (University of Redlands), “A”, 5%, 10/01/2036 | 1,000,000 | 1,001,630 | ||
| California Educational Facilities Authority Rev. (University of Redlands), “A”, 5%, 10/01/2037 | 1,000,000 | 993,377 | ||
| California Educational Facilities Authority Rev. (University of Redlands), “A”, 5%, 10/01/2038 | 500,000 | 492,617 | ||
| California Educational Facilities Authority Rev. (University of San Francisco), “A”, 5%, 10/01/2038 | 1,000,000 | 1,025,627 | ||
| California Municipal Finance Authority Rev. (Biola University), 5%, 10/01/2033 | 625,000 | 635,991 | ||
| California Municipal Finance Authority Rev. (Biola University), 5%, 10/01/2035 | 1,195,000 | 1,212,709 | ||
| California Municipal Finance Authority Rev. (Biola University), 5%, 10/01/2039 | 1,000,000 | 1,000,028 | ||
| California Municipal Finance Authority Rev. (Emerson College), “B”, 5%, 1/01/2042 | 4,310,000 | 4,148,156 | ||
| California Municipal Finance Authority Rev. (University of La Verne), “A”, 5%, 6/01/2043 | 1,500,000 | 1,506,357 | ||
| California Municipal Finance Authority Rev. (William Jessup University), 5%, 8/01/2039 | 500,000 | 440,920 | ||
| California Municipal Finance Authority Rev. (William Jessup University), 5%, 8/01/2048 | 2,500,000 | 2,048,657 | ||
| California State University Systemwide Rev., “A”, 3%, 11/01/2052 | 2,000,000 | 1,377,675 | ||
| California Statewide Communities Development Authority Rev. (Lancer Plaza Project), 5.875%, 11/01/2043 | 1,500,000 | 1,500,075 | ||
| Tulare and Kings Counties, CA, College of the Sequoias Community District (Area Improvement District No. 3), “E”, 3%, 8/01/2051 | 200,000 | 135,576 | ||
| $22,803,047 | ||||
| Universities - Dormitories – 3.0% | ||||
| California Community College Financing Authority Student Housing Rev. (NCCD - Napa Valley Properties LLC - Napa Valley College Project), “A”, 5.75%, 7/01/2060 (n) | $ | 2,250,000 | $2,103,770 | |
| California Enterprise Development Authority, Student Housing Rev. (Provident Group - SDSU Properties LLC - M@College Project), “A”, 5%, 8/01/2045 | 600,000 | 596,803 | ||
| California Enterprise Development Authority, Student Housing Rev. (Provident Group - SDSU Properties LLC - M@College Project), “A”, 5%, 8/01/2050 | 650,000 | 636,786 | ||
| California Enterprise Development Authority, Student Housing Rev. (Provident Group - SDSU Properties LLC - M@College Project), “A”, 5%, 8/01/2055 | 825,000 | 794,437 | ||
27
Portfolio of Investments (unaudited) –
continued
| Issuer | Shares/Par | Value ($) | ||
| Municipal Bonds – continued | ||||
| Universities - Dormitories – continued | ||||
| California Enterprise Development Authority, Student Housing Rev. (Provident Group - SDSU Properties LLC - M@College Project), “A”, 5%, 8/01/2057 | $ | 450,000 | $426,134 | |
| California Municipal Finance Authority, Student Housing Rev. (Bowles Hall Foundation), “A”, 5%, 6/01/2035 | 225,000 | 224,395 | ||
| California Municipal Finance Authority, Student Housing Rev. (CHF-Davis I LLC - West Village Student Housing Project), 5%, 5/15/2037 | 2,605,000 | 2,647,147 | ||
| California Statewide Communities Development Authority Rev. (Lancer Educational Student Housing Project), “A”, 5%, 6/01/2034 (n) | 375,000 | 355,937 | ||
| California Statewide Communities Development Authority Rev. (Lancer Educational Student Housing Project), “A”, 5%, 6/01/2039 (n) | 475,000 | 438,044 | ||
| California Statewide Communities Development Authority Rev. (Lancer Educational Student Housing Project), “A”, 5%, 6/01/2051 (n) | 1,440,000 | 1,243,188 | ||
| California Statewide Communities Development Authority, College Housing Rev. (NCCD-Hooper Street LLC College of the Arts Project), 5.25%, 7/01/2039 (n) | 1,740,000 | 1,628,266 | ||
| University of California, Hastings Campus Housing Finance Authority, Campus Housing Rev., “A”, 5%, 7/01/2045 (n) | 3,000,000 | 2,550,779 | ||
| University of California, Hastings Campus Housing Finance Authority, Campus Housing Rev., Convertible Capital Appreciation, “B”, 0% to 7/01/2035, 6.75% to 7/01/2061 (n) | 3,250,000 | 1,125,317 | ||
| $14,771,003 | ||||
| Utilities - Cogeneration – 0.5% | ||||
| California Pollution Control Financing Authority, Water Furnishing Refunding Rev. (San Diego County Water Authority Desalination Project Pipeline), 5%, 7/01/2039 (n) | $ | 1,000,000 | $1,001,294 | |
| California Pollution Control Financing Authority, Water Furnishing Refunding Rev. (San Diego County Water Authority Desalination Project Pipeline), 5%, 11/21/2045 (n) | 1,610,000 | 1,561,678 | ||
| $2,562,972 | ||||
| Utilities - Municipal Owned – 0.9% | ||||
| Guam Power Authority Rev., “A”, AGM, 5%, 10/01/2039 | $ | 280,000 | $280,674 | |
| Guam Power Authority Rev., “A”, AGM, 5%, 10/01/2044 | 315,000 | 311,619 | ||
| Puerto Rico Electric Power Authority Refunding Rev., “DDD”, 5%, 7/01/2020 (a)(d) | 50,000 | 12,500 | ||
| Puerto Rico Electric Power Authority Refunding Rev., “DDD”, 5%, 7/01/2021 (a)(d) | 475,000 | 118,750 | ||
| Puerto Rico Electric Power Authority Refunding Rev., “DDD”, 5%, 7/01/2022 (a)(d) | 765,000 | 191,250 | ||
| Puerto Rico Electric Power Authority Refunding Rev., “VV”, NPFG, 5.25%, 7/01/2034 | 55,000 | 54,241 | ||
| Puerto Rico Electric Power Authority Rev., “A”, 5%, 7/01/2029 (a)(d) | 1,200,000 | 300,000 | ||
| Puerto Rico Electric Power Authority Rev., “A”, 5%, 7/01/2042 (a)(d) | 180,000 | 45,000 | ||
| Puerto Rico Electric Power Authority Rev., “AAA”, 5.25%, 7/01/2021 (a)(d) | 100,000 | 25,000 | ||
| Puerto Rico Electric Power Authority Rev., “AAA”, 5.25%, 7/01/2030 (a)(d) | 50,000 | 12,500 | ||
| Puerto Rico Electric Power Authority Rev., “CCC”, 5.25%, 7/01/2027 (a)(d) | 455,000 | 113,750 | ||
| Puerto Rico Electric Power Authority Rev., “TT”, 5%, 7/01/2021 (a)(d) | 235,000 | 58,750 | ||
| Puerto Rico Electric Power Authority Rev., “TT”, 5%, 7/01/2023 (a)(d) | 200,000 | 50,000 | ||
| Puerto Rico Electric Power Authority Rev., “TT”, 5%, 7/01/2027 (a)(d) | 40,000 | 10,000 | ||
| Puerto Rico Electric Power Authority Rev., “TT”, 5%, 7/01/2037 (a)(d) | 620,000 | 155,000 | ||
| Puerto Rico Electric Power Authority Rev., “WW”, 5.375%, 7/01/2022 (a)(d) | 45,000 | 11,250 | ||
| Puerto Rico Electric Power Authority Rev., “WW”, 5.25%, 7/01/2025 (a)(d) | 95,000 | 23,750 | ||
| Puerto Rico Electric Power Authority Rev., “ZZ”, 5%, 7/01/2018 (a)(d) | 290,000 | 72,500 | ||
| Puerto Rico Electric Power Authority Rev., “ZZ”, 5.25%, 7/01/2023 (a)(d) | 325,000 | 81,250 | ||
| Puerto Rico Electric Power Authority Rev., “ZZ”, 5.25%, 7/01/2024 (a)(d) | 115,000 | 28,750 | ||
| Puerto Rico Electric Power Authority Rev., “ZZ”, 5.25%, 7/01/2026 (a)(d) | 355,000 | 88,750 | ||
| Puerto Rico Electric Power Authority Rev., Taxable, “EEE”, 6.05%, 7/01/2032 (a)(d) | 280,000 | 70,000 | ||
| Truckee Donner Public Utility District Electric System Rev., “A”, 5%, 11/15/2037 | 1,250,000 | 1,286,946 | ||
| Vernon, CA, Electric System Rev., “A”, 5%, 8/01/2039 | 425,000 | 422,713 | ||
| Vernon, CA, Electric System Rev., “A”, 5%, 8/01/2040 | 365,000 | 362,007 | ||
| Vernon, CA, Electric System Rev., “A”, 5%, 8/01/2041 | 420,000 | 405,904 | ||
| $4,592,854 | ||||
| Utilities - Other – 5.4% | ||||
| Black Belt Energy Gas District, AL, Gas Project Rev. (Project No. 8), “A”, 4%, 12/01/2052 (Put Date 12/01/2029) | $ | 1,195,000 | $1,116,153 | |
| Black Belt Energy Gas District, AL, Gas Project Rev., “A”, 4%, 6/01/2051 (Put Date 12/01/2031) | 1,415,000 | 1,334,171 | ||
| Black Belt Energy Gas District, AL, Gas Project Rev., “C-1”, 5.25%, 2/01/2053 (Put Date 6/01/2029) | 2,735,000 | 2,775,361 | ||
| California Community Choice Financing Authority, Clean Energy Project Rev., “A-1”, 4%, 5/01/2053 (Put Date 8/01/2028) | 4,000,000 | 3,872,296 | ||
| California Community Choice Financing Authority, Clean Energy Project Rev., “A-1”, 5%, 12/01/2053 (Put Date 8/01/2029) | 5,000,000 | 5,035,702 | ||
| California Community Choice Financing Authority, Clean Energy Project Rev., “C”, 5.25%, 1/01/2054 (Put Date 10/01/2031) | 5,000,000 | 4,988,207 | ||
| California M-S-R Energy Authority Gas Rev., “A”, 7%, 11/01/2034 | 1,750,000 | 2,047,570 | ||
28
Portfolio of Investments (unaudited) –
continued
| Issuer | Shares/Par | Value ($) | ||
| Municipal Bonds – continued | ||||
| Utilities - Other – continued | ||||
| Southeast Alabama Energy Authority Commodity Supply Rev. (Project No. 5), “A”, 5.25%, 1/01/2054 (Put Date 7/01/2029) | $ | 2,540,000 | $2,556,484 | |
| Southern California Public Power Authority (Natural Gas Project No. 1), “A”, 5%, 11/01/2033 | 1,655,000 | 1,663,204 | ||
| Tennergy Corp., TN, Gas Supply Rev., “A”, 5.5%, 10/01/2053 (Put Date 12/01/2030) | 1,520,000 | 1,543,798 | ||
| $26,932,946 | ||||
| Water & Sewer Utility Revenue – 5.2% | ||||
| Cambria, CA, Community Services District Wastewater Rev., “A”, AGM, 4.625%, 9/01/2047 | $ | 1,000,000 | $993,654 | |
| Cambria, CA, Community Services District Wastewater Rev., “A”, AGM, 4.75%, 9/01/2052 | 1,100,000 | 1,088,689 | ||
| Fillmore, CA, Wastewater Refunding Rev., AGM, 5%, 5/01/2047 | 3,000,000 | 3,050,717 | ||
| Guam Waterworks Authority Rev. (Water and Wastewater System), “A”, 5%, 1/01/2050 | 720,000 | 667,255 | ||
| Oxnard, CA, Financing Authority, Wastewater Rev., AGM, 5%, 6/01/2031 | 415,000 | 417,704 | ||
| Pajaro Valley, CA, Water Management Agency Rev., COP, BAM, 4.125%, 3/01/2048 | 3,500,000 | 3,223,503 | ||
| Pajaro Valley, CA, Water Management Agency Rev., COP, BAM, 4.125%, 3/01/2053 | 1,500,000 | 1,345,427 | ||
| San Francisco, CA, City & County Public Utilities Commission, Power Rev. Bonds, “A”, 5%, 10/31/2053 (w) | 3,500,000 | 3,614,006 | ||
| Santa Barbara County, CA, Solid Waste System Rev., COP, “B”, 5%, 12/01/2036 | 2,000,000 | 2,042,638 | ||
| Silicon Valley Clean Water, CA, Wastewater Rev., 4%, 8/01/2044 | 3,250,000 | 3,008,309 | ||
| Texas Water Development Board State Water Implementation Rev., “A”, 5%, 10/15/2058 (w) | 1,560,000 | 1,603,732 | ||
| Truckee Donner Public Utility District Water System Rev., “A”, 5%, 11/15/2042 | 2,070,000 | 2,173,933 | ||
| Tulare, CA, Sewer Rev., AGM, 5%, 11/15/2031 | 1,700,000 | 1,750,098 | ||
| Tulare, CA, Sewer Rev., AGM, 5%, 11/15/2035 | 830,000 | 852,300 | ||
| $25,831,965 | ||||
| Total Municipal Bonds (Identified Cost, $522,124,043) | $480,921,826 | |||
| Bonds – 0.3% | ||||
| Consumer Services – 0.3% | ||||
| Toll Road Investors Partnership II LP, Capital Appreciation, NPFG, 0%, 2/15/2025 (n) | $ | 902,000 | $812,198 | |
| Toll Road Investors Partnership II LP, Capital Appreciation, NPFG, 0%, 2/15/2043 (n) | 1,796,438 | 590,553 | ||
| Total Bonds (Identified Cost, $1,532,327) | $1,402,751 | |||
| Contingent Value Instruments – 0.1% | ||||
| General Obligations - General Purpose – 0.1% | ||||
| Commonwealth of Puerto Rico, General Obligation Contingent Value Instrument, 11/01/2043 (Identified Cost, $616,905) | $ | 1,039,759 | $539,375 | |
| Investment Companies (h) – 2.4% | ||||
| Money Market Funds – 2.4% | ||||
| MFS Institutional Money Market Portfolio, 5.4% (v) (Identified Cost, $11,767,939) | 11,766,958 | $11,769,311 | ||
| Other Assets, Less Liabilities – 0.1% | 659,046 | |||
| Net Assets – 100.0% | $495,292,309 | |||
See Portfolio Footnotes and Notes to
Financial Statements
29
Portfolio of Investments (unaudited) –
continued
MFS Georgia Municipal Bond
Fund
| Issuer | Shares/Par | Value ($) | ||
| Municipal Bonds – 98.2% | ||||
| Airport Revenue – 5.9% | ||||
| Atlanta, GA, Airport General Refunding Rev., “B”, 5%, 1/01/2033 | $ | 1,000,000 | $1,001,803 | |
| Atlanta, GA, Airport General Refunding Rev., “C”, 4%, 7/01/2038 | 1,000,000 | 925,839 | ||
| Atlanta, GA, Airport General Rev., “B”, 5%, 7/01/2052 | 1,000,000 | 989,853 | ||
| Atlanta, GA, Airport General Rev., “C”, 5%, 6/30/2053 | 500,000 | 494,880 | ||
| Atlanta, GA, Airport General Rev., “B”, 5%, 7/01/2044 | 1,000,000 | 999,445 | ||
| Atlanta, GA, Airport Passenger Facility Charge and Subordinate Lien Rev., “D”, 4%, 7/01/2038 | 520,000 | 481,436 | ||
| Atlanta, GA, Airport Passenger Facility Charge and Subordinate Lien Rev., “D”, 4%, 7/01/2039 | 530,000 | 486,848 | ||
| San Francisco, CA, City & County Airports Commission, International Airport Rev., “B”, 5%, 5/01/2046 | 265,000 | 263,970 | ||
| Wayne County, MI, Airport Authority Rev. (Detroit Metropolitan Wayne County Airport), “B”, 5%, 12/01/2044 | 30,000 | 29,598 | ||
| Wayne County, MI, Airport Authority Rev. (Detroit Metropolitan Wayne County Airport), “B”, BAM, 5%, 12/01/2039 | 35,000 | 34,998 | ||
| Wayne County, MI, Airport Authority Rev. (Detroit Metropolitan Wayne County Airport), “C”, 5%, 12/01/2039 | 25,000 | 24,946 | ||
| Wayne County, MI, Airport Authority Rev. (Detroit Metropolitan Wayne County Airport), “C”, 5%, 12/01/2044 | 40,000 | 39,413 | ||
| $5,773,029 | ||||
| General Obligations - General Purpose – 4.3% | ||||
| Bridgeview, IL, Stadium and Redevelopment Projects, Taxable, AAC, 5.14%, 12/01/2036 | $ | 220,000 | $189,921 | |
| Cartersville, GA, General Obligation, 2%, 10/01/2040 | 1,000,000 | 629,017 | ||
| Chicago, IL, General Obligation, “A”, 5.5%, 1/01/2035 | 60,000 | 62,451 | ||
| Chicago, IL, General Obligation, “F”, 5.5%, 1/01/2042 | 165,000 | 163,592 | ||
| Commonwealth of Puerto Rico, General Obligation Restructured Bonds, Capital Appreciation, Series 2022A, 0%, 7/01/2024 | 7,530 | 7,274 | ||
| Commonwealth of Puerto Rico, General Obligation Restructured Bonds, Capital Appreciation, Series 2022A, 0%, 7/01/2033 | 59,571 | 35,109 | ||
| Commonwealth of Puerto Rico, General Obligation Restructured Bonds, Series 2022A, 5.625%, 7/01/2027 | 51,087 | 52,424 | ||
| Commonwealth of Puerto Rico, General Obligation Restructured Bonds, Series 2022A, 5.625%, 7/01/2029 | 50,258 | 51,932 | ||
| Commonwealth of Puerto Rico, General Obligation Restructured Bonds, Series 2022A, 5.75%, 7/01/2031 | 150,816 | 157,500 | ||
| Commonwealth of Puerto Rico, General Obligation Restructured Bonds, Series 2022A, 4%, 7/01/2033 | 46,290 | 41,491 | ||
| Commonwealth of Puerto Rico, General Obligation Restructured Bonds, Series 2022A, 4%, 7/01/2035 | 85,068 | 73,929 | ||
| Commonwealth of Puerto Rico, General Obligation Restructured Bonds, Series 2022A, 4%, 7/01/2037 | 35,711 | 29,977 | ||
| Commonwealth of Puerto Rico, General Obligation Restructured Bonds, Series 2022A, 4%, 7/01/2041 | 48,553 | 39,037 | ||
| Commonwealth of Puerto Rico, General Obligation Restructured Bonds, Series 2022A, 4%, 7/01/2046 | 171,495 | 132,219 | ||
| Roswell, GA, General Obligation, “A”, 4%, 2/01/2048 | 500,000 | 459,570 | ||
| State of Georgia, General Obligation, “A”, 5%, 6/30/2024 | 1,000,000 | 1,008,923 | ||
| State of Illinois, General Obligation, 5.5%, 5/01/2039 | 180,000 | 187,791 | ||
| State of Illinois, General Obligation, “B”, 5.5%, 5/01/2047 | 85,000 | 88,180 | ||
| State of Illinois, General Obligation, “C”, 4%, 10/01/2040 | 245,000 | 214,385 | ||
| State of Illinois, General Obligation, “C”, 4%, 10/01/2041 | 155,000 | 134,215 | ||
| Valdosta & Lowndes County, GA, Hospital Authority Rev. Anticipation Certificate, “A”, 5%, 10/01/2036 | 500,000 | 526,971 | ||
| $4,285,908 | ||||
| General Obligations - Schools – 7.0% | ||||
| Ben Hill County, GA, School District Rev., 4%, 4/01/2037 | $ | 750,000 | $727,272 | |
| Bryan County, GA, School District General Obligation, 4%, 8/01/2032 | 500,000 | 496,655 | ||
| Chicago, IL, Board of Education, Unlimited Tax General Obligation Dedicated Rev., “A”, 4%, 12/01/2047 | 370,000 | 287,422 | ||
| Clarke County, GA, General Obligation, 5%, 9/01/2025 | 1,000,000 | 1,022,460 | ||
| Dalton, GA, General Obligation, 5%, 2/01/2036 | 500,000 | 523,379 | ||
| Evans County, GA, School District, 4%, 6/01/2035 | 660,000 | 651,607 | ||
| Gwinnett County, GA, School District, 5%, 2/01/2039 | 1,500,000 | 1,568,387 | ||
| Gwinnett County, GA, School District General Obligation, 5%, 2/01/2029 | 1,000,000 | 1,014,337 | ||
| Little Rock, AR, School District & Construction, “A”, BAM, 3%, 2/01/2048 | 930,000 | 632,990 | ||
| $6,924,509 | ||||
| Healthcare Revenue - Hospitals – 12.3% | ||||
| Allegheny County, PA, Hospital Development Authority Rev. (Allegheny Health Network Obligated Group), “A”, 4%, 4/01/2044 | $ | 210,000 | $170,512 | |
| Cedartown Polk County, GA, Hospital Authority Rev., Anticipation Certificates (Polk Medical Center Project), 5%, 7/01/2039 (Prerefunded 7/01/2026) | 500,000 | 516,510 | ||
| Cobb County, GA, Kennestone Hospital Authority Rev. (WellStar Health System, Inc. Project), “B”, 4%, 4/01/2041 | 485,000 | 434,758 | ||
| Colorado Health Facilities Authority Rev. (CommonSpirit Health), “A-2”, 4%, 8/01/2049 | 25,000 | 20,137 | ||
| Columbus, GA, Hospital Authority Refunding Rev., Anticipation Certificates, 5%, 6/30/2024 | 670,000 | 675,634 | ||
| Dalton-Whitfield County, GA, Joint Development Authority Rev. (Hamilton Health Care System), 4%, 8/15/2048 | 250,000 | 213,671 | ||
30
Portfolio of Investments (unaudited) –
continued
| Issuer | Shares/Par | Value ($) | ||
| Municipal Bonds – continued | ||||
| Healthcare Revenue - Hospitals – continued | ||||
| Doylestown, PA, Hospital Authority Rev., “A”, 5%, 7/01/2049 | $ | 15,000 | $12,204 | |
| Fulton County, GA, Development Authority Hospital Rev. (Piedmont Healthcare, Inc. Project), “A”, 5%, 7/01/2032 | 500,000 | 509,873 | ||
| Fulton County, GA, Development Authority Hospital Rev. (Piedmont Healthcare, Inc. Project), “A”, 4%, 7/01/2035 | 500,000 | 469,040 | ||
| Fulton County, GA, Development Authority Hospital Rev. (Piedmont Healthcare, Inc. Project), “A”, 4%, 7/01/2039 | 500,000 | 444,034 | ||
| Fulton County, GA, Development Authority Hospital Rev. (Piedmont Healthcare, Inc. Project), “A”, 4%, 7/01/2049 | 1,000,000 | 841,410 | ||
| Fulton County, GA, Development Authority Hospital Rev. (WellStar Health System, Inc. Project), 5%, 4/01/2034 | 1,000,000 | 1,023,967 | ||
| Fulton County, GA, Development Authority Hospital Rev. (WellStar Health System, Inc. Project), “A”, 5%, 4/01/2042 | 750,000 | 748,346 | ||
| Glynn-Brunswick, GA, Memorial Hospital Authority Rev. (Southeast Georgia Health System, Inc. Project), 5%, 8/01/2028 | 500,000 | 495,882 | ||
| Hall County and Gainesville, GA, Hospital Authority Rev. (Northeast Georgia Health System, Inc. Project), “A”, 5%, 2/15/2042 | 1,000,000 | 1,000,868 | ||
| Harris County, TX, Cultural Education Facilities Finance Corp., Hospital Rev. (Memorial Hermann Health System), “A”, 4.125%, 7/01/2052 | 645,000 | 548,571 | ||
| New York Dormitory Authority Rev. (Norwell Health Obligated Group), “A”, 4.25%, 5/01/2052 | 695,000 | 598,934 | ||
| North Carolina Medical Care Commission, Health Care Facilities Rev. (Rex Healthcare), “A”, 4%, 7/01/2049 | 765,000 | 634,083 | ||
| Richmond County, GA, Hospital Authority Rev., Anticipation Certificates (University Health Services, Inc. Project), 4%, 1/01/2036 | 1,000,000 | 925,296 | ||
| Savannah, GA, Hospital Authority Rev. (St. Joseph's/Candler Health System, Inc.), “A”, 4%, 7/01/2043 | 1,000,000 | 860,275 | ||
| Spartanburg County, SC, Regional Health Services District Hospital Rev., “A”, 4%, 4/15/2043 | 570,000 | 483,090 | ||
| Virginia Small Business Financing Authority, Health Facilities Rev. (Bon Secours Mercy Health, Inc.), “A”, 4%, 12/01/2049 | 550,000 | 460,282 | ||
| $12,087,377 | ||||
| Healthcare Revenue - Long Term Care – 1.0% | ||||
| Fulton County, GA, Residential Care Facilities, Elderly Authority Rev. (Lenbrook Square Foundation, Inc. Project), “A, 5%, 7/01/2036 | $ | 500,000 | $477,268 | |
| Hall County and Gainesville, GA, Development Authority Retirement Community Rev. (ACTS Retirement - Life Communities, Inc. Obligated Group), 5%, 11/15/2033 | 500,000 | 501,689 | ||
| $978,957 | ||||
| Industrial Revenue - Other – 0.1% | ||||
| Port Beaumont, TX, Navigation District, Dock & Wharf Facility Rev. (Jefferson Gulf Coast Energy Project), ”A“, 2.875%, 1/01/2041 (n) | $ | 130,000 | $80,762 | |
| Industrial Revenue - Paper – 0.1% | ||||
| Rockdale County, GA, Development Authority Refunding Rev. (Pratt Paper LLC Project), 4%, 1/01/2038 (n) | $ | 150,000 | $137,566 | |
| Miscellaneous Revenue - Other – 6.0% | ||||
| Atlanta, GA, Geo. L. Smith II World Congress Center Authority Convention Center Hotel Rev., ”A“, 4%, 1/01/2054 | $ | 1,250,000 | $954,551 | |
| Atlanta, GA, Geo. L. Smith II World Congress Center Authority Convention Center Hotel Rev., ”B“, 5%, 1/01/2054 (n) | 1,000,000 | 759,259 | ||
| Clarke County, GA, Classic Center Authority Rev. (Classic Center Arena Project), ”A“, 4.625%, 4/30/2043 (w) | 1,000,000 | 982,880 | ||
| Fulton County, GA, Development Authority Rev. (Robert W. Woodruff Arts Center, Inc. Project), ”A“, 5%, 3/15/2034 | 500,000 | 521,566 | ||
| Fulton County, GA, Development Authority Rev. (Robert W. Woodruff Arts Center, Inc. Project), ”A“, 5%, 3/15/2036 | 500,000 | 505,916 | ||
| Fulton County, GA, Development Authority Rev. (Robert W. Woodruff Arts Center, Inc. Project), ”A“, 5%, 3/15/2044 | 660,000 | 667,706 | ||
| Hart County, GA, Association County Commissioners (Public Purpose Project), 4.75%, 11/01/2052 | 1,000,000 | 927,666 | ||
| Matching Fund Special Purpose Securitization Corp., ”A“, 5%, 10/01/2026 | 45,000 | 45,172 | ||
| New York Liberty Development Corp., Liberty Rev. (3 World Trade Center Project), ”1“, 5%, 11/15/2044 (n) | 280,000 | 258,676 | ||
| New York, NY, Industrial Development Agency, Airport Facilities Rev. (Transportation Infrastructure Properties LLC), 5%, 7/01/2028 | 270,000 | 266,529 | ||
| $5,889,921 | ||||
| Multi-Family Housing Revenue – 0.3% | ||||
| New Hampshire National Finance Authority Municipal Certificates, ”1-A“, 4.375%, 9/20/2036 | $ | 324,878 | $300,832 | |
| Port Revenue – 2.6% | ||||
| Georgia Ports Authority Rev., 4%, 7/01/2047 | $ | 1,000,000 | $891,684 | |
| Georgia Ports Authority Rev., 4%, 7/01/2052 | 1,000,000 | 868,865 | ||
| Port Authority of NY & NJ (221st Series), 4%, 7/15/2055 | 1,000,000 | 819,567 | ||
| $2,580,116 | ||||
| Sales & Excise Tax Revenue – 6.6% | ||||
| Chicago, IL, Metropolitan Pier & Exposition Authority Refunding Bonds (McCormick Place Expansion Project), Capital Appreciation, ”B-1“, AGM, 0%, 6/15/2044 | $ | 1,205,000 | $411,058 | |
| Guam Government Business Privilege Tax Refunding, ”F“, 5%, 1/01/2030 | 5,000 | 4,985 | ||
| Guam Government Business Privilege Tax Refunding, ”F“, 5%, 1/01/2031 | 10,000 | 9,935 | ||
| Guam Government Business Privilege Tax Refunding, ”F“, 4%, 1/01/2042 | 90,000 | 72,836 | ||
| Metropolitan Atlanta Rapid Transit Authority, GA, Sales Tax Refunding Rev., ”A“, 5%, 7/01/2039 | 1,000,000 | 1,069,222 | ||
31
Portfolio of Investments (unaudited) –
continued
| Issuer | Shares/Par | Value ($) | ||
| Municipal Bonds – continued | ||||
| Sales & Excise Tax Revenue – continued | ||||
| Metropolitan Atlanta Rapid Transit Authority, GA, Sales Tax Rev. (Third Indenture Series), ”A“, 5%, 7/01/2044 (Prerefunded 7/01/2025) | $ | 1,000,000 | $1,021,345 | |
| Metropolitan Atlanta Rapid Transit Authority, GA, Sales Tax Rev. (Third Indenture Series), ”C“, 4%, 7/01/2036 | 750,000 | 728,446 | ||
| Metropolitan Atlanta Rapid Transit Authority, GA, Sales Tax Rev., ”E-1“, 3%, 7/01/2040 | 1,000,000 | 780,540 | ||
| Puerto Rico Sales Tax Financing Corp., Restructured Sales Tax Rev., ”2019A-1“, 4.55%, 7/01/2040 | 24,000 | 22,082 | ||
| Puerto Rico Sales Tax Financing Corp., Restructured Sales Tax Rev., ”2019A-1“, 4.75%, 7/01/2053 | 82,000 | 72,493 | ||
| Puerto Rico Sales Tax Financing Corp., Restructured Sales Tax Rev., ”2019A-1“, 5%, 7/01/2058 | 745,000 | 673,915 | ||
| Puerto Rico Sales Tax Financing Corp., Restructured Sales Tax Rev., ”2019A-2“, 4.329%, 7/01/2040 | 196,000 | 175,550 | ||
| Puerto Rico Sales Tax Financing Corp., Restructured Sales Tax Rev., ”2019A-2“, 4.329%, 7/01/2040 | 83,000 | 74,340 | ||
| Puerto Rico Sales Tax Financing Corp., Restructured Sales Tax Rev., ”2019A-2“, 4.784%, 7/01/2058 | 578,000 | 504,504 | ||
| Puerto Rico Sales Tax Financing Corp., Restructured Sales Tax Rev., Capital Appreciation, ”2019A-1“, 0%, 7/01/2024 | 1,000 | 968 | ||
| Puerto Rico Sales Tax Financing Corp., Restructured Sales Tax Rev., Capital Appreciation, ”2019A-1“, 0%, 7/01/2027 | 35,000 | 29,802 | ||
| Puerto Rico Sales Tax Financing Corp., Restructured Sales Tax Rev., Capital Appreciation, ”2019A-1“, 0%, 7/01/2029 | 6,000 | 4,665 | ||
| Puerto Rico Sales Tax Financing Corp., Restructured Sales Tax Rev., Capital Appreciation, ”2019A-1“, 0%, 7/01/2031 | 326,000 | 230,947 | ||
| Puerto Rico Sales Tax Financing Corp., Restructured Sales Tax Rev., Capital Appreciation, ”2019A-1“, 0%, 7/01/2033 | 316,000 | 202,477 | ||
| Puerto Rico Sales Tax Financing Corp., Restructured Sales Tax Rev., Capital Appreciation, ”2019A-1“, 0%, 7/01/2046 | 1,075,000 | 277,122 | ||
| Wisconsin Public Finance Authority Limited Obligation Grant Rev. (American Dream at Meadowlands Project), ”A“, 6.25%, 8/01/2027 (a)(d)(n) | 245,000 | 187,119 | ||
| $6,554,351 | ||||
| Secondary Schools – 0.2% | ||||
| District of Columbia Rev. (Rocketship D.C.), ”A“, 5%, 6/01/2049 (n) | $ | 250,000 | $207,515 | |
| Single Family Housing - State – 4.5% | ||||
| Connecticut Housing Finance Authority Rev. (Housing Mortgage Finance Program), ”C-1“, 4%, 11/15/2047 | $ | 200,000 | $196,997 | |
| Georgia Housing & Finance Authority Rev., Single Family Mortgage, ”A“, 4.15%, 12/01/2038 | 1,000,000 | 905,395 | ||
| Georgia Housing & Finance Authority Rev., Single Family Mortgage, ”A“, 3.85%, 12/01/2041 | 1,465,000 | 1,365,737 | ||
| Georgia Housing & Finance Authority Rev., Single Family Mortgage, ”A“, 3.6%, 12/01/2044 | 1,000,000 | 807,225 | ||
| Georgia Housing & Finance Authority Rev., Single Family Mortgage, ”A“, 4%, 12/01/2048 | 405,000 | 390,767 | ||
| Maryland Community Development Administration, Department of Housing & Community Development Residential Rev., ”A“, GNMA, 4.45%, 9/01/2043 | 595,000 | 556,278 | ||
| Maryland Community Development Administration, Department of Housing & Community Development Residential Rev., ”A“, GNMA, 4.5%, 9/01/2046 | 195,000 | 180,125 | ||
| $4,402,524 | ||||
| State & Local Agencies – 0.5% | ||||
| Villa Rica, GA, Public Facilities Authority Rev. (Water and Sewerage Project), 5%, 3/01/2039 (Prerefunded 9/01/2024) | $ | 500,000 | $505,368 | |
| Student Loan Revenue – 0.7% | ||||
| Iowa Student Loan Liquidity Corp. Rev., ”B“, 3%, 12/01/2039 | $ | 5,000 | $4,616 | |
| Iowa Student Loan Liquidity Corp. Rev., ”B“, 3.5%, 12/01/2044 | 130,000 | 94,531 | ||
| Minnesota Office of Higher Education Supplemental Student Loan Program Rev., 2.65%, 11/01/2038 | 55,000 | 47,923 | ||
| New Jersey Higher Education Student Assistance Authority, Senior Student Loan Rev., ”B“, 4%, 12/01/2041 | 585,000 | 553,374 | ||
| $700,444 | ||||
| Tax - Other – 1.8% | ||||
| Atlanta & Fulton County, GA, Recreation Authority Park Improvement, ”A“, 5%, 12/01/2032 | $ | 500,000 | $505,074 | |
| Chicago, IL, Board of Education, Dedicated Capital Improvement Tax Bond, 5%, 4/01/2045 | 65,000 | 64,161 | ||
| Chicago, IL, Board of Education, Dedicated Capital Improvement Tax Bond, 5.75%, 4/01/2048 | 185,000 | 193,676 | ||
| Guam Government Limited Obligation Rev., ”A“, 5%, 12/01/2036 | 35,000 | 34,165 | ||
| Guam Government Limited Obligation Rev., ”A“, 5%, 12/01/2046 | 100,000 | 87,692 | ||
| New York, NY, Transitional Finance Authority Rev., ”C-1“, 4%, 5/01/2045 | 930,000 | 832,231 | ||
| Wisconsin Public Finance Authority Limited Obligation PILOT Rev. (American Dream at Meadowlands Project), 7%, 12/01/2050 | 100,000 | 88,977 | ||
| $1,805,976 | ||||
| Tax Assessment – 0.5% | ||||
| Atlanta, GA, Tax Allocation (Eastside Project), 5%, 1/01/2030 (Prerefunded 1/01/2026) | $ | 410,000 | $421,575 | |
| Brunswick, MD, Special Obligation Refunding (Brunswick Crossing Special Taxing District), 4%, 7/01/2029 | 10,000 | 9,544 | ||
| Brunswick, MD, Special Obligation Refunding (Brunswick Crossing Special Taxing District), 5%, 7/01/2036 | 9,000 | 8,793 | ||
| $439,912 | ||||
32
Portfolio of Investments (unaudited) –
continued
| Issuer | Shares/Par | Value ($) | ||
| Municipal Bonds – continued | ||||
| Tobacco – 0.8% | ||||
| Buckeye, OH, Tobacco Settlement Financing Authority Senior Asset-Backed Refunding, 2020B-2, ”2“, 5%, 6/01/2055 | $ | 560,000 | $482,389 | |
| Golden State, CA, Tobacco Securitization Corp., Tobacco Settlement Rev., Taxable, ”B-1“, 3.85%, 6/01/2050 | 370,000 | 335,610 | ||
| $817,999 | ||||
| Toll Roads – 0.4% | ||||
| Texas Private Activity Surface Transportation Corp., Senior Lien Rev. (NTE Mobility Partners Segments 3 LLC Segments 3A & 3B Facility), 7%, 12/31/2038 | $ | 80,000 | $80,152 | |
| Texas Private Activity Surface Transportation Corp., Senior Lien Rev. (NTE Mobility Partners Segments 3 LLC Segments 3A & 3B Facility), 6.75%, 6/30/2043 | 60,000 | 60,096 | ||
| Virginia Small Business Financing Authority Senior Lien Rev. (Elizabeth River Crossings Opco LLC Project), 3%, 1/01/2041 | 375,000 | 269,969 | ||
| $410,217 | ||||
| Transportation - Special Tax – 0.1% | ||||
| New Jersey Transportation Trust Fund Authority, ”A“, 5%, 12/15/2039 | $ | 70,000 | $71,810 | |
| Universities - Colleges – 17.5% | ||||
| Albany-Dougherty County, GA, Inner City Authority Refunding Rev. (USG Real Estate Foundation X LLC Project), 4%, 6/01/2034 | $ | 1,430,000 | $1,396,145 | |
| Americus-Sumter, GA, Payroll Development Authority Rev. (USG Real Estate Foundation VII LLC Project), ”A“, 3.5%, 6/01/2035 | 500,000 | 459,630 | ||
| Barnesville-Lamar County, GA, Industrial Development Authority Refunding Rev. (USG Real Estate Foundation VI LLC Project), 5%, 6/01/2038 | 600,000 | 605,607 | ||
| Bibb County, GA, Development Authority Rev. (USG Real Estate Foundation IX LLC Project), 4%, 6/01/2037 | 560,000 | 508,056 | ||
| Bibb County, GA, Development Authority Rev. (USG Real Estate Foundation IX LLC Project), 4%, 6/01/2044 | 1,000,000 | 826,707 | ||
| Bleckley-Dodge County, GA, Joint Development Authority Refunding Rev. (USG Real Estate Foundation VII LLC Project), 5%, 7/01/2038 | 815,000 | 822,731 | ||
| Bulloch County, GA, Development Authority Rev. (Georgia Southern University Housing Foundation Four, LLC Project), 5%, 7/01/2038 (Prerefunded 7/01/2027) | 200,000 | 209,351 | ||
| Bulloch County, GA, Development Authority Rev. (Georgia Southern University Housing Foundation Four, LLC Project), 5%, 7/01/2038 | 800,000 | 821,104 | ||
| Carrollton, GA, Payroll Development Authority Refunding Rev. (UWG Housing, LLC Project), 5%, 7/01/2038 | 750,000 | 767,890 | ||
| Clemson University, SC, Athletic Facilities Rev., ”A“, 3%, 5/01/2048 | 1,000,000 | 679,985 | ||
| Cobb County, GA, Development Authority, Parking & Dining Hall Refunding Lease Rev. (Kennesaw State University Real Estate Foundations Projects), 5%, 7/15/2034 | 500,000 | 522,068 | ||
| Dahlonega, GA, Downtown Development Authority Refunding Rev. (North Georgia MAC LLC), 5%, 7/01/2036 | 1,000,000 | 1,025,570 | ||
| Fulton County, GA, Development Authority Rev. (Georgia Tech Facilities, Inc.), 5%, 3/01/2034 | 300,000 | 314,398 | ||
| Fulton County, GA, Development Authority Rev. (Georgia Tech Facilities, Inc.), 5%, 6/15/2044 | 1,000,000 | 1,027,292 | ||
| Fulton County, GA, Development Authority Rev. (Georgia Tech Facilities, Inc.), 4%, 6/15/2049 | 500,000 | 433,691 | ||
| Fulton County, GA, Development Authority Rev. (Georgia Tech Facilities, Inc.), 5%, 6/15/2052 | 1,000,000 | 1,020,111 | ||
| Fulton County, GA, Development Authority Rev. (Spelman College), 5%, 6/01/2028 | 500,000 | 506,662 | ||
| Georgia Higher Education Facilities Authority Refunding Rev. (USG Real Estate Foundation II LLC Project), 4%, 6/15/2036 | 750,000 | 703,597 | ||
| Georgia Private Colleges & Universities Authority Rev. (Mercer University Project), 5%, 10/01/2040 | 350,000 | 343,219 | ||
| Georgia Private Colleges & Universities Authority Rev. (Mercer University Project), 5.25%, 10/01/2051 | 1,000,000 | 1,013,923 | ||
| Gwinnett County, GA, Development Authority Rev. (Student Housing), ”A“, 5%, 7/01/2040 | 1,000,000 | 1,003,905 | ||
| Massachusetts Development Finance Agency Rev. (Suffolk University), 4%, 7/01/2051 | 500,000 | 378,497 | ||
| Moultrie-Colquitt County, GA, Development Authority Rev. (Philadelphia College of Osteopathic Medicine), 5%, 12/01/2048 | 870,000 | 888,760 | ||
| Puerto Rico Industrial, Tourist, Educational, Medical & Environmental Control Facilities Financing Authority, Educational Facilities Rev. (University Plaza Project), NPFG, 5%, 7/01/2033 | 70,000 | 67,874 | ||
| Puerto Rico Industrial, Tourist, Educational, Medical & Environmental Control Facilities Financing Authority, Higher Education Rev. (International American University of Puerto Rico Project), 5%, 10/01/2031 | 50,000 | 50,035 | ||
| Richmond County, GA, Development Authority Rev. (Georgia Regents University Academic Research Center Project), AGM, 5%, 12/15/2032 | 325,000 | 326,808 | ||
| South Regional, GA, Joint Development Authority Rev. (VSU Parking and Student Service Center Project), ”A“, 5%, 8/01/2035 | 500,000 | 506,974 | ||
| $17,230,590 | ||||
| Universities - Dormitories – 0.4% | ||||
| Cobb County, GA, Development Authority Student Housing Refunding Rev. (Kennesaw State University Foundation, Inc.), ”C“, 5%, 7/15/2030 | $ | 390,000 | $392,614 | |
| Cobb County, GA, Development Authority Student Housing Refunding Rev. (Kennesaw State University Foundation, Inc.), ”C“, 5%, 7/15/2030 (Prerefunded 7/15/2025) | 10,000 | 10,201 | ||
| $402,815 | ||||
33
Portfolio of Investments (unaudited) –
continued
| Issuer | Shares/Par | Value ($) | ||
| Municipal Bonds – continued | ||||
| Utilities - Investor Owned – 0.7% | ||||
| Bartow County, GA, Development Authority Pollution Control Rev. (Georgia Power Co. Plant Bowen Project), 3.95%, 12/01/2032 (Put Date 3/08/2028) | $ | 750,000 | $723,769 | |
| Utilities - Municipal Owned – 9.1% | ||||
| Dalton, GA, Combined Utilities Rev., 5%, 3/01/2029 | $ | 1,195,000 | $1,218,257 | |
| Dalton, GA, Combined Utilities Rev., 5%, 3/01/2032 | 1,000,000 | 1,047,966 | ||
| Dalton, GA, Combined Utilities Rev., 4%, 3/01/2035 | 500,000 | 473,976 | ||
| Dalton, GA, Combined Utilities Rev., 4%, 3/01/2036 | 500,000 | 467,868 | ||
| Georgia Municipal Electric Authority (Plant Vogtle Units 3 & 4 Project J), ”A“, 4.5%, 7/01/2063 | 1,000,000 | 889,444 | ||
| Georgia Municipal Electric Authority (Plant Vogtle Units 3 & 4 Project J), ”A“, AGM, 5%, 7/01/2048 | 1,000,000 | 1,010,043 | ||
| Georgia Municipal Electric Authority (Plant Vogtle Units 3 & 4 Project J), ”A“, AGM, 5%, 7/01/2055 | 1,000,000 | 1,004,592 | ||
| Georgia Municipal Electric Authority (Plant Vogtle Units 3 & 4 Project M), ”A“, 5%, 1/01/2039 | 750,000 | 753,742 | ||
| Georgia Municipal Electric Authority (Project One), ”A“, 5%, 1/01/2037 | 1,000,000 | 1,034,680 | ||
| Georgia Municipal Electric Authority (Project One), ”A“, 5%, 1/01/2038 | 125,000 | 126,876 | ||
| Guam Power Authority Rev., ”A“, AGM, 5%, 10/01/2039 | 50,000 | 50,120 | ||
| Guam Power Authority Rev., ”A“, AGM, 5%, 10/01/2044 | 60,000 | 59,356 | ||
| Puerto Rico Electric Power Authority Refunding Rev., ”DDD“, 5%, 7/01/2020 (a)(d) | 10,000 | 2,500 | ||
| Puerto Rico Electric Power Authority Refunding Rev., ”DDD“, 5%, 7/01/2021 (a)(d) | 100,000 | 25,000 | ||
| Puerto Rico Electric Power Authority Refunding Rev., ”DDD“, 5%, 7/01/2022 (a)(d) | 155,000 | 38,750 | ||
| Puerto Rico Electric Power Authority Refunding Rev., ”VV“, NPFG, 5.25%, 7/01/2030 | 70,000 | 69,166 | ||
| Puerto Rico Electric Power Authority Refunding Rev., ”VV“, NPFG, 5.25%, 7/01/2034 | 10,000 | 9,862 | ||
| Puerto Rico Electric Power Authority Rev., ”A“, 5%, 7/01/2029 (a)(d) | 245,000 | 61,250 | ||
| Puerto Rico Electric Power Authority Rev., ”A“, 5%, 7/01/2042 (a)(d) | 40,000 | 10,000 | ||
| Puerto Rico Electric Power Authority Rev., ”AAA“, 5.25%, 7/01/2021 (a)(d) | 20,000 | 5,000 | ||
| Puerto Rico Electric Power Authority Rev., ”AAA“, 5.25%, 7/01/2030 (a)(d) | 10,000 | 2,500 | ||
| Puerto Rico Electric Power Authority Rev., ”CCC“, 5.25%, 7/01/2027 (a)(d) | 95,000 | 23,750 | ||
| Puerto Rico Electric Power Authority Rev., ”RR“, AGM, 5%, 7/01/2028 | 490,000 | 492,985 | ||
| Puerto Rico Electric Power Authority Rev., ”TT“, 5%, 7/01/2021 (a)(d) | 45,000 | 11,250 | ||
| Puerto Rico Electric Power Authority Rev., ”TT“, 5%, 7/01/2023 (a)(d) | 45,000 | 11,250 | ||
| Puerto Rico Electric Power Authority Rev., ”TT“, 5%, 7/01/2027 (a)(d) | 10,000 | 2,500 | ||
| Puerto Rico Electric Power Authority Rev., ”TT“, 5%, 7/01/2037 (a)(d) | 125,000 | 31,250 | ||
| Puerto Rico Electric Power Authority Rev., ”WW“, 5.375%, 7/01/2022 (a)(d) | 10,000 | 2,500 | ||
| Puerto Rico Electric Power Authority Rev., ”WW“, 5.25%, 7/01/2025 (a)(d) | 20,000 | 5,000 | ||
| Puerto Rico Electric Power Authority Rev., ”ZZ“, 5%, 7/01/2018 (a)(d) | 60,000 | 15,000 | ||
| Puerto Rico Electric Power Authority Rev., ”ZZ“, 5.25%, 7/01/2023 (a)(d) | 70,000 | 17,500 | ||
| Puerto Rico Electric Power Authority Rev., ”ZZ“, 5.25%, 7/01/2024 (a)(d) | 25,000 | 6,250 | ||
| Puerto Rico Electric Power Authority Rev., ”ZZ“, 5.25%, 7/01/2026 (a)(d) | 75,000 | 18,750 | ||
| Puerto Rico Electric Power Authority Rev., Taxable, ”EEE“, 6.05%, 7/01/2032 (a)(d) | 60,000 | 15,000 | ||
| $9,013,933 | ||||
| Utilities - Other – 4.2% | ||||
| Alabama Southeast Energy, Cooperative District Energy Supply Rev., ”A-1“, 5.5%, 11/01/2053 (Put Date 1/01/2031) | $ | 715,000 | $734,848 | |
| Black Belt Energy Gas District, AL, Gas Project Rev. (Project No. 8), ”A“, 4%, 12/01/2052 (Put Date 12/01/2029) | 250,000 | 233,505 | ||
| Black Belt Energy Gas District, AL, Gas Project Rev., ”A“, 4%, 6/01/2051 (Put Date 12/01/2031) | 300,000 | 282,863 | ||
| California Community Choice Financing Authority, Clean Energy Project Rev., ”C“, 5.25%, 1/01/2054 (Put Date 10/01/2031) | 585,000 | 583,620 | ||
| Georgia Main Street Natural Gas, Inc., Gas Supply Rev., ”A“, 5%, 6/01/2053 (Put Date 6/01/2030) | 1,000,000 | 991,757 | ||
| Georgia Main Street Natural Gas, Inc., Gas Supply Rev., ”C“, 5%, 9/01/2053 (Put Date 9/01/2030) | 750,000 | 757,823 | ||
| Tennessee Energy Acquisition Corp., Gas Project Rev., ”A-1“, 5%, 5/01/2053 (Put Date 5/01/2028) | 520,000 | 518,791 | ||
| $4,103,207 | ||||
| Water & Sewer Utility Revenue – 10.6% | ||||
| Atlanta, GA, Water & Wastewater Refunding Rev., 5%, 11/01/2036 | $ | 750,000 | $771,651 | |
| Atlanta, GA, Water & Wastewater Refunding Rev., ”A“, 5%, 11/01/2037 | 1,000,000 | 1,023,903 | ||
| Atlanta, GA, Water & Wastewater Refunding Rev., ”A“, 5%, 11/01/2038 | 1,000,000 | 1,021,299 | ||
| Atlanta, GA, Water & Wastewater Refunding Rev., ”B“, 4%, 11/01/2038 | 500,000 | 466,863 | ||
| Cartersville, GA, Development Authority Waste & Water Facilities Rev., 4%, 6/01/2038 | 500,000 | 467,369 | ||
| Cherokee County, GA, Water and Sewerage Authority Rev., 4%, 8/01/2053 | 1,000,000 | 873,301 | ||
| Columbus, GA, Water and Sewerage Rev., 5%, 5/01/2036 | 150,000 | 153,261 | ||
| DeKalb County, GA, Water & Sewer Rev., 5%, 10/01/2052 | 1,000,000 | 1,027,937 | ||
34
Portfolio of Investments (unaudited) –
continued
| Issuer | Shares/Par | Value ($) | ||
| Municipal Bonds – continued | ||||
| Water & Sewer Utility Revenue – continued | ||||
| DeKalb County, GA, Water & Sewer Rev., ”B“, 5.25%, 10/01/2025 | $ | 1,000,000 | $1,029,874 | |
| Guam Waterworks Authority Rev. (Water and Wastewater System), 5%, 7/01/2036 | 30,000 | 30,002 | ||
| Guam Waterworks Authority Rev. (Water and Wastewater System), 5%, 1/01/2046 | 125,000 | 117,809 | ||
| Guam Waterworks Authority Rev. (Water and Wastewater System), ”A“, 5%, 7/01/2029 | 45,000 | 45,078 | ||
| Guam Waterworks Authority Rev. (Water and Wastewater System), ”A“, 5%, 7/01/2035 | 45,000 | 45,027 | ||
| Guam Waterworks Authority Rev. (Water and Wastewater System), ”A“, 5%, 1/01/2050 | 155,000 | 143,645 | ||
| Henry County, GA, Water & Sewer Authority Rev., BHAC, 5.25%, 2/01/2027 | 1,000,000 | 1,051,180 | ||
| Michigan Finance Authority Local Government Loan Program Rev. (Detroit Water and Sewerage Department Sewage Disposal System Rev. Refunding Second Lien Local Project), ”C-7“, NPFG, 5%, 7/01/2032 | 15,000 | 15,086 | ||
| Michigan Finance Authority Local Government Loan Program Rev. (Detroit Water and Sewerage Department Water Supply System Rev. Refunding Second Lien Local Project), ”D-6“, NPFG, 5%, 7/01/2036 | 20,000 | 20,044 | ||
| Michigan Finance Authority Local Government Loan Program Rev. (Detroit Water and Sewerage Department Water Supply System Rev. Refunding Senior Lien Local Project), ”D-1“, AGM, 5%, 7/01/2035 | 10,000 | 10,048 | ||
| Michigan Finance Authority Local Government Loan Program Rev. (Detroit Water and Sewerage Department Water Supply System Rev. Refunding Senior Lien Local Project), ”D-1“, AGM, 5%, 7/01/2037 | 20,000 | 20,054 | ||
| Oconee County, GA, Water & Sewerage Rev., ”A“, 5%, 9/01/2033 | 555,000 | 576,042 | ||
| Walton County, GA, Water & Sewer Authority Rev. (Walton-Hard Labor Creek Project), 5%, 2/01/2038 (Prerefunded 2/01/2026) | 500,000 | 514,724 | ||
| Walton County, GA, Water & Sewer Authority Rev. (Walton-Hard Labor Creek Reservoir Water Treatment Facility Project), 5%, 2/01/2053 | 1,000,000 | 1,032,611 | ||
| $10,456,808 | ||||
| Total Municipal Bonds (Identified Cost, $105,839,090) | $96,886,215 | |||
| Bonds – 0.3% | ||||
| Consumer Services – 0.3% | ||||
| Toll Road Investors Partnership II LP, Capital Appreciation, NPFG, 0%, 2/15/2025 (n) | $ | 204,000 | $183,690 | |
| Toll Road Investors Partnership II LP, Capital Appreciation, NPFG, 0%, 2/15/2043 (n) | 378,198 | 124,327 | ||
| Total Bonds (Identified Cost, $336,057) | $308,017 | |||
| Contingent Value Instruments – 0.1% | ||||
| General Obligations - General Purpose – 0.1% | ||||
| Commonwealth of Puerto Rico, General Obligation Contingent Value Instrument, 11/01/2043 (Identified Cost, $130,039) | $ | 219,173 | $113,696 | |
| Investment Companies (h) – 1.3% | ||||
| Money Market Funds – 1.3% | ||||
| MFS Institutional Money Market Portfolio, 5.4% (v) (Identified Cost, $1,287,714) | 1,287,570 | $1,287,828 | ||
| Other Assets, Less Liabilities – 0.1% | 101,608 | |||
| Net Assets – 100.0% | $98,697,364 | |||
See Portfolio Footnotes and Notes to
Financial Statements
35
Portfolio of Investments (unaudited) –
continued
MFS Maryland Municipal Bond
Fund
| Issuer | Shares/Par | Value ($) | ||
| Municipal Bonds – 97.7% | ||||
| Airport Revenue – 1.4% | ||||
| Denver, CO, City & County Airport System Rev., ”A“, 4.125%, 11/15/2047 | $ | 70,000 | $61,012 | |
| Denver, CO, City & County Airport System Rev., ”A“, 4.125%, 11/15/2053 | 65,000 | 55,152 | ||
| Metropolitan Washington, D.C., Airport Authority System Refunding Rev., ”A“, 5%, 9/30/2025 | 1,525,000 | 1,543,372 | ||
| $1,659,536 | ||||
| General Obligations - General Purpose – 17.2% | ||||
| Anne Arundel County, MD, General Obligation, Consolidated Improvement, 5%, 4/01/2033 | $ | 1,895,000 | $1,926,567 | |
| Anne Arundel County, MD, General Obligation, Consolidated Improvement, 5%, 10/01/2045 | 1,315,000 | 1,381,272 | ||
| Baltimore County, MD, Metropolitan District (80th Issue), 4%, 3/01/2045 | 1,500,000 | 1,367,222 | ||
| Bridgeview, IL, Stadium and Redevelopment Projects, Taxable, AAC, 5.14%, 12/01/2036 | 225,000 | 194,237 | ||
| Cheverly, MD, Public Improvement, 4.5%, 11/01/2047 | 490,000 | 466,209 | ||
| Chicago, IL, General Obligation, ”A“, 5.5%, 1/01/2040 | 480,000 | 491,165 | ||
| Commonwealth of Puerto Rico, General Obligation Restructured Bonds, Capital Appreciation, Series 2022A, 0%, 7/01/2024 | 6,747 | 6,518 | ||
| Commonwealth of Puerto Rico, General Obligation Restructured Bonds, Capital Appreciation, Series 2022A, 0%, 7/01/2033 | 53,375 | 31,457 | ||
| Commonwealth of Puerto Rico, General Obligation Restructured Bonds, Series 2022A, 5.625%, 7/01/2027 | 45,774 | 46,972 | ||
| Commonwealth of Puerto Rico, General Obligation Restructured Bonds, Series 2022A, 5.625%, 7/01/2029 | 45,031 | 46,531 | ||
| Commonwealth of Puerto Rico, General Obligation Restructured Bonds, Series 2022A, 5.75%, 7/01/2031 | 121,739 | 127,135 | ||
| Commonwealth of Puerto Rico, General Obligation Restructured Bonds, Series 2022A, 4%, 7/01/2033 | 41,476 | 37,176 | ||
| Commonwealth of Puerto Rico, General Obligation Restructured Bonds, Series 2022A, 4%, 7/01/2035 | 75,390 | 65,518 | ||
| Commonwealth of Puerto Rico, General Obligation Restructured Bonds, Series 2022A, 4%, 7/01/2037 | 31,997 | 26,859 | ||
| Commonwealth of Puerto Rico, General Obligation Restructured Bonds, Series 2022A, 4%, 7/01/2041 | 43,504 | 34,978 | ||
| Commonwealth of Puerto Rico, General Obligation Restructured Bonds, Series 2022A, 4%, 7/01/2046 | 150,243 | 115,834 | ||
| Frederick County, MD, General Obligation, Public Facilities, ”A“, 5%, 8/01/2024 | 1,500,000 | 1,514,935 | ||
| Howard County, MD, Metropolitan District Project, ”B“, 3%, 8/15/2051 | 1,155,000 | 785,291 | ||
| Howard County, MD, Metropolitan District Project, ”C“, 4%, 2/15/2048 | 1,500,000 | 1,349,092 | ||
| Maryland Community Development Administration, Local Government Infrastructure, ”A-2“, 4%, 6/01/2036 | 1,210,000 | 1,159,907 | ||
| Maryland State & Local Facilities Loan, General Obligation, 4%, 6/01/2029 | 1,500,000 | 1,497,622 | ||
| Maryland State & Local Facilities Loan, General Obligation Refunding, ”A“, 5%, 8/01/2025 | 2,055,000 | 2,100,038 | ||
| Maryland State & Local Facilities Loan, General Obligation, ”A“, 5%, 6/01/2036 | 1,000,000 | 1,089,891 | ||
| Maryland State & Local Facilities Loan, General Obligation, ”C“, 5%, 8/01/2024 | 2,000,000 | 2,020,566 | ||
| Montgomery County, MD, General Obligation, Consolidated Public Improvement, ”A“, 5%, 8/01/2035 | 1,000,000 | 1,099,962 | ||
| Oxford, AL, General Obligation Warrants, ”A“, 5%, 7/01/2052 | 385,000 | 389,406 | ||
| State of California, Various Purpose General Obligation, 4%, 3/01/2036 | 430,000 | 427,161 | ||
| State of Illinois, General Obligation, 5.5%, 5/01/2039 | 160,000 | 166,925 | ||
| State of Illinois, General Obligation, ”B“, 5.5%, 5/01/2047 | 100,000 | 103,741 | ||
| State of Illinois, General Obligation, ”C“, 4%, 10/01/2040 | 300,000 | 262,512 | ||
| State of Illinois, General Obligation, ”C“, 4%, 10/01/2041 | 190,000 | 164,522 | ||
| Texas Cedar Port Navigation & Improvement District, Unlimited Tax, 4.5%, 8/31/2048 | 130,000 | 117,346 | ||
| Texas Cedar Port Navigation & Improvement District, Unlimited Tax, 4.5%, 8/31/2052 | 50,000 | 44,547 | ||
| $20,659,114 | ||||
| General Obligations - Schools – 0.5% | ||||
| Chicago, IL, Board of Education, Unlimited Tax General Obligation Dedicated Rev., ”A“, 4%, 12/01/2047 | $ | 325,000 | $252,466 | |
| Orange County, CA, Anaheim Elementary School District, AGM, 4%, 8/01/2048 | 405,000 | 369,826 | ||
| $622,292 | ||||
| Healthcare Revenue - Hospitals – 16.2% | ||||
| Doylestown, PA, Hospital Authority Rev., ”A“, 4%, 6/30/2045 (Prerefunded 7/01/2029) | $ | 5,000 | $5,110 | |
| Doylestown, PA, Hospital Authority Rev., ”A“, 4%, 6/30/2045 | 10,000 | 7,128 | ||
| Harris County, TX, Cultural Education Facilities Finance Corp., Hospital Rev. (Memorial Hermann Health System), ”A“, 4.125%, 7/01/2052 | 540,000 | 459,269 | ||
| Maryland Health & Higher Educational Facilities Authority Rev. (Adventist Healthcare), 5%, 1/01/2036 | 750,000 | 736,836 | ||
| Maryland Health & Higher Educational Facilities Authority Rev. (Doctors Community Hospital), ”A“, 5%, 7/01/2034 | 750,000 | 755,098 | ||
| Maryland Health & Higher Educational Facilities Authority Rev. (Frederick Health System), 4%, 7/01/2045 | 1,000,000 | 845,154 | ||
| Maryland Health & Higher Educational Facilities Authority Rev. (Greater Baltimore Medical Center), ”A“, 4%, 7/01/2039 | 1,145,000 | 1,029,221 | ||
| Maryland Health & Higher Educational Facilities Authority Rev. (Greater Baltimore Medical Center), ”A“, 4%, 7/01/2041 | 1,000,000 | 878,066 | ||
| Maryland Health & Higher Educational Facilities Authority Rev. (LifeBridge Health), 5%, 7/01/2028 (Prerefunded 7/01/2025) | 750,000 | 766,008 | ||
| Maryland Health & Higher Educational Facilities Authority Rev. (LifeBridge Health), 5%, 7/01/2033 | 400,000 | 408,208 | ||
36
Portfolio of Investments (unaudited) –
continued
| Issuer | Shares/Par | Value ($) | ||
| Municipal Bonds – continued | ||||
| Healthcare Revenue - Hospitals – continued | ||||
| Maryland Health & Higher Educational Facilities Authority Rev. (LifeBridge Health), 4%, 7/01/2042 | $ | 1,000,000 | $861,331 | |
| Maryland Health & Higher Educational Facilities Authority Rev. (Medlantic/Helix Parent, Inc.), ”A“, AGM, 5.25%, 8/15/2038 | 1,155,000 | 1,217,292 | ||
| Maryland Health & Higher Educational Facilities Authority Rev. (MedStar Health), 5%, 8/15/2033 | 1,030,000 | 1,040,633 | ||
| Maryland Health & Higher Educational Facilities Authority Rev. (MedStar Health), ”A“, 5%, 8/15/2041 | 505,000 | 490,305 | ||
| Maryland Health & Higher Educational Facilities Authority Rev. (MedStar Health), ”A“, 5%, 5/15/2042 | 750,000 | 745,718 | ||
| Maryland Health & Higher Educational Facilities Authority Rev. (Mercy Medical Center), ”A“, 5%, 7/01/2032 | 600,000 | 604,536 | ||
| Maryland Health & Higher Educational Facilities Authority Rev. (Meritus Medical Center), 5%, 7/01/2027 | 500,000 | 503,189 | ||
| Maryland Health & Higher Educational Facilities Authority Rev. (Peninsula Regional Health System), ”A“, 5%, 7/01/2033 | 1,205,000 | 1,236,775 | ||
| Maryland Health & Higher Educational Facilities Authority Rev. (Peninsula Regional Health System), ”A“, 5%, 7/01/2035 | 500,000 | 512,806 | ||
| Maryland Health & Higher Educational Facilities Authority Rev. (Trinity Health Credit Group), ”MD“, 5%, 12/01/2046 | 1,000,000 | 1,004,491 | ||
| Maryland Health & Higher Educational Facilities Authority Rev. (University of Maryland Medical System), ”B“, 5%, 7/01/2034 | 1,000,000 | 1,027,916 | ||
| Maryland Health & Higher Educational Facilities Authority Rev. (University of Maryland Medical System), ”D“, 4%, 7/01/2048 | 1,250,000 | 1,056,669 | ||
| Maryland Health & Higher Educational Facilities Authority Rev. (Western Maryland Health System), 5.25%, 7/01/2034 (Prerefunded 7/01/2024) | 1,000,000 | 1,007,804 | ||
| Montgomery County, MD, Rev. (Trinity Health Credit Group), 5%, 12/01/2045 | 1,240,000 | 1,242,302 | ||
| New York Dormitory Authority Rev. (Norwell Health Obligated Group), ”A“, 4.25%, 5/01/2052 | 590,000 | 508,448 | ||
| Spartanburg County, SC, Regional Health Services District Hospital Rev., ”A“, 4%, 4/15/2043 | 635,000 | 538,179 | ||
| $19,488,492 | ||||
| Healthcare Revenue - Long Term Care – 2.9% | ||||
| Baltimore County, MD, Rev. (Oak Crest Village, Inc.), 4%, 1/01/2045 | $ | 1,000,000 | $812,632 | |
| Baltimore County, MD, Rev. (Riderwood Village, Inc.), 4%, 1/01/2038 | 450,000 | 396,836 | ||
| Howard County, MD, Retirement Community Rev. (Vantage House Facility), 5%, 4/01/2036 | 500,000 | 431,104 | ||
| Maryland Health & Higher Educational Facilities Authority Rev. (Charlestown Community Project), ”A“, 5%, 1/01/2045 | 500,000 | 489,302 | ||
| Rockville, MD, Mayor & Council Economic Development Rev. (Ingleside at King Farm Project), ”B“, 5%, 11/01/2042 | 350,000 | 292,379 | ||
| Washington County, MD, County Commissioners Rev. (Diakon Lutheran Social Ministries Project), ”B“, 5%, 1/01/2032 | 575,000 | 612,656 | ||
| Westminster, MD, Refunding Rev. (Carroll Lutheran Village, Inc.), 5.125%, 7/01/2040 | 400,000 | 402,906 | ||
| $3,437,815 | ||||
| Healthcare Revenue - Other – 0.3% | ||||
| Maryland Economic Development Corp., Economic Development Rev. (Lutheran World Relief Refugee), 5.25%, 4/01/2029 | $ | 370,000 | $370,086 | |
| Industrial Revenue - Paper – 0.1% | ||||
| Valparaiso, IN, Exempt Facilities Rev. (Pratt Paper LLC Project), 7%, 1/01/2044 | $ | 100,000 | $100,652 | |
| Miscellaneous Revenue - Other – 2.4% | ||||
| Baltimore, MD, Convention Center Hotel Rev., 5%, 9/01/2025 | $ | 20,000 | $19,696 | |
| Baltimore, MD, Convention Center Hotel Rev., 5%, 9/01/2034 | 85,000 | 80,790 | ||
| Baltimore, MD, Convention Center Hotel Rev., 5%, 9/01/2042 | 70,000 | 60,135 | ||
| Maryland Economic Development Corp., Air Cargo Obligated Group Rev. (AFCO Airport Real Estate Group), 5%, 7/01/2028 | 90,000 | 90,529 | ||
| Maryland Economic Development Corp., Air Cargo Obligated Group Rev. (AFCO Airport Real Estate Group), 5%, 7/01/2029 | 210,000 | 211,531 | ||
| Maryland Economic Development Corp., Air Cargo Obligated Group Rev. (AFCO Airport Real Estate Group), 4%, 7/01/2039 | 1,100,000 | 928,727 | ||
| Matching Fund Special Purpose Securitization Corp., ”A“, 5%, 10/01/2026 | 40,000 | 40,152 | ||
| Montgomery County, MD, Transportation Fund Lease Authority Rev., ”A“, 5%, 11/01/2036 | 415,000 | 418,803 | ||
| New York Liberty Development Corp., Liberty Rev. (3 World Trade Center Project), ”1“, 5%, 11/15/2044 (n) | 240,000 | 221,723 | ||
| New York, NY, Industrial Development Agency, Airport Facilities Rev. (Transportation Infrastructure Properties LLC), 5%, 7/01/2028 | 390,000 | 384,987 | ||
| Pennsylvania Economic Development Financing Authority, Private Activity Rev. (PennDOT Major Bridges Package One Project), AGM, 5%, 12/31/2057 | 490,000 | 471,977 | ||
| $2,929,050 | ||||
| Multi-Family Housing Revenue – 8.5% | ||||
| Howard County, MD, Housing Commission Rev. (Beech's Farm Apartments), VRDN, 3.19%, 11/30/2062 | $ | 3,000,000 | $3,000,000 | |
| Howard County, MD, Housing Commission Rev. (Columbia Commons Apartments), ”A“, 5%, 6/01/2044 | 500,000 | 497,180 | ||
| Howard County, MD, Housing Commission Rev. (Woodfield Oxford Square Apartments), 5%, 12/01/2037 | 750,000 | 763,108 | ||
| Maryland Community Development Administration, Department of Housing & Community Development Housing Rev., ”A“, FHA, 4%, 7/01/2048 | 500,000 | 405,157 | ||
| Maryland Community Development Administration, Department of Housing & Community Development Housing Rev., ”B“, 3.65%, 7/01/2049 | 505,000 | 416,122 | ||
37
Portfolio of Investments (unaudited) –
continued
| Issuer | Shares/Par | Value ($) | ||
| Municipal Bonds – continued | ||||
| Multi-Family Housing Revenue – continued | ||||
| Maryland Community Development Administration, Department of Housing & Community Development Housing Rev., ”D“, 3.35%, 7/01/2049 | $ | 1,765,000 | $1,321,917 | |
| Montgomery County, MD, Housing Opportunities Commission, Multi-Family Housing Development Rev., ”A“, 4.85%, 7/01/2053 | 500,000 | 455,352 | ||
| Montgomery County, MD, Housing Opportunities Commission, Multi-Family Housing Development Rev., ”A-1“, FHA, 3.05%, 7/01/2044 | 1,000,000 | 715,277 | ||
| Montgomery County, MD, Housing Opportunities Commission, Multi-Family Housing Development Rev., ”C“, 5.125%, 7/01/2037 | 1,000,000 | 1,017,585 | ||
| Montgomery County, MD, Housing Opportunities Commission, Multi-Family Housing Development Rev., “C”, 3.1%, 7/01/2036 | 1,065,000 | 881,036 | ||
| New Hampshire National Finance Authority Municipal Certificates, ”1-A“, 4.375%, 9/20/2036 | 283,356 | 262,383 | ||
| New York, NY, Housing Development Corp., Multi-Family Housing Rev. (Sustainable Development Bonds), “G”, FHA, 2.45%, 11/01/2045 | 765,000 | 483,496 | ||
| $10,218,613 | ||||
| Parking – 1.2% | ||||
| Maryland Health & Higher Educational Facilities Authority Rev. (Johns Hopkins Medical Institutions), AAC, 5%, 7/01/2034 | $ | 1,385,000 | $1,394,082 | |
| Port Revenue – 1.2% | ||||
| Maryland Economic Development Corp. Rev. (Terminal Project), ”A“, 5%, 6/01/2044 | $ | 500,000 | $478,620 | |
| Maryland Economic Development Corp. Rev. (Terminal Project), ”A“, 5%, 6/01/2049 | 250,000 | 233,610 | ||
| Maryland Economic Development Corp. Rev. (Transportation Facilities Project), ”A“, 5%, 6/01/2031 | 650,000 | 661,616 | ||
| New York Liberty Development Corp., Liberty Refunding Rev. (1 World Trade Center Project), 2.75%, 2/15/2044 | 190,000 | 125,525 | ||
| $1,499,371 | ||||
| Sales & Excise Tax Revenue – 2.3% | ||||
| Guam Government Business Privilege Tax Refunding, ”F“, 5%, 1/01/2030 | $ | 5,000 | $4,985 | |
| Guam Government Business Privilege Tax Refunding, ”F“, 5%, 1/01/2031 | 10,000 | 9,935 | ||
| Guam Government Business Privilege Tax Refunding, ”F“, 4%, 1/01/2042 | 75,000 | 60,697 | ||
| Puerto Rico Sales Tax Financing Corp., Restructured Sales Tax Rev., ”2019A-1“, 4.55%, 7/01/2040 | 21,000 | 19,322 | ||
| Puerto Rico Sales Tax Financing Corp., Restructured Sales Tax Rev., ”2019A-1“, 4.75%, 7/01/2053 | 81,000 | 71,609 | ||
| Puerto Rico Sales Tax Financing Corp., Restructured Sales Tax Rev., ”2019A-1“, 5%, 7/01/2058 | 1,276,000 | 1,154,248 | ||
| Puerto Rico Sales Tax Financing Corp., Restructured Sales Tax Rev., ”2019A-2“, 4.329%, 7/01/2040 | 160,000 | 143,306 | ||
| Puerto Rico Sales Tax Financing Corp., Restructured Sales Tax Rev., ”2019A-2“, 4.329%, 7/01/2040 | 75,000 | 67,175 | ||
| Puerto Rico Sales Tax Financing Corp., Restructured Sales Tax Rev., ”2019A-2“, 4.784%, 7/01/2058 | 267,000 | 233,049 | ||
| Puerto Rico Sales Tax Financing Corp., Restructured Sales Tax Rev., Capital Appreciation, ”2019A-1“, 0%, 7/01/2024 | 1,000 | 968 | ||
| Puerto Rico Sales Tax Financing Corp., Restructured Sales Tax Rev., Capital Appreciation, ”2019A-1“, 0%, 7/01/2027 | 36,000 | 30,653 | ||
| Puerto Rico Sales Tax Financing Corp., Restructured Sales Tax Rev., Capital Appreciation, ”2019A-1“, 0%, 7/01/2029 | 6,000 | 4,665 | ||
| Puerto Rico Sales Tax Financing Corp., Restructured Sales Tax Rev., Capital Appreciation, ”2019A-1“, 0%, 7/01/2031 | 338,000 | 239,449 | ||
| Puerto Rico Sales Tax Financing Corp., Restructured Sales Tax Rev., Capital Appreciation, ”2019A-1“, 0%, 7/01/2033 | 332,000 | 212,729 | ||
| Puerto Rico Sales Tax Financing Corp., Restructured Sales Tax Rev., Capital Appreciation, ”2019A-1“, 0%, 7/01/2046 | 1,467,000 | 378,175 | ||
| Wisconsin Public Finance Authority Limited Obligation Grant Rev. (American Dream at Meadowlands Project), ”A“, 6.25%, 8/01/2027 (a)(d)(n) | 120,000 | 91,650 | ||
| $2,722,615 | ||||
| Secondary Schools – 0.2% | ||||
| District of Columbia Rev. (Rocketship D.C.), ”A“, 5%, 6/01/2039 (n) | $ | 250,000 | $224,118 | |
| Single Family Housing - Local – 0.9% | ||||
| Montgomery County, MD, Housing Opportunities Commission (Single Family Mortgage Rev.), ”A“, FHA, 5.75%, 7/01/2054 | $ | 1,000,000 | $1,045,438 | |
| Single Family Housing - State – 6.1% | ||||
| Maryland Community Development Administration, Department of Housing & Community Development Housing Rev., ”B“, 2.1%, 9/01/2041 | $ | 1,500,000 | $934,669 | |
| Maryland Community Development Administration, Department of Housing & Community Development Residential Rev., ”A“, GNMA, 4.45%, 9/01/2043 | 500,000 | 467,461 | ||
| Maryland Community Development Administration, Department of Housing & Community Development Residential Rev., ”A“, GNMA, 5.5%, 9/01/2053 | 1,000,000 | 1,032,496 | ||
| Maryland Community Development Administration, Department of Housing & Community Development Residential Rev., ”C“, 2.1%, 3/01/2033 | 250,000 | 199,494 | ||
| Maryland Community Development Administration, Department of Housing & Community Development Residential Rev., ”C“, 3%, 9/01/2051 | 940,000 | 882,290 | ||
38
Portfolio of Investments (unaudited) –
continued
| Issuer | Shares/Par | Value ($) | ||
| Municipal Bonds – continued | ||||
| Single Family Housing - State – continued | ||||
| Maryland Community Development Administration, Department of Housing & Community Development Residential Rev., ”D“, 5.05%, 3/01/2047 | $ | 1,000,000 | $993,385 | |
| Maryland Community Development Administration, Department of Housing & Community Development Residential Rev., ”D“, 6%, 3/01/2053 | 985,000 | 1,030,551 | ||
| Maryland Community Development Administration, Department of Housing & Community Development Residential Rev., “C”, 3%, 9/01/2039 | 1,000,000 | 788,567 | ||
| West Virginia Housing Development Fund Finance Bonds, ”C“, 4.85%, 11/01/2052 | 1,000,000 | 971,463 | ||
| $7,300,376 | ||||
| State & Local Agencies – 9.1% | ||||
| Maryland Stadium Authority Rev., Baltimore City Public Schools Construction and Revitalization Program, 5%, 5/01/2041 (Prerefunded 5/01/2026) | $ | 500,000 | $516,584 | |
| Maryland Stadium Authority Rev., Baltimore City Public Schools Construction and Revitalization Program, ”A“, 5%, 5/01/2038 | 500,000 | 513,499 | ||
| Maryland Stadium Authority Rev., Baltimore City Public Schools Construction and Revitalization Program, Capital Appreciation, ”C“, 0%, 5/01/2054 | 2,000,000 | 377,643 | ||
| Maryland Stadium Authority, Built to Learn Rev., 4%, 6/01/2046 | 1,405,000 | 1,226,300 | ||
| Maryland Stadium Authority, Built to Learn Rev., ”A“, 4%, 6/01/2036 | 1,000,000 | 955,083 | ||
| Maryland Stadium Authority, Built to Learn Rev., ”A“, 4%, 6/01/2041 | 1,500,000 | 1,355,798 | ||
| Maryland Stadium Authority, Hagerstown Multi-Use Sports & Events Facility Lease Rev., ”A“, 5%, 6/01/2052 | 1,000,000 | 1,024,164 | ||
| Prince George's County, MD, COP (Suitland Public Infrastructure), 3%, 10/01/2038 | 1,000,000 | 812,463 | ||
| Prince George's County, MD, COP (University of Maryland Capital Region Medical Center), 5%, 10/01/2037 | 1,000,000 | 1,034,490 | ||
| Prince George's County, MD, COP (University of Maryland Capital Region Medical Center), 5%, 10/01/2048 | 1,500,000 | 1,512,986 | ||
| Washington, D.C., Metropolitan Area Transit Authority Dedicated Rev. (Green Bonds - Climate Bond Certified), ”A“, 5%, 7/15/2040 | 1,500,000 | 1,581,521 | ||
| $10,910,531 | ||||
| Student Loan Revenue – 0.5% | ||||
| Iowa Student Loan Liquidity Corp. Rev., ”B“, 3.5%, 12/01/2044 | $ | 115,000 | $83,624 | |
| New Jersey Higher Education Student Assistance Authority, Senior Student Loan Rev., ”B“, 4%, 12/01/2041 | 490,000 | 463,509 | ||
| $547,133 | ||||
| Tax - Other – 1.7% | ||||
| Chicago, IL, Board of Education, Dedicated Capital Improvement Tax Bond, 5%, 4/01/2045 | $ | 85,000 | $83,903 | |
| Chicago, IL, Board of Education, Dedicated Capital Improvement Tax Bond, 5.75%, 4/01/2048 | 225,000 | 235,552 | ||
| New York, NY, Transitional Finance Authority Rev., ”C-1“, 4%, 5/01/2045 | 850,000 | 760,641 | ||
| St. Clair County, AL, Board of Education, Special Tax School Warrants (15 Mill Moody Tax), ”A“, BAM, 4.125%, 2/01/2048 | 500,000 | 441,798 | ||
| Triborough Bridge & Tunnel Authority Rev., NY, Payroll Mobility Tax (MTA Bridges and Tunnels), ”C-3“, 3%, 5/15/2051 | 600,000 | 403,817 | ||
| Wisconsin Public Finance Authority Limited Obligation PILOT Rev. (American Dream at Meadowlands Project), 7%, 12/01/2050 | 100,000 | 88,977 | ||
| $2,014,688 | ||||
| Tax Assessment – 3.6% | ||||
| Baltimore, MD, Special Obligation (East Baltimore Research Park Project), ”A“, 5%, 9/01/2038 | $ | 500,000 | $477,469 | |
| Baltimore, MD, Special Obligation Rev. (Harbor Point Project), ”B“, 3.875%, 6/01/2046 (n) | 300,000 | 227,101 | ||
| Brunswick, MD, Special Obligation Refunding (Brunswick Crossing Special Taxing District), 5%, 7/01/2036 | 500,000 | 488,481 | ||
| Frederick County, MD, Limited Obligation (Jefferson Technology Park Project), ”B“, 4.625%, 7/01/2043 (n) | 250,000 | 226,631 | ||
| Frederick County, MD, Limited Obligation (Oakdale-Lake Linganore Project), 3.75%, 7/01/2039 | 500,000 | 410,176 | ||
| Frederick County, MD, Senior Special Obligation (Urbana Community Development Authority), ”B“, 4%, 7/01/2040 | 180,000 | 155,671 | ||
| Frederick County, MD, Senior Special Obligation Refunding (Urbana Community Development Authority), ”A“, 5%, 7/01/2026 | 820,000 | 836,125 | ||
| Frederick County, MD, Special Tax Limited Obligation Refunding (Jefferson Technology Park Project), ”A“, 5%, 7/01/2043 (n) | 250,000 | 230,790 | ||
| Howard County, MD, Special Obligation (Annapolis Junction Town Center Project), 6.1%, 2/15/2044 | 230,000 | 225,309 | ||
| Howard County, MD, Special Obligation (Downtown Columbia Project), ”A“, 4.5%, 2/15/2047 (n) | 300,000 | 254,839 | ||
| Maryland Economic Development Corp., Special Obligation (Port Covington Project), 4%, 9/01/2050 (n) | 500,000 | 379,229 | ||
| Prince George's County, MD, Special Obligation (Westphalia Town Center Project), 5.25%, 7/01/2048 (n) | 400,000 | 367,954 | ||
| $4,279,775 | ||||
| Tobacco – 0.9% | ||||
| Buckeye, OH, Tobacco Settlement Financing Authority Senior Asset-Backed Refunding, 2020A-2, ”1“, 4%, 6/01/2048 | $ | 410,000 | $346,318 | |
| Buckeye, OH, Tobacco Settlement Financing Authority Senior Asset-Backed Refunding, 2020B-2, ”2“, 5%, 6/01/2055 | 500,000 | 430,705 | ||
39
Portfolio of Investments (unaudited) –
continued
| Issuer | Shares/Par | Value ($) | ||
| Municipal Bonds – continued | ||||
| Tobacco – continued | ||||
| Golden State, CA, Tobacco Securitization Corp., Tobacco Settlement Rev., Taxable, ”B-1“, 3.85%, 6/01/2050 | $ | 365,000 | $331,075 | |
| $1,108,098 | ||||
| Toll Roads – 1.1% | ||||
| Metropolitan Washington, D.C., Airport Authority, Dulles Toll Road Rev. (Dulles Metrorail and Capital Improvement Projects), ”A“, AGM, 4%, 10/01/2052 | $ | 500,000 | $430,466 | |
| Virginia Small Business Financing Authority Senior Lien Refunding Rev. (95 Express Lanes LLC Project), 5%, 1/01/2035 | 915,000 | 948,139 | ||
| $1,378,605 | ||||
| Transportation - Special Tax – 6.2% | ||||
| Maryland Department of Transportation, Consolidated Transportation, 5%, 10/01/2026 | $ | 1,335,000 | $1,387,079 | |
| Maryland Department of Transportation, Consolidated Transportation, 4%, 12/15/2029 | 1,500,000 | 1,492,230 | ||
| Maryland Department of Transportation, Consolidated Transportation Refunding, ”A“, 5%, 12/01/2025 | 1,080,000 | 1,109,882 | ||
| Maryland Department of Transportation, Consolidated Transportation, ”A“, 3%, 10/01/2033 | 500,000 | 447,962 | ||
| Metropolitan Transportation Authority, NY, Refunding Rev. (Climate Bond Certified), ”E“, 4%, 11/15/2045 | 1,000,000 | 846,235 | ||
| New Jersey Transportation Trust Fund Authority, ”CC“, 5.5%, 6/15/2050 | 75,000 | 79,021 | ||
| Washington, D.C., Metropolitan Area Transit Authority Gross Rev., 5%, 7/01/2037 | 440,000 | 449,221 | ||
| Washington, D.C., Metropolitan Area Transit Authority Gross Rev., 5%, 7/01/2038 | 440,000 | 447,453 | ||
| Washington, D.C., Metropolitan Area Transit Authority Gross Rev., ”B“, 5%, 7/01/2042 | 1,140,000 | 1,154,713 | ||
| $7,413,796 | ||||
| Universities - Colleges – 4.2% | ||||
| Maryland Health & Higher Educational Facilities Authority Rev. (Goucher College), ”A“, 5%, 7/01/2044 | $ | 500,000 | $491,487 | |
| Maryland Health & Higher Educational Facilities Authority Rev. (Loyola University Maryland), 5%, 10/01/2032 | 500,000 | 505,650 | ||
| Maryland Health & Higher Educational Facilities Authority Rev. (Loyola University Maryland), “A”, 5%, 10/01/2049 | 1,000,000 | 1,001,109 | ||
| Maryland Health & Higher Educational Facilities Authority Rev. (Maryland Institute College of Art Issue), 5%, 6/01/2033 | 450,000 | 454,514 | ||
| Maryland Health & Higher Educational Facilities Authority Rev. (Stevenson University), “A”, 4%, 6/01/2046 | 750,000 | 625,119 | ||
| Maryland Health & Higher Educational Facilities Authority Rev. (Stevenson University), “A”, 4%, 6/01/2051 | 250,000 | 201,465 | ||
| Massachusetts Development Finance Agency Rev. (Suffolk University), 4%, 7/01/2051 | 420,000 | 317,938 | ||
| Puerto Rico Industrial, Tourist, Educational, Medical & Environmental Control Facilities Financing Authority, Higher Education Rev. (International American University of Puerto Rico Project), 5%, 10/01/2031 | 75,000 | 75,052 | ||
| University System of Maryland, Auxiliary Facility & Tuition Rev., ”A“, 5%, 4/01/2028 | 1,205,000 | 1,277,394 | ||
| Virginia College Building Authority, Educational Facilities Rev. (Marymount University Project), ”B“, 5.25%, 7/01/2035 (n) | 110,000 | 107,448 | ||
| $5,057,176 | ||||
| Universities - Dormitories – 2.0% | ||||
| Maryland Economic Development Corp., Senior Student Housing Rev. (University of Maryland, College Park Projects), AGM, 5%, 6/01/2035 | $ | 750,000 | $764,195 | |
| Maryland Economic Development Corp., Student Housing Rev. (Morgan State University Project), 5%, 7/01/2050 | 1,000,000 | 969,798 | ||
| Maryland Economic Development Corp., Student Housing Rev. (Salisbury University Project), 5%, 6/01/2027 | 410,000 | 409,977 | ||
| Maryland Economic Development Corp., Student Housing Rev. (Salisbury University Project), 5%, 6/01/2030 | 300,000 | 297,969 | ||
| $2,441,939 | ||||
| Utilities - Electric Power – 0.3% | ||||
| Texas Municipal Power Agency, Transmission System Rev., AGM, 2%, 9/01/2033 | $ | 555,000 | $409,487 | |
| Utilities - Municipal Owned – 0.3% | ||||
| Puerto Rico Electric Power Authority Refunding Rev., ”DDD“, 5%, 7/01/2020 (a)(d) | $ | 10,000 | $2,500 | |
| Puerto Rico Electric Power Authority Refunding Rev., ”DDD“, 5%, 7/01/2021 (a)(d) | 100,000 | 25,000 | ||
| Puerto Rico Electric Power Authority Refunding Rev., ”DDD“, 5%, 7/01/2022 (a)(d) | 160,000 | 40,000 | ||
| Puerto Rico Electric Power Authority Refunding Rev., ”VV“, NPFG, 5.25%, 7/01/2034 | 10,000 | 9,862 | ||
| Puerto Rico Electric Power Authority Rev., ”A“, 5%, 7/01/2029 (a)(d) | 250,000 | 62,500 | ||
| Puerto Rico Electric Power Authority Rev., ”A“, 5%, 7/01/2042 (a)(d) | 40,000 | 10,000 | ||
| Puerto Rico Electric Power Authority Rev., ”AAA“, 5.25%, 7/01/2021 (a)(d) | 20,000 | 5,000 | ||
| Puerto Rico Electric Power Authority Rev., ”AAA“, 5.25%, 7/01/2030 (a)(d) | 10,000 | 2,500 | ||
| Puerto Rico Electric Power Authority Rev., ”CCC“, 5.25%, 7/01/2027 (a)(d) | 95,000 | 23,750 | ||
| Puerto Rico Electric Power Authority Rev., ”TT“, 5%, 7/01/2021 (a)(d) | 45,000 | 11,250 | ||
| Puerto Rico Electric Power Authority Rev., ”TT“, 5%, 7/01/2023 (a)(d) | 40,000 | 10,000 | ||
| Puerto Rico Electric Power Authority Rev., ”TT“, 5%, 7/01/2027 (a)(d) | 10,000 | 2,500 | ||
40
Portfolio of Investments (unaudited) –
continued
| Issuer | Shares/Par | Value ($) | ||
| Municipal Bonds – continued | ||||
| Utilities - Municipal Owned – continued | ||||
| Puerto Rico Electric Power Authority Rev., ”TT“, 5%, 7/01/2037 (a)(d) | $ | 125,000 | $31,250 | |
| Puerto Rico Electric Power Authority Rev., ”WW“, 5.375%, 7/01/2022 (a)(d) | 10,000 | 2,500 | ||
| Puerto Rico Electric Power Authority Rev., ”WW“, 5.25%, 7/01/2025 (a)(d) | 20,000 | 5,000 | ||
| Puerto Rico Electric Power Authority Rev., ”ZZ“, 5%, 7/01/2018 (a)(d) | 60,000 | 15,000 | ||
| Puerto Rico Electric Power Authority Rev., ”ZZ“, 5.25%, 7/01/2023 (a)(d) | 65,000 | 16,250 | ||
| Puerto Rico Electric Power Authority Rev., ”ZZ“, 5.25%, 7/01/2024 (a)(d) | 20,000 | 5,000 | ||
| Puerto Rico Electric Power Authority Rev., ”ZZ“, 5.25%, 7/01/2026 (a)(d) | 65,000 | 16,250 | ||
| Puerto Rico Electric Power Authority Rev., Taxable, ”EEE“, 6.05%, 7/01/2032 (a)(d) | 50,000 | 12,500 | ||
| $308,612 | ||||
| Utilities - Other – 3.0% | ||||
| Black Belt Energy Gas District, AL, Gas Project Rev., ”A“, 4%, 6/01/2051 (Put Date 12/01/2031) | $ | 375,000 | $353,579 | |
| Black Belt Energy Gas District, AL, Gas Project Rev., ”C-1“, 5.25%, 2/01/2053 (Put Date 6/01/2029) | 745,000 | 755,994 | ||
| California Community Choice Financing Authority, Clean Energy Project Rev., ”C“, 5.25%, 1/01/2054 (Put Date 10/01/2031) | 720,000 | 718,302 | ||
| Southeast Alabama Energy Authority Commodity Supply Rev. (Project No. 5), ”A“, 5.25%, 1/01/2054 (Put Date 7/01/2029) | 665,000 | 669,316 | ||
| Tennergy Corp., TN, Gas Supply Rev., ”A“, 5.5%, 10/01/2053 (Put Date 12/01/2030) | 410,000 | 416,419 | ||
| Tennessee Energy Acquisition Corp., Gas Project Rev., ”A-1“, 5%, 5/01/2053 (Put Date 5/01/2028) | 650,000 | 648,489 | ||
| $3,562,099 | ||||
| Water & Sewer Utility Revenue – 3.4% | ||||
| Baltimore, MD, Project Rev. (Mayor and City Council of Baltimore Water Projects), ”A“, 4%, 7/01/2038 | $ | 550,000 | $514,671 | |
| Baltimore, MD, Project Rev. (Stormwater Projects), ”A“, 5%, 7/01/2049 | 1,000,000 | 1,018,999 | ||
| Baltimore, MD, Refunding Rev. (Mayor and City Council of Baltimore Water Projects), ”B“, 5%, 7/01/2042 (Prerefunded 1/01/2024) | 1,320,000 | 1,322,866 | ||
| Guam Waterworks Authority Rev. (Water and Wastewater System), 5%, 7/01/2036 | 20,000 | 20,001 | ||
| Guam Waterworks Authority Rev. (Water and Wastewater System), 5%, 1/01/2046 | 105,000 | 98,960 | ||
| Guam Waterworks Authority Rev. (Water and Wastewater System), ”A“, 5%, 7/01/2029 | 205,000 | 205,353 | ||
| Guam Waterworks Authority Rev. (Water and Wastewater System), ”A“, 5%, 7/01/2035 | 205,000 | 205,124 | ||
| Guam Waterworks Authority Rev. (Water and Wastewater System), ”A“, 5%, 1/01/2050 | 130,000 | 120,477 | ||
| Michigan Finance Authority Local Government Loan Program Rev. (Detroit Water and Sewerage Department Sewage Disposal System Rev. Refunding Second Lien Local Project), ”C-7“, NPFG, 5%, 7/01/2032 | 25,000 | 25,143 | ||
| Michigan Finance Authority Local Government Loan Program Rev. (Detroit Water and Sewerage Department Water Supply System Rev. Refunding Second Lien Local Project), ”D-6“, NPFG, 5%, 7/01/2036 | 30,000 | 30,066 | ||
| Michigan Finance Authority Local Government Loan Program Rev. (Detroit Water and Sewerage Department Water Supply System Rev. Refunding Senior Lien Local Project), ”D-1“, AGM, 5%, 7/01/2035 | 15,000 | 15,071 | ||
| Michigan Finance Authority Local Government Loan Program Rev. (Detroit Water and Sewerage Department Water Supply System Rev. Refunding Senior Lien Local Project), ”D-1“, AGM, 5%, 7/01/2037 | 35,000 | 35,095 | ||
| Mississippi Development Bank Special Obligation (Jackson Water and Sewer System Rev. Bond Project), AGM, 6.875%, 12/01/2040 | 50,000 | 50,154 | ||
| Texas Water Development Board State Water Implementation Rev., ”A“, 5%, 10/15/2058 (w) | 380,000 | 390,653 | ||
| $4,052,633 | ||||
| Total Municipal Bonds (Identified Cost, $126,733,376) | $117,156,222 | |||
| Bonds – 0.2% | ||||
| Consumer Services – 0.2% | ||||
| Toll Road Investors Partnership II LP, Capital Appreciation, NPFG, 0%, 2/15/2025 (n) | $ | 165,000 | $148,573 | |
| Toll Road Investors Partnership II LP, Capital Appreciation, NPFG, 0%, 2/15/2043 (n) | 378,198 | 124,327 | ||
| Total Bonds (Identified Cost, $298,629) | $272,900 | |||
| Contingent Value Instruments – 0.1% | ||||
| General Obligations - General Purpose – 0.1% | ||||
| Commonwealth of Puerto Rico, General Obligation Contingent Value Instrument, 11/01/2043 (Identified Cost, $116,515) | $ | 196,379 | $101,872 | |
41
Portfolio of Investments (unaudited) –
continued
| Issuer | Shares/Par | Value ($) | ||
| Investment Companies (h) – 0.8% | ||||
| Money Market Funds – 0.8% | ||||
| MFS Institutional Money Market Portfolio, 5.4% (v) (Identified Cost, $958,107) | 958,044 | $958,236 | ||
| Other Assets, Less Liabilities – 1.2% | 1,466,348 | |||
| Net Assets – 100.0% | $119,955,578 | |||
See Portfolio Footnotes and Notes to
Financial Statements
42
Portfolio of Investments (unaudited) –
continued
MFS Massachusetts Municipal
Bond Fund
| Issuer | Shares/Par | Value ($) | ||
| Municipal Bonds – 98.4% | ||||
| Airport Revenue – 6.0% | ||||
| Denver, CO, City & County Airport System Rev., ”A“, 4.125%, 11/15/2047 | $ | 265,000 | $230,973 | |
| Denver, CO, City & County Airport System Rev., ”A“, 4.125%, 11/15/2053 | 250,000 | 212,122 | ||
| Massachusetts Port Authority Rev., ”A“, 5%, 7/01/2038 | 2,000,000 | 2,027,500 | ||
| Massachusetts Port Authority Rev., ”A“, 5%, 7/01/2040 | 2,755,000 | 2,777,718 | ||
| Massachusetts Port Authority Rev., ”A“, 5%, 7/01/2042 | 3,000,000 | 3,000,425 | ||
| Massachusetts Port Authority Rev., ”A“, 5%, 7/01/2042 | 3,455,000 | 3,468,456 | ||
| Massachusetts Port Authority Rev., ”A“, 5%, 7/01/2047 | 1,500,000 | 1,485,148 | ||
| Massachusetts Port Authority Rev., ”B“, 5%, 7/01/2043 | 3,625,000 | 3,615,601 | ||
| Massachusetts Port Authority Rev., ”C“, 5%, 7/01/2044 | 3,000,000 | 2,998,335 | ||
| Massachusetts Port Authority Rev., ”E“, 5%, 7/01/2051 | 3,055,000 | 3,020,709 | ||
| $22,836,987 | ||||
| General Obligations - General Purpose – 20.4% | ||||
| Ashland, MA, General Obligation Purpose Loan, Unlimited Tax, 4%, 8/01/2040 | $ | 1,830,000 | $1,766,258 | |
| Ashland, MA, General Obligation Purpose Loan, Unlimited Tax, 4%, 8/01/2041 | 1,905,000 | 1,798,551 | ||
| Ashland, MA, General Obligation Purpose Loan, Unlimited Tax, 4%, 8/01/2042 | 1,980,000 | 1,848,956 | ||
| Attleboro, MA, General Obligation School Construction Bond Anticipation Notes, 5%, 11/01/2023 | 8,800,000 | 8,807,135 | ||
| Bridgeview, IL, Stadium and Redevelopment Projects, Taxable, AAC, 5.14%, 12/01/2036 | 705,000 | 608,609 | ||
| Brockton, MA, Public Safety Facility, General Obligation, 4%, 8/01/2052 | 4,000,000 | 3,464,937 | ||
| Chicago, IL, General Obligation, ”A“, 5%, 1/01/2025 | 535,000 | 539,161 | ||
| Commonwealth of Massachusetts, ”A“, 5%, 5/01/2048 | 4,000,000 | 4,153,202 | ||
| Commonwealth of Massachusetts, ”B“, 5.25%, 8/01/2028 | 2,225,000 | 2,408,457 | ||
| Commonwealth of Massachusetts, General Obligation Consolidated Loan, ”C“, 5%, 5/01/2029 | 1,410,000 | 1,411,040 | ||
| Commonwealth of Massachusetts, General Obligation Consolidated Loan, ”E“, 5%, 11/01/2049 | 3,000,000 | 3,102,026 | ||
| Commonwealth of Massachusetts, General Obligation Consolidated Loan, ”F“, 5%, 11/01/2042 | 3,000,000 | 3,068,271 | ||
| Commonwealth of Massachusetts, General Obligation Consolidated Loan, ”I“, 5%, 12/01/2034 | 1,000,000 | 1,038,363 | ||
| Commonwealth of Puerto Rico, General Obligation Restructured Bonds, Capital Appreciation, Series 2022A, 0%, 7/01/2024 | 23,374 | 22,579 | ||
| Commonwealth of Puerto Rico, General Obligation Restructured Bonds, Capital Appreciation, Series 2022A, 0%, 7/01/2033 | 184,909 | 108,979 | ||
| Commonwealth of Puerto Rico, General Obligation Restructured Bonds, Series 2022A, 5.625%, 7/01/2027 | 158,576 | 162,725 | ||
| Commonwealth of Puerto Rico, General Obligation Restructured Bonds, Series 2022A, 5.625%, 7/01/2029 | 156,003 | 161,199 | ||
| Commonwealth of Puerto Rico, General Obligation Restructured Bonds, Series 2022A, 5.75%, 7/01/2031 | 343,525 | 358,750 | ||
| Commonwealth of Puerto Rico, General Obligation Restructured Bonds, Series 2022A, 4%, 7/01/2033 | 143,685 | 128,790 | ||
| Commonwealth of Puerto Rico, General Obligation Restructured Bonds, Series 2022A, 4%, 7/01/2035 | 282,284 | 245,319 | ||
| Commonwealth of Puerto Rico, General Obligation Restructured Bonds, Series 2022A, 4%, 7/01/2037 | 110,848 | 93,050 | ||
| Commonwealth of Puerto Rico, General Obligation Restructured Bonds, Series 2022A, 4%, 7/01/2041 | 150,711 | 121,174 | ||
| Commonwealth of Puerto Rico, General Obligation Restructured Bonds, Series 2022A, 4%, 7/01/2046 | 516,737 | 398,394 | ||
| Fall River, MA, General Obligation Anticipation Notes, 4%, 2/02/2024 | 4,496,686 | 4,496,744 | ||
| Framingham, MA, General Obligation Purpose Loan, 5%, 8/01/2040 | 1,060,000 | 1,117,288 | ||
| Framingham, MA, General Obligation Purpose Loan, 5%, 8/01/2041 | 1,095,000 | 1,146,722 | ||
| Framingham, MA, General Obligation Purpose Loan, 5%, 8/01/2042 | 1,130,000 | 1,178,715 | ||
| Hingham, MA, General Obligation Anticipation Notes, 4%, 2/16/2024 | 3,000,000 | 3,003,499 | ||
| Lawrence, MA, General Obligation Purpose Loan, 4%, 6/01/2034 | 1,125,000 | 1,149,953 | ||
| Lawrence, MA, General Obligation Purpose Loan, 4%, 6/01/2044 | 1,665,000 | 1,510,531 | ||
| Lawrence, MA, General Obligation Purpose Loan, 3%, 2/01/2049 | 3,000,000 | 2,045,423 | ||
| Massachusetts Turnpike Authority, Metropolitan Highway System Rev., Capital Appreciation, ”A“, NPFG, 0%, 1/01/2029 | 1,560,000 | 1,245,040 | ||
| Nantucket, MA, General Obligation Purpose Loan, ”A“, 4%, 8/15/2039 | 1,090,000 | 1,067,473 | ||
| Nantucket, MA, General Obligation Purpose Loan, ”A“, 4%, 8/15/2040 | 1,125,000 | 1,085,759 | ||
| Nantucket, MA, General Obligation Purpose Loan, ”A“, 4%, 8/15/2041 | 1,000,000 | 944,066 | ||
| Nantucket, MA, General Obligation Purpose Loan, ”A“, 4%, 8/15/2042 | 695,000 | 648,961 | ||
| New Bedford, MA, General Obligation State Qualified Municipal Purpose Loan, 4%, 9/01/2047 | 5,000,000 | 4,492,648 | ||
| Norton, MA, General Obligation Municipal Purpose Loan, 5%, 10/15/2023 | 1,215,000 | 1,215,435 | ||
| Norton, MA, General Obligation Municipal Purpose Loan, 5%, 10/15/2024 | 740,000 | 749,395 | ||
| Norton, MA, General Obligation Municipal Purpose Loan, 5%, 10/15/2025 | 350,000 | 360,018 | ||
| Pittsfield, MA, General Obligation State Qualified Municipal Purpose Loan, 4%, 12/01/2041 | 685,000 | 635,827 | ||
| Pittsfield, MA, General Obligation State Qualified Municipal Purpose Loan, 4%, 12/01/2042 | 790,000 | 724,992 | ||
| Pittsfield, MA, General Obligation State Qualified Municipal Purpose Loan, 4%, 12/01/2043 | 730,000 | 664,656 | ||
| Provincetown, MA, General Obligation Municipal Purpose Loan, Taxable, 3%, 6/15/2028 | 755,000 | 727,951 | ||
| Quincy, MA, General Obligation, ”B“, 5%, 7/01/2038 | 675,000 | 723,199 | ||
43
Portfolio of Investments (unaudited) –
continued
| Issuer | Shares/Par | Value ($) | ||
| Municipal Bonds – continued | ||||
| General Obligations - General Purpose – continued | ||||
| Quincy, MA, General Obligation, ”B“, 5%, 7/01/2039 | $ | 740,000 | $786,853 | |
| Quincy, MA, General Obligation, ”B“, 5%, 7/01/2040 | 785,000 | 831,553 | ||
| Quincy, MA, General Obligation, ”B“, 5%, 7/01/2041 | 620,000 | 652,122 | ||
| Quincy, MA, General Obligation, ”B“, 5%, 7/01/2042 | 600,000 | 628,364 | ||
| State of California, Various Purpose General Obligation, 4%, 3/01/2036 | 1,410,000 | 1,400,692 | ||
| State of Illinois, General Obligation, 5.5%, 5/01/2039 | 280,000 | 292,119 | ||
| State of Illinois, General Obligation, 5.75%, 5/01/2045 | 255,000 | 265,843 | ||
| State of Illinois, General Obligation, ”C“, 4%, 10/01/2040 | 950,000 | 831,287 | ||
| State of Illinois, General Obligation, ”C“, 4%, 10/01/2041 | 595,000 | 515,214 | ||
| Texas Cedar Port Navigation & Improvement District, Unlimited Tax, 4.5%, 8/31/2048 | 395,000 | 356,553 | ||
| Texas Cedar Port Navigation & Improvement District, Unlimited Tax, 4.5%, 8/31/2052 | 160,000 | 142,550 | ||
| Tisbury, MA, General Obligation, Municipal Purpose Loan, Unlimited Tax, 3%, 8/15/2052 | 5,000,000 | 3,404,183 | ||
| $76,857,553 | ||||
| General Obligations - Schools – 2.6% | ||||
| Bristol-Plymouth Regional Vocational Technical School District, MA, 5%, 2/28/2024 | $ | 6,000,000 | $6,019,149 | |
| Chicago, IL, Board of Education, Unlimited Tax General Obligation Dedicated Rev., ”A“, 4%, 12/01/2047 | 1,270,000 | 986,557 | ||
| Orange County, CA, Anaheim Elementary School District, AGM, 4%, 8/01/2048 | 1,285,000 | 1,173,400 | ||
| San Marcos, CA, Unified School District (Election of 2010), Capital Appreciation, ”C“, 0%, 8/01/2038 (Prerefunded 2/15/2024) | 3,375,000 | 1,559,205 | ||
| $9,738,311 | ||||
| Healthcare Revenue - Hospitals – 12.9% | ||||
| California Health Facilities Financing Authority Rev. (Cedars-Sinai Health System), ”A“, 5%, 8/15/2051 | $ | 2,405,000 | $2,456,031 | |
| Harris County, TX, Cultural Education Facilities Finance Corp., Hospital Rev. (Memorial Hermann Health System), ”A“, 4.125%, 7/01/2052 | 1,960,000 | 1,666,975 | ||
| Massachusetts Development Finance Agency Rev. (Atrius Health Issue), ”A“, 4%, 6/01/2049 (Prerefunded 6/01/2029) | 1,500,000 | 1,536,551 | ||
| Massachusetts Development Finance Agency Rev. (Baystate Medical Center), ”N“, 5%, 7/01/2044 | 2,000,000 | 1,904,637 | ||
| Massachusetts Development Finance Agency Rev. (Beth Israel Lahey Health, Inc.), ”J-2“, 5%, 7/01/2048 | 3,615,000 | 3,560,407 | ||
| Massachusetts Development Finance Agency Rev. (Beth Israel Lahey Health, Inc.), ”K“, 5%, 7/01/2036 | 635,000 | 651,124 | ||
| Massachusetts Development Finance Agency Rev. (Beth Israel Lahey Health, Inc.), ”K“, 5%, 7/01/2037 | 850,000 | 866,926 | ||
| Massachusetts Development Finance Agency Rev. (Beth Israel Lahey Health, Inc.), ”K“, 5%, 7/01/2038 | 700,000 | 710,101 | ||
| Massachusetts Development Finance Agency Rev. (Boston Medical Center), ”G“, 5.25%, 7/01/2048 | 2,000,000 | 1,969,112 | ||
| Massachusetts Development Finance Agency Rev. (CareGroup), ”I“, 5%, 7/01/2037 | 1,000,000 | 1,008,908 | ||
| Massachusetts Development Finance Agency Rev. (CareGroup), ”J-2“, 5%, 7/01/2036 | 1,000,000 | 1,024,849 | ||
| Massachusetts Development Finance Agency Rev. (CareGroup), ”J-2“, 5%, 7/01/2037 | 1,000,000 | 1,018,078 | ||
| Massachusetts Development Finance Agency Rev. (Children's Hospital), ”P“, 5%, 10/01/2032 (Prerefunded 10/01/2024) | 1,000,000 | 1,009,383 | ||
| Massachusetts Development Finance Agency Rev. (Dana-Farber Cancer Institute), ”N“, 5%, 12/01/2041 | 1,690,000 | 1,698,394 | ||
| Massachusetts Development Finance Agency Rev. (Dana-Farber Cancer Institute), ”O“, 5%, 12/01/2034 | 400,000 | 419,118 | ||
| Massachusetts Development Finance Agency Rev. (Lahey Health System), ”F“, 5%, 8/15/2030 | 2,000,000 | 2,035,788 | ||
| Massachusetts Development Finance Agency Rev. (Milford Regional Medical Center), ”F“, 5.75%, 7/15/2043 | 1,000,000 | 913,919 | ||
| Massachusetts Development Finance Agency Rev. (Milford Regional Medical Center), ”G“, 5%, 7/15/2046 (n) | 1,000,000 | 808,805 | ||
| Massachusetts Development Finance Agency Rev. (Partners Healthcare), ”Q“, 5%, 7/01/2041 | 1,810,000 | 1,820,446 | ||
| Massachusetts Development Finance Agency Rev. (Partners Healthcare), ”Q“, 5%, 7/01/2047 | 1,500,000 | 1,484,251 | ||
| Massachusetts Development Finance Agency Rev. (Partners Healthcare), ”S“, 4%, 7/01/2041 | 1,500,000 | 1,374,019 | ||
| Massachusetts Development Finance Agency Rev. (South Shore Hospital), ”I“, 5%, 7/01/2041 | 2,300,000 | 2,207,667 | ||
| Massachusetts Development Finance Agency Rev. (UMass Memorial Health Care Obligated Group), ”I“, 5%, 7/01/2041 | 1,850,000 | 1,800,520 | ||
| Massachusetts Development Finance Agency Rev. (UMass Memorial Health Care Obligated Group), ”K“, 5%, 7/01/2038 | 2,000,000 | 1,968,617 | ||
| Massachusetts Development Finance Agency Rev. (UMass Memorial Health Care Obligated Group), ”L“, 5%, 7/01/2044 | 1,000,000 | 955,928 | ||
| Massachusetts Development Finance Agency Rev. (Wellforce, Inc.), ”A“, 4%, 7/01/2044 | 2,080,000 | 1,643,453 | ||
| Massachusetts Development Finance Agency Rev. (Wellforce, Inc.), ”A“, 5%, 7/01/2044 | 2,000,000 | 1,748,441 | ||
| Massachusetts Development Finance Agency Rev. (Wellforce, Inc.), ”C“, AGM, 4%, 10/01/2045 | 4,150,000 | 3,586,827 | ||
| Massachusetts Development Financing Agency Rev. (Beth Israel Lahey Health, Inc.), ”J-2“, 5%, 7/01/2043 | 2,855,000 | 2,861,799 | ||
| New York Dormitory Authority Rev. (Norwell Health Obligated Group), ”A“, 4.25%, 5/01/2052 | 2,120,000 | 1,826,965 | ||
| $48,538,039 | ||||
| Healthcare Revenue - Long Term Care – 1.4% | ||||
| Massachusetts Development Finance Agency First Mortgage Rev. (Berkshire Retirement Community), 5%, 7/01/2031 | $ | 1,000,000 | $999,945 | |
| Massachusetts Development Finance Agency Rev. (Adventcare), ”A“, 6.75%, 10/15/2037 (a)(d) | 415,361 | 4,154 | ||
44
Portfolio of Investments (unaudited) –
continued
| Issuer | Shares/Par | Value ($) | ||
| Municipal Bonds – continued | ||||
| Healthcare Revenue - Long Term Care – continued | ||||
| Massachusetts Development Finance Agency Rev. (Carleton-Willard Village), 4%, 12/01/2042 | $ | 485,000 | $382,234 | |
| Massachusetts Development Finance Agency Rev. (Carleton-Willard Village), 5%, 12/01/2042 | 525,000 | 490,365 | ||
| Massachusetts Development Finance Agency Rev. (Loomis Communities), 4%, 1/01/2031 (n) | 500,000 | 477,211 | ||
| Massachusetts Development Finance Agency Rev. (Loomis Communities), 4%, 1/01/2051 | 900,000 | 699,901 | ||
| Massachusetts Development Finance Agency Rev. (Newbridge on the Charles, Inc.), 5%, 10/01/2037 (n) | 1,250,000 | 1,146,058 | ||
| Massachusetts Development Finance Agency Rev. (North Hill Communities), ”A“, 6.5%, 11/15/2043 (Prerefunded 11/15/2023) (n) | 1,000,000 | 1,002,484 | ||
| $5,202,352 | ||||
| Industrial Revenue - Environmental Services – 0.5% | ||||
| California Municipal Finance Authority, Solid Waste Disposal Rev. (Waste Management, Inc. Project), ”A“, 0.7%, 12/01/2044 (Put Date 12/01/2023) | $ | 2,000,000 | $1,985,073 | |
| Industrial Revenue - Other – 0.1% | ||||
| Port Beaumont, TX, Navigation District, Dock & Wharf Facility Rev. (Jefferson Gulf Coast Energy Project), ”A“, 3.625%, 1/01/2035 (n) | $ | 500,000 | $386,536 | |
| Miscellaneous Revenue - Other – 4.4% | ||||
| California Infrastructure & Economic Development Bank Rev. (Brightline West Passenger Rail), ”A“, 3.65%, 1/01/2050 (Put Date 1/31/2024) (n) | $ | 2,235,000 | $2,221,347 | |
| Commonwealth of Massachusetts, Federal Highway Grant Anticipation Notes (Accelerated Bridge Program), ”A“, 5%, 6/15/2024 | 6,000,000 | 6,049,171 | ||
| Massachusetts Development Finance Agency Rev. (Woods Hole Oceanographic Institution), 5%, 6/01/2037 | 1,000,000 | 1,025,214 | ||
| Massachusetts Development Finance Agency Rev. (Woods Hole Oceanographic Institution), 5%, 6/01/2038 | 1,000,000 | 1,020,156 | ||
| Massachusetts Development Finance Agency Rev. (Woods Hole Oceanographic Institution), 5%, 6/01/2043 | 1,000,000 | 1,011,051 | ||
| Massachusetts Port Authority Special Facilities Rev. (BOSFuel Project), ”A“, 5%, 7/01/2039 | 3,000,000 | 3,002,863 | ||
| Matching Fund Special Purpose Securitization Corp., ”A“, 5%, 10/01/2026 | 140,000 | 140,534 | ||
| New York Liberty Development Corp., Liberty Rev. (3 World Trade Center Project), ”1“, 5%, 11/15/2044 (n) | 950,000 | 877,652 | ||
| Pennsylvania Economic Development Financing Authority, Private Activity Rev. (PennDOT Major Bridges Package One Project), AGM, 5%, 12/31/2057 | 1,495,000 | 1,440,012 | ||
| $16,788,000 | ||||
| Multi-Family Housing Revenue – 4.5% | ||||
| Massachusetts Development Finance Agency Rev. (Morville House Apartments), ”A“, LOC, 4.95%, 12/15/2023 | $ | 1,790,000 | $1,790,813 | |
| Massachusetts Housing Finance Agency, ”A“, 3.7%, 12/01/2038 | 1,000,000 | 860,458 | ||
| Massachusetts Housing Finance Agency, ”A“, 3.8%, 12/01/2043 | 2,025,000 | 1,658,831 | ||
| Massachusetts Housing Finance Agency, ”C“, 5.35%, 12/01/2049 | 1,035,000 | 1,036,078 | ||
| Massachusetts Housing Finance Agency, ”C-1“, HUD Section 8, 5.125%, 12/01/2057 | 3,000,000 | 2,918,927 | ||
| Massachusetts Housing Finance Agency, “A-3”, 3.05%, 12/01/2027 | 3,000,000 | 2,875,726 | ||
| Massachusetts Housing Finance Agency, “C-1”, 2.9%, 12/01/2039 | 1,000,000 | 752,488 | ||
| Massachusetts Housing Finance Agency, “C-1”, 3.1%, 12/01/2044 | 2,000,000 | 1,413,709 | ||
| Massachusetts Housing Finance Agency, Multi-Family Housing, ”A“, FHA, 4.75%, 12/01/2030 | 1,425,000 | 1,425,317 | ||
| Massachusetts Housing Finance Agency, Multi-Family Housing, ”A“, FHA, 4.875%, 12/01/2032 | 1,190,000 | 1,190,246 | ||
| New Hampshire National Finance Authority Municipal Certificates, ”1-A“, 4.375%, 9/20/2036 | 1,106,515 | 1,024,616 | ||
| $16,947,209 | ||||
| Sales & Excise Tax Revenue – 5.2% | ||||
| Guam Government Business Privilege Tax Refunding, ”F“, 5%, 1/01/2030 | $ | 20,000 | $19,941 | |
| Guam Government Business Privilege Tax Refunding, ”F“, 5%, 1/01/2031 | 25,000 | 24,837 | ||
| Guam Government Business Privilege Tax Refunding, ”F“, 4%, 1/01/2042 | 255,000 | 206,368 | ||
| Massachusetts Bay Transportation Authority, Sales Tax Rev., ”A“, 5%, 7/01/2024 | 2,590,000 | 2,611,971 | ||
| Massachusetts Bay Transportation Authority, Sales Tax Rev., ”A-1“, 5.25%, 7/01/2029 | 1,850,000 | 2,029,001 | ||
| Massachusetts Bay Transportation Authority, Sales Tax Rev., ”A-1“, 5.25%, 7/01/2031 | 2,000,000 | 2,237,153 | ||
| Massachusetts School Building Authority, Senior Dedicated Sales Tax Rev., ”A“, 5%, 2/15/2044 | 4,000,000 | 4,093,489 | ||
| Puerto Rico Sales Tax Financing Corp., Restructured Sales Tax Rev., ”2019A-1“, 4.55%, 7/01/2040 | 73,000 | 67,166 | ||
| Puerto Rico Sales Tax Financing Corp., Restructured Sales Tax Rev., ”2019A-1“, 4.75%, 7/01/2053 | 239,000 | 211,291 | ||
| Puerto Rico Sales Tax Financing Corp., Restructured Sales Tax Rev., ”2019A-1“, 5%, 7/01/2058 | 2,803,000 | 2,535,547 | ||
| Puerto Rico Sales Tax Financing Corp., Restructured Sales Tax Rev., ”2019A-2“, 4.329%, 7/01/2040 | 597,000 | 534,711 | ||
| Puerto Rico Sales Tax Financing Corp., Restructured Sales Tax Rev., ”2019A-2“, 4.329%, 7/01/2040 | 256,000 | 229,290 | ||
| Puerto Rico Sales Tax Financing Corp., Restructured Sales Tax Rev., ”2019A-2“, 4.536%, 7/01/2053 | 5,000 | 4,265 | ||
| Puerto Rico Sales Tax Financing Corp., Restructured Sales Tax Rev., ”2019A-2“, 4.784%, 7/01/2058 | 2,179,000 | 1,901,927 | ||
| Puerto Rico Sales Tax Financing Corp., Restructured Sales Tax Rev., Capital Appreciation, ”2019A-1“, 0%, 7/01/2024 | 4,000 | 3,872 | ||
45
Portfolio of Investments (unaudited) –
continued
| Issuer | Shares/Par | Value ($) | ||
| Municipal Bonds – continued | ||||
| Sales & Excise Tax Revenue – continued | ||||
| Puerto Rico Sales Tax Financing Corp., Restructured Sales Tax Rev., Capital Appreciation, ”2019A-1“, 0%, 7/01/2027 | $ | 117,000 | $99,624 | |
| Puerto Rico Sales Tax Financing Corp., Restructured Sales Tax Rev., Capital Appreciation, ”2019A-1“, 0%, 7/01/2029 | 22,000 | 17,106 | ||
| Puerto Rico Sales Tax Financing Corp., Restructured Sales Tax Rev., Capital Appreciation, ”2019A-1“, 0%, 7/01/2031 | 1,059,000 | 750,225 | ||
| Puerto Rico Sales Tax Financing Corp., Restructured Sales Tax Rev., Capital Appreciation, ”2019A-1“, 0%, 7/01/2033 | 1,011,000 | 647,798 | ||
| Puerto Rico Sales Tax Financing Corp., Restructured Sales Tax Rev., Capital Appreciation, ”2019A-1“, 0%, 7/01/2046 | 2,912,000 | 750,679 | ||
| Wisconsin Public Finance Authority Limited Obligation Grant Rev. (American Dream at Meadowlands Project), ”A“, 6.25%, 8/01/2027 (a)(d)(n) | 585,000 | 446,794 | ||
| Wisconsin Public Finance Authority Limited Obligation Grant Rev., Taxable (American Dream at Meadowlands Project), ”A“, 5.625%, 8/01/2024 (a)(d)(n) | 360,000 | 274,950 | ||
| $19,698,005 | ||||
| Secondary Schools – 1.8% | ||||
| Collegiate Charter School of Lowell, MA, Rev., 5%, 6/15/2054 | $ | 1,000,000 | $865,384 | |
| District of Columbia Rev. (Rocketship D.C.), ”A“, 5%, 6/01/2056 (n) | 290,000 | 233,642 | ||
| Lowell, MA, Collegiate Charter School Rev., 5%, 6/15/2039 | 1,000,000 | 934,422 | ||
| Massachusetts Development Finance Agency Rev. (Dexter Southfield), 5%, 5/01/2030 | 500,000 | 508,048 | ||
| Massachusetts Development Finance Agency Rev. (Dexter Southfield), 5%, 5/01/2031 | 1,015,000 | 1,031,297 | ||
| Massachusetts Development Finance Agency Rev. (Foxborough Regional Charter School), ”B“, 5%, 7/01/2037 | 1,000,000 | 937,214 | ||
| Massachusetts Development Finance Agency Rev. (Roxbury Latin School), ”A“, 3.5%, 7/01/2044 | 265,000 | 214,231 | ||
| Massachusetts Development Finance Agency Rev. (Sabis International Charter School Issue), 5%, 4/15/2033 | 2,000,000 | 1,952,248 | ||
| $6,676,486 | ||||
| Single Family Housing - State – 2.7% | ||||
| Connecticut Housing Finance Authority Rev. (Housing Mortgage Finance Program), ”C-1“, 4%, 11/15/2047 | $ | 600,000 | $590,991 | |
| Massachusetts Housing Finance Agency, Single Family Housing Rev., ”206“, 3.3%, 6/01/2034 | 365,000 | 329,708 | ||
| Massachusetts Housing Finance Agency, Single Family Housing Rev., ”206“, 3.45%, 12/01/2036 | 485,000 | 426,079 | ||
| Massachusetts Housing Finance Agency, Single Family Housing Rev., ”215“, GNMA, 4%, 12/01/2050 | 2,390,000 | 2,323,737 | ||
| Massachusetts Housing Finance Agency, Single Family Housing Rev., ”220“, GNMA, 1.35%, 12/01/2029 | 400,000 | 330,848 | ||
| Massachusetts Housing Finance Agency, Single Family Housing Rev., ”222“, GNMA, 3%, 6/01/2051 | 935,000 | 874,556 | ||
| Massachusetts Housing Finance Agency, Single Family Housing Rev., ”225“, 5.5%, 12/01/2052 | 4,000,000 | 4,107,589 | ||
| Massachusetts Housing Finance Agency, Single Family Housing Rev., “214”, GNMA, 2.95%, 12/01/2044 | 1,865,000 | 1,364,492 | ||
| $10,348,000 | ||||
| Student Loan Revenue – 5.2% | ||||
| Massachusetts Educational Financing Authority, Education Loan Rev., ”B“, 5%, 7/01/2029 | $ | 1,400,000 | $1,424,952 | |
| Massachusetts Educational Financing Authority, Education Loan Rev., ”B“, 5%, 7/01/2030 | 1,300,000 | 1,327,030 | ||
| Massachusetts Educational Financing Authority, Education Loan Rev., ”B“, 2%, 7/01/2037 | 3,000,000 | 2,403,422 | ||
| Massachusetts Educational Financing Authority, Education Loan Rev., ”C“, 4.125%, 7/01/2046 | 2,250,000 | 1,774,980 | ||
| Massachusetts Educational Financing Authority, Education Loan Rev., ”C“, 3.75%, 7/01/2047 | 4,000,000 | 2,936,592 | ||
| Massachusetts Educational Financing Authority, Education Loan Rev., ”J“, 3.5%, 7/01/2033 | 635,000 | 615,392 | ||
| Massachusetts Educational Financing Authority, Education Loan Rev., Issue L, ”B“, 4.25%, 7/01/2044 | 3,000,000 | 2,779,883 | ||
| Massachusetts Educational Financing Authority, Education Loan Rev., Issue M, ”B“, 5%, 7/01/2031 | 1,000,000 | 1,023,213 | ||
| Massachusetts Educational Financing Authority, Education Loan Subordinate Rev., ”C“, 3%, 7/01/2051 | 2,000,000 | 1,213,597 | ||
| Massachusetts Educational Financing Authority, Education Loan Subordinate Rev., ”C“, 4.125%, 7/01/2052 | 3,000,000 | 2,264,584 | ||
| Minnesota Office of Higher Education Supplemental Student Loan Program Rev., 2.65%, 11/01/2038 | 180,000 | 156,840 | ||
| New Jersey Higher Education Student Assistance Authority, Senior Student Loan Rev., ”B“, 4%, 12/01/2041 | 1,710,000 | 1,617,554 | ||
| $19,538,039 | ||||
| Tax - Other – 0.4% | ||||
| Chicago, IL, Board of Education, Dedicated Capital Improvement Tax Bond, 5%, 4/01/2045 | $ | 255,000 | $251,710 | |
| Chicago, IL, Board of Education, Dedicated Capital Improvement Tax Bond, 5.75%, 4/01/2048 | 710,000 | 743,296 | ||
| Guam Government Limited Obligation Rev., ”A“, 5%, 12/01/2036 | 120,000 | 117,139 | ||
| Guam Government Limited Obligation Rev., ”A“, 5%, 12/01/2046 | 370,000 | 324,459 | ||
| Wisconsin Public Finance Authority Limited Obligation PILOT Rev. (American Dream at Meadowlands Project), 7%, 12/01/2050 | 225,000 | 200,197 | ||
| $1,636,801 | ||||
| Tax Assessment – 0.0% | ||||
| Brunswick, MD, Special Obligation Refunding (Brunswick Crossing Special Taxing District), 4%, 7/01/2029 | $ | 25,000 | $23,859 | |
46
Portfolio of Investments (unaudited) –
continued
| Issuer | Shares/Par | Value ($) | ||
| Municipal Bonds – continued | ||||
| Tax Assessment – continued | ||||
| Brunswick, MD, Special Obligation Refunding (Brunswick Crossing Special Taxing District), 5%, 7/01/2036 | $ | 32,000 | $31,263 | |
| $55,122 | ||||
| Tobacco – 0.8% | ||||
| Buckeye, OH, Tobacco Settlement Financing Authority Senior Asset-Backed Refunding, 2020A-2, ”1“, 4%, 6/01/2048 | $ | 1,290,000 | $1,089,635 | |
| Buckeye, OH, Tobacco Settlement Financing Authority Senior Asset-Backed Refunding, 2020B-2, ”2“, 5%, 6/01/2055 | 800,000 | 689,128 | ||
| Golden State, CA, Tobacco Securitization Corp., Tobacco Settlement Rev., Taxable, ”B-1“, 3.85%, 6/01/2050 | 1,340,000 | 1,215,452 | ||
| $2,994,215 | ||||
| Toll Roads – 0.3% | ||||
| Massachusetts Department of Transportation, Metropolitan Highway System Refunding Rev., Subordinated Contract Assistance, 5%, 1/01/2037 | $ | 1,000,000 | $1,051,467 | |
| Transportation - Special Tax – 3.3% | ||||
| Commonwealth of Massachusetts Transportation Fund Rev. (Rail Enhancement & Accelerated Bridge Programs), ”A“, 5%, 6/01/2036 | $ | 2,850,000 | $2,930,332 | |
| Commonwealth of Massachusetts Transportation Fund Rev. (Rail Enhancement & Accelerated Bridge Programs), ”A“, 5%, 6/01/2042 | 3,000,000 | 3,060,738 | ||
| Commonwealth of Massachusetts Transportation Fund Rev. (Rail Enhancement Program), ”B“, 5%, 5/31/2049 (w) | 3,000,000 | 3,131,067 | ||
| Massachusetts Transportation Fund Rev. (Rail Enhancement Program), ”B“, 5%, 6/01/2052 | 3,000,000 | 3,111,468 | ||
| New Jersey Transportation Trust Fund Authority, ”A“, 5%, 12/15/2039 | 225,000 | 230,817 | ||
| $12,464,422 | ||||
| Universities - Colleges – 18.7% | ||||
| Connecticut Health & Educational Facilities Authority Rev. (Connecticut College Issue), ”M“, 3%, 7/01/2047 | $ | 2,830,000 | $1,870,702 | |
| Massachusetts Development Finance Agency Refunding Rev. (Brandeis University), ”S-1“, 5%, 10/01/2038 | 605,000 | 629,345 | ||
| Massachusetts Development Finance Agency Refunding Rev. (Brandeis University), ”S-1“, 5%, 10/01/2040 | 2,665,000 | 2,751,117 | ||
| Massachusetts Development Finance Agency Refunding Rev. (Olin College) ”F“, 5%, 10/31/2040 | 850,000 | 880,772 | ||
| Massachusetts Development Finance Agency Refunding Rev. (Olin College) ”F“, 4%, 10/31/2041 | 1,800,000 | 1,613,008 | ||
| Massachusetts Development Finance Agency Refunding Rev. (Olin College) ”F“, 5%, 10/31/2042 | 950,000 | 976,792 | ||
| Massachusetts Development Finance Agency Refunding Rev. (Olin College) ”F“, 4.125%, 10/31/2043 | 1,250,000 | 1,121,279 | ||
| Massachusetts Development Finance Agency Refunding Rev. (Suffolk University), 5%, 7/01/2035 | 970,000 | 974,929 | ||
| Massachusetts Development Finance Agency Refunding Rev. (Suffolk University), 5%, 7/01/2036 | 850,000 | 850,663 | ||
| Massachusetts Development Finance Agency Refunding Rev. (Suffolk University), 5%, 7/01/2037 | 625,000 | 618,063 | ||
| Massachusetts Development Finance Agency Refunding Rev. (Suffolk University), 5%, 7/01/2038 | 340,000 | 332,263 | ||
| Massachusetts Development Finance Agency Refunding Rev. (Suffolk University), 4%, 7/01/2039 | 3,055,000 | 2,608,217 | ||
| Massachusetts Development Finance Agency Rev. (Bentley University), 5%, 7/01/2040 | 1,500,000 | 1,506,198 | ||
| Massachusetts Development Finance Agency Rev. (Brandeis University), ”R“, 5%, 10/01/2038 | 835,000 | 860,912 | ||
| Massachusetts Development Finance Agency Rev. (Brandeis University), ”S-1“, 5%, 10/01/2039 | 2,660,000 | 2,755,581 | ||
| Massachusetts Development Finance Agency Rev. (Emerson College), 5%, 1/01/2043 | 725,000 | 694,662 | ||
| Massachusetts Development Finance Agency Rev. (Emerson College), 5%, 1/01/2048 | 2,845,000 | 2,658,123 | ||
| Massachusetts Development Finance Agency Rev. (Emerson College), ”A“, 5.25%, 1/01/2042 | 2,000,000 | 1,994,360 | ||
| Massachusetts Development Finance Agency Rev. (Emmanuel College), ”A“, 5%, 10/01/2043 | 2,000,000 | 1,893,486 | ||
| Massachusetts Development Finance Agency Rev. (Emmanuel College), “A”, 4%, 10/01/2046 | 1,375,000 | 1,086,652 | ||
| Massachusetts Development Finance Agency Rev. (Lasell University), 4%, 7/01/2045 | 250,000 | 189,941 | ||
| Massachusetts Development Finance Agency Rev. (Lesley University), ”A“, 5%, 7/01/2044 | 2,250,000 | 2,074,060 | ||
| Massachusetts Development Finance Agency Rev. (Merrimack College), 5%, 7/01/2047 | 1,000,000 | 914,093 | ||
| Massachusetts Development Finance Agency Rev. (Merrimack College), 5%, 7/01/2052 | 2,300,000 | 2,062,492 | ||
| Massachusetts Development Finance Agency Rev. (Merrimack College), ”B“, 4%, 7/01/2042 | 475,000 | 389,201 | ||
| Massachusetts Development Finance Agency Rev. (Merrimack College), ”B“, 4%, 7/01/2050 | 1,825,000 | 1,393,071 | ||
| Massachusetts Development Finance Agency Rev. (Northeastern University), 5%, 10/01/2044 | 2,000,000 | 2,081,718 | ||
| Massachusetts Development Finance Agency Rev. (Northeastern University), ”A“, 5%, 10/01/2035 | 1,555,000 | 1,673,637 | ||
| Massachusetts Development Finance Agency Rev. (Simmons University), ”H“, SYNCORA, 5.25%, 10/01/2026 | 1,420,000 | 1,433,628 | ||
| Massachusetts Development Finance Agency Rev. (Simmons University), ”L“, 5%, 10/01/2035 | 2,000,000 | 2,000,899 | ||
| Massachusetts Development Finance Agency Rev. (Simmons University), ”M“, 5%, 10/01/2045 | 725,000 | 657,070 | ||
| Massachusetts Development Finance Agency Rev. (Springfield College), ”A“, 4%, 6/01/2056 | 3,000,000 | 2,172,749 | ||
| Massachusetts Development Finance Agency Rev. (Suffolk University), 4%, 7/01/2046 | 1,000,000 | 787,037 | ||
| Massachusetts Development Finance Agency Rev. (Suffolk University), 4%, 7/01/2051 | 1,385,000 | 1,048,438 | ||
| Massachusetts Development Finance Agency Rev. (Wentworth Institute of Technology), 5%, 10/01/2046 | 2,000,000 | 1,812,640 | ||
| Massachusetts Development Finance Agency Rev. (Western New England University), 5%, 9/01/2031 | 1,110,000 | 1,102,153 | ||
| Massachusetts Development Finance Agency Rev. (Western New England University), AGM, 5%, 9/01/2038 | 2,550,000 | 2,599,248 | ||
47
Portfolio of Investments (unaudited) –
continued
| Issuer | Shares/Par | Value ($) | ||
| Municipal Bonds – continued | ||||
| Universities - Colleges – continued | ||||
| Massachusetts Development Finance Agency Rev. (Worcester Polytechnic Institute), 5%, 9/01/2039 | $ | 950,000 | $985,156 | |
| Massachusetts Development Finance Agency Rev. (Worcester Polytechnic Institute), 5%, 9/01/2047 | 1,395,000 | 1,415,753 | ||
| Massachusetts Health & Educational Facilities Authority Rev. (Boston College), 5.5%, 6/01/2027 | 1,735,000 | 1,851,868 | ||
| Massachusetts Health & Educational Facilities Authority Rev. (Massachusetts Institute of Technology), ”I-1“, 5.2%, 1/01/2028 | 1,000,000 | 1,075,185 | ||
| Massachusetts Health & Educational Facilities Authority Rev. (University of Massachusetts), ”A“, 2.45%, 11/01/2030 (Put Date 4/01/2026) | 3,500,000 | 3,365,327 | ||
| Massachusetts Health & Educational Facilities Authority Rev. (Williams College), ”I“, 0.7%, 7/01/2033 (Put Date 7/01/2025) | 2,400,000 | 2,217,876 | ||
| Puerto Rico Industrial, Tourist, Educational, Medical & Environmental Control Facilities Financing Authority, Educational Facilities Rev. (University Plaza Project), NPFG, 5%, 7/01/2033 | 265,000 | 256,950 | ||
| Puerto Rico Industrial, Tourist, Educational, Medical & Environmental Control Facilities Financing Authority, Higher Education Rev. (University of Sacred Heart), 4.375%, 10/01/2031 | 75,000 | 75,056 | ||
| Puerto Rico Industrial, Tourist, Educational, Medical & Environmental Control Facilities Financing Authority, Higher Education Rev. (University of Sacred Heart), 5%, 10/01/2042 | 90,000 | 90,174 | ||
| Red River, TX, Education Finance Corp., Higher Education Rev. (Houston Baptist University Project), 5.5%, 10/01/2046 | 470,000 | 462,251 | ||
| University of Massachusetts Building Authority Project Senior Rev., ”1“, 5%, 11/01/2040 | 2,500,000 | 2,513,269 | ||
| University of Massachusetts Building Authority Senior Refunding Rev., ”2019-1“, 5%, 5/01/2039 | 3,000,000 | 3,127,240 | ||
| $70,505,304 | ||||
| Utilities - Municipal Owned – 0.5% | ||||
| Guam Power Authority Rev., ”A“, AGM, 5%, 10/01/2039 | $ | 200,000 | $200,481 | |
| Guam Power Authority Rev., ”A“, AGM, 5%, 10/01/2044 | 235,000 | 232,478 | ||
| Puerto Rico Electric Power Authority Refunding Rev., ”DDD“, 5%, 7/01/2020 (a)(d) | 35,000 | 8,750 | ||
| Puerto Rico Electric Power Authority Refunding Rev., ”DDD“, 5%, 7/01/2021 (a)(d) | 315,000 | 78,750 | ||
| Puerto Rico Electric Power Authority Refunding Rev., ”DDD“, 5%, 7/01/2022 (a)(d) | 510,000 | 127,500 | ||
| Puerto Rico Electric Power Authority Refunding Rev., ”VV“, NPFG, 5.25%, 7/01/2029 | 385,000 | 380,764 | ||
| Puerto Rico Electric Power Authority Refunding Rev., ”VV“, NPFG, 5.25%, 7/01/2034 | 35,000 | 34,517 | ||
| Puerto Rico Electric Power Authority Rev., ”A“, 5%, 7/01/2029 (a)(d) | 800,000 | 200,000 | ||
| Puerto Rico Electric Power Authority Rev., ”A“, 5%, 7/01/2042 (a)(d) | 125,000 | 31,250 | ||
| Puerto Rico Electric Power Authority Rev., ”AAA“, 5.25%, 7/01/2021 (a)(d) | 65,000 | 16,250 | ||
| Puerto Rico Electric Power Authority Rev., ”AAA“, 5.25%, 7/01/2030 (a)(d) | 30,000 | 7,500 | ||
| Puerto Rico Electric Power Authority Rev., ”CCC“, 5.25%, 7/01/2027 (a)(d) | 300,000 | 75,000 | ||
| Puerto Rico Electric Power Authority Rev., ”TT“, 5%, 7/01/2021 (a)(d) | 150,000 | 37,500 | ||
| Puerto Rico Electric Power Authority Rev., ”TT“, 5%, 7/01/2023 (a)(d) | 135,000 | 33,750 | ||
| Puerto Rico Electric Power Authority Rev., ”TT“, 5%, 7/01/2027 (a)(d) | 25,000 | 6,250 | ||
| Puerto Rico Electric Power Authority Rev., ”TT“, 5%, 7/01/2037 (a)(d) | 415,000 | 103,750 | ||
| Puerto Rico Electric Power Authority Rev., ”WW“, 5.375%, 7/01/2022 (a)(d) | 30,000 | 7,500 | ||
| Puerto Rico Electric Power Authority Rev., ”WW“, 5.25%, 7/01/2025 (a)(d) | 65,000 | 16,250 | ||
| Puerto Rico Electric Power Authority Rev., ”ZZ“, 5%, 7/01/2018 (a)(d) | 195,000 | 48,750 | ||
| Puerto Rico Electric Power Authority Rev., ”ZZ“, 5.25%, 7/01/2023 (a)(d) | 220,000 | 55,000 | ||
| Puerto Rico Electric Power Authority Rev., ”ZZ“, 5.25%, 7/01/2024 (a)(d) | 75,000 | 18,750 | ||
| Puerto Rico Electric Power Authority Rev., ”ZZ“, 5.25%, 7/01/2026 (a)(d) | 230,000 | 57,500 | ||
| Puerto Rico Electric Power Authority Rev., Taxable, ”EEE“, 6.05%, 7/01/2032 (a)(d) | 190,000 | 47,500 | ||
| $1,825,740 | ||||
| Utilities - Other – 3.5% | ||||
| Alabama Southeast Energy, Cooperative District Energy Supply Rev., ”A-1“, 5.5%, 11/01/2053 (Put Date 1/01/2031) | $ | 2,720,000 | $2,795,505 | |
| Black Belt Energy Gas District, AL, Gas Project Rev., ”A“, 4%, 6/01/2051 (Put Date 12/01/2031) | 1,165,000 | 1,098,451 | ||
| California Community Choice Financing Authority, Clean Energy Project Rev., ”C“, 5.25%, 1/01/2054 (Put Date 10/01/2031) | 2,250,000 | 2,244,693 | ||
| Southeast Alabama Energy Authority Commodity Supply Rev. (Project No. 5), ”A“, 5.25%, 1/01/2054 (Put Date 7/01/2029) | 2,065,000 | 2,078,401 | ||
| Tennergy Corp., TN, Gas Supply Rev., ”A“, 5.5%, 10/01/2053 (Put Date 12/01/2030) | 1,270,000 | 1,289,884 | ||
| Tennessee Energy Acquisition Corp., Gas Project Rev., ”A“, 5.25%, 9/01/2026 | 1,610,000 | 1,614,532 | ||
| Tennessee Energy Acquisition Corp., Gas Project Rev., ”A-1“, 5%, 5/01/2053 (Put Date 5/01/2028) | 2,020,000 | 2,015,305 | ||
| $13,136,771 | ||||
| Water & Sewer Utility Revenue – 3.2% | ||||
| Guam Waterworks Authority Rev. (Water and Wastewater System), ”A“, 5%, 1/01/2050 | $ | 455,000 | $421,668 | |
| Massachusetts Clean Water Trust, State Revolving Fund, 5%, 8/01/2038 | 1,255,000 | 1,326,785 | ||
| Massachusetts Water Pollution Abatement Trust, 5.25%, 8/01/2027 | 1,280,000 | 1,365,170 | ||
| Massachusetts Water Pollution Abatement Trust, 5.25%, 8/01/2033 | 2,000,000 | 2,308,053 | ||
48
Portfolio of Investments (unaudited) –
continued
| Issuer | Shares/Par | Value ($) | ||
| Municipal Bonds – continued | ||||
| Water & Sewer Utility Revenue – continued | ||||
| Massachusetts Water Pollution Abatement Trust (MWRA Program), ”A“, 5%, 8/01/2032 | $ | 75,000 | $75,055 | |
| Massachusetts Water Resources Authority, General Refunding Rev. (Green Bonds), ”C“, 4%, 8/01/2040 | 2,910,000 | 2,693,749 | ||
| Massachusetts Water Resources Authority, General Rev., ”B“, 5%, 8/01/2042 | 430,000 | 453,770 | ||
| Massachusetts Water Resources Authority, General Rev., ”B“, 5%, 8/01/2043 | 750,000 | 789,817 | ||
| Massachusetts Water Resources Authority, General Rev., ”B“, AGM, 5.25%, 8/01/2029 | 595,000 | 653,304 | ||
| Massachusetts Water Resources Authority, General Rev., ”B“, AGM, 5.25%, 8/01/2031 | 1,625,000 | 1,819,481 | ||
| $11,906,852 | ||||
| Total Municipal Bonds (Identified Cost, $402,941,702) | $371,117,284 | |||
| Bonds – 0.2% | ||||
| Consumer Services – 0.2% | ||||
| Toll Road Investors Partnership II LP, Capital Appreciation, NPFG, 0%, 2/15/2025 (n) | $ | 581,000 | $523,156 | |
| Toll Road Investors Partnership II LP, Capital Appreciation, NPFG, 0%, 2/15/2043 (n) | 1,134,593 | 372,981 | ||
| Total Bonds (Identified Cost, $978,658) | $896,137 | |||
| Contingent Value Instruments – 0.1% | ||||
| General Obligations - General Purpose – 0.1% | ||||
| Commonwealth of Puerto Rico, General Obligation Contingent Value Instrument, 11/01/2043 (Identified Cost, $403,641) | $ | 680,314 | $352,913 | |
| Investment Companies (h) – 1.1% | ||||
| Money Market Funds – 1.1% | ||||
| MFS Institutional Money Market Portfolio, 5.4% (v) (Identified Cost, $4,228,189) | 4,227,940 | $4,228,786 | ||
| Other Assets, Less Liabilities – 0.2% | 610,214 | |||
| Net Assets – 100.0% | $377,205,334 | |||
Portfolio Footnotes:
| (a) | Non-income producing security. |
| (d) | In default. |
| (h) | An affiliated issuer, which may be considered one in which the fund owns 5% or more of the outstanding voting securities, or a company which is under common control. At period end, the aggregate values of each fund’s investments in affiliated issuers and in unaffiliated issuers were as follows: |
| Affiliated Issuers | Unaffiliated Issuers | |
| Alabama Fund | $1,199,740 | $62,055,397 |
| Arkansas Fund | 906,007 | 136,656,329 |
| California Fund | 11,769,311 | 482,863,952 |
| Georgia Fund | 1,287,828 | 97,307,928 |
| Maryland Fund | 958,236 | 117,530,994 |
| Massachusetts Fund | 4,228,786 | 372,366,334 |
| (n) | Securities exempt from registration under Rule 144A of the Securities Act of 1933. These securities may be sold in the ordinary course of business in transactions exempt from registration, normally to qualified institutional buyers. At period end, the aggregate value of these securities and percentage of net assets for each fund is as follows: |
| Value | Percent of net assets | |
| Alabama Fund | $1,360,985 | 2.1% |
| Arkansas Fund | 1,680,541 | 1.2% |
| California Fund | 63,210,241 | 12.8% |
| Georgia Fund | 1,938,914 | 2.0% |
| Maryland Fund | 2,604,383 | 2.2% |
| Massachusetts Fund | 8,771,616 | 2.3% |
| (v) | Affiliated issuer that is available only to investment companies managed by MFS. The rate quoted for the MFS Institutional Money Market Portfolio is the annualized seven-day yield of the fund at period end. |
| (w) | When-issued security. |
49
Portfolio of Investments (unaudited) –
continued
| (z) | Restricted securities are not registered under the Securities Act of 1933 and are subject to legal restrictions on resale. These securities generally may be resold in transactions exempt from registration or to the public if the securities are subsequently registered. Disposal of these securities may involve time-consuming negotiations and prompt sale at an acceptable price may be difficult. The following fund(s) holds the following restricted securities: |
| Alabama Fund | |||
| Restricted Securities | Acquisition Date | Cost | Value |
| Muscle Shoals, Sheffield, and Tuscumbia, AL, Solid Waste Disposal Authority Rev. (Cherokee Industrial Landfill Project), ”A“, 6%, 5/01/2040 | 6/10/2020 | $300,000 | $225,000 |
| % of Net assets | 0.4% |
| The following abbreviations are used in this report and are defined: | |
| AAC | Ambac Assurance Corp. |
| AGM | Assured Guaranty Municipal |
| BAM | Build America Mutual |
| BHAC | Berkshire Hathaway Assurance Corp. |
| COP | Certificate of Participation |
| ETM | Escrowed to Maturity |
| FGIC | Financial Guaranty Insurance Co. |
| FHA | Federal Housing Administration |
| GNMA | Government National Mortgage Assn. |
| LOC | Letter of Credit |
| NPFG | National Public Finance Guarantee Corp. |
| SYNCORA | Syncora Guarantee Inc. |
| VRDN | Variable rate demand note that may be puttable to the issuer at the option of the holder. The stated interest rate, which generally resets either daily or weekly, represents the rate in effect at period end and may not be the current rate. |
See Notes to Financial Statements
50
Financial Statements
Statements of Assets and
Liabilities
At 9/30/23 (unaudited)
These statements represent each
fund's balance sheet, which details the assets and liabilities comprising the total value of each fund.
| Alabama Fund | Arkansas Fund | California Fund | |
| Assets | |||
| Investments in unaffiliated issuers, at value (identified cost, $68,653,058, $151,469,980, and $524,273,275, respectively) | $62,055,397 | $136,656,329 | $482,863,952 |
| Investments in affiliated issuers, at value (identified cost, $1,199,599, $905,852, and $11,767,939, respectively) | 1,199,740 | 906,007 | 11,769,311 |
| Cash | — | — | 12,100 |
| Receivables for | |||
| Investments sold | — | 799,283 | 2,525,940 |
| Fund shares sold | 35,277 | 224,501 | 2,204,970 |
| Interest | 752,143 | 1,827,118 | 5,668,110 |
| Receivable from investment adviser | 7,671 | 3,844 | — |
| Other assets | 7,467 | 10,154 | 17,257 |
| Total assets | $64,057,695 | $140,427,236 | $505,061,640 |
| Liabilities | |||
| Payables for | |||
| Distributions | $25,197 | $20,031 | $137,683 |
| Investments purchased | — | — | 2,750,000 |
| Fund shares reacquired | 150,779 | 183,514 | 1,446,883 |
| When-issued investments purchased | 202,830 | 1,464,105 | 5,210,909 |
| Payable to affiliates | |||
| Investment adviser | — | — | 17,759 |
| Administrative services fee | 159 | 248 | 666 |
| Shareholder servicing costs | 14,168 | 29,350 | 100,686 |
| Distribution and service fees | 879 | 966 | 3,292 |
| Payable for independent Trustees' compensation | 7 | — | 3,720 |
| Accrued expenses and other liabilities | 60,474 | 64,347 | 97,733 |
| Total liabilities | $454,493 | $1,762,561 | $9,769,331 |
| Net assets | $63,603,202 | $138,664,675 | $495,292,309 |
| Net assets consist of | |||
| Paid-in capital | $75,077,374 | $161,925,953 | $562,564,259 |
| Total distributable earnings (loss) | (11,474,172) | (23,261,278) | (67,271,950) |
| Net assets | $63,603,202 | $138,664,675 | $495,292,309 |
51
Statements of Assets and Liabilities (unaudited) – continued
| Alabama Fund | Arkansas Fund | California Fund | |
| Net assets | |||
| Class A | $42,576,900 | $115,825,249 | $296,945,904 |
| Class B | 53,926 | 220,962 | 223,903 |
| Class C | — | — | 10,286,007 |
| Class I | 17,758,925 | 17,377,305 | 129,369,284 |
| Class R6 | 3,213,451 | 5,241,159 | 58,467,211 |
| Total net assets | $63,603,202 | $138,664,675 | $495,292,309 |
| Shares of beneficial interest outstanding | |||
| Class A | 4,822,946 | 13,610,179 | 56,809,805 |
| Class B | 6,108 | 25,941 | 42,816 |
| Class C | — | — | 1,961,392 |
| Class I | 2,110,854 | 2,056,870 | 15,204,883 |
| Class R6 | 381,932 | 620,412 | 6,876,243 |
| Total shares of beneficial interest outstanding | 7,321,840 | 16,313,402 | 80,895,139 |
| Class A shares | |||
| Net asset value per share (net assets / shares of beneficial interest outstanding) | $8.83 | $8.51 | $5.23 |
| Offering price per share (100 / 95.75 x net asset value per share) | $9.22 | $8.89 | $5.46 |
| Class B shares | |||
| Net asset value and offering price per share (net assets / shares of beneficial interest outstanding) | $8.83 | $8.52 | $5.23 |
| Class C shares | |||
| Net asset value and offering price per share (net assets / shares of beneficial interest outstanding) | $— | $— | $5.24 |
| Class I shares | |||
| Net asset value, offering price, and redemption price per share (net assets / shares of beneficial interest outstanding) | $8.41 | $8.45 | $8.51 |
| Class R6 shares | |||
| Net asset value, offering price, and redemption price per share (net assets / shares of beneficial interest outstanding) | $8.41 | $8.45 | $8.50 |
| On sales of $100,000 or more, the maximum offering price of Class A shares is reduced. A contingent deferred sales charge may be imposed on redemptions of Class A, Class B, and Class C shares. | |||
See Notes to Financial Statements
52
Statements of Assets and Liabilities (unaudited) – continued
| At 9/30/23 | Georgia Fund | Maryland Fund | Massachusetts Fund |
| Assets | |||
| Investments in unaffiliated issuers, at value (identified cost, $106,305,186, $127,148,520, and $404,324,001, respectively) | $97,307,928 | $117,530,994 | $372,366,334 |
| Investments in affiliated issuers, at value (identified cost, $1,287,714, $958,107, and $4,228,189, respectively) | 1,287,828 | 958,236 | 4,228,786 |
| Receivables for | |||
| Investments sold | 5,000 | 1,022,082 | 430,000 |
| Fund shares sold | 17,740 | 61,910 | 237,699 |
| Interest | 1,245,046 | 1,575,108 | 5,335,772 |
| Receivable from investment adviser | 1,709 | 8,902 | — |
| Other assets | 10,367 | 11,853 | 9,924 |
| Total assets | $99,875,618 | $121,169,085 | $382,608,515 |
| Liabilities | |||
| Payables for | |||
| Distributions | $17,153 | $29,846 | $99,483 |
| Fund shares reacquired | 99,309 | 709,927 | 1,959,254 |
| When-issued investments purchased | 981,660 | 385,377 | 3,171,690 |
| Payable to affiliates | |||
| Investment adviser | — | — | 3,866 |
| Administrative services fee | 201 | 226 | 530 |
| Shareholder servicing costs | 14,979 | 27,809 | 80,993 |
| Distribution and service fees | 1,541 | 1,680 | 4,618 |
| Payable for independent Trustees' compensation | — | 2,238 | 2,230 |
| Accrued expenses and other liabilities | 63,411 | 56,404 | 80,517 |
| Total liabilities | $1,178,254 | $1,213,507 | $5,403,181 |
| Net assets | $98,697,364 | $119,955,578 | $377,205,334 |
| Net assets consist of | |||
| Paid-in capital | $114,439,428 | $135,162,369 | $428,078,912 |
| Total distributable earnings (loss) | (15,742,064) | (15,206,791) | (50,873,578) |
| Net assets | $98,697,364 | $119,955,578 | $377,205,334 |
53
Statements of Assets and Liabilities (unaudited) – continued
| Georgia Fund | Maryland Fund | Massachusetts Fund | |
| Net assets | |||
| Class A | $74,894,939 | $81,879,554 | $222,520,948 |
| Class B | 48,396 | 206,026 | 147,401 |
| Class I | 11,194,190 | 28,414,589 | 145,325,579 |
| Class R6 | 12,559,839 | 9,455,409 | 9,211,406 |
| Total net assets | $98,697,364 | $119,955,578 | $377,205,334 |
| Shares of beneficial interest outstanding | |||
| Class A | 7,940,175 | 8,682,017 | 23,170,031 |
| Class B | 5,112 | 21,856 | 15,323 |
| Class I | 1,308,871 | 3,340,008 | 17,288,459 |
| Class R6 | 1,467,731 | 1,111,179 | 1,095,154 |
| Total shares of beneficial interest outstanding | 10,721,889 | 13,155,060 | 41,568,967 |
| Class A shares | |||
| Net asset value per share (net assets / shares of beneficial interest outstanding) | $9.43 | $9.43 | $9.60 |
| Offering price per share (100 / 95.75 x net asset value per share) | $9.85 | $9.85 | $10.03 |
| Class B shares | |||
| Net asset value and offering price per share (net assets / shares of beneficial interest outstanding) | $9.47 | $9.43 | $9.62 |
| Class I shares | |||
| Net asset value, offering price, and redemption price per share (net assets / shares of beneficial interest outstanding) | $8.55 | $8.51 | $8.41 |
| Class R6 shares | |||
| Net asset value, offering price, and redemption price per share (net assets / shares of beneficial interest outstanding) | $8.56 | $8.51 | $8.41 |
| On sales of $100,000 or more, the maximum offering price of Class A shares is reduced. A contingent deferred sales charge may be imposed on redemptions of Class A and Class B shares. | |||
See Notes to Financial Statements
54
Financial Statements
Statements of Operations
Six months ended 9/30/23 (unaudited)
These statements describe how much
each fund earned in investment income and accrued in expenses. They also describe any gains or losses generated by each fund’s operations.
| Alabama Fund | Arkansas Fund | California Fund | |
| Net investment income (loss) | |||
| Interest | $1,237,557 | $2,618,205 | $9,721,201 |
| Dividends from affiliated issuers | 32,587 | 48,553 | 182,731 |
| Other | 41 | 67 | 155 |
| Total investment income | $1,270,185 | $2,666,825 | $9,904,087 |
| Expenses | |||
| Management fee | $152,824 | $329,509 | $1,123,633 |
| Distribution and service fees | 56,956 | 155,141 | 437,361 |
| Shareholder servicing costs | 25,425 | 54,594 | 167,985 |
| Administrative services fee | 10,036 | 15,673 | 41,003 |
| Independent Trustees' compensation | 1,665 | 2,277 | 5,252 |
| Custodian fee | 10,499 | 14,426 | 36,177 |
| Shareholder communications | 3,653 | 4,653 | 7,938 |
| Audit and tax fees | 32,884 | 32,886 | 32,892 |
| Legal fees | 2,566 | 1,987 | 9,090 |
| Registration fees | 29,788 | 30,954 | 41,676 |
| Miscellaneous | 13,242 | 13,904 | 17,286 |
| Total expenses | $339,538 | $656,004 | $1,920,293 |
| Fees paid indirectly | (38) | (46) | (416) |
| Reduction of expenses by investment adviser and distributor | (62,803) | (155,500) | (259,869) |
| Net expenses | $276,697 | $500,458 | $1,660,008 |
| Net investment income (loss) | $993,488 | $2,166,367 | $8,244,079 |
| Realized and unrealized gain (loss) | |||
| Realized gain (loss) (identified cost basis) | |||
| Unaffiliated issuers | $(388,478) | $(343,406) | $(976,246) |
| Affiliated issuers | (95) | (922) | (2,557) |
| Net realized gain (loss) | $(388,573) | $(344,328) | $(978,803) |
| Change in unrealized appreciation or depreciation | |||
| Unaffiliated issuers | $(3,809,839) | $(9,499,498) | $(26,690,503) |
| Affiliated issuers | (140) | (138) | (276) |
| Net unrealized gain (loss) | $(3,809,979) | $(9,499,636) | $(26,690,779) |
| Net realized and unrealized gain (loss) | $(4,198,552) | $(9,843,964) | $(27,669,582) |
| Change in net assets from operations | $(3,205,064) | $(7,677,597) | $(19,425,503) |
See Notes to Financial Statements
55
Statements of Operations (unaudited) –
continued
| Six months ended 9/30/23 | Georgia Fund | Maryland Fund | Massachusetts Fund |
| Net investment income (loss) | |||
| Interest | $1,844,064 | $2,398,548 | $7,142,213 |
| Dividends from affiliated issuers | 32,085 | 42,981 | 123,804 |
| Other | 57 | 62 | 142 |
| Total investment income | $1,876,206 | $2,441,591 | $7,266,159 |
| Expenses | |||
| Management fee | $234,663 | $287,738 | $893,763 |
| Distribution and service fees | 99,365 | 113,541 | 301,326 |
| Shareholder servicing costs | 27,426 | 49,823 | 159,370 |
| Administrative services fee | 12,647 | 14,340 | 33,670 |
| Independent Trustees' compensation | 1,940 | 2,271 | 4,431 |
| Custodian fee | 13,544 | 12,861 | 28,100 |
| Shareholder communications | 4,340 | 4,372 | 6,737 |
| Audit and tax fees | 32,886 | 32,886 | 32,891 |
| Legal fees | 2,882 | 5,482 | 13,533 |
| Registration fees | 29,924 | 31,892 | 31,545 |
| Miscellaneous | 13,704 | 13,924 | 15,984 |
| Total expenses | $473,321 | $569,130 | $1,521,350 |
| Fees paid indirectly | (57) | (32) | (216) |
| Reduction of expenses by investment adviser and distributor | (38,232) | (87,607) | (90,097) |
| Net expenses | $435,032 | $481,491 | $1,431,037 |
| Net investment income (loss) | $1,441,174 | $1,960,100 | $5,835,122 |
| Realized and unrealized gain (loss) | |||
| Realized gain (loss) (identified cost basis) | |||
| Unaffiliated issuers | $(155,857) | $(222,527) | $(1,397,794) |
| Affiliated issuers | (431) | 1,043 | (1,857) |
| Net realized gain (loss) | $(156,288) | $(221,484) | $(1,399,651) |
| Change in unrealized appreciation or depreciation | |||
| Unaffiliated issuers | $(5,942,380) | $(7,037,533) | $(20,620,262) |
| Affiliated issuers | (292) | (419) | (338) |
| Net unrealized gain (loss) | $(5,942,672) | $(7,037,952) | $(20,620,600) |
| Net realized and unrealized gain (loss) | $(6,098,960) | $(7,259,436) | $(22,020,251) |
| Change in net assets from operations | $(4,657,786) | $(5,299,336) | $(16,185,129) |
See Notes to Financial Statements
56
Financial Statements
Statements of Changes in Net
Assets
These statements describe the
increases and/or decreases in net assets resulting from operations, any distributions, and any shareholder transactions.
| Six months ended 9/30/23 (unaudited) | Alabama Fund | Arkansas Fund | California Fund |
| Change in net assets | |||
| From operations | |||
| Net investment income (loss) | $993,488 | $2,166,367 | $8,244,079 |
| Net realized gain (loss) | (388,573) | (344,328) | (978,803) |
| Net unrealized gain (loss) | (3,809,979) | (9,499,636) | (26,690,779) |
| Change in net assets from operations | $(3,205,064) | $(7,677,597) | $(19,425,503) |
| Total distributions to shareholders | $(1,021,509) | $(2,205,916) | $(8,693,661) |
| Change in net assets from fund share transactions | $(1,862,938) | $260,902 | $28,319,477 |
| Total change in net assets | $(6,089,511) | $(9,622,611) | $200,313 |
| Net assets | |||
| At beginning of period | 69,692,713 | 148,287,286 | 495,091,996 |
| At end of period | $63,603,202 | $138,664,675 | $495,292,309 |
| Six months ended 9/30/23 (unaudited) | Georgia Fund | Maryland Fund | Massachusetts Fund |
| Change in net assets | |||
| From operations | |||
| Net investment income (loss) | $1,441,174 | $1,960,100 | $5,835,122 |
| Net realized gain (loss) | (156,288) | (221,484) | (1,399,651) |
| Net unrealized gain (loss) | (5,942,672) | (7,037,952) | (20,620,600) |
| Change in net assets from operations | $(4,657,786) | $(5,299,336) | $(16,185,129) |
| Total distributions to shareholders | $(1,484,548) | $(2,017,479) | $(6,011,636) |
| Change in net assets from fund share transactions | $(287,556) | $(1,632,999) | $(6,797,747) |
| Total change in net assets | $(6,429,890) | $(8,949,814) | $(28,994,512) |
| Net assets | |||
| At beginning of period | 105,127,254 | 128,905,392 | 406,199,846 |
| At end of period | $98,697,364 | $119,955,578 | $377,205,334 |
See Notes to Financial Statements
57
Statements of Changes in Net Assets –
continued
| Year ended 3/31/23 | Alabama Fund | Arkansas Fund | California Fund |
| Change in net assets | |||
| From operations | |||
| Net investment income (loss) | $1,900,283 | $4,066,652 | $15,087,890 |
| Net realized gain (loss) | (3,251,665) | (2,958,247) | (17,308,102) |
| Net unrealized gain (loss) | (1,588,812) | (4,537,002) | (15,378,465) |
| Change in net assets from operations | $(2,940,194) | $(3,428,597) | $(17,598,677) |
| Total distributions to shareholders | $(1,949,555) | $(4,258,041) | $(15,555,001) |
| Change in net assets from fund share transactions | $(23,021,418) | $(14,864,563) | $(58,558,889) |
| Total change in net assets | $(27,911,167) | $(22,551,201) | $(91,712,567) |
| Net assets | |||
| At beginning of period | 97,603,880 | 170,838,487 | 586,804,563 |
| At end of period | $69,692,713 | $148,287,286 | $495,091,996 |
| Year ended 3/31/23 | Georgia Fund | Maryland Fund | Massachusetts Fund |
| Change in net assets | |||
| From operations | |||
| Net investment income (loss) | $2,669,959 | $3,086,315 | $10,273,856 |
| Net realized gain (loss) | (4,548,239) | (3,054,181) | (9,629,585) |
| Net unrealized gain (loss) | (1,275,352) | (1,132,077) | (8,711,265) |
| Change in net assets from operations | $(3,153,632) | $(1,099,943) | $(8,066,994) |
| Total distributions to shareholders | $(2,729,363) | $(3,232,520) | $(11,284,840) |
| Change in net assets from fund share transactions | $(23,998,632) | $15,517,451 | $18,426,365 |
| Total change in net assets | $(29,881,627) | $11,184,988 | $(925,469) |
| Net assets | |||
| At beginning of period | 135,008,881 | 117,720,404 | 407,125,315 |
| At end of period | $105,127,254 | $128,905,392 | $406,199,846 |
See Notes to Financial Statements
58
Financial Statements
Financial Highlights
MFS ALABAMA MUNICIPAL BOND
FUND
The financial highlights table is
intended to help you understand the fund's financial performance for the semiannual period and the past 5 fiscal years. Certain information reflects financial results for a single fund share. The total returns in the
table represent the rate that an investor would have earned (or lost) on an investment in the fund share class (assuming reinvestment of all distributions) held for the entire period.
| Six months ended | Year ended | |||||
| Class A | 9/30/23 (unaudited) | 3/31/23 | 3/31/22 | 3/31/21 | 3/31/20 | 3/31/19 |
| Net asset value, beginning of period | $9.41 | $9.89 | $10.46 | $10.18 | $10.15 | $10.02 |
| Income (loss) from investment operations | ||||||
| Net investment income (loss) (d) | $0.13 | $0.22 | $0.16 | $0.22 | $0.27 | $0.36 |
| Net realized and unrealized gain (loss) | (0.57) | (0.47) | (0.57) | 0.28 | 0.02 | 0.09 |
| Total from investment operations | $(0.44) | $(0.25) | $(0.41) | $0.50 | $0.29 | $0.45 |
| Less distributions declared to shareholders | ||||||
| From net investment income | $(0.14) | $(0.23) | $(0.16) | $(0.22) | $(0.26) | $(0.32) |
| Net asset value, end of period (x) | $8.83 | $9.41 | $9.89 | $10.46 | $10.18 | $10.15 |
| Total return (%) (r)(s)(t)(x) | (4.77)(n) | (2.52) | (4.00) | 4.91 | 2.89 | 4.63 |
| Ratios (%) (to average net assets) and Supplemental data: | ||||||
| Expenses before expense reductions (f) | 1.09(a) | 1.05 | 0.99 | 1.01 | 1.04 | 1.09 |
| Expenses after expense reductions (f) | 0.90(a) | 0.90 | 0.90 | 0.90 | 0.90 | 0.90 |
| Net investment income (loss) | 2.84(a) | 2.33 | 1.52 | 2.07 | 2.56 | 3.60 |
| Portfolio turnover | 10(n) | 30 | 10 | 25 | 30 | 19 |
| Net assets at end of period (000 omitted) | $42,577 | $46,256 | $62,260 | $61,257 | $53,321 | $51,280 |
| Six months ended | Year ended | |||||
| Class B | 9/30/23 (unaudited) | 3/31/23 | 3/31/22 | 3/31/21 | 3/31/20 | 3/31/19 |
| Net asset value, beginning of period | $9.41 | $9.90 | $10.47 | $10.18 | $10.15 | $10.02 |
| Income (loss) from investment operations | ||||||
| Net investment income (loss) (d) | $0.10 | $0.15 | $0.08 | $0.15 | $0.19 | $0.28 |
| Net realized and unrealized gain (loss) | (0.58) | (0.48) | (0.57) | 0.28 | 0.03 | 0.10 |
| Total from investment operations | $(0.48) | $(0.33) | $(0.49) | $0.43 | $0.22 | $0.38 |
| Less distributions declared to shareholders | ||||||
| From net investment income | $(0.10) | $(0.16) | $(0.08) | $(0.14) | $(0.19) | $(0.25) |
| Net asset value, end of period (x) | $8.83 | $9.41 | $9.90 | $10.47 | $10.18 | $10.15 |
| Total return (%) (r)(s)(t)(x) | (5.13)(n) | (3.35) | (4.71) | 4.24 | 2.13 | 3.85 |
| Ratios (%) (to average net assets) and Supplemental data: | ||||||
| Expenses before expense reductions (f) | 1.84(a) | 1.80 | 1.74 | 1.77 | 1.80 | 1.84 |
| Expenses after expense reductions (f) | 1.65(a) | 1.65 | 1.65 | 1.65 | 1.65 | 1.65 |
| Net investment income (loss) | 2.09(a) | 1.60 | 0.77 | 1.44 | 1.86 | 2.85 |
| Portfolio turnover | 10(n) | 30 | 10 | 25 | 30 | 19 |
| Net assets at end of period (000 omitted) | $54 | $59 | $61 | $64 | $176 | $250 |
See Notes to Financial Statements
59
Financial
Highlights − continued
MFS ALABAMA MUNICIPAL BOND
FUND − continued
| Six months ended | Year ended | |||||
| Class I | 9/30/23 (unaudited) | 3/31/23 | 3/31/22 | 3/31/21 | 3/31/20 | 3/31/19 |
| Net asset value, beginning of period | $8.97 | $9.43 | $9.97 | $9.70 | $9.67 | $9.55 |
| Income (loss) from investment operations | ||||||
| Net investment income (loss) (d) | $0.14 | $0.23 | $0.18 | $0.23 | $0.27 | $0.37 |
| Net realized and unrealized gain (loss) | (0.56) | (0.45) | (0.54) | 0.27 | 0.04 | 0.08 |
| Total from investment operations | $(0.42) | $(0.22) | $(0.36) | $0.50 | $0.31 | $0.45 |
| Less distributions declared to shareholders | ||||||
| From net investment income | $(0.14) | $(0.24) | $(0.18) | $(0.23) | $(0.28) | $(0.33) |
| Net asset value, end of period (x) | $8.41 | $8.97 | $9.43 | $9.97 | $9.70 | $9.67 |
| Total return (%) (r)(s)(t)(x) | (4.74)(n) | (2.31) | (3.73) | 5.21 | 3.15 | 4.83 |
| Ratios (%) (to average net assets) and Supplemental data: | ||||||
| Expenses before expense reductions (f) | 0.84(a) | 0.80 | 0.74 | 0.76 | 0.79 | 0.84 |
| Expenses after expense reductions (f) | 0.65(a) | 0.65 | 0.65 | 0.65 | 0.65 | 0.65 |
| Net investment income (loss) | 3.09(a) | 2.57 | 1.77 | 2.31 | 2.77 | 3.85 |
| Portfolio turnover | 10(n) | 30 | 10 | 25 | 30 | 19 |
| Net assets at end of period (000 omitted) | $17,759 | $20,064 | $30,262 | $29,971 | $22,796 | $11,490 |
| Six months ended | Year ended | |||||
| Class R6 | 9/30/23 (unaudited) | 3/31/23 | 3/31/22 | 3/31/21 | 3/31/20 | 3/31/19 |
| Net asset value, beginning of period | $8.97 | $9.43 | $9.97 | $9.70 | $9.67 | $9.55 |
| Income (loss) from investment operations | ||||||
| Net investment income (loss) (d) | $0.14 | $0.24 | $0.18 | $0.23 | $0.28 | $0.37 |
| Net realized and unrealized gain (loss) | (0.56) | (0.46) | (0.54) | 0.28 | 0.03 | 0.09 |
| Total from investment operations | $(0.42) | $(0.22) | $(0.36) | $0.51 | $0.31 | $0.46 |
| Less distributions declared to shareholders | ||||||
| From net investment income | $(0.14) | $(0.24) | $(0.18) | $(0.24) | $(0.28) | $(0.34) |
| Net asset value, end of period (x) | $8.41 | $8.97 | $9.43 | $9.97 | $9.70 | $9.67 |
| Total return (%) (r)(s)(t)(x) | (4.70)(n) | (2.24) | (3.66) | 5.28 | 3.23 | 4.92 |
| Ratios (%) (to average net assets) and Supplemental data: | ||||||
| Expenses before expense reductions (f) | 0.76(a) | 0.73 | 0.67 | 0.69 | 0.71 | 0.77 |
| Expenses after expense reductions (f) | 0.58(a) | 0.58 | 0.58 | 0.58 | 0.57 | 0.58 |
| Net investment income (loss) | 3.16(a) | 2.63 | 1.83 | 2.35 | 2.85 | 3.92 |
| Portfolio turnover | 10(n) | 30 | 10 | 25 | 30 | 19 |
| Net assets at end of period (000 omitted) | $3,213 | $3,314 | $5,020 | $3,867 | $2,100 | $1,242 |
See Notes to Financial Statements
60
Financial
Highlights − continued
MFS ALABAMA MUNICIPAL BOND
FUND − continued
| (a) | Annualized. |
| (d) | Per share data is based on average shares outstanding. |
| (f) | Ratios do not reflect reductions from fees paid indirectly, if applicable. See Note 2 in the Notes to Financial Statements for additional information. |
| (n) | Not annualized. |
| (r) | Certain expenses have been reduced without which performance would have been lower. |
| (s) | From time to time the fund may receive proceeds from litigation settlements, without which performance would be lower. |
| (t) | Total returns do not include any applicable sales charges. |
| (x) | The net asset values and total returns have been calculated on net assets which include adjustments made in accordance with U.S. generally accepted accounting principles required at period end for financial reporting purposes. |
See Notes to Financial Statements
61
Financial
Highlights − continued
MFS ARKANSAS MUNICIPAL BOND FUND
The financial highlights table is
intended to help you understand the fund's financial performance for the semiannual period and the past 5 fiscal years. Certain information reflects financial results for a single fund share. The total returns in the
table represent the rate that an investor would have earned (or lost) on an investment in the fund share class (assuming reinvestment of all distributions) held for the entire period.
| Six months ended | Year ended | |||||
| Class A | 9/30/23 (unaudited) | 3/31/23 | 3/31/22 | 3/31/21 | 3/31/20 | 3/31/19 |
| Net asset value, beginning of period | $9.12 | $9.54 | $10.07 | $9.75 | $9.80 | $9.64 |
| Income (loss) from investment operations | ||||||
| Net investment income (loss) (d) | $0.13 | $0.24 | $0.22 | $0.25 | $0.27 | $0.33 |
| Net realized and unrealized gain (loss) | (0.61) | (0.41) | (0.54) | 0.32 | (0.05) | 0.12 |
| Total from investment operations | $(0.48) | $(0.17) | $(0.32) | $0.57 | $0.22 | $0.45 |
| Less distributions declared to shareholders | ||||||
| From net investment income | $(0.13) | $(0.25) | $(0.21) | $(0.25) | $(0.27) | $(0.29) |
| Net asset value, end of period (x) | $8.51 | $9.12 | $9.54 | $10.07 | $9.75 | $9.80 |
| Total return (%) (r)(s)(t)(x) | (5.27)(n) | (1.73) | (3.22) | 5.85 | 2.27 | 4.74 |
| Ratios (%) (to average net assets) and Supplemental data: | ||||||
| Expenses before expense reductions (f) | 0.94(a) | 0.93 | 0.91 | 0.91 | 0.92 | 0.93 |
| Expenses after expense reductions (f) | 0.70(a) | 0.70 | 0.71 | 0.75 | 0.76 | 0.77 |
| Net investment income (loss) | 2.94(a) | 2.63 | 2.15 | 2.47 | 2.77 | 3.40 |
| Portfolio turnover | 6(n) | 26 | 17 | 22 | 20 | 14 |
| Net assets at end of period (000 omitted) | $115,825 | $124,509 | $128,341 | $133,754 | $123,979 | $121,888 |
| Six months ended | Year ended | |||||
| Class B | 9/30/23 (unaudited) | 3/31/23 | 3/31/22 | 3/31/21 | 3/31/20 | 3/31/19 |
| Net asset value, beginning of period | $9.13 | $9.55 | $10.08 | $9.76 | $9.81 | $9.65 |
| Income (loss) from investment operations | ||||||
| Net investment income (loss) (d) | $0.10 | $0.17 | $0.14 | $0.18 | $0.20 | $0.25 |
| Net realized and unrealized gain (loss) | (0.61) | (0.41) | (0.53) | 0.31 | (0.05) | 0.13 |
| Total from investment operations | $(0.51) | $(0.24) | $(0.39) | $0.49 | $0.15 | $0.38 |
| Less distributions declared to shareholders | ||||||
| From net investment income | $(0.10) | $(0.18) | $(0.14) | $(0.17) | $(0.20) | $(0.22) |
| Net asset value, end of period (x) | $8.52 | $9.13 | $9.55 | $10.08 | $9.76 | $9.81 |
| Total return (%) (r)(s)(t)(x) | (5.62)(n) | (2.46) | (3.94) | 5.07 | 1.51 | 3.97 |
| Ratios (%) (to average net assets) and Supplemental data: | ||||||
| Expenses before expense reductions (f) | 1.69(a) | 1.68 | 1.66 | 1.66 | 1.67 | 1.68 |
| Expenses after expense reductions (f) | 1.45(a) | 1.45 | 1.46 | 1.50 | 1.51 | 1.52 |
| Net investment income (loss) | 2.19(a) | 1.87 | 1.41 | 1.79 | 2.03 | 2.64 |
| Portfolio turnover | 6(n) | 26 | 17 | 22 | 20 | 14 |
| Net assets at end of period (000 omitted) | $221 | $295 | $480 | $610 | $1,587 | $2,477 |
See Notes to Financial Statements
62
Financial
Highlights − continued
MFS ARKANSAS MUNICIPAL BOND
FUND − continued
| Six months ended | Year ended | |||||
| Class I | 9/30/23 (unaudited) | 3/31/23 | 3/31/22 | 3/31/21 | 3/31/20 | 3/31/19 |
| Net asset value, beginning of period | $9.05 | $9.47 | $9.99 | $9.68 | $9.73 | $9.57 |
| Income (loss) from investment operations | ||||||
| Net investment income (loss) (d) | $0.14 | $0.24 | $0.22 | $0.25 | $0.28 | $0.33 |
| Net realized and unrealized gain (loss) | (0.60) | (0.40) | (0.52) | 0.31 | (0.05) | 0.13 |
| Total from investment operations | $(0.46) | $(0.16) | $(0.30) | $0.56 | $0.23 | $0.46 |
| Less distributions declared to shareholders | ||||||
| From net investment income | $(0.14) | $(0.26) | $(0.22) | $(0.25) | $(0.28) | $(0.30) |
| Net asset value, end of period (x) | $8.45 | $9.05 | $9.47 | $9.99 | $9.68 | $9.73 |
| Total return (%) (r)(s)(t)(x) | (5.17)(n) | (1.67) | (3.07) | 5.88 | 2.36 | 4.86 |
| Ratios (%) (to average net assets) and Supplemental data: | ||||||
| Expenses before expense reductions (f) | 0.69(a) | 0.68 | 0.66 | 0.66 | 0.67 | 0.68 |
| Expenses after expense reductions (f) | 0.60(a) | 0.60 | 0.61 | 0.65 | 0.66 | 0.67 |
| Net investment income (loss) | 3.04(a) | 2.68 | 2.25 | 2.56 | 2.86 | 3.49 |
| Portfolio turnover | 6(n) | 26 | 17 | 22 | 20 | 14 |
| Net assets at end of period (000 omitted) | $17,377 | $18,194 | $36,162 | $34,603 | $29,078 | $26,586 |
| Six months ended | Year ended | |||||
| Class R6 | 9/30/23 (unaudited) | 3/31/23 | 3/31/22 | 3/31/21 | 3/31/20 | 3/31/19 |
| Net asset value, beginning of period | $9.05 | $9.47 | $9.99 | $9.68 | $9.73 | $9.58 |
| Income (loss) from investment operations | ||||||
| Net investment income (loss) (d) | $0.14 | $0.25 | $0.23 | $0.26 | $0.29 | $0.34 |
| Net realized and unrealized gain (loss) | (0.60) | (0.41) | (0.52) | 0.31 | (0.05) | 0.11 |
| Total from investment operations | $(0.46) | $(0.16) | $(0.29) | $0.57 | $0.24 | $0.45 |
| Less distributions declared to shareholders | ||||||
| From net investment income | $(0.14) | $(0.26) | $(0.23) | $(0.26) | $(0.29) | $(0.30) |
| Net asset value, end of period (x) | $8.45 | $9.05 | $9.47 | $9.99 | $9.68 | $9.73 |
| Total return (%) (r)(s)(t)(x) | (5.13)(n) | (1.60) | (3.00) | 5.95 | 2.44 | 4.83 |
| Ratios (%) (to average net assets) and Supplemental data: | ||||||
| Expenses before expense reductions (f) | 0.61(a) | 0.61 | 0.58 | 0.58 | 0.59 | 0.60 |
| Expenses after expense reductions (f) | 0.53(a) | 0.53 | 0.54 | 0.57 | 0.58 | 0.59 |
| Net investment income (loss) | 3.11(a) | 2.79 | 2.31 | 2.58 | 2.92 | 3.58 |
| Portfolio turnover | 6(n) | 26 | 17 | 22 | 20 | 14 |
| Net assets at end of period (000 omitted) | $5,241 | $5,290 | $5,856 | $3,971 | $1,538 | $954 |
See Notes to Financial Statements
63
Financial
Highlights − continued
MFS ARKANSAS MUNICIPAL BOND
FUND − continued
| (a) | Annualized. |
| (d) | Per share data is based on average shares outstanding. |
| (f) | Ratios do not reflect reductions from fees paid indirectly, if applicable. See Note 2 in the Notes to Financial Statements for additional information. |
| (n) | Not annualized. |
| (r) | Certain expenses have been reduced without which performance would have been lower. |
| (s) | From time to time the fund may receive proceeds from litigation settlements, without which performance would be lower. |
| (t) | Total returns do not include any applicable sales charges. |
| (x) | The net asset values and total returns have been calculated on net assets which include adjustments made in accordance with U.S. generally accepted accounting principles required at period end for financial reporting purposes. |
See Notes to Financial Statements
64
Financial
Highlights − continued
MFS CALIFORNIA MUNICIPAL BOND FUND
The financial highlights table is
intended to help you understand the fund's financial performance for the semiannual period and the past 5 fiscal years. Certain information reflects financial results for a single fund share. The total returns in the
table represent the rate that an investor would have earned (or lost) on an investment in the fund share class (assuming reinvestment of all distributions) held for the entire period.
| Six months ended | Year ended | |||||
| Class A | 9/30/23 (unaudited) | 3/31/23 | 3/31/22 | 3/31/21 | 3/31/20 | 3/31/19 |
| Net asset value, beginning of period | $5.53 | $5.87 | $6.24 | $5.97 | $6.04 | $5.94 |
| Income (loss) from investment operations | ||||||
| Net investment income (loss) (d) | $0.09 | $0.17 | $0.14 | $0.15 | $0.18 | $0.22 |
| Net realized and unrealized gain (loss) | (0.30) | (0.34) | (0.37) | 0.28 | (0.07) | 0.08 |
| Total from investment operations | $(0.21) | $(0.17) | $(0.23) | $0.43 | $0.11 | $0.30 |
| Less distributions declared to shareholders | ||||||
| From net investment income | $(0.09) | $(0.17) | $(0.14) | $(0.16) | $(0.18) | $(0.20) |
| Net asset value, end of period (x) | $5.23 | $5.53 | $5.87 | $6.24 | $5.97 | $6.04 |
| Total return (%) (r)(s)(t)(x) | (3.77)(n) | (2.83) | (3.82) | 7.24 | 1.76 | 5.21 |
| Ratios (%) (to average net assets) and Supplemental data: | ||||||
| Expenses before expense reductions (f) | 0.85(a) | 0.86 | 0.84 | 0.84 | 0.86 | 0.87 |
| Expenses after expense reductions (f) | 0.69(a) | 0.70 | 0.68 | 0.68 | 0.70 | 0.71 |
| Net investment income (loss) | 3.28(a) | 3.00 | 2.22 | 2.50 | 2.94 | 3.76 |
| Portfolio turnover | 9(n) | 36 | 25 | 31 | 22 | 15 |
| Net assets at end of period (000 omitted) | $296,946 | $303,141 | $362,465 | $396,643 | $374,941 | $299,882 |
| Six months ended | Year ended | |||||
| Class B | 9/30/23 (unaudited) | 3/31/23 | 3/31/22 | 3/31/21 | 3/31/20 | 3/31/19 |
| Net asset value, beginning of period | $5.53 | $5.87 | $6.24 | $5.97 | $6.04 | $5.94 |
| Income (loss) from investment operations | ||||||
| Net investment income (loss) (d) | $0.07 | $0.12 | $0.09 | $0.11 | $0.14 | $0.18 |
| Net realized and unrealized gain (loss) | (0.30) | (0.33) | (0.37) | 0.27 | (0.08) | 0.08 |
| Total from investment operations | $(0.23) | $(0.21) | $(0.28) | $0.38 | $0.06 | $0.26 |
| Less distributions declared to shareholders | ||||||
| From net investment income | $(0.07) | $(0.13) | $(0.09) | $(0.11) | $(0.13) | $(0.16) |
| Net asset value, end of period (x) | $5.23 | $5.53 | $5.87 | $6.24 | $5.97 | $6.04 |
| Total return (%) (r)(s)(t)(x) | (4.13)(n) | (3.55) | (4.54) | 6.45 | 1.00 | 4.43 |
| Ratios (%) (to average net assets) and Supplemental data: | ||||||
| Expenses before expense reductions (f) | 1.61(a) | 1.61 | 1.59 | 1.59 | 1.61 | 1.62 |
| Expenses after expense reductions (f) | 1.44(a) | 1.45 | 1.43 | 1.43 | 1.45 | 1.46 |
| Net investment income (loss) | 2.53(a) | 2.23 | 1.48 | 1.78 | 2.22 | 3.01 |
| Portfolio turnover | 9(n) | 36 | 25 | 31 | 22 | 15 |
| Net assets at end of period (000 omitted) | $224 | $247 | $451 | $627 | $1,033 | $1,506 |
See Notes to Financial Statements
65
Financial
Highlights − continued
MFS CALIFORNIA MUNICIPAL BOND
FUND − continued
| Six months ended | Year ended | |||||
| Class C | 9/30/23 (unaudited) | 3/31/23 | 3/31/22 | 3/31/21 | 3/31/20 | 3/31/19 |
| Net asset value, beginning of period | $5.55 | $5.88 | $6.26 | $5.99 | $6.06 | $5.96 |
| Income (loss) from investment operations | ||||||
| Net investment income (loss) (d) | $0.07 | $0.12 | $0.08 | $0.10 | $0.13 | $0.17 |
| Net realized and unrealized gain (loss) | (0.31) | (0.33) | (0.38) | 0.27 | (0.08) | 0.08 |
| Total from investment operations | $(0.24) | $(0.21) | $(0.30) | $0.37 | $0.05 | $0.25 |
| Less distributions declared to shareholders | ||||||
| From net investment income | $(0.07) | $(0.12) | $(0.08) | $(0.10) | $(0.12) | $(0.15) |
| Net asset value, end of period (x) | $5.24 | $5.55 | $5.88 | $6.26 | $5.99 | $6.06 |
| Total return (%) (r)(s)(t)(x) | (4.36)(n) | (3.51) | (4.83) | 6.27 | 0.85 | 4.26 |
| Ratios (%) (to average net assets) and Supplemental data: | ||||||
| Expenses before expense reductions (f) | 1.61(a) | 1.61 | 1.59 | 1.59 | 1.61 | 1.62 |
| Expenses after expense reductions (f) | 1.59(a) | 1.60 | 1.58 | 1.58 | 1.60 | 1.61 |
| Net investment income (loss) | 2.38(a) | 2.08 | 1.33 | 1.62 | 2.05 | 2.86 |
| Portfolio turnover | 9(n) | 36 | 25 | 31 | 22 | 15 |
| Net assets at end of period (000 omitted) | $10,286 | $11,377 | $16,767 | $21,410 | $25,552 | $22,786 |
| Six months ended | Year ended | |||||
| Class I | 9/30/23 (unaudited) | 3/31/23 | 3/31/22 | 3/31/21 | 3/31/20 | 3/31/19 |
| Net asset value, beginning of period | $9.00 | $9.55 | $10.16 | $9.71 | $9.83 | $9.67 |
| Income (loss) from investment operations | ||||||
| Net investment income (loss) (d) | $0.15 | $0.28 | $0.24 | $0.26 | $0.31 | $0.37 |
| Net realized and unrealized gain (loss) | (0.48) | (0.54) | (0.61) | 0.46 | (0.13) | 0.13 |
| Total from investment operations | $(0.33) | $(0.26) | $(0.37) | $0.72 | $0.18 | $0.50 |
| Less distributions declared to shareholders | ||||||
| From net investment income | $(0.16) | $(0.29) | $(0.24) | $(0.27) | $(0.30) | $(0.34) |
| Net asset value, end of period (x) | $8.51 | $9.00 | $9.55 | $10.16 | $9.71 | $9.83 |
| Total return (%) (r)(s)(t)(x) | (3.74)(n) | (2.70) | (3.80) | 7.46 | 1.79 | 5.27 |
| Ratios (%) (to average net assets) and Supplemental data: | ||||||
| Expenses before expense reductions (f) | 0.60(a) | 0.61 | 0.59 | 0.59 | 0.61 | 0.62 |
| Expenses after expense reductions (f) | 0.59(a) | 0.59 | 0.58 | 0.58 | 0.60 | 0.61 |
| Net investment income (loss) | 3.38(a) | 3.08 | 2.32 | 2.60 | 3.04 | 3.85 |
| Portfolio turnover | 9(n) | 36 | 25 | 31 | 22 | 15 |
| Net assets at end of period (000 omitted) | $129,369 | $124,323 | $153,882 | $157,366 | $128,914 | $79,276 |
See Notes to Financial Statements
66
Financial
Highlights − continued
MFS CALIFORNIA MUNICIPAL BOND
FUND − continued
| Six months ended | Year ended | |||||
| Class R6 | 9/30/23 (unaudited) | 3/31/23 | 3/31/22 | 3/31/21 | 3/31/20 | 3/31/19 |
| Net asset value, beginning of period | $9.00 | $9.54 | $10.16 | $9.71 | $9.82 | $9.66 |
| Income (loss) from investment operations | ||||||
| Net investment income (loss) (d) | $0.15 | $0.29 | $0.24 | $0.27 | $0.31 | $0.38 |
| Net realized and unrealized gain (loss) | (0.49) | (0.54) | (0.62) | 0.45 | (0.11) | 0.12 |
| Total from investment operations | $(0.34) | $(0.25) | $(0.38) | $0.72 | $0.20 | $0.50 |
| Less distributions declared to shareholders | ||||||
| From net investment income | $(0.16) | $(0.29) | $(0.24) | $(0.27) | $(0.31) | $(0.34) |
| Net asset value, end of period (x) | $8.50 | $9.00 | $9.54 | $10.16 | $9.71 | $9.82 |
| Total return (%) (r)(s)(t)(x) | (3.82)(n) | (2.52) | (3.83) | 7.54 | 1.97 | 5.36 |
| Ratios (%) (to average net assets) and Supplemental data: | ||||||
| Expenses before expense reductions (f) | 0.53(a) | 0.53 | 0.52 | 0.52 | 0.53 | 0.54 |
| Expenses after expense reductions (f) | 0.52(a) | 0.52 | 0.50 | 0.51 | 0.52 | 0.53 |
| Net investment income (loss) | 3.45(a) | 3.18 | 2.39 | 2.66 | 3.10 | 3.92 |
| Portfolio turnover | 9(n) | 36 | 25 | 31 | 22 | 15 |
| Net assets at end of period (000 omitted) | $58,467 | $56,005 | $53,240 | $40,556 | $28,396 | $12,773 |
| (a) | Annualized. |
| (d) | Per share data is based on average shares outstanding. |
| (f) | Ratios do not reflect reductions from fees paid indirectly, if applicable. See Note 2 in the Notes to Financial Statements for additional information. |
| (n) | Not annualized. |
| (r) | Certain expenses have been reduced without which performance would have been lower. |
| (s) | From time to time the fund may receive proceeds from litigation settlements, without which performance would be lower. |
| (t) | Total returns do not include any applicable sales charges. |
| (x) | The net asset values and total returns have been calculated on net assets which include adjustments made in accordance with U.S. generally accepted accounting principles required at period end for financial reporting purposes. |
See Notes to Financial Statements
67
Financial
Highlights − continued
MFS GEORGIA MUNICIPAL BOND FUND
The financial highlights table is
intended to help you understand the fund's financial performance for the semiannual period and the past 5 fiscal years. Certain information reflects financial results for a single fund share. The total returns in the
table represent the rate that an investor would have earned (or lost) on an investment in the fund share class (assuming reinvestment of all distributions) held for the entire period.
| Six months ended | Year ended | |||||
| Class A | 9/30/23 (unaudited) | 3/31/23 | 3/31/22 | 3/31/21 | 3/31/20 | 3/31/19 |
| Net asset value, beginning of period | $10.02 | $10.45 | $11.06 | $10.70 | $10.73 | $10.58 |
| Income (loss) from investment operations | ||||||
| Net investment income (loss) (d) | $0.13 | $0.23 | $0.17 | $0.21 | $0.26 | $0.36 |
| Net realized and unrealized gain (loss) | (0.58) | (0.43) | (0.61) | 0.36 | (0.02) | 0.11 |
| Total from investment operations | $(0.45) | $(0.20) | $(0.44) | $0.57 | $0.24 | $0.47 |
| Less distributions declared to shareholders | ||||||
| From net investment income | $(0.14) | $(0.23) | $(0.17) | $(0.21) | $(0.27) | $(0.32) |
| Net asset value, end of period (x) | $9.43 | $10.02 | $10.45 | $11.06 | $10.70 | $10.73 |
| Total return (%) (r)(s)(t)(x) | (4.56)(n) | (1.82) | (4.08) | 5.38 | 2.17 | 4.51 |
| Ratios (%) (to average net assets) and Supplemental data: | ||||||
| Expenses before expense reductions (f) | 0.97(a) | 0.96 | 0.91 | 0.92 | 0.95 | 1.02 |
| Expenses after expense reductions (f) | 0.90(a) | 0.90 | 0.90 | 0.90 | 0.90 | 0.90 |
| Net investment income (loss) | 2.70(a) | 2.29 | 1.53 | 1.94 | 2.39 | 3.41 |
| Portfolio turnover | 5(n) | 30 | 12 | 22 | 28 | 14 |
| Net assets at end of period (000 omitted) | $74,895 | $80,018 | $99,895 | $108,346 | $95,352 | $70,456 |
| Six months ended | Year ended | |||||
| Class B | 9/30/23 (unaudited) | 3/31/23 | 3/31/22 | 3/31/21 | 3/31/20 | 3/31/19 |
| Net asset value, beginning of period | $10.06 | $10.48 | $11.10 | $10.74 | $10.77 | $10.62 |
| Income (loss) from investment operations | ||||||
| Net investment income (loss) (d) | $0.10 | $0.15 | $0.09 | $0.14 | $0.19 | $0.28 |
| Net realized and unrealized gain (loss) | (0.59) | (0.41) | (0.63) | 0.35 | (0.03) | 0.11 |
| Total from investment operations | $(0.49) | $(0.26) | $(0.54) | $0.49 | $0.16 | $0.39 |
| Less distributions declared to shareholders | ||||||
| From net investment income | $(0.10) | $(0.16) | $(0.08) | $(0.13) | $(0.19) | $(0.24) |
| Net asset value, end of period (x) | $9.47 | $10.06 | $10.48 | $11.10 | $10.74 | $10.77 |
| Total return (%) (r)(s)(t)(x) | (4.89)(n) | (2.45) | (4.87) | 4.61 | 1.44 | 3.73 |
| Ratios (%) (to average net assets) and Supplemental data: | ||||||
| Expenses before expense reductions (f) | 1.72(a) | 1.71 | 1.66 | 1.68 | 1.71 | 1.77 |
| Expenses after expense reductions (f) | 1.65(a) | 1.65 | 1.65 | 1.63 | 1.63 | 1.65 |
| Net investment income (loss) | 1.94(a) | 1.52 | 0.77 | 1.29 | 1.72 | 2.67 |
| Portfolio turnover | 5(n) | 30 | 12 | 22 | 28 | 14 |
| Net assets at end of period (000 omitted) | $48 | $30 | $40 | $66 | $261 | $399 |
See Notes to Financial Statements
68
Financial
Highlights − continued
MFS GEORGIA MUNICIPAL BOND
FUND − continued
| Six months ended | Year ended | |||||
| Class I | 9/30/23 (unaudited) | 3/31/23 | 3/31/22 | 3/31/21 | 3/31/20 | 3/31/19 |
| Net asset value, beginning of period | $9.08 | $9.47 | $10.03 | $9.70 | $9.73 | $9.60 |
| Income (loss) from investment operations | ||||||
| Net investment income (loss) (d) | $0.13 | $0.23 | $0.18 | $0.21 | $0.26 | $0.35 |
| Net realized and unrealized gain (loss) | (0.52) | (0.39) | (0.56) | 0.34 | (0.02) | 0.09 |
| Total from investment operations | $(0.39) | $(0.16) | $(0.38) | $0.55 | $0.24 | $0.44 |
| Less distributions declared to shareholders | ||||||
| From net investment income | $(0.14) | $(0.23) | $(0.18) | $(0.22) | $(0.27) | $(0.31) |
| Net asset value, end of period (x) | $8.55 | $9.08 | $9.47 | $10.03 | $9.70 | $9.73 |
| Total return (%) (r)(s)(t)(x) | (4.39)(n) | (1.58) | (3.91) | 5.68 | 2.39 | 4.70 |
| Ratios (%) (to average net assets) and Supplemental data: | ||||||
| Expenses before expense reductions (f) | 0.72(a) | 0.71 | 0.66 | 0.67 | 0.70 | 0.77 |
| Expenses after expense reductions (f) | 0.65(a) | 0.65 | 0.65 | 0.65 | 0.65 | 0.65 |
| Net investment income (loss) | 2.95(a) | 2.54 | 1.78 | 2.16 | 2.64 | 3.65 |
| Portfolio turnover | 5(n) | 30 | 12 | 22 | 28 | 14 |
| Net assets at end of period (000 omitted) | $11,194 | $12,077 | $14,154 | $15,012 | $9,345 | $7,834 |
| Six months ended | Year ended | |||||
| Class R6 | 9/30/23 (unaudited) | 3/31/23 | 3/31/22 | 3/31/21 | 3/31/20 | 3/31/19 |
| Net asset value, beginning of period | $9.09 | $9.48 | $10.03 | $9.70 | $9.73 | $9.60 |
| Income (loss) from investment operations | ||||||
| Net investment income (loss) (d) | $0.13 | $0.23 | $0.18 | $0.22 | $0.27 | $0.36 |
| Net realized and unrealized gain (loss) | (0.52) | (0.38) | (0.55) | 0.33 | (0.03) | 0.09 |
| Total from investment operations | $(0.39) | $(0.15) | $(0.37) | $0.55 | $0.24 | $0.45 |
| Less distributions declared to shareholders | ||||||
| From net investment income | $(0.14) | $(0.24) | $(0.18) | $(0.22) | $(0.27) | $(0.32) |
| Net asset value, end of period (x) | $8.56 | $9.09 | $9.48 | $10.03 | $9.70 | $9.73 |
| Total return (%) (r)(s)(t)(x) | (4.36)(n) | (1.52) | (3.76) | 5.72 | 2.44 | 4.77 |
| Ratios (%) (to average net assets) and Supplemental data: | ||||||
| Expenses before expense reductions (f) | 0.67(a) | 0.66 | 0.62 | 0.62 | 0.65 | 0.70 |
| Expenses after expense reductions (f) | 0.60(a) | 0.60 | 0.60 | 0.60 | 0.60 | 0.59 |
| Net investment income (loss) | 3.00(a) | 2.55 | 1.82 | 2.20 | 2.68 | 3.72 |
| Portfolio turnover | 5(n) | 30 | 12 | 22 | 28 | 14 |
| Net assets at end of period (000 omitted) | $12,560 | $13,001 | $20,920 | $17,956 | $11,022 | $7,371 |
See Notes to Financial Statements
69
Financial
Highlights − continued
MFS GEORGIA MUNICIPAL BOND
FUND − continued
| (a) | Annualized. |
| (d) | Per share data is based on average shares outstanding. |
| (f) | Ratios do not reflect reductions from fees paid indirectly, if applicable. See Note 2 in the Notes to Financial Statements for additional information. |
| (n) | Not annualized. |
| (r) | Certain expenses have been reduced without which performance would have been lower. |
| (s) | From time to time the fund may receive proceeds from litigation settlements, without which performance would be lower. |
| (t) | Total returns do not include any applicable sales charges. |
| (x) | The net asset values and total returns have been calculated on net assets which include adjustments made in accordance with U.S. generally accepted accounting principles required at period end for financial reporting purposes. |
See Notes to Financial Statements
70
Financial
Highlights − continued
MFS MARYLAND MUNICIPAL BOND FUND
The financial highlights table is
intended to help you understand the fund's financial performance for the semiannual period and the past 5 fiscal years. Certain information reflects financial results for a single fund share. The total returns in the
table represent the rate that an investor would have earned (or lost) on an investment in the fund share class (assuming reinvestment of all distributions) held for the entire period.
| Six months ended | Year ended | |||||
| Class A | 9/30/23 (unaudited) | 3/31/23 | 3/31/22 | 3/31/21 | 3/31/20 | 3/31/19 |
| Net asset value, beginning of period | $10.00 | $10.47 | $11.04 | $10.62 | $10.76 | $10.65 |
| Income (loss) from investment operations | ||||||
| Net investment income (loss) (d) | $0.15 | $0.25 | $0.20 | $0.26 | $0.31 | $0.40 |
| Net realized and unrealized gain (loss) | (0.57) | (0.46) | (0.57) | 0.42 | (0.14) | 0.06 |
| Total from investment operations | $(0.42) | $(0.21) | $(0.37) | $0.68 | $0.17 | $0.46 |
| Less distributions declared to shareholders | ||||||
| From net investment income | $(0.15) | $(0.26) | $(0.20) | $(0.26) | $(0.31) | $(0.35) |
| Net asset value, end of period (x) | $9.43 | $10.00 | $10.47 | $11.04 | $10.62 | $10.76 |
| Total return (%) (r)(s)(t)(x) | (4.23)(n) | (1.96) | (3.45) | 6.51 | 1.57 | 4.46 |
| Ratios (%) (to average net assets) and Supplemental data: | ||||||
| Expenses before expense reductions (f) | 0.97(a) | 0.98 | 0.97 | 0.98 | 0.99 | 1.01 |
| Expenses after expense reductions (f) | 0.83(a) | 0.83 | 0.83 | 0.83 | 0.82 | 0.82 |
| Net investment income (loss) | 2.99(a) | 2.52 | 1.79 | 2.42 | 2.85 | 3.77 |
| Portfolio turnover | 8(n) | 41 | 16 | 27 | 27 | 14 |
| Net assets at end of period (000 omitted) | $81,880 | $92,970 | $80,515 | $82,725 | $83,852 | $75,215 |
| Six months ended | Year ended | |||||
| Class B | 9/30/23 (unaudited) | 3/31/23 | 3/31/22 | 3/31/21 | 3/31/20 | 3/31/19 |
| Net asset value, beginning of period | $9.99 | $10.47 | $11.04 | $10.62 | $10.75 | $10.65 |
| Income (loss) from investment operations | ||||||
| Net investment income (loss) (d) | $0.11 | $0.17 | $0.12 | $0.18 | $0.23 | $0.32 |
| Net realized and unrealized gain (loss) | (0.56) | (0.46) | (0.57) | 0.42 | (0.13) | 0.05 |
| Total from investment operations | $(0.45) | $(0.29) | $(0.45) | $0.60 | $0.10 | $0.37 |
| Less distributions declared to shareholders | ||||||
| From net investment income | $(0.11) | $(0.19) | $(0.12) | $(0.18) | $(0.23) | $(0.27) |
| Net asset value, end of period (x) | $9.43 | $9.99 | $10.47 | $11.04 | $10.62 | $10.75 |
| Total return (%) (r)(s)(t)(x) | (4.49)(n) | (2.78) | (4.17) | 5.71 | 0.91 | 3.58 |
| Ratios (%) (to average net assets) and Supplemental data: | ||||||
| Expenses before expense reductions (f) | 1.72(a) | 1.74 | 1.72 | 1.73 | 1.74 | 1.76 |
| Expenses after expense reductions (f) | 1.58(a) | 1.58 | 1.58 | 1.58 | 1.58 | 1.58 |
| Net investment income (loss) | 2.24(a) | 1.70 | 1.04 | 1.69 | 2.12 | 3.01 |
| Portfolio turnover | 8(n) | 41 | 16 | 27 | 27 | 14 |
| Net assets at end of period (000 omitted) | $206 | $257 | $576 | $656 | $1,040 | $1,217 |
See Notes to Financial Statements
71
Financial
Highlights − continued
MFS MARYLAND MUNICIPAL BOND
FUND − continued
| Six months ended | Year ended | |||||
| Class I | 9/30/23 (unaudited) | 3/31/23 | 3/31/22 | 3/31/21 | 3/31/20 | 3/31/19 |
| Net asset value, beginning of period | $9.02 | $9.45 | $9.96 | $9.58 | $9.70 | $9.61 |
| Income (loss) from investment operations | ||||||
| Net investment income (loss) (d) | $0.14 | $0.25 | $0.20 | $0.26 | $0.30 | $0.38 |
| Net realized and unrealized gain (loss) | (0.50) | (0.42) | (0.51) | 0.38 | (0.11) | 0.05 |
| Total from investment operations | $(0.36) | $(0.17) | $(0.31) | $0.64 | $0.19 | $0.43 |
| Less distributions declared to shareholders | ||||||
| From net investment income | $(0.15) | $(0.26) | $(0.20) | $(0.26) | $(0.31) | $(0.34) |
| Net asset value, end of period (x) | $8.51 | $9.02 | $9.45 | $9.96 | $9.58 | $9.70 |
| Total return (%) (r)(s)(t)(x) | (4.07)(n) | (1.77) | (3.17) | 6.78 | 1.88 | 4.61 |
| Ratios (%) (to average net assets) and Supplemental data: | ||||||
| Expenses before expense reductions (f) | 0.72(a) | 0.73 | 0.72 | 0.73 | 0.74 | 0.76 |
| Expenses after expense reductions (f) | 0.58(a) | 0.58 | 0.58 | 0.58 | 0.58 | 0.58 |
| Net investment income (loss) | 3.24(a) | 2.74 | 2.03 | 2.64 | 3.07 | 4.01 |
| Portfolio turnover | 8(n) | 41 | 16 | 27 | 27 | 14 |
| Net assets at end of period (000 omitted) | $28,415 | $27,697 | $27,736 | $26,243 | $18,140 | $11,831 |
| Six months ended | Year ended | |||||
| Class R6 | 9/30/23 (unaudited) | 3/31/23 | 3/31/22 | 3/31/21 | 3/31/20 | 3/31/19 |
| Net asset value, beginning of period | $9.02 | $9.45 | $9.96 | $9.58 | $9.70 | $9.61 |
| Income (loss) from investment operations | ||||||
| Net investment income (loss) (d) | $0.15 | $0.25 | $0.21 | $0.26 | $0.30 | $0.39 |
| Net realized and unrealized gain (loss) | (0.51) | (0.42) | (0.51) | 0.39 | (0.11) | 0.05 |
| Total from investment operations | $(0.36) | $(0.17) | $(0.30) | $0.65 | $0.19 | $0.44 |
| Less distributions declared to shareholders | ||||||
| From net investment income | $(0.15) | $(0.26) | $(0.21) | $(0.27) | $(0.31) | $(0.35) |
| Net asset value, end of period (x) | $8.51 | $9.02 | $9.45 | $9.96 | $9.58 | $9.70 |
| Total return (%) (r)(s)(t)(x) | (4.03)(n) | (1.70) | (3.10) | 6.84 | 1.93 | 4.67 |
| Ratios (%) (to average net assets) and Supplemental data: | ||||||
| Expenses before expense reductions (f) | 0.64(a) | 0.66 | 0.65 | 0.66 | 0.68 | 0.70 |
| Expenses after expense reductions (f) | 0.51(a) | 0.51 | 0.51 | 0.52 | 0.52 | 0.52 |
| Net investment income (loss) | 3.30(a) | 2.80 | 2.09 | 2.67 | 3.10 | 4.07 |
| Portfolio turnover | 8(n) | 41 | 16 | 27 | 27 | 14 |
| Net assets at end of period (000 omitted) | $9,455 | $7,982 | $8,893 | $6,155 | $2,837 | $1,315 |
See Notes to Financial Statements
72
Financial
Highlights − continued
MFS MARYLAND MUNICIPAL BOND
FUND − continued
| (a) | Annualized. |
| (d) | Per share data is based on average shares outstanding. |
| (f) | Ratios do not reflect reductions from fees paid indirectly, if applicable. See Note 2 in the Notes to Financial Statements for additional information. |
| (n) | Not annualized. |
| (r) | Certain expenses have been reduced without which performance would have been lower. |
| (s) | From time to time the fund may receive proceeds from litigation settlements, without which performance would be lower. |
| (t) | Total returns do not include any applicable sales charges. |
| (x) | The net asset values and total returns have been calculated on net assets which include adjustments made in accordance with U.S. generally accepted accounting principles required at period end for financial reporting purposes. |
See Notes to Financial Statements
73
Financial
Highlights − continued
MFS MASSACHUSETTS MUNICIPAL BOND
FUND
The financial highlights table is
intended to help you understand the fund's financial performance for the semiannual period and the past 5 fiscal years. Certain information reflects financial results for a single fund share. The total returns in the
table represent the rate that an investor would have earned (or lost) on an investment in the fund share class (assuming reinvestment of all distributions) held for the entire period.
| Six months ended | Year ended | |||||
| Class A | 9/30/23 (unaudited) | 3/31/23 | 3/31/22 | 3/31/21 | 3/31/20 | 3/31/19 |
| Net asset value, beginning of period | $10.17 | $10.67 | $11.30 | $10.90 | $11.04 | $10.90 |
| Income (loss) from investment operations | ||||||
| Net investment income (loss) (d) | $0.14 | $0.24 | $0.21 | $0.27 | $0.33 | $0.41 |
| Net realized and unrealized gain (loss) | (0.56) | (0.47) | (0.63) | 0.39 | (0.15) | 0.09 |
| Total from investment operations | $(0.42) | $(0.23) | $(0.42) | $0.66 | $0.18 | $0.50 |
| Less distributions declared to shareholders | ||||||
| From net investment income | $(0.15) | $(0.27) | $(0.21) | $(0.26) | $(0.32) | $(0.36) |
| Net asset value, end of period (x) | $9.60 | $10.17 | $10.67 | $11.30 | $10.90 | $11.04 |
| Total return (%) (r)(s)(t)(x) | (4.21)(n) | (2.11) | (3.83) | 6.16 | 1.61 | 4.74 |
| Ratios (%) (to average net assets) and Supplemental data: | ||||||
| Expenses before expense reductions (f) | 0.87(a) | 0.87 | 0.86 | 0.86 | 0.87 | 0.88 |
| Expenses after expense reductions (f) | 0.82(a) | 0.83 | 0.85 | 0.84 | 0.83 | 0.85 |
| Net investment income (loss) | 2.84(a) | 2.42 | 1.87 | 2.39 | 2.91 | 3.75 |
| Portfolio turnover | 6(n) | 36 | 17 | 26 | 29 | 13 |
| Net assets at end of period (000 omitted) | $222,521 | $246,509 | $216,458 | $216,177 | $226,471 | $207,565 |
| Six months ended | Year ended | |||||
| Class B | 9/30/23 (unaudited) | 3/31/23 | 3/31/22 | 3/31/21 | 3/31/20 | 3/31/19 |
| Net asset value, beginning of period | $10.18 | $10.69 | $11.32 | $10.92 | $11.06 | $10.92 |
| Income (loss) from investment operations | ||||||
| Net investment income (loss) (d) | $0.10 | $0.17 | $0.13 | $0.19 | $0.25 | $0.32 |
| Net realized and unrealized gain (loss) | (0.55) | (0.49) | (0.64) | 0.39 | (0.15) | 0.10 |
| Total from investment operations | $(0.45) | $(0.32) | $(0.51) | $0.58 | $0.10 | $0.42 |
| Less distributions declared to shareholders | ||||||
| From net investment income | $(0.11) | $(0.19) | $(0.12) | $(0.18) | $(0.24) | $(0.28) |
| Net asset value, end of period (x) | $9.62 | $10.18 | $10.69 | $11.32 | $10.92 | $11.06 |
| Total return (%) (r)(s)(t)(x) | (4.46)(n) | (2.91) | (4.54) | 5.36 | 0.84 | 3.94 |
| Ratios (%) (to average net assets) and Supplemental data: | ||||||
| Expenses before expense reductions (f) | 1.62(a) | 1.62 | 1.61 | 1.61 | 1.62 | 1.63 |
| Expenses after expense reductions (f) | 1.57(a) | 1.58 | 1.60 | 1.60 | 1.60 | 1.62 |
| Net investment income (loss) | 2.08(a) | 1.68 | 1.12 | 1.67 | 2.19 | 2.98 |
| Portfolio turnover | 6(n) | 36 | 17 | 26 | 29 | 13 |
| Net assets at end of period (000 omitted) | $147 | $267 | $347 | $470 | $1,081 | $1,664 |
See Notes to Financial Statements
74
Financial
Highlights − continued
MFS MASSACHUSETTS MUNICIPAL BOND
FUND − continued
| Six months ended | Year ended | |||||
| Class I | 9/30/23 (unaudited) | 3/31/23 | 3/31/22 | 3/31/21 | 3/31/20 | 3/31/19 |
| Net asset value, beginning of period | $8.90 | $9.34 | $9.89 | $9.54 | $9.66 | $9.54 |
| Income (loss) from investment operations | ||||||
| Net investment income (loss) (d) | $0.14 | $0.24 | $0.21 | $0.25 | $0.30 | $0.38 |
| Net realized and unrealized gain (loss) | (0.49) | (0.42) | (0.55) | 0.36 | (0.12) | 0.08 |
| Total from investment operations | $(0.35) | $(0.18) | $(0.34) | $0.61 | $0.18 | $0.46 |
| Less distributions declared to shareholders | ||||||
| From net investment income | $(0.14) | $(0.26) | $(0.21) | $(0.26) | $(0.30) | $(0.34) |
| Net asset value, end of period (x) | $8.41 | $8.90 | $9.34 | $9.89 | $9.54 | $9.66 |
| Total return (%) (r)(s)(t)(x) | (3.99)(n) | (1.89) | (3.58) | 6.41 | 1.86 | 4.95 |
| Ratios (%) (to average net assets) and Supplemental data: | ||||||
| Expenses before expense reductions (f) | 0.62(a) | 0.62 | 0.61 | 0.61 | 0.62 | 0.63 |
| Expenses after expense reductions (f) | 0.57(a) | 0.58 | 0.60 | 0.60 | 0.60 | 0.62 |
| Net investment income (loss) | 3.09(a) | 2.67 | 2.11 | 2.60 | 3.10 | 3.98 |
| Portfolio turnover | 6(n) | 36 | 17 | 26 | 29 | 13 |
| Net assets at end of period (000 omitted) | $145,326 | $150,099 | $179,551 | $168,647 | $124,875 | $68,669 |
| Six months ended | Year ended | |||||
| Class R6 | 9/30/23 (unaudited) | 3/31/23 | 3/31/22 | 3/31/21 | 3/31/20 | 3/31/19 |
| Net asset value, beginning of period | $8.90 | $9.34 | $9.90 | $9.55 | $9.67 | $9.54 |
| Income (loss) from investment operations | ||||||
| Net investment income (loss) (d) | $0.14 | $0.24 | $0.22 | $0.26 | $0.31 | $0.38 |
| Net realized and unrealized gain (loss) | (0.49) | (0.41) | (0.57) | 0.35 | (0.12) | 0.10 |
| Total from investment operations | $(0.35) | $(0.17) | $(0.35) | $0.61 | $0.19 | $0.48 |
| Less distributions declared to shareholders | ||||||
| From net investment income | $(0.14) | $(0.27) | $(0.21) | $(0.26) | $(0.31) | $(0.35) |
| Net asset value, end of period (x) | $8.41 | $8.90 | $9.34 | $9.90 | $9.55 | $9.67 |
| Total return (%) (r)(s)(t)(x) | (3.95)(n) | (1.81) | (3.60) | 6.48 | 1.93 | 5.13 |
| Ratios (%) (to average net assets) and Supplemental data: | ||||||
| Expenses before expense reductions (f) | 0.54(a) | 0.54 | 0.54 | 0.54 | 0.55 | 0.56 |
| Expenses after expense reductions (f) | 0.50(a) | 0.51 | 0.52 | 0.53 | 0.53 | 0.55 |
| Net investment income (loss) | 3.16(a) | 2.76 | 2.18 | 2.67 | 3.15 | 4.05 |
| Portfolio turnover | 6(n) | 36 | 17 | 26 | 29 | 13 |
| Net assets at end of period (000 omitted) | $9,211 | $9,326 | $10,769 | $9,628 | $6,636 | $3,176 |
See Notes to Financial Statements
75
Financial
Highlights − continued
MFS MASSACHUSETTS MUNICIPAL BOND
FUND − continued
| (a) | Annualized. |
| (d) | Per share data is based on average shares outstanding. |
| (f) | Ratios do not reflect reductions from fees paid indirectly, if applicable. See Note 2 in the Notes to Financial Statements for additional information. |
| (n) | Not annualized. |
| (r) | Certain expenses have been reduced without which performance would have been lower. |
| (s) | From time to time the fund may receive proceeds from litigation settlements, without which performance would be lower. |
| (t) | Total returns do not include any applicable sales charges. |
| (x) | The net asset values and total returns have been calculated on net assets which include adjustments made in accordance with U.S. generally accepted accounting principles required at period end for financial reporting purposes. |
See Notes to Financial Statements
76
Notes to Financial
Statements
(unaudited)
(1) Business and
Organization
MFS Alabama Municipal Bond Fund
(Alabama Fund), MFS Arkansas Municipal Bond Fund (Arkansas Fund), MFS California Municipal Bond Fund (California Fund), MFS Georgia Municipal Bond Fund (Georgia Fund), MFS Maryland Municipal Bond Fund (Maryland Fund),
and MFS Massachusetts Municipal Bond Fund (Massachusetts Fund) are each a diversified series of MFS Municipal Series Trust which is organized as a Massachusetts business trust and is registered under the Investment
Company Act of 1940, as amended, as an open-end management investment company.
Each fund is an investment
company and accordingly follows the investment company accounting and reporting guidance of the Financial Accounting Standards Board (FASB) Accounting Standards Codification Topic 946 Financial Services - Investment
Companies.
(2) Significant Accounting
Policies
General — The preparation of financial statements in conformity with U.S. generally accepted accounting principles requires management to make estimates and assumptions that affect the
reported amounts of assets and liabilities, and disclosure of contingent assets and liabilities at the date of the financial statements and the reported amounts of increases and decreases in net assets from operations
during the reporting period. Actual results could differ from those estimates. In the preparation of these financial statements, management has evaluated subsequent events occurring after the date of each fund’s
Statement of Assets and Liabilities through the date that the financial statements were issued. Each fund invests primarily in municipal instruments, which generally trade in the over-the-counter market. The value of municipal instruments can be affected by changes in their actual or
perceived credit quality. The credit quality of, and the ability to pay principal and interest when due by, an issuer of a municipal instrument depends on the credit quality of the entity supporting the municipal
instrument, how essential any services supported by the municipal instrument are, the sufficiency of any revenues or taxes that support the municipal instrument, and/or the willingness or ability of the appropriate
government entity to approve any appropriations necessary to support the municipal instrument. Municipal instruments may be supported by insurance which typically guarantees the timely payment of all principal and
interest due on the underlying municipal instrument. The value of a municipal instrument can be volatile and significantly affected by adverse tax changes or court rulings, legislative or political changes, changes in
specific or general market and economic conditions in the region or state where the instrument is issued, and the financial condition of municipal issuers and of municipal instrument insurers of which there are a
limited number. Also, because many municipal instruments are issued to finance similar projects, conditions in certain industries can significantly affect the funds and the overall municipal market. If the Internal
Revenue Service determines an issuer of a municipal instrument has not complied with the applicable tax requirements, interest from the security could become taxable, the security could decline in value, and
distributions made by the funds could be taxable to shareholders.
Balance Sheet Offsetting — Each fund's accounting policy with respect to balance sheet offsetting is that, absent an event of default by the counterparty or a termination of the agreement, the International
Swaps and Derivatives Association (ISDA) Master Agreement, or similar agreement, does not result in an offset of reported amounts of financial assets and financial liabilities in the Statements of Assets and
Liabilities across transactions between each fund and the applicable counterparty. Each fund's right to setoff may be restricted or prohibited by the bankruptcy or insolvency laws of the particular jurisdiction to
which a specific master netting agreement counterparty is subject. Balance sheet offsetting disclosures, to the extent applicable to each fund, have been included in each fund’s Significant Accounting Policies
note under the captions for each of the fund’s in-scope financial instruments and transactions.
Investment Valuations — Subject to its oversight, the funds' Board of Trustees has delegated primary responsibility for determining or causing to be determined the value of each fund’s investments to MFS as
the funds' adviser, pursuant to each fund’s valuation policy and procedures which have been adopted by the adviser and approved by the Board. In accordance with Rule 2a-5 under the Investment Company Act of
1940, the Board of Trustees designated the adviser as the “valuation designee” of each fund. If the adviser, as valuation designee, determines that reliable market quotations are not readily available for
an investment, the investment is valued at fair value as determined in good faith by the adviser in accordance with the adviser’s fair valuation policy and procedures.
Under each fund's valuation
policy and procedures, debt instruments and floating rate loans, including restricted debt instruments, are generally valued at an evaluated or composite bid as provided by a third-party pricing service. Short-term
instruments with a maturity at issuance of 60 days or less may be valued at amortized cost, which approximates market value. Open-end investment companies are generally valued at net asset value per share.
Under each fund’s
valuation policy and procedures, market quotations are not considered to be readily available for debt instruments, floating rate loans, and many types of derivatives. These investments are generally valued at fair
value based on information from third-party pricing services or otherwise determined by the adviser in accordance with the adviser’s fair valuation policy and procedures. Securities and other assets generally
valued on the basis of information from a third-party pricing service may also be valued at a broker/dealer bid quotation. In determining values, third-party pricing services can utilize both transaction data and
market information such as yield, quality, coupon rate, maturity, type of issue, trading characteristics, spreads and other market data. An investment may also be valued at fair value if the adviser determines that
the investment’s value has been materially affected by events occurring after the close of the exchange or market on which the investment is principally traded (such as foreign exchange or
77
Notes to Financial
Statements (unaudited) - continued
market) and prior to the determination of each
fund’s net asset value, or after the halt of trading of a specific security where trading does not resume prior to the close of the exchange or market on which the security is principally traded. The adviser
generally relies on third-party pricing services or other information (such as the correlation with price movements of similar securities in the same or other markets; the type, cost and investment characteristics of
the security; the business and financial condition of the issuer; and trading and other market data) to assist in determining whether to fair value and at what value to fair value an investment. The value of an
investment for purposes of calculating each fund’s net asset value can differ depending on the source and method used to determine value. When fair valuation is used, the value of an investment used to determine
each fund’s net asset value may differ from quoted or published prices for the same investment. There can be no assurance that each fund could obtain the fair value assigned to an investment if it were to sell
the investment at the same time at which each fund determines its net asset value per share.
Various inputs are used in
determining the value of each fund's assets or liabilities. These inputs are categorized into three broad levels. In certain cases, the inputs used to measure fair value may fall into different levels of the fair
value hierarchy. In such cases, an investment's level within the fair value hierarchy is based on the lowest level of input that is significant to the fair value measurement. Each fund's assessment of the significance
of a particular input to the fair value measurement in its entirety requires judgment, and considers factors specific to the investment. Level 1 includes unadjusted quoted prices in active markets for identical assets
or liabilities. Level 2 includes other significant observable market-based inputs (including quoted prices for similar securities, interest rates, prepayment speed, and credit risk). Level 3 includes significant
unobservable inputs, which may include the adviser's own assumptions in determining the fair value of investments. The following is a summary of the levels used as of September 30, 2023 in valuing each fund's assets
and liabilities:
| Level 1 | Level 2 | Level 3 | Total | |
| Alabama Fund | ||||
| Financial Instruments | ||||
| Municipal Bonds | $— | $61,870,773 | $— | $61,870,773 |
| U.S. Corporate Bonds | — | 184,624 | — | 184,624 |
| Mutual Funds | 1,199,740 | — | — | 1,199,740 |
| Total | $1,199,740 | $62,055,397 | $— | $63,255,137 |
| Arkansas Fund | ||||
| Financial Instruments | ||||
| Municipal Bonds | $— | $136,280,312 | $— | $136,280,312 |
| U.S. Corporate Bonds | — | 376,017 | — | 376,017 |
| Mutual Funds | 906,007 | — | — | 906,007 |
| Total | $906,007 | $136,656,329 | $— | $137,562,336 |
| California Fund | ||||
| Financial Instruments | ||||
| Municipal Bonds | $— | $481,461,201 | $— | $481,461,201 |
| U.S. Corporate Bonds | — | 1,402,751 | — | 1,402,751 |
| Mutual Funds | 11,769,311 | — | — | 11,769,311 |
| Total | $11,769,311 | $482,863,952 | $— | $494,633,263 |
| Georgia Fund | ||||
| Financial Instruments | ||||
| Municipal Bonds | $— | $96,999,911 | $— | $96,999,911 |
| U.S. Corporate Bonds | — | 308,017 | — | 308,017 |
| Mutual Funds | 1,287,828 | — | — | 1,287,828 |
| Total | $1,287,828 | $97,307,928 | $— | $98,595,756 |
| Maryland Fund | ||||
| Financial Instruments | ||||
| Municipal Bonds | $— | $117,258,094 | $— | $117,258,094 |
| U.S. Corporate Bonds | — | 272,900 | — | 272,900 |
| Mutual Funds | 958,236 | — | — | 958,236 |
| Total | $958,236 | $117,530,994 | $— | $118,489,230 |
78
Notes to Financial
Statements (unaudited) - continued
| Level 1 | Level 2 | Level 3 | Total | |
| Massachusetts Fund | ||||
| Financial Instruments | ||||
| Municipal Bonds | $— | $371,470,197 | $— | $371,470,197 |
| U.S. Corporate Bonds | — | 896,137 | — | 896,137 |
| Mutual Funds | 4,228,786 | — | — | 4,228,786 |
| Total | $4,228,786 | $372,366,334 | $— | $376,595,120 |
For further information
regarding security characteristics, see the Portfolio of Investments.
Indemnifications — Under each fund's organizational documents, its officers and Trustees may be indemnified against certain liabilities and expenses arising out of the performance of their duties to
each fund. Additionally, in the normal course of business, each fund enters into agreements with service providers that may contain indemnification clauses. Each fund's maximum exposure under these agreements is
unknown as this would involve future claims that may be made against each fund that have not yet occurred.
Investment Transactions and
Income — Interest income is recorded on the accrual basis. All premium and discount is amortized or accreted for financial statement purposes in accordance with U.S. generally accepted accounting principles. Interest payments received in additional securities are recorded on the ex-interest date in an amount equal to the value of the security on such date.
Debt obligations may be placed on non-accrual
status or set to accrue at a rate of interest less than the contractual coupon when the collection of all or a portion of interest has become doubtful. Interest income for those debt obligations may be further reduced
by the write-off of the related interest receivables when deemed uncollectible.
Each fund may receive proceeds
from litigation settlements. Any proceeds received from litigation involving portfolio holdings are reflected in the Statements of Operations in realized gain/loss if the security has been disposed of by the fund or
in unrealized gain/loss if the security is still held by the fund. Any other proceeds from litigation not related to portfolio holdings are reflected as other income in the Statements of Operations.
Investment transactions are
recorded on the trade date. In determining the net gain or loss on securities sold, the cost of securities is determined on the identified cost basis.
Each fund may purchase or sell
securities on a when-issued or delayed delivery basis. In these extended settlement transactions, the receipt or delivery of the securities by the fund and related payments occur at a future date, usually beyond
the customary settlement period. The price of such security and the date that the security will be settled are generally fixed at the time the transaction is negotiated. The value of the security varies with market
fluctuations and for debt securities no interest accrues to the fund until settlement takes place. When the fund sells securities on a when-issued or delayed delivery basis, the fund typically owns or has the right to
acquire securities equivalent in kind and amount to the securities sold. Purchase and sale commitments for when-issued or delayed delivery securities are held at carrying amount, which approximates fair value and are
categorized as level 2 within the fair value hierarchy, and included in When-issued investments purchased and When-issued investments sold in the Statements of Assets and Liabilities, as applicable. Losses may arise
due to changes in the value of the underlying securities prior to settlement date or if the counterparty does not perform under the contract’s terms, or if the issuer does not issue the securities due to
political, economic or other factors.
Legal fees and other related
expenses incurred to preserve and protect the value of a security owned are added to the cost of the security; other legal fees are expensed. Capital infusions made directly to the security issuer, which are generally
non-recurring, incurred to protect or enhance the value of high-yield debt securities, are reported as additions to the cost basis of the security. Costs that are incurred to negotiate the terms or conditions of
capital infusions or that are expected to result in a plan of reorganization are reported as realized losses. Ongoing costs incurred to protect or enhance an investment, or costs incurred to pursue other claims or
legal actions, are expensed.
Fees Paid Indirectly — Each fund's custody fee may be reduced by a credit earned under an arrangement that measures the value of U.S. dollars deposited with the custodian by each fund. The amount of the
credit, for the six months ended September 30, 2023, is shown as a reduction of total expenses in the Statements of Operations.
Tax Matters and Distributions
— Each fund intends to qualify as a regulated investment company, as defined under Subchapter M of the Internal Revenue Code, and to distribute all of its taxable and tax-exempt
income, including realized capital gains. As a result, no provision for federal income tax is required. Each fund’s federal tax returns, when filed, will remain subject to examination by the Internal Revenue
Service for a three year period. Management has analyzed each fund’s tax positions taken on federal and state tax returns for all open tax years and does not believe that there are any uncertain tax positions
that require recognition of a tax liability.
79
Notes to Financial
Statements (unaudited) - continued
Distributions to shareholders
are recorded on the ex-dividend date. Income and capital gain distributions are determined in accordance with income tax regulations, which may differ from U.S. generally accepted accounting principles. Certain
capital accounts in the financial statements are periodically adjusted for permanent differences in order to reflect their tax character. These adjustments have no impact on net assets or net asset value per share.
Temporary differences which arise from recognizing certain items of income, expense, gain or loss in different periods for financial statement and tax purposes will reverse at some time in the future.
Book/tax differences primarily
relate to defaulted bonds and treating a portion of the proceeds from redemptions as a distribution for tax purposes, as applicable to each fund.
The tax character of
distributions made during the current period will be determined at fiscal year end. The tax character of distributions declared to shareholders for the last fiscal year is as follows:
| Year ended 3/31/23 | Alabama Fund | Arkansas Fund | California Fund | Georgia Fund | Maryland Fund | Massachusetts Fund |
| Ordinary income (including any short-term capital gains) | $52,208 | $148,830 | $502,450 | $52,176 | $137,919 | $318,834 |
| Tax-exempt income | 1,897,347 | 4,109,211 | 15,052,551 | 2,677,187 | 3,094,601 | 10,966,006 |
| Total distributions | $1,949,555 | $4,258,041 | $15,555,001 | $2,729,363 | $3,232,520 | $11,284,840 |
The federal tax cost and the tax
basis components of distributable earnings were as follows:
| As of 9/30/23 | Alabama Fund | Arkansas Fund | California Fund | Georgia Fund | Maryland Fund | Massachusetts Fund |
| Cost of investments | $69,966,822 | $152,613,486 | $537,089,705 | $107,749,477 | $128,209,078 | $409,303,400 |
| Gross appreciation | 55,566 | 287,810 | 1,690,954 | 128,946 | 203,577 | 1,364,215 |
| Gross depreciation | (6,767,251) | (15,338,960) | (44,147,396) | (9,282,667) | (9,923,425) | (34,072,495) |
| Net unrealized appreciation (depreciation) | $(6,711,685) | $(15,051,150) | $(42,456,442) | $(9,153,721) | $(9,719,848) | $(32,708,280) |
| As of 3/31/23 | ||||||
| Undistributed ordinary income | — | — | — | — | — | 353,464 |
| Undistributed tax-exempt income | 382,558 | 777,368 | 2,917,098 | 514,348 | 702,394 | 1,248,974 |
| Capital loss carryforwards | (4,548,239) | (8,198,665) | (24,948,509) | (6,637,323) | (5,542,155) | (17,086,430) |
| Other temporary differences | (170,205) | (375,645) | (1,518,947) | (247,631) | (335,794) | (1,075,493) |
| Net unrealized appreciation (depreciation) | (2,911,713) | (5,580,823) | (15,602,428) | (3,229,124) | (2,714,421) | (12,117,328) |
The aggregate cost above
includes prior fiscal year end tax adjustments, if applicable.
As of March 31, 2023, each fund
had capital loss carryforwards available to offset future realized gains. These net capital losses may be carried forward indefinitely and their character is retained as short-term and/or long-term losses. Such losses
are characterized as follows:
| Alabama Fund | Arkansas Fund | California Fund | Georgia Fund | Maryland Fund | Massachusetts Fund | |
| Short-Term | $(1,191,462) | $(3,028,060) | $(8,986,891) | $(2,260,411) | $(2,524,706) | $(9,987,758) |
| Long-Term | (3,356,777) | (5,170,605) | (15,961,618) | (4,376,912) | (3,017,449) | (7,098,672) |
| Total | $(4,548,239) | $(8,198,665) | $(24,948,509) | $(6,637,323) | $(5,542,155) | $(17,086,430) |
Multiple Classes of Shares of
Beneficial Interest — Each fund offers multiple classes of shares, which differ in their respective distribution and service fees. Each fund's income and common expenses are allocated to shareholders
based on the value of settled shares outstanding of each class. Each fund's realized and unrealized gain (loss) are allocated to shareholders based on the daily net assets of each class. Dividends are declared
separately for each class. Differences in per share dividend rates are generally due to
80
Notes to Financial
Statements (unaudited) - continued
differences in separate class expenses. Class B
and Class C shares will convert to Class A shares approximately eight years after purchase. Each fund’s distributions declared to shareholders as reported in the Statements of Changes in Net Assets are presented
by class as follows:
| Alabama Fund | Arkansas Fund | California Fund | |||||||||
| Six Months Ended 9/30/23 | Year Ended 3/31/23 | Six Months Ended 9/30/23 | Year Ended 3/31/23 | Six Months Ended 9/30/23 | Year Ended 3/31/23 | ||||||
| Class A | $660,694 | $1,196,317 | $1,837,783 | $3,343,241 | $5,247,007 | $9,438,506 | |||||
| Class B | 574 | 968 | 2,969 | 8,537 | 3,240 | 8,132 | |||||
| Class C | — | — | — | — | 142,469 | 286,297 | |||||
| Class I | 306,185 | 648,692 | 279,742 | 763,784 | 2,251,401 | 4,140,478 | |||||
| Class R6 | 54,056 | 103,578 | 85,422 | 142,479 | 1,049,544 | 1,681,588 | |||||
| Total | $1,021,509 | $1,949,555 | $2,205,916 | $4,258,041 | $8,693,661 | $15,555,001 | |||||
| Georgia Fund | Maryland Fund | Massachusetts Fund | |||||||||
| Six Months Ended 9/30/23 | Year Ended 3/31/23 | Six Months Ended 9/30/23 | Year Ended 3/31/23 | Six Months Ended 9/30/23 | Year Ended 3/31/23 | ||||||
| Class A | $1,099,770 | $1,985,301 | $1,379,861 | $2,201,485 | $3,504,684 | $6,316,825 | |||||
| Class B | 457 | 541 | 2,691 | 7,611 | 2,424 | 5,478 | |||||
| Class I | 180,437 | 334,462 | 484,113 | 801,276 | 2,351,785 | 4,679,152 | |||||
| Class R6 | 203,884 | 409,059 | 150,814 | 222,148 | 152,743 | 283,385 | |||||
| Total | $1,484,548 | $2,729,363 | $2,017,479 | $3,232,520 | $6,011,636 | $11,284,840 | |||||
(3) Transactions with
Affiliates
Investment Adviser — Each fund has an investment advisory agreement with MFS to provide overall investment management and related administrative services and facilities to each fund. The management fee is computed daily and paid monthly at an annual rate of 0.45% of each fund’s average daily net assets.
MFS has agreed in writing to
reduce its management fee by a specified amount if certain MFS mutual fund assets exceed thresholds agreed to by MFS and the funds’ Board of Trustees. MFS has also agreed in writing to waive at least 0.01% of
its management fee as part of this agreement. The agreement to waive at least 0.01% of the management fee will continue until modified by the funds' Board of Trustees, but such agreement will continue at least until
July 31, 2024. For the six months ended September 30, 2023, these management fee reductions amounted to the following, which are included in the reduction of total expenses in the Statements of Operations:
| Alabama Fund | Arkansas Fund | California Fund | Georgia Fund | Maryland Fund | Massachusetts Fund |
| $4,267 | $9,200 | $31,371 | $6,552 | $8,034 | $24,953 |
The management fee incurred for
the six months ended September 30, 2023 was equivalent to an annual effective rate of 0.44% of each fund's average daily net assets.
The investment adviser has
agreed in writing to pay a portion of the following funds’ total annual operating expenses, excluding interest, taxes, extraordinary expenses, brokerage and transaction costs, certain tax reclaim recovery
expenses (including contingency fees and closing agreement expenses), and investment-related expenses, such that total fund operating expenses do not exceed the following rates annually of these funds’ average
daily net assets:
| Alabama Fund | Arkansas Fund | Georgia Fund | Maryland Fund | Massachusetts Fund | |
| Class A | 0.90% | 0.70% | 0.90% | 0.83% | 0.82% |
| Class B | 1.65% | 1.45% | 1.65% | 1.58% | 1.57% |
| Class I | 0.65% | 0.60% | 0.65% | 0.58% | 0.57% |
| Class R6 | 0.59% | 0.53% | 0.60% | 0.53% | 0.50% |
These written agreements will
continue until modified by the funds' Board of Trustees, but such agreements will continue at least until July 31, 2024. For the six months ended September 30, 2023, these reductions amounted to $58,536 for the
Alabama Fund, $53,809 for the Arkansas Fund, $31,675 for the Georgia Fund, $79,469 for the Maryland Fund, and $65,144 for the Massachusetts Fund. Each reduction is included in the reduction of total expenses in the
Statements of Operations.
81
Notes to Financial
Statements (unaudited) - continued
Distributor — MFS Fund Distributors, Inc. (MFD), a wholly-owned subsidiary of MFS, as distributor, received the following amounts for the six months ended September 30, 2023, as its
portion of the initial sales charge on sales of Class A shares of each fund:
| Alabama Fund | Arkansas Fund | California Fund | Georgia Fund | Maryland Fund | Massachusetts Fund |
| $964 | $2,342 | $2,385 | $1,389 | $1,121 | $2,191 |
The Board of Trustees has
adopted a distribution plan for certain share classes pursuant to Rule 12b-1 of the Investment Company Act of 1940.
Each fund's distribution plan
provides that each fund will pay MFD for services provided by MFD and financial intermediaries in connection with the distribution and servicing of certain share classes. One component of the plan is a
distribution fee paid to MFD and another component of the plan is a service fee paid to MFD. MFD may subsequently pay all, or a portion, of the distribution and/or service fees to financial intermediaries. The
distribution and service fees are computed daily and paid monthly.
Distribution Plan Fee Table:
| Class A | |||||
| Distribution Fee Rate (d) | Service Fee Rate (d) | Total Distribution Plan (d) | Annual Effective Rate (e) | Distribution and Service Fee | |
| Alabama Fund | — | 0.25% | 0.25% | 0.25% | $56,692 |
| Arkansas Fund | — | 0.25% | 0.25% | 0.10% | 153,820 |
| California Fund | — | 0.25% | 0.25% | 0.10% | 380,413 |
| Georgia Fund | — | 0.25% | 0.25% | 0.25% | 99,140 |
| Maryland Fund | — | 0.25% | 0.25% | 0.25% | 112,386 |
| Massachusetts Fund | — | 0.25% | 0.25% | 0.25% | 300,210 |
| Class B | |||||
| Distribution Fee Rate (d) | Service Fee Rate (d) | Total Distribution Plan (d) | Annual Effective Rate (e) | Distribution and Service Fee | |
| Alabama Fund | 0.75% | 0.25% | 1.00% | 1.00% | $264 |
| Arkansas Fund | 0.75% | 0.25% | 1.00% | 0.85% | 1,321 |
| California Fund | 0.75% | 0.25% | 1.00% | 0.85% | 1,196 |
| Georgia Fund | 0.75% | 0.25% | 1.00% | 1.00% | 225 |
| Maryland Fund | 0.75% | 0.25% | 1.00% | 1.00% | 1,155 |
| Massachusetts Fund | 0.75% | 0.25% | 1.00% | 1.00% | 1,116 |
| Class C | |||||
| Distribution Fee Rate (d) | Service Fee Rate (d) | Total Distribution Plan (d) | Annual Effective Rate (e) | Distribution and Service Fee | |
| California Fund | 0.75% | 0.25% | 1.00% | 1.00% | $55,752 |
| Alabama Fund | Arkansas Fund | California Fund | Georgia Fund | Maryland Fund | Massachusetts Fund | |
| Total Distribution and Service Fees | $56,956 | $155,141 | $437,361 | $99,365 | $113,541 | $301,326 |
| (d) | In accordance with the distribution plan for certain classes, each fund pays distribution and/or service fees equal to these annual percentage rates of each class’s average daily net assets. The distribution and service fee rates disclosed by class represent the current rates in effect at the end of the reporting period. Any rate changes, if applicable, are detailed below. |
| (e) | The annual effective rates represent actual fees incurred under the distribution plan for the six months ended September 30, 2023 based on each class's average daily net assets. MFD has voluntarily agreed to rebate a portion of each class’s 0.25% service fee attributable to accounts for which |
82
Notes to Financial
Statements (unaudited) - continued
there is no financial
intermediary specified on the account except for accounts attributable to MFS or its affiliates’ seed money. For the six months ended September 30, 2023, these rebates amounted to the following and are included
in the reduction of total expenses in the Statements of Operations:
| Alabama Fund | Arkansas Fund | California Fund | Georgia Fund | Maryland Fund | Massachusetts Fund | |
| Class A | $— | $— | $69 | $5 | $104 | $— |
Arkansas
Fund: MFD has agreed in writing to reduce the Class A and Class B service fee rate to 0.10%. This written agreement will continue until modified by the fund’s Board of Trustees, but such
agreement will continue at least until July 31, 2024. For the six months ended September 30, 2023, these reductions amounted to $92,293 and $198 for Class A and Class B shares, respectively, and are included in the
reduction of total expenses in the Statements of Operations.
California
Fund: MFD has agreed in writing to reduce the Class A and Class B service fee rate to 0.10%. This written agreement will continue until modified by the fund’s Board of Trustees, but such
agreement will continue at least until July 31, 2024. For the six months ended September 30, 2023, these reductions amounted to $228,249 and $180 for Class A and Class B shares, respectively, and are included in the
reduction of total expenses in the Statements of Operations.
Certain Class A shares are
subject to a contingent deferred sales charge (CDSC) in the event of a shareholder redemption within 18 months of purchase. Class B shares are subject to a CDSC in the event of a shareholder redemption within six
years of purchase. Class C shares are subject to a CDSC in the event of a shareholder redemption within 12 months of purchase. All contingent deferred sales charges are paid to MFD and during the six months
ended September 30, 2023, were as follows:
| CDSC Imposed | Alabama Fund | Arkansas Fund | California Fund | Georgia Fund | Maryland Fund | Massachusetts Fund |
| Class A | $68 | $2,211 | $10,599 | $274 | $— | $24,164 |
| Class B | — | — | — | — | 278 | — |
| Class C | N/A | N/A | 12 | N/A | N/A | N/A |
Shareholder Servicing Agent — MFS Service Center, Inc. (MFSC), a wholly-owned subsidiary of MFS, receives a fee from each fund for its services as shareholder servicing agent calculated as a percentage of the
average daily net assets of each fund as determined periodically under the supervision of the funds’ Board of Trustees. For the six months ended September 30, 2023, each fund paid the following fee, which
equated to the following annual percentage of each fund’s average daily net assets:
| Alabama Fund | Arkansas Fund | California Fund | Georgia Fund | Maryland Fund | Massachusetts Fund | |
| Expenses paid | $968 | $1,120 | $7,376 | $1,485 | $4,636 | $9,533 |
| Annual percentage of average daily net assets | 0.0029% | 0.0015% | 0.0030% | 0.0028% | 0.0073% | 0.0048% |
MFSC also receives reimbursement
from each fund for out-of-pocket expenses, sub-accounting and other shareholder servicing costs which may be paid to affiliated and unaffiliated service providers. Class R6 shares do not incur sub-accounting fees. For
the six months ended September 30, 2023, these out-of-pocket expenses, sub-accounting and other shareholder servicing costs amounted to the following:
| Alabama Fund | Arkansas Fund | California Fund | Georgia Fund | Maryland Fund | Massachusetts Fund |
| $24,457 | $53,474 | $160,609 | $25,941 | $45,187 | $149,837 |
Administrator — MFS provides certain financial, legal, shareholder communications, compliance, and other administrative services to each fund. Under an administrative services agreement, each
fund reimburses MFS the costs incurred to provide these services. Each fund is charged an annual fixed amount of $17,500 plus a fee based on average daily net assets. The administrative services fee is computed daily
and paid monthly. The administrative services fee incurred for the six months ended September 30, 2023 was equivalent to the following annual effective rates of each fund's average daily net assets:
| Alabama Fund | Arkansas Fund | California Fund | Georgia Fund | Maryland Fund | Massachusetts Fund | |
| Percentage of average daily net assets | 0.0296% | 0.0214% | 0.0164% | 0.0243% | 0.0224% | 0.0170% |
Trustees’ and
Officers’ Compensation — Each fund pays compensation to independent Trustees in the form of a retainer, attendance fees, and additional compensation to Board and Committee chairpersons.
Independent Trustees’ compensation is accrued daily and paid subsequent to each Trustee Board meeting. The funds do not pay compensation directly to Trustees or officers of each fund who are also officers
of the investment adviser, all of whom receive remuneration from MFS for their services to each fund. Certain officers and Trustees of each fund are officers or directors of MFS, MFD, and MFSC.
Prior to December 31, 2001, each
fund had an unfunded defined benefit plan (“DB plan”) for independent Trustees. As of December 31, 2001, the Board took action to terminate the DB plan with respect to then-current and any future
independent Trustees, such that the DB plan covers only certain of those former independent Trustees who retired on or before December 31,
83
Notes to Financial
Statements (unaudited) - continued
2001. The Alabama Fund, the Arkansas Fund, and
the Georgia Fund no longer participate in the DB plan. The DB plan resulted in a pension expense for the following funds. These amounts are included in “Independent Trustees’ compensation” in the
Statements of Operations for the six months ended September 30, 2023:
| California Fund | Maryland Fund | Massachusetts Fund |
| $229 | $143 | $145 |
The liability for deferred
retirement benefits payable to those former independent Trustees under the DB plan amounted to the following at September 30, 2023, and is included in “Payable for independent Trustees’ compensation”
in the Statements of Assets and Liabilities. The deferred retirement benefits compensation fee is accrued daily and paid monthly:
| California Fund | Maryland Fund | Massachusetts Fund |
| $3,720 | $2,238 | $2,230 |
Other — Each fund invests in the MFS Institutional Money Market Portfolio which is managed by MFS and seeks current income consistent with preservation of capital and liquidity. This money
market fund does not pay a management fee to MFS but does incur investment and operating costs.
MFS purchased or redeemed the
following fund shares:
| Fund | Date | Transaction | Class | Shares | Amount |
| Alabama Fund | 8/03/2022 | Redemption | Class I | 17 | $157 |
| Alabama Fund | 6/23/2023 | Purchase | Class B | 1,480 | 13,850 |
| Alabama Fund | 6/23/2023 | Redemption | Class R6 | 6,014 | 53,645 |
| Arkansas Fund | 8/03/2022 | Redemption | Class I | 15 | 139 |
| California Fund | 8/03/2022 | Redemption | Class I | 17 | 158 |
| California Fund | 8/03/2022 | Redemption | Class R6 | 21 | 195 |
| Georgia Fund | 8/03/2022 | Purchase | Class B | 1,164 | 12,000 |
| Georgia Fund | 8/03/2022 | Redemption | Class I | 15 | 140 |
| Georgia Fund | 6/23/2023 | Purchase | Class B | 3,012 | 30,229 |
| Maryland Fund | 8/03/2022 | Redemption | Class I | 18 | 167 |
| Massachusetts Fund | 8/03/2022 | Redemption | Class I | 17 | 156 |
At September 30, 2023, MFS held
approximately 83% of the outstanding shares of Class B of the Georgia Fund.
(4) Portfolio Securities
For the six months ended
September 30, 2023, purchases and sales of investments, other than short-term obligations, were as follows:
| Alabama Fund | Arkansas Fund | California Fund | Georgia Fund | Maryland Fund | Massachusetts Fund | |
| Purchases | $6,657,169 | $12,401,331 | $73,692,339 | $6,262,638 | $13,224,988 | $24,431,530 |
| Sales | $8,010,445 | $9,091,023 | $45,694,819 | $4,765,773 | $9,444,293 | $26,332,960 |
(5) Shares of Beneficial
Interest
Each fund's Declaration of Trust
permits the Trustees to issue an unlimited number of full and fractional shares of beneficial interest. Transactions in fund shares were as follows:
| Alabama Fund | Arkansas Fund | ||||||||||
| Six Months Ended 9/30/23 | Year ended 3/31/23 | Six Months Ended 9/30/23 | Year ended 3/31/23 | ||||||||
| Shares | Amount | Shares | Amount | Shares | Amount | Shares | Amount | ||||
| Shares sold | |||||||||||
| Class A | 356,960 | $ 3,328,827 | 720,833 | $ 6,708,346 | 604,818 | $ 5,426,941 | 3,303,159 | $ 29,808,552 | |||
| Class B | 1,530 | 14,314 | 76 | 702 | — | — | — | — | |||
| Class I | 99,596 | 884,826 | 613,013 | 5,470,610 | 352,302 | 3,133,567 | 674,905 | 6,096,372 | |||
| Class R6 | 78,193 | 689,863 | 143,020 | 1,275,915 | 88,896 | 793,427 | 320,125 | 2,867,747 | |||
| 536,279 | $4,917,830 | 1,476,942 | $13,455,573 | 1,046,016 | $9,353,935 | 4,298,189 | $38,772,671 | ||||
84
Notes to Financial
Statements (unaudited) - continued
| Alabama Fund − continued | Arkansas Fund − continued | ||||||||||
| Six Months Ended 9/30/23 | Year ended 3/31/23 | Six Months Ended 9/30/23 | Year ended 3/31/23 | ||||||||
| Shares | Amount | Shares | Amount | Shares | Amount | Shares | Amount | ||||
| Shares issued to shareholders in reinvestment of distributions | |||||||||||
| Class A | 64,756 | $ 596,259 | 115,455 | $ 1,076,800 | 195,579 | $ 1,743,158 | 349,867 | $ 3,157,324 | |||
| Class B | 12 | 111 | 28 | 264 | 333 | 2,969 | 944 | 8,522 | |||
| Class I | 24,893 | 218,464 | 55,624 | 494,696 | 28,625 | 253,303 | 79,799 | 715,294 | |||
| Class R6 | 6,162 | 54,056 | 11,645 | 103,578 | 9,609 | 84,995 | 15,828 | 141,901 | |||
| 95,823 | $868,890 | 182,752 | $1,675,338 | 234,146 | $2,084,425 | 446,438 | $4,023,041 | ||||
| Shares reacquired | |||||||||||
| Class A | (514,306) | $ (4,785,522) | (2,213,039) | $ (20,790,052) | (844,968) | $ (7,584,828) | (3,449,128) | $ (31,234,404) | |||
| Class B | (1,715) | (16,173) | — | — | (6,670) | (59,986) | (18,905) | (170,457) | |||
| Class I | (250,887) | (2,215,089) | (1,640,622) | (14,541,559) | (333,898) | (2,974,547) | (2,562,893) | (22,914,159) | |||
| Class R6 | (71,915) | (632,874) | (317,588) | (2,820,718) | (62,542) | (558,097) | (369,744) | (3,341,255) | |||
| (838,823) | $(7,649,658) | (4,171,249) | $(38,152,329) | (1,248,078) | $(11,177,458) | (6,400,670) | $(57,660,275) | ||||
| Net change | |||||||||||
| Class A | (92,590) | $ (860,436) | (1,376,751) | $ (13,004,906) | (44,571) | $ (414,729) | 203,898 | $ 1,731,472 | |||
| Class B | (173) | (1,748) | 104 | 966 | (6,337) | (57,017) | (17,961) | (161,935) | |||
| Class I | (126,398) | (1,111,799) | (971,985) | (8,576,253) | 47,029 | 412,323 | (1,808,189) | (16,102,493) | |||
| Class R6 | 12,440 | 111,045 | (162,923) | (1,441,225) | 35,963 | 320,325 | (33,791) | (331,607) | |||
| (206,721) | $(1,862,938) | (2,511,555) | $(23,021,418) | 32,084 | $260,902 | (1,656,043) | $(14,864,563) | ||||
| California Fund | Georgia Fund | ||||||||||
| Six Months Ended 9/30/23 | Year ended 3/31/23 | Six Months Ended 9/30/23 | Year ended 3/31/23 | ||||||||
| Shares | Amount | Shares | Amount | Shares | Amount | Shares | Amount | ||||
| Shares sold | |||||||||||
| Class A | 6,999,735 | $ 38,228,628 | 16,913,905 | $ 92,715,220 | 463,790 | $ 4,610,290 | 1,092,737 | $ 10,834,589 | |||
| Class B | — | — | — | — | 3,012 | 30,229 | 1,164 | 12,000 | |||
| Class C | 116,498 | 646,306 | 251,403 | 1,391,500 | — | — | — | — | |||
| Class I | 3,041,761 | 26,827,263 | 12,846,155 | 115,742,704 | 150,570 | 1,339,794 | 683,449 | 6,167,535 | |||
| Class R6 | 1,505,790 | 13,376,841 | 4,468,708 | 39,994,888 | 214,228 | 1,931,897 | 450,027 | 4,101,223 | |||
| 11,663,784 | $79,079,038 | 34,480,171 | $249,844,312 | 831,600 | $7,912,210 | 2,227,377 | $21,115,347 | ||||
| Shares issued to shareholders in reinvestment of distributions | |||||||||||
| Class A | 886,769 | $ 4,820,802 | 1,558,072 | $ 8,561,775 | 106,189 | $ 1,044,493 | 189,813 | $ 1,880,159 | |||
| Class B | 596 | 3,240 | 1,367 | 7,519 | 38 | 374 | 31 | 306 | |||
| Class C | 24,367 | 132,914 | 48,502 | 267,341 | — | — | — | — | |||
| Class I | 205,939 | 1,822,373 | 344,502 | 3,082,155 | 14,545 | 129,766 | 25,607 | 229,581 | |||
| Class R6 | 118,667 | 1,048,695 | 187,809 | 1,678,050 | 22,834 | 203,777 | 45,483 | 409,059 | |||
| 1,236,338 | $7,828,024 | 2,140,252 | $13,596,840 | 143,606 | $1,378,410 | 260,934 | $2,519,105 | ||||
| Shares reacquired | |||||||||||
| Class A | (5,891,610) | $(32,235,161) | (25,454,457) | $(140,562,940) | (617,233) | $ (6,109,561) | (2,859,001) | $ (28,365,428) | |||
| Class B | (2,409) | (13,175) | (33,615) | (186,760) | (968) | (9,425) | (1,982) | (20,040) | |||
| Class C | (229,901) | (1,259,910) | (1,098,697) | (6,076,143) | — | — | — | — | |||
| Class I | (1,853,184) | (16,444,519) | (15,497,036) | (139,289,274) | (185,854) | (1,662,586) | (874,048) | (7,800,232) | |||
| Class R6 | (973,709) | (8,634,820) | (4,010,627) | (35,884,924) | (199,912) | (1,796,604) | (1,272,812) | (11,447,384) | |||
| (8,950,813) | $(58,587,585) | (46,094,432) | $(322,000,041) | (1,003,967) | $(9,578,176) | (5,007,843) | $(47,633,084) | ||||
85
Notes to Financial
Statements (unaudited) - continued
| California Fund − continued | Georgia Fund − continued | ||||||||||
| Six Months Ended 9/30/23 | Year ended 3/31/23 | Six Months Ended 9/30/23 | Year ended 3/31/23 | ||||||||
| Shares | Amount | Shares | Amount | Shares | Amount | Shares | Amount | ||||
| Net change | |||||||||||
| Class A | 1,994,894 | $ 10,814,269 | (6,982,480) | $ (39,285,945) | (47,254) | $ (454,778) | (1,576,451) | $ (15,650,680) | |||
| Class B | (1,813) | (9,935) | (32,248) | (179,241) | 2,082 | 21,178 | (787) | (7,734) | |||
| Class C | (89,036) | (480,690) | (798,792) | (4,417,302) | — | — | — | — | |||
| Class I | 1,394,516 | 12,205,117 | (2,306,379) | (20,464,415) | (20,739) | (193,026) | (164,992) | (1,403,116) | |||
| Class R6 | 650,748 | 5,790,716 | 645,890 | 5,788,014 | 37,150 | 339,070 | (777,302) | (6,937,102) | |||
| 3,949,309 | $28,319,477 | (9,474,009) | $(58,558,889) | (28,761) | $(287,556) | (2,519,532) | $(23,998,632) | ||||
| Maryland Fund | Massachusetts Fund | ||||||||||
| Six Months Ended 9/30/23 | Year ended 3/31/23 | Six Months Ended 9/30/23 | Year ended 3/31/23 | ||||||||
| Shares | Amount | Shares | Amount | Shares | Amount | Shares | Amount | ||||
| Shares sold | |||||||||||
| Class A | 414,375 | $ 4,091,993 | 5,929,738 | $ 57,645,267 | 948,812 | $ 9,524,137 | 24,299,659 | $ 242,110,913 | |||
| Class B | — | — | — | — | — | — | 1,470 | 14,902 | |||
| Class I | 628,289 | 5,597,056 | 2,026,526 | 18,031,427 | 2,174,267 | 18,970,060 | 11,571,924 | 102,710,711 | |||
| Class R6 | 265,022 | 2,356,441 | 436,181 | 3,903,263 | 150,010 | 1,316,966 | 374,602 | 3,315,322 | |||
| 1,307,686 | $12,045,490 | 8,392,445 | $79,579,957 | 3,273,089 | $29,811,163 | 36,247,655 | $348,151,848 | ||||
| Shares issued to shareholders in reinvestment of distributions | |||||||||||
| Class A | 129,716 | $ 1,270,950 | 196,702 | $ 1,946,856 | 324,385 | $ 3,234,032 | 583,760 | $ 5,877,136 | |||
| Class B | 273 | 2,677 | 760 | 7,534 | 238 | 2,387 | 542 | 5,466 | |||
| Class I | 46,190 | 408,045 | 74,108 | 662,159 | 230,431 | 2,010,168 | 439,024 | 3,870,082 | |||
| Class R6 | 17,076 | 150,814 | 24,810 | 222,148 | 17,500 | 152,743 | 32,123 | 283,383 | |||
| 193,255 | $1,832,486 | 296,380 | $2,838,697 | 572,554 | $5,399,330 | 1,055,449 | $10,036,067 | ||||
| Shares reacquired | |||||||||||
| Class A | (1,163,673) | $(11,392,617) | (4,512,798) | $ (44,458,113) | (2,350,185) | $(23,463,478) | (20,925,299) | $(208,558,550) | |||
| Class B | (4,115) | (40,694) | (30,068) | (295,257) | (11,111) | (111,080) | (8,248) | (83,468) | |||
| Class I | (406,321) | (3,581,545) | (1,964,610) | (17,545,627) | (1,984,264) | (17,383,948) | (14,371,267) | (126,598,269) | |||
| Class R6 | (56,041) | (496,119) | (517,057) | (4,602,206) | (119,710) | (1,049,734) | (511,978) | (4,521,263) | |||
| (1,630,150) | $(15,510,975) | (7,024,533) | $(66,901,203) | (4,465,270) | $(42,008,240) | (35,816,792) | $(339,761,550) | ||||
| Net change | |||||||||||
| Class A | (619,582) | $ (6,029,674) | 1,613,642 | $ 15,134,010 | (1,076,988) | $(10,705,309) | 3,958,120 | $ 39,429,499 | |||
| Class B | (3,842) | (38,017) | (29,308) | (287,723) | (10,873) | (108,693) | (6,236) | (63,100) | |||
| Class I | 268,158 | 2,423,556 | 136,024 | 1,147,959 | 420,434 | 3,596,280 | (2,360,319) | (20,017,476) | |||
| Class R6 | 226,057 | 2,011,136 | (56,066) | (476,795) | 47,800 | 419,975 | (105,253) | (922,558) | |||
| (129,209) | $(1,632,999) | 1,664,292 | $15,517,451 | (619,627) | $(6,797,747) | 1,486,312 | $18,426,365 | ||||
Effective June 1, 2019,
purchases of each fund’s Class B shares were closed to new and existing investors subject to certain exceptions.
(6) Line of Credit
Each fund and certain other
funds managed by MFS participate in a $1.45 billion unsecured committed line of credit of which $1.2 billion is reserved for use by each fund and certain other MFS U.S. funds. The line of credit is provided by a
syndicate of banks under a credit agreement. Borrowings may be made for temporary financing needs. Interest is charged to each fund, based on its borrowings, generally at a rate equal to the highest of 1) Daily Simple
SOFR (Secured Overnight Financing Rate) plus 0.10%, 2) the Federal Funds Effective Rate, or 3) the Overnight Bank Funding Rate, each plus an agreed upon spread. A commitment fee, based on the average daily unused
portion of the committed line of credit, is allocated among the participating funds. The line of credit expires on March 14, 2024 unless extended or renewed. In addition, each fund and other funds managed by MFS have
established unsecured uncommitted borrowing arrangements with certain banks for temporary financing needs. Interest is charged to each fund,
86
Notes to Financial
Statements (unaudited) - continued
based on its borrowings, at rates equal to
customary reference rates plus an agreed upon spread. For the six months ended September 30, 2023, each fund’s commitment fee and interest expense were as follows and are included in “Miscellaneous”
expense in the Statements of Operations:
| Alabama Fund | Arkansas Fund | California Fund | Georgia Fund | Maryland Fund | Massachusetts Fund | |
| Commitment Fee | $178 | $380 | $1,279 | $257 | $339 | $1,059 |
| Interest Expense | — | — | — | — | — | — |
(7) Investments in
Affiliated Issuers
An affiliated issuer of a fund
may be considered one in which the fund owns 5% or more of the outstanding voting securities, or a company which is under common control. For the purposes of this report, each fund assumes the MFS Institutional Money
Market Portfolio to be an affiliated issuer. Each fund’s transactions in the MFS Institutional Money Market Portfolio for the six months ended September 30, 2023, are as follows:
| Affiliated Issuer - MFS Institutional Money Market Portfolio | ||||||
| Beginning Value | Purchases | Sales Proceeds | Realized Gain (Loss) | Change in Unrealized Appreciation or Depreciation | Ending Value | |
| Alabama Fund | $1,420,478 | $10,387,302 | $10,607,805 | $(95) | $(140) | $1,199,740 |
| Arkansas Fund | 2,404,434 | 14,840,018 | 16,337,385 | (922) | (138) | 906,007 |
| California Fund | 9,269,803 | 82,815,081 | 80,312,740 | (2,557) | (276) | 11,769,311 |
| Georgia Fund | 2,287,590 | 12,130,114 | 13,129,153 | (431) | (292) | 1,287,828 |
| Maryland Fund | 2,575,767 | 17,672,543 | 19,290,698 | 1,043 | (419) | 958,236 |
| Massachusetts Fund | 8,411,492 | 40,445,660 | 44,626,171 | (1,857) | (338) | 4,228,786 |
| Dividend Income | Capital Gain Distributions | |
| Alabama Fund | $32,587 | $— |
| Arkansas Fund | 48,553 | — |
| California Fund | 182,731 | — |
| Georgia Fund | 32,085 | — |
| Maryland Fund | 42,981 | — |
| Massachusetts Fund | 123,804 | — |
87
Board Review of Investment
Advisory Agreement
The Investment Company Act of
1940 requires that both the full Board of Trustees and a majority of the non-interested (“independent”) Trustees, voting separately, annually approve the continuation of each Fund’s investment
advisory agreement with MFS. The Trustees consider matters bearing on the Funds and their advisory arrangements at their meetings throughout the year, including a review of performance data at each regular
meeting. In addition, the independent Trustees met several times over the course of three months beginning in May and ending in July, 2023 (“contract review meetings”) for the specific purpose of
considering whether to approve the continuation of the investment advisory agreement for the Funds and the other investment companies that the Board oversees (the “MFS Funds”). The independent
Trustees were assisted in their evaluation of the Funds’ investment advisory agreement by independent legal counsel, from whom they received separate legal advice and with whom they met separately from MFS
during various contract review meetings. The independent Trustees were also assisted in this process by an independent consultant who was retained by and reported to the independent Trustees.
In connection with their
deliberations regarding the continuation of the investment advisory agreement, the Trustees, including the independent Trustees, considered such information and factors as they believed, in light of the legal advice
furnished to them and their own business judgment, to be relevant. The investment advisory agreement for each Fund was considered separately, although the Trustees also took into account the common interests of
all MFS Funds in their review. As described below, the Trustees considered the nature, quality, and extent of the various investment advisory, administrative, and shareholder services performed by MFS under the
existing investment advisory agreement and other arrangements with the Funds.
In connection with their
contract review meetings, the Trustees received and relied upon materials that included, among other items: (i) information provided by Broadridge Financial Solutions, Inc. (“Broadridge”), an independent
third party, on the investment performance of the Funds for various time periods ended December 31, 2022 and the investment performance of a group of funds with substantially similar investment
classifications/objectives (the “Broadridge performance universe”), (ii) information provided by Broadridge on the Funds’ advisory fees and other expenses and the advisory fees and other expenses of
comparable funds identified by Broadridge as well as all other funds in the same investment classification/category (the “Broadridge expense group and universe”), (iii) information provided by MFS on the
advisory fees of portfolios of other clients of MFS, including institutional separate accounts and other clients, (iv) information as to whether and to what extent applicable expense waivers, reimbursements or fee
“breakpoints” are observed for the Funds, (v) information regarding MFS’ financial results and financial condition, including MFS’ and certain of its affiliates’ estimated profitability
from services performed for the Funds and the MFS Funds as a whole, and compared to MFS' institutional business, (vi) MFS’ views regarding the outlook for the mutual fund industry and the strategic business
plans of MFS, (vii) descriptions of various functions performed by MFS for the Funds, such as compliance monitoring and portfolio trading practices, and (viii) information regarding the overall organization of MFS,
including information about MFS’ senior management and other personnel providing investment advisory, administrative and other services to the Funds and the other MFS Funds. The comparative performance,
fee and expense information prepared and provided by Broadridge was not independently verified and the independent Trustees did not independently verify any information provided to them by MFS.
The Trustees’ conclusion
as to the continuation of the investment advisory agreement was based on a comprehensive consideration of all information provided to the Trustees and not the result of any single factor. Some of the factors
that figured particularly in the Trustees’ deliberations are described below, although individual Trustees may have evaluated the information presented differently from one another, giving different weights to
various factors. It is also important to recognize that the fee arrangements for the Funds and other MFS Funds are the result of years of review and discussion between the independent Trustees and MFS, that
certain aspects of such arrangements may receive greater scrutiny in some years than in others, and that the Trustees’ conclusions may be based, in part, on their consideration of these same arrangements during
the course of the year and in prior years.
Based on information provided
by Broadridge and MFS, the Trustees reviewed each Fund’s total return investment performance as well as its respective Broadridge performance universe over various time periods. The Trustees placed
particular emphasis on the total return performance of each Fund’s Class I shares in comparison to the performance of funds in its respective Broadridge performance universe over the five-year period ended
December 31, 2022, which the Trustees believed was a long enough period to reflect differing market conditions. See below for a description of the performance information considered by the Trustees.
In assessing the
reasonableness of each Fund’s advisory fee, the Trustees considered, among other information, each Fund’s advisory fee and the total expense ratio of each Fund’s Class I shares as a percentage of
average daily net assets and the advisory fee and total expense ratios of the Broadridge expense groups based on information provided by Broadridge. The Trustees considered whether the Funds were subject to any
fee waivers or reductions or expense limitations. See below for a description of the fee information considered by the Trustees.
The Trustees also considered
the advisory fees charged by MFS to any institutional separate accounts advised by MFS (“separate accounts”) and unaffiliated investment companies for which MFS serves as subadviser (“subadvised
funds”) that have comparable investment strategies to each Fund, if any. In comparing these fees, the Trustees considered information provided by MFS as to the generally broader scope of services provided
by MFS to each Fund, as well as the more extensive regulatory burdens imposed on MFS in managing each Fund, in comparison to the relevant separate accounts and subadvised funds. The Trustees also considered the
higher demands placed on MFS’ investment personnel and trading infrastructure as a result of the daily cash in-flows and out-flows of each Fund in comparison to the relevant separate accounts.
88
Board Review of Investment Advisory
Agreement - continued
The Trustees also considered
whether each Fund may benefit from any economies of scale in the management of the Fund in the event of growth in assets of the Fund and/or growth in assets of the MFS Funds as a whole. They noted that each
Fund’s advisory fee rate schedule is not subject to any breakpoints. Taking into account the information noted below, the Trustees determined not to recommend any advisory fee breakpoints for the Funds at
this time. The Trustees also noted that MFS has agreed in writing to waive a portion of the management fees of certain MFS Funds, including the Funds, if the total combined assets of certain funds within the MFS
Funds’ complex increase above agreed upon thresholds (the “group fee waiver”), enabling each Fund’s shareholders to share in the benefits from any economies of scale at the complex level.
The group fee waiver is reviewed and renewed annually between the Board and MFS. The Trustees concluded that the group fee waiver was sufficient to allow each Fund to benefit from economies of scale as its
assets and overall complex assets grow.
The Trustees also considered
information prepared by MFS relating to MFS’ costs and profits with respect to each Fund, the MFS Funds considered as a group, and other investment companies and accounts advised by MFS, as well as MFS’
methodologies used to determine and allocate its costs to the MFS Funds, the Funds and other accounts and products for purposes of estimating profitability.
After reviewing these and
other factors described herein, the Trustees concluded, within the context of their overall conclusions regarding the investment advisory agreement, that the advisory fees charged to each Fund represent reasonable
compensation in light of the services being provided by MFS to the Funds.
In addition, the Trustees
considered MFS’ resources and related efforts to continue to retain, attract and motivate capable personnel to serve the Funds. The Trustees also considered current and developing conditions in the
financial services industry, including the presence of large and well-capitalized companies which are spending, and appear to be prepared to continue to spend, substantial sums to engage personnel and to provide
services to competing investment companies. In this regard, the Trustees also considered the financial resources of MFS and its ultimate parent, Sun Life Financial Inc. The Trustees also considered the
advantages and possible disadvantages to the Funds of having an adviser that also serves other investment companies as well as other accounts.
The Trustees also considered
the nature, quality, cost, and extent of administrative, transfer agency, and distribution services provided to the Funds by MFS and its affiliates under agreements and plans other than the investment advisory
agreement, including any 12b-1 fees the Funds pay to MFS Fund Distributors, Inc., an affiliate of MFS. The Trustees also considered the nature, extent and quality of certain other services MFS performs or
arranges for on the Funds’ behalf, which may include securities lending programs, directed expense payment programs, class action recovery programs, and MFS’ interaction with third-party service providers,
principally custodians and sub-custodians. The Trustees concluded that the various non-advisory services provided by MFS and its affiliates on behalf of the Funds were satisfactory.
The Trustees considered
so-called “fall-out benefits” to MFS such as reputational value derived from serving as investment manager to the MFS Funds. The Trustees also considered that MFS discontinued its historic practice
of obtaining investment research from portfolio brokerage commissions paid by certain MFS Funds effective January 2018, and directly pays or voluntarily reimburses a Fund, if applicable, for the costs of external
research acquired through the use of the Fund’s portfolio brokerage commissions.
Based on their evaluation of
factors that they deemed to be material, including those factors described above, the Board of Trustees, including the independent Trustees, concluded that each Fund’s investment advisory agreement with MFS
should be continued for an additional one-year period, commencing August 1, 2023.
MFS Alabama Municipal Bond
Fund
The total return performance
of the Fund’s Class I shares was in the 2nd quintile relative to the funds in its Broadridge performance universe for the five-year period ended December 31, 2022 (the 1st quintile being the best performers and the 5th quintile being the worst performers). The total return performance of the Fund’s Class I shares was in the 3rd quintile for each of the one- and three-year periods ended December 31, 2022 relative to the other funds in the universe. Because of the passage of
time, these performance results may differ from the performance results for more recent periods, including those shown elsewhere in this report.
In the course of their
deliberations, the Trustees took into account information provided by MFS in connection with the contract review meetings, as well as during investment review meetings conducted with portfolio management personnel
during the course of the year regarding the Fund’s performance. After reviewing these and related factors, the Trustees concluded, within the context of their overall conclusions regarding the investment
advisory agreement, that they were satisfied with MFS’ responses and efforts relating to investment performance.
In assessing the
reasonableness of the Fund’s advisory fee, the Trustees considered that MFS currently observes an expense limitation for the Fund, which may not be changed without the Trustees’ approval. The
Trustees also considered that, according to the data provided by Broadridge (which takes into account any fee reductions or expense limitations that were in effect during the Fund’s last fiscal year), the
Fund’s effective advisory fee rate and total expense ratio were each approximately at the Broadridge expense group median.
89
Board Review of Investment Advisory
Agreement - continued
MFS Arkansas Municipal Bond
Fund
The total return performance
of the Fund’s Class I shares was in the 1st quintile relative to the funds in its Broadridge performance universe for each of the one-, three-, and five-year periods ended December 31, 2022
(the 1st quintile being the best performers and the 5th quintile being the worst performers). Because of the passage of time, these performance results may differ from the performance results for more
recent periods, including those shown elsewhere in this report.
In the course of their
deliberations, the Trustees took into account information provided by MFS in connection with the contract review meetings, as well as during investment review meetings conducted with portfolio management personnel
during the course of the year regarding the Fund’s performance. After reviewing these and related factors, the Trustees concluded, within the context of their overall conclusions regarding the investment
advisory agreement, that they were satisfied with MFS’ responses and efforts relating to investment performance.
In assessing the
reasonableness of the Fund’s advisory fee, the Trustees considered that MFS currently observes an expense limitation for the Fund, which may not be changed without the Trustees’ approval. The
Trustees also considered that, according to the data provided by Broadridge (which takes into account any fee reductions or expense limitations that were in effect during the Fund’s last fiscal year), the
Fund’s effective advisory fee rate and total expense ratio were each approximately at the Broadridge expense group median.
MFS California Municipal Bond
Fund
The total return performance
of the Fund’s Class I shares was in the 2nd quintile relative to the funds in its Broadridge performance universe for the five-year period ended December 31, 2022 (the 1st quintile being the best performers and the 5th quintile being the worst performers). The total return performance of the Fund’s Class I shares was in the 4th quintile for the one-year period and the 3rd quintile for the three-year period ended December 31, 2022 relative to the other funds in the universe. Because of the passage of time, these
performance results may differ from the performance results for more recent periods, including those shown elsewhere in this report.
In the course of their
deliberations, the Trustees took into account information provided by MFS in connection with the contract review meetings, as well as during investment review meetings conducted with portfolio management personnel
during the course of the year regarding the Fund’s performance. After reviewing these and related factors, the Trustees concluded, within the context of their overall conclusions regarding the investment
advisory agreement, that they were satisfied with MFS’ responses and efforts relating to investment performance.
In assessing the
reasonableness of the Fund’s advisory fee the Trustees considered that, according to the data provided by Broadridge (which takes into account any fee reductions or expense limitations that were in effect during
the Fund’s last fiscal year), the Fund’s effective advisory fee rate was approximately at the Broadridge expense group median and the Fund’s total expense ratio was higher than the Broadridge expense
group median.
MFS Georgia Municipal Bond
Fund
The total return performance
of the Fund’s Class I shares was in the 2nd quintile relative to the funds in its Broadridge performance universe for each of the one-, three-, and five-year periods ended December 31, 2022
(the 1st quintile being the best performers and the 5th quintile being the worst performers). Because of the passage of time, these performance results may differ from the performance results for more
recent periods, including those shown elsewhere in this report.
In the course of their
deliberations, the Trustees took into account information provided by MFS in connection with the contract review meetings, as well as during investment review meetings conducted with portfolio management personnel
during the course of the year regarding the Fund’s performance. After reviewing these and related factors, the Trustees concluded, within the context of their overall conclusions regarding the investment
advisory agreement, that they were satisfied with MFS’ responses and efforts relating to investment performance.
In assessing the
reasonableness of the Fund’s advisory fee, the Trustees considered that MFS currently observes an expense limitation for the Fund, which may not be changed without the Trustees’ approval. The
Trustees also considered that, according to the data provided by Broadridge (which takes into account any fee reductions or expense limitations that were in effect during the Fund’s last fiscal year), the
Fund’s effective advisory fee rate and total expense ratio were each approximately at the Broadridge expense group median.
MFS Maryland Municipal Bond
Fund
The total return performance
of the Fund’s Class I shares was in the 1st quintile relative to the funds in its Broadridge performance universe for each of the one-, three-, and five-year periods ended December 31, 2022
(the 1st quintile being the best performers and the 5th quintile being the worst performers). Because of the passage of time, these performance results may differ from the performance results for
more recent periods, including those shown elsewhere in this report.
90
Board Review of Investment Advisory
Agreement - continued
In the course of their
deliberations, the Trustees took into account information provided by MFS in connection with the contract review meetings, as well as during investment review meetings conducted with portfolio management personnel
during the course of the year regarding the Fund’s performance. After reviewing these and related factors, the Trustees concluded, within the context of their overall conclusions regarding the investment
advisory agreement, that they were satisfied with MFS’ responses and efforts relating to investment performance.
In assessing the
reasonableness of the Fund’s advisory fee, the Trustees considered that MFS currently observes an expense limitation for the Fund, which may not be changed without the Trustees’ approval. The
Trustees also considered that, according to the data provided by Broadridge (which takes into account any fee reductions or expense limitations that were in effect during the Fund’s last fiscal year), the
Fund’s effective advisory fee rate was lower than the Broadridge expense group median and the Fund’s total expense ratio was approximately at the Broadridge expense group median.
MFS Massachusetts Municipal Bond
Fund
The total return performance
of the Fund’s Class I shares was in the 1st quintile relative to the funds in its Broadridge performance universe for the five-year period ended December 31, 2022 (the 1st quintile being the best performers and the 5th quintile being the worst performers). The total return performance of the Fund’s Class I shares was in the 3rd quintile for the one-year period and the 2nd quintile for the three-year period ended December 31, 2022 relative to the other funds in the universe. Because of the passage of time, these
performance results may differ from the performance results for more recent periods, including those shown elsewhere in this report.
In the course of their
deliberations, the Trustees took into account information provided by MFS in connection with the contract review meetings, as well as during investment review meetings conducted with portfolio management personnel
during the course of the year regarding the Fund’s performance. After reviewing these and related factors, the Trustees concluded, within the context of their overall conclusions regarding the investment
advisory agreement, that they were satisfied with MFS’ responses and efforts relating to investment performance.
In assessing the
reasonableness of the Fund’s advisory fee, the Trustees considered that MFS currently observes an expense limitation for the Fund, which may not be changed without the Trustees’ approval. The
Trustees also considered that, according to the data provided by Broadridge (which takes into account any fee reductions or expense limitations that were in effect during the Fund’s last fiscal year), the
Fund’s effective advisory fee rate and total expense ratio were each approximately at the Broadridge expense group median.
91
Proxy Voting Policies and
Information
MFS votes proxies on behalf of
the funds pursuant to proxy voting policies and procedures that are available without charge, upon request, by calling 1-800-225-2606, by visiting mfs.com/proxyvoting, or by visiting the SEC’s Web site at http://www.sec.gov.
Information regarding how each
fund voted proxies relating to portfolio securities during the most recent twelve-month period ended June 30 is available by August 31 of each year without charge by visiting mfs.com/proxyvoting, or by visiting the SEC’s Web site at http://www.sec.gov.
Quarterly Portfolio
Disclosure
Each fund files a complete
schedule of portfolio holdings with the SEC for the first and third quarters of each fiscal year as an exhibit to its reports on Form N-PORT. Each fund's Form N-PORT reports are available on the SEC's Web site at
http://www.sec.gov. A shareholder can obtain the portfolio holdings report for the first and third quarters of each fund's fiscal year at mfs.com/openendfunds by choosing the fund's name and then scrolling to the “Resources” section and clicking on the “Prospectus and Reports” tab.
Further Information
From time to time, MFS may post
important information about each fund or the MFS Funds on the MFS Web site (mfs.com). This information is available at https://www.mfs.com/announcements or at mfs.com/openendfunds by choosing each fund’s name and then scrolling to the “Resources” section and clicking on the “Announcements” tab, if any.
Information About Fund
Contracts and Legal Claims
Each fund has entered into
contractual arrangements with an investment adviser, administrator, distributor, shareholder servicing agent, and custodian who each provide services to the fund. Unless expressly stated otherwise, shareholders are
not parties to, or intended beneficiaries of these contractual arrangements, and these contractual arrangements are not intended to create any shareholder right to enforce them against the service providers or to seek
any remedy under them against the service providers, either directly or on behalf of the fund.
Under the Trust’s By-Laws
and Declaration of Trust, any claims asserted against or on behalf of the MFS Funds, including claims against Trustees and Officers, must be brought in state and federal courts located within the Commonwealth of
Massachusetts.
Provision of Financial
Reports and Summary Prospectuses
Each fund produces financial
reports every six months and updates its summary prospectus and prospectus annually. To avoid sending duplicate copies of materials to households, only one copy of each fund’s annual and semiannual report and
summary prospectus may be mailed to shareholders having the same last name and residential address on the fund’s records. However, any shareholder may contact MFSC (please see back cover for address and
telephone number) to request that copies of these reports and summary prospectuses be sent personally to that shareholder.
93


Semiannual Report
September 30, 2023
MFS® Municipal Series Trust

For the states of:
Mississippi, New York, North Carolina,
Pennsylvania, South Carolina, Virginia, and West Virginia
MSTB-SEM
MFS® Municipal Series Trust
For the states of: Mississippi, New York, North
Carolina, Pennsylvania, South Carolina, Virginia, and West Virginia
Portfolio Composition
MFS Mississippi Municipal Bond
Fund

| (a) | For all securities other than those specifically described below, ratings are assigned to underlying securities utilizing ratings from Moody’s, Fitch, and Standard & Poor’s rating agencies and applying the following hierarchy: If all three agencies provide a rating, the middle rating (after dropping the highest and lowest ratings) is assigned; if two of the three agencies rate a security, the lower of the two is assigned. If none of the 3 rating agencies above assign a rating, but the security is rated by DBRS Morningstar, then the DBRS Morningstar rating is assigned. If none of the 4 rating agencies listed above rate the security, but the security is rated by the Kroll Bond Rating Agency (KBRA), then the KBRA rating is assigned. Ratings are shown in the S&P and Fitch scale (e.g., AAA). Securities rated BBB or higher are considered investment grade. All ratings are subject to change. Not Rated includes fixed income securities and fixed income derivatives that have not been rated by any rating agency. The fund may or may not have held all of these instruments on this date. The fund is not rated by these agencies. |
| (d) | Duration is a measure of how much a bond’s price is likely to fluctuate with general changes in interest rates, e.g., if rates rise 1.00%, a bond with a 5-year duration is likely to lose about 5.00% of its value due to the interest rate move. The Average Duration calculation reflects the impact of the equivalent exposure of derivative positions, if any. |
| (i) | For purposes of this presentation, the components include the value of securities, and reflect the impact of the equivalent exposure of derivative positions, if any. These amounts may be negative from time to time. Equivalent exposure is a calculated amount that translates the derivative position into a reasonable approximation of the amount of the underlying asset that the portfolio would have to hold at a given point in time to have the same price sensitivity that results from the portfolio’s ownership of the derivative contract. When dealing with derivatives, equivalent exposure is a more representative measure of the potential impact of a position on portfolio performance than value. The bond component will include any accrued interest amounts. |
| (m) | In determining each instrument’s effective maturity for purposes of calculating the fund’s dollar-weighted average effective maturity, MFS uses the instrument’s stated maturity or, if applicable, an earlier date on which MFS believes it is probable that a maturity-shortening feature (such as a put, pre-refunding or prepayment) will cause the instrument to be repaid. Such an earlier date can be substantially shorter than the instrument’s stated maturity. |
| (o) | Less than 0.1%. |
Cash & Cash
Equivalents includes any cash, investments in money market funds, short-term securities, and other assets less liabilities. Please see the Statements of Assets and Liabilities for additional information related to the
fund’s cash position and other assets and liabilities.
Percentages are based
on net assets as of September 30, 2023.
The portfolio is
actively managed and current holdings may be different.
1
Portfolio Composition - continued
MFS New York Municipal Bond
Fund

| (a) | For all securities other than those specifically described below, ratings are assigned to underlying securities utilizing ratings from Moody’s, Fitch, and Standard & Poor’s rating agencies and applying the following hierarchy: If all three agencies provide a rating, the middle rating (after dropping the highest and lowest ratings) is assigned; if two of the three agencies rate a security, the lower of the two is assigned. If none of the 3 rating agencies above assign a rating, but the security is rated by DBRS Morningstar, then the DBRS Morningstar rating is assigned. If none of the 4 rating agencies listed above rate the security, but the security is rated by the Kroll Bond Rating Agency (KBRA), then the KBRA rating is assigned. Ratings are shown in the S&P and Fitch scale (e.g., AAA). Securities rated BBB or higher are considered investment grade. All ratings are subject to change. Not Rated includes fixed income securities and fixed income derivatives that have not been rated by any rating agency. The fund may or may not have held all of these instruments on this date. The fund is not rated by these agencies. |
| (d) | Duration is a measure of how much a bond’s price is likely to fluctuate with general changes in interest rates, e.g., if rates rise 1.00%, a bond with a 5-year duration is likely to lose about 5.00% of its value due to the interest rate move. The Average Duration calculation reflects the impact of the equivalent exposure of derivative positions, if any. |
| (i) | For purposes of this presentation, the components include the value of securities, and reflect the impact of the equivalent exposure of derivative positions, if any. These amounts may be negative from time to time. Equivalent exposure is a calculated amount that translates the derivative position into a reasonable approximation of the amount of the underlying asset that the portfolio would have to hold at a given point in time to have the same price sensitivity that results from the portfolio’s ownership of the derivative contract. When dealing with derivatives, equivalent exposure is a more representative measure of the potential impact of a position on portfolio performance than value. The bond component will include any accrued interest amounts. |
| (m) | In determining each instrument’s effective maturity for purposes of calculating the fund’s dollar-weighted average effective maturity, MFS uses the instrument’s stated maturity or, if applicable, an earlier date on which MFS believes it is probable that a maturity-shortening feature (such as a put, pre-refunding or prepayment) will cause the instrument to be repaid. Such an earlier date can be substantially shorter than the instrument’s stated maturity. |
Cash & Cash
Equivalents includes any cash, investments in money market funds, short-term securities, and other assets less liabilities. Please see the Statements of Assets and Liabilities for additional information related to the
fund’s cash position and other assets and liabilities.
Percentages are based
on net assets as of September 30, 2023.
The portfolio is
actively managed and current holdings may be different.
2
Portfolio Composition - continued
MFS North Carolina Municipal
Bond Fund

| (a) | For all securities other than those specifically described below, ratings are assigned to underlying securities utilizing ratings from Moody’s, Fitch, and Standard & Poor’s rating agencies and applying the following hierarchy: If all three agencies provide a rating, the middle rating (after dropping the highest and lowest ratings) is assigned; if two of the three agencies rate a security, the lower of the two is assigned. If none of the 3 rating agencies above assign a rating, but the security is rated by DBRS Morningstar, then the DBRS Morningstar rating is assigned. If none of the 4 rating agencies listed above rate the security, but the security is rated by the Kroll Bond Rating Agency (KBRA), then the KBRA rating is assigned. Ratings are shown in the S&P and Fitch scale (e.g., AAA). Securities rated BBB or higher are considered investment grade. All ratings are subject to change. Not Rated includes fixed income securities and fixed income derivatives that have not been rated by any rating agency. The fund may or may not have held all of these instruments on this date. The fund is not rated by these agencies. |
| (d) | Duration is a measure of how much a bond’s price is likely to fluctuate with general changes in interest rates, e.g., if rates rise 1.00%, a bond with a 5-year duration is likely to lose about 5.00% of its value due to the interest rate move. The Average Duration calculation reflects the impact of the equivalent exposure of derivative positions, if any. |
| (i) | For purposes of this presentation, the components include the value of securities, and reflect the impact of the equivalent exposure of derivative positions, if any. These amounts may be negative from time to time. Equivalent exposure is a calculated amount that translates the derivative position into a reasonable approximation of the amount of the underlying asset that the portfolio would have to hold at a given point in time to have the same price sensitivity that results from the portfolio’s ownership of the derivative contract. When dealing with derivatives, equivalent exposure is a more representative measure of the potential impact of a position on portfolio performance than value. The bond component will include any accrued interest amounts. |
| (m) | In determining each instrument’s effective maturity for purposes of calculating the fund’s dollar-weighted average effective maturity, MFS uses the instrument’s stated maturity or, if applicable, an earlier date on which MFS believes it is probable that a maturity-shortening feature (such as a put, pre-refunding or prepayment) will cause the instrument to be repaid. Such an earlier date can be substantially shorter than the instrument’s stated maturity. |
| (o) | Less than 0.1%. |
Cash & Cash
Equivalents includes any cash, investments in money market funds, short-term securities, and other assets less liabilities. Please see the Statements of Assets and Liabilities for additional information related to the
fund’s cash position and other assets and liabilities.
Percentages are based
on net assets as of September 30, 2023.
The portfolio is
actively managed and current holdings may be different.
3
Portfolio Composition - continued
MFS Pennsylvania Municipal Bond
Fund

| (a) | For all securities other than those specifically described below, ratings are assigned to underlying securities utilizing ratings from Moody’s, Fitch, and Standard & Poor’s rating agencies and applying the following hierarchy: If all three agencies provide a rating, the middle rating (after dropping the highest and lowest ratings) is assigned; if two of the three agencies rate a security, the lower of the two is assigned. If none of the 3 rating agencies above assign a rating, but the security is rated by DBRS Morningstar, then the DBRS Morningstar rating is assigned. If none of the 4 rating agencies listed above rate the security, but the security is rated by the Kroll Bond Rating Agency (KBRA), then the KBRA rating is assigned. Ratings are shown in the S&P and Fitch scale (e.g., AAA). Securities rated BBB or higher are considered investment grade. All ratings are subject to change. Not Rated includes fixed income securities and fixed income derivatives that have not been rated by any rating agency. The fund may or may not have held all of these instruments on this date. The fund is not rated by these agencies. |
| (d) | Duration is a measure of how much a bond’s price is likely to fluctuate with general changes in interest rates, e.g., if rates rise 1.00%, a bond with a 5-year duration is likely to lose about 5.00% of its value due to the interest rate move. The Average Duration calculation reflects the impact of the equivalent exposure of derivative positions, if any. |
| (i) | For purposes of this presentation, the components include the value of securities, and reflect the impact of the equivalent exposure of derivative positions, if any. These amounts may be negative from time to time. Equivalent exposure is a calculated amount that translates the derivative position into a reasonable approximation of the amount of the underlying asset that the portfolio would have to hold at a given point in time to have the same price sensitivity that results from the portfolio’s ownership of the derivative contract. When dealing with derivatives, equivalent exposure is a more representative measure of the potential impact of a position on portfolio performance than value. The bond component will include any accrued interest amounts. |
| (m) | In determining each instrument’s effective maturity for purposes of calculating the fund’s dollar-weighted average effective maturity, MFS uses the instrument’s stated maturity or, if applicable, an earlier date on which MFS believes it is probable that a maturity-shortening feature (such as a put, pre-refunding or prepayment) will cause the instrument to be repaid. Such an earlier date can be substantially shorter than the instrument’s stated maturity. |
| (o) | Less than 0.1%. |
Cash & Cash
Equivalents includes any cash, investments in money market funds, short-term securities, and other assets less liabilities. Please see the Statements of Assets and Liabilities for additional information related to the
fund’s cash position and other assets and liabilities.
Percentages are based
on net assets as of September 30, 2023.
The portfolio is
actively managed and current holdings may be different.
4
Portfolio Composition - continued
MFS South Carolina Municipal
Bond Fund
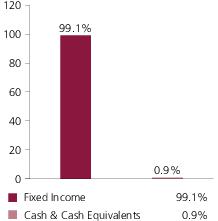
| (a) | For all securities other than those specifically described below, ratings are assigned to underlying securities utilizing ratings from Moody’s, Fitch, and Standard & Poor’s rating agencies and applying the following hierarchy: If all three agencies provide a rating, the middle rating (after dropping the highest and lowest ratings) is assigned; if two of the three agencies rate a security, the lower of the two is assigned. If none of the 3 rating agencies above assign a rating, but the security is rated by DBRS Morningstar, then the DBRS Morningstar rating is assigned. If none of the 4 rating agencies listed above rate the security, but the security is rated by the Kroll Bond Rating Agency (KBRA), then the KBRA rating is assigned. Ratings are shown in the S&P and Fitch scale (e.g., AAA). Securities rated BBB or higher are considered investment grade. All ratings are subject to change. Not Rated includes fixed income securities and fixed income derivatives that have not been rated by any rating agency. The fund may or may not have held all of these instruments on this date. The fund is not rated by these agencies. |
| (d) | Duration is a measure of how much a bond’s price is likely to fluctuate with general changes in interest rates, e.g., if rates rise 1.00%, a bond with a 5-year duration is likely to lose about 5.00% of its value due to the interest rate move. The Average Duration calculation reflects the impact of the equivalent exposure of derivative positions, if any. |
| (i) | For purposes of this presentation, the components include the value of securities, and reflect the impact of the equivalent exposure of derivative positions, if any. These amounts may be negative from time to time. Equivalent exposure is a calculated amount that translates the derivative position into a reasonable approximation of the amount of the underlying asset that the portfolio would have to hold at a given point in time to have the same price sensitivity that results from the portfolio’s ownership of the derivative contract. When dealing with derivatives, equivalent exposure is a more representative measure of the potential impact of a position on portfolio performance than value. The bond component will include any accrued interest amounts. |
| (m) | In determining each instrument’s effective maturity for purposes of calculating the fund’s dollar-weighted average effective maturity, MFS uses the instrument’s stated maturity or, if applicable, an earlier date on which MFS believes it is probable that a maturity-shortening feature (such as a put, pre-refunding or prepayment) will cause the instrument to be repaid. Such an earlier date can be substantially shorter than the instrument’s stated maturity. |
| (o) | Less than 0.1%. |
Cash & Cash
Equivalents includes any cash, investments in money market funds, short-term securities, and other assets less liabilities. Please see the Statements of Assets and Liabilities for additional information related to the
fund’s cash position and other assets and liabilities.
Percentages are based
on net assets as of September 30, 2023.
The portfolio is
actively managed and current holdings may be different.
5
Portfolio Composition - continued
MFS Virginia Municipal Bond
Fund

| (a) | For all securities other than those specifically described below, ratings are assigned to underlying securities utilizing ratings from Moody’s, Fitch, and Standard & Poor’s rating agencies and applying the following hierarchy: If all three agencies provide a rating, the middle rating (after dropping the highest and lowest ratings) is assigned; if two of the three agencies rate a security, the lower of the two is assigned. If none of the 3 rating agencies above assign a rating, but the security is rated by DBRS Morningstar, then the DBRS Morningstar rating is assigned. If none of the 4 rating agencies listed above rate the security, but the security is rated by the Kroll Bond Rating Agency (KBRA), then the KBRA rating is assigned. Ratings are shown in the S&P and Fitch scale (e.g., AAA). Securities rated BBB or higher are considered investment grade. All ratings are subject to change. Not Rated includes fixed income securities and fixed income derivatives that have not been rated by any rating agency. The fund may or may not have held all of these instruments on this date. The fund is not rated by these agencies. |
| (d) | Duration is a measure of how much a bond’s price is likely to fluctuate with general changes in interest rates, e.g., if rates rise 1.00%, a bond with a 5-year duration is likely to lose about 5.00% of its value due to the interest rate move. The Average Duration calculation reflects the impact of the equivalent exposure of derivative positions, if any. |
| (i) | For purposes of this presentation, the components include the value of securities, and reflect the impact of the equivalent exposure of derivative positions, if any. These amounts may be negative from time to time. Equivalent exposure is a calculated amount that translates the derivative position into a reasonable approximation of the amount of the underlying asset that the portfolio would have to hold at a given point in time to have the same price sensitivity that results from the portfolio’s ownership of the derivative contract. When dealing with derivatives, equivalent exposure is a more representative measure of the potential impact of a position on portfolio performance than value. The bond component will include any accrued interest amounts. |
| (m) | In determining each instrument’s effective maturity for purposes of calculating the fund’s dollar-weighted average effective maturity, MFS uses the instrument’s stated maturity or, if applicable, an earlier date on which MFS believes it is probable that a maturity-shortening feature (such as a put, pre-refunding or prepayment) will cause the instrument to be repaid. Such an earlier date can be substantially shorter than the instrument’s stated maturity. |
| (o) | Less than 0.1%. |
Cash & Cash
Equivalents includes any cash, investments in money market funds, short-term securities, and other assets less liabilities. Please see the Statements of Assets and Liabilities for additional information related to the
fund’s cash position and other assets and liabilities.
Percentages are based
on net assets as of September 30, 2023.
The portfolio is
actively managed and current holdings may be different.
6
Portfolio Composition - continued
MFS West Virginia Municipal
Bond Fund
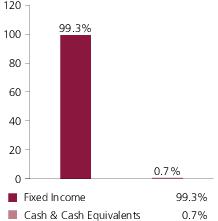
| (a) | For all securities other than those specifically described below, ratings are assigned to underlying securities utilizing ratings from Moody’s, Fitch, and Standard & Poor’s rating agencies and applying the following hierarchy: If all three agencies provide a rating, the middle rating (after dropping the highest and lowest ratings) is assigned; if two of the three agencies rate a security, the lower of the two is assigned. If none of the 3 rating agencies above assign a rating, but the security is rated by DBRS Morningstar, then the DBRS Morningstar rating is assigned. If none of the 4 rating agencies listed above rate the security, but the security is rated by the Kroll Bond Rating Agency (KBRA), then the KBRA rating is assigned. Ratings are shown in the S&P and Fitch scale (e.g., AAA). Securities rated BBB or higher are considered investment grade. All ratings are subject to change. Not Rated includes fixed income securities and fixed income derivatives that have not been rated by any rating agency. The fund may or may not have held all of these instruments on this date. The fund is not rated by these agencies. |
| (d) | Duration is a measure of how much a bond’s price is likely to fluctuate with general changes in interest rates, e.g., if rates rise 1.00%, a bond with a 5-year duration is likely to lose about 5.00% of its value due to the interest rate move. The Average Duration calculation reflects the impact of the equivalent exposure of derivative positions, if any. |
| (i) | For purposes of this presentation, the components include the value of securities, and reflect the impact of the equivalent exposure of derivative positions, if any. These amounts may be negative from time to time. Equivalent exposure is a calculated amount that translates the derivative position into a reasonable approximation of the amount of the underlying asset that the portfolio would have to hold at a given point in time to have the same price sensitivity that results from the portfolio’s ownership of the derivative contract. When dealing with derivatives, equivalent exposure is a more representative measure of the potential impact of a position on portfolio performance than value. The bond component will include any accrued interest amounts. |
| (m) | In determining each instrument’s effective maturity for purposes of calculating the fund’s dollar-weighted average effective maturity, MFS uses the instrument’s stated maturity or, if applicable, an earlier date on which MFS believes it is probable that a maturity-shortening feature (such as a put, pre-refunding or prepayment) will cause the instrument to be repaid. Such an earlier date can be substantially shorter than the instrument’s stated maturity. |
| (o) | Less than 0.1%. |
Cash & Cash
Equivalents includes any cash, investments in money market funds, short-term securities, and other assets less liabilities. Please see the Statements of Assets and Liabilities for additional information related to the
fund’s cash position and other assets and liabilities.
Percentages are based
on net assets as of September 30, 2023.
The portfolio is
actively managed and current holdings may be different.
7
Expense Tables
Fund expenses borne by the
shareholders during the period, April 1, 2023 through September 30, 2023
As a shareholder of the funds,
you incur two types of costs: (1) transaction costs, including sales charges (loads) on certain purchase or redemption payments, and (2) ongoing costs, including management fees; distribution and service (12b-1) fees;
and other fund expenses. These examples are intended to help you understand your ongoing costs (in dollars) of investing in the funds and to compare these costs with the ongoing costs of investing in other mutual
funds.
These examples are based on an
investment of $1,000 invested at the beginning of the period and held for the entire period April 1, 2023 through September 30, 2023.
Actual Expenses
The first line for each share
class in the following tables provides information about actual account values and actual expenses. You may use the information in this line, together with the amount you invested, to estimate the expenses that you
paid over the period. Simply divide your account value by $1,000 (for example, an $8,600 account value divided by $1,000 = 8.6), then multiply the result by the number in the first line under the heading entitled
“Expenses Paid During Period” to estimate the expenses you paid on your account during this period.
Hypothetical Example for
Comparison Purposes
The second line for each share
class in the following tables provides information about hypothetical account values and hypothetical expenses based on each fund’s actual expense ratio and an assumed rate of return of 5% per year before
expenses, which is not each fund’s actual return. The hypothetical account values and expenses may not be used to estimate the actual ending account balance or expenses you paid for the period. You may use this
information to compare the ongoing costs of investing in each fund and other funds. To do so, compare this 5% hypothetical example with the 5% hypothetical examples that appear in the shareholder reports of the other
funds.
Please note that the expenses
shown in the tables are meant to highlight your ongoing costs only and do not reflect any transactional costs, such as sales charges (loads). Therefore, the second line for each share class in the tables is useful in
comparing ongoing costs only, and will not help you determine the relative total costs of owning different funds. In addition, if these transactional costs were included, your costs would have been higher.
MFS MISSISSIPPI MUNICIPAL BOND
FUND
| Share Class | Annualized Expense Ratio | Beginning Account Value 4/01/23 | Ending Account Value 9/30/23 | Expenses Paid During Period (p) 4/01/23-9/30/23 | |
| A | Actual | 0.86% | $1,000.00 | $951.55 | $4.20 |
| Hypothetical (h) | 0.86% | $1,000.00 | $1,020.70 | $4.34 | |
| B | Actual | 1.52% | $1,000.00 | $949.61 | $7.41 |
| Hypothetical (h) | 1.52% | $1,000.00 | $1,017.40 | $7.67 | |
| I | Actual | 0.76% | $1,000.00 | $953.03 | $3.71 |
| Hypothetical (h) | 0.76% | $1,000.00 | $1,021.20 | $3.84 | |
| R6 | Actual | 0.70% | $1,000.00 | $953.31 | $3.42 |
| Hypothetical (h) | 0.70% | $1,000.00 | $1,021.50 | $3.54 |
| (h) | 5% class return per year before expenses. |
| (p) | “Expenses Paid During Period” are equal to each class’s annualized expense ratio, as shown above, multiplied by the average account value over the period, multiplied by 183/366 (to reflect the one-half year period). Expenses paid do not include any applicable sales charges (loads). If these transaction costs had been included, your costs would have been higher. |
8
Expense Tables - continued
MFS NEW YORK MUNICIPAL BOND
FUND
| Share Class | Annualized Expense Ratio | Beginning Account Value 4/01/23 | Ending Account Value 9/30/23 | Expenses Paid During Period (p) 4/01/23-9/30/23 | |
| A | Actual | 0.83% | $1,000.00 | $952.45 | $4.05 |
| Hypothetical (h) | 0.83% | $1,000.00 | $1,020.85 | $4.19 | |
| B | Actual | 1.58% | $1,000.00 | $948.70 | $7.70 |
| Hypothetical (h) | 1.58% | $1,000.00 | $1,017.10 | $7.97 | |
| C | Actual | 1.58% | $1,000.00 | $949.78 | $7.70 |
| Hypothetical (h) | 1.58% | $1,000.00 | $1,017.10 | $7.97 | |
| I | Actual | 0.58% | $1,000.00 | $953.17 | $2.83 |
| Hypothetical (h) | 0.58% | $1,000.00 | $1,022.10 | $2.93 | |
| R6 | Actual | 0.50% | $1,000.00 | $955.79 | $2.44 |
| Hypothetical (h) | 0.50% | $1,000.00 | $1,022.50 | $2.53 |
MFS NORTH CAROLINA MUNICIPAL BOND
FUND
| Share Class | Annualized Expense Ratio | Beginning Account Value 4/01/23 | Ending Account Value 9/30/23 | Expenses Paid During Period (p) 4/01/23-9/30/23 | |
| A | Actual | 0.84% | $1,000.00 | $955.54 | $4.11 |
| Hypothetical (h) | 0.84% | $1,000.00 | $1,020.80 | $4.24 | |
| B | Actual | 1.59% | $1,000.00 | $950.97 | $7.76 |
| Hypothetical (h) | 1.59% | $1,000.00 | $1,017.05 | $8.02 | |
| C | Actual | 1.59% | $1,000.00 | $951.03 | $7.76 |
| Hypothetical (h) | 1.59% | $1,000.00 | $1,017.05 | $8.02 | |
| I | Actual | 0.59% | $1,000.00 | $956.18 | $2.89 |
| Hypothetical (h) | 0.59% | $1,000.00 | $1,022.05 | $2.98 | |
| R6 | Actual | 0.52% | $1,000.00 | $956.50 | $2.54 |
| Hypothetical (h) | 0.52% | $1,000.00 | $1,022.40 | $2.63 |
| (h) | 5% class return per year before expenses. |
| (p) | “Expenses Paid During Period” are equal to each class’s annualized expense ratio, as shown above, multiplied by the average account value over the period, multiplied by 183/366 (to reflect the one-half year period). Expenses paid do not include any applicable sales charges (loads). If these transaction costs had been included, your costs would have been higher. |
9
Expense Tables - continued
MFS PENNSYLVANIA MUNICIPAL BOND
FUND
| Share Class | Annualized Expense Ratio | Beginning Account Value 4/01/23 | Ending Account Value 9/30/23 | Expenses Paid During Period (p) 4/01/23-9/30/23 | |
| A | Actual | 0.69% | $1,000.00 | $955.62 | $3.37 |
| Hypothetical (h) | 0.69% | $1,000.00 | $1,021.55 | $3.49 | |
| B | Actual | 1.44% | $1,000.00 | $952.17 | $7.03 |
| Hypothetical (h) | 1.44% | $1,000.00 | $1,017.80 | $7.26 | |
| I | Actual | 0.59% | $1,000.00 | $955.32 | $2.88 |
| Hypothetical (h) | 0.59% | $1,000.00 | $1,022.05 | $2.98 | |
| R6 | Actual | 0.52% | $1,000.00 | $956.78 | $2.54 |
| Hypothetical (h) | 0.52% | $1,000.00 | $1,022.40 | $2.63 |
MFS SOUTH CAROLINA MUNICIPAL BOND
FUND
| Share Class | Annualized Expense Ratio | Beginning Account Value 4/01/23 | Ending Account Value 9/30/23 | Expenses Paid During Period (p) 4/01/23-9/30/23 | |
| A | Actual | 0.84% | $1,000.00 | $952.06 | $4.10 |
| Hypothetical (h) | 0.84% | $1,000.00 | $1,020.80 | $4.24 | |
| B | Actual | 1.59% | $1,000.00 | $947.59 | $7.74 |
| Hypothetical (h) | 1.59% | $1,000.00 | $1,017.05 | $8.02 | |
| I | Actual | 0.59% | $1,000.00 | $953.38 | $2.88 |
| Hypothetical (h) | 0.59% | $1,000.00 | $1,022.05 | $2.98 | |
| R6 | Actual | 0.53% | $1,000.00 | $953.64 | $2.59 |
| Hypothetical (h) | 0.53% | $1,000.00 | $1,022.35 | $2.68 |
| (h) | 5% class return per year before expenses. |
| (p) | “Expenses Paid During Period” are equal to each class’s annualized expense ratio, as shown above, multiplied by the average account value over the period, multiplied by 183/366 (to reflect the one-half year period). Expenses paid do not include any applicable sales charges (loads). If these transaction costs had been included, your costs would have been higher. |
10
Expense Tables - continued
MFS VIRGINIA MUNICIPAL BOND
FUND
| Share Class | Annualized Expense Ratio | Beginning Account Value 4/01/23 | Ending Account Value 9/30/23 | Expenses Paid During Period (p) 4/01/23-9/30/23 | |
| A | Actual | 0.81% | $1,000.00 | $950.43 | $3.95 |
| Hypothetical (h) | 0.81% | $1,000.00 | $1,020.95 | $4.09 | |
| B | Actual | 1.56% | $1,000.00 | $946.81 | $7.59 |
| Hypothetical (h) | 1.56% | $1,000.00 | $1,017.20 | $7.87 | |
| C | Actual | 1.56% | $1,000.00 | $946.87 | $7.59 |
| Hypothetical (h) | 1.56% | $1,000.00 | $1,017.20 | $7.87 | |
| I | Actual | 0.56% | $1,000.00 | $952.14 | $2.73 |
| Hypothetical (h) | 0.56% | $1,000.00 | $1,022.20 | $2.83 | |
| R6 | Actual | 0.48% | $1,000.00 | $952.58 | $2.34 |
| Hypothetical (h) | 0.48% | $1,000.00 | $1,022.60 | $2.43 |
MFS WEST VIRGINIA MUNICIPAL BOND
FUND
| Share Class | Annualized Expense Ratio | Beginning Account Value 4/01/23 | Ending Account Value 9/30/23 | Expenses Paid During Period (p) 4/01/23-9/30/23 | |
| A | Actual | 0.87% | $1,000.00 | $954.06 | $4.25 |
| Hypothetical (h) | 0.87% | $1,000.00 | $1,020.65 | $4.39 | |
| B | Actual | 1.62% | $1,000.00 | $950.48 | $7.90 |
| Hypothetical (h) | 1.62% | $1,000.00 | $1,016.90 | $8.17 | |
| I | Actual | 0.62% | $1,000.00 | $954.94 | $3.03 |
| Hypothetical (h) | 0.62% | $1,000.00 | $1,021.90 | $3.13 | |
| R6 | Actual | 0.54% | $1,000.00 | $955.31 | $2.64 |
| Hypothetical (h) | 0.54% | $1,000.00 | $1,022.30 | $2.73 |
| (h) | 5% class return per year before expenses. |
| (p) | “Expenses Paid During Period” are equal to each class’s annualized expense ratio, as shown above, multiplied by the average account value over the period, multiplied by 183/366 (to reflect the one-half year period). Expenses paid do not include any applicable sales charges (loads). If these transaction costs had been included, your costs would have been higher. |
11
Portfolio of Investments
9/30/23 (unaudited)
The Portfolio of Investments is
a complete list of all securities owned by your fund. It is categorized by broad-based asset classes.
MFS Mississippi Municipal Bond
Fund
| Issuer | Shares/Par | Value ($) | ||
| Municipal Bonds – 95.8% | ||||
| Airport Revenue – 0.9% | ||||
| Denver, CO, City & County Airport System Rev., “A”, 4.125%, 11/15/2047 | $ | 60,000 | $52,296 | |
| Denver, CO, City & County Airport System Rev., “A”, 4.125%, 11/15/2053 | 55,000 | 46,667 | ||
| New York Transportation Development Corp. Special Facilities (LaGuardia Airport Terminal B Redevelopment Project), “A”, 5%, 7/01/2034 | 230,000 | 227,772 | ||
| Wayne County, MI, Airport Authority Rev. (Detroit Metropolitan Wayne County Airport), “B”, 5%, 12/01/2044 | 45,000 | 44,397 | ||
| Wayne County, MI, Airport Authority Rev. (Detroit Metropolitan Wayne County Airport), “B”, BAM, 5%, 12/01/2039 | 230,000 | 229,987 | ||
| Wayne County, MI, Airport Authority Rev. (Detroit Metropolitan Wayne County Airport), “C”, 5%, 12/01/2039 | 35,000 | 34,924 | ||
| Wayne County, MI, Airport Authority Rev. (Detroit Metropolitan Wayne County Airport), “C”, 5%, 12/01/2044 | 60,000 | 59,120 | ||
| $695,163 | ||||
| General Obligations - General Purpose – 20.4% | ||||
| Bridgeview, IL, Stadium and Redevelopment Projects, Taxable, AAC, 5.14%, 12/01/2036 | $ | 220,000 | $189,921 | |
| Chicago, IL, General Obligation, “A”, 5.5%, 1/01/2035 | 50,000 | 52,042 | ||
| Chicago, IL, General Obligation, “F”, 5.5%, 1/01/2042 | 135,000 | 133,848 | ||
| Commonwealth of Puerto Rico, General Obligation Restructured Bonds, Capital Appreciation, Series 2022A, 0%, 7/01/2024 | 6,174 | 5,964 | ||
| Commonwealth of Puerto Rico, General Obligation Restructured Bonds, Capital Appreciation, Series 2022A, 0%, 7/01/2033 | 48,848 | 28,789 | ||
| Commonwealth of Puerto Rico, General Obligation Restructured Bonds, Series 2022A, 5.625%, 7/01/2027 | 41,891 | 42,987 | ||
| Commonwealth of Puerto Rico, General Obligation Restructured Bonds, Series 2022A, 5.625%, 7/01/2029 | 41,212 | 42,585 | ||
| Commonwealth of Puerto Rico, General Obligation Restructured Bonds, Series 2022A, 5.75%, 7/01/2031 | 40,029 | 41,803 | ||
| Commonwealth of Puerto Rico, General Obligation Restructured Bonds, Series 2022A, 4%, 7/01/2033 | 37,958 | 34,023 | ||
| Commonwealth of Puerto Rico, General Obligation Restructured Bonds, Series 2022A, 4%, 7/01/2035 | 66,803 | 58,055 | ||
| Commonwealth of Puerto Rico, General Obligation Restructured Bonds, Series 2022A, 4%, 7/01/2037 | 29,283 | 24,581 | ||
| Commonwealth of Puerto Rico, General Obligation Restructured Bonds, Series 2022A, 4%, 7/01/2041 | 39,814 | 32,011 | ||
| Commonwealth of Puerto Rico, General Obligation Restructured Bonds, Series 2022A, 4%, 7/01/2046 | 128,406 | 98,998 | ||
| Desoto County, MI, General Obligation Refunding, 5%, 11/01/2024 | 685,000 | 693,714 | ||
| Jackson, MS, General Obligation Refunding, 5%, 3/01/2027 | 700,000 | 699,703 | ||
| Mississippi Development Bank Special Obligation (Biloxi General Obligation), 4%, 3/01/2037 | 500,000 | 470,534 | ||
| Mississippi Development Bank Special Obligation (Harrison County Coliseum), “A”, 5.25%, 1/01/2034 | 1,000,000 | 1,088,878 | ||
| Mississippi Development Bank Special Obligation (Hattiesburg General Obligation), 4%, 2/01/2045 | 500,000 | 432,066 | ||
| Mississippi Development Bank Special Obligation (Hattiesburg General Obligation), 5.25%, 2/01/2049 | 750,000 | 764,652 | ||
| Mississippi Development Bank Special Obligation (Hinds County), 5%, 11/01/2032 | 500,000 | 482,357 | ||
| Mississippi Development Bank Special Obligation (Hinds County), 4%, 11/01/2042 | 500,000 | 387,878 | ||
| Mississippi Development Bank Special Obligation (Rankin County General Obligation Bond Project), 5%, 8/01/2034 | 350,000 | 374,967 | ||
| Mississippi Development Bank Special Obligation (Rankin County), 5%, 3/01/2031 | 1,000,000 | 1,041,663 | ||
| Mississippi Development Bank Special Obligation (Rankin County), 5%, 3/01/2032 | 1,000,000 | 1,039,974 | ||
| Mississippi Development Bank Special Obligation (Vicksburg Sports Complex General Obligation Bond Project), BAM, 5%, 7/01/2048 | 1,000,000 | 1,023,962 | ||
| Mississippi Development Bank Special Obligation Refunding, Taxable (Clay County Industrial Development Project), BAM, 2.955%, 3/01/2025 | 335,000 | 322,080 | ||
| State of Illinois, General Obligation, 5.5%, 5/01/2039 | 150,000 | 156,492 | ||
| State of Illinois, General Obligation, “B”, 5.5%, 5/01/2047 | 65,000 | 67,432 | ||
| State of Illinois, General Obligation, “C”, 4%, 10/01/2040 | 195,000 | 170,633 | ||
| State of Illinois, General Obligation, “C”, 4%, 10/01/2041 | 125,000 | 108,238 | ||
| State of Mississippi, “A”, 5%, 10/01/2033 (Prerefunded 10/01/2027) | 1,000,000 | 1,054,680 | ||
| State of Mississippi, “A”, 5%, 11/01/2036 (Prerefunded 11/01/2026) | 1,000,000 | 1,039,427 | ||
| State of Mississippi, “B”, 5%, 12/01/2033 (Prerefunded 12/01/2026) | 1,000,000 | 1,042,248 | ||
| State of Mississippi, “B”, 3%, 10/01/2035 | 875,000 | 740,466 | ||
| State of Mississippi, “B”, 4%, 10/01/2038 | 1,000,000 | 960,150 | ||
| State of Mississippi, “D”, 4%, 12/01/2030 | 1,000,000 | 1,002,340 | ||
| State of Mississippi, General Obligation Refunding, “C”, 5%, 9/30/2024 | 250,000 | 252,784 | ||
| $16,202,925 | ||||
| General Obligations - Schools – 13.3% | ||||
| Little Rock, AR, School District & Construction, “A”, BAM, 3%, 2/01/2048 | $ | 700,000 | $476,444 | |
12
Portfolio of Investments (unaudited) –
continued
| Issuer | Shares/Par | Value ($) | ||
| Municipal Bonds – continued | ||||
| General Obligations - Schools – continued | ||||
| Mississippi Development Bank Special Obligation (Canton Public School District), AGM, 5%, 12/01/2031 (Prerefunded 12/01/2025) | $ | 1,000,000 | $1,025,992 | |
| Mississippi Development Bank Special Obligation (Clinton Public School District), 4%, 4/01/2036 | 500,000 | 477,366 | ||
| Mississippi Development Bank Special Obligation (Clinton Public School District), 4%, 4/01/2037 | 500,000 | 469,764 | ||
| Mississippi Development Bank Special Obligation (Gulfport School District), BAM, 5%, 4/01/2031 (Prerefunded 4/01/2024) | 500,000 | 502,632 | ||
| Mississippi Development Bank Special Obligation (Gulfport School District), BAM, 5%, 4/01/2032 (Prerefunded 4/01/2024) | 500,000 | 502,632 | ||
| Mississippi Development Bank Special Obligation (Hinds County School District), 4%, 3/01/2024 | 355,000 | 354,756 | ||
| Mississippi Development Bank Special Obligation (Hinds County School District), 5%, 3/01/2043 | 450,000 | 454,763 | ||
| Mississippi Development Bank Special Obligation (Jackson Public School District Limited Tax Refunding Note Project), “B”, 5%, 10/01/2023 | 275,000 | 275,000 | ||
| Mississippi Development Bank Special Obligation (Jackson Public School District), BAM, 5.25%, 10/01/2037 | 1,000,000 | 1,031,561 | ||
| Mississippi Development Bank Special Obligation (Meridian Public School District General Obligation Project), BAM, 4.125%, 4/01/2043 | 1,000,000 | 911,395 | ||
| Mississippi Development Bank Special Obligation (Rankin County), 4%, 6/01/2043 | 750,000 | 648,386 | ||
| Mississippi Development Bank Special Obligation (Vicksburg Warren School District General Obligation Project), BAM, 5%, 3/01/2048 | 1,500,000 | 1,452,106 | ||
| Natchez-Adams, MS, School District Trust Certificates, 5%, 2/01/2025 | 470,000 | 475,309 | ||
| San Diego, CA, Unified School District (Election of 2008), Capital Appreciation, “C”, 0%, 7/01/2035 | 1,020,000 | 615,841 | ||
| Sunflower County, MI, Consolidated School District, General Obligation, BAM, 4%, 6/01/2038 | 1,000,000 | 897,499 | ||
| $10,571,446 | ||||
| Healthcare Revenue - Hospitals – 8.0% | ||||
| Colorado Health Facilities Authority Rev. (CommonSpirit Health), “A-2”, 4%, 8/01/2049 | $ | 20,000 | $16,109 | |
| Gulfport, MS, Hospital Facilities Rev. (Memorial Hospital at Gulfport Project), 5%, 7/01/2027 | 500,000 | 492,680 | ||
| Harris County, TX, Cultural Education Facilities Finance Corp., Hospital Rev. (Memorial Hermann Health System), “A”, 4.125%, 7/01/2052 | 470,000 | 399,734 | ||
| Mississippi Hospital Equipment & Facilities Authority Refunding Rev. (Baptist Memorial Health Care Corp.), “A-2”, 4.125%, 8/31/2036 (Put Date 8/28/2024) | 1,000,000 | 995,568 | ||
| Mississippi Hospital Equipment & Facilities Authority Refunding Rev. (Forrest County General Hospital Refunding Project), “A”, 5%, 1/01/2028 | 575,000 | 590,059 | ||
| Mississippi Hospital Equipment & Facilities Authority Rev. (Baptist Memorial Healthcare), “A”, 5%, 9/01/2044 (Put Date 9/01/2025) | 500,000 | 507,171 | ||
| Mississippi Hospital Equipment & Facilities Authority Rev. (Forrest County General Hospital Refunding Project), “A”, 4%, 1/01/2040 | 1,000,000 | 866,886 | ||
| Mississippi Hospital Equipment & Facilities Authority Rev. (North Mississippi Health Services), “IV”, 5%, 10/01/2037 | 1,500,000 | 1,511,833 | ||
| New York Dormitory Authority Rev. (Norwell Health Obligated Group), “A”, 4.25%, 5/01/2052 | 505,000 | 435,197 | ||
| Spartanburg County, SC, Regional Health Services District Hospital Rev., “A”, 4%, 4/15/2043 | 655,000 | 555,129 | ||
| $6,370,366 | ||||
| Industrial Revenue - Other – 1.3% | ||||
| Mississippi Business Finance Corp., Gulf Opportunity Zone Industrial Development Rev. (Chevron U.S.A., Inc. Project), VRDN, 3.2%, 11/30/2030 | $ | 295,000 | $295,000 | |
| Mississippi Business Finance Corp., Gulf Opportunity Zone Industrial Development Rev. (Chevron U.S.A., Inc. Project), VRDN, 3.2%, 11/30/2030 | 200,000 | 200,000 | ||
| Mississippi Development Bank Special Obligation (Jackson County GOMESA Project), 3.625%, 11/01/2036 (n) | 500,000 | 431,520 | ||
| Port Beaumont, TX, Navigation District, Dock & Wharf Facility Rev. (Jefferson Gulf Coast Energy Project), “A”, 2.875%, 1/01/2041 (n) | 100,000 | 62,125 | ||
| $988,645 | ||||
| Industrial Revenue - Paper – 1.2% | ||||
| Warren County, MS, Environmental Improvement Rev. (International Paper Co. Project), “B”, 1.6%, 8/01/2027 (Put Date 6/16/2025) | $ | 1,000,000 | $954,523 | |
| Miscellaneous Revenue - Other – 1.6% | ||||
| Matching Fund Special Purpose Securitization Corp., “A”, 5%, 10/01/2026 | $ | 35,000 | $35,134 | |
| Mississippi Development Bank Special Obligation (Itawamba Community College Capital Improvement Project), 5%, 10/01/2030 | 720,000 | 770,030 | ||
| New York Liberty Development Corp., Liberty Rev. (3 World Trade Center Project), “1”, 5%, 11/15/2044 (n) | 210,000 | 194,007 | ||
| Pennsylvania Economic Development Financing Authority, Private Activity Rev. (PennDOT Major Bridges Package One Project), AGM, 5%, 12/31/2057 | 310,000 | 298,598 | ||
| $1,297,769 | ||||
| Multi-Family Housing Revenue – 0.8% | ||||
| New Hampshire National Finance Authority Municipal Certificates, “1-A”, 4.375%, 9/20/2036 | $ | 242,838 | $224,865 | |
13
Portfolio of Investments (unaudited) –
continued
| Issuer | Shares/Par | Value ($) | ||
| Municipal Bonds – continued | ||||
| Multi-Family Housing Revenue – continued | ||||
| New York, NY, Housing Development Corp., Multi-Family Housing Rev. (Sustainable Development Bonds), “G”, FHA, 2.45%, 11/01/2045 | $ | 650,000 | $410,814 | |
| $635,679 | ||||
| Sales & Excise Tax Revenue – 4.7% | ||||
| Chicago, IL, Metropolitan Pier & Exposition Authority Refunding Bonds (McCormick Place Expansion Project), Capital Appreciation, “B-1”, AGM, 0%, 6/15/2044 | $ | 905,000 | $308,720 | |
| Guam Government Business Privilege Tax Refunding, “F”, 5%, 1/01/2030 | 5,000 | 4,985 | ||
| Guam Government Business Privilege Tax Refunding, “F”, 5%, 1/01/2031 | 5,000 | 4,967 | ||
| Guam Government Business Privilege Tax Refunding, “F”, 4%, 1/01/2042 | 70,000 | 56,650 | ||
| Guam Government Business Privilege Tax Rev., “D”, 5%, 11/15/2031 | 270,000 | 266,106 | ||
| Massachusetts Bay Transportation Authority, Sales Tax Rev., “A-1”, 5.25%, 7/01/2029 | 750,000 | 822,568 | ||
| Puerto Rico Sales Tax Financing Corp., Restructured Sales Tax Rev., “2019A-1”, 4.55%, 7/01/2040 | 20,000 | 18,402 | ||
| Puerto Rico Sales Tax Financing Corp., Restructured Sales Tax Rev., “2019A-1”, 4.75%, 7/01/2053 | 71,000 | 62,768 | ||
| Puerto Rico Sales Tax Financing Corp., Restructured Sales Tax Rev., “2019A-1”, 5%, 7/01/2058 | 929,000 | 840,358 | ||
| Puerto Rico Sales Tax Financing Corp., Restructured Sales Tax Rev., “2019A-2”, 4.329%, 7/01/2040 | 162,000 | 145,098 | ||
| Puerto Rico Sales Tax Financing Corp., Restructured Sales Tax Rev., “2019A-2”, 4.329%, 7/01/2040 | 71,000 | 63,592 | ||
| Puerto Rico Sales Tax Financing Corp., Restructured Sales Tax Rev., “2019A-2”, 4.536%, 7/01/2053 | 1,000 | 853 | ||
| Puerto Rico Sales Tax Financing Corp., Restructured Sales Tax Rev., “2019A-2”, 4.784%, 7/01/2058 | 234,000 | 204,245 | ||
| Puerto Rico Sales Tax Financing Corp., Restructured Sales Tax Rev., Capital Appreciation, “2019A-1”, 0%, 7/01/2024 | 1,000 | 968 | ||
| Puerto Rico Sales Tax Financing Corp., Restructured Sales Tax Rev., Capital Appreciation, “2019A-1”, 0%, 7/01/2027 | 38,000 | 32,357 | ||
| Puerto Rico Sales Tax Financing Corp., Restructured Sales Tax Rev., Capital Appreciation, “2019A-1”, 0%, 7/01/2029 | 7,000 | 5,443 | ||
| Puerto Rico Sales Tax Financing Corp., Restructured Sales Tax Rev., Capital Appreciation, “2019A-1”, 0%, 7/01/2031 | 346,000 | 245,116 | ||
| Puerto Rico Sales Tax Financing Corp., Restructured Sales Tax Rev., Capital Appreciation, “2019A-1”, 0%, 7/01/2033 | 330,000 | 211,447 | ||
| Puerto Rico Sales Tax Financing Corp., Restructured Sales Tax Rev., Capital Appreciation, “2019A-1”, 0%, 7/01/2046 | 1,356,000 | 349,561 | ||
| Wisconsin Public Finance Authority Limited Obligation Grant Rev. (American Dream at Meadowlands Project), “A”, 6.25%, 8/01/2027 (a)(d)(n) | 115,000 | 87,831 | ||
| $3,732,035 | ||||
| Single Family Housing - State – 8.9% | ||||
| Mississippi Home Corp., Single Family Mortgage Rev., “A”, GNMA, 5%, 5/31/2026 | $ | 200,000 | $204,787 | |
| Mississippi Home Corp., Single Family Mortgage Rev., “A”, GNMA, 3%, 6/01/2050 | 470,000 | 441,718 | ||
| Mississippi Home Corp., Single Family Mortgage Rev., “A”, GNMA, 3%, 12/01/2050 | 1,270,000 | 1,201,971 | ||
| Mississippi Home Corp., Single Family Mortgage Rev., “A”, GNMA, 5.25%, 12/01/2053 | 1,000,000 | 1,019,730 | ||
| Mississippi Home Corp., Single Family Mortgage Rev., “B”, GNMA, 2.875%, 12/01/2043 | 1,000,000 | 694,946 | ||
| Mississippi Home Corp., Single Family Mortgage Rev., “B”, GNMA, 3%, 6/01/2051 | 905,000 | 853,246 | ||
| Mississippi Home Corp., Single Family Mortgage Rev., “C”, GNMA, 3.95%, 12/01/2042 | 1,000,000 | 878,427 | ||
| Mississippi Home Corp., Single Family Mortgage Rev., “C”, GNMA, 4.05%, 12/01/2047 | 1,000,000 | 826,547 | ||
| Mississippi Home Corp., Single Family Mortgage Rev., “C”, GNMA, 4.65%, 12/01/2048 | 1,000,000 | 924,550 | ||
| $7,045,922 | ||||
| State & Local Agencies – 3.2% | ||||
| Mississippi Development Bank Special Obligation (Montfort Jones Memorial Hospital Project), 5.75%, 5/01/2036 | $ | 500,000 | $500,229 | |
| Mississippi Development Bank Special Obligation (Tupelo Public Improvement Rev. Project), 5%, 7/01/2049 | 1,500,000 | 1,512,680 | ||
| Mississippi Development Bank Special Obligation Refunding, Taxable (Desoto County Highway Project), 2.358%, 1/01/2026 | 590,000 | 550,527 | ||
| $2,563,436 | ||||
| Student Loan Revenue – 0.6% | ||||
| Iowa Student Loan Liquidity Corp. Rev., “B”, 3%, 12/01/2039 | $ | 10,000 | $9,231 | |
| Iowa Student Loan Liquidity Corp. Rev., “B”, 3.5%, 12/01/2044 | 110,000 | 79,988 | ||
| New Jersey Higher Education Student Assistance Authority, Senior Student Loan Rev., “B”, 4%, 12/01/2041 | 420,000 | 397,294 | ||
| $486,513 | ||||
| Tax - Other – 4.1% | ||||
| Birmingham-Jefferson, AL, Civic Center Authority, “B”, 5%, 7/01/2043 | $ | 455,000 | $453,820 | |
| Chicago, IL, Board of Education, Dedicated Capital Improvement Tax Bond, 5%, 4/01/2045 | 60,000 | 59,226 | ||
| Chicago, IL, Board of Education, Dedicated Capital Improvement Tax Bond, 5.75%, 4/01/2048 | 150,000 | 157,034 | ||
| State of Mississippi, Gaming Tax Rev., “A”, 4%, 10/15/2038 | 1,000,000 | 865,110 | ||
| State of Mississippi, Gaming Tax Rev., “E”, 5%, 10/15/2030 | 1,305,000 | 1,315,830 | ||
14
Portfolio of Investments (unaudited) –
continued
| Issuer | Shares/Par | Value ($) | ||
| Municipal Bonds – continued | ||||
| Tax - Other – continued | ||||
| Triborough Bridge & Tunnel Authority Rev., NY, Payroll Mobility Tax (MTA Bridges and Tunnels), ”C-3“, 3%, 5/15/2051 | $ | 545,000 | $366,801 | |
| $3,217,821 | ||||
| Tobacco – 0.8% | ||||
| Buckeye, OH, Tobacco Settlement Financing Authority Senior Asset-Backed Refunding, 2020A-2, “1”, 4%, 6/01/2048 | $ | 265,000 | $223,840 | |
| Buckeye, OH, Tobacco Settlement Financing Authority Senior Asset-Backed Refunding, 2020B-2, “2”, 5%, 6/01/2055 | 185,000 | 159,360 | ||
| Golden State, CA, Tobacco Securitization Corp., Tobacco Settlement Rev., Taxable, “B-1”, 3.85%, 6/01/2050 | 295,000 | 267,581 | ||
| $650,781 | ||||
| Toll Roads – 0.5% | ||||
| Texas Private Activity Surface Transportation Corp., Senior Lien Rev. (NTE Mobility Partners Segments 3 LLC Segments 3A & 3B Facility), 7%, 12/31/2038 | $ | 110,000 | $110,209 | |
| Texas Private Activity Surface Transportation Corp., Senior Lien Rev. (NTE Mobility Partners Segments 3 LLC Segments 3A & 3B Facility), 6.75%, 6/30/2043 | 85,000 | 85,136 | ||
| Virginia Small Business Financing Authority Senior Lien Rev. (Elizabeth River Crossings Opco LLC Project), 3%, 1/01/2041 | 280,000 | 201,577 | ||
| $396,922 | ||||
| Transportation - Special Tax – 0.3% | ||||
| Metropolitan Transportation Authority, NY, Refunding Rev. (Climate Bond Certified), “E”, 4%, 11/15/2045 | $ | 255,000 | $215,790 | |
| Universities - Colleges – 11.4% | ||||
| Massachusetts Development Finance Agency Rev. (Suffolk University), 4%, 7/01/2051 | $ | 370,000 | $280,088 | |
| Massachusetts Health & Educational Facilities Authority Rev. (Massachusetts Institute of Technology), “I-1”, 5.2%, 1/01/2028 | 920,000 | 989,170 | ||
| Medical Center, Educational Building Corp. Rev. (Colony Park Teaching Campus), “A”, 4%, 6/01/2053 | 1,000,000 | 841,190 | ||
| Mississippi Development Bank Special Obligation (Northwest Mississippi Community College Improvement Project), 4%, 3/01/2050 | 435,000 | 369,671 | ||
| Mississippi State University, Educational Building Corp. Refunding Rev. (Mississippi State University Facilities Refinancing), “A”, 4%, 8/01/2043 | 600,000 | 519,957 | ||
| University of Mississippi Medical Center, Educational Building Corp. Rev. (New Facilities & Refinancing Project), “A”, 5%, 5/31/2042 | 500,000 | 502,897 | ||
| University of Mississippi Medical Center, Educational Building Corp. Rev. (New Facilities & Refinancing Project), “A”, 4%, 6/01/2047 | 1,000,000 | 872,907 | ||
| University of Mississippi Medical Center, Educational Building Corp. Rev. (New Facilities & Refinancing Project), “A”, 5%, 6/01/2047 | 1,250,000 | 1,247,488 | ||
| University of Mississippi Medical Center, Educational Building Corp. Rev., “B”, AAC, 5.5%, 12/01/2023 | 165,000 | 165,358 | ||
| University of Mississippi, Educational Building Corp. Rev. (New Facilities Project), 4.5%, 10/01/2052 | 1,000,000 | 927,206 | ||
| University of Southern Mississippi, Educational Building Corp. Rev. (Facilities Refinancing Project), “A”, 5%, 3/01/2028 | 745,000 | 752,876 | ||
| University of Southern Mississippi, Educational Building Corp. Rev. (Facilities Refinancing Project), “A”, 5%, 9/01/2035 | 1,515,000 | 1,535,468 | ||
| $9,004,276 | ||||
| Utilities - Electric Power – 0.3% | ||||
| Texas Municipal Power Agency, Transmission System Rev., AGM, 2%, 9/01/2033 | $ | 355,000 | $261,924 | |
| Utilities - Investor Owned – 0.4% | ||||
| Mississippi Business Finance Corp. Refunding Rev. (System Energy Resources, Inc. Project), 2.375%, 6/01/2044 | $ | 500,000 | $284,755 | |
| Utilities - Municipal Owned – 2.6% | ||||
| Guam Power Authority Rev., “A”, AGM, 5%, 10/01/2033 | $ | 315,000 | $317,386 | |
| Guam Power Authority Rev., “A”, AGM, 5%, 10/01/2039 | 75,000 | 75,180 | ||
| Guam Power Authority Rev., “A”, AGM, 5%, 10/01/2044 | 85,000 | 84,088 | ||
| Mississippi Development Bank Special Obligation (Municipal Energy Agency Power Supply Project), AGM, 5%, 3/01/2035 | 500,000 | 509,010 | ||
| Puerto Rico Electric Power Authority Refunding Rev., “DDD”, 5%, 7/01/2020 (a)(d) | 10,000 | 2,500 | ||
| Puerto Rico Electric Power Authority Refunding Rev., “DDD”, 5%, 7/01/2021 (a)(d) | 90,000 | 22,500 | ||
| Puerto Rico Electric Power Authority Refunding Rev., “DDD”, 5%, 7/01/2022 (a)(d) | 150,000 | 37,500 | ||
| Puerto Rico Electric Power Authority Refunding Rev., “VV”, NPFG, 5.25%, 7/01/2030 | 105,000 | 103,749 | ||
| Puerto Rico Electric Power Authority Refunding Rev., “VV”, NPFG, 5.25%, 7/01/2034 | 10,000 | 9,862 | ||
| Puerto Rico Electric Power Authority Rev., “A”, 5%, 7/01/2029 (a)(d) | 240,000 | 60,000 | ||
| Puerto Rico Electric Power Authority Rev., “A”, 5%, 7/01/2042 (a)(d) | 35,000 | 8,750 | ||
| Puerto Rico Electric Power Authority Rev., “AAA”, 5.25%, 7/01/2021 (a)(d) | 20,000 | 5,000 | ||
| Puerto Rico Electric Power Authority Rev., “AAA”, 5.25%, 7/01/2030 (a)(d) | 10,000 | 2,500 | ||
| Puerto Rico Electric Power Authority Rev., “CCC”, 5.25%, 7/01/2027 (a)(d) | 90,000 | 22,500 | ||
| Puerto Rico Electric Power Authority Rev., “DDD”, AGM, 3.65%, 7/01/2024 | 80,000 | 79,171 | ||
| Puerto Rico Electric Power Authority Rev., “SS”, AGM, 4.375%, 7/01/2030 | 15,000 | 14,370 | ||
| Puerto Rico Electric Power Authority Rev., “TT”, 5%, 7/01/2021 (a)(d) | 40,000 | 10,000 | ||
15
Portfolio of Investments (unaudited) –
continued
| Issuer | Shares/Par | Value ($) | ||
| Municipal Bonds – continued | ||||
| Utilities - Municipal Owned – continued | ||||
| Puerto Rico Electric Power Authority Rev., “TT”, 5%, 7/01/2023 (a)(d) | $ | 40,000 | $10,000 | |
| Puerto Rico Electric Power Authority Rev., “TT”, 5%, 7/01/2027 (a)(d) | 5,000 | 1,250 | ||
| Puerto Rico Electric Power Authority Rev., “TT”, 5%, 7/01/2037 (a)(d) | 120,000 | 30,000 | ||
| Puerto Rico Electric Power Authority Rev., “UU”, AGM, 5%, 7/01/2024 | 500,000 | 523,543 | ||
| Puerto Rico Electric Power Authority Rev., “UU”, AGM, 4.25%, 7/01/2027 | 60,000 | 58,240 | ||
| Puerto Rico Electric Power Authority Rev., “WW”, 5.375%, 7/01/2022 (a)(d) | 10,000 | 2,500 | ||
| Puerto Rico Electric Power Authority Rev., “WW”, 5.25%, 7/01/2025 (a)(d) | 15,000 | 3,750 | ||
| Puerto Rico Electric Power Authority Rev., “ZZ”, 5%, 7/01/2018 (a)(d) | 60,000 | 15,000 | ||
| Puerto Rico Electric Power Authority Rev., “ZZ”, 5.25%, 7/01/2023 (a)(d) | 65,000 | 16,250 | ||
| Puerto Rico Electric Power Authority Rev., “ZZ”, 5.25%, 7/01/2024 (a)(d) | 20,000 | 5,000 | ||
| Puerto Rico Electric Power Authority Rev., “ZZ”, 5.25%, 7/01/2026 (a)(d) | 60,000 | 15,000 | ||
| Puerto Rico Electric Power Authority Rev., Taxable, “EEE”, 6.05%, 7/01/2032 (a)(d) | 50,000 | 12,500 | ||
| $2,057,099 | ||||
| Utilities - Other – 2.2% | ||||
| Alabama Southeast Energy, Cooperative District Energy Supply Rev., “A-1”, 5.5%, 11/01/2053 (Put Date 1/01/2031) | $ | 560,000 | $575,545 | |
| Black Belt Energy Gas District, AL, Gas Project Rev. (Project No. 8), “A”, 4%, 12/01/2052 (Put Date 12/01/2029) | 200,000 | 186,804 | ||
| Black Belt Energy Gas District, AL, Gas Project Rev., “A”, 4%, 6/01/2051 (Put Date 12/01/2031) | 240,000 | 226,290 | ||
| California Community Choice Financing Authority, Clean Energy Project Rev., “C”, 5.25%, 1/01/2054 (Put Date 10/01/2031) | 460,000 | 458,915 | ||
| Tennergy Corp., TN, Gas Supply Rev., “A”, 5.5%, 10/01/2053 (Put Date 12/01/2030) | 265,000 | 269,149 | ||
| $1,716,703 | ||||
| Water & Sewer Utility Revenue – 8.3% | ||||
| Guam Waterworks Authority Rev. (Water and Wastewater System), 5%, 7/01/2036 | $ | 30,000 | $30,002 | |
| Guam Waterworks Authority Rev. (Water and Wastewater System), 5%, 1/01/2046 | 145,000 | 136,659 | ||
| Guam Waterworks Authority Rev. (Water and Wastewater System), “A”, 5%, 7/01/2029 | 30,000 | 30,052 | ||
| Guam Waterworks Authority Rev. (Water and Wastewater System), “A”, 5%, 7/01/2035 | 30,000 | 30,018 | ||
| Guam Waterworks Authority Rev. (Water and Wastewater System), “A”, 5%, 1/01/2050 | 120,000 | 111,209 | ||
| Jackson County, MS, Utility Authority Rev. (Water and Wastewater Treatment System), AGM, 5%, 9/01/2040 | 2,000,000 | 2,002,349 | ||
| Michigan Finance Authority Local Government Loan Program Rev. (Detroit Water and Sewerage Department Sewage Disposal System Rev. Refunding Second Lien Local Project), “C-7”, NPFG, 5%, 7/01/2032 | 25,000 | 25,143 | ||
| Michigan Finance Authority Local Government Loan Program Rev. (Detroit Water and Sewerage Department Water Supply System Rev. Refunding Second Lien Local Project), “D-6”, NPFG, 5%, 7/01/2036 | 30,000 | 30,066 | ||
| Michigan Finance Authority Local Government Loan Program Rev. (Detroit Water and Sewerage Department Water Supply System Rev. Refunding Senior Lien Local Project), “D-1”, AGM, 5%, 7/01/2035 | 15,000 | 15,071 | ||
| Michigan Finance Authority Local Government Loan Program Rev. (Detroit Water and Sewerage Department Water Supply System Rev. Refunding Senior Lien Local Project), “D-1”, AGM, 5%, 7/01/2037 | 35,000 | 35,095 | ||
| Mississippi Development Bank Special Obligation (Jackson Water and Sewer System Rev. Bond Project), AGM, 6.875%, 12/01/2040 | 750,000 | 752,314 | ||
| Mississippi Development Bank Special Obligation (Meridian Combined Water and Sewer Rev. Project), BAM, 4%, 7/01/2045 | 1,305,000 | 1,108,837 | ||
| Mississippi Development Bank Special Obligation (Meridian Combined Water and Sewer Rev. Project), BAM, 4%, 7/01/2050 | 1,500,000 | 1,234,279 | ||
| West Rankin, MS, Utility Authority Rev., AGM, 5%, 1/01/2048 (Prerefunded 1/01/2028) | 1,000,000 | 1,054,338 | ||
| $6,595,432 | ||||
| Total Municipal Bonds (Identified Cost, $83,163,647) | $75,945,925 | |||
| Bonds – 0.3% | ||||
| Consumer Services – 0.3% | ||||
| Toll Road Investors Partnership II LP, Capital Appreciation, NPFG, 0%, 2/15/2025 (n) | $ | 161,000 | $144,971 | |
| Toll Road Investors Partnership II LP, Capital Appreciation, NPFG, 0%, 2/15/2043 (n) | 283,648 | 93,245 | ||
| Total Bonds (Identified Cost, $259,839) | $238,216 | |||
| Contingent Value Instruments – 0.1% | ||||
| General Obligations - General Purpose – 0.1% | ||||
| Commonwealth of Puerto Rico, General Obligation Contingent Value Instrument, 11/01/2043 (Identified Cost, $106,632) | $ | 179,722 | $93,231 | |
16
Portfolio of Investments (unaudited) –
continued
| Issuer | Shares/Par | Value ($) | ||
| Investment Companies (h) – 1.6% | ||||
| Money Market Funds – 1.6% | ||||
| MFS Institutional Money Market Portfolio, 5.4% (v) (Identified Cost, $1,287,233) | 1,286,841 | $1,287,098 | ||
| Other Assets, Less Liabilities – 2.2% | 1,749,365 | |||
| Net Assets – 100.0% | $79,313,835 | |||
See Portfolio Footnotes and Notes to
Financial Statements
17
Portfolio of Investments (unaudited) –
continued
MFS New York Municipal Bond
Fund
| Issuer | Shares/Par | Value ($) | ||
| Municipal Bonds – 97.2% | ||||
| Airport Revenue – 5.2% | ||||
| Albany County, NY, Airport Authority Rev., “A”, 5%, 12/15/2043 | $ | 1,500,000 | $1,508,740 | |
| New York Transportation Development Corp. Special Facilities (LaGuardia Airport Terminal B Redevelopment Project), “A”, 5%, 7/01/2034 | 900,000 | 891,284 | ||
| New York Transportation Development Corp., Special Facilities Rev. (LaGuardia Airport, Terminal B Redevelopment), “A”, AGM, 4%, 7/01/2031 | 2,000,000 | 1,917,573 | ||
| New York Transportation Development Corp., Special Facilities Rev. (Terminal 4 John F. Kennedy International Airport Project), “A”, 4%, 12/01/2040 | 1,500,000 | 1,312,341 | ||
| Niagara, NY, Frontier Transportation Authority Rev. (Buffalo-Niagara International Airport), “A”, 5%, 4/01/2028 | 650,000 | 649,423 | ||
| Niagara, NY, Frontier Transportation Authority Rev. (Buffalo-Niagara International Airport), “A”, 5%, 4/01/2029 | 500,000 | 499,544 | ||
| Niagara, NY, Frontier Transportation Authority Rev. (Buffalo-Niagara International Airport), “A”, 5%, 4/01/2038 | 1,000,000 | 997,705 | ||
| Wayne County, MI, Airport Authority Rev. (Detroit Metropolitan Wayne County Airport), “B”, 5%, 12/01/2044 | 90,000 | 88,794 | ||
| Wayne County, MI, Airport Authority Rev. (Detroit Metropolitan Wayne County Airport), “B”, BAM, 5%, 12/01/2039 | 15,000 | 14,999 | ||
| Wayne County, MI, Airport Authority Rev. (Detroit Metropolitan Wayne County Airport), “C”, 5%, 12/01/2039 | 80,000 | 79,827 | ||
| Wayne County, MI, Airport Authority Rev. (Detroit Metropolitan Wayne County Airport), “C”, 5%, 12/01/2044 | 130,000 | 128,093 | ||
| $8,088,323 | ||||
| General Obligations - General Purpose – 7.4% | ||||
| Bridgeview, IL, Stadium and Redevelopment Projects, Taxable, AAC, 5.14%, 12/01/2036 | $ | 615,000 | $530,914 | |
| Commonwealth of Puerto Rico, General Obligation Restructured Bonds, Capital Appreciation, Series 2022A, 0%, 7/01/2024 | 17,681 | 17,080 | ||
| Commonwealth of Puerto Rico, General Obligation Restructured Bonds, Capital Appreciation, Series 2022A, 0%, 7/01/2033 | 139,873 | 82,436 | ||
| Commonwealth of Puerto Rico, General Obligation Restructured Bonds, Series 2022A, 5.625%, 7/01/2027 | 119,953 | 123,091 | ||
| Commonwealth of Puerto Rico, General Obligation Restructured Bonds, Series 2022A, 5.625%, 7/01/2029 | 118,007 | 121,938 | ||
| Commonwealth of Puerto Rico, General Obligation Restructured Bonds, Series 2022A, 5.75%, 7/01/2031 | 114,620 | 119,700 | ||
| Commonwealth of Puerto Rico, General Obligation Restructured Bonds, Series 2022A, 4%, 7/01/2033 | 108,689 | 97,422 | ||
| Commonwealth of Puerto Rico, General Obligation Restructured Bonds, Series 2022A, 4%, 7/01/2035 | 184,514 | 160,352 | ||
| Commonwealth of Puerto Rico, General Obligation Restructured Bonds, Series 2022A, 4%, 7/01/2037 | 83,850 | 70,387 | ||
| Commonwealth of Puerto Rico, General Obligation Restructured Bonds, Series 2022A, 4%, 7/01/2041 | 114,004 | 91,661 | ||
| Commonwealth of Puerto Rico, General Obligation Restructured Bonds, Series 2022A, 4%, 7/01/2046 | 354,563 | 273,361 | ||
| Long Beach, NY, General Obligation, “B”, BAM, 4.625%, 7/15/2052 | 2,000,000 | 1,819,594 | ||
| New York, NY, “B-1”, 3%, 10/01/2044 | 1,825,000 | 1,315,923 | ||
| New York, NY, “D-1”, 5%, 12/01/2038 | 2,000,000 | 2,052,665 | ||
| New York, NY, “J”, FGIC, 5.5%, 2/15/2026 | 5,000 | 5,006 | ||
| New York, NY, General Obligation, “A”, 5%, 7/31/2051 | 1,500,000 | 1,523,737 | ||
| New York, NY, General Obligation, “A”, 4.125%, 7/31/2053 | 1,500,000 | 1,303,802 | ||
| Poughkeepsie, NY, Dutchess County Public Improvement, 5%, 6/01/2031 | 635,000 | 634,618 | ||
| State of Illinois, General Obligation, 5.5%, 5/01/2039 | 215,000 | 224,306 | ||
| State of Illinois, General Obligation, 5.75%, 5/01/2045 | 200,000 | 208,504 | ||
| Yonkers, NY, General Obligation, “F”, BAM, 5%, 11/15/2042 | 750,000 | 774,720 | ||
| $11,551,217 | ||||
| Healthcare Revenue - Hospitals – 10.6% | ||||
| Buffalo & Erie County, NY, Industrial Land Development Corp. Rev. (Catholic Health System, Inc. Project), 5%, 7/01/2026 | $ | 450,000 | $426,650 | |
| Buffalo & Erie County, NY, Industrial Land Development Corp. Rev. (Catholic Health System, Inc. Project), 5%, 7/01/2027 | 300,000 | 279,819 | ||
| Buffalo & Erie County, NY, Industrial Land Development Corp. Rev. (Catholic Health System, Inc. Project), 5%, 7/01/2029 | 590,000 | 534,326 | ||
| California Health Facilities Financing Authority Rev. (Cedars-Sinai Health System), “A”, 5%, 8/15/2051 | 2,000,000 | 2,042,438 | ||
| Dutchess County, NY, Local Development Corp. Rev. (Health Quest Systems, Inc. Project), 4%, 7/01/2041 | 1,605,000 | 1,345,165 | ||
| Dutchess County, NY, Local Development Corp. Rev. (Health Quest Systems, Inc. Project), “A”, 5%, 7/01/2044 (Prerefunded 7/01/2024) | 1,000,000 | 1,008,189 | ||
| Jefferson County, NY, Civic Development Corp. Rev. (Samaritan Medical Center), “A”, 5%, 11/01/2037 | 2,000,000 | 1,741,469 | ||
| Monroe County, NY, Industrial Development Corp. Rev. (Rochester General Hospital Project), 5%, 12/01/2046 | 2,000,000 | 1,902,770 | ||
| Nassau County, NY, Local Economic Assistance Corp. Rev. (Catholic Health Services of Long Island Obligated Group Project), 5%, 7/01/2032 | 1,000,000 | 1,002,458 | ||
| New York Dormitory Authority Rev. (HYU Langone Hospitals Obligated Group), “A”, 4%, 7/01/2050 | 2,000,000 | 1,699,201 | ||
| New York Dormitory Authority Rev. (Montefiore Obligated Group), “A”, 4%, 9/01/2050 | 1,500,000 | 1,159,386 | ||
| New York Dormitory Authority Rev. (Norwell Health Obligated Group), “A”, 4.25%, 5/01/2052 | 3,000,000 | 2,585,329 | ||
| New York Dormitory Authority Rev. (Orange Regional Medical Center Obligated Group Rev.), 5%, 12/01/2035 (n) | 800,000 | 749,759 | ||
18
Portfolio of Investments (unaudited) –
continued
| Issuer | Shares/Par | Value ($) | ||
| Municipal Bonds – continued | ||||
| Healthcare Revenue - Hospitals – continued | ||||
| Westchester County, NY, Health Care Corp. Rev., “B”, “C-2”, 6%, 11/01/2030 | $ | 120,000 | $120,124 | |
| $16,597,083 | ||||
| Healthcare Revenue - Long Term Care – 2.7% | ||||
| Brookhaven, NY, Local Development Corp. Rev. (Active Retirement Community, Inc. d/b/a/ Jefferson's Ferry Project), 5.25%, 11/01/2036 | $ | 1,000,000 | $997,147 | |
| Brookhaven, NY, Local Development Corp. Rev. (Active Retirement Community, Inc. d/b/a/ Jefferson's Ferry Project), “A”, 4%, 11/01/2045 | 2,000,000 | 1,582,286 | ||
| Buffalo & Erie County, NY, Industrial Land Development Corp. Rev. (Orchard Park CCRC, Inc. Project), 5%, 11/15/2037 | 750,000 | 724,897 | ||
| Tompkins County, NY, Development Corp. Continuing Care Retirement Community Rev. (Kendal at Ithaca, Inc. Project), “A”, 5%, 7/01/2044 | 915,000 | 820,143 | ||
| Ulster County, NY, Capital Resource Corp. Rev. (Woodland Pond at New Paltz Project), 4%, 9/15/2025 | 100,000 | 94,495 | ||
| $4,218,968 | ||||
| Industrial Revenue - Airlines – 4.8% | ||||
| New York Transportation Development Corp., Special Facilities Rev. (American Airlines, Inc. John F. Kennedy International Airport Project), 3%, 8/01/2031 | $ | 1,500,000 | $1,295,282 | |
| New York Transportation Development Corp., Special Facilities Rev. (American Airlines, Inc. John F. Kennedy International Airport Project), 5%, 8/01/2031 | 1,000,000 | 977,155 | ||
| New York Transportation Development Corp., Special Facilities Rev. (American Airlines, Inc. John F. Kennedy International Airport Project), 5.375%, 8/01/2036 | 1,035,000 | 1,011,215 | ||
| New York Transportation Development Corp., Special Facilities Rev. (Delta Airlines, Inc. LaGuardia Airport Terminals C&D Redevelopment Project), 5%, 1/01/2034 | 1,000,000 | 1,006,814 | ||
| New York Transportation Development Corp., Special Facilities Rev. (Delta Airlines, Inc. LaGuardia Airport Terminals C&D Redevelopment Project), 5%, 1/01/2036 | 2,000,000 | 1,985,838 | ||
| New York Transportation Development Corp., Special Facilities Rev. (Delta Airlines, Inc. LaGuardia Airport Terminals C&D Redevelopment Project), 4.375%, 10/01/2045 | 1,500,000 | 1,303,469 | ||
| $7,579,773 | ||||
| Industrial Revenue - Other – 0.2% | ||||
| Port Beaumont, TX, Navigation District, Dock & Wharf Facility Rev. (Jefferson Gulf Coast Energy Project), “A”, 3.625%, 1/01/2035 (n) | $ | 200,000 | $154,614 | |
| Port Beaumont, TX, Navigation District, Dock & Wharf Facility Rev. (Jefferson Gulf Coast Energy Project), “A”, 2.875%, 1/01/2041 (n) | 255,000 | 158,419 | ||
| $313,033 | ||||
| Industrial Revenue - Paper – 0.3% | ||||
| Build NYC Resource Corp. Solid Waste Disposal Rev. (Pratt Paper, Inc. Project), 4.5%, 1/01/2025 (n) | $ | 445,000 | $445,586 | |
| Miscellaneous Revenue - Other – 6.0% | ||||
| Battery Park, NY, Authority Senior Rev., “A”, 5%, 11/01/2053 | $ | 2,000,000 | $2,069,333 | |
| Matching Fund Special Purpose Securitization Corp., “A”, 5%, 10/01/2026 | 90,000 | 90,343 | ||
| New York City Convention Center Development Corp., Capital Appreciation, “B”, AGM, 0%, 11/15/2043 | 680,000 | 235,086 | ||
| New York Liberty Development Corp., Liberty Rev. (3 World Trade Center Project), “1”, 5%, 11/15/2044 (n) | 1,940,000 | 1,792,257 | ||
| New York Liberty Development Corp., Liberty Rev. (3 World Trade Center Project), “2”, 5.375%, 11/15/2040 (n) | 1,500,000 | 1,442,301 | ||
| New York, NY, Industrial Development Agency, Airport Facilities Rev. (Transportation Infrastructure Properties LLC), 5%, 7/01/2028 | 2,585,000 | 2,551,772 | ||
| Syracuse, NY, Industrial Development Agency PILOT Rev. (Carousel Center Project), “A”, 5%, 1/01/2034 | 750,000 | 545,223 | ||
| Syracuse, NY, Industrial Development Agency PILOT Rev. (Carousel Center Project), “A”, 5%, 1/01/2036 | 1,000,000 | 726,893 | ||
| $9,453,208 | ||||
| Multi-Family Housing Revenue – 14.6% | ||||
| New Hampshire National Finance Authority Municipal Certificates, “1-A”, 4.375%, 9/20/2036 | $ | 653,303 | $604,949 | |
| New York Housing Finance Agency Affordable Housing Rev. (Climate Bond), “B”, 3.7%, 11/01/2038 | 1,450,000 | 1,239,665 | ||
| New York Housing Finance Agency Affordable Housing Rev. (Climate Bond), “I”, 4%, 11/01/2043 | 1,015,000 | 886,802 | ||
| New York Housing Finance Agency Affordable Housing Rev., “E-1”, 4.125%, 11/01/2047 | 4,080,000 | 3,391,496 | ||
| New York Housing Finance Agency Affordable Housing Rev., “F-1”, 5.1%, 11/01/2052 | 1,000,000 | 976,588 | ||
| New York Housing Finance Agency Affordable Housing Rev., “F-1”, 5.15%, 11/01/2057 | 1,200,000 | 1,172,344 | ||
| New York Housing Finance Agency Affordable Housing Rev., “G-1”, 4.625%, 11/01/2042 | 350,000 | 336,220 | ||
| New York Housing Finance Agency Affordable Housing Rev., “G-1”, 4.8%, 11/01/2047 | 1,000,000 | 952,837 | ||
| New York State Housing Finance Agency Affordable Rev., “A-2”, 2.5%, 11/01/2060 (Put Date 5/01/2027) | 2,000,000 | 1,858,375 | ||
| New York, NY, Housing Development Corp., Multi-Family Housing Rev. (8 Spruce Street), “E”, 3.5%, 2/15/2048 | 276,686 | 271,855 | ||
19
Portfolio of Investments (unaudited) –
continued
| Issuer | Shares/Par | Value ($) | ||
| Municipal Bonds – continued | ||||
| Multi-Family Housing Revenue – continued | ||||
| New York, NY, Housing Development Corp., Multi-Family Housing Rev. (8 Spruce Street), “F”, 4.5%, 2/15/2048 | $ | 750,000 | $735,789 | |
| New York, NY, Housing Development Corp., Multi-Family Housing Rev. (Sustainable Development Bonds), “F-1”, 4.6%, 11/01/2042 | 1,000,000 | 958,756 | ||
| New York, NY, Housing Development Corp., Multi-Family Housing Rev. (Sustainable Development Bonds), “F-1”, 4.75%, 11/01/2047 | 500,000 | 471,672 | ||
| New York, NY, Housing Development Corp., Multi-Family Housing Rev. (Sustainable Development Bonds), “F-1”, 4.85%, 11/01/2052 | 500,000 | 476,932 | ||
| New York, NY, Housing Development Corp., Multi-Family Housing Rev. (Sustainable Development Bonds), “G”, FHA, 2.45%, 11/01/2045 | 2,500,000 | 1,580,053 | ||
| New York, NY, Housing Development Corp., Multi-Family Housing Rev. (Sustainable Neighborhood Bonds), “A-3-A”, 3.8%, 11/01/2039 | 1,870,000 | 1,639,934 | ||
| New York, NY, Housing Development Corp., Multi-Family Housing Rev. (Sustainable Neighborhood Bonds), “C-1-A”, 3.95%, 11/01/2048 | 2,610,000 | 2,163,626 | ||
| New York, NY, Housing Development Corp., Multi-Family Housing Rev., “C-1”, 4.25%, 11/01/2052 | 2,500,000 | 2,136,604 | ||
| New York, NY, Housing Development Corp., Multi-Family Housing Rev., “F-1”, 2.25%, 11/01/2041 | 1,535,000 | 993,045 | ||
| $22,847,542 | ||||
| Port Revenue – 3.1% | ||||
| New York Liberty Development Corp., Liberty Refunding Rev. (1 World Trade Center Project), 2.75%, 2/15/2044 | $ | 2,000,000 | $1,321,312 | |
| Port Authority of NY & NJ (178th Series), 5%, 11/30/2033 | 1,500,000 | 1,502,464 | ||
| Port Authority of NY & NJ (221st Series), 4%, 7/15/2055 | 2,485,000 | 2,036,623 | ||
| $4,860,399 | ||||
| Sales & Excise Tax Revenue – 4.6% | ||||
| Guam Government Business Privilege Tax Refunding, “F”, 5%, 1/01/2030 | $ | 15,000 | $14,956 | |
| Guam Government Business Privilege Tax Refunding, “F”, 5%, 1/01/2031 | 20,000 | 19,870 | ||
| Guam Government Business Privilege Tax Refunding, “F”, 4%, 1/01/2042 | 185,000 | 149,718 | ||
| Guam Government Business Privilege Tax Rev., “D”, 5%, 11/15/2031 | 750,000 | 739,182 | ||
| Puerto Rico Sales Tax Financing Corp., Restructured Sales Tax Rev., “2019A-1”, 4.55%, 7/01/2040 | 63,000 | 57,965 | ||
| Puerto Rico Sales Tax Financing Corp., Restructured Sales Tax Rev., “2019A-1”, 4.75%, 7/01/2053 | 200,000 | 176,812 | ||
| Puerto Rico Sales Tax Financing Corp., Restructured Sales Tax Rev., “2019A-1”, 5%, 7/01/2058 | 2,186,000 | 1,977,419 | ||
| Puerto Rico Sales Tax Financing Corp., Restructured Sales Tax Rev., “2019A-2”, 4.329%, 7/01/2040 | 451,000 | 403,944 | ||
| Puerto Rico Sales Tax Financing Corp., Restructured Sales Tax Rev., “2019A-2”, 4.329%, 7/01/2040 | 210,000 | 188,089 | ||
| Puerto Rico Sales Tax Financing Corp., Restructured Sales Tax Rev., “2019A-2”, 4.536%, 7/01/2053 | 4,000 | 3,412 | ||
| Puerto Rico Sales Tax Financing Corp., Restructured Sales Tax Rev., “2019A-2”, 4.784%, 7/01/2058 | 635,000 | 554,256 | ||
| Puerto Rico Sales Tax Financing Corp., Restructured Sales Tax Rev., Capital Appreciation, “2019A-1”, 0%, 7/01/2024 | 3,000 | 2,904 | ||
| Puerto Rico Sales Tax Financing Corp., Restructured Sales Tax Rev., Capital Appreciation, “2019A-1”, 0%, 7/01/2027 | 103,000 | 87,703 | ||
| Puerto Rico Sales Tax Financing Corp., Restructured Sales Tax Rev., Capital Appreciation, “2019A-1”, 0%, 7/01/2029 | 17,000 | 13,218 | ||
| Puerto Rico Sales Tax Financing Corp., Restructured Sales Tax Rev., Capital Appreciation, “2019A-1”, 0%, 7/01/2031 | 942,000 | 667,339 | ||
| Puerto Rico Sales Tax Financing Corp., Restructured Sales Tax Rev., Capital Appreciation, “2019A-1”, 0%, 7/01/2033 | 904,000 | 579,238 | ||
| Puerto Rico Sales Tax Financing Corp., Restructured Sales Tax Rev., Capital Appreciation, “2019A-1”, 0%, 7/01/2046 | 3,848,000 | 991,969 | ||
| Wisconsin Public Finance Authority Limited Obligation Grant Rev. (American Dream at Meadowlands Project), “A”, 6.25%, 8/01/2027 (a)(d)(n) | 545,000 | 416,244 | ||
| Wisconsin Public Finance Authority Limited Obligation Grant Rev., Taxable (American Dream at Meadowlands Project), ”A“, 5.625%, 8/01/2024 (a)(d)(n) | 255,000 | 194,756 | ||
| $7,238,994 | ||||
| Secondary Schools – 6.6% | ||||
| Buffalo & Erie County, NY, Industrial Land Development Corp. Rev. (Charter School for Applied Technologies Project), “A”, 5%, 6/01/2035 | $ | 1,000,000 | $1,003,977 | |
| Build NYC Resource Corp. Rev. (Academic Leadership Charter School Project), 4%, 6/15/2025 | 220,000 | 215,693 | ||
| Build NYC Resource Corp. Rev. (Academic Leadership Charter School Project), 4%, 6/15/2029 | 320,000 | 303,044 | ||
| Build NYC Resource Corp. Rev. (Academic Leadership Charter School Project), 4%, 6/15/2036 | 400,000 | 348,019 | ||
| Build NYC Resource Corp. Rev. (Grand Concourse Academy Charter School Project), “A”, 5%, 7/01/2042 | 550,000 | 519,049 | ||
| Build NYC Resource Corp. Rev. (Grand Concourse Academy Charter School Project), “A”, 5%, 7/01/2056 | 550,000 | 488,943 | ||
| Build NYC Resource Corp. Rev. (International Leadership Charter School Project), 6%, 7/01/2043 | 750,000 | 721,420 | ||
| Build NYC Resource Corp. Rev. (KIPP NYC Public Schools Facilities - Canal West Project), 5.25%, 7/01/2052 | 2,000,000 | 1,917,753 | ||
| Build NYC Resource Corp. Rev. (New World Preparatory Charter School Project), “A”, 4%, 6/15/2031 (n) | 350,000 | 319,647 | ||
| Build NYC Resource Corp. Rev. (New World Preparatory Charter School Project), “A”, 4%, 6/15/2041 (n) | 610,000 | 471,899 | ||
| Build NYC Resource Corp. Rev. (New World Preparatory Charter School Project), “A”, 4%, 6/15/2051 (n) | 1,265,000 | 874,618 | ||
| Build NYC Resource Corp. Rev. (Packer Collegiate Institute Project), 5%, 6/01/2040 | 675,000 | 674,343 | ||
20
Portfolio of Investments (unaudited) –
continued
| Issuer | Shares/Par | Value ($) | ||
| Municipal Bonds – continued | ||||
| Secondary Schools – continued | ||||
| Nassau County, NY, Local Economic Assistance Corp. Education Rev. (Friends of Roosevelt Children's Academy Charter School, Inc. Project), “A”, 5%, 7/01/2055 | $ | 1,000,000 | $880,969 | |
| Rensselaer County, NY, Industrial Development Agency, Civic Facility Rev. (Emma Willard School Refunding Project), 5%, 1/01/2034 | 450,000 | 455,141 | ||
| Rensselaer County, NY, Industrial Development Agency, Civic Facility Rev. (Emma Willard School Refunding Project), 5%, 1/01/2035 | 500,000 | 505,469 | ||
| Rensselaer County, NY, Industrial Development Agency, Civic Facility Rev. (Emma Willard School Refunding Project), 5%, 1/01/2036 | 645,000 | 651,742 | ||
| $10,351,726 | ||||
| Single Family Housing - State – 1.2% | ||||
| New York Mortgage Agency Homeowner Mortgage Rev., “211”, 3.8%, 10/01/2048 | $ | 400,000 | $358,109 | |
| New York Mortgage Agency Homeowner Mortgage Rev., “212”, AMT, 3.7%, 10/01/2033 | 335,000 | 329,925 | ||
| New York Mortgage Agency Homeowner Mortgage Rev., “217”, 3.625%, 4/01/2039 | 355,000 | 343,636 | ||
| New York Mortgage Agency Homeowner Mortgage Rev., “239”, 3.25%, 10/01/2051 | 940,000 | 883,456 | ||
| $1,915,126 | ||||
| State & Local Agencies – 1.8% | ||||
| New York Dormitory Authority Rev., State Personal Income Tax Rev., 3%, 3/15/2050 | $ | 1,225,000 | $822,515 | |
| Yonkers, NY, Industrial Development Agency, School Facility Rev. (New Community School Project), 5%, 5/01/2042 | 2,000,000 | 2,062,752 | ||
| $2,885,267 | ||||
| Tax - Other – 3.9% | ||||
| Chicago, IL, Board of Education, Dedicated Capital Improvement Tax Bond, 5%, 4/01/2045 | $ | 135,000 | $133,258 | |
| Chicago, IL, Board of Education, Dedicated Capital Improvement Tax Bond, 5.75%, 4/01/2048 | 325,000 | 340,241 | ||
| Glen Cove, NY, Local Economic Assistance Corp. (Garvies Point Public Improvement Project), Capital Appreciation, “B”, 0%, 1/01/2045 | 1,970,000 | 475,888 | ||
| Guam Government Limited Obligation Rev., “A”, 5%, 12/01/2036 | 100,000 | 97,615 | ||
| Guam Government Limited Obligation Rev., “A”, 5%, 12/01/2046 | 300,000 | 263,075 | ||
| New York, NY, Transitional Finance Authority Rev., “C-1”, 4%, 5/01/2045 | 1,800,000 | 1,610,769 | ||
| Triborough Bridge & Tunnel Authority Rev., NY, Payroll Mobility Tax (MTA Bridges and Tunnels), “A-1”, 4%, 5/15/2046 | 3,350,000 | 2,958,529 | ||
| Wisconsin Public Finance Authority Limited Obligation PILOT Rev. (American Dream at Meadowlands Project), 7%, 12/01/2050 | 165,000 | 146,812 | ||
| $6,026,187 | ||||
| Tobacco – 2.3% | ||||
| Buckeye, OH, Tobacco Settlement Financing Authority Senior Asset-Backed Refunding, 2020A-2, “1”, 4%, 6/01/2048 | $ | 695,000 | $587,051 | |
| Buckeye, OH, Tobacco Settlement Financing Authority Senior Asset-Backed Refunding, 2020B-2, “2”, 5%, 6/01/2055 | 275,000 | 236,888 | ||
| Golden State, CA, Tobacco Securitization Corp., Tobacco Settlement Rev., Taxable, “B-1”, 3.85%, 6/01/2050 | 750,000 | 680,290 | ||
| New York Counties Tobacco Trust II, 5.625%, 6/01/2035 | 5,000 | 5,091 | ||
| Tobacco Settlement Asset Securitization Corp., NY, “A”, 5%, 6/01/2035 | 1,000,000 | 1,019,795 | ||
| Tobacco Settlement Asset Securitization Corp., NY, “A”, 5%, 6/01/2036 | 1,000,000 | 1,015,535 | ||
| $3,544,650 | ||||
| Toll Roads – 0.2% | ||||
| Texas Private Activity Surface Transportation Corp., Senior Lien Rev. (NTE Mobility Partners Segments 3 LLC Segments 3A & 3B Facility), 7%, 12/31/2038 | $ | 205,000 | $205,390 | |
| Texas Private Activity Surface Transportation Corp., Senior Lien Rev. (NTE Mobility Partners Segments 3 LLC Segments 3A & 3B Facility), 6.75%, 6/30/2043 | 170,000 | 170,272 | ||
| $375,662 | ||||
| Transportation - Special Tax – 7.6% | ||||
| Metropolitan Transportation Authority, NY, Refunding Rev. (Climate Bond Certified), “E”, 5%, 11/15/2033 | $ | 2,000,000 | $2,094,946 | |
| Metropolitan Transportation Authority, NY, Refunding Rev. (Climate Bond Certified), “E”, 4%, 11/15/2045 | 1,340,000 | 1,133,955 | ||
| Metropolitan Transportation Authority, NY, Transportation Rev., “A”, 4%, 11/15/2052 | 3,170,000 | 2,573,424 | ||
| Metropolitan Transportation Authority, NY, Transportation Rev., “A-2”, FLR, 4.364% (67% of SOFR + 0.8%), 11/01/2032 (Put Date 4/01/2026) | 1,500,000 | 1,486,313 | ||
| Metropolitan Transportation Authority, NY, Transportation Rev., “B”, BAM, 5%, 11/15/2052 | 3,100,000 | 3,109,670 | ||
| New Jersey Transportation Trust Fund Authority, “A”, 5%, 12/15/2039 | 185,000 | 189,783 | ||
| New Jersey Transportation Trust Fund Authority, “CC”, 5.5%, 6/15/2050 | 125,000 | 131,702 | ||
| New York Transportation Development Corp., Exempt Facility Rev. (State Thruway Service Areas Project), 4%, 10/31/2046 | 1,000,000 | 817,801 | ||
21
Portfolio of Investments (unaudited) –
continued
| Issuer | Shares/Par | Value ($) | ||
| Municipal Bonds – continued | ||||
| Transportation - Special Tax – continued | ||||
| New York Transportation Development Corp., Exempt Facility Rev. (State Thruway Service Areas Project), 4%, 4/30/2053 | $ | 435,000 | $339,319 | |
| $11,876,913 | ||||
| Universities - Colleges – 6.8% | ||||
| Albany, NY, Capital Resource Corp. Rev. (Albany College of Pharmacy Project), “A”, 5%, 12/01/2033 | $ | 125,000 | $125,216 | |
| Build NYC Resource Corp. Rev. (Albert Einstein School of Medicine, Inc.), 5.5%, 9/01/2045 (n) | 980,000 | 915,433 | ||
| Build NYC Resource Corp. Rev. (Manhattan College Project), 5%, 8/01/2047 | 2,000,000 | 1,910,959 | ||
| Dobbs Ferry, NY, Local Development Corp. (Mercy College Project), 5%, 7/01/2039 | 1,000,000 | 1,003,412 | ||
| Dutchess County, NY, Local Development Corp. Rev. (Vassar College Project), 5%, 7/01/2042 | 1,500,000 | 1,523,483 | ||
| Hempstead, NY, Local Development Corp. Rev. (Hofstra University Project), “A”, 3%, 7/01/2051 | 3,000,000 | 1,900,277 | ||
| Hempstead, NY, Local Development Corp. Rev. (Molloy College Project), 5%, 7/01/2036 | 675,000 | 664,046 | ||
| Hempstead, NY, Local Development Corp. Rev. (Molloy College Project), 5%, 7/01/2038 | 480,000 | 459,556 | ||
| Monroe County, NY, Industrial Development Corp. Rev. (University of Rochester Project), “A”, 5%, 7/01/2037 | 1,000,000 | 1,023,036 | ||
| Oneida County, NY, Local Development Corp. Rev. (Hamilton College Project), 5%, 7/01/2051 | 750,000 | 757,230 | ||
| St. Lawrence County, NY, Industrial Development Agency, Civic Development Corp Rev., (Clarkson University), “B”, 5%, 9/01/2039 | 200,000 | 194,241 | ||
| St. Lawrence County, NY, Industrial Development Agency, Civic Development Corp Rev., (Clarkson University), “B”, 5%, 9/01/2040 | 150,000 | 144,645 | ||
| St. Lawrence County, NY, Industrial Development Agency, Civic Development Corp Rev., (Clarkson University), “B”, 5%, 9/01/2041 | 100,000 | 95,744 | ||
| $10,717,278 | ||||
| Universities - Dormitories – 0.6% | ||||
| Onondaga County, NY, Trust for Cultural Resources Rev. (Abby Lane Housing Corp. Project), 5%, 5/01/2040 | $ | 1,000,000 | $988,859 | |
| Utilities - Municipal Owned – 0.7% | ||||
| Guam Power Authority Rev., “A”, AGM, 5%, 10/01/2039 | $ | 155,000 | $155,373 | |
| Guam Power Authority Rev., “A”, AGM, 5%, 10/01/2044 | 180,000 | 178,068 | ||
| Puerto Rico Electric Power Authority Refunding Rev., “DDD”, 5%, 7/01/2020 (a)(d) | 25,000 | 6,250 | ||
| Puerto Rico Electric Power Authority Refunding Rev., “DDD”, 5%, 7/01/2021 (a)(d) | 265,000 | 66,250 | ||
| Puerto Rico Electric Power Authority Refunding Rev., “DDD”, 5%, 7/01/2022 (a)(d) | 430,000 | 107,500 | ||
| Puerto Rico Electric Power Authority Refunding Rev., “VV”, NPFG, 5.25%, 7/01/2034 | 30,000 | 29,586 | ||
| Puerto Rico Electric Power Authority Rev., “A”, 5%, 7/01/2029 (a)(d) | 675,000 | 168,750 | ||
| Puerto Rico Electric Power Authority Rev., “A”, 5%, 7/01/2042 (a)(d) | 100,000 | 25,000 | ||
| Puerto Rico Electric Power Authority Rev., “AAA”, 5.25%, 7/01/2021 (a)(d) | 50,000 | 12,500 | ||
| Puerto Rico Electric Power Authority Rev., “AAA”, 5.25%, 7/01/2030 (a)(d) | 25,000 | 6,250 | ||
| Puerto Rico Electric Power Authority Rev., “CCC”, 5.25%, 7/01/2027 (a)(d) | 250,000 | 62,500 | ||
| Puerto Rico Electric Power Authority Rev., “TT”, 5%, 7/01/2021 (a)(d) | 115,000 | 28,750 | ||
| Puerto Rico Electric Power Authority Rev., “TT”, 5%, 7/01/2023 (a)(d) | 110,000 | 27,500 | ||
| Puerto Rico Electric Power Authority Rev., “TT”, 5%, 7/01/2027 (a)(d) | 20,000 | 5,000 | ||
| Puerto Rico Electric Power Authority Rev., “TT”, 5%, 7/01/2037 (a)(d) | 345,000 | 86,250 | ||
| Puerto Rico Electric Power Authority Rev., “WW”, 5.375%, 7/01/2022 (a)(d) | 20,000 | 5,000 | ||
| Puerto Rico Electric Power Authority Rev., “WW”, 5.25%, 7/01/2025 (a)(d) | 50,000 | 12,500 | ||
| Puerto Rico Electric Power Authority Rev., “ZZ”, 5%, 7/01/2018 (a)(d) | 170,000 | 42,500 | ||
| Puerto Rico Electric Power Authority Rev., “ZZ”, 5.25%, 7/01/2023 (a)(d) | 180,000 | 45,000 | ||
| Puerto Rico Electric Power Authority Rev., “ZZ”, 5.25%, 7/01/2024 (a)(d) | 55,000 | 13,750 | ||
| Puerto Rico Electric Power Authority Rev., “ZZ”, 5.25%, 7/01/2026 (a)(d) | 170,000 | 42,500 | ||
| Puerto Rico Electric Power Authority Rev., Taxable, “EEE”, 6.05%, 7/01/2032 (a)(d) | 140,000 | 35,000 | ||
| $1,161,777 | ||||
| Utilities - Other – 3.5% | ||||
| Black Belt Energy Gas District, AL, Gas Project Rev. (Project No. 8), “A”, 4%, 12/01/2052 (Put Date 12/01/2029) | $ | 525,000 | $490,360 | |
| Black Belt Energy Gas District, AL, Gas Project Rev., “A”, 4%, 6/01/2051 (Put Date 12/01/2031) | 630,000 | 594,012 | ||
| Black Belt Energy Gas District, AL, Gas Project Rev., “C-1”, 5.25%, 2/01/2053 (Put Date 6/01/2029) | 1,265,000 | 1,283,668 | ||
| California Community Choice Financing Authority, Clean Energy Project Rev., “C”, 5.25%, 1/01/2054 (Put Date 10/01/2031) | 1,210,000 | 1,207,146 | ||
| Public Authority for Colorado Energy Natural Gas Purchase Rev., 6.5%, 11/15/2038 | 1,085,000 | 1,227,368 | ||
| Tennergy Corp., TN, Gas Supply Rev., “A”, 5.5%, 10/01/2053 (Put Date 12/01/2030) | 705,000 | 716,038 | ||
| $5,518,592 | ||||
| Water & Sewer Utility Revenue – 2.5% | ||||
| Great Neck North, NY, Water Authority System Rev., 3%, 11/01/2044 | $ | 1,340,000 | $971,242 | |
| Buffalo, NY, Municipal Water Finance Authority, Water System Rev., “A”, AGM, 4%, 6/30/2046 | 1,500,000 | 1,302,417 | ||
22
Portfolio of Investments (unaudited) –
continued
| Issuer | Shares/Par | Value ($) | ||
| Municipal Bonds – continued | ||||
| Water & Sewer Utility Revenue – continued | ||||
| Guam Waterworks Authority Rev. (Water and Wastewater System), 5%, 7/01/2036 | $ | 215,000 | $214,890 | |
| Guam Waterworks Authority Rev. (Water and Wastewater System), 5%, 7/01/2037 | 270,000 | 265,956 | ||
| Guam Waterworks Authority Rev. (Water and Wastewater System), 5%, 7/01/2040 | 750,000 | 720,950 | ||
| Guam Waterworks Authority Rev. (Water and Wastewater System), “A”, 5%, 1/01/2050 | 345,000 | 319,726 | ||
| Mississippi Development Bank Special Obligation (Jackson Water and Sewer System Rev. Bond Project), AGM, 6.875%, 12/01/2040 | 100,000 | 100,309 | ||
| $3,895,490 | ||||
| Total Municipal Bonds (Identified Cost, $169,098,684) | $152,451,653 | |||
| Bonds – 0.4% | ||||
| Consumer Services – 0.4% | ||||
| Toll Road Investors Partnership II LP, Capital Appreciation, NPFG, 0%, 2/15/2025 (n) | $ | 415,000 | $373,683 | |
| Toll Road Investors Partnership II LP, Capital Appreciation, NPFG, 0%, 2/15/2043 (n) | 945,494 | 310,817 | ||
| Total Bonds (Identified Cost, $749,208) | $684,500 | |||
| Contingent Value Instruments – 0.2% | ||||
| General Obligations - General Purpose – 0.2% | ||||
| Commonwealth of Puerto Rico, General Obligation Contingent Value Instrument, 11/01/2043 (Identified Cost, $305,332) | $ | 514,619 | $266,959 | |
| Investment Companies (h) – 0.9% | ||||
| Money Market Funds – 0.9% | ||||
| MFS Institutional Money Market Portfolio, 5.4% (v) (Identified Cost, $1,393,922) | 1,393,820 | $1,394,099 | ||
| Other Assets, Less Liabilities – 1.3% | 2,008,131 | |||
| Net Assets – 100.0% | $156,805,342 | |||
See Portfolio Footnotes and Notes to
Financial Statements
23
Portfolio of Investments (unaudited) –
continued
MFS North Carolina Municipal
Bond Fund
| Issuer | Shares/Par | Value ($) | ||
| Municipal Bonds – 97.8% | ||||
| Airport Revenue – 9.1% | ||||
| Charlotte, NC, Airport Rev. (Charlotte/Douglas International Airport), “A”, 5%, 7/01/2032 | $ | 1,245,000 | $1,242,261 | |
| Charlotte, NC, Airport Rev. (Charlotte/Douglas International Airport), “A”, 5%, 7/01/2039 | 1,000,000 | 1,033,731 | ||
| Charlotte, NC, Airport Rev. (Charlotte/Douglas International Airport), “A”, 4%, 7/01/2052 | 5,000,000 | 4,374,659 | ||
| Charlotte, NC, Airport Rev. (Charlotte/Douglas International Airport), “B”, 4%, 6/30/2037 | 1,000,000 | 940,038 | ||
| Charlotte, NC, Airport Rev. (Charlotte/Douglas International Airport), “B”, 4%, 7/01/2039 | 1,700,000 | 1,561,586 | ||
| Charlotte, NC, Airport Rev. (Charlotte/Douglas International Airport), “B”, 4%, 7/01/2040 | 2,000,000 | 1,814,529 | ||
| Charlotte, NC, Airport Rev. (Charlotte/Douglas International Airport), “B”, 4%, 7/01/2041 | 1,500,000 | 1,347,279 | ||
| Charlotte, NC, Airport Rev. (Charlotte/Douglas International Airport), “B”, 5%, 7/01/2041 | 2,155,000 | 2,185,977 | ||
| Charlotte, NC, Airport Rev. (Charlotte/Douglas International Airport), “B”, 5%, 7/01/2042 | 1,000,000 | 998,292 | ||
| Charlotte, NC, Airport Rev. (Charlotte/Douglas International Airport), “B”, 5%, 7/01/2042 | 2,300,000 | 2,318,628 | ||
| Charlotte, NC, Airport Rev. (Charlotte/Douglas International Airport), “B”, 5%, 7/01/2047 | 2,000,000 | 1,977,476 | ||
| Charlotte, NC, Airport Rev. (Charlotte/Douglas International Airport), “B”, 5%, 7/01/2049 | 2,500,000 | 2,475,425 | ||
| Greater Asheville Regional Airport Authority Rev., “A”, AGM, 5.5%, 7/01/2052 | 1,500,000 | 1,541,043 | ||
| Greater Ashville, NC, Regional Airport Authority System Rev., AGM, 5.25%, 7/01/2048 | 1,000,000 | 1,010,344 | ||
| Greater Ashville, NC, Regional Airport Authority System Rev., AGM, 5.25%, 7/01/2053 | 4,000,000 | 4,021,943 | ||
| New York Transportation Development Corp. Special Facilities (LaGuardia Airport Terminal B Redevelopment Project), “A”, 5%, 7/01/2034 | 1,275,000 | 1,262,653 | ||
| Raleigh-Durham, NC, Airport Authority Refunding Rev., “A”, 5%, 5/01/2034 | 1,150,000 | 1,195,517 | ||
| Raleigh-Durham, NC, Airport Authority Refunding Rev., “A”, 5%, 5/01/2035 | 1,000,000 | 1,037,366 | ||
| Raleigh-Durham, NC, Airport Authority Refunding Rev., “A”, 5%, 5/01/2036 | 1,000,000 | 1,031,532 | ||
| Raleigh-Durham, NC, Airport Authority Rev., “A”, 5%, 5/01/2036 | 2,000,000 | 2,022,668 | ||
| Raleigh-Durham, NC, Airport Authority Rev., “A”, 5%, 5/01/2037 | 2,000,000 | 2,013,600 | ||
| San Francisco, CA, City & County Airports Commission, International Airport Rev., “B”, 5%, 5/01/2046 | 1,445,000 | 1,439,382 | ||
| Wayne County, MI, Airport Authority Rev. (Detroit Metropolitan Wayne County Airport), “B”, 5%, 12/01/2044 | 175,000 | 172,656 | ||
| Wayne County, MI, Airport Authority Rev. (Detroit Metropolitan Wayne County Airport), “B”, BAM, 5%, 12/01/2039 | 195,000 | 194,989 | ||
| Wayne County, MI, Airport Authority Rev. (Detroit Metropolitan Wayne County Airport), “C”, 5%, 12/01/2039 | 150,000 | 149,675 | ||
| Wayne County, MI, Airport Authority Rev. (Detroit Metropolitan Wayne County Airport), “C”, 5%, 12/01/2044 | 240,000 | 236,479 | ||
| $39,599,728 | ||||
| General Obligations - General Purpose – 5.8% | ||||
| Asheville, NC, General Obligation Refunding, 4%, 6/01/2039 | $ | 295,000 | $279,753 | |
| Asheville, NC, General Obligation Refunding, 4%, 6/01/2041 | 500,000 | 465,294 | ||
| Bridgeview, IL, Stadium and Redevelopment Projects, Taxable, AAC, 5.14%, 12/01/2036 | 1,030,000 | 889,174 | ||
| Cartersville, GA, General Obligation, 2%, 10/01/2040 | 2,190,000 | 1,377,548 | ||
| Chicago, IL, General Obligation, “A”, 5.5%, 1/01/2035 | 235,000 | 244,599 | ||
| Chicago, IL, General Obligation, “A”, 5.5%, 1/01/2040 | 1,655,000 | 1,693,497 | ||
| Chicago, IL, General Obligation, “F”, 5.5%, 1/01/2042 | 665,000 | 659,324 | ||
| Commonwealth of Puerto Rico, General Obligation Restructured Bonds, Capital Appreciation, Series 2022A, 0%, 7/01/2024 | 30,211 | 29,184 | ||
| Commonwealth of Puerto Rico, General Obligation Restructured Bonds, Capital Appreciation, Series 2022A, 0%, 7/01/2033 | 239,000 | 140,858 | ||
| Commonwealth of Puerto Rico, General Obligation Restructured Bonds, Series 2022A, 5.625%, 7/01/2027 | 204,963 | 210,326 | ||
| Commonwealth of Puerto Rico, General Obligation Restructured Bonds, Series 2022A, 5.625%, 7/01/2029 | 201,638 | 208,354 | ||
| Commonwealth of Puerto Rico, General Obligation Restructured Bonds, Series 2022A, 5.75%, 7/01/2031 | 554,850 | 579,442 | ||
| Commonwealth of Puerto Rico, General Obligation Restructured Bonds, Series 2022A, 4%, 7/01/2033 | 185,717 | 166,465 | ||
| Commonwealth of Puerto Rico, General Obligation Restructured Bonds, Series 2022A, 4%, 7/01/2035 | 344,225 | 299,149 | ||
| Commonwealth of Puerto Rico, General Obligation Restructured Bonds, Series 2022A, 4%, 7/01/2037 | 143,274 | 120,269 | ||
| Commonwealth of Puerto Rico, General Obligation Restructured Bonds, Series 2022A, 4%, 7/01/2041 | 194,798 | 156,620 | ||
| Commonwealth of Puerto Rico, General Obligation Restructured Bonds, Series 2022A, 4%, 7/01/2046 | 680,587 | 524,719 | ||
| Durham County, NC, General Obligation Refunding, 4%, 6/01/2036 | 500,000 | 492,022 | ||
| Durham County, NC, General Obligation Refunding, 4%, 6/01/2037 | 450,000 | 438,358 | ||
| Durham County, NC, General Obligation Refunding, 4%, 6/01/2039 | 650,000 | 613,848 | ||
| Forsyth, NC, General Obligation, “A”, 4%, 4/01/2034 | 5,100,000 | 5,149,549 | ||
| Gaston County, NC, Rev., 5%, 4/01/2035 | 610,000 | 648,713 | ||
| Granville County, NC, 5%, 10/01/2034 | 675,000 | 710,732 | ||
| Granville County, NC, 5%, 10/01/2035 | 690,000 | 723,515 | ||
| Howard County, MD, Metropolitan District Project, “B”, 3%, 8/15/2051 | 4,000,000 | 2,719,622 | ||
| Lee County, NC, Limited Obligation, 3.25%, 5/01/2035 | 1,000,000 | 893,874 | ||
| Lee County, NC, Limited Obligation, 4%, 5/01/2037 | 855,000 | 810,110 | ||
| Randolph County, NC, 4%, 10/01/2037 | 1,045,000 | 979,391 | ||
24
Portfolio of Investments (unaudited) –
continued
| Issuer | Shares/Par | Value ($) | ||
| Municipal Bonds – continued | ||||
| General Obligations - General Purpose – continued | ||||
| State of Illinois, General Obligation, 5.5%, 5/01/2039 | $ | 375,000 | $391,231 | |
| State of Illinois, General Obligation, 5.75%, 5/01/2045 | 350,000 | 364,883 | ||
| State of Illinois, General Obligation, “C”, 4%, 10/01/2040 | 1,065,000 | 931,917 | ||
| State of Illinois, General Obligation, “C”, 4%, 10/01/2041 | 665,000 | 575,827 | ||
| Texas Cedar Port Navigation & Improvement District, Unlimited Tax, 4.5%, 8/31/2048 | 460,000 | 415,226 | ||
| Texas Cedar Port Navigation & Improvement District, Unlimited Tax, 4.5%, 8/31/2052 | 185,000 | 164,823 | ||
| $25,068,216 | ||||
| General Obligations - Schools – 0.3% | ||||
| Chicago, IL, Board of Education, Unlimited Tax General Obligation Dedicated Rev., “A”, 4%, 12/01/2047 | $ | 1,510,000 | $1,172,993 | |
| Healthcare Revenue - Hospitals – 11.6% | ||||
| Allegheny County, PA, Hospital Development Authority Rev. (Allegheny Health Network Obligated Group), “A”, 4%, 4/01/2044 | $ | 555,000 | $450,640 | |
| Charlotte-Mecklenburg, NC, Hospital Authority Health Care System Rev. (Atrium Health), “D”, 5%, 1/15/2049 (Put Date 12/01/2031) | 3,910,000 | 4,208,119 | ||
| Charlotte-Mecklenburg, NC, Hospital Authority Health Care System Rev. (Carolinas Health Care System), “A”, 5%, 1/15/2036 | 3,000,000 | 3,101,950 | ||
| Charlotte-Mecklenburg, NC, Hospital Authority Health Care System Rev. (Carolinas Health Care System), “A”, 5%, 1/15/2040 | 3,000,000 | 3,014,039 | ||
| Harris County, TX, Cultural Education Facilities Finance Corp., Hospital Rev. (Memorial Hermann Health System), “A”, 4.125%, 7/01/2052 | 2,480,000 | 2,109,234 | ||
| New Hanover County, NC, Hospital Rev. (New Hanover Regional Medical Center), 5%, 10/01/2036 (Prerefunded 10/01/2027) | 1,500,000 | 1,579,163 | ||
| New Hanover County, NC, Hospital Rev. (New Hanover Regional Medical Center), 5%, 10/01/2047 (Prerefunded 10/01/2027) | 2,425,000 | 2,552,979 | ||
| New York Dormitory Authority Rev. (Norwell Health Obligated Group), “A”, 4.25%, 5/01/2052 | 4,685,000 | 4,037,422 | ||
| North Carolina Medical Care Commission, Health Care Facilities Rev. (Novant Health Obligated Group), “A”, 4%, 11/01/2052 | 5,000,000 | 4,356,704 | ||
| North Carolina Medical Care Commission, Health Care Facilities Rev. (Rex Healthcare), “A”, 5%, 7/01/2032 | 600,000 | 627,583 | ||
| North Carolina Medical Care Commission, Health Care Facilities Rev. (Rex Healthcare), “A”, 5%, 7/01/2033 | 255,000 | 266,507 | ||
| North Carolina Medical Care Commission, Health Care Facilities Rev. (Rex Healthcare), “A”, 4%, 7/01/2049 | 5,000,000 | 4,144,331 | ||
| North Carolina Medical Care Commission, Health Care Facilities Rev. (Vidant Health), 5%, 6/01/2031 (Prerefunded 6/01/2025) | 2,800,000 | 2,856,725 | ||
| North Carolina Medical Care Commission, Health Care Facilities Rev. (Vidant Health), 5%, 6/01/2033 (Prerefunded 6/01/2025) | 3,000,000 | 3,060,777 | ||
| North Carolina Medical Care Commission, Health Care Facilities Rev. (Vidant Health), 5%, 6/01/2045 | 2,500,000 | 2,410,380 | ||
| North Carolina Medical Care Commission, Health Care Facilities Rev. (Wake Forest Baptist Obligated Group), “A”, 5%, 12/01/2033 | 1,000,000 | 1,038,563 | ||
| Spartanburg County, SC, Regional Health Services District Hospital Rev., “A”, 4%, 4/15/2043 | 1,580,000 | 1,339,091 | ||
| Surry County, NC, Northern Hospital District, Health Care Facilities Rev., 5%, 10/01/2027 | 150,000 | 149,782 | ||
| Surry County, NC, Northern Hospital District, Health Care Facilities Rev., 5%, 10/01/2035 | 1,515,000 | 1,433,181 | ||
| Surry County, NC, Northern Hospital District, Health Care Facilities Rev., 5%, 10/01/2038 | 1,065,000 | 949,646 | ||
| University of North Carolina, Hospitals at Chapel Hill Rev., 5%, 2/01/2046 | 6,500,000 | 6,515,272 | ||
| $50,202,088 | ||||
| Healthcare Revenue - Long Term Care – 6.8% | ||||
| North Carolina Medical Care Commission, Health Care Facilities First Mortgage Rev. (Deerfield Episcopal Retirement Community), 5%, 11/01/2037 | $ | 2,750,000 | $2,727,143 | |
| North Carolina Medical Care Commission, Health Care Facilities First Mortgage Rev. (Lutheran Services for the Aging), “C”, 4%, 3/01/2036 | 1,000,000 | 813,691 | ||
| North Carolina Medical Care Commission, Health Care Facilities First Mortgage Rev. (Lutheran Services for the Aging), “C”, 4%, 3/01/2042 | 2,000,000 | 1,453,815 | ||
| North Carolina Medical Care Commission, Health Care Facilities First Mortgage Rev. (Pennybyrn at Maryfield), 5%, 10/01/2035 | 1,500,000 | 1,394,857 | ||
| North Carolina Medical Care Commission, Health Care Facilities First Mortgage Rev. (Presbyterian Homes Obligated Group), 5%, 10/01/2031 | 1,000,000 | 1,009,398 | ||
| North Carolina Medical Care Commission, Health Care Facilities First Mortgage Rev. (Presbyterian Homes Obligated Group), 5%, 10/01/2036 | 800,000 | 801,759 | ||
| North Carolina Medical Care Commission, Health Care Facilities First Mortgage Rev. (Presbyterian Homes Obligated Group), “A”, 5%, 10/01/2050 | 2,000,000 | 1,868,184 | ||
| North Carolina Medical Care Commission, Retirement Facilities First Mortgage Refunding Rev. (Plantation Village, Inc.), “A”, 4%, 1/01/2052 | 3,000,000 | 2,140,518 | ||
| North Carolina Medical Care Commission, Retirement Facilities First Mortgage Rev. (Aldersgate), 5%, 7/01/2045 | 1,000,000 | 741,498 | ||
| North Carolina Medical Care Commission, Retirement Facilities First Mortgage Rev. (Aldersgate), “A”, 5%, 7/01/2047 | 1,000,000 | 727,186 | ||
| North Carolina Medical Care Commission, Retirement Facilities First Mortgage Rev. (Carolina Village Project), “B”, 5%, 4/01/2047 | 2,000,000 | 1,584,537 | ||
| North Carolina Medical Care Commission, Retirement Facilities First Mortgage Rev. (Forest at Duke Project), 4%, 9/01/2033 | 180,000 | 165,397 | ||
| North Carolina Medical Care Commission, Retirement Facilities First Mortgage Rev. (Forest at Duke Project), 4%, 9/01/2034 | 185,000 | 168,125 | ||
| North Carolina Medical Care Commission, Retirement Facilities First Mortgage Rev. (Forest at Duke Project), 4%, 9/01/2041 | 830,000 | 666,476 | ||
| North Carolina Medical Care Commission, Retirement Facilities First Mortgage Rev. (Forest at Duke Project), 4%, 9/01/2046 | 715,000 | 543,265 | ||
25
Portfolio of Investments (unaudited) –
continued
| Issuer | Shares/Par | Value ($) | ||
| Municipal Bonds – continued | ||||
| Healthcare Revenue - Long Term Care – continued | ||||
| North Carolina Medical Care Commission, Retirement Facilities First Mortgage Rev. (Forest at Duke Project), 4%, 9/01/2051 | $ | 1,100,000 | $801,350 | |
| North Carolina Medical Care Commission, Retirement Facilities First Mortgage Rev. (Friends Homes, Inc.), “A”, 4%, 9/01/2040 | 2,000,000 | 1,551,750 | ||
| North Carolina Medical Care Commission, Retirement Facilities First Mortgage Rev. (Galloway Ridge), “A”, 5%, 1/01/2039 | 1,225,000 | 1,074,664 | ||
| North Carolina Medical Care Commission, Retirement Facilities First Mortgage Rev. (Pennybyrn at Maryfield Project), “A”, 5%, 10/01/2050 | 1,500,000 | 1,213,790 | ||
| North Carolina Medical Care Commission, Retirement Facilities First Mortgage Rev. (Salemtowne Project), 5.25%, 10/01/2037 | 1,500,000 | 1,330,642 | ||
| North Carolina Medical Care Commission, Retirement Facilities First Mortgage Rev. (Sharon Towers), “A”, 5%, 7/01/2049 | 2,000,000 | 1,608,159 | ||
| North Carolina Medical Care Commission, Retirement Facilities First Mortgage Rev. (Southminster), 5%, 10/01/2031 | 800,000 | 775,402 | ||
| North Carolina Medical Care Commission, Retirement Facilities First Mortgage Rev. (Southminster), 5%, 10/01/2037 | 2,200,000 | 1,989,769 | ||
| North Carolina Medical Care Commission, Retirement Facilities First Mortgage Rev. (United Church Homes and Services), “A”, 5%, 9/01/2037 (Prerefunded 9/01/2024) | 1,500,000 | 1,515,432 | ||
| North Carolina Medical Care Commission, Retirement Facilities First Mortgage Rev. (United Methodist Retirement Homes), “A”, 5%, 10/01/2035 | 1,000,000 | 979,694 | ||
| $29,646,501 | ||||
| Human Services – 0.2% | ||||
| North Carolina Capital Facilities Finance Agency Rev. (Arc of North Carolina Projects), “A”, 5%, 10/01/2034 | $ | 1,000,000 | $953,599 | |
| Industrial Revenue - Other – 0.2% | ||||
| Port Beaumont, TX, Navigation District, Dock & Wharf Facility Rev. (Jefferson Gulf Coast Energy Project), “A”, 3.625%, 1/01/2035 (n) | $ | 600,000 | $463,844 | |
| Port Beaumont, TX, Navigation District, Dock & Wharf Facility Rev. (Jefferson Gulf Coast Energy Project), “A”, 2.875%, 1/01/2041 (n) | 510,000 | 316,837 | ||
| $780,681 | ||||
| Miscellaneous Revenue - Other – 1.6% | ||||
| Durham County, NC, Industrial Facilities & Pollution Control Financing Authority Rev. (Research Triangle Institute), 5%, 2/01/2025 | $ | 1,000,000 | $1,013,881 | |
| Durham County, NC, Limited Obligation, “A”, 5%, 6/01/2041 | 1,000,000 | 1,060,287 | ||
| Durham County, NC, Limited Obligation, “A”, 5%, 6/01/2042 | 1,000,000 | 1,055,332 | ||
| Durham County, NC, Limited Obligation, “A”, 5%, 6/01/2043 | 875,000 | 921,525 | ||
| Matching Fund Special Purpose Securitization Corp., “A”, 5%, 10/01/2026 | 190,000 | 190,724 | ||
| New York Liberty Development Corp., Liberty Rev. (3 World Trade Center Project), “1”, 5%, 11/15/2044 (n) | 1,130,000 | 1,043,944 | ||
| Pennsylvania Economic Development Financing Authority, Private Activity Rev. (PennDOT Major Bridges Package One Project), AGM, 5%, 12/31/2057 | 1,690,000 | 1,627,840 | ||
| $6,913,533 | ||||
| Multi-Family Housing Revenue – 0.7% | ||||
| New Hampshire National Finance Authority Municipal Certificates, “1-A”, 4.375%, 9/20/2036 | $ | 1,313,147 | $1,215,955 | |
| New Mexico Mortgage Finance Authority, Multifamily Housing Rev. (Mountain View II & III Apartments Project), HUD Section 8, 5%, 2/01/2042 (Put Date 9/01/2025) | 675,000 | 679,930 | ||
| New Mexico Mortgage Finance Authority, Multifamily Housing Rev. (Santa Fe Apartment & Sangre de Cristo Project), HUD Section 8, 5%, 2/01/2042 (Put Date 6/01/2025) | 1,070,000 | 1,075,063 | ||
| Puerto Rico Housing Finance Authority, Multi-Family Housing Collateralized Rev. (Mirador Las Casas Project), “B”, 5%, 3/01/2027 (Put Date 3/01/2026) | 240,000 | 244,807 | ||
| $3,215,755 | ||||
| Sales & Excise Tax Revenue – 2.7% | ||||
| Guam Government Business Privilege Tax Refunding, “F”, 5%, 1/01/2030 | $ | 25,000 | $24,925 | |
| Guam Government Business Privilege Tax Refunding, “F”, 5%, 1/01/2031 | 35,000 | 34,772 | ||
| Guam Government Business Privilege Tax Refunding, “F”, 4%, 1/01/2042 | 350,000 | 283,250 | ||
| Guam Government Business Privilege Tax Rev., “D”, 5%, 11/15/2031 | 1,295,000 | 1,276,321 | ||
| Puerto Rico Sales Tax Financing Corp., Restructured Sales Tax Rev., “2019A-1”, 4.55%, 7/01/2040 | 105,000 | 96,608 | ||
| Puerto Rico Sales Tax Financing Corp., Restructured Sales Tax Rev., “2019A-1”, 4.75%, 7/01/2053 | 336,000 | 297,045 | ||
| Puerto Rico Sales Tax Financing Corp., Restructured Sales Tax Rev., “2019A-1”, 5%, 7/01/2058 | 3,212,000 | 2,905,522 | ||
| Puerto Rico Sales Tax Financing Corp., Restructured Sales Tax Rev., “2019A-2”, 4.329%, 7/01/2040 | 635,000 | 568,746 | ||
| Puerto Rico Sales Tax Financing Corp., Restructured Sales Tax Rev., “2019A-2”, 4.329%, 7/01/2040 | 348,000 | 311,691 | ||
| Puerto Rico Sales Tax Financing Corp., Restructured Sales Tax Rev., “2019A-2”, 4.536%, 7/01/2053 | 9,000 | 7,677 | ||
| Puerto Rico Sales Tax Financing Corp., Restructured Sales Tax Rev., “2019A-2”, 4.784%, 7/01/2058 | 154,000 | 134,418 | ||
| Puerto Rico Sales Tax Financing Corp., Restructured Sales Tax Rev., Capital Appreciation, “2019A-1”, 0%, 7/01/2024 | 7,000 | 6,776 | ||
| Puerto Rico Sales Tax Financing Corp., Restructured Sales Tax Rev., Capital Appreciation, “2019A-1”, 0%, 7/01/2027 | 174,000 | 148,159 | ||
| Puerto Rico Sales Tax Financing Corp., Restructured Sales Tax Rev., Capital Appreciation, “2019A-1”, 0%, 7/01/2029 | 31,000 | 24,104 | ||
26
Portfolio of Investments (unaudited) –
continued
| Issuer | Shares/Par | Value ($) | ||
| Municipal Bonds – continued | ||||
| Sales & Excise Tax Revenue – continued | ||||
| Puerto Rico Sales Tax Financing Corp., Restructured Sales Tax Rev., Capital Appreciation, “2019A-1”, 0%, 7/01/2031 | $ | 1,584,000 | $1,122,149 | |
| Puerto Rico Sales Tax Financing Corp., Restructured Sales Tax Rev., Capital Appreciation, “2019A-1”, 0%, 7/01/2033 | 1,515,000 | 970,736 | ||
| Puerto Rico Sales Tax Financing Corp., Restructured Sales Tax Rev., Capital Appreciation, “2019A-1”, 0%, 7/01/2046 | 9,954,000 | 2,566,024 | ||
| Wisconsin Public Finance Authority Limited Obligation Grant Rev. (American Dream at Meadowlands Project), “A”, 6.25%, 8/01/2027 (a)(d)(n) | 880,000 | 672,100 | ||
| Wisconsin Public Finance Authority Limited Obligation Grant Rev., Taxable (American Dream at Meadowlands Project), ”A“, 5.625%, 8/01/2024 (a)(d)(n) | 485,000 | 370,419 | ||
| $11,821,442 | ||||
| Secondary Schools – 0.1% | ||||
| District of Columbia Rev. (Rocketship D.C.), “A”, 5%, 6/01/2056 (n) | $ | 430,000 | $346,436 | |
| Single Family Housing - State – 7.5% | ||||
| Connecticut Housing Finance Authority Rev. (Housing Mortgage Finance Program), “C-1”, 4%, 11/15/2047 | $ | 780,000 | $768,289 | |
| North Carolina Housing Finance Agency, Home Ownership Refunding Rev., “45”, GNMA, 3%, 7/01/2051 | 2,295,000 | 2,168,859 | ||
| North Carolina Housing Finance Agency, Home Ownership Rev., “41”, FNMA, 3.55%, 7/01/2044 | 1,290,000 | 1,135,264 | ||
| North Carolina Housing Finance Agency, Home Ownership Rev., “43”, GNMA, 2.95%, 7/01/2043 | 2,740,000 | 1,992,713 | ||
| North Carolina Housing Finance Agency, Home Ownership Rev., “44”, 4%, 7/01/2050 | 3,670,000 | 3,577,501 | ||
| North Carolina Housing Finance Agency, Home Ownership Rev., “48”, 3.75%, 7/01/2052 | 3,395,000 | 3,262,568 | ||
| North Carolina Housing Finance Agency, Home Ownership Rev., “49”, 4.875%, 7/01/2042 | 1,200,000 | 1,185,224 | ||
| North Carolina Housing Finance Agency, Home Ownership Rev., “49”, GNMA, 5%, 7/01/2047 | 4,990,000 | 4,917,291 | ||
| North Carolina Housing Finance Agency, Home Ownership Rev., “49”, GNMA, 6%, 7/01/2053 | 1,495,000 | 1,561,200 | ||
| North Carolina Housing Finance Agency, Home Ownership Rev., “50”, GNMA, 5.5%, 1/01/2054 | 5,000,000 | 5,149,744 | ||
| North Carolina Housing Finance Agency, Home Ownership Rev., “51”, 4.5%, 1/01/2048 | 3,000,000 | 2,719,694 | ||
| North Carolina Housing Finance Agency, Home Ownership Rev., “51”, 5.75%, 1/01/2054 | 4,000,000 | 4,158,553 | ||
| $32,596,900 | ||||
| State & Local Agencies – 16.7% | ||||
| Buncombe County, NC, Limited Obligation, 4%, 6/01/2034 | $ | 1,700,000 | $1,690,483 | |
| Buncombe County, NC, Limited Obligation, 4%, 6/01/2035 | 1,465,000 | 1,446,369 | ||
| Cabarrus County, NC, Limited Obligation, 4%, 6/01/2034 | 1,000,000 | 981,667 | ||
| Charlotte, NC, Convention Facility Projects, COP, “A”, 4%, 6/01/2049 | 2,500,000 | 2,210,774 | ||
| Charlotte, NC, COP, 5%, 12/01/2034 | 1,000,000 | 1,061,430 | ||
| Charlotte, NC, COP, 5%, 12/01/2035 | 2,000,000 | 2,113,053 | ||
| Charlotte, NC, COP, 3%, 6/01/2048 | 4,425,000 | 3,075,481 | ||
| Charlotte, NC, COP (Government Facilities), “G”, VRDN, 3.15%, 5/31/2033 | 4,600,000 | 4,600,000 | ||
| Charlotte, NC, Cultural Arts Facilities, COP, “B”, 4%, 6/01/2039 | 2,250,000 | 2,146,564 | ||
| Charlotte, NC, NASCAR Hall of Fame Public Facilities, COP, “C”, 4%, 6/01/2038 | 4,500,000 | 4,274,038 | ||
| Charlotte, NC, NASCAR Hall of Fame Public Facilities, COP, “C”, 3%, 6/01/2039 | 3,000,000 | 2,362,478 | ||
| Charlotte, NC, Refunding COP (Transit Projects Phase II), “B”, 5%, 6/01/2026 | 1,250,000 | 1,273,054 | ||
| Chatham County, NC, Limited Obligation, 4%, 11/01/2037 | 1,750,000 | 1,692,607 | ||
| Durham County, NC, Financing Corp. Limited Obligation, 4%, 10/01/2034 | 2,000,000 | 1,986,722 | ||
| Durham County, NC, Financing Corp. Limited Obligation, 4%, 10/01/2035 | 1,240,000 | 1,220,301 | ||
| Durham County, NC, Financing Corp. Limited Obligation, 4%, 10/01/2036 | 1,375,000 | 1,340,997 | ||
| Durham County, NC, Limited Obligation, 4%, 4/01/2035 | 1,270,000 | 1,255,875 | ||
| Durham County, NC, Limited Obligation, 4%, 4/01/2037 | 3,000,000 | 2,915,076 | ||
| Durham County, NC, Limited Obligation, 4.5%, 10/01/2042 (w) | 2,400,000 | 2,371,752 | ||
| Durham County, NC, Limited Obligation, 4.5%, 10/01/2043 (w) | 2,000,000 | 1,968,840 | ||
| Mecklenburg County, NC, School General Obligation, 5%, 9/01/2024 | 1,250,000 | 1,263,867 | ||
| Mooresville, NC, Limited Obligation, “A”, 3%, 10/01/2036 | 350,000 | 291,175 | ||
| North Carolina Turnpike Authority Refunding Rev., (Monroe Expressway System), 5%, 7/01/2038 | 1,250,000 | 1,326,273 | ||
| North Carolina Turnpike Authority Refunding Rev., (Monroe Expressway System), 5%, 7/01/2041 | 1,795,000 | 1,885,049 | ||
| North Carolina Turnpike Authority, Triangle Expressway System Appropriation Refunding Rev., “A”, 4%, 1/01/2034 | 2,555,000 | 2,543,891 | ||
| North Carolina Turnpike Authority, Triangle Expressway System Appropriation Rev., Capital Appreciation, 0%, 1/01/2043 | 3,500,000 | 1,320,393 | ||
| North Carolina Turnpike Authority, Triangle Expressway System Appropriation Rev., Capital Appreciation, 0%, 1/01/2046 | 2,035,000 | 639,976 | ||
| Onslow County, NC, Limited Obligation, 4%, 12/01/2040 | 500,000 | 466,048 | ||
| Onslow County, NC, Limited Obligation, 4%, 12/01/2041 | 1,035,000 | 955,983 | ||
| Onslow County, NC, Limited Obligation, 4%, 12/01/2042 | 500,000 | 456,647 | ||
| Onslow County, NC, Limited Obligation, 4%, 12/01/2043 | 425,000 | 386,925 | ||
27
Portfolio of Investments (unaudited) –
continued
| Issuer | Shares/Par | Value ($) | ||
| Municipal Bonds – continued | ||||
| State & Local Agencies – continued | ||||
| Pennsylvania Public School Building Authority, School Lease Rev. (School District of Philadelphia Project), “A”, AGM, 5%, 6/01/2033 | $ | 2,530,000 | $2,594,466 | |
| Raleigh, NC, COP (Downtown Improvement Projects), “B-1”, VRDN, 3.05%, 1/31/2034 | 1,100,000 | 1,100,000 | ||
| Scotland County, NC, Limited Obligation, 5%, 12/01/2033 | 210,000 | 219,206 | ||
| Scotland County, NC, Limited Obligation, 5%, 12/01/2034 | 1,000,000 | 1,043,265 | ||
| State of North Carolina, Limited Obligation, “A”, 5%, 5/01/2033 | 2,500,000 | 2,757,724 | ||
| State of North Carolina, Limited Obligation, “A”, 5%, 5/01/2034 | 2,500,000 | 2,753,908 | ||
| Wake County, NC, Limited Obligation, “A”, 4%, 8/01/2037 | 3,000,000 | 2,908,584 | ||
| Wake County, NC, Limited Obligation, “A”, 5%, 4/01/2040 | 1,825,000 | 1,943,879 | ||
| Wake County, NC, Limited Obligation, “A”, 5%, 4/01/2041 | 1,625,000 | 1,721,678 | ||
| Wake County, NC, Limited Obligation, “B”, 5%, 4/01/2041 | 1,765,000 | 1,870,008 | ||
| $72,436,506 | ||||
| Student Loan Revenue – 1.2% | ||||
| New Jersey Higher Education Student Assistance Authority, Senior Student Loan Rev., “B”, 4%, 12/01/2041 | $ | 2,305,000 | $2,180,387 | |
| North Carolina Education Assistance Authority, Student Loan Rev., “A”, 5%, 6/01/2027 | 550,000 | 563,231 | ||
| North Carolina Education Assistance Authority, Tax-Exempt Student Loan Rev., “A”, 5%, 6/01/2028 | 1,000,000 | 1,030,384 | ||
| North Carolina Education Assistance Authority, Tax-Exempt Student Loan Rev., “A”, 5%, 6/01/2029 | 700,000 | 723,968 | ||
| North Carolina Education Assistance Authority, Tax-Exempt Student Loan Rev., “A”, 3.125%, 6/01/2039 | 720,000 | 664,915 | ||
| $5,162,885 | ||||
| Tax - Other – 1.1% | ||||
| Chicago, IL, Board of Education, Dedicated Capital Improvement Tax Bond, 5%, 4/01/2045 | $ | 285,000 | $281,322 | |
| Chicago, IL, Board of Education, Dedicated Capital Improvement Tax Bond, 5.75%, 4/01/2048 | 670,000 | 701,420 | ||
| New York, NY, Transitional Finance Authority Rev., “C-1”, 4%, 5/01/2045 | 3,715,000 | 3,324,448 | ||
| Wisconsin Public Finance Authority Limited Obligation PILOT Rev. (American Dream at Meadowlands Project), 7%, 12/01/2050 | 305,000 | 271,379 | ||
| $4,578,569 | ||||
| Tax Assessment – 0.2% | ||||
| Mooresville, NC, Special Assessment Rev., 5.375%, 3/01/2040 (n) | $ | 1,000,000 | $877,718 | |
| Tobacco – 0.8% | ||||
| Buckeye, OH, Tobacco Settlement Financing Authority Senior Asset-Backed Refunding, 2020A-2, “1”, 4%, 6/01/2048 | $ | 1,455,000 | $1,229,007 | |
| Buckeye, OH, Tobacco Settlement Financing Authority Senior Asset-Backed Refunding, 2020B-2, “2”, 5%, 6/01/2055 | 1,030,000 | 887,252 | ||
| Golden State, CA, Tobacco Securitization Corp., Tobacco Settlement Rev., Taxable, “B-1”, 3.85%, 6/01/2050 | 1,565,000 | 1,419,539 | ||
| $3,535,798 | ||||
| Toll Roads – 3.4% | ||||
| North Carolina Turnpike Authority, Monroe Expressway Toll Rev., “A”, 5%, 7/01/2047 | $ | 2,000,000 | $1,955,889 | |
| North Carolina Turnpike Authority, Triangle Expressway System Rev., 5%, 1/01/2040 | 2,000,000 | 2,021,679 | ||
| North Carolina Turnpike Authority, Triangle Expressway System Rev., AGM, 5%, 1/01/2038 | 3,000,000 | 3,057,602 | ||
| North Carolina Turnpike Authority, Triangle Expressway System Senior Lien Refunding Rev., AGM, 5%, 1/01/2036 | 1,975,000 | 2,042,480 | ||
| North Carolina Turnpike Authority, Triangle Expressway System Senior Lien Rev., 5%, 1/01/2032 | 1,150,000 | 1,178,978 | ||
| North Carolina Turnpike Authority, Triangle Expressway System Senior Lien Rev., AGM, 5%, 1/01/2039 | 2,600,000 | 2,623,877 | ||
| Texas Private Activity Surface Transportation Corp., Senior Lien Rev. (NTE Mobility Partners Segments 3 LLC Segments 3A & 3B Facility), 7%, 12/31/2038 | 435,000 | 435,826 | ||
| Texas Private Activity Surface Transportation Corp., Senior Lien Rev. (NTE Mobility Partners Segments 3 LLC Segments 3A & 3B Facility), 6.75%, 6/30/2043 | 350,000 | 350,560 | ||
| Virginia Small Business Financing Authority Senior Lien Rev. (Elizabeth River Crossings Opco LLC Project), 3%, 1/01/2041 | 1,505,000 | 1,083,475 | ||
| $14,750,366 | ||||
| Transportation - Special Tax – 1.6% | ||||
| Metropolitan Transportation Authority, NY, Refunding Rev. (Climate Bond Certified), “E”, 4%, 11/15/2045 | $ | 2,605,000 | $2,204,443 | |
| New Jersey Transportation Trust Fund Authority, “A”, 5%, 12/15/2039 | 260,000 | 266,721 | ||
| New Jersey Transportation Trust Fund Authority, “CC”, 5.5%, 6/15/2050 | 250,000 | 263,405 | ||
| North Carolina Department of State Treasurer, Grant Anticipation Rev., 4%, 3/01/2034 | 2,000,000 | 2,011,826 | ||
| North Carolina Department of State Treasurer, Grant Anticipation Rev., 4%, 3/01/2035 | 2,000,000 | 1,997,287 | ||
| $6,743,682 | ||||
28
Portfolio of Investments (unaudited) –
continued
| Issuer | Shares/Par | Value ($) | ||
| Municipal Bonds – continued | ||||
| Universities - Colleges – 14.1% | ||||
| Appalachian State University, Millennial Campus Rev. (End Zone Project), 5%, 5/01/2044 | $ | 3,000,000 | $3,048,923 | |
| Elizabeth City, NC, State University General Rev., AGM, 5%, 4/01/2040 | 3,155,000 | 3,184,981 | ||
| North Carolina Agricultural & Technical University Rev., “A”, 5%, 10/01/2035 | 3,075,000 | 3,103,839 | ||
| North Carolina Capital Facilities Finance Agency Refunding Rev. (Duke University), “B”, 5%, 10/01/2044 | 4,955,000 | 5,042,568 | ||
| North Carolina Capital Facilities Finance Agency Rev. (Duke University), “B”, ETM, 5%, 10/01/2055 (Prerefunded 10/01/2025) | 1,120,000 | 1,146,605 | ||
| North Carolina Capital Facilities Finance Agency, Educational Facilities Rev. (Meredith College), 4%, 6/01/2034 | 1,370,000 | 1,294,115 | ||
| North Carolina Central University Rev., 5%, 4/01/2044 | 3,265,000 | 3,192,454 | ||
| North Carolina State University, Raleigh General Refunding Rev., 5%, 10/01/2023 | 1,200,000 | 1,200,000 | ||
| North Carolina State University, Raleigh General Rev., “A”, 5%, 10/01/2035 | 1,180,000 | 1,262,237 | ||
| Puerto Rico Industrial, Tourist, Educational, Medical & Environmental Control Facilities Financing Authority, Higher Education Rev. (University of Sacred Heart), 4.375%, 10/01/2031 | 115,000 | 115,086 | ||
| Puerto Rico Industrial, Tourist, Educational, Medical & Environmental Control Facilities Financing Authority, Higher Education Rev. (University of Sacred Heart), 5%, 10/01/2042 | 140,000 | 140,271 | ||
| Red River, TX, Education Finance Corp., Higher Education Rev. (Houston Baptist University Project), 5.5%, 10/01/2046 | 735,000 | 722,881 | ||
| University of North Carolina Board of Governors Rev., 4%, 4/01/2049 | 5,000,000 | 4,024,460 | ||
| University of North Carolina, Ashville, Rev., 4%, 6/01/2039 | 1,450,000 | 1,326,145 | ||
| University of North Carolina, Charlotte, Rev., 5%, 4/01/2043 (Prerefunded 4/01/2024) | 1,715,000 | 1,724,447 | ||
| University of North Carolina, Charlotte, Rev., “A”, 5%, 10/01/2038 | 1,110,000 | 1,152,889 | ||
| University of North Carolina, Charlotte, Rev., “A”, 4%, 10/01/2045 | 4,415,000 | 3,923,792 | ||
| University of North Carolina, Greensboro, Refunding Rev., 4%, 4/01/2036 | 1,750,000 | 1,673,814 | ||
| University of North Carolina, Greensboro, Rev., 4%, 4/01/2034 | 1,000,000 | 982,363 | ||
| University of North Carolina, Greensboro, Rev., 4%, 4/01/2035 | 1,000,000 | 973,235 | ||
| University of North Carolina, Greensboro, Rev., 5%, 4/01/2039 | 2,000,000 | 2,007,607 | ||
| University of North Carolina, School of Art General Rev., 4%, 2/01/2040 | 1,000,000 | 896,640 | ||
| University of North Carolina, School of Art General Rev., 4%, 2/01/2045 | 2,825,000 | 2,415,508 | ||
| University of North Carolina, Wilmington, Limited Obligation (Student Housing Projects), 5%, 6/01/2028 | 3,045,000 | 3,096,111 | ||
| University of North Carolina, Wilmington, Limited Obligation (Student Housing Projects), 4%, 6/01/2032 | 500,000 | 491,348 | ||
| University of North Carolina, Wilmington, Limited Obligation (Student Housing Projects), 4%, 6/01/2033 | 400,000 | 386,124 | ||
| University of North Carolina, Wilmington, Limited Obligation (Student Housing Projects), 4%, 6/01/2034 | 500,000 | 477,158 | ||
| Virginia College Building Authority, Educational Facilities Rev. (Marymount University Project), “B”, 5.25%, 7/01/2035 (n) | 195,000 | 190,476 | ||
| Western Carolina University, NC, General Obligation Rev., 5%, 10/01/2043 | 3,700,000 | 3,766,911 | ||
| Western Carolina University, NC, General Rev., “B”, 5%, 4/01/2032 | 2,420,000 | 2,564,297 | ||
| Western Carolina University, NC, General Rev., “B”, 5%, 4/01/2034 | 1,300,000 | 1,377,171 | ||
| Winston-Salem State University, NC, General Rev., AGM, 5%, 10/01/2042 | 2,470,000 | 2,540,715 | ||
| Winston-Salem State University, NC, Student Housing Project Rev., 5%, 6/01/2029 | 1,550,000 | 1,553,495 | ||
| $60,998,666 | ||||
| Utilities - Municipal Owned – 0.6% | ||||
| Greenville, NC, Utilities Commission Combined Enterprise System Rev., 5%, 8/01/2044 | $ | 300,000 | $309,867 | |
| Puerto Rico Electric Power Authority Refunding Rev., “DDD”, 5%, 7/01/2020 (a)(d) | 40,000 | 10,000 | ||
| Puerto Rico Electric Power Authority Refunding Rev., “DDD”, 5%, 7/01/2021 (a)(d) | 440,000 | 110,000 | ||
| Puerto Rico Electric Power Authority Refunding Rev., “DDD”, 5%, 7/01/2022 (a)(d) | 720,000 | 180,000 | ||
| Puerto Rico Electric Power Authority Refunding Rev., “VV”, NPFG, 5.25%, 7/01/2029 | 525,000 | 519,224 | ||
| Puerto Rico Electric Power Authority Refunding Rev., “VV”, NPFG, 5.25%, 7/01/2030 | 425,000 | 419,936 | ||
| Puerto Rico Electric Power Authority Refunding Rev., “VV”, NPFG, 5.25%, 7/01/2034 | 50,000 | 49,310 | ||
| Puerto Rico Electric Power Authority Rev., “A”, 5%, 7/01/2029 (a)(d) | 1,125,000 | 281,250 | ||
| Puerto Rico Electric Power Authority Rev., “A”, 5%, 7/01/2042 (a)(d) | 175,000 | 43,750 | ||
| Puerto Rico Electric Power Authority Rev., “AAA”, 5.25%, 7/01/2021 (a)(d) | 85,000 | 21,250 | ||
| Puerto Rico Electric Power Authority Rev., “AAA”, 5.25%, 7/01/2030 (a)(d) | 40,000 | 10,000 | ||
| Puerto Rico Electric Power Authority Rev., “CCC”, 5.25%, 7/01/2027 (a)(d) | 415,000 | 103,750 | ||
| Puerto Rico Electric Power Authority Rev., “TT”, 5%, 7/01/2021 (a)(d) | 195,000 | 48,750 | ||
| Puerto Rico Electric Power Authority Rev., “TT”, 5%, 7/01/2023 (a)(d) | 190,000 | 47,500 | ||
| Puerto Rico Electric Power Authority Rev., “TT”, 5%, 7/01/2027 (a)(d) | 35,000 | 8,750 | ||
| Puerto Rico Electric Power Authority Rev., “TT”, 5%, 7/01/2037 (a)(d) | 585,000 | 146,250 | ||
| Puerto Rico Electric Power Authority Rev., “WW”, 5.375%, 7/01/2022 (a)(d) | 35,000 | 8,750 | ||
| Puerto Rico Electric Power Authority Rev., “WW”, 5.25%, 7/01/2025 (a)(d) | 80,000 | 20,000 | ||
| Puerto Rico Electric Power Authority Rev., “ZZ”, 5%, 7/01/2018 (a)(d) | 265,000 | 66,250 | ||
| Puerto Rico Electric Power Authority Rev., “ZZ”, 5.25%, 7/01/2023 (a)(d) | 305,000 | 76,250 | ||
| Puerto Rico Electric Power Authority Rev., “ZZ”, 5.25%, 7/01/2024 (a)(d) | 95,000 | 23,750 | ||
29
Portfolio of Investments (unaudited) –
continued
| Issuer | Shares/Par | Value ($) | ||
| Municipal Bonds – continued | ||||
| Utilities - Municipal Owned – continued | ||||
| Puerto Rico Electric Power Authority Rev., “ZZ”, 5.25%, 7/01/2026 (a)(d) | $ | 300,000 | $75,000 | |
| Puerto Rico Electric Power Authority Rev., Taxable, “EEE”, 6.05%, 7/01/2032 (a)(d) | 240,000 | 60,000 | ||
| $2,639,587 | ||||
| Utilities - Other – 3.4% | ||||
| Black Belt Energy Gas District, AL, Gas Project Rev. (Project No. 8), “A”, 4%, 12/01/2052 (Put Date 12/01/2029) | $ | 1,090,000 | $1,018,081 | |
| Black Belt Energy Gas District, AL, Gas Project Rev., “A”, 4%, 6/01/2051 (Put Date 12/01/2031) | 1,295,000 | 1,221,025 | ||
| Black Belt Energy Gas District, AL, Gas Project Rev., “C-1”, 5.25%, 2/01/2053 (Put Date 6/01/2029) | 2,580,000 | 2,618,073 | ||
| California Community Choice Financing Authority, Clean Energy Project Rev., “C”, 5.25%, 1/01/2054 (Put Date 10/01/2031) | 2,535,000 | 2,529,021 | ||
| Southeast Alabama Energy Authority Commodity Supply Rev. (Project No. 5), “A”, 5.25%, 1/01/2054 (Put Date 7/01/2029) | 2,320,000 | 2,335,056 | ||
| Tennergy Corp., TN, Gas Supply Rev., “A”, 5.5%, 10/01/2053 (Put Date 12/01/2030) | 1,445,000 | 1,467,624 | ||
| Tennessee Energy Acquisition Corp., Gas Project Rev., “A”, 5.25%, 9/01/2026 | 1,290,000 | 1,293,631 | ||
| Tennessee Energy Acquisition Corp., Gas Project Rev., “A-1”, 5%, 5/01/2053 (Put Date 5/01/2028) | 2,250,000 | 2,244,770 | ||
| $14,727,281 | ||||
| Water & Sewer Utility Revenue – 8.1% | ||||
| Cape Fear Public Utility Authority, Water & Sewer System Rev., 5%, 6/01/2040 (Prerefunded 6/01/2024) | $ | 1,250,000 | $1,259,365 | |
| Clayton, NC, Water & Sewer System Rev., 5%, 8/01/2045 | 2,500,000 | 2,587,053 | ||
| Clayton, NC, Water & Sewer System Rev., 4%, 8/01/2047 | 2,500,000 | 2,238,718 | ||
| Greensboro, NC, Enterprise System Rev., 5.25%, 6/01/2047 | 1,000,000 | 1,064,935 | ||
| Greensboro, NC, Enterprise System Rev., 5.25%, 6/01/2048 | 3,990,000 | 4,242,813 | ||
| Greenville, NC, Utilities Commission, Combined Enterprise System Rev., 4%, 12/01/2039 | 380,000 | 358,498 | ||
| Greenville, NC, Utilities Commission, Combined Enterprise System Rev., 4%, 12/01/2041 | 300,000 | 279,160 | ||
| Greenville, NC, Utilities Commission, Combined Enterprise System Rev., 4.125%, 12/01/2043 | 510,000 | 472,852 | ||
| Greenville, NC, Utilities Commission, Combined Enterprise System Rev., 5%, 12/01/2046 | 525,000 | 546,953 | ||
| Guam Waterworks Authority Rev. (Water and Wastewater System), 5%, 7/01/2036 | 220,000 | 220,013 | ||
| Guam Waterworks Authority Rev. (Water and Wastewater System), 5%, 7/01/2036 | 380,000 | 379,806 | ||
| Guam Waterworks Authority Rev. (Water and Wastewater System), 5%, 7/01/2037 | 480,000 | 472,810 | ||
| Guam Waterworks Authority Rev. (Water and Wastewater System), 5%, 7/01/2040 | 1,325,000 | 1,273,679 | ||
| Guam Waterworks Authority Rev. (Water and Wastewater System), 5%, 1/01/2046 | 1,000,000 | 942,474 | ||
| Guam Waterworks Authority Rev. (Water and Wastewater System), “A”, 5%, 1/01/2050 | 605,000 | 560,679 | ||
| Johnston County, NC, Water & Sewer System Rev., 4%, 4/01/2048 | 4,000,000 | 3,562,693 | ||
| Johnston County, NC, Water & Sewer System Rev., 4%, 4/01/2053 | 5,000,000 | 4,370,926 | ||
| Lincoln County, NC, Enterprise System Rev., 3%, 8/01/2034 | 175,000 | 152,767 | ||
| Michigan Finance Authority Local Government Loan Program Rev. (Detroit Water and Sewerage Department Sewage Disposal System Rev. Refunding Second Lien Local Project), “C-7”, NPFG, 5%, 7/01/2032 | 95,000 | 95,542 | ||
| Michigan Finance Authority Local Government Loan Program Rev. (Detroit Water and Sewerage Department Water Supply System Rev. Refunding Second Lien Local Project), “D-6”, NPFG, 5%, 7/01/2036 | 115,000 | 115,254 | ||
| Michigan Finance Authority Local Government Loan Program Rev. (Detroit Water and Sewerage Department Water Supply System Rev. Refunding Senior Lien Local Project), “D-1”, AGM, 5%, 7/01/2035 | 60,000 | 60,285 | ||
| Michigan Finance Authority Local Government Loan Program Rev. (Detroit Water and Sewerage Department Water Supply System Rev. Refunding Senior Lien Local Project), “D-1”, AGM, 5%, 7/01/2037 | 140,000 | 140,380 | ||
| Oak Island, NC, Enterprise System Rev., AGM, 5%, 6/01/2025 | 2,010,000 | 2,043,902 | ||
| Oak Island, NC, Enterprise System Rev., AGM, 5%, 6/01/2028 | 500,000 | 519,560 | ||
| Oak Island, NC, Enterprise System Rev., AGM, 5%, 6/01/2029 | 1,400,000 | 1,421,517 | ||
| Oak Island, NC, Enterprise System Rev., AGM, 5%, 6/01/2031 | 1,600,000 | 1,624,391 | ||
| Texas Water Development Board State Water Implementation Rev., “A”, 5%, 10/15/2058 (w) | 1,360,000 | 1,398,125 | ||
| Union County, NC, Enterprise System Rev., 3%, 6/01/2046 | 2,500,000 | 1,769,415 | ||
| Winston-Salem, NC, Water & Sewer Systems Rev., 4%, 6/01/2034 | 700,000 | 694,288 | ||
| Winston-Salem, NC, Water & Sewer Systems Rev., 4%, 6/01/2035 | 500,000 | 492,278 | ||
| $35,361,131 | ||||
| Total Municipal Bonds (Identified Cost, $464,521,719) | $424,130,061 | |||
| Bonds – 0.3% | ||||
| Consumer Services – 0.3% | ||||
| Toll Road Investors Partnership II LP, Capital Appreciation, NPFG, 0%, 2/15/2025 (n) | $ | 786,000 | $707,746 | |
30
Portfolio of Investments (unaudited) –
continued
| Issuer | Shares/Par | Value ($) | ||
| Bonds – continued | ||||
| Consumer Services – continued | ||||
| Toll Road Investors Partnership II LP, Capital Appreciation, NPFG, 0%, 2/15/2043 (n) | $ | 1,607,340 | $528,390 | |
| Total Bonds (Identified Cost, $1,350,863) | $1,236,136 | |||
| Contingent Value Instruments – 0.1% | ||||
| General Obligations - General Purpose – 0.1% | ||||
| Commonwealth of Puerto Rico, General Obligation Contingent Value Instrument, 11/01/2043 (Identified Cost, $521,716) | $ | 879,323 | $456,149 | |
| Investment Companies (h) – 1.0% | ||||
| Money Market Funds – 1.0% | ||||
| MFS Institutional Money Market Portfolio, 5.4% (v) (Identified Cost, $4,492,433) | 4,491,916 | $4,492,814 | ||
| Other Assets, Less Liabilities – 0.8% | 3,571,253 | |||
| Net Assets – 100.0% | $433,886,413 | |||
See Portfolio Footnotes and Notes to
Financial Statements
31
Portfolio of Investments (unaudited) –
continued
MFS Pennsylvania Municipal Bond
Fund
| Issuer | Shares/Par | Value ($) | ||
| Municipal Bonds – 97.4% | ||||
| Airport Revenue – 1.7% | ||||
| Philadelphia, PA, Airport Refunding Rev., 5%, 7/01/2029 | $ | 1,590,000 | $1,640,173 | |
| Philadelphia, PA, Airport Rev., “B”, 5%, 7/01/2034 | 750,000 | 762,291 | ||
| Wayne County, MI, Airport Authority Rev. (Detroit Metropolitan Wayne County Airport), “B”, 5%, 12/01/2044 | 55,000 | 54,263 | ||
| Wayne County, MI, Airport Authority Rev. (Detroit Metropolitan Wayne County Airport), “B”, BAM, 5%, 12/01/2039 | 65,000 | 64,996 | ||
| Wayne County, MI, Airport Authority Rev. (Detroit Metropolitan Wayne County Airport), “C”, 5%, 12/01/2039 | 45,000 | 44,902 | ||
| Wayne County, MI, Airport Authority Rev. (Detroit Metropolitan Wayne County Airport), “C”, 5%, 12/01/2044 | 80,000 | 78,827 | ||
| $2,645,452 | ||||
| General Obligations - General Purpose – 6.6% | ||||
| Bridgeview, IL, Stadium and Redevelopment Projects, Taxable, AAC, 5.14%, 12/01/2036 | $ | 350,000 | $302,146 | |
| Bucks County, PA, Northampton Township, General Obligation, 4%, 5/15/2043 | 1,000,000 | 888,334 | ||
| Chicago, IL, General Obligation, “A”, 5%, 1/01/2025 | 220,000 | 221,711 | ||
| Chicago, IL, General Obligation, “A”, 5.5%, 1/01/2040 | 600,000 | 613,957 | ||
| Commonwealth of Puerto Rico, General Obligation Restructured Bonds, Capital Appreciation, Series 2022A, 0%, 7/01/2024 | 9,939 | 9,601 | ||
| Commonwealth of Puerto Rico, General Obligation Restructured Bonds, Capital Appreciation, Series 2022A, 0%, 7/01/2033 | 78,634 | 46,344 | ||
| Commonwealth of Puerto Rico, General Obligation Restructured Bonds, Series 2022A, 5.625%, 7/01/2027 | 67,435 | 69,199 | ||
| Commonwealth of Puerto Rico, General Obligation Restructured Bonds, Series 2022A, 5.625%, 7/01/2029 | 66,341 | 68,551 | ||
| Commonwealth of Puerto Rico, General Obligation Restructured Bonds, Series 2022A, 5.75%, 7/01/2031 | 245,437 | 256,315 | ||
| Commonwealth of Puerto Rico, General Obligation Restructured Bonds, Series 2022A, 4%, 7/01/2033 | 61,103 | 54,769 | ||
| Commonwealth of Puerto Rico, General Obligation Restructured Bonds, Series 2022A, 4%, 7/01/2035 | 116,918 | 101,608 | ||
| Commonwealth of Puerto Rico, General Obligation Restructured Bonds, Series 2022A, 4%, 7/01/2037 | 47,139 | 39,570 | ||
| Commonwealth of Puerto Rico, General Obligation Restructured Bonds, Series 2022A, 4%, 7/01/2041 | 64,091 | 51,530 | ||
| Commonwealth of Puerto Rico, General Obligation Restructured Bonds, Series 2022A, 4%, 7/01/2046 | 234,653 | 180,913 | ||
| Lancaster, PA, General Obligation, BAM, 5%, 11/01/2034 | 1,890,000 | 2,023,088 | ||
| Penn Hills, PA, Capital Appreciation, “D”, 0%, 12/01/2032 | 595,000 | 384,915 | ||
| Philadelphia, PA, “B”, 5%, 2/01/2035 | 1,000,000 | 1,050,401 | ||
| Philadelphia, PA, Energy Authority City Service Agreement Rev. (Philadelphia Street Lighting Project), “A”, 5%, 11/01/2042 | 1,000,000 | 1,018,524 | ||
| Reading, Berks County, PA, General Obligation, BAM, 5%, 11/01/2030 | 1,000,000 | 1,056,590 | ||
| Reading, Berks County, PA, General Obligation, BAM, 5%, 11/01/2031 | 1,000,000 | 1,057,251 | ||
| State of Illinois, General Obligation, 5.5%, 5/01/2039 | 125,000 | 130,410 | ||
| State of Illinois, General Obligation, 5.75%, 5/01/2045 | 115,000 | 119,890 | ||
| State of Illinois, General Obligation, “B”, 5.5%, 5/01/2047 | 130,000 | 134,863 | ||
| Texas Cedar Port Navigation & Improvement District, Unlimited Tax, 4.5%, 8/31/2048 | 165,000 | 148,940 | ||
| Texas Cedar Port Navigation & Improvement District, Unlimited Tax, 4.5%, 8/31/2052 | 65,000 | 57,911 | ||
| $10,087,331 | ||||
| General Obligations - Schools – 8.7% | ||||
| Beaver County, PA, Aliquippa School District, General Obligation, BAM, 4%, 12/01/2041 | $ | 1,000,000 | $910,224 | |
| Berks County, PA, Reading School District, AGM, 5%, 3/01/2038 | 1,000,000 | 1,016,474 | ||
| Coatesville, PA, Area School District, General Obligation, AGM, 5%, 8/01/2024 | 970,000 | 978,315 | ||
| Conneaut, PA, School District, Capital Appreciation, “B”, AGM, 0%, 11/01/2031 | 1,150,000 | 797,108 | ||
| Erie, PA, City School District General Obligation, “A”, AGM, 4%, 4/01/2033 | 1,150,000 | 1,139,931 | ||
| Luzerne County, PA, Wilkes-Barre Area School District, General Obligation, BAM, 4%, 4/15/2054 | 765,000 | 647,595 | ||
| Luzerne County, PA, Wilkes-Barre Area School District, General Obligation, BAM, 5%, 4/15/2059 | 1,500,000 | 1,486,053 | ||
| Montgomery County, PA, Springfield Township School District, General Obligation, 4%, 11/15/2037 | 1,500,000 | 1,423,535 | ||
| Philadelphia, PA, School District General Obligation, “F”, 5%, 9/01/2038 (Prerefunded 9/01/2026) | 5,000 | 5,184 | ||
| Philadelphia, PA, School District General Obligation, “F”, 5%, 9/01/2038 | 1,495,000 | 1,494,855 | ||
| Philadelphia, PA, School District, “A”, 5%, 9/01/2044 | 1,500,000 | 1,508,230 | ||
| Scranton, PA, School District, “E”, BAM, 5%, 12/01/2034 | 1,000,000 | 1,033,624 | ||
| Upper St. Clair Township, PA, School District General Obligation, “B”, 3.625%, 10/01/2039 | 1,000,000 | 836,811 | ||
| $13,277,939 | ||||
| Healthcare Revenue - Hospitals – 17.3% | ||||
| Allegheny County, PA, Mt. Lebanon Hospital Authority Rev. (St. Clair Memorial Hospital), 5%, 7/01/2038 | $ | 1,000,000 | $1,009,532 | |
| Berks County, PA, Industrial Development Authority Health System Rev. (Tower Health Project), 4%, 11/01/2038 | 500,000 | 284,999 | ||
| Berks County, PA, Municipal Authority Rev. (Reading Hospital & Medical Center), “A”, 5%, 11/01/2040 | 1,600,000 | 912,537 | ||
| Bucks County, PA, Industrial Development Authority, Hospital Rev. (St. Luke's University Health Network Project), 4%, 8/15/2044 | 1,000,000 | 843,760 | ||
32
Portfolio of Investments (unaudited) –
continued
| Issuer | Shares/Par | Value ($) | ||
| Municipal Bonds – continued | ||||
| Healthcare Revenue - Hospitals – continued | ||||
| Bucks County, PA, St. Mary Hospital Authority Refunding Rev. (Trinity Health Credit Group), 5%, 12/01/2048 (Prerefunded 12/01/2028) | $ | 665,000 | $714,430 | |
| Bucks County, PA, St. Mary Hospital Authority Refunding Rev. (Trinity Health Credit Group), 5%, 12/01/2048 | 335,000 | 326,299 | ||
| Centre County, PA, Hospital Authority Rev. (Mount Nittany Medical Center), 5%, 11/15/2041 (Prerefunded 11/15/2025) | 850,000 | 870,635 | ||
| Chester County, PA, Health & Education Facilities Authority Health System Rev. (Main Line Health System), “A”, 5%, 10/01/2052 | 1,750,000 | 1,748,125 | ||
| Doylestown, PA, Hospital Authority Rev., “A”, 5%, 6/30/2049 (Prerefunded 7/01/2029) | 100,000 | 107,354 | ||
| Doylestown, PA, Hospital Authority Rev., “A”, 5%, 7/01/2049 | 900,000 | 732,234 | ||
| DuBois, PA, Hospital Authority Rev. (Penn Highlands Healthcare), 5%, 7/15/2039 | 500,000 | 490,574 | ||
| DuBois, PA, Hospital Authority Rev. (Penn Highlands Healthcare), 5%, 7/15/2040 | 1,000,000 | 976,896 | ||
| DuBois, PA, Hospital Authority Rev. (Penn Highlands Healthcare), 5%, 7/15/2043 | 1,000,000 | 970,253 | ||
| Fulton County, PA, Industrial Development Authority Hospital Rev. (Medical Center Project), 5%, 7/01/2040 | 500,000 | 427,180 | ||
| Harris County, TX, Cultural Education Facilities Finance Corp., Hospital Rev. (Memorial Hermann Health System), “A”, 4.125%, 7/01/2052 | 900,000 | 765,448 | ||
| Lancaster County, PA, Hospital Authority Rev. (University of Pennsylvania Health System), “A”, 5%, 8/15/2036 | 1,000,000 | 1,024,823 | ||
| Lehigh County, PA, Hospital Authority Rev. (Lehigh Valley Health Network), “A”, 4%, 7/01/2039 | 1,000,000 | 878,869 | ||
| Montgomery County, PA, Higher Education & Health Authority Rev. (Thomas Jefferson University), “B”, 4%, 5/01/2042 | 2,000,000 | 1,758,791 | ||
| Montour County, PA, Geisinger Authority Health System Rev., “A”, 4%, 4/01/2039 | 1,000,000 | 928,151 | ||
| Montour County, PA, Geisinger Authority Health System Rev., “A-1”, 5%, 2/15/2045 | 1,000,000 | 987,493 | ||
| Northampton County, PA, General Purpose Authority Hospital Rev. (St. Luke's Hospital), “A”, 5%, 8/15/2048 | 500,000 | 475,382 | ||
| Pennsylvania Economic Development Financing Authority, UPMC Rev., “A”, 4%, 5/15/2053 | 1,000,000 | 817,956 | ||
| Pennsylvania Higher Educational Facilities Authority Rev. (University of Pennsylvania Health System), “A”, VRDN, 3.16%, 12/31/2037 | 2,000,000 | 2,000,000 | ||
| Philadelphia, PA, Authority for Industrial Development Rev. (Thomas Jefferson University), “A”, 5%, 9/01/2036 | 1,000,000 | 1,009,400 | ||
| Philadelphia, PA, Authority for Industrial Development Rev. (Thomas Jefferson University), “A”, 5%, 9/01/2042 | 1,000,000 | 988,151 | ||
| Philadelphia, PA, Hospitals and Higher Education Facilities Authority Rev. (Temple University Health System Obligated Group), “A”, 5%, 7/01/2034 | 500,000 | 498,427 | ||
| Royal Oak, MI, Hospital Finance Authority Rev. (William Beaumont Hospital), 5%, 9/01/2039 (Prerefunded 3/01/2024) | 810,000 | 812,787 | ||
| Southcentral, PA, General Authority Rev. (WellSpan Health Obligated Group), 4%, 6/01/2044 | 1,000,000 | 874,443 | ||
| Southcentral, PA, General Authority Rev. (WellSpan Health Obligated Group), “A”, 5%, 6/01/2044 (Prerefunded 6/01/2024) | 1,000,000 | 1,006,515 | ||
| Westmoreland County, PA, Industrial Development Authority, Health System Rev. (Excela Health Project), “A”, 4%, 7/01/2037 | 1,400,000 | 1,188,024 | ||
| $26,429,468 | ||||
| Healthcare Revenue - Long Term Care – 4.1% | ||||
| Chester County, PA, Health & Education Facilities Authority Rev. (Simpson Senior Services Project), “A”, 5.25%, 12/01/2045 | $ | 500,000 | $391,394 | |
| Cumberland County, PA, Municipal Authority Rev. (Diakon Lutheran Social Ministries), “A”, 5%, 1/01/2039 | 140,000 | 132,550 | ||
| Cumberland County, PA, Municipal Authority Rev. (Diakon Lutheran Social Ministries), “A”, ETM, 5%, 1/01/2039 (Prerefunded 1/01/2029) | 95,000 | 101,221 | ||
| Cumberland County, PA, Municipal Authority Rev. (Diakon Lutheran Social Ministries), “A”, ETM, 5%, 1/01/2039 (Prerefunded 1/01/2029) | 765,000 | 815,099 | ||
| East Hempfield Township, PA, Industrial Development Authority Rev. (Willow Valley Communities Project), 5%, 12/01/2039 | 750,000 | 736,970 | ||
| Lancaster County, PA, Hospital Authority Health Center Rev. (Landis Homes Retirement Community Project), “A”, 5%, 7/01/2045 | 500,000 | 427,240 | ||
| Lancaster County, PA, Hospital Authority Health Center Rev. (Masonic Villages Project), 5%, 11/01/2035 | 500,000 | 500,646 | ||
| Lancaster County, PA, Hospital Authority Health Center Rev. (Masonic Villages Project), 5%, 11/01/2036 | 260,000 | 258,484 | ||
| Lancaster County, PA, Hospital Authority Health Center Rev. (Masonic Villages Project), 5%, 11/01/2037 | 250,000 | 244,969 | ||
| Lancaster County, PA, Hospital Authority Rev. (Brethren Village Project), 5.125%, 7/01/2037 | 500,000 | 441,409 | ||
| Lancaster County, PA, Hospital Authority Rev. (Saint Anne's Retirement Community, Inc. Project), 5%, 3/01/2040 | 500,000 | 409,216 | ||
| Lancaster County, PA, Hospital Authority Rev. (Saint Anne's Retirement Community, Inc. Project), 5%, 3/01/2045 | 500,000 | 387,560 | ||
| Montgomery County, PA, Industrial Development Authority Rev. (Whitemarsh Continuing Care Retirement Community Project), 5.375%, 1/01/2050 | 400,000 | 325,216 | ||
| Pennsylvania Economic Development Financing Authority Rev. (Presbyterian Senior Living Project), “B-1”, 5.25%, 7/01/2049 | 750,000 | 710,458 | ||
| Philadelphia, PA, Authority for Industrial Development, Senior Living Facilities Rev. (Wesley Enhanced Living Obligated Group), “A”, 5%, 7/01/2049 | 500,000 | 377,768 | ||
| $6,260,200 | ||||
| Industrial Revenue - Environmental Services – 1.8% | ||||
| Blythe, PA, Solid Waste Authority Rev., 7.75%, 12/01/2037 (Prerefunded 12/01/2027) | $ | 225,000 | $249,581 | |
| California Municipal Finance Authority, Solid Waste Disposal Rev. (Waste Management, Inc. Project), “A”, 0.7%, 12/01/2044 (Put Date 12/01/2023) | 500,000 | 496,268 | ||
| Pennsylvania Economic Development Financing Authority, Solid Waste Disposal Rev. (Waste Management, Inc. Project), 4.125%, 8/01/2045 (Put Date 11/01/2023) | 1,000,000 | 999,487 | ||
33
Portfolio of Investments (unaudited) –
continued
| Issuer | Shares/Par | Value ($) | ||
| Municipal Bonds – continued | ||||
| Industrial Revenue - Environmental Services – continued | ||||
| Pennsylvania Economic Development Financing Authority, Solid Waste Disposal Rev. (Waste Management, Inc. Project), “A-2”, 4.6%, 10/01/2046 (Put Date 10/01/2026) | $ | 1,000,000 | $999,679 | |
| $2,745,015 | ||||
| Industrial Revenue - Other – 0.7% | ||||
| Pennsylvania Economic Development Financing Authority, Solid Waste Disposal Rev. (Procter & Gamble), 5.375%, 3/01/2031 | $ | 1,000,000 | $1,078,227 | |
| Miscellaneous Revenue - Other – 1.5% | ||||
| California Infrastructure & Economic Development Bank Rev. (Brightline West Passenger Rail), “A”, 3.65%, 1/01/2050 (Put Date 1/31/2024) (n) | $ | 945,000 | $939,227 | |
| Matching Fund Special Purpose Securitization Corp., “A”, 5%, 10/01/2026 | 65,000 | 65,248 | ||
| New York Liberty Development Corp., Liberty Rev. (3 World Trade Center Project), “1”, 5%, 11/15/2044 (n) | 395,000 | 364,918 | ||
| Pennsylvania Economic Development Financing Authority, Private Activity Rev. (Pennsylvania Rapid Bridge Replacement Project), 5%, 12/31/2034 | 970,000 | 969,184 | ||
| $2,338,577 | ||||
| Multi-Family Housing Revenue – 1.9% | ||||
| New Hampshire National Finance Authority Municipal Certificates, “1-A”, 4.375%, 9/20/2036 | $ | 461,825 | $427,643 | |
| New Mexico Mortgage Finance Authority, Multifamily Housing Rev. (Mountain View II & III Apartments Project), HUD Section 8, 5%, 2/01/2042 (Put Date 9/01/2025) | 225,000 | 226,643 | ||
| New Mexico Mortgage Finance Authority, Multifamily Housing Rev. (Santa Fe Apartment & Sangre de Cristo Project), HUD Section 8, 5%, 2/01/2042 (Put Date 6/01/2025) | 355,000 | 356,680 | ||
| Pennsylvania Housing Finance Agency, Special Limited Obligation, Multi-Family Housing Development Rev. (Country Commons Apartments), FNMA, 3.6%, 8/01/2035 | 938,181 | 861,362 | ||
| Philadelphia, PA, Authority for Industrial Development, Multi-Family Housing Rev. (University Square Apartment Project-Section 8), “I”, 5%, 12/01/2058 | 1,250,000 | 1,085,239 | ||
| $2,957,567 | ||||
| Port Revenue – 0.1% | ||||
| New York Liberty Development Corp., Liberty Refunding Rev. (1 World Trade Center Project), 2.75%, 2/15/2044 | $ | 300,000 | $198,197 | |
| Sales & Excise Tax Revenue – 2.4% | ||||
| Guam Government Business Privilege Tax Refunding, “F”, 5%, 1/01/2030 | $ | 10,000 | $9,970 | |
| Guam Government Business Privilege Tax Refunding, “F”, 5%, 1/01/2031 | 10,000 | 9,935 | ||
| Guam Government Business Privilege Tax Refunding, “F”, 4%, 1/01/2042 | 120,000 | 97,114 | ||
| Puerto Rico Sales Tax Financing Corp., Restructured Sales Tax Rev., “2019A-1”, 4.55%, 7/01/2040 | 35,000 | 32,203 | ||
| Puerto Rico Sales Tax Financing Corp., Restructured Sales Tax Rev., “2019A-1”, 4.75%, 7/01/2053 | 124,000 | 109,624 | ||
| Puerto Rico Sales Tax Financing Corp., Restructured Sales Tax Rev., “2019A-1”, 5%, 7/01/2058 | 1,188,000 | 1,074,645 | ||
| Puerto Rico Sales Tax Financing Corp., Restructured Sales Tax Rev., “2019A-2”, 4.329%, 7/01/2040 | 243,000 | 217,646 | ||
| Puerto Rico Sales Tax Financing Corp., Restructured Sales Tax Rev., “2019A-2”, 4.329%, 7/01/2040 | 116,000 | 103,897 | ||
| Puerto Rico Sales Tax Financing Corp., Restructured Sales Tax Rev., “2019A-2”, 4.536%, 7/01/2053 | 1,000 | 853 | ||
| Puerto Rico Sales Tax Financing Corp., Restructured Sales Tax Rev., “2019A-2”, 4.784%, 7/01/2058 | 364,000 | 317,715 | ||
| Puerto Rico Sales Tax Financing Corp., Restructured Sales Tax Rev., Capital Appreciation, “2019A-1”, 0%, 7/01/2024 | 2,000 | 1,936 | ||
| Puerto Rico Sales Tax Financing Corp., Restructured Sales Tax Rev., Capital Appreciation, “2019A-1”, 0%, 7/01/2027 | 55,000 | 46,832 | ||
| Puerto Rico Sales Tax Financing Corp., Restructured Sales Tax Rev., Capital Appreciation, “2019A-1”, 0%, 7/01/2029 | 9,000 | 6,998 | ||
| Puerto Rico Sales Tax Financing Corp., Restructured Sales Tax Rev., Capital Appreciation, “2019A-1”, 0%, 7/01/2031 | 524,000 | 371,216 | ||
| Puerto Rico Sales Tax Financing Corp., Restructured Sales Tax Rev., Capital Appreciation, “2019A-1”, 0%, 7/01/2033 | 509,000 | 326,142 | ||
| Puerto Rico Sales Tax Financing Corp., Restructured Sales Tax Rev., Capital Appreciation, “2019A-1”, 0%, 7/01/2046 | 2,148,000 | 553,729 | ||
| Wisconsin Public Finance Authority Limited Obligation Grant Rev. (American Dream at Meadowlands Project), “A”, 6.25%, 8/01/2027 (a)(d)(n) | 195,000 | 148,931 | ||
| Wisconsin Public Finance Authority Limited Obligation Grant Rev., Taxable (American Dream at Meadowlands Project), ”A“, 5.625%, 8/01/2024 (a)(d)(n) | 205,000 | 156,569 | ||
| $3,585,955 | ||||
| Secondary Schools – 2.0% | ||||
| Bucks County, PA, Industrial Development Authority Rev. (School Lane Charter School Project), “A”, 5.125%, 3/15/2046 | $ | 500,000 | $451,609 | |
| Chester County, PA, Industrial Development Authority Educational Facilities Rev. (Avon Grove Charter School), “A”, 5%, 12/15/2047 | 500,000 | 437,034 | ||
| Philadelphia, PA, Authority for Industrial Development Charter School Rev. (Tacony Academy School Project), 5.5%, 6/15/2043 (n) | 500,000 | 470,187 | ||
| Philadelphia, PA, Authority for Industrial Development Rev. (A String Theory Charter School Project), 5%, 6/15/2040 (n) | 900,000 | 835,380 | ||
| Philadelphia, PA, Authority for Industrial Development Rev. (MaST Charter School Project), “B”, 6%, 8/01/2051 | 450,000 | 452,738 | ||
34
Portfolio of Investments (unaudited) –
continued
| Issuer | Shares/Par | Value ($) | ||
| Municipal Bonds – continued | ||||
| Secondary Schools – continued | ||||
| Philadelphia, PA, Authority for Industrial Development Rev. (MaST Community Charter School II Project), 5%, 8/01/2050 | $ | 500,000 | $433,582 | |
| $3,080,530 | ||||
| Single Family Housing - State – 6.4% | ||||
| Pennsylvania Housing Finance Agency, Single Family Mortgage Rev., “128A”, 3.65%, 10/01/2032 | $ | 1,000,000 | $906,481 | |
| Pennsylvania Housing Finance Agency, Single Family Mortgage Rev., “135A”, 3%, 10/01/2051 | 1,585,000 | 1,520,662 | ||
| Pennsylvania Housing Finance Agency, Single Family Mortgage Rev., “141A”, 4.6%, 10/01/2043 | 1,000,000 | 950,963 | ||
| Pennsylvania Housing Finance Agency, Single Family Mortgage Rev., “141A”, 4.7%, 10/01/2046 | 1,000,000 | 945,053 | ||
| Pennsylvania Housing Finance Agency, Single Family Mortgage Rev., “134B”, 5%, 4/01/2025 | 500,000 | 502,854 | ||
| Pennsylvania Housing Finance Agency, Single Family Mortgage Rev., “134B”, 5%, 10/01/2025 | 300,000 | 302,474 | ||
| Pennsylvania Housing Finance Agency, Single Family Mortgage Rev., “134B”, 5%, 10/01/2026 | 1,545,000 | 1,568,414 | ||
| Pennsylvania Housing Finance Agency, Single Family Mortgage Rev., “141A”, 5.75%, 10/01/2053 | 1,490,000 | 1,542,234 | ||
| Pennsylvania Housing Finance Agency, Single Family Mortgage Rev., “142A”, 5.5%, 10/01/2053 | 1,500,000 | 1,542,108 | ||
| $9,781,243 | ||||
| State & Local Agencies – 2.3% | ||||
| Pennsylvania Public School Building Authority, School Lease Rev. (School District of Philadelphia Project), “A”, AGM, 5%, 6/01/2033 | $ | 1,255,000 | $1,286,978 | |
| Philadelphia, PA, Authority for Industrial Development Rev. (Rebuild Project), 5%, 5/01/2037 | 250,000 | 256,717 | ||
| Philadelphia, PA, Authority for Industrial Development Rev. (Rebuild Project), 5%, 5/01/2038 | 1,000,000 | 1,020,737 | ||
| Philadelphia, PA, Redevelopment Authority City Agreement Rev., “A”, 5%, 4/15/2028 | 1,000,000 | 1,014,121 | ||
| $3,578,553 | ||||
| Student Loan Revenue – 3.5% | ||||
| New Jersey Higher Education Student Assistance Authority, Senior Student Loan Rev., “B”, 4%, 12/01/2041 | $ | 820,000 | $775,669 | |
| Pennsylvania Higher Educational Assistance Agency, Education Loan Rev., “A”, 5%, 6/01/2029 | 325,000 | 330,897 | ||
| Pennsylvania Higher Educational Assistance Agency, Education Loan Rev., “A”, 5%, 6/01/2030 | 400,000 | 408,238 | ||
| Pennsylvania Higher Educational Assistance Agency, Education Loan Rev., “A”, 2.625%, 6/01/2042 | 925,000 | 739,869 | ||
| Pennsylvania Higher Educational Assistance Agency, Education Loan Rev., “A”, 4.5%, 6/01/2043 | 1,835,000 | 1,738,361 | ||
| Pennsylvania Higher Educational Assistance Agency, Education Loan Rev., “A”, 4%, 6/01/2044 | 1,000,000 | 907,141 | ||
| Pennsylvania Higher Educational Assistance Agency, Education Loan Rev., “B”, 5%, 6/01/2050 | 500,000 | 444,019 | ||
| $5,344,194 | ||||
| Tax - Other – 2.9% | ||||
| Allentown, PA, Neighborhood Improvement Zone Development Authority Tax Refunding Rev., 5%, 5/01/2042 | $ | 1,000,000 | $929,738 | |
| Allentown, PA, Neighborhood Improvement Zone Development Authority Tax Rev. (City Center Project), 5.375%, 5/01/2042 (n) | 300,000 | 289,207 | ||
| Allentown, PA, Neighborhood Improvement Zone Development Authority Tax Rev. (City Center Refunding Project), 5%, 5/01/2042 (n) | 500,000 | 466,701 | ||
| Chicago, IL, Board of Education, Dedicated Capital Improvement Tax Bond, 5%, 4/01/2045 | 105,000 | 103,645 | ||
| Chicago, IL, Board of Education, Dedicated Capital Improvement Tax Bond, 5.75%, 4/01/2048 | 285,000 | 298,365 | ||
| Guam Government Limited Obligation Rev., “A”, 5%, 12/01/2036 | 60,000 | 58,569 | ||
| Guam Government Limited Obligation Rev., “A”, 5%, 12/01/2046 | 185,000 | 162,230 | ||
| Lancaster County, PA, Convention Center Authority Hotel Room Rental Tax Rev., “B”, 4%, 5/01/2049 | 500,000 | 430,076 | ||
| New York, NY, Transitional Finance Authority Rev., “C-1”, 4%, 5/01/2045 | 1,320,000 | 1,181,231 | ||
| St. Clair County, AL, Board of Education, Special Tax School Warrants (15 Mill Moody Tax), “A”, BAM, 4.25%, 2/01/2052 | 500,000 | 443,931 | ||
| Wisconsin Public Finance Authority Limited Obligation PILOT Rev. (American Dream at Meadowlands Project), 7%, 12/01/2050 | 105,000 | 93,425 | ||
| $4,457,118 | ||||
| Tax Assessment – 0.3% | ||||
| Washington County, PA, Redevelopment Authority Refunding Rev. (Victory Centre Tax Increment Financing Project), 5%, 7/01/2035 | $ | 500,000 | $470,287 | |
| Tobacco – 0.8% | ||||
| Buckeye, OH, Tobacco Settlement Financing Authority Senior Asset-Backed Refunding, 2020A-2, “1”, 4%, 6/01/2048 | $ | 540,000 | $456,126 | |
| Buckeye, OH, Tobacco Settlement Financing Authority Senior Asset-Backed Refunding, 2020B-2, “2”, 5%, 6/01/2055 | 300,000 | 258,423 | ||
| Golden State, CA, Tobacco Securitization Corp., Tobacco Settlement Rev., Taxable, “B-1”, 3.85%, 6/01/2050 | 550,000 | 498,880 | ||
| $1,213,429 | ||||
| Toll Roads – 1.8% | ||||
| Delaware River Port Authority Rev., 5%, 1/01/2029 (Prerefunded 1/01/2024) | $ | 1,145,000 | $1,147,345 | |
| Pennsylvania Turnpike Commission Subordinate Rev., “A”, AGM, 4%, 12/01/2049 | 1,500,000 | 1,295,672 | ||
35
Portfolio of Investments (unaudited) –
continued
| Issuer | Shares/Par | Value ($) | ||
| Municipal Bonds – continued | ||||
| Toll Roads – continued | ||||
| Texas Private Activity Surface Transportation Corp., Senior Lien Rev. (NTE Mobility Partners Segments 3 LLC Segments 3A & 3B Facility), 7%, 12/31/2038 | $ | 140,000 | $140,266 | |
| Texas Private Activity Surface Transportation Corp., Senior Lien Rev. (NTE Mobility Partners Segments 3 LLC Segments 3A & 3B Facility), 6.75%, 6/30/2043 | 110,000 | 110,176 | ||
| $2,693,459 | ||||
| Transportation - Special Tax – 1.5% | ||||
| New Jersey Transportation Trust Fund Authority, “A”, 5%, 12/15/2039 | $ | 85,000 | $87,197 | |
| New Jersey Transportation Trust Fund Authority, “CC”, 5.5%, 6/15/2050 | 90,000 | 94,826 | ||
| Southeastern Pennsylvania Transportation Authority Rev. (Asset Improvement Program), 5.25%, 6/01/2047 | 2,000,000 | 2,089,830 | ||
| $2,271,853 | ||||
| Universities - Colleges – 14.7% | ||||
| Allegheny County, PA, Higher Education Building Authority Rev. (Duquesne University), “A”, 5%, 3/01/2032 (Prerefunded 3/01/2025) | $ | 500,000 | $507,831 | |
| Allegheny County, PA, Higher Education Building Authority Rev. (Duquesne University), “A”, 4%, 3/01/2041 | 2,000,000 | 1,766,976 | ||
| Clemson University, SC, Athletic Facilities Rev., “A”, 3%, 5/01/2048 | 1,500,000 | 1,019,977 | ||
| Erie, PA, Higher Education Building Authority Rev. (AICUP Financing Program-Gannon University Project), 4%, 5/01/2036 | 300,000 | 259,983 | ||
| Erie, PA, Higher Education Building Authority Rev. (AICUP Financing Program-Gannon University Project), 4%, 5/01/2041 | 920,000 | 730,949 | ||
| Indiana County, PA, Industrial Development Authority Refunding Rev. (Foundation for Indiana University of Pennsylvania Project), BAM, 4%, 5/01/2054 | 2,750,000 | 2,310,692 | ||
| Montgomery County, PA, Higher Education & Health Authority Rev. (Thomas Jefferson University), “B”, AGM, 3.125%, 5/01/2053 | 95,000 | 61,785 | ||
| Montgomery County, PA, Industrial Development Authority Rev. (Germantown Academy Project), “A”, 4%, 10/01/2046 | 625,000 | 460,850 | ||
| Northampton County, PA, General Purpose Authority College Rev. (Lafayette College), 4%, 11/01/2038 | 1,000,000 | 932,491 | ||
| Northampton County, PA, General Purpose University Authority Rev. (Lehigh University), “B”, VRDN, 4.02%, 12/01/2030 | 2,000,000 | 2,000,000 | ||
| Northeastern, PA, Hospital & Education Authority College Rev. (King's College Project), 5%, 5/01/2049 | 1,000,000 | 836,021 | ||
| Pennsylvania Higher Educational Facilities Authority Rev. (Drexel University), “A”, AGM, 5%, 5/01/2046 | 1,750,000 | 1,774,852 | ||
| Pennsylvania Higher Educational Facilities Authority Rev. (Duquesne University), “A”, 4%, 3/01/2037 | 750,000 | 697,996 | ||
| Pennsylvania Higher Educational Facilities Authority Rev. (Duquesne University), “A”, 5%, 3/01/2039 | 750,000 | 754,535 | ||
| Pennsylvania Higher Educational Facilities Authority Rev. (Widener University), “A”, 4%, 7/15/2051 | 1,250,000 | 919,873 | ||
| Pennsylvania Public School Building Authority, College Rev. (Delaware County Community College Project), BAM, 5%, 10/01/2038 | 1,200,000 | 1,216,352 | ||
| Pennsylvania Public School Building Authority, College Rev. (Montgomery County Community College), 5%, 5/01/2033 | 1,000,000 | 1,009,480 | ||
| Pennsylvania State University, Tax-Exempt, “A”, 5.25%, 9/01/2052 | 3,000,000 | 3,124,195 | ||
| Philadelphia, PA, Authority for Industrial Development University Rev. (Saint Joseph's University Project), 5.5%, 11/01/2060 | 1,000,000 | 1,015,190 | ||
| University of Puerto Rico Rev., “P”, NPFG, 5%, 6/01/2025 | 25,000 | 25,022 | ||
| Wilkes-Barre, PA, Finance Authority Rev. (University of Scranton), “A”, 5%, 11/01/2026 | 1,000,000 | 1,015,008 | ||
| $22,440,058 | ||||
| Universities - Dormitories – 0.7% | ||||
| East Hempfield Township, PA, Industrial Development Authority Rev. (Student Services, Inc., Student Housing Project at Millersville University of Pennsylvania), 5%, 7/01/2046 (Prerefunded 7/01/2024) | $ | 1,000,000 | $1,007,090 | |
| Utilities - Municipal Owned – 0.8% | ||||
| Guam Power Authority Rev., “A”, AGM, 5%, 10/01/2039 | $ | 95,000 | $95,229 | |
| Guam Power Authority Rev., “A”, AGM, 5%, 10/01/2044 | 105,000 | 103,873 | ||
| Philadelphia, PA, Gas Works Rev., 5%, 8/01/2031 | 500,000 | 501,648 | ||
| Puerto Rico Electric Power Authority Refunding Rev., “DDD”, 5%, 7/01/2020 (a)(d) | 15,000 | 3,750 | ||
| Puerto Rico Electric Power Authority Refunding Rev., “DDD”, 5%, 7/01/2021 (a)(d) | 150,000 | 37,500 | ||
| Puerto Rico Electric Power Authority Refunding Rev., “DDD”, 5%, 7/01/2022 (a)(d) | 245,000 | 61,250 | ||
| Puerto Rico Electric Power Authority Refunding Rev., “VV”, NPFG, 5.25%, 7/01/2034 | 15,000 | 14,793 | ||
| Puerto Rico Electric Power Authority Rev., “A”, 5%, 7/01/2029 (a)(d) | 390,000 | 97,500 | ||
| Puerto Rico Electric Power Authority Rev., “A”, 5%, 7/01/2042 (a)(d) | 55,000 | 13,750 | ||
| Puerto Rico Electric Power Authority Rev., “AAA”, 5.25%, 7/01/2021 (a)(d) | 25,000 | 6,250 | ||
| Puerto Rico Electric Power Authority Rev., “AAA”, 5.25%, 7/01/2030 (a)(d) | 15,000 | 3,750 | ||
| Puerto Rico Electric Power Authority Rev., “CCC”, 5.25%, 7/01/2027 (a)(d) | 140,000 | 35,000 | ||
| Puerto Rico Electric Power Authority Rev., “TT”, 5%, 7/01/2021 (a)(d) | 65,000 | 16,250 | ||
| Puerto Rico Electric Power Authority Rev., “TT”, 5%, 7/01/2023 (a)(d) | 65,000 | 16,250 | ||
| Puerto Rico Electric Power Authority Rev., “TT”, 5%, 7/01/2027 (a)(d) | 10,000 | 2,500 | ||
| Puerto Rico Electric Power Authority Rev., “TT”, 5%, 7/01/2037 (a)(d) | 200,000 | 50,000 | ||
| Puerto Rico Electric Power Authority Rev., “WW”, 5.375%, 7/01/2022 (a)(d) | 10,000 | 2,500 | ||
36
Portfolio of Investments (unaudited) –
continued
| Issuer | Shares/Par | Value ($) | ||
| Municipal Bonds – continued | ||||
| Utilities - Municipal Owned – continued | ||||
| Puerto Rico Electric Power Authority Rev., “WW”, 5.25%, 7/01/2025 (a)(d) | $ | 30,000 | $7,500 | |
| Puerto Rico Electric Power Authority Rev., “ZZ”, 5%, 7/01/2018 (a)(d) | 95,000 | 23,750 | ||
| Puerto Rico Electric Power Authority Rev., “ZZ”, 5.25%, 7/01/2023 (a)(d) | 105,000 | 26,250 | ||
| Puerto Rico Electric Power Authority Rev., “ZZ”, 5.25%, 7/01/2024 (a)(d) | 30,000 | 7,500 | ||
| Puerto Rico Electric Power Authority Rev., “ZZ”, 5.25%, 7/01/2026 (a)(d) | 95,000 | 23,750 | ||
| Puerto Rico Electric Power Authority Rev., Taxable, “EEE”, 6.05%, 7/01/2032 (a)(d) | 80,000 | 20,000 | ||
| $1,170,543 | ||||
| Utilities - Other – 3.2% | ||||
| Black Belt Energy Gas District, AL, Gas Project Rev., “A”, 4%, 6/01/2051 (Put Date 12/01/2031) | $ | 475,000 | $447,867 | |
| Black Belt Energy Gas District, AL, Gas Project Rev., “C-1”, 5.25%, 2/01/2053 (Put Date 6/01/2029) | 935,000 | 948,798 | ||
| California Community Choice Financing Authority, Clean Energy Project Rev., “C”, 5.25%, 1/01/2054 (Put Date 10/01/2031) | 925,000 | 922,818 | ||
| Public Authority for Colorado Energy Natural Gas Purchase Rev., 6.5%, 11/15/2038 | 280,000 | 316,740 | ||
| Southeast Alabama Energy Authority Commodity Supply Rev. (Project No. 5), “A”, 5.25%, 1/01/2054 (Put Date 7/01/2029) | 845,000 | 850,484 | ||
| Tennergy Corp., TN, Gas Supply Rev., “A”, 5.5%, 10/01/2053 (Put Date 12/01/2030) | 520,000 | 528,141 | ||
| Tennessee Energy Acquisition Corp., Gas Project Rev., “A-1”, 5%, 5/01/2053 (Put Date 5/01/2028) | 825,000 | 823,082 | ||
| $4,837,930 | ||||
| Water & Sewer Utility Revenue – 9.7% | ||||
| Allegheny County, PA, Sanitation Authority Sewer Rev., 5%, 6/01/2053 | $ | 1,000,000 | $1,010,204 | |
| Allegheny County, PA, Sanitation Authority Sewer Rev., BAM, 5%, 12/01/2030 | 500,000 | 508,932 | ||
| Bucks County, PA, Water & Sewer Authority Sewer System Rev. “A”, AGM, 4.25%, 12/01/2047 | 2,000,000 | 1,837,707 | ||
| Canonsburg-Houston, PA, Joint Authority Sewer Rev., “A”, 5%, 12/01/2040 | 1,000,000 | 1,013,425 | ||
| Clairton, PA, Municipal Authority Sewer Rev., “B”, 5%, 12/01/2042 | 500,000 | 478,367 | ||
| Erie, PA, Water Authority Rev., “A”, AGM, 5%, 12/01/2043 | 1,000,000 | 1,022,383 | ||
| Erie, PA, Water Authority Rev., “A”, AGM, 4%, 12/01/2050 | 995,000 | 844,053 | ||
| Erie, PA, Water Authority Rev., “D”, BAM, 4%, 12/01/2041 | 1,500,000 | 1,351,370 | ||
| Florida Capital Region Water Sewer System Rev., 5%, 7/15/2042 | 1,000,000 | 1,007,149 | ||
| Guam Waterworks Authority Rev. (Water and Wastewater System), “A”, 5%, 1/01/2050 | 205,000 | 189,982 | ||
| Philadelphia, PA, Water & Wastewater Rev., “A”, 5%, 10/01/2037 | 1,000,000 | 1,025,560 | ||
| Philadelphia, PA, Water & Wastewater Rev., “A”, 5%, 10/01/2038 | 1,000,000 | 1,020,670 | ||
| Philadelphia, PA, Water & Wastewater Rev., “B”, AGM, 5.5%, 9/01/2053 | 1,000,000 | 1,059,040 | ||
| Pittsburgh, PA, Water & Sewer System Authority Rev., “A”, AGM, 5%, 9/01/2048 | 1,000,000 | 1,028,077 | ||
| Pittsburgh, PA, Water & Sewer System Authority Subordinate Refunding Rev., “B”, AGM, 4%, 9/01/2034 | 1,500,000 | 1,442,244 | ||
| $14,839,163 | ||||
| Total Municipal Bonds (Identified Cost, $163,217,192) | $148,789,378 | |||
| Bonds – 0.3% | ||||
| Consumer Services – 0.3% | ||||
| Toll Road Investors Partnership II LP, Capital Appreciation, NPFG, 0%, 2/15/2025 (n) | $ | 270,000 | $243,119 | |
| Toll Road Investors Partnership II LP, Capital Appreciation, NPFG, 0%, 2/15/2043 (n) | 472,747 | 155,409 | ||
| Total Bonds (Identified Cost, $434,586) | $398,528 | |||
| Contingent Value Instruments – 0.1% | ||||
| General Obligations - General Purpose – 0.1% | ||||
| Commonwealth of Puerto Rico, General Obligation Contingent Value Instrument, 11/01/2043 (Identified Cost, $171,651) | $ | 289,308 | $150,079 | |
| Investment Companies (h) – 1.6% | ||||
| Money Market Funds – 1.6% | ||||
| MFS Institutional Money Market Portfolio, 5.4% (v) (Identified Cost, $2,422,879) | 2,422,905 | $2,423,389 | ||
| Other Assets, Less Liabilities – 0.6% | 984,264 | |||
| Net Assets – 100.0% | $152,745,638 | |||
See Portfolio Footnotes and Notes to
Financial Statements
37
Portfolio of Investments (unaudited) –
continued
MFS South Carolina Municipal
Bond Fund
| Issuer | Shares/Par | Value ($) | ||
| Municipal Bonds – 97.3% | ||||
| Airport Revenue – 3.3% | ||||
| Charleston County, SC, Airport District Rev., 5%, 7/01/2038 | $ | 750,000 | $768,653 | |
| Charleston County, SC, Airport District Rev., 5%, 7/01/2039 | 450,000 | 459,896 | ||
| Charleston County, SC, Airport District Rev., 5%, 7/01/2043 | 1,250,000 | 1,261,066 | ||
| Charleston County, SC, Airport District Rev., 5%, 7/01/2048 | 1,500,000 | 1,500,417 | ||
| Denver, CO, City & County Airport System Rev., “A”, 4.125%, 11/15/2047 | 160,000 | 139,456 | ||
| Denver, CO, City & County Airport System Rev., “A”, 4.125%, 11/15/2053 | 150,000 | 127,273 | ||
| Horry County, SC, Airport Refunding Rev., 4%, 7/01/2040 | 2,070,000 | 1,923,124 | ||
| Wayne County, MI, Airport Authority Rev. (Detroit Metropolitan Wayne County Airport), “B”, 5%, 12/01/2044 | 90,000 | 88,794 | ||
| Wayne County, MI, Airport Authority Rev. (Detroit Metropolitan Wayne County Airport), “B”, BAM, 5%, 12/01/2039 | 10,000 | 9,999 | ||
| Wayne County, MI, Airport Authority Rev. (Detroit Metropolitan Wayne County Airport), “C”, 5%, 12/01/2039 | 75,000 | 74,837 | ||
| Wayne County, MI, Airport Authority Rev. (Detroit Metropolitan Wayne County Airport), “C”, 5%, 12/01/2044 | 120,000 | 118,240 | ||
| $6,471,755 | ||||
| General Obligations - General Purpose – 4.5% | ||||
| Berkeley County, SC, General Obligation, 5%, 3/01/2033 | $ | 2,000,000 | $2,202,813 | |
| Bridgeview, IL, Stadium and Redevelopment Projects, Taxable, AAC, 5.14%, 12/01/2036 | 475,000 | 410,056 | ||
| Chicago, IL, General Obligation, “A”, 5%, 1/01/2025 | 325,000 | 327,528 | ||
| Chicago, IL, General Obligation, “A”, 5.5%, 1/01/2040 | 785,000 | 803,260 | ||
| Commonwealth of Puerto Rico, General Obligation Restructured Bonds, Capital Appreciation, Series 2022A, 0%, 7/01/2024 | 14,669 | 14,170 | ||
| Commonwealth of Puerto Rico, General Obligation Restructured Bonds, Capital Appreciation, Series 2022A, 0%, 7/01/2033 | 116,044 | 68,392 | ||
| Commonwealth of Puerto Rico, General Obligation Restructured Bonds, Series 2022A, 5.625%, 7/01/2027 | 99,518 | 102,122 | ||
| Commonwealth of Puerto Rico, General Obligation Restructured Bonds, Series 2022A, 5.625%, 7/01/2029 | 97,904 | 101,165 | ||
| Commonwealth of Puerto Rico, General Obligation Restructured Bonds, Series 2022A, 5.75%, 7/01/2031 | 330,093 | 344,723 | ||
| Commonwealth of Puerto Rico, General Obligation Restructured Bonds, Series 2022A, 4%, 7/01/2033 | 90,173 | 80,825 | ||
| Commonwealth of Puerto Rico, General Obligation Restructured Bonds, Series 2022A, 4%, 7/01/2035 | 170,651 | 148,305 | ||
| Commonwealth of Puerto Rico, General Obligation Restructured Bonds, Series 2022A, 4%, 7/01/2037 | 69,565 | 58,395 | ||
| Commonwealth of Puerto Rico, General Obligation Restructured Bonds, Series 2022A, 4%, 7/01/2041 | 94,583 | 76,046 | ||
| Commonwealth of Puerto Rico, General Obligation Restructured Bonds, Series 2022A, 4%, 7/01/2046 | 349,365 | 269,354 | ||
| Horry County, SC, Limited Obligation (Hospitality Fee & Local Accommodations Fee Pledge), 4.5%, 9/01/2052 | 2,000,000 | 1,828,819 | ||
| Lancaster County, SC, General Obligation Refunding, 3%, 3/01/2039 | 725,000 | 570,616 | ||
| State of Illinois, General Obligation, 5.5%, 5/01/2039 | 190,000 | 198,224 | ||
| State of Illinois, General Obligation, 5.75%, 5/01/2045 | 175,000 | 182,441 | ||
| State of Illinois, General Obligation, “B”, 5.5%, 5/01/2047 | 165,000 | 171,172 | ||
| State of Illinois, General Obligation, “C”, 4%, 10/01/2040 | 495,000 | 433,144 | ||
| State of Illinois, General Obligation, “C”, 4%, 10/01/2041 | 310,000 | 268,431 | ||
| Texas Cedar Port Navigation & Improvement District, Unlimited Tax, 4.5%, 8/31/2048 | 210,000 | 189,560 | ||
| Texas Cedar Port Navigation & Improvement District, Unlimited Tax, 4.5%, 8/31/2052 | 85,000 | 75,730 | ||
| $8,925,291 | ||||
| General Obligations - Schools – 7.9% | ||||
| Aiken County, SC, Consolidated School District Special Obligation, 4%, 6/01/2035 | $ | 275,000 | $271,503 | |
| Aiken County, SC, Consolidated School District Special Obligation, 3.125%, 6/01/2041 | 1,400,000 | 1,134,035 | ||
| Beaufort County, SC, School District General Obligation (Credit Enhancement Program), “B”, 5%, 2/29/2024 | 2,000,000 | 2,008,349 | ||
| Beaufort County, SC, School District, General Obligation , “C”, SCSDE, 4%, 3/01/2035 | 3,000,000 | 3,007,558 | ||
| Chicago, IL, Board of Education, Unlimited Tax General Obligation Dedicated Rev., “A”, 4%, 12/01/2047 | 770,000 | 598,149 | ||
| Little Rock, AR, School District & Construction, “A”, BAM, 3%, 2/01/2048 | 1,925,000 | 1,310,221 | ||
| Spartanburg County, SC, School District No. 4, General Obligation, “A”, SCSDE, 5%, 3/01/2047 | 2,000,000 | 2,063,418 | ||
| Spartanburg County, SC, School District No. 4, General Obligation, “A”, SCSDE, 5.25%, 3/01/2052 | 3,000,000 | 3,131,024 | ||
| Spartanburg County, SC, School District No. 7, General Obligation, “B”, SCSDE, 5%, 3/01/2048 | 2,000,000 | 2,041,427 | ||
| $15,565,684 | ||||
| Healthcare Revenue - Hospitals – 12.7% | ||||
| Allegheny County, PA, Hospital Development Authority Rev. (Allegheny Health Network Obligated Group), “A”, 4%, 4/01/2044 | $ | 255,000 | $207,051 | |
| Colorado Health Facilities Authority Rev. (CommonSpirit Health), “A-2”, 4%, 8/01/2049 | 50,000 | 40,273 | ||
| Doylestown, PA, Hospital Authority Rev., “A”, 4%, 6/30/2045 | 30,000 | 21,385 | ||
| Greenwood County, SC, Hospital Facilities Refunding Rev. (Self Regional Healthcare), 4%, 10/01/2036 | 1,975,000 | 1,846,465 | ||
| Harris County, TX, Cultural Education Facilities Finance Corp., Hospital Rev. (Memorial Hermann Health System), “A”, 4.125%, 7/01/2052 | 1,290,000 | 1,097,142 | ||
38
Portfolio of Investments (unaudited) –
continued
| Issuer | Shares/Par | Value ($) | ||
| Municipal Bonds – continued | ||||
| Healthcare Revenue - Hospitals – continued | ||||
| Lexington County, SC, Health Services District, Inc., Hospital Rev., 4%, 11/01/2031 | $ | 1,000,000 | $962,288 | |
| Lexington County, SC, Health Services District, Inc., Hospital Rev., 4%, 11/01/2032 | 1,000,000 | 956,246 | ||
| Lexington County, SC, Health Services District, Inc., Hospital Rev., 5%, 11/01/2035 | 1,000,000 | 1,007,574 | ||
| New York Dormitory Authority Rev. (Norwell Health Obligated Group), “A”, 4.25%, 5/01/2052 | 1,405,000 | 1,210,796 | ||
| North Carolina Medical Care Commission, Health Care Facilities Rev. (Rex Healthcare), “A”, 4%, 7/01/2049 | 1,580,000 | 1,309,609 | ||
| South Carolina Jobs & Economic Development Authority, Hospital Facilities Rev. (Bon Secours Mercy Health, Inc.), “A”, 4%, 12/01/2044 | 285,000 | 249,065 | ||
| South Carolina Jobs & Economic Development Authority, Hospital Facilities Rev. (Bon Secours Mercy Health, Inc.), “A”, 5%, 12/01/2046 | 2,000,000 | 2,001,619 | ||
| South Carolina Jobs & Economic Development Authority, Hospital Rev. (Anmed Health), 5%, 2/01/2038 | 1,500,000 | 1,503,310 | ||
| South Carolina Jobs & Economic Development Authority, Hospital Rev. (AnMed Health), 4.25%, 1/31/2048 | 2,000,000 | 1,793,016 | ||
| South Carolina Jobs & Economic Development Authority, Hospital Rev. (Conway Hospital, Inc.), 5.25%, 7/01/2047 | 2,000,000 | 1,976,820 | ||
| South Carolina Jobs & Economic Development Authority, Hospital Rev. (Hampton Regional Medical Center Project), 5%, 11/01/2037 | 500,000 | 465,355 | ||
| South Carolina Jobs & Economic Development Authority, Hospital Rev. (McLeod Health Projects), 4%, 11/01/2048 | 2,000,000 | 1,717,354 | ||
| South Carolina Jobs & Economic Development Authority, Hospital Rev. (Prisma Health Obligated Group), 5%, 5/01/2037 | 2,000,000 | 2,003,516 | ||
| Spartanburg County, SC, Regional Health Services District Hospital Rev., “A”, 4%, 4/15/2043 | 3,340,000 | 2,830,736 | ||
| Spartanburg County, SC, Regional Health Services District Hospital Rev., “A”, AGM, 4%, 4/15/2036 | 450,000 | 426,915 | ||
| Spartanburg County, SC, Regional Health Services District Hospital Rev., “A”, AGM, 4%, 4/15/2037 | 550,000 | 507,279 | ||
| Spartanburg County, SC, Regional Health Services District, Inc. Hospital Refunding Rev., 4%, 4/15/2037 | 1,000,000 | 922,446 | ||
| $25,056,260 | ||||
| Healthcare Revenue - Long Term Care – 2.1% | ||||
| South Carolina Jobs & Economic Development Authority Rev. (Bishop Gadsden Episcopal Retirement Community), “A”, 5%, 4/01/2049 | $ | 1,250,000 | $1,050,663 | |
| South Carolina Jobs & Economic Development Authority, Health Facilities Rev. (Lutheran Homes of South Carolina, Inc.), 5%, 5/01/2043 | 750,000 | 580,123 | ||
| South Carolina Jobs & Economic Development Authority, Health Facilities Rev. (Lutheran Homes of South Carolina, Inc.), 5.125%, 5/01/2048 | 250,000 | 188,975 | ||
| South Carolina Jobs & Economic Development Authority, Health Facilities Rev. (Lutheran Homes of South Carolina, Inc.), “B”, 5%, 5/01/2042 | 750,000 | 586,226 | ||
| South Carolina Jobs & Economic Development Authority, Health Facilities Rev. (Wesley Commons), 5%, 10/01/2036 (n) | 1,000,000 | 892,345 | ||
| South Carolina Jobs & Economic Development Authority, Residential Care Facilities Rev. (Episcopal Home at Still Hopes), 5%, 4/01/2047 | 1,000,000 | 798,212 | ||
| $4,096,544 | ||||
| Industrial Revenue - Other – 0.1% | ||||
| Port Beaumont, TX, Navigation District, Dock & Wharf Facility Rev. (Jefferson Gulf Coast Energy Project), “A”, 3.625%, 1/01/2035 (n) | $ | 100,000 | $77,307 | |
| Port Beaumont, TX, Navigation District, Dock & Wharf Facility Rev. (Jefferson Gulf Coast Energy Project), “A”, 2.875%, 1/01/2041 (n) | 260,000 | 161,525 | ||
| $238,832 | ||||
| Industrial Revenue - Paper – 0.0% | ||||
| Valparaiso, IN, Exempt Facilities Rev. (Pratt Paper LLC Project), 7%, 1/01/2044 | $ | 100,000 | $100,652 | |
| Miscellaneous Revenue - Other – 1.3% | ||||
| Matching Fund Special Purpose Securitization Corp., “A”, 5%, 10/01/2026 | $ | 100,000 | $100,381 | |
| New York Liberty Development Corp., Liberty Rev. (3 World Trade Center Project), “1”, 5%, 11/15/2044 (n) | 575,000 | 531,210 | ||
| Pennsylvania Economic Development Financing Authority, Private Activity Rev. (PennDOT Major Bridges Package One Project), AGM, 5%, 12/31/2057 | 795,000 | 765,759 | ||
| Saxe Gotha-Lexington, SC, Public Facilities Corp. Rev. (Icehouse Development Project), 5.5%, 5/03/2024 | 1,145,000 | 1,155,183 | ||
| $2,552,533 | ||||
| Multi-Family Housing Revenue – 0.3% | ||||
| New Hampshire National Finance Authority Municipal Certificates, “1-A”, 4.375%, 9/20/2036 | $ | 667,348 | $617,954 | |
| Port Revenue – 6.8% | ||||
| Port Authority of NY & NJ (221st Series), 4%, 7/15/2045 | $ | 1,820,000 | $1,555,060 | |
| South Carolina Ports Authority Rev., 5%, 7/01/2028 | 300,000 | 303,282 | ||
| South Carolina Ports Authority Rev., 5%, 7/01/2029 | 450,000 | 454,972 | ||
| South Carolina Ports Authority Rev., 5%, 7/01/2033 (Prerefunded 7/01/2025) | 500,000 | 504,353 | ||
39
Portfolio of Investments (unaudited) –
continued
| Issuer | Shares/Par | Value ($) | ||
| Municipal Bonds – continued | ||||
| Port Revenue – continued | ||||
| South Carolina Ports Authority Rev., 5%, 7/01/2036 | $ | 3,000,000 | $3,045,993 | |
| South Carolina Ports Authority Rev., 4%, 7/01/2055 | 2,000,000 | 1,564,608 | ||
| South Carolina Ports Authority Rev., 5.25%, 7/01/2055 (Prerefunded 7/01/2025) | 3,000,000 | 3,038,560 | ||
| South Carolina Ports Authority Rev., “B”, 5%, 7/01/2044 | 3,000,000 | 2,922,769 | ||
| $13,389,597 | ||||
| Sales & Excise Tax Revenue – 4.0% | ||||
| Chicago, IL, Metropolitan Pier & Exposition Authority Refunding Bonds (McCormick Place Expansion Project), Capital Appreciation, “B-1”, AGM, 0%, 6/15/2044 | $ | 2,485,000 | $847,701 | |
| Guam Government Business Privilege Tax Refunding, “F”, 5%, 1/01/2030 | 15,000 | 14,955 | ||
| Guam Government Business Privilege Tax Refunding, “F”, 5%, 1/01/2031 | 20,000 | 19,870 | ||
| Guam Government Business Privilege Tax Refunding, “F”, 4%, 1/01/2042 | 190,000 | 153,765 | ||
| Puerto Rico Sales Tax Financing Corp., Restructured Sales Tax Rev., “2019A-1”, 4.55%, 7/01/2040 | 49,000 | 45,084 | ||
| Puerto Rico Sales Tax Financing Corp., Restructured Sales Tax Rev., “2019A-1”, 4.75%, 7/01/2053 | 158,000 | 139,682 | ||
| Puerto Rico Sales Tax Financing Corp., Restructured Sales Tax Rev., “2019A-1”, 5%, 7/01/2058 | 3,610,000 | 3,265,546 | ||
| Puerto Rico Sales Tax Financing Corp., Restructured Sales Tax Rev., “2019A-2”, 4.329%, 7/01/2040 | 299,000 | 267,803 | ||
| Puerto Rico Sales Tax Financing Corp., Restructured Sales Tax Rev., “2019A-2”, 4.329%, 7/01/2040 | 163,000 | 145,993 | ||
| Puerto Rico Sales Tax Financing Corp., Restructured Sales Tax Rev., “2019A-2”, 4.536%, 7/01/2053 | 4,000 | 3,412 | ||
| Puerto Rico Sales Tax Financing Corp., Restructured Sales Tax Rev., “2019A-2”, 4.784%, 7/01/2058 | 71,000 | 61,972 | ||
| Puerto Rico Sales Tax Financing Corp., Restructured Sales Tax Rev., Capital Appreciation, “2019A-1”, 0%, 7/01/2024 | 3,000 | 2,904 | ||
| Puerto Rico Sales Tax Financing Corp., Restructured Sales Tax Rev., Capital Appreciation, “2019A-1”, 0%, 7/01/2027 | 79,000 | 67,267 | ||
| Puerto Rico Sales Tax Financing Corp., Restructured Sales Tax Rev., Capital Appreciation, “2019A-1”, 0%, 7/01/2029 | 14,000 | 10,886 | ||
| Puerto Rico Sales Tax Financing Corp., Restructured Sales Tax Rev., Capital Appreciation, “2019A-1”, 0%, 7/01/2031 | 725,000 | 513,610 | ||
| Puerto Rico Sales Tax Financing Corp., Restructured Sales Tax Rev., Capital Appreciation, “2019A-1”, 0%, 7/01/2033 | 695,000 | 445,321 | ||
| Puerto Rico Sales Tax Financing Corp., Restructured Sales Tax Rev., Capital Appreciation, “2019A-1”, 0%, 7/01/2046 | 5,158,000 | 1,329,672 | ||
| Wisconsin Public Finance Authority Limited Obligation Grant Rev. (American Dream at Meadowlands Project), “A”, 6.25%, 8/01/2027 (a)(d)(n) | 510,000 | 389,512 | ||
| Wisconsin Public Finance Authority Limited Obligation Grant Rev., Taxable (American Dream at Meadowlands Project), ”A“, 5.625%, 8/01/2024 (a)(d)(n) | 270,000 | 206,213 | ||
| $7,931,168 | ||||
| Secondary Schools – 0.5% | ||||
| District of Columbia Rev. (Rocketship D.C.), “A”, 5%, 6/01/2049 (n) | $ | 250,000 | $207,516 | |
| South Carolina Jobs & Economic Development Authority, Educational Facilities Rev. (Green Charter Schools Project), “A”, 4%, 6/01/2056 (n) | 1,400,000 | 853,623 | ||
| $1,061,139 | ||||
| Single Family Housing - State – 8.5% | ||||
| Connecticut Housing Finance Authority Rev. (Housing Mortgage Finance Program), “C-1”, 4%, 11/15/2047 | $ | 380,000 | $374,294 | |
| Maryland Community Development Administration, Department of Housing & Community Development Residential Rev., “A”, GNMA, 4.45%, 9/01/2043 | 1,195,000 | 1,117,231 | ||
| Maryland Community Development Administration, Department of Housing & Community Development Residential Rev., “A”, GNMA, 4.5%, 9/01/2046 | 400,000 | 369,488 | ||
| South Carolina Housing Finance & Development Authority Mortgage Rev., “A”, 3.75%, 7/01/2043 | 285,000 | 260,185 | ||
| South Carolina Housing Finance & Development Authority Mortgage Rev., “A”, 3.8%, 1/01/2049 | 270,000 | 244,501 | ||
| South Carolina Housing Finance & Development Authority Mortgage Rev., “A”, 3%, 1/01/2052 | 2,910,000 | 2,737,918 | ||
| South Carolina Housing Finance & Development Authority Mortgage Rev., “A”, 4.95%, 7/01/2053 | 1,000,000 | 980,967 | ||
| South Carolina Housing Finance & Development Authority Mortgage Rev., “A”, 5.75%, 1/01/2054 | 3,000,000 | 3,136,420 | ||
| South Carolina Housing Finance & Development Authority Mortgage Rev., “B”, 4.2%, 7/01/2042 | 1,995,000 | 1,841,918 | ||
| South Carolina Housing Finance & Development Authority Mortgage Rev., “B”, 3.25%, 1/01/2052 | 2,415,000 | 2,306,770 | ||
| South Carolina Housing Finance & Development Authority Mortgage Rev., “B”, 4.9%, 6/30/2053 | 1,355,000 | 1,318,867 | ||
| South Carolina Housing Finance & Development Authority Mortgage Rev., “B”, 6%, 12/31/2053 | 2,000,000 | 2,114,225 | ||
| $16,802,784 | ||||
| State & Local Agencies – 7.8% | ||||
| Dillon County, SC, School Facilities Corp., 5%, 12/01/2032 | $ | 1,625,000 | $1,709,142 | |
| Dillon County, SC, School Facilities Corp., 5%, 12/01/2033 | 1,705,000 | 1,792,535 | ||
| Greenwood, SC, Fifty School Facilities, Inc., Installment Purchase Rev. (School District No. 50), BAM, 5%, 12/01/2028 | 3,000,000 | 3,088,164 | ||
| Orangeburg County, SC, Facilities Corp. Installment Purchase Rev. (Detention Center Project), 4%, 12/01/2042 | 2,000,000 | 1,706,090 | ||
40
Portfolio of Investments (unaudited) –
continued
| Issuer | Shares/Par | Value ($) | ||
| Municipal Bonds – continued | ||||
| State & Local Agencies – continued | ||||
| Orangeburg County, SC, School District, Special Obligation, 5%, 6/01/2029 | $ | 740,000 | $752,689 | |
| Orangeburg County, SC, School District, Special Obligation, 5%, 6/01/2030 | 870,000 | 885,922 | ||
| Pennsylvania Public School Building Authority, School Lease Rev. (School District of Philadelphia Project), “A”, AGM, 5%, 6/01/2033 | 1,115,000 | 1,143,411 | ||
| Scago, SC, Educational Facilities Installment Purchase Rev. (School District of Pickens County Project), 5%, 12/01/2028 | 2,000,000 | 2,022,870 | ||
| Sumter, SC, School Facilities, Inc., Installment Purchase Rev. (Sumter Two School Facilities, Inc.), BAM, 5%, 12/01/2026 | 1,000,000 | 1,020,805 | ||
| Sumter, SC, School Facilities, Inc., Installment Purchase Rev. (Sumter Two School Facilities, Inc.), BAM, 5%, 12/01/2027 | 1,195,000 | 1,217,678 | ||
| $15,339,306 | ||||
| Student Loan Revenue – 0.6% | ||||
| New Jersey Higher Education Student Assistance Authority, Senior Student Loan Rev., “B”, 4%, 12/01/2041 | $ | 1,180,000 | $1,116,207 | |
| Tax - Other – 3.0% | ||||
| Birmingham-Jefferson, AL, Civic Center Authority, “B”, 5%, 7/01/2043 | $ | 940,000 | $937,563 | |
| Chicago, IL, Board of Education, Dedicated Capital Improvement Tax Bond, 5%, 4/01/2045 | 135,000 | 133,258 | ||
| Chicago, IL, Board of Education, Dedicated Capital Improvement Tax Bond, 5.75%, 4/01/2048 | 375,000 | 392,586 | ||
| Greenville County, SC, Road Fee Rev., 4%, 4/01/2043 | 1,000,000 | 912,243 | ||
| Guam Government Limited Obligation Rev., “A”, 5%, 12/01/2036 | 95,000 | 92,735 | ||
| Guam Government Limited Obligation Rev., “A”, 5%, 12/01/2046 | 285,000 | 249,921 | ||
| Myrtle Beach, SC, Tax Increment Refunding Bonds Rev. (Myrtle Beach Air Force Base Redevelopment Project Area), 5%, 10/01/2030 | 1,000,000 | 1,024,919 | ||
| North Charleston, SC, Limited Obligation Bond (Hospitality Fee Pledge), “A”, 5%, 10/01/2040 | 2,000,000 | 2,023,118 | ||
| Wisconsin Public Finance Authority Limited Obligation PILOT Rev. (American Dream at Meadowlands Project), 7%, 12/01/2050 | 165,000 | 146,811 | ||
| $5,913,154 | ||||
| Tax Assessment – 0.4% | ||||
| Berkeley County, SC, Assessment Rev. (Nexton Improvement District), 4.375%, 11/01/2049 (n) | $ | 1,000,000 | $769,741 | |
| Brunswick, MD, Special Obligation Refunding (Brunswick Crossing Special Taxing District), 4%, 7/01/2029 | 20,000 | 19,088 | ||
| Brunswick, MD, Special Obligation Refunding (Brunswick Crossing Special Taxing District), 5%, 7/01/2036 | 18,000 | 17,585 | ||
| $806,414 | ||||
| Tobacco – 0.8% | ||||
| Buckeye, OH, Tobacco Settlement Financing Authority Senior Asset-Backed Refunding, 2020A-2, “1”, 4%, 6/01/2048 | $ | 280,000 | $236,510 | |
| Buckeye, OH, Tobacco Settlement Financing Authority Senior Asset-Backed Refunding, 2020B-2, “2”, 5%, 6/01/2055 | 740,000 | 637,443 | ||
| Golden State, CA, Tobacco Securitization Corp., Tobacco Settlement Rev., Taxable, “B-1”, 3.85%, 6/01/2050 | 765,000 | 693,896 | ||
| $1,567,849 | ||||
| Toll Roads – 0.7% | ||||
| Virginia Small Business Financing Authority Senior Lien Refunding Rev. (95 Express Lanes LLC Project), 5%, 1/01/2035 | $ | 800,000 | $828,974 | |
| Virginia Small Business Financing Authority Senior Lien Rev. (Elizabeth River Crossings Opco LLC Project), 3%, 1/01/2041 | 765,000 | 550,736 | ||
| $1,379,710 | ||||
| Transportation - Special Tax – 1.8% | ||||
| New Jersey Transportation Trust Fund Authority, “A”, 5%, 12/15/2039 | $ | 125,000 | $128,232 | |
| New Jersey Transportation Trust Fund Authority, “CC”, 5.5%, 6/15/2050 | 120,000 | 126,434 | ||
| South Carolina Transportation Infrastructure Bank Refunding Rev., “A”, 5%, 10/01/2036 | 1,205,000 | 1,239,680 | ||
| South Carolina Transportation Infrastructure Bank Rev., “A”, 5%, 10/01/2040 | 2,000,000 | 2,033,816 | ||
| $3,528,162 | ||||
| Universities - Colleges – 4.4% | ||||
| Clemson University, SC, Athletic Facilities Rev., “A”, 3%, 5/01/2048 | $ | 3,000,000 | $2,039,954 | |
| Puerto Rico Industrial, Tourist, Educational, Medical & Environmental Control Facilities Financing Authority, Higher Education Rev. (University of Sacred Heart), 4.375%, 10/01/2031 | 55,000 | 55,041 | ||
| Puerto Rico Industrial, Tourist, Educational, Medical & Environmental Control Facilities Financing Authority, Higher Education Rev. (University of Sacred Heart), 5%, 10/01/2042 | 70,000 | 70,135 | ||
| Red River, TX, Education Finance Corp., Higher Education Rev. (Houston Baptist University Project), 5.5%, 10/01/2046 | 390,000 | 383,570 | ||
| South Carolina Jobs & Economic Development Authority (Furman University), 5%, 10/01/2028 | 700,000 | 708,698 | ||
| South Carolina Jobs & Economic Development Authority (Wofford College), 5%, 4/01/2035 | 1,565,000 | 1,583,907 | ||
| South Carolina Jobs & Economic Development Authority (Wofford College), 5%, 4/01/2049 | 2,000,000 | 1,940,936 | ||
| University of Puerto Rico Rev., “P”, NPFG, 5%, 6/01/2025 | 30,000 | 30,027 | ||
41
Portfolio of Investments (unaudited) –
continued
| Issuer | Shares/Par | Value ($) | ||
| Municipal Bonds – continued | ||||
| Universities - Colleges – continued | ||||
| University of South Carolina, Higher Education Rev. (Campus Village Project), “A”, 5%, 5/01/2046 | $ | 1,900,000 | $1,938,898 | |
| $8,751,166 | ||||
| Utilities - Municipal Owned – 6.7% | ||||
| Guam Power Authority Rev., “A”, AGM, 5%, 10/01/2039 | $ | 145,000 | $145,349 | |
| Guam Power Authority Rev., “A”, AGM, 5%, 10/01/2044 | 170,000 | 168,175 | ||
| Puerto Rico Electric Power Authority Refunding Rev., “DDD”, 5%, 7/01/2020 (a)(d) | 20,000 | 5,000 | ||
| Puerto Rico Electric Power Authority Refunding Rev., “DDD”, 5%, 7/01/2021 (a)(d) | 205,000 | 51,250 | ||
| Puerto Rico Electric Power Authority Refunding Rev., “DDD”, 5%, 7/01/2022 (a)(d) | 330,000 | 82,500 | ||
| Puerto Rico Electric Power Authority Refunding Rev., “VV”, NPFG, 5.25%, 7/01/2034 | 25,000 | 24,655 | ||
| Puerto Rico Electric Power Authority Rev., “A”, 5%, 7/01/2029 (a)(d) | 525,000 | 131,250 | ||
| Puerto Rico Electric Power Authority Rev., “A”, 5%, 7/01/2042 (a)(d) | 80,000 | 20,000 | ||
| Puerto Rico Electric Power Authority Rev., “AAA”, 5.25%, 7/01/2021 (a)(d) | 40,000 | 10,000 | ||
| Puerto Rico Electric Power Authority Rev., “AAA”, 5.25%, 7/01/2030 (a)(d) | 20,000 | 5,000 | ||
| Puerto Rico Electric Power Authority Rev., “CCC”, 5.25%, 7/01/2027 (a)(d) | 190,000 | 47,500 | ||
| Puerto Rico Electric Power Authority Rev., “TT”, 5%, 7/01/2021 (a)(d) | 100,000 | 25,000 | ||
| Puerto Rico Electric Power Authority Rev., “TT”, 5%, 7/01/2023 (a)(d) | 90,000 | 22,500 | ||
| Puerto Rico Electric Power Authority Rev., “TT”, 5%, 7/01/2027 (a)(d) | 15,000 | 3,750 | ||
| Puerto Rico Electric Power Authority Rev., “TT”, 5%, 7/01/2037 (a)(d) | 270,000 | 67,500 | ||
| Puerto Rico Electric Power Authority Rev., “WW”, 5.375%, 7/01/2022 (a)(d) | 15,000 | 3,750 | ||
| Puerto Rico Electric Power Authority Rev., “WW”, 5.25%, 7/01/2025 (a)(d) | 40,000 | 10,000 | ||
| Puerto Rico Electric Power Authority Rev., “ZZ”, 5%, 7/01/2018 (a)(d) | 120,000 | 30,000 | ||
| Puerto Rico Electric Power Authority Rev., “ZZ”, 5.25%, 7/01/2023 (a)(d) | 140,000 | 35,000 | ||
| Puerto Rico Electric Power Authority Rev., “ZZ”, 5.25%, 7/01/2024 (a)(d) | 45,000 | 11,250 | ||
| Puerto Rico Electric Power Authority Rev., “ZZ”, 5.25%, 7/01/2026 (a)(d) | 145,000 | 36,250 | ||
| Puerto Rico Electric Power Authority Rev., Taxable, “EEE”, 6.05%, 7/01/2032 (a)(d) | 115,000 | 28,750 | ||
| Rock Hill, SC, Utility Systems Rev., 5%, 1/01/2041 | 1,000,000 | 1,005,771 | ||
| Rock Hill, SC, Utility Systems Rev., “A”, BAM, 4%, 1/01/2049 | 650,000 | 556,313 | ||
| South Carolina Patriots Energy Group Gas System Improvement Refunding Rev., “A”, 4%, 6/01/2035 | 500,000 | 472,323 | ||
| South Carolina Patriots Energy Group Gas System Improvement Refunding Rev., “A”, 4%, 6/01/2036 | 500,000 | 465,490 | ||
| South Carolina Public Service Authority Improvement Rev., “B”, 4%, 12/01/2038 | 1,750,000 | 1,586,170 | ||
| South Carolina Public Service Authority Improvement Rev., “B”, 4%, 12/01/2039 | 1,500,000 | 1,347,899 | ||
| South Carolina Public Service Authority Improvement Rev., Tax-Exempt, “B”, 5%, 12/01/2051 | 2,055,000 | 1,998,784 | ||
| South Carolina Public Service Authority Improvement Rev., Tax-Exempt, “E”, AGM, 5.25%, 12/01/2038 | 2,000,000 | 2,106,494 | ||
| South Carolina Public Service Authority Refunding Rev., “A”, 4%, 12/01/2040 | 3,000,000 | 2,666,160 | ||
| $13,169,833 | ||||
| Utilities - Other – 3.3% | ||||
| Black Belt Energy Gas District, AL, Gas Project Rev. (Project No. 8), “A”, 4%, 12/01/2052 (Put Date 12/01/2029) | $ | 520,000 | $485,690 | |
| Black Belt Energy Gas District, AL, Gas Project Rev., “C-1”, 5.25%, 2/01/2053 (Put Date 6/01/2029) | 1,230,000 | 1,248,151 | ||
| California Community Choice Financing Authority, Clean Energy Project Rev., “C”, 5.25%, 1/01/2054 (Put Date 10/01/2031) | 1,195,000 | 1,192,181 | ||
| Public Authority for Colorado Energy Natural Gas Purchase Rev., 6.25%, 11/15/2028 | 130,000 | 136,050 | ||
| Southeast Alabama Energy Authority Commodity Supply Rev. (Project No. 5), “A”, 5.25%, 1/01/2054 (Put Date 7/01/2029) | 1,090,000 | 1,097,074 | ||
| Tennergy Corp., TN, Gas Supply Rev., “A”, 5.5%, 10/01/2053 (Put Date 12/01/2030) | 685,000 | 695,725 | ||
| Tennessee Energy Acquisition Corp., Gas Project Rev., “A”, 5.25%, 9/01/2026 | 570,000 | 571,605 | ||
| Tennessee Energy Acquisition Corp., Gas Project Rev., “A-1”, 5%, 5/01/2053 (Put Date 5/01/2028) | 1,065,000 | 1,062,524 | ||
| $6,489,000 | ||||
| Water & Sewer Utility Revenue – 15.8% | ||||
| Columbia, SC, Stormwater System Rev. (City Improvements), 5%, 2/01/2038 | $ | 755,000 | $780,974 | |
| Columbia, SC, Waterworks & Sewer System Rev., 4%, 2/01/2043 | 2,000,000 | 1,838,462 | ||
| Columbia, SC, Waterworks & Sewer System Rev., 5%, 2/01/2047 | 1,000,000 | 1,040,652 | ||
| Columbia, SC, Waterworks & Sewer System Rev., 5.25%, 2/01/2052 | 500,000 | 526,063 | ||
| Dorchester County, SC, Waterworks & Sewer Systems Rev., 4.25%, 10/01/2048 | 2,250,000 | 2,039,684 | ||
| Guam Waterworks Authority Rev. (Water and Wastewater System), 5%, 7/01/2036 | 90,000 | 90,005 | ||
| Guam Waterworks Authority Rev. (Water and Wastewater System), 5%, 1/01/2046 | 410,000 | 386,414 | ||
| Guam Waterworks Authority Rev. (Water and Wastewater System), “A”, 5%, 1/01/2050 | 300,000 | 278,023 | ||
| Kershaw County, SC, Waterworks System Rev. (Lugoff Water District), “B”, 5%, 7/01/2030 | 500,000 | 514,992 | ||
42
Portfolio of Investments (unaudited) –
continued
| Issuer | Shares/Par | Value ($) | ||
| Municipal Bonds – continued | ||||
| Water & Sewer Utility Revenue – continued | ||||
| Kershaw County, SC, Waterworks System Rev. (Lugoff Water District), “B”, 5%, 7/01/2035 | $ | 500,000 | $512,243 | |
| Lexington County, SC, Joint Municipal Water & Sewer Commission and Improvement Refunding Rev., “A”, 4%, 6/01/2043 | 1,260,000 | 1,157,398 | ||
| Lexington, SC, Waterworks & Sewer Systems Rev., 4%, 6/01/2041 | 2,000,000 | 1,847,593 | ||
| Michigan Finance Authority Local Government Loan Program Rev. (Detroit Water and Sewerage Department Sewage Disposal System Rev. Refunding Second Lien Local Project), “C-7”, NPFG, 5%, 7/01/2032 | 50,000 | 50,285 | ||
| Michigan Finance Authority Local Government Loan Program Rev. (Detroit Water and Sewerage Department Water Supply System Rev. Refunding Second Lien Local Project), “D-6”, NPFG, 5%, 7/01/2036 | 60,000 | 60,132 | ||
| Michigan Finance Authority Local Government Loan Program Rev. (Detroit Water and Sewerage Department Water Supply System Rev. Refunding Senior Lien Local Project), “D-1”, AGM, 5%, 7/01/2035 | 30,000 | 30,143 | ||
| Michigan Finance Authority Local Government Loan Program Rev. (Detroit Water and Sewerage Department Water Supply System Rev. Refunding Senior Lien Local Project), “D-1”, AGM, 5%, 7/01/2037 | 70,000 | 70,190 | ||
| Mount Pleasant, SC, Waterworks & Sewer System Rev., “A”, 5%, 6/01/2036 | 1,000,000 | 1,036,001 | ||
| Mount Pleasant, SC, Waterworks & Sewer System Rev., “A”, 5%, 6/01/2037 | 1,000,000 | 1,031,243 | ||
| Myrtle Beach, SC, Waterworks & Sewer System Improvement Refunding Rev., “C”, 5%, 2/28/2042 | 605,000 | 629,224 | ||
| Myrtle Beach, SC, Waterworks & Sewer System Improvement Refunding Rev., “C”, 5%, 2/28/2043 | 325,000 | 337,590 | ||
| Myrtle Beach, SC, Waterworks & Sewer System Improvement Refunding Rev., “C”, 5%, 2/28/2045 | 1,350,000 | 1,387,032 | ||
| Myrtle Beach, SC, Waterworks & Sewer System Improvement Refunding Rev., “C”, 4%, 2/29/2048 | 1,645,000 | 1,463,539 | ||
| North Charleston, SC, Sewer District, 5%, 7/01/2039 | 3,425,000 | 3,433,697 | ||
| South Island Public Service District, SC, Waterworks & Sewer System Improvement Rev., 4.5%, 4/01/2052 | 5,000,000 | 4,479,210 | ||
| Spartanburg, SC, Sanitary Sewer District Convertible Rev., “B”, 5%, 3/01/2034 | 2,000,000 | 2,021,437 | ||
| Spartanburg, SC, Water System Refunding & Improvement Rev., “B”, 5%, 6/01/2039 | 2,000,000 | 2,034,698 | ||
| York County, SC, Water and Sewer System Rev., 4%, 6/01/2040 | 1,100,000 | 1,025,933 | ||
| York County, SC, Water and Sewer System Rev., 4%, 6/01/2042 | 1,100,000 | 1,016,734 | ||
| $31,119,591 | ||||
| Total Municipal Bonds (Identified Cost, $211,196,474) | $191,990,585 | |||
| Bonds – 0.3% | ||||
| Consumer Services – 0.3% | ||||
| Toll Road Investors Partnership II LP, Capital Appreciation, NPFG, 0%, 2/15/2025 (n) | $ | 420,000 | $378,185 | |
| Toll Road Investors Partnership II LP, Capital Appreciation, NPFG, 0%, 2/15/2043 (n) | 756,395 | 248,654 | ||
| Total Bonds (Identified Cost, $683,868) | $626,839 | |||
| Contingent Value Instruments – 0.1% | ||||
| General Obligations - General Purpose – 0.1% | ||||
| Commonwealth of Puerto Rico, General Obligation Contingent Value Instrument, 11/01/2043 (Identified Cost, $253,316) | $ | 426,950 | $221,480 | |
| Investment Companies (h) – 0.8% | ||||
| Money Market Funds – 0.8% | ||||
| MFS Institutional Money Market Portfolio, 5.4% (v) (Identified Cost, $1,496,972) | 1,496,832 | $1,497,131 | ||
| Other Assets, Less Liabilities – 1.5% | 2,879,935 | |||
| Net Assets – 100.0% | $197,215,970 | |||
See Portfolio Footnotes and Notes to
Financial Statements
43
Portfolio of Investments (unaudited) –
continued
MFS Virginia Municipal Bond
Fund
| Issuer | Shares/Par | Value ($) | ||
| Municipal Bonds – 97.4% | ||||
| Airport Revenue – 4.3% | ||||
| Metropolitan Washington, D.C., Airport Authority System Refunding Rev., “A”, 5%, 9/30/2034 | $ | 3,000,000 | $2,978,591 | |
| Metropolitan Washington, D.C., Airport Authority System Refunding Rev., “A”, 5%, 10/01/2037 | 1,000,000 | 1,006,729 | ||
| Metropolitan Washington, D.C., Airport Authority System Refunding Rev., “A”, 5%, 10/01/2038 | 1,000,000 | 1,003,394 | ||
| Metropolitan Washington, D.C., Airport Authority System Refunding Rev., “A”, 4%, 10/01/2039 | 1,000,000 | 917,768 | ||
| Metropolitan Washington, D.C., Airport Authority System Refunding Rev., “A”, 4%, 10/01/2041 | 1,000,000 | 897,341 | ||
| Metropolitan Washington, D.C., Airport Authority System Refunding Rev., “A”, 5.25%, 10/01/2048 | 3,600,000 | 3,676,888 | ||
| Metropolitan Washington, D.C., Airport Authority System Refunding Rev., “B”, 5%, 10/01/2027 | 980,000 | 987,748 | ||
| Metropolitan Washington, D.C., Airport Authority System Refunding Rev., “B”, 5%, 10/01/2028 | 1,000,000 | 1,008,973 | ||
| New York Transportation Development Corp. Special Facilities (LaGuardia Airport Terminal B Redevelopment Project), “A”, 5%, 7/01/2034 | 995,000 | 985,364 | ||
| San Francisco, CA, City & County Airports Commission, International Airport Rev., “B”, 5%, 5/01/2046 | 1,160,000 | 1,155,490 | ||
| $14,618,286 | ||||
| General Obligations - General Purpose – 9.3% | ||||
| Alexandria, VA, General Obligation, “B”, 4%, 12/15/2043 | $ | 1,375,000 | $1,246,544 | |
| Alexandria, VA, General Obligation, “B”, 4%, 12/15/2044 | 1,430,000 | 1,286,636 | ||
| Alexandria, VA, General Obligation, “B”, 4%, 12/15/2045 | 1,485,000 | 1,326,110 | ||
| Alexandria, VA, General Obligation, “B”, 4%, 12/15/2046 | 1,550,000 | 1,373,761 | ||
| Alexandria, VA, General Obligation, “B”, 4%, 12/15/2047 | 1,610,000 | 1,416,622 | ||
| Bridgeview, IL, Stadium and Redevelopment Projects, Taxable, AAC, 5.14%, 12/01/2036 | 775,000 | 669,038 | ||
| Chesterfield County, VA, Public Improvement, “A”, 4%, 1/01/2036 | 1,570,000 | 1,574,962 | ||
| Chicago, IL, General Obligation, “A”, 5.5%, 1/01/2040 | 1,300,000 | 1,330,240 | ||
| Chicago, IL, General Obligation, “F”, 5.5%, 1/01/2042 | 475,000 | 470,946 | ||
| Commonwealth of Puerto Rico, General Obligation Restructured Bonds, Capital Appreciation, Series 2022A, 0%, 7/01/2024 | 21,717 | 20,979 | ||
| Commonwealth of Puerto Rico, General Obligation Restructured Bonds, Capital Appreciation, Series 2022A, 0%, 7/01/2033 | 171,803 | 101,255 | ||
| Commonwealth of Puerto Rico, General Obligation Restructured Bonds, Series 2022A, 5.625%, 7/01/2027 | 147,336 | 151,191 | ||
| Commonwealth of Puerto Rico, General Obligation Restructured Bonds, Series 2022A, 5.625%, 7/01/2029 | 144,946 | 149,774 | ||
| Commonwealth of Puerto Rico, General Obligation Restructured Bonds, Series 2022A, 5.75%, 7/01/2031 | 318,785 | 332,914 | ||
| Commonwealth of Puerto Rico, General Obligation Restructured Bonds, Series 2022A, 4%, 7/01/2033 | 133,501 | 119,662 | ||
| Commonwealth of Puerto Rico, General Obligation Restructured Bonds, Series 2022A, 4%, 7/01/2035 | 251,000 | 218,132 | ||
| Commonwealth of Puerto Rico, General Obligation Restructured Bonds, Series 2022A, 4%, 7/01/2037 | 102,991 | 86,454 | ||
| Commonwealth of Puerto Rico, General Obligation Restructured Bonds, Series 2022A, 4%, 7/01/2041 | 140,029 | 112,585 | ||
| Commonwealth of Puerto Rico, General Obligation Restructured Bonds, Series 2022A, 4%, 7/01/2046 | 476,628 | 367,471 | ||
| Fairfax County, VA, Public Improvement, “A”, 5%, 10/01/2037 | 2,000,000 | 2,105,176 | ||
| Fairfax County, VA, Public Improvement, “B”, 4%, 10/01/2025 | 3,900,000 | 3,917,591 | ||
| Lynchburg, VA, Public Improvement, 5%, 6/01/2026 | 1,000,000 | 1,008,602 | ||
| Newport News, VA, General Obligation Improvement, “A”, 4%, 2/01/2038 | 1,425,000 | 1,350,294 | ||
| Norfolk, VA, General Obligation Capital Improvement, 5%, 8/01/2043 (Prerefunded 8/01/2028) | 2,615,000 | 2,796,914 | ||
| Norfolk, VA, General Obligation Capital Improvement, “A”, 5%, 9/01/2039 | 800,000 | 857,912 | ||
| Norfolk, VA, General Obligation Capital Improvement, “A”, 5%, 9/01/2040 | 925,000 | 988,850 | ||
| Petersburg, VA, General Obligation, 4.25%, 9/01/2048 | 1,160,000 | 1,077,185 | ||
| Petersburg, VA, General Obligation, 4.25%, 9/01/2053 | 1,500,000 | 1,372,832 | ||
| State of Illinois, General Obligation, 5.5%, 5/01/2039 | 270,000 | 281,686 | ||
| State of Illinois, General Obligation, 5.75%, 5/01/2045 | 245,000 | 255,418 | ||
| State of Illinois, General Obligation, “B”, 5.5%, 5/01/2047 | 280,000 | 290,474 | ||
| State of Illinois, General Obligation, “C”, 4%, 10/01/2040 | 805,000 | 704,406 | ||
| State of Illinois, General Obligation, “C”, 4%, 10/01/2041 | 505,000 | 437,282 | ||
| Suffolk, VA, General Obligation Capital Improvement, “A”, 2%, 2/01/2039 | 1,675,000 | 1,111,372 | ||
| Texas Cedar Port Navigation & Improvement District, Unlimited Tax, 4.5%, 8/31/2048 | 365,000 | 329,473 | ||
| Texas Cedar Port Navigation & Improvement District, Unlimited Tax, 4.5%, 8/31/2052 | 145,000 | 129,186 | ||
| $31,369,929 | ||||
| Healthcare Revenue - Hospitals – 13.3% | ||||
| Arlington County, VA, Industrial Development Authority, Hospital Rev. (Virginia Hospital Center), 5%, 7/01/2037 | $ | 2,800,000 | $2,891,958 | |
| Chesapeake, VA, Hospital Authority Facility Rev. (Chesapeake Regional Medical Center), 5%, 7/01/2033 | 2,000,000 | 2,077,630 | ||
| Chesapeake, VA, Hospital Authority Facility Rev. (Chesapeake Regional Medical Center), 5%, 7/01/2034 | 1,475,000 | 1,534,970 | ||
| Chesapeake, VA, Hospital Authority Facility Rev. (Chesapeake Regional Medical Center), 4%, 7/01/2043 | 625,000 | 531,111 | ||
| Doylestown, PA, Hospital Authority Rev., “A”, 4%, 6/30/2045 (Prerefunded 7/01/2029) | 5,000 | 5,110 | ||
44
Portfolio of Investments (unaudited) –
continued
| Issuer | Shares/Par | Value ($) | ||
| Municipal Bonds – continued | ||||
| Healthcare Revenue - Hospitals – continued | ||||
| Doylestown, PA, Hospital Authority Rev., “A”, 4%, 6/30/2045 | $ | 40,000 | $28,514 | |
| Fairfax County, VA, Industrial Development Authority Health Care Rev. (Inova Health System Project), “A”, 4%, 5/15/2044 | 2,000,000 | 1,812,976 | ||
| Fairfax County, VA, Industrial Development Authority Health Care Rev. (Inova Health System Project), “A”, 5%, 5/15/2044 | 2,000,000 | 2,002,612 | ||
| Fairfax County, VA, Industrial Development Authority Health Care Rev. (Inova Health System Project), “A”, 4%, 5/15/2048 | 4,000,000 | 3,439,585 | ||
| Franklin County, VA, Industrial Development Authority Health Care Refunding Rev. (Inova Health System Project), 5%, 5/15/2029 | 1,475,000 | 1,565,214 | ||
| Fredericksburg, VA, Economic Development Authority, Hospital Facilities Rev. (Mary Washington Healthcare Obligated Group), 5%, 6/15/2031 | 750,000 | 752,205 | ||
| Fredericksburg, VA, Economic Development Authority, Hospital Facilities Rev. (Mary Washington Healthcare Obligated Group), 5%, 6/15/2033 | 1,000,000 | 1,002,227 | ||
| Harris County, TX, Cultural Education Facilities Finance Corp., Hospital Rev. (Memorial Hermann Health System), “A”, 4.125%, 7/01/2052 | 1,835,000 | 1,560,663 | ||
| Lynchburg, VA, Economic Development Authority Hospital Refunding Rev. (Centra Health Obligated Group), 4%, 1/01/2038 | 2,200,000 | 2,010,731 | ||
| Lynchburg, VA, Economic Development Authority Hospital Refunding Rev. (Centra Health Obligated Group), 4%, 1/01/2039 | 1,320,000 | 1,193,496 | ||
| Lynchburg, VA, Economic Development Authority Hospital Refunding Rev. (Centra Health Obligated Group), 4%, 1/01/2040 | 550,000 | 493,112 | ||
| Lynchburg, VA, Economic Development Authority Rev. (Centra Health), “A”, 5%, 1/01/2047 | 3,000,000 | 2,871,927 | ||
| Norfolk, VA, Economic Development Authority Hospital Facilities Refunding Rev. (Sentara Healthcare), “B”, 4%, 11/01/2048 | 3,000,000 | 2,638,480 | ||
| Roanoke, VA, Economic Development Authority, Hospital Rev. (Carilion Medical Center), “A”, 5%, 7/01/2047 | 1,625,000 | 1,638,049 | ||
| Rockingham County, VA, Economic Development Authority, Health Care Facilities Rev. (Sentara RMH Medical Center), “A”, 3%, 11/01/2046 | 2,255,000 | 1,582,974 | ||
| Virginia Small Business Financing Authority Rev. (Sentara Healthcare), 4%, 11/01/2039 | 3,750,000 | 3,443,305 | ||
| Virginia Small Business Financing Authority Rev. (Sentara Healthcare), 3%, 11/01/2040 | 3,370,000 | 2,605,911 | ||
| Virginia Small Business Financing Authority, Health Facilities Rev. (Bon Secours Mercy Health, Inc.), “A”, 4%, 12/01/2049 | 3,445,000 | 2,883,042 | ||
| Virginia Small Business Financing Authority, Hospital Rev. (Carilion Clinic Obligated Group), “A”, VRDN, 3.94%, 7/01/2042 | 1,250,000 | 1,250,000 | ||
| Winchester, VA, Economic Development Authority Hospital Rev. (Valley Health System Obligated Group), 5%, 1/01/2028 | 600,000 | 612,636 | ||
| Winchester, VA, Economic Development Authority Hospital Rev. (Valley Health System Obligated Group), 5%, 1/01/2030 | 400,000 | 406,912 | ||
| Winchester, VA, Economic Development Authority Hospital Rev. (Valley Health System Obligated Group), “A”, 5%, 1/01/2044 (Prerefunded 1/01/2024) | 2,000,000 | 2,003,360 | ||
| $44,838,710 | ||||
| Healthcare Revenue - Long Term Care – 2.9% | ||||
| Alexandria, VA, Industrial Development Authority, Residential Care Facilities Mortgage Rev. (Goodwin House, Inc.), 5%, 10/01/2030 (Prerefunded 10/01/2025) | $ | 1,000,000 | $1,022,788 | |
| Fairfax County, VA, Economic Development Authority Residential Care Facilities Rev. (Goodwin House, Inc.), 5%, 10/01/2036 (Prerefunded 10/01/2024) | 1,000,000 | 1,028,110 | ||
| Henrico County, VA, Economic Development Authority Rev., Residential Care Facility (Lifespire of Virginia.), “C”, 5%, 12/01/2037 | 765,000 | 748,246 | ||
| Henrico County, VA, Economic Development Authority Rev., Residential Care Facility (Virginia United Methodist Homes, Inc.), 5%, 6/01/2024 | 395,000 | 395,077 | ||
| Henrico County, VA, Economic Development Authority Rev., Residential Care Facility (Virginia United Methodist Homes, Inc.), 5%, 6/01/2025 | 385,000 | 385,058 | ||
| Henrico County, VA, Economic Development Authority Rev., Residential Care Facility (Westminster-Canterbury of Richmond), 4%, 10/01/2040 | 500,000 | 424,650 | ||
| Henrico County, VA, Economic Development Authority Rev., Residential Care Facility (Westminster-Canterbury of Richmond), 4%, 10/01/2045 | 720,000 | 585,038 | ||
| Lexington, VA, Industrial Development Authority Residential Care Facilities Rev. (Kendal at Lexington), 4%, 1/01/2037 | 1,000,000 | 886,970 | ||
| Prince William County, VA, Industrial Development Authority, Residential Care Facilities Rev. (Westminster at Lake Ridge), 5%, 1/01/2037 | 1,000,000 | 858,471 | ||
| Suffolk, VA, Economic Development Facilities First Mortgage Rev. (Lake Prince Center, Inc.), 5%, 9/01/2031 | 1,000,000 | 932,315 | ||
| Virginia Small Business Financing Authority Rev. (Obligated Group of National Senior Campuses, Inc.), “A”, 5%, 1/01/2033 | 1,750,000 | 1,766,679 | ||
| Virginia Small Business Financing Authority, Residential Care Facility Rev. (Pinnacle Living), “C”, 5%, 6/01/2042 | 1,000,000 | 904,162 | ||
| $9,937,564 | ||||
| Industrial Revenue - Environmental Services – 0.3% | ||||
| Virginia Small Business Financing Authority Rev., Solid Waste Disposal (Covanta Project), 5%, 1/01/2048 (Put Date 7/01/2038) (n) | $ | 1,000,000 | $888,574 | |
| Industrial Revenue - Other – 1.5% | ||||
| Port Beaumont, TX, Navigation District, Dock & Wharf Facility Rev. (Jefferson Gulf Coast Energy Project), “A”, 3.625%, 1/01/2035 (n) | $ | 300,000 | $231,922 | |
| Virginia Small Business Financing Authority, Environmental Facilities Rev. (Pure Salmon Virginia LLC Project), 3.5%, 11/01/2052 (Put Date 11/01/2023) | 5,000,000 | 4,995,771 | ||
| $5,227,693 | ||||
45
Portfolio of Investments (unaudited) –
continued
| Issuer | Shares/Par | Value ($) | ||
| Municipal Bonds – continued | ||||
| Industrial Revenue - Paper – 0.1% | ||||
| Valparaiso, IN, Exempt Facilities Rev. (Pratt Paper LLC Project), 6.75%, 1/01/2034 | $ | 100,000 | $100,614 | |
| Valparaiso, IN, Exempt Facilities Rev. (Pratt Paper LLC Project), 7%, 1/01/2044 | 130,000 | 130,848 | ||
| $231,462 | ||||
| Miscellaneous Revenue - Other – 0.9% | ||||
| Loudoun County, VA, Economic Development Authority Rev. (Howard Hughes Medical Institute), Capital Appreciation, “A”, 0%, 7/01/2049 | $ | 7,500,000 | $2,011,259 | |
| Matching Fund Special Purpose Securitization Corp., “A”, 5%, 10/01/2026 | 130,000 | 130,496 | ||
| New York Liberty Development Corp., Liberty Rev. (3 World Trade Center Project), “1”, 5%, 11/15/2044 (n) | 845,000 | 780,648 | ||
| $2,922,403 | ||||
| Multi-Family Housing Revenue – 10.1% | ||||
| Arlington County, VA, Industrial Development Authority Multi-Family Housing Rev. (Park Shirlington Apartments), “A”, 5%, 1/01/2026 | $ | 4,000,000 | $4,050,886 | |
| New Hampshire National Finance Authority Municipal Certificates, “1-A”, 4.375%, 9/20/2036 | 988,085 | 914,952 | ||
| New Mexico Mortgage Finance Authority, Multifamily Housing Rev. (Mountain View II & III Apartments Project), 5%, 2/01/2042 (Put Date 9/01/2025) | 525,000 | 528,834 | ||
| New Mexico Mortgage Finance Authority, Multifamily Housing Rev. (Santa Fe Apartment & Sangre de Cristo Project), 5%, 2/01/2042 (Put Date 6/01/2025) | 830,000 | 833,928 | ||
| Northampton County, VA Economic Development Authority, Multifamily Housing Rev. (Myrtle Landing Apartments), 4.5%, 4/01/2026 (Put Date 4/01/2025) | 3,720,000 | 3,699,767 | ||
| Virginia Housing Development Authority, Rental Housing, “A”, 3.8%, 9/01/2044 | 2,000,000 | 1,623,223 | ||
| Virginia Housing Development Authority, Rental Housing, “B”, 4.4%, 3/01/2043 | 710,000 | 655,380 | ||
| Virginia Housing Development Authority, Rental Housing, “B”, 4.45%, 3/01/2045 | 1,535,000 | 1,386,975 | ||
| Virginia Housing Development Authority, Rental Housing, “B”, 4.55%, 3/01/2048 | 2,580,000 | 2,324,042 | ||
| Virginia Housing Development Authority, Rental Housing, “D”, 1.8%, 5/01/2033 | 500,000 | 381,253 | ||
| Virginia Housing Development Authority, Rental Housing, “D”, 3.7%, 10/01/2038 | 3,000,000 | 2,596,870 | ||
| Virginia Housing Development Authority, Rental Housing, “D”, 4.75%, 8/01/2053 | 4,000,000 | 3,680,263 | ||
| Virginia Housing Development Authority, Rental Housing, “D”, 4%, 10/01/2053 | 2,875,000 | 2,358,875 | ||
| Virginia Housing Development Authority, Rental Housing, “E”, 3.15%, 12/01/2049 | 1,635,000 | 1,096,632 | ||
| Virginia Housing Development Authority, Rental Housing, “E”, 4.25%, 6/01/2052 | 3,000,000 | 2,513,778 | ||
| Virginia Housing Development Authority, Rental Housing, “F”, 1.6%, 7/01/2033 | 770,000 | 572,815 | ||
| Virginia Housing Development Authority, Rental Housing, “G”, 5.05%, 11/01/2047 | 1,000,000 | 976,338 | ||
| Virginia Housing Development Authority, Rental Housing, “G”, 5.15%, 11/01/2052 | 2,680,000 | 2,637,105 | ||
| Virginia Housing Development Authority, Rental Housing, “G”, 5.375%, 11/01/2064 | 1,250,000 | 1,249,589 | ||
| $34,081,505 | ||||
| Parking – 0.9% | ||||
| Fairfax County, VA, Economic Development Authority Metrorail Parking System Project Rev., 5%, 4/01/2035 | $ | 1,250,000 | $1,292,346 | |
| Fairfax County, VA, Economic Development Authority Metrorail Parking System Project Rev., 5%, 4/01/2036 | 1,000,000 | 1,030,839 | ||
| Fairfax County, VA, Economic Development Authority Metrorail Parking System Project Rev., 5%, 4/01/2037 | 750,000 | 769,232 | ||
| $3,092,417 | ||||
| Port Revenue – 1.2% | ||||
| New York Liberty Development Corp., Liberty Refunding Rev. (1 World Trade Center Project), 2.75%, 2/15/2044 | $ | 590,000 | $389,787 | |
| Virginia Port Authority Facilities Refunding Rev., “B”, 5%, 7/01/2041 | 750,000 | 740,579 | ||
| Virginia Port Authority Facilities Rev, “A”, 5%, 7/01/2031 (Prerefunded 7/01/2025) | 3,000,000 | 3,036,169 | ||
| $4,166,535 | ||||
| Sales & Excise Tax Revenue – 4.0% | ||||
| Guam Government Business Privilege Tax Refunding, “F”, 5%, 1/01/2030 | $ | 20,000 | $19,941 | |
| Guam Government Business Privilege Tax Refunding, “F”, 5%, 1/01/2031 | 25,000 | 24,837 | ||
| Guam Government Business Privilege Tax Refunding, “F”, 4%, 1/01/2042 | 245,000 | 198,275 | ||
| Hampton Roads, VA, Transportation Accountability Commission, “A”, 4%, 7/01/2057 | 4,000,000 | 3,497,544 | ||
| Puerto Rico Sales Tax Financing Corp., Restructured Sales Tax Rev., “2019A-1”, 4.55%, 7/01/2040 | 77,000 | 70,846 | ||
| Puerto Rico Sales Tax Financing Corp., Restructured Sales Tax Rev., “2019A-1”, 4.75%, 7/01/2053 | 249,000 | 220,131 | ||
| Puerto Rico Sales Tax Financing Corp., Restructured Sales Tax Rev., “2019A-1”, 5%, 7/01/2058 | 4,818,000 | 4,358,283 | ||
| Puerto Rico Sales Tax Financing Corp., Restructured Sales Tax Rev., “2019A-2”, 4.329%, 7/01/2040 | 476,000 | 426,336 | ||
| Puerto Rico Sales Tax Financing Corp., Restructured Sales Tax Rev., “2019A-2”, 4.329%, 7/01/2040 | 251,000 | 224,812 | ||
| Puerto Rico Sales Tax Financing Corp., Restructured Sales Tax Rev., “2019A-2”, 4.536%, 7/01/2053 | 6,000 | 5,118 | ||
46
Portfolio of Investments (unaudited) –
continued
| Issuer | Shares/Par | Value ($) | ||
| Municipal Bonds – continued | ||||
| Sales & Excise Tax Revenue – continued | ||||
| Puerto Rico Sales Tax Financing Corp., Restructured Sales Tax Rev., “2019A-2”, 4.784%, 7/01/2058 | $ | 122,000 | $106,487 | |
| Puerto Rico Sales Tax Financing Corp., Restructured Sales Tax Rev., Capital Appreciation, “2019A-1”, 0%, 7/01/2024 | 5,000 | 4,840 | ||
| Puerto Rico Sales Tax Financing Corp., Restructured Sales Tax Rev., Capital Appreciation, “2019A-1”, 0%, 7/01/2027 | 135,000 | 114,951 | ||
| Puerto Rico Sales Tax Financing Corp., Restructured Sales Tax Rev., Capital Appreciation, “2019A-1”, 0%, 7/01/2029 | 26,000 | 20,216 | ||
| Puerto Rico Sales Tax Financing Corp., Restructured Sales Tax Rev., Capital Appreciation, “2019A-1”, 0%, 7/01/2031 | 1,212,000 | 858,614 | ||
| Puerto Rico Sales Tax Financing Corp., Restructured Sales Tax Rev., Capital Appreciation, “2019A-1”, 0%, 7/01/2033 | 1,160,000 | 743,270 | ||
| Puerto Rico Sales Tax Financing Corp., Restructured Sales Tax Rev., Capital Appreciation, “2019A-1”, 0%, 7/01/2046 | 7,149,000 | 1,842,928 | ||
| Wisconsin Public Finance Authority Limited Obligation Grant Rev. (American Dream at Meadowlands Project), “A”, 6.25%, 8/01/2027 (a)(n) | 795,000 | 607,181 | ||
| Wisconsin Public Finance Authority Limited Obligation Grant Rev., Taxable (American Dream at Meadowlands Project), ”A“, 5.625%, 8/01/2024 (a)(n) | 345,000 | 263,494 | ||
| $13,608,104 | ||||
| Secondary Schools – 0.1% | ||||
| District of Columbia Rev. (Rocketship D.C.), “A”, 5%, 6/01/2056 (n) | $ | 325,000 | $261,841 | |
| State & Local Agencies – 11.4% | ||||
| Campbell County, VA, Industrial Development Authority, 4%, 6/01/2039 | $ | 1,000,000 | $920,707 | |
| Campbell County, VA, Industrial Development Authority, 4%, 6/01/2040 | 1,000,000 | 914,459 | ||
| Fairfax County, VA, Economic Development Authority Facilities Rev. (County Facilities Projects), “A”, 5%, 10/01/2033 (Prerefunded 10/01/2024) | 500,000 | 505,665 | ||
| Fairfax County, VA, Economic Development Authority Facilities Rev. (County Facilities Projects), “A”, 5%, 10/01/2034 (Prerefunded 10/01/2024) | 1,000,000 | 1,011,330 | ||
| Fairfax County, VA, Redevelopment and Housing Authority Refunding Rev. (Wedgewood Affordable Housing Acquisition), 5%, 10/01/2039 | 1,765,000 | 1,791,505 | ||
| Fairfax County, VA, Redevelopment and Housing Authority Refunding Rev. (Wedgewood Affordable Housing Acquisition), AGM, 5%, 10/01/2038 | 1,500,000 | 1,526,190 | ||
| Franklin County, VA, Industrial Development Authority, 3%, 10/15/2036 | 1,000,000 | 818,109 | ||
| Franklin County, VA, Industrial Development Authority, 3%, 10/15/2037 | 580,000 | 458,973 | ||
| Henry County, VA, Industrial Development Authority, Public Facility Leave Rev., 4%, 11/01/2045 | 3,000,000 | 2,530,618 | ||
| Loudoun County, VA, Economic Development Authority Refunding Rev. (Louduon County Public Facilities Project), “A”, 5%, 12/01/2024 | 1,860,000 | 1,885,549 | ||
| Loudoun County, VA, Economic Development Authority Rev. (Louduon County Public Facilities Project), “A”, 3%, 12/01/2037 | 2,000,000 | 1,609,363 | ||
| New River Valley, VA, Regional Jail Authority Rev., 5%, 10/01/2036 | 3,205,000 | 3,286,963 | ||
| Virginia College Building Authority, Educational Facilities Refunding Rev. (21st Century College and Equipment Programs), “E”, 5%, 2/01/2025 | 540,000 | 548,968 | ||
| Virginia College Building Authority, Educational Facilities Rev. (21st Century College and Equipment Programs), “A”, 5%, 2/01/2038 | 4,000,000 | 4,246,138 | ||
| Virginia College Building Authority, Educational Facilities Rev. (21st Century College and Equipment Programs), “D”, 5%, 2/01/2025 | 1,435,000 | 1,458,830 | ||
| Virginia College Building Authority, Educational Facilities Rev. (Public Higher Education Financing Program), “A”, 4%, 9/01/2039 | 5,810,000 | 5,487,518 | ||
| Virginia Public Building Authority, Facilities Rev., “A”, 4%, 8/01/2039 (Prerefunded 8/01/2029) | 30,000 | 30,748 | ||
| Virginia Public Building Authority, Facilities Rev., “A”, 4%, 8/01/2039 | 4,470,000 | 4,200,902 | ||
| Washington, D.C., Metropolitan Area Transit Authority Dedicated Rev., “A”, 5%, 7/15/2045 | 5,000,000 | 5,115,131 | ||
| $38,347,666 | ||||
| Student Loan Revenue – 0.5% | ||||
| Iowa Student Loan Liquidity Corp. Rev., “B”, 3%, 12/01/2039 | $ | 15,000 | $13,847 | |
| Iowa Student Loan Liquidity Corp. Rev., “B”, 3.5%, 12/01/2044 | 385,000 | 279,958 | ||
| New Jersey Higher Education Student Assistance Authority, Senior Student Loan Rev., “B”, 4%, 12/01/2041 | 1,590,000 | 1,504,041 | ||
| $1,797,846 | ||||
| Tax - Other – 0.7% | ||||
| Chicago, IL, Board of Education, Dedicated Capital Improvement Tax Bond, 5%, 4/01/2045 | $ | 230,000 | $227,032 | |
| Chicago, IL, Board of Education, Dedicated Capital Improvement Tax Bond, 5.75%, 4/01/2048 | 635,000 | 664,779 | ||
| Triborough Bridge & Tunnel Authority Rev., NY, Payroll Mobility Tax (MTA Bridges and Tunnels), ”C-3“, 3%, 5/15/2051 | 1,965,000 | 1,322,501 | ||
| Wisconsin Public Finance Authority Limited Obligation PILOT Rev. (American Dream at Meadowlands Project), 7%, 12/01/2050 | 220,000 | 195,749 | ||
| $2,410,061 | ||||
| Tax Assessment – 0.4% | ||||
| Peninsula Town Center Community Development Authority, VA, Special Obligation Refunding, 5%, 9/01/2045 (n) | $ | 1,000,000 | $875,605 | |
47
Portfolio of Investments (unaudited) –
continued
| Issuer | Shares/Par | Value ($) | ||
| Municipal Bonds – continued | ||||
| Tax Assessment – continued | ||||
| Prince William County, VA, Cherry Hill Community Development Authority Rev. (Potomac Shores Project), 5.15%, 3/01/2035 (n) | $ | 500,000 | $500,919 | |
| $1,376,524 | ||||
| Tobacco – 0.6% | ||||
| Buckeye, OH, Tobacco Settlement Financing Authority Senior Asset-Backed Refunding, 2020B-2, “2”, 5%, 6/01/2055 | $ | 970,000 | $835,567 | |
| Golden State, CA, Tobacco Securitization Corp., Tobacco Settlement Rev., Taxable, “B-1”, 3.85%, 6/01/2050 | 1,155,000 | 1,047,648 | ||
| $1,883,215 | ||||
| Toll Roads – 5.8% | ||||
| Chesapeake Bay Bridge & Tunnel District First Tier General Resolution Rev., 5%, 7/01/2051 | $ | 3,000,000 | $3,013,097 | |
| Metropolitan Washington, D.C., Airport Authority, Dulles Toll Road Rev. (Dulles Metrorail and Capital Improvement Projects), “A”, AGM, 4%, 10/01/2052 | 4,180,000 | 3,598,691 | ||
| Metropolitan Washington, D.C., Airport Authority, Toll Road Subordinate Lien Refunding Rev. (Dulles Metrorail and Capital Improvement Project), “B”, 4%, 10/01/2044 | 3,000,000 | 2,607,896 | ||
| Metropolitan Washington, D.C., Airport Authority, Toll Road Subordinate Lien Refunding Rev. (Dulles Metrorail and Capital Improvement Project), “B”, AGM, 4%, 10/01/2053 | 2,830,000 | 2,440,895 | ||
| Virginia Small Business Financing Authority Senior Lien Refunding Rev. (95 Express Lanes LLC Project), 5%, 1/01/2035 | 3,000,000 | 3,108,653 | ||
| Virginia Small Business Financing Authority Senior Lien Refunding Rev. (Elizabeth River Crossings Opco LLC Project), 4%, 1/01/2040 | 2,000,000 | 1,782,822 | ||
| Virginia Small Business Financing Authority Senior Lien Rev. (Elizabeth River Crossings Opco LLC Project), 3%, 1/01/2041 | 3,000,000 | 2,159,750 | ||
| Virginia Small Business Financing Authority, Senior Lien Private Activity Rev. (Transform 66 P3 Project), 5%, 12/31/2052 | 1,000,000 | 947,053 | ||
| $19,658,857 | ||||
| Transportation - Special Tax – 4.3% | ||||
| Commonwealth of Virginia, Transportation Board Rev., Capital Projects, 4%, 5/15/2042 | $ | 3,000,000 | $2,738,649 | |
| Commonwealth of Virginia, Transportation Board Rev., Capital Projects, “A”, 4%, 5/15/2035 | 2,750,000 | 2,732,135 | ||
| New Jersey Transportation Trust Fund Authority, “A”, 5%, 12/15/2039 | 190,000 | 194,912 | ||
| New Jersey Transportation Trust Fund Authority, “CC”, 5.5%, 6/15/2050 | 200,000 | 210,724 | ||
| Virginia Port Authority Rev., 5%, 7/01/2030 (Prerefunded 7/01/2025) | 1,000,000 | 1,011,217 | ||
| Virginia Port Authority Rev., 5%, 7/01/2031 (Prerefunded 7/01/2025) | 500,000 | 505,609 | ||
| Washington, D.C., Metropolitan Area Transit Authority Gross Rev., 5%, 7/01/2037 | 1,560,000 | 1,592,691 | ||
| Washington, D.C., Metropolitan Area Transit Authority Gross Rev., 5%, 7/01/2038 | 1,560,000 | 1,586,423 | ||
| Washington, D.C., Metropolitan Area Transit Authority Gross Rev., “B”, 5%, 7/01/2042 | 3,860,000 | 3,909,819 | ||
| $14,482,179 | ||||
| Universities - Colleges – 8.7% | ||||
| Amherst, VA, Industrial Development Authority Rev. (Educational Facilities Sweet Briar), 5%, 9/01/2026 | $ | 750,000 | $730,391 | |
| Commonwealth of Virginia, University General Pledge Refunding Rev., “A”, 4%, 11/01/2037 | 745,000 | 703,923 | ||
| Commonwealth of Virginia, University General Pledge Refunding Rev., “A”, 4%, 5/01/2048 | 2,475,000 | 2,160,543 | ||
| Lexington, VA, Industrial Development Authority Educational Facilities Rev. (Washington and Lee Universities), “A”, 5%, 1/01/2043 | 1,000,000 | 1,022,531 | ||
| Montgomery County, VA, Economic Development Authority Rev., Tax-Exempt (Virginia Tech Foundation), “A”, 4%, 6/01/2037 | 1,000,000 | 967,076 | ||
| Montgomery County, VA, Economic Development Authority Rev., Tax-Exempt (Virginia Tech Foundation), “A”, 4%, 6/01/2038 | 1,750,000 | 1,646,312 | ||
| Puerto Rico Industrial, Tourist, Educational, Medical & Environmental Control Facilities Financing Authority, Educational Facilities Rev. (University Plaza Project), NPFG, 5%, 7/01/2033 | 390,000 | 378,152 | ||
| Red River, TX, Education Finance Corp., Higher Education Rev. (Houston Baptist University Project), 5.5%, 10/01/2046 | 595,000 | 585,190 | ||
| Roanoke, VA, Economic Development Authority, Educational Facilities Rev. (Lynchburg College), “A”, 5%, 9/01/2034 | 1,000,000 | 1,008,070 | ||
| Salem, VA, Economic Development Authority, Educational Facilities (Roanoke College), 4%, 4/01/2038 | 250,000 | 215,297 | ||
| Salem, VA, Economic Development Authority, Educational Facilities (Roanoke College), 4%, 4/01/2039 | 225,000 | 191,176 | ||
| Salem, VA, Economic Development Authority, Educational Facilities (Roanoke College), 4%, 4/01/2040 | 250,000 | 209,621 | ||
| Salem, VA, Economic Development Authority, Educational Facilities (Roanoke College), 5%, 4/01/2049 | 900,000 | 819,413 | ||
| University of Virginia, General Rev. Pledge Refunding, “B”, 5%, 4/01/2046 | 2,500,000 | 2,548,678 | ||
| Virginia College Building Authority, Educational Facilities Rev. (Marymount University Project), “A”, 5%, 7/01/2035 (n) | 1,000,000 | 951,259 | ||
| Virginia College Building Authority, Educational Facilities Rev. (Marymount University Project), “B”, 5.25%, 7/01/2035 (n) | 1,000,000 | 976,802 | ||
| Virginia College Building Authority, Educational Facilities Rev. (Randolph-Macon College), 4%, 1/15/2041 | 1,600,000 | 1,382,882 | ||
| Virginia College Building Authority, Educational Facilities Rev. (Regent University Project), 4%, 6/01/2036 | 1,280,000 | 1,155,000 | ||
| Virginia College Building Authority, Educational Facilities Rev. (Regent University Project), 3%, 6/01/2041 | 470,000 | 331,416 | ||
| Virginia College Building Authority, Educational Facilities Rev. (Regent University Project), 4%, 6/01/2046 | 1,250,000 | 985,636 | ||
| Virginia College Building Authority, Educational Facilities Rev. (Washington & Lee University), NPFG, 5.25%, 1/01/2031 | 1,000,000 | 1,061,191 | ||
| Virginia College Building Authority, Educational Facilities Rev. (Washington & Lee University), “A”, 5%, 1/01/2040 (Prerefunded 1/01/2025) | 1,000,000 | 1,014,893 | ||
48
Portfolio of Investments (unaudited) –
continued
| Issuer | Shares/Par | Value ($) | ||
| Municipal Bonds – continued | ||||
| Universities - Colleges – continued | ||||
| Virginia Commonwealth University, General Rev., “A”, 5%, 11/01/2033 | $ | 4,000,000 | $4,316,832 | |
| Virginia Small Business Financing Authority Rev. (Hampton University), 5.25%, 10/01/2029 | 2,500,000 | 2,517,351 | ||
| Williamsburg, VA, Economic Development Authority Dining Lease Rev. (Provident Group - Williamsburg Properties LLC - William & Mary Project), “B”, AGM, 4.125%, 7/01/2048 | 1,000,000 | 875,943 | ||
| Williamsburg, VA, Economic Development Authority Dining Lease Rev. (Provident Group - Williamsburg Properties LLC - William & Mary Project), “B”, AGM, 4.25%, 7/01/2058 | 755,000 | 653,045 | ||
| $29,408,623 | ||||
| Universities - Dormitories – 0.6% | ||||
| Williamsburg, VA, Economic Development Authority Student Housing Rev. (Provident Group - Williamsburg Properties LLC - William & Mary Project), “B”, AGM, 4%, 7/01/2048 | $ | 2,245,000 | $1,930,513 | |
| Utilities - Electric Power – 0.3% | ||||
| Texas Municipal Power Agency, Transmission System Rev., AGM, 2%, 9/01/2033 | $ | 1,455,000 | $1,073,519 | |
| Utilities - Investor Owned – 1.1% | ||||
| Louisa, VA, Industrial Development Authority, Pollution Control Refunding Rev. (Virginia Electric and Power Co. Project), “A”, 3.65%, 11/01/2035 (Put Date 10/01/2027) | $ | 4,000,000 | $3,872,609 | |
| Utilities - Municipal Owned – 2.1% | ||||
| Puerto Rico Electric Power Authority Refunding Rev., “DDD”, 5%, 7/01/2020 (a)(d) | $ | 30,000 | $7,500 | |
| Puerto Rico Electric Power Authority Refunding Rev., “DDD”, 5%, 7/01/2021 (a)(d) | 320,000 | 80,000 | ||
| Puerto Rico Electric Power Authority Refunding Rev., “DDD”, 5%, 7/01/2022 (a)(d) | 535,000 | 133,750 | ||
| Puerto Rico Electric Power Authority Refunding Rev., “PP”, NPFG, 5%, 7/01/2024 | 25,000 | 25,003 | ||
| Puerto Rico Electric Power Authority Refunding Rev., “VV”, NPFG, 5.25%, 7/01/2030 | 340,000 | 335,949 | ||
| Puerto Rico Electric Power Authority Refunding Rev., “VV”, NPFG, 5.25%, 7/01/2034 | 35,000 | 34,517 | ||
| Puerto Rico Electric Power Authority Rev., “A”, 5%, 7/01/2029 (a)(d) | 835,000 | 208,750 | ||
| Puerto Rico Electric Power Authority Rev., “A”, 5%, 7/01/2042 (a)(d) | 130,000 | 32,500 | ||
| Puerto Rico Electric Power Authority Rev., “AAA”, 5.25%, 7/01/2021 (a)(d) | 60,000 | 15,000 | ||
| Puerto Rico Electric Power Authority Rev., “AAA”, 5.25%, 7/01/2030 (a)(d) | 30,000 | 7,500 | ||
| Puerto Rico Electric Power Authority Rev., “CCC”, 5.25%, 7/01/2027 (a)(d) | 305,000 | 76,250 | ||
| Puerto Rico Electric Power Authority Rev., “DDD”, AGM, 3.65%, 7/01/2024 | 315,000 | 311,735 | ||
| Puerto Rico Electric Power Authority Rev., “SS”, AGM, 4.375%, 7/01/2030 | 45,000 | 43,112 | ||
| Puerto Rico Electric Power Authority Rev., “TT”, 5%, 7/01/2021 (a)(d) | 145,000 | 36,250 | ||
| Puerto Rico Electric Power Authority Rev., “TT”, 5%, 7/01/2023 (a)(d) | 140,000 | 35,000 | ||
| Puerto Rico Electric Power Authority Rev., “TT”, 5%, 7/01/2027 (a)(d) | 25,000 | 6,250 | ||
| Puerto Rico Electric Power Authority Rev., “TT”, 5%, 7/01/2037 (a)(d) | 430,000 | 107,500 | ||
| Puerto Rico Electric Power Authority Rev., “UU”, AGM, 4.25%, 7/01/2027 | 185,000 | 179,573 | ||
| Puerto Rico Electric Power Authority Rev., “WW”, 5.375%, 7/01/2022 (a)(d) | 25,000 | 6,250 | ||
| Puerto Rico Electric Power Authority Rev., “WW”, 5.25%, 7/01/2025 (a)(d) | 60,000 | 15,000 | ||
| Puerto Rico Electric Power Authority Rev., “ZZ”, 5%, 7/01/2018 (a)(d) | 205,000 | 51,250 | ||
| Puerto Rico Electric Power Authority Rev., “ZZ”, 5.25%, 7/01/2023 (a)(d) | 225,000 | 56,250 | ||
| Puerto Rico Electric Power Authority Rev., “ZZ”, 5.25%, 7/01/2024 (a)(d) | 70,000 | 17,500 | ||
| Puerto Rico Electric Power Authority Rev., “ZZ”, 5.25%, 7/01/2026 (a)(d) | 215,000 | 53,750 | ||
| Puerto Rico Electric Power Authority Rev., Taxable, “EEE”, 6.05%, 7/01/2032 (a)(d) | 175,000 | 43,750 | ||
| Richmond, VA, Public Utility Refunding Rev., “C”, 4%, 1/15/2045 | 1,000,000 | 911,904 | ||
| Richmond, VA, Public Utility Refunding Rev., “C”, 4.25%, 1/15/2053 | 2,500,000 | 2,303,344 | ||
| Richmond, VA, Public Utility Rev., “A”, 5%, 1/15/2035 | 2,000,000 | 2,035,292 | ||
| $7,170,429 | ||||
| Utilities - Other – 2.1% | ||||
| Black Belt Energy Gas District, AL, Gas Project Rev., “A”, 4%, 6/01/2051 (Put Date 12/01/2031) | $ | 1,045,000 | $985,306 | |
| Black Belt Energy Gas District, AL, Gas Project Rev., “C-1”, 5.25%, 2/01/2053 (Put Date 6/01/2029) | 2,020,000 | 2,049,809 | ||
| Southeast Alabama Energy Authority Commodity Supply Rev. (Project No. 5), “A”, 5.25%, 1/01/2054 (Put Date 7/01/2029) | 1,850,000 | 1,862,006 | ||
| Tennergy Corp., TN, Gas Supply Rev., “A”, 5.5%, 10/01/2053 (Put Date 12/01/2030) | 1,115,000 | 1,132,457 | ||
| Tennessee Energy Acquisition Corp., Gas Project Rev., “A”, 5.25%, 9/01/2026 | 1,140,000 | 1,143,209 | ||
| $7,172,787 | ||||
| Water & Sewer Utility Revenue – 9.9% | ||||
| Fairfax County, VA, Sewer Rev., “A”, 4%, 7/15/2039 | $ | 3,000,000 | $2,829,091 | |
49
Portfolio of Investments (unaudited) –
continued
| Issuer | Shares/Par | Value ($) | ||
| Municipal Bonds – continued | ||||
| Water & Sewer Utility Revenue – continued | ||||
| Fairfax County, VA, Water Authority Rev., 5%, 4/01/2041 | $ | 3,000,000 | $3,086,804 | |
| Guam Waterworks Authority Rev. (Water and Wastewater System), 5%, 7/01/2036 | 295,000 | 294,850 | ||
| Guam Waterworks Authority Rev. (Water and Wastewater System), 5%, 7/01/2037 | 375,000 | 369,383 | ||
| Guam Waterworks Authority Rev. (Water and Wastewater System), 5%, 7/01/2040 | 1,045,000 | 1,004,524 | ||
| Guam Waterworks Authority Rev. (Water and Wastewater System), “A”, 5%, 1/01/2050 | 430,000 | 398,499 | ||
| Hampton Roads, VA, Sanitation District Wastewater Rev., “A”, 5%, 8/01/2034 (Prerefunded 8/01/2026) | 3,000,000 | 3,106,756 | ||
| Hampton Roads, VA, Sanitation District Wastewater Rev., “A”, 5%, 10/01/2035 (Prerefunded 10/01/2027) | 660,000 | 696,089 | ||
| Hampton Roads, VA, Sanitation District Wastewater Rev., “A”, 4%, 10/01/2038 | 1,265,000 | 1,181,424 | ||
| Henrico County, VA, Water and Sewer System Rev., 4%, 5/01/2046 | 1,435,000 | 1,288,288 | ||
| Michigan Finance Authority Local Government Loan Program Rev. (Detroit Water and Sewerage Department Sewage Disposal System Rev. Refunding Second Lien Local Project), “C-7”, NPFG, 5%, 7/01/2032 | 80,000 | 80,456 | ||
| Michigan Finance Authority Local Government Loan Program Rev. (Detroit Water and Sewerage Department Water Supply System Rev. Refunding Second Lien Local Project), “D-6”, NPFG, 5%, 7/01/2036 | 100,000 | 100,220 | ||
| Michigan Finance Authority Local Government Loan Program Rev. (Detroit Water and Sewerage Department Water Supply System Rev. Refunding Senior Lien Local Project), “D-1”, AGM, 5%, 7/01/2035 | 50,000 | 50,238 | ||
| Michigan Finance Authority Local Government Loan Program Rev. (Detroit Water and Sewerage Department Water Supply System Rev. Refunding Senior Lien Local Project), “D-1”, AGM, 5%, 7/01/2037 | 110,000 | 110,298 | ||
| Spotsylvania County, VA, Water and Sewer System Rev., 4.5%, 12/01/2046 | 3,865,000 | 3,701,457 | ||
| Upper Occoquan, VA, Sewage Authority Regional Sewage Rev., 3%, 7/01/2044 | 2,065,000 | 1,530,661 | ||
| Virginia Resources Authority, Infrastructure Rev., Pooled Financing Program, “B”, 5%, 11/01/2025 | 5,000 | 5,004 | ||
| Virginia Resources Authority, Infrastructure Rev., Pooled Financing Program, “B”, 5%, 11/01/2027 | 45,000 | 45,031 | ||
| Virginia Resources Authority, Infrastructure Rev., Pooled Financing Program, “B”, 5%, 11/01/2028 | 40,000 | 40,028 | ||
| Virginia Resources Authority, Infrastructure Rev., Pooled Financing Program, “C”, 4%, 11/01/2032 | 1,000,000 | 1,022,613 | ||
| Virginia Resources Authority, Infrastructure Rev., Pooled Financing Program, “C”, 4%, 11/01/2033 | 1,500,000 | 1,533,429 | ||
| Virginia Resources Authority, Infrastructure Rev., Pooled Financing Program, “C”, 4%, 11/01/2036 | 3,450,000 | 3,428,393 | ||
| Virginia Resources Authority, Infrastructure Rev., Unrefunded Balance, 5%, 11/01/2025 | 45,000 | 45,033 | ||
| Virginia Resources Authority, State Moral Obligation Rev., Pooled Financing Program, “A”, 5%, 11/01/2039 | 1,610,000 | 1,704,491 | ||
| Virginia Resources Authority, State Moral Obligation Rev., Pooled Financing Program, “A”, 5%, 11/01/2041 | 1,030,000 | 1,082,194 | ||
| Virginia Resources Authority, State Moral Obligation Rev., Pooled Financing Program, “A”, 5%, 11/01/2042 | 1,330,000 | 1,390,575 | ||
| Virginia Resources Authority, State Moral Obligation Rev., Pooled Financing Program, “B”, 5.25%, 11/01/2047 | 2,350,000 | 2,513,783 | ||
| Virginia Resources Authority, State Moral Obligation Rev., Pooled Financing Program, “B”, 4.75%, 11/01/2052 | 750,000 | 742,068 | ||
| $33,381,680 | ||||
| Total Municipal Bonds (Identified Cost, $363,589,759) | $329,211,531 | |||
| Bonds – 0.3% | ||||
| Consumer Services – 0.3% | ||||
| Toll Road Investors Partnership II LP, Capital Appreciation, NPFG, 0%, 2/15/2025 (n) | $ | 557,000 | $501,546 | |
| Toll Road Investors Partnership II LP, Capital Appreciation, NPFG, 0%, 2/15/2043 (n) | 1,134,593 | 372,981 | ||
| Total Bonds (Identified Cost, $955,625) | $874,527 | |||
| Contingent Value Instruments – 0.1% | ||||
| General Obligations - General Purpose – 0.1% | ||||
| Commonwealth of Puerto Rico, General Obligation Contingent Value Instrument, 11/01/2043 (Identified Cost, $375,033) | $ | 632,096 | $327,900 | |
| Investment Companies (h) – 1.0% | ||||
| Money Market Funds – 1.0% | ||||
| MFS Institutional Money Market Portfolio, 5.4% (v) (Identified Cost, $3,370,959) | 3,370,900 | $3,371,574 | ||
| Other Assets, Less Liabilities – 1.2% | 4,109,539 | |||
| Net Assets – 100.0% | $337,895,071 | |||
See Portfolio Footnotes and Notes to
Financial Statements
50
Portfolio of Investments (unaudited) –
continued
MFS West Virginia Municipal
Bond Fund
| Issuer | Shares/Par | Value ($) | ||
| Municipal Bonds – 97.5% | ||||
| Airport Revenue – 0.3% | ||||
| Wayne County, MI, Airport Authority Rev. (Detroit Metropolitan Wayne County Airport), “B”, 5%, 12/01/2044 | $ | 60,000 | $59,196 | |
| Wayne County, MI, Airport Authority Rev. (Detroit Metropolitan Wayne County Airport), “B”, BAM, 5%, 12/01/2039 | 70,000 | 69,996 | ||
| Wayne County, MI, Airport Authority Rev. (Detroit Metropolitan Wayne County Airport), “C”, 5%, 12/01/2039 | 55,000 | 54,881 | ||
| Wayne County, MI, Airport Authority Rev. (Detroit Metropolitan Wayne County Airport), “C”, 5%, 12/01/2044 | 85,000 | 83,753 | ||
| $267,826 | ||||
| General Obligations - General Purpose – 9.0% | ||||
| Bridgeview, IL, Stadium and Redevelopment Projects, Taxable, AAC, 5.14%, 12/01/2036 | $ | 260,000 | $224,452 | |
| Chicago, IL, General Obligation, “A”, 5.5%, 1/01/2040 | 360,000 | 368,374 | ||
| Commonwealth of Puerto Rico, General Obligation Restructured Bonds, Capital Appreciation, Series 2022A, 0%, 7/01/2024 | 6,627 | 6,402 | ||
| Commonwealth of Puerto Rico, General Obligation Restructured Bonds, Capital Appreciation, Series 2022A, 0%, 7/01/2033 | 52,422 | 30,896 | ||
| Commonwealth of Puerto Rico, General Obligation Restructured Bonds, Series 2022A, 5.625%, 7/01/2027 | 44,957 | 46,133 | ||
| Commonwealth of Puerto Rico, General Obligation Restructured Bonds, Series 2022A, 5.625%, 7/01/2029 | 44,227 | 45,700 | ||
| Commonwealth of Puerto Rico, General Obligation Restructured Bonds, Series 2022A, 5.75%, 7/01/2031 | 42,958 | 44,862 | ||
| Commonwealth of Puerto Rico, General Obligation Restructured Bonds, Series 2022A, 4%, 7/01/2033 | 40,735 | 36,512 | ||
| Commonwealth of Puerto Rico, General Obligation Restructured Bonds, Series 2022A, 4%, 7/01/2035 | 74,630 | 64,857 | ||
| Commonwealth of Puerto Rico, General Obligation Restructured Bonds, Series 2022A, 4%, 7/01/2037 | 31,426 | 26,380 | ||
| Commonwealth of Puerto Rico, General Obligation Restructured Bonds, Series 2022A, 4%, 7/01/2041 | 42,727 | 34,353 | ||
| Commonwealth of Puerto Rico, General Obligation Restructured Bonds, Series 2022A, 4%, 7/01/2046 | 143,435 | 110,586 | ||
| State of California, Various Purpose General Obligation, 4%, 3/01/2036 | 405,000 | 402,326 | ||
| State of Illinois, General Obligation, 5.5%, 5/01/2039 | 165,000 | 172,142 | ||
| State of Illinois, General Obligation, “C”, 4%, 10/01/2040 | 230,000 | 201,259 | ||
| State of Illinois, General Obligation, “C”, 4%, 10/01/2041 | 145,000 | 125,556 | ||
| State of West Virginia, General Obligation Road Bonds, “A”, 5%, 6/01/2043 | 400,000 | 413,563 | ||
| State of West Virginia, General Obligation Road Bonds, “A”, 5%, 12/01/2043 | 1,000,000 | 1,026,809 | ||
| State of West Virginia, General Obligation Road Bonds, “A”, 5%, 6/01/2044 | 3,000,000 | 3,074,130 | ||
| State of West Virginia, General Obligation Road Bonds, “A”, 5%, 12/01/2044 | 705,000 | 727,155 | ||
| State of West Virginia, General Obligation Road Bonds, “B”, 4%, 12/01/2042 | 1,000,000 | 902,166 | ||
| $8,084,613 | ||||
| General Obligations - Schools – 4.1% | ||||
| Berkeley County, WV, Public School Board of Education, 3%, 6/01/2026 | $ | 1,000,000 | $966,796 | |
| Berkeley County, WV, Public School Board of Education, 4%, 6/01/2037 | 1,000,000 | 951,969 | ||
| Cabell County, WV, Public School Board of Education, AGM, 3%, 6/01/2029 | 1,000,000 | 951,260 | ||
| Little Rock, AR, School District & Construction, “A”, BAM, 3%, 2/01/2048 | 820,000 | 558,120 | ||
| Orange County, CA, Anaheim Elementary School District, AGM, 4%, 8/01/2048 | 310,000 | 283,077 | ||
| $3,711,222 | ||||
| Healthcare Revenue - Hospitals – 16.4% | ||||
| Allegheny County, PA, Hospital Development Authority Rev. (Allegheny Health Network Obligated Group), “A”, 4%, 4/01/2044 | $ | 155,000 | $125,854 | |
| Doylestown, PA, Hospital Authority Rev., “A”, 4%, 6/30/2045 (Prerefunded 7/01/2029) | 5,000 | 5,110 | ||
| Doylestown, PA, Hospital Authority Rev., “A”, 4%, 6/30/2045 | 10,000 | 7,128 | ||
| Spartanburg County, SC, Regional Health Services District Hospital Rev., “A”, 4%, 4/15/2043 | 780,000 | 661,070 | ||
| Virginia Small Business Financing Authority, Health Facilities Rev. (Bon Secours Mercy Health, Inc.), “A”, 4%, 12/01/2049 | 490,000 | 410,070 | ||
| West Virginia Hospital Finance Authority Hospital Rev. (Cabell Huntington Hospital Obligated Group), 4%, 12/31/2037 | 230,000 | 192,143 | ||
| West Virginia Hospital Finance Authority Hospital Rev. (Cabell Huntington Hospital Obligated Group), “A”, 4.125%, 1/01/2047 | 1,245,000 | 910,043 | ||
| West Virginia Hospital Finance Authority Hospital Rev. (Charleston Area Medical Center, Inc.), “A”, 5%, 8/31/2028 | 1,000,000 | 1,003,855 | ||
| West Virginia Hospital Finance Authority Hospital Rev. (Charleston Area Medical Center, Inc.), “A”, 5%, 8/31/2039 | 1,500,000 | 1,421,208 | ||
| West Virginia Hospital Finance Authority Hospital Rev. (Valley Health System Obligation Group), 5%, 1/01/2044 (Prerefunded 1/01/2024) | 1,000,000 | 1,001,680 | ||
| West Virginia Hospital Finance Authority Hospital Rev. (Valley Health System Obligation Group), 5%, 1/01/2044 | 1,000,000 | 973,678 | ||
| West Virginia Hospital Finance Authority Hospital Rev. (West Virginia United Health System Obligated Group), “A”, 5%, 6/01/2027 | 200,000 | 205,034 | ||
| West Virginia Hospital Finance Authority Hospital Rev. (West Virginia United Health System Obligated Group), “A”, 4%, 6/01/2035 | 1,500,000 | 1,397,331 | ||
| West Virginia Hospital Finance Authority Hospital Rev. (West Virginia University Health System Obligated Group), “A”, 5%, 6/01/2042 | 1,000,000 | 996,299 | ||
| West Virginia Hospital Finance Authority Hospital Rev. (West Virginia University Health System Obligated Group), “A”, 4%, 5/31/2051 | 860,000 | 697,477 | ||
| West Virginia Hospital Finance Authority Hospital Rev. (West Virginia University Health System Obligated Group), “A”, 4.375%, 5/31/2053 | 1,000,000 | 904,782 | ||
51
Portfolio of Investments (unaudited) –
continued
| Issuer | Shares/Par | Value ($) | ||
| Municipal Bonds – continued | ||||
| Healthcare Revenue - Hospitals – continued | ||||
| West Virginia Hospital Finance Authority Hospital Rev. (West Virginia University Health System Obligated Group), “A”, AGM, 4%, 6/01/2051 | $ | 2,220,000 | $1,868,392 | |
| West Virginia Hospital Finance Authority Hospital Rev. (West Virginia University Health System Obligated Group), “C”, VRDN, TD BANK NA, 3.15%, 5/31/2034 | 2,000,000 | 2,000,000 | ||
| $14,781,154 | ||||
| Industrial Revenue - Other – 0.7% | ||||
| New York Liberty Development Corp. Rev. (Goldman Sachs Headquarters), 5.25%, 10/01/2035 | $ | 420,000 | $456,689 | |
| Port Beaumont, TX, Navigation District, Dock & Wharf Facility Rev. (Jefferson Gulf Coast Energy Project), “A”, 2.875%, 1/01/2041 (n) | 115,000 | 71,444 | ||
| Port Beaumont, TX, Navigation District, Dock & Wharf Facility Rev. (Jefferson Gulf Coast Energy Project), “A”, 4%, 1/01/2050 (n) | 200,000 | 134,232 | ||
| $662,365 | ||||
| Miscellaneous Revenue - Other – 4.9% | ||||
| Matching Fund Special Purpose Securitization Corp., “A”, 5%, 10/01/2026 | $ | 40,000 | $40,152 | |
| New York Liberty Development Corp., Liberty Rev. (3 World Trade Center Project), “1”, 5%, 11/15/2044 (n) | 580,000 | 535,830 | ||
| West Virginia Economic Development Authority, Excess Lottery Rev., “A”, 5%, 7/01/2038 | 1,000,000 | 1,035,059 | ||
| West Virginia School Building Authority, “A”, 3%, 7/01/2033 | 2,000,000 | 1,780,568 | ||
| West Virginia School Building Authority, Excess Lottery Refunding Rev., “B”, 5%, 7/01/2038 | 265,000 | 282,638 | ||
| West Virginia School Building Authority, Excess Lottery Refunding Rev., “B”, 5%, 7/01/2039 | 735,000 | 782,306 | ||
| $4,456,553 | ||||
| Multi-Family Housing Revenue – 0.3% | ||||
| New Hampshire National Finance Authority Municipal Certificates, “1-A”, 4.375%, 9/20/2036 | $ | 284,054 | $263,030 | |
| Port Revenue – 0.1% | ||||
| New York Liberty Development Corp., Liberty Refunding Rev. (1 World Trade Center Project), 2.75%, 2/15/2044 | $ | 170,000 | $112,312 | |
| Sales & Excise Tax Revenue – 4.1% | ||||
| Guam Government Business Privilege Tax Refunding, “F”, 5%, 1/01/2030 | $ | 5,000 | $4,985 | |
| Guam Government Business Privilege Tax Refunding, “F”, 5%, 1/01/2031 | 10,000 | 9,935 | ||
| Guam Government Business Privilege Tax Refunding, “F”, 4%, 1/01/2042 | 75,000 | 60,696 | ||
| Monongalia County, WV, Commission Special District Excise Tax Refunding & Improvement Rev. (University Town Centre Economic Opportunity Development District), “A”, 4.125%, 6/01/2043 (n) | 945,000 | 798,052 | ||
| Puerto Rico Sales Tax Financing Corp., Restructured Sales Tax Rev., “2019A-1”, 4.55%, 7/01/2040 | 25,000 | 23,002 | ||
| Puerto Rico Sales Tax Financing Corp., Restructured Sales Tax Rev., “2019A-1”, 4.75%, 7/01/2053 | 83,000 | 73,377 | ||
| Puerto Rico Sales Tax Financing Corp., Restructured Sales Tax Rev., “2019A-1”, 5%, 7/01/2058 | 1,537,000 | 1,390,345 | ||
| Puerto Rico Sales Tax Financing Corp., Restructured Sales Tax Rev., “2019A-2”, 4.329%, 7/01/2040 | 158,000 | 141,515 | ||
| Puerto Rico Sales Tax Financing Corp., Restructured Sales Tax Rev., “2019A-2”, 4.329%, 7/01/2040 | 83,000 | 74,340 | ||
| Puerto Rico Sales Tax Financing Corp., Restructured Sales Tax Rev., “2019A-2”, 4.536%, 7/01/2053 | 1,000 | 853 | ||
| Puerto Rico Sales Tax Financing Corp., Restructured Sales Tax Rev., “2019A-2”, 4.784%, 7/01/2058 | 39,000 | 34,041 | ||
| Puerto Rico Sales Tax Financing Corp., Restructured Sales Tax Rev., Capital Appreciation, “2019A-1”, 0%, 7/01/2024 | 1,000 | 968 | ||
| Puerto Rico Sales Tax Financing Corp., Restructured Sales Tax Rev., Capital Appreciation, “2019A-1”, 0%, 7/01/2027 | 45,000 | 38,317 | ||
| Puerto Rico Sales Tax Financing Corp., Restructured Sales Tax Rev., Capital Appreciation, “2019A-1”, 0%, 7/01/2029 | 7,000 | 5,443 | ||
| Puerto Rico Sales Tax Financing Corp., Restructured Sales Tax Rev., Capital Appreciation, “2019A-1”, 0%, 7/01/2031 | 412,000 | 291,872 | ||
| Puerto Rico Sales Tax Financing Corp., Restructured Sales Tax Rev., Capital Appreciation, “2019A-1”, 0%, 7/01/2033 | 396,000 | 253,737 | ||
| Puerto Rico Sales Tax Financing Corp., Restructured Sales Tax Rev., Capital Appreciation, “2019A-1”, 0%, 7/01/2046 | 1,503,000 | 387,455 | ||
| Wisconsin Public Finance Authority Limited Obligation Grant Rev. (American Dream at Meadowlands Project), “A”, 6.25%, 8/01/2027 (a)(d)(n) | 120,000 | 91,650 | ||
| $3,680,583 | ||||
| Single Family Housing - State – 9.0% | ||||
| West Virginia Housing Development Fund, “A”, 3.875%, 11/01/2044 | $ | 1,175,000 | $1,097,630 | |
| West Virginia Housing Development Fund, “A”, 4.75%, 11/01/2048 | 1,000,000 | 958,361 | ||
| West Virginia Housing Development Fund, “B”, 1.8%, 5/01/2026 | 485,000 | 452,905 | ||
| West Virginia Housing Development Fund, “B”, 4.2%, 11/01/2047 | 1,000,000 | 869,288 | ||
| West Virginia Housing Development Fund, “B”, 4.25%, 11/01/2052 | 1,000,000 | 855,970 | ||
| West Virginia Housing Development Fund, “B”, 4.7%, 11/01/2053 | 1,000,000 | 946,635 | ||
| West Virginia Housing Development Fund, “C”, 4.45%, 11/01/2037 | 1,000,000 | 982,123 | ||
| West Virginia Housing Development Fund, “C”, 4.625%, 11/01/2042 | 1,000,000 | 964,218 | ||
52
Portfolio of Investments (unaudited) –
continued
| Issuer | Shares/Par | Value ($) | ||
| Municipal Bonds – continued | ||||
| Single Family Housing - State – continued | ||||
| West Virginia Housing Development Fund, “C”, 4.8%, 11/01/2047 | $ | 1,000,000 | $973,027 | |
| $8,100,157 | ||||
| State & Local Agencies – 9.4% | ||||
| Berkeley County, WV, Building Commission Lease Rev. (Berkeley County Day Report Center and Public Safety Building Projects), 4%, 12/01/2042 | $ | 1,740,000 | $1,539,431 | |
| Berkeley County, WV, Building Commission Lease Rev. (LED Lighting Project), “B”, 5%, 6/01/2024 | 545,000 | 548,019 | ||
| North Carolina Turnpike Authority, Triangle Expressway System Appropriation Rev., Capital Appreciation, 0%, 1/01/2044 | 1,640,000 | 579,669 | ||
| Putnam County, WV, Building Commission Lease Rev. (Sheriff's Headquarters), “A”, BAM, 4.25%, 5/01/2042 | 500,000 | 464,860 | ||
| Putnam County, WV, Building Commission Lease Rev. (Sheriff's Headquarters), “A”, BAM, 4.25%, 5/01/2047 | 500,000 | 451,218 | ||
| Putnam County, WV, Building Commission Lease Rev. (Sheriff's Headquarters), “A”, BAM, 4.375%, 5/01/2052 | 560,000 | 499,690 | ||
| West Virginia Economic Development Authority, Lease Rev. (Correctional, Juvenile and Public Safety Facilities), “A”, 5%, 6/01/2029 | 2,000,000 | 2,001,729 | ||
| West Virginia Economic Development Authority, Lease Rev. (State Office Building), “B”, NPFG, 5.25%, 1/01/2025 | 215,000 | 215,183 | ||
| West Virginia Economic Development Authority, Lease Rev. (State Office Building), “B”, NPFG, 5.25%, 1/01/2030 | 1,355,000 | 1,356,431 | ||
| West Virginia Hospital Finance Authority Hospital Rev. (Veterans Nursing Home), 5.5%, 3/01/2034 | 795,000 | 795,600 | ||
| $8,451,830 | ||||
| Student Loan Revenue – 0.5% | ||||
| New Jersey Higher Education Student Assistance Authority, Senior Student Loan Rev., “B”, 4%, 12/01/2041 | $ | 485,000 | $458,780 | |
| Tax - Other – 4.0% | ||||
| Birmingham-Jefferson, AL, Civic Center Authority, “B”, 5%, 7/01/2043 | $ | 535,000 | $533,613 | |
| Chicago, IL, Board of Education, Dedicated Capital Improvement Tax Bond, 5%, 4/01/2045 | 60,000 | 59,226 | ||
| Chicago, IL, Board of Education, Dedicated Capital Improvement Tax Bond, 5.75%, 4/01/2048 | 175,000 | 183,207 | ||
| Monongalia County, WV, Senior Tax Increment Improvement Refunding Rev. (Development District No. 4 - University Town Centre), “A”, 6%, 5/31/2053 (n) | 1,000,000 | 1,023,227 | ||
| New York, NY, Transitional Finance Authority Rev., “C-1”, 4%, 5/01/2045 | 790,000 | 706,948 | ||
| Virgin Islands Public Finance Authority Rev. (Gross Receipts), AGM, 5%, 10/01/2032 | 1,000,000 | 999,966 | ||
| Wisconsin Public Finance Authority Limited Obligation PILOT Rev. (American Dream at Meadowlands Project), 7%, 12/01/2050 | 100,000 | 88,977 | ||
| $3,595,164 | ||||
| Tax Assessment – 1.4% | ||||
| Morgantown, WV, Tax Increment Rev., Parking Garage Project, “A”, 5%, 6/01/2033 | $ | 455,000 | $414,343 | |
| Ohio County, WV, Commission Tax Increment Rev. (Fort Henry Centre), 4%, 6/01/2034 | 1,000,000 | 881,835 | ||
| $1,296,178 | ||||
| Tobacco – 0.9% | ||||
| Buckeye, OH, Tobacco Settlement Financing Authority Senior Asset-Backed Refunding, 2020A-2, “1”, 4%, 6/01/2048 | $ | 125,000 | $105,585 | |
| Buckeye, OH, Tobacco Settlement Financing Authority Senior Asset-Backed Refunding, 2020B-2, “2”, 5%, 6/01/2055 | 500,000 | 430,705 | ||
| Golden State, CA, Tobacco Securitization Corp., Tobacco Settlement Rev., Taxable, “B-1”, 3.85%, 6/01/2050 | 335,000 | 303,863 | ||
| $840,153 | ||||
| Toll Roads – 2.6% | ||||
| Texas Private Activity Surface Transportation Corp., Senior Lien Rev. (NTE Mobility Partners Segments 3 LLC Segments 3A & 3B Facility), 7%, 12/31/2038 | $ | 155,000 | $155,294 | |
| Texas Private Activity Surface Transportation Corp., Senior Lien Rev. (NTE Mobility Partners Segments 3 LLC Segments 3A & 3B Facility), 6.75%, 6/30/2043 | 120,000 | 120,192 | ||
| Virginia Small Business Financing Authority Senior Lien Rev. (Elizabeth River Crossings Opco LLC Project), 3%, 1/01/2041 | 325,000 | 233,973 | ||
| West Virginia Parkways Authority, Senior Lien Turnpike Toll Rev., 4%, 6/01/2042 | 1,000,000 | 909,632 | ||
| West Virginia Parkways Authority, Turnpike Toll Rev., 4%, 6/01/2047 | 1,000,000 | 879,816 | ||
| $2,298,907 | ||||
| Transportation - Special Tax – 2.2% | ||||
| New Jersey Transportation Trust Fund Authority, “AA”, 4%, 6/15/2050 | $ | 1,000,000 | $869,110 | |
| New Jersey Transportation Trust Fund Authority, Transportation Program, “BB”, 4%, 6/15/2044 | 1,225,000 | 1,079,145 | ||
| $1,948,255 | ||||
| Universities - Colleges – 9.1% | ||||
| Fairmont, WV, State University Board of Governors Refunding Rev., “A”, 5%, 6/01/2032 | $ | 1,050,000 | $1,119,028 | |
53
Portfolio of Investments (unaudited) –
continued
| Issuer | Shares/Par | Value ($) | ||
| Municipal Bonds – continued | ||||
| Universities - Colleges – continued | ||||
| Marshall University, WV, Board of Governors Rev., “A”, AGM, 3%, 5/01/2046 | $ | 1,000,000 | $687,709 | |
| Marshall University, WV, Board of Governors Rev., “A”, AGM, 4%, 5/01/2050 | 1,500,000 | 1,221,864 | ||
| Puerto Rico Industrial, Tourist, Educational, Medical & Environmental Control Facilities Financing Authority, Higher Education Rev. (International American University of Puerto Rico Project), 5%, 10/01/2031 | 100,000 | 100,070 | ||
| West Virginia University, Board of Governors Improvement Rev. (West Virginia University Project), “A”, 5%, 10/01/2044 | 1,000,000 | 1,024,895 | ||
| West Virginia University, Board of Governors Improvement Rev. (West Virginia University Project), “A”, 5%, 10/01/2049 | 2,000,000 | 2,025,988 | ||
| West Virginia University, University Systems Rev., “A”, NPFG, 5.25%, 4/01/2028 | 2,035,000 | 2,078,319 | ||
| $8,257,873 | ||||
| Universities - Dormitories – 1.1% | ||||
| West Virginia Economic Development Authority, University Facilities Refunding Rev. (Provident Group - Marshall Properties LLC - Marshall University Project), “A-1”, AGM, 5%, 6/30/2042 | $ | 1,000,000 | $1,022,890 | |
| Utilities - Investor Owned – 2.8% | ||||
| West Virginia Economic Development Authority, Solid Waste Disposal Facilities Refunding Rev. (Wheeling Power Co. - Mitchell Project), “A”, 3%, 6/01/2037 (Put Date 6/18/2027) | $ | 1,000,000 | $919,368 | |
| West Virginia Economic Development Authority, Solid Waste Disposal Facilities Rev. (Appalachian Power Company - Amos Project), “A”, 0.625%, 12/01/2038 (Put Date 12/15/2025) | 750,000 | 678,221 | ||
| West Virginia Economic Development Authority, Solid Waste Disposal Facilities Rev. (Appalachian Power Company - Amos Project), “A”, 1%, 1/01/2041 (Put Date 9/01/2025) | 1,000,000 | 923,334 | ||
| $2,520,923 | ||||
| Utilities - Municipal Owned – 1.0% | ||||
| Guam Power Authority Rev., “A”, AGM, 5%, 10/01/2033 | $ | 435,000 | $438,295 | |
| Puerto Rico Electric Power Authority Refunding Rev., “DDD”, 5%, 7/01/2020 (a)(d) | 10,000 | 2,500 | ||
| Puerto Rico Electric Power Authority Refunding Rev., “DDD”, 5%, 7/01/2021 (a)(d) | 110,000 | 27,500 | ||
| Puerto Rico Electric Power Authority Refunding Rev., “DDD”, 5%, 7/01/2022 (a)(d) | 180,000 | 45,000 | ||
| Puerto Rico Electric Power Authority Refunding Rev., “VV”, NPFG, 5.25%, 7/01/2030 | 135,000 | 133,392 | ||
| Puerto Rico Electric Power Authority Refunding Rev., “VV”, NPFG, 5.25%, 7/01/2034 | 10,000 | 9,862 | ||
| Puerto Rico Electric Power Authority Rev., “A”, 5%, 7/01/2029 (a)(d) | 285,000 | 71,250 | ||
| Puerto Rico Electric Power Authority Rev., “A”, 5%, 7/01/2042 (a)(d) | 45,000 | 11,250 | ||
| Puerto Rico Electric Power Authority Rev., “AAA”, 5.25%, 7/01/2021 (a)(d) | 20,000 | 5,000 | ||
| Puerto Rico Electric Power Authority Rev., “AAA”, 5.25%, 7/01/2030 (a)(d) | 10,000 | 2,500 | ||
| Puerto Rico Electric Power Authority Rev., “CCC”, 5.25%, 7/01/2027 (a)(d) | 100,000 | 25,000 | ||
| Puerto Rico Electric Power Authority Rev., “TT”, 5%, 7/01/2021 (a)(d) | 40,000 | 10,000 | ||
| Puerto Rico Electric Power Authority Rev., “TT”, 5%, 7/01/2023 (a)(d) | 50,000 | 12,500 | ||
| Puerto Rico Electric Power Authority Rev., “TT”, 5%, 7/01/2027 (a)(d) | 10,000 | 2,500 | ||
| Puerto Rico Electric Power Authority Rev., “TT”, 5%, 7/01/2037 (a)(d) | 145,000 | 36,250 | ||
| Puerto Rico Electric Power Authority Rev., “WW”, 5.375%, 7/01/2022 (a)(d) | 10,000 | 2,500 | ||
| Puerto Rico Electric Power Authority Rev., “WW”, 5.25%, 7/01/2025 (a)(d) | 20,000 | 5,000 | ||
| Puerto Rico Electric Power Authority Rev., “ZZ”, 5%, 7/01/2018 (a)(d) | 70,000 | 17,500 | ||
| Puerto Rico Electric Power Authority Rev., “ZZ”, 5.25%, 7/01/2023 (a)(d) | 75,000 | 18,750 | ||
| Puerto Rico Electric Power Authority Rev., “ZZ”, 5.25%, 7/01/2024 (a)(d) | 20,000 | 5,000 | ||
| Puerto Rico Electric Power Authority Rev., “ZZ”, 5.25%, 7/01/2026 (a)(d) | 65,000 | 16,250 | ||
| Puerto Rico Electric Power Authority Rev., Taxable, “EEE”, 6.05%, 7/01/2032 (a)(d) | 50,000 | 12,500 | ||
| $910,299 | ||||
| Utilities - Other – 3.0% | ||||
| Black Belt Energy Gas District, AL, Gas Project Rev., “A”, 4%, 6/01/2051 (Put Date 12/01/2031) | $ | 280,000 | $264,006 | |
| Black Belt Energy Gas District, AL, Gas Project Rev., “C-1”, 5.25%, 2/01/2053 (Put Date 6/01/2029) | 565,000 | 573,338 | ||
| California Community Choice Financing Authority, Clean Energy Project Rev., “C”, 5.25%, 1/01/2054 (Put Date 10/01/2031) | 560,000 | 558,679 | ||
| Southeast Alabama Energy Authority Commodity Supply Rev. (Project No. 5), “A”, 5.25%, 1/01/2054 (Put Date 7/01/2029) | 510,000 | 513,310 | ||
| Tennergy Corp., TN, Gas Supply Rev., “A”, 5.5%, 10/01/2053 (Put Date 12/01/2030) | 310,000 | 314,853 | ||
| Tennessee Energy Acquisition Corp., Gas Project Rev., “A-1”, 5%, 5/01/2053 (Put Date 5/01/2028) | 490,000 | 488,861 | ||
| $2,713,047 | ||||
| Water & Sewer Utility Revenue – 10.6% | ||||
| Berkeley County, WV, Public Service Sewer District, “A”, BAM, 5%, 6/01/2036 | $ | 1,700,000 | $1,721,401 | |
| Greenbrier County, WV, Public Service District No. 1, Sewerage System Improvement Rev., “A”, BAM, 4.625%, 10/01/2052 | 1,000,000 | 926,081 | ||
54
Portfolio of Investments (unaudited) –
continued
| Issuer | Shares/Par | Value ($) | ||
| Municipal Bonds – continued | ||||
| Water & Sewer Utility Revenue – continued | ||||
| Guam Waterworks Authority Rev. (Water and Wastewater System), 5%, 7/01/2036 | $ | 40,000 | $40,002 | |
| Guam Waterworks Authority Rev. (Water and Wastewater System), 5%, 1/01/2046 | 180,000 | 169,645 | ||
| Guam Waterworks Authority Rev. (Water and Wastewater System), “A”, 5%, 7/01/2029 | 20,000 | 20,035 | ||
| Guam Waterworks Authority Rev. (Water and Wastewater System), “A”, 5%, 7/01/2035 | 20,000 | 20,012 | ||
| Guam Waterworks Authority Rev. (Water and Wastewater System), “A”, 5%, 1/01/2050 | 135,000 | 125,110 | ||
| Michigan Finance Authority Local Government Loan Program Rev. (Detroit Water and Sewerage Department Sewage Disposal System Rev. Refunding Second Lien Local Project), “C-7”, NPFG, 5%, 7/01/2032 | 35,000 | 35,200 | ||
| Michigan Finance Authority Local Government Loan Program Rev. (Detroit Water and Sewerage Department Water Supply System Rev. Refunding Second Lien Local Project), “D-6”, NPFG, 5%, 7/01/2036 | 40,000 | 40,088 | ||
| Michigan Finance Authority Local Government Loan Program Rev. (Detroit Water and Sewerage Department Water Supply System Rev. Refunding Senior Lien Local Project), “D-1”, AGM, 5%, 7/01/2035 | 20,000 | 20,095 | ||
| Michigan Finance Authority Local Government Loan Program Rev. (Detroit Water and Sewerage Department Water Supply System Rev. Refunding Senior Lien Local Project), “D-1”, AGM, 5%, 7/01/2037 | 50,000 | 50,136 | ||
| Mississippi Development Bank Special Obligation (Jackson Water and Sewer System Rev. Bond Project), AGM, 6.875%, 12/01/2040 | 75,000 | 75,232 | ||
| Morgantown, WV, Combined Utility System Rev., “A”, AGM, 5%, 12/01/2041 | 1,000,000 | 1,016,878 | ||
| Morgantown, WV, Combined Utility System Rev., “B”, 5%, 12/01/2043 | 2,000,000 | 2,025,897 | ||
| West Virginia Water Development Authority Rev. (Loan Program II), “A-II”, 5%, 11/01/2033 | 1,475,000 | 1,511,425 | ||
| West Virginia Water Development Authority Rev. (Loan Program IV), “A-IV”, 5%, 11/01/2038 | 500,000 | 516,945 | ||
| Wheeling, WV, Combined Waterworks and Sewerage System Rev., “A”, BAM, 4%, 6/01/2051 | 1,500,000 | 1,263,068 | ||
| $9,577,250 | ||||
| Total Municipal Bonds (Identified Cost, $96,758,791) | $88,011,364 | |||
| Bonds – 0.3% | ||||
| Consumer Services – 0.3% | ||||
| Toll Road Investors Partnership II LP, Capital Appreciation, NPFG, 0%, 2/15/2025 (n) | $ | 167,000 | $150,373 | |
| Toll Road Investors Partnership II LP, Capital Appreciation, NPFG, 0%, 2/15/2043 (n) | 378,198 | 124,327 | ||
| Total Bonds (Identified Cost, $300,549) | $274,700 | |||
| Contingent Value Instruments – 0.1% | ||||
| General Obligations - General Purpose – 0.1% | ||||
| Commonwealth of Puerto Rico, General Obligation Contingent Value Instrument, 11/01/2043 (Identified Cost, $114,434) | $ | 192,873 | $100,053 | |
| Investment Companies (h) – 0.8% | ||||
| Money Market Funds – 0.8% | ||||
| MFS Institutional Money Market Portfolio, 5.4% (v) (Identified Cost, $752,555) | 752,485 | $752,636 | ||
| Other Assets, Less Liabilities – 1.3% | 1,160,199 | |||
| Net Assets – 100.0% | $90,298,952 | |||
Portfolio Footnotes:
| (a) | Non-income producing security. |
| (d) | In default. |
| (h) | An affiliated issuer, which may be considered one in which the fund owns 5% or more of the outstanding voting securities, or a company which is under common control. At period end, the aggregate values of each fund’s investments in affiliated issuers and in unaffiliated issuers were as follows: |
| Affiliated Issuers | Unaffiliated Issuers | |
| Mississippi Fund | $1,287,098 | $76,277,372 |
| New York Fund | 1,394,099 | 153,403,112 |
| North Carolina Fund | 4,492,814 | 425,822,346 |
| Pennsylvania Fund | 2,423,389 | 149,337,985 |
| South Carolina Fund | 1,497,131 | 192,838,904 |
| Virginia Fund | 3,371,574 | 330,413,958 |
| West Virginia Fund | 752,636 | 88,386,117 |
55
Portfolio of Investments (unaudited) –
continued
| (n) | Securities exempt from registration under Rule 144A of the Securities Act of 1933. These securities may be sold in the ordinary course of business in transactions exempt from registration, normally to qualified institutional buyers. At period end, the aggregate value of these securities and percentage of net assets for each fund is as follows: |
| Value | Percent of net assets | |
| Mississippi Fund | $1,013,699 | 1.3% |
| New York Fund | 8,620,033 | 5.5% |
| North Carolina Fund | 5,517,910 | 1.3% |
| Pennsylvania Fund | 4,069,648 | 2.7% |
| South Carolina Fund | 4,715,831 | 2.4% |
| Virginia Fund | 7,212,772 | 2.1% |
| West Virginia Fund | 2,929,135 | 3.2% |
| (v) | Affiliated issuer that is available only to investment companies managed by MFS. The rate quoted for the MFS Institutional Money Market Portfolio is the annualized seven-day yield of the fund at period end. |
| (w) | When-issued security. |
| The following abbreviations are used in this report and are defined: | |
| AAC | Ambac Assurance Corp. |
| AGM | Assured Guaranty Municipal |
| BAM | Build America Mutual |
| COP | Certificate of Participation |
| ETM | Escrowed to Maturity |
| FGIC | Financial Guaranty Insurance Co. |
| FHA | Federal Housing Administration |
| FLR | Floating Rate. Interest rate resets periodically based on the parenthetically disclosed reference rate plus a spread (if any). The period-end rate reported may not be the current rate. All reference rates are USD unless otherwise noted. |
| FNMA | Federal National Mortgage Assn. |
| GNMA | Government National Mortgage Assn. |
| NPFG | National Public Finance Guarantee Corp. |
| SOFR | Secured Overnight Financing Rate |
| VRDN | Variable rate demand note that may be puttable to the issuer at the option of the holder. The stated interest rate, which generally resets either daily or weekly, represents the rate in effect at period end and may not be the current rate. |
See Notes to Financial Statements
56
Financial Statements
Statements of Assets and
Liabilities
At 9/30/23 (unaudited)
These statements represent each
fund's balance sheet, which details the assets and liabilities comprising the total value of each fund.
| Mississippi Fund | New York Fund | North Carolina Fund | Pennsylvania Fund | |
| Assets | ||||
| Investments in unaffiliated issuers, at value (identified cost, $83,530,118, $170,153,224, $466,394,298, and $163,823,429, respectively) | $76,277,372 | $153,403,112 | $425,822,346 | $149,337,985 |
| Investments in affiliated issuers, at value (identified cost, $1,287,233, $1,393,922, $4,492,433, and $2,422,879, respectively) | 1,287,098 | 1,394,099 | 4,492,814 | 2,423,389 |
| Receivables for | ||||
| Investments sold | — | — | 1,629,750 | 100,000 |
| Fund shares sold | 1,002,526 | 57,720 | 3,020,153 | 204,256 |
| Interest | 1,014,481 | 2,282,001 | 6,364,014 | 2,119,070 |
| Receivable from investment adviser | — | 10,180 | — | 6,125 |
| Other assets | 10,885 | 8,800 | 8,856 | 7,321 |
| Total assets | $79,592,362 | $157,155,912 | $441,337,933 | $154,198,146 |
| Liabilities | ||||
| Payable to custodian | $— | $— | $— | $1,089 |
| Payables for | ||||
| Distributions | 8,952 | 71,097 | 56,805 | 45,511 |
| Investments purchased | — | — | — | 1,000,000 |
| Fund shares reacquired | 191,344 | 167,017 | 1,485,816 | 309,683 |
| When-issued investments purchased | — | — | 5,704,296 | — |
| Payable to affiliates | ||||
| Investment adviser | 2,853 | — | 14,280 | — |
| Administrative services fee | 178 | 269 | 594 | 264 |
| Shareholder servicing costs | 15,507 | 41,575 | 85,905 | 31,094 |
| Distribution and service fees | 571 | 2,828 | 7,410 | 875 |
| Payable for independent Trustees' compensation | — | 24 | 2,225 | — |
| Payable for audit and tax fees | 33,107 | 33,111 | 33,115 | 33,108 |
| Accrued expenses and other liabilities | 26,015 | 34,649 | 61,074 | 30,884 |
| Total liabilities | $278,527 | $350,570 | $7,451,520 | $1,452,508 |
| Net assets | $79,313,835 | $156,805,342 | $433,886,413 | $152,745,638 |
| Net assets consist of | ||||
| Paid-in capital | $91,700,851 | $186,909,322 | $499,208,555 | $174,704,237 |
| Total distributable earnings (loss) | (12,387,016) | (30,103,980) | (65,322,142) | (21,958,599) |
| Net assets | $79,313,835 | $156,805,342 | $433,886,413 | $152,745,638 |
57
Statements of Assets and Liabilities (unaudited) – continued
| Mississippi Fund | New York Fund | North Carolina Fund | Pennsylvania Fund | |
| Net assets | ||||
| Class A | $69,061,488 | $114,520,429 | $288,508,346 | $103,854,243 |
| Class B | 50,714 | 427,319 | 144,579 | 332,056 |
| Class C | — | 5,359,379 | 18,034,989 | — |
| Class I | 7,089,108 | 32,134,428 | 95,199,379 | 28,829,091 |
| Class R6 | 3,112,525 | 4,363,787 | 31,999,120 | 19,730,248 |
| Total net assets | $79,313,835 | $156,805,342 | $433,886,413 | $152,745,638 |
| Shares of beneficial interest outstanding | ||||
| Class A | 8,247,920 | 12,226,307 | 28,349,516 | 11,568,039 |
| Class B | 6,050 | 45,740 | 14,224 | 36,888 |
| Class C | — | 572,856 | 1,773,144 | — |
| Class I | 848,011 | 3,880,149 | 11,222,040 | 3,370,019 |
| Class R6 | 372,321 | 526,171 | 3,771,823 | 2,306,262 |
| Total shares of beneficial interest outstanding | 9,474,302 | 17,251,223 | 45,130,747 | 17,281,208 |
| Class A shares | ||||
| Net asset value per share (net assets / shares of beneficial interest outstanding) | $8.37 | $9.37 | $10.18 | $8.98 |
| Offering price per share (100 / 95.75 x net asset value per share) | $8.74 | $9.79 | $10.63 | $9.38 |
| Class B shares | ||||
| Net asset value and offering price per share (net assets / shares of beneficial interest outstanding) | $8.38 | $9.34 | $10.16 | $9.00 |
| Class C shares | ||||
| Net asset value and offering price per share (net assets / shares of beneficial interest outstanding) | $— | $9.36 | $10.17 | $— |
| Class I shares | ||||
| Net asset value, offering price, and redemption price per share (net assets / shares of beneficial interest outstanding) | $8.36 | $8.28 | $8.48 | $8.55 |
| Class R6 shares | ||||
| Net asset value, offering price, and redemption price per share (net assets / shares of beneficial interest outstanding) | $8.36 | $8.29 | $8.48 | $8.56 |
| On sales of $100,000 or more, the maximum offering price of Class A shares is reduced. A contingent deferred sales charge may be imposed on redemptions of Class A, Class B, and Class C shares. | ||||
See Notes to Financial Statements
58
Statements of Assets and Liabilities (unaudited) – continued
| At 9/30/23 | South Carolina Fund | Virginia Fund | West Virginia Fund |
| Assets | |||
| Investments in unaffiliated issuers, at value (identified cost, $212,133,658, $364,920,417, and $97,173,774, respectively) | $192,838,904 | $330,413,958 | $88,386,117 |
| Investments in affiliated issuers, at value (identified cost, $1,496,972, $3,370,959, and $752,555, respectively) | 1,497,131 | 3,371,574 | 752,636 |
| Receivables for | |||
| Investments sold | — | — | 10,000 |
| Fund shares sold | 544,653 | 3,019,538 | 1,835 |
| Interest | 2,679,679 | 4,751,112 | 1,322,405 |
| Receivable from investment adviser | — | 3,588 | 7,228 |
| Other assets | 9,984 | 8,814 | 9,831 |
| Total assets | $197,570,351 | $341,568,584 | $90,490,052 |
| Liabilities | |||
| Payables for | |||
| Distributions | $16,825 | $63,652 | $10,660 |
| Fund shares reacquired | 228,112 | 3,436,153 | 98,976 |
| Payable to affiliates | |||
| Investment adviser | 302 | — | — |
| Administrative services fee | 316 | 483 | 191 |
| Shareholder servicing costs | 35,217 | 82,247 | 22,460 |
| Distribution and service fees | 2,876 | 5,228 | 1,484 |
| Payable for independent Trustees' compensation | 2,250 | 2,241 | 2,249 |
| Payable for audit and tax fees | 33,110 | 33,113 | 33,107 |
| Accrued expenses and other liabilities | 35,373 | 50,396 | 21,973 |
| Total liabilities | $354,381 | $3,673,513 | $191,100 |
| Net assets | $197,215,970 | $337,895,071 | $90,298,952 |
| Net assets consist of | |||
| Paid-in capital | $233,677,032 | $391,263,892 | $105,448,075 |
| Total distributable earnings (loss) | (36,461,062) | (53,368,821) | (15,149,123) |
| Net assets | $197,215,970 | $337,895,071 | $90,298,952 |
59
Statements of Assets and Liabilities (unaudited) – continued
| South Carolina Fund | Virginia Fund | West Virginia Fund | |
| Net assets | |||
| Class A | $139,767,430 | $225,387,871 | $72,013,872 |
| Class B | 66,924 | 209,667 | 57,452 |
| Class C | — | 6,886,883 | — |
| Class I | 42,056,872 | 83,723,771 | 14,760,306 |
| Class R6 | 15,324,744 | 21,686,879 | 3,467,322 |
| Total net assets | $197,215,970 | $337,895,071 | $90,298,952 |
| Shares of beneficial interest outstanding | |||
| Class A | 13,438,473 | 23,375,285 | 7,546,630 |
| Class B | 6,439 | 21,762 | 6,022 |
| Class C | — | 714,427 | — |
| Class I | 4,991,170 | 9,990,326 | 1,757,379 |
| Class R6 | 1,818,404 | 2,585,753 | 412,878 |
| Total shares of beneficial interest outstanding | 20,254,486 | 36,687,553 | 9,722,909 |
| Class A shares | |||
| Net asset value per share (net assets / shares of beneficial interest outstanding) | $10.40 | $9.64 | $9.54 |
| Offering price per share (100 / 95.75 x net asset value per share) | $10.86 | $10.07 | $9.96 |
| Class B shares | |||
| Net asset value and offering price per share (net assets / shares of beneficial interest outstanding) | $10.39 | $9.63 | $9.54 |
| Class C shares | |||
| Net asset value and offering price per share (net assets / shares of beneficial interest outstanding) | $— | $9.64 | $— |
| Class I shares | |||
| Net asset value, offering price, and redemption price per share (net assets / shares of beneficial interest outstanding) | $8.43 | $8.38 | $8.40 |
| Class R6 shares | |||
| Net asset value, offering price, and redemption price per share (net assets / shares of beneficial interest outstanding) | $8.43 | $8.39 | $8.40 |
| On sales of $100,000 or more, the maximum offering price of Class A shares is reduced. A contingent deferred sales charge may be imposed on redemptions of Class A, Class B, and Class C shares. | |||
See Notes to Financial Statements
60
Financial Statements
Statements of Operations
Six months ended 9/30/23 (unaudited)
These statements describe how much
each fund earned in investment income and accrued in expenses. They also describe any gains or losses generated by each fund’s operations.
| Mississippi Fund | New York Fund | North Carolina Fund | Pennsylvania Fund | |
| Net investment income (loss) | ||||
| Interest | $1,429,255 | $3,819,928 | $8,031,438 | $2,994,790 |
| Dividends from affiliated issuers | 33,969 | 92,080 | 168,467 | 72,703 |
| Other | 47 | 88 | 154 | 75 |
| Total investment income | $1,463,271 | $3,912,096 | $8,200,059 | $3,067,568 |
| Expenses | ||||
| Management fee | $184,728 | $429,772 | $1,020,409 | $365,658 |
| Distribution and service fees | 89,755 | 187,615 | 478,074 | 140,456 |
| Shareholder servicing costs | 27,320 | 79,336 | 162,661 | 61,388 |
| Administrative services fee | 11,054 | 18,870 | 37,711 | 16,826 |
| Independent Trustees' compensation | 1,771 | 2,757 | 4,829 | 2,414 |
| Custodian fee | 9,895 | 17,899 | 30,526 | 16,505 |
| Shareholder communications | 3,682 | 5,476 | 8,937 | 5,895 |
| Audit and tax fees | 32,886 | 32,888 | 32,892 | 32,886 |
| Legal fees | 2,717 | 7,118 | 5,188 | 5,969 |
| Registration fees | 30,005 | 36,351 | 38,371 | 31,028 |
| Miscellaneous | 13,379 | 14,807 | 16,809 | 14,139 |
| Total expenses | $407,192 | $832,889 | $1,836,407 | $693,164 |
| Fees paid indirectly | (22) | (162) | (169) | (96) |
| Reduction of expenses by investment adviser and distributor | (58,922) | (101,387) | (32,670) | (163,584) |
| Net expenses | $348,248 | $731,340 | $1,803,568 | $529,484 |
| Net investment income (loss) | $1,115,023 | $3,180,756 | $6,396,491 | $2,538,084 |
| Realized and unrealized gain (loss) | ||||
| Realized gain (loss) (identified cost basis) | ||||
| Unaffiliated issuers | $(239,847) | $(1,322,798) | $(1,486,395) | $(839,158) |
| Affiliated issuers | (526) | (1,859) | (840) | (821) |
| Net realized gain (loss) | $(240,373) | $(1,324,657) | $(1,487,235) | $(839,979) |
| Change in unrealized appreciation or depreciation | ||||
| Unaffiliated issuers | $(4,847,900) | $(9,227,004) | $(25,307,798) | $(8,871,658) |
| Affiliated issuers | (313) | (558) | (1,103) | (125) |
| Net unrealized gain (loss) | $(4,848,213) | $(9,227,562) | $(25,308,901) | $(8,871,783) |
| Net realized and unrealized gain (loss) | $(5,088,586) | $(10,552,219) | $(26,796,136) | $(9,711,762) |
| Change in net assets from operations | $(3,973,563) | $(7,371,463) | $(20,399,645) | $(7,173,678) |
See Notes to Financial Statements
61
Statements of Operations (unaudited) –
continued
| Six months ended 9/30/23 | South Carolina Fund | Virginia Fund | West Virginia Fund |
| Net investment income (loss) | |||
| Interest | $3,748,245 | $6,220,464 | $1,794,156 |
| Dividends from affiliated issuers | 62,766 | 156,824 | 23,904 |
| Other | 86 | 126 | 50 |
| Total investment income | $3,811,097 | $6,377,414 | $1,818,110 |
| Expenses | |||
| Management fee | $472,477 | $807,258 | $216,588 |
| Distribution and service fees | 188,380 | 343,500 | 96,658 |
| Shareholder servicing costs | 66,907 | 146,787 | 41,011 |
| Administrative services fee | 20,233 | 30,912 | 12,070 |
| Independent Trustees' compensation | 2,932 | 4,109 | 2,035 |
| Custodian fee | 17,422 | 24,185 | 9,596 |
| Shareholder communications | 5,500 | 7,223 | 3,917 |
| Audit and tax fees | 32,887 | 32,890 | 32,886 |
| Legal fees | 5,331 | 4,390 | 1,625 |
| Registration fees | 30,172 | 37,916 | 31,117 |
| Miscellaneous | 14,520 | 15,951 | 13,486 |
| Total expenses | $856,761 | $1,455,121 | $460,989 |
| Fees paid indirectly | (140) | (93) | (92) |
| Reduction of expenses by investment adviser and distributor | (53,282) | (115,928) | (66,993) |
| Net expenses | $803,339 | $1,339,100 | $393,904 |
| Net investment income (loss) | $3,007,758 | $5,038,314 | $1,424,206 |
| Realized and unrealized gain (loss) | |||
| Realized gain (loss) (identified cost basis) | |||
| Unaffiliated issuers | $(1,987,816) | $(3,820,888) | $(328,255) |
| Affiliated issuers | (383) | 1,248 | (172) |
| Net realized gain (loss) | $(1,988,199) | $(3,819,640) | $(328,427) |
| Change in unrealized appreciation or depreciation | |||
| Unaffiliated issuers | $(10,999,616) | $(18,822,309) | $(5,445,014) |
| Affiliated issuers | (51) | (277) | (61) |
| Net unrealized gain (loss) | $(10,999,667) | $(18,822,586) | $(5,445,075) |
| Net realized and unrealized gain (loss) | $(12,987,866) | $(22,642,226) | $(5,773,502) |
| Change in net assets from operations | $(9,980,108) | $(17,603,912) | $(4,349,296) |
See Notes to Financial Statements
62
Financial Statements
Statements of Changes in Net
Assets
These statements describe the
increases and/or decreases in net assets resulting from operations, any distributions, and any shareholder transactions.
| Six months ended 9/30/23 (unaudited) | Mississippi Fund | New York Fund | North Carolina Fund | Pennsylvania Fund |
| Change in net assets | ||||
| From operations | ||||
| Net investment income (loss) | $1,115,023 | $3,180,756 | $6,396,491 | $2,538,084 |
| Net realized gain (loss) | (240,373) | (1,324,657) | (1,487,235) | (839,979) |
| Net unrealized gain (loss) | (4,848,213) | (9,227,562) | (25,308,901) | (8,871,783) |
| Change in net assets from operations | $(3,973,563) | $(7,371,463) | $(20,399,645) | $(7,173,678) |
| Total distributions to shareholders | $(1,147,254) | $(3,354,767) | $(6,670,942) | $(2,640,874) |
| Change in net assets from fund share transactions | $520,043 | $(50,252,308) | $8,647,188 | $(3,554,539) |
| Total change in net assets | $(4,600,774) | $(60,978,538) | $(18,423,399) | $(13,369,091) |
| Net assets | ||||
| At beginning of period | 83,914,609 | 217,783,880 | 452,309,812 | 166,114,729 |
| At end of period | $79,313,835 | $156,805,342 | $433,886,413 | $152,745,638 |
| Six months ended 9/30/23 (unaudited) | South Carolina Fund | Virginia Fund | West Virginia Fund |
| Change in net assets | |||
| From operations | |||
| Net investment income (loss) | $3,007,758 | $5,038,314 | $1,424,206 |
| Net realized gain (loss) | (1,988,199) | (3,819,640) | (328,427) |
| Net unrealized gain (loss) | (10,999,667) | (18,822,586) | (5,445,075) |
| Change in net assets from operations | $(9,980,108) | $(17,603,912) | $(4,349,296) |
| Total distributions to shareholders | $(3,043,698) | $(5,251,515) | $(1,456,184) |
| Change in net assets from fund share transactions | $(3,086,032) | $(1,258,923) | $(3,388,528) |
| Total change in net assets | $(16,109,838) | $(24,114,350) | $(9,194,008) |
| Net assets | |||
| At beginning of period | 213,325,808 | 362,009,421 | 99,492,960 |
| At end of period | $197,215,970 | $337,895,071 | $90,298,952 |
See Notes to Financial Statements
63
Statements of Changes in Net Assets –
continued
| Year ended 3/31/23 | Mississippi Fund | New York Fund | North Carolina Fund | Pennsylvania Fund |
| Change in net assets | ||||
| From operations | ||||
| Net investment income (loss) | $2,129,191 | $6,817,763 | $11,114,359 | $4,562,568 |
| Net realized gain (loss) | (1,887,065) | (8,287,593) | (10,728,203) | (4,208,152) |
| Net unrealized gain (loss) | (2,459,904) | (6,865,116) | (10,633,552) | (5,102,945) |
| Change in net assets from operations | $(2,217,778) | $(8,334,946) | $(10,247,396) | $(4,748,529) |
| Total distributions to shareholders | $(2,234,760) | $(7,026,543) | $(11,616,464) | $(4,736,498) |
| Change in net assets from fund share transactions | $(9,802,626) | $(26,384,440) | $(67,570,276) | $(15,531,967) |
| Total change in net assets | $(14,255,164) | $(41,745,929) | $(89,434,136) | $(25,016,994) |
| Net assets | ||||
| At beginning of period | 98,169,773 | 259,529,809 | 541,743,948 | 191,131,723 |
| At end of period | $83,914,609 | $217,783,880 | $452,309,812 | $166,114,729 |
| Year ended 3/31/23 | South Carolina Fund | Virginia Fund | West Virginia Fund |
| Change in net assets | |||
| From operations | |||
| Net investment income (loss) | $5,442,532 | $9,257,508 | $2,596,176 |
| Net realized gain (loss) | (9,606,016) | (7,317,996) | (2,294,870) |
| Net unrealized gain (loss) | (2,950,265) | (9,131,583) | (2,835,655) |
| Change in net assets from operations | $(7,113,749) | $(7,192,071) | $(2,534,349) |
| Total distributions to shareholders | $(5,622,830) | $(9,469,451) | $(2,712,235) |
| Change in net assets from fund share transactions | $(53,709,621) | $4,859,970 | $(7,381,557) |
| Total change in net assets | $(66,446,200) | $(11,801,552) | $(12,628,141) |
| Net assets | |||
| At beginning of period | 279,772,008 | 373,810,973 | 112,121,101 |
| At end of period | $213,325,808 | $362,009,421 | $99,492,960 |
See Notes to Financial Statements
64
Financial Statements
Financial Highlights
MFS MISSISSIPPI MUNICIPAL BOND
FUND
The financial highlights table is
intended to help you understand the fund's financial performance for the semiannual period and the past 5 fiscal years. Certain information reflects financial results for a single fund share. The total returns in the
table represent the rate that an investor would have earned (or lost) on an investment in the fund share class (assuming reinvestment of all distributions) held for the entire period.
| Six months ended | Year ended | |||||
| Class A | 9/30/23 (unaudited) | 3/31/23 | 3/31/22 | 3/31/21 | 3/31/20 | 3/31/19 |
| Net asset value, beginning of period | $8.92 | $9.33 | $9.90 | $9.63 | $9.64 | $9.53 |
| Income (loss) from investment operations | ||||||
| Net investment income (loss) (d) | $0.12 | $0.21 | $0.19 | $0.23 | $0.28 | $0.34 |
| Net realized and unrealized gain (loss) | (0.55) | (0.39) | (0.57) | 0.27 | (0.01) | 0.08 |
| Total from investment operations | $(0.43) | $(0.18) | $(0.38) | $0.50 | $0.27 | $0.42 |
| Less distributions declared to shareholders | ||||||
| From net investment income | $(0.12) | $(0.23) | $(0.19) | $(0.23) | $(0.28) | $(0.31) |
| Net asset value, end of period (x) | $8.37 | $8.92 | $9.33 | $9.90 | $9.63 | $9.64 |
| Total return (%) (r)(s)(t)(x) | (4.84)(n) | (1.93) | (3.95) | 5.20 | 2.80 | 4.47 |
| Ratios (%) (to average net assets) and Supplemental data: | ||||||
| Expenses before expense reductions (f) | 1.03(a) | 1.01 | 0.97 | 0.97 | 0.98 | 1.00 |
| Expenses after expense reductions (f) | 0.86(a) | 0.85 | 0.80 | 0.81 | 0.82 | 0.83 |
| Net investment income (loss) | 2.70(a) | 2.41 | 1.90 | 2.33 | 2.88 | 3.53 |
| Portfolio turnover | 9(n) | 19 | 13 | 20 | 30 | 16 |
| Net assets at end of period (000 omitted) | $69,061 | $73,256 | $81,093 | $92,395 | $86,335 | $79,190 |
| Six months ended | Year ended | |||||
| Class B | 9/30/23 (unaudited) | 3/31/23 | 3/31/22 | 3/31/21 | 3/31/20 | 3/31/19 |
| Net asset value, beginning of period | $8.92 | $9.35 | $9.92 | $9.64 | $9.65 | $9.54 |
| Income (loss) from investment operations | ||||||
| Net investment income (loss) (d) | $0.09 | $0.15 | $0.12 | $0.18 | $0.22 | $0.27 |
| Net realized and unrealized gain (loss) | (0.54) | (0.41) | (0.57) | 0.26 | (0.01) | 0.09 |
| Total from investment operations | $(0.45) | $(0.26) | $(0.45) | $0.44 | $0.21 | $0.36 |
| Less distributions declared to shareholders | ||||||
| From net investment income | $(0.09) | $(0.17) | $(0.12) | $(0.16) | $(0.22) | $(0.25) |
| Net asset value, end of period (x) | $8.38 | $8.92 | $9.35 | $9.92 | $9.64 | $9.65 |
| Total return (%) (r)(s)(t)(x) | (5.04)(n) | (2.78) | (4.56) | 4.63 | 2.14 | 3.79 |
| Ratios (%) (to average net assets) and Supplemental data: | ||||||
| Expenses before expense reductions (f) | 1.78(a) | 1.76 | 1.72 | 1.72 | 1.73 | 1.75 |
| Expenses after expense reductions (f) | 1.52(a) | 1.50 | 1.45 | 1.46 | 1.47 | 1.49 |
| Net investment income (loss) | 2.06(a) | 1.71 | 1.26 | 1.79 | 2.24 | 2.87 |
| Portfolio turnover | 9(n) | 19 | 13 | 20 | 30 | 16 |
| Net assets at end of period (000 omitted) | $51 | $8 | $90 | $115 | $626 | $659 |
See Notes to Financial Statements
65
Financial
Highlights − continued
MFS MISSISSIPPI MUNICIPAL BOND
FUND − continued
| Six months ended | Year ended | |||||
| Class I | 9/30/23 (unaudited) | 3/31/23 | 3/31/22 | 3/31/21 | 3/31/20 | 3/31/19 |
| Net asset value, beginning of period | $8.90 | $9.31 | $9.89 | $9.61 | $9.63 | $9.51 |
| Income (loss) from investment operations | ||||||
| Net investment income (loss) (d) | $0.12 | $0.22 | $0.20 | $0.24 | $0.29 | $0.34 |
| Net realized and unrealized gain (loss) | (0.53) | (0.40) | (0.58) | 0.28 | (0.02) | 0.09 |
| Total from investment operations | $(0.41) | $(0.18) | $(0.38) | $0.52 | $0.27 | $0.43 |
| Less distributions declared to shareholders | ||||||
| From net investment income | $(0.13) | $(0.23) | $(0.20) | $(0.24) | $(0.29) | $(0.31) |
| Net asset value, end of period (x) | $8.36 | $8.90 | $9.31 | $9.89 | $9.61 | $9.63 |
| Total return (%) (r)(s)(t)(x) | (4.70)(n) | (1.85) | (3.96) | 5.41 | 2.79 | 4.67 |
| Ratios (%) (to average net assets) and Supplemental data: | ||||||
| Expenses before expense reductions (f) | 0.78(a) | 0.76 | 0.72 | 0.72 | 0.72 | 0.75 |
| Expenses after expense reductions (f) | 0.76(a) | 0.75 | 0.70 | 0.70 | 0.71 | 0.74 |
| Net investment income (loss) | 2.80(a) | 2.50 | 2.00 | 2.42 | 2.96 | 3.63 |
| Portfolio turnover | 9(n) | 19 | 13 | 20 | 30 | 16 |
| Net assets at end of period (000 omitted) | $7,089 | $7,777 | $13,661 | $13,878 | $11,374 | $8,672 |
| Six months ended | Year ended | |||||
| Class R6 | 9/30/23 (unaudited) | 3/31/23 | 3/31/22 | 3/31/21 | 3/31/20 | 3/31/19 |
| Net asset value, beginning of period | $8.90 | $9.31 | $9.89 | $9.61 | $9.63 | $9.51 |
| Income (loss) from investment operations | ||||||
| Net investment income (loss) (d) | $0.13 | $0.23 | $0.20 | $0.24 | $0.29 | $0.35 |
| Net realized and unrealized gain (loss) | (0.54) | (0.40) | (0.58) | 0.28 | (0.01) | 0.09 |
| Total from investment operations | $(0.41) | $(0.17) | $(0.38) | $0.52 | $0.28 | $0.44 |
| Less distributions declared to shareholders | ||||||
| From net investment income | $(0.13) | $(0.24) | $(0.20) | $(0.24) | $(0.30) | $(0.32) |
| Net asset value, end of period (x) | $8.36 | $8.90 | $9.31 | $9.89 | $9.61 | $9.63 |
| Total return (%) (r)(s)(t)(x) | (4.67)(n) | (1.78) | (3.90) | 5.48 | 2.85 | 4.74 |
| Ratios (%) (to average net assets) and Supplemental data: | ||||||
| Expenses before expense reductions (f) | 0.71(a) | 0.70 | 0.65 | 0.65 | 0.66 | 0.68 |
| Expenses after expense reductions (f) | 0.70(a) | 0.68 | 0.64 | 0.64 | 0.65 | 0.67 |
| Net investment income (loss) | 2.86(a) | 2.57 | 2.06 | 2.47 | 2.95 | 3.71 |
| Portfolio turnover | 9(n) | 19 | 13 | 20 | 30 | 16 |
| Net assets at end of period (000 omitted) | $3,113 | $2,874 | $3,327 | $2,668 | $2,384 | $867 |
See Notes to Financial Statements
66
Financial
Highlights − continued
MFS MISSISSIPPI MUNICIPAL BOND
FUND − continued
| (a) | Annualized. |
| (d) | Per share data is based on average shares outstanding. |
| (f) | Ratios do not reflect reductions from fees paid indirectly, if applicable. See Note 2 in the Notes to Financial Statements for additional information. |
| (n) | Not annualized. |
| (r) | Certain expenses have been reduced without which performance would have been lower. |
| (s) | From time to time the fund may receive proceeds from litigation settlements, without which performance would be lower. |
| (t) | Total returns do not include any applicable sales charges. |
| (x) | The net asset values and total returns have been calculated on net assets which include adjustments made in accordance with U.S. generally accepted accounting principles required at period end for financial reporting purposes. |
See Notes to Financial Statements
67
Financial
Highlights − continued
MFS NEW YORK MUNICIPAL BOND FUND
The financial highlights table is
intended to help you understand the fund's financial performance for the semiannual period and the past 5 fiscal years. Certain information reflects financial results for a single fund share. The total returns in the
table represent the rate that an investor would have earned (or lost) on an investment in the fund share class (assuming reinvestment of all distributions) held for the entire period.
| Six months ended | Year ended | |||||
| Class A | 9/30/23 (unaudited) | 3/31/23 | 3/31/22 | 3/31/21 | 3/31/20 | 3/31/19 |
| Net asset value, beginning of period | $10.01 | $10.62 | $11.33 | $10.93 | $11.00 | $10.87 |
| Income (loss) from investment operations | ||||||
| Net investment income (loss) (d) | $0.16 | $0.29 | $0.24 | $0.29 | $0.31 | $0.40 |
| Net realized and unrealized gain (loss) | (0.63) | (0.60) | (0.71) | 0.39 | (0.08) | 0.11 |
| Total from investment operations | $(0.47) | $(0.31) | $(0.47) | $0.68 | $0.23 | $0.51 |
| Less distributions declared to shareholders | ||||||
| From net investment income | $(0.17) | $(0.30) | $(0.24) | $(0.28) | $(0.30) | $(0.38) |
| Net asset value, end of period (x) | $9.37 | $10.01 | $10.62 | $11.33 | $10.93 | $11.00 |
| Total return (%) (r)(s)(t)(x) | (4.75)(n) | (2.91) | (4.30) | 6.32 | 2.08 | 4.82 |
| Ratios (%) (to average net assets) and Supplemental data: | ||||||
| Expenses before expense reductions (f) | 0.94(a) | 0.91 | 0.88 | 0.87 | 0.88 | 0.89 |
| Expenses after expense reductions (f) | 0.83(a) | 0.83 | 0.83 | 0.84 | 0.86 | 0.88 |
| Net investment income (loss) | 3.28(a) | 2.86 | 2.09 | 2.57 | 2.73 | 3.75 |
| Portfolio turnover | 11(n) | 35 | 19 | 45 | 25 | 17 |
| Net assets at end of period (000 omitted) | $114,520 | $126,231 | $153,525 | $170,723 | $174,514 | $154,803 |
| Six months ended | Year ended | |||||
| Class B | 9/30/23 (unaudited) | 3/31/23 | 3/31/22 | 3/31/21 | 3/31/20 | 3/31/19 |
| Net asset value, beginning of period | $9.98 | $10.60 | $11.31 | $10.90 | $10.97 | $10.84 |
| Income (loss) from investment operations | ||||||
| Net investment income (loss) (d) | $0.12 | $0.21 | $0.15 | $0.20 | $0.22 | $0.32 |
| Net realized and unrealized gain (loss) | (0.63) | (0.61) | (0.71) | 0.41 | (0.07) | 0.11 |
| Total from investment operations | $(0.51) | $(0.40) | $(0.56) | $0.61 | $0.15 | $0.43 |
| Less distributions declared to shareholders | ||||||
| From net investment income | $(0.13) | $(0.22) | $(0.15) | $(0.20) | $(0.22) | $(0.30) |
| Net asset value, end of period (x) | $9.34 | $9.98 | $10.60 | $11.31 | $10.90 | $10.97 |
| Total return (%) (r)(s)(t)(x) | (5.13)(n) | (3.74) | (5.02) | 5.63 | 1.32 | 4.05 |
| Ratios (%) (to average net assets) and Supplemental data: | ||||||
| Expenses before expense reductions (f) | 1.69(a) | 1.66 | 1.63 | 1.62 | 1.63 | 1.64 |
| Expenses after expense reductions (f) | 1.58(a) | 1.58 | 1.58 | 1.60 | 1.62 | 1.63 |
| Net investment income (loss) | 2.53(a) | 2.10 | 1.35 | 1.85 | 2.00 | 3.01 |
| Portfolio turnover | 11(n) | 35 | 19 | 45 | 25 | 17 |
| Net assets at end of period (000 omitted) | $427 | $516 | $725 | $1,063 | $2,193 | $2,876 |
See Notes to Financial Statements
68
Financial
Highlights − continued
MFS NEW YORK MUNICIPAL BOND
FUND − continued
| Six months ended | Year ended | |||||
| Class C | 9/30/23 (unaudited) | 3/31/23 | 3/31/22 | 3/31/21 | 3/31/20 | 3/31/19 |
| Net asset value, beginning of period | $9.99 | $10.61 | $11.32 | $10.91 | $10.98 | $10.86 |
| Income (loss) from investment operations | ||||||
| Net investment income (loss) (d) | $0.12 | $0.21 | $0.15 | $0.20 | $0.22 | $0.32 |
| Net realized and unrealized gain (loss) | (0.62) | (0.61) | (0.71) | 0.41 | (0.07) | 0.10 |
| Total from investment operations | $(0.50) | $(0.40) | $(0.56) | $0.61 | $0.15 | $0.42 |
| Less distributions declared to shareholders | ||||||
| From net investment income | $(0.13) | $(0.22) | $(0.15) | $(0.20) | $(0.22) | $(0.30) |
| Net asset value, end of period (x) | $9.36 | $9.99 | $10.61 | $11.32 | $10.91 | $10.98 |
| Total return (%) (r)(s)(t)(x) | (5.02)(n) | (3.73) | (5.02) | 5.63 | 1.32 | 3.95 |
| Ratios (%) (to average net assets) and Supplemental data: | ||||||
| Expenses before expense reductions (f) | 1.69(a) | 1.66 | 1.63 | 1.62 | 1.63 | 1.64 |
| Expenses after expense reductions (f) | 1.58(a) | 1.58 | 1.58 | 1.59 | 1.62 | 1.63 |
| Net investment income (loss) | 2.53(a) | 2.09 | 1.34 | 1.83 | 1.98 | 2.99 |
| Portfolio turnover | 11(n) | 35 | 19 | 45 | 25 | 17 |
| Net assets at end of period (000 omitted) | $5,359 | $6,462 | $9,646 | $12,260 | $15,471 | $16,953 |
| Six months ended | Year ended | |||||
| Class I | 9/30/23 (unaudited) | 3/31/23 | 3/31/22 | 3/31/21 | 3/31/20 | 3/31/19 |
| Net asset value, beginning of period | $8.85 | $9.39 | $10.02 | $9.66 | $9.73 | $9.61 |
| Income (loss) from investment operations | ||||||
| Net investment income (loss) (d) | $0.15 | $0.27 | $0.24 | $0.28 | $0.30 | $0.38 |
| Net realized and unrealized gain (loss) | (0.56) | (0.53) | (0.64) | 0.35 | (0.08) | 0.10 |
| Total from investment operations | $(0.41) | $(0.26) | $(0.40) | $0.63 | $0.22 | $0.48 |
| Less distributions declared to shareholders | ||||||
| From net investment income | $(0.16) | $(0.28) | $(0.23) | $(0.27) | $(0.29) | $(0.36) |
| Net asset value, end of period (x) | $8.28 | $8.85 | $9.39 | $10.02 | $9.66 | $9.73 |
| Total return (%) (r)(s)(t)(x) | (4.68)(n) | (2.67) | (4.08) | 6.65 | 2.25 | 5.13 |
| Ratios (%) (to average net assets) and Supplemental data: | ||||||
| Expenses before expense reductions (f) | 0.69(a) | 0.66 | 0.62 | 0.62 | 0.63 | 0.64 |
| Expenses after expense reductions (f) | 0.58(a) | 0.58 | 0.58 | 0.59 | 0.62 | 0.63 |
| Net investment income (loss) | 3.53(a) | 3.10 | 2.32 | 2.81 | 2.97 | 3.99 |
| Portfolio turnover | 11(n) | 35 | 19 | 45 | 25 | 17 |
| Net assets at end of period (000 omitted) | $32,134 | $36,516 | $44,708 | $95,882 | $83,586 | $68,415 |
See Notes to Financial Statements
69
Financial
Highlights − continued
MFS NEW YORK MUNICIPAL BOND
FUND − continued
| Six months ended | Year ended | |||||
| Class R6 | 9/30/23 (unaudited) | 3/31/23 | 3/31/22 | 3/31/21 | 3/31/20 | 3/31/19 |
| Net asset value, beginning of period | $8.84 | $9.39 | $10.02 | $9.66 | $9.73 | $9.61 |
| Income (loss) from investment operations | ||||||
| Net investment income (loss) (d) | $0.15 | $0.28 | $0.25 | $0.28 | $0.30 | $0.39 |
| Net realized and unrealized gain (loss) | (0.53) | (0.54) | (0.64) | 0.36 | (0.07) | 0.10 |
| Total from investment operations | $(0.38) | $(0.26) | $(0.39) | $0.64 | $0.23 | $0.49 |
| Less distributions declared to shareholders | ||||||
| From net investment income | $(0.17) | $(0.29) | $(0.24) | $(0.28) | $(0.30) | $(0.37) |
| Net asset value, end of period (x) | $8.29 | $8.84 | $9.39 | $10.02 | $9.66 | $9.73 |
| Total return (%) (r)(s)(t)(x) | (4.42)(n) | (2.70) | (4.02) | 6.72 | 2.31 | 5.19 |
| Ratios (%) (to average net assets) and Supplemental data: | ||||||
| Expenses before expense reductions (f) | 0.59(a) | 0.58 | 0.57 | 0.56 | 0.56 | 0.57 |
| Expenses after expense reductions (f) | 0.50(a) | 0.50 | 0.51 | 0.53 | 0.55 | 0.57 |
| Net investment income (loss) | 3.51(a) | 3.21 | 2.51 | 2.86 | 3.01 | 4.04 |
| Portfolio turnover | 11(n) | 35 | 19 | 45 | 25 | 17 |
| Net assets at end of period (000 omitted) | $4,364 | $48,058 | $50,925 | $4,866 | $3,092 | $1,914 |
| (a) | Annualized. |
| (d) | Per share data is based on average shares outstanding. |
| (f) | Ratios do not reflect reductions from fees paid indirectly, if applicable. See Note 2 in the Notes to Financial Statements for additional information. |
| (n) | Not annualized. |
| (r) | Certain expenses have been reduced without which performance would have been lower. |
| (s) | From time to time the fund may receive proceeds from litigation settlements, without which performance would be lower. |
| (t) | Total returns do not include any applicable sales charges. |
| (x) | The net asset values and total returns have been calculated on net assets which include adjustments made in accordance with U.S. generally accepted accounting principles required at period end for financial reporting purposes. |
See Notes to Financial Statements
70
Financial
Highlights − continued
MFS NORTH CAROLINA MUNICIPAL BOND
FUND
The financial highlights table is
intended to help you understand the fund's financial performance for the semiannual period and the past 5 fiscal years. Certain information reflects financial results for a single fund share. The total returns in the
table represent the rate that an investor would have earned (or lost) on an investment in the fund share class (assuming reinvestment of all distributions) held for the entire period.
| Six months ended | Year ended | |||||
| Class A | 9/30/23 (unaudited) | 3/31/23 | 3/31/22 | 3/31/21 | 3/31/20 | 3/31/19 |
| Net asset value, beginning of period | $10.81 | $11.25 | $11.91 | $11.45 | $11.59 | $11.48 |
| Income (loss) from investment operations | ||||||
| Net investment income (loss) (d) | $0.15 | $0.25 | $0.21 | $0.27 | $0.32 | $0.40 |
| Net realized and unrealized gain (loss) | (0.63) | (0.43) | (0.67) | 0.46 | (0.13) | 0.07 |
| Total from investment operations | $(0.48) | $(0.18) | $(0.46) | $0.73 | $0.19 | $0.47 |
| Less distributions declared to shareholders | ||||||
| From net investment income | $(0.15) | $(0.26) | $(0.20) | $(0.27) | $(0.33) | $(0.36) |
| Net asset value, end of period (x) | $10.18 | $10.81 | $11.25 | $11.91 | $11.45 | $11.59 |
| Total return (%) (r)(s)(t)(x) | (4.45)(n) | (1.56) | (3.91) | 6.42 | 1.55 | 4.23 |
| Ratios (%) (to average net assets) and Supplemental data: | ||||||
| Expenses before expense reductions (f) | 0.86(a) | 0.85 | 0.84 | 0.84 | 0.85 | 0.86 |
| Expenses after expense reductions (f) | 0.84(a) | 0.84 | 0.83 | 0.83 | 0.83 | 0.85 |
| Net investment income (loss) | 2.78(a) | 2.30 | 1.74 | 2.29 | 2.72 | 3.53 |
| Portfolio turnover | 10(n) | 30 | 16 | 25 | 28 | 19 |
| Net assets at end of period (000 omitted) | $288,508 | $302,524 | $354,752 | $359,286 | $326,916 | $295,515 |
| Six months ended | Year ended | |||||
| Class B | 9/30/23 (unaudited) | 3/31/23 | 3/31/22 | 3/31/21 | 3/31/20 | 3/31/19 |
| Net asset value, beginning of period | $10.80 | $11.24 | $11.90 | $11.44 | $11.57 | $11.46 |
| Income (loss) from investment operations | ||||||
| Net investment income (loss) (d) | $0.11 | $0.16 | $0.12 | $0.19 | $0.24 | $0.32 |
| Net realized and unrealized gain (loss) | (0.64) | (0.42) | (0.67) | 0.45 | (0.13) | 0.07 |
| Total from investment operations | $(0.53) | $(0.26) | $(0.55) | $0.64 | $0.11 | $0.39 |
| Less distributions declared to shareholders | ||||||
| From net investment income | $(0.11) | $(0.18) | $(0.11) | $(0.18) | $(0.24) | $(0.28) |
| Net asset value, end of period (x) | $10.16 | $10.80 | $11.24 | $11.90 | $11.44 | $11.57 |
| Total return (%) (r)(s)(t)(x) | (4.90)(n) | (2.29) | (4.63) | 5.64 | 0.88 | 3.46 |
| Ratios (%) (to average net assets) and Supplemental data: | ||||||
| Expenses before expense reductions (f) | 1.61(a) | 1.61 | 1.59 | 1.59 | 1.61 | 1.62 |
| Expenses after expense reductions (f) | 1.59(a) | 1.59 | 1.58 | 1.58 | 1.59 | 1.61 |
| Net investment income (loss) | 2.03(a) | 1.51 | 0.99 | 1.60 | 2.01 | 2.78 |
| Portfolio turnover | 10(n) | 30 | 16 | 25 | 28 | 19 |
| Net assets at end of period (000 omitted) | $145 | $165 | $323 | $416 | $788 | $1,299 |
See Notes to Financial Statements
71
Financial
Highlights − continued
MFS NORTH CAROLINA MUNICIPAL BOND
FUND − continued
| Six months ended | Year ended | |||||
| Class C | 9/30/23 (unaudited) | 3/31/23 | 3/31/22 | 3/31/21 | 3/31/20 | 3/31/19 |
| Net asset value, beginning of period | $10.81 | $11.25 | $11.91 | $11.45 | $11.58 | $11.47 |
| Income (loss) from investment operations | ||||||
| Net investment income (loss) (d) | $0.11 | $0.17 | $0.12 | $0.18 | $0.23 | $0.32 |
| Net realized and unrealized gain (loss) | (0.64) | (0.43) | (0.67) | 0.46 | (0.12) | 0.07 |
| Total from investment operations | $(0.53) | $(0.26) | $(0.55) | $0.64 | $0.11 | $0.39 |
| Less distributions declared to shareholders | ||||||
| From net investment income | $(0.11) | $(0.18) | $(0.11) | $(0.18) | $(0.24) | $(0.28) |
| Net asset value, end of period (x) | $10.17 | $10.81 | $11.25 | $11.91 | $11.45 | $11.58 |
| Total return (%) (r)(s)(t)(x) | (4.90)(n) | (2.29) | (4.63) | 5.63 | 0.88 | 3.45 |
| Ratios (%) (to average net assets) and Supplemental data: | ||||||
| Expenses before expense reductions (f) | 1.61(a) | 1.60 | 1.59 | 1.59 | 1.61 | 1.62 |
| Expenses after expense reductions (f) | 1.59(a) | 1.59 | 1.58 | 1.58 | 1.59 | 1.61 |
| Net investment income (loss) | 2.03(a) | 1.54 | 0.99 | 1.56 | 1.96 | 2.78 |
| Portfolio turnover | 10(n) | 30 | 16 | 25 | 28 | 19 |
| Net assets at end of period (000 omitted) | $18,035 | $21,315 | $28,828 | $35,315 | $45,135 | $38,639 |
| Six months ended | Year ended | |||||
| Class I | 9/30/23 (unaudited) | 3/31/23 | 3/31/22 | 3/31/21 | 3/31/20 | 3/31/19 |
| Net asset value, beginning of period | $9.01 | $9.38 | $9.93 | $9.55 | $9.66 | $9.57 |
| Income (loss) from investment operations | ||||||
| Net investment income (loss) (d) | $0.13 | $0.23 | $0.20 | $0.25 | $0.29 | $0.36 |
| Net realized and unrealized gain (loss) | (0.52) | (0.36) | (0.56) | 0.38 | (0.10) | 0.06 |
| Total from investment operations | $(0.39) | $(0.13) | $(0.36) | $0.63 | $0.19 | $0.42 |
| Less distributions declared to shareholders | ||||||
| From net investment income | $(0.14) | $(0.24) | $(0.19) | $(0.25) | $(0.30) | $(0.33) |
| Net asset value, end of period (x) | $8.48 | $9.01 | $9.38 | $9.93 | $9.55 | $9.66 |
| Total return (%) (r)(s)(t)(x) | (4.38)(n) | (1.35) | (3.67) | 6.64 | 1.87 | 4.46 |
| Ratios (%) (to average net assets) and Supplemental data: | ||||||
| Expenses before expense reductions (f) | 0.60(a) | 0.60 | 0.59 | 0.59 | 0.60 | 0.61 |
| Expenses after expense reductions (f) | 0.59(a) | 0.59 | 0.58 | 0.58 | 0.59 | 0.60 |
| Net investment income (loss) | 3.03(a) | 2.54 | 1.99 | 2.52 | 2.95 | 3.77 |
| Portfolio turnover | 10(n) | 30 | 16 | 25 | 28 | 19 |
| Net assets at end of period (000 omitted) | $95,199 | $97,036 | $116,857 | $113,800 | $83,861 | $58,802 |
See Notes to Financial Statements
72
Financial
Highlights − continued
MFS NORTH CAROLINA MUNICIPAL BOND
FUND − continued
| Six months ended | Year ended | |||||
| Class R6 | 9/30/23 (unaudited) | 3/31/23 | 3/31/22 | 3/31/21 | 3/31/20 | 3/31/19 |
| Net asset value, beginning of period | $9.01 | $9.38 | $9.93 | $9.55 | $9.66 | $9.57 |
| Income (loss) from investment operations | ||||||
| Net investment income (loss) (d) | $0.14 | $0.23 | $0.20 | $0.25 | $0.30 | $0.37 |
| Net realized and unrealized gain (loss) | (0.53) | (0.36) | (0.55) | 0.38 | (0.11) | 0.05 |
| Total from investment operations | $(0.39) | $(0.13) | $(0.35) | $0.63 | $0.19 | $0.42 |
| Less distributions declared to shareholders | ||||||
| From net investment income | $(0.14) | $(0.24) | $(0.20) | $(0.25) | $(0.30) | $(0.33) |
| Net asset value, end of period (x) | $8.48 | $9.01 | $9.38 | $9.93 | $9.55 | $9.66 |
| Total return (%) (r)(s)(t)(x) | (4.35)(n) | (1.28) | (3.60) | 6.71 | 1.94 | 4.54 |
| Ratios (%) (to average net assets) and Supplemental data: | ||||||
| Expenses before expense reductions (f) | 0.53(a) | 0.53 | 0.52 | 0.52 | 0.53 | 0.54 |
| Expenses after expense reductions (f) | 0.52(a) | 0.52 | 0.51 | 0.51 | 0.52 | 0.53 |
| Net investment income (loss) | 3.10(a) | 2.61 | 2.05 | 2.59 | 3.01 | 3.85 |
| Portfolio turnover | 10(n) | 30 | 16 | 25 | 28 | 19 |
| Net assets at end of period (000 omitted) | $31,999 | $31,269 | $40,985 | $34,703 | $24,040 | $16,161 |
| (a) | Annualized. |
| (d) | Per share data is based on average shares outstanding. |
| (f) | Ratios do not reflect reductions from fees paid indirectly, if applicable. See Note 2 in the Notes to Financial Statements for additional information. |
| (n) | Not annualized. |
| (r) | Certain expenses have been reduced without which performance would have been lower. |
| (s) | From time to time the fund may receive proceeds from litigation settlements, without which performance would be lower. |
| (t) | Total returns do not include any applicable sales charges. |
| (x) | The net asset values and total returns have been calculated on net assets which include adjustments made in accordance with U.S. generally accepted accounting principles required at period end for financial reporting purposes. |
See Notes to Financial Statements
73
Financial
Highlights − continued
MFS PENNSYLVANIA MUNICIPAL BOND
FUND
The financial highlights table is
intended to help you understand the fund's financial performance for the semiannual period and the past 5 fiscal years. Certain information reflects financial results for a single fund share. The total returns in the
table represent the rate that an investor would have earned (or lost) on an investment in the fund share class (assuming reinvestment of all distributions) held for the entire period.
| Six months ended | Year ended | |||||
| Class A | 9/30/23 (unaudited) | 3/31/23 | 3/31/22 | 3/31/21 | 3/31/20 | 3/31/19 |
| Net asset value, beginning of period | $9.55 | $10.05 | $10.60 | $10.24 | $10.26 | $10.15 |
| Income (loss) from investment operations | ||||||
| Net investment income (loss) (d) | $0.15 | $0.25 | $0.21 | $0.27 | $0.33 | $0.40 |
| Net realized and unrealized gain (loss) | (0.57) | (0.49) | (0.55) | 0.36 | (0.02) | 0.07 |
| Total from investment operations | $(0.42) | $(0.24) | $(0.34) | $0.63 | $0.31 | $0.47 |
| Less distributions declared to shareholders | ||||||
| From net investment income | $(0.15) | $(0.26) | $(0.21) | $(0.27) | $(0.33) | $(0.36) |
| Net asset value, end of period (x) | $8.98 | $9.55 | $10.05 | $10.60 | $10.24 | $10.26 |
| Total return (%) (r)(s)(t)(x) | (4.44)(n) | (2.31) | (3.29) | 6.21 | 2.97 | 4.73 |
| Ratios (%) (to average net assets) and Supplemental data: | ||||||
| Expenses before expense reductions (f) | 0.94(a) | 0.93 | 0.91 | 0.92 | 0.94 | 0.96 |
| Expenses after expense reductions (f) | 0.69(a) | 0.69 | 0.71 | 0.76 | 0.78 | 0.80 |
| Net investment income (loss) | 3.09(a) | 2.65 | 2.02 | 2.55 | 3.13 | 3.91 |
| Portfolio turnover | 9(n) | 29 | 19 | 28 | 17 | 16 |
| Net assets at end of period (000 omitted) | $103,854 | $113,427 | $132,466 | $137,727 | $117,575 | $105,777 |
| Six months ended | Year ended | |||||
| Class B | 9/30/23 (unaudited) | 3/31/23 | 3/31/22 | 3/31/21 | 3/31/20 | 3/31/19 |
| Net asset value, beginning of period | $9.57 | $10.07 | $10.62 | $10.27 | $10.29 | $10.18 |
| Income (loss) from investment operations | ||||||
| Net investment income (loss) (d) | $0.11 | $0.18 | $0.14 | $0.19 | $0.25 | $0.32 |
| Net realized and unrealized gain (loss) | (0.56) | (0.49) | (0.56) | 0.35 | (0.02) | 0.07 |
| Total from investment operations | $(0.45) | $(0.31) | $(0.42) | $0.54 | $0.23 | $0.39 |
| Less distributions declared to shareholders | ||||||
| From net investment income | $(0.12) | $(0.19) | $(0.13) | $(0.19) | $(0.25) | $(0.28) |
| Net asset value, end of period (x) | $9.00 | $9.57 | $10.07 | $10.62 | $10.27 | $10.29 |
| Total return (%) (r)(s)(t)(x) | (4.78)(n) | (3.03) | (4.00) | 5.32 | 2.21 | 3.95 |
| Ratios (%) (to average net assets) and Supplemental data: | ||||||
| Expenses before expense reductions (f) | 1.69(a) | 1.68 | 1.66 | 1.67 | 1.69 | 1.71 |
| Expenses after expense reductions (f) | 1.44(a) | 1.44 | 1.46 | 1.51 | 1.53 | 1.55 |
| Net investment income (loss) | 2.34(a) | 1.89 | 1.27 | 1.86 | 2.40 | 3.15 |
| Portfolio turnover | 9(n) | 29 | 19 | 28 | 17 | 16 |
| Net assets at end of period (000 omitted) | $332 | $414 | $577 | $851 | $1,507 | $2,373 |
See Notes to Financial Statements
74
Financial
Highlights − continued
MFS PENNSYLVANIA MUNICIPAL BOND
FUND − continued
| Six months ended | Year ended | |||||
| Class I | 9/30/23 (unaudited) | 3/31/23 | 3/31/22 | 3/31/21 | 3/31/20 | 3/31/19 |
| Net asset value, beginning of period | $9.10 | $9.57 | $10.09 | $9.76 | $9.78 | $9.67 |
| Income (loss) from investment operations | ||||||
| Net investment income (loss) (d) | $0.14 | $0.25 | $0.21 | $0.26 | $0.32 | $0.38 |
| Net realized and unrealized gain (loss) | (0.54) | (0.46) | (0.52) | 0.34 | (0.02) | 0.08 |
| Total from investment operations | $(0.40) | $(0.21) | $(0.31) | $0.60 | $0.30 | $0.46 |
| Less distributions declared to shareholders | ||||||
| From net investment income | $(0.15) | $(0.26) | $(0.21) | $(0.27) | $(0.32) | $(0.35) |
| Net asset value, end of period (x) | $8.55 | $9.10 | $9.57 | $10.09 | $9.76 | $9.78 |
| Total return (%) (r)(s)(t)(x) | (4.47)(n) | (2.15) | (3.16) | 6.18 | 3.06 | 4.88 |
| Ratios (%) (to average net assets) and Supplemental data: | ||||||
| Expenses before expense reductions (f) | 0.69(a) | 0.68 | 0.66 | 0.67 | 0.69 | 0.71 |
| Expenses after expense reductions (f) | 0.59(a) | 0.59 | 0.61 | 0.66 | 0.68 | 0.70 |
| Net investment income (loss) | 3.18(a) | 2.74 | 2.11 | 2.64 | 3.21 | 4.00 |
| Portfolio turnover | 9(n) | 29 | 19 | 28 | 17 | 16 |
| Net assets at end of period (000 omitted) | $28,829 | $31,571 | $37,530 | $32,103 | $26,064 | $20,253 |
| Six months ended | Year ended | |||||
| Class R6 | 9/30/23 (unaudited) | 3/31/23 | 3/31/22 | 3/31/21 | 3/31/20 | 3/31/19 |
| Net asset value, beginning of period | $9.10 | $9.58 | $10.10 | $9.76 | $9.78 | $9.67 |
| Income (loss) from investment operations | ||||||
| Net investment income (loss) (d) | $0.15 | $0.26 | $0.22 | $0.27 | $0.33 | $0.40 |
| Net realized and unrealized gain (loss) | (0.54) | (0.48) | (0.52) | 0.34 | (0.02) | 0.07 |
| Total from investment operations | $(0.39) | $(0.22) | $(0.30) | $0.61 | $0.31 | $0.47 |
| Less distributions declared to shareholders | ||||||
| From net investment income | $(0.15) | $(0.26) | $(0.22) | $(0.27) | $(0.33) | $(0.36) |
| Net asset value, end of period (x) | $8.56 | $9.10 | $9.58 | $10.10 | $9.76 | $9.78 |
| Total return (%) (r)(s)(t)(x) | (4.32)(n) | (2.19) | (3.09) | 6.35 | 3.13 | 4.94 |
| Ratios (%) (to average net assets) and Supplemental data: | ||||||
| Expenses before expense reductions (f) | 0.62(a) | 0.61 | 0.59 | 0.60 | 0.61 | 0.64 |
| Expenses after expense reductions (f) | 0.52(a) | 0.52 | 0.54 | 0.59 | 0.60 | 0.63 |
| Net investment income (loss) | 3.25(a) | 2.83 | 2.18 | 2.71 | 3.28 | 4.13 |
| Portfolio turnover | 9(n) | 29 | 19 | 28 | 17 | 16 |
| Net assets at end of period (000 omitted) | $19,730 | $20,702 | $20,559 | $15,830 | $13,031 | $10,736 |
See Notes to Financial Statements
75
Financial
Highlights − continued
MFS PENNSYLVANIA MUNICIPAL BOND
FUND − continued
| (a) | Annualized. |
| (d) | Per share data is based on average shares outstanding. |
| (f) | Ratios do not reflect reductions from fees paid indirectly, if applicable. See Note 2 in the Notes to Financial Statements for additional information. |
| (n) | Not annualized. |
| (r) | Certain expenses have been reduced without which performance would have been lower. |
| (s) | From time to time the fund may receive proceeds from litigation settlements, without which performance would be lower. |
| (t) | Total returns do not include any applicable sales charges. |
| (x) | The net asset values and total returns have been calculated on net assets which include adjustments made in accordance with U.S. generally accepted accounting principles required at period end for financial reporting purposes. |
See Notes to Financial Statements
76
Financial
Highlights − continued
MFS SOUTH CAROLINA MUNICIPAL BOND
FUND
The financial highlights table is
intended to help you understand the fund's financial performance for the semiannual period and the past 5 fiscal years. Certain information reflects financial results for a single fund share. The total returns in the
table represent the rate that an investor would have earned (or lost) on an investment in the fund share class (assuming reinvestment of all distributions) held for the entire period.
| Six months ended | Year ended | |||||
| Class A | 9/30/23 (unaudited) | 3/31/23 | 3/31/22 | 3/31/21 | 3/31/20 | 3/31/19 |
| Net asset value, beginning of period | $11.08 | $11.61 | $12.30 | $11.94 | $11.97 | $11.83 |
| Income (loss) from investment operations | ||||||
| Net investment income (loss) (d) | $0.15 | $0.25 | $0.19 | $0.25 | $0.33 | $0.41 |
| Net realized and unrealized gain (loss) | (0.68) | (0.52) | (0.69) | 0.36 | (0.04) | 0.10 |
| Total from investment operations | $(0.53) | $(0.27) | $(0.50) | $0.61 | $0.29 | $0.51 |
| Less distributions declared to shareholders | ||||||
| From net investment income | $(0.15) | $(0.26) | $(0.19) | $(0.25) | $(0.32) | $(0.37) |
| Net asset value, end of period (x) | $10.40 | $11.08 | $11.61 | $12.30 | $11.94 | $11.97 |
| Total return (%) (r)(s)(t)(x) | (4.79)(n) | (2.26) | (4.15) | 5.18 | 2.44 | 4.39 |
| Ratios (%) (to average net assets) and Supplemental data: | ||||||
| Expenses before expense reductions (f) | 0.89(a) | 0.88 | 0.86 | 0.87 | 0.88 | 0.90 |
| Expenses after expense reductions (f) | 0.84(a) | 0.84 | 0.84 | 0.84 | 0.84 | 0.84 |
| Net investment income (loss) | 2.79(a) | 2.27 | 1.55 | 2.08 | 2.68 | 3.49 |
| Portfolio turnover | 12(n) | 28 | 22 | 23 | 22 | 14 |
| Net assets at end of period (000 omitted) | $139,767 | $154,644 | $204,883 | $222,730 | $192,059 | $156,427 |
| Six months ended | Year ended | |||||
| Class B | 9/30/23 (unaudited) | 3/31/23 | 3/31/22 | 3/31/21 | 3/31/20 | 3/31/19 |
| Net asset value, beginning of period | $11.08 | $11.60 | $12.30 | $11.93 | $11.97 | $11.82 |
| Income (loss) from investment operations | ||||||
| Net investment income (loss) (d) | $0.11 | $0.17 | $0.10 | $0.18 | $0.24 | $0.32 |
| Net realized and unrealized gain (loss) | (0.69) | (0.51) | (0.70) | 0.35 | (0.05) | 0.11 |
| Total from investment operations | $(0.58) | $(0.34) | $(0.60) | $0.53 | $0.19 | $0.43 |
| Less distributions declared to shareholders | ||||||
| From net investment income | $(0.11) | $(0.18) | $(0.10) | $(0.16) | $(0.23) | $(0.28) |
| Net asset value, end of period (x) | $10.39 | $11.08 | $11.60 | $12.30 | $11.93 | $11.97 |
| Total return (%) (r)(s)(t)(x) | (5.24)(n) | (2.91) | (4.95) | 4.50 | 1.59 | 3.70 |
| Ratios (%) (to average net assets) and Supplemental data: | ||||||
| Expenses before expense reductions (f) | 1.64(a) | 1.63 | 1.61 | 1.62 | 1.64 | 1.65 |
| Expenses after expense reductions (f) | 1.59(a) | 1.59 | 1.59 | 1.59 | 1.59 | 1.59 |
| Net investment income (loss) | 2.02(a) | 1.55 | 0.81 | 1.48 | 1.96 | 2.74 |
| Portfolio turnover | 12(n) | 28 | 22 | 23 | 22 | 14 |
| Net assets at end of period (000 omitted) | $67 | $137 | $146 | $280 | $1,200 | $1,955 |
See Notes to Financial Statements
77
Financial
Highlights − continued
MFS SOUTH CAROLINA MUNICIPAL BOND
FUND − continued
| Six months ended | Year ended | |||||
| Class I | 9/30/23 (unaudited) | 3/31/23 | 3/31/22 | 3/31/21 | 3/31/20 | 3/31/19 |
| Net asset value, beginning of period | $8.98 | $9.40 | $9.97 | $9.67 | $9.70 | $9.58 |
| Income (loss) from investment operations | ||||||
| Net investment income (loss) (d) | $0.13 | $0.23 | $0.18 | $0.23 | $0.29 | $0.36 |
| Net realized and unrealized gain (loss) | (0.54) | (0.42) | (0.57) | 0.30 | (0.03) | 0.08 |
| Total from investment operations | $(0.41) | $(0.19) | $(0.39) | $0.53 | $0.26 | $0.44 |
| Less distributions declared to shareholders | ||||||
| From net investment income | $(0.14) | $(0.23) | $(0.18) | $(0.23) | $(0.29) | $(0.32) |
| Net asset value, end of period (x) | $8.43 | $8.98 | $9.40 | $9.97 | $9.67 | $9.70 |
| Total return (%) (r)(s)(t)(x) | (4.66)(n) | (1.93) | (4.02) | 5.53 | 2.63 | 4.71 |
| Ratios (%) (to average net assets) and Supplemental data: | ||||||
| Expenses before expense reductions (f) | 0.64(a) | 0.63 | 0.61 | 0.62 | 0.63 | 0.65 |
| Expenses after expense reductions (f) | 0.59(a) | 0.59 | 0.59 | 0.59 | 0.59 | 0.59 |
| Net investment income (loss) | 3.04(a) | 2.52 | 1.80 | 2.31 | 2.92 | 3.74 |
| Portfolio turnover | 12(n) | 28 | 22 | 23 | 22 | 14 |
| Net assets at end of period (000 omitted) | $42,057 | $44,457 | $56,292 | $53,171 | $35,189 | $28,182 |
| Six months ended | Year ended | |||||
| Class R6 | 9/30/23 (unaudited) | 3/31/23 | 3/31/22 | 3/31/21 | 3/31/20 | 3/31/19 |
| Net asset value, beginning of period | $8.98 | $9.41 | $9.97 | $9.67 | $9.70 | $9.58 |
| Income (loss) from investment operations | ||||||
| Net investment income (loss) (d) | $0.14 | $0.23 | $0.19 | $0.23 | $0.29 | $0.36 |
| Net realized and unrealized gain (loss) | (0.55) | (0.42) | (0.57) | 0.31 | (0.03) | 0.09 |
| Total from investment operations | $(0.41) | $(0.19) | $(0.38) | $0.54 | $0.26 | $0.45 |
| Less distributions declared to shareholders | ||||||
| From net investment income | $(0.14) | $(0.24) | $(0.18) | $(0.24) | $(0.29) | $(0.33) |
| Net asset value, end of period (x) | $8.43 | $8.98 | $9.41 | $9.97 | $9.67 | $9.70 |
| Total return (%) (r)(s)(t)(x) | (4.64)(n) | (1.96) | (3.86) | 5.59 | 2.68 | 4.77 |
| Ratios (%) (to average net assets) and Supplemental data: | ||||||
| Expenses before expense reductions (f) | 0.58(a) | 0.57 | 0.55 | 0.55 | 0.57 | 0.58 |
| Expenses after expense reductions (f) | 0.53(a) | 0.53 | 0.53 | 0.53 | 0.53 | 0.52 |
| Net investment income (loss) | 3.10(a) | 2.59 | 1.86 | 2.36 | 2.95 | 3.81 |
| Portfolio turnover | 12(n) | 28 | 22 | 23 | 22 | 14 |
| Net assets at end of period (000 omitted) | $15,325 | $14,088 | $18,450 | $14,608 | $8,892 | $4,341 |
See Notes to Financial Statements
78
Financial
Highlights − continued
MFS SOUTH CAROLINA MUNICIPAL BOND
FUND − continued
| (a) | Annualized. |
| (d) | Per share data is based on average shares outstanding. |
| (f) | Ratios do not reflect reductions from fees paid indirectly, if applicable. See Note 2 in the Notes to Financial Statements for additional information. |
| (n) | Not annualized. |
| (r) | Certain expenses have been reduced without which performance would have been lower. |
| (s) | From time to time the fund may receive proceeds from litigation settlements, without which performance would be lower. |
| (t) | Total returns do not include any applicable sales charges. |
| (x) | The net asset values and total returns have been calculated on net assets which include adjustments made in accordance with U.S. generally accepted accounting principles required at period end for financial reporting purposes. |
See Notes to Financial Statements
79
Financial
Highlights − continued
MFS VIRGINIA MUNICIPAL BOND FUND
The financial highlights table is
intended to help you understand the fund's financial performance for the semiannual period and the past 5 fiscal years. Certain information reflects financial results for a single fund share. The total returns in the
table represent the rate that an investor would have earned (or lost) on an investment in the fund share class (assuming reinvestment of all distributions) held for the entire period.
| Six months ended | Year ended | |||||
| Class A | 9/30/23 (unaudited) | 3/31/23 | 3/31/22 | 3/31/21 | 3/31/20 | 3/31/19 |
| Net asset value, beginning of period | $10.29 | $10.77 | $11.42 | $11.07 | $11.14 | $10.98 |
| Income (loss) from investment operations | ||||||
| Net investment income (loss) (d) | $0.14 | $0.26 | $0.24 | $0.29 | $0.33 | $0.37 |
| Net realized and unrealized gain (loss) | (0.64) | (0.48) | (0.65) | 0.36 | (0.08) | 0.13 |
| Total from investment operations | $(0.50) | $(0.22) | $(0.41) | $0.65 | $0.25 | $0.50 |
| Less distributions declared to shareholders | ||||||
| From net investment income | $(0.15) | $(0.26) | $(0.24) | $(0.30) | $(0.32) | $(0.34) |
| Net asset value, end of period (x) | $9.64 | $10.29 | $10.77 | $11.42 | $11.07 | $11.14 |
| Total return (%) (r)(s)(t)(x) | (4.96)(n) | (1.96) | (3.72) | 5.94 | 2.22 | 4.67 |
| Ratios (%) (to average net assets) and Supplemental data: | ||||||
| Expenses before expense reductions (f) | 0.88(a) | 0.87 | 0.87 | 0.88 | 0.91 | 0.92 |
| Expenses after expense reductions (f) | 0.81(a) | 0.81 | 0.81 | 0.82 | 0.84 | 0.84 |
| Net investment income (loss) | 2.75(a) | 2.52 | 2.14 | 2.57 | 2.88 | 3.37 |
| Portfolio turnover | 11(n) | 34 | 23 | 21 | 24 | 15 |
| Net assets at end of period (000 omitted) | $225,388 | $247,207 | $246,986 | $251,971 | $235,639 | $226,366 |
| Supplemental Ratios (%): | ||||||
| Ratios of expenses to average net assets after expense reductions and excluding interest expense and fees (f)(l) | N/A | N/A | 0.81 | 0.81 | 0.81 | 0.81 |
See Notes to Financial Statements
80
Financial
Highlights − continued
MFS VIRGINIA MUNICIPAL BOND
FUND − continued
| Six months ended | Year ended | |||||
| Class B | 9/30/23 (unaudited) | 3/31/23 | 3/31/22 | 3/31/21 | 3/31/20 | 3/31/19 |
| Net asset value, beginning of period | $10.28 | $10.76 | $11.41 | $11.06 | $11.13 | $10.98 |
| Income (loss) from investment operations | ||||||
| Net investment income (loss) (d) | $0.10 | $0.18 | $0.16 | $0.21 | $0.24 | $0.29 |
| Net realized and unrealized gain (loss) | (0.64) | (0.47) | (0.66) | 0.36 | (0.07) | 0.12 |
| Total from investment operations | $(0.54) | $(0.29) | $(0.50) | $0.57 | $0.17 | $0.41 |
| Less distributions declared to shareholders | ||||||
| From net investment income | $(0.11) | $(0.19) | $(0.15) | $(0.22) | $(0.24) | $(0.26) |
| Net asset value, end of period (x) | $9.63 | $10.28 | $10.76 | $11.41 | $11.06 | $11.13 |
| Total return (%) (r)(s)(t)(x) | (5.32)(n) | (2.68) | (4.45) | 5.16 | 1.46 | 3.80 |
| Ratios (%) (to average net assets) and Supplemental data: | ||||||
| Expenses before expense reductions (f) | 1.63(a) | 1.63 | 1.62 | 1.63 | 1.66 | 1.67 |
| Expenses after expense reductions (f) | 1.56(a) | 1.56 | 1.56 | 1.57 | 1.59 | 1.60 |
| Net investment income (loss) | 2.00(a) | 1.76 | 1.39 | 1.82 | 2.14 | 2.62 |
| Portfolio turnover | 11(n) | 34 | 23 | 21 | 24 | 15 |
| Net assets at end of period (000 omitted) | $210 | $237 | $387 | $436 | $581 | $755 |
| Supplemental Ratios (%): | ||||||
| Ratios of expenses to average net assets after expense reductions and excluding interest expense and fees (f)(l) | N/A | N/A | 1.56 | 1.56 | 1.56 | 1.56 |
See Notes to Financial Statements
81
Financial
Highlights − continued
MFS VIRGINIA MUNICIPAL BOND
FUND − continued
| Six months ended | Year ended | |||||
| Class C | 9/30/23 (unaudited) | 3/31/23 | 3/31/22 | 3/31/21 | 3/31/20 | 3/31/19 |
| Net asset value, beginning of period | $10.29 | $10.77 | $11.42 | $11.06 | $11.14 | $10.98 |
| Income (loss) from investment operations | ||||||
| Net investment income (loss) (d) | $0.10 | $0.18 | $0.16 | $0.21 | $0.24 | $0.29 |
| Net realized and unrealized gain (loss) | (0.64) | (0.47) | (0.66) | 0.37 | (0.08) | 0.13 |
| Total from investment operations | $(0.54) | $(0.29) | $(0.50) | $0.58 | $0.16 | $0.42 |
| Less distributions declared to shareholders | ||||||
| From net investment income | $(0.11) | $(0.19) | $(0.15) | $(0.22) | $(0.24) | $(0.26) |
| Net asset value, end of period (x) | $9.64 | $10.29 | $10.77 | $11.42 | $11.06 | $11.14 |
| Total return (%) (r)(s)(t)(x) | (5.31)(n) | (2.69) | (4.44) | 5.25 | 1.36 | 3.89 |
| Ratios (%) (to average net assets) and Supplemental data: | ||||||
| Expenses before expense reductions (f) | 1.63(a) | 1.63 | 1.62 | 1.63 | 1.66 | 1.67 |
| Expenses after expense reductions (f) | 1.56(a) | 1.56 | 1.56 | 1.57 | 1.59 | 1.60 |
| Net investment income (loss) | 2.00(a) | 1.76 | 1.39 | 1.82 | 2.13 | 2.62 |
| Portfolio turnover | 11(n) | 34 | 23 | 21 | 24 | 15 |
| Net assets at end of period (000 omitted) | $6,887 | $8,671 | $11,754 | $14,348 | $16,736 | $17,665 |
| Supplemental Ratios (%): | ||||||
| Ratios of expenses to average net assets after expense reductions and excluding interest expense and fees (f)(l) | N/A | N/A | 1.56 | 1.56 | 1.56 | 1.56 |
See Notes to Financial Statements
82
Financial
Highlights − continued
MFS VIRGINIA MUNICIPAL BOND
FUND − continued
| Six months ended | Year ended | |||||
| Class I | 9/30/23 (unaudited) | 3/31/23 | 3/31/22 | 3/31/21 | 3/31/20 | 3/31/19 |
| Net asset value, beginning of period | $8.94 | $9.36 | $9.93 | $9.62 | $9.68 | $9.55 |
| Income (loss) from investment operations | ||||||
| Net investment income (loss) (d) | $0.13 | $0.25 | $0.24 | $0.28 | $0.31 | $0.34 |
| Net realized and unrealized gain (loss) | (0.55) | (0.42) | (0.58) | 0.32 | (0.07) | 0.11 |
| Total from investment operations | $(0.42) | $(0.17) | $(0.34) | $0.60 | $0.24 | $0.45 |
| Less distributions declared to shareholders | ||||||
| From net investment income | $(0.14) | $(0.25) | $(0.23) | $(0.29) | $(0.30) | $(0.32) |
| Net asset value, end of period (x) | $8.38 | $8.94 | $9.36 | $9.93 | $9.62 | $9.68 |
| Total return (%) (r)(s)(t)(x) | (4.79)(n) | (1.75) | (3.53) | 6.26 | 2.47 | 4.82 |
| Ratios (%) (to average net assets) and Supplemental data: | ||||||
| Expenses before expense reductions (f) | 0.62(a) | 0.62 | 0.62 | 0.63 | 0.66 | 0.67 |
| Expenses after expense reductions (f) | 0.56(a) | 0.56 | 0.56 | 0.57 | 0.59 | 0.60 |
| Net investment income (loss) | 2.99(a) | 2.76 | 2.39 | 2.80 | 3.12 | 3.61 |
| Portfolio turnover | 11(n) | 34 | 23 | 21 | 24 | 15 |
| Net assets at end of period (000 omitted) | $83,724 | $85,821 | $88,808 | $94,495 | $71,807 | $57,139 |
| Supplemental Ratios (%): | ||||||
| Ratios of expenses to average net assets after expense reductions and excluding interest expense and fees (f)(l) | N/A | N/A | 0.56 | 0.56 | 0.56 | 0.56 |
See Notes to Financial Statements
83
Financial
Highlights − continued
MFS VIRGINIA MUNICIPAL BOND
FUND − continued
| Six months ended | Year ended | |||||
| Class R6 | 9/30/23 (unaudited) | 3/31/23 | 3/31/22 | 3/31/21 | 3/31/20 | 3/31/19 |
| Net asset value, beginning of period | $8.95 | $9.37 | $9.93 | $9.63 | $9.69 | $9.55 |
| Income (loss) from investment operations | ||||||
| Net investment income (loss) (d) | $0.14 | $0.25 | $0.24 | $0.28 | $0.31 | $0.35 |
| Net realized and unrealized gain (loss) | (0.56) | (0.41) | (0.56) | 0.31 | (0.06) | 0.12 |
| Total from investment operations | $(0.42) | $(0.16) | $(0.32) | $0.59 | $0.25 | $0.47 |
| Less distributions declared to shareholders | ||||||
| From net investment income | $(0.14) | $(0.26) | $(0.24) | $(0.29) | $(0.31) | $(0.33) |
| Net asset value, end of period (x) | $8.39 | $8.95 | $9.37 | $9.93 | $9.63 | $9.69 |
| Total return (%) (r)(s)(t)(x) | (4.74)(n) | (1.66) | (3.35) | 6.23 | 2.55 | 5.01 |
| Ratios (%) (to average net assets) and Supplemental data: | ||||||
| Expenses before expense reductions (f) | 0.54(a) | 0.55 | 0.54 | 0.55 | 0.58 | 0.59 |
| Expenses after expense reductions (f) | 0.48(a) | 0.48 | 0.48 | 0.50 | 0.51 | 0.51 |
| Net investment income (loss) | 3.07(a) | 2.84 | 2.46 | 2.87 | 3.20 | 3.69 |
| Portfolio turnover | 11(n) | 34 | 23 | 21 | 24 | 15 |
| Net assets at end of period (000 omitted) | $21,687 | $20,073 | $25,876 | $22,118 | $14,286 | $10,153 |
| Supplemental Ratios (%): | ||||||
| Ratios of expenses to average net assets after expense reductions and excluding interest expense and fees (f)(l) | N/A | N/A | 0.48 | 0.48 | 0.48 | 0.48 |
| (a) | Annualized. |
| (d) | Per share data is based on average shares outstanding. |
| (f) | Ratios do not reflect reductions from fees paid indirectly, if applicable. See Note 2 in the Notes to Financial Statements for additional information. |
| (l) | Interest expense and fees include payments made to the holders of the floating rate certificates. |
| (n) | Not annualized. |
| (r) | Certain expenses have been reduced without which performance would have been lower. |
| (s) | From time to time the fund may receive proceeds from litigation settlements, without which performance would be lower. |
| (t) | Total returns do not include any applicable sales charges. |
| (x) | The net asset values and total returns have been calculated on net assets which include adjustments made in accordance with U.S. generally accepted accounting principles required at period end for financial reporting purposes. |
See Notes to Financial Statements
84
Financial
Highlights − continued
MFS WEST VIRGINIA MUNICIPAL BOND
FUND
The financial highlights table is
intended to help you understand the fund's financial performance for the semiannual period and the past 5 fiscal years. Certain information reflects financial results for a single fund share. The total returns in the
table represent the rate that an investor would have earned (or lost) on an investment in the fund share class (assuming reinvestment of all distributions) held for the entire period.
| Six months ended | Year ended | |||||
| Class A | 9/30/23 (unaudited) | 3/31/23 | 3/31/22 | 3/31/21 | 3/31/20 | 3/31/19 |
| Net asset value, beginning of period | $10.15 | $10.64 | $11.19 | $10.95 | $10.98 | $10.89 |
| Income (loss) from investment operations | ||||||
| Net investment income (loss) (d) | $0.15 | $0.25 | $0.23 | $0.28 | $0.33 | $0.38 |
| Net realized and unrealized gain (loss) | (0.61) | (0.48) | (0.55) | 0.24 | (0.03) | 0.06 |
| Total from investment operations | $(0.46) | $(0.23) | $(0.32) | $0.52 | $0.30 | $0.44 |
| Less distributions declared to shareholders | ||||||
| From net investment income | $(0.15) | $(0.26) | $(0.23) | $(0.28) | $(0.33) | $(0.35) |
| Net asset value, end of period (x) | $9.54 | $10.15 | $10.64 | $11.19 | $10.95 | $10.98 |
| Total return (%) (r)(s)(t)(x) | (4.59)(n) | (2.08) | (2.90) | 4.81 | 2.75 | 4.09 |
| Ratios (%) (to average net assets) and Supplemental data: | ||||||
| Expenses before expense reductions (f) | 1.01(a) | 1.00 | 0.97 | 0.97 | 0.98 | 0.98 |
| Expenses after expense reductions (f) | 0.87(a) | 0.87 | 0.87 | 0.87 | 0.86 | 0.86 |
| Net investment income (loss) | 2.91(a) | 2.49 | 2.09 | 2.51 | 3.00 | 3.53 |
| Portfolio turnover | 12(n) | 24 | 21 | 23 | 19 | 17 |
| Net assets at end of period (000 omitted) | $72,014 | $79,776 | $94,024 | $99,380 | $98,950 | $98,510 |
| Six months ended | Year ended | |||||
| Class B | 9/30/23 (unaudited) | 3/31/23 | 3/31/22 | 3/31/21 | 3/31/20 | 3/31/19 |
| Net asset value, beginning of period | $10.15 | $10.63 | $11.18 | $10.95 | $10.98 | $10.88 |
| Income (loss) from investment operations | ||||||
| Net investment income (loss) (d) | $0.11 | $0.18 | $0.15 | $0.20 | $0.25 | $0.30 |
| Net realized and unrealized gain (loss) | (0.61) | (0.47) | (0.55) | 0.23 | (0.03) | 0.06 |
| Total from investment operations | $(0.50) | $(0.29) | $(0.40) | $0.43 | $0.22 | $0.36 |
| Less distributions declared to shareholders | ||||||
| From net investment income | $(0.11) | $(0.19) | $(0.15) | $(0.20) | $(0.25) | $(0.26) |
| Net asset value, end of period (x) | $9.54 | $10.15 | $10.63 | $11.18 | $10.95 | $10.98 |
| Total return (%) (r)(s)(t)(x) | (4.95)(n) | (2.72) | (3.63) | 3.93 | 1.98 | 3.40 |
| Ratios (%) (to average net assets) and Supplemental data: | ||||||
| Expenses before expense reductions (f) | 1.76(a) | 1.75 | 1.72 | 1.72 | 1.73 | 1.73 |
| Expenses after expense reductions (f) | 1.62(a) | 1.62 | 1.62 | 1.62 | 1.62 | 1.62 |
| Net investment income (loss) | 2.16(a) | 1.74 | 1.35 | 1.78 | 2.28 | 2.77 |
| Portfolio turnover | 12(n) | 24 | 21 | 23 | 19 | 17 |
| Net assets at end of period (000 omitted) | $57 | $49 | $54 | $109 | $155 | $494 |
See Notes to Financial Statements
85
Financial
Highlights − continued
MFS WEST VIRGINIA MUNICIPAL BOND
FUND − continued
| Six months ended | Year ended | |||||
| Class I | 9/30/23 (unaudited) | 3/31/23 | 3/31/22 | 3/31/21 | 3/31/20 | 3/31/19 |
| Net asset value, beginning of period | $8.94 | $9.36 | $9.84 | $9.64 | $9.67 | $9.58 |
| Income (loss) from investment operations | ||||||
| Net investment income (loss) (d) | $0.14 | $0.24 | $0.23 | $0.27 | $0.32 | $0.36 |
| Net realized and unrealized gain (loss) | (0.54) | (0.41) | (0.48) | 0.20 | (0.03) | 0.06 |
| Total from investment operations | $(0.40) | $(0.17) | $(0.25) | $0.47 | $0.29 | $0.42 |
| Less distributions declared to shareholders | ||||||
| From net investment income | $(0.14) | $(0.25) | $(0.23) | $(0.27) | $(0.32) | $(0.33) |
| Net asset value, end of period (x) | $8.40 | $8.94 | $9.36 | $9.84 | $9.64 | $9.67 |
| Total return (%) (r)(s)(t)(x) | (4.51)(n) | (1.72) | (2.63) | 4.94 | 2.95 | 4.44 |
| Ratios (%) (to average net assets) and Supplemental data: | ||||||
| Expenses before expense reductions (f) | 0.76(a) | 0.75 | 0.72 | 0.72 | 0.73 | 0.73 |
| Expenses after expense reductions (f) | 0.62(a) | 0.62 | 0.62 | 0.62 | 0.62 | 0.62 |
| Net investment income (loss) | 3.15(a) | 2.74 | 2.32 | 2.73 | 3.23 | 3.75 |
| Portfolio turnover | 12(n) | 24 | 21 | 23 | 19 | 17 |
| Net assets at end of period (000 omitted) | $14,760 | $16,442 | $16,290 | $14,052 | $7,545 | $6,248 |
| Six months ended | Year ended | |||||
| Class R6 | 9/30/23 (unaudited) | 3/31/23 | 3/31/22 | 3/31/21 | 3/31/20 | 3/31/19 |
| Net asset value, beginning of period | $8.94 | $9.36 | $9.84 | $9.63 | $9.66 | $9.58 |
| Income (loss) from investment operations | ||||||
| Net investment income (loss) (d) | $0.14 | $0.25 | $0.23 | $0.28 | $0.32 | $0.37 |
| Net realized and unrealized gain (loss) | (0.53) | (0.41) | (0.47) | 0.21 | (0.03) | 0.04 |
| Total from investment operations | $(0.39) | $(0.16) | $(0.24) | $0.49 | $0.29 | $0.41 |
| Less distributions declared to shareholders | ||||||
| From net investment income | $(0.15) | $(0.26) | $(0.24) | $(0.28) | $(0.32) | $(0.33) |
| Net asset value, end of period (x) | $8.40 | $8.94 | $9.36 | $9.84 | $9.63 | $9.66 |
| Total return (%) (r)(s)(t)(x) | (4.47)(n) | (1.65) | (2.56) | 5.13 | 3.02 | 4.42 |
| Ratios (%) (to average net assets) and Supplemental data: | ||||||
| Expenses before expense reductions (f) | 0.68(a) | 0.67 | 0.64 | 0.64 | 0.64 | 0.64 |
| Expenses after expense reductions (f) | 0.54(a) | 0.54 | 0.54 | 0.54 | 0.54 | 0.53 |
| Net investment income (loss) | 3.24(a) | 2.85 | 2.38 | 2.83 | 3.27 | 3.87 |
| Portfolio turnover | 12(n) | 24 | 21 | 23 | 19 | 17 |
| Net assets at end of period (000 omitted) | $3,467 | $3,226 | $1,754 | $824 | $715 | $246 |
See Notes to Financial Statements
86
Financial
Highlights − continued
MFS WEST VIRGINIA MUNICIPAL BOND
FUND − continued
| (a) | Annualized. |
| (d) | Per share data is based on average shares outstanding. |
| (f) | Ratios do not reflect reductions from fees paid indirectly, if applicable. See Note 2 in the Notes to Financial Statements for additional information. |
| (n) | Not annualized. |
| (r) | Certain expenses have been reduced without which performance would have been lower. |
| (s) | From time to time the fund may receive proceeds from litigation settlements, without which performance would be lower. |
| (t) | Total returns do not include any applicable sales charges. |
| (x) | The net asset values and total returns have been calculated on net assets which include adjustments made in accordance with U.S. generally accepted accounting principles required at period end for financial reporting purposes. |
See Notes to Financial Statements
87
Notes to Financial
Statements
(unaudited)
(1) Business and
Organization
MFS Mississippi Municipal Bond
Fund (Mississippi Fund), MFS New York Municipal Bond Fund (New York Fund), MFS North Carolina Municipal Bond Fund (North Carolina Fund), MFS Pennsylvania Municipal Bond Fund (Pennsylvania Fund), MFS South Carolina
Municipal Bond Fund (South Carolina Fund), MFS Virginia Municipal Bond Fund (Virginia Fund), and MFS West Virginia Municipal Bond Fund (West Virginia Fund) are each a series of MFS Municipal Series Trust which is
organized as a Massachusetts business trust and is registered under the Investment Company Act of 1940, as amended, as an open-end management investment company. Each fund is a diversified series with the exception of
Mississippi Fund and West Virginia Fund which are non-diversified.
Each fund is an investment
company and accordingly follows the investment company accounting and reporting guidance of the Financial Accounting Standards Board (FASB) Accounting Standards Codification Topic 946 Financial Services - Investment
Companies.
(2) Significant Accounting
Policies
General — The preparation of financial statements in conformity with U.S. generally accepted accounting principles requires management to make estimates and assumptions that affect the
reported amounts of assets and liabilities, and disclosure of contingent assets and liabilities at the date of the financial statements and the reported amounts of increases and decreases in net assets from operations
during the reporting period. Actual results could differ from those estimates. In the preparation of these financial statements, management has evaluated subsequent events occurring after the date of each fund’s
Statement of Assets and Liabilities through the date that the financial statements were issued. Each fund invests primarily in municipal instruments, which generally trade in the over-the-counter market. The value of municipal instruments can be affected by changes in their actual or
perceived credit quality. The credit quality of, and the ability to pay principal and interest when due by, an issuer of a municipal instrument depends on the credit quality of the entity supporting the municipal
instrument, how essential any services supported by the municipal instrument are, the sufficiency of any revenues or taxes that support the municipal instrument, and/or the willingness or ability of the appropriate
government entity to approve any appropriations necessary to support the municipal instrument. Municipal instruments may be supported by insurance which typically guarantees the timely payment of all principal and
interest due on the underlying municipal instrument. The value of a municipal instrument can be volatile and significantly affected by adverse tax changes or court rulings, legislative or political changes, changes in
specific or general market and economic conditions in the region or state where the instrument is issued, and the financial condition of municipal issuers and of municipal instrument insurers of which there are a
limited number. Also, because many municipal instruments are issued to finance similar projects, conditions in certain industries can significantly affect the funds and the overall municipal market. If the Internal
Revenue Service determines an issuer of a municipal instrument has not complied with the applicable tax requirements, interest from the security could become taxable, the security could decline in value, and
distributions made by the funds could be taxable to shareholders.
Balance Sheet Offsetting — Each fund's accounting policy with respect to balance sheet offsetting is that, absent an event of default by the counterparty or a termination of the agreement, the International
Swaps and Derivatives Association (ISDA) Master Agreement, or similar agreement, does not result in an offset of reported amounts of financial assets and financial liabilities in the Statements of Assets and
Liabilities across transactions between each fund and the applicable counterparty. Each fund's right to setoff may be restricted or prohibited by the bankruptcy or insolvency laws of the particular jurisdiction to
which a specific master netting agreement counterparty is subject. Balance sheet offsetting disclosures, to the extent applicable to each fund, have been included in each fund’s Significant Accounting Policies
note under the captions for each of the fund’s in-scope financial instruments and transactions.
Investment Valuations — Subject to its oversight, the funds' Board of Trustees has delegated primary responsibility for determining or causing to be determined the value of each fund’s investments to MFS as
the funds' adviser, pursuant to each fund’s valuation policy and procedures which have been adopted by the adviser and approved by the Board. In accordance with Rule 2a-5 under the Investment Company Act of
1940, the Board of Trustees designated the adviser as the “valuation designee” of each fund. If the adviser, as valuation designee, determines that reliable market quotations are not readily available for
an investment, the investment is valued at fair value as determined in good faith by the adviser in accordance with the adviser’s fair valuation policy and procedures.
Under each fund's valuation
policy and procedures, debt instruments and floating rate loans, including restricted debt instruments, are generally valued at an evaluated or composite bid as provided by a third-party pricing service. Short-term
instruments with a maturity at issuance of 60 days or less may be valued at amortized cost, which approximates market value. Open-end investment companies are generally valued at net asset value per share.
Under each fund’s
valuation policy and procedures, market quotations are not considered to be readily available for debt instruments, floating rate loans, and many types of derivatives. These investments are generally valued at fair
value based on information from third-party pricing services or otherwise determined by the adviser in accordance with the adviser’s fair valuation policy and procedures. Securities and other assets generally
valued on the basis of information from a third-party pricing service may also be valued at a broker/dealer bid quotation. In determining values, third-party pricing services can utilize both transaction data and
market information such as yield, quality, coupon rate, maturity, type of issue, trading characteristics, spreads and other market data. An investment may also be valued at fair value if the adviser determines that
the investment’s value has been materially affected by
88
Notes to Financial
Statements (unaudited) - continued
events occurring after the close of the
exchange or market on which the investment is principally traded (such as foreign exchange or market) and prior to the determination of each fund’s net asset value, or after the halt of trading of a specific
security where trading does not resume prior to the close of the exchange or market on which the security is principally traded. The adviser generally relies on third-party pricing services or other information (such
as the correlation with price movements of similar securities in the same or other markets; the type, cost and investment characteristics of the security; the business and financial condition of the issuer; and
trading and other market data) to assist in determining whether to fair value and at what value to fair value an investment. The value of an investment for purposes of calculating each fund’s net asset value can
differ depending on the source and method used to determine value. When fair valuation is used, the value of an investment used to determine each fund’s net asset value may differ from quoted or published prices
for the same investment. There can be no assurance that each fund could obtain the fair value assigned to an investment if it were to sell the investment at the same time at which each fund determines its net asset
value per share.
Various inputs are used in
determining the value of each fund's assets or liabilities. These inputs are categorized into three broad levels. In certain cases, the inputs used to measure fair value may fall into different levels of the fair
value hierarchy. In such cases, an investment's level within the fair value hierarchy is based on the lowest level of input that is significant to the fair value measurement. Each fund's assessment of the significance
of a particular input to the fair value measurement in its entirety requires judgment, and considers factors specific to the investment. Level 1 includes unadjusted quoted prices in active markets for identical assets
or liabilities. Level 2 includes other significant observable market-based inputs (including quoted prices for similar securities, interest rates, prepayment speed, and credit risk). Level 3 includes significant
unobservable inputs, which may include the adviser's own assumptions in determining the fair value of investments. The following is a summary of the levels used as of September 30, 2023 in valuing each fund's assets
and liabilities:
| Level 1 | Level 2 | Level 3 | Total | |
| Mississippi Fund | ||||
| Financial Instruments | ||||
| Municipal Bonds | $— | $76,039,156 | $— | $76,039,156 |
| U.S. Corporate Bonds | — | 238,216 | — | 238,216 |
| Mutual Funds | 1,287,098 | — | — | 1,287,098 |
| Total | $1,287,098 | $76,277,372 | $— | $77,564,470 |
| New York Fund | ||||
| Financial Instruments | ||||
| Municipal Bonds | $— | $152,718,612 | $— | $152,718,612 |
| U.S. Corporate Bonds | — | 684,500 | — | 684,500 |
| Mutual Funds | 1,394,099 | — | — | 1,394,099 |
| Total | $1,394,099 | $153,403,112 | $— | $154,797,211 |
| North Carolina Fund | ||||
| Financial Instruments | ||||
| Municipal Bonds | $— | $424,586,210 | $— | $424,586,210 |
| U.S. Corporate Bonds | — | 1,236,136 | — | 1,236,136 |
| Mutual Funds | 4,492,814 | — | — | 4,492,814 |
| Total | $4,492,814 | $425,822,346 | $— | $430,315,160 |
| Pennsylvania Fund | ||||
| Financial Instruments | ||||
| Municipal Bonds | $— | $148,939,457 | $— | $148,939,457 |
| U.S. Corporate Bonds | — | 398,528 | — | 398,528 |
| Mutual Funds | 2,423,389 | — | — | 2,423,389 |
| Total | $2,423,389 | $149,337,985 | $— | $151,761,374 |
| South Carolina Fund | ||||
| Financial Instruments | ||||
| Municipal Bonds | $— | $192,212,065 | $— | $192,212,065 |
| U.S. Corporate Bonds | — | 626,839 | — | 626,839 |
| Mutual Funds | 1,497,131 | — | — | 1,497,131 |
| Total | $1,497,131 | $192,838,904 | $— | $194,336,035 |
89
Notes to Financial
Statements (unaudited) - continued
| Level 1 | Level 2 | Level 3 | Total | |
| Virginia Fund | ||||
| Financial Instruments | ||||
| Municipal Bonds | $— | $329,539,431 | $— | $329,539,431 |
| U.S. Corporate Bonds | — | 874,527 | — | 874,527 |
| Mutual Funds | 3,371,574 | — | — | 3,371,574 |
| Total | $3,371,574 | $330,413,958 | $— | $333,785,532 |
| West Virginia Fund | ||||
| Financial Instruments | ||||
| Municipal Bonds | $— | $88,111,417 | $— | $88,111,417 |
| U.S. Corporate Bonds | — | 274,700 | — | 274,700 |
| Mutual Funds | 752,636 | — | — | 752,636 |
| Total | $752,636 | $88,386,117 | $— | $89,138,753 |
For further information
regarding security characteristics, see the Portfolio of Investments.
Indemnifications — Under each fund's organizational documents, its officers and Trustees may be indemnified against certain liabilities and expenses arising out of the performance of their duties to
each fund. Additionally, in the normal course of business, each fund enters into agreements with service providers that may contain indemnification clauses. Each fund's maximum exposure under these agreements is
unknown as this would involve future claims that may be made against each fund that have not yet occurred.
Investment Transactions and
Income — Interest income is recorded on the accrual basis. All premium and discount is amortized or accreted for financial statement purposes in accordance with U.S. generally accepted accounting principles. Interest payments received in additional securities are recorded on the ex-interest date in an amount equal to the value of the security on such date.
Debt obligations may be placed on non-accrual
status or set to accrue at a rate of interest less than the contractual coupon when the collection of all or a portion of interest has become doubtful. Interest income for those debt obligations may be further reduced
by the write-off of the related interest receivables when deemed uncollectible.
Each fund may receive proceeds
from litigation settlements. Any proceeds received from litigation involving portfolio holdings are reflected in the Statements of Operations in realized gain/loss if the security has been disposed of by the fund or
in unrealized gain/loss if the security is still held by the fund. Any other proceeds from litigation not related to portfolio holdings are reflected as other income in the Statements of Operations.
Investment transactions are
recorded on the trade date. In determining the net gain or loss on securities sold, the cost of securities is determined on the identified cost basis.
Each fund may purchase or sell
securities on a when-issued or delayed delivery basis. In these extended settlement transactions, the receipt or delivery of the securities by the fund and related payments occur at a future date, usually beyond
the customary settlement period. The price of such security and the date that the security will be settled are generally fixed at the time the transaction is negotiated. The value of the security varies with market
fluctuations and for debt securities no interest accrues to the fund until settlement takes place. When the fund sells securities on a when-issued or delayed delivery basis, the fund typically owns or has the right to
acquire securities equivalent in kind and amount to the securities sold. Purchase and sale commitments for when-issued or delayed delivery securities are held at carrying amount, which approximates fair value and are
categorized as level 2 within the fair value hierarchy, and included in When-issued investments purchased and When-issued investments sold in the Statements of Assets and Liabilities, as applicable. Losses may arise
due to changes in the value of the underlying securities prior to settlement date or if the counterparty does not perform under the contract’s terms, or if the issuer does not issue the securities due to
political, economic or other factors.
Legal fees and other related
expenses incurred to preserve and protect the value of a security owned are added to the cost of the security; other legal fees are expensed. Capital infusions made directly to the security issuer, which are generally
non-recurring, incurred to protect or enhance the value of high-yield debt securities, are reported as additions to the cost basis of the security. Costs that are incurred to negotiate the terms or conditions of
capital infusions or that are expected to result in a plan of reorganization are reported as realized losses. Ongoing costs incurred to protect or enhance an investment, or costs incurred to pursue other claims or
legal actions, are expensed.
Fees Paid Indirectly — Each fund's custody fee may be reduced by a credit earned under an arrangement that measures the value of U.S. dollars deposited with the custodian by each fund. The amount of the
credit, for the six months ended September 30, 2023, is shown as a reduction of total expenses in the Statements of Operations.
90
Notes to Financial
Statements (unaudited) - continued
Tax Matters and Distributions
— Each fund intends to qualify as a regulated investment company, as defined under Subchapter M of the Internal Revenue Code, and to distribute all of its taxable and tax-exempt
income, including realized capital gains. As a result, no provision for federal income tax is required. Each fund’s federal tax returns, when filed, will remain subject to examination by the Internal Revenue
Service for a three year period. Management has analyzed each fund’s tax positions taken on federal and state tax returns for all open tax years and does not believe that there are any uncertain tax positions
that require recognition of a tax liability.
Distributions to shareholders
are recorded on the ex-dividend date. Income and capital gain distributions are determined in accordance with income tax regulations, which may differ from U.S. generally accepted accounting principles. Certain
capital accounts in the financial statements are periodically adjusted for permanent differences in order to reflect their tax character. These adjustments have no impact on net assets or net asset value per share.
Temporary differences which arise from recognizing certain items of income, expense, gain or loss in different periods for financial statement and tax purposes will reverse at some time in the future.
Book/tax differences primarily
relate to defaulted bonds, wash sale loss deferrals, amortization and accretion of debt securities and treating a portion of the proceeds from redemptions as a distribution for tax purposes, as applicable to each
fund.
The tax character of
distributions made during the current period will be determined at fiscal year end. The tax character of distributions declared to shareholders for the last fiscal year is as follows:
| Year ended 3/31/23 | Mississippi Fund | New York Fund | North Carolina Fund | Pennsylvania Fund | South Carolina Fund | Virginia Fund | West Virginia Fund |
| Ordinary income (including any short-term capital gains) | $58,068 | $282,858 | $274,803 | $220,372 | $243,505 | $384,305 | $84,387 |
| Tax-exempt income | 2,176,692 | 6,743,685 | 11,341,661 | 4,516,126 | 5,379,325 | 9,085,146 | 2,627,848 |
| Total distributions | $2,234,760 | $7,026,543 | $11,616,464 | $4,736,498 | $5,622,830 | $9,469,451 | $2,712,235 |
The federal tax cost and the tax
basis components of distributable earnings were as follows:
| As of 9/30/23 | Mississippi Fund | New York Fund | North Carolina Fund | Pennsylvania Fund |
| Cost of investments | $85,049,972 | $171,925,709 | $471,406,274 | $166,516,685 |
| Gross appreciation | 280,555 | 291,594 | 653,181 | 299,640 |
| Gross depreciation | (7,766,057) | (17,420,092) | (41,744,295) | (15,054,951) |
| Net unrealized appreciation (depreciation) | $(7,485,502) | $(17,128,498) | $(41,091,114) | $(14,755,311) |
| As of 3/31/23 | ||||
| Undistributed ordinary income | 3,315 | 146,186 | 81,957 | 4,271 |
| Undistributed tax-exempt income | 454,472 | 1,402,208 | 2,178,952 | 910,121 |
| Capital loss carryforwards | (4,875,465) | (12,320,398) | (23,475,075) | (6,700,696) |
| Other temporary differences | (190,927) | (656,166) | (1,161,831) | (463,614) |
| Net unrealized appreciation (depreciation) | (2,657,594) | (7,949,580) | (15,875,558) | (5,894,129) |
| As of 9/30/23 | South Carolina Fund | Virginia Fund | West Virginia Fund |
| Cost of investments | $214,089,032 | $369,007,433 | $98,101,589 |
| Gross appreciation | 172,499 | 296,676 | 151,178 |
| Gross depreciation | (19,925,496) | (35,518,577) | (9,114,014) |
| Net unrealized appreciation (depreciation) | $(19,752,997) | $(35,221,901) | $(8,962,836) |
| As of 3/31/23 | |||
| Undistributed ordinary income | — | — | 15,920 |
| Undistributed tax-exempt income | 1,153,565 | 1,746,617 | 517,455 |
| Capital loss carryforwards | (15,505,590) | (15,343,516) | (6,102,646) |
| Other temporary differences | (517,464) | (916,497) | (244,482) |
| Net unrealized appreciation (depreciation) | (8,567,767) | (15,999,998) | (3,529,890) |
The aggregate cost above
includes prior fiscal year end tax adjustments, if applicable.
91
Notes to Financial
Statements (unaudited) - continued
As of March 31, 2023, each fund
had capital loss carryforwards available to offset future realized gains. These net capital losses may be carried forward indefinitely and their character is retained as short-term and/or long-term losses. Such losses
are characterized as follows:
| Mississippi Fund | New York Fund | North Carolina Fund | Pennsylvania Fund | South Carolina Fund | Virginia Fund | West Virginia Fund | |
| Short-Term | $(1,659,270) | $(6,308,479) | $(11,633,060) | $(3,542,058) | $(4,700,755) | $(5,589,554) | $(2,082,898) |
| Long-Term | (3,216,195) | (6,011,919) | (11,842,015) | (3,158,638) | (10,804,835) | (9,753,962) | (4,019,748) |
| Total | $(4,875,465) | $(12,320,398) | $(23,475,075) | $(6,700,696) | $(15,505,590) | $(15,343,516) | $(6,102,646) |
Multiple Classes of Shares of
Beneficial Interest — Each fund offers multiple classes of shares, which differ in their respective distribution and service fees. Each fund's income and common expenses are allocated to shareholders
based on the value of settled shares outstanding of each class. Each fund's realized and unrealized gain (loss) are allocated to shareholders based on the daily net assets of each class. Dividends are declared
separately for each class. Differences in per share dividend rates are generally due to differences in separate class expenses. Class B and Class C shares will convert to Class A shares approximately eight years after
purchase. Each fund’s distributions declared to shareholders as reported in the Statements of Changes in Net Assets are presented by class as follows:
| Mississippi Fund | New York Fund | North Carolina Fund | Pennsylvania Fund | ||||||||||||
| Six Months Ended 9/30/23 | Year Ended 3/31/23 | Six Months Ended 9/30/23 | Year Ended 3/31/23 | Six Months Ended 9/30/23 | Year Ended 3/31/23 | Six Months Ended 9/30/23 | Year Ended 3/31/23 | ||||||||
| Class A | $992,220 | $1,872,021 | $2,133,544 | $3,974,888 | $4,358,953 | $7,560,408 | $1,775,567 | $3,253,708 | |||||||
| Class B | 545 | 995 | 6,726 | 13,317 | 1,718 | 4,083 | 4,524 | 9,679 | |||||||
| Class C | — | — | 81,443 | 165,999 | 215,291 | 392,590 | — | — | |||||||
| Class I | 108,782 | 282,216 | 657,073 | 1,309,073 | 1,568,710 | 2,797,517 | 512,504 | 893,788 | |||||||
| Class R6 | 45,707 | 79,528 | 475,981 | 1,563,266 | 526,270 | 861,866 | 348,279 | 579,323 | |||||||
| Total | $1,147,254 | $2,234,760 | $3,354,767 | $7,026,543 | $6,670,942 | $11,616,464 | $2,640,874 | $4,736,498 | |||||||
| South Carolina Fund | Virginia Fund | West Virginia Fund | |||||||||
| Six Months Ended 9/30/23 | Year Ended 3/31/23 | Six Months Ended 9/30/23 | Year Ended 3/31/23 | Six Months Ended 9/30/23 | Year Ended 3/31/23 | ||||||
| Class A | $2,116,641 | $4,054,666 | $3,455,899 | $6,349,347 | $1,142,924 | $2,189,595 | |||||
| Class B | 964 | 2,238 | 2,371 | 5,456 | 608 | 926 | |||||
| Class C | — | — | 84,578 | 174,262 | — | — | |||||
| Class I | 677,444 | 1,177,884 | 1,360,696 | 2,328,407 | 255,473 | 452,344 | |||||
| Class R6 | 248,649 | 388,042 | 347,971 | 611,979 | 57,179 | 69,370 | |||||
| Total | $3,043,698 | $5,622,830 | $5,251,515 | $9,469,451 | $1,456,184 | $2,712,235 | |||||
(3) Transactions with
Affiliates
Investment Adviser — Each fund has an investment advisory agreement with MFS to provide overall investment management and related administrative services and facilities to each fund. The management fee is computed daily and paid monthly at an annual rate of 0.45% of each fund’s average daily net assets.
MFS has agreed in writing to
reduce its management fee by a specified amount if certain MFS mutual fund assets exceed thresholds agreed to by MFS and the funds’ Board of Trustees. MFS has also agreed in writing to waive at least 0.01% of
its management fee as part of this agreement. The agreement to waive at least 0.01% of the management fee will continue until modified by the funds' Board of Trustees, but such agreement will continue at least until
July 31, 2024. For the six months ended September 30, 2023, these management fee reductions amounted to the following, which are included in the reduction of total expenses in the Statements of Operations:
| Mississippi Fund | New York Fund | North Carolina Fund | Pennsylvania Fund | South Carolina Fund | Virginia Fund | West Virginia Fund |
| $5,158 | $11,999 | $28,490 | $10,209 | $13,192 | $22,539 | $6,047 |
The management fee incurred for
the six months ended September 30, 2023 was equivalent to an annual effective rate of 0.44% of each fund's average daily net assets.
92
Notes to Financial
Statements (unaudited) - continued
The investment adviser has
agreed in writing to pay a portion of the following funds’ total annual operating expenses, excluding interest, taxes, extraordinary expenses, brokerage and transaction costs, certain tax reclaim recovery
expenses (including contingency fees and closing agreement expenses), and investment-related expenses, such that total fund operating expenses do not exceed the following rates annually of these funds’ average
daily net assets:
| New York Fund | North Carolina Fund | Pennsylvania Fund | South Carolina Fund | Virginia Fund | West Virginia Fund | |
| Class A | 0.83% | 0.84% | 0.69% | 0.84% | 0.81% | 0.87% |
| Class B | 1.58% | 1.59% | 1.44% | 1.59% | 1.56% | 1.62% |
| Class C | 1.58% | 1.59% | N/A | N/A | 1.56% | N/A |
| Class I | 0.58% | 0.59% | 0.59% | 0.59% | 0.56% | 0.62% |
| Class R6 | 0.53% | 0.52% | 0.52% | 0.53% | 0.49% | 0.55% |
These written agreements will
continue until modified by the funds’ Board of Trustees, but such agreements will continue at least until July 31, 2024. For the six months ended September 30, 2023, these reductions amounted to the
following for the New York Fund, the North Carolina Fund, the Pennsylvania Fund, the South Carolina Fund, the Virginia Fund, and the West Virginia Fund and are included in the reduction of total expenses in the
Statements of Operations.
| New York Fund | North Carolina Fund | Pennsylvania Fund | South Carolina Fund | Virginia Fund | West Virginia Fund |
| $89,388 | $4,165 | $69,924 | $40,090 | $93,379 | $60,946 |
Distributor — MFS Fund Distributors, Inc. (MFD), a wholly-owned subsidiary of MFS, as distributor, received the following amounts for the six months ended September 30, 2023, as its
portion of the initial sales charge on sales of Class A shares of each fund:
| Mississippi Fund | New York Fund | North Carolina Fund | Pennsylvania Fund | South Carolina Fund | Virginia Fund | West Virginia Fund |
| $2,384 | $793 | $3,497 | $1,059 | $2,552 | $2,065 | $147 |
The Board of Trustees has
adopted a distribution plan for certain share classes pursuant to Rule 12b-1 of the Investment Company Act of 1940.
Each fund's distribution plan
provides that each fund will pay MFD for services provided by MFD and financial intermediaries in connection with the distribution and servicing of certain share classes. One component of the plan is a
distribution fee paid to MFD and another component of the plan is a service fee paid to MFD. MFD may subsequently pay all, or a portion, of the distribution and/or service fees to financial intermediaries. The
distribution and service fees are computed daily and paid monthly.
Distribution Plan Fee Table:
| Class A | |||||
| Distribution Fee Rate (d) | Service Fee Rate (d) | Total Distribution Plan (d) | Annual Effective Rate (e) | Distribution and Service Fee | |
| Mississippi Fund | — | 0.25% | 0.25% | 0.10% | $89,500 |
| New York Fund | — | 0.25% | 0.25% | 0.25% | 154,990 |
| North Carolina Fund | — | 0.25% | 0.25% | 0.25% | 377,201 |
| Pennsylvania Fund | — | 0.25% | 0.25% | 0.10% | 138,623 |
| South Carolina Fund | — | 0.25% | 0.25% | 0.25% | 187,910 |
| Virginia Fund | — | 0.25% | 0.25% | 0.25% | 302,446 |
| West Virginia Fund | — | 0.25% | 0.25% | 0.25% | 96,384 |
93
Notes to Financial
Statements (unaudited) - continued
| Class B | |||||
| Distribution Fee Rate (d) | Service Fee Rate (d) | Total Distribution Plan (d) | Annual Effective Rate (e) | Distribution and Service Fee | |
| Mississippi Fund | 0.75% | 0.25% | 1.00% | 0.75% | $255 |
| New York Fund | 0.75% | 0.25% | 1.00% | 1.00% | 2,490 |
| North Carolina Fund | 0.75% | 0.25% | 1.00% | 1.00% | 800 |
| Pennsylvania Fund | 0.75% | 0.25% | 1.00% | 0.85% | 1,833 |
| South Carolina Fund | 0.75% | 0.25% | 1.00% | 1.00% | 470 |
| Virginia Fund | 0.75% | 0.25% | 1.00% | 1.00% | 1,119 |
| West Virginia Fund | 0.75% | 0.25% | 1.00% | 1.00% | 274 |
| Class C | |||||
| Distribution Fee Rate (d) | Service Fee Rate (d) | Total Distribution Plan (d) | Annual Effective Rate (e) | Distribution and Service Fee | |
| New York Fund | 0.75% | 0.25% | 1.00% | 1.00% | $30,135 |
| North Carolina Fund | 0.75% | 0.25% | 1.00% | 1.00% | 100,073 |
| Virginia Fund | 0.75% | 0.25% | 1.00% | 1.00% | 39,935 |
| Mississippi Fund | New York Fund | North Carolina Fund | Pennsylvania Fund | South Carolina Fund | Virginia Fund | West Virginia Fund | |
| Total Distribution and Service Fees | $89,755 | $187,615 | $478,074 | $140,456 | $188,380 | $343,500 | $96,658 |
| (d) | In accordance with the distribution plan for certain classes, each fund pays distribution and/or service fees equal to these annual percentage rates of each class’s average daily net assets. The distribution and service fee rates disclosed by class represent the current rates in effect at the end of the reporting period. Any rate changes, if applicable, are detailed below. |
| (e) | The annual effective rates represent actual fees incurred under the distribution plan for the six months ended September 30, 2023 based on each class's average daily net assets. MFD has voluntarily agreed to rebate a portion of each class’s 0.25% service fee attributable to accounts for which there is no financial intermediary specified on the account except for accounts attributable to MFS or its affiliates’ seed money. For the six months ended September 30, 2023, these rebates amounted to the following and are included in the reduction of total expenses in the Statements of Operations: |
| Mississippi Fund | New York Fund | North Carolina Fund | Pennsylvania Fund | South Carolina Fund | Virginia Fund | West Virginia Fund | |
| Class A | $— | $— | $15 | $1 | $— | $10 | $— |
Mississippi
Fund: MFD has agreed in writing to reduce the Class A and Class B service fee rates to 0.10% and 0.00%, respectively. This written agreement will continue until modified by the fund’s
Board of Trustees, but such agreement will continue at least until July 31, 2024. For the six months ended September 30, 2023, these reductions amounted to $53,700 and $64 for Class A and Class B shares, respectively,
and are included in the reduction of total expenses in the Statements of Operations.
Pennsylvania
Fund: MFD has agreed in writing to reduce the Class A and Class B service fee rates to 0.10%. This written agreement will continue until modified by the fund’s Board of Trustees, but such
agreement will continue at least until July 31, 2024. For the six months ended September 30, 2023, these reductions amounted to $83,174 and $276 for Class A and Class B shares, respectively, and are included in the
reduction of total expenses in the Statements of Operations.
Certain Class A shares are
subject to a contingent deferred sales charge (CDSC) in the event of a shareholder redemption within 18 months of purchase. Class B shares are subject to a CDSC in the event of a shareholder redemption within six
years of purchase. Class C shares are subject to a CDSC in the event of a shareholder redemption within 12 months of purchase. All contingent deferred sales charges are paid to MFD and during the six months
ended September 30, 2023, were as follows:
| CDSC Imposed | Mississippi Fund | New York Fund | North Carolina Fund | Pennsylvania Fund | South Carolina Fund | Virginia Fund | West Virginia Fund |
| Class A | $— | $4,455 | $875 | $340 | $887 | $1,873 | $27 |
| Class B | — | 173 | — | 220 | — | 274 | — |
| Class C | N/A | 229 | 382 | N/A | N/A | 12 | N/A |
94
Notes to Financial
Statements (unaudited) - continued
Shareholder Servicing Agent — MFS Service Center, Inc. (MFSC), a wholly-owned subsidiary of MFS, receives a fee from each fund for its services as shareholder servicing agent calculated as a percentage of the
average daily net assets of each fund as determined periodically under the supervision of the funds’ Board of Trustees. For the six months ended September 30, 2023, each fund paid the following fee, which
equated to the following annual percentage of each fund’s average daily net assets:
| Mississippi Fund | New York Fund | North Carolina Fund | Pennsylvania Fund | South Carolina Fund | Virginia Fund | West Virginia Fund | |
| Expenses paid | $932 | $7,103 | $6,738 | $7,818 | $2,946 | $6,429 | $1,709 |
| Annual percentage of average daily net assets | 0.0023% | 0.0074% | 0.0030% | 0.0096% | 0.0028% | 0.0036% | 0.0036% |
MFSC also receives reimbursement
from each fund for out-of-pocket expenses, sub-accounting and other shareholder servicing costs which may be paid to affiliated and unaffiliated service providers. Class R6 shares do not incur sub-accounting fees. For
the six months ended September 30, 2023, these out-of-pocket expenses, sub-accounting and other shareholder servicing costs amounted to the following:
| Mississippi Fund | New York Fund | North Carolina Fund | Pennsylvania Fund | South Carolina Fund | Virginia Fund | West Virginia Fund |
| $26,388 | $72,233 | $155,923 | $53,570 | $63,961 | $140,358 | $39,302 |
Administrator — MFS provides certain financial, legal, shareholder communications, compliance, and other administrative services to each fund. Under an administrative services agreement, each
fund reimburses MFS the costs incurred to provide these services. Each fund is charged an annual fixed amount of $17,500 plus a fee based on average daily net assets. The administrative services fee is computed daily
and paid monthly. The administrative services fee incurred for the six months ended September 30, 2023 was equivalent to the following annual effective rates of each fund's average daily net assets:
| Mississippi Fund | New York Fund | North Carolina Fund | Pennsylvania Fund | South Carolina Fund | Virginia Fund | West Virginia Fund | |
| Percentage of average daily net assets | 0.0269% | 0.0198% | 0.0166% | 0.0207% | 0.0193% | 0.0172% | 0.0251% |
Trustees’ and
Officers’ Compensation — Each fund pays compensation to independent Trustees in the form of a retainer, attendance fees, and additional compensation to Board and Committee chairpersons.
Independent Trustees’ compensation is accrued daily and paid subsequent to each Trustee Board meeting. The funds do not pay compensation directly to Trustees or officers of each fund who are also officers
of the investment adviser, all of whom receive remuneration from MFS for their services to each fund. Certain officers and Trustees of each fund are officers or directors of MFS, MFD, and MFSC.
Prior to December 31, 2001, each
fund had an unfunded defined benefit plan (“DB plan”) for independent Trustees. As of December 31, 2001, the Board took action to terminate the DB plan with respect to then-current and any future
independent Trustees, such that the DB plan covers only certain of those former independent Trustees who retired on or before December 31, 2001. The Mississippi Fund, the New York Fund, and the Pennsylvania Fund no
longer participate in the DB plan. The DB plan resulted in a pension expense for the following funds. These amounts are included in “Independent Trustees’ compensation” in the Statements of
Operations for the six months ended September 30, 2023:
| North Carolina Fund | South Carolina Fund | Virginia Fund | West Virginia Fund |
| $144 | $143 | $145 | $143 |
The liability for deferred
retirement benefits payable to those former independent Trustees under the DB plan amounted to the following at September 30, 2023, and is included in “Payable for independent Trustees’ compensation”
in the Statements of Assets and Liabilities. The deferred retirement benefits compensation fee is accrued daily and paid monthly:
| North Carolina Fund | South Carolina Fund | Virginia Fund | West Virginia Fund |
| $2,225 | $2,250 | $2,241 | $2,249 |
Other — Each fund invests in the MFS Institutional Money Market Portfolio which is managed by MFS and seeks current income consistent with preservation of capital and liquidity. This money
market fund does not pay a management fee to MFS but does incur investment and operating costs.
95
Notes to Financial
Statements (unaudited) - continued
MFS purchased or redeemed the
following fund shares:
| Fund | Date | Transaction | Class | Shares | Amount |
| Mississippi Fund | 8/03/2022 | Redemption | Class I | 15 | $137 |
| Mississippi Fund | 4/21/2023 | Purchase | Class B | 5,631 | 50,000 |
| New York Fund | 8/03/2022 | Redemption | Class I | 18 | 165 |
| North Carolina Fund | 8/03/2022 | Redemption | Class I | 16 | 148 |
| North Carolina Fund | 8/03/2022 | Redemption | Class R6 | 18 | 166 |
| Pennsylvania Fund | 8/03/2022 | Redemption | Class I | 17 | 159 |
| South Carolina Fund | 8/03/2022 | Redemption | Class I | 15 | 139 |
| South Carolina Fund | 6/23/2023 | Redemption | Class R6 | 5,978 | 53,562 |
| Virginia Fund | 8/03/2022 | Redemption | Class I | 16 | 147 |
| Virginia Fund | 8/03/2022 | Redemption | Class R6 | 21 | 193 |
| West Virginia Fund | 8/03/2022 | Redemption | Class I | 15 | 137 |
| West Virginia Fund | 6/23/2023 | Purchase | Class B | 1,095 | 11,094 |
At September 30, 2023, MFS held
approximately 94% of the outstanding shares of Class B of the Mississippi Fund.
(4) Portfolio Securities
For the six months ended
September 30, 2023, purchases and sales of investments, other than short-term obligations, were as follows:
| Mississippi Fund | New York Fund | North Carolina Fund | Pennsylvania Fund | South Carolina Fund | Virginia Fund | West Virginia Fund | |
| Purchases | $7,164,528 | $20,487,668 | $59,323,116 | $13,695,241 | $25,048,385 | $37,377,033 | $11,625,119 |
| Sales | $7,522,804 | $66,958,051 | $44,416,543 | $14,766,518 | $28,210,195 | $36,859,800 | $13,811,608 |
(5) Shares of Beneficial
Interest
Each fund's Declaration of Trust
permits the Trustees to issue an unlimited number of full and fractional shares of beneficial interest. Transactions in fund shares were as follows:
| Mississippi Fund | New York Fund | ||||||||||
| Six Months Ended 9/30/23 | Year ended 3/31/23 | Six Months Ended 9/30/23 | Year ended 3/31/23 | ||||||||
| Shares | Amount | Shares | Amount | Shares | Amount | Shares | Amount | ||||
| Shares sold | |||||||||||
| Class A | 447,554 | $ 3,879,709 | 1,018,773 | $ 9,067,006 | 557,726 | $ 5,516,471 | 1,612,232 | $ 16,075,395 | |||
| Class B | 5,632 | 50,000 | 10 | 90 | — | — | — | 3 | |||
| Class C | — | — | — | — | 13,158 | 130,625 | 56,801 | 565,117 | |||
| Class I | 45,218 | 393,391 | 324,258 | 2,880,365 | 318,072 | 2,772,493 | 2,191,263 | 19,273,599 | |||
| Class R6 | 76,120 | 670,345 | 73,853 | 660,231 | 120,827 | 1,058,155 | 299,108 | 2,633,060 | |||
| 574,524 | $4,993,445 | 1,416,894 | $12,607,692 | 1,009,783 | $9,477,744 | 4,159,404 | $38,547,174 | ||||
| Shares issued to shareholders in reinvestment of distributions | |||||||||||
| Class A | 109,447 | $ 953,263 | 202,281 | $ 1,790,717 | 186,258 | $ 1,829,468 | 343,648 | $ 3,420,403 | |||
| Class B | 58 | 508 | 93 | 825 | 656 | 6,431 | 1,313 | 13,029 | |||
| Class C | — | — | — | — | 7,823 | 76,756 | 15,408 | 153,202 | |||
| Class I | 10,893 | 94,761 | 29,011 | 256,350 | 59,233 | 514,109 | 115,161 | 1,013,316 | |||
| Class R6 | 5,259 | 45,706 | 8,995 | 79,528 | 41,087 | 360,573 | 177,756 | 1,563,264 | |||
| 125,657 | $1,094,238 | 240,380 | $2,127,420 | 295,057 | $2,787,337 | 653,286 | $6,163,214 | ||||
96
Notes to Financial
Statements (unaudited) - continued
| Mississippi Fund − continued | New York Fund − continued | ||||||||||
| Six Months Ended 9/30/23 | Year ended 3/31/23 | Six Months Ended 9/30/23 | Year ended 3/31/23 | ||||||||
| Shares | Amount | Shares | Amount | Shares | Amount | Shares | Amount | ||||
| Shares reacquired | |||||||||||
| Class A | (523,049) | $ (4,575,400) | (1,698,929) | $ (15,074,773) | (1,133,199) | $(11,172,130) | (3,791,175) | $ (37,759,154) | |||
| Class B | (527) | (4,551) | (8,829) | (78,549) | (6,653) | (64,578) | (18,020) | (179,027) | |||
| Class C | — | — | — | — | (94,670) | (938,809) | (334,694) | (3,313,873) | |||
| Class I | (81,491) | (709,368) | (946,422) | (8,343,888) | (624,723) | (5,433,827) | (2,938,093) | (25,718,519) | |||
| Class R6 | (31,793) | (278,321) | (117,245) | (1,040,528) | (5,069,291) | (44,908,045) | (466,164) | (4,124,255) | |||
| (636,860) | $(5,567,640) | (2,771,425) | $(24,537,738) | (6,928,536) | $(62,517,389) | (7,548,146) | $(71,094,828) | ||||
| Net change | |||||||||||
| Class A | 33,952 | $ 257,572 | (477,875) | $ (4,217,050) | (389,215) | $ (3,826,191) | (1,835,295) | $ (18,263,356) | |||
| Class B | 5,163 | 45,957 | (8,726) | (77,634) | (5,997) | (58,147) | (16,707) | (165,995) | |||
| Class C | — | — | — | — | (73,689) | (731,428) | (262,485) | (2,595,554) | |||
| Class I | (25,380) | (221,216) | (593,153) | (5,207,173) | (247,418) | (2,147,225) | (631,669) | (5,431,604) | |||
| Class R6 | 49,586 | 437,730 | (34,397) | (300,769) | (4,907,377) | (43,489,317) | 10,700 | 72,069 | |||
| 63,321 | $520,043 | (1,114,151) | $(9,802,626) | (5,623,696) | $(50,252,308) | (2,735,456) | $(26,384,440) | ||||
| North Carolina Fund | Pennsylvania Fund | ||||||||||
| Six Months Ended 9/30/23 | Year ended 3/31/23 | Six Months Ended 9/30/23 | Year ended 3/31/23 | ||||||||
| Shares | Amount | Shares | Amount | Shares | Amount | Shares | Amount | ||||
| Shares sold | |||||||||||
| Class A | 3,335,625 | $ 35,205,406 | 15,937,908 | $ 169,352,402 | 538,912 | $ 5,084,156 | 1,936,430 | $ 18,407,445 | |||
| Class B | — | — | — | — | 20 | 186 | 11,207 | 108,343 | |||
| Class C | 53,616 | 573,905 | 178,511 | 1,904,368 | — | — | — | — | |||
| Class I | 1,716,006 | 15,327,628 | 5,433,999 | 48,750,067 | 424,427 | 3,803,334 | 1,577,787 | 14,289,405 | |||
| Class R6 | 824,084 | 7,337,267 | 1,644,324 | 14,637,720 | 317,777 | 2,849,416 | 1,007,875 | 9,102,153 | |||
| 5,929,331 | $58,444,206 | 23,194,742 | $234,644,557 | 1,281,136 | $11,737,092 | 4,533,299 | $41,907,346 | ||||
| Shares issued to shareholders in reinvestment of distributions | |||||||||||
| Class A | 393,062 | $ 4,164,276 | 672,819 | $ 7,200,381 | 182,414 | $ 1,705,123 | 327,843 | $ 3,109,403 | |||
| Class B | 162 | 1,718 | 376 | 4,025 | 482 | 4,520 | 984 | 9,354 | |||
| Class C | 19,932 | 211,150 | 35,503 | 379,733 | — | — | — | — | |||
| Class I | 161,389 | 1,425,173 | 282,258 | 2,517,802 | 54,671 | 486,964 | 92,196 | 833,133 | |||
| Class R6 | 57,728 | 509,718 | 91,512 | 817,271 | 18,695 | 166,485 | 28,543 | 258,036 | |||
| 632,273 | $6,312,035 | 1,082,468 | $10,919,212 | 256,262 | $2,363,092 | 449,566 | $4,209,926 | ||||
| Shares reacquired | |||||||||||
| Class A | (3,353,981) | $(35,459,374) | (20,163,392) | $(214,917,787) | (1,031,490) | $ (9,690,321) | (3,568,841) | $ (33,995,612) | |||
| Class B | (1,257) | (13,252) | (13,768) | (146,968) | (6,807) | (64,503) | (26,279) | (248,457) | |||
| Class C | (272,503) | (2,902,727) | (805,366) | (8,637,197) | — | — | — | — | |||
| Class I | (1,419,789) | (12,599,974) | (7,410,416) | (65,841,610) | (578,783) | (5,173,542) | (2,120,043) | (19,170,095) | |||
| Class R6 | (578,676) | (5,133,726) | (2,636,646) | (23,590,483) | (305,256) | (2,726,357) | (908,309) | (8,235,075) | |||
| (5,626,206) | $(56,109,053) | (31,029,588) | $(313,134,045) | (1,922,336) | $(17,654,723) | (6,623,472) | $(61,649,239) | ||||
| Net change | |||||||||||
| Class A | 374,706 | $ 3,910,308 | (3,552,665) | $ (38,365,004) | (310,164) | $ (2,901,042) | (1,304,568) | $ (12,478,764) | |||
| Class B | (1,095) | (11,534) | (13,392) | (142,943) | (6,305) | (59,797) | (14,088) | (130,760) | |||
| Class C | (198,955) | (2,117,672) | (591,352) | (6,353,096) | — | — | — | — | |||
| Class I | 457,606 | 4,152,827 | (1,694,159) | (14,573,741) | (99,685) | (883,244) | (450,060) | (4,047,557) | |||
| Class R6 | 303,136 | 2,713,259 | (900,810) | (8,135,492) | 31,216 | 289,544 | 128,109 | 1,125,114 | |||
| 935,398 | $8,647,188 | (6,752,378) | $(67,570,276) | (384,938) | $(3,554,539) | (1,640,607) | $(15,531,967) | ||||
97
Notes to Financial
Statements (unaudited) - continued
| South Carolina Fund | Virginia Fund | ||||||||||
| Six Months Ended 9/30/23 | Year ended 3/31/23 | Six Months Ended 9/30/23 | Year ended 3/31/23 | ||||||||
| Shares | Amount | Shares | Amount | Shares | Amount | Shares | Amount | ||||
| Shares sold | |||||||||||
| Class A | 422,800 | $ 4,629,208 | 1,453,070 | $ 16,015,542 | 2,337,778 | $ 23,291,879 | 16,437,061 | $ 166,413,666 | |||
| Class B | — | — | — | — | — | — | 34 | 359 | |||
| Class C | — | — | — | — | 36,323 | 369,145 | 104,741 | 1,066,867 | |||
| Class I | 672,490 | 5,950,522 | 2,782,524 | 24,452,341 | 1,647,090 | 14,512,033 | 6,940,567 | 61,299,000 | |||
| Class R6 | 502,467 | 4,481,282 | 765,590 | 6,801,579 | 665,373 | 5,898,404 | 1,055,514 | 9,406,522 | |||
| 1,597,757 | $15,061,012 | 5,001,184 | $47,269,462 | 4,686,564 | $44,071,461 | 24,537,917 | $238,186,414 | ||||
| Shares issued to shareholders in reinvestment of distributions | |||||||||||
| Class A | 189,807 | $ 2,061,410 | 358,083 | $ 3,932,028 | 316,646 | $ 3,190,254 | 574,637 | $ 5,860,260 | |||
| Class B | 89 | 964 | 204 | 2,238 | 236 | 2,371 | 494 | 5,032 | |||
| Class C | — | — | — | — | 7,411 | 74,719 | 15,269 | 155,703 | |||
| Class I | 70,158 | 617,054 | 115,738 | 1,030,612 | 143,134 | 1,252,775 | 233,134 | 2,067,395 | |||
| Class R6 | 28,226 | 248,259 | 43,595 | 387,858 | 39,576 | 346,604 | 68,668 | 609,841 | |||
| 288,280 | $2,927,687 | 517,620 | $5,352,736 | 507,003 | $4,866,723 | 892,202 | $8,698,231 | ||||
| Shares reacquired | |||||||||||
| Class A | (1,124,893) | $(12,298,031) | (5,512,390) | $ (60,411,065) | (3,303,234) | $(33,014,836) | (15,918,553) | $(160,940,142) | |||
| Class B | (6,043) | (66,392) | (426) | (4,675) | (1,523) | (15,320) | (13,455) | (136,056) | |||
| Class C | — | — | — | — | (172,186) | (1,739,893) | (368,755) | (3,767,138) | |||
| Class I | (701,788) | (6,227,048) | (3,934,218) | (35,194,045) | (1,395,938) | (12,226,445) | (7,064,768) | (62,556,061) | |||
| Class R6 | (280,714) | (2,483,260) | (1,202,514) | (10,722,034) | (362,016) | (3,200,613) | (1,643,452) | (14,625,278) | |||
| (2,113,438) | $(21,074,731) | (10,649,548) | $(106,331,819) | (5,234,897) | $(50,197,107) | (25,008,983) | $(242,024,675) | ||||
| Net change | |||||||||||
| Class A | (512,286) | $ (5,607,413) | (3,701,237) | $ (40,463,495) | (648,810) | $ (6,532,703) | 1,093,145 | $ 11,333,784 | |||
| Class B | (5,954) | (65,428) | (222) | (2,437) | (1,287) | (12,949) | (12,927) | (130,665) | |||
| Class C | — | — | — | — | (128,452) | (1,296,029) | (248,745) | (2,544,568) | |||
| Class I | 40,860 | 340,528 | (1,035,956) | (9,711,092) | 394,286 | 3,538,363 | 108,933 | 810,334 | |||
| Class R6 | 249,979 | 2,246,281 | (393,329) | (3,532,597) | 342,933 | 3,044,395 | (519,270) | (4,608,915) | |||
| (227,401) | $(3,086,032) | (5,130,744) | $(53,709,621) | (41,330) | $(1,258,923) | 421,136 | $4,859,970 | ||||
| West Virginia Fund | |||||
| Six Months Ended 9/30/23 | Year ended 3/31/23 | ||||
| Shares | Amount | Shares | Amount | ||
| Shares sold | |||||
| Class A | 235,663 | $ 2,371,175 | 866,487 | $ 8,787,393 | |
| Class B | 1,095 | 11,096 | — | — | |
| Class I | 206,733 | 1,825,988 | 557,936 | 4,960,718 | |
| Class R6 | 65,519 | 578,857 | 232,364 | 2,040,176 | |
| 509,010 | $4,787,116 | 1,656,787 | $15,788,287 | ||
| Shares issued to shareholders in reinvestment of distributions | |||||
| Class A | 111,581 | $ 1,110,500 | 210,761 | $ 2,121,870 | |
| Class B | 61 | 608 | 92 | 926 | |
| Class I | 25,489 | 223,347 | 44,164 | 391,284 | |
| Class R6 | 6,532 | 57,175 | 7,844 | 69,370 | |
| 143,663 | $1,391,630 | 262,861 | $2,583,450 | ||
98
Notes to Financial
Statements (unaudited) - continued
| West Virginia Fund − continued | |||||
| Six Months Ended 9/30/23 | Year ended 3/31/23 | ||||
| Shares | Amount | Shares | Amount | ||
| Shares reacquired | |||||
| Class A | (657,590) | $ (6,603,980) | (2,061,021) | $ (20,703,458) | |
| Class B | — | — | (277) | (2,736) | |
| Class I | (314,672) | (2,786,104) | (502,486) | (4,455,646) | |
| Class R6 | (20,194) | (177,190) | (66,569) | (591,454) | |
| (992,456) | $(9,567,274) | (2,630,353) | $(25,753,294) | ||
| Net change | |||||
| Class A | (310,346) | $ (3,122,305) | (983,773) | $ (9,794,195) | |
| Class B | 1,156 | 11,704 | (185) | (1,810) | |
| Class I | (82,450) | (736,769) | 99,614 | 896,356 | |
| Class R6 | 51,857 | 458,842 | 173,639 | 1,518,092 | |
| (339,783) | $(3,388,528) | (710,705) | $(7,381,557) | ||
Effective June 1, 2019,
purchases of each fund’s Class B shares were closed to new and existing investors subject to certain exceptions.
(6) Line of Credit
Each fund and certain other
funds managed by MFS participate in a $1.45 billion unsecured committed line of credit of which $1.2 billion is reserved for use by each fund and certain other MFS U.S. funds. The line of credit is provided by a
syndicate of banks under a credit agreement. Borrowings may be made for temporary financing needs. Interest is charged to each fund, based on its borrowings, generally at a rate equal to the highest of 1) Daily Simple
SOFR (Secured Overnight Financing Rate) plus 0.10%, 2) the Federal Funds Effective Rate, or 3) the Overnight Bank Funding Rate, each plus an agreed upon spread. A commitment fee, based on the average daily unused
portion of the committed line of credit, is allocated among the participating funds. The line of credit expires on March 14, 2024 unless extended or renewed. In addition, each fund and other funds managed by MFS have
established unsecured uncommitted borrowing arrangements with certain banks for temporary financing needs. Interest is charged to each fund, based on its borrowings, at rates equal to customary reference rates plus an
agreed upon spread. For the six months ended September 30, 2023, each fund’s commitment fee and interest expense were as follows and are included in “Miscellaneous” expense in the Statements of
Operations:
| Mississippi Fund | New York Fund | North Carolina Fund | Pennsylvania Fund | South Carolina Fund | Virginia Fund | West Virginia Fund | |
| Commitment Fee | $219 | $559 | $1,166 | $437 | $529 | $949 | $260 |
| Interest Expense | — | — | — | — | — | — | — |
(7) Investments in
Affiliated Issuers
An affiliated issuer of a fund
may be considered one in which the fund owns 5% or more of the outstanding voting securities, or a company which is under common control. For the purposes of this report, each fund assumes the MFS Institutional Money
Market Portfolio to be an affiliated issuer. Each fund’s transactions in the MFS Institutional Money Market Portfolio for the six months ended September 30, 2023, are as follows:
| Affiliated Issuer - MFS Institutional Money Market Portfolio | ||||||
| Beginning Value | Purchases | Sales Proceeds | Realized Gain (Loss) | Change in Unrealized Appreciation or Depreciation | Ending Value | |
| Mississippi Fund | $1,072,843 | $11,423,363 | $11,208,269 | $(526) | $(313) | $1,287,098 |
| New York Fund | 4,625,535 | 22,956,171 | 26,185,190 | (1,859) | (558) | 1,394,099 |
| North Carolina Fund | 7,469,318 | 57,098,181 | 60,072,742 | (840) | (1,103) | 4,492,814 |
| Pennsylvania Fund | 3,258,731 | 20,287,377 | 21,121,773 | (821) | (125) | 2,423,389 |
| South Carolina Fund | 2,629,846 | 35,530,778 | 36,663,059 | (383) | (51) | 1,497,131 |
| Virginia Fund | 4,049,683 | 52,280,141 | 52,959,221 | 1,248 | (277) | 3,371,574 |
| West Virginia Fund | 716,373 | 12,559,439 | 12,522,943 | (172) | (61) | 752,636 |
99
Notes to Financial
Statements (unaudited) - continued
| Dividend Income | Capital Gain Distributions | |
| Mississippi Fund | $33,969 | $— |
| New York Fund | 92,080 | — |
| North Carolina Fund | 168,467 | — |
| Pennsylvania Fund | 72,703 | — |
| South Carolina Fund | 62,766 | — |
| Virginia Fund | 156,824 | — |
| West Virginia Fund | 23,904 | — |
100
Board Review of Investment
Advisory Agreement
The Investment Company Act of
1940 requires that both the full Board of Trustees and a majority of the non-interested (“independent”) Trustees, voting separately, annually approve the continuation of each Fund’s investment
advisory agreement with MFS. The Trustees consider matters bearing on the Funds and their advisory arrangements at their meetings throughout the year, including a review of performance data at each regular
meeting. In addition, the independent Trustees met several times over the course of three months beginning in May and ending in July, 2023 (“contract review meetings”) for the specific purpose of
considering whether to approve the continuation of the investment advisory agreement for the Funds and the other investment companies that the Board oversees (the “MFS Funds”). The independent
Trustees were assisted in their evaluation of the Funds’ investment advisory agreement by independent legal counsel, from whom they received separate legal advice and with whom they met separately from MFS
during various contract review meetings. The independent Trustees were also assisted in this process by an independent consultant who was retained by and reported to the independent Trustees.
In connection with their
deliberations regarding the continuation of the investment advisory agreement, the Trustees, including the independent Trustees, considered such information and factors as they believed, in light of the legal advice
furnished to them and their own business judgment, to be relevant. The investment advisory agreement for each Fund was considered separately, although the Trustees also took into account the common interests of
all MFS Funds in their review. As described below, the Trustees considered the nature, quality, and extent of the various investment advisory, administrative, and shareholder services performed by MFS under the
existing investment advisory agreement and other arrangements with the Funds.
In connection with their
contract review meetings, the Trustees received and relied upon materials that included, among other items: (i) information provided by Broadridge Financial Solutions, Inc. (“Broadridge”), an independent
third party, on the investment performance of the Funds for various time periods ended December 31, 2022 and the investment performance of a group of funds with substantially similar investment
classifications/objectives (the “Broadridge performance universe”), (ii) information provided by Broadridge on the Funds’ advisory fees and other expenses and the advisory fees and other expenses of
comparable funds identified by Broadridge as well as all other funds in the same investment classification/category (the “Broadridge expense group and universe”), (iii) information provided by MFS on the
advisory fees of portfolios of other clients of MFS, including institutional separate accounts and other clients, (iv) information as to whether and to what extent applicable expense waivers, reimbursements or fee
“breakpoints” are observed for the Funds, (v) information regarding MFS’ financial results and financial condition, including MFS’ and certain of its affiliates’ estimated profitability
from services performed for the Funds and the MFS Funds as a whole, and compared to MFS’ institutional business, (vi) MFS’ views regarding the outlook for the mutual fund industry and the strategic
business plans of MFS, (vii) descriptions of various functions performed by MFS for the Funds, such as compliance monitoring and portfolio trading practices, and (viii) information regarding the overall organization
of MFS, including information about MFS’ senior management and other personnel providing investment advisory, administrative and other services to the Funds and the other MFS Funds. The comparative
performance, fee and expense information prepared and provided by Broadridge was not independently verified and the independent Trustees did not independently verify any information provided to them by MFS.
The Trustees’ conclusion
as to the continuation of the investment advisory agreement was based on a comprehensive consideration of all information provided to the Trustees and not the result of any single factor. Some of the factors
that figured particularly in the Trustees’ deliberations are described below, although individual Trustees may have evaluated the information presented differently from one another, giving different weights to
various factors. It is also important to recognize that the fee arrangements for the Funds and other MFS Funds are the result of years of review and discussion between the independent Trustees and MFS, that
certain aspects of such arrangements may receive greater scrutiny in some years than in others, and that the Trustees’ conclusions may be based, in part, on their consideration of these same arrangements during
the course of the year and in prior years.
Based on information provided
by Broadridge and MFS, the Trustees reviewed each Fund’s total return investment performance as well as its respective Broadridge performance universe over various time periods. The Trustees placed
particular emphasis on the total return performance of each Fund’s Class I shares in comparison to the performance of funds in its respective Broadridge performance universe over the five-year period ended
December 31, 2022, which the Trustees believed was a long enough period to reflect differing market conditions. See below for a description of the performance information considered by the Trustees.
In assessing the
reasonableness of each Fund’s advisory fee, the Trustees considered, among other information, each Fund’s advisory fee and the total expense ratio of each Fund’s Class I shares as a percentage of
average daily net assets and the advisory fee and total expense ratios of the Broadridge expense groups based on information provided by Broadridge. The Trustees considered whether the Funds were subject to any
fee waivers or reductions or expense limitations. See below for a description of the fee information considered by the Trustees.
The Trustees also considered
the advisory fees charged by MFS to any institutional separate accounts advised by MFS (“separate accounts”) and unaffiliated investment companies for which MFS serves as subadviser (“subadvised
funds”) that have comparable investment strategies to each Fund, if any. In comparing these fees, the Trustees considered information provided by MFS as to the generally broader scope of services provided
by MFS to each Fund, as well as the more extensive regulatory burdens imposed on MFS in managing each Fund, in comparison to the relevant separate accounts and subadvised funds. The Trustees also considered the
higher demands placed on MFS’ investment personnel and trading infrastructure as a result of the daily cash in-flows and out-flows of each Fund in comparison to the relevant separate accounts.
101
Board Review of Investment Advisory
Agreement - continued
The Trustees also considered
whether each Fund may benefit from any economies of scale in the management of the Fund in the event of growth in assets of the Fund and/or growth in assets of the MFS Funds as a whole. They noted that each
Fund’s advisory fee rate schedule is not subject to any breakpoints. Taking into account the information noted below, the Trustees determined not to recommend any advisory fee breakpoints for the Funds at
this time. The Trustees also noted that MFS has agreed in writing to waive a portion of the management fees of certain MFS Funds, including the Funds, if the total combined assets of certain funds within the MFS
Funds’ complex increase above agreed upon thresholds (the “group fee waiver”), enabling each Fund’s shareholders to share in the benefits from any economies of scale at the complex level.
The group fee waiver is reviewed and renewed annually between the Board and MFS. The Trustees concluded that the group fee waiver was sufficient to allow each Fund to benefit from economies of scale as its
assets and overall complex assets grow.
The Trustees also considered
information prepared by MFS relating to MFS’ costs and profits with respect to each Fund, the MFS Funds considered as a group, and other investment companies and accounts advised by MFS, as well as MFS’
methodologies used to determine and allocate its costs to the MFS Funds, the Funds and other accounts and products for purposes of estimating profitability.
After reviewing these and
other factors described herein, the Trustees concluded, within the context of their overall conclusions regarding the investment advisory agreement, that the advisory fees charged to each Fund represent reasonable
compensation in light of the services being provided by MFS to the Funds.
In addition, the Trustees
considered MFS’ resources and related efforts to continue to retain, attract and motivate capable personnel to serve the Funds. The Trustees also considered current and developing conditions in the
financial services industry, including the presence of large and well-capitalized companies which are spending, and appear to be prepared to continue to spend, substantial sums to engage personnel and to provide
services to competing investment companies. In this regard, the Trustees also considered the financial resources of MFS and its ultimate parent, Sun Life Financial Inc. The Trustees also considered the
advantages and possible disadvantages to the Funds of having an adviser that also serves other investment companies as well as other accounts.
The Trustees also considered
the nature, quality, cost, and extent of administrative, transfer agency, and distribution services provided to the Funds by MFS and its affiliates under agreements and plans other than the investment advisory
agreement, including any 12b-1 fees the Funds pay to MFS Fund Distributors, Inc., an affiliate of MFS. The Trustees also considered the nature, extent and quality of certain other services MFS performs or
arranges for on the Funds’ behalf, which may include securities lending programs, directed expense payment programs, class action recovery programs, and MFS’ interaction with third-party service providers,
principally custodians and sub-custodians. The Trustees concluded that the various non-advisory services provided by MFS and its affiliates on behalf of the Funds were satisfactory.
The Trustees considered
so-called “fall-out benefits” to MFS such as reputational value derived from serving as investment manager to the MFS Funds. The Trustees also considered that MFS discontinued its historic practice
of obtaining investment research from portfolio brokerage commissions paid by certain MFS Funds effective January 2018, and directly pays or voluntarily reimburses a Fund, if applicable, for the costs of external
research acquired through the use of the Fund’s portfolio brokerage commissions.
Based on their evaluation of
factors that they deemed to be material, including those factors described above, the Board of Trustees, including the independent Trustees, concluded that each Fund’s investment advisory agreement with MFS
should be continued for an additional one-year period, commencing August 1, 2023.
MFS Mississippi Municipal Bond
Fund
The total return performance
of the Fund’s Class I shares was in the 2nd quintile relative to the funds in its Broadridge performance universe for each of the one-, three-, and five-year periods ended December 31, 2022
(the 1st quintile being the best performers and the 5th quintile being the worst performers). Because of the passage of time, these performance results may differ from the performance results for
more recent periods, including those shown elsewhere in this report.
In the course of their
deliberations, the Trustees took into account information provided by MFS in connection with the contract review meetings, as well as during investment review meetings conducted with portfolio management personnel
during the course of the year regarding the Fund’s performance. After reviewing these and related factors, the Trustees concluded, within the context of their overall conclusions regarding the investment
advisory agreement, that they were satisfied with MFS’ responses and efforts relating to investment performance.
In assessing the
reasonableness of the Fund’s advisory fee, the Trustees considered that, according to the data provided by Broadridge (which takes into account any fee reductions or expense limitations that were in effect
during the Fund’s last fiscal year), the Fund’s effective advisory fee rate was approximately at the Broadridge expense group median and the Fund’s total expense ratio was higher than the Broadridge
expense group median.
MFS New York Municipal Bond
Fund
The total return performance
of the Fund’s Class I shares was in the 3rd quintile relative to the funds in its Broadridge performance universe for each of the one-, three-, and five-year periods ended December 31, 2022
(the 1st quintile being the best performers and the 5th quintile being the worst performers). Because of the passage of time, these performance results may differ from the performance results for
more recent periods, including those shown elsewhere in this report.
102
Board Review of Investment Advisory
Agreement - continued
In the course of their
deliberations, the Trustees took into account information provided by MFS in connection with the contract review meetings, as well as during investment review meetings conducted with portfolio management personnel
during the course of the year regarding the Fund’s performance. After reviewing these and related factors, the Trustees concluded, within the context of their overall conclusions regarding the investment
advisory agreement, that they were satisfied with MFS’ responses and efforts relating to investment performance.
In assessing the
reasonableness of the Fund’s advisory fee, the Trustees considered that MFS currently observes an expense limitation for the Fund, which may not be changed without the Trustees’ approval. The
Trustees also considered that, according to the data provided by Broadridge (which takes into account any fee reductions or expense limitations that were in effect during the Fund’s last fiscal year), the
Fund’s effective advisory fee rate and total expense ratio were each approximately at the Broadridge expense group median.
MFS North Carolina Municipal
Bond Fund
The total return performance
of the Fund’s Class I shares was in the 1st quintile relative to the funds in its Broadridge performance universe for the five-year period ended December 31, 2022 (the 1st quintile being the best performers and the 5th quintile being the worst performers). The total return performance of the Fund’s Class I shares was in the 1st quintile for the one-year period and the 2nd quintile for the three-year period ended December 31, 2022 relative to the other funds in the universe. Because of the passage of time, these
performance results may differ from the performance results for more recent periods, including those shown elsewhere in this report.
In the course of their
deliberations, the Trustees took into account information provided by MFS in connection with the contract review meetings, as well as during investment review meetings conducted with portfolio management personnel
during the course of the year regarding the Fund’s performance. After reviewing these and related factors, the Trustees concluded, within the context of their overall conclusions regarding the investment
advisory agreement, that they were satisfied with MFS’ responses and efforts relating to investment performance.
In assessing the
reasonableness of the Fund’s advisory fee, the Trustees considered that MFS currently observes an expense limitation for the Fund, which may not be changed without the Trustees’ approval. The
Trustees also considered that, according to the data provided by Broadridge (which takes into account any fee reductions or expense limitations that were in effect during the Fund’s last fiscal year), the
Fund’s effective advisory fee rate and total expense ratio were each approximately at the Broadridge expense group median.
MFS Pennsylvania Municipal Bond
Fund
The total return performance
of the Fund’s Class I shares was in the 1st quintile relative to the funds in its Broadridge performance universe for the five-year period ended December 31, 2022 (the 1st quintile being the best performers and the 5th quintile being the worst performers). The total return performance of the Fund’s Class I shares was in the 2nd quintile relative to the other funds in the universe for each of the one- and three-year periods ended December 31, 2022. Because of the
passage of time, these performance results may differ from the performance results for more recent periods, including those shown elsewhere in this report.
In the course of their
deliberations, the Trustees took into account information provided by MFS in connection with the contract review meetings, as well as during investment review meetings conducted with portfolio management personnel
during the course of the year regarding the Fund’s performance. After reviewing these and related factors, the Trustees concluded, within the context of their overall conclusions regarding the investment
advisory agreement, that they were satisfied with MFS’ responses and efforts relating to investment performance.
In assessing the
reasonableness of the Fund’s advisory fee, the Trustees considered that MFS currently observes an expense limitation for the Fund, which may not be changed without the Trustees’ approval. The
Trustees also considered that, according to the data provided by Broadridge (which takes into account any fee reductions or expense limitations that were in effect during the Fund’s last fiscal year), the
Fund’s effective advisory fee rate and total expense ratio were each approximately at the Broadridge expense group median.
MFS South Carolina Municipal
Bond Fund
The total return performance
of the Fund’s Class I shares was in the 2nd quintile relative to the funds in its Broadridge performance universe for the five-year period ended December 31, 2022 (the 1st quintile being the best performers and the 5th quintile being the worst performers). The total return performance of the Fund’s Class I shares was in the 2nd quintile for the one-year period and the 3rd quintile for the three-year period ended December 31, 2022 relative to the other funds in the universe. Because of the passage of time, these
performance results may differ from the performance results for more recent periods, including those shown elsewhere in this report.
In the course of their
deliberations, the Trustees took into account information provided by MFS in connection with the contract review meetings, as well as during investment review meetings conducted with portfolio management personnel
during the course of the year regarding the Fund’s performance. After reviewing these and related factors, the Trustees concluded, within the context of their overall conclusions regarding the investment
advisory agreement, that they were satisfied with MFS’ responses and efforts relating to investment performance.
103
Board Review of Investment Advisory
Agreement - continued
In assessing the
reasonableness of the Fund’s advisory fee, the Trustees considered that MFS currently observes an expense limitation for the Fund, which may not be changed without the Trustees’ approval. The
Trustees also considered that, according to the data provided by Broadridge (which takes into account any fee reductions or expense limitations that were in effect during the Fund’s last fiscal year), the
Fund’s effective advisory fee rate and total expense ratio were each approximately at the Broadridge expense group median.
MFS Virginia Municipal Bond
Fund
The total return performance
of the Fund’s Class I shares was in the 1st quintile relative to the funds in its Broadridge performance universe for each of the one-, three-, and five-year periods ended December 31, 2022
(the 1st quintile being the best performers and the 5th quintile being the worst performers). Because of the passage of time, these performance results may differ from the performance results for
more recent periods, including those shown elsewhere in this report.
In the course of their
deliberations, the Trustees took into account information provided by MFS in connection with the contract review meetings, as well as during investment review meetings conducted with portfolio management personnel
during the course of the year regarding the Fund’s performance. After reviewing these and related factors, the Trustees concluded, within the context of their overall conclusions regarding the investment
advisory agreement, that they were satisfied with MFS’ responses and efforts relating to investment performance.
In assessing the
reasonableness of the Fund’s advisory fee, the Trustees considered that MFS currently observes an expense limitation for the Fund, which may not be changed without the Trustees’ approval. The
Trustees also considered that, according to the data provided by Broadridge (which takes into account any fee reductions or expense limitations that were in effect during the Fund’s last fiscal year), the
Fund’s effective advisory fee rate and total expense ratio were each approximately at the Broadridge expense group median.
MFS West Virginia Municipal Bond
Fund
The total return performance
of the Fund’s Class I shares was in the 1st quintile relative to the funds in its Broadridge performance universe for each of the one-, three-, and five-year periods ended December 31, 2022
(the 1st quintile being the best performers and the 5th quintile being the worst performers). Because of the passage of time, these performance results may differ from the performance results for
more recent periods, including those shown elsewhere in this report.
In the course of their
deliberations, the Trustees took into account information provided by MFS in connection with the contract review meetings, as well as during investment review meetings conducted with portfolio management personnel
during the course of the year regarding the Fund’s performance. After reviewing these and related factors, the Trustees concluded, within the context of their overall conclusions regarding the investment
advisory agreement, that they were satisfied with MFS’ responses and efforts relating to investment performance.
In assessing the
reasonableness of the Fund’s advisory fee, the Trustees considered that MFS currently observes an expense limitation for the Fund, which may not be changed without the Trustees’ approval. The
Trustees also considered that, according to the data provided by Broadridge (which takes into account any fee reductions or expense limitations that were in effect during the Fund’s last fiscal year), the
Fund’s effective advisory fee rate and total expense ratio were each approximately at the Broadridge expense group median.
104
Proxy Voting Policies and
Information
MFS votes proxies on behalf of
the funds pursuant to proxy voting policies and procedures that are available without charge, upon request, by calling 1-800-225-2606, by visiting mfs.com/proxyvoting, or by visiting the SEC’s Web site at http://www.sec.gov.
Information regarding how each
fund voted proxies relating to portfolio securities during the most recent twelve-month period ended June 30 is available by August 31 of each year without charge by visiting mfs.com/proxyvoting, or by visiting the SEC’s Web site at http://www.sec.gov.
Quarterly Portfolio
Disclosure
Each fund files a complete
schedule of portfolio holdings with the SEC for the first and third quarters of each fiscal year as an exhibit to its reports on Form N-PORT. Each fund's Form N-PORT reports are available on the SEC's Web site at
http://www.sec.gov. A shareholder can obtain the portfolio holdings report for the first and third quarters of each fund's fiscal year at mfs.com/openendfunds by choosing the fund's name and then scrolling to the “Resources” section and clicking on the “Prospectus and Reports” tab.
Further Information
From time to time, MFS may post
important information about each fund or the MFS Funds on the MFS Web site (mfs.com). This information is available at https://www.mfs.com/announcements or at mfs.com/openendfunds by choosing each fund’s name and then scrolling to the “Resources” section and clicking on the “Announcements” tab, if any.
Information About Fund
Contracts and Legal Claims
Each fund has entered into
contractual arrangements with an investment adviser, administrator, distributor, shareholder servicing agent, and custodian who each provide services to the fund. Unless expressly stated otherwise, shareholders are
not parties to, or intended beneficiaries of these contractual arrangements, and these contractual arrangements are not intended to create any shareholder right to enforce them against the service providers or to seek
any remedy under them against the service providers, either directly or on behalf of the fund.
Under the Trust’s By-Laws
and Declaration of Trust, any claims asserted against or on behalf of the MFS Funds, including claims against Trustees and Officers, must be brought in state and federal courts located within the Commonwealth of
Massachusetts.
Provision of Financial
Reports and Summary Prospectuses
Each fund produces financial
reports every six months and updates its summary prospectus and prospectus annually. To avoid sending duplicate copies of materials to households, only one copy of each fund’s annual and semiannual report and
summary prospectus may be mailed to shareholders having the same last name and residential address on the fund’s records. However, any shareholder may contact MFSC (please see back cover for address and
telephone number) to request that copies of these reports and summary prospectuses be sent personally to that shareholder.
106


Semiannual Report
September 30, 2023
MFS® Municipal Income Fund

LMB-SEM
MFS® Municipal Income Fund
CONTENTS
| 1 | |
| 3 | |
| 5 | |
| 117 | |
| 119 | |
| 120 | |
| 121 | |
| 128 | |
| 141 | |
| 145 | |
| 145 | |
| 145 | |
| 145 | |
| 145 |
| back cover |
The report is prepared for the
general information of shareholders. It is authorized for distribution to prospective investors only when preceded or accompanied by a current prospectus.
NOT FDIC INSURED
• MAY LOSE VALUE • NO BANK GUARANTEE
Portfolio Composition
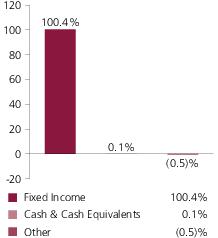
| (a) | For all securities other than those specifically described below, ratings are assigned to underlying securities utilizing ratings from Moody’s, Fitch, and Standard & Poor’s rating agencies and applying the following hierarchy: If all three agencies provide a rating, the middle rating (after dropping the highest and lowest ratings) is assigned; if two of the three agencies rate a security, the lower of the two is assigned. If none of the 3 rating agencies above assign a rating, but the security is rated by DBRS Morningstar, then the DBRS Morningstar rating is assigned. If none of the 4 rating agencies listed above rate the security, but the security is rated by the Kroll Bond Rating Agency (KBRA), then the KBRA rating is assigned. Ratings are shown in the S&P and Fitch scale (e.g., AAA). Securities rated BBB or higher are considered investment grade. All ratings are subject to change. Not Rated includes fixed income securities and fixed income derivatives that have not been rated by any rating agency. The fund may or may not have held all of these instruments on this date. The fund is not rated by these agencies. |
1
Portfolio Composition - continued
| (d) | Duration is a measure of how much a bond’s price is likely to fluctuate with general changes in interest rates, e.g., if rates rise 1.00%, a bond with a 5-year duration is likely to lose about 5.00% of its value due to the interest rate move. The Average Duration calculation reflects the impact of the equivalent exposure of derivative positions, if any. |
| (i) | For purposes of this presentation, the components include the value of securities, and reflect the impact of the equivalent exposure of derivative positions, if any. These amounts may be negative from time to time. Equivalent exposure is a calculated amount that translates the derivative position into a reasonable approximation of the amount of the underlying asset that the portfolio would have to hold at a given point in time to have the same price sensitivity that results from the portfolio’s ownership of the derivative contract. When dealing with derivatives, equivalent exposure is a more representative measure of the potential impact of a position on portfolio performance than value. The bond component will include any accrued interest amounts. |
| (m) | In determining each instrument’s effective maturity for purposes of calculating the fund’s dollar-weighted average effective maturity, MFS uses the instrument’s stated maturity or, if applicable, an earlier date on which MFS believes it is probable that a maturity-shortening feature (such as a put, pre-refunding or prepayment) will cause the instrument to be repaid. Such an earlier date can be substantially shorter than the instrument’s stated maturity. |
| (o) | Less than 0.1%. |
Cash & Cash Equivalents includes
any cash, investments in money market funds, short-term securities, and other assets less liabilities. Please see the Statement of Assets and Liabilities for additional information related to the fund’s cash
position and other assets and liabilities.
Other includes equivalent exposure
from currency derivatives and/or any offsets to derivative positions and/or the leverage created through the issuance of self-deposited inverse floaters and may be negative.
Percentages are based on net assets
as of September 30, 2023.
The portfolio is actively managed
and current holdings may be different.
2
Expense Table
Fund expenses borne by the
shareholders during the period,
April 1, 2023 through September 30, 2023
April 1, 2023 through September 30, 2023
As a shareholder of the fund, you
incur two types of costs: (1) transaction costs, including sales charges (loads) on certain purchase or redemption payments, and (2) ongoing costs, including management fees; distribution and service (12b-1) fees; and
other fund expenses. This example is intended to help you understand your ongoing costs (in dollars) of investing in the fund and to compare these costs with the ongoing costs of investing in other mutual funds.
The example is based on an
investment of $1,000 invested at the beginning of the period and held for the entire period April 1, 2023 through September 30, 2023.
Actual Expenses
The first line for each share class
in the following table provides information about actual account values and actual expenses. You may use the information in this line, together with the amount you invested, to estimate the expenses that you paid over
the period. Simply divide your account value by $1,000 (for example, an $8,600 account value divided by $1,000 = 8.6), then multiply the result by the number in the first line under the heading entitled
“Expenses Paid During Period” to estimate the expenses you paid on your account during this period.
Hypothetical Example for
Comparison Purposes
The second line for each share class
in the following table provides information about hypothetical account values and hypothetical expenses based on the fund’s actual expense ratio and an assumed rate of return of 5% per year before expenses,
which is not the fund’s actual return. The hypothetical account values and expenses may not be used to estimate the actual ending account balance or expenses you paid for the period. You may use this information
to compare the ongoing costs of investing in the fund and other funds. To do so, compare this 5% hypothetical example with the 5% hypothetical examples that appear in the shareholder reports of the other funds.
Please note that the expenses shown
in the table are meant to highlight your ongoing costs only and do not reflect any transactional costs, such as sales charges (loads). Therefore, the second line for each share class in the table is useful in
comparing ongoing costs only, and will not help you determine the relative total costs of owning different funds. In addition, if these transactional costs were included, your costs would have been higher.
3
Expense Table - continued
| Share Class | Annualized Expense Ratio | Beginning Account Value 4/01/23 | Ending Account Value 9/30/23 | Expenses Paid During Period (p) 4/01/23-9/30/23 | |
| A | Actual | 0.74% | $1,000.00 | $957.94 | $3.62 |
| Hypothetical (h) | 0.74% | $1,000.00 | $1,021.30 | $3.74 | |
| B | Actual | 1.50% | $1,000.00 | $954.43 | $7.33 |
| Hypothetical (h) | 1.50% | $1,000.00 | $1,017.50 | $7.57 | |
| C | Actual | 1.50% | $1,000.00 | $954.57 | $7.33 |
| Hypothetical (h) | 1.50% | $1,000.00 | $1,017.50 | $7.57 | |
| I | Actual | 0.49% | $1,000.00 | $960.31 | $2.40 |
| Hypothetical (h) | 0.49% | $1,000.00 | $1,022.55 | $2.48 | |
| R6 | Actual | 0.43% | $1,000.00 | $959.38 | $2.11 |
| Hypothetical (h) | 0.43% | $1,000.00 | $1,022.85 | $2.17 | |
| A1 | Actual | 0.49% | $1,000.00 | $960.41 | $2.40 |
| Hypothetical (h) | 0.49% | $1,000.00 | $1,022.55 | $2.48 | |
| B1 | Actual | 1.25% | $1,000.00 | $956.87 | $6.12 |
| Hypothetical (h) | 1.25% | $1,000.00 | $1,018.75 | $6.31 |
| (h) | 5% class return per year before expenses. |
| (p) | “Expenses Paid During Period” are equal to each class’s annualized expense ratio, as shown above, multiplied by the average account value over the period, multiplied by 183/366 (to reflect the one-half year period). Expenses paid do not include any applicable sales charges (loads). If these transaction costs had been included, your costs would have been higher. |
Notes to Expense Table
Expense ratios include 0.03% of
investment related expenses from self-deposited inverse floaters (see Note 2 of the Notes to Financial Statements) that are outside of the expense limitation arrangement (See Note 3 of the Notes to Financial
Statements).
4
Portfolio of Investments
9/30/23 (unaudited)
The Portfolio of Investments is a
complete list of all securities owned by your fund. It is categorized by jurisdiction.
| Issuer | Shares/Par | Value ($) | ||
| Municipal Bonds - 97.6% | ||||
| Alabama - 2.9% | ||||
| Alabama DCH Health Care Authority, Health Care Facilities Rev., 5%, 6/01/2033 | $ | 620,000 | $622,446 | |
| Alabama Southeast Energy Authority Commodity Supply Rev. (Project No.6), 5%, 1/01/2054 (Put Date 6/01/2030) | 6,875,000 | 6,944,350 | ||
| Alabama Stadium Trace Village Improvement District Development Incentive Anticipation, 3.625%, 3/01/2036 | 1,315,000 | 1,011,344 | ||
| Birmingham, AL, Airport Authority Rev., BAM, 4%, 7/01/2035 | 240,000 | 234,574 | ||
| Birmingham, AL, Airport Authority Rev., BAM, 4%, 7/01/2038 | 1,245,000 | 1,172,925 | ||
| Birmingham, AL, Special Care Facilities Financing Authority Rev. (Methodist Home for the Aging), 5.25%, 6/01/2025 | 285,000 | 279,231 | ||
| Black Belt Energy Gas District, AL, Gas Prepay Rev., “A-1”, 4%, 12/01/2049 (Put Date 12/01/2025) | 4,825,000 | 4,736,885 | ||
| Black Belt Energy Gas District, AL, Gas Prepay Rev., “B-1”, FLR, 4.548% (67% of (SOFR - 1mo. + 0.11448%) + 0.9%), 12/01/2048 (Put Date 12/01/2023) | 15,870,000 | 15,867,548 | ||
| Black Belt Energy Gas District, AL, Gas Project Rev., “A”, 4%, 6/01/2051 (Put Date 12/01/2031) | 12,920,000 | 12,181,968 | ||
| Black Belt Energy Gas District, AL, Gas Project Rev., “F”, 5.5%, 11/01/2053 (Put Date 12/01/2028) | 6,810,000 | 6,956,177 | ||
| Black Belt Energy Gas District, AL, Gas Supply Rev., “B”, 5.25%, 12/01/2053 (Put Date 12/01/2030) | 4,500,000 | 4,615,709 | ||
| Jacksonville, AL, Public Educational Building Authority Higher Education Facilities Rev. (Jacksonville State University Foundation), “A”, AGM, 5.25%, 8/01/2053 | 2,235,000 | 2,276,930 | ||
| Jacksonville, AL, Public Educational Building Authority Higher Education Facilities Rev. (Jacksonville State University Foundation), “A”, AGM, 5.5%, 8/01/2058 | 1,885,000 | 1,942,176 | ||
| Jefferson County, AL, Cooper Green Mercy Health Services Authority Rev., “A”, 5.25%, 9/01/2052 | 9,730,000 | 9,692,218 | ||
| Jefferson County, AL, Sewer Rev. Warrants, Capital Appreciation, Senior Lien, “B”, AGM, 0%, 10/01/2026 | 925,000 | 775,972 | ||
| Jefferson County, AL, Sewer Rev. Warrants, Capital Appreciation, Senior Lien, “B”, AGM, 0%, 10/01/2029 | 1,305,000 | 930,442 | ||
| Jefferson County, AL, Sewer Rev. Warrants, Capital Appreciation, Senior Lien, “B”, AGM, 0%, 10/01/2034 | 1,865,000 | 942,434 | ||
| Jefferson County, AL, Sewer Rev. Warrants, Capital Appreciation, Senior Lien, “B”, AGM, 0%, 10/01/2035 | 3,535,000 | 1,637,538 | ||
| Jefferson County, AL, Sewer Rev. Warrants, Subordinate Lien, “D”, 5%, 10/01/2023 | 360,000 | 360,000 | ||
5
Portfolio of Investments (unaudited)
– continued
| Issuer | Shares/Par | Value ($) | ||
| Municipal Bonds - continued | ||||
| Alabama - continued | ||||
| Southeast Alabama Energy Authority Commodity Supply Rev. (Project No. 2), “A”, 4%, 12/01/2051 (Put Date 12/01/2031) | $ | 9,535,000 | $8,868,366 | |
| Southeast Alabama Energy Authority Commodity Supply Rev. (Project No. 3), “A-1”, 5.5%, 1/01/2053 (Put Date 12/01/2029) | 5,485,000 | 5,628,719 | ||
| Southeast Alabama Energy Authority Commodity Supply Rev. (Project No. 4), “B-1”, 5%, 5/01/2053 (Put Date 8/01/2028) | 10,165,000 | 10,152,868 | ||
| Southeast Alabama Energy Authority Commodity Supply Rev. (Project No. 5), “A”, 5.25%, 1/01/2054 (Put Date 7/01/2029) | 18,165,000 | 18,282,885 | ||
| Southeast Alabama Gas Supply District Rev. (Project No. 1), “A”, 4%, 4/01/2049 (Put Date 4/01/2024) | 11,470,000 | 11,423,512 | ||
| University of North Alabama, General Fee Rev., “B”, BAM, 5%, 11/01/2038 | 1,185,000 | 1,222,354 | ||
| University of North Alabama, General Fee Rev., “B”, BAM, 5%, 11/01/2039 | 490,000 | 504,268 | ||
| University of South Alabama, Facilities Rev., “A”, BAM, 5%, 4/01/2044 | 3,205,000 | 3,219,925 | ||
| University of South Alabama, Facilities Rev., “A”, BAM, 5%, 4/01/2049 | 1,955,000 | 1,940,896 | ||
| $134,424,660 | ||||
| Alaska - 0.1% | ||||
| Alaska Municipal Bond Bank, General Obligation, “2”, 5.25%, 12/01/2047 | $ | 1,580,000 | $1,557,484 | |
| Alaska Municipal Bond Bank, General Obligation, “2”, 5.25%, 12/01/2052 | 1,975,000 | 1,920,697 | ||
| $3,478,181 | ||||
| Arizona - 2.1% | ||||
| Arizona Board of Regents, Arizona State University System Rev., “B”, 4%, 7/01/2053 | $ | 10,795,000 | $9,228,770 | |
| Arizona Industrial Development Authority Education Rev. (Academies of Math & Science Projects), 5.25%, 7/01/2043 | 120,000 | 113,231 | ||
| Arizona Industrial Development Authority Education Rev. (Academies of Math & Science Projects), 5.375%, 7/01/2053 | 440,000 | 404,869 | ||
| Arizona Industrial Development Authority Education Rev. (Academies of Math & Science Projects), 5.5%, 7/01/2058 | 415,000 | 384,242 | ||
| Arizona Industrial Development Authority Education Rev. (Academies of Math & Science Projects), “A”, 5%, 7/01/2052 | 975,000 | 907,984 | ||
| Arizona Industrial Development Authority Education Rev. (Basis Schools Projects), “A”, 5.125%, 7/01/2037 (n) | 790,000 | 757,209 | ||
| Arizona Industrial Development Authority Education Rev. (Basis Schools Projects), “A”, 5.25%, 7/01/2047 (n) | 590,000 | 534,312 | ||
| Arizona Industrial Development Authority Education Rev. (Basis Schools Projects), “D”, 5%, 7/01/2037 (n) | 95,000 | 89,926 | ||
6
Portfolio of Investments (unaudited)
– continued
| Issuer | Shares/Par | Value ($) | ||
| Municipal Bonds - continued | ||||
| Arizona - continued | ||||
| Arizona Industrial Development Authority Education Rev. (Basis Schools Projects), “D”, 5%, 7/01/2047 (n) | $ | 130,000 | $113,644 | |
| Arizona Industrial Development Authority Education Rev. (Basis Schools Projects), “D”, 5%, 7/01/2051 (n) | 335,000 | 287,155 | ||
| Arizona Industrial Development Authority Education Rev. (Basis Schools Projects), “F”, 5%, 7/01/2037 | 790,000 | 795,497 | ||
| Arizona Industrial Development Authority Education Rev. (Basis Schools Projects), “F”, 5%, 7/01/2047 | 1,850,000 | 1,784,664 | ||
| Arizona Industrial Development Authority Education Rev. (Basis Schools Projects), “F”, 5%, 7/01/2052 | 1,475,000 | 1,402,257 | ||
| Arizona Industrial Development Authority Education Rev. (Basis Schools Projects), “G”, 5%, 7/01/2037 (n) | 130,000 | 123,057 | ||
| Arizona Industrial Development Authority Education Rev. (Basis Schools Projects), “G”, 5%, 7/01/2047 (n) | 130,000 | 113,644 | ||
| Arizona Industrial Development Authority Education Rev. (Basis Schools Projects), “G”, 5%, 7/01/2051 (n) | 245,000 | 210,009 | ||
| Arizona Industrial Development Authority Education Rev. (Benjamin Franklin Charter School Projects), “A”, 5.25%, 7/01/2053 | 440,000 | 387,275 | ||
| Arizona Industrial Development Authority Education Rev. (Benjamin Franklin Charter School Projects), “A”, 5.5%, 7/01/2058 | 440,000 | 392,244 | ||
| Arizona Industrial Development Authority Education Rev. (KIPP Nashville Projects), “A”, 5%, 7/01/2047 | 300,000 | 277,172 | ||
| Arizona Industrial Development Authority Education Rev. (KIPP Nashville Projects), “A”, 5%, 7/01/2057 | 385,000 | 344,440 | ||
| Arizona Industrial Development Authority Education Rev. (KIPP Nashville Projects), “A”, 5%, 7/01/2062 | 535,000 | 472,444 | ||
| Arizona Industrial Development Authority National Charter School Revolving Loan Fund Rev., “A”, 4%, 11/01/2036 | 870,000 | 804,463 | ||
| Arizona Industrial Development Authority National Charter School Revolving Loan Fund Rev., “A”, 4%, 11/01/2038 | 475,000 | 425,920 | ||
| Arizona Industrial Development Authority National Charter School Revolving Loan Fund Rev., “A”, 4%, 11/01/2039 | 590,000 | 522,975 | ||
| Arizona Industrial Development Authority National Charter School Revolving Loan Fund Rev., “A”, 4%, 11/01/2040 | 630,000 | 552,093 | ||
| Arizona Industrial Development Authority National Charter School Revolving Loan Fund Rev., “A”, 4%, 11/01/2051 | 1,965,000 | 1,558,764 | ||
| Arizona Industrial Development Authority National Charter School Revolving Loan Fund Rev., “A”, 4.25%, 11/01/2052 | 2,760,000 | 2,277,042 | ||
| Glendale, AZ, Industrial Development Authority, Graduate & Professional Student Loan Program Rev. (Midwestern University Foundation), “A”, 2.125%, 7/01/2033 | 1,015,000 | 761,868 | ||
7
Portfolio of Investments (unaudited)
– continued
| Issuer | Shares/Par | Value ($) | ||
| Municipal Bonds - continued | ||||
| Arizona - continued | ||||
| Glendale, AZ, Industrial Development Authority, Graduate & Professional Student Loan Program Rev. (Midwestern University Foundation), “A”, 3%, 7/01/2035 | $ | 1,550,000 | $1,325,091 | |
| Glendale, AZ, Industrial Development Authority, Senior Living Rev. (Sun Health Services), “A”, 5%, 11/15/2042 | 2,360,000 | 2,157,831 | ||
| Glendale, AZ, Industrial Development Authority, Senior Living Rev. (Sun Health Services), “A”, 5%, 11/15/2048 | 3,150,000 | 2,776,034 | ||
| La Paz County, AZ, Industrial Development Authority Education Facility Lease Rev. (Charter School Solutions - Harmony Public Schools Project), “A”, 5%, 2/15/2038 | 535,000 | 505,463 | ||
| La Paz County, AZ, Industrial Development Authority Education Facility Lease Rev. (Charter School Solutions - Harmony Public Schools Project), “A”, 5%, 2/15/2048 | 465,000 | 408,362 | ||
| Maricopa County, AZ, Higley Unified School District No. 60, Certificates of Participation, AGM, 4.25%, 6/01/2047 | 655,000 | 579,257 | ||
| Maricopa County, AZ, Higley Unified School District No. 60, Certificates of Participation, AGM, 5%, 6/01/2053 | 4,375,000 | 4,422,728 | ||
| Maricopa County, AZ, Industrial Development Authority Education Rev. (Legacy Traditional Schools Projects), “A”, 4%, 7/01/2034 | 135,000 | 128,325 | ||
| Maricopa County, AZ, Industrial Development Authority Education Rev. (Legacy Traditional Schools Projects), “A”, 5%, 7/01/2039 | 235,000 | 234,992 | ||
| Maricopa County, AZ, Industrial Development Authority Education Rev. (Legacy Traditional Schools Projects), “A”, 5%, 7/01/2039 (n) | 680,000 | 630,901 | ||
| Maricopa County, AZ, Industrial Development Authority Education Rev. (Legacy Traditional Schools Projects), “A”, 5%, 7/01/2049 (n) | 430,000 | 409,161 | ||
| Maricopa County, AZ, Industrial Development Authority Education Rev. (Legacy Traditional Schools Projects), “A”, 5%, 7/01/2049 (n) | 365,000 | 317,142 | ||
| Maricopa County, AZ, Industrial Development Authority Education Rev. (Legacy Traditional Schools Projects), “A”, 5%, 7/01/2054 | 545,000 | 512,701 | ||
| Maricopa County, AZ, Industrial Development Authority Education Rev. (Legacy Traditional Schools Projects), “A”, 5%, 7/01/2054 (n) | 1,615,000 | 1,377,427 | ||
| Maricopa County, AZ, Industrial Development Authority Rev. (Banner Health), “A”, 5%, 1/01/2038 | 2,360,000 | 2,391,660 | ||
| Maricopa County, AZ, Pollution Control Corp. Rev. (Public Service Company of New Mexico Palo Verde Project), “B”, 0.875%, 6/01/2043 (Put Date 10/01/2026) | 625,000 | 545,028 | ||
| Phoenix, AZ, Civic Improvement Corp. Rental Car Facility Charge Rev., “A”, 5%, 7/01/2037 | 5,115,000 | 5,263,671 | ||
| Phoenix, AZ, Civic Improvement Corp. Rental Car Facility Charge Rev., “A”, 5%, 7/01/2045 | 7,865,000 | 7,889,310 | ||
| Phoenix, AZ, Industrial Development Authority, Education Facility Rev. (Basis Schools Projects), “A”, 5%, 7/01/2035 (n) | 370,000 | 360,669 | ||
8
Portfolio of Investments (unaudited)
– continued
| Issuer | Shares/Par | Value ($) | ||
| Municipal Bonds - continued | ||||
| Arizona - continued | ||||
| Phoenix, AZ, Industrial Development Authority, Education Facility Rev. (Basis Schools Projects), “A”, 5%, 7/01/2035 (n) | $ | 115,000 | $112,100 | |
| Phoenix, AZ, Industrial Development Authority, Education Facility Rev. (Basis Schools Projects), “A”, 5%, 7/01/2045 (n) | 450,000 | 398,188 | ||
| Phoenix, AZ, Industrial Development Authority, Education Facility Rev. (Basis Schools Projects), “A”, 5%, 7/01/2046 (n) | 270,000 | 237,312 | ||
| Phoenix, AZ, Industrial Development Authority, Education Facility Rev. (Great Hearts Academies Project), “A”, 5%, 7/01/2036 | 555,000 | 533,966 | ||
| Phoenix, AZ, Industrial Development Authority, Education Facility Rev. (Great Hearts Academies Project), “A”, 5%, 7/01/2041 | 445,000 | 407,103 | ||
| Phoenix, AZ, Industrial Development Authority, Education Facility Rev. (Great Hearts Academies Project), “A”, 5%, 7/01/2046 | 705,000 | 621,343 | ||
| Phoenix, AZ, Industrial Development Authority, Education Facility Rev. (Legacy Traditional Schools Project), 5%, 7/01/2035 (n) | 665,000 | 649,371 | ||
| Phoenix, AZ, Industrial Development Authority, Education Facility Rev. (Legacy Traditional Schools Project), 5%, 7/01/2045 (n) | 730,000 | 649,209 | ||
| Phoenix, AZ, Industrial Development Authority, Education Facility Rev. (Legacy Traditional Schools Project), 5%, 7/01/2046 (n) | 480,000 | 423,515 | ||
| Phoenix, AZ, Industrial Development Authority, Hotel Rev. (Provident Group - Falcon Properties LLC, Project), “A”, 4%, 12/01/2041 (n) | 1,885,000 | 1,424,401 | ||
| Phoenix, AZ, Industrial Development Authority, Hotel Rev. (Provident Group - Falcon Properties LLC, Project), “A”, 4%, 12/01/2051 (n) | 6,255,000 | 4,279,079 | ||
| Phoenix, AZ, Industrial Development Authority, Hotel Rev. (Provident Group - Falcon Properties LLC, Project), “A”, 4.15%, 12/01/2057 (n) | 2,355,000 | 1,571,926 | ||
| Phoenix, AZ, Industrial Development Authority, Hotel Rev. (Provident Group - Falcon Properties LLC, Project), “B”, 5.75%, 12/15/2057 (n) | 2,750,000 | 1,976,669 | ||
| Phoenix, AZ, Industrial Development Authority, Student Housing Refunding Rev. (Downtown Phoenix Student Housing II LLC - Arizona State University Project), “A”, 5%, 7/01/2044 | 335,000 | 319,177 | ||
| Phoenix, AZ, Industrial Development Authority, Student Housing Refunding Rev. (Downtown Phoenix Student Housing II LLC - Arizona State University Project), “A”, 5%, 7/01/2049 | 815,000 | 759,169 | ||
| Phoenix, AZ, Industrial Development Authority, Student Housing Refunding Rev. (Downtown Phoenix Student Housing II LLC - Arizona State University Project), “A”, 5%, 7/01/2059 | 665,000 | 603,587 | ||
| Phoenix, AZ, Industrial Development Authority, Student Housing Refunding Rev. (Downtown Phoenix Student Housing LLC - Arizona State University Project), “A”, 5%, 7/01/2030 | 120,000 | 122,273 | ||
9
Portfolio of Investments (unaudited)
– continued
| Issuer | Shares/Par | Value ($) | ||
| Municipal Bonds - continued | ||||
| Arizona - continued | ||||
| Phoenix, AZ, Industrial Development Authority, Student Housing Refunding Rev. (Downtown Phoenix Student Housing LLC - Arizona State University Project), “A”, 5%, 7/01/2031 | $ | 420,000 | $427,417 | |
| Phoenix, AZ, Industrial Development Authority, Student Housing Refunding Rev. (Downtown Phoenix Student Housing LLC - Arizona State University Project), “A”, 5%, 7/01/2033 | 225,000 | 228,398 | ||
| Phoenix, AZ, Industrial Development Authority, Student Housing Refunding Rev. (Downtown Phoenix Student Housing LLC - Arizona State University Project), “A”, 5%, 7/01/2037 | 395,000 | 393,416 | ||
| Phoenix, AZ, Industrial Development Authority, Student Housing Refunding Rev. (Downtown Phoenix Student Housing LLC - Arizona State University Project), “A”, 5%, 7/01/2042 | 480,000 | 461,879 | ||
| Pima County, AZ, Industrial Development Authority Education Facility Rev. (American Leadership Academy Project), 4%, 6/15/2041 (n) | 185,000 | 146,006 | ||
| Pima County, AZ, Industrial Development Authority Education Facility Rev. (American Leadership Academy Project), 4%, 6/15/2041 (n) | 995,000 | 785,277 | ||
| Pima County, AZ, Industrial Development Authority Education Facility Rev. (American Leadership Academy Project), 4%, 6/15/2051 (n) | 1,105,000 | 782,580 | ||
| Pima County, AZ, Industrial Development Authority Education Facility Rev. (American Leadership Academy Project), 4%, 6/15/2051 (n) | 285,000 | 201,842 | ||
| Pima County, AZ, Industrial Development Authority Education Facility Rev. (American Leadership Academy Project), 4%, 6/15/2057 (n) | 250,000 | 169,482 | ||
| Pima County, AZ, Industrial Development Authority Education Facility Rev. (American Leadership Academy Project), 4%, 6/15/2057 (n) | 1,245,000 | 843,780 | ||
| Pima County, AZ, Industrial Development Authority Senior Living Rev. (La Posada at Pusch Ridge Project), “A”, 6.75%, 11/15/2042 (n) | 925,000 | 926,776 | ||
| Pima County, AZ, Industrial Development Authority Senior Living Rev. (La Posada at Pusch Ridge Project), “A”, 6.875%, 11/15/2052 (n) | 2,625,000 | 2,600,271 | ||
| Pima County, AZ, Industrial Development Authority Senior Living Rev. (La Posada at Pusch Ridge Project), “A”, 7%, 11/15/2057 (n) | 1,180,000 | 1,179,873 | ||
| Pima County, AZ, Industrial Development Authority Senior Living Rev. (La Posada at Pusch Ridge Project), “B3”, 5.125%, 11/15/2029 (n) | 1,135,000 | 1,116,537 | ||
| Salt River, AZ, Agricultural Improvement & Power District, “A”, 5%, 1/01/2038 | 6,295,000 | 6,449,119 | ||
10
Portfolio of Investments (unaudited)
– continued
| Issuer | Shares/Par | Value ($) | ||
| Municipal Bonds - continued | ||||
| Arizona - continued | ||||
| Sierra Vista, AZ, Industrial Development Authority, Education Facility Rev. (American Leadership Academy Project), 5.75%, 6/15/2053 | $ | 3,560,000 | $3,371,027 | |
| Sierra Vista, AZ, Industrial Development Authority, Education Facility Rev. (American Leadership Academy Project), 5.75%, 6/15/2058 | 2,700,000 | 2,520,051 | ||
| Yavapai County, AZ, Industrial Development Authority Rev. (Waste Management, Inc.), “A-2”, 2.2%, 3/01/2028 (Put Date 6/03/2024) | 1,695,000 | 1,669,521 | ||
| $97,624,563 | ||||
| Arkansas - 0.4% | ||||
| Arkansas Development Finance Authority, Charter School Capital Improvement Rev. (LISA Academy Project), 4%, 7/01/2028 | $ | 170,000 | $161,509 | |
| Arkansas Development Finance Authority, Charter School Capital Improvement Rev. (LISA Academy Project), 4.5%, 7/01/2033 | 345,000 | 322,680 | ||
| Arkansas Development Finance Authority, Charter School Capital Improvement Rev. (LISA Academy Project), 4.5%, 7/01/2039 | 40,000 | 35,242 | ||
| Arkansas Development Finance Authority, Health Care Rev. (Baptist Memorial Health Care Corp.), “B-1”, 5%, 9/01/2026 | 3,515,000 | 3,579,321 | ||
| Arkansas Development Finance Authority, Health Care Rev. (Baptist Memorial Health Care Corp.), “B-1”, 5%, 9/01/2027 | 3,690,000 | 3,788,559 | ||
| Arkansas Development Finance Authority, Health Care Rev. (Baptist Memorial Health Care Corp.), “B-1”, 5%, 9/01/2028 | 1,595,000 | 1,648,274 | ||
| Arkansas Development Finance Authority, Health Care Rev. (Baptist Memorial Health Care Corp.), “B-1”, 5%, 9/01/2029 | 1,360,000 | 1,409,668 | ||
| Arkansas Development Finance Authority, Health Care Rev. (Baptist Memorial Health Care Corp.), “B-1”, 5%, 9/01/2036 | 685,000 | 683,811 | ||
| Arkansas Development Finance Authority, Health Care Rev. (Baptist Memorial Health Care Corp.), “B-1”, 5%, 9/01/2037 | 480,000 | 473,568 | ||
| Arkansas Development Finance Authority, Health Care Rev. (Baptist Memorial Health Care Corp.), “B-1”, 5%, 9/01/2039 | 380,000 | 368,659 | ||
| Arkansas Development Finance Authority, Health Care Rev. (Baptist Memorial Health Care Corp.), “B-1”, 5%, 9/01/2040 | 420,000 | 404,551 | ||
| Arkansas Development Finance Authority, Health Care Rev. (Baptist Memorial Health Care Corp.), “B-2”, 5%, 9/01/2044 (Put Date 9/01/2027) | 965,000 | 993,113 | ||
| Arkansas Development Finance Authority, Healthcare Facilities Rev. (Carti Surgery Center Project), “B”, 3%, 7/01/2032 | 135,000 | 108,944 | ||
| Arkansas Development Finance Authority, Healthcare Facilities Rev. (Carti Surgery Center Project), “B”, 3.125%, 7/01/2036 | 370,000 | 272,498 | ||
| Arkansas Development Finance Authority, Healthcare Facilities Rev. (Carti Surgery Center Project), “B”, 4.25%, 7/01/2041 | 145,000 | 117,888 | ||
11
Portfolio of Investments (unaudited)
– continued
| Issuer | Shares/Par | Value ($) | ||
| Municipal Bonds - continued | ||||
| Arkansas - continued | ||||
| Arkansas Development Finance Authority, Healthcare Facilities Rev. (Carti Surgery Center Project), “B”, 4%, 7/01/2052 | $ | 610,000 | $421,217 | |
| Arkansas Development Finance Authority, Hospital Rev. (Washington Regional Medical Center), 5%, 2/01/2038 | 1,310,000 | 1,241,898 | ||
| Arkansas Development Finance Authority, Hospital Rev. (Washington Regional Medical Center), “A”, 5%, 2/01/2035 | 345,000 | 345,122 | ||
| Arkansas Development Finance Authority, Tobacco Settlement Rev. (Cancer Research Center Project), Capital Appreciation, AAC, 0%, 7/01/2046 | 3,930,000 | 1,131,799 | ||
| Pulaski County, AR, Public Facilities Board, Healthcare Rev. (Baptist Health), 5%, 12/01/2042 | 1,200,000 | 1,197,262 | ||
| $18,705,583 | ||||
| California - 7.1% | ||||
| Alameda, CA, Corridor Transportation Authority Rev., Convertible Capital Appreciation, “C”, AGM, 0%, 10/01/2052 | $ | 6,270,000 | $3,036,014 | |
| California Community Choice Financing Authority, Clean Energy Project Rev., “A-1”, 4%, 5/01/2053 (Put Date 8/01/2028) | 6,850,000 | 6,631,308 | ||
| California Community Choice Financing Authority, Clean Energy Project Rev., “C”, 5.25%, 1/01/2054 (Put Date 10/01/2031) | 26,240,000 | 26,178,110 | ||
| California Community College Financing Authority Lease Rev. (West Valley Mission Community College), “C”, ETM, 5%, 6/01/2025 | 3,115,000 | 3,185,684 | ||
| California Community College Financing Authority Lease Rev. (West Valley Mission Community College), “C”, ETM, 5%, 6/01/2026 | 3,260,000 | 3,379,707 | ||
| California Community Housing Agency, Essential Housing Rev. (Aster), “A-1”, 4%, 2/01/2056 (n) | 4,970,000 | 3,830,387 | ||
| California County Tobacco Securitization Agency Settlement (Gold Country Settlement Funding Corp.), “A”, 4%, 6/01/2049 | 700,000 | 587,712 | ||
| California County Tobacco Securitization Agency Settlement (Los Angeles County Securitization Corp.), “A”, 4%, 6/01/2038 | 105,000 | 97,410 | ||
| California County Tobacco Securitization Agency Settlement (Los Angeles County Securitization Corp.), “A”, 4%, 6/01/2039 | 130,000 | 119,254 | ||
| California Health Facilities Financing Authority Rev. (CommonSpirit Health), “A”, 4%, 4/01/2049 | 785,000 | 647,904 | ||
| California Health Facilities Financing Authority Rev. (Sutter Health), “A”, 5%, 11/15/2046 (Prerefunded 11/15/2025) | 1,990,000 | 2,051,813 | ||
| California Housing Finance Agency Municipal Certificates, “A”, 4%, 3/20/2033 | 3,854,344 | 3,666,871 | ||
| California Housing Finance Agency Municipal Certificates, “A”, 4.375%, 9/20/2036 | 18,246,414 | 16,641,761 | ||
12
Portfolio of Investments (unaudited)
– continued
| Issuer | Shares/Par | Value ($) | ||
| Municipal Bonds - continued | ||||
| California - continued | ||||
| California Housing Finance Agency Municipal Certificates, “X”, 0.797%, 11/20/2035 (i) | $ | 53,562,443 | $2,646,724 | |
| California Housing Finance Agency Municipal Certificates, “X”, 0.764%, 8/19/2036 (i)(n) | 19,136,753 | 994,537 | ||
| California Infrastructure & Economic Development Bank Refunding Rev. (Los Angeles County Museum of Art Project), “A”, 1.2%, 12/01/2050 (Put Date 6/01/2028) | 6,245,000 | 5,247,419 | ||
| California M-S-R Energy Authority Gas Rev., “A”, 7%, 11/01/2034 | 470,000 | 549,919 | ||
| California Municipal Finance Authority Rev. (Community Medical Centers), “A”, 5%, 2/01/2042 | 1,380,000 | 1,377,184 | ||
| California Municipal Finance Authority Rev. (NorthBay Healthcare Group), “A”, 5.25%, 11/01/2036 | 1,190,000 | 1,121,253 | ||
| California Municipal Finance Authority Rev. (NorthBay Healthcare Group), “A”, 5.25%, 11/01/2041 | 1,060,000 | 952,181 | ||
| California Municipal Finance Authority Rev. (NorthBay Healthcare Group), “A”, 5.25%, 11/01/2047 | 2,975,000 | 2,550,540 | ||
| California Municipal Finance Authority Rev. (William Jessup University), 5%, 8/01/2039 | 1,695,000 | 1,494,719 | ||
| California Municipal Finance Authority, COP (Palomar Health), “A”, AGM, 5.25%, 11/01/2052 | 3,185,000 | 3,285,343 | ||
| California Municipal Finance Authority, Multi-Family Housing Rev. (CityView Apartments), “A”, 4%, 11/01/2036 (n) | 1,515,000 | 1,320,423 | ||
| California Municipal Finance Authority, Solid Waste Disposal Rev. (Waste Management, Inc. Project), “A”, 2.4%, 10/01/2044 (Put Date 10/01/2029) | 3,370,000 | 2,943,333 | ||
| California Municipal Special Finance Agency, Essential Housing Rev. (Solana at Grand), “A-1”, 4%, 8/01/2056 (n) | 2,420,000 | 1,871,025 | ||
| California Pollution Control Financing Authority, Solid Waste Disposal Rev. (Waste Management, Inc.), “A”, 2.5%, 11/01/2038 (Put Date 5/01/2024) | 2,985,000 | 2,951,936 | ||
| California Public Finance Authority Rev. (Henry Mayo Newhall Hospital), 5%, 10/15/2033 | 205,000 | 206,860 | ||
| California Public Finance Authority Rev. (Henry Mayo Newhall Hospital), 5%, 10/15/2037 | 405,000 | 400,981 | ||
| California Public Finance Authority Rev. (Henry Mayo Newhall Hospital), 5%, 10/15/2047 | 405,000 | 380,136 | ||
| California Public Finance Authority Rev. (Henry Mayo Newhall Hospital), “A”, 4%, 10/15/2026 | 330,000 | 321,816 | ||
| California Public Finance Authority Rev. (Henry Mayo Newhall Hospital), “A”, 4%, 10/15/2027 | 315,000 | 305,832 | ||
| California Public Finance Authority Rev. (Henry Mayo Newhall Hospital), “A”, 4%, 10/15/2028 | 285,000 | 274,940 | ||
13
Portfolio of Investments (unaudited)
– continued
| Issuer | Shares/Par | Value ($) | ||
| Municipal Bonds - continued | ||||
| California - continued | ||||
| California Public Finance Authority, Senior Living Refunding Rev. (Enso Village Project), “A”, 5%, 11/15/2036 (n) | $ | 705,000 | $659,182 | |
| California Public Finance Authority, Senior Living Rev. (Enso Village Project), “B-1”, 3.125%, 5/15/2029 (n) | 1,595,000 | 1,484,909 | ||
| California Public Finance Authority, Senior Living Rev. (Enso Village Project), “B-2”, 2.375%, 11/15/2028 (n) | 1,065,000 | 1,010,737 | ||
| California Public Works Board Lease Rev. (Various Capital Projects), “I”, 5%, 11/01/2038 | 7,220,000 | 7,223,500 | ||
| California Public Works Board Lease Rev., Department of Corrections and Rehabilitation (Various Correctional Facilities), “A”, 5%, 9/01/2033 | 7,275,000 | 7,347,239 | ||
| California School Finance Authority, Charter School Rev. (Aspire Public Schools - Obligated Group - Issue No. 5), “A”, 4%, 8/01/2061 (n) | 890,000 | 637,522 | ||
| California School Finance Authority, Charter School Rev. (Aspire Public Schools - Obligated Group), “A”, 4%, 8/01/2051 | 550,000 | 414,334 | ||
| California School Finance Authority, School Facility Rev. (Alliance for College-Ready Public Schools Projects), “A”, 4%, 7/01/2024 (n) | 445,000 | 442,544 | ||
| California School Finance Authority, School Facility Rev. (Alliance for College-Ready Public Schools Projects), “A”, 4%, 7/01/2025 (n) | 465,000 | 458,959 | ||
| California School Finance Authority, School Facility Rev. (Alliance for College-Ready Public Schools Projects), “A”, 5%, 7/01/2045 (n) | 1,055,000 | 972,593 | ||
| California School Finance Authority, School Facility Rev. (KIPP LA Projects), “A”, 4%, 7/01/2050 (n) | 2,740,000 | 2,135,121 | ||
| California Statewide Communities Development Authority Multi-Family Housing Rev. (Apple Tree Village Apartments), “R”, 3.95%, 4/01/2060 (Put Date 10/01/2037) | 10,200,000 | 7,869,633 | ||
| California Statewide Communities Development Authority Rev. (Adventist Health System/West), “A”, 5%, 3/01/2034 | 790,000 | 811,300 | ||
| California Statewide Communities Development Authority Rev. (Adventist Health System/West), “A”, 5%, 3/01/2035 | 1,160,000 | 1,189,978 | ||
| California Statewide Communities Development Authority Rev. (California Baptist University), “A”, 3.5%, 11/01/2027 (n) | 2,590,000 | 2,432,717 | ||
| California Statewide Communities Development Authority Rev. (California Baptist University), “A”, 5%, 11/01/2032 (n) | 385,000 | 382,490 | ||
| California Statewide Communities Development Authority Rev. (California Baptist University), “A”, 5%, 11/01/2041 (n) | 755,000 | 691,033 | ||
| California Statewide Communities Development Authority Rev. (Enloe Medical Center), “A”, AGM, 5.25%, 8/15/2052 | 2,640,000 | 2,748,636 | ||
| California Statewide Communities Development Authority Rev. (Enloe Medical Center), “A”, AGM, 5.375%, 8/15/2057 | 2,510,000 | 2,626,640 | ||
| California Statewide Communities Development Authority Rev. (Lancer Plaza Project), 5.625%, 11/01/2033 | 190,000 | 190,103 | ||
14
Portfolio of Investments (unaudited)
– continued
| Issuer | Shares/Par | Value ($) | ||
| Municipal Bonds - continued | ||||
| California - continued | ||||
| California Statewide Communities Development Authority Rev. (Loma Linda University Medical Center), “A”, 5.25%, 12/01/2034 | $ | 510,000 | $511,207 | |
| California Statewide Communities Development Authority Rev. (Loma Linda University Medical Center), “A”, 5.25%, 12/01/2044 | 2,085,000 | 1,957,251 | ||
| California Statewide Communities Development Authority Rev. (Loma Linda University Medical Center), “A”, 5%, 12/01/2046 (n) | 4,290,000 | 3,911,967 | ||
| California Statewide Communities Development Authority Rev. (Loma Linda University Medical Center), “A”, 5.25%, 12/01/2056 (n) | 8,560,000 | 7,838,437 | ||
| California Statewide Communities Development Authority Rev. (Loma Linda University Medical Center), “A”, 5.5%, 12/01/2058 | 5,820,000 | 5,528,335 | ||
| California Statewide Communities Development Authority, College Housing Rev. (NCCD-Hooper Street LLC College of the Arts Project), 5%, 7/01/2029 (n) | 490,000 | 482,999 | ||
| California Statewide Communities Development Authority, College Housing Rev. (NCCD-Hooper Street LLC College of the Arts Project), 5.25%, 7/01/2039 (n) | 375,000 | 350,919 | ||
| California Statewide Communities Development Authority, College Housing Rev. (NCCD-Hooper Street LLC College of the Arts Project), 5.25%, 7/01/2049 (n) | 1,415,000 | 1,269,785 | ||
| California Statewide Communities Development Authority, College Housing Rev. (NCCD-Hooper Street LLC College of the Arts Project), 5.25%, 7/01/2052 (n) | 615,000 | 545,235 | ||
| California Statewide Communities Development Authority, Essential Housing Rev. (Pasadena Portfolio), “A-1”, 2.65%, 12/01/2046 (n) | 7,160,000 | 5,005,924 | ||
| California Statewide Communities Development Authority, Insured Rev. (Viamonte Senior Living 1 Project), “A”, 3.5%, 7/01/2034 | 630,000 | 581,511 | ||
| Escondido, CA, Union High School District (Election of 2008), Capital Appreciation, “A”, AGM, 0%, 8/01/2031 | 3,160,000 | 2,280,829 | ||
| Escondido, CA, Union High School District (Election of 2008), Capital Appreciation, “A”, AGM, 0%, 8/01/2033 | 2,195,000 | 1,444,416 | ||
| Foothill-De Anza, CA, Community College District, Capital Appreciation, NPFG, 0%, 8/01/2034 | 16,840,000 | 10,801,429 | ||
| Golden State, CA, Tobacco Securitization Corp., Tobacco Settlement Rev., “A”, 5%, 6/01/2034 (Prerefunded 6/01/2025) | 2,360,000 | 2,411,637 | ||
| Golden State, CA, Tobacco Securitization Corp., Tobacco Settlement Rev., Taxable, “B-1”, 3.85%, 6/01/2050 | 18,505,000 | 16,785,036 | ||
| Irvine, CA, Financial Authority Special Tax Rev. (Irvine Great Park Infrastructure Project), BAM, 4%, 9/01/2058 | 10,305,000 | 9,143,077 | ||
| Long Beach, CA, Marina Rev. (Alamitos Bay Marina Project), 5%, 5/15/2035 | 380,000 | 381,301 | ||
15
Portfolio of Investments (unaudited)
– continued
| Issuer | Shares/Par | Value ($) | ||
| Municipal Bonds - continued | ||||
| California - continued | ||||
| Los Angeles, CA, Department of Airports Refunding Rev. (Los Angeles International), “A”, 5%, 5/15/2036 | $ | 1,345,000 | $1,391,672 | |
| Los Angeles, CA, Department of Airports Refunding Rev. (Los Angeles International), “A”, 5%, 5/15/2037 | 1,005,000 | 1,030,842 | ||
| Los Angeles, CA, Department of Airports Refunding Rev. (Los Angeles International), “A”, 5%, 5/15/2038 | 2,210,000 | 2,248,746 | ||
| Los Angeles, CA, Department of Airports Refunding Rev. (Los Angeles International), “A”, 5%, 5/15/2039 | 3,275,000 | 3,331,015 | ||
| Los Angeles, CA, Department of Airports Rev. (Los Angeles International), “A”, 5.25%, 5/15/2038 | 1,395,000 | 1,422,815 | ||
| Los Angeles, CA, Department of Airports Rev. (Los Angeles International), “A”, 5%, 5/15/2044 | 2,840,000 | 2,838,491 | ||
| Los Angeles, CA, Department of Water & Power Water System Rev., “A”, 5%, 7/01/2038 | 3,180,000 | 3,242,534 | ||
| Modesto, CA, Elementary School District, General Obligation, “B”, 3%, 8/01/2046 | 1,415,000 | 1,004,225 | ||
| Modesto, CA, Elementary School District, General Obligation, “B”, 3%, 8/01/2050 | 880,000 | 601,497 | ||
| Montebello, CA, Public Financing Authority Lease Rev. (Montebello Home2 Suites by Hilton Hotel Project), “A”, 5%, 6/01/2041 | 5,115,000 | 5,180,362 | ||
| Montebello, CA, Public Financing Authority Lease Rev. (Montebello Home2 Suites by Hilton Hotel Project), “A”, 5%, 6/01/2046 | 1,575,000 | 1,588,753 | ||
| Mount San Antonio, CA, Community College District Rev. (Election of 2008), Convertible Capital Appreciation, “A”, 5.875% to 8/01/2023, 5.875% to 7/31/2028 | 1,465,000 | 1,611,130 | ||
| Mountain House Financing Authority, CA, Utility Systems Rev., BAM, 4.125%, 12/01/2048 | 1,000,000 | 917,629 | ||
| Mountain House Financing Authority, CA, Utility Systems Rev., BAM, 4.25%, 12/01/2052 | 2,000,000 | 1,840,388 | ||
| Oceanside, CA, Unified School District General Obligation, Capital Appreciation, “A”, AGM, 0%, 8/01/2027 | 1,165,000 | 1,004,207 | ||
| Oceanside, CA, Unified School District General Obligation, Capital Appreciation, “A”, AGM, 0%, 8/01/2029 | 2,425,000 | 1,924,844 | ||
| Oceanside, CA, Unified School District General Obligation, Capital Appreciation, “A”, AGM, 0%, 8/01/2030 | 3,110,000 | 2,360,101 | ||
| Oceanside, CA, Unified School District General Obligation, Capital Appreciation, “A”, ETM, AGM, 0%, 8/01/2024 | 280,000 | 271,254 | ||
| Oceanside, CA, Unified School District General Obligation, Capital Appreciation, “A”, ETM, AGM, 0%, 8/01/2027 | 155,000 | 134,854 | ||
| Oceanside, CA, Unified School District General Obligation, Capital Appreciation, “A”, ETM, AGM, 0%, 8/01/2027 | 75,000 | 65,252 | ||
16
Portfolio of Investments (unaudited)
– continued
| Issuer | Shares/Par | Value ($) | ||
| Municipal Bonds - continued | ||||
| California - continued | ||||
| Oceanside, CA, Unified School District General Obligation, Capital Appreciation, “A”, ETM, AGM, 0%, 8/01/2027 | $ | 130,000 | $113,103 | |
| Oceanside, CA, Unified School District General Obligation, Capital Appreciation, “A”, ETM, AGM, 0%, 8/01/2029 | 225,000 | 182,525 | ||
| Oceanside, CA, Unified School District General Obligation, Capital Appreciation, “A”, ETM, AGM, 0%, 8/01/2029 | 125,000 | 101,403 | ||
| Oceanside, CA, Unified School District General Obligation, Capital Appreciation, “A”, ETM, AGM, 0%, 8/01/2030 | 180,000 | 140,737 | ||
| Oceanside, CA, Unified School District General Obligation, Capital Appreciation, “A”, ETM, AGM, 0%, 8/01/2030 | 125,000 | 97,081 | ||
| Oxnard, CA, Financing Authority, Wastewater Rev., AGM, 5%, 6/01/2030 | 1,290,000 | 1,298,488 | ||
| Pomona, CA, Unified School District, General Obligation, “F”, BAM, 3%, 8/01/2048 | 765,000 | 527,760 | ||
| Port of Oakland, CA, Intermediate Lien Refunding Rev., “H”, 5%, 5/01/2024 | 1,245,000 | 1,249,524 | ||
| Port of Oakland, CA, Intermediate Lien Refunding Rev., “H”, 5%, 5/01/2025 | 3,775,000 | 3,818,558 | ||
| Port of Oakland, CA, Intermediate Lien Refunding Rev., “H”, 5%, 5/01/2026 | 2,165,000 | 2,203,166 | ||
| Port of Oakland, CA, Intermediate Lien Refunding Rev., “H”, 5%, 5/01/2027 | 2,165,000 | 2,225,413 | ||
| Port of Oakland, CA, Intermediate Lien Refunding Rev., “H”, ETM, 5%, 5/01/2024 | 95,000 | 95,643 | ||
| River Islands, CA, Public Finance Authority Improvement Area No. 1, Special Tax Community Facilities District No. 2003-1, “A-1”, AGM, 5.25%, 9/01/2052 | 6,700,000 | 6,997,233 | ||
| River Islands, CA, Public Finance Authority, Special Tax Community Facilities District No. 2016-1, AGM, 5.25%, 9/01/2052 | 1,575,000 | 1,644,872 | ||
| Riverside County, CA, Transportation Commission Sales Tax Rev. (Limited Tax), “A”, 2%, 6/01/2029 | 1,585,000 | 1,384,540 | ||
| Sacramento County, CA, Airport System Rev., “A”, 5%, 7/01/2041 | 7,865,000 | 8,013,223 | ||
| Sacramento County, CA, Airport System Rev., “B”, 5%, 7/01/2041 | 4,720,000 | 4,805,280 | ||
| San Diego County, CA, Regional Airport Authority Rev., “B”, 4%, 7/01/2041 | 1,310,000 | 1,170,869 | ||
| San Diego County, CA, Regional Airport Authority Rev., “B”, 4%, 7/01/2046 | 1,500,000 | 1,279,522 | ||
| San Diego County, CA, Regional Airport Authority Rev., “B”, 5%, 7/01/2046 | 1,875,000 | 1,845,146 | ||
| San Diego County, CA, Regional Airport Authority Rev., “B”, 5%, 7/01/2051 | 1,875,000 | 1,837,545 | ||
| San Diego County, CA, Regional Airport Authority Rev., “B”, 4%, 7/01/2056 | 2,060,000 | 1,671,204 | ||
17
Portfolio of Investments (unaudited)
– continued
| Issuer | Shares/Par | Value ($) | ||
| Municipal Bonds - continued | ||||
| California - continued | ||||
| San Francisco, CA, City & County Airports Commission, International Airport Rev., “E”, 5%, 5/01/2038 | $ | 3,385,000 | $3,415,604 | |
| San Francisco, CA, City & County Airports Commission, International Airport Rev., “E”, 5%, 5/01/2039 | 3,855,000 | 3,879,231 | ||
| San Francisco, CA, City & County Airports Commission, International Airport Rev., “E”, 5%, 5/01/2040 | 1,800,000 | 1,806,670 | ||
| San Francisco, CA, City & County Redevelopment Successor Agency, Tax Allocation (Mission Bay South Redevelopment Project), “A”, 5%, 8/01/2043 | 270,000 | 271,361 | ||
| San Mateo County, CA, Community College District (Election of 2005), Capital Appreciation, “A”, NPFG, 0%, 9/01/2026 | 4,015,000 | 3,594,438 | ||
| State of California, Various Purpose General Obligation Refunding, 5%, 8/01/2029 | 3,935,000 | 4,088,935 | ||
| State of California, Various Purpose General Obligation Refunding, 5%, 9/01/2034 | 7,080,000 | 7,337,014 | ||
| State of California, Veterans General Obligation, “CU”, 4.85%, 12/01/2046 | 1,445,000 | 1,451,422 | ||
| Tulare and Kings Counties, CA, College of the Sequoias Community District (Area Improvement District No. 3), “E”, 3%, 8/01/2051 | 1,685,000 | 1,142,227 | ||
| University of California, Hastings Campus Housing Finance Authority, Campus Housing Rev., “A”, 5%, 7/01/2045 (n) | 6,640,000 | 5,645,724 | ||
| University of California, Hastings Campus Housing Finance Authority, Campus Housing Rev., “A”, 5%, 7/01/2061 (n) | 6,760,000 | 5,362,299 | ||
| University of California, Hastings Campus Housing Finance Authority, Campus Housing Rev., Convertible Capital Appreciation, “B”, 0% to 7/01/2035, 6.75% to 7/01/2061 (n) | 9,605,000 | 3,325,744 | ||
| West Contra Costa, CA, Unified School District (Election of 2005), Capital Appreciation, “C”, AGM, 0%, 8/01/2029 | 2,710,000 | 2,140,033 | ||
| $334,385,649 | ||||
| Colorado - 4.3% | ||||
| Arapahoe County, CO, Whispering Pines Metropolitan District No. 1, General Obligation, 5%, 12/01/2043 | $ | 325,000 | $327,349 | |
| Arapahoe County, CO, Whispering Pines Metropolitan District No. 1, General Obligation, AGM, 5%, 12/01/2052 | 645,000 | 631,683 | ||
| Arvada, CO, Vauxmont Metropolitan District Rev., AGM, 5%, 12/15/2027 | 45,000 | 46,878 | ||
| Arvada, CO, Vauxmont Metropolitan District Rev., AGM, 5%, 12/15/2028 | 44,000 | 45,841 | ||
| Arvada, CO, Vauxmont Metropolitan District Rev., AGM, 5%, 12/15/2029 | 44,000 | 45,825 | ||
18
Portfolio of Investments (unaudited)
– continued
| Issuer | Shares/Par | Value ($) | ||
| Municipal Bonds - continued | ||||
| Colorado - continued | ||||
| Arvada, CO, Vauxmont Metropolitan District Rev., AGM, 5%, 12/15/2032 | $ | 56,000 | $58,296 | |
| Colorado Educational & Cultural Facilities Authority Rev. (Classical Academy Project), 5%, 12/01/2031 | 1,360,000 | 1,368,607 | ||
| Colorado Educational & Cultural Facilities Authority Rev. (Classical Academy Project), “A”, 5%, 12/01/2038 | 805,000 | 803,044 | ||
| Colorado Educational & Cultural Facilities Authority Rev. (Leman Academy of Excellence-Douglas County, CO Campus Project), “A”, 4.25%, 7/01/2043 | 3,105,000 | 2,701,672 | ||
| Colorado Educational & Cultural Facilities Authority Rev. (Leman Academy of Excellence-Douglas County, CO Campus Project), “A”, 4.5%, 7/01/2053 | 5,250,000 | 4,467,140 | ||
| Colorado Educational & Cultural Facilities Authority Rev. (Leman Academy of Excellence-Douglas County, CO Campus Project), “A”, 4.5%, 7/01/2058 | 3,780,000 | 3,132,979 | ||
| Colorado Educational & Cultural Facilities Authority Rev. (Liberty Common Project), 5%, 1/15/2029 | 155,000 | 155,083 | ||
| Colorado Educational & Cultural Facilities Authority Rev. (Liberty Common Project), 5%, 1/15/2039 | 585,000 | 560,276 | ||
| Colorado Educational & Cultural Facilities Authority Rev. (Liberty Common Project), 5%, 1/15/2044 | 480,000 | 443,461 | ||
| Colorado Educational & Cultural Facilities Authority Rev. (Montessori Charter School Project), 5%, 7/15/2037 | 430,000 | 430,223 | ||
| Colorado Educational & Cultural Facilities Authority Rev. (Peak to Peak Charter School Project), 5%, 8/15/2030 | 390,000 | 392,190 | ||
| Colorado Educational & Cultural Facilities Authority Rev. (Peak to Peak Charter School Project), 5%, 8/15/2034 | 390,000 | 392,142 | ||
| Colorado Educational & Cultural Facilities Authority Rev. (Pinnacle Charter School Building Corp.), 5%, 6/01/2029 | 720,000 | 720,316 | ||
| Colorado Educational & Cultural Facilities Authority Rev. (Stargate Charter School Project), “A”, 4%, 12/01/2048 | 2,710,000 | 2,174,311 | ||
| Colorado Educational & Cultural Facilities Authority Rev. (Twin Peaks Charter Academy Project), 5%, 11/15/2031 | 1,460,000 | 1,469,225 | ||
| Colorado Educational & Cultural Facilities Authority Rev. (Union Colony School Project), 5%, 4/01/2038 | 240,000 | 239,449 | ||
| Colorado Educational & Cultural Facilities Authority Rev. (Union Colony School Project), 5%, 4/01/2048 | 290,000 | 275,746 | ||
| Colorado Educational & Cultural Facilities Authority Rev. (Union Colony School Project), 5%, 4/01/2053 | 305,000 | 285,969 | ||
| Colorado Educational & Cultural Facilities Authority, Charter School Refunding and Improvement Rev. (American Academy Project), 5%, 12/01/2040 | 2,800,000 | 2,754,714 | ||
19
Portfolio of Investments (unaudited)
– continued
| Issuer | Shares/Par | Value ($) | ||
| Municipal Bonds - continued | ||||
| Colorado - continued | ||||
| Colorado Educational & Cultural Facilities Authority, Charter School Refunding and Improvement Rev. (American Academy Project), 5%, 12/01/2050 | $ | 14,255,000 | $13,462,364 | |
| Colorado Educational & Cultural Facilities Authority, Charter School Refunding and Improvement Rev. (Pinnacle Charter School, Inc. Project), “A”, 4%, 12/01/2036 | 1,080,000 | 991,156 | ||
| Colorado Educational & Cultural Facilities Authority, Charter School Refunding and Improvement Rev. (Pinnacle Charter School, Inc. Project), “A”, 4%, 12/01/2041 | 1,315,000 | 1,130,572 | ||
| Colorado Educational & Cultural Facilities Authority, Charter School Refunding and Improvement Rev. (Prospect Ridge Academy Project), “A”, 5%, 3/15/2040 | 1,380,000 | 1,367,388 | ||
| Colorado Educational & Cultural Facilities Authority, Charter School Refunding and Improvement Rev. (Prospect Ridge Academy Project), “A”, 5%, 3/15/2050 | 2,825,000 | 2,673,708 | ||
| Colorado Educational & Cultural Facilities Authority, Charter School Refunding and Improvement Rev. (Prospect Ridge Academy Project), “A”, 5%, 3/15/2055 | 4,165,000 | 3,892,358 | ||
| Colorado Educational & Cultural Facilities Authority, Charter School Refunding Rev. (American Academy Project), 5%, 12/01/2055 | 1,145,000 | 1,067,720 | ||
| Colorado Educational & Cultural Facilities Authority, Charter School Refunding Rev. (Thomas MacLaren State Charter School Project), “A”, 5%, 6/01/2035 | 420,000 | 425,715 | ||
| Colorado Educational & Cultural Facilities Authority, Charter School Refunding Rev. (Windsor Charter Academy Project), 4%, 9/01/2050 | 385,000 | 307,492 | ||
| Colorado Educational & Cultural Facilities Authority, Charter School Refunding Rev. (Windsor Charter Academy Project), 4%, 9/01/2055 | 690,000 | 537,119 | ||
| Colorado Educational & Cultural Facilities Authority, Charter School Rev. (Highline Academy Charter School Project), 5.75%, 12/01/2061 | 3,140,000 | 3,203,221 | ||
| Colorado Health Facilities Authority Rev. (Adventist System/Sunbelt Obligated Group), “A”, 5%, 11/15/2041 | 7,865,000 | 7,979,461 | ||
| Colorado Health Facilities Authority Rev. (Adventist System/Sunbelt Obligated Group), “A”, 4%, 11/15/2048 | 18,540,000 | 15,916,076 | ||
| Colorado Health Facilities Authority Rev. (CommonSpirit Health), “A”, 5.5%, 11/01/2047 | 2,915,000 | 2,964,110 | ||
| Colorado Health Facilities Authority Rev. (CommonSpirit Health), “A”, 5.25%, 11/01/2052 | 4,430,000 | 4,334,308 | ||
| Colorado Health Facilities Authority Rev. (CommonSpirit Health), “A-2”, 4%, 8/01/2044 | 4,025,000 | 3,356,945 | ||
20
Portfolio of Investments (unaudited)
– continued
| Issuer | Shares/Par | Value ($) | ||
| Municipal Bonds - continued | ||||
| Colorado - continued | ||||
| Colorado Health Facilities Authority Rev. (CommonSpirit Health), “A-2”, 4%, 8/01/2049 | $ | 8,090,000 | $6,516,243 | |
| Colorado Health Facilities Authority Rev. (Sanford Health), “A”, 5%, 11/01/2039 | 7,395,000 | 7,396,370 | ||
| Colorado Health Facilities Authority Rev. (SCL Health System), “A”, 4%, 1/01/2036 | 935,000 | 903,517 | ||
| Colorado Health Facilities Authority Rev. (SCL Health System), “A”, 4%, 1/01/2037 | 3,380,000 | 3,191,317 | ||
| Colorado Health Facilities Authority Rev. (SCL Health System), “A”, 4%, 1/01/2038 | 3,895,000 | 3,656,453 | ||
| Colorado Health Facilities Authority Rev. (SCL Health System), “A”, 5%, 1/01/2044 | 3,635,000 | 3,643,339 | ||
| Colorado Health Facilities Authority, Hospital Rev. (AdventHealth Obligated Group), “A”, 4%, 11/15/2043 | 3,685,000 | 3,317,826 | ||
| Colorado Health Facilities Authority, Hospital Rev. (Boulder Community Health Project), 5%, 10/01/2032 | 800,000 | 831,030 | ||
| Colorado Health Facilities Authority, Hospital Rev. (Boulder Community Health Project), 5%, 10/01/2033 | 790,000 | 820,972 | ||
| Colorado Health Facilities Authority, Hospital Rev. (Boulder Community Health Project), 5%, 10/01/2034 | 820,000 | 851,069 | ||
| Colorado Health Facilities Authority, Hospital Rev. (Boulder Community Health Project), 4%, 10/01/2035 | 600,000 | 559,738 | ||
| Colorado Health Facilities Authority, Hospital Rev. (Boulder Community Health Project), 4%, 10/01/2037 | 355,000 | 325,049 | ||
| Colorado Health Facilities Authority, Hospital Rev. (Boulder Community Health Project), 4%, 10/01/2038 | 280,000 | 252,272 | ||
| Colorado Health Facilities Authority, Hospital Rev. (Boulder Community Health Project), 4%, 10/01/2039 | 280,000 | 248,298 | ||
| Colorado Health Facilities Authority, Hospital Rev. (Boulder Community Health Project), 4%, 10/01/2040 | 240,000 | 209,172 | ||
| Colorado Housing & Finance Authority Rev., Single Family Mortgage Class I, “C”, 4.75%, 5/01/2049 (u) | 3,210,000 | 3,191,108 | ||
| Colorado Housing & Finance Authority Rev., Single Family Mortgage Class III, “H”, 4.25%, 11/01/2049 | 3,285,000 | 3,223,487 | ||
| Colorado Housing & Finance Authority, Single Family Mortgage, “F”, GNMA, 5.25%, 11/01/2052 | 5,830,000 | 5,885,522 | ||
| Colorado Housing & Finance Authority, Single Family Mortgage, Class III, “D”, 5.75%, 5/01/2053 | 18,515,000 | 19,114,927 | ||
| Colorado Regional Transportation District (Denver Transit Partners Eagle P3 Project), “A”, 4%, 1/15/2033 | 280,000 | 273,369 | ||
| Colorado Regional Transportation District (Denver Transit Partners Eagle P3 Project), “A”, 4%, 7/15/2036 | 465,000 | 440,379 | ||
21
Portfolio of Investments (unaudited)
– continued
| Issuer | Shares/Par | Value ($) | ||
| Municipal Bonds - continued | ||||
| Colorado - continued | ||||
| Colorado Regional Transportation District (Denver Transit Partners Eagle P3 Project), “A”, 4%, 7/15/2038 | $ | 335,000 | $307,091 | |
| Colorado Regional Transportation District, Sales Tax Rev. (Fastracks Project), “A”, 5%, 11/01/2036 | 2,170,000 | 2,222,957 | ||
| Colorado Regional Transportation District, Sales Tax Rev. (Fastracks Project), “A”, 5%, 11/01/2040 | 7,865,000 | 7,986,495 | ||
| Colorado State University Board of Governors, System Enterprise Rev., “B”, 5%, 3/01/2025 | 2,360,000 | 2,396,639 | ||
| Denver, CO, City & County Airport System Rev., “A”, 4.125%, 11/15/2047 | 2,700,000 | 2,353,313 | ||
| Denver, CO, City & County Airport System Rev., “A”, 4.125%, 11/15/2053 | 2,535,000 | 2,150,913 | ||
| Denver, CO, Convention Center Hotel Authority Rev., 5%, 12/01/2035 | 760,000 | 745,503 | ||
| Denver, CO, Convention Center Hotel Authority Rev., 5%, 12/01/2040 | 1,290,000 | 1,196,880 | ||
| Denver, CO, Health & Hospital Authority Rev., “A”, 4%, 12/01/2038 | 620,000 | 524,444 | ||
| Denver, CO, Health & Hospital Authority Rev., “A”, 4%, 12/01/2040 | 1,000,000 | 823,769 | ||
| Denver, CO, Health & Hospital Authority Rev., “A”, 5.25%, 12/01/2045 | 955,000 | 945,496 | ||
| Eagle, Garfield & Routt Counties, CO, School District RE50J General Obligation, 5%, 12/01/2034 | 1,995,000 | 2,048,811 | ||
| Eagle, Garfield & Routt Counties, CO, School District RE50J General Obligation, 5%, 12/01/2035 | 3,935,000 | 4,036,440 | ||
| Park Creek Metropolitan District, CO, Senior Limited Property Tax Supported Rev., “A”, NPFG, 5%, 12/01/2030 | 1,160,000 | 1,182,724 | ||
| Park Creek Metropolitan District, CO, Senior Limited Property Tax Supported Rev., “A”, NPFG, 5%, 12/01/2031 | 1,310,000 | 1,339,548 | ||
| Park Creek Metropolitan District, CO, Senior Limited Property Tax Supported Rev., “A”, NPFG, 5%, 12/01/2032 | 1,385,000 | 1,411,722 | ||
| Park Creek Metropolitan District, CO, Senior Limited Property Tax Supported Rev., “A”, NPFG, 5%, 12/01/2033 | 1,385,000 | 1,411,312 | ||
| Park Creek Metropolitan District, CO, Senior Limited Property Tax Supported Rev., “A”, NPFG, 5%, 12/01/2034 | 1,140,000 | 1,158,290 | ||
| Park Creek Metropolitan District, CO, Senior Limited Property Tax Supported Rev., “A”, NPFG, 5%, 12/01/2035 | 1,285,000 | 1,300,325 | ||
| Park Creek Metropolitan District, CO, Senior Limited Property Tax Supported Rev., “A”, NPFG, 5%, 12/01/2045 | 4,155,000 | 4,045,061 | ||
| Public Authority for Colorado Energy Natural Gas Purchase Rev., 6.25%, 11/15/2028 | 960,000 | 1,004,680 | ||
22
Portfolio of Investments (unaudited)
– continued
| Issuer | Shares/Par | Value ($) | ||
| Municipal Bonds - continued | ||||
| Colorado - continued | ||||
| State of Colorado (Building Excellent Schools Today), “S”, COP, AGM, 4%, 3/15/2046 | $ | 12,145,000 | $10,636,077 | |
| $203,612,079 | ||||
| Connecticut - 0.9% | ||||
| Connecticut Airport Authority Rev. (Ground Transportation Center Project), “A”, 4%, 7/01/2049 | $ | 1,550,000 | $1,230,257 | |
| Connecticut Health & Educational Facilities Authority Rev. (Connecticut Children's Medical Issue), “E”, 5.25%, 7/15/2048 | 1,910,000 | 1,950,876 | ||
| Connecticut Health & Educational Facilities Authority Rev. (Connecticut Children's Medical Issue), “E”, 4.25%, 7/15/2053 | 2,195,000 | 1,845,558 | ||
| Connecticut Health & Educational Facilities Authority Rev. (Masonicare), “F”, 5%, 7/01/2025 | 2,355,000 | 2,339,324 | ||
| Connecticut Health & Educational Facilities Authority Rev. (Masonicare), “F”, 5%, 7/01/2043 | 3,330,000 | 3,074,123 | ||
| Connecticut Higher Education Supplemental Loan Authority Rev. (Chesla Loan Program), “B”, 3.5%, 11/15/2033 | 1,380,000 | 1,234,651 | ||
| Connecticut Higher Education Supplemental Loan Authority Rev. (Chesla Loan Program), “B”, 3.75%, 11/15/2034 | 1,680,000 | 1,517,555 | ||
| Connecticut Higher Education Supplemental Loan Authority Rev. (Chesla Loan Program), “B”, 4%, 11/15/2035 | 1,000,000 | 910,990 | ||
| Connecticut Higher Education Supplemental Loan Authority Rev. (Chesla Loan Program), “B”, 4%, 11/15/2036 | 450,000 | 398,828 | ||
| Connecticut Higher Education Supplemental Loan Authority Rev. (Chesla Loan Program), “B”, 4.25%, 11/15/2039 | 910,000 | 793,006 | ||
| Connecticut Housing Finance Authority Rev. (Housing Mortgage Finance Program), “C-1”, 3.5%, 11/15/2045 | 360,000 | 356,541 | ||
| Great Pond, CT, Improvement District Special Obligation Rev. (Great Pond Phase II Project), 5.5%, 10/01/2042 (n) | 2,050,000 | 2,011,860 | ||
| Great Pond, CT, Improvement District Special Obligation Rev. (Great Pond Phase II Project), 5.75%, 10/01/2052 (n) | 5,560,000 | 5,434,923 | ||
| Mohegan Tribal Finance Authority, CT, Economic Development Bonds, 7%, 2/01/2045 (n) | 7,240,000 | 7,088,846 | ||
| New Haven, CT, General Obligation, “A”, AGM, 5%, 8/15/2032 | 790,000 | 811,175 | ||
| State of Connecticut, Special Tax Obligation Rev., Transportation Purposes, “A”, 5%, 5/01/2035 | 7,000,000 | 7,545,443 | ||
| Steel Point Infrastructure Improvement District, CT, Special Obligation Rev. (Steel Point Harbor Project), 4%, 4/01/2031 (n) | 145,000 | 133,719 | ||
| Steel Point Infrastructure Improvement District, CT, Special Obligation Rev. (Steel Point Harbor Project), 4%, 4/01/2036 (n) | 230,000 | 198,741 | ||
| Steel Point Infrastructure Improvement District, CT, Special Obligation Rev. (Steel Point Harbor Project), 4%, 4/01/2041 (n) | 275,000 | 224,724 | ||
23
Portfolio of Investments (unaudited)
– continued
| Issuer | Shares/Par | Value ($) | ||
| Municipal Bonds - continued | ||||
| Connecticut - continued | ||||
| Steel Point Infrastructure Improvement District, CT, Special Obligation Rev. (Steel Point Harbor Project), 4%, 4/01/2051 (n) | $ | 630,000 | $475,779 | |
| West Haven, CT, General Obligation, BAM, 4%, 3/15/2035 | 728,000 | 696,520 | ||
| West Haven, CT, General Obligation, BAM, 4%, 3/15/2040 | 590,000 | 531,909 | ||
| $40,805,348 | ||||
| Delaware - 0.0% | ||||
| Delaware Economic Development Authority Rev. (Newark Charter School, Inc.), “A”, 5%, 9/01/2036 | $ | 185,000 | $186,196 | |
| Delaware Economic Development Authority Rev. (Newark Charter School, Inc.), “A”, 5%, 9/01/2046 | 375,000 | 356,405 | ||
| $542,601 | ||||
| District of Columbia - 0.6% | ||||
| District of Columbia Student Dormitory Rev. (Provident Group - Howard Properties LLC), 5%, 10/01/2030 | $ | 2,705,000 | $2,624,282 | |
| District of Columbia Student Dormitory Rev. (Provident Group - Howard Properties LLC), 5%, 10/01/2035 | 3,545,000 | 3,340,309 | ||
| District of Columbia Student Dormitory Rev. (Provident Group - Howard Properties LLC), 5%, 10/01/2045 | 720,000 | 636,697 | ||
| District of Columbia University Rev. (Georgetown University), 5%, 4/01/2035 | 2,360,000 | 2,411,723 | ||
| Metropolitan Washington, D.C., Airport Authority System Refunding Rev., “A”, 5%, 10/01/2031 | 4,720,000 | 4,964,601 | ||
| Metropolitan Washington, D.C., Airport Authority System Refunding Rev., “A”, 5%, 10/01/2032 | 3,150,000 | 3,315,106 | ||
| Metropolitan Washington, D.C., Airport Authority System Refunding Rev., “A”, 5%, 10/01/2034 | 7,870,000 | 8,230,956 | ||
| Metropolitan Washington, D.C., Airport Authority, Dulles Toll Road Rev. (Dulles Metrorail and Capital Improvement Projects), “A”, AGM, 4%, 10/01/2052 | 2,085,000 | 1,795,041 | ||
| Metropolitan Washington, D.C., Airport Authority, Dulles Toll Road Rev. (Dulles Metrorail and Capital Improvement Projects), “B”, AGM, 4%, 10/01/2049 | 1,575,000 | 1,380,144 | ||
| Metropolitan Washington, D.C., Airport Authority, Toll Road Subordinate Lien Refunding Rev. (Dulles Metrorail and Capital Improvement Project), “B”, AGM, 4%, 10/01/2053 | 1,250,000 | 1,078,134 | ||
| $29,776,993 | ||||
24
Portfolio of Investments (unaudited)
– continued
| Issuer | Shares/Par | Value ($) | ||
| Municipal Bonds - continued | ||||
| Florida - 4.1% | ||||
| Alachua County, FL, Health Facilities Authority, Continuing Care Retirement Community Rev. (Oak Hammock, Inc. at the University of Florida), 4%, 10/01/2040 | $ | 520,000 | $406,388 | |
| Alachua County, FL, Health Facilities Authority, Continuing Care Retirement Community Rev. (Oak Hammock, Inc. at the University of Florida), 4%, 10/01/2046 | 700,000 | 505,825 | ||
| Alachua County, FL, Health Facilities Authority, Health Facilities Rev. (Shands Teaching Hospital and Clinics, Inc. at the University of Florida), “B-1”, 5%, 12/01/2035 | 795,000 | 807,806 | ||
| Alachua County, FL, Health Facilities Authority, Health Facilities Rev. (Shands Teaching Hospital and Clinics, Inc. at the University of Florida), “B-1”, 5%, 12/01/2036 | 1,345,000 | 1,356,671 | ||
| Alachua County, FL, Health Facilities Authority, Health Facilities Rev. (Shands Teaching Hospital and Clinics, Inc. at the University of Florida), “B-1”, 5%, 12/01/2037 | 1,750,000 | 1,752,386 | ||
| Arborwood Community Development District, FL, Capital Improvement Rev., “A-1”, 6.9%, 5/01/2036 | 20,000 | 19,604 | ||
| Bellalago, FL, Educational Facilities Benefit District Capital Improvement Refunding Rev., 4.375%, 5/01/2030 | 825,000 | 825,624 | ||
| Bellalago, FL, Educational Facilities Benefit District Capital Improvement Refunding Rev., 4.5%, 5/01/2033 | 385,000 | 381,960 | ||
| Broward County, FL, Airport System Rev., 5%, 10/01/2042 | 855,000 | 852,554 | ||
| Broward County, FL, Airport System Rev., “A”, 5%, 10/01/2038 | 2,360,000 | 2,369,394 | ||
| Broward County, FL, Airport System Rev., “A”, 5%, 10/01/2039 | 3,540,000 | 3,543,776 | ||
| Broward County, FL, Airport System Rev., “A”, 5%, 10/01/2044 | 2,755,000 | 2,743,031 | ||
| Collier County, FL, Health Facilities Authority, Residential Care Facility Rev. (The Moorings, Inc.), 4%, 5/01/2052 | 4,070,000 | 3,143,611 | ||
| Collier County, FL, Industrial Development Authority, Continuing Care Community Rev. (Arlington of Naples Project), “A”, 6.25%, 5/15/2035 (a)(d)(z) | 75,307 | 4,142 | ||
| Collier County, FL, Industrial Development Authority, Continuing Care Community Rev. (Arlington of Naples Project), “A”, 7.75%, 5/15/2035 (a)(d)(z) | 492,158 | 27,069 | ||
| Collier County, FL, Industrial Development Authority, Continuing Care Community Rev. (Arlington of Naples Project), “A”, 8.125%, 5/15/2044 (a)(d)(z) | 741,965 | 40,808 | ||
| Collier County, FL, Industrial Development Authority, Continuing Care Community Rev. (Arlington of Naples Project), “A”, 6.5%, 5/15/2049 (a)(d)(z) | 135,552 | 7,455 | ||
| Daytona Beach, FL, Halifax Hospital Medical Center Rev., 5%, 6/01/2029 (Prerefunded 6/01/2025) | 1,065,000 | 1,084,853 | ||
| Daytona Beach, FL, Halifax Hospital Medical Center Rev., 5%, 6/01/2030 (Prerefunded 6/01/2025) | 1,120,000 | 1,140,879 | ||
25
Portfolio of Investments (unaudited)
– continued
| Issuer | Shares/Par | Value ($) | ||
| Municipal Bonds - continued | ||||
| Florida - continued | ||||
| Daytona Beach, FL, Halifax Hospital Medical Center Rev., 5%, 6/01/2036 | $ | 465,000 | $466,043 | |
| Florida Capital Region Community Development District, Capital Improvement Rev., “A-1”, 4.625%, 5/01/2028 | 80,000 | 78,990 | ||
| Florida Capital Region Community Development District, Capital Improvement Rev., “A-1”, 5.125%, 5/01/2039 | 495,000 | 470,504 | ||
| Florida Capital Trust Agency, Air Cargo Rev. (Aero Miami FX LLC), “A”, 5.35%, 7/01/2029 | 4,660,000 | 4,663,276 | ||
| Florida Capital Trust Agency, Educational Facilities Rev. (Liza Jackson Preparatory School, Inc. Project), “A”, 4%, 8/01/2030 | 80,000 | 75,078 | ||
| Florida Capital Trust Agency, Educational Facilities Rev. (Liza Jackson Preparatory School, Inc. Project), “A”, 5%, 8/01/2040 | 125,000 | 115,190 | ||
| Florida Capital Trust Agency, Educational Facilities Rev. (Liza Jackson Preparatory School, Inc. Project), “A”, 5%, 8/01/2055 | 385,000 | 329,300 | ||
| Florida Development Finance Corp. Educational Facilities Rev. (Drs. Kiran & Pallavi Patel 2017 Foundation for Global Understanding, Inc. Project), “A”, 3%, 7/01/2031 (n) | 100,000 | 88,407 | ||
| Florida Development Finance Corp. Educational Facilities Rev. (Drs. Kiran & Pallavi Patel 2017 Foundation for Global Understanding, Inc. Project), “A”, 4%, 7/01/2051 (n) | 510,000 | 392,180 | ||
| Florida Development Finance Corp. Educational Facilities Rev. (Mater Academy Projects), “A”, 5%, 6/15/2047 | 250,000 | 226,729 | ||
| Florida Development Finance Corp. Educational Facilities Rev. (Mater Academy Projects), “A”, 5%, 6/15/2052 | 880,000 | 782,417 | ||
| Florida Development Finance Corp. Educational Facilities Rev. (Mater Academy Projects), “A”, 5%, 6/15/2056 | 1,290,000 | 1,131,488 | ||
| Florida Development Finance Corp. Educational Facilities Rev. (Renaissance Charter School Projects), “C”, 4%, 9/15/2030 (n) | 220,000 | 196,905 | ||
| Florida Development Finance Corp. Educational Facilities Rev. (Renaissance Charter School Projects), “C”, 5%, 9/15/2040 (n) | 395,000 | 335,374 | ||
| Florida Development Finance Corp. Educational Facilities Rev. (Renaissance Charter School Projects), “C”, 5%, 9/15/2050 (n) | 775,000 | 604,451 | ||
| Florida Development Finance Corp. Educational Facilities Rev. (River City Science Academy Projects), “A”, 4%, 7/01/2035 | 120,000 | 107,788 | ||
| Florida Development Finance Corp. Educational Facilities Rev. (River City Science Academy Projects), “A”, 4%, 7/01/2045 | 225,000 | 173,990 | ||
| Florida Development Finance Corp. Educational Facilities Rev. (River City Science Academy Projects), “A”, 4%, 7/01/2055 | 315,000 | 224,452 | ||
| Florida Development Finance Corp. Educational Facilities Rev. (River City Science Academy Projects), “A-1”, 5%, 7/01/2042 | 170,000 | 157,060 | ||
| Florida Development Finance Corp. Educational Facilities Rev. (River City Science Academy Projects), “A-1”, 5%, 7/01/2051 | 155,000 | 136,334 | ||
26
Portfolio of Investments (unaudited)
– continued
| Issuer | Shares/Par | Value ($) | ||
| Municipal Bonds - continued | ||||
| Florida - continued | ||||
| Florida Development Finance Corp. Educational Facilities Rev. (River City Science Academy Projects), “A-1”, 5%, 2/01/2057 | $ | 185,000 | $159,716 | |
| Florida Development Finance Corp. Educational Facilities Rev. (Southwest Charter Foundation, Inc. Project), “A”, 6%, 6/15/2037 (n) | 305,000 | 279,875 | ||
| Florida Development Finance Corp. Educational Facilities Rev. (Southwest Charter Foundation, Inc. Project), “A”, 6.125%, 6/15/2047 (n) | 930,000 | 812,253 | ||
| Florida Development Finance Corp. Healthcare Facilities Rev. (UF Health Jacksonville Project), “A”, AGM, 4%, 2/01/2046 | 5,120,000 | 4,424,887 | ||
| Florida Development Finance Corp. Senior Living Rev. (Glenridge on Palmer Ranch Project), 5%, 6/01/2031 (n) | 540,000 | 511,302 | ||
| Florida Development Finance Corp. Senior Living Rev. (Glenridge on Palmer Ranch Project), 5%, 6/01/2035 (n) | 320,000 | 290,407 | ||
| Florida Development Finance Corp. Senior Living Rev. (Glenridge on Palmer Ranch Project), 5%, 6/01/2051 (n) | 6,605,000 | 5,124,262 | ||
| Florida Development Finance Corp. Senior Living Rev. (Mayflower Retirement Community Project), “A”, 4%, 6/01/2036 (n) | 645,000 | 487,350 | ||
| Florida Development Finance Corp. Senior Living Rev. (Mayflower Retirement Community Project), “A”, 4%, 6/01/2041 (n) | 330,000 | 228,170 | ||
| Florida Development Finance Corp. Senior Living Rev. (Mayflower Retirement Community Project), “A”, 4%, 6/01/2046 (n) | 390,000 | 249,640 | ||
| Florida Development Finance Corp. Senior Living Rev. (Mayflower Retirement Community Project), “B-1”, 2.375%, 6/01/2027 (n) | 100,000 | 94,874 | ||
| Florida Higher Educational Facilities Financing Authority Rev. (Florida Institute of Technology), 5%, 10/01/2031 | 740,000 | 750,351 | ||
| Florida Higher Educational Facilities Financing Authority Rev. (Florida Institute of Technology), 5%, 10/01/2033 | 1,020,000 | 1,030,840 | ||
| Florida Higher Educational Facilities Financing Authority Rev. (Florida Institute of Technology), 5%, 10/01/2034 | 845,000 | 851,282 | ||
| Florida Higher Educational Facilities Financing Authority Rev. (Florida Institute of Technology), 5%, 10/01/2035 | 470,000 | 471,213 | ||
| Florida Higher Educational Facilities Financing Authority Rev. (Florida Institute of Technology), 5%, 10/01/2036 | 645,000 | 640,157 | ||
| Florida Higher Educational Facilities Financing Authority Rev. (Florida Institute of Technology), 4%, 10/01/2037 | 900,000 | 784,065 | ||
| Florida Higher Educational Facilities Financing Authority Rev. (Florida Institute of Technology), 4%, 10/01/2038 | 1,240,000 | 1,063,983 | ||
| Florida Higher Educational Facilities Financing Authority Rev. (Florida Institute of Technology), 4%, 10/01/2039 | 1,480,000 | 1,252,976 | ||
| Florida Higher Educational Facilities Financing Authority Rev. (Florida Institute of Technology), 4%, 10/01/2044 | 2,310,000 | 1,836,670 | ||
27
Portfolio of Investments (unaudited)
– continued
| Issuer | Shares/Par | Value ($) | ||
| Municipal Bonds - continued | ||||
| Florida - continued | ||||
| Florida Higher Educational Facilities Financing Authority Rev. (Jacksonville University Project), “A”, 4.5%, 6/01/2033 (n) | $ | 435,000 | $405,489 | |
| Florida Higher Educational Facilities Financing Authority Rev. (Jacksonville University Project), “A”, 4.75%, 6/01/2038 (n) | 1,990,000 | 1,763,760 | ||
| Florida Higher Educational Facilities Financing Authority Rev. (Jacksonville University Project), “A”, 5%, 6/01/2048 (n) | 1,785,000 | 1,502,172 | ||
| Florida Housing Finance Corp., Homeowner Mortgage Rev., “1”, FHLMC, 4%, 7/01/2049 | 2,360,000 | 2,319,188 | ||
| Florida Housing Finance Corp., Homeowner Mortgage Rev., “1”, GNMA, 3%, 1/01/2052 | 4,785,000 | 4,527,546 | ||
| Florida Housing Finance Corp., Homeowner Mortgage Rev., “1”, GNMA, 3.5%, 7/01/2052 | 7,720,000 | 7,362,460 | ||
| Florida Housing Finance Corp., Homeowner Mortgage Rev., “2”, GNMA, 3%, 7/01/2052 | 5,795,000 | 5,442,604 | ||
| Florida Mid-Bay Bridge Authority Rev., “A”, 5%, 10/01/2035 | 2,560,000 | 2,566,262 | ||
| Hillsborough County FL, Industrial Development Authority, Hospital Rev. (Tampa General Hospital Project), “A”, 4%, 8/01/2055 | 1,875,000 | 1,490,743 | ||
| Jacksonville, FL, Educational Facilities Rev. (Jacksonville University Project), “B”, 5%, 6/01/2053 (n) | 450,000 | 369,272 | ||
| Lakeland, FL, Hospital Rev. (Lakeland Regional Health Systems), 5%, 11/15/2034 (Prerefunded 11/15/2024) | 1,525,000 | 1,544,401 | ||
| Lakewood Ranch Stewardship District, FL, Special Assessment Rev. (Lakewood Centre North Project), 4.875%, 5/01/2035 | 95,000 | 91,535 | ||
| Lakewood Ranch Stewardship District, FL, Special Assessment Rev. (Lakewood Centre North Project), 4.875%, 5/01/2045 | 150,000 | 132,492 | ||
| Lakewood Ranch Stewardship District, FL, Special Assessment Rev. (Lakewood National and Polo Run Projects), 5.375%, 5/01/2047 | 480,000 | 466,494 | ||
| Lakewood Ranch Stewardship District, FL, Special Assessment Rev. (Taylor Ranch Project), 6.125%, 5/01/2043 (w) | 1,080,000 | 1,081,497 | ||
| Lakewood Ranch Stewardship District, FL, Special Assessment Rev. (Taylor Ranch Project), 6.3%, 5/01/2054 (w) | 1,500,000 | 1,499,831 | ||
| Lee County, FL, Industrial Development Authority Healthcare Facilities Rev. (Shell Point Alliance), 5%, 11/15/2044 | 1,620,000 | 1,483,526 | ||
| Lee County, FL, Industrial Development Authority Healthcare Facilities Rev. (Shell Point Alliance), 5%, 11/15/2049 | 1,705,000 | 1,520,452 | ||
| Manatee Country, FL, Public Utilities Improvement Refunding Rev., 4%, 10/01/2048 | 10,000,000 | 8,687,320 | ||
| Manatee Country, FL, Public Utilities Improvement Refunding Rev., 4%, 10/01/2053 | 6,750,000 | 5,772,971 | ||
| Miami Beach, FL, Health Facilities Authority Hospital Rev. (Mount Sinai Medical Center of Florida), “B”, 4%, 11/15/2051 | 9,745,000 | 7,800,357 | ||
28
Portfolio of Investments (unaudited)
– continued
| Issuer | Shares/Par | Value ($) | ||
| Municipal Bonds - continued | ||||
| Florida - continued | ||||
| Miami-Dade County, FL, Seaport Refunding Rev., “A”, 5.25%, 10/01/2052 | $ | 1,630,000 | $1,618,721 | |
| Miami-Dade County, FL, Seaport Refunding Rev., “A-1”, AGM, 4%, 10/01/2045 | 4,880,000 | 4,136,909 | ||
| Midtown Miami, FL, Community Development District Special Assessment (Infrastructure Project), “B”, 5%, 5/01/2029 | 225,000 | 220,875 | ||
| Midtown Miami, FL, Community Development District Special Assessment (Infrastructure Project), “B”, 5%, 5/01/2037 | 110,000 | 102,883 | ||
| Midtown Miami, FL, Community Development District Special Assessment (Parking Garage Project), “A”, 5%, 5/01/2037 | 185,000 | 173,030 | ||
| Orange County, FL, Health Facilities Authority Hospital Rev. (Orlando Health Obligated Group), “A”, 5%, 10/01/2053 | 8,320,000 | 8,222,467 | ||
| Orange County, FL, Health Facilities Authority Rev. (Presbyterian Retirement Communities Obligated Group Project), “A”, 4%, 8/01/2036 | 1,000,000 | 882,068 | ||
| Orange County, FL, Health Facilities Authority Rev. (Presbyterian Retirement Communities Obligated Group Project), “A”, 4%, 8/01/2042 | 3,625,000 | 2,946,595 | ||
| Orange County, FL, Health Facilities Authority Rev. (Presbyterian Retirement Communities Obligated Group Project), “A”, 4%, 8/01/2047 | 4,085,000 | 3,149,634 | ||
| Osceola County, FL, Transportation Improvement and Refunding Rev. (Osceola Parkway), “A-1”, 5%, 10/01/2044 | 590,000 | 571,188 | ||
| Osceola County, FL, Transportation Improvement and Refunding Rev. (Osceola Parkway), Capital Appreciation, “A-2”, 0%, 10/01/2035 | 435,000 | 237,267 | ||
| Osceola County, FL, Transportation Improvement and Refunding Rev. (Osceola Parkway), Capital Appreciation, “A-2”, 0%, 10/01/2036 | 520,000 | 264,026 | ||
| Osceola County, FL, Transportation Improvement and Refunding Rev. (Osceola Parkway), Capital Appreciation, “A-2”, 0%, 10/01/2037 | 200,000 | 94,596 | ||
| Osceola County, FL, Transportation Improvement and Refunding Rev. (Osceola Parkway), Capital Appreciation, “A-2”, 0%, 10/01/2038 | 610,000 | 269,625 | ||
| Osceola County, FL, Transportation Improvement and Refunding Rev. (Osceola Parkway), Capital Appreciation, “A-2”, 0%, 10/01/2039 | 725,000 | 300,569 | ||
| Osceola County, FL, Transportation Improvement and Refunding Rev. (Osceola Parkway), Capital Appreciation, “A-2”, 0%, 10/01/2040 | 775,000 | 300,371 | ||
29
Portfolio of Investments (unaudited)
– continued
| Issuer | Shares/Par | Value ($) | ||
| Municipal Bonds - continued | ||||
| Florida - continued | ||||
| Osceola County, FL, Transportation Improvement and Refunding Rev. (Osceola Parkway), Capital Appreciation, “A-2”, 0%, 10/01/2041 | $ | 865,000 | $314,231 | |
| Osceola County, FL, Transportation Improvement and Refunding Rev. (Osceola Parkway), Capital Appreciation, “A-2”, 0%, 10/01/2042 | 695,000 | 234,194 | ||
| Palm Beach County, FL, Health Facilities Authority Hospital Rev. (Baptist Health South Florida Obligated Group), 4%, 8/15/2049 | 7,700,000 | 6,754,890 | ||
| Palm Beach County, FL, Health Facilities Authority Hospital Rev. (Jupiter Medical Center Project), “A”, 5%, 11/01/2047 | 755,000 | 696,217 | ||
| Palm Beach County, FL, Health Facilities Authority Hospital Rev. (Jupiter Medical Center Project), “A”, 5%, 11/01/2052 | 985,000 | 898,382 | ||
| Palm Beach County, FL, Health Facilities Authority Retirement Communities Rev. (Acts Retirement-Life Communities, Inc. Obligated Group), “B”, 5%, 11/15/2042 | 700,000 | 664,430 | ||
| Palm Beach County, FL, Health Facilities Authority Rev. (Toby & Leon Cooperman Sinai Residences of Boca Raton), 4%, 6/01/2031 | 480,000 | 432,656 | ||
| Palm Beach County, FL, Health Facilities Authority Rev. (Toby & Leon Cooperman Sinai Residences of Boca Raton), 4%, 6/01/2036 | 790,000 | 651,193 | ||
| Palm Beach County, FL, Health Facilities Authority Rev. (Toby & Leon Cooperman Sinai Residences of Boca Raton), 4%, 6/01/2041 | 515,000 | 387,111 | ||
| Palm Beach County, FL, Health Facilities Authority Rev. (Toby & Leon Cooperman Sinai Residences of Boca Raton), 4.25%, 6/01/2056 | 3,250,000 | 2,212,098 | ||
| Pasco County, FL, Capital Improvement Cigarette Tax Allocation, “A”, AGM, 5%, 9/01/2048 | 4,540,000 | 4,572,747 | ||
| Pasco County, FL, Capital Improvement Cigarette Tax Allocation, “A”, AGM, 5.75%, 9/01/2054 | 4,430,000 | 4,712,179 | ||
| Pasco County, FL, Del Webb Bexley Community Development District, Special Assessment Rev., 5.3%, 5/01/2039 | 540,000 | 521,922 | ||
| Pasco County, FL, Del Webb Bexley Community Development District, Special Assessment Rev., 5.4%, 5/01/2049 | 700,000 | 647,323 | ||
| Pompano Beach, FL, Refunding Rev. (John Knox Village Project), 4%, 9/01/2040 | 160,000 | 126,430 | ||
| Pompano Beach, FL, Refunding Rev. (John Knox Village Project), 4%, 9/01/2050 | 4,215,000 | 2,957,504 | ||
| Pompano Beach, FL, Refunding Rev. (John Knox Village Project), “A”, 4%, 9/01/2051 | 3,020,000 | 2,103,468 | ||
| Pompano Beach, FL, Refunding Rev. (John Knox Village Project), “A”, 4%, 9/01/2056 | 4,500,000 | 3,029,052 | ||
| Pompano Beach, FL, Refunding Rev. (John Knox Village Project), “B-2”, 1.45%, 1/01/2027 | 575,000 | 509,314 | ||
30
Portfolio of Investments (unaudited)
– continued
| Issuer | Shares/Par | Value ($) | ||
| Municipal Bonds - continued | ||||
| Florida - continued | ||||
| South Miami, FL, Health Facilities Authority Hospital Refunding Rev. (Baptist Health South Florida Obligated Group), 4%, 8/15/2047 | $ | 13,610,000 | $12,092,037 | |
| St. John's County, FL, Industrial Development Authority, Senior Living Rev. (Vicars Landing Project), “A”, 4%, 12/15/2027 | 85,000 | 79,604 | ||
| St. John's County, FL, Industrial Development Authority, Senior Living Rev. (Vicars Landing Project), “A”, 4%, 12/15/2028 | 80,000 | 74,050 | ||
| St. John's County, FL, Industrial Development Authority, Senior Living Rev. (Vicars Landing Project), “A”, 4%, 12/15/2029 | 85,000 | 77,869 | ||
| St. John's County, FL, Industrial Development Authority, Senior Living Rev. (Vicars Landing Project), “A”, 4%, 12/15/2030 | 75,000 | 67,923 | ||
| St. John's County, FL, Industrial Development Authority, Senior Living Rev. (Vicars Landing Project), “A”, 4%, 12/15/2031 | 80,000 | 71,621 | ||
| St. John's County, FL, Industrial Development Authority, Senior Living Rev. (Vicars Landing Project), “A”, 4%, 12/15/2036 | 375,000 | 308,454 | ||
| St. John's County, FL, Industrial Development Authority, Senior Living Rev. (Vicars Landing Project), “A”, 4%, 12/15/2041 | 285,000 | 215,087 | ||
| St. John's County, FL, Industrial Development Authority, Senior Living Rev. (Vicars Landing Project), “A”, 4%, 12/15/2046 | 285,000 | 201,544 | ||
| St. John's County, FL, Industrial Development Authority, Senior Living Rev. (Vicars Landing Project), “A”, 4%, 12/15/2050 | 275,000 | 187,250 | ||
| Sterling Hill Community Development District, FL, Capital Improvement Rev., “B”, 5.5%, 11/01/2010 (d) | 42,764 | 21,809 | ||
| Sumter County, FL, Industrial Development Authority Hospital Rev. (Central Florida Health Alliance Projects), “A”, 5%, 7/01/2026 | 195,000 | 195,294 | ||
| Sumter County, FL, Industrial Development Authority Hospital Rev. (Central Florida Health Alliance Projects), “A”, 5%, 7/01/2029 | 180,000 | 180,210 | ||
| Sumter County, FL, Industrial Development Authority Hospital Rev. (Central Florida Health Alliance Projects), “A”, 5.125%, 7/01/2034 | 385,000 | 385,558 | ||
| Sumter County, FL, Industrial Development Authority Hospital Rev. (Central Florida Health Alliance Projects), “A”, 5.25%, 7/01/2044 | 1,145,000 | 1,101,015 | ||
| Tallahassee, FL, Health Facilities Rev. (Tallahassee Memorial Healthcare, Inc.), “A”, 5%, 12/01/2055 | 875,000 | 770,342 | ||
| Tampa, FL, Capital Improvement Cigarette Tax Allocation (H. Lee Moffitt Cancer Center Project), Capital Appreciation, “A”, 0%, 9/01/2034 | 1,125,000 | 647,844 | ||
| Tampa, FL, Capital Improvement Cigarette Tax Allocation (H. Lee Moffitt Cancer Center Project), Capital Appreciation, “A”, 0%, 9/01/2035 | 620,000 | 334,378 | ||
| Tampa, FL, Capital Improvement Cigarette Tax Allocation (H. Lee Moffitt Cancer Center Project), Capital Appreciation, “A”, 0%, 9/01/2036 | 955,000 | 480,714 | ||
31
Portfolio of Investments (unaudited)
– continued
| Issuer | Shares/Par | Value ($) | ||
| Municipal Bonds - continued | ||||
| Florida - continued | ||||
| Tampa, FL, Capital Improvement Cigarette Tax Allocation (H. Lee Moffitt Cancer Center Project), Capital Appreciation, “A”, 0%, 9/01/2037 | $ | 450,000 | $210,822 | |
| Tampa, FL, Capital Improvement Cigarette Tax Allocation (H. Lee Moffitt Cancer Center Project), Capital Appreciation, “A”, 0%, 9/01/2038 | 620,000 | 271,611 | ||
| Tampa, FL, Capital Improvement Cigarette Tax Allocation (H. Lee Moffitt Cancer Center Project), Capital Appreciation, “A”, 0%, 9/01/2039 | 620,000 | 254,740 | ||
| Tampa, FL, Capital Improvement Cigarette Tax Allocation (H. Lee Moffitt Cancer Center Project), Capital Appreciation, “A”, 0%, 9/01/2040 | 845,000 | 325,448 | ||
| Tampa, FL, Capital Improvement Cigarette Tax Allocation (H. Lee Moffitt Cancer Center Project), Capital Appreciation, “A”, 0%, 9/01/2041 | 375,000 | 135,321 | ||
| Tampa, FL, Capital Improvement Cigarette Tax Allocation (H. Lee Moffitt Cancer Center Project), Capital Appreciation, “A”, 0%, 9/01/2042 | 375,000 | 126,409 | ||
| Tampa, FL, Hospital Rev. (H. Lee Moffitt Cancer Center Project), “B”, 4%, 7/01/2038 | 245,000 | 219,668 | ||
| Tampa, FL, Hospital Rev. (H. Lee Moffitt Cancer Center Project), “B”, 4%, 7/01/2039 | 245,000 | 217,145 | ||
| Tampa, FL, Hospital Rev. (H. Lee Moffitt Cancer Center Project), “B”, 4%, 7/01/2045 | 3,865,000 | 3,225,763 | ||
| Tampa, FL, Water and Wastewater Systems Rev., “A”, 5.25%, 10/01/2057 | 2,500,000 | 2,604,285 | ||
| Wildwood, FL, Special Assessment Rev. (Village Community Development District No. 15), 4.85%, 5/01/2038 | 325,000 | 313,140 | ||
| Wildwood, FL, Special Assessment Rev. (Village Community Development District No. 15), 5%, 5/01/2043 | 490,000 | 468,752 | ||
| Wildwood, FL, Special Assessment Rev. (Village Community Development District No. 15), 5.25%, 5/01/2054 | 935,000 | 888,623 | ||
| $193,614,932 | ||||
| Georgia - 2.9% | ||||
| Atlanta, GA, Airport Passenger Facility Charge and Subordinate Lien Rev., “D”, 4%, 7/01/2038 | $ | 4,680,000 | $4,332,928 | |
| Atlanta, GA, Airport Passenger Facility Charge and Subordinate Lien Rev., “D”, 4%, 7/01/2039 | 6,860,000 | 6,301,460 | ||
| Atlanta, GA, Geo. L. Smith II World Congress Center Authority Convention Center Hotel Rev., “B”, 3.625%, 1/01/2031 (n) | 1,040,000 | 875,899 | ||
| Atlanta, GA, Geo. L. Smith II World Congress Center Authority Convention Center Hotel Rev., “B”, 5%, 1/01/2036 (n) | 910,000 | 811,810 | ||
32
Portfolio of Investments (unaudited)
– continued
| Issuer | Shares/Par | Value ($) | ||
| Municipal Bonds - continued | ||||
| Georgia - continued | ||||
| Atlanta, GA, Geo. L. Smith II World Congress Center Authority Convention Center Hotel Rev., “B”, 5%, 1/01/2054 (n) | $ | 2,595,000 | $1,970,278 | |
| Bainbridge, GA, Combined Utilities Rev., BAM, 4%, 12/01/2051 | 4,825,000 | 4,083,107 | ||
| Bibb County, GA, Development Authority Rev. (USG Real Estate Foundation IX LLC Project), 4%, 6/01/2044 | 675,000 | 558,027 | ||
| Burke County, GA, Development Authority Pollution Control Rev. (Georgia Power Co. Plant Vogtle Project), 1.5%, 1/01/2040 (Put Date 2/03/2025) | 3,970,000 | 3,756,188 | ||
| Burke County, GA, Development Authority Pollution Control Rev. (Oglethorpe Power Corp. Vogtle Project), 4.125%, 11/01/2045 | 2,000,000 | 1,609,995 | ||
| Cherokee County, GA, Water and Sewerage Authority Rev., 4%, 8/01/2053 | 1,250,000 | 1,091,626 | ||
| Cobb County, GA, Development Authority Student Housing Refunding Rev. (Kennesaw State University Foundation, Inc.), “C”, 5%, 7/15/2030 | 505,000 | 508,386 | ||
| Cobb County, GA, Development Authority Student Housing Refunding Rev. (Kennesaw State University Foundation, Inc.), “C”, 5%, 7/15/2030 (Prerefunded 7/15/2025) | 10,000 | 10,201 | ||
| Cobb County, GA, Development Authority Student Housing Refunding Rev. (Kennesaw State University Foundation, Inc.), “C”, 5%, 7/15/2033 (Prerefunded 2/15/2025) | 40,000 | 40,803 | ||
| Cobb County, GA, Development Authority Student Housing Refunding Rev. (Kennesaw State University Foundation, Inc.), “C”, 5%, 7/15/2033 | 860,000 | 865,034 | ||
| Cobb County, GA, Kennestone Hospital Authority Rev. (WellStar Health System, Inc. Project), “B”, 4%, 4/01/2034 | 275,000 | 263,150 | ||
| Cobb County, GA, Kennestone Hospital Authority Rev. (WellStar Health System, Inc. Project), “B”, 4%, 4/01/2036 | 245,000 | 230,673 | ||
| Fulton County, GA, Development Authority Hospital Rev. (WellStar Health System, Inc. Project), “A”, 4%, 4/01/2050 | 2,670,000 | 2,240,626 | ||
| Fulton County, GA, Residential Care Facilities, Elderly Authority Rev. (Lenbrook Square Foundation, Inc. Project), 5%, 7/01/2042 | 5,275,000 | 4,723,892 | ||
| Georgia Housing & Finance Authority Rev., Single Family Mortgage, “A”, 4%, 12/01/2047 | 835,000 | 824,632 | ||
| Georgia Housing & Finance Authority Rev., Single Family Mortgage, “A-1”, 4%, 6/01/2044 | 55,000 | 54,887 | ||
| Georgia Main Street Natural Gas, Inc., Gas Project Rev., “A”, 5.5%, 9/15/2026 | 665,000 | 673,300 | ||
| Georgia Main Street Natural Gas, Inc., Gas Project Rev., “A”, 5.5%, 9/15/2028 | 1,370,000 | 1,406,524 | ||
| Georgia Main Street Natural Gas, Inc., Gas Project Rev., “A”, 5%, 5/15/2043 | 1,470,000 | 1,414,792 | ||
33
Portfolio of Investments (unaudited)
– continued
| Issuer | Shares/Par | Value ($) | ||
| Municipal Bonds - continued | ||||
| Georgia - continued | ||||
| Georgia Main Street Natural Gas, Inc., Gas Supply Rev., “A”, 5%, 5/15/2031 | $ | 4,530,000 | $4,473,807 | |
| Georgia Main Street Natural Gas, Inc., Gas Supply Rev., “A”, 5%, 6/01/2053 (Put Date 6/01/2030) | 17,500,000 | 17,355,742 | ||
| Georgia Main Street Natural Gas, Inc., Gas Supply Rev., “B”, 4%, 8/01/2049 (Put Date 12/02/2024) | 5,030,000 | 4,997,707 | ||
| Georgia Main Street Natural Gas, Inc., Gas Supply Rev., “C”, 4%, 3/01/2050 (Put Date 9/01/2026) | 1,670,000 | 1,632,196 | ||
| Georgia Main Street Natural Gas, Inc., Gas Supply Rev., “C”, 4%, 5/01/2052 (Put Date 12/01/2028) | 14,255,000 | 13,614,718 | ||
| Georgia Main Street Natural Gas, Inc., Gas Supply Rev., “C”, 5%, 9/01/2053 (Put Date 9/01/2030) | 9,915,000 | 10,018,421 | ||
| Georgia Main Street Natural Gas, Inc., Gas Supply Rev., “D”, 5%, 12/01/2054 (Put Date 12/01/2030) | 8,570,000 | 8,489,940 | ||
| Georgia Municipal Electric Authority (Plant Vogtle Units 3 & 4 Project J), “A”, AGM, 5%, 7/01/2064 | 4,175,000 | 4,194,171 | ||
| Georgia Municipal Electric Authority (Plant Vogtle Units 3 & 4 Project M), “A”, 5%, 1/01/2056 | 1,530,000 | 1,476,133 | ||
| Georgia Municipal Electric Authority (Plant Vogtle Units 3 & 4 Project M), “A”, AGM, 4%, 1/01/2046 | 590,000 | 511,455 | ||
| Georgia Municipal Electric Authority (Plant Vogtle Units 3 & 4 Project M), “A”, AGM, 5%, 1/01/2062 | 2,125,000 | 2,132,014 | ||
| Georgia Municipal Electric Authority (Plant Vogtle Units 3 & 4 Project P), “A”, 5.5%, 7/01/2064 | 4,415,000 | 4,422,038 | ||
| Georgia Municipal Electric Authority (Plant Vogtle Units 3 & 4 Project), “A”, AGM, 4%, 1/01/2046 | 945,000 | 819,194 | ||
| Georgia Municipal Electric Authority Power Rev., “GG”, 5%, 1/01/2026 | 2,415,000 | 2,415,989 | ||
| Georgia Ports Authority Rev., 4%, 7/01/2047 | 1,900,000 | 1,694,200 | ||
| Georgia Ports Authority Rev., 4%, 7/01/2052 | 2,985,000 | 2,593,563 | ||
| Glynn-Brunswick, GA, Memorial Hospital Authority Rev., Anticipation Certificates (Southeast Georgia Health System Project), 4%, 8/01/2035 | 240,000 | 211,633 | ||
| Glynn-Brunswick, GA, Memorial Hospital Authority Rev., Anticipation Certificates (Southeast Georgia Health System Project), 4%, 8/01/2036 | 265,000 | 234,657 | ||
| Glynn-Brunswick, GA, Memorial Hospital Authority Rev., Anticipation Certificates (Southeast Georgia Health System Project), 4%, 8/01/2037 | 185,000 | 159,917 | ||
| Hall County and Gainesville, GA, Hospital Authority Rev. (Northeast Georgia Health System, Inc. Project), “A”, 5%, 2/15/2042 | 3,150,000 | 3,152,733 | ||
34
Portfolio of Investments (unaudited)
– continued
| Issuer | Shares/Par | Value ($) | ||
| Municipal Bonds - continued | ||||
| Georgia - continued | ||||
| Hall County and Gainesville, GA, Hospital Authority Rev. (Northeast Georgia Health System, Inc. Project), “A”, 5%, 2/15/2045 | $ | 3,935,000 | $3,838,844 | |
| Hall County and Gainesville, GA, Hospital Authority Rev. (Northeast Georgia Health System, Inc. Project), “A”, 5.5%, 8/15/2054 (Prerefunded 2/15/2025) | 3,315,000 | 3,384,635 | ||
| Monroe County, GA, Development Authority Pollution Control Rev. (Oglethorpe Power Corp. Scherer Project), “A”, 1.5%, 1/01/2039 (Put Date 2/03/2025) | 2,950,000 | 2,791,122 | ||
| Walton County, GA, Water & Sewer Authority Rev. (Walton-Hard Labor Creek Reservoir Water Treatment Facility Project), 5%, 2/01/2053 | 1,325,000 | 1,368,210 | ||
| $134,631,257 | ||||
| Guam - 0.2% | ||||
| Guam Government Business Privilege Tax Refunding, “F”, 5%, 1/01/2030 | $ | 220,000 | $219,345 | |
| Guam Government Business Privilege Tax Refunding, “F”, 5%, 1/01/2031 | 295,000 | 293,076 | ||
| Guam Government Business Privilege Tax Refunding, “F”, 4%, 1/01/2042 | 2,235,000 | 1,808,756 | ||
| Guam International Airport Authority Rev., Taxable (A.B. Won Pat Airport), “A”, 3.839%, 10/01/2036 | 680,000 | 515,958 | ||
| Guam International Airport Authority Rev., Taxable (A.B. Won Pat Airport), “A”, 4.46%, 10/01/2043 | 770,000 | 543,531 | ||
| Guam Waterworks Authority Rev. (Water and Wastewater System), “A”, 5%, 1/01/2050 | 4,770,000 | 4,420,564 | ||
| $7,801,230 | ||||
| Hawaii - 0.0% | ||||
| Hawaii Harbor System Rev., “A”, 4%, 7/01/2035 | $ | 235,000 | $221,023 | |
| Illinois - 8.7% | ||||
| Bridgeview, IL, Stadium and Redevelopment Projects, Taxable, AAC, 5.14%, 12/01/2036 | $ | 7,230,000 | $6,241,481 | |
| Chicago, IL, Board of Education (School Reform), “A”, NPFG, 5.25%, 12/01/2023 | 2,750,000 | 2,751,968 | ||
| Chicago, IL, Board of Education (School Reform), Capital Appreciation, “A”, NPFG, 0%, 12/01/2028 | 7,785,000 | 6,083,515 | ||
| Chicago, IL, Board of Education (School Reform), Capital Appreciation, “A”, NPFG, 0%, 12/01/2029 | 2,590,000 | 1,921,558 | ||
| Chicago, IL, Board of Education (School Reform), Capital Appreciation, “A”, NPFG, 0%, 12/01/2030 | 1,125,000 | 790,581 | ||
35
Portfolio of Investments (unaudited)
– continued
| Issuer | Shares/Par | Value ($) | ||
| Municipal Bonds - continued | ||||
| Illinois - continued | ||||
| Chicago, IL, Board of Education (School Reform), Capital Appreciation, “B-1”, NPFG, 0%, 12/01/2023 | $ | 11,475,000 | $11,385,697 | |
| Chicago, IL, Board of Education (School Reform), Capital Appreciation, “B-1”, NPFG, 0%, 12/01/2026 | 2,680,000 | 2,304,478 | ||
| Chicago, IL, Board of Education (School Reform), Capital Appreciation, “B-1”, NPFG, 0%, 12/01/2028 | 3,065,000 | 2,395,115 | ||
| Chicago, IL, Board of Education, Dedicated Capital Improvement Tax Bond, 5%, 4/01/2033 | 270,000 | 274,194 | ||
| Chicago, IL, Board of Education, Dedicated Capital Improvement Tax Bond, 5%, 4/01/2033 | 220,000 | 224,639 | ||
| Chicago, IL, Board of Education, Dedicated Capital Improvement Tax Bond, 5%, 4/01/2036 | 795,000 | 800,717 | ||
| Chicago, IL, Board of Education, Dedicated Capital Improvement Tax Bond, 5%, 4/01/2037 | 795,000 | 797,233 | ||
| Chicago, IL, Board of Education, Dedicated Capital Improvement Tax Bond, 5%, 4/01/2042 | 1,405,000 | 1,360,219 | ||
| Chicago, IL, Board of Education, Dedicated Capital Improvement Tax Bond, 5%, 4/01/2045 | 2,800,000 | 2,763,870 | ||
| Chicago, IL, Board of Education, Dedicated Capital Improvement Tax Bond, 5%, 4/01/2046 | 1,965,000 | 1,858,670 | ||
| Chicago, IL, Board of Education, Dedicated Capital Improvement Tax Bond, 6%, 4/01/2046 | 11,885,000 | 12,221,246 | ||
| Chicago, IL, Board of Education, Dedicated Capital Improvement Tax Bond, 5.75%, 4/01/2048 | 6,350,000 | 6,647,788 | ||
| Chicago, IL, Board of Education, Unlimited Tax General Obligation Dedicated Rev., “A”, 4%, 12/01/2047 | 13,010,000 | 10,106,387 | ||
| Chicago, IL, Board of Education, Unlimited Tax General Obligation Dedicated Rev., “A”, AAC, 5.5%, 12/01/2028 | 1,070,000 | 1,085,450 | ||
| Chicago, IL, Board of Education, Unlimited Tax General Obligation Dedicated Rev., “A”, AAC, 5.5%, 12/01/2029 | 610,000 | 619,996 | ||
| Chicago, IL, Board of Education, Unlimited Tax General Obligation Dedicated Rev., “A”, AAC, 5.5%, 12/01/2030 | 535,000 | 545,178 | ||
| Chicago, IL, Board of Education, Unlimited Tax General Obligation Dedicated Rev., “A”, AAC, 5.5%, 12/01/2031 | 1,425,000 | 1,454,029 | ||
| Chicago, IL, Board of Education, Unlimited Tax General Obligation Dedicated Rev., “C”, AGM, 5%, 12/01/2030 | 2,260,000 | 2,306,451 | ||
| Chicago, IL, Board of Education, Unlimited Tax General Obligation Dedicated Rev., “C”, AGM, 5%, 12/01/2031 | 4,200,000 | 4,285,919 | ||
| Chicago, IL, Board of Education, Unlimited Tax General Obligation Refunding Dedicated Rev., “A”, 5%, 12/01/2042 | 9,915,000 | 9,126,596 | ||
| Chicago, IL, Board of Education, Unlimited Tax General Obligation Refunding Dedicated Rev., “A”, 4%, 12/01/2043 | 1,000,000 | 805,778 | ||
36
Portfolio of Investments (unaudited)
– continued
| Issuer | Shares/Par | Value ($) | ||
| Municipal Bonds - continued | ||||
| Illinois - continued | ||||
| Chicago, IL, Board of Education, Unlimited Tax General Obligation Refunding Dedicated Rev., “A”, AGM, 5%, 12/01/2030 | $ | 200,000 | $204,111 | |
| Chicago, IL, Board of Education, Unlimited Tax General Obligation Refunding Dedicated Rev., “A”, AGM, 5%, 12/01/2033 | 180,000 | 183,603 | ||
| Chicago, IL, Board of Education, Unlimited Tax General Obligation Refunding Dedicated Rev., “A”, AGM, 5%, 12/01/2034 | 175,000 | 178,164 | ||
| Chicago, IL, Board of Education, Unlimited Tax General Obligation Refunding Dedicated Rev., “A”, AGM, 5%, 12/01/2035 | 130,000 | 131,743 | ||
| Chicago, IL, Board of Education, Unlimited Tax General Obligation Refunding Dedicated Rev., “B”, 4%, 12/01/2036 | 955,000 | 831,555 | ||
| Chicago, IL, Board of Education, Unlimited Tax General Obligation Refunding Dedicated Rev., “B”, 4%, 12/01/2039 | 1,500,000 | 1,265,292 | ||
| Chicago, IL, Board of Education, Unlimited Tax General Obligation Refunding Dedicated Rev., “B”, 4%, 12/01/2040 | 980,000 | 815,417 | ||
| Chicago, IL, Board of Education, Unlimited Tax General Obligation Refunding Dedicated Rev., “B”, 4%, 12/01/2041 | 6,865,000 | 5,641,571 | ||
| Chicago, IL, Board of Education, Unlimited Tax General Obligation Refunding Dedicated Rev., “G”, 5%, 12/01/2034 | 950,000 | 951,777 | ||
| Chicago, IL, Board of Education, Unlimited Tax General Obligation Refunding Dedicated Rev., “H”, 5%, 12/01/2036 | 2,555,000 | 2,488,387 | ||
| Chicago, IL, Board of Education, Unlimited Tax General Obligation Refunding Dedicated Rev., “H”, 5%, 12/01/2046 | 2,895,000 | 2,618,750 | ||
| Chicago, IL, City Colleges Capital Improvement Project, Capital Appreciation, NPFG, 0%, 1/01/2026 | 7,625,000 | 6,967,958 | ||
| Chicago, IL, City Colleges Capital Improvement Project, Capital Appreciation, NPFG, 0%, 1/01/2027 | 1,435,000 | 1,262,653 | ||
| Chicago, IL, General Obligation (Chicago Works), “A”, 5.5%, 1/01/2039 | 5,435,000 | 5,581,324 | ||
| Chicago, IL, General Obligation (Chicago Works), “A”, 5.5%, 1/01/2041 | 1,740,000 | 1,767,395 | ||
| Chicago, IL, General Obligation (Chicago Works), “A”, 5.5%, 1/01/2043 | 435,000 | 439,791 | ||
| Chicago, IL, General Obligation, “A”, 5%, 1/01/2025 | 590,000 | 594,589 | ||
| Chicago, IL, General Obligation, “A”, 5%, 1/01/2027 | 2,095,000 | 2,140,569 | ||
| Chicago, IL, General Obligation, “A”, 5%, 1/01/2028 | 480,000 | 492,769 | ||
| Chicago, IL, General Obligation, “A”, 5%, 1/01/2029 | 5,580,000 | 5,757,183 | ||
| Chicago, IL, General Obligation, “A”, 4%, 1/01/2035 | 1,970,000 | 1,798,480 | ||
| Chicago, IL, General Obligation, “A”, 5.25%, 1/01/2038 | 7,390,000 | 7,483,554 | ||
| Chicago, IL, General Obligation, “A”, 5%, 1/01/2039 | 1,435,000 | 1,429,702 | ||
| Chicago, IL, General Obligation, “A”, 5%, 1/01/2040 | 280,000 | 277,350 | ||
| Chicago, IL, General Obligation, “A”, 5%, 1/01/2044 | 3,540,000 | 3,426,236 | ||
| Chicago, IL, General Obligation, “A”, 5.5%, 1/01/2049 | 5,505,000 | 5,517,205 | ||
| Chicago, IL, General Obligation, “D”, 5.5%, 1/01/2033 | 740,000 | 746,380 | ||
37
Portfolio of Investments (unaudited)
– continued
| Issuer | Shares/Par | Value ($) | ||
| Municipal Bonds - continued | ||||
| Illinois - continued | ||||
| Chicago, IL, General Obligation, Refunding, “A”, 5.625%, 1/01/2031 | $ | 240,000 | $249,257 | |
| Chicago, IL, Metropolitan Pier & Exposition Authority Refunding Bonds (McCormick Place Expansion Project), “A”, 4%, 12/15/2047 | 2,605,000 | 2,148,641 | ||
| Chicago, IL, Metropolitan Pier & Exposition Authority Refunding Bonds (McCormick Place Expansion Project), “A”, 4%, 6/15/2052 | 4,340,000 | 3,476,126 | ||
| Chicago, IL, Metropolitan Pier & Exposition Authority Rev. (McCormick Place Expansion Project), “A”, 5%, 6/15/2053 | 3,335,000 | 3,197,189 | ||
| Chicago, IL, Metropolitan Pier & Exposition Authority Rev. (McCormick Place Expansion Project), “A”, 5%, 6/15/2057 | 6,090,000 | 5,825,567 | ||
| Chicago, IL, Metropolitan Pier & Exposition Authority Rev. (McCormick Place Expansion Project), Capital Appreciation, “A”, AGM, 0%, 12/15/2056 | 4,020,000 | 681,761 | ||
| Chicago, IL, Metropolitan Pier & Exposition Authority, Dedicated State Tax Rev. (McCormick Place Expansion Project), NPFG, 5.5%, 6/15/2029 | 4,505,000 | 4,590,061 | ||
| Chicago, IL, Metropolitan Pier & Exposition Authority, Dedicated State Tax Rev. Refunding Bonds (McCormick Place Expansion Project), Capital Appreciation, “B-1”, AGM, 0%, 6/15/2026 | 1,890,000 | 1,677,107 | ||
| Chicago, IL, Midway Airport Rev., Second Lien, “A”, BAM, 5%, 1/01/2031 | 1,200,000 | 1,197,920 | ||
| Chicago, IL, O’Hare International Airport Rev., Special Facilities, 5%, 7/01/2033 | 590,000 | 592,106 | ||
| Chicago, IL, O’Hare International Airport Rev., Special Facilities, 5%, 7/01/2038 | 1,455,000 | 1,397,309 | ||
| Chicago, IL, O’Hare International Airport Rev., Special Facilities, 5%, 7/01/2048 | 4,640,000 | 4,221,420 | ||
| Chicago, IL, O’Hare International Airport, Customer Facility Charge Senior Lien Refunding, BAM, 5.25%, 1/01/2042 | 1,345,000 | 1,388,287 | ||
| Chicago, IL, O’Hare International Airport, Customer Facility Charge Senior Lien Refunding, BAM, 5.25%, 1/01/2043 | 1,055,000 | 1,086,040 | ||
| Chicago, IL, O'Hare International Airport Rev., Senior Lien, “A”, 4.5%, 1/01/2048 | 7,210,000 | 6,562,120 | ||
| Chicago, IL, O'Hare International Airport Rev., Senior Lien, “A”, 5%, 1/01/2048 | 2,610,000 | 2,587,051 | ||
| Chicago, IL, O'Hare International Airport Rev., Senior Lien, “A”, 4.625%, 1/01/2053 | 8,650,000 | 7,934,544 | ||
| Chicago, IL, O'Hare International Airport Rev., Senior Lien, “A”, 5.5%, 1/01/2055 | 2,760,000 | 2,819,064 | ||
| Chicago, IL, Transit Authority Second Lien Sales Tax Rev., “A”, 5%, 12/01/2045 | 1,450,000 | 1,455,852 | ||
| Chicago, IL, Transit Authority Second Lien Sales Tax Rev., “A”, 4%, 12/01/2050 | 2,365,000 | 1,995,682 | ||
38
Portfolio of Investments (unaudited)
– continued
| Issuer | Shares/Par | Value ($) | ||
| Municipal Bonds - continued | ||||
| Illinois - continued | ||||
| Chicago, IL, Transit Authority Second Lien Sales Tax Rev., “A”, 5%, 12/01/2057 | $ | 7,855,000 | $7,732,383 | |
| Chicago, IL, Wastewater Transmission Rev., Second Lien, “A”, AGM, 5.25%, 1/01/2053 | 5,000,000 | 5,123,591 | ||
| Chicago, IL, Wastewater Transmission Rev., Second Lien, “A”, AGM, 5.25%, 1/01/2058 | 10,000,000 | 10,247,183 | ||
| Cook County, IL, Community College District No. 508 (City Colleges), BAM, 5%, 12/01/2047 | 7,605,000 | 7,629,514 | ||
| Cook County, IL, Sales Tax Rev., “A”, 5%, 11/15/2038 | 865,000 | 884,708 | ||
| Cook County, IL, Sales Tax Rev., “A”, 4%, 11/15/2039 | 1,105,000 | 1,009,922 | ||
| DuPage County, IL, Carol Stream Park District, “C”, BAM, 3%, 11/01/2032 | 985,000 | 880,874 | ||
| Illinois Finance Authority Rev. (Dominican University), 5%, 3/01/2034 | 330,000 | 317,875 | ||
| Illinois Finance Authority Rev. (Dominican University), 5%, 3/01/2038 | 405,000 | 368,369 | ||
| Illinois Finance Authority Rev. (Dominican University), 5%, 3/01/2042 | 250,000 | 220,737 | ||
| Illinois Finance Authority Rev. (Dominican University), 5%, 3/01/2047 | 455,000 | 390,920 | ||
| Illinois Finance Authority Rev. (Dominican University), 5%, 3/01/2052 | 395,000 | 330,324 | ||
| Illinois Finance Authority Rev. (Edward-Elmhurst Healthcare), “A”, 5%, 1/01/2034 (Prerefunded 1/01/2027) | 1,820,000 | 1,890,886 | ||
| Illinois Finance Authority Rev. (Edward-Elmhurst Healthcare), “A”, 5%, 1/01/2035 (Prerefunded 1/01/2027) | 1,825,000 | 1,896,080 | ||
| Illinois Finance Authority Rev. (McKinley Foundation), “A”, 5.125%, 11/01/2055 (n) | 2,525,000 | 1,957,498 | ||
| Illinois Finance Authority Rev. (Mercy Health Corp.), 5%, 12/01/2046 | 7,265,000 | 6,735,826 | ||
| Illinois Finance Authority Rev. (Plymouth Place, Inc.), “A”, 6.5%, 5/15/2042 | 1,640,000 | 1,627,617 | ||
| Illinois Finance Authority Rev. (Plymouth Place, Inc.), “A”, 6.5%, 5/15/2047 | 2,385,000 | 2,320,334 | ||
| Illinois Finance Authority Rev. (Plymouth Place, Inc.), “A”, 6.625%, 5/15/2052 | 1,940,000 | 1,882,992 | ||
| Illinois Finance Authority Rev. (Plymouth Place, Inc.), “A”, 6.75%, 5/15/2058 | 2,580,000 | 2,519,059 | ||
| Illinois Finance Authority Rev. (Plymouth Place, Inc.), “B-1”, 6%, 11/15/2027 | 2,425,000 | 2,406,549 | ||
| Illinois Finance Authority Rev. (Presence Health Network), “C”, 5%, 2/15/2036 | 815,000 | 831,737 | ||
39
Portfolio of Investments (unaudited)
– continued
| Issuer | Shares/Par | Value ($) | ||
| Municipal Bonds - continued | ||||
| Illinois - continued | ||||
| Illinois Finance Authority Rev. (Presence Health Network), “C”, 5%, 2/15/2041 | $ | 1,210,000 | $1,218,058 | |
| Illinois Finance Authority Rev. (Rosalind Franklin University), “A”, 5%, 8/01/2042 | 405,000 | 383,519 | ||
| Illinois Finance Authority Rev. (Rosalind Franklin University), “A”, 5%, 8/01/2047 | 820,000 | 755,478 | ||
| Illinois Finance Authority Rev. (Rosalind Franklin University, Research Building Project), “C”, 5%, 8/01/2046 | 645,000 | 597,096 | ||
| Illinois Finance Authority Rev. (Rosalind Franklin University, Research Building Project), “C”, 5%, 8/01/2049 | 630,000 | 575,599 | ||
| Illinois Finance Authority Rev. (Southern Illinois Healthcare Enterprises, Inc.), “A”, 5%, 3/01/2047 | 7,865,000 | 7,324,836 | ||
| Illinois Finance Authority Rev., Taxable (McKinley Foundation), “B”, 7%, 11/01/2037 (n) | 775,000 | 722,254 | ||
| Illinois Finance Authority, Academic Facilities Lease Rev. (Provident Group - UIUC Properties LLC - University of Illinois at Urbana-Champaign Project), “A”, 5%, 10/01/2051 | 335,000 | 316,441 | ||
| Illinois Finance Authority, Graduate & Professional Student Loan Program Rev. (Midwestern University Foundation), “A”, 2.25%, 7/01/2033 | 445,000 | 338,866 | ||
| Illinois Finance Authority, Graduate & Professional Student Loan Program Rev. (Midwestern University Foundation), “A”, 3%, 7/01/2035 | 400,000 | 341,959 | ||
| Illinois Finance Authority, Health Services Facility Lease Rev. (Provident Group - UIC Surgery Center LLC - University of Illinois Health Services Facility Project), 4%, 10/01/2050 | 2,430,000 | 1,888,734 | ||
| Illinois Finance Authority, Lease Rev. (Provident Group - SCCIL Properties LLC - University of Illinois Urbana-Champaign Project), “A”, BAM, 5.25%, 10/01/2053 | 5,210,000 | 5,362,482 | ||
| Illinois Finance Authority, Lease Rev. (Provident Group - SCCIL Properties LLC - University of Illinois Urbana-Champaign Project), “A”, BAM, 5.25%, 10/01/2057 | 6,000,000 | 6,151,733 | ||
| Illinois Finance Authority, Student Housing and Academic Facility Rev. (CHF - Chicago LLC - University of Illinois at Chicago Project), “A”, 5%, 2/15/2028 | 155,000 | 155,693 | ||
| Illinois Finance Authority, Student Housing and Academic Facility Rev. (CHF - Chicago LLC - University of Illinois at Chicago Project), “A”, 5%, 2/15/2037 | 390,000 | 377,420 | ||
| Illinois Finance Authority, Student Housing and Academic Facility Rev. (CHF - Chicago LLC - University of Illinois at Chicago Project), “A”, 5%, 2/15/2047 | 2,055,000 | 1,850,768 | ||
40
Portfolio of Investments (unaudited)
– continued
| Issuer | Shares/Par | Value ($) | ||
| Municipal Bonds - continued | ||||
| Illinois - continued | ||||
| Illinois Finance Authority, Student Housing and Academic Facility Rev. (CHF - Chicago LLC - University of Illinois at Chicago Project), “A”, 5%, 2/15/2050 | $ | 390,000 | $346,652 | |
| Illinois Housing Development Authority Rev. “A”, GNMA, 4.8%, 10/01/2043 | 10,620,000 | 10,418,665 | ||
| Illinois Housing Development Authority Rev. “A”, GNMA, 4.9%, 4/01/2047 | 2,775,000 | 2,740,554 | ||
| Illinois Housing Development Authority Rev., “A”, 4.5%, 10/01/2048 | 2,870,000 | 2,838,599 | ||
| Illinois Housing Development Authority Rev., “A”, FHLMC, 3.87%, 11/15/2035 (z) | 7,967,205 | 6,790,448 | ||
| Illinois Housing Development Authority Rev., “A”, GNMA, 3%, 4/01/2051 | 2,265,000 | 2,140,769 | ||
| Illinois Housing Development Authority Rev., “B”, FHLMC, 3.87%, 11/15/2035 (z) | 3,249,208 | 2,769,300 | ||
| Illinois Housing Development Authority Rev., “C”, FHLMC, 3.87%, 11/15/2035 (z) | 3,242,283 | 2,714,666 | ||
| Illinois Housing Development Authority Rev., “D”, FHLMC, 3.87%, 11/15/2035 (z) | 2,958,577 | 2,466,680 | ||
| Illinois Housing Development Authority Rev., “E”, FHLMC, 3.87%, 11/15/2035 (z) | 2,036,058 | 1,690,386 | ||
| Illinois Sports Facilities Authority, State Tax Supported Refunding Rev., AGM, 5%, 6/15/2027 | 1,395,000 | 1,394,950 | ||
| Kane County, IL, East Aurora School District No. 131, “A”, AGM, 4%, 12/01/2036 | 200,000 | 187,740 | ||
| Kane County, IL, East Aurora School District No. 131, “A”, AGM, 4%, 12/01/2039 | 645,000 | 580,323 | ||
| Macon County, IL, Decatur School District No. 61 General Obligation School Rev., “C”, AGM, 4%, 1/01/2035 | 1,475,000 | 1,441,073 | ||
| Madison County, IL, Edwardsville Community Unit School District No. 007, BAM, 5%, 12/01/2028 | 605,000 | 618,069 | ||
| Madison County, IL, Edwardsville Community Unit School District No. 007, BAM, 5%, 12/01/2029 | 620,000 | 633,393 | ||
| Northern Illinois University, Auxiliary Facilities System Refunding Rev., BAM, 4%, 10/01/2039 | 320,000 | 287,339 | ||
| Northern Illinois University, Auxiliary Facilities System Refunding Rev., BAM, 4%, 10/01/2041 | 315,000 | 275,128 | ||
| Northern Illinois University, Auxiliary Facilities System Refunding Rev., BAM, 4%, 10/01/2043 | 190,000 | 162,116 | ||
| Northern Illinois University, Auxiliary Facilities System Refunding Rev., “B”, BAM, 4%, 4/01/2036 | 490,000 | 460,241 | ||
| Northern Illinois University, Auxiliary Facilities System Refunding Rev., “B”, BAM, 4%, 4/01/2038 | 555,000 | 500,607 | ||
41
Portfolio of Investments (unaudited)
– continued
| Issuer | Shares/Par | Value ($) | ||
| Municipal Bonds - continued | ||||
| Illinois - continued | ||||
| Northern Illinois University, Auxiliary Facilities System Refunding Rev., “B”, BAM, 4%, 4/01/2040 | $ | 525,000 | $464,629 | |
| Northern Illinois University, Auxiliary Facilities System Refunding Rev., “B”, BAM, 4%, 4/01/2041 | 250,000 | 219,100 | ||
| Romeoville, IL, Rev. (Lewis University Project), “A”, 5%, 10/01/2042 | 1,330,000 | 1,222,315 | ||
| Romeoville, IL, Rev. (Lewis University Project), “B”, 5%, 10/01/2039 | 1,095,000 | 1,031,786 | ||
| Romeoville, IL, Rev. (Lewis University Project), “B”, 4.125%, 10/01/2041 | 890,000 | 733,306 | ||
| Romeoville, IL, Rev. (Lewis University Project), “B”, 4.125%, 10/01/2046 | 885,000 | 689,722 | ||
| Southern Illinois University Housing and Auxiliary Facilities System Rev., “A”, 4%, 4/01/2028 | 590,000 | 579,286 | ||
| Southern Illinois University Housing and Auxiliary Facilities System Rev., “A”, 4%, 4/01/2029 | 315,000 | 302,992 | ||
| Southern Illinois University Housing and Auxiliary Facilities System Rev., “A”, 4%, 4/01/2031 | 750,000 | 704,262 | ||
| Southern Illinois University Housing and Auxiliary Facilities System Rev., “A”, 4%, 4/01/2034 | 710,000 | 655,050 | ||
| Southern Illinois University Housing and Auxiliary Facilities System Rev., “A”, 4%, 4/01/2036 | 515,000 | 459,066 | ||
| Southern Illinois University Housing and Auxiliary Facilities System Rev., “A”, 4%, 4/01/2038 | 790,000 | 681,383 | ||
| State of Illinois, General Obligation, 5%, 2/01/2025 | 2,045,000 | 2,066,069 | ||
| State of Illinois, General Obligation, 5%, 11/01/2028 | 1,580,000 | 1,615,418 | ||
| State of Illinois, General Obligation, 4.125%, 11/01/2031 | 1,355,000 | 1,317,142 | ||
| State of Illinois, General Obligation, 5.5%, 5/01/2039 | 1,310,000 | 1,366,700 | ||
| State of Illinois, General Obligation, 4.5%, 11/01/2039 | 1,495,000 | 1,378,784 | ||
| State of Illinois, General Obligation, 5.75%, 5/01/2045 | 1,220,000 | 1,271,877 | ||
| State of Illinois, General Obligation, “A”, 5%, 3/01/2024 | 1,575,000 | 1,579,503 | ||
| State of Illinois, General Obligation, “A”, 5%, 3/01/2025 | 1,970,000 | 1,991,672 | ||
| State of Illinois, General Obligation, “A”, 5%, 3/01/2026 | 1,970,000 | 2,009,589 | ||
| State of Illinois, General Obligation, “A”, 5%, 11/01/2027 | 7,725,000 | 7,990,068 | ||
| State of Illinois, General Obligation, “A”, 5%, 11/01/2028 | 10,235,000 | 10,660,423 | ||
| State of Illinois, General Obligation, “B”, 5%, 3/01/2024 | 2,755,000 | 2,762,764 | ||
| State of Illinois, General Obligation, “B”, 5%, 3/01/2025 | 3,150,000 | 3,184,654 | ||
| State of Illinois, General Obligation, “B”, 5%, 3/01/2026 | 2,560,000 | 2,611,446 | ||
| State of Illinois, General Obligation, “B”, 4%, 11/01/2038 | 1,335,000 | 1,196,021 | ||
| State of Illinois, General Obligation, “B”, 5.5%, 5/01/2047 | 3,700,000 | 3,838,413 | ||
| State of Illinois, General Obligation, “C”, 4%, 3/01/2024 | 4,865,000 | 4,859,328 | ||
| State of Illinois, General Obligation, “C”, 4%, 3/01/2025 | 1,180,000 | 1,176,984 | ||
42
Portfolio of Investments (unaudited)
– continued
| Issuer | Shares/Par | Value ($) | ||
| Municipal Bonds - continued | ||||
| Illinois - continued | ||||
| University of Illinois, Auxiliary Facilities System Rev., “A”, BAM, 4%, 4/01/2032 | $ | 1,740,000 | $1,692,291 | |
| University of Illinois, Auxiliary Facilities System Rev., “A”, BAM, 4%, 4/01/2035 | 2,320,000 | 2,209,259 | ||
| University of Illinois, Auxiliary Facilities System Rev., “A”, BAM, 4%, 4/01/2036 | 1,190,000 | 1,118,967 | ||
| University of Illinois, Auxiliary Facilities System Rev., “A”, BAM, 4%, 4/01/2038 | 1,520,000 | 1,389,607 | ||
| University of Illinois, Auxiliary Facilities System Rev., “A”, BAM, 4%, 4/01/2044 | 790,000 | 701,304 | ||
| Western Illinois Economic Development Authority, Local Government Program Rev. (City of Quincy Project), “B”, BAM, 4%, 12/01/2029 | 535,000 | 530,615 | ||
| Western Illinois Economic Development Authority, Local Government Program Rev. (City of Quincy Project), “B”, BAM, 4%, 12/01/2030 | 670,000 | 662,061 | ||
| Western Illinois Economic Development Authority, Local Government Program Rev. (City of Quincy Project), “B”, BAM, 4%, 12/01/2032 | 930,000 | 909,385 | ||
| Western Illinois Economic Development Authority, Local Government Program Rev. (City of Quincy Project), “B”, BAM, 4%, 12/01/2034 | 1,385,000 | 1,317,119 | ||
| Western Illinois Economic Development Authority, Local Government Program Rev. (City of Quincy Project), “B”, BAM, 4%, 12/01/2036 | 1,575,000 | 1,433,524 | ||
| $408,842,861 | ||||
| Indiana - 1.1% | ||||
| Indiana Finance Authority Rev. (BHI Senior Living), “A”, 6%, 11/15/2041 (Prerefunded 11/15/2023) | $ | 2,235,000 | $2,238,824 | |
| Indiana Finance Authority Rev. (Marquette Project), “A”, 5%, 3/01/2030 | 420,000 | 415,901 | ||
| Indiana Finance Authority Rev. (Marquette Project), “A”, 5%, 3/01/2039 | 1,055,000 | 979,874 | ||
| Indiana Finance Authority Student Housing Rev. (CHF - Tippecanoe, LLC - Student Housing Project), “A”, 5%, 6/01/2053 | 1,050,000 | 1,002,136 | ||
| Indiana Finance Authority Student Housing Rev. (CHF - Tippecanoe, LLC - Student Housing Project), “A”, 5.125%, 6/01/2058 | 860,000 | 828,744 | ||
| Indiana Finance Authority Student Housing Rev. (CHF - Tippecanoe, LLC - Student Housing Project), “A”, 5.375%, 6/01/2064 | 2,580,000 | 2,503,178 | ||
43
Portfolio of Investments (unaudited)
– continued
| Issuer | Shares/Par | Value ($) | ||
| Municipal Bonds - continued | ||||
| Indiana - continued | ||||
| Indiana Finance Authority, Education Facilities Rev. (Rose-Hulman Institute of Technology Project), 5%, 6/01/2027 | $ | 150,000 | $154,172 | |
| Indiana Finance Authority, Education Facilities Rev. (Rose-Hulman Institute of Technology Project), 5%, 6/01/2032 | 320,000 | 335,285 | ||
| Indiana Finance Authority, Education Facilities Rev. (Rose-Hulman Institute of Technology Project), 4%, 6/01/2033 | 180,000 | 172,744 | ||
| Indiana Finance Authority, Education Facilities Rev. (Rose-Hulman Institute of Technology Project), 4%, 6/01/2034 | 185,000 | 176,479 | ||
| Indiana Finance Authority, Educational Facilities Rev. (Valparaiso University Project), 5%, 10/01/2028 | 205,000 | 206,400 | ||
| Indiana Finance Authority, Educational Facilities Rev. (Valparaiso University Project), 5%, 10/01/2033 | 135,000 | 135,318 | ||
| Indiana Finance Authority, Environmental Facilities Refunding Rev. (Indianapolis Power & Light Co.), “B”, 0.95%, 12/01/2038 (Put Date 4/01/2026) | 2,260,000 | 1,990,369 | ||
| Indiana Finance Authority, Health Facilities Rev. (Baptist Healthcare System Obligated Group), 5%, 8/15/2051 | 4,685,000 | 4,472,269 | ||
| Indiana Finance Authority, Hospital Rev. (Reid Health), AGM, 4.25%, 1/01/2047 | 2,005,000 | 1,767,815 | ||
| Indiana Housing & Community Development Authority, Single Family Mortgage Rev., “B-1”, GNMA, 3.25%, 7/01/2049 | 1,265,000 | 1,215,106 | ||
| Indiana Secondary Market for Education Loans, Inc., Student Loan Program Rev., “1-A”, 4.5%, 6/01/2039 | 3,760,000 | 3,488,066 | ||
| Indianapolis, IN, Local Public Improvement (Indianapolis Airport Authority Project), “D”, 5%, 1/01/2027 | 8,655,000 | 8,796,018 | ||
| Indianapolis, IN, Local Public Improvement (Indianapolis Airport Authority Project), “I”, 5%, 1/01/2028 | 1,570,000 | 1,576,149 | ||
| Indianapolis, IN, Water System First Lien Refunding Rev., “A”, 5%, 10/01/2037 | 4,130,000 | 4,253,701 | ||
| St. Joseph County, IN, Educational Facilities Rev. (University of Notre Dame), 6.5%, 3/01/2026 | 790,000 | 838,157 | ||
| Valparaiso, IN, Exempt Facilities Rev. (Pratt Paper LLC Project), 6.75%, 1/01/2034 | 330,000 | 332,027 | ||
| Valparaiso, IN, Exempt Facilities Rev. (Pratt Paper LLC Project), 7%, 1/01/2044 | 595,000 | 598,878 | ||
| Whiting, IN, Environmental Facilities Rev. (BP Products North America, Inc. Project), 4.4%, 11/01/2045 (Put Date 6/10/2031) | 10,475,000 | 10,202,070 | ||
| Whiting, IN, Environmental Facilities Rev. (BP Products North America, Inc. Project), “A”, 5%, 12/01/2044 (Put Date 6/05/2026) | 2,620,000 | 2,660,386 | ||
| $51,340,066 | ||||
44
Portfolio of Investments (unaudited)
– continued
| Issuer | Shares/Par | Value ($) | ||
| Municipal Bonds - continued | ||||
| Iowa - 0.4% | ||||
| Iowa Finance Authority Senior Housing Rev. (Northcrest, Inc. Project), “A”, 5%, 3/01/2033 | $ | 610,000 | $573,691 | |
| Iowa Finance Authority Senior Housing Rev. (Northcrest, Inc. Project), “A”, 5%, 3/01/2038 | 485,000 | 429,195 | ||
| Iowa Finance Authority Senior Housing Rev. (Northcrest, Inc. Project), “A”, 5%, 3/01/2048 | 885,000 | 710,735 | ||
| Iowa Finance Authority, Single Family Mortgage Rev., “A”, FNMA, 4%, 7/01/2047 | 430,000 | 421,832 | ||
| Iowa Finance Authority, Single Family Mortgage Rev., “A”, GNMA, 3%, 1/01/2047 | 2,710,000 | 2,554,210 | ||
| Iowa Finance Authority, Single Family Mortgage Rev., “B”, 3%, 7/01/2051 | 7,010,000 | 6,615,702 | ||
| Iowa Higher Education Loan Authority, Private College Facility Rev. (Des Moines University Project), 4.75%, 10/01/2042 | 620,000 | 568,800 | ||
| Iowa Higher Education Loan Authority, Private College Facility Rev. (Des Moines University Project), 5%, 10/01/2047 | 660,000 | 616,184 | ||
| Iowa Higher Education Loan Authority, Private College Facility Rev. (Des Moines University Project), 5.375%, 10/01/2052 | 730,000 | 708,933 | ||
| Iowa Student Loan Liquidity Corp. Rev., “B”, 3%, 12/01/2039 | 210,000 | 193,858 | ||
| Iowa Student Loan Liquidity Corp. Rev., “B”, 3.5%, 12/01/2044 | 4,615,000 | 3,355,859 | ||
| Iowa Tobacco Settlement Authority Asset-Backed, “B-1”, 4%, 6/01/2049 | 2,160,000 | 1,996,502 | ||
| $18,745,501 | ||||
| Kansas - 0.8% | ||||
| Coffeyville, KS, Electric Utility System Rev., “B”, NPFG, 5%, 6/01/2038 (Prerefunded 6/01/2025) (n) | $ | 3,000,000 | $3,041,430 | |
| Coffeyville, KS, Electric Utility System Rev., “B”, NPFG, 5%, 6/01/2042 (Prerefunded 6/01/2025) (n) | 1,200,000 | 1,216,572 | ||
| Ellis County, KS, Unified School District No. 489 General Obligation, “B”, AGM, 4%, 9/01/2052 | 1,270,000 | 1,078,584 | ||
| Hutchinson, KS, Hospital Facilities Rev. (Hutchinson Regional Medical Center, Inc.), 5%, 12/01/2036 | 1,020,000 | 915,763 | ||
| Hutchinson, KS, Hospital Facilities Rev. (Hutchinson Regional Medical Center, Inc.), 5%, 12/01/2041 | 535,000 | 451,516 | ||
| Lyon County, KS, School District No. 253 General Obligation, 4%, 9/01/2032 | 100,000 | 100,084 | ||
| Lyon County, KS, School District No. 253 General Obligation, 4%, 9/01/2033 | 410,000 | 408,980 | ||
| Lyon County, KS, School District No. 253 General Obligation, 4%, 9/01/2034 | 465,000 | 460,176 | ||
| Lyon County, KS, School District No. 253 General Obligation, BAM, 4%, 9/01/2039 | 2,360,000 | 2,173,807 | ||
45
Portfolio of Investments (unaudited)
– continued
| Issuer | Shares/Par | Value ($) | ||
| Municipal Bonds - continued | ||||
| Kansas - continued | ||||
| Overland Park, KS, Development Corp. Improvement and Refunding Rev. (Overland Park Convention Center Hotel), 5%, 3/01/2032 | $ | 815,000 | $771,531 | |
| Overland Park, KS, Development Corp. Improvement and Refunding Rev. (Overland Park Convention Center Hotel), 5%, 3/01/2033 | 855,000 | 806,951 | ||
| Overland Park, KS, Development Corp. Improvement and Refunding Rev. (Overland Park Convention Center Hotel), 5%, 3/01/2034 | 905,000 | 855,254 | ||
| Overland Park, KS, Development Corp. Improvement and Refunding Rev. (Overland Park Convention Center Hotel), 5%, 3/01/2036 | 995,000 | 943,083 | ||
| Overland Park, KS, Development Corp. Improvement and Refunding Rev. (Overland Park Convention Center Hotel), 5%, 3/01/2038 | 1,100,000 | 1,012,513 | ||
| Overland Park, KS, Development Corp. Improvement and Refunding Rev. (Overland Park Convention Center Hotel), 5%, 3/01/2044 | 1,890,000 | 1,688,814 | ||
| Overland Park, KS, Development Corp. Improvement and Refunding Rev. (Overland Park Convention Center Hotel), 5%, 3/01/2049 | 3,580,000 | 3,129,338 | ||
| Sedgwick County, KS, Unified School District No. 266 General Obligation, “A”, 4%, 9/01/2031 | 905,000 | 897,300 | ||
| Sedgwick County, KS, Unified School District No. 266 General Obligation, “A”, 4%, 9/01/2032 | 675,000 | 669,117 | ||
| Topeka, KS, Health Care Facilities Rev. (Brewster Place), “A”, 6.25%, 12/01/2042 | 1,260,000 | 1,187,181 | ||
| Topeka, KS, Health Care Facilities Rev. (Brewster Place), “A”, 6.5%, 12/01/2052 | 2,310,000 | 2,169,624 | ||
| University of Kansas Hospital Authority, Health Facilities Rev. (University of Kansas Health System), “A”, 5%, 9/01/2048 | 10,590,000 | 10,638,757 | ||
| Wichita, KS, Health Care Facilities Rev. (Presbyterian Manors, Inc.), “I”, 5%, 5/15/2033 | 115,000 | 95,818 | ||
| Wichita, KS, Health Care Facilities Rev. (Presbyterian Manors, Inc.), “I”, 5%, 5/15/2038 | 140,000 | 103,875 | ||
| Wichita, KS, Health Care Facilities Rev. (Presbyterian Manors, Inc.), “I”, 4.625%, 5/15/2041 | 115,000 | 77,024 | ||
| Wichita, KS, Health Care Facilities Rev. (Presbyterian Manors, Inc.), “I”, 5%, 5/15/2047 | 570,000 | 372,701 | ||
| Wyandotte County/Kansas City, KS, Unified Government Community Improvement District Sales Tax Rev. (Legends Apartments Garage & West Lawn Project), 4.5%, 6/01/2040 | 315,000 | 276,144 | ||
| $35,541,937 | ||||
46
Portfolio of Investments (unaudited)
– continued
| Issuer | Shares/Par | Value ($) | ||
| Municipal Bonds - continued | ||||
| Kentucky - 1.1% | ||||
| Henderson, KY, Exempt Facilities Rev. (Pratt Paper LLC Project), “B”, 4.45%, 1/01/2042 (n) | $ | 1,915,000 | $1,766,039 | |
| Kentucky Economic Development Finance Authority Hospital Rev. (Baptist Healthcare System), “B”, 5%, 8/15/2037 | 465,000 | 470,536 | ||
| Kentucky Economic Development Finance Authority Hospital Rev. (Baptist Healthcare System), “B”, 5%, 8/15/2041 | 3,335,000 | 3,297,827 | ||
| Kentucky Economic Development Finance Authority Hospital Rev. (Baptist Healthcare System), “B”, 5%, 8/15/2046 | 2,115,000 | 2,065,637 | ||
| Kentucky Economic Development Finance Authority Hospital Rev. (Owensboro Health, Inc.), “A”, 5%, 6/01/2037 | 1,990,000 | 1,871,920 | ||
| Kentucky Economic Development Finance Authority Hospital Rev. (Owensboro Health, Inc.), “A”, 5%, 6/01/2041 | 1,305,000 | 1,184,771 | ||
| Kentucky Economic Development Finance Authority Hospital Rev. (Owensboro Health, Inc.), “A”, 5.25%, 6/01/2041 | 1,015,000 | 1,003,132 | ||
| Kentucky Economic Development Finance Authority Hospital Rev. (Owensboro Health, Inc.), “A”, 5%, 6/01/2045 | 1,630,000 | 1,427,098 | ||
| Kentucky Economic Development Finance Authority Louisville Arena Project Rev. (Louisville Arena Authority, Inc.), “A”, AGM, 5%, 12/01/2047 | 705,000 | 652,212 | ||
| Kentucky Higher Education Student Loan Corp. Rev., “B-1”, 5%, 6/01/2036 | 5,095,000 | 4,990,369 | ||
| Kentucky State University, Certificates of Participation, BAM, 4%, 11/01/2036 | 60,000 | 58,318 | ||
| Kentucky State University, Certificates of Participation, BAM, 4%, 11/01/2038 | 125,000 | 116,637 | ||
| Kentucky State University, Certificates of Participation, BAM, 4%, 11/01/2041 | 95,000 | 85,810 | ||
| Kentucky State University, Certificates of Participation, BAM, 4%, 11/01/2051 | 200,000 | 169,544 | ||
| Public Energy Authority of Kentucky, Gas Supply Rev., “B”, 4%, 1/01/2049 (Put Date 1/01/2025) | 2,530,000 | 2,506,334 | ||
| Public Energy Authority of Kentucky, Gas Supply Rev., “C-1”, 4%, 12/01/2049 (Put Date 6/01/2025) | 20,000,000 | 19,706,286 | ||
| Trimble, KY, Pollution Control Refunding Rev. (Louisville Gas & Electric Co. Project), “A”, 1.3%, 9/01/2044 (Put Date 9/01/2027) | 10,000,000 | 8,491,164 | ||
| $49,863,634 | ||||
47
Portfolio of Investments (unaudited)
– continued
| Issuer | Shares/Par | Value ($) | ||
| Municipal Bonds - continued | ||||
| Louisiana - 1.1% | ||||
| East Baton Rouge, LA, Sewerage Commission Multi-Modal Rev., “A”, 1.3%, 2/01/2041 (Put Date 2/01/2028) | $ | 7,420,000 | $6,054,557 | |
| Louisiana Local Government, Environmental Facilities & Community Development Authority Rev. (CDF Healthcare), “A”, 5.625%, 6/01/2045 | 3,645,000 | 2,879,151 | ||
| Louisiana Local Government, Environmental Facilities & Community Development Authority Rev. (Ragin' Cajun Facilities, Inc. - Student Housing & Parking Project), AGM, 5%, 10/01/2043 | 465,000 | 463,820 | ||
| Louisiana Local Government, Environmental Facilities & Community Development Authority Rev. (Ragin' Cajun Facilities, Inc. - Student Housing & Parking Project), AGM, 5%, 10/01/2048 | 2,010,000 | 1,964,336 | ||
| Louisiana Local Government, Environmental Facilities & Community Development Authority Student Housing Rev. (Provident Group - ULM Properties LLC - University of Louisiana at Monroe Project), “A”, 5%, 7/01/2029 (n) | 365,000 | 342,221 | ||
| Louisiana Local Government, Environmental Facilities & Community Development Authority Student Housing Rev. (Provident Group - ULM Properties LLC - University of Louisiana at Monroe Project), “A”, 5%, 7/01/2039 (n) | 945,000 | 760,877 | ||
| Louisiana Local Government, Environmental Facilities & Community Development Authority Student Housing Rev. (Provident Group - ULM Properties LLC - University of Louisiana at Monroe Project), “A”, 5%, 7/01/2054 (n) | 1,515,000 | 1,083,093 | ||
| Louisiana Local Government, Environmental Facilities & Community Development Authority, Healthcare Refunding Rev. (St. James Place of Baton Rouge Project), “A”, 6%, 11/15/2035 | 460,000 | 436,447 | ||
| Louisiana Local Government, Environmental Facilities & Community Development Authority, Healthcare Refunding Rev. (St. James Place of Baton Rouge Project), “A”, 6.25%, 11/15/2045 | 2,755,000 | 2,506,784 | ||
| Louisiana Offshore Terminal Authority, Deepwater Port Rev. (Loop LLC Project), “A”, 1.65%, 9/01/2027 (Put Date 12/01/2023) | 3,950,000 | 3,925,405 | ||
| Louisiana Offshore Terminal Authority, Deepwater Port Rev. (Loop LLC Project), “A”, 1.65%, 9/01/2033 (Put Date 12/01/2023) | 3,205,000 | 3,185,044 | ||
| Louisiana Offshore Terminal Authority, Deepwater Port Rev. (Loop LLC Project), “A”, 1.65%, 9/01/2034 (Put Date 12/01/2023) | 2,470,000 | 2,454,620 | ||
| Louisiana Public Facilities Authority Refunding Rev. (Loyola University Project), 5%, 10/01/2034 | 445,000 | 458,730 | ||
| Louisiana Public Facilities Authority Refunding Rev. (Loyola University Project), 5%, 10/01/2035 | 1,160,000 | 1,188,431 | ||
| Louisiana Public Facilities Authority Refunding Rev. (Loyola University Project), 4%, 10/01/2041 | 875,000 | 749,341 | ||
| Louisiana Public Facilities Authority Refunding Rev. (Tulane University Project), “A”, 5%, 4/01/2045 | 3,865,000 | 3,902,246 | ||
48
Portfolio of Investments (unaudited)
– continued
| Issuer | Shares/Par | Value ($) | ||
| Municipal Bonds - continued | ||||
| Louisiana - continued | ||||
| Louisiana Public Facilities Authority Rev. (Loyola University Project), Convertible Capital Appreciation, 5.25% to 10/01/2023, 5.25% to 10/01/2046 | $ | 7,810,000 | $7,058,559 | |
| Louisiana Public Facilities Authority Rev. (Provident Group - HSC Properties, Inc., LSU Health Foundation, New Orleans Project), “A-1”, 5.375%, 1/01/2040 (n) | 3,175,000 | 2,918,027 | ||
| Louisiana Public Facilities Authority Rev. (Provident Group - HSC Properties, Inc., LSU Health Foundation, New Orleans Project), “A-1”, 5.5%, 1/01/2050 (n) | 2,175,000 | 1,909,995 | ||
| Louisiana Public Facilities Authority Rev. (Provident Group - HSC Properties, Inc., LSU Health Foundation, New Orleans Project), “A-1”, 5.1%, 1/01/2057 (n) | 7,310,000 | 5,864,375 | ||
| New Orleans, LA, Aviation Board Special Facility Rev. (Parking Facilities Corp. Consolidated Garage System), “A”, AGM, 5%, 10/01/2043 | 590,000 | 595,432 | ||
| New Orleans, LA, Aviation Board Special Facility Rev. (Parking Facilities Corp. Consolidated Garage System), “A”, AGM, 5%, 10/01/2048 | 955,000 | 957,385 | ||
| New Orleans, LA, Sewerage Services Rev., 5%, 12/01/2040 (Prerefunded 12/01/2025) | 630,000 | 645,716 | ||
| Shreveport, LA, Water & Sewer Rev., “B”, AGM, 4%, 12/01/2044 | 790,000 | 682,717 | ||
| Shreveport, LA, Water & Sewer Rev., “B”, AGM, 4%, 12/01/2049 | 985,000 | 820,073 | ||
| $53,807,382 | ||||
| Maine - 0.4% | ||||
| Maine Finance Authority Solid Waste Disposal Rev. (Casella Waste Systems, Inc.), “R-2”, 4.375%, 8/01/2035 (Put Date 8/01/2025) (n) | $ | 900,000 | $889,001 | |
| Maine Finance Authority Solid Waste Disposal Rev. (Casella Waste Systems, Inc.), “R-3”, 5.25%, 1/01/2025 (n) | 450,000 | 450,874 | ||
| Maine Finance Authority, Student Loan Rev., “A-1”, AGM, 5%, 12/01/2028 | 395,000 | 407,176 | ||
| Maine Finance Authority, Student Loan Rev., “A-1”, AGM, 5%, 12/01/2029 | 395,000 | 409,060 | ||
| Maine Finance Authority, Student Loan Rev., “A-1”, AGM, 5%, 12/01/2030 | 395,000 | 410,942 | ||
| Maine Health and Higher Educational Facilities Authority Rev. (MaineHealth), “A”, 4%, 7/01/2036 | 1,160,000 | 1,089,396 | ||
| Maine Health and Higher Educational Facilities Authority Rev. (MaineHealth), “A”, 4%, 7/01/2037 | 945,000 | 879,639 | ||
| Maine Health and Higher Educational Facilities Authority Rev. (MaineHealth), “A”, 4%, 7/01/2038 | 985,000 | 907,362 | ||
| Maine Health and Higher Educational Facilities Authority Rev. (MaineHealth), “A”, 4%, 7/01/2039 | 1,220,000 | 1,109,764 | ||
49
Portfolio of Investments (unaudited)
– continued
| Issuer | Shares/Par | Value ($) | ||
| Municipal Bonds - continued | ||||
| Maine - continued | ||||
| Maine Health and Higher Educational Facilities Authority Rev. (MaineHealth), “A”, 4%, 7/01/2040 | $ | 1,735,000 | $1,560,307 | |
| Maine Health and Higher Educational Facilities Authority Rev. (MaineHealth), “A”, 4%, 7/01/2050 | 6,175,000 | 5,150,875 | ||
| Maine Housing Authority Mortgage, “C”, 4%, 11/15/2050 | 2,095,000 | 2,043,797 | ||
| Maine Housing Authority Mortgage, “C-1”, 3.5%, 11/15/2044 | 440,000 | 435,804 | ||
| Maine Housing Authority Mortgage, “E”, 5%, 11/15/2052 | 1,510,000 | 1,515,597 | ||
| $17,259,594 | ||||
| Maryland - 1.4% | ||||
| Baltimore, MD, Convention Center Hotel Rev., 5%, 9/01/2025 | $ | 1,125,000 | $1,107,905 | |
| Baltimore, MD, Convention Center Hotel Rev., 5%, 9/01/2026 | 380,000 | 372,313 | ||
| Baltimore, MD, Convention Center Hotel Rev., 5%, 9/01/2033 | 790,000 | 753,503 | ||
| Baltimore, MD, Convention Center Hotel Rev., 5%, 9/01/2034 | 2,875,000 | 2,732,605 | ||
| Baltimore, MD, Convention Center Hotel Rev., 5%, 9/01/2042 | 1,635,000 | 1,404,586 | ||
| Baltimore, MD, Convention Center Hotel Rev., 5%, 9/01/2046 | 1,070,000 | 890,174 | ||
| Baltimore, MD, Special Obligation (East Baltimore Research Park Project), “A”, 5%, 9/01/2038 | 1,235,000 | 1,179,348 | ||
| Baltimore, MD, Subordinate Project Rev. (Mayor and City Council of Baltimore Water Projects), “A”, 5%, 7/01/2041 | 3,935,000 | 3,981,365 | ||
| Brunswick, MD, Special Obligation Refunding (Brunswick Crossing Special Taxing District), 4%, 7/01/2029 | 300,000 | 286,315 | ||
| Brunswick, MD, Special Obligation Refunding (Brunswick Crossing Special Taxing District), 5%, 7/01/2036 | 335,000 | 327,282 | ||
| Frederick County, MD, Limited Obligation (Jefferson Technology Park Project), “B”, 4.625%, 7/01/2043 (n) | 760,000 | 688,958 | ||
| Howard County, MD, Special Obligation (Downtown Columbia Project), “A”, 4.125%, 2/15/2034 (n) | 150,000 | 137,308 | ||
| Howard County, MD, Special Obligation (Downtown Columbia Project), “A”, 4.375%, 2/15/2039 (n) | 155,000 | 138,705 | ||
| Howard County, MD, Special Obligation (Downtown Columbia Project), “A”, 4.5%, 2/15/2047 (n) | 870,000 | 739,034 | ||
| Maryland Community Development Administration, Department of Housing & Community Development Housing Rev., “A”, 4.5%, 9/01/2048 (u) | 5,455,000 | 5,386,276 | ||
| Maryland Community Development Administration, Department of Housing & Community Development Housing Rev., “B”, 4.5%, 9/01/2048 (u) | 4,420,000 | 4,328,912 | ||
| Maryland Community Development Administration, Department of Housing & Community Development Housing Rev., “C”, 4%, 9/01/2044 | 410,000 | 406,519 | ||
50
Portfolio of Investments (unaudited)
– continued
| Issuer | Shares/Par | Value ($) | ||
| Municipal Bonds - continued | ||||
| Maryland - continued | ||||
| Maryland Community Development Administration, Department of Housing & Community Development Residential Rev., “A”, 3%, 9/01/2051 | $ | 5,500,000 | $5,203,117 | |
| Maryland Community Development Administration, Department of Housing & Community Development Residential Rev., “D”, 3.25%, 9/01/2050 | 6,235,000 | 5,952,625 | ||
| Maryland Economic Development Corp., Senior Student Housing Rev. (University of Maryland, College Park Projects), AGM, 5%, 6/01/2035 | 550,000 | 560,410 | ||
| Maryland Economic Development Corp., Special Obligation (Port Covington Project), 3.25%, 9/01/2030 (n) | 235,000 | 213,136 | ||
| Maryland Economic Development Corp., Special Obligation (Port Covington Project), 4%, 9/01/2040 (n) | 655,000 | 547,702 | ||
| Maryland Economic Development Corp., Subordinate Parking Facilities Rev. (Baltimore City Project), “C”, 4%, 6/01/2038 | 145,000 | 117,587 | ||
| Maryland Economic Development Corp., Subordinate Parking Facilities Rev. (Baltimore City Project), “C”, 4%, 6/01/2048 | 435,000 | 310,560 | ||
| Maryland Economic Development Corp., Subordinate Parking Facilities Rev. (Baltimore City Project), “C”, 4%, 6/01/2058 | 1,270,000 | 849,875 | ||
| Maryland Health & Higher Educational Facilities Authority Rev. (Adventist Healthcare), 5%, 1/01/2036 | 575,000 | 564,907 | ||
| Maryland Health & Higher Educational Facilities Authority Rev. (Adventist Healthcare), “A”, 5.5%, 1/01/2036 | 4,005,000 | 4,056,225 | ||
| Maryland Health & Higher Educational Facilities Authority Rev. (Doctors Community Hospital), “A”, 5%, 7/01/2033 | 1,375,000 | 1,385,489 | ||
| Maryland Health & Higher Educational Facilities Authority Rev. (Doctors Community Hospital), “A”, 5%, 7/01/2034 | 860,000 | 865,846 | ||
| Maryland Health & Higher Educational Facilities Authority Rev. (Doctors Community Hospital), “A”, 5%, 7/01/2038 | 3,815,000 | 3,640,097 | ||
| Maryland Health & Higher Educational Facilities Authority Rev. (Medstar Health Issue), 5%, 8/15/2025 | 5,055,000 | 5,103,078 | ||
| Maryland Health & Higher Educational Facilities Authority Rev. (Pooled Loan Program), “B”, VRDN, 3.1%, 3/31/2035 | 7,355,000 | 7,355,000 | ||
| Maryland Stadium Authority Rev., Baltimore City Public Schools Construction and Revitalization Program, Capital Appreciation, “C”, 0%, 5/01/2051 | 4,985,000 | 1,123,850 | ||
| Maryland Stadium Authority Rev., Baltimore City Public Schools Construction and Revitalization Program, Capital Appreciation, “C”, 0%, 5/01/2052 | 7,475,000 | 1,587,046 | ||
| Maryland Stadium Authority Rev., Baltimore City Public Schools Construction and Revitalization Program, Capital Appreciation, “C”, 0%, 5/01/2053 | 3,665,000 | 732,910 | ||
51
Portfolio of Investments (unaudited)
– continued
| Issuer | Shares/Par | Value ($) | ||
| Municipal Bonds - continued | ||||
| Maryland - continued | ||||
| Maryland Stadium Authority Rev., Baltimore City Public Schools Construction and Revitalization Program, Capital Appreciation, “C”, 0%, 5/01/2054 | $ | 5,485,000 | $1,035,685 | |
| Maryland Stadium Authority Rev., Baltimore City Public Schools Construction and Revitalization Program, Capital Appreciation, “C”, 0%, 5/01/2055 | 3,390,000 | 604,283 | ||
| Prince George's County, MD, Special Obligation (Westphalia Town Center Project), 5.125%, 7/01/2039 (n) | 440,000 | 412,591 | ||
| Prince George's County, MD, Special Obligation (Westphalia Town Center Project), 5.25%, 7/01/2048 (n) | 430,000 | 395,551 | ||
| Rockville, MD, Mayor & Council Economic Development Refunding Rev. (Ingleside at King Farm Project), “A-1”, 5%, 11/01/2037 | 150,000 | 131,329 | ||
| Rockville, MD, Mayor & Council Economic Development Rev. (Ingleside at King Farm Project), “B”, 5%, 11/01/2042 | 250,000 | 208,842 | ||
| Rockville, MD, Mayor & Council Economic Development Rev. (Ingleside at King Farm Project), “B”, 5%, 11/01/2047 | 260,000 | 209,891 | ||
| $68,028,740 | ||||
| Massachusetts - 2.5% | ||||
| Commonwealth of Massachusetts Transportation Fund Rev., “A”, 5%, 6/01/2043 | $ | 7,310,000 | $7,455,128 | |
| Commonwealth of Massachusetts, “A”, AAC, 5.5%, 8/01/2030 | 3,935,000 | 4,361,038 | ||
| Massachusetts Bay Transportation Authority, Sales Tax Rev., “A-2”, 5%, 7/01/2041 | 5,115,000 | 5,286,650 | ||
| Massachusetts Bay Transportation Authority, Sales Tax Rev., “A-2”, 5%, 7/01/2042 | 1,770,000 | 1,823,859 | ||
| Massachusetts Development Finance Agency Rev. (Beth Israel Lahey Health Inc.), “K”, 5%, 7/01/2031 | 890,000 | 925,315 | ||
| Massachusetts Development Finance Agency Rev. (Beth Israel Lahey Health Inc.), “K”, 5%, 7/01/2032 | 905,000 | 940,480 | ||
| Massachusetts Development Finance Agency Rev. (Beth Israel Lahey Health, Inc.), “2018 I-2”, 5%, 7/01/2053 | 6,820,000 | 6,630,056 | ||
| Massachusetts Development Finance Agency Rev. (Boston Medical Center), “G”, 4.375%, 7/01/2052 | 2,820,000 | 2,369,309 | ||
| Massachusetts Development Finance Agency Rev. (CareGroup), “J-1”, 5%, 7/01/2048 | 2,360,000 | 2,324,360 | ||
| Massachusetts Development Finance Agency Rev. (Emerson College), 5%, 1/01/2031 | 705,000 | 710,126 | ||
| Massachusetts Development Finance Agency Rev. (Emerson College), “A”, 5.25%, 1/01/2042 | 200,000 | 199,436 | ||
| Massachusetts Development Finance Agency Rev. (Emmanuel College), “A”, 5%, 10/01/2043 | 2,765,000 | 2,617,745 | ||
52
Portfolio of Investments (unaudited)
– continued
| Issuer | Shares/Par | Value ($) | ||
| Municipal Bonds - continued | ||||
| Massachusetts - continued | ||||
| Massachusetts Development Finance Agency Rev. (Emmanuel College), “A”, 4%, 10/01/2046 | $ | 625,000 | $493,933 | |
| Massachusetts Development Finance Agency Rev. (Lahey Health System), “F”, 5%, 8/15/2030 | 790,000 | 804,136 | ||
| Massachusetts Development Finance Agency Rev. (Lowell General Hospital), “G”, 5%, 7/01/2037 | 2,145,000 | 1,956,700 | ||
| Massachusetts Development Finance Agency Rev. (Milford Regional Medical Center), “F”, 5.75%, 7/15/2043 | 365,000 | 333,580 | ||
| Massachusetts Development Finance Agency Rev. (Newbridge on the Charles, Inc.), 5%, 10/01/2037 (n) | 110,000 | 100,853 | ||
| Massachusetts Development Finance Agency Rev. (Newbridge on the Charles, Inc.), 5%, 10/01/2047 (n) | 1,205,000 | 1,021,679 | ||
| Massachusetts Development Finance Agency Rev. (Newbridge on the Charles, Inc.), 5%, 10/01/2057 (n) | 2,330,000 | 1,902,039 | ||
| Massachusetts Development Finance Agency Rev. (North Hill Communities), “A”, 6.25%, 11/15/2033 (Prerefunded 11/15/2023) (n) | 275,000 | 275,614 | ||
| Massachusetts Development Finance Agency Rev. (North Hill Communities), “A”, 6.5%, 11/15/2043 (Prerefunded 11/15/2023) (n) | 435,000 | 436,081 | ||
| Massachusetts Development Finance Agency Rev. (Partners Healthcare), “S”, 5%, 7/01/2032 | 1,005,000 | 1,049,184 | ||
| Massachusetts Development Finance Agency Rev. (Sabis International Charter School Issue), 5%, 4/15/2025 | 125,000 | 123,951 | ||
| Massachusetts Development Finance Agency Rev. (Salem Community Corp.), 5.125%, 1/01/2040 (n) | 400,000 | 349,643 | ||
| Massachusetts Development Finance Agency Rev. (Salem Community Corp.), 5.25%, 1/01/2050 (n) | 1,045,000 | 854,429 | ||
| Massachusetts Development Finance Agency Rev. (Suffolk University), 5%, 7/01/2034 | 560,000 | 564,379 | ||
| Massachusetts Development Finance Agency Rev. (Suffolk University), 4%, 7/01/2051 | 4,140,000 | 3,133,959 | ||
| Massachusetts Development Finance Agency Rev. (UMass Memorial Health Care Obligated Group), “K”, 5%, 7/01/2038 | 1,025,000 | 1,008,916 | ||
| Massachusetts Development Finance Agency Rev. (Wellforce Inc.), “C”, AGM, 5%, 10/01/2032 | 670,000 | 692,724 | ||
| Massachusetts Development Finance Agency Rev. (Wellforce Inc.), “C”, AGM, 5%, 10/01/2033 | 415,000 | 428,241 | ||
| Massachusetts Development Finance Agency Rev. (Wellforce, Inc.), “A”, 5%, 7/01/2039 | 1,470,000 | 1,359,664 | ||
| Massachusetts Development Finance Agency Rev. (Wellforce, Inc.), “A”, 4%, 7/01/2044 | 1,765,000 | 1,394,565 | ||
53
Portfolio of Investments (unaudited)
– continued
| Issuer | Shares/Par | Value ($) | ||
| Municipal Bonds - continued | ||||
| Massachusetts - continued | ||||
| Massachusetts Development Finance Agency Rev. (Wellforce, Inc.), “A”, 5%, 7/01/2044 | $ | 1,755,000 | $1,534,257 | |
| Massachusetts Development Finance Agency Rev. (Wentworth Institute of Technology), 5%, 10/01/2046 | 905,000 | 820,220 | ||
| Massachusetts Educational Financing Authority, Education Loan Rev., “B”, 3%, 7/01/2035 | 70,000 | 69,667 | ||
| Massachusetts Educational Financing Authority, Education Loan Rev., “B”, 2%, 7/01/2037 | 350,000 | 280,399 | ||
| Massachusetts Educational Financing Authority, Education Loan Rev., “C”, 2.625%, 7/01/2036 | 30,000 | 28,963 | ||
| Massachusetts Educational Financing Authority, Education Loan Rev., “C”, 4.125%, 7/01/2046 | 8,040,000 | 6,342,594 | ||
| Massachusetts Educational Financing Authority, Education Loan Rev., “C”, 3.75%, 7/01/2047 | 9,100,000 | 6,680,747 | ||
| Massachusetts Educational Financing Authority, Education Loan Rev., “J”, 4.7%, 7/01/2026 | 340,000 | 338,413 | ||
| Massachusetts Educational Financing Authority, Education Loan Rev., “J”, 4.9%, 7/01/2028 | 350,000 | 348,102 | ||
| Massachusetts Educational Financing Authority, Education Loan Rev., “J”, 3.5%, 7/01/2033 | 10,675,000 | 10,345,368 | ||
| Massachusetts Educational Financing Authority, Education Loan Subordinate Rev., “C”, 3%, 7/01/2051 | 2,580,000 | 1,565,540 | ||
| Massachusetts Educational Financing Authority, Education Loan Subordinate Rev., “C”, 4.125%, 7/01/2052 | 8,155,000 | 6,155,893 | ||
| Massachusetts Housing Finance Agency, Single Family Housing Rev., “221”, 3%, 12/01/2050 | 2,770,000 | 2,623,288 | ||
| Massachusetts Port Authority Rev., “A”, 5%, 7/01/2037 | 3,080,000 | 3,139,394 | ||
| Massachusetts Port Authority Rev., “A”, 5%, 7/01/2038 | 3,870,000 | 3,923,213 | ||
| Massachusetts Port Authority Rev., “A”, 5%, 7/01/2039 | 6,275,000 | 6,343,445 | ||
| Massachusetts Port Authority Special Facilities Rev. (BOSFuel Project), “A”, 5%, 7/01/2035 | 395,000 | 403,951 | ||
| Massachusetts Port Authority Special Facilities Rev. (BOSFuel Project), “A”, 5%, 7/01/2036 | 790,000 | 802,762 | ||
| Massachusetts Port Authority Special Facilities Rev. (BOSFuel Project), “A”, 5%, 7/01/2037 | 1,130,000 | 1,140,434 | ||
| Tisbury, MA, General Obligation, Municipal Purpose Loan, Unlimited Tax, 3%, 8/15/2047 | 4,785,000 | 3,409,883 | ||
| Tisbury, MA, General Obligation, Municipal Purpose Loan, Unlimited Tax, 3%, 8/15/2052 | 3,015,000 | 2,052,722 | ||
| University of Massachusetts Building Authority Rev., “2017-3”, 5%, 11/01/2036 | 7,000,000 | 7,284,770 | ||
| $119,561,797 | ||||
54
Portfolio of Investments (unaudited)
– continued
| Issuer | Shares/Par | Value ($) | ||
| Municipal Bonds - continued | ||||
| Michigan - 1.8% | ||||
| Detroit, MI, Downtown Development Authority Tax Increment Rev. (Catalyst Development Project), “A”, AGM, 5%, 7/01/2037 | $ | 4,150,000 | $4,083,828 | |
| Detroit, MI, Downtown Development Authority Tax Increment Rev. (Catalyst Development), “A”, AGM, 5%, 7/01/2043 | 1,235,000 | 1,209,081 | ||
| Great Lakes Water Authority, Michigan Water Supply System Rev., “B”, BAM, 5%, 7/01/2046 | 4,520,000 | 4,600,692 | ||
| Great Lakes Water Authority, Michigan Water Supply System Rev., “D”, 5%, 7/01/2036 | 2,485,000 | 2,538,471 | ||
| Kent County, MI, Gerald R. Ford International Airport Authority Rev., 5%, 1/01/2051 | 990,000 | 990,234 | ||
| Michigan Building Authority Rev. (Facilities Program), 4%, 10/15/2052 | 1,370,000 | 1,162,921 | ||
| Michigan Building Authority Rev., “I”, 4%, 10/15/2049 | 2,205,000 | 1,896,199 | ||
| Michigan Finance Authority (Detroit Financial Recovery Income Tax Rev.), “F”, 3.875%, 10/01/2023 | 540,000 | 540,000 | ||
| Michigan Finance Authority (Detroit Financial Recovery Income Tax Rev.), “F”, 4%, 10/01/2024 | 680,000 | 672,461 | ||
| Michigan Finance Authority Hospital Rev. (McLaren Health Care), “D-1”, 1.2%, 10/15/2030 (Put Date 4/13/2028) | 2,005,000 | 1,706,251 | ||
| Michigan Finance Authority Hospital Rev. (McLaren Health Care), “D-2”, 1.2%, 10/15/2038 (Put Date 4/13/2028) | 2,515,000 | 2,140,260 | ||
| Michigan Finance Authority Hospital Rev. (Trinity Health Credit Group), 5%, 12/01/2030 | 790,000 | 817,184 | ||
| Michigan Finance Authority Hospital Rev. (Trinity Health Credit Group), 5%, 12/01/2031 | 1,575,000 | 1,626,821 | ||
| Michigan Finance Authority Hospital Rev. (Trinity Health Credit Group), 5%, 12/01/2048 | 2,905,000 | 2,829,550 | ||
| Michigan Finance Authority Hospital Rev. (Trinity Health Credit Group), “2”, 4%, 12/01/2036 | 4,145,000 | 3,915,992 | ||
| Michigan Finance Authority Hospital Rev. (Trinity Health Credit Group), “A”, 5%, 12/01/2032 | 6,295,000 | 6,642,738 | ||
| Michigan Finance Authority Local Government Loan Program Rev. (Detroit Water and Sewerage Department Sewage Disposal System Rev. Refunding Second Lien Local Project), “C”, 5%, 7/01/2033 | 630,000 | 638,068 | ||
| Michigan Finance Authority Local Government Loan Program Rev. (Detroit Water and Sewerage Department Sewage Disposal System Rev. Refunding Second Lien Local Project), “C-7”, NPFG, 5%, 7/01/2032 | 460,000 | 462,622 | ||
| Michigan Finance Authority Local Government Loan Program Rev. (Detroit Water and Sewerage Department Water Supply System Rev. Refunding Local Project), “D-2”, 5%, 7/01/2034 | 630,000 | 637,433 | ||
55
Portfolio of Investments (unaudited)
– continued
| Issuer | Shares/Par | Value ($) | ||
| Municipal Bonds - continued | ||||
| Michigan - continued | ||||
| Michigan Finance Authority Local Government Loan Program Rev. (Detroit Water and Sewerage Department Water Supply System Rev. Refunding Second Lien Local Project), “D-6”, NPFG, 5%, 7/01/2036 | $ | 385,000 | $385,849 | |
| Michigan Finance Authority Local Government Loan Program Rev. (Detroit Water and Sewerage Department Water Supply System Rev. Refunding Senior Lien Local Project), “D-1”, AGM, 5%, 7/01/2035 | 190,000 | 190,903 | ||
| Michigan Finance Authority Local Government Loan Program Rev. (Detroit Water and Sewerage Department Water Supply System Rev. Refunding Senior Lien Local Project), “D-1”, AGM, 5%, 7/01/2037 | 450,000 | 451,221 | ||
| Michigan Finance Authority Tobacco Settlement Asset-Backed Rev. (2007 Sold Tobacco Receipts), “B-1”, 5%, 6/01/2049 | 540,000 | 540,608 | ||
| Michigan Housing Development Authority, Rental Housing Rev., “A”, 5.15%, 10/01/2058 | 11,055,000 | 10,798,263 | ||
| Michigan Strategic Fund Limited Obligation Rev. (I-75 Improvement Project), 5%, 6/30/2048 | 3,935,000 | 3,694,233 | ||
| Michigan Strategic Fund Limited Obligation Rev. (I-75 Improvement Project), AGM, 4.125%, 6/29/2035 | 7,315,000 | 6,972,695 | ||
| Michigan Strategic Fund Limited Obligation Rev. (I-75 Improvement Project), AGM, 4.25%, 12/31/2038 | 2,300,000 | 2,128,375 | ||
| Wayne County, MI, Airport Authority Rev. (Detroit Metropolitan Wayne County Airport), “B”, 5%, 12/01/2044 | 790,000 | 779,417 | ||
| Wayne County, MI, Airport Authority Rev. (Detroit Metropolitan Wayne County Airport), “B”, BAM, 5%, 12/01/2039 | 480,000 | 479,972 | ||
| Wayne County, MI, Airport Authority Rev. (Detroit Metropolitan Wayne County Airport), “C”, 5%, 12/01/2039 | 370,000 | 369,197 | ||
| Wayne County, MI, Airport Authority Rev. (Detroit Metropolitan Wayne County Airport), “C”, 5%, 12/01/2044 | 805,000 | 793,191 | ||
| Wayne County, MI, Airport Authority Rev. (Detroit Metropolitan Wayne County Airport), “D”, AGM, 5%, 12/01/2040 | 5,590,000 | 5,608,645 | ||
| Wayne County, MI, Airport Authority Rev. (Detroit Metropolitan Wayne County Airport), “D”, 5%, 12/01/2031 | 1,960,000 | 2,005,526 | ||
| Wayne County, MI, Airport Authority Rev. (Detroit Metropolitan Wayne County Airport), “D”, 5%, 12/01/2032 | 2,030,000 | 2,076,991 | ||
| Wayne County, MI, Detroit School District, ”A“, 5%, 5/01/2030 | 775,000 | 824,216 | ||
| Wayne County, MI, Detroit School District, ”A“, 5%, 5/01/2031 | 945,000 | 1,005,662 | ||
| Wayne County, MI, Detroit School District, ”A“, 5%, 5/01/2032 | 1,455,000 | 1,545,133 | ||
| Wayne County, MI, Detroit School District, ”A“, 5%, 5/01/2034 | 2,755,000 | 2,913,198 | ||
| Wayne County, MI, Detroit School District, ”A“, 5%, 5/01/2036 | 790,000 | 824,715 | ||
| Wayne County, MI, Detroit School District, ”A“, 5%, 5/01/2037 | 870,000 | 896,805 | ||
| $84,395,621 | ||||
56
Portfolio of Investments (unaudited)
– continued
| Issuer | Shares/Par | Value ($) | ||
| Municipal Bonds - continued | ||||
| Minnesota - 0.8% | ||||
| Duluth, MN, Economic Development Authority Rev. (Benedictine Health System), “A”, 4%, 7/01/2031 | $ | 840,000 | $751,529 | |
| Duluth, MN, Economic Development Authority Rev. (Benedictine Health System), “A”, 4%, 7/01/2036 | 1,330,000 | 1,078,776 | ||
| Duluth, MN, Economic Development Authority Rev. (Benedictine Health System), “A”, 4%, 7/01/2041 | 555,000 | 416,818 | ||
| Duluth, MN, Economic Development Authority, Health Care Facilities Rev. (Essentia Health), “A”, 4.25%, 2/15/2043 | 2,195,000 | 1,885,558 | ||
| Duluth, MN, Economic Development Authority, Health Care Facilities Rev. (Essentia Health), “A”, 5%, 2/15/2043 | 2,010,000 | 1,968,955 | ||
| Duluth, MN, Economic Development Authority, Health Care Facilities Rev. (Essentia Health), “A”, 4.25%, 2/15/2048 | 2,585,000 | 2,143,198 | ||
| Duluth, MN, Economic Development Authority, Health Care Facilities Rev. (Essentia Health), “A”, 5%, 2/15/2048 | 1,585,000 | 1,518,230 | ||
| Duluth, MN, Independent School District No. 709, “A”, 4.2%, 3/01/2034 | 240,000 | 225,670 | ||
| Duluth, MN, Independent School District No. 709, “B”, COP, 5%, 2/01/2025 | 190,000 | 192,391 | ||
| Minneapolis & St. Paul, MN, Metropolitan Airports Commission Rev., “C”, 5%, 1/01/2041 | 1,970,000 | 1,984,356 | ||
| Minneapolis & St. Paul, MN, Metropolitan Airports Commission Rev., “C”, 5%, 1/01/2046 | 2,360,000 | 2,362,008 | ||
| Minnesota Housing Finance Agency, Residential Housing, “A”, 4%, 1/01/2041 | 130,000 | 129,086 | ||
| Minnesota Housing Finance Agency, Residential Housing, “A”, 4.25%, 7/01/2049 (u) | 11,790,000 | 11,565,694 | ||
| Minnesota Housing Finance Agency, Residential Housing, “B”, GNMA, 3%, 7/01/2051 | 4,705,000 | 4,438,244 | ||
| Minnesota Housing Finance Agency, Residential Housing, “D”, 3%, 1/01/2052 | 4,875,000 | 4,586,543 | ||
| Minnesota Office of Higher Education Supplemental Student Loan Program Rev., 4%, 11/01/2037 | 1,170,000 | 1,135,416 | ||
| Minnesota Office of Higher Education Supplemental Student Loan Program Rev., 2.65%, 11/01/2038 | 1,815,000 | 1,581,469 | ||
| St. Paul, MN, Housing & Redevelopment Authority Charter School Lease Rev. (Great River School Project), “A”, 5.5%, 7/01/2052 (n) | 240,000 | 219,960 | ||
| $38,183,901 | ||||
57
Portfolio of Investments (unaudited)
– continued
| Issuer | Shares/Par | Value ($) | ||
| Municipal Bonds - continued | ||||
| Mississippi - 0.9% | ||||
| Medical Center, Educational Building Corp. Rev. (Colony Park Teaching Campus), “A”, 4%, 6/01/2048 | $ | 10,990,000 | $9,412,952 | |
| Medical Center, Educational Building Corp. Rev. (Colony Park Teaching Campus), “A”, 4%, 6/01/2053 | 8,350,000 | 7,023,933 | ||
| Mississippi Development Bank Special Obligation (Harrison County Coliseum), “A”, 5.25%, 1/01/2034 | 1,935,000 | 2,106,980 | ||
| Mississippi Development Bank Special Obligation (Jackson Sales Tax Rev. Infrastructure Project), 5%, 9/01/2025 | 315,000 | 315,503 | ||
| Mississippi Development Bank Special Obligation (Jackson Sales Tax Rev. Infrastructure Project), 5%, 9/01/2026 | 790,000 | 792,024 | ||
| Mississippi Development Bank Special Obligation (Jackson Water and Sewer System Rev. Bond Project), AGM, 6.875%, 12/01/2040 | 390,000 | 391,203 | ||
| Mississippi Development Bank Special Obligation (Vicksburg Warren School District General Obligation Project), BAM, 5%, 3/01/2048 | 3,150,000 | 3,049,421 | ||
| Mississippi Home Corp., Single Family Mortgage Rev., “A”, 4%, 12/01/2044 | 770,000 | 753,396 | ||
| Mississippi Home Corp., Single Family Mortgage Rev., “B”, GNMA, 3%, 6/01/2051 | 2,765,000 | 2,606,879 | ||
| Mississippi Hospital Equipment & Facilities Authority Rev. (Baptist Memorial Healthcare), “A”, 5%, 9/01/2046 | 1,500,000 | 1,397,602 | ||
| Mississippi Hospital Equipment & Facilities Authority Rev. (Forrest County General Hospital Refunding Project), “A”, 4%, 1/01/2036 | 665,000 | 622,449 | ||
| Mississippi Hospital Equipment & Facilities Authority Rev. (Forrest County General Hospital Refunding Project), “A”, 4%, 1/01/2037 | 600,000 | 550,053 | ||
| Mississippi Hospital Equipment & Facilities Authority Rev. (Forrest County General Hospital Refunding Project), “A”, 4%, 1/01/2039 | 600,000 | 527,875 | ||
| Mississippi Hospital Equipment & Facilities Authority Rev. (Forrest County General Hospital Refunding Project), “A”, 4%, 1/01/2040 | 335,000 | 290,407 | ||
| Mississippi Hospital Equipment & Facilities Authority Rev. (North Mississippi Health Services), “IV”, 5%, 10/01/2033 | 280,000 | 289,603 | ||
| Mississippi Hospital Equipment & Facilities Authority Rev. (North Mississippi Health Services), “IV”, 5%, 10/01/2035 | 945,000 | 971,096 | ||
| Mississippi Hospital Equipment & Facilities Authority Rev. (North Mississippi Health Services), “IV”, 5%, 10/01/2039 | 670,000 | 662,764 | ||
| State of Mississippi, “B”, 5%, 12/01/2032 (Prerefunded 12/01/2026) | 1,970,000 | 2,053,228 | ||
| State of Mississippi, “B”, 5%, 12/01/2033 (Prerefunded 12/01/2026) | 1,970,000 | 2,053,228 | ||
| State of Mississippi, “B”, 5%, 12/01/2034 (Prerefunded 12/01/2026) | 3,935,000 | 4,101,244 | ||
58
Portfolio of Investments (unaudited)
– continued
| Issuer | Shares/Par | Value ($) | ||
| Municipal Bonds - continued | ||||
| Mississippi - continued | ||||
| University of Southern Mississippi, Educational Building Corp. Rev. (Facilities Refinancing Project), “A”, 5%, 3/01/2028 | $ | 850,000 | $858,987 | |
| $40,830,827 | ||||
| Missouri - 1.3% | ||||
| Brentwood & Maplewood, MO, Hanley Road Corridor Transportation Development District, Transportation Sales Tax Refunding Rev., 2%, 10/01/2039 | $ | 340,000 | $330,788 | |
| Jackson County, MO, Special Obligations, “A”, 5.25%, 12/01/2058 | 15,250,000 | 15,676,468 | ||
| Kansas City, MO, Industrial Development Authority, Airport Rev. (Kansas City International Airport Terminal Modernization Project), “B”, 5%, 3/01/2054 | 8,055,000 | 7,862,134 | ||
| Kansas City, MO, Industrial Development Authority, Airport Rev. (Kansas City International Airport Terminal Modernization Project), “B”, AGM, 5%, 3/01/2055 | 4,465,000 | 4,390,748 | ||
| Kansas City, MO, Land Clearance for Redevelopment Authority Rev. (Convention Center Hotel Project - TIF Financing), “B”, 5%, 2/01/2040 (n) | 160,000 | 124,188 | ||
| Kansas City, MO, Land Clearance for Redevelopment Authority Rev. (Convention Center Hotel Project - TIF Financing), “B”, 5%, 2/01/2050 (n) | 275,000 | 194,666 | ||
| Missouri Development Finance Board, Infrastructure Facilities Rev. (Crackerneck Creek Project), 4%, 3/01/2036 | 945,000 | 843,170 | ||
| Missouri Development Finance Board, Infrastructure Facilities Rev. (Crackerneck Creek Project), 4%, 3/01/2037 | 300,000 | 260,357 | ||
| Missouri Development Finance Board, Infrastructure Facilities Rev. (Crackerneck Creek Project), 4%, 3/01/2041 | 380,000 | 310,617 | ||
| Missouri Development Finance Board, Infrastructure Facilities Rev. (Crackerneck Creek Project), 4%, 3/01/2051 | 1,070,000 | 802,971 | ||
| Missouri Health & Educational Facilities Authority Rev. (Mercy Health), 5.5%, 12/01/2048 (w) | 3,995,000 | 4,202,512 | ||
| Missouri Health & Educational Facilities Authority Rev. (Mercy Health), “A”, 5%, 6/01/2030 | 3,935,000 | 4,082,053 | ||
| Missouri Health & Educational Facilities Authority Rev. (Mercy Health), “A”, 5%, 6/01/2031 | 2,490,000 | 2,581,206 | ||
| Missouri Health & Educational Facilities Authority Rev. (Mosaic Health System), “A”, 4%, 2/15/2044 | 1,810,000 | 1,514,059 | ||
| Missouri Health & Educational Facilities Authority Rev. (Mosaic Health System), “A”, 4%, 2/15/2049 | 3,935,000 | 3,254,956 | ||
| Missouri Health & Educational Facilities Authority Rev. (Mosaic Health System), “A”, 4%, 2/15/2054 | 3,580,000 | 2,910,396 | ||
| Missouri Health & Educational Facilities Authority Rev. (SSM Health Care), “A”, 5%, 6/01/2031 (Prerefunded 6/01/2024) | 2,060,000 | 2,072,079 | ||
59
Portfolio of Investments (unaudited)
– continued
| Issuer | Shares/Par | Value ($) | ||
| Municipal Bonds - continued | ||||
| Missouri - continued | ||||
| Missouri Housing Development Commission, Single Family Mortgage Rev. (First Place Homeownership Loan Program), “A”, 3.75%, 5/01/2038 | $ | 155,000 | $152,971 | |
| Missouri Housing Development Commission, Single Family Mortgage Rev. (First Place Homeownership Loan Program), “A”, FHLMC, 3%, 5/01/2052 | 4,070,000 | 3,835,570 | ||
| Missouri Housing Development Commission, Single Family Mortgage Rev. (First Place Homeownership Loan Program), “A”, FNMA, 4.25%, 5/01/2049 | 2,450,000 | 2,412,074 | ||
| Plaza at Noah's Ark Community District, MO, Tax Increment and Improvement Rev., 3%, 5/01/2030 | 255,000 | 224,077 | ||
| Plaza at Noah's Ark Community District, MO, Tax Increment and Improvement Rev., 3.125%, 5/01/2035 | 175,000 | 139,367 | ||
| Poplar Bluff, MO, Transportation Development District, Transportation Sales Tax Refunding & Improvement Rev., “B”, 4%, 12/01/2037 | 1,115,000 | 979,844 | ||
| St. Louis County, MO, Industrial Development Authority Health Facilities Rev. (Nazareth Living Center), “A”, 5%, 8/15/2030 | 115,000 | 107,186 | ||
| St. Louis County, MO, Industrial Development Authority Health Facilities Rev. (Nazareth Living Center), “A”, 5%, 8/15/2035 | 95,000 | 83,547 | ||
| St. Louis County, MO, Industrial Development Authority Health Facilities Rev. (Nazareth Living Center), “A”, 5.125%, 8/15/2045 | 205,000 | 164,680 | ||
| St. Louis, MO, Industrial Development Authority Financing Rev. (Ballpark Village Development Project), “A”, 3.875%, 11/15/2029 | 150,000 | 127,276 | ||
| St. Louis, MO, Industrial Development Authority Financing Rev. (Ballpark Village Development Project), “A”, 4.375%, 11/15/2035 | 580,000 | 445,163 | ||
| St. Louis, MO, Industrial Development Authority Financing Rev. (Ballpark Village Development Project), “A”, 4.75%, 11/15/2047 | 1,805,000 | 1,252,529 | ||
| St. Louis, MO, Municipal Finance Corp. Leasehold Rev. (Convention Center Expansion and Improvement Projects), AGM, 5%, 10/01/2049 | 2,385,000 | 2,298,227 | ||
| $63,635,879 | ||||
| Montana - 0.1% | ||||
| Montana Board of Housing Single Family Mortgage, “B”, 4%, 12/01/2050 | $ | 2,685,000 | $2,614,022 | |
| Montana Board of Housing Single Family Program (Federally Insured or Guaranteed Mortgage Loans), “A-2”, 3%, 12/01/2043 | 115,000 | 114,090 | ||
| $2,728,112 | ||||
60
Portfolio of Investments (unaudited)
– continued
| Issuer | Shares/Par | Value ($) | ||
| Municipal Bonds - continued | ||||
| Nebraska - 0.1% | ||||
| Central Plains Energy Project, NE, Gas Project Rev. (Project No. 3), “A”, 5%, 9/01/2034 | $ | 670,000 | $673,749 | |
| Nebraska Investment Finance Authority, Single Family Housing Rev., “A”, 4%, 9/01/2044 | 210,000 | 208,085 | ||
| Nebraska Investment Finance Authority, Single Family Housing Rev., “C”, FHLMC, 4%, 9/01/2048 | 2,310,000 | 2,259,737 | ||
| $3,141,571 | ||||
| Nevada - 0.2% | ||||
| Clark County, NV, School District General Obligation, “A”, AGM, 4%, 6/15/2037 | $ | 710,000 | $667,605 | |
| Clark County, NV, School District General Obligation, “A”, AGM, 4%, 6/15/2039 | 1,555,000 | 1,419,469 | ||
| Director of the State of Nevada, Department of Business and Industry, Charter School Lease Rev. (Somerset Academy), “A”, 4.5%, 12/15/2029 (n) | 140,000 | 133,425 | ||
| Director of the State of Nevada, Department of Business and Industry, Charter School Lease Rev. (Somerset Academy), “A”, 5%, 12/15/2035 (n) | 500,000 | 476,670 | ||
| Director of the State of Nevada, Department of Business and Industry, Charter School Lease Rev. (Somerset Academy), “A”, 5%, 12/15/2038 (n) | 1,005,000 | 924,423 | ||
| Director of the State of Nevada, Department of Business and Industry, Charter School Lease Rev. (Somerset Academy), “A”, 5.125%, 12/15/2045 (n) | 600,000 | 527,322 | ||
| Director of the State of Nevada, Department of Business and Industry, Charter School Lease Rev. (Somerset Academy), “A”, 5%, 12/15/2048 (n) | 2,835,000 | 2,400,639 | ||
| Nevada Housing Division, Single Family Mortgage Rev., “A”, GNMA, 3%, 4/01/2051 | 2,085,000 | 1,962,841 | ||
| Reno, NV, Sales Tax Rev. (Retrac-Reno Transportation Rail Access Corridor Project), “B”, AGM, 5%, 6/01/2038 | 95,000 | 96,573 | ||
| Reno, NV, Sales Tax Rev. (Retrac-Reno Transportation Rail Access Corridor Project), “B”, AGM, 4%, 6/01/2048 | 365,000 | 298,424 | ||
| Reno, NV, Sales Tax Rev. (Retrac-Reno Transportation Rail Access Corridor Project), “B”, AGM, 4.125%, 6/01/2058 | 450,000 | 364,584 | ||
| $9,271,975 | ||||
61
Portfolio of Investments (unaudited)
– continued
| Issuer | Shares/Par | Value ($) | ||
| Municipal Bonds - continued | ||||
| New Hampshire - 1.0% | ||||
| National Finance Authority, New Hampshire Municipal Certificates, “A-2”, 4%, 10/20/2036 | $ | 6,573,565 | $5,889,308 | |
| National Finance Authority, New Hampshire Municipal Certificates, “A-2”, 3.875%, 1/20/2038 | 7,653,712 | 6,591,673 | ||
| National Finance Authority, New Hampshire Municipal Certificates, “X-2”, 0.674%, 10/20/2036 (i) | 29,180,000 | 1,408,519 | ||
| National Finance Authority, New Hampshire Resource Recovery Refunding Rev., “B”, 4.625%, 11/01/2042 (n) | 1,855,000 | 1,525,282 | ||
| National Finance Authority, New Hampshire Resource Recovery Refunding Rev., “B”, 3.75%, 7/01/2045 (Put Date 7/02/2040) (n) | 2,290,000 | 1,689,012 | ||
| National Finance Authority, New Hampshire Rev. (Presbyterian Senior Living Project), “A”, 5.25%, 7/01/2048 | 1,175,000 | 1,106,700 | ||
| National Finance Authority, New Hampshire Senior Living Rev. (Springpoint Senior Living Project), 4%, 1/01/2041 | 840,000 | 663,263 | ||
| National Finance Authority, New Hampshire, Municipal Certificates, “A”, 4.125%, 1/20/2034 | 6,626,982 | 6,164,149 | ||
| National Finance Authority, NV, Lease Rev. (NCCD - UNR Properties LLC - University of Nevada, Reno Project), “A”, BAM, 5.25%, 6/01/2051 | 2,520,000 | 2,611,545 | ||
| National Finance Authority, NV, Lease Rev. (NCCD - UNR Properties LLC - University of Nevada, Reno Project), “A”, BAM, 4.5%, 6/01/2053 | 1,130,000 | 1,011,379 | ||
| New Hampshire Health & Education Facilities Authority Rev., 4%, 7/01/2037 | 12,920,000 | 10,680,120 | ||
| New Hampshire National Finance Authority Municipal Certificates, “1-A”, 4.375%, 9/20/2036 | 9,472,971 | 8,771,828 | ||
| $48,112,778 | ||||
| New Jersey - 4.5% | ||||
| Atlantic City, NJ, Board of Education, 4%, 4/01/2030 | $ | 130,000 | $130,091 | |
| Atlantic City, NJ, Board of Education, 4%, 4/01/2031 | 130,000 | 129,307 | ||
| Atlantic City, NJ, Board of Education, 4%, 4/01/2032 | 225,000 | 222,443 | ||
| Atlantic City, NJ, Board of Education, 4%, 4/01/2034 | 225,000 | 221,032 | ||
| Atlantic City, NJ, Improvement Authority Lease Rev. (Stockton University Campus Phase II Project), “A”, AGM, 4%, 7/01/2040 | 245,000 | 227,339 | ||
| Atlantic City, NJ, Tax Appeal Refunding Bonds (Qualified Pursuant to the Provisions of the Municipal Qualified Bond Act), “A”, BAM, 5%, 3/01/2032 | 3,875,000 | 3,999,994 | ||
| Atlantic City, NJ, Tax Appeal Refunding Bonds (Qualified Pursuant to the Provisions of the Municipal Qualified Bond Act), “A”, BAM, 5%, 3/01/2042 | 475,000 | 478,407 | ||
62
Portfolio of Investments (unaudited)
– continued
| Issuer | Shares/Par | Value ($) | ||
| Municipal Bonds - continued | ||||
| New Jersey - continued | ||||
| Atlantic City, NJ, Tax Appeal Refunding Bonds (Qualified Pursuant to the Provisions of the Municipal Qualified Bond Act), “B”, AGM, 5%, 3/01/2037 | $ | 1,315,000 | $1,340,413 | |
| Camden County, NJ, Improvement Authority School Rev. (KIPP Cooper Norcross Academy), 6%, 6/15/2042 | 225,000 | 236,730 | ||
| Camden County, NJ, Improvement Authority School Rev. (KIPP Cooper Norcross Academy), 6%, 6/15/2047 | 620,000 | 646,332 | ||
| Camden County, NJ, Improvement Authority School Rev. (KIPP Cooper Norcross Academy), 6%, 6/15/2052 | 570,000 | 591,608 | ||
| Camden County, NJ, Improvement Authority School Rev. (KIPP Cooper Norcross Academy), 6%, 6/15/2062 | 1,880,000 | 1,939,988 | ||
| Middlesex County, NJ, Improvement Authority Rev. (Rutgers University H-1 Project), “A”, 5%, 8/15/2053 | 22,330,000 | 23,037,075 | ||
| New Jersey Economic Development Authority (Motor Vehicle Surcharges Subordinate Refunding Rev.), “A”, 3.125%, 7/01/2029 | 670,000 | 609,895 | ||
| New Jersey Economic Development Authority (Motor Vehicle Surcharges Subordinate Refunding Rev.), “A”, BAM, 5%, 7/01/2028 | 7,270,000 | 7,556,434 | ||
| New Jersey Economic Development Authority Refunding Rev. (School Facilities Construction), “SSS”, 5.25%, 6/15/2036 (w) | 570,000 | 594,142 | ||
| New Jersey Economic Development Authority Refunding Rev. (School Facilities Construction), “SSS”, 5.25%, 6/15/2037 (w) | 570,000 | 587,738 | ||
| New Jersey Economic Development Authority Refunding Rev. (School Facilities Construction), “SSS”, 5.25%, 6/15/2038 (w) | 750,000 | 766,372 | ||
| New Jersey Economic Development Authority Refunding Rev. (School Facilities Construction), “SSS”, 5.25%, 6/15/2039 (w) | 685,000 | 696,857 | ||
| New Jersey Economic Development Authority Rev. (Goethals Bridge Replacement Project), 5.5%, 1/01/2027 | 370,000 | 371,077 | ||
| New Jersey Economic Development Authority Rev. (Goethals Bridge Replacement Project), 5%, 1/01/2028 | 370,000 | 370,714 | ||
| New Jersey Economic Development Authority Rev. (Goethals Bridge Replacement Project), AGM, 5%, 1/01/2031 | 1,115,000 | 1,117,297 | ||
| New Jersey Economic Development Authority Rev. (Goethals Bridge Replacement Project), AGM, 5.125%, 7/01/2042 | 345,000 | 345,216 | ||
| New Jersey Economic Development Authority Rev. (Provident Group - Rowan Properties LLC - Rowan University Student Housing Project), “A”, 5%, 1/01/2030 | 865,000 | 841,439 | ||
| New Jersey Economic Development Authority Rev. (Provident Group - Rowan Properties LLC - Rowan University Student Housing Project), “A”, 5%, 1/01/2035 | 1,235,000 | 1,175,660 | ||
| New Jersey Economic Development Authority Rev. (School Facilities Construction), “DDD”, 5%, 6/15/2042 | 2,250,000 | 2,365,156 | ||
63
Portfolio of Investments (unaudited)
– continued
| Issuer | Shares/Par | Value ($) | ||
| Municipal Bonds - continued | ||||
| New Jersey - continued | ||||
| New Jersey Economic Development Authority, Motor Vehicle Surcharges Subordinate Refunding Rev., “A”, BAM, 3.125%, 7/01/2031 | $ | 16,900,000 | $15,505,975 | |
| New Jersey Economic Development Authority, Special Facilities Rev. (Continental Airlines, Inc.), 5.25%, 9/15/2029 | 2,875,000 | 2,863,315 | ||
| New Jersey Economic Development Authority, Special Facilities Rev. (Continental Airlines, Inc.), “A”, 5.625%, 11/15/2030 | 3,185,000 | 3,202,939 | ||
| New Jersey Economic Development Authority, State Lease Rev. (Juvenile Justice Commission Facilities Project), “C”, 5%, 6/15/2042 | 2,665,000 | 2,668,954 | ||
| New Jersey Economic Development Authority, Water Facilities Rev. (American Water Co., Inc. Project), “E”, 0.85%, 12/01/2025 | 1,550,000 | 1,382,383 | ||
| New Jersey Educational Facilities Authority Rev. (Ramapo College Project), “A”, 5%, 7/01/2031 | 590,000 | 636,314 | ||
| New Jersey Educational Facilities Authority Rev. (Ramapo College Project), “A”, 5%, 7/01/2032 | 790,000 | 858,070 | ||
| New Jersey Educational Facilities Authority Rev. (Ramapo College Project), “A”, 5%, 7/01/2033 | 355,000 | 382,301 | ||
| New Jersey Health Care Facilities, Financing Authority, State Contract Refunding Bonds (Hospital Asset Transformation Program), 5%, 10/01/2031 | 1,660,000 | 1,715,590 | ||
| New Jersey Health Care Facilities, Financing Authority, State Contract Refunding Bonds (Hospital Asset Transformation Program), 5%, 10/01/2032 | 1,655,000 | 1,708,318 | ||
| New Jersey Health Care Facilities, Financing Authority, State Contract Refunding Bonds (Hospital Asset Transformation Program), 5%, 10/01/2037 | 2,395,000 | 2,437,169 | ||
| New Jersey Higher Education Student Assistance Authority, Senior Student Loan Rev., “B”, 3.25%, 12/01/2039 | 2,800,000 | 2,531,677 | ||
| New Jersey Higher Education Student Assistance Authority, Senior Student Loan Rev., “B”, 4%, 12/01/2041 | 11,485,000 | 10,864,096 | ||
| New Jersey Higher Education Student Assistance Authority, Senior Student Loan Rev., ”A“, 5%, 12/01/2028 | 315,000 | 321,060 | ||
| New Jersey Higher Education Student Assistance Authority, Senior Student Loan Rev., ”A“, 5%, 12/01/2029 | 435,000 | 445,050 | ||
| New Jersey Higher Education Student Assistance Authority, Senior Student Loan Rev., ”B“, 5%, 12/01/2028 | 1,145,000 | 1,167,029 | ||
| New Jersey Higher Education Student Assistance Authority, Senior Student Loan Rev., ”B“, 5%, 12/01/2029 | 1,115,000 | 1,139,559 | ||
| New Jersey Higher Education Student Assistance Authority, Senior Student Loan Rev., ”B“, 3.5%, 12/01/2039 | 4,365,000 | 4,050,133 | ||
| New Jersey Higher Education Student Assistance Authority, Senior Student Loan Rev., ”B“, 2.5%, 12/01/2040 | 1,690,000 | 1,334,771 | ||
64
Portfolio of Investments (unaudited)
– continued
| Issuer | Shares/Par | Value ($) | ||
| Municipal Bonds - continued | ||||
| New Jersey - continued | ||||
| New Jersey Higher Education Student Assistance Authority, Senior Student Loan Rev., ”C“, 3.25%, 12/01/2051 | $ | 700,000 | $447,025 | |
| New Jersey Higher Education Student Assistance Authority, Student Loan Refunding Rev., “B”, 4%, 12/01/2044 | 12,920,000 | 11,646,220 | ||
| New Jersey Higher Education Student Assistance Authority, Student Loan Refunding Rev., “C”, 5%, 12/01/2053 | 1,475,000 | 1,267,290 | ||
| New Jersey Housing & Mortgage Finance Agency, Single Family Housing Rev., “E”, 3.5%, 4/01/2051 | 8,110,000 | 7,771,693 | ||
| New Jersey Housing & Mortgage Finance Agency, Single Family Housing Rev., “H”, 3%, 10/01/2052 | 7,670,000 | 7,142,441 | ||
| New Jersey Tobacco Settlement Financing Corp., “A”, 5%, 6/01/2032 | 2,360,000 | 2,437,777 | ||
| New Jersey Tobacco Settlement Financing Corp., “A”, 5%, 6/01/2033 | 2,360,000 | 2,437,038 | ||
| New Jersey Tobacco Settlement Financing Corp., “A”, 5%, 6/01/2034 | 2,360,000 | 2,432,820 | ||
| New Jersey Tobacco Settlement Financing Corp., “A”, 5%, 6/01/2035 | 2,320,000 | 2,382,524 | ||
| New Jersey Transportation Trust Fund Authority, “AA”, 5%, 6/15/2035 | 840,000 | 884,287 | ||
| New Jersey Transportation Trust Fund Authority, “AA”, 4%, 6/15/2038 | 1,120,000 | 1,044,220 | ||
| New Jersey Transportation Trust Fund Authority, “AA”, 5%, 6/15/2038 | 1,200,000 | 1,241,623 | ||
| New Jersey Transportation Trust Fund Authority, “AA”, 5%, 6/15/2040 | 840,000 | 862,770 | ||
| New Jersey Transportation Trust Fund Authority, “AA”, 4.25%, 6/15/2044 | 955,000 | 877,886 | ||
| New Jersey Transportation Trust Fund Authority, “AA”, 4%, 6/15/2045 | 2,225,000 | 1,972,467 | ||
| New Jersey Transportation Trust Fund Authority, “B”, AAC, 5.5%, 9/01/2026 | 2,775,000 | 2,890,332 | ||
| New Jersey Transportation Trust Fund Authority, “CC”, 5.5%, 6/15/2050 | 2,405,000 | 2,533,952 | ||
| New Jersey Transportation Trust Fund Authority, Capital Appreciation, “A”, 0%, 12/15/2037 | 19,665,000 | 9,669,029 | ||
| New Jersey Transportation Trust Fund Authority, Capital Appreciation, “C”, AAC, 0%, 12/15/2035 | 2,930,000 | 1,662,631 | ||
| New Jersey Transportation Trust Fund Authority, Capital Appreciation, “C”, AAC, 0%, 12/15/2036 | 7,645,000 | 4,057,048 | ||
| New Jersey Transportation Trust Fund Authority, Federal Highway Reimbursement Rev., “A”, 5%, 6/15/2029 | 2,690,000 | 2,743,106 | ||
65
Portfolio of Investments (unaudited)
– continued
| Issuer | Shares/Par | Value ($) | ||
| Municipal Bonds - continued | ||||
| New Jersey - continued | ||||
| New Jersey Transportation Trust Fund Authority, Transportation System, “A”, 4.25%, 6/15/2040 | $ | 3,975,000 | $3,732,927 | |
| New Jersey Transportation Trust Fund Authority, Transportation System, Capital Appreciation, “C”, AAC, 0%, 12/15/2028 | 9,535,000 | 7,671,348 | ||
| New Jersey Transportation Trust Fund Authority, Transportation System, Capital Appreciation, “C”, AGM, 0%, 12/15/2029 | 12,340,000 | 9,487,825 | ||
| New Jersey Transportation Trust Fund Authority, Transportation System, Capital Appreciation, “C”, AGM, 0%, 12/15/2032 | 2,635,000 | 1,751,119 | ||
| New Jersey Transportation Trust Fund Authority, Transportation System, Capital Appreciation, “C”, NPFG, 0%, 12/15/2027 | 5,430,000 | 4,552,923 | ||
| New Jersey Transportation Trust Fund Authority, Transportation System, Capital Appreciation, “C”, NPFG, 0%, 12/15/2031 | 3,935,000 | 2,734,208 | ||
| Newark, NJ, General Obligation Refunding, “A”, AGM, 5%, 10/01/2024 | 590,000 | 595,478 | ||
| Newark, NJ, General Obligation Refunding, “B”, AGM, 5%, 10/01/2023 | 790,000 | 790,000 | ||
| Newark, NJ, General Obligation Refunding, “B”, AGM, 5%, 10/01/2025 | 395,000 | 400,965 | ||
| South Jersey, NJ, Transportation Authority System Rev., “A”, AGM, 5%, 11/01/2031 | 1,015,000 | 1,070,410 | ||
| South Jersey, NJ, Transportation Authority System Rev., “A”, AGM, 5%, 11/01/2033 | 575,000 | 606,163 | ||
| South Jersey, NJ, Transportation Authority System Rev., “A”, BAM, 5.25%, 11/01/2052 | 2,760,000 | 2,844,906 | ||
| $210,455,910 | ||||
| New Mexico - 0.2% | ||||
| Los Ranchos de Albuquerque, NM, Education Facilities Rev. (Albuquerque Academy Project), 4%, 9/01/2040 | $ | 410,000 | $353,484 | |
| New Mexico Mortgage Finance Authority, Single Family Mortgage Program, “A-1”, FNMA, 4%, 1/01/2049 | 675,000 | 660,392 | ||
| New Mexico Mortgage Finance Authority, Single Family Mortgage Program, “C”, FNMA, 4%, 1/01/2049 | 1,405,000 | 1,376,103 | ||
| New Mexico Mortgage Finance Authority, Single Family Mortgage Program, “D”, GNMA, 5.25%, 3/01/2053 | 5,500,000 | 5,591,918 | ||
| Santa Fe, NM, Retirement Facility Rev. (El Castillo Retirement Residences Project), “A”, 5%, 5/15/2034 | 215,000 | 196,858 | ||
| Santa Fe, NM, Retirement Facility Rev. (El Castillo Retirement Residences Project), “A”, 5%, 5/15/2039 | 165,000 | 140,501 | ||
| Santa Fe, NM, Retirement Facility Rev. (El Castillo Retirement Residences Project), “A”, 5%, 5/15/2044 | 170,000 | 137,938 | ||
66
Portfolio of Investments (unaudited)
– continued
| Issuer | Shares/Par | Value ($) | ||
| Municipal Bonds - continued | ||||
| New Mexico - continued | ||||
| Santa Fe, NM, Retirement Facility Rev. (El Castillo Retirement Residences Project), “A”, 5%, 5/15/2049 | $ | 445,000 | $345,305 | |
| $8,802,499 | ||||
| New York - 6.2% | ||||
| Broome County, NY, Local Development Corp. Rev. (United Health Services Hospitals, Inc.), AGM, 5%, 4/01/2031 | $ | 730,000 | $750,639 | |
| Broome County, NY, Local Development Corp. Rev. (United Health Services Hospitals, Inc.), AGM, 5%, 4/01/2032 | 790,000 | 812,475 | ||
| Broome County, NY, Local Development Corp. Rev. (United Health Services Hospitals, Inc.), AGM, 5%, 4/01/2033 | 830,000 | 853,746 | ||
| Broome County, NY, Local Development Corp. Rev. (United Health Services Hospitals, Inc.), AGM, 4%, 4/01/2034 | 790,000 | 751,487 | ||
| Broome County, NY, Local Development Corp. Rev. (United Health Services Hospitals, Inc.), AGM, 3%, 4/01/2036 | 1,420,000 | 1,117,468 | ||
| Broome County, NY, Local Development Corp. Rev. (United Health Services Hospitals, Inc.), AGM, 3%, 4/01/2037 | 1,180,000 | 901,042 | ||
| Broome County, NY, Local Development Corp. Rev. (United Health Services Hospitals, Inc.), AGM, 4%, 4/01/2038 | 985,000 | 886,171 | ||
| Broome County, NY, Local Development Corp. Rev. (United Health Services Hospitals, Inc.), AGM, 4%, 4/01/2039 | 1,065,000 | 947,072 | ||
| Build NYC Resource Corp. Rev. (Albert Einstein School of Medicine, Inc.), 5.5%, 9/01/2045 (n) | 14,815,000 | 13,838,918 | ||
| Build NYC Resource Corp. Rev. (Grand Concourse Academy Charter School Project), “A”, 5%, 7/01/2052 | 290,000 | 261,557 | ||
| Build NYC Resource Corp. Rev. (Grand Concourse Academy Charter School Project), “B”, 5%, 7/01/2062 | 2,170,000 | 1,898,226 | ||
| Build NYC Resource Corp. Rev. (KIPP NYC Public Schools Facilities - Canal West Project), 5.25%, 7/01/2057 | 1,615,000 | 1,528,054 | ||
| Build NYC Resource Corp. Rev. (KIPP NYC Public Schools Facilities - Canal West Project), 5.25%, 7/01/2062 | 2,025,000 | 1,896,764 | ||
| Jefferson County, NY, Civic Development Corp. Rev. (Samaritan Medical Center), “A”, 4%, 11/01/2032 | 380,000 | 335,910 | ||
| New York Dormitory Authority Rev. (Cornell University), “D”, 5%, 7/01/2035 | 465,000 | 529,465 | ||
| New York Dormitory Authority Rev. (HYU Langone Hospitals Obligated Group), “A”, 4%, 7/01/2050 | 4,750,000 | 4,035,603 | ||
| New York Dormitory Authority Rev. (Northwell Health Obligated Group), “A”, 4%, 5/01/2045 | 4,380,000 | 3,716,602 | ||
| New York Dormitory Authority Rev. (Orange Regional Medical Center Obligated Group Rev.), 5%, 12/01/2033 (n) | 100,000 | 94,952 | ||
| New York Dormitory Authority Rev. (Orange Regional Medical Center Obligated Group Rev.), 5%, 12/01/2035 (n) | 200,000 | 187,440 | ||
67
Portfolio of Investments (unaudited)
– continued
| Issuer | Shares/Par | Value ($) | ||
| Municipal Bonds - continued | ||||
| New York - continued | ||||
| New York Dormitory Authority Rev. (Rochester Institute of Technology), “A”, 5%, 7/01/2036 | $ | 880,000 | $920,016 | |
| New York Dormitory Authority Rev. (Rochester Institute of Technology), “A”, 5%, 7/01/2040 | 995,000 | 1,020,655 | ||
| New York Dormitory Authority Rev., State Personal Income Tax, “A”, 4%, 3/15/2048 | 4,300,000 | 3,790,233 | ||
| New York Dormitory Authority Rev., State Personal Income Tax, “E”, 4%, 3/15/2042 | 14,455,000 | 13,189,841 | ||
| New York Environmental Facilities Corp. Rev., Solid Waste Disposal (Casella Waste Management, Inc. Project), 2.75%, 9/01/2050 (Put Date 9/02/2025) (n) | 580,000 | 555,632 | ||
| New York Housing Finance Agency Affordable Housing Rev., “L-2”, 0.75%, 11/01/2025 | 1,325,000 | 1,211,406 | ||
| New York Liberty Development Corp., Liberty Rev. (3 World Trade Center Project), “1”, 5%, 11/15/2044 (n) | 22,780,000 | 21,045,169 | ||
| New York Liberty Development Corp., Liberty Rev. (3 World Trade Center Project), “2”, 5.375%, 11/15/2040 (n) | 2,510,000 | 2,413,450 | ||
| New York Power Authority, Green Transmission Project Rev., “A”, AGM, 4%, 11/15/2047 | 1,565,000 | 1,368,050 | ||
| New York State Thruway Authority, Personal Income Tax Rev., “A”, 4%, 3/15/2043 | 10,645,000 | 9,618,525 | ||
| New York State Thruway Authority, Personal Income Tax Rev., “C”, 4.125%, 3/15/2057 | 6,005,000 | 5,132,528 | ||
| New York Transportation Development Corp., Exempt Facility Rev. (State Thruway Service Areas Project), 4%, 10/31/2046 | 7,000,000 | 5,724,609 | ||
| New York Transportation Development Corp., Exempt Facility Rev. (State Thruway Service Areas Project), 4%, 4/30/2053 | 1,740,000 | 1,357,278 | ||
| New York Transportation Development Corp., Special Facilities Rev. (American Airlines, Inc. John F. Kennedy International Airport Project), 3%, 8/01/2031 | 555,000 | 479,254 | ||
| New York Transportation Development Corp., Special Facilities Rev. (American Airlines, Inc. John F. Kennedy International Airport Project), 5.25%, 8/01/2031 | 1,015,000 | 1,025,727 | ||
| New York Transportation Development Corp., Special Facilities Rev. (American Airlines, Inc. John F. Kennedy International Airport Project), 5.375%, 8/01/2036 | 2,620,000 | 2,559,792 | ||
| New York Transportation Development Corp., Special Facilities Rev. (Delta Airlines, Inc. LaGuardia Airport Terminals C&D Redevelopment Project), 5%, 1/01/2031 | 6,400,000 | 6,448,914 | ||
| New York Transportation Development Corp., Special Facilities Rev. (Delta Airlines, Inc. LaGuardia Airport Terminals C&D Redevelopment Project), 5%, 1/01/2032 | 1,835,000 | 1,848,822 | ||
68
Portfolio of Investments (unaudited)
– continued
| Issuer | Shares/Par | Value ($) | ||
| Municipal Bonds - continued | ||||
| New York - continued | ||||
| New York Transportation Development Corp., Special Facilities Rev. (Delta Airlines, Inc. LaGuardia Airport Terminals C&D Redevelopment Project), 5%, 10/01/2035 | $ | 4,395,000 | $4,410,032 | |
| New York Transportation Development Corp., Special Facilities Rev. (Delta Airlines, Inc. LaGuardia Airport Terminals C&D Redevelopment Project), 4%, 1/01/2036 | 1,035,000 | 952,406 | ||
| New York Transportation Development Corp., Special Facilities Rev. (Delta Airlines, Inc. LaGuardia Airport Terminals C&D Redevelopment Project), 5%, 10/01/2040 | 5,050,000 | 4,837,988 | ||
| New York Transportation Development Corp., Special Facilities Rev. (Terminal 4 John F. Kennedy International Airport Project), “A”, 5%, 12/01/2036 | 40,000 | 40,351 | ||
| New York Transportation Development Corp., Special Facilities Rev. (Terminal 4 John F. Kennedy International Airport Project), “A”, 4%, 12/01/2038 | 170,000 | 151,697 | ||
| New York Transportation Development Corp., Special Facilities Rev. (Terminal 4 John F. Kennedy International Airport Project), “A”, 4%, 12/01/2039 | 400,000 | 353,991 | ||
| New York Transportation Development Corp., Special Facility Rev. (LaGuardia Airport Terminal B Redevelopment Project), “A”, 5%, 7/01/2046 | 10,000,000 | 9,505,647 | ||
| New York Urban Development Corp., State Personal Income Tax Rev. (General Purpose), “C”, 4%, 3/15/2049 | 8,025,000 | 6,959,837 | ||
| New York Urban Development Corp., State Personal Income Tax Rev., “A”, 4%, 3/15/2039 | 4,720,000 | 4,404,867 | ||
| New York, NY, General Obligation, “B-1”, 5%, 12/01/2041 | 2,755,000 | 2,773,215 | ||
| New York, NY, General Obligation, “F-1”, 5%, 3/01/2039 | 3,540,000 | 3,670,878 | ||
| New York, NY, Housing Development Corp., Housing Impact (Sustainable Development Bonds), “A”, 4.8%, 2/01/2053 | 6,270,000 | 5,921,137 | ||
| New York, NY, Housing Development Corp., Multi-Family Housing Rev. (8 Spruce Street), “E”, 3.5%, 2/15/2048 | 4,585,308 | 4,505,247 | ||
| New York, NY, Housing Development Corp., Multi-Family Housing Rev. (8 Spruce Street), “F”, 4.5%, 2/15/2048 | 22,686,278 | 22,256,425 | ||
| New York, NY, Housing Development Corp., Multi-Family Housing Rev. (Sustainable Development Bonds), “G”, 4.75%, 11/01/2048 | 1,645,000 | 1,545,335 | ||
| New York, NY, Housing Development Corp., Multi-Family Housing Rev. (Sustainable Development Bonds), “G”, 4.85%, 11/01/2053 | 835,000 | 794,843 | ||
| New York, NY, Housing Development Corp., Multi-Family Housing Rev. (Sustainable Development Bonds), “A-1”, 4.85%, 11/01/2053 | 2,625,000 | 2,498,759 | ||
| New York, NY, Housing Development Corp., Multi-Family Housing Rev. (Sustainable Development Bonds), “A-1”, 4.95%, 11/01/2058 | 2,500,000 | 2,358,689 | ||
| New York, NY, Industrial Development Agency, Airport Facilities Rev. (Transportation Infrastructure Properties LLC), 5%, 7/01/2028 | 1,695,000 | 1,673,212 | ||
69
Portfolio of Investments (unaudited)
– continued
| Issuer | Shares/Par | Value ($) | ||
| Municipal Bonds - continued | ||||
| New York - continued | ||||
| New York, NY, Industrial Development Agency, PILOT Refunding Rev. (Yankee Stadium Project), “A”, AGM, 3%, 3/01/2040 | $ | 3,155,000 | $2,369,001 | |
| New York, NY, Municipal Water Finance Authority, Water & Sewer System Rev., “CC-1”, 5%, 6/15/2046 | 5,505,000 | 5,553,215 | ||
| New York, NY, Municipal Water Finance Authority, Water & Sewer System Rev., “CC-1”, 5%, 6/15/2048 | 4,055,000 | 4,099,324 | ||
| New York, NY, Transitional Finance Authority Building Aid Rev., “S-3”, 5%, 7/15/2043 | 810,000 | 826,843 | ||
| New York, NY, Transitional Finance Authority Future Tax Secured Subordinate, “A”, 4%, 11/01/2034 | 790,000 | 791,710 | ||
| New York, NY, Transitional Finance Authority Future Tax Secured Subordinate, “A”, 4%, 11/01/2035 | 790,000 | 780,192 | ||
| New York, NY, Transitional Finance Authority Future Tax Secured Subordinate, “C”, 4%, 2/01/2041 | 6,035,000 | 5,556,238 | ||
| New York, NY, Transitional Finance Authority Future Tax Secured Subordinate, “C-1”, 4%, 5/01/2045 | 7,865,000 | 7,038,165 | ||
| New York, NY, Transitional Finance Authority Future Tax Secured Subordinate, “F”, 4%, 2/01/2051 | 15,000,000 | 13,069,032 | ||
| New York, NY, Transitional Finance Authority Rev., “C-1”, 4%, 5/01/2036 | 1,575,000 | 1,539,707 | ||
| New York, NY, Transitional Finance Authority Rev., “C-1”, 4%, 5/01/2039 | 2,755,000 | 2,578,599 | ||
| Niagara, NY, Area Development Corp. Rev. (Catholic Health System, Inc. Project), 4.5%, 7/01/2052 | 2,260,000 | 1,585,546 | ||
| Niagara, NY, Area Development Corp. Rev. (Catholic Health System, Inc. Project), 5%, 7/01/2052 | 1,215,000 | 903,871 | ||
| Port Authority of NY & NJ (214th Series), 4%, 9/01/2037 | 1,750,000 | 1,613,602 | ||
| Port Authority of NY & NJ (214th Series), 4%, 9/01/2039 | 725,000 | 653,309 | ||
| Port Authority of NY & NJ (214th Series), 4%, 9/01/2043 | 1,170,000 | 1,012,325 | ||
| Port Authority of NY & NJ (221st Series), 4%, 7/15/2045 | 1,125,000 | 961,232 | ||
| Port Authority of NY & NJ (221st Series), 4%, 7/15/2050 | 2,810,000 | 2,351,921 | ||
| Port Authority of NY & NJ (221st Series), 4%, 7/15/2055 | 9,010,000 | 7,384,294 | ||
| Port Authority of NY & NJ (223th Series), 4%, 7/15/2038 | 2,210,000 | 2,010,558 | ||
| Port Authority of NY & NJ (223th Series), 4%, 7/15/2040 | 645,000 | 574,251 | ||
| Port Authority of NY & NJ (226th Series), 5%, 10/15/2038 | 2,360,000 | 2,428,763 | ||
| Port Authority of NY & NJ (226th Series), 5%, 10/15/2039 | 1,750,000 | 1,794,280 | ||
| Schenectady County, NY, Capital Resource Corp. Tax-Exempt Rev. (Union College Project), 5.25%, 7/01/2052 | 555,000 | 576,073 | ||
| Syracuse, NY, Industrial Development Agency PILOT Rev. (Carousel Center Project), “A”, 5%, 1/01/2028 | 1,315,000 | 956,322 | ||
| Syracuse, NY, Industrial Development Agency PILOT Rev. (Carousel Center Project), “A”, 5%, 1/01/2029 | 1,915,000 | 1,392,564 | ||
70
Portfolio of Investments (unaudited)
– continued
| Issuer | Shares/Par | Value ($) | ||
| Municipal Bonds - continued | ||||
| New York - continued | ||||
| Syracuse, NY, Industrial Development Agency PILOT Rev. (Carousel Center Project), “A”, 5%, 1/01/2030 | $ | 1,475,000 | $1,072,527 | |
| Syracuse, NY, Industrial Development Agency PILOT Rev. (Carousel Center Project), “A”, 5%, 1/01/2031 | 1,825,000 | 1,326,939 | ||
| Syracuse, NY, Industrial Development Agency PILOT Rev. (Carousel Center Project), “A”, 5%, 1/01/2032 | 3,370,000 | 2,450,143 | ||
| Syracuse, NY, Industrial Development Agency PILOT Rev. (Carousel Center Project), “A”, 5%, 1/01/2033 | 2,970,000 | 2,159,200 | ||
| Syracuse, NY, Industrial Development Agency PILOT Rev. (Carousel Center Project), “A”, 5%, 1/01/2034 | 2,660,000 | 1,933,725 | ||
| Syracuse, NY, Industrial Development Agency PILOT Rev. (Carousel Center Project), “A”, 5%, 1/01/2035 | 3,550,000 | 2,580,594 | ||
| Syracuse, NY, Industrial Development Agency PILOT Rev. (Carousel Center Project), “A”, 5%, 1/01/2036 | 1,160,000 | 843,196 | ||
| Tobacco Settlement Asset Securitization Corp., NY, “A”, 5%, 6/01/2035 | 380,000 | 387,522 | ||
| Tobacco Settlement Asset Securitization Corp., NY, “A”, 5%, 6/01/2041 | 2,135,000 | 2,136,977 | ||
| Triborough Bridge & Tunnel Authority Rev., NY, Payroll Mobility Tax (MTA Bridges and Tunnels), “C-3”, 4%, 5/15/2051 | 8,500,000 | 7,290,718 | ||
| Yonkers, NY, General Obligation, “C”, AGM, 5%, 3/15/2035 | 1,255,000 | 1,369,740 | ||
| Yonkers, NY, School Serial Bonds, “D”, AGM, 5%, 3/15/2035 | 960,000 | 1,047,769 | ||
| $289,668,035 | ||||
| North Carolina - 1.0% | ||||
| Greater Ashville, NC, Regional Airport Authority System Rev., AGM, 5.25%, 7/01/2048 | $ | 735,000 | $742,603 | |
| North Carolina Capital Facilities Finance Agency, Educational Facilities Refunding Rev. (High Point University), 4%, 5/01/2032 | 790,000 | 769,802 | ||
| North Carolina Housing Finance Agency, Home Ownership Rev., “44”, 4%, 7/01/2050 | 985,000 | 960,174 | ||
| North Carolina Housing Finance Agency, Home Ownership Rev., “46-A”, GNMA, 3%, 7/01/2051 | 9,840,000 | 9,267,001 | ||
| North Carolina Medical Care Commission, Health Care Facilities First Mortgage Rev. (Lutheran Services for the Aging), “A”, 4%, 3/01/2029 | 220,000 | 202,111 | ||
| North Carolina Medical Care Commission, Health Care Facilities First Mortgage Rev. (Lutheran Services for the Aging), “A”, 4%, 3/01/2036 | 1,070,000 | 870,650 | ||
| North Carolina Medical Care Commission, Health Care Facilities First Mortgage Rev. (Lutheran Services for the Aging), “A”, 4%, 3/01/2041 | 370,000 | 273,456 | ||
71
Portfolio of Investments (unaudited)
– continued
| Issuer | Shares/Par | Value ($) | ||
| Municipal Bonds - continued | ||||
| North Carolina - continued | ||||
| North Carolina Medical Care Commission, Health Care Facilities First Mortgage Rev. (Lutheran Services for the Aging), “A”, 4%, 3/01/2051 | $ | 4,170,000 | $2,716,120 | |
| North Carolina Medical Care Commission, Health Care Facilities First Mortgage Rev. (Lutheran Services for the Aging), “C”, 4%, 3/01/2036 | 465,000 | 378,366 | ||
| North Carolina Medical Care Commission, Health Care Facilities First Mortgage Rev. (Lutheran Services for the Aging), “C”, 4%, 3/01/2042 | 175,000 | 127,209 | ||
| North Carolina Medical Care Commission, Health Care Facilities First Mortgage Rev. (Pennybyrn at Maryfield), 5%, 10/01/2025 | 70,000 | 69,373 | ||
| North Carolina Medical Care Commission, Health Care Facilities First Mortgage Rev. (Pennybyrn at Maryfield), 5%, 10/01/2030 | 205,000 | 197,617 | ||
| North Carolina Medical Care Commission, Health Care Facilities First Mortgage Rev. (Pennybyrn at Maryfield), 5%, 10/01/2035 | 225,000 | 209,229 | ||
| North Carolina Medical Care Commission, Health Care Facilities First Mortgage Rev. (Presbyterian Homes Obligated Group), “A”, 5%, 10/01/2040 | 720,000 | 707,864 | ||
| North Carolina Medical Care Commission, Health Care Facilities First Mortgage Rev. (Presbyterian Homes Obligated Group), “A”, 5%, 10/01/2045 | 690,000 | 658,133 | ||
| North Carolina Medical Care Commission, Health Care Facilities First Mortgage Rev. (Presbyterian Homes Obligated Group), “A”, 5%, 10/01/2050 | 445,000 | 415,671 | ||
| North Carolina Medical Care Commission, Health Care Facilities Rev. (Novant Health Obligated Group), “A”, 4%, 11/01/2052 | 2,465,000 | 2,147,855 | ||
| North Carolina Medical Care Commission, Retirement Facilities First Mortgage Refunding Rev. (Plantation Village, Inc.), “A”, 4%, 1/01/2052 | 1,370,000 | 977,503 | ||
| North Carolina Medical Care Commission, Retirement Facilities First Mortgage Rev. (United Church Homes and Services), “A”, 5%, 9/01/2037 (Prerefunded 9/01/2024) | 80,000 | 80,823 | ||
| North Carolina Turnpike Authority, Monroe Expressway Toll Rev., “A”, 5%, 7/01/2042 | 480,000 | 479,180 | ||
| North Carolina Turnpike Authority, Monroe Expressway Toll Rev., “A”, 5%, 7/01/2047 | 940,000 | 919,268 | ||
| North Carolina Turnpike Authority, Monroe Expressway Toll Rev., “A”, 5%, 7/01/2051 | 1,920,000 | 1,873,325 | ||
| North Carolina Turnpike Authority, Monroe Expressway Toll Rev., “A”, 5%, 7/01/2054 | 1,650,000 | 1,597,902 | ||
| North Carolina Turnpike Authority, Triangle Expressway System Rev., AGM, 5%, 1/01/2031 | 1,260,000 | 1,300,325 | ||
72
Portfolio of Investments (unaudited)
– continued
| Issuer | Shares/Par | Value ($) | ||
| Municipal Bonds - continued | ||||
| North Carolina - continued | ||||
| North Carolina Turnpike Authority, Triangle Expressway System Senior Lien Refunding Rev., AGM, 5%, 1/01/2036 | $ | 9,165,000 | $9,478,139 | |
| North Carolina Turnpike Authority, Triangle Expressway System Senior Lien Rev., AGM, 5%, 1/01/2049 | 1,400,000 | 1,403,746 | ||
| Raleigh-Durham, NC, Airport Authority Rev., “A”, 5%, 5/01/2027 | 1,105,000 | 1,132,141 | ||
| Raleigh-Durham, NC, Airport Authority Rev., “A”, 5%, 5/01/2030 | 985,000 | 1,028,368 | ||
| Raleigh-Durham, NC, Airport Authority Rev., “A”, 5%, 5/01/2031 | 1,065,000 | 1,111,730 | ||
| Raleigh-Durham, NC, Airport Authority Rev., “A”, 5%, 5/01/2032 | 790,000 | 825,043 | ||
| Raleigh-Durham, NC, Airport Authority Rev., “A”, 5%, 5/01/2033 | 790,000 | 822,171 | ||
| Surry County, NC, Northern Hospital District, Health Care Facilities Rev., 5%, 10/01/2027 | 1,190,000 | 1,188,271 | ||
| Surry County, NC, Northern Hospital District, Health Care Facilities Rev., 5%, 10/01/2031 | 985,000 | 941,328 | ||
| Surry County, NC, Northern Hospital District, Health Care Facilities Rev., 5%, 10/01/2033 | 1,085,000 | 1,031,980 | ||
| $46,904,477 | ||||
| North Dakota - 0.7% | ||||
| Grand Forks, ND, Healthcare System Rev. (Altru Health System), “A”, AGM, 5%, 12/01/2048 | $ | 535,000 | $527,964 | |
| Grand Forks, ND, Healthcare System Rev. (Altru Health System), “A”, AGM, 5%, 12/01/2053 | 1,315,000 | 1,295,468 | ||
| North Dakota Housing Finance Agency Rev. (Home Mortgage Finance Program), “A”, 4%, 1/01/2051 | 9,195,000 | 8,961,500 | ||
| North Dakota Housing Finance Agency Rev. (Home Mortgage Finance Program), “A”, 3%, 1/01/2052 | 6,950,000 | 6,556,489 | ||
| North Dakota Housing Finance Agency Rev. (Home Mortgage Finance Program), “D”, 4.25%, 1/01/2049 (u) | 3,960,000 | 3,901,916 | ||
| North Dakota Housing Finance Agency Rev. (Home Mortgage Finance Program), “F”, 5%, 1/01/2053 | 2,485,000 | 2,494,174 | ||
| North Dakota State Board of Higher Education, Housing and Auxiliary Facilities Rev. (University of North Dakota), “A”, AGM, 4%, 4/01/2039 | 1,845,000 | 1,680,833 | ||
| Ward County, ND, Health Care Facilities Rev. (Trinity Obligated Group), “C”, 5%, 6/01/2034 | 3,065,000 | 2,722,705 | ||
| Ward County, ND, Health Care Facilities Rev. (Trinity Obligated Group), “C”, 5%, 6/01/2038 | 2,850,000 | 2,350,084 | ||
| Ward County, ND, Health Care Facilities Rev. (Trinity Obligated Group), “C”, 5%, 6/01/2048 | 160,000 | 116,984 | ||
| Ward County, ND, Health Care Facilities Rev. (Trinity Obligated Group), “C”, 5%, 6/01/2053 | 1,170,000 | 831,563 | ||
| $31,439,680 | ||||
73
Portfolio of Investments (unaudited)
– continued
| Issuer | Shares/Par | Value ($) | ||
| Municipal Bonds - continued | ||||
| Ohio - 3.1% | ||||
| Brunswick, OH, School District, Classroom Facilities and School Improvement, Unlimited Tax General Obligation, BAM, 5.25%, 12/01/2053 | $ | 4,585,000 | $4,746,412 | |
| Brunswick, OH, School District, Classroom Facilities and School Improvement, Unlimited Tax General Obligation, BAM, 5.5%, 12/01/2060 | 8,490,000 | 8,868,569 | ||
| Buckeye, OH, Tobacco Settlement Financing Authority Senior Asset-Backed Refunding, 2020A-2, “1”, 4%, 6/01/2048 | 11,550,000 | 9,756,036 | ||
| Buckeye, OH, Tobacco Settlement Financing Authority Senior Asset-Backed Refunding, 2020B-2, “2”, 5%, 6/01/2055 | 29,240,000 | 25,187,611 | ||
| Buckeye, OH, Tobacco Settlement Financing Authority Senior Asset-Backed Refunding, Capital Appreciation, 2020B-3, “2”, 0%, 6/01/2057 | 39,410,000 | 3,838,305 | ||
| Cuyahoga County, OH, Hospital Rev. (Metrohealth System), 4.75%, 2/15/2047 | 3,200,000 | 2,790,645 | ||
| Cuyahoga County, OH, Hospital Rev. (Metrohealth System), 5.25%, 2/15/2047 | 2,730,000 | 2,605,568 | ||
| Cuyahoga County, OH, Hospital Rev. (Metrohealth System), 5%, 2/15/2052 | 1,575,000 | 1,403,182 | ||
| Cuyahoga County, OH, Hospital Rev. (Metrohealth System), 5.5%, 2/15/2057 | 8,850,000 | 8,254,653 | ||
| Cuyahoga County, OH, Metropolitan Housing Authority, General Rev. (2045 Initiative Project), 2%, 12/01/2031 | 2,305,000 | 1,937,659 | ||
| Cuyahoga County, OH, Port Authority Tax Increment Financing Rev. (Flats East Bank Project), “A”, 4%, 12/01/2055 (n) | 665,000 | 488,339 | ||
| Cuyahoga County, OH, Port Authority Tax Increment Financing Rev. (Flats East Bank Project), “B”, 4.5%, 12/01/2055 (n) | 380,000 | 290,786 | ||
| Franklin County, OH, Hospital Facilities Rev. (OhioHealth Corp.), “A”, 4%, 5/15/2047 | 3,260,000 | 2,807,034 | ||
| Hamilton County, OH, Healthcare Rev. (Life Enriching Communities Project), “A”, 5.25%, 12/31/2037 | 250,000 | 241,229 | ||
| Hamilton County, OH, Healthcare Rev. (Life Enriching Communities Project), “A”, 5.5%, 1/01/2043 | 755,000 | 728,869 | ||
| Hamilton County, OH, Healthcare Rev. (Life Enriching Communities Project), “A”, 5.75%, 1/01/2053 | 1,420,000 | 1,363,626 | ||
| Lancaster, PA, Port Authority Gas Supply Rev., “A”, 5%, 8/01/2049 (Put Date 2/01/2025) | 4,130,000 | 4,143,482 | ||
| Miami County, OH, Hospital Facilities Rev. (Kettering Health), “A”, 5%, 8/01/2049 | 7,745,000 | 7,530,221 | ||
| Middleburg Heights, OH, Hospital Facilities Improvement Rev. (Southwest General Health Center Project), “A”, 4%, 8/01/2041 | 2,470,000 | 2,071,442 | ||
| Middleburg Heights, OH, Hospital Facilities Improvement Rev. (Southwest General Health Center Project), “A”, 4%, 8/01/2047 | 1,555,000 | 1,224,963 | ||
74
Portfolio of Investments (unaudited)
– continued
| Issuer | Shares/Par | Value ($) | ||
| Municipal Bonds - continued | ||||
| Ohio - continued | ||||
| Montgomery County, OH, Hospital Facilities Rev. (Premier Health Partners Obligated Group), “A”, 5%, 11/15/2034 | $ | 790,000 | $794,619 | |
| Montgomery County, OH, Hospital Facilities Rev. (Premier Health Partners Obligated Group), “A”, 4%, 11/15/2038 | 1,775,000 | 1,523,275 | ||
| Montgomery County, OH, Hospital Facilities Rev. (Premier Health Partners Obligated Group), “A”, 4%, 11/15/2045 | 850,000 | 674,442 | ||
| Northeast Ohio Medical University, General Receipts and Refunding Bonds, “A”, 4%, 12/01/2035 | 115,000 | 105,269 | ||
| Northeast Ohio Medical University, General Receipts and Refunding Bonds, “A”, 4%, 12/01/2045 | 85,000 | 68,160 | ||
| Ohio Air Quality Development Authority Refunding Rev. (Duke Energy Corp. Project), “A”, 4.25%, 11/01/2039 (Put Date 6/01/2027) | 2,615,000 | 2,556,688 | ||
| Ohio Air Quality Development Authority Refunding Rev. (Duke Energy Corp. Project), “B”, 4%, 9/01/2030 (Put Date 6/01/2027) | 3,105,000 | 3,035,437 | ||
| Ohio Air Quality Development Authority Rev. (American Electric Power Co.), “B”, 2.6%, 6/01/2041 (Put Date 10/01/2029) | 3,630,000 | 3,046,566 | ||
| Ohio Air Quality Development Authority Rev. (American Electric Power Co.), “C”, 2.1%, 12/01/2027 (Put Date 10/01/2024) | 6,610,000 | 6,383,816 | ||
| Ohio Air Quality Development Authority Rev. (American Electric Power Co.), “C”, 2.1%, 4/01/2028 (Put Date 10/01/2024) | 3,090,000 | 2,984,265 | ||
| Ohio Air Quality Development Authority, Facilities Rev. (Pratt Paper LLC Project), 3.75%, 1/15/2028 (n) | 5,030,000 | 4,928,352 | ||
| Ohio Air Quality Development Authority, Facilities Rev. (Pratt Paper LLC Project), 4.25%, 1/15/2038 (n) | 250,000 | 235,640 | ||
| Ohio Air Quality Development Authority, Facilities Rev. (Pratt Paper LLC Project), 4.5%, 1/15/2048 (n) | 330,000 | 295,394 | ||
| Ohio Higher Educational Facility Commission Rev. (Franciscan University of Steubenville), 5%, 11/01/2041 | 2,360,000 | 2,343,339 | ||
| Ohio Higher Educational Facility Rev. (Cleveland Institute of Music 2022 Project), 5.125%, 12/01/2042 | 1,135,000 | 1,028,280 | ||
| Ohio Higher Educational Facility Rev. (Cleveland Institute of Music 2022 Project), 5.375%, 12/01/2052 | 1,850,000 | 1,650,411 | ||
| Ohio Housing Finance Agency Residential Mortgage Rev. (Mortgage-Backed Securities Program), “A”, 4.5%, 9/01/2048 (u) | 2,630,000 | 2,600,572 | ||
| Ohio Housing Finance Agency Residential Mortgage Rev. (Mortgage-Backed Securities Program), “A”, 4.8%, 9/01/2048 | 9,120,000 | 8,809,539 | ||
| Ohio Housing Finance Agency Residential Mortgage Rev. (Mortgage-Backed Securities Program), “A”, 4.9%, 9/01/2053 | 4,370,000 | 4,252,277 | ||
| Ohio State Hospital Rev. (Premier Health Partners Obligated Group), 4%, 11/15/2036 | 500,000 | 440,962 | ||
| Ohio State Hospital Rev. (Premier Health Partners Obligated Group), 4%, 11/15/2038 | 490,000 | 415,077 | ||
75
Portfolio of Investments (unaudited)
– continued
| Issuer | Shares/Par | Value ($) | ||
| Municipal Bonds - continued | ||||
| Ohio - continued | ||||
| Ohio State Hospital Rev. (Premier Health Partners Obligated Group), 4%, 11/15/2040 | $ | 465,000 | $383,185 | |
| Ohio Tax Exempt Private Activity (Portsmouth Bypass Project), AGM, 5%, 12/31/2035 | 6,090,000 | 6,103,692 | ||
| $144,937,888 | ||||
| Oklahoma - 0.6% | ||||
| Catoosa, OK, Industrial Authority Sales Tax Rev., 4%, 10/01/2028 | $ | 20,000 | $18,922 | |
| Norman, OK, Regional Hospital Authority Rev., 4%, 9/01/2045 | 3,120,000 | 2,350,176 | ||
| Norman, OK, Regional Hospital Authority Rev., 5%, 9/01/2045 | 2,605,000 | 2,388,547 | ||
| Oklahoma Development Finance Authority, First Mortgage Rev. (Sommerset Project), 5%, 7/01/2042 | 1,180,000 | 965,349 | ||
| Oklahoma Development Finance Authority, Health System Rev. (OU Medicine Project), “A”, 5.5%, 8/15/2041 | 3,920,000 | 3,496,560 | ||
| Oklahoma Development Finance Authority, Health System Rev. (OU Medicine Project), “A”, 5.5%, 8/15/2044 | 3,960,000 | 3,488,741 | ||
| Oklahoma Development Finance Authority, Health System Rev. (OU Medicine Project), “B”, 5%, 8/15/2038 | 895,000 | 797,793 | ||
| Oklahoma Development Finance Authority, Health System Rev. (OU Medicine Project), “B”, 5.25%, 8/15/2043 | 315,000 | 282,044 | ||
| Oklahoma Development Finance Authority, Health System Rev. (OU Medicine Project), “B”, 5.25%, 8/15/2048 | 900,000 | 781,723 | ||
| Oklahoma Development Finance Authority, Health System Rev. (OU Medicine Project), “B”, 5.5%, 8/15/2057 | 9,390,000 | 8,287,713 | ||
| Oklahoma Development Finance Authority, Health System Rev., Taxable (OU Medicine Project), “C”, 5.45%, 8/15/2028 | 6,087,000 | 5,233,032 | ||
| Oklahoma Housing Finance Agency, Single Family Mortgage Rev. (Homeownership Loan Project), “A”, 4.75%, 9/01/2048 | 1,095,000 | 1,087,894 | ||
| Tulsa, OK, Airport Improvement Trust Rev., “A”, 5%, 6/01/2045 (Prerefunded 6/01/2024) | 595,000 | 597,330 | ||
| $29,775,824 | ||||
| Oregon - 1.0% | ||||
| Gilliam County, OR, Solid Waste Disposal Rev. (Waste Management, Inc. Project), “A”, 3.95%, 8/01/2025 (Put Date 5/01/2024) | $ | 2,925,000 | $2,908,630 | |
| Medford, OR, Hospital Facilities Authority Rev. (Asante Projects), “A”, 4%, 8/15/2050 | 3,015,000 | 2,544,256 | ||
| Multnomah County, OR, Hospital Facilities Authority Refunding Rev. (Terwilliger Plaza - Parkview Project), “A”, 4%, 12/01/2041 | 2,370,000 | 1,693,456 | ||
| Multnomah County, OR, Hospital Facilities Authority Refunding Rev. (Terwilliger Plaza - Parkview Project), “A”, 4%, 12/01/2051 | 1,750,000 | 1,112,383 | ||
| Multnomah County, OR, Hospital Facilities Authority Refunding Rev. (Terwilliger Plaza - Parkview Project), “B-1”, 1.2%, 6/01/2028 | 630,000 | 527,559 | ||
76
Portfolio of Investments (unaudited)
– continued
| Issuer | Shares/Par | Value ($) | ||
| Municipal Bonds - continued | ||||
| Oregon - continued | ||||
| Multnomah County, OR, Hospital Facilities Authority Refunding Rev. (Terwilliger Plaza - Parkview Project), “B-2”, 0.95%, 6/01/2027 | $ | 1,610,000 | $1,395,750 | |
| Multnomah County, OR, Hospital Facilities Authority Refunding Rev., Taxable (Terwilliger Plaza - Parkview Project), “C”, 1.25%, 6/01/2026 | 775,000 | 702,900 | ||
| Oregon Facilities Authority Lease Rent Rev. (Legacy Health System), “A”, 4.9%, 9/14/2035 | 14,015,000 | 13,957,473 | ||
| Oregon Facilities Authority Rev. (Legacy Health Project), “A”, 5%, 6/01/2046 | 7,945,000 | 7,688,281 | ||
| Oregon Health & Sciences University Rev., “B”, 5%, 7/01/2034 | 5,900,000 | 6,056,759 | ||
| Port of Portland, OR, International Airport Rev., “24B”, 5%, 7/01/2042 | 1,055,000 | 1,045,606 | ||
| Yamhill County, OR, Hospital Authority Rev. (Friendsview Retirement), “A”, 5%, 11/15/2036 | 575,000 | 491,876 | ||
| Yamhill County, OR, Hospital Authority Rev. (Friendsview Retirement), “A”, 5%, 11/15/2046 | 690,000 | 517,085 | ||
| Yamhill County, OR, Hospital Authority Rev. (Friendsview Retirement), “A”, 5%, 11/15/2046 | 1,360,000 | 1,019,181 | ||
| Yamhill County, OR, Hospital Authority Rev. (Friendsview Retirement), “A”, 5%, 11/15/2051 | 580,000 | 420,480 | ||
| Yamhill County, OR, Hospital Authority Rev. (Friendsview Retirement), “A”, 5%, 11/15/2056 | 3,325,000 | 2,349,716 | ||
| Yamhill County, OR, Hospital Authority Rev. (Friendsview Retirement), “B-1”, 2.5%, 11/15/2028 | 700,000 | 605,434 | ||
| Yamhill County, OR, Hospital Authority Rev. (Friendsview Retirement), “B-2”, 2.125%, 11/15/2027 | 280,000 | 261,045 | ||
| Yamhill County, OR, Hospital Authority Rev. (Friendsview Retirement), “B-3”, 1.75%, 11/15/2026 | 380,000 | 364,003 | ||
| $45,661,873 | ||||
| Pennsylvania - 6.8% | ||||
| Allegheny County, PA, Hospital Development Authority Rev. (Allegheny Health Network Obligated Group), “A”, 4%, 4/01/2044 | $ | 5,185,000 | $4,210,031 | |
| Allentown, PA, City School District Rev., “C”, BAM, 4%, 2/01/2035 | 905,000 | 890,363 | ||
| Allentown, PA, City School District Rev., “C”, BAM, 4%, 2/01/2036 | 870,000 | 843,589 | ||
| Allentown, PA, Commercial and Industrial Development Authority Education Facility Lease Rev. (Lincoln Leadership Academy Charter School Project), 5.5%, 6/14/2038 (n)(w) | 160,000 | 156,019 | ||
| Allentown, PA, Commercial and Industrial Development Authority Education Facility Lease Rev. (Lincoln Leadership Academy Charter School Project), 5.75%, 6/15/2043 (n)(w) | 330,000 | 320,579 | ||
77
Portfolio of Investments (unaudited)
– continued
| Issuer | Shares/Par | Value ($) | ||
| Municipal Bonds - continued | ||||
| Pennsylvania - continued | ||||
| Allentown, PA, Commercial and Industrial Development Authority Education Facility Lease Rev. (Lincoln Leadership Academy Charter School Project), 6%, 6/15/2053 (n)(w) | $ | 575,000 | $555,841 | |
| Allentown, PA, Neighborhood Improvement Zone Development Authority Tax Rev. (City Center Project), 5%, 5/01/2028 (n) | 250,000 | 251,118 | ||
| Allentown, PA, Neighborhood Improvement Zone Development Authority Tax Rev. (City Center Project), 5%, 5/01/2033 (n) | 135,000 | 135,329 | ||
| Allentown, PA, Neighborhood Improvement Zone Development Authority Tax Rev. (City Center Project), 5%, 5/01/2042 (n) | 330,000 | 306,577 | ||
| Allentown, PA, Neighborhood Improvement Zone Development Authority Tax Rev. (City Center Project), 5.25%, 5/01/2042 (n) | 800,000 | 757,282 | ||
| Allentown, PA, Neighborhood Improvement Zone Development Authority Tax Rev. (City Center Refunding Project), 5%, 5/01/2027 (n) | 1,180,000 | 1,184,357 | ||
| Armstrong & Indiana Counties, PA, Armstrong School District, General Obligation, “A”, BAM, 4%, 3/15/2035 | 395,000 | 387,763 | ||
| Armstrong & Indiana Counties, PA, Armstrong School District, General Obligation, “A”, BAM, 4%, 3/15/2036 | 850,000 | 828,140 | ||
| Armstrong & Indiana Counties, PA, Armstrong School District, General Obligation, “A”, BAM, 4%, 3/15/2037 | 395,000 | 374,731 | ||
| Armstrong & Indiana Counties, PA, Armstrong School District, General Obligation, “A”, BAM, 4%, 3/15/2038 | 395,000 | 371,709 | ||
| Armstrong & Indiana Counties, PA, Armstrong School District, General Obligation, “A”, BAM, 4%, 3/15/2041 | 1,970,000 | 1,784,785 | ||
| Beaver County, PA, Economic Development Authority Rev., BAM, 4%, 11/15/2035 | 1,795,000 | 1,771,441 | ||
| Beaver County, PA, Economic Development Authority Rev., BAM, 4%, 11/15/2036 | 675,000 | 657,029 | ||
| Berks County, PA, Industrial Development Authority Health System Rev. (Tower Health Project), 5%, 11/01/2028 | 885,000 | 544,493 | ||
| Berks County, PA, Industrial Development Authority Health System Rev. (Tower Health Project), 5%, 11/01/2029 | 3,115,000 | 1,850,189 | ||
| Berks County, PA, Industrial Development Authority Health System Rev. (Tower Health Project), 5%, 11/01/2030 | 1,595,000 | 945,118 | ||
| Berks County, PA, Industrial Development Authority Health System Rev. (Tower Health Project), 5%, 11/01/2037 | 740,000 | 422,999 | ||
| Berks County, PA, Industrial Development Authority Health System Rev. (Tower Health Project), 5%, 11/01/2047 | 1,150,000 | 653,728 | ||
| Berks County, PA, Municipal Authority Rev. (Reading Hospital & Medical Center), “A”, 5%, 11/01/2044 | 6,035,000 | 3,434,570 | ||
| Berks County, PA, Municipal Authority Rev. (Tower Health Project), “B-2”, 5%, 2/01/2040 (Put Date 2/01/2027) | 7,775,000 | 5,051,757 | ||
78
Portfolio of Investments (unaudited)
– continued
| Issuer | Shares/Par | Value ($) | ||
| Municipal Bonds - continued | ||||
| Pennsylvania - continued | ||||
| Berks County, PA, Municipal Authority Rev. (Tower Health Project), “B-3”, 5%, 2/01/2040 (Put Date 2/01/2030) | $ | 3,305,000 | $1,964,356 | |
| Bucks County, PA, Industrial Development Authority, Hospital Rev. (St. Luke's University Health Network Project), 4%, 8/15/2044 | 810,000 | 683,446 | ||
| Bucks County, PA, Industrial Development Authority, Hospital Rev. (St. Luke's University Health Network Project), 4%, 8/15/2050 | 7,225,000 | 5,738,383 | ||
| Bucks County, PA, Water & Sewer Authority, Sewer System Rev., “A”, AGM, 5.25%, 12/01/2047 | 1,710,000 | 1,781,150 | ||
| Chester County, PA, Health & Education Facilities Authority Rev. (Simpson Senior Services Project), 5%, 12/01/2051 | 1,555,000 | 1,122,789 | ||
| Chester County, PA, Industrial Development Authority Educational Facilities Rev. (Avon Grove Charter School), “A”, 4.75%, 12/15/2037 | 880,000 | 799,100 | ||
| Chester County, PA, Industrial Development Authority Educational Facilities Rev. (Avon Grove Charter School), “A”, 5%, 12/15/2047 | 420,000 | 367,109 | ||
| Chester County, PA, Industrial Development Authority Educational Facilities Rev. (Avon Grove Charter School), “A”, 5%, 12/15/2051 | 510,000 | 437,600 | ||
| Cumberland County, PA, Municipal Authority Rev. (Diakon Lutheran Social Ministries), 4%, 1/01/2033 (Prerefunded 1/01/2025) | 245,000 | 245,109 | ||
| Cumberland County, PA, Municipal Authority Rev. (Diakon Lutheran Social Ministries), 4%, 1/01/2033 (Prerefunded 1/01/2025) | 840,000 | 840,373 | ||
| Cumberland County, PA, Municipal Authority Rev. (Diakon Lutheran Social Ministries), 4%, 1/01/2033 | 615,000 | 561,759 | ||
| Cumberland County, PA, Municipal Authority Rev. (Diakon Lutheran Social Ministries), 5%, 1/01/2038 (Prerefunded 1/01/2025) | 25,000 | 25,311 | ||
| Cumberland County, PA, Municipal Authority Rev. (Diakon Lutheran Social Ministries), 5%, 1/01/2038 (Prerefunded 1/01/2025) | 115,000 | 116,433 | ||
| Cumberland County, PA, Municipal Authority Rev. (Diakon Lutheran Social Ministries), 5%, 1/01/2038 | 140,000 | 135,282 | ||
| Cumberland County, PA, Municipal Authority Rev. (Penn State Health), 4%, 11/01/2049 | 3,355,000 | 2,767,237 | ||
| Dallas, PA, Municipal Authority, University Rev. (Misericordia University Project), 5%, 5/01/2048 | 400,000 | 337,924 | ||
| Delaware County, PA, Chichester School General Obligation, AGM, 4%, 9/15/2030 | 670,000 | 672,746 | ||
| Delaware County, PA, Chichester School General Obligation, AGM, 4%, 9/15/2031 | 395,000 | 395,222 | ||
| Delaware County, PA, Chichester School General Obligation, AGM, 4%, 9/15/2032 | 395,000 | 394,136 | ||
79
Portfolio of Investments (unaudited)
– continued
| Issuer | Shares/Par | Value ($) | ||
| Municipal Bonds - continued | ||||
| Pennsylvania - continued | ||||
| Delaware County, PA, Upper Darby School District, General Obligation, “A”, BAM, 4%, 4/01/2046 | $ | 475,000 | $412,549 | |
| Delaware Valley, PA, Regional Finance Authority, “C”, FLR, 4.55% (67% of LIBOR - 3mo. + 0.75%), 6/01/2037 | 5,755,000 | 4,817,802 | ||
| Doylestown, PA, Hospital Authority Rev., “A”, 4%, 6/30/2045 (Prerefunded 7/01/2029) | 45,000 | 45,991 | ||
| Doylestown, PA, Hospital Authority Rev., “A”, 4%, 6/30/2045 | 420,000 | 299,395 | ||
| Doylestown, PA, Hospital Authority Rev., “A”, 5%, 6/30/2049 (Prerefunded 7/01/2029) | 50,000 | 53,677 | ||
| Doylestown, PA, Hospital Authority Rev., “A”, 5%, 7/01/2049 | 415,000 | 337,641 | ||
| East Hempfield Township, PA, Industrial Development Authority Rev. (Student Services, Inc., Student Housing Project at Millersville University of Pennsylvania), 5%, 7/01/2030 (Prerefunded 7/01/2025) | 290,000 | 295,452 | ||
| East Hempfield Township, PA, Industrial Development Authority Rev. (Student Services, Inc., Student Housing Project at Millersville University of Pennsylvania), 5%, 7/01/2035 (Prerefunded 7/01/2025) | 370,000 | 376,956 | ||
| East Hempfield Township, PA, Industrial Development Authority Rev. (Student Services, Inc., Student Housing Project at Millersville University of Pennsylvania), 5%, 7/01/2039 (Prerefunded 7/01/2024) | 385,000 | 387,730 | ||
| East Hempfield Township, PA, Industrial Development Authority Rev. (Student Services, Inc., Student Housing Project at Millersville University of Pennsylvania), 5%, 7/01/2046 (Prerefunded 7/01/2024) | 210,000 | 211,489 | ||
| Geisinger, PA, Geisinger Authority Health System Rev., “A”, 4%, 4/01/2050 | 5,000,000 | 4,202,314 | ||
| Lehigh County, PA, Hospital Authority Rev. (Lehigh Valley Health Network), “A”, 4%, 7/01/2049 | 7,900,000 | 6,627,248 | ||
| Lehigh County, PA, Water & Sewer Authority Rev. (Allentown Concession), Capital Appreciation, “B”, 0%, 12/01/2036 | 9,515,000 | 4,902,512 | ||
| Lehigh County, PA, Water & Sewer Authority Rev., “A”, 5%, 12/01/2043 (Prerefunded 12/01/2023) | 4,065,000 | 4,071,740 | ||
| Luzerne County, PA, “A”, AGM, 5%, 12/15/2023 | 535,000 | 536,036 | ||
| Luzerne County, PA, “A”, AGM, 5%, 12/15/2024 | 545,000 | 552,428 | ||
| Luzerne County, PA, “A”, AGM, 5%, 12/15/2026 | 500,000 | 514,878 | ||
| Maxatawny Township, PA, Municipal Authority Rev. (Diakon Lutheran Social Ministries), “A”, 5%, 1/01/2039 | 215,000 | 200,409 | ||
| Maxatawny Township, PA, Municipal Authority Rev. (Diakon Lutheran Social Ministries), “A”, 5%, 1/01/2040 | 765,000 | 704,121 | ||
| Maxatawny Township, PA, Municipal Authority Rev. (Diakon Lutheran Social Ministries), “A”, 5%, 1/01/2041 | 565,000 | 515,519 | ||
80
Portfolio of Investments (unaudited)
– continued
| Issuer | Shares/Par | Value ($) | ||
| Municipal Bonds - continued | ||||
| Pennsylvania - continued | ||||
| Maxatawny Township, PA, Municipal Authority Rev. (Diakon Lutheran Social Ministries), “A”, 5%, 1/01/2042 | $ | 585,000 | $529,633 | |
| Maxatawny Township, PA, Municipal Authority Rev. (Diakon Lutheran Social Ministries), “A”, 4.5%, 1/01/2045 | 2,015,000 | 1,660,867 | ||
| Montgomery County, PA, Higher Education & Health Authority Rev. (Thomas Jefferson University), 4%, 9/01/2044 | 1,550,000 | 1,337,439 | ||
| Montgomery County, PA, Higher Education & Health Authority Rev. (Thomas Jefferson University), 4%, 9/01/2049 | 1,480,000 | 1,229,266 | ||
| Montgomery County, PA, Higher Education & Health Authority Rev. (Thomas Jefferson University), “A”, 4%, 9/01/2049 | 1,815,000 | 1,507,512 | ||
| Montgomery County, PA, Higher Education & Health Authority Rev. (Thomas Jefferson University), “B”, 4%, 5/01/2047 | 1,750,000 | 1,474,420 | ||
| Montgomery County, PA, Higher Education & Health Authority Rev. (Thomas Jefferson University), “B”, AGM, 3.125%, 5/01/2053 | 2,415,000 | 1,570,633 | ||
| Montgomery County, PA, Higher Education & Health Authority Rev., Taxable (Thomas Jefferson University), 4%, 9/01/2051 | 2,980,000 | 2,435,788 | ||
| Montgomery County, PA, Industrial Development Authority Retirement Communities Rev. (Acts Retirement - Life Communities, Inc. Obligated Group), “C”, 5%, 11/15/2045 | 1,090,000 | 1,016,729 | ||
| Montgomery County, PA, Industrial Development Authority Rev. (Whitemarsh Continuing Care Retirement Community Project), 5%, 1/01/2030 | 790,000 | 751,257 | ||
| Montgomery County, PA, Industrial Development Authority Rev. (Whitemarsh Continuing Care Retirement Community Project), 5.375%, 1/01/2050 | 7,060,000 | 5,740,061 | ||
| Montour County, PA, Geisinger Authority Health System Rev., “A”, 4%, 4/01/2039 | 2,615,000 | 2,427,114 | ||
| Northeastern, PA, Hospital & Education Authority College Rev. (King's College Project), 5%, 5/01/2032 | 355,000 | 343,444 | ||
| Northeastern, PA, Hospital & Education Authority College Rev. (King's College Project), 5%, 5/01/2033 | 475,000 | 457,053 | ||
| Northeastern, PA, Hospital & Education Authority College Rev. (King's College Project), 5%, 5/01/2044 | 1,035,000 | 894,486 | ||
| Northeastern, PA, Hospital & Education Authority College Rev. (King's College Project), 5%, 5/01/2049 | 630,000 | 526,693 | ||
| Pennsylvania Economic Development Financing Authority Rev. (Presbyterian Senior Living Project), “B-1”, 5.25%, 7/01/2049 | 1,180,000 | 1,117,786 | ||
| Pennsylvania Economic Development Financing Authority Rev. (Presbyterian Senior Living Project), “B-2”, 5%, 7/01/2042 | 1,755,000 | 1,656,929 | ||
| Pennsylvania Economic Development Financing Authority Rev. (Presbyterian Senior Living Project), “B-2”, 5.25%, 7/01/2046 | 940,000 | 901,391 | ||
| Pennsylvania Economic Development Financing Authority Rev. (Rapid Bridge Replacement Project), 5%, 12/31/2038 | 10,825,000 | 10,419,007 | ||
81
Portfolio of Investments (unaudited)
– continued
| Issuer | Shares/Par | Value ($) | ||
| Municipal Bonds - continued | ||||
| Pennsylvania - continued | ||||
| Pennsylvania Economic Development Financing Authority, Guaranteed Parking Rev. (Capitol Region Parking System), Capital Appreciation, “B-2”, 0%, 1/01/2035 | $ | 1,190,000 | $689,790 | |
| Pennsylvania Economic Development Financing Authority, Guaranteed Parking Rev. (Capitol Region Parking System), Capital Appreciation, “B-2”, 0%, 1/01/2036 | 1,255,000 | 681,887 | ||
| Pennsylvania Economic Development Financing Authority, Guaranteed Parking Rev. (Capitol Region Parking System), Capital Appreciation, “B-2”, 0%, 1/01/2037 | 1,215,000 | 616,872 | ||
| Pennsylvania Economic Development Financing Authority, Guaranteed Parking Rev. (Capitol Region Parking System), Capital Appreciation, “B-2”, 0%, 1/01/2038 | 1,245,000 | 585,872 | ||
| Pennsylvania Economic Development Financing Authority, Guaranteed Parking Rev. (Capitol Region Parking System), Capital Appreciation, “B-2”, 0%, 1/01/2039 | 1,365,000 | 601,445 | ||
| Pennsylvania Economic Development Financing Authority, Guaranteed Parking Rev. (Capitol Region Parking System), Capital Appreciation, “B-2”, 0%, 1/01/2040 | 1,315,000 | 544,482 | ||
| Pennsylvania Economic Development Financing Authority, Guaranteed Parking Rev. (Capitol Region Parking System), Capital Appreciation, “B-2”, 0%, 1/01/2041 | 1,265,000 | 491,951 | ||
| Pennsylvania Economic Development Financing Authority, Guaranteed Parking Rev. (Capitol Region Parking System), Capital Appreciation, “B-2”, 0%, 1/01/2042 | 1,215,000 | 442,506 | ||
| Pennsylvania Economic Development Financing Authority, Guaranteed Parking Rev. (Capitol Region Parking System), Capital Appreciation, “B-2”, 0%, 1/01/2043 | 1,160,000 | 397,728 | ||
| Pennsylvania Economic Development Financing Authority, Guaranteed Parking Rev. (Capitol Region Parking System), Capital Appreciation, “B-2”, BAM, 0%, 1/01/2046 | 2,750,000 | 815,707 | ||
| Pennsylvania Economic Development Financing Authority, Guaranteed Parking Rev. (Capitol Region Parking System), Capital Appreciation, “B-2”, BAM, 0%, 1/01/2047 | 2,865,000 | 800,473 | ||
| Pennsylvania Economic Development Financing Authority, Guaranteed Parking Rev. (Capitol Region Parking System), Capital Appreciation, “B-3”, 0%, 1/01/2049 | 5,775,000 | 1,031,009 | ||
| Pennsylvania Economic Development Financing Authority, Private Activity Rev. (PennDOT Major Bridges Package One Project), 5.25%, 6/30/2053 | 11,855,000 | 11,523,807 | ||
| Pennsylvania Economic Development Financing Authority, Private Activity Rev. (PennDOT Major Bridges Package One Project), AGM, 5%, 12/31/2057 | 13,590,000 | 13,090,142 | ||
82
Portfolio of Investments (unaudited)
– continued
| Issuer | Shares/Par | Value ($) | ||
| Municipal Bonds - continued | ||||
| Pennsylvania - continued | ||||
| Pennsylvania Economic Development Financing Authority, Private Activity Rev. (Pennsylvania Rapid Bridge Replacement Project), 4.125%, 12/31/2038 | $ | 1,330,000 | $1,137,579 | |
| Pennsylvania Economic Development Financing Authority, Sewage Sludge Disposal Refunding Rev. (Philadelphia Biosolids Facility Project), 4%, 1/01/2026 | 875,000 | 855,944 | ||
| Pennsylvania Economic Development Financing Authority, Sewage Sludge Disposal Refunding Rev. (Philadelphia Biosolids Facility Project), 4%, 1/01/2027 | 600,000 | 582,148 | ||
| Pennsylvania Economic Development Financing Authority, Sewage Sludge Disposal Refunding Rev. (Philadelphia Biosolids Facility Project), 4%, 1/01/2028 | 630,000 | 607,152 | ||
| Pennsylvania Economic Development Financing Authority, Solid Waste Disposal Rev. (Waste Management, Inc. Project), 2.15%, 7/01/2041 (Put Date 7/01/2024) | 6,295,000 | 6,187,240 | ||
| Pennsylvania Economic Development Financing Authority, UPMC Rev., “A”, 4%, 5/15/2048 | 3,250,000 | 2,749,784 | ||
| Pennsylvania Economic Development Financing Authority, UPMC Rev., “A”, 4%, 5/15/2053 | 4,265,000 | 3,488,582 | ||
| Pennsylvania Higher Educational Assistance Agency, Education Loan Rev., “A”, 5%, 6/01/2030 | 200,000 | 204,119 | ||
| Pennsylvania Higher Educational Assistance Agency, Education Loan Rev., “A”, 2.625%, 6/01/2042 | 1,005,000 | 803,858 | ||
| Pennsylvania Higher Educational Assistance Agency, Education Loan Rev., “A”, 4.5%, 6/01/2043 | 790,000 | 748,395 | ||
| Pennsylvania Higher Educational Assistance Agency, Education Loan Rev., “A”, 4%, 6/01/2044 | 9,770,000 | 8,862,765 | ||
| Pennsylvania Higher Educational Facilities Authority Rev. (Duquesne University), “A”, 5%, 3/01/2038 | 790,000 | 799,789 | ||
| Pennsylvania Higher Educational Facilities Authority Rev. (Duquesne University), “A”, 5%, 3/01/2039 | 200,000 | 201,209 | ||
| Pennsylvania Housing Finance Agency, Single Family Mortgage Rev., “128A”, 4.75%, 4/01/2033 (u) | 3,115,000 | 3,085,886 | ||
| Pennsylvania Housing Finance Agency, Single Family Mortgage Rev., “135A”, 3%, 10/01/2051 | 6,210,000 | 5,957,926 | ||
| Pennsylvania Housing Finance Agency, Single Family Mortgage Rev., “135B”, 5%, 4/01/2028 | 1,850,000 | 1,894,647 | ||
| Pennsylvania Housing Finance Agency, Single Family Mortgage Rev., “135B”, 5%, 4/01/2029 | 1,890,000 | 1,944,893 | ||
| Pennsylvania Housing Finance Agency, Single Family Mortgage Rev., “135B”, 5%, 10/01/2029 | 1,900,000 | 1,959,097 | ||
| Pennsylvania Housing Finance Agency, Single Family Mortgage Rev., “135B”, 5%, 4/01/2030 | 1,905,000 | 1,965,107 | ||
83
Portfolio of Investments (unaudited)
– continued
| Issuer | Shares/Par | Value ($) | ||
| Municipal Bonds - continued | ||||
| Pennsylvania - continued | ||||
| Pennsylvania Housing Finance Agency, Single Family Mortgage Rev., “135B”, 5%, 10/01/2030 | $ | 1,105,000 | $1,142,057 | |
| Pennsylvania Housing Finance Agency, Single Family Mortgage Rev., “134A”, 3%, 10/01/2049 | 8,805,000 | 8,445,996 | ||
| Pennsylvania Housing Finance Agency, Single Family Mortgage Rev., “141A”, 5.75%, 10/01/2053 | 12,045,000 | 12,467,252 | ||
| Pennsylvania Public School Building Authority, College Rev. (Northampton County Area Community College Project), BAM, 4%, 6/15/2031 | 720,000 | 719,021 | ||
| Pennsylvania Public School Building Authority, College Rev. (Northampton County Area Community College Project), BAM, 4%, 6/15/2032 | 475,000 | 472,603 | ||
| Pennsylvania Public School Building Authority, College Rev. (Northampton County Area Community College Project), BAM, 4%, 6/15/2033 | 505,000 | 498,695 | ||
| Pennsylvania Public School Building Authority, College Rev. (Northampton County Area Community College Project), BAM, 4%, 6/15/2034 | 510,000 | 505,580 | ||
| Pennsylvania Public School Building Authority, School Lease Rev. (School District of Philadelphia Project), “A”, AGM, 5%, 6/01/2030 | 1,575,000 | 1,618,894 | ||
| Pennsylvania Public School Building Authority, School Lease Rev. (School District of Philadelphia Project), “A”, AGM, 5%, 6/01/2032 | 6,150,000 | 6,312,210 | ||
| Pennsylvania Public School Building Authority, School Lease Rev. (School District of Philadelphia Project), “A”, AGM, 5%, 6/01/2033 | 17,170,000 | 17,607,504 | ||
| Philadelphia, PA, “B”, 5%, 2/01/2032 | 4,130,000 | 4,386,717 | ||
| Philadelphia, PA, “B”, 5%, 2/01/2035 | 3,030,000 | 3,182,715 | ||
| Philadelphia, PA, Airport Refunding Rev., “B”, AGM, 5%, 7/01/2042 | 8,790,000 | 8,649,089 | ||
| Philadelphia, PA, Airport Rev., “B”, 5%, 7/01/2034 | 4,200,000 | 4,268,829 | ||
| Philadelphia, PA, Airport Rev., “B”, 5%, 7/01/2042 | 3,920,000 | 3,852,529 | ||
| Philadelphia, PA, Authority for Industrial Development Charter School Rev. (Green Woods Charter School Project), “A”, 5.125%, 6/15/2042 | 335,000 | 299,174 | ||
| Philadelphia, PA, Authority for Industrial Development Charter School Rev. (Green Woods Charter School Project), “A”, 5.25%, 6/15/2052 | 380,000 | 330,465 | ||
| Philadelphia, PA, Authority for Industrial Development Charter School Rev. (Green Woods Charter School Project), “A”, 5.375%, 6/15/2057 | 180,000 | 156,150 | ||
| Philadelphia, PA, Authority for Industrial Development Rev. (MaST Charter School Project), “A”, 5.625%, 8/01/2036 | 250,000 | 252,544 | ||
| Philadelphia, PA, Authority for Industrial Development Rev. (MaST Charter School Project), “A”, 5.75%, 8/01/2046 | 815,000 | 816,818 | ||
84
Portfolio of Investments (unaudited)
– continued
| Issuer | Shares/Par | Value ($) | ||
| Municipal Bonds - continued | ||||
| Pennsylvania - continued | ||||
| Philadelphia, PA, Authority for Industrial Development Rev. (MaST Charter School Project), “A”, 5.375%, 8/01/2051 | $ | 1,205,000 | $1,154,568 | |
| Philadelphia, PA, Authority for Industrial Development Rev. (MaST Charter School Project), “B”, 6%, 8/01/2051 | 845,000 | 850,142 | ||
| Philadelphia, PA, Authority for Industrial Development Rev. (Thomas Jefferson University), “A”, 5%, 9/01/2035 | 820,000 | 831,225 | ||
| Philadelphia, PA, Authority for Industrial Development Rev. (Thomas Jefferson University), “A”, 5%, 9/01/2042 | 8,505,000 | 8,404,223 | ||
| Philadelphia, PA, Authority for Industrial Development University Rev. (Saint Joseph's University Project), 5.5%, 11/01/2060 | 7,085,000 | 7,192,619 | ||
| Philadelphia, PA, Authority for Industrial Development, Multi-Family Housing Rev. (University Square Apartment Project-Section 8), “I”, 5%, 12/01/2037 | 1,620,000 | 1,622,656 | ||
| Philadelphia, PA, Authority for Industrial Development, Multi-Family Housing Rev. (University Square Apartment Project-Section 8), “I”, 5%, 12/01/2058 | 6,530,000 | 5,669,287 | ||
| Philadelphia, PA, Authority for Industrial Development, Multi-Family Housing Rev. (University Square Apartment Project-Section 8), “III”, 5.25%, 12/01/2047 (n) | 350,000 | 293,287 | ||
| Philadelphia, PA, Authority for Industrial Development, Multi-Family Housing Rev. (University Square Apartment Project-Section 8), “III”, 5.5%, 12/01/2058 (n) | 400,000 | 334,913 | ||
| Philadelphia, PA, Authority for Industrial Development, Senior Living Facilities Rev. (Wesley Enhanced Living Obligated Group), “A”, 5%, 7/01/2037 | 445,000 | 372,843 | ||
| Philadelphia, PA, Authority for Industrial Development, Senior Living Facilities Rev. (Wesley Enhanced Living Obligated Group), “A”, 5%, 7/01/2042 | 1,530,000 | 1,214,171 | ||
| Philadelphia, PA, Authority for Industrial Development, Senior Living Facilities Rev. (Wesley Enhanced Living Obligated Group), “A”, 5%, 7/01/2049 | 1,330,000 | 1,004,864 | ||
| Philadelphia, PA, Gas Works Rev., “14”, AGM, 5%, 10/01/2033 | 2,290,000 | 2,322,128 | ||
| Philadelphia, PA, Hospitals and Higher Education Facilities Authority Rev. (Temple University Health System Obligated Group), AGM, 5%, 7/01/2035 | 1,375,000 | 1,428,844 | ||
| Philadelphia, PA, Hospitals and Higher Education Facilities Authority Rev. (Temple University Health System Obligated Group), AGM, 5%, 7/01/2036 | 1,965,000 | 2,024,549 | ||
| Philadelphia, PA, School District General Obligation, “F”, 5%, 9/01/2038 | 205,000 | 204,980 | ||
| Philadelphia, PA, School District, “A”, 4%, 9/01/2037 | 980,000 | 877,846 | ||
| Philadelphia, PA, School District, “A”, 4%, 9/01/2038 | 1,400,000 | 1,249,871 | ||
| Philadelphia, PA, School District, “A”, 5%, 9/01/2038 | 305,000 | 309,426 | ||
85
Portfolio of Investments (unaudited)
– continued
| Issuer | Shares/Par | Value ($) | ||
| Municipal Bonds - continued | ||||
| Pennsylvania - continued | ||||
| Philadelphia, PA, School District, “B”, 5%, 9/01/2043 | $ | 915,000 | $923,754 | |
| Philadelphia, PA, School District, “F”, 5%, 9/01/2037 | 805,000 | 806,032 | ||
| Pittsburgh, PA, Water & Sewer System Authority Rev., “A”, AGM, 4.25%, 8/31/2053 | 2,910,000 | 2,562,999 | ||
| Washington County, PA, Canon-McMillan School District, BAM, 4%, 6/01/2046 | 2,320,000 | 2,008,981 | ||
| Washington County, PA, Canon-McMillan School District, BAM, 4%, 6/01/2048 | 3,440,000 | 2,959,412 | ||
| Washington County, PA, Redevelopment Authority Refunding Rev. (Victory Centre Tax Increment Financing Project), 5%, 7/01/2035 | 65,000 | 61,137 | ||
| Washington County, PA, Trinity Area School District, AGM, 4%, 11/01/2043 | 500,000 | 446,043 | ||
| Washington County, PA, Trinity Area School District, AGM, 4%, 11/01/2051 | 1,190,000 | 1,007,057 | ||
| West Shore, PA, Area Authority Rev. (Messiah Village Project), “A”, 5%, 7/01/2030 | 350,000 | 340,796 | ||
| West Shore, PA, Area Authority Rev. (Messiah Village Project), “A”, 5%, 7/01/2035 | 345,000 | 323,935 | ||
| $317,275,618 | ||||
| Puerto Rico - 2.2% | ||||
| Commonwealth of Puerto Rico, General Obligation Restructured Bonds, Capital Appreciation, Series 2022A, 0%, 7/01/2024 | $ | 240,138 | $231,975 | |
| Commonwealth of Puerto Rico, General Obligation Restructured Bonds, Capital Appreciation, Series 2022A, 0%, 7/01/2033 | 1,878,095 | 1,106,886 | ||
| Commonwealth of Puerto Rico, General Obligation Restructured Bonds, Series 2022A, 5.625%, 7/01/2027 | 1,611,004 | 1,653,154 | ||
| Commonwealth of Puerto Rico, General Obligation Restructured Bonds, Series 2022A, 5.625%, 7/01/2029 | 1,584,778 | 1,637,564 | ||
| Commonwealth of Puerto Rico, General Obligation Restructured Bonds, Series 2022A, 5.75%, 7/01/2031 | 3,538,937 | 3,695,787 | ||
| Commonwealth of Puerto Rico, General Obligation Restructured Bonds, Series 2022A, 4%, 7/01/2033 | 1,459,691 | 1,308,372 | ||
| Commonwealth of Puerto Rico, General Obligation Restructured Bonds, Series 2022A, 4%, 7/01/2035 | 2,865,019 | 2,489,849 | ||
| Commonwealth of Puerto Rico, General Obligation Restructured Bonds, Series 2022A, 4%, 7/01/2037 | 1,126,601 | 945,707 | ||
| Commonwealth of Puerto Rico, General Obligation Restructured Bonds, Series 2022A, 4%, 7/01/2041 | 1,531,429 | 1,231,288 | ||
| Commonwealth of Puerto Rico, General Obligation Restructured Bonds, Series 2022A, 4%, 7/01/2046 | 1,592,259 | 1,227,600 | ||
| Puerto Rico Aqueduct and Sewer Authority Rev., “A”, 5%, 7/01/2025 | 11,815,000 | 11,847,339 | ||
86
Portfolio of Investments (unaudited)
– continued
| Issuer | Shares/Par | Value ($) | ||
| Municipal Bonds - continued | ||||
| Puerto Rico - continued | ||||
| Puerto Rico Electric Power Authority Refunding Rev., “DDD”, 5%, 7/01/2020 (a)(d) | $ | 335,000 | $83,750 | |
| Puerto Rico Electric Power Authority Refunding Rev., “DDD”, 5%, 7/01/2021 (a)(d) | 3,140,000 | 785,000 | ||
| Puerto Rico Electric Power Authority Refunding Rev., “DDD”, 5%, 7/01/2022 (a)(d) | 5,075,000 | 1,268,750 | ||
| Puerto Rico Electric Power Authority Refunding Rev., “NN”, NPFG, 4.75%, 7/01/2033 | 1,405,000 | 1,353,914 | ||
| Puerto Rico Electric Power Authority Refunding Rev., “PP”, NPFG, 5%, 7/01/2024 | 160,000 | 160,017 | ||
| Puerto Rico Electric Power Authority Refunding Rev., “PP”, NPFG, 5%, 7/01/2025 | 170,000 | 170,018 | ||
| Puerto Rico Electric Power Authority Refunding Rev., “VV”, NPFG, 5.25%, 7/01/2025 | 225,000 | 222,792 | ||
| Puerto Rico Electric Power Authority Refunding Rev., “VV”, NPFG, 5.25%, 7/01/2026 | 940,000 | 928,042 | ||
| Puerto Rico Electric Power Authority Refunding Rev., “VV”, NPFG, 5.25%, 7/01/2029 | 3,755,000 | 3,713,685 | ||
| Puerto Rico Electric Power Authority Refunding Rev., “VV”, NPFG, 5.25%, 7/01/2030 | 2,455,000 | 2,425,747 | ||
| Puerto Rico Electric Power Authority Refunding Rev., “VV”, NPFG, 5.25%, 7/01/2034 | 370,000 | 364,895 | ||
| Puerto Rico Electric Power Authority Rev., “A”, 5%, 7/01/2029 (a)(d) | 7,990,000 | 1,997,500 | ||
| Puerto Rico Electric Power Authority Rev., “A”, 5%, 7/01/2042 (a)(d) | 1,210,000 | 302,500 | ||
| Puerto Rico Electric Power Authority Rev., “AAA”, 5.25%, 7/01/2021 (a)(d) | 670,000 | 167,500 | ||
| Puerto Rico Electric Power Authority Rev., “AAA”, 5.25%, 7/01/2030 (a)(d) | 320,000 | 80,000 | ||
| Puerto Rico Electric Power Authority Rev., “CCC”, 5.25%, 7/01/2027 (a)(d) | 3,005,000 | 751,250 | ||
| Puerto Rico Electric Power Authority Rev., “DDD”, AGM, 3.65%, 7/01/2024 | 1,510,000 | 1,494,349 | ||
| Puerto Rico Electric Power Authority Rev., “RR”, AGM, 5%, 7/01/2028 | 90,000 | 90,548 | ||
| Puerto Rico Electric Power Authority Rev., “SS”, AGM, 4.375%, 7/01/2030 | 375,000 | 359,264 | ||
| Puerto Rico Electric Power Authority Rev., “TT”, 5%, 7/01/2021 (a)(d) | 1,540,000 | 385,000 | ||
| Puerto Rico Electric Power Authority Rev., “TT”, 5%, 7/01/2023 (a)(d) | 1,345,000 | 336,250 | ||
87
Portfolio of Investments (unaudited)
– continued
| Issuer | Shares/Par | Value ($) | ||
| Municipal Bonds - continued | ||||
| Puerto Rico - continued | ||||
| Puerto Rico Electric Power Authority Rev., “TT”, 5%, 7/01/2027 (a)(d) | $ | 275,000 | $68,750 | |
| Puerto Rico Electric Power Authority Rev., “TT”, 5%, 7/01/2037 (a)(d) | 4,105,000 | 1,026,250 | ||
| Puerto Rico Electric Power Authority Rev., “TT”, NPFG, 5%, 7/01/2024 | 765,000 | 765,356 | ||
| Puerto Rico Electric Power Authority Rev., “TT”, NPFG, 5%, 7/01/2026 | 30,000 | 30,014 | ||
| Puerto Rico Electric Power Authority Rev., “UU”, AGM, 4.25%, 7/01/2027 | 1,090,000 | 1,058,027 | ||
| Puerto Rico Electric Power Authority Rev., “WW”, 5.375%, 7/01/2022 (a)(d) | 285,000 | 71,250 | ||
| Puerto Rico Electric Power Authority Rev., “WW”, 5.25%, 7/01/2025 (a)(d) | 645,000 | 161,250 | ||
| Puerto Rico Electric Power Authority Rev., “ZZ”, 5%, 7/01/2018 (a)(d) | 1,930,000 | 482,500 | ||
| Puerto Rico Electric Power Authority Rev., “ZZ”, 5.25%, 7/01/2023 (a)(d) | 2,150,000 | 537,500 | ||
| Puerto Rico Electric Power Authority Rev., “ZZ”, 5.25%, 7/01/2024 (a)(d) | 755,000 | 188,750 | ||
| Puerto Rico Electric Power Authority Rev., “ZZ”, 5.25%, 7/01/2026 (a)(d) | 2,320,000 | 580,000 | ||
| Puerto Rico Electric Power Authority Rev., Taxable, “EEE”, 6.05%, 7/01/2032 (a)(d) | 1,875,000 | 468,750 | ||
| Puerto Rico Housing Finance Authority, Multi-Family Housing Collateralized Rev. (Mirador Las Casas Project), “B”, 5%, 3/01/2027 (Put Date 3/01/2026) | 1,435,000 | 1,463,742 | ||
| Puerto Rico Industrial, Tourist, Educational, Medical & Environmental Control Facilities Financing Authority, Educational Facilities Rev. (University Plaza Project), NPFG, 5%, 7/01/2033 | 1,920,000 | 1,861,672 | ||
| Puerto Rico Municipal Finance Agency, “A”, AGM, 5%, 8/01/2027 | 100,000 | 100,609 | ||
| Puerto Rico Sales Tax Financing Corp., Restructured Sales Tax Rev., “2019A-1”, 4.5%, 7/01/2034 | 311,000 | 299,401 | ||
| Puerto Rico Sales Tax Financing Corp., Restructured Sales Tax Rev., “2019A-1”, 4.55%, 7/01/2040 | 766,000 | 704,781 | ||
| Puerto Rico Sales Tax Financing Corp., Restructured Sales Tax Rev., “2019A-1”, 4.75%, 7/01/2053 | 1,988,000 | 1,757,514 | ||
| Puerto Rico Sales Tax Financing Corp., Restructured Sales Tax Rev., “2019A-1”, 5%, 7/01/2058 | 23,782,000 | 21,512,802 | ||
| Puerto Rico Sales Tax Financing Corp., Restructured Sales Tax Rev., “2019A-2”, 4.329%, 7/01/2040 | 5,124,000 | 4,589,380 | ||
| Puerto Rico Sales Tax Financing Corp., Restructured Sales Tax Rev., “2019A-2”, 4.536%, 7/01/2053 | 104,000 | 88,715 | ||
88
Portfolio of Investments (unaudited)
– continued
| Issuer | Shares/Par | Value ($) | ||
| Municipal Bonds - continued | ||||
| Puerto Rico - continued | ||||
| Puerto Rico Sales Tax Financing Corp., Restructured Sales Tax Rev., “2019A-2”, 4.784%, 7/01/2058 | $ | 1,435,000 | $1,252,531 | |
| Puerto Rico Sales Tax Financing Corp., Restructured Sales Tax Rev., Capital Appreciation, “2019A-1”, 0%, 7/01/2024 | 48,000 | 46,467 | ||
| Puerto Rico Sales Tax Financing Corp., Restructured Sales Tax Rev., Capital Appreciation, “2019A-1”, 0%, 7/01/2027 | 1,223,000 | 1,041,368 | ||
| Puerto Rico Sales Tax Financing Corp., Restructured Sales Tax Rev., Capital Appreciation, “2019A-1”, 0%, 7/01/2029 | 231,000 | 179,611 | ||
| Puerto Rico Sales Tax Financing Corp., Restructured Sales Tax Rev., Capital Appreciation, “2019A-1”, 0%, 7/01/2031 | 11,027,000 | 7,811,832 | ||
| Puerto Rico Sales Tax Financing Corp., Restructured Sales Tax Rev., Capital Appreciation, “2019A-1”, 0%, 7/01/2033 | 10,791,000 | 6,914,331 | ||
| Puerto Rico Sales Tax Financing Corp., Restructured Sales Tax Rev., Capital Appreciation, “2019A-1”, 0%, 7/01/2046 | 7,706,000 | 1,986,516 | ||
| University of Puerto Rico Rev., “P”, NPFG, 5%, 6/01/2025 | 280,000 | 280,250 | ||
| $102,146,211 | ||||
| Rhode Island - 0.5% | ||||
| Rhode Island Health and Educational Building Corp., Higher Education Facility Rev. (Providence College), “B”, 5%, 11/01/2034 | $ | 365,000 | $388,848 | |
| Rhode Island Health and Educational Building Corp., Higher Education Facility Rev. (Providence College), “B”, 5%, 11/01/2035 | 395,000 | 418,858 | ||
| Rhode Island Health and Educational Building Corp., Higher Education Facility Rev. (Providence College), “B”, 5%, 11/01/2036 | 415,000 | 435,733 | ||
| Rhode Island Health and Educational Building Corp., Higher Education Facility Rev. (Providence College), “B”, 4%, 11/01/2037 | 525,000 | 489,487 | ||
| Rhode Island Health and Educational Building Corp., Higher Education Facility Rev. (Providence College), “B”, 4%, 11/01/2038 | 555,000 | 515,658 | ||
| Rhode Island Health and Educational Building Corp., Higher Education Facility Rev. (Providence College), “B”, 4%, 11/01/2039 | 675,000 | 618,938 | ||
| Rhode Island Health and Educational Building Corp., Higher Education Facility Rev. (Providence College), “B”, 4%, 11/01/2040 | 710,000 | 644,258 | ||
| Rhode Island Student Loan Authority, Education Loan Rev., “A”, 5%, 12/01/2028 | 690,000 | 709,662 | ||
| Rhode Island Student Loan Authority, Education Loan Rev., “A”, 5%, 12/01/2029 | 555,000 | 574,754 | ||
| Rhode Island Student Loan Authority, Education Loan Rev., “A”, 5%, 12/01/2030 | 515,000 | 530,350 | ||
| Rhode Island Student Loan Authority, Education Loan Rev., “A”, 2.25%, 12/01/2039 | 1,660,000 | 1,317,117 | ||
| Rhode Island Student Loan Authority, Education Loan Rev., “A”, 4.125%, 12/01/2042 | 7,960,000 | 6,863,557 | ||
89
Portfolio of Investments (unaudited)
– continued
| Issuer | Shares/Par | Value ($) | ||
| Municipal Bonds - continued | ||||
| Rhode Island - continued | ||||
| Rhode Island Student Loan Authority, Education Loan Rev., Federally Taxable, “1”, 4.125%, 12/01/2041 | $ | 5,150,000 | $4,580,675 | |
| Rhode Island Student Loan Authority, Student Loan Rev., “A”, 3.5%, 12/01/2034 | 910,000 | 870,757 | ||
| Rhode Island Student Loan Authority, Student Loan Rev., ”A“, 3.625%, 12/01/2037 | 3,710,000 | 3,260,640 | ||
| $22,219,292 | ||||
| South Carolina - 1.7% | ||||
| Lexington County, SC, Health Services District, Inc., Hospital Refunding Rev., 5%, 11/01/2028 | $ | 515,000 | $530,108 | |
| North Charleston, SC, Limited Obligation Bond (Hospitality Fee Pledge), “A”, 5%, 10/01/2040 | 3,055,000 | 3,090,312 | ||
| Rock Hill, SC, Utility Systems Rev., “A”, BAM, 4%, 1/01/2049 | 3,425,000 | 2,931,340 | ||
| South Carolina Housing Finance & Development Authority Mortgage Rev., “B”, 5%, 1/01/2052 | 11,685,000 | 11,756,444 | ||
| South Carolina Jobs & Economic Development Authority, Educational Facilities Rev. (Green Charter Schools Project), “A”, 4%, 6/01/2036 (n) | 380,000 | 302,506 | ||
| South Carolina Jobs & Economic Development Authority, Educational Facilities Rev. (Green Charter Schools Project), “A”, 4%, 6/01/2046 (n) | 420,000 | 279,959 | ||
| South Carolina Jobs & Economic Development Authority, Hospital Facilities Rev. (Bon Secours Mercy Health, Inc.), “A”, 4%, 12/01/2044 | 4,840,000 | 4,229,745 | ||
| South Carolina Jobs & Economic Development Authority, Hospital Rev. (Conway Hospital, Inc.), 5.25%, 7/01/2047 | 6,630,000 | 6,553,157 | ||
| South Carolina Jobs & Economic Development Authority, Hospital Rev. (Prisma Health Obligated Group), “A”, 5%, 5/01/2048 | 5,260,000 | 4,965,684 | ||
| South Carolina Jobs & Economic Development Authority, Hospital Rev. (St. Joseph's/Candler Health System, Inc.), “C”, 5%, 7/01/2032 | 3,935,000 | 4,016,783 | ||
| South Carolina Jobs & Economic Development Authority, Residential Care Facilities Rev. (Episcopal Home at Still Hopes), 5%, 4/01/2047 | 2,060,000 | 1,644,317 | ||
| South Carolina Jobs & Economic Development Authority, Residential Care Facilities Rev. (Episcopal Home at Still Hopes), 5%, 4/01/2048 | 790,000 | 626,261 | ||
| South Carolina Jobs & Economic Development Authority, Residential Care Facilities Rev. (Episcopal Home at Still Hopes), 5%, 4/01/2052 | 955,000 | 738,826 | ||
| South Carolina Patriots Energy Group Finance Agency, Gas Supply Rev., “A-1”, 5.25%, 10/01/2054 (Put Date 8/01/2031) | 3,995,000 | 4,021,066 | ||
90
Portfolio of Investments (unaudited)
– continued
| Issuer | Shares/Par | Value ($) | ||
| Municipal Bonds - continued | ||||
| South Carolina - continued | ||||
| South Carolina Ports Authority Rev., 5.25%, 7/01/2050 (Prerefunded 7/01/2025) | $ | 2,420,000 | $2,451,105 | |
| South Carolina Ports Authority Rev., “B”, 4%, 7/01/2035 | 2,680,000 | 2,479,491 | ||
| South Carolina Ports Authority Rev., “B”, 4%, 7/01/2037 | 4,165,000 | 3,697,215 | ||
| South Carolina Ports Authority Rev., “B”, 4%, 7/01/2039 | 4,120,000 | 3,542,783 | ||
| South Carolina Ports Authority Rev., “B”, 5%, 7/01/2044 | 6,295,000 | 6,132,944 | ||
| South Carolina Student Loan Corp., Student Loan Rev., Taxable, “A”, 2.641%, 12/01/2026 | 6,285,000 | 5,682,892 | ||
| South Carolina Student Loan Corp., Student Loan Rev., Taxable, “A”, 2.771%, 12/01/2027 | 2,910,000 | 2,570,213 | ||
| South Carolina Student Loan Corp., Student Loan Rev., Taxable, “A”, 2.923%, 12/01/2028 | 2,165,000 | 1,868,424 | ||
| South Carolina Student Loan Corp., Student Loan Rev., Taxable, “A”, 2.993%, 12/01/2029 | 1,420,000 | 1,190,430 | ||
| South Carolina Student Loan Corp., Student Loan Rev., Taxable, “A”, 3.043%, 12/01/2030 | 455,000 | 370,180 | ||
| South Carolina Student Loan Corp., Student Loan Rev., Taxable, “A”, 3.593%, 12/01/2039 | 1,550,000 | 1,450,026 | ||
| Spartanburg County, SC, Regional Health Services District Hospital Rev., “A”, 5%, 4/15/2048 | 3,635,000 | 3,441,722 | ||
| Spartanburg County, SC, Regional Health Services District Hospital Rev., “A”, AGM, 4%, 4/15/2045 | 1,070,000 | 924,578 | ||
| $81,488,511 | ||||
| South Dakota - 0.3% | ||||
| South Dakota Educational Enhancement Funding Corp., Tobacco Settlement Rev., Taxable, 0.961%, 6/01/2024 | $ | 1,570,000 | $1,519,054 | |
| South Dakota Educational Enhancement Funding Corp., Tobacco Settlement Rev., Taxable, 1.245%, 6/01/2025 | 2,755,000 | 2,555,157 | ||
| South Dakota Educational Enhancement Funding Corp., Tobacco Settlement Rev., Taxable, 1.495%, 6/01/2026 | 1,970,000 | 1,768,154 | ||
| South Dakota Housing Development Authority, Homeownership Mortgage, “A”, GNMA, 6%, 5/01/2054 | 3,935,000 | 4,111,017 | ||
| South Dakota Housing Development Authority, Homeownership Mortgage, “B”, 4.5%, 11/01/2048 (u) | 5,310,000 | 5,253,976 | ||
| $15,207,358 | ||||
| Tennessee - 2.9% | ||||
| Knox County, TN, Health, Educational & Housing Facility Board Hospital Rev. (Covenant Health), “A”, 5%, 1/01/2042 | $ | 5,505,000 | $5,329,683 | |
| Knox County, TN, Health, Educational & Housing Facility Board Rev. (University Health Systems, Inc.), 5%, 4/01/2030 | 625,000 | 632,472 | ||
| Knox County, TN, Health, Educational & Housing Facility Board Rev. (University Health Systems, Inc.), 5%, 4/01/2036 | 2,210,000 | 2,221,967 | ||
91
Portfolio of Investments (unaudited)
– continued
| Issuer | Shares/Par | Value ($) | ||
| Municipal Bonds - continued | ||||
| Tennessee - continued | ||||
| Knox County, TN, Health, Educational & Housing Facility Board Rev. (University Health Systems, Inc.), “A”, 5%, 9/01/2030 | $ | 4,525,000 | $4,592,593 | |
| Knox County, TN, Health, Educational & Housing Facility Board Rev. (University Health Systems, Inc.), “A”, 5%, 9/01/2040 | 7,445,000 | 6,812,338 | ||
| Memphis-Shelby County, TN, Airport Authority Rev., “A”, 5%, 7/01/2031 | 200,000 | 207,941 | ||
| Memphis-Shelby County, TN, Airport Authority Rev., “A”, 5%, 7/01/2032 | 910,000 | 946,032 | ||
| Memphis-Shelby County, TN, Airport Authority Rev., “A”, 5%, 7/01/2033 | 1,380,000 | 1,434,400 | ||
| Memphis-Shelby County, TN, Airport Authority Rev., “A”, 5%, 7/01/2034 | 2,910,000 | 3,019,993 | ||
| Memphis-Shelby County, TN, Airport Authority Rev., “A”, 5%, 7/01/2035 | 3,055,000 | 3,144,497 | ||
| Memphis-Shelby County, TN, Airport Authority Rev., “A”, 5%, 7/01/2036 | 3,205,000 | 3,271,878 | ||
| Memphis-Shelby County, TN, Airport Authority Rev., “A”, 5%, 7/01/2037 | 3,370,000 | 3,410,176 | ||
| Memphis-Shelby County, TN, Airport Authority Rev., “A”, 5%, 7/01/2038 | 3,535,000 | 3,552,210 | ||
| Memphis-Shelby County, TN, Airport Authority Rev., “A”, 5%, 7/01/2039 | 3,710,000 | 3,714,639 | ||
| Memphis-Shelby County, TN, Airport Authority Rev., “A”, 5%, 7/01/2040 | 1,540,000 | 1,534,282 | ||
| Metropolitan Government of Nashville & Davidson County, TN, Health & Educational Facilities Board Rev. (Vanderbilt University Medical Center), “A”, 5%, 7/01/2035 | 2,115,000 | 2,148,912 | ||
| Metropolitan Government of Nashville & Davidson County, TN, Health & Educational Facilities Board Rev., Refunding & Improvement (Trevecca Nazarene University Project), 5%, 10/01/2034 | 135,000 | 135,516 | ||
| Metropolitan Government of Nashville & Davidson County, TN, Sports Authority Stadium Project Senior Rev., “A”, AGM, 5.25%, 7/01/2053 | 1,200,000 | 1,235,710 | ||
| Metropolitan Government of Nashville & Davidson County, TN, Sports Authority Stadium Project Senior Rev., “A”, AGM, 5.25%, 7/01/2056 | 2,995,000 | 3,076,828 | ||
| Metropolitan Government of Nashville & Davidson County, TN, Sports Authority Stadium Project Subordinate Rev., “B”, AGM, 5.25%, 7/01/2053 | 4,795,000 | 4,926,006 | ||
| Metropolitan Government of Nashville & Davidson County, TN, Sports Authority Stadium Project Subordinate Rev., “B”, AGM, 5.25%, 7/01/2056 | 5,565,000 | 5,703,522 | ||
92
Portfolio of Investments (unaudited)
– continued
| Issuer | Shares/Par | Value ($) | ||
| Municipal Bonds - continued | ||||
| Tennessee - continued | ||||
| Metropolitan Nashville, TN, Airport Authority Improvement Rev., “B”, 5%, 7/01/2035 | $ | 1,340,000 | $1,374,911 | |
| Metropolitan Nashville, TN, Airport Authority Improvement Rev., “B”, 5.5%, 7/01/2052 | 5,055,000 | 5,189,726 | ||
| Metropolitan Nashville, TN, Airport Authority Improvement Rev., “B”, 5%, 7/01/2054 | 7,865,000 | 7,699,321 | ||
| Nashville and Davidson County, TN, Health & Education Facilities, Board of Metropolitan Government, Multi-Family Tax-Exempt Mortgage-Backed (Ben Allen Ridge Apartments Project), “A”, 4.75%, 2/01/2048 | 8,825,696 | 7,935,082 | ||
| Shelby County, TN, New Memphis Arena Public Building Authority, Local Government Public Improvement (City of Memphis Project), Capital Appreciation, 0%, 4/01/2032 | 445,000 | 296,440 | ||
| Shelby County, TN, New Memphis Arena Public Building Authority, Local Government Public Improvement (City of Memphis Project), Capital Appreciation, 0%, 4/01/2033 | 630,000 | 398,148 | ||
| Shelby County, TN, New Memphis Arena Public Building Authority, Local Government Public Improvement (City of Memphis Project), Capital Appreciation, 0%, 4/01/2034 | 380,000 | 227,249 | ||
| Shelby County, TN, New Memphis Arena Public Building Authority, Local Government Public Improvement (City of Memphis Project), Capital Appreciation, 0%, 4/01/2035 | 490,000 | 275,511 | ||
| Shelby County, TN, New Memphis Arena Public Building Authority, Local Government Public Improvement (City of Memphis Project), Capital Appreciation, 0%, 4/01/2036 | 475,000 | 250,427 | ||
| Shelby County, TN, New Memphis Arena Public Building Authority, Local Government Public Improvement (City of Memphis Project), Capital Appreciation, 0%, 4/01/2037 | 570,000 | 280,346 | ||
| Shelby County, TN, New Memphis Arena Public Building Authority, Local Government Public Improvement (City of Memphis Project), Capital Appreciation, 0%, 4/01/2038 | 475,000 | 217,190 | ||
| Tennergy Corp., TN, Gas Supply Rev., “A”, 5.5%, 10/01/2053 (Put Date 12/01/2030) | 19,225,000 | 19,525,994 | ||
| Tennessee Energy Acquisition Corp., Gas Project Rev., “A”, 5.25%, 9/01/2026 | 2,210,000 | 2,216,221 | ||
| Tennessee Energy Acquisition Corp., Gas Project Rev., “A-1”, 5%, 5/01/2053 (Put Date 5/01/2028) | 18,000,000 | 17,958,159 | ||
| Tennessee Housing Development Agency, Residential Finance Program Rev., “1”, 5%, 7/01/2028 | 1,580,000 | 1,655,356 | ||
| Tennessee Housing Development Agency, Residential Finance Program Rev., “1”, 5%, 1/01/2029 | 850,000 | 891,579 | ||
| Tennessee Housing Development Agency, Residential Finance Program Rev., “1”, 5%, 7/01/2029 | 1,480,000 | 1,558,184 | ||
93
Portfolio of Investments (unaudited)
– continued
| Issuer | Shares/Par | Value ($) | ||
| Municipal Bonds - continued | ||||
| Tennessee - continued | ||||
| Tennessee Housing Development Agency, Residential Finance Program Rev., “1”, 5%, 1/01/2030 | $ | 1,720,000 | $1,810,740 | |
| Tennessee Housing Development Agency, Residential Finance Program Rev., “1”, 5%, 7/01/2030 | 1,745,000 | 1,843,329 | ||
| Tennessee Housing Development Agency, Residential Finance Program Rev., “1”, 5%, 1/01/2031 | 825,000 | 871,740 | ||
| Tennessee Housing Development Agency, Residential Finance Program Rev., “1”, 5%, 7/01/2031 | 1,855,000 | 1,966,138 | ||
| Tennessee Housing Development Agency, Residential Finance Program Rev., “1”, 3.75%, 7/01/2039 | 685,000 | 635,571 | ||
| Tennessee Housing Development Agency, Residential Finance Program Rev., “1”, 4%, 1/01/2043 | 935,000 | 917,482 | ||
| Tennessee Housing Development Agency, Residential Finance Program Rev., “2-C”, 4%, 1/01/2045 | 180,000 | 178,729 | ||
| Tennessee Housing Development Agency, Residential Finance Program Rev., “3”, 4.25%, 7/01/2049 | 1,140,000 | 1,121,968 | ||
| $138,347,136 | ||||
| Texas - 7.0% | ||||
| Anna, TX, Independent School District, Unlimited Tax School Building, PSF, 4.125%, 2/15/2053 | $ | 795,000 | $702,927 | |
| Arlington, TX, Higher Education Finance Corp. Rev. (Basis Charter Schools, Inc.), 4.5%, 6/15/2056 (Put Date 6/15/2026) (n) | 725,000 | 711,426 | ||
| Arlington, TX, Higher Education Finance Corp. Rev. (Great Hearts America-Texas), “A”, PSF, 4%, 8/15/2048 | 1,400,000 | 1,160,278 | ||
| Arlington, TX, Higher Education Finance Corp. Rev. (Great Hearts America-Texas), “A”, PSF, 4%, 8/15/2053 | 1,000,000 | 810,465 | ||
| Arlington, TX, Higher Education Finance Corp. Rev. (Great Hearts America-Texas), “A”, PSF, 4.125%, 8/15/2058 | 1,500,000 | 1,227,203 | ||
| Arlington, TX, Higher Education Finance Corp. Rev. (Riverwalk Education Foundation, Inc.), 5%, 8/15/2057 | 4,400,000 | 4,447,956 | ||
| Arlington, TX, Higher Education Finance Corp. Rev. (Trinity Basin Preparatory, Inc.), PSF, 4.125%, 8/15/2042 | 2,915,000 | 2,571,020 | ||
| Arlington, TX, Higher Education Finance Corp. Rev. (Trinity Basin Preparatory, Inc.), PSF, 4.375%, 8/15/2052 | 3,130,000 | 2,870,391 | ||
| Arlington, TX, Senior Lien Special Tax Rev., “A”, AGM, 5%, 2/15/2038 | 775,000 | 787,118 | ||
| Arlington, TX, Senior Lien Special Tax Rev., “A”, AGM, 5%, 2/15/2043 | 4,015,000 | 4,028,222 | ||
| Austin, TX, Airport System Rev., 5%, 11/15/2052 | 1,315,000 | 1,303,588 | ||
| Austin, TX, Airport System Rev., “B”, 5%, 11/15/2041 | 845,000 | 842,708 | ||
| Austin, TX, Convention Center (Convention Enterprises, Inc.), “A”, 5%, 1/01/2029 | 565,000 | 564,268 | ||
94
Portfolio of Investments (unaudited)
– continued
| Issuer | Shares/Par | Value ($) | ||
| Municipal Bonds - continued | ||||
| Texas - continued | ||||
| Austin, TX, Convention Center (Convention Enterprises, Inc.), “A”, 5%, 1/01/2031 | $ | 830,000 | $827,565 | |
| Austin, TX, Convention Center (Convention Enterprises, Inc.), “A”, 5%, 1/01/2034 | 160,000 | 151,246 | ||
| Austin, TX, Convention Center (Convention Enterprises, Inc.), “B”, 5%, 1/01/2026 | 390,000 | 382,243 | ||
| Austin, TX, Convention Center (Convention Enterprises, Inc.), “B”, 5%, 1/01/2028 | 250,000 | 243,221 | ||
| Austin, TX, Convention Center (Convention Enterprises, Inc.), “B”, 5%, 1/01/2030 | 365,000 | 351,058 | ||
| Belton, TX, Independent School District, Unlimited Tax School Building Bonds, PSF, 4%, 2/15/2052 | 2,250,000 | 1,969,473 | ||
| Bexar County, TX, Southwest Independent School District, PSF, 4%, 2/01/2053 | 15,000,000 | 13,144,476 | ||
| Brazos, TX, Higher Education Authority, Inc., Student Loan Program Rev., “1A”, 2.35%, 4/01/2040 | 30,000 | 29,570 | ||
| Brazos, TX, Higher Education Authority, Inc., Student Loan Program Rev., “1A”, 3%, 4/01/2040 | 710,000 | 533,041 | ||
| Brazos, TX, Higher Education Authority, Inc., Student Loan Program Rev., Taxable, “1A”, 3.414%, 4/01/2040 | 65,000 | 64,702 | ||
| Brock, TX, Independent School District, Unlimited Tax School Building, PSF, 4%, 8/15/2048 | 7,975,000 | 7,004,190 | ||
| Clifton, TX, Higher Education Finance Corp. Rev. (International Leadership of Texas, Inc.), PSF, 4.25%, 8/15/2052 | 2,500,000 | 2,155,489 | ||
| College of the Mainland, TX, General Obligation, 4%, 8/15/2044 | 1,765,000 | 1,562,780 | ||
| Conroe, TX, Local Government Corp., First Lien Hotel Rev. (Convention Center Hotel), “A”, 2.5%, 10/01/2031 | 340,000 | 271,498 | ||
| Conroe, TX, Local Government Corp., First Lien Hotel Rev. (Convention Center Hotel), “A”, 4%, 10/01/2050 | 1,165,000 | 834,503 | ||
| Conroe, TX, Local Government Corp., Second Lien Hotel Rev. (Convention Center Hotel), “B”, 3.5%, 10/01/2031 (n) | 355,000 | 286,915 | ||
| Conroe, TX, Local Government Corp., Second Lien Hotel Rev. (Convention Center Hotel), “B”, 5%, 10/01/2050 (n) | 535,000 | 397,675 | ||
| Conroe, TX, Local Government Corp., Third Lien Hotel Rev. (Convention Center Hotel), “C”, 4%, 10/01/2046 | 265,000 | 217,597 | ||
| Crowley, TX, Independent School District (Tarrant and Johnson Counties), PSF, 4.25%, 2/01/2053 | 8,960,000 | 8,135,714 | ||
| Cypress-Fairbanks, TX, Independent School District, Unlimited Tax School Building, PSF, 4%, 2/15/2048 | 2,100,000 | 1,861,380 | ||
| Denton County, TX, Lakes Fresh Water Supply District, BAM, 4%, 9/01/2048 | 5,385,000 | 4,500,463 | ||
| Eagle Pass, TX, Tax and Limited Pledge Rev., AGM, 4%, 3/01/2033 | 235,000 | 236,424 | ||
| Eagle Pass, TX, Tax and Limited Pledge Rev., AGM, 4%, 3/01/2035 | 200,000 | 200,391 | ||
95
Portfolio of Investments (unaudited)
– continued
| Issuer | Shares/Par | Value ($) | ||
| Municipal Bonds - continued | ||||
| Texas - continued | ||||
| Eagle Pass, TX, Tax and Limited Pledge Rev., AGM, 4%, 3/01/2036 | $ | 230,000 | $227,504 | |
| Eagle Pass, TX, Tax and Limited Pledge Rev., AGM, 4%, 3/01/2038 | 390,000 | 353,577 | ||
| East Montgomery County, TX, Municipal Utility District No. 3, BAM, 4.5%, 8/15/2043 | 1,000,000 | 928,127 | ||
| East Montgomery County, TX, Municipal Utility District No. 3, BAM, 4.375%, 8/15/2047 | 1,450,000 | 1,282,216 | ||
| East Montgomery County, TX, Municipal Utility District No. 3, BAM, 4.375%, 8/15/2050 | 2,400,000 | 2,080,608 | ||
| Ector County, TX, Hospital District General Obligation Refunding, 5%, 9/15/2025 | 340,000 | 339,268 | ||
| Ector County, TX, Hospital District General Obligation Refunding, 5%, 9/15/2026 | 515,000 | 514,870 | ||
| Ector County, TX, Hospital District General Obligation Refunding, 5%, 9/15/2027 | 790,000 | 793,193 | ||
| Ector County, TX, Hospital District General Obligation Refunding, 5%, 9/15/2028 | 850,000 | 856,404 | ||
| Ector County, TX, Hospital District General Obligation Refunding, 5%, 9/15/2029 | 555,000 | 559,143 | ||
| Ector County, TX, Hospital District General Obligation Refunding, 5%, 9/15/2030 | 630,000 | 635,248 | ||
| Ector County, TX, Hospital District General Obligation Refunding, 5%, 9/15/2031 | 870,000 | 874,076 | ||
| Elgin, TX, Tax and General Obligation Rev., AGM, 4%, 7/15/2032 | 180,000 | 177,184 | ||
| Elgin, TX, Tax and General Obligation Rev., AGM, 4%, 7/15/2033 | 205,000 | 200,810 | ||
| Elgin, TX, Tax and General Obligation Rev., AGM, 4%, 7/15/2034 | 320,000 | 313,485 | ||
| Elgin, TX, Tax and General Obligation Rev., AGM, 4%, 7/15/2035 | 410,000 | 398,787 | ||
| Elgin, TX, Tax and General Obligation Rev., AGM, 4%, 7/15/2036 | 270,000 | 256,367 | ||
| Elgin, TX, Tax and General Obligation Rev., AGM, 4%, 7/15/2038 | 465,000 | 424,708 | ||
| Fort Bend County, TX, Lamar Consolidated Independent School District, Unlimited Tax Schoolhouse, 4%, 2/15/2048 | 7,905,000 | 6,804,040 | ||
| Fort Bend County, TX, Lamar Consolidated Independent School District, Unlimited Tax Schoolhouse, 4%, 2/15/2053 | 5,535,000 | 4,654,084 | ||
| Fredericksburg, TX, Independent School District, Unlimited Tax School Building, PSF, 4%, 2/15/2052 | 4,005,000 | 3,460,956 | ||
| Galveston County, TX, Municipal Utility District No. 45, BAM, 4.375%, 9/01/2039 | 1,280,000 | 1,215,916 | ||
| Galveston County, TX, Municipal Utility District No. 45, BAM, 4.5%, 9/01/2042 | 1,110,000 | 1,051,224 | ||
| Galveston County, TX, Municipal Utility District No. 45, BAM, 4.5%, 9/01/2045 | 1,260,000 | 1,183,604 | ||
| Galveston County, TX, Municipal Utility District No. 56, AGM, 4.5%, 6/01/2047 | 1,600,000 | 1,441,576 | ||
96
Portfolio of Investments (unaudited)
– continued
| Issuer | Shares/Par | Value ($) | ||
| Municipal Bonds - continued | ||||
| Texas - continued | ||||
| Harlandale, TX, Independent School District, Maintenance Tax, BAM, 2%, 8/15/2040 (Put Date 8/15/2024) | $ | 3,140,000 | $3,082,167 | |
| Harlingen, TX, Economic Development Corp., Sales Tax Refunding Rev., “A”, BAM, 4%, 2/15/2030 | 925,000 | 926,052 | ||
| Harris County, TX, Cultural Education Facilities Finance Corp., Hospital Rev. (Memorial Hermann Health System), “A”, 4.125%, 7/01/2052 | 7,825,000 | 6,655,143 | ||
| Harris County, TX, Cultural Education Facilities Finance Corp., Hospital Rev. (Texas Children's Hospital), “A”, BAM, 4%, 10/01/2035 | 1,240,000 | 1,213,418 | ||
| Harris County, TX, Cultural Education Facilities Finance Corp., Hospital Rev. (Texas Children's Hospital), “A”, BAM, 4%, 10/01/2036 | 2,195,000 | 2,088,026 | ||
| Harris County, TX, Cultural Education Facilities Finance Corp., Hospital Rev. (Texas Children's Hospital), “A”, BAM, 4%, 10/01/2037 | 2,970,000 | 2,772,764 | ||
| Harris County, TX, Cultural Education Facilities Finance Corp., Hospital Rev. (Texas Children's Hospital), “A”, BAM, 4%, 10/01/2038 | 2,480,000 | 2,294,576 | ||
| Harris County, TX, Municipal Utility District No. 460, Unlimited Tax, AGM, 4%, 4/01/2046 | 1,615,000 | 1,353,077 | ||
| Harris County, TX, Municipal Utility District No. 460, Unlimited Tax, AGM, 4%, 4/01/2048 | 1,755,000 | 1,442,512 | ||
| Harris County, TX, Municipal Utility District No. 460, Unlimited Tax, AGM, 4%, 4/01/2050 | 1,915,000 | 1,550,968 | ||
| Harris County-Houston, TX, Sports Authority Rev., “C”, 5%, 11/15/2032 | 180,000 | 180,492 | ||
| Harris County-Houston, TX, Sports Authority Rev., “C”, 5%, 11/15/2033 | 430,000 | 431,144 | ||
| Harris County-Houston, TX, Sports Authority Rev., Capital Appreciation, “A”, AGM, 0%, 11/15/2041 | 710,000 | 257,273 | ||
| Harris County-Houston, TX, Sports Authority Rev., Capital Appreciation, “A”, AGM, 0%, 11/15/2046 | 1,770,000 | 468,997 | ||
| Houston, TX, Airport System Refunding Rev., Subordinate Lien, “A”, AGM, 5.25%, 7/01/2053 | 6,970,000 | 7,024,160 | ||
| Houston, TX, Airport System Rev., Special Facilities Rev. (United Airlines, Inc. Terminal E Project), 4.75%, 7/01/2024 | 1,365,000 | 1,362,141 | ||
| Houston, TX, Airport System Rev., Special Facilities Rev. (United Airlines, Inc. Terminal E Project), 5%, 7/01/2029 | 100,000 | 98,377 | ||
| Houston, TX, Airport System Rev., Special Facilities Rev. (United Airlines, Inc. Terminal E Project), “A”, 5%, 7/01/2027 | 525,000 | 522,036 | ||
97
Portfolio of Investments (unaudited)
– continued
| Issuer | Shares/Par | Value ($) | ||
| Municipal Bonds - continued | ||||
| Texas - continued | ||||
| Houston, TX, Airport System Rev., Special Facilities Rev. (United Airlines, Inc. Terminal Improvement Projects), “B-1”, 5%, 7/15/2030 | $ | 2,175,000 | $2,134,412 | |
| Houston, TX, Airport System Rev., Special Facilities Rev. (United Airlines, Inc. Terminal Improvement Projects), “B-2”, 5%, 7/15/2027 | 715,000 | 710,988 | ||
| Houston, TX, Higher Education Finance Corp. University Rev. (Houston Baptist University Project), 3.375%, 10/01/2037 | 190,000 | 149,256 | ||
| Houston, TX, Higher Education Finance Corp. University Rev. (Houston Baptist University Project), 4%, 10/01/2051 | 630,000 | 469,358 | ||
| Irving, TX, Hospital Authority Rev. (Baylor Scott & White Medical Center-Irving), “A”, 5%, 10/15/2044 | 1,235,000 | 1,124,179 | ||
| Irving, TX, Hotel Occupancy Tax Rev., 5%, 8/15/2035 | 120,000 | 120,796 | ||
| Irving, TX, Hotel Occupancy Tax Rev., 5%, 8/15/2037 | 170,000 | 166,338 | ||
| Irving, TX, Hotel Occupancy Tax Rev., 5%, 8/15/2038 | 190,000 | 182,993 | ||
| Irving, TX, Hotel Occupancy Tax Rev., 5%, 8/15/2043 | 345,000 | 319,952 | ||
| Kaufman Country, TX, Fresh Water Supply District No. 4A, BAM, 4.5%, 9/01/2042 | 1,960,000 | 1,841,408 | ||
| Kaufman Country, TX, Fresh Water Supply District No. 4A, BAM, 4.5%, 9/01/2042 | 1,370,000 | 1,282,328 | ||
| Kaufman Country, TX, Fresh Water Supply District No. 4A, BAM, 4.625%, 9/01/2048 | 2,580,000 | 2,360,168 | ||
| Kaufman Country, TX, Fresh Water Supply District No. 4A, BAM, 4.625%, 9/01/2048 | 1,810,000 | 1,662,849 | ||
| Mission, TX, Economic Development Corp., Solid Waste Disposal Rev. (Waste Management, Inc. Project), 4.25%, 6/01/2048 (Put Date 6/03/2024) | 3,110,000 | 3,101,522 | ||
| Montgomery County, TX, Municipal Utility District No. 139, AGM, 4.125%, 4/01/2045 | 1,035,000 | 888,841 | ||
| Montgomery County, TX, Municipal Utility District No. 139, AGM, 4.125%, 4/01/2047 | 1,145,000 | 965,296 | ||
| New Hope, TX, Cultural Education Facilities Finance Corp., Capital Improvement Rev. (CHF - Collegiate Housing Denton LLC - Texas Woman's University Housing Project), “A-1”, AGM, 5%, 7/01/2038 | 390,000 | 389,109 | ||
| New Hope, TX, Cultural Education Facilities Finance Corp., Capital Improvement Rev. (CHF - Collegiate Housing Denton LLC - Texas Woman's University Housing Project), “A-1”, AGM, 5%, 7/01/2058 | 1,400,000 | 1,300,800 | ||
| New Hope, TX, Cultural Education Facilities Finance Corp., Retirement Facility Rev. (Morningside Ministries Project), 4%, 1/01/2032 | 420,000 | 349,487 | ||
98
Portfolio of Investments (unaudited)
– continued
| Issuer | Shares/Par | Value ($) | ||
| Municipal Bonds - continued | ||||
| Texas - continued | ||||
| New Hope, TX, Cultural Education Facilities Finance Corp., Retirement Facility Rev. (Morningside Ministries Project), 4%, 1/01/2037 | $ | 570,000 | $430,811 | |
| New Hope, TX, Cultural Education Facilities Finance Corp., Retirement Facility Rev. (Morningside Ministries Project), 4%, 1/01/2042 | 900,000 | 629,198 | ||
| New Hope, TX, Cultural Education Facilities Finance Corp., Retirement Facility Rev. (Morningside Ministries Project), 4%, 1/01/2047 | 1,475,000 | 966,716 | ||
| New Hope, TX, Cultural Education Facilities Finance Corp., Retirement Facility Rev. (Morningside Ministries Project), 4.25%, 1/01/2057 | 3,155,000 | 1,955,403 | ||
| New Hope, TX, Cultural Education Facilities Finance Corp., Retirement Facility Rev. (Morningside Ministries Project), 5%, 1/01/2057 | 2,100,000 | 1,527,355 | ||
| New Hope, TX, Cultural Education Facilities Finance Corp., Student Housing Rev. (CHF - Collegiate Housing Stephenville III LLC - Tarleton State University Project), 5%, 4/01/2030 (Prerefunded 4/01/2025) | 280,000 | 284,062 | ||
| New Hope, TX, Cultural Education Facilities Finance Corp., Student Housing Rev. (CHF - Collegiate Housing Stephenville III LLC - Tarleton State University Project), 5%, 4/01/2035 (Prerefunded 4/01/2025) | 280,000 | 284,062 | ||
| New Hope, TX, Cultural Education Facilities Finance Corp., Student Housing Rev. (CHF - Collegiate Housing Stephenville III LLC - Tarleton State University Project), 5%, 4/01/2047 (Prerefunded 4/01/2025) | 705,000 | 715,227 | ||
| Newark, TX, Higher Education Finance Corp. Rev. (Austin Achieve Public Schools, Inc.), “A”, PSF, 4%, 6/15/2052 | 1,375,000 | 1,147,397 | ||
| Peaster, TX, Independent School District, Unlimited Tax School Building Bonds, PSF, 3%, 8/15/2051 | 2,645,000 | 1,742,139 | ||
| Pflugerville, TX, Combination Tax & Limited Rev., 4%, 8/01/2049 | 3,185,000 | 2,716,096 | ||
| Port Arthur, TX, Tax and Rev., BAM, 4%, 2/15/2035 | 495,000 | 481,094 | ||
| Port Arthur, TX, Tax and Rev., BAM, 4%, 2/15/2037 | 630,000 | 588,141 | ||
| Port Arthur, TX, Tax and Rev., BAM, 4%, 2/15/2038 | 315,000 | 287,603 | ||
| Port Arthur, TX, Tax and Rev., BAM, 4%, 2/15/2039 | 240,000 | 217,139 | ||
| Port Arthur, TX, Tax and Rev., BAM, 4%, 2/15/2040 | 280,000 | 250,240 | ||
| Port Arthur, TX, Tax and Rev., BAM, 4%, 2/15/2041 | 280,000 | 246,018 | ||
| Port Beaumont, TX, Industrial Development Authority Facility Rev., Taxable (Jefferson Gulf Coast Energy Project), “B”, 4.1%, 1/01/2028 (n) | 14,750,000 | 11,663,517 | ||
| Port Beaumont, TX, Navigation District, Dock & Wharf Facility Rev. (Jefferson Gulf Coast Energy Project), “A”, 3.625%, 1/01/2035 (n) | 2,515,000 | 1,944,278 | ||
99
Portfolio of Investments (unaudited)
– continued
| Issuer | Shares/Par | Value ($) | ||
| Municipal Bonds - continued | ||||
| Texas - continued | ||||
| Port Beaumont, TX, Navigation District, Dock & Wharf Facility Rev. (Jefferson Gulf Coast Energy Project), “A”, 3%, 1/01/2050 (n) | $ | 1,540,000 | $843,995 | |
| Port Beaumont, TX, Navigation District, Dock & Wharf Facility Rev. (Jefferson Gulf Coast Energy Project), “A”, 4%, 1/01/2050 (n) | 1,980,000 | 1,328,894 | ||
| Port Beaumont, TX, Navigation District, Dock & Wharf Facility Rev. Taxable (Jefferson Gulf Coast Energy Project), “A”, 6%, 1/01/2025 (n) | 7,415,000 | 6,975,015 | ||
| Red River, TX, Education Finance Corp., Higher Education Rev. (Houston Baptist University Project), 5.5%, 10/01/2046 | 3,445,000 | 3,388,198 | ||
| San Antonio, TX, Electric & Gas Systems Rev., 5%, 2/01/2031 | 4,720,000 | 4,833,039 | ||
| San Antonio, TX, Passenger Facility Charge and Subordinate Lien Airport System Rev., “A”, 5%, 7/01/2031 | 295,000 | 303,296 | ||
| San Antonio, TX, Water System Junior Lien Rev., “A”, 5.25%, 5/15/2052 | 15,000,000 | 15,494,523 | ||
| Shallowater, TX, Independent School District, Unlimited Tax School Building, PSF, 5.25%, 2/15/2048 | 1,500,000 | 1,570,206 | ||
| Shallowater, TX, Independent School District, Unlimited Tax School Building, PSF, 5.25%, 2/15/2053 | 2,800,000 | 2,907,206 | ||
| Sweetwater, TX, Independent School District, Unlimited Tax School Building, PSF, 4%, 2/15/2053 | 5,000,000 | 4,316,202 | ||
| Tarrant County, TX, Cultural Education Facilities Finance Corp. (Christus Health), “A”, 4%, 7/01/2053 | 9,115,000 | 7,333,977 | ||
| Tarrant County, TX, Cultural Education Facilities Finance Corp., Hospital Rev. (Baylor Scott & White Health Project), “D”, 5%, 11/15/2051 | 6,025,000 | 5,937,998 | ||
| Tarrant County, TX, Cultural Education Facilities Finance Corp., Retirement Facility Rev. (Barton Creek Senior Living Center, Inc., Querencia Project), 5%, 11/15/2030 | 915,000 | 883,601 | ||
| Tarrant County, TX, Cultural Education Facilities Finance Corp., Retirement Facility Rev. (Barton Creek Senior Living Center, Inc., Querencia Project), 5%, 11/15/2035 | 1,090,000 | 1,009,413 | ||
| Tarrant County, TX, Cultural Education Facilities Finance Corp., Retirement Facility Rev. (Stayton at Museum Way), 5.75%, 12/01/2054 (a)(d) | 7,357,772 | 4,782,552 | ||
| Tarrant County, TX, Cultural Education Facilities Finance Corp., Retirement Facility Rev. (Trinity Terrace Project), “A-1”, 5%, 10/01/2044 | 2,535,000 | 2,281,033 | ||
| Tarrant County, TX, Hospital District, 4.25%, 8/15/2053 | 4,340,000 | 3,865,211 | ||
| Temple, TX, Reinvestment Zone 1 Rev., “A”, BAM, 4%, 8/01/2033 | 160,000 | 157,818 | ||
| Temple, TX, Reinvestment Zone 1 Rev., “A”, BAM, 4%, 8/01/2034 | 200,000 | 197,624 | ||
| Temple, TX, Reinvestment Zone 1 Rev., “A”, BAM, 4%, 8/01/2037 | 160,000 | 149,488 | ||
| Temple, TX, Reinvestment Zone 1 Rev., “A”, BAM, 4%, 8/01/2038 | 135,000 | 121,934 | ||
| Temple, TX, Reinvestment Zone 1 Rev., “A”, BAM, 4%, 8/01/2041 | 160,000 | 141,579 | ||
100
Portfolio of Investments (unaudited)
– continued
| Issuer | Shares/Par | Value ($) | ||
| Municipal Bonds - continued | ||||
| Texas - continued | ||||
| Texas Cedar Port Navigation & Improvement District, Unlimited Tax, 4.5%, 8/31/2048 | $ | 4,980,000 | $4,495,269 | |
| Texas Cedar Port Navigation & Improvement District, Unlimited Tax, 4.5%, 8/31/2052 | 2,010,000 | 1,790,783 | ||
| Texas Department of Housing & Community Affairs, Residential Mortgage Rev., “A”, 4.75%, 1/01/2049 (u) | 8,195,000 | 8,146,924 | ||
| Texas Department of Housing & Community Affairs, Residential Mortgage Rev., “A”, GNMA, 3.5%, 7/01/2052 | 5,745,000 | 5,458,634 | ||
| Texas Department of Housing & Community Affairs, Single Family Mortgage Rev., “A”, 4.75%, 3/01/2049 (u) | 1,895,000 | 1,883,834 | ||
| Texas Department of Housing & Community Affairs, Single Family Mortgage Rev., “A”, 5.5%, 9/01/2052 | 4,635,000 | 4,762,362 | ||
| Texas Department of Housing & Community Affairs, Single Family Mortgage Rev., “A”, GNMA, 5.125%, 9/01/2048 | 2,000,000 | 1,998,183 | ||
| Texas Department of Housing & Community Affairs, Single Family Mortgage Rev., “A”, GNMA, 3%, 3/01/2052 | 10,125,000 | 9,474,225 | ||
| Texas Highway 380 Municipal Management District No. 1, Unlimited Tax Road, AGM, 4%, 5/01/2048 | 6,740,000 | 5,466,139 | ||
| Texas Municipal Gas Acquisition and Supply Corp. III, Gas Supply Rev., 5%, 12/15/2030 | 785,000 | 776,655 | ||
| Texas Municipal Gas Acquisition and Supply Corp. III, Gas Supply Rev., 5%, 12/15/2031 | 2,245,000 | 2,210,821 | ||
| Texas Private Activity Surface Transportation Corp., Senior Lien Rev. (NTE Mobility Partners Segments 3 LLC Segment 3C Project), 5%, 6/30/2058 | 6,230,000 | 5,934,139 | ||
| Texas Private Activity Surface Transportation Corp., Senior Lien Rev. (NTE Mobility Partners Segments 3 LLC Segments 3A & 3B Facility), 7%, 12/31/2038 | 1,180,000 | 1,182,242 | ||
| Texas Private Activity Surface Transportation Corp., Senior Lien Rev. (NTE Mobility Partners Segments 3 LLC Segments 3A & 3B Facility), 6.75%, 6/30/2043 | 940,000 | 941,505 | ||
| Texas Public Finance Authority Rev. (Texas Southern University), BAM, 5%, 5/01/2028 | 790,000 | 805,435 | ||
| Texas Public Finance Authority Rev. (Texas Southern University), BAM, 5.25%, 5/01/2037 | 270,000 | 280,498 | ||
| Texas Public Finance Authority Rev. (Texas Southern University), BAM, 5.25%, 5/01/2038 | 500,000 | 514,677 | ||
| Texas Public Finance Authority Rev. (Texas Southern University), BAM, 5.25%, 5/01/2039 | 600,000 | 615,916 | ||
| Texas Public Finance Authority Rev. (Texas Southern University), BAM, 5.25%, 5/01/2040 | 500,000 | 511,986 | ||
| Texas Public Finance Authority Rev. (Texas Southern University), BAM, 5.25%, 5/01/2041 | 500,000 | 510,068 | ||
101
Portfolio of Investments (unaudited)
– continued
| Issuer | Shares/Par | Value ($) | ||
| Municipal Bonds - continued | ||||
| Texas - continued | ||||
| Texas Public Finance Authority Rev. (Texas Southern University), BAM, 5.25%, 5/01/2042 | $ | 500,000 | $508,505 | |
| Texas Rockwall Independent School District, Unlimited Tax School Building, PSF, 4%, 2/15/2053 | 2,280,000 | 1,977,232 | ||
| Texas State Affordable Housing Corp. Single Family Mortgage Rev., “A”, GNMA, 5.5%, 9/01/2053 | 3,935,000 | 4,035,566 | ||
| Texas State Technical College System Rev., Financing System Improvement, “A”, AGM, 5.5%, 8/01/2042 | 1,500,000 | 1,590,004 | ||
| Texas State Technical College System Rev., Financing System Improvement, “A”, AGM, 5.75%, 8/01/2047 | 2,145,000 | 2,284,049 | ||
| Texas State Technical College System Rev., Financing System Improvement, “A”, AGM, 6%, 8/01/2054 | 2,065,000 | 2,232,731 | ||
| Texas Transportation Commission, State Highway 249 System Rev., “A”, 5%, 8/01/2057 | 3,225,000 | 2,938,675 | ||
| Texas Transportation Commission, State Highway 249 System Rev., Capital Appreciation, “A”, 0%, 8/01/2037 | 360,000 | 169,687 | ||
| Texas Transportation Commission, State Highway 249 System Rev., Capital Appreciation, “A”, 0%, 8/01/2038 | 265,000 | 116,460 | ||
| Texas Transportation Commission, State Highway 249 System Rev., Capital Appreciation, “A”, 0%, 8/01/2039 | 295,000 | 121,586 | ||
| Texas Transportation Commission, State Highway 249 System Rev., Capital Appreciation, “A”, 0%, 8/01/2040 | 295,000 | 113,967 | ||
| Texas Transportation Commission, State Highway 249 System Rev., Capital Appreciation, “A”, 0%, 8/01/2041 | 590,000 | 213,546 | ||
| Texas Transportation Commission, State Highway 249 System Rev., Capital Appreciation, “A”, 0%, 8/01/2042 | 810,000 | 273,354 | ||
| Texas Transportation Commission, State Highway 249 System Rev., Capital Appreciation, “A”, 0%, 8/01/2043 | 665,000 | 210,346 | ||
| Texas Water Development Boards State Water Implementation Rev., “A”, 4%, 4/15/2048 | 3,995,000 | 3,556,517 | ||
| White Settlement, TX, Independent School District, Unlimited Tax School Building Bonds, PSF, 4%, 8/15/2052 | 2,015,000 | 1,728,312 | ||
| $328,389,692 | ||||
| U.S. Virgin Islands - 0.0% | ||||
| Matching Fund Special Purpose Securitization Corp., “A”, 5%, 10/01/2025 | $ | 285,000 | $286,698 | |
| Matching Fund Special Purpose Securitization Corp., “A”, 5%, 10/01/2026 | 1,365,000 | 1,370,204 | ||
| $1,656,902 | ||||
102
Portfolio of Investments (unaudited)
– continued
| Issuer | Shares/Par | Value ($) | ||
| Municipal Bonds - continued | ||||
| Utah - 0.6% | ||||
| Salt Lake City, UT, Airport Rev. (Salty Lake City International Airport), “A”, 5.5%, 7/01/2053 | $ | 9,000,000 | $9,289,381 | |
| Utah Charter School Finance Authority, Charter School Rev. (Summit Academy, Inc.), “A”, 5%, 4/15/2049 | 1,450,000 | 1,380,091 | ||
| Utah Charter School Finance Authority, Charter School Rev. (Syracuse Arts Academy Project), 5%, 4/15/2037 | 790,000 | 792,517 | ||
| Utah Charter School Finance Authority, Charter School Rev. (Syracuse Arts Academy Project), 5%, 4/15/2042 | 2,750,000 | 2,677,522 | ||
| Utah County, UT, Hospital Rev. (IHC Health Services, Inc.), “A”, 5%, 5/15/2043 | 3,935,000 | 4,001,191 | ||
| Utah Housing Corp., Tax Exempt Mortgage-Backed Securities, “G”, GNMA, 4.5%, 7/21/2049 | 543,691 | 506,584 | ||
| Utah Housing Corp., Tax Exempt Mortgage-Backed Securities, “H”, GNMA, 4.5%, 8/21/2049 | 340,181 | 314,764 | ||
| Utah Housing Corp., Tax Exempt Mortgage-Backed Securities, “I”, GNMA, 4%, 9/21/2049 | 549,847 | 486,350 | ||
| Utah Housing Corp., Tax Exempt Mortgage-Backed Securities, “I”, GNMA, 2.5%, 8/21/2051 | 2,707,481 | 2,115,922 | ||
| Utah Housing Corp., Tax Exempt Mortgage-Backed Securities, “J”, GNMA, 2.5%, 9/21/2051 | 10,392,604 | 8,392,236 | ||
| Utah Housing Corp., Tax-Exempt Mortgage-Backed Securities, “G”, GNMA, 3.5%, 2/21/2050 | 802,320 | 682,407 | ||
| $30,638,965 | ||||
| Vermont - 0.5% | ||||
| Vermont Economic Development Authority, Solid Waste Disposal Rev. (Casella Waste Systems, Inc.), 4.625%, 4/01/2036 (Put Date 4/03/2028) (n) | $ | 815,000 | $795,455 | |
| Vermont Housing Finance Agency, Multi-Purpose Rev., “A”, GNMA, 6%, 11/01/2053 | 2,685,000 | 2,832,439 | ||
| Vermont Student Assistance Corp., Education Loan Rev., “A”, 3.625%, 6/15/2029 | 165,000 | 162,856 | ||
| Vermont Student Assistance Corp., Education Loan Rev., “A”, 5%, 6/15/2029 | 395,000 | 401,210 | ||
| Vermont Student Assistance Corp., Education Loan Rev., “A”, 3.75%, 6/15/2030 | 170,000 | 167,820 | ||
| Vermont Student Assistance Corp., Education Loan Rev., “A”, 5%, 6/15/2031 | 445,000 | 450,968 | ||
| Vermont Student Assistance Corp., Education Loan Rev., “A”, 4%, 6/15/2033 | 165,000 | 162,997 | ||
| Vermont Student Assistance Corp., Education Loan Rev., “A”, 4%, 6/15/2034 | 170,000 | 167,948 | ||
103
Portfolio of Investments (unaudited)
– continued
| Issuer | Shares/Par | Value ($) | ||
| Municipal Bonds - continued | ||||
| Vermont - continued | ||||
| Vermont Student Assistance Corp., Education Loan Rev., “A”, 3%, 6/15/2035 | $ | 4,275,000 | $3,751,868 | |
| Vermont Student Assistance Corp., Education Loan Rev., “A”, 3.375%, 6/15/2036 | 3,700,000 | 3,417,921 | ||
| Vermont Student Assistance Corp., Education Loan Rev., “A”, 2.375%, 6/15/2039 | 715,000 | 640,166 | ||
| Vermont Student Assistance Corp., Education Loan Rev., “A”, 4.375%, 6/15/2040 | 1,260,000 | 1,160,395 | ||
| Vermont Student Assistance Corp., Education Loan Rev., “A”, 4%, 6/15/2041 | 7,000,000 | 6,235,942 | ||
| Vermont Student Assistance Corp., Education Loan Rev., “B”, 4.375%, 6/15/2046 | 605,000 | 496,334 | ||
| Vermont Student Assistance Corp., Education Loan Rev., “B”, 4%, 6/15/2047 | 995,000 | 762,441 | ||
| $21,606,760 | ||||
| Virginia - 2.2% | ||||
| Albemarle County, VA, Economic Development Authority, Hospital Facilities Rev. (Sentara Martha Jefferson Hospital), “A”, VRDN, 3.12%, 9/30/2048 | $ | 24,705,000 | $24,705,000 | |
| Charles City County, VA, Industrial Development Authority, Solid Waste Disposal Rev. (Waste Management, Inc. Project), 1.45%, 4/01/2027 | 320,000 | 285,316 | ||
| Charles City County, VA, Industrial Development Authority, Solid Waste Disposal Rev. (Waste Management, Inc. Project), “A”, 3.95%, 8/01/2027 (Put Date 5/01/2024) | 975,000 | 971,014 | ||
| Commonwealth of Virginia, University Health System General Rev., “A”, 4%, 7/01/2040 | 10,345,000 | 9,384,255 | ||
| Fairfax County, VA, Redevelopment and Housing Authority Rev. (Wedgewood Affordable Housing Acquisition), 5%, 10/01/2035 | 3,075,000 | 3,200,911 | ||
| Gloucester County, VA, Industrial Development Authority Rev. (Waste Management Disposal Services of Virginia, Inc.), “A”, 3.95%, 9/01/2038 (Put Date 5/01/2024) | 815,000 | 812,402 | ||
| Henrico County, VA, Economic Development Authority Rev., Residential Care Facility (Westminster-Canterbury of Richmond), “A”, 5%, 10/01/2052 | 1,715,000 | 1,587,476 | ||
| Henrico County, VA, Industrial Development Authority Rev. (Bon Secours Health Systems Project), RIBS, “B”, ETM, AGM, 3.865%, 8/23/2027 | 50,000 | 50,000 | ||
| Henrico County, VA, Industrial Development Authority Rev. (Bon Secours Health Systems, Inc.), RIBS, ETM, AGM, 7.655%, 8/23/2027 (p) | 2,100,000 | 2,288,960 | ||
104
Portfolio of Investments (unaudited)
– continued
| Issuer | Shares/Par | Value ($) | ||
| Municipal Bonds - continued | ||||
| Virginia - continued | ||||
| Louisa, VA, Industrial Development Authority, Pollution Control Refunding Rev. (Virginia Electric and Power Co. Project), “B”, 0.75%, 11/01/2035 (Put Date 9/02/2025) | $ | 3,275,000 | $2,991,091 | |
| Lynchburg, VA, Economic Development Authority Hospital Refunding Rev. (Centra Health Obligated Group), 4%, 1/01/2055 | 4,080,000 | 3,334,844 | ||
| Norfolk, VA, Economic Development Authority Hospital Facilities Refunding Rev. (Sentara Healthcare), “B”, 4%, 11/01/2048 | 10,590,000 | 9,313,835 | ||
| Peninsula Town Center Community Development Authority, VA, Special Obligation Refunding, 4.5%, 9/01/2028 (n) | 145,000 | 140,599 | ||
| Peninsula Town Center Community Development Authority, VA, Special Obligation Refunding, 5%, 9/01/2037 (n) | 270,000 | 252,000 | ||
| Peninsula Town Center Community Development Authority, VA, Special Obligation Refunding, 4.5%, 9/01/2045 (n) | 775,000 | 640,841 | ||
| Peninsula Town Center Community Development Authority, VA, Special Obligation Refunding, 5%, 9/01/2045 (n) | 1,195,000 | 1,046,348 | ||
| Sussex County, VA, Industrial Development Authority Solid Waste Disposal Rev. (Atlantic Waste Disposal, Inc. Project), “A”, 3.95%, 6/01/2028 (Put Date 5/01/2024) | 1,300,000 | 1,294,686 | ||
| Virginia College Building Authority, Educational Facilities Rev. (Marymount University Project), “B”, 5.25%, 7/01/2030 (n) | 630,000 | 629,239 | ||
| Virginia College Building Authority, Educational Facilities Rev. (Marymount University Project), “B”, 5.25%, 7/01/2035 (n) | 565,000 | 551,893 | ||
| Virginia College Building Authority, Educational Facilities Rev. (Regent University Project), 5%, 6/01/2027 | 295,000 | 297,913 | ||
| Virginia College Building Authority, Educational Facilities Rev. (Regent University Project), 5%, 6/01/2028 | 315,000 | 319,384 | ||
| Virginia College Building Authority, Educational Facilities Rev. (Regent University Project), 5%, 6/01/2029 | 315,000 | 320,088 | ||
| Virginia Housing Development Authority, Rental Housing, “D”, 4.875%, 8/01/2065 | 22,080,000 | 20,174,699 | ||
| Virginia Small Business Financing Authority Rev. (Hampton University), 5.25%, 10/01/2029 | 495,000 | 498,436 | ||
| Virginia Small Business Financing Authority Rev., Solid Waste Disposal (Covanta Project), 5%, 1/01/2048 (Put Date 7/01/2038) (n) | 185,000 | 164,386 | ||
| Williamsburg, VA, Economic Development Authority Dining Lease Rev. (Provident Group - Williamsburg Properties LLC - William & Mary Project), “A”, AGM, 5.25%, 7/01/2053 | 810,000 | 842,745 | ||
| Williamsburg, VA, Economic Development Authority Dining Lease Rev. (Provident Group - Williamsburg Properties LLC - William & Mary Project), “A”, AGM, 4.125%, 7/01/2058 | 4,195,000 | 3,599,053 | ||
105
Portfolio of Investments (unaudited)
– continued
| Issuer | Shares/Par | Value ($) | ||
| Municipal Bonds - continued | ||||
| Virginia - continued | ||||
| Williamsburg, VA, Economic Development Authority Dining Lease Rev. (Provident Group - Williamsburg Properties LLC - William & Mary Project), “A”, AGM, 4.375%, 7/01/2063 | $ | 11,360,000 | $10,109,290 | |
| Williamsburg, VA, Economic Development Authority Dining Lease Rev. (Provident Group - Williamsburg Properties LLC - William & Mary Project), “B”, AGM, 4.25%, 7/01/2058 | 925,000 | 800,088 | ||
| Williamsburg, VA, Economic Development Authority Dining Lease Rev. (Provident Group - Williamsburg Properties LLC - William & Mary Project), “B”, AGM, 4.375%, 7/01/2063 | 4,050,000 | 3,560,160 | ||
| $104,166,952 | ||||
| Washington - 2.1% | ||||
| Central Puget Sound, WA, Regional Transit Authority Sales Tax & Motor Vehicle Excise Tax Rev., “S-1”, 5%, 11/01/2041 | $ | 10,225,000 | $10,362,405 | |
| Everett, WA, Housing Authority Refunding Rev. (Huntington Park Apartments Project), 4%, 7/01/2037 | 10,030,000 | 8,787,812 | ||
| Grays Harbor County, WA, Public Hospital District No. 2, Limited Tax General Obligation Refunding, 5%, 12/15/2033 | 1,485,000 | 1,504,532 | ||
| Grays Harbor County, WA, Public Hospital District No. 2, Limited Tax General Obligation Refunding, 5%, 12/15/2038 | 1,900,000 | 1,869,584 | ||
| Grays Harbor County, WA, Public Hospital District No. 2, Limited Tax General Obligation Refunding, 5%, 12/15/2048 | 3,645,000 | 3,467,930 | ||
| Seattle, WA, Housing Authority Rev. (Northgate Plaza Project), 1%, 6/01/2026 | 4,220,000 | 3,814,945 | ||
| Seattle, WA, Port Intermediate Lien Refunding Rev., “B”, 4%, 8/01/2047 | 1,185,000 | 993,716 | ||
| Seattle, WA, Port Intermediate Lien Rev., 5%, 4/01/2038 | 7,865,000 | 7,978,148 | ||
| Seattle, WA, Port Intermediate Lien Rev., “C”, 5%, 8/01/2026 | 3,165,000 | 3,217,150 | ||
| Seattle, WA, Port Rev., 4%, 4/01/2044 | 1,260,000 | 1,084,226 | ||
| Washington Health Care Facilities Authority Rev. (Seattle Cancer Care Alliance), 5%, 9/01/2045 | 4,045,000 | 4,032,058 | ||
| Washington Health Care Facilities Authority Rev. (Seattle Cancer Care Alliance), 5%, 9/01/2050 | 1,970,000 | 1,952,435 | ||
| Washington Health Care Facilities Authority Rev. (Seattle Cancer Care Alliance), 5%, 9/01/2055 | 5,005,000 | 4,921,271 | ||
| Washington Health Care Facilities Authority Rev. (Virginia Mason Medical Center), 5%, 8/15/2027 | 395,000 | 401,135 | ||
| Washington Health Care Facilities Authority Rev. (Virginia Mason Medical Center), 5%, 8/15/2034 | 1,080,000 | 1,076,247 | ||
| Washington Health Care Facilities Authority Rev. (Virginia Mason Medical Center), 5%, 8/15/2035 | 395,000 | 389,849 | ||
| Washington Health Care Facilities Authority Rev. (Virginia Mason Medical Center), 5%, 8/15/2037 | 1,345,000 | 1,264,809 | ||
106
Portfolio of Investments (unaudited)
– continued
| Issuer | Shares/Par | Value ($) | ||
| Municipal Bonds - continued | ||||
| Washington - continued | ||||
| Washington Health Care Facilities Authority Rev. (Virginia Mason Medical Center), 4%, 8/15/2042 | $ | 5,100,000 | $4,073,409 | |
| Washington Higher Education Facilities Authority Refunding Rev., (Gonzaga University Project), 4%, 4/01/2041 | 2,380,000 | 2,059,477 | ||
| Washington Motor Vehicle Fuel Tax, “E”, 5%, 2/01/2037 | 9,440,000 | 9,459,548 | ||
| Washington Motor Vehicle Fuel Tax, “E”, 5%, 2/01/2039 | 6,280,000 | 6,290,339 | ||
| Washington State Housing Finance Commission Municipal Certificates, “A”, 3.5%, 12/20/2035 | 16,012,517 | 13,835,432 | ||
| Washington State Housing Finance Commission, Non-Profit Housing Rev. (Emerald Heights Project), “A”, 5%, 7/01/2043 | 1,045,000 | 1,019,310 | ||
| Washington State Housing Finance Commission, Non-Profit Housing Rev. (Emerald Heights Project), “A”, 5%, 7/01/2048 | 920,000 | 873,617 | ||
| Washington State Housing Finance Commission, Single Family Rev., “1N”, GNMA, 3%, 12/01/2049 | 4,925,000 | 4,651,238 | ||
| $99,380,622 | ||||
| West Virginia - 0.4% | ||||
| Monongalia County, WV, Commission Special District Excise Tax Refunding & Improvement Rev. (University Town Centre Economic Opportunity Development District), “A”, 4.125%, 6/01/2043 (n) | $ | 1,040,000 | $878,279 | |
| Monongalia County, WV, Special District Excise Tax Rev. (University Town Centre Economic Opportunity Development District), “B”, 4.875%, 6/01/2043 (n) | 2,280,000 | 2,083,443 | ||
| West Virginia Economic Development Authority, Solid Waste Disposal Facilities Refunding Rev. (Wheeling Power Co. - Mitchell Project), “A”, 3%, 6/01/2037 (Put Date 6/18/2027) | 3,610,000 | 3,318,920 | ||
| West Virginia Economic Development Authority, Solid Waste Disposal Facilities Rev. (Appalachian Power Company - Amos Project), “A”, 0.625%, 12/01/2038 (Put Date 12/15/2025) | 2,625,000 | 2,373,773 | ||
| West Virginia Economic Development Authority, Solid Waste Disposal Facilities Rev. (Appalachian Power Company - Amos Project), “A”, 1%, 1/01/2041 (Put Date 9/01/2025) | 2,470,000 | 2,280,634 | ||
| West Virginia Hospital Finance Authority Hospital Rev. (Charleston Area Medical Center, Inc.), “A”, 5%, 8/31/2038 | 665,000 | 638,461 | ||
| West Virginia Hospital Finance Authority Hospital Rev. (Charleston Area Medical Center, Inc.), “A”, 5%, 8/31/2039 | 200,000 | 189,494 | ||
| West Virginia Hospital Finance Authority Hospital Rev. (West Virginia University Health System Obligated Group), “A”, AGM, 4%, 6/01/2051 | 5,505,000 | 4,633,106 | ||
| West Virginia Housing Development Fund, “A”, FHA, 3.45%, 11/01/2033 | 505,000 | 469,753 | ||
| West Virginia Housing Development Fund, “A”, FHA, 3.75%, 11/01/2038 | 480,000 | 423,498 | ||
107
Portfolio of Investments (unaudited)
– continued
| Issuer | Shares/Par | Value ($) | ||
| Municipal Bonds - continued | ||||
| West Virginia - continued | ||||
| West Virginia Water Development Authority Rev. (Loan Program II), “A-II”, 5%, 11/01/2033 | $ | 535,000 | $548,212 | |
| $17,837,573 | ||||
| Wisconsin - 3.6% | ||||
| University of Wisconsin Hospitals and Clinics Authority Rev. (Green Bonds), “B”, 4%, 4/01/2051 | $ | 10,905,000 | $9,087,488 | |
| Wisconsin Center District Junior Dedicated Tax Rev., Capital Appreciation, “D”, AGM, 0%, 12/15/2032 | 515,000 | 342,557 | ||
| Wisconsin Center District Junior Dedicated Tax Rev., Capital Appreciation, “D”, AGM, 0%, 12/15/2033 | 785,000 | 496,582 | ||
| Wisconsin Center District Junior Dedicated Tax Rev., Capital Appreciation, “D”, AGM, 0%, 12/15/2034 | 750,000 | 449,922 | ||
| Wisconsin Center District Junior Dedicated Tax Rev., Capital Appreciation, “D”, AGM, 0%, 12/15/2035 | 1,120,000 | 634,031 | ||
| Wisconsin Center District Junior Dedicated Tax Rev., Capital Appreciation, “D”, AGM, 0%, 12/15/2036 | 1,150,000 | 613,436 | ||
| Wisconsin Center District Junior Dedicated Tax Rev., Capital Appreciation, “D”, AGM, 0%, 12/15/2037 | 1,865,000 | 936,253 | ||
| Wisconsin Center District Junior Dedicated Tax Rev., Capital Appreciation, “D”, AGM, 0%, 12/15/2038 | 2,025,000 | 959,830 | ||
| Wisconsin Center District Junior Dedicated Tax Rev., Capital Appreciation, “D”, AGM, 0%, 12/15/2039 | 2,200,000 | 983,943 | ||
| Wisconsin Center District Junior Dedicated Tax Rev., Capital Appreciation, “D”, AGM, 0%, 12/15/2040 | 950,000 | 400,700 | ||
| Wisconsin Center District Senior Dedicated Tax Rev., Capital Appreciation, “C”, AGM, 0%, 12/15/2031 | 390,000 | 272,296 | ||
| Wisconsin Center District Senior Dedicated Tax Rev., Capital Appreciation, “C”, AGM, 0%, 12/15/2032 | 525,000 | 349,209 | ||
| Wisconsin Center District Senior Dedicated Tax Rev., Capital Appreciation, “C”, AGM, 0%, 12/15/2033 | 505,000 | 319,457 | ||
| Wisconsin Center District Senior Dedicated Tax Rev., Capital Appreciation, “C”, AGM, 0%, 12/15/2034 | 470,000 | 281,951 | ||
| Wisconsin Center District Senior Dedicated Tax Rev., Capital Appreciation, “C”, AGM, 0%, 12/15/2035 | 600,000 | 339,660 | ||
| Wisconsin Center District Senior Dedicated Tax Rev., Capital Appreciation, “C”, AGM, 0%, 12/15/2036 | 580,000 | 309,385 | ||
| Wisconsin Center District Senior Dedicated Tax Rev., Capital Appreciation, “C”, AGM, 0%, 12/15/2037 | 585,000 | 293,677 | ||
| Wisconsin Center District Senior Dedicated Tax Rev., Capital Appreciation, “C”, AGM, 0%, 12/15/2038 | 600,000 | 284,394 | ||
| Wisconsin Center District Senior Dedicated Tax Rev., Capital Appreciation, “C”, AGM, 0%, 12/15/2039 | 560,000 | 250,458 | ||
108
Portfolio of Investments (unaudited)
– continued
| Issuer | Shares/Par | Value ($) | ||
| Municipal Bonds - continued | ||||
| Wisconsin - continued | ||||
| Wisconsin Center District Senior Dedicated Tax Rev., Capital Appreciation, “C”, AGM, 0%, 12/15/2040 | $ | 140,000 | $59,051 | |
| Wisconsin Health & Educational Facilities Authority Refunding Rev. (Froedtert Health, Inc. Obligated Group), “A”, 4%, 4/01/2040 | 17,300,000 | 15,331,758 | ||
| Wisconsin Health & Educational Facilities Authority Rev. (Bellin Memorial Hospital, Inc.), “A”, 5.5%, 12/01/2052 | 4,335,000 | 4,428,957 | ||
| Wisconsin Health & Educational Facilities Authority Rev. (Marshfield Clinic Health System, Inc.), “A”, AGM, 4%, 2/15/2036 | 945,000 | 878,272 | ||
| Wisconsin Health & Educational Facilities Authority Rev. (Marshfield Clinic Health System, Inc.), “A”, AGM, 4%, 2/15/2037 | 870,000 | 794,194 | ||
| Wisconsin Health & Educational Facilities Authority Rev. (Marshfield Clinic Health System, Inc.), “C”, 4%, 2/15/2042 | 2,315,000 | 1,880,980 | ||
| Wisconsin Health & Educational Facilities Authority Rev. (Marshfield Clinic Health System, Inc.), “C”, 5%, 2/15/2047 | 635,000 | 582,420 | ||
| Wisconsin Health & Educational Facilities Authority Rev. (Marshfield Clinic Health System, Inc.), “C”, 4%, 2/15/2050 | 2,260,000 | 1,662,522 | ||
| Wisconsin Health & Educational Facilities Authority Rev. (Milwaukee Science Education Consortium, Inc.), “A”, 4.75%, 3/15/2043 | 505,000 | 445,228 | ||
| Wisconsin Health & Educational Facilities Authority Rev. (Milwaukee Science Education Consortium, Inc.), “A”, 5%, 3/15/2053 | 510,000 | 440,107 | ||
| Wisconsin Health & Educational Facilities Authority Rev. (Oakwood Lutheran Senior Ministries), 4%, 1/01/2037 | 1,810,000 | 1,423,033 | ||
| Wisconsin Health & Educational Facilities Authority Rev. (Oakwood Lutheran Senior Ministries), 4%, 1/01/2047 | 2,230,000 | 1,515,462 | ||
| Wisconsin Health & Educational Facilities Authority Rev. (Oakwood Lutheran Senior Ministries), 4%, 1/01/2057 | 3,845,000 | 2,418,870 | ||
| Wisconsin Health & Educational Facilities Authority Rev. (St. Camillus Health System, Inc.), “A”, 5%, 11/01/2039 | 645,000 | 525,947 | ||
| Wisconsin Health & Educational Facilities Authority Rev. (St. Camillus Health System, Inc.), “A”, 5%, 11/01/2046 | 1,445,000 | 1,087,067 | ||
| Wisconsin Health & Educational Facilities Authority Rev. (St. Camillus Health System, Inc.), “A”, 5%, 11/01/2054 | 6,435,000 | 4,601,477 | ||
| Wisconsin Housing & Economic Development Authority Home Ownership, “D”, 4%, 3/01/2047 | 2,690,000 | 2,629,424 | ||
| Wisconsin Public Finance Authority Air Cargo Obligated Group Rev. (AFCO Airport Real Estate Group), 5.5%, 7/01/2036 | 1,000,000 | 1,020,732 | ||
| Wisconsin Public Finance Authority Air Cargo Obligated Group Rev. (AFCO Airport Real Estate Group), 5.5%, 7/01/2037 | 1,205,000 | 1,217,329 | ||
| Wisconsin Public Finance Authority Air Cargo Obligated Group Rev. (AFCO Airport Real Estate Group), 5.5%, 7/01/2039 | 250,000 | 249,217 | ||
109
Portfolio of Investments (unaudited)
– continued
| Issuer | Shares/Par | Value ($) | ||
| Municipal Bonds - continued | ||||
| Wisconsin - continued | ||||
| Wisconsin Public Finance Authority Air Cargo Obligated Group Rev. (AFCO Airport Real Estate Group), 5.5%, 7/01/2043 | $ | 1,000,000 | $974,046 | |
| Wisconsin Public Finance Authority Airport Facilities Rev. (Transportation Infrastructure Properties LLC), “B”, 5.25%, 7/01/2028 | 785,000 | 785,046 | ||
| Wisconsin Public Finance Authority Airport Facilities Rev. (Transportation Infrastructure Properties LLC), “B”, 5%, 7/01/2042 | 1,430,000 | 1,321,153 | ||
| Wisconsin Public Finance Authority Airport Facilities Rev. (Transportation Infrastructure Properties LLC), “C”, 5%, 7/01/2042 | 1,630,000 | 1,505,930 | ||
| Wisconsin Public Finance Authority Education Facilities Rev. (Piedmont Community Charter School), 5%, 6/15/2039 | 160,000 | 148,482 | ||
| Wisconsin Public Finance Authority Education Facilities Rev. (Piedmont Community Charter School), 5%, 6/15/2049 | 485,000 | 421,916 | ||
| Wisconsin Public Finance Authority Education Facilities Rev. (Piedmont Community Charter School), 5%, 6/15/2053 | 335,000 | 286,874 | ||
| Wisconsin Public Finance Authority Education Rev. (Pine Lake Preparatory), 4.95%, 3/01/2030 (n) | 95,000 | 93,283 | ||
| Wisconsin Public Finance Authority Education Rev. (Pine Lake Preparatory), 5.25%, 3/01/2035 (n) | 95,000 | 94,797 | ||
| Wisconsin Public Finance Authority Education Rev. (Triad Educational Services, Inc.), 5%, 6/15/2042 | 495,000 | 435,539 | ||
| Wisconsin Public Finance Authority Education Rev. (Triad Educational Services, Inc.), 5.25%, 6/15/2052 | 695,000 | 598,065 | ||
| Wisconsin Public Finance Authority Education Rev. (Triad Educational Services, Inc.), 5.375%, 6/15/2057 | 665,000 | 573,898 | ||
| Wisconsin Public Finance Authority Education Rev. (Triad Educational Services, Inc.), 5.5%, 6/15/2062 | 1,045,000 | 908,584 | ||
| Wisconsin Public Finance Authority Entrance Fee Principal Redemption Accredited Rev. (Searstone CCRC Project), “B2”, 2.25%, 6/01/2027 (n) | 1,755,000 | 1,611,310 | ||
| Wisconsin Public Finance Authority Entrance Fee Principal Redemption Accredited Rev., Taxable (Searstone CCRC Project), “C”, 2.75%, 6/01/2026 (n) | 935,000 | 909,026 | ||
| Wisconsin Public Finance Authority Healthcare Facility Rev. (Blue Ridge Healthcare), “A”, 4%, 1/01/2045 | 650,000 | 545,774 | ||
| Wisconsin Public Finance Authority Healthcare Facility Rev. (Church Home of Hartford, Inc. Project), “A”, 5%, 9/01/2025 (n) | 25,000 | 24,501 | ||
| Wisconsin Public Finance Authority Healthcare Facility Rev. (Church Home of Hartford, Inc. Project), “A”, 5%, 9/01/2030 (n) | 130,000 | 120,160 | ||
| Wisconsin Public Finance Authority Healthcare Facility Rev. (Church Home of Hartford, Inc. Project), “A”, 5%, 9/01/2038 (n) | 175,000 | 146,915 | ||
110
Portfolio of Investments (unaudited)
– continued
| Issuer | Shares/Par | Value ($) | ||
| Municipal Bonds - continued | ||||
| Wisconsin - continued | ||||
| Wisconsin Public Finance Authority Higher Education Facilities Rev. (Gannon University Project), 5%, 5/01/2042 | $ | 520,000 | $470,112 | |
| Wisconsin Public Finance Authority Higher Education Facilities Rev. (Gannon University Project), 5%, 5/01/2047 | 585,000 | 510,889 | ||
| Wisconsin Public Finance Authority Hospital Rev. (WakeMed), “A”, 4%, 10/01/2049 | 6,320,000 | 5,278,457 | ||
| Wisconsin Public Finance Authority Hotel & Conference Center Facilities Rev. (Foundation of the University of North Carolina at Charlotte, Inc.), “A”, 4%, 9/01/2036 (n) | 1,475,000 | 1,230,287 | ||
| Wisconsin Public Finance Authority Hotel & Conference Center Facilities Rev. (Foundation of the University of North Carolina at Charlotte, Inc.), “A”, 4%, 9/01/2041 (n) | 1,345,000 | 1,018,850 | ||
| Wisconsin Public Finance Authority Hotel & Conference Center Facilities Rev. (Foundation of the University of North Carolina at Charlotte, Inc.), “A”, 4%, 9/01/2051 (n) | 4,715,000 | 3,194,042 | ||
| Wisconsin Public Finance Authority Hotel & Conference Center Facilities Rev. (Foundation of the University of North Carolina at Charlotte, Inc.), “A”, 4%, 9/01/2056 (n) | 2,245,000 | 1,465,612 | ||
| Wisconsin Public Finance Authority Limited Obligation Grant Rev. (American Dream at Meadowlands Project), “A”, 6.25%, 8/01/2027 (a)(d)(n) | 10,340,000 | 7,897,175 | ||
| Wisconsin Public Finance Authority Limited Obligation Grant Rev., Taxable (American Dream at Meadowlands Project), ”A“, 5.625%, 8/01/2024 (a)(d)(n) | 4,090,000 | 3,123,738 | ||
| Wisconsin Public Finance Authority Limited Obligation PILOT Rev. (American Dream at Meadowlands Project), 6.5%, 12/01/2037 (n) | 190,000 | 168,463 | ||
| Wisconsin Public Finance Authority Limited Obligation PILOT Rev. (American Dream at Meadowlands Project), 7%, 12/01/2050 | 4,400,000 | 3,914,972 | ||
| Wisconsin Public Finance Authority Project Rev. (Eastern Michigan University Student Housing Project), “A-1”, 5.5%, 7/01/2052 | 5,510,000 | 5,755,591 | ||
| Wisconsin Public Finance Authority Project Rev. (Eastern Michigan University Student Housing Project), “A-1”, 5.625%, 7/01/2055 | 4,225,000 | 4,447,604 | ||
| Wisconsin Public Finance Authority Retirement Communities Rev. (Acts Retirement-Life Communities, Inc. Obligated Group), “A”, 5%, 11/15/2041 | 795,000 | 756,719 | ||
| Wisconsin Public Finance Authority Retirement Facilities First Mortgage Rev. (United Methodist Retirement Homes), “A”, 4%, 10/01/2041 | 190,000 | 153,759 | ||
| Wisconsin Public Finance Authority Retirement Facilities First Mortgage Rev. (United Methodist Retirement Homes), “A”, 4%, 10/01/2046 | 260,000 | 196,918 | ||
111
Portfolio of Investments (unaudited)
– continued
| Issuer | Shares/Par | Value ($) | ||
| Municipal Bonds - continued | ||||
| Wisconsin - continued | ||||
| Wisconsin Public Finance Authority Retirement Facilities First Mortgage Rev. (United Methodist Retirement Homes), “A”, 4%, 10/01/2051 | $ | 730,000 | $526,191 | |
| Wisconsin Public Finance Authority Rev. (Obligated Group of National Senior Communities, Inc.), 4%, 1/01/2047 | 295,000 | 232,049 | ||
| Wisconsin Public Finance Authority Rev. (Obligated Group of National Senior Communities, Inc.), 4%, 1/01/2052 | 395,000 | 299,586 | ||
| Wisconsin Public Finance Authority Senior Living Refunding Bonds Rev. (Mary's Woods at Marylhurst Project), “A”, 5.25%, 5/15/2037 (n) | 1,180,000 | 1,107,764 | ||
| Wisconsin Public Finance Authority Senior Living Refunding Bonds Rev. (Mary's Woods at Marylhurst Project), “A”, 5.25%, 5/15/2042 (n) | 885,000 | 796,453 | ||
| Wisconsin Public Finance Authority Senior Living Refunding Bonds Rev. (Mary's Woods at Marylhurst Project), “A”, 5.25%, 5/15/2047 (n) | 2,215,000 | 1,940,816 | ||
| Wisconsin Public Finance Authority Senior Living Refunding Bonds Rev. (Mary's Woods at Marylhurst Project), “A”, 5.25%, 5/15/2052 (n) | 1,860,000 | 1,580,736 | ||
| Wisconsin Public Finance Authority Senior Living Rev. (Rose Villa Project), “A”, 5.125%, 11/15/2029 (n) | 390,000 | 392,938 | ||
| Wisconsin Public Finance Authority Senior Living Rev. (Rose Villa Project), “A”, 5.5%, 11/15/2034 (n) | 360,000 | 364,166 | ||
| Wisconsin Public Finance Authority Senior Living Rev. (Rose Villa Project), “A”, 5.75%, 11/15/2044 (n) | 295,000 | 299,208 | ||
| Wisconsin Public Finance Authority Senior Living Rev. (Rose Villa Project), “A”, 6%, 11/15/2049 (n) | 585,000 | 594,728 | ||
| Wisconsin Public Finance Authority Senior Secured Rev. (McLemore Hotel & Conference Center), “A”, 4.5%, 6/01/2056 (n) | 5,460,000 | 3,666,624 | ||
| Wisconsin Public Finance Authority Student Housing Rev. (Beyond Boone LLC - Appalachian State University Project), “A”, AGM, 5%, 7/01/2044 | 295,000 | 292,954 | ||
| Wisconsin Public Finance Authority Student Housing Rev. (Beyond Boone LLC - Appalachian State University Project), “A”, AGM, 4%, 7/01/2045 | 635,000 | 539,549 | ||
| Wisconsin Public Finance Authority Student Housing Rev. (Beyond Boone LLC - Appalachian State University Project), “A”, AGM, 4%, 7/01/2050 | 550,000 | 452,569 | ||
| Wisconsin Public Finance Authority Student Housing Rev. (Beyond Boone LLC - Appalachian State University Project), “A”, AGM, 4%, 7/01/2055 | 620,000 | 501,126 | ||
112
Portfolio of Investments (unaudited)
– continued
| Issuer | Shares/Par | Value ($) | ||
| Municipal Bonds - continued | ||||
| Wisconsin - continued | ||||
| Wisconsin Public Finance Authority Student Housing Rev. (CHF - Manoa LLC UH Residences for Graduate Students), “A”, 5.75%, 7/01/2053 (n) | $ | 4,715,000 | $4,564,585 | |
| Wisconsin Public Finance Authority Student Housing Rev. (CHF - Manoa LLC UH Residences for Graduate Students), “A”, 5.75%, 7/01/2063 (n) | 1,815,000 | 1,717,643 | ||
| Wisconsin Public Finance Authority Student Housing Rev. (CHF - Wilmington LLC - University of North Carolina at Wilmington Project), 5%, 7/01/2036 | 395,000 | 402,107 | ||
| Wisconsin Public Finance Authority Student Housing Rev. (CHF - Wilmington LLC - University of North Carolina at Wilmington Project), AGM, 5%, 7/01/2048 | 4,720,000 | 4,648,720 | ||
| Wisconsin Public Finance Authority Student Housing Rev. (CHF - Wilmington LLC - University of North Carolina at Wilmington Project), AGM, 5%, 7/01/2053 | 2,810,000 | 2,744,233 | ||
| Wisconsin Public Finance Authority Student Housing Rev. (CHF - Wilmington LLC - University of North Carolina at Wilmington Project), AGM, 5%, 7/01/2058 | 3,935,000 | 3,835,625 | ||
| Wisconsin Public Finance Authority Student Housing Rev. (University of Hawai'i Foundation Project), “A-1”, 4%, 7/01/2041 (n) | 335,000 | 270,950 | ||
| Wisconsin Public Finance Authority Student Housing Rev. (University of Hawai'i Foundation Project), “A-1”, 4%, 7/01/2051 (n) | 1,310,000 | 957,925 | ||
| Wisconsin Public Finance Authority Student Housing Rev. (University of Hawai'i Foundation Project), “A-1”, 4%, 7/01/2061 (n) | 2,315,000 | 1,600,360 | ||
| Wisconsin Public Finance Authority Student Housing Rev., Taxable (University of Hawai'i Foundation Project), “A-2”, 4.85%, 7/01/2031 (n) | 335,000 | 282,880 | ||
| Wisconsin Public Finance Authority Student Housing Rev., Taxable (University of Hawai'i Foundation Project), “A-2”, 5.35%, 7/01/2040 (n) | 1,125,000 | 865,067 | ||
| Wisconsin Public Finance Authority, Health Care System Rev. (Cone Health), “A”, 4%, 10/01/2052 | 7,495,000 | 6,346,987 | ||
| Wisconsin Public Finance Authority, Health Care System Rev. (Cone Health), “E”, VRDN, 3.88%, 10/01/2044 | 15,810,000 | 15,810,000 | ||
| $169,520,302 | ||||
113
Portfolio of Investments (unaudited)
– continued
| Issuer | Shares/Par | Value ($) | ||
| Municipal Bonds - continued | ||||
| Wyoming - 0.2% | ||||
| Laramie County, WY, Hospital Refunding Rev. (Cheyenne Regional Medical Center Project), 4%, 5/01/2037 | $ | 160,000 | $146,301 | |
| Wyoming Community Development Authority, Housing Rev., 4%, 12/01/2050 | 5,960,000 | 5,803,056 | ||
| Wyoming Community Development Authority, Housing Rev., GNMA, 3.5%, 6/01/2052 | 3,770,000 | 3,595,191 | ||
| $9,544,548 | ||||
| Total Municipal Bonds (Identified Cost, $5,028,982,739) | $4,579,988,903 | |||
| Other Municipal Bonds – 1.0% | ||||
| Multi-Family Housing Revenue – 1.0% | ||||
| Affordable Housing Opportunities Trust Certificates, AH-01, “A”, 3.527%, 4/30/2039 (n) | $ | 9,275,000 | $7,178,858 | |
| Affordable Housing Pass-Thru Trust Certificates, 6%, 10/05/2040 | 11,705,364 | 10,606,487 | ||
| Freddie Mac, 2.625%, 6/15/2035 (n) | 13,290,000 | 10,649,066 | ||
| Freddie Mac, 4.14%, 1/25/2040 | 15,956,015 | 13,992,698 | ||
| FRETE 2021-ML12 Trust, “X-US”, FHLMC, 1.219%, 7/24/2041 (i)(n) | 12,461,996 | 1,185,913 | ||
| FRETE 2022-ML13 Trust, “X-CA”, 0.954%, 7/25/2036 (i) | 36,349,354 | 2,015,859 | ||
| FRETE 2023-ML16 Trust, “X-CA”, 4.632%, 7/25/2038 | 3,014,446 | 2,700,320 | ||
| Total Other Municipal Bonds (Identified Cost, $53,902,499) | $48,329,201 | |||
| Bonds – 0.4% | ||||
| Consumer Services – 0.4% | ||||
| Toll Road Investors Partnership II LP, Capital Appreciation, NPFG, 0%, 2/15/2025 (n) | $ | 6,276,000 | $5,651,168 | |
| Toll Road Investors Partnership II LP, Capital Appreciation, NPFG, 0%, 2/15/2026 (n) | 4,770,000 | 3,999,823 | ||
| Toll Road Investors Partnership II LP, Capital Appreciation, NPFG, 0%, 2/15/2027 (n) | 670,000 | 521,609 | ||
| Toll Road Investors Partnership II LP, Capital Appreciation, NPFG, 0%, 2/15/2028 (n) | 2,726,000 | 1,967,289 | ||
| Toll Road Investors Partnership II LP, Capital Appreciation, NPFG, 0%, 2/15/2033 (n) | 2,925,000 | 1,442,564 | ||
| Toll Road Investors Partnership II LP, Capital Appreciation, NPFG, 0%, 2/15/2043 (n) | 19,288,075 | 6,340,677 | ||
| $19,923,130 | ||||
| Medical & Health Technology & Services – 0.0% | ||||
| ProMedica Toledo Hospital, “B”, 5.325%, 11/15/2028 | $ | 385,000 | $303,669 | |
| Total Bonds (Identified Cost, $22,312,449) | $20,226,799 | |||
114
Portfolio of Investments (unaudited)
– continued
| Issuer | Shares/Par | Value ($) | ||
| Contingent Value Instruments - 0.1% | ||||
| General Obligations - General Purpose – 0.1% | ||||
| Commonwealth of Puerto Rico, General Obligation Contingent Value Instrument, 11/01/2043 (Identified Cost, $4,100,153) | $ | 6,910,575 | $3,584,861 | |
| Investment Companies (h) - 0.3% | ||||
| Money Market Funds – 0.3% | ||||
| MFS Institutional Money Market Portfolio, 5.4% (v) (Identified Cost, $12,921,864) | 12,923,215 | $12,925,799 | ||
| Other Assets, Less Liabilities - 0.6% | 26,688,223 | |||
| Net Assets - 100.0% | $4,691,743,786 | |||
| (a) | Non-income producing security. |
| (d) | In default. |
| (h) | An affiliated issuer, which may be considered one in which the fund owns 5% or more of the outstanding voting securities, or a company which is under common control. At period end, the aggregate values of the fund's investments in affiliated issuers and in unaffiliated issuers were $12,925,799 and $4,652,129,764, respectively. |
| (i) | Interest only security for which the fund receives interest on notional principal (Par amount). Par amount shown is the notional principal and does not reflect the cost of the security. |
| (n) | Securities exempt from registration under Rule 144A of the Securities Act of 1933. These securities may be sold in the ordinary course of business in transactions exempt from registration, normally to qualified institutional buyers. At period end, the aggregate value of these securities was $312,799,556, representing 6.7% of net assets. |
| (p) | Primary market inverse floater. |
| (u) | Underlying security deposited into special purpose trust upon creation of self-deposited inverse floaters. |
| (v) | Affiliated issuer that is available only to investment companies managed by MFS. The rate quoted for the MFS Institutional Money Market Portfolio is the annualized seven-day yield of the fund at period end. |
| (w) | When-issued security. |
| (z) | Restricted securities are not registered under the Securities Act of 1933 and are subject to legal restrictions on resale. These securities generally may be resold in transactions exempt from registration or to the public if the securities are subsequently registered. Disposal of these securities may involve time-consuming negotiations and prompt sale at an acceptable price may be difficult. The fund holds the following restricted securities: |
| Restricted Securities | Acquisition Date | Cost | Value |
| Collier County, FL, Industrial Development Authority, Continuing Care Community Rev. (Arlington of Naples Project), “A”, 6.25%, 5/15/2035 | 6/30/15 | $50,752 | $4,142 |
| Collier County, FL, Industrial Development Authority, Continuing Care Community Rev. (Arlington of Naples Project), “A”, 7.75%, 5/15/2035 | 11/15/17 | 331,061 | 27,069 |
115
Portfolio of Investments (unaudited)
– continued
| Restricted Securities - continued | Acquisition Date | Cost | Value |
| Collier County, FL, Industrial Development Authority, Continuing Care Community Rev. (Arlington of Naples Project), “A”, 8.125%, 5/15/2044 | 11/15/17 | $490,570 | $40,808 |
| Collier County, FL, Industrial Development Authority, Continuing Care Community Rev. (Arlington of Naples Project), “A”, 6.5%, 5/15/2049 | 6/30/15 | 89,586 | 7,455 |
| Illinois Housing Development Authority Rev., “A”, FHLMC, 3.87%, 11/15/2035 | 2/04/21 | 9,313,021 | 6,790,448 |
| Illinois Housing Development Authority Rev., “B”, FHLMC, 3.87%, 11/15/2035 | 2/04/21 | 3,798,062 | 2,769,300 |
| Illinois Housing Development Authority Rev., “C”, FHLMC, 3.87%, 11/15/2035 | 2/04/21 | 3,789,967 | 2,714,666 |
| Illinois Housing Development Authority Rev., “D”, FHLMC, 3.87%, 11/15/2035 | 2/04/21 | 3,458,339 | 2,466,680 |
| Illinois Housing Development Authority Rev., “E”, FHLMC, 3.87%, 11/15/2035 | 2/04/21 | 2,379,988 | 1,690,386 |
| Total Restricted Securities | $16,510,954 | ||
| % of Net assets | 0.4% |
| The following abbreviations are used in this report and are defined: | |
| AAC | Ambac Assurance Corp. |
| AGM | Assured Guaranty Municipal |
| BAM | Build America Mutual |
| COP | Certificate of Participation |
| ETM | Escrowed to Maturity |
| FHA | Federal Housing Administration |
| FHLMC | Federal Home Loan Mortgage Corp. |
| FLR | Floating Rate. Interest rate resets periodically based on the parenthetically disclosed reference rate plus a spread (if any). The period-end rate reported may not be the current rate. All reference rates are USD unless otherwise noted. |
| FNMA | Federal National Mortgage Assn. |
| GNMA | Government National Mortgage Assn. |
| LIBOR | London Interbank Offered Rate |
| NPFG | National Public Finance Guarantee Corp. |
| PSF | Permanent School Fund |
| RIBS | Residual Interest Bonds |
| SOFR | Secured Overnight Financing Rate |
| VRDN | Variable rate demand note that may be puttable to the issuer at the option of the holder. The stated interest rate, which generally resets either daily or weekly, represents the rate in effect at period end and may not be the current rate. |
See Notes to Financial Statements
116
Financial Statements
Statement of Assets and
Liabilities
At 9/30/23 (unaudited)
This statement represents your
fund’s balance sheet, which details the assets and liabilities comprising the total value of the fund.
| Assets | |
| Investments in unaffiliated issuers, at value (identified cost, $5,109,297,840) | $4,652,129,764 |
| Investments in affiliated issuers, at value (identified cost, $12,921,864) | 12,925,799 |
| Cash | 34,589 |
| Receivables for | |
| Investments sold | 4,992,377 |
| Fund shares sold | 15,515,372 |
| Interest | 57,710,547 |
| Other assets | 22,115 |
| Total assets | $4,743,330,563 |
| Liabilities | |
| Payables for | |
| Distributions | $2,540,398 |
| When-issued investments purchased | 10,507,930 |
| Fund shares reacquired | 11,985,020 |
| Interest expense and fees | 254,777 |
| Payable to the holders of the floating rate certificates | 25,010,000 |
| Payable to affiliates | |
| Investment adviser | 136,524 |
| Administrative services fee | 5,084 |
| Shareholder servicing costs | 711,364 |
| Distribution and service fees | 42,529 |
| Accrued expenses and other liabilities | 393,151 |
| Total liabilities | $51,586,777 |
| Net assets | $4,691,743,786 |
| Net assets consist of | |
| Paid-in capital | $5,314,793,462 |
| Total distributable earnings (loss) | (623,049,676) |
| Net assets | $4,691,743,786 |
| Shares of beneficial interest outstanding | 613,497,018 |
117
Statement of Assets and Liabilities (unaudited) – continued
| Net assets | Shares outstanding | Net asset value per share (a) | |
| Class A | $1,852,066,152 | 242,097,279 | $7.65 |
| Class B | 1,456,080 | 189,983 | 7.66 |
| Class C | 54,526,507 | 7,100,708 | 7.68 |
| Class I | 1,765,591,693 | 230,922,256 | 7.65 |
| Class R6 | 765,056,020 | 100,138,251 | 7.64 |
| Class A1 | 252,995,150 | 33,041,733 | 7.66 |
| Class B1 | 52,184 | 6,808 | 7.67 |
| (a) | Maximum offering price per share was equal to the net asset value per share for all share classes, except for Classes A and A1, for which the maximum offering prices per share were $7.99 [100 / 95.75 x $7.65] and $8.00 [100 / 95.75 x $7.66], respectively. On sales of $100,000 or more, the maximum offering prices of Class A and Class A1 shares are reduced. A contingent deferred sales charge may be imposed on redemptions of Class A, Class B, Class C, Class A1, and Class B1 shares. Redemption price per share was equal to the net asset value per share for Classes I and R6. |
See Notes to Financial Statements
118
Financial Statements
Statement of Operations
Six months ended 9/30/23
(unaudited)
This statement describes how much
your fund earned in investment income and accrued in expenses. It also describes any gains and/or losses generated by fund operations.
| Net investment income (loss) | |
| Income | |
| Interest | $93,237,657 |
| Dividends from affiliated issuers | 2,509,361 |
| Total investment income | $95,747,018 |
| Expenses | |
| Management fee | $8,829,862 |
| Distribution and service fees | 2,717,104 |
| Shareholder servicing costs | 1,478,582 |
| Administrative services fee | 310,117 |
| Independent Trustees' compensation | 39,691 |
| Custodian fee | 191,056 |
| Shareholder communications | 72,796 |
| Audit and tax fees | 36,528 |
| Legal fees | 30,105 |
| Interest expense and fees | 723,397 |
| Miscellaneous | 232,956 |
| Total expenses | $14,662,194 |
| Fees paid indirectly | (2,028) |
| Reduction of expenses by investment adviser and distributor | (303,134) |
| Net expenses | $14,357,032 |
| Net investment income (loss) | $81,389,986 |
| Realized and unrealized gain (loss) | |
| Realized gain (loss) (identified cost basis) | |
| Unaffiliated issuers | $(10,862,358) |
| Affiliated issuers | (26,251) |
| Net realized gain (loss) | $(10,888,609) |
| Change in unrealized appreciation or depreciation | |
| Unaffiliated issuers | $(272,251,848) |
| Affiliated issuers | (22,527) |
| Net unrealized gain (loss) | $(272,274,375) |
| Net realized and unrealized gain (loss) | $(283,162,984) |
| Change in net assets from operations | $(201,772,998) |
See Notes to Financial Statements
119
Financial Statements
Statements of Changes in Net
Assets
These statements describe the
increases and/or decreases in net assets resulting from operations, any distributions, and any shareholder transactions.
| Six months ended | Year ended | |
| 9/30/23 (unaudited) | 3/31/23 | |
| Change in net assets | ||
| From operations | ||
| Net investment income (loss) | $81,389,986 | $132,055,116 |
| Net realized gain (loss) | (10,888,609) | (177,993,608) |
| Net unrealized gain (loss) | (272,274,375) | (94,557,739) |
| Change in net assets from operations | $(201,772,998) | $(140,496,231) |
| Total distributions to shareholders | $(83,435,879) | $(134,897,656) |
| Change in net assets from fund share transactions | $279,850,676 | $(1,028,517,483) |
| Total change in net assets | $(5,358,201) | $(1,303,911,370) |
| Net assets | ||
| At beginning of period | 4,697,101,987 | 6,001,013,357 |
| At end of period | $4,691,743,786 | $4,697,101,987 |
See Notes to Financial Statements
120
Financial Statements
Financial Highlights
The financial highlights table is
intended to help you understand the fund's financial performance for the semiannual period and the past 5 fiscal years (or life of a particular share class, if shorter). Certain information reflects financial results
for a single fund share. The total returns in the table represent the rate that an investor would have earned (or lost) on an investment in the fund share class (assuming reinvestment of all distributions) held for
the entire period.
| Class A | Six months ended | Year ended | ||||
| 9/30/23 (unaudited) | 3/31/23 | 3/31/22 | 3/31/21 | 3/31/20 | 3/31/19 | |
| Net asset value, beginning of period | $8.12 | $8.54 | $9.09 | $8.68 | $8.77 | $8.63 |
| Income (loss) from investment operations | ||||||
| Net investment income (loss) (d) | $0.13 | $0.22 | $0.20 | $0.23 | $0.26 | $0.32 |
| Net realized and unrealized gain (loss) | (0.47) | (0.41) | (0.55) | 0.41 | (0.09) | 0.11 |
| Total from investment operations | $(0.34) | $(0.19) | $(0.35) | $0.64 | $0.17 | $0.43 |
| Less distributions declared to shareholders | ||||||
| From net investment income | $(0.13) | $(0.23) | $(0.20) | $(0.23) | $(0.26) | $(0.29) |
| Net asset value, end of period (x) | $7.65 | $8.12 | $8.54 | $9.09 | $8.68 | $8.77 |
| Total return (%) (r)(s)(t)(x) | (4.21)(n) | (2.18) | (4.01) | 7.43 | 1.88 | 5.14 |
| Ratios (%) (to average net assets) and Supplemental data: | ||||||
| Expenses before expense reductions (f) | 0.76(a) | 0.77 | 0.73 | 0.74 | 0.78 | 0.77 |
| Expenses after expense reductions (f) | 0.74(a) | 0.76 | 0.71 | 0.73 | 0.77 | 0.75 |
| Net investment income (loss) | 3.23(a) | 2.74 | 2.16 | 2.57 | 2.89 | 3.74 |
| Portfolio turnover | 8(n) | 35 | 14 | 24 | 23 | 19 |
| Net assets at end of period (000 omitted) | $1,852,066 | $1,888,158 | $3,370,745 | $3,166,883 | $2,386,528 | $1,683,822 |
| Supplemental Ratios (%): | ||||||
| Ratios of expenses to average net assets after expense reductions and excluding interest expense and fees (f)(l) | 0.71(a) | 0.72 | 0.70 | 0.72 | 0.73 | 0.73 |
See Notes to Financial Statements
121
Financial Highlights – continued
| Class B | Six months ended | Year ended | ||||
| 9/30/23 (unaudited) | 3/31/23 | 3/31/22 | 3/31/21 | 3/31/20 | 3/31/19 | |
| Net asset value, beginning of period | $8.13 | $8.56 | $9.10 | $8.69 | $8.78 | $8.65 |
| Income (loss) from investment operations | ||||||
| Net investment income (loss) (d) | $0.10 | $0.16 | $0.13 | $0.17 | $0.20 | $0.26 |
| Net realized and unrealized gain (loss) | (0.47) | (0.42) | (0.54) | 0.40 | (0.10) | 0.10 |
| Total from investment operations | $(0.37) | $(0.26) | $(0.41) | $0.57 | $0.10 | $0.36 |
| Less distributions declared to shareholders | ||||||
| From net investment income | $(0.10) | $(0.17) | $(0.13) | $(0.16) | $(0.19) | $(0.23) |
| Net asset value, end of period (x) | $7.66 | $8.13 | $8.56 | $9.10 | $8.69 | $8.78 |
| Total return (%) (r)(s)(t)(x) | (4.56)(n) | (3.01) | (4.61) | 6.63 | 1.14 | 4.23 |
| Ratios (%) (to average net assets) and Supplemental data: | ||||||
| Expenses before expense reductions (f) | 1.51(a) | 1.52 | 1.48 | 1.49 | 1.53 | 1.52 |
| Expenses after expense reductions (f) | 1.50(a) | 1.51 | 1.46 | 1.48 | 1.52 | 1.50 |
| Net investment income (loss) | 2.48(a) | 2.01 | 1.42 | 1.87 | 2.19 | 2.99 |
| Portfolio turnover | 8(n) | 35 | 14 | 24 | 23 | 19 |
| Net assets at end of period (000 omitted) | $1,456 | $1,834 | $2,790 | $4,777 | $7,843 | $12,579 |
| Supplemental Ratios (%): | ||||||
| Ratios of expenses to average net assets after expense reductions and excluding interest expense and fees (f)(l) | 1.47(a) | 1.47 | 1.45 | 1.46 | 1.48 | 1.48 |
See Notes to Financial Statements
122
Financial Highlights – continued
| Class C | Six months ended | Year ended | ||||
| 9/30/23 (unaudited) | 3/31/23 | 3/31/22 | 3/31/21 | 3/31/20 | 3/31/19 | |
| Net asset value, beginning of period | $8.15 | $8.57 | $9.12 | $8.71 | $8.80 | $8.66 |
| Income (loss) from investment operations | ||||||
| Net investment income (loss) (d) | $0.10 | $0.16 | $0.13 | $0.17 | $0.19 | $0.26 |
| Net realized and unrealized gain (loss) | (0.47) | (0.41) | (0.55) | 0.40 | (0.09) | 0.11 |
| Total from investment operations | $(0.37) | $(0.25) | $(0.42) | $0.57 | $0.10 | $0.37 |
| Less distributions declared to shareholders | ||||||
| From net investment income | $(0.10) | $(0.17) | $(0.13) | $(0.16) | $(0.19) | $(0.23) |
| Net asset value, end of period (x) | $7.68 | $8.15 | $8.57 | $9.12 | $8.71 | $8.80 |
| Total return (%) (r)(s)(t)(x) | (4.54)(n) | (2.89) | (4.71) | 6.62 | 1.13 | 4.35 |
| Ratios (%) (to average net assets) and Supplemental data: | ||||||
| Expenses before expense reductions (f) | 1.51(a) | 1.52 | 1.48 | 1.49 | 1.53 | 1.52 |
| Expenses after expense reductions (f) | 1.50(a) | 1.51 | 1.46 | 1.48 | 1.52 | 1.50 |
| Net investment income (loss) | 2.48(a) | 2.01 | 1.42 | 1.86 | 2.16 | 2.99 |
| Portfolio turnover | 8(n) | 35 | 14 | 24 | 23 | 19 |
| Net assets at end of period (000 omitted) | $54,527 | $66,358 | $90,334 | $113,569 | $155,843 | $151,636 |
| Supplemental Ratios (%): | ||||||
| Ratios of expenses to average net assets after expense reductions and excluding interest expense and fees (f)(l) | 1.47(a) | 1.47 | 1.45 | 1.46 | 1.48 | 1.48 |
See Notes to Financial Statements
123
Financial Highlights – continued
| Class I | Six months ended | Year ended | ||||
| 9/30/23 (unaudited) | 3/31/23 | 3/31/22 | 3/31/21 | 3/31/20 | 3/31/19 | |
| Net asset value, beginning of period | $8.11 | $8.54 | $9.08 | $8.67 | $8.76 | $8.63 |
| Income (loss) from investment operations | ||||||
| Net investment income (loss) (d) | $0.14 | $0.24 | $0.22 | $0.25 | $0.28 | $0.34 |
| Net realized and unrealized gain (loss) | (0.46) | (0.42) | (0.54) | 0.41 | (0.09) | 0.10 |
| Total from investment operations | $(0.32) | $(0.18) | $(0.32) | $0.66 | $0.19 | $0.44 |
| Less distributions declared to shareholders | ||||||
| From net investment income | $(0.14) | $(0.25) | $(0.22) | $(0.25) | $(0.28) | $(0.31) |
| Net asset value, end of period (x) | $7.65 | $8.11 | $8.54 | $9.08 | $8.67 | $8.76 |
| Total return (%) (r)(s)(t)(x) | (3.97)(n) | (2.06) | (3.66) | 7.70 | 2.13 | 5.27 |
| Ratios (%) (to average net assets) and Supplemental data: | ||||||
| Expenses before expense reductions (f) | 0.51(a) | 0.52 | 0.48 | 0.49 | 0.53 | 0.52 |
| Expenses after expense reductions (f) | 0.49(a) | 0.51 | 0.46 | 0.48 | 0.52 | 0.51 |
| Net investment income (loss) | 3.48(a) | 3.03 | 2.41 | 2.82 | 3.15 | 3.99 |
| Portfolio turnover | 8(n) | 35 | 14 | 24 | 23 | 19 |
| Net assets at end of period (000 omitted) | $1,765,592 | $1,709,032 | $1,498,236 | $1,389,505 | $1,042,592 | $870,855 |
| Supplemental Ratios (%): | ||||||
| Ratios of expenses to average net assets after expense reductions and excluding interest expense and fees (f)(l) | 0.46(a) | 0.47 | 0.45 | 0.47 | 0.48 | 0.48 |
See Notes to Financial Statements
124
Financial Highlights – continued
| Class R6 | Six months ended | Year ended | ||||
| 9/30/23 (unaudited) | 3/31/23 | 3/31/22 | 3/31/21 | 3/31/20 | 3/31/19 | |
| Net asset value, beginning of period | $8.11 | $8.53 | $9.08 | $8.67 | $8.76 | $8.62 |
| Income (loss) from investment operations | ||||||
| Net investment income (loss) (d) | $0.14 | $0.25 | $0.23 | $0.26 | $0.29 | $0.35 |
| Net realized and unrealized gain (loss) | (0.46) | (0.42) | (0.56) | 0.41 | (0.09) | 0.11 |
| Total from investment operations | $(0.32) | $(0.17) | $(0.33) | $0.67 | $0.20 | $0.46 |
| Less distributions declared to shareholders | ||||||
| From net investment income | $(0.15) | $(0.25) | $(0.22) | $(0.26) | $(0.29) | $(0.32) |
| Net asset value, end of period (x) | $7.64 | $8.11 | $8.53 | $9.08 | $8.67 | $8.76 |
| Total return (%) (r)(s)(t)(x) | (4.06)(n) | (1.87) | (3.71) | 7.78 | 2.21 | 5.48 |
| Ratios (%) (to average net assets) and Supplemental data: | ||||||
| Expenses before expense reductions (f) | 0.44(a) | 0.45 | 0.41 | 0.42 | 0.46 | 0.45 |
| Expenses after expense reductions (f) | 0.43(a) | 0.44 | 0.39 | 0.41 | 0.45 | 0.43 |
| Net investment income (loss) | 3.54(a) | 3.10 | 2.48 | 2.90 | 3.22 | 4.06 |
| Portfolio turnover | 8(n) | 35 | 14 | 24 | 23 | 19 |
| Net assets at end of period (000 omitted) | $765,056 | $747,221 | $702,294 | $605,320 | $591,947 | $491,400 |
| Supplemental Ratios (%): | ||||||
| Ratios of expenses to average net assets after expense reductions and excluding interest expense and fees (f)(l) | 0.40(a) | 0.40 | 0.38 | 0.39 | 0.41 | 0.41 |
See Notes to Financial Statements
125
Financial Highlights – continued
| Class A1 | Six months ended | Year ended | ||||
| 9/30/23 (unaudited) | 3/31/23 | 3/31/22 | 3/31/21 | 3/31/20 | 3/31/19 | |
| Net asset value, beginning of period | $8.12 | $8.55 | $9.10 | $8.69 | $8.78 | $8.64 |
| Income (loss) from investment operations | ||||||
| Net investment income (loss) (d) | $0.14 | $0.24 | $0.22 | $0.25 | $0.28 | $0.34 |
| Net realized and unrealized gain (loss) | (0.46) | (0.42) | (0.55) | 0.41 | (0.09) | 0.12 |
| Total from investment operations | $(0.32) | $(0.18) | $(0.33) | $0.66 | $0.19 | $0.46 |
| Less distributions declared to shareholders | ||||||
| From net investment income | $(0.14) | $(0.25) | $(0.22) | $(0.25) | $(0.28) | $(0.32) |
| Net asset value, end of period (x) | $7.66 | $8.12 | $8.55 | $9.10 | $8.69 | $8.78 |
| Total return (%) (r)(s)(t)(x) | (3.96)(n) | (2.04) | (3.76) | 7.70 | 2.14 | 5.40 |
| Ratios (%) (to average net assets) and Supplemental data: | ||||||
| Expenses before expense reductions (f) | 0.51(a) | 0.52 | 0.48 | 0.49 | 0.53 | 0.52 |
| Expenses after expense reductions (f) | 0.49(a) | 0.51 | 0.46 | 0.48 | 0.52 | 0.51 |
| Net investment income (loss) | 3.48(a) | 3.02 | 2.42 | 2.85 | 3.18 | 3.99 |
| Portfolio turnover | 8(n) | 35 | 14 | 24 | 23 | 19 |
| Net assets at end of period (000 omitted) | $252,995 | $284,440 | $336,545 | $381,748 | $421,338 | $454,350 |
| Supplemental Ratios (%): | ||||||
| Ratios of expenses to average net assets after expense reductions and excluding interest expense and fees (f)(l) | 0.46(a) | 0.47 | 0.45 | 0.47 | 0.48 | 0.48 |
See Notes to Financial Statements
126
Financial Highlights – continued
| Class B1 | Six months ended | Year ended | ||||
| 9/30/23 (unaudited) | 3/31/23 | 3/31/22 | 3/31/21 | 3/31/20 | 3/31/19 | |
| Net asset value, beginning of period | $8.13 | $8.56 | $9.10 | $8.69 | $8.78 | $8.65 |
| Income (loss) from investment operations | ||||||
| Net investment income (loss) (d) | $0.11 | $0.18 | $0.15 | $0.19 | $0.22 | $0.28 |
| Net realized and unrealized gain (loss) | (0.46) | (0.42) | (0.54) | 0.40 | (0.09) | 0.10 |
| Total from investment operations | $(0.35) | $(0.24) | $(0.39) | $0.59 | $0.13 | $0.38 |
| Less distributions declared to shareholders | ||||||
| From net investment income | $(0.11) | $(0.19) | $(0.15) | $(0.18) | $(0.22) | $(0.25) |
| Net asset value, end of period (x) | $7.67 | $8.13 | $8.56 | $9.10 | $8.69 | $8.78 |
| Total return (%) (r)(s)(t)(x) | (4.31)(n) | (2.77) | (4.38) | 6.90 | 1.38 | 4.49 |
| Ratios (%) (to average net assets) and Supplemental data: | ||||||
| Expenses before expense reductions (f) | 1.51(a) | 1.52 | 1.48 | 1.49 | 1.53 | 1.52 |
| Expenses after expense reductions (f) | 1.25(a) | 1.26 | 1.21 | 1.23 | 1.27 | 1.25 |
| Net investment income (loss) | 2.73(a) | 2.27 | 1.62 | 2.12 | 2.45 | 3.24 |
| Portfolio turnover | 8(n) | 35 | 14 | 24 | 23 | 19 |
| Net assets at end of period (000 omitted) | $52 | $60 | $69 | $34 | $58 | $91 |
| Supplemental Ratios (%): | ||||||
| Ratios of expenses to average net assets after expense reductions and excluding interest expense and fees (f)(l) | 1.22(a) | 1.22 | 1.20 | 1.21 | 1.23 | 1.23 |
| (a) | Annualized. |
| (d) | Per share data is based on average shares outstanding. |
| (f) | Ratios do not reflect reductions from fees paid indirectly, if applicable. See Note 2 in the Notes to Financial Statements for additional information. |
| (l) | Interest expense and fees include payments made to the holders of the floating rate certificates. |
| (n) | Not annualized. |
| (r) | Certain expenses have been reduced without which performance would have been lower. |
| (s) | From time to time the fund may receive proceeds from litigation settlements, without which performance would be lower. |
| (t) | Total returns do not include any applicable sales charges. |
| (x) | The net asset values and total returns have been calculated on net assets which include adjustments made in accordance with U.S. generally accepted accounting principles required at period end for financial reporting purposes. |
See Notes to Financial Statements
127
Notes to Financial Statements
(unaudited)
(1) Business and
Organization
MFS Municipal Income Fund (the fund)
is a diversified series of MFS Municipal Series Trust which is organized as a Massachusetts business trust and is registered under the Investment Company Act of 1940, as amended, as an open-end management investment
company.
The fund is an investment company
and accordingly follows the investment company accounting and reporting guidance of the Financial Accounting Standards Board (FASB) Accounting Standards Codification Topic 946 Financial Services - Investment
Companies.
(2) Significant Accounting
Policies
General — The preparation of financial statements in conformity with U.S. generally accepted accounting principles requires management to make estimates and assumptions that affect the
reported amounts of assets and liabilities, and disclosure of contingent assets and liabilities at the date of the financial statements and the reported amounts of increases and decreases in net assets from operations
during the reporting period. Actual results could differ from those estimates. In the preparation of these financial statements, management has evaluated subsequent events occurring after the date of the fund’s
Statement of Assets and Liabilities through the date that the financial statements were issued. The fund invests primarily in municipal instruments, which generally trade in the over-the-counter market. The value of municipal instruments can be affected by changes in their actual or
perceived credit quality. The credit quality of, and the ability to pay principal and interest when due by, an issuer of a municipal instrument depends on the credit quality of the entity supporting the municipal
instrument, how essential any services supported by the municipal instrument are, the sufficiency of any revenues or taxes that support the municipal instrument, and/or the willingness or ability of the appropriate
government entity to approve any appropriations necessary to support the municipal instrument. Municipal instruments may be supported by insurance which typically guarantees the timely payment of all principal and
interest due on the underlying municipal instrument. The value of a municipal instrument can be volatile and significantly affected by adverse tax changes or court rulings, legislative or political changes, changes in
specific or general market and economic conditions in the region where the instrument is issued, and the financial condition of municipal issuers and of municipal instrument insurers of which there are a limited
number. Also, because many municipal instruments are issued to finance similar projects, conditions in certain industries can significantly affect the fund and the overall municipal market. If the Internal Revenue
Service determines an issuer of a municipal instrument has not complied with the applicable tax requirements, interest from the security could become taxable, the security could decline in value, and distributions
made by the fund could be taxable to shareholders.
Balance Sheet Offsetting — The fund's accounting policy with respect to balance sheet offsetting is that, absent an event of default by the counterparty or a termination of the agreement, the International
Swaps and Derivatives Association (ISDA) Master Agreement, or similar agreement, does not result in an offset of reported amounts of financial assets and financial liabilities in the Statement of Assets and
Liabilities across transactions between the fund and the applicable counterparty. The fund's right to setoff may be restricted or prohibited by the bankruptcy or insolvency laws of the
128
Notes to Financial
Statements (unaudited) - continued
particular jurisdiction to which a specific master
netting agreement counterparty is subject. Balance sheet offsetting disclosures, to the extent applicable to the fund, have been included in the fund’s Significant Accounting Policies note under the captions for
each of the fund’s in-scope financial instruments and transactions.
Investment Valuations — Subject to its oversight, the fund's Board of Trustees has delegated primary responsibility for determining or causing to be determined the value of the fund’s investments to MFS as
the fund's adviser, pursuant to the fund’s valuation policy and procedures which have been adopted by the adviser and approved by the Board. In accordance with Rule 2a-5 under the Investment Company Act of
1940, the Board of Trustees designated the adviser as the “valuation designee” of the fund. If the adviser, as valuation designee, determines that reliable market quotations are not readily available for
an investment, the investment is valued at fair value as determined in good faith by the adviser in accordance with the adviser’s fair valuation policy and procedures.
Under the fund's valuation policy
and procedures, debt instruments and floating rate loans, including restricted debt instruments, are generally valued at an evaluated or composite bid as provided by a third-party pricing service. Short-term
instruments with a maturity at issuance of 60 days or less may be valued at amortized cost, which approximates market value. Open-end investment companies are generally valued at net asset value per share.
Under the fund’s valuation
policy and procedures, market quotations are not considered to be readily available for debt instruments, floating rate loans, and many types of derivatives. These investments are generally valued at fair value based
on information from third-party pricing services or otherwise determined by the adviser in accordance with the adviser’s fair valuation policy and procedures. Securities and other assets generally valued on the
basis of information from a third-party pricing service may also be valued at a broker/dealer bid quotation. In determining values, third-party pricing services can utilize both transaction data and market information
such as yield, quality, coupon rate, maturity, type of issue, trading characteristics, spreads and other market data. An investment may also be valued at fair value if the adviser determines that the
investment’s value has been materially affected by events occurring after the close of the exchange or market on which the investment is principally traded (such as foreign exchange or market) and prior to the
determination of the fund’s net asset value, or after the halt of trading of a specific security where trading does not resume prior to the close of the exchange or market on which the security is principally
traded. The adviser generally relies on third-party pricing services or other information (such as the correlation with price movements of similar securities in the same or other markets; the type, cost and investment
characteristics of the security; the business and financial condition of the issuer; and trading and other market data) to assist in determining whether to fair value and at what value to fair value an investment. The
value of an investment for purposes of calculating the fund’s net asset value can differ depending on the source and method used to determine value. When fair valuation is used, the value of an investment used
to determine the fund’s net asset value may differ from quoted or published prices for the same investment. There can be no assurance that the fund could obtain the fair value assigned to an investment if it
were to sell the investment at the same time at which the fund determines its net asset value per share.
129
Notes to Financial
Statements (unaudited) - continued
Various inputs are used in
determining the value of the fund's assets or liabilities. These inputs are categorized into three broad levels. In certain cases, the inputs used to measure fair value may fall into different levels of the fair value
hierarchy. In such cases, an investment's level within the fair value hierarchy is based on the lowest level of input that is significant to the fair value measurement. The fund's assessment of the significance of a
particular input to the fair value measurement in its entirety requires judgment, and considers factors specific to the investment. Level 1 includes unadjusted quoted prices in active markets for identical assets or
liabilities. Level 2 includes other significant observable market-based inputs (including quoted prices for similar securities, interest rates, prepayment speed, and credit risk). Level 3 includes significant
unobservable inputs, which may include the adviser's own assumptions in determining the fair value of investments. The following is a summary of the levels used as of September 30, 2023 in valuing the fund's assets
and liabilities:
| Financial Instruments | Level 1 | Level 2 | Level 3 | Total |
| Municipal Bonds | $— | $4,631,902,965 | $— | $4,631,902,965 |
| U.S. Corporate Bonds | — | 20,226,799 | — | 20,226,799 |
| Mutual Funds | 12,925,799 | — | — | 12,925,799 |
| Total | $12,925,799 | $4,652,129,764 | $— | $4,665,055,563 |
For further information regarding
security characteristics, see the Portfolio of Investments.
Inverse Floaters — The fund invests in municipal inverse floating rate securities in the form of self-deposited secondary market inverse floaters and primary market inverse floaters, both of
which have variable rates of interest that typically move in the opposite direction of short-term rates. A self-deposited secondary market inverse floater is created when the fund transfers a municipal bond from its
portfolio to a special purpose trust (“the trust”) and causes the trust to issue (a) inverse floaters to be held by the fund and (b) floating rate certificates to be held by third parties. The floating
rate certificates usually pay tax-exempt interest at short-term rates that reset weekly and the holders of those certificates typically have the option to tender at par plus accrued interest. Self-deposited secondary
market inverse floaters are accounted for as secured borrowings, with the municipal bonds transferred to the trust being reflected as fund investments and the amounts owed to floating rate certificate holders being
reflected as fund liabilities in the Statement of Assets and Liabilities as “Payable to the holders of the floating rate certificates”. The carrying value of that liability as reported in the fund’s
Statement of Assets and Liabilities approximates its fair value which would be considered level 2 under the fair value hierarchy.
At September 30, 2023, the
fund’s payable to the holders of the floating rate certificates was $25,010,000 and the related weighted average interest rate on the settled floating rate certificates issued by the trust was 4.01%. For the six
months ended September 30, 2023, the average payable to the holders of the settled floating rate certificates was $35,139,098 at a weighted average interest rate of 3.93%. Interest expense and fees, which are recorded
as incurred, include interest payments made to the holders of the floating rate certificates and associated fees. For the six months ended September 30, 2023, the related interest expense and fees amounted to $711,805
which is included in “Interest expense and fees” in the Statement of Operations. Primary market inverse floaters held by the fund are presented as fund investments and are not accounted for as secured
borrowings.
130
Notes to Financial
Statements (unaudited) - continued
Indemnifications — Under the fund's organizational documents, its officers and Trustees may be indemnified against certain liabilities and expenses arising out of the performance of their duties to
the fund. Additionally, in the normal course of business, the fund enters into agreements with service providers that may contain indemnification clauses. The fund's maximum exposure under these agreements is unknown
as this would involve future claims that may be made against the fund that have not yet occurred.
Investment Transactions and
Income — Interest income is recorded on the accrual basis. All premium and discount is amortized or accreted for financial statement purposes in accordance with U.S. generally accepted accounting principles. Interest payments received in additional securities are recorded on the ex-interest date in an amount equal to the value of the security on such date. Debt obligations may be placed on non-accrual status or set to accrue at a rate of interest less than the contractual coupon when the collection of all or a portion of interest has become
doubtful. Interest income for those debt obligations may be further reduced by the write-off of the related interest receivables when deemed uncollectible.
The fund may receive proceeds from
litigation settlements. Any proceeds received from litigation involving portfolio holdings are reflected in the Statement of Operations in realized gain/loss if the security has been disposed of by the fund or in
unrealized gain/loss if the security is still held by the fund. Any other proceeds from litigation not related to portfolio holdings are reflected as other income in the Statement of Operations.
Investment transactions are recorded
on the trade date. In determining the net gain or loss on securities sold, the cost of securities is determined on the identified cost basis.
The fund may purchase or sell
securities on a when-issued or delayed delivery basis. In these extended settlement transactions, the receipt or delivery of the securities by the fund and related payments occur at a future date, usually beyond
the customary settlement period. The price of such security and the date that the security will be settled are generally fixed at the time the transaction is negotiated. The value of the security varies with market
fluctuations and for debt securities no interest accrues to the fund until settlement takes place. When the fund sells securities on a when-issued or delayed delivery basis, the fund typically owns or has the right to
acquire securities equivalent in kind and amount to the securities sold. Purchase and sale commitments for when-issued or delayed delivery securities are held at carrying amount, which approximates fair value and are
categorized as level 2 within the fair value hierarchy, and included in When-issued investments purchased and When-issued investments sold in the Statement of Assets and Liabilities, as applicable. Losses may arise
due to changes in the value of the underlying securities prior to settlement date or if the counterparty does not perform under the contract’s terms, or if the issuer does not issue the securities due to
political, economic or other factors.
Legal fees and other related
expenses incurred to preserve and protect the value of a security owned are added to the cost of the security; other legal fees are expensed. Capital infusions made directly to the security issuer, which are generally
non-recurring, incurred to protect or enhance the value of high-yield debt securities, are reported as additions to the cost basis of the security. Costs that are incurred to negotiate the
131
Notes to Financial
Statements (unaudited) - continued
terms or conditions of capital infusions or that
are expected to result in a plan of reorganization are reported as realized losses. Ongoing costs incurred to protect or enhance an investment, or costs incurred to pursue other claims or legal actions, are
expensed.
Fees Paid Indirectly — The fund's custody fee may be reduced by a credit earned under an arrangement that measures the value of U.S. dollars deposited with the custodian by the fund. The amount of the
credit, for the six months ended September 30, 2023, is shown as a reduction of total expenses in the Statement of Operations.
Tax Matters and Distributions — The fund intends to qualify as a regulated investment company, as defined under Subchapter M of the Internal Revenue Code, and to distribute all of its taxable and tax-exempt
income, including realized capital gains. As a result, no provision for federal income tax is required. The fund’s federal tax returns, when filed, will remain subject to examination by the Internal Revenue
Service for a three year period. Management has analyzed the fund’s tax positions taken on federal and state tax returns for all open tax years and does not believe that there are any uncertain tax positions
that require recognition of a tax liability.
Distributions to shareholders are
recorded on the ex-dividend date. Income and capital gain distributions are determined in accordance with income tax regulations, which may differ from U.S. generally accepted accounting principles. Certain capital
accounts in the financial statements are periodically adjusted for permanent differences in order to reflect their tax character. These adjustments have no impact on net assets or net asset value per share. Temporary
differences which arise from recognizing certain items of income, expense, gain or loss in different periods for financial statement and tax purposes will reverse at some time in the future.
Book/tax differences primarily
relate to defaulted bonds, amortization and accretion of debt securities, treating a portion of the proceeds from redemptions as a distribution for tax purposes, and redemptions in-kind.
The tax character of distributions
made during the current period will be determined at fiscal year end. The tax character of distributions declared to shareholders for the last fiscal year is as follows:
| Year ended 3/31/23 | |
| Ordinary income (including any short-term capital gains) | $8,927,565 |
| Tax-exempt income | 125,970,091 |
| Total distributions | $134,897,656 |
132
Notes to Financial
Statements (unaudited) - continued
The federal tax cost and the tax
basis components of distributable earnings were as follows:
| As of 9/30/23 | |
| Cost of investments | $5,098,210,201 |
| Gross appreciation | 13,373,115 |
| Gross depreciation | (471,537,753) |
| Net unrealized appreciation (depreciation) | $(458,164,638) |
| As of 3/31/23 | |
| Undistributed tax-exempt income | 25,943,964 |
| Capital loss carryforwards | (163,708,868) |
| Other temporary differences | (12,886,286) |
| Net unrealized appreciation (depreciation) | (187,189,609) |
The aggregate cost above includes
prior fiscal year end tax adjustments, if applicable.
As of March 31, 2023, the fund had
capital loss carryforwards available to offset future realized gains. These net capital losses may be carried forward indefinitely and their character is retained as short-term and/or long-term losses. Such losses are
characterized as follows:
| Short-Term | $(75,382,866) |
| Long-Term | (88,326,002) |
| Total | $(163,708,868) |
Multiple Classes of Shares of
Beneficial Interest — The fund offers multiple classes of shares, which differ in their respective distribution and service fees. The fund's income and common expenses are allocated to shareholders based
on the value of settled shares outstanding of each class. The fund's realized and unrealized gain (loss) are allocated to shareholders based on the daily net assets of each class. Dividends are declared separately for
each class. Differences in per share dividend rates are generally due to differences in separate class expenses. Class B and B1 shares will convert to Class A and A1 shares, respectively, approximately eight years
after purchase. Class C shares will convert to Class A shares approximately ten years after purchase. The fund’s distributions declared to shareholders as reported in the Statements of Changes in Net Assets are
presented by class as follows:
| Six months ended 9/30/23 | Year ended 3/31/23 | |
| Class A | $31,722,385 | $58,735,121 |
| Class B | 21,418 | 45,495 |
| Class C | 791,509 | 1,538,014 |
| Class I | 32,009,558 | 44,058,443 |
| Class R6 | 14,000,898 | 21,227,438 |
| Class A1 | 4,889,317 | 9,291,680 |
| Class B1 | 794 | 1,465 |
| Total | $83,435,879 | $134,897,656 |
133
Notes to Financial
Statements (unaudited) - continued
(3) Transactions with
Affiliates
Investment Adviser — The fund has an investment advisory agreement with MFS to provide overall investment management and related administrative services and facilities to the fund. The management fee is computed daily and paid monthly at the following annual rates based on the fund's average daily net assets:
| Up to $1.3 billion | 0.40% |
| In excess of $1.3 billion and up to $2 billion | 0.37% |
| In excess of $2 billion and up to $5 billion | 0.35% |
| In excess of $5 billion and up to $10 billion | 0.34% |
| In excess of $10 billion | 0.33% |
MFS has agreed in writing to reduce
its management fee by a specified amount if certain MFS mutual fund assets exceed thresholds agreed to by MFS and the fund's Board of Trustees. MFS has also agreed in writing to waive at least 0.01% of its management
fee as part of this agreement. The agreement to waive at least 0.01% of the management fee will continue until modified by the fund's Board of Trustees, but such agreement will continue at least until July 31, 2024.
For the six months ended September 30, 2023, this management fee reduction amounted to $302,786, which is included in the reduction of total expenses in the Statement of Operations. The management fee incurred for the
six months ended September 30, 2023 was equivalent to an annual effective rate of 0.35% of the fund's average daily net assets.
The investment adviser has agreed in
writing to pay a portion of the fund’s total annual operating expenses, excluding interest, taxes, extraordinary expenses, brokerage and transaction costs, certain tax reclaim recovery expenses (including
contingency fees and closing agreement expenses), and investment-related expenses (including interest expense and fees associated with investments in inverse floating rate instruments), such that total fund operating
expenses do not exceed the following rates annually of each class’s average daily net assets:
| Classes | ||||||
| A | B | C | I | R6 | A1 | B1 |
| 0.73% | 1.48% | 1.48% | 0.48% | 0.42% | 0.48% | 1.23% |
This written agreement will continue
until modified by the fund’s Board of Trustees, but such agreement will continue at least until July 31, 2024. For the six months ended September 30, 2023, the fund’s actual operating expenses did not
exceed the limit and therefore, the investment adviser did not pay any portion of the fund’s expenses related to this agreement.
Distributor — MFS Fund Distributors, Inc. (MFD), a wholly-owned subsidiary of MFS, as distributor, received $26,257 and $146 for the six months ended September 30, 2023, as its portion of the
initial sales charge on sales of Class A and Class A1 shares of the fund, respectively.
The Board of Trustees has adopted a
distribution plan for certain share classes pursuant to Rule 12b-1 of the Investment Company Act of 1940.
The fund's distribution plan
provides that the fund will pay MFD for services provided by MFD and financial intermediaries in connection with the distribution and servicing of certain share classes. One component of the plan is a
distribution fee paid to MFD and
134
Notes to Financial
Statements (unaudited) - continued
another component of the plan is a service fee paid
to MFD. MFD may subsequently pay all, or a portion, of the distribution and/or service fees to financial intermediaries. The distribution and service fees are computed daily and paid monthly.
Distribution Plan Fee Table:
| Distribution Fee Rate (d) | Service Fee Rate (d) | Total Distribution Plan (d) | Annual Effective Rate (e) | Distribution and Service Fee | |
| Class A | — | 0.25% | 0.25% | 0.25% | $ 2,399,501 |
| Class B | 0.75% | 0.25% | 1.00% | 1.00% | 8,365 |
| Class C | 0.75% | 0.25% | 1.00% | 1.00% | 308,955 |
| Class B1 | 0.75% | 0.25% | 1.00% | 0.75% | 283 |
| Total Distribution and Service Fees | $2,717,104 |
| (d) | In accordance with the distribution plan for certain classes, the fund pays distribution and/or service fees equal to these annual percentage rates of each class’s average daily net assets. The distribution and service fee rates disclosed by class represent the current rates in effect at the end of the reporting period. Any rate changes, if applicable, are detailed below. |
| (e) | The annual effective rates represent actual fees incurred under the distribution plan for the six months ended September 30, 2023 based on each class's average daily net assets. MFD has agreed in writing to reduce the Class B1 service fee rate to 0.00% for all Class B1 shares. This written agreement will continue until modified by the fund’s Board of Trustees, but such agreement will continue at least until July 31, 2024. For the six months ended September 30, 2023, this reduction amounted to $71 and is included in the reduction of total expenses in the Statement of Operations. MFD has voluntarily agreed to rebate a portion of each class’s 0.25% service fee attributable to accounts for which there is no financial intermediary specified on the account except for accounts attributable to MFS or its affiliates’ seed money. For the six months ended September 30, 2023, this rebate amounted to $277 for Class A shares, and is included in the reduction of total expenses in the Statement of Operations. |
Certain Class A and Class A1
shares are subject to a contingent deferred sales charge (CDSC) in the event of a shareholder redemption within 18 months of purchase. Class B and Class B1 shares are subject to a CDSC in the event of a
shareholder redemption within six years of purchase. Class C shares are subject to a CDSC in the event of a shareholder redemption within 12 months of purchase. All contingent deferred sales charges are paid to
MFD and during the six months ended September 30, 2023, were as follows:
| Amount | |
| Class A | $69,521 |
| Class B | 324 |
| Class C | 2,296 |
| Class A1 | — |
| Class B1 | — |
Shareholder Servicing Agent — MFS Service Center, Inc. (MFSC), a wholly-owned subsidiary of MFS, receives a fee from the fund for its services as shareholder servicing agent calculated as a percentage of the
average daily net assets of the fund as determined periodically under the supervision of the fund's Board of Trustees. For the six months ended September 30, 2023, the fee was $76,931, which equated to 0.0032%
annually of the fund's average daily net assets. MFSC also receives reimbursement from the fund for out-of-pocket expenses, sub-accounting and other
135
Notes to Financial
Statements (unaudited) - continued
shareholder servicing costs which may be paid to
affiliated and unaffiliated service providers. Class R6 shares do not incur sub-accounting fees. For the six months ended September 30, 2023, these out-of-pocket expenses, sub-accounting and other shareholder
servicing costs amounted to $1,401,651.
Administrator — MFS provides certain financial, legal, shareholder communications, compliance, and other administrative services to the fund. Under an administrative services agreement, the
fund reimburses MFS the costs incurred to provide these services. The fund is charged an annual fixed amount of $17,500 plus a fee based on average daily net assets. The administrative services fee is
computed daily and paid monthly. The administrative services fee incurred for the six months ended September 30, 2023 was equivalent to an annual effective rate of 0.0129% of the fund's average daily net
assets.
Trustees’ and Officers’
Compensation — The fund pays compensation to independent Trustees in the form of a retainer, attendance fees, and additional compensation to Board and Committee chairpersons.
Independent Trustees’ compensation is accrued daily and paid subsequent to each Trustee Board meeting. The fund does not pay compensation directly to Trustees or officers of the fund who are also officers
of the investment adviser, all of whom receive remuneration from MFS for their services to the fund. Certain officers and Trustees of the fund are officers or directors of MFS, MFD, and MFSC.
Prior to December 31, 2001, the fund
had an unfunded defined benefit plan (“DB plan”) for independent Trustees. As of December 31, 2001, the Board took action to terminate the DB plan with respect to then-current and any future
independent Trustees, such that the DB plan covers only certain of those former independent Trustees who retired on or before December 31, 2001. The DB plan resulted in a pension expense of $1,162 and is included in
“Independent Trustees’ compensation” in the Statement of Operations for the six months ended September 30, 2023. The deferred retirement benefits compensation fee is accrued daily and paid
monthly.
Other — The fund invests in the MFS Institutional Money Market Portfolio which is managed by MFS and seeks current income consistent with preservation of capital and liquidity. This money
market fund does not pay a management fee to MFS but does incur investment and operating costs.
On August 3, 2022, MFS redeemed 24
shares of Class R6 for an aggregate amount of $200.
At September 30, 2023, MFS held
approximately 83% of the outstanding shares of Class B1.
During the six months ended
September 30, 2023, pursuant to a policy adopted by the Board of Trustees and designed to comply with Rule 17a-7 under the Investment Company Act of 1940 (the “Act”) and relevant guidance, the fund
engaged in purchase transactions with funds and accounts for which MFS serves as investment adviser or sub-adviser (“cross-trades”) which amounted to $10,200,335.
(4) Portfolio Securities
For the six months ended September
30, 2023, purchases and sales of investments, other than short-term obligations, aggregated $765,970,479 and $376,001,665, respectively.
136
Notes to Financial
Statements (unaudited) - continued
(5) Shares of Beneficial
Interest
The fund's Declaration of Trust
permits the Trustees to issue an unlimited number of full and fractional shares of beneficial interest. Transactions in fund shares were as follows:
| Six months ended 9/30/23 | Year ended 3/31/23 | ||||
| Shares | Amount | Shares | Amount | ||
| Shares sold | |||||
| Class A | 32,783,704 | $263,049,316 | 98,284,339 | $797,054,723 | |
| Class B | — | — | 5,526 | 44,658 | |
| Class C | 322,388 | 2,599,356 | 1,468,132 | 11,839,413 | |
| Class I | 54,068,527 | 434,501,080 | 156,596,680 | 1,264,571,253 | |
| Class R6 | 20,795,266 | 166,403,977 | 59,236,837 | 476,571,226 | |
| Class A1 | 28,097 | 226,716 | 156,903 | 1,270,701 | |
| 107,997,982 | $866,780,445 | 315,748,417 | $2,551,351,974 | ||
| Shares issued to shareholders in reinvestment of distributions | |||||
| Class A | 3,850,819 | $30,667,351 | 6,916,062 | $55,945,063 | |
| Class B | 2,674 | 21,347 | 5,455 | 44,109 | |
| Class C | 91,065 | 728,425 | 171,393 | 1,387,960 | |
| Class I | 2,471,061 | 19,659,068 | 3,653,641 | 29,457,906 | |
| Class R6 | 1,665,081 | 13,241,535 | 2,524,493 | 20,334,074 | |
| Class A1 | 533,627 | 4,255,911 | 1,006,421 | 8,124,770 | |
| Class B1 | 99 | 794 | 181 | 1,465 | |
| 8,614,426 | $68,574,431 | 14,277,646 | $115,295,347 | ||
| Shares reacquired | |||||
| Class A | (27,163,822) | $(217,675,419) | (267,143,600) | $(2,188,092,837) | |
| Class B | (38,285) | (307,282) | (111,476) | (903,972) | |
| Class C | (1,457,291) | (11,725,250) | (4,032,515) | (32,685,715) | |
| Class I | (36,291,634) | (289,644,325) | (125,110,537) | (1,010,153,693) | |
| Class R6 | (14,504,762) | (115,898,670) | (51,923,278) | (418,694,789) | |
| Class A1 | (2,533,034) | (20,248,357) | (5,523,112) | (44,626,055) | |
| Class B1 | (610) | (4,897) | (960) | (7,743) | |
| (81,989,438) | $(655,504,200) | (453,845,478) | $(3,695,164,804) | ||
137
Notes to Financial
Statements (unaudited) - continued
| Six months ended 9/30/23 | Year ended 3/31/23 | ||||
| Shares | Amount | Shares | Amount | ||
| Net change | |||||
| Class A | 9,470,701 | $76,041,248 | (161,943,199) | $(1,335,093,051) | |
| Class B | (35,611) | (285,935) | (100,495) | (815,205) | |
| Class C | (1,043,838) | (8,397,469) | (2,392,990) | (19,458,342) | |
| Class I | 20,247,954 | 164,515,823 | 35,139,784 | 283,875,466 | |
| Class R6 | 7,955,585 | 63,746,842 | 9,838,052 | 78,210,511 | |
| Class A1 | (1,971,310) | (15,765,730) | (4,359,788) | (35,230,584) | |
| Class B1 | (511) | (4,103) | (779) | (6,278) | |
| 34,622,970 | $279,850,676 | (123,819,415) | $(1,028,517,483) | ||
Effective June 1, 2019, purchases of
the fund’s Class B and Class B1 shares were closed to new and existing investors subject to certain exceptions.
(6) Line of Credit
The fund and certain other funds
managed by MFS participate in a $1.45 billion unsecured committed line of credit of which $1.2 billion is reserved for use by the fund and certain other MFS U.S. funds. The line of credit is provided by a syndicate of
banks under a credit agreement. Borrowings may be made for temporary financing needs. Interest is charged to each fund, based on its borrowings, generally at a rate equal to the highest of 1) Daily Simple SOFR
(Secured Overnight Financing Rate) plus 0.10%, 2) the Federal Funds Effective Rate, or 3) the Overnight Bank Funding Rate, each plus an agreed upon spread. A commitment fee, based on the average daily unused portion
of the committed line of credit, is allocated among the participating funds. The line of credit expires on March 14, 2024 unless extended or renewed. In addition, the fund and other funds managed by MFS have
established unsecured uncommitted borrowing arrangements with certain banks for temporary financing needs. Interest is charged to each fund, based on its borrowings, at rates equal to customary reference rates plus an
agreed upon spread. For the six months ended September 30, 2023, the fund’s commitment fee and interest expense were $11,581 and $0, respectively, and are included in “Interest expense and fees” in
the Statement of Operations.
(7) Investments in Affiliated
Issuers
An affiliated issuer may be
considered one in which the fund owns 5% or more of the outstanding voting securities, or a company which is under common control. For the purposes of this report, the following were affiliated issuers:
| Affiliated Issuers | Beginning Value | Purchases | Sales Proceeds | Realized Gain (Loss) | Change in Unrealized Appreciation or Depreciation | Ending Value |
| MFS Institutional Money Market Portfolio | $134,031,504 | $497,173,259 | $618,230,186 | $(26,251) | $(22,527) | $12,925,799 |
138
Notes to Financial
Statements (unaudited) - continued
| Affiliated Issuers | Dividend Income | Capital Gain Distributions |
| MFS Institutional Money Market Portfolio | $2,509,361 | $— |
(8) LIBOR Transition
The London Interbank Offered Rate
(LIBOR) was intended to represent the rate at which contributing banks may obtain short-term borrowings from each other in the London interbank market. Certain of the fund's investments, payment obligations, and
financing terms were historically based on LIBOR. In 2017, the United Kingdom Financial Conduct Authority (FCA) announced plans to transition away from LIBOR by the end of 2021. LIBOR's administrator, ICE Benchmark
Administration (IBA), ceased publication (on a representative basis) of many of its LIBOR settings as of December 31, 2021 and ceased publication (on a representative basis) of the remaining U.S. dollar LIBOR settings
as of June 30, 2023. In addition, global regulators announced that, with limited exceptions, no new LIBOR-based contracts should be entered into after 2021. Although the FCA has announced that it will require the IBA
to continue to publish certain select LIBOR rates on a synthetic basis after the relevant cessation dates, such synthetic rates are not considered to be representative of the underlying market and economic reality
they are intended to measure, are expected to be published for a limited time period, and are intended solely for use on a limited basis for legacy transactions.
Regulators and industry groups have
implemented measures to facilitate the transition away from LIBOR and other interbank offered rates to alternative reference rates, such as the Secured Overnight Financing Rate (SOFR). SOFR is a broad measure of the
cost of borrowing cash overnight collateralized by U.S. Treasury securities in the repurchase agreement (repo) market. SOFR is published in various forms including as a daily, compounded, and forward-looking term
rate. The transition to alternative reference rates may affect the liquidity and valuation of investments that were tied to LIBOR or other interbank offered rates and may lead to other consequences affecting
securities and credit markets more broadly. For example, while some investments that were tied to LIBOR provided for an alternative or “fallback” rate-setting methodology in the event LIBOR is not
available, there is uncertainty regarding the effectiveness of any such alternative methodologies to replace LIBOR and certain investments tied to LIBOR may not have fallback provisions. While legislation passed in
the United States facilitates by operation of law the replacement of U.S. dollar LIBOR settings in certain legacy instruments with a specified replacement rate, such as SOFR, there is uncertainty regarding the
effectiveness of such legislation. There also remains uncertainty regarding the willingness and ability of parties to add or amend fallback provisions in certain other legacy instruments maturing after the cessation
of the applicable LIBOR rates, which could create market and litigation risk.
It is difficult to quantify or
predict the impact on the fund resulting from the transition from LIBOR to alternative reference rates and the potential effects of the transition from LIBOR on the fund, or on certain instruments in which
the fund invests, are not known. The transition process may involve, among other things, increased volatility or illiquidity in markets for instruments that relied on LIBOR to determine interest rates. The
transition may also result in a reduction in value of certain LIBOR-related
139
Notes to Financial
Statements (unaudited) - continued
investments held by the fund or reduce the
effectiveness of related transactions such as hedges. Any such effects of the transition away from LIBOR and the adoption of alternative reference rates, as well as other unforeseen effects, could have an adverse
impact on the fund's performance.
With respect to the fund’s
accounting for investments, including investments in certain debt instruments and derivatives, as well as borrowings by the fund and any other contractual arrangements of the fund that undergo reference
rate-related modifications as a result of the transition, management has and will continue to rely upon the relief provided by FASB Codification Topic 848 – Reference Rate Reform (Topic 848). The guidance in
Topic 848 permits the fund to account for such contract modifications made on or before December 31, 2024 as a continuation of the existing contracts. The situation remains fluid, and management believes, based on
best available information, that the impact of the transition will not be material to the fund.
140
Board Review of Investment Advisory
Agreement
MFS Municipal Income Fund
The Investment Company Act of 1940
requires that both the full Board of Trustees and a majority of the non-interested (“independent”) Trustees, voting separately, annually approve the continuation of the Fund’s investment advisory
agreement with MFS. The Trustees consider matters bearing on the Fund and its advisory arrangements at their meetings throughout the year, including a review of performance data at each regular meeting. In
addition, the independent Trustees met several times over the course of three months beginning in May and ending in July, 2023 (“contract review meetings”) for the specific purpose of considering whether
to approve the continuation of the investment advisory agreement for the Fund and the other investment companies that the Board oversees (the “MFS Funds”). The independent Trustees were assisted in
their evaluation of the Fund’s investment advisory agreement by independent legal counsel, from whom they received separate legal advice and with whom they met separately from MFS during various contract review
meetings. The independent Trustees were also assisted in this process by an independent consultant who was retained by and reported to the independent Trustees.
In connection with their
deliberations regarding the continuation of the investment advisory agreement, the Trustees, including the independent Trustees, considered such information and factors as they believed, in light of the legal advice
furnished to them and their own business judgment, to be relevant. The investment advisory agreement for the Fund was considered separately, although the Trustees also took into account the common interests of
all MFS Funds in their review. As described below, the Trustees considered the nature, quality, and extent of the various investment advisory, administrative, and shareholder services performed by MFS under the
existing investment advisory agreement and other arrangements with the Fund.
In connection with their contract
review meetings, the Trustees received and relied upon materials that included, among other items: (i) information provided by Broadridge Financial Solutions, Inc. (“Broadridge”), an independent third
party, on the investment performance of the Fund for various time periods ended December 31, 2022 and the investment performance of a group of funds with substantially similar investment classifications/objectives
(the “Broadridge performance universe”), (ii) information provided by Broadridge on the Fund’s advisory fees and other expenses and the advisory fees and other expenses of comparable funds identified
by Broadridge as well as all other funds in the same investment classification/category (the “Broadridge expense group and universe”), (iii) information provided by MFS on the advisory fees of portfolios
of other clients of MFS, including institutional separate accounts and other clients, (iv) information as to whether and to what extent applicable expense waivers, reimbursements or fee “breakpoints” are
observed for the Fund, (v) information regarding MFS’ financial results and financial condition, including MFS’ and certain of its affiliates’ estimated profitability from services performed for the
Fund and the MFS Funds as a whole, and compared to MFS’ institutional business, (vi) MFS’ views regarding the outlook for the mutual fund industry and the strategic business plans of MFS, (vii)
descriptions of various functions performed by MFS for the Funds, such as compliance monitoring and portfolio trading practices, and (viii) information regarding the overall organization of MFS, including information
about
141
Board Review of Investment Advisory
Agreement - continued
MFS’ senior management and other personnel
providing investment advisory, administrative and other services to the Fund and the other MFS Funds. The comparative performance, fee and expense information prepared and provided by Broadridge was not
independently verified and the independent Trustees did not independently verify any information provided to them by MFS.
The Trustees’ conclusion as to
the continuation of the investment advisory agreement was based on a comprehensive consideration of all information provided to the Trustees and not the result of any single factor. Some of the factors that
figured particularly in the Trustees’ deliberations are described below, although individual Trustees may have evaluated the information presented differently from one another, giving different weights to
various factors. It is also important to recognize that the fee arrangements for the Fund and other MFS Funds are the result of years of review and discussion between the independent Trustees and MFS, that
certain aspects of such arrangements may receive greater scrutiny in some years than in others, and that the Trustees’ conclusions may be based, in part, on their consideration of these same arrangements during
the course of the year and in prior years.
Based on information provided by
Broadridge and MFS, the Trustees reviewed the Fund’s total return investment performance as well as the Broadridge performance universe over various time periods. The Trustees placed particular emphasis on
the total return performance of the Fund’s Class I shares in comparison to the performance of funds in its Broadridge performance universe over the five-year period ended December 31, 2022, which the Trustees
believed was a long enough period to reflect differing market conditions. The total return performance of the Fund’s Class I shares was in the 2nd quintile relative to the other funds in the universe for
this five-year period (the 1st quintile being the best performers and the 5th quintile being the worst performers). The total return performance of the Fund’s Class I shares was in the 2nd quintile for
each of the one- and three-year periods ended December 31, 2022 relative to the Broadridge performance universe. Because of the passage of time, these performance results may differ from the performance results
for more recent periods, including those shown elsewhere in this report.
In the course of their
deliberations, the Trustees took into account information provided by MFS in connection with the contract review meetings, as well as during investment review meetings conducted with portfolio management personnel
during the course of the year regarding the Fund’s performance. After reviewing these and related factors, the Trustees concluded, within the context of their overall conclusions regarding the investment
advisory agreement, that they were satisfied with MFS’ responses and efforts relating to investment performance.
In assessing the reasonableness of
the Fund’s advisory fee, the Trustees considered, among other information, the Fund’s advisory fee and the total expense ratio of the Fund’s Class I shares as a percentage of average daily net assets
and the advisory fee and total expense ratios of the Broadridge expense group based on information provided by Broadridge. The Trustees considered that MFS currently observes an expense limitation for the Fund,
which may not be changed without the Trustees’ approval. The Trustees also considered that, according to the data provided by
142
Board Review of Investment Advisory
Agreement - continued
Broadridge (which takes into account any fee
reductions or expense limitations that were in effect during the Fund’s last fiscal year), the Fund’s effective advisory fee rate and total expense ratio were each approximately at the Broadridge expense
group median.
The Trustees also considered the
advisory fees charged by MFS to any institutional separate accounts advised by MFS (“separate accounts”) and unaffiliated investment companies for which MFS serves as subadviser (“subadvised
funds”) that have comparable investment strategies to the Fund, if any. In comparing these fees, the Trustees considered information provided by MFS as to the generally broader scope of services provided
by MFS to the Fund, as well as the more extensive regulatory burdens imposed on MFS in managing the Fund, in comparison to separate accounts and subadvised funds. The Trustees also considered the higher demands
placed on MFS’ investment personnel and trading infrastructure as a result of the daily cash in-flows and out-flows of the Fund in comparison to separate accounts.
The Trustees also considered whether
the Fund may benefit from any economies of scale in the management of the Fund in the event of growth in assets of the Fund and/or growth in assets of the MFS Funds as a whole. They noted that the Fund’s
advisory fee rate schedule is subject to contractual breakpoints that reduce the Fund’s advisory fee rate on average daily net assets over $1.3 billion, $2 billion, $5 billion and $10 billion. The Trustees
also noted that MFS has agreed in writing to waive a portion of the management fees of certain MFS Funds, including the Fund, if the total combined assets of certain funds within the MFS Funds’ complex increase
above agreed upon thresholds (the “group fee waiver”), enabling the Fund’s shareholders to share in the benefits from any economies of scale at the complex level. The group fee waiver is
reviewed and renewed annually between the Board and MFS. The Trustees concluded that the breakpoints and the group fee waiver were sufficient to allow the Fund to benefit from economies of scale as its assets
and overall complex assets grow.
The Trustees also considered
information prepared by MFS relating to MFS’ costs and profits with respect to the Fund, the MFS Funds considered as a group, and other investment companies and accounts advised by MFS, as well as MFS’
methodologies used to determine and allocate its costs to the MFS Funds, the Fund and other accounts and products for purposes of estimating profitability.
After reviewing these and other
factors described herein, the Trustees concluded, within the context of their overall conclusions regarding the investment advisory agreement, that the advisory fees charged to the Fund represent reasonable
compensation in light of the services being provided by MFS to the Fund.
In addition, the Trustees considered
MFS’ resources and related efforts to continue to retain, attract and motivate capable personnel to serve the Fund. The Trustees also considered current and developing conditions in the financial services
industry, including the presence of large and well-capitalized companies which are spending, and appear to be prepared to continue to spend, substantial sums to engage personnel and to provide services to competing
investment companies. In this regard, the Trustees also considered the financial resources of MFS and its ultimate parent, Sun Life Financial Inc. The Trustees also considered the advantages and possible
disadvantages to the Fund of having an adviser that also serves other investment companies as well as other accounts.
143
Board Review of Investment Advisory
Agreement - continued
The Trustees also considered the
nature, quality, cost, and extent of administrative, transfer agency, and distribution services provided to the Fund by MFS and its affiliates under agreements and plans other than the investment advisory agreement,
including any 12b-1 fees the Fund pays to MFS Fund Distributors, Inc., an affiliate of MFS. The Trustees also considered the nature, extent and quality of certain other services MFS performs or arranges for on
the Fund’s behalf, which may include securities lending programs, directed expense payment programs, class action recovery programs, and MFS’ interaction with third-party service providers, principally
custodians and sub-custodians. The Trustees concluded that the various non-advisory services provided by MFS and its affiliates on behalf of the Fund were satisfactory.
The Trustees considered so-called
“fall-out benefits” to MFS such as reputational value derived from serving as investment manager to the MFS Funds. The Trustees also considered that MFS discontinued its historic practice of
obtaining investment research from portfolio brokerage commissions paid by certain MFS Funds effective January 2018, and directly pays or voluntarily reimburses a Fund, if applicable, for the costs of external
research acquired through the use of the Fund’s portfolio brokerage commissions.
Based on their evaluation of factors
that they deemed to be material, including those factors described above, the Board of Trustees, including the independent Trustees, concluded that the Fund’s investment advisory agreement with MFS should be
continued for an additional one-year period, commencing August 1, 2023.
144
Proxy Voting Policies and
Information
MFS votes proxies on behalf of the
fund pursuant to proxy voting policies and procedures that are available without charge, upon request, by calling 1-800-225-2606, by visiting mfs.com/proxyvoting, or by visiting the SEC’s Web site at http://www.sec.gov.
Information regarding how the fund
voted proxies relating to portfolio securities during the most recent twelve-month period ended June 30 is available by August 31 of each year without charge by visiting mfs.com/proxyvoting, or by visiting the SEC’s Web site at http://www.sec.gov.
Quarterly Portfolio
Disclosure
The fund files a complete schedule
of portfolio holdings with the SEC for the first and third quarters of each fiscal year as an exhibit to its reports on Form N-PORT. The fund's Form N-PORT reports are available on the SEC's Web site at http://www.sec.gov. A shareholder can obtain the portfolio holdings report for the first and third quarters of the fund's fiscal year at mfs.com/openendfunds by choosing the fund's name and then scrolling to the “Resources” section and clicking on the “Prospectus and Reports” tab.
Further Information
From time to time, MFS may post
important information about the fund or the MFS Funds on the MFS Web site (mfs.com). This information is available at https://www.mfs.com/announcements or at mfs.com/openendfunds by choosing the fund’s name and then scrolling to the “Resources” section and clicking on the “Announcements” tab, if any.
Information About Fund
Contracts and Legal Claims
The fund has entered into
contractual arrangements with an investment adviser, administrator, distributor, shareholder servicing agent, and custodian who each provide services to the fund. Unless expressly stated otherwise, shareholders are
not parties to, or intended beneficiaries of these contractual arrangements, and these contractual arrangements are not intended to create any shareholder right to enforce them against the service providers or to seek
any remedy under them against the service providers, either directly or on behalf of the fund.
Under the Trust’s By-Laws and
Declaration of Trust, any claims asserted against or on behalf of the MFS Funds, including claims against Trustees and Officers, must be brought in state and federal courts located within the Commonwealth of
Massachusetts.
Provision of Financial
Reports and Summary Prospectuses
The fund produces financial reports
every six months and updates its summary prospectus and prospectus annually. To avoid sending duplicate copies of materials to households, only one copy of the fund’s annual and semiannual report and summary
prospectus may be mailed to shareholders having the same last name and residential address on the fund’s records. However, any shareholder may contact MFSC (please see back cover for address and telephone
number) to request that copies of these reports and summary prospectuses be sent personally to that shareholder.
145


Semiannual Report
September 30, 2023
MFS® Municipal
Intermediate Fund
Intermediate Fund

MIU-SEM
MFS® Municipal
Intermediate Fund
Intermediate Fund
CONTENTS
| 1 | |
| 3 | |
| 5 | |
| 29 | |
| 31 | |
| 32 | |
| 33 | |
| 37 | |
| 48 | |
| 52 | |
| 52 | |
| 52 | |
| 52 | |
| 52 |
| back cover |
The report is prepared for the
general information of shareholders. It is authorized for distribution to prospective investors only when preceded or accompanied by a current prospectus.
NOT FDIC INSURED
• MAY LOSE VALUE • NO BANK GUARANTEE
Portfolio Composition

| (a) | For all securities other than those specifically described below, ratings are assigned to underlying securities utilizing ratings from Moody’s, Fitch, and Standard & Poor’s rating agencies and applying the following hierarchy: If all three agencies provide a rating, the middle rating (after dropping the highest and lowest ratings) is assigned; if two of the three agencies rate a security, the lower of the two is assigned. If none of the 3 rating agencies above assign a rating, but the security is rated by DBRS Morningstar, then the DBRS Morningstar rating is assigned. If none of the 4 rating agencies listed above rate the security, but the security is rated by the Kroll Bond Rating Agency (KBRA), then the KBRA rating is assigned. Ratings are shown in the S&P and Fitch scale (e.g., AAA). Securities rated BBB or higher are considered investment grade. All ratings are subject to change. Not Rated includes fixed income securities and fixed income derivatives that have not been rated by any rating agency. The fund may or may not have held all of these instruments on this date. The fund is not rated by these agencies. |
1
Portfolio Composition - continued
| (d) | Duration is a measure of how much a bond’s price is likely to fluctuate with general changes in interest rates, e.g., if rates rise 1.00%, a bond with a 5-year duration is likely to lose about 5.00% of its value due to the interest rate move. The Average Duration calculation reflects the impact of the equivalent exposure of derivative positions, if any. |
| (i) | For purposes of this presentation, the components include the value of securities, and reflect the impact of the equivalent exposure of derivative positions, if any. These amounts may be negative from time to time. Equivalent exposure is a calculated amount that translates the derivative position into a reasonable approximation of the amount of the underlying asset that the portfolio would have to hold at a given point in time to have the same price sensitivity that results from the portfolio’s ownership of the derivative contract. When dealing with derivatives, equivalent exposure is a more representative measure of the potential impact of a position on portfolio performance than value. The bond component will include any accrued interest amounts. |
| (m) | In determining each instrument’s effective maturity for purposes of calculating the fund’s dollar-weighted average effective maturity, MFS uses the instrument’s stated maturity or, if applicable, an earlier date on which MFS believes it is probable that a maturity-shortening feature (such as a put, pre-refunding or prepayment) will cause the instrument to be repaid. Such an earlier date can be substantially shorter than the instrument’s stated maturity. |
| (o) | Less than 0.1%. |
Cash & Cash Equivalents includes
any cash, investments in money market funds, short-term securities, and other assets less liabilities. Please see the Statement of Assets and Liabilities for additional information related to the fund’s cash
position and other assets and liabilities.
Percentages are based on net assets
as of September 30, 2023.
The portfolio is actively managed
and current holdings may be different.
2
Expense Table
Fund expenses borne by the
shareholders during the period,
April 1, 2023 through September 30, 2023
April 1, 2023 through September 30, 2023
As a shareholder of the fund, you
incur two types of costs: (1) transaction costs, including sales charges (loads) on certain purchase or redemption payments, and (2) ongoing costs, including management fees; distribution and service (12b-1) fees; and
other fund expenses. This example is intended to help you understand your ongoing costs (in dollars) of investing in the fund and to compare these costs with the ongoing costs of investing in other mutual funds.
The example is based on an
investment of $1,000 invested at the beginning of the period and held for the entire period April 1, 2023 through September 30, 2023.
Actual Expenses
The first line for each share class
in the following table provides information about actual account values and actual expenses. You may use the information in this line, together with the amount you invested, to estimate the expenses that you paid over
the period. Simply divide your account value by $1,000 (for example, an $8,600 account value divided by $1,000 = 8.6), then multiply the result by the number in the first line under the heading entitled
“Expenses Paid During Period” to estimate the expenses you paid on your account during this period.
Hypothetical Example for
Comparison Purposes
The second line for each share class
in the following table provides information about hypothetical account values and hypothetical expenses based on the fund’s actual expense ratio and an assumed rate of return of 5% per year before expenses,
which is not the fund’s actual return. The hypothetical account values and expenses may not be used to estimate the actual ending account balance or expenses you paid for the period. You may use this information
to compare the ongoing costs of investing in the fund and other funds. To do so, compare this 5% hypothetical example with the 5% hypothetical examples that appear in the shareholder reports of the other funds.
Please note that the expenses shown
in the table are meant to highlight your ongoing costs only and do not reflect any transactional costs, such as sales charges (loads). Therefore, the second line for each share class in the table is useful in
comparing ongoing costs only, and will not help you determine the relative total costs of owning different funds. In addition, if these transactional costs were included, your costs would have been higher.
3
Expense Table - continued
| Share Class | Annualized Expense Ratio | Beginning Account Value 4/01/23 | Ending Account Value 9/30/23 | Expenses Paid During Period (p) 4/01/23-9/30/23 | |
| A | Actual | 0.70% | $1,000.00 | $967.02 | $3.44 |
| Hypothetical (h) | 0.70% | $1,000.00 | $1,021.50 | $3.54 | |
| C | Actual | 1.45% | $1,000.00 | $963.37 | $7.12 |
| Hypothetical (h) | 1.45% | $1,000.00 | $1,017.75 | $7.31 | |
| I | Actual | 0.45% | $1,000.00 | $968.25 | $2.21 |
| Hypothetical (h) | 0.45% | $1,000.00 | $1,022.75 | $2.28 | |
| R6 | Actual | 0.38% | $1,000.00 | $968.44 | $1.87 |
| Hypothetical (h) | 0.38% | $1,000.00 | $1,023.10 | $1.92 |
| (h) | 5% class return per year before expenses. |
| (p) | “Expenses Paid During Period” are equal to each class’s annualized expense ratio, as shown above, multiplied by the average account value over the period, multiplied by 183/366 (to reflect the one-half year period). Expenses paid do not include any applicable sales charges (loads). If these transaction costs had been included, your costs would have been higher. |
4
Portfolio of Investments
9/30/23 (unaudited)
The Portfolio of Investments is a
complete list of all securities owned by your fund. It is categorized by jurisdiction.
| Issuer | Shares/Par | Value ($) | ||
| Municipal Bonds - 97.1% | ||||
| Alabama - 4.4% | ||||
| Alabama Housing Finance Authority, Multi-Family Housing Rev. (Maryvale Place Project), “F”, HUD Section 8, 4%, 10/01/2025 (Put Date 4/01/2025) | $ | 355,000 | $349,757 | |
| Birmingham-Jefferson, AL, Civic Center Authority, “B”, 5%, 7/01/2043 | 495,000 | 493,717 | ||
| Black Belt Energy Gas District, AL, Gas Project Rev., “A”, 4%, 6/01/2051 (Put Date 12/01/2031) | 185,000 | 174,432 | ||
| Black Belt Energy Gas District, AL, Gas Project Rev., “F”, 5.5%, 11/01/2053 (Put Date 12/01/2028) | 345,000 | 352,405 | ||
| Black Belt Energy Gas District, AL, Gas Supply Rev., “B”, 5.25%, 12/01/2053 (Put Date 12/01/2030) | 250,000 | 256,428 | ||
| Black Belt Energy Gas District, AL, Gas Supply Rev., “D-1”, 4%, 7/01/2052 (Put Date 6/01/2027) | 315,000 | 306,749 | ||
| Mobile, AL, Industrial Development Board Pollution Control Rev. (Alabama Power Co. Barry Plant Project), “C”, 3.78%, 6/01/2034 (Put Date 6/16/2026) | 1,000,000 | 981,937 | ||
| Mobile, AL, Infirmary Health System Special Care Facilities Financing Authority Rev. (Infirmary Health System, Inc.), “A”, 4%, 2/01/2037 | 1,110,000 | 997,656 | ||
| Southeast Alabama Energy Authority Commodity Supply Rev. (Project No. 2), “A”, 4%, 12/01/2051 (Put Date 12/01/2031) | 750,000 | 697,564 | ||
| Southeast Alabama Energy Authority Commodity Supply Rev. (Project No. 3), “A-1”, 5.5%, 1/01/2053 (Put Date 12/01/2029) | 215,000 | 220,634 | ||
| Southeast Alabama Energy Authority Commodity Supply Rev. (Project No. 4), “B-1”, 5%, 5/01/2053 (Put Date 8/01/2028) | 480,000 | 479,427 | ||
| Southeast Alabama Energy Authority Commodity Supply Rev. (Project No. 5), “A”, 5.25%, 1/01/2054 (Put Date 7/01/2029) | 1,000,000 | 1,006,490 | ||
| $6,317,196 | ||||
| Alaska - 0.3% | ||||
| Alaska Housing Finance Corp., General Mortgage Rev. II, “C”, 5.75%, 12/01/2052 | $ | 360,000 | $371,953 | |
| Arizona - 3.6% | ||||
| Arizona Industrial Development Authority Education Rev. (Academies of Math & Science Projects), 4.5%, 7/01/2033 | $ | 515,000 | $497,219 | |
| Arizona Industrial Development Authority Education Rev. (Benjamin Franklin Charter School Projects), “A”, 4.43%, 7/01/2033 | 500,000 | 466,465 | ||
| Arizona Industrial Development Authority Education Rev. (Great Hearts Arizona Projects), “A”, 5%, 7/01/2026 | 125,000 | 126,681 | ||
5
Portfolio of Investments (unaudited)
– continued
| Issuer | Shares/Par | Value ($) | ||
| Municipal Bonds - continued | ||||
| Arizona - continued | ||||
| Chandler, AZ, Industrial Development Authority Rev. (Intel Corp. Project), 5%, 9/01/2052 (Put Date 9/01/2027) | $ | 1,255,000 | $1,269,006 | |
| Coconino County, AZ, Pollution Control Refunding Rev. (Nevada Power Co. Projects), “A”, 4.125%, 9/01/2032 (Put Date 3/31/2026) | 155,000 | 152,565 | ||
| Glendale, AZ, Industrial Development Authority, Graduate & Professional Student Loan Program Rev. (Midwestern University Foundation), “A”, 2.125%, 7/01/2033 | 5,000 | 3,753 | ||
| Maricopa County, AZ, Pollution Control Corp. Rev. (Public Service Company of New Mexico Palo Verde Project), “B”, 0.875%, 6/01/2043 (Put Date 10/01/2026) | 15,000 | 13,081 | ||
| Phoenix, AZ, Industrial Development Authority, Solid Waste Disposal Rev. (Republic Services, Inc. Project), 4.125%, 12/01/2035 (Put Date 11/01/2023) | 1,500,000 | 1,499,290 | ||
| Phoenix, AZ, Industrial Development Authority, Student Housing Refunding Rev. (Downtown Phoenix Student Housing LLC - Arizona State University Project), “A”, 5%, 7/01/2026 | 200,000 | 201,924 | ||
| Pima County, AZ, Industrial Development Authority Senior Living Rev. (La Posada at Pusch Ridge Project), “B3”, 5.125%, 11/15/2029 (n) | 245,000 | 241,015 | ||
| Sierra Vista, AZ, Industrial Development Authority, Education Facility Rev. (American Leadership Academy Project), 5.25%, 6/14/2038 | 500,000 | 476,803 | ||
| Tempe, AZ, Industrial Development Authority Rev. (Friendship Village of Tempe Project), “A”, 4%, 12/01/2026 | 245,000 | 235,552 | ||
| $5,183,354 | ||||
| Arkansas - 0.1% | ||||
| Arkansas Development Finance Authority, Healthcare Facilities Rev. (Carti Surgery Center Project), “B”, 4%, 7/01/2027 | $ | 125,000 | $120,231 | |
| California - 3.3% | ||||
| California Community Choice Financing Authority, Clean Energy Project Rev., “C”, 5.25%, 1/01/2054 (Put Date 10/01/2031) | $ | 770,000 | $768,184 | |
| California Infrastructure & Economic Development Bank Rev. (Brightline West Passenger Rail), “A”, 3.65%, 1/01/2050 (Put Date 1/31/2024) (n) | 530,000 | 526,762 | ||
| California Municipal Finance Authority Refunding Rev. (William Jessup University), 5%, 8/01/2027 | 500,000 | 490,426 | ||
| California Municipal Finance Authority, COP (Palomar Health), “A”, AGM, 5.25%, 11/01/2034 | 1,000,000 | 1,103,684 | ||
| California Municipal Finance Authority, Solid Waste Disposal Rev. (Waste Management, Inc. Project), “A”, 4.125%, 10/01/2041 (Put Date 10/01/2025) | 50,000 | 49,637 | ||
| California School Finance Authority, Charter School Rev. (Aspire Public Schools - Obligated Group), “A”, 5%, 8/01/2032 (n) | 500,000 | 504,865 | ||
6
Portfolio of Investments (unaudited)
– continued
| Issuer | Shares/Par | Value ($) | ||
| Municipal Bonds - continued | ||||
| California - continued | ||||
| California School Finance Authority, Charter School Rev. (Partnerships to Uplift Communities Project), 5%, 8/01/2033 | $ | 715,000 | $714,126 | |
| California Statewide Communities Development Authority Rev. (Adventist Health System West), “A”, 4.125%, 3/01/2034 | 90,000 | 86,681 | ||
| California Statewide Communities Development Authority Rev. (American Baptist Homes of the West), 5%, 10/01/2027 | 90,000 | 90,677 | ||
| California Statewide Communities Development Authority Rev. (Loma Linda University Medical Center), “A”, 5.25%, 12/01/2044 | 130,000 | 122,035 | ||
| California Statewide Communities Development Authority Rev. (University of California, Irvine East Campus Apartments Phase IV-A CHF Irvine LLC), 5%, 5/15/2030 | 80,000 | 82,096 | ||
| Los Angeles County, CA, Development Authority, Multi-Family Housing Mortgage Rev. (2111 Firestone), “E”, 5%, 7/01/2043 (Put Date 7/01/2026) | 221,000 | 224,198 | ||
| $4,763,371 | ||||
| Colorado - 1.4% | ||||
| Colorado Health Facilities Authority Rev. (Christian Living Neighborhoods), 4%, 1/01/2026 | $ | 125,000 | $121,544 | |
| Colorado Health Facilities Authority Rev. (CommonSpirit Health), “A”, 5.25%, 11/01/2037 | 1,000,000 | 1,033,151 | ||
| Denver, CO, City & County Airport Systems Rev., “A”, 5%, 11/15/2031 | 750,000 | 789,323 | ||
| $1,944,018 | ||||
| Connecticut - 3.0% | ||||
| Connecticut Health & Educational Facilities Authority Rev. (Masonicare), “F”, 4%, 7/01/2030 | $ | 1,000,000 | $929,171 | |
| Connecticut Higher Education Supplemental Loan Authority Rev. (CHESLA Loan Program), “B”, 5%, 11/15/2031 | 1,530,000 | 1,567,926 | ||
| Connecticut Higher Education Supplemental Loan Authority, “B”, 5%, 11/15/2024 | 250,000 | 251,393 | ||
| Connecticut Housing Finance Authority Rev. (Housing Mortgage Finance Program), “E-1”, GNMA, 5.5%, 11/15/2052 | 610,000 | 624,418 | ||
| Great Pond, CT, Improvement District Special Obligation Rev. (Great Pond Phase II Project), 5%, 10/01/2035 (n) | 890,000 | 874,259 | ||
| $4,247,167 | ||||
| District of Columbia - 1.1% | ||||
| District of Columbia Rev. (Rocketship D.C.), “A”, 5%, 6/01/2049 (n) | $ | 250,000 | $207,515 | |
| District of Columbia Student Dormitory Rev. (Provident Group - Howard Properties LLC), 5%, 10/01/2045 | 100,000 | 88,430 | ||
| District of Columbia, Housing Finance Agency, Multi-Family Development Program, “B-2”, 0.5%, 3/01/2027 (Put Date 10/01/2024) | 260,000 | 247,854 | ||
7
Portfolio of Investments (unaudited)
– continued
| Issuer | Shares/Par | Value ($) | ||
| Municipal Bonds - continued | ||||
| District of Columbia - continued | ||||
| Metropolitan Washington, D.C., Airport Authority System Refunding Rev., “A”, 5%, 9/30/2034 | $ | 1,000,000 | $992,864 | |
| $1,536,663 | ||||
| Florida - 5.3% | ||||
| Florida Development Finance Corp. Senior Living Rev. (Mayflower Retirement Community Project), “A”, 4%, 6/01/2028 (n) | $ | 500,000 | $447,969 | |
| Florida Higher Educational Facilities Financing Authority Rev. (Jacksonville University Project), “A”, 4.75%, 6/01/2038 (n) | 500,000 | 443,156 | ||
| Florida Housing Finance Corp., Multi-Family Mortgage Rev. (Hampton Point Apartments), “E”, 5%, 5/01/2026 (Put Date 5/01/2025) | 400,000 | 403,096 | ||
| Florida Housing Finance Corp., Multi-Family Mortgage Rev. (Northside Transit Village III), “B”, GNMA, 5%, 2/01/2027 (Put Date 2/01/2026) | 450,000 | 454,829 | ||
| Miami-Dade County, FL, Housing Finance Authority Multi-Family Rev. (Quail Roost Transit Village I), HUD Section 8, 5%, 9/01/2026 (Put Date 9/01/2025) | 500,000 | 502,518 | ||
| Miami-Dade County, FL, Seaport Refunding Rev., “A”, 5%, 10/01/2036 | 1,000,000 | 1,021,086 | ||
| Orange County, FL, Health Facilities Authority Rev. (Presbyterian Retirement Communities Obligated Group Project), “A”, 4%, 8/01/2036 | 1,000,000 | 882,068 | ||
| Palm Beach County, FL, Health Facilities Authority Hospital Rev. (Jupiter Medical Center Project), “A”, 5%, 11/01/2033 | 350,000 | 354,922 | ||
| Palm Beach County, FL, Health Facilities Authority Rev. (Toby & Leon Cooperman Sinai Residences of Boca Raton), 4%, 6/01/2026 | 300,000 | 290,060 | ||
| Pasco County, FL, Capital Improvement Cigarette Tax Allocation, “A”, AGM, 5.5%, 9/01/2038 | 1,000,000 | 1,075,799 | ||
| Pompano Beach, FL, Refunding Rev. (John Knox Village Project), 4%, 9/01/2040 | 100,000 | 79,019 | ||
| Pompano Beach, FL, Rev. (John Knox Village Project), “A”, 4%, 9/01/2036 | 550,000 | 465,787 | ||
| St. John's County, FL, Industrial Development Authority, Senior Living Rev. (Vicars Landing Project), “A”, 4%, 12/15/2026 | 190,000 | 180,819 | ||
| Wildwood, FL, Special Assessment Rev. (Village Community Development District No. 15), 4.375%, 5/01/2033 | 1,000,000 | 972,126 | ||
| $7,573,254 | ||||
8
Portfolio of Investments (unaudited)
– continued
| Issuer | Shares/Par | Value ($) | ||
| Municipal Bonds - continued | ||||
| Georgia - 4.0% | ||||
| Bartow County, GA, Development Authority Pollution Control Rev. (Georgia Power Co. Plant Bowen Project), 3.95%, 12/01/2032 (Put Date 3/08/2028) | $ | 505,000 | $487,338 | |
| Burke County, GA, Development Authority Pollution Control Rev. (Georgia Power Co. Plant Vogtle Project), 3.8%, 10/01/2032 (Put Date 5/21/2026) | 250,000 | 243,735 | ||
| Georgia Main Street Natural Gas, Inc., Gas Supply Rev., “A”, 5%, 6/01/2053 (Put Date 6/01/2030) | 1,000,000 | 991,757 | ||
| Georgia Main Street Natural Gas, Inc., Gas Supply Rev., “B”, 4%, 8/01/2049 (Put Date 12/02/2024) | 775,000 | 770,024 | ||
| Georgia Main Street Natural Gas, Inc., Gas Supply Rev., “B”, 5%, 12/01/2052 (Put Date 6/01/2029) | 500,000 | 499,067 | ||
| Georgia Main Street Natural Gas, Inc., Gas Supply Rev., “C”, 5%, 9/01/2053 (Put Date 9/01/2030) | 455,000 | 459,746 | ||
| Georgia Municipal Electric Authority (Plant Vogtle Units 3 & 4 Project J), “A”, AGM, 5%, 7/01/2037 | 250,000 | 262,000 | ||
| Georgia Municipal Electric Authority (Plant Vogtle Units 3 & 4 Project J), “A”, AGM, 5%, 7/01/2038 | 250,000 | 259,880 | ||
| Georgia Municipal Electric Authority (Plant Vogtle Units 3 & 4 Project J), “A”, AGM, 5%, 7/01/2039 | 250,000 | 258,794 | ||
| Georgia Municipal Electric Authority (Plant Vogtle Units 3 & 4 Project J), “A”, AGM, 5%, 7/01/2040 | 500,000 | 515,557 | ||
| Georgia Private Colleges & Universities Authority Rev. (Emory University), “B”, 4%, 9/01/2039 | 985,000 | 947,352 | ||
| $5,695,250 | ||||
| Guam - 1.1% | ||||
| Guam Government Business Privilege Tax Refunding, “F”, 5%, 1/01/2028 | $ | 100,000 | $100,423 | |
| Guam Government Business Privilege Tax Refunding, “F”, 5%, 1/01/2030 | 5,000 | 4,985 | ||
| Guam Government Business Privilege Tax Refunding, “F”, 5%, 1/01/2031 | 5,000 | 4,967 | ||
| Guam Government Business Privilege Tax Refunding, “F”, 4%, 1/01/2042 | 30,000 | 24,279 | ||
| Guam Government Business Privilege Tax Rev., “D”, 5%, 11/15/2031 | 270,000 | 266,106 | ||
| Guam Government Limited Obligation Rev., “A”, 5%, 12/01/2036 | 60,000 | 58,569 | ||
| Guam Government Limited Obligation Rev., “A”, 5%, 12/01/2046 | 175,000 | 153,460 | ||
| Guam International Airport Authority Rev., Taxable (A.B. Won Pat Airport), “A”, 2.699%, 10/01/2026 | 25,000 | 22,487 | ||
| Guam International Airport Authority Rev., Taxable (A.B. Won Pat Airport), “A”, 3.489%, 10/01/2031 | 55,000 | 43,785 | ||
9
Portfolio of Investments (unaudited)
– continued
| Issuer | Shares/Par | Value ($) | ||
| Municipal Bonds - continued | ||||
| Guam - continued | ||||
| Guam Waterworks Authority Rev. (Water and Wastewater System), 5%, 7/01/2036 | $ | 65,000 | $65,004 | |
| Guam Waterworks Authority Rev. (Water and Wastewater System), 5%, 7/01/2036 | 110,000 | 109,944 | ||
| Guam Waterworks Authority Rev. (Water and Wastewater System), 5%, 7/01/2037 | 135,000 | 132,978 | ||
| Guam Waterworks Authority Rev. (Water and Wastewater System), 5%, 7/01/2040 | 380,000 | 365,282 | ||
| Guam Waterworks Authority Rev. (Water and Wastewater System), 5%, 1/01/2046 | 300,000 | 282,742 | ||
| $1,635,011 | ||||
| Idaho - 0.0% | ||||
| Idaho Housing and Finance Association Multi-Family Housing Rev. (Sunset Landing Apartments Project), “A”, 0.7%, 7/01/2024 | $ | 60,000 | $58,380 | |
| Illinois - 5.5% | ||||
| Bridgeview, IL, Stadium and Redevelopment Projects, Taxable, AAC, 5.14%, 12/01/2036 | $ | 245,000 | $211,502 | |
| Chicago, IL, Board of Education, “A”, NPFG, 5.5%, 12/01/2026 | 70,000 | 70,715 | ||
| Chicago, IL, Board of Education, Dedicated Capital Improvement Tax Bond, 5%, 4/01/2041 | 1,000,000 | 1,003,874 | ||
| Chicago, IL, Board of Education, Unlimited Tax General Obligation Refunding Dedicated Rev., “A”, 5%, 12/01/2030 | 500,000 | 506,521 | ||
| Chicago, IL, Board of Education, Unlimited Tax General Obligation Refunding Dedicated Rev., “B”, 4%, 12/01/2041 | 225,000 | 184,902 | ||
| Chicago, IL, General Obligation (Neighborhood Alive 21 Program), “B”, 5.5%, 1/01/2037 | 45,000 | 45,216 | ||
| Chicago, IL, General Obligation, “A”, 5%, 1/01/2025 | 145,000 | 146,128 | ||
| Chicago, IL, General Obligation, “A”, 5%, 1/01/2027 | 45,000 | 45,979 | ||
| Chicago, IL, General Obligation, “A”, 5.25%, 1/01/2038 | 1,000,000 | 1,012,660 | ||
| Chicago, IL, General Obligation, Refunding, “A”, 5.625%, 1/01/2031 | 100,000 | 103,857 | ||
| Chicago, IL, Midway Airport Rev., “A”, 5%, 1/01/2026 | 135,000 | 136,315 | ||
| Chicago, IL, Multi-Family Housing Rev. (Covent Apartments Project), 4%, 9/01/2025 (Put Date 9/01/2024) | 132,750 | 131,716 | ||
| Chicago, IL, O'Hare International Airport Rev., Senior Lien, “C”, 5%, 1/01/2033 | 400,000 | 418,067 | ||
| Chicago, IL, O'Hare International Airport Rev., Senior Lien, “C”, 5%, 1/01/2034 | 200,000 | 208,186 | ||
| East Moline, IL, General Obligation, Taxable, BAM, 1.665%, 1/15/2025 | 250,000 | 236,308 | ||
| Illinois Finance Authority Rev. (Dominican University), 5%, 3/01/2032 | 655,000 | 634,870 | ||
| Illinois Finance Authority Rev. (OSF Healthcare System), “A”, 4.125%, 11/15/2037 | 70,000 | 63,873 | ||
10
Portfolio of Investments (unaudited)
– continued
| Issuer | Shares/Par | Value ($) | ||
| Municipal Bonds - continued | ||||
| Illinois - continued | ||||
| Illinois Finance Authority Rev. (Plymouth Place, Inc.), “A”, 5.625%, 5/15/2030 | $ | 855,000 | $842,669 | |
| Illinois Finance Authority Rev. (Plymouth Place, Inc.), “B-2”, 5.25%, 11/15/2027 | 60,000 | 58,932 | ||
| Illinois Finance Authority Rev. (Plymouth Place, Inc.), “B-3”, 4.75%, 11/15/2027 | 120,000 | 117,407 | ||
| Illinois Finance Authority Rev., Taxable (Christian Horizons Obligated Group), “B”, 3.25%, 5/15/2027 | 75,000 | 33,937 | ||
| Illinois Finance Authority Water Facilities Refunding Rev. (American Water Capital Corp. Project), 3.875%, 4/30/2040 (Put Date 9/01/2028) | 250,000 | 243,043 | ||
| Illinois Finance Authority, Graduate & Professional Student Loan Program Rev. (Midwestern University Foundation), “A”, 2.25%, 7/01/2033 | 5,000 | 3,807 | ||
| Illinois Highway Authority, Toll Rev., “A”, 5%, 1/01/2040 | 110,000 | 110,164 | ||
| Illinois Housing Development Authority Multi-Family Housing Rev. (South Shore), GNMA, 4%, 6/01/2026 (Put Date 6/01/2025) | 325,000 | 320,151 | ||
| Illinois Housing Development Authority, Multi-Family Housing Rev. (Berry Manor), 4%, 9/01/2025 (Put Date 9/01/2024) | 500,000 | 495,710 | ||
| Southern Illinois University Housing and Auxiliary Facilities System Refunding Rev., “A”, 5%, 4/01/2032 | 200,000 | 207,267 | ||
| State of Illinois, General Obligation, 5.5%, 5/01/2039 | 150,000 | 156,492 | ||
| State of Illinois, Sales Tax Rev., “A”, 5%, 6/15/2027 | 125,000 | 127,341 | ||
| $7,877,609 | ||||
| Indiana - 2.6% | ||||
| Beech Grove, IN, Central Schools Building Corp., “B”, 2%, 7/15/2025 | $ | 100,000 | $94,736 | |
| Indiana Finance Authority Refunding Rev., Taxable (BHI Senior Living), “B”, 2.45%, 11/15/2025 | 30,000 | 27,742 | ||
| Indiana Finance Authority Student Housing Rev. (CHF - Tippecanoe, LLC - Student Housing Project), “A”, 5%, 6/01/2038 | 800,000 | 798,299 | ||
| Indiana Finance Authority, Educational Facilities Rev. (Valparaiso University Project), 5%, 10/01/2026 | 200,000 | 200,530 | ||
| Indiana Housing & Community Development Authority, Single Family Mortgage Rev., “B”, 5%, 1/01/2030 | 500,000 | 522,167 | ||
| Indiana Housing & Community Development Authority, Single Family Mortgage Rev., “B”, 5%, 7/01/2030 | 285,000 | 298,488 | ||
| Indiana Secondary Market for Education Loans, Inc., Student Loan Program Rev., “1A”, 5%, 6/01/2031 | 1,000,000 | 1,010,811 | ||
| Whiting, IN, Environmental Facilities Rev. (BP Products North America, Inc. Project), 4.4%, 11/01/2045 (Put Date 6/10/2031) | 750,000 | 730,458 | ||
| $3,683,231 | ||||
11
Portfolio of Investments (unaudited)
– continued
| Issuer | Shares/Par | Value ($) | ||
| Municipal Bonds - continued | ||||
| Iowa - 0.5% | ||||
| Iowa Student Loan Liquidity Corp. Rev., “B”, 5%, 11/30/2033 | $ | 600,000 | $597,170 | |
| Iowa Student Loan Liquidity Corp. Rev., “B”, 3%, 12/01/2039 | 5,000 | 4,615 | ||
| Iowa Student Loan Liquidity Corp. Rev., “B”, 3.5%, 12/01/2044 | 115,000 | 83,624 | ||
| $685,409 | ||||
| Kansas - 1.0% | ||||
| Kansas Development Finance Authority Rev. (Advent Health Obligated Group Hospital), “B”, 5%, 11/15/2054 (Put Date 11/15/2028) | $ | 530,000 | $553,895 | |
| Kansas Development Finance Authority Rev. (Advent Health Obligated Group Hospital), ETM, “B”, 5%, 11/15/2054 (Prerefunded 11/15/2028) | 70,000 | 74,153 | ||
| Manhattan, KS, Health Care Facilities Rev. (Meadowlark Hills), “A”, 4%, 6/01/2025 | 125,000 | 121,958 | ||
| Topeka, KS, Health Care Facilities Rev. (Brewster Place), “A”, 5.75%, 12/01/2033 | 750,000 | 722,577 | ||
| $1,472,583 | ||||
| Kentucky - 0.6% | ||||
| Henderson, KY, Exempt Facilities Rev. (Pratt Paper LLC Project), “B”, 3.7%, 1/01/2032 (n) | $ | 105,000 | $99,401 | |
| Kentucky Higher Education Student Loan Corp. Rev., Tax-Exempt, “A-1”, 5%, 6/01/2031 | 500,000 | 506,684 | ||
| Kentucky State University, Certificates of Participation, BAM, 5%, 11/01/2024 | 10,000 | 10,094 | ||
| Owen County, KY, Water Facilities Refunding Rev. (Kentucky-American Water Co. Project), 3.875%, 5/31/2040 (Put Date 9/01/2028) | 275,000 | 267,347 | ||
| $883,526 | ||||
| Louisiana - 0.1% | ||||
| Louisiana Public Facilities Authority Refunding Rev. (Loyola University Project), 5%, 10/01/2025 | $ | 200,000 | $201,991 | |
| Maine - 0.7% | ||||
| State Maine Housing Authority Mortgage Purchase, “B”, 3.125%, 11/15/2054 (Put Date 5/01/2024) | $ | 1,000,000 | $992,726 | |
12
Portfolio of Investments (unaudited)
– continued
| Issuer | Shares/Par | Value ($) | ||
| Municipal Bonds - continued | ||||
| Maryland - 0.8% | ||||
| Baltimore, MD, Project Rev. (Mayor and City Council of Baltimore Water Projects), “A”, 4%, 7/01/2038 | $ | 450,000 | $421,094 | |
| Chestertown, MD, Economic Development Rev., Taxable (Washington College Project), “B”, 1.78%, 3/01/2024 | 550,000 | 539,714 | ||
| Maryland Health & Higher Educational Facilities Authority Rev. (Pooled Loan Program), “B”, VRDN, 3.1%, 3/31/2035 | 215,000 | 215,000 | ||
| $1,175,808 | ||||
| Massachusetts - 2.0% | ||||
| Massachusetts Development Finance Agency Rev. (Lasell University), 4%, 7/01/2026 | $ | 100,000 | $96,837 | |
| Massachusetts Development Finance Agency Rev. (Simmons University), “N”, 5.25%, 9/30/2036 | 500,000 | 500,784 | ||
| Massachusetts Development Finance Agency Rev. (South Shore Hospital), “I”, 4%, 7/01/2036 | 90,000 | 79,217 | ||
| Massachusetts Development Finance Agency Rev. (Williams College), “N”, 0.45%, 7/01/2041 (Put Date 7/01/2025) | 45,000 | 41,400 | ||
| Massachusetts Educational Financing Authority, Education Loan Rev., Issue L, “B”, 4.25%, 7/01/2044 | 375,000 | 347,485 | ||
| Massachusetts Educational Financing Authority, Education Loan Rev., Issue M, “B”, 3.625%, 7/01/2038 | 315,000 | 265,127 | ||
| Massachusetts Housing Finance Agency, “D-3”, FHA, 3.35%, 6/01/2027 | 1,000,000 | 956,866 | ||
| Massachusetts Housing Finance Agency, Single Family Housing Rev., “225”, 5.5%, 12/01/2052 | 500,000 | 513,449 | ||
| $2,801,165 | ||||
| Michigan - 2.4% | ||||
| Detroit, MI, Downtown Development Authority Tax Increment Refunding Rev. (Catalyst Development Project), “A”, AGM, 5%, 6/30/2033 | $ | 100,000 | $99,361 | |
| Michigan Finance Authority Hospital Rev. (Bronson Healthcare Group Inc.), “B”, 5%, 11/15/2044 (Put Date 11/16/2026) | 325,000 | 329,589 | ||
| Michigan Finance Authority Local Government Loan Program Rev. (Detroit Water and Sewerage Department Sewage Disposal System Rev. Refunding Second Lien Local Project), “C-7”, NPFG, 5%, 7/01/2032 | 30,000 | 30,171 | ||
| Michigan Finance Authority Local Government Loan Program Rev. (Detroit Water and Sewerage Department Water Supply System Rev. Refunding Second Lien Local Project), “D-6”, NPFG, 5%, 7/01/2036 | 35,000 | 35,077 | ||
| Michigan Finance Authority Local Government Loan Program Rev. (Detroit Water and Sewerage Department Water Supply System Rev. Refunding Senior Lien Local Project), “D-1”, AGM, 5%, 7/01/2035 | 20,000 | 20,095 | ||
13
Portfolio of Investments (unaudited)
– continued
| Issuer | Shares/Par | Value ($) | ||
| Municipal Bonds - continued | ||||
| Michigan - continued | ||||
| Michigan Finance Authority Local Government Loan Program Rev. (Detroit Water and Sewerage Department Water Supply System Rev. Refunding Senior Lien Local Project), “D-1”, AGM, 5%, 7/01/2037 | $ | 45,000 | $45,122 | |
| Michigan Housing Development Authority, Multi-Family Housing Rev. (Clark Road Senior Apartments Project), 4.5%, 12/01/2042 (Put Date 4/01/2026) | 515,000 | 513,940 | ||
| Michigan Housing Development Authority, Rental Housing Rev., “A”, 0.55%, 4/01/2025 | 110,000 | 103,410 | ||
| Michigan Housing Development Authority, Single Family Mortgage Rev., “D”, 5.5%, 6/01/2053 | 370,000 | 378,344 | ||
| Michigan Strategic Fund Limited Obligation Rev. (DTE Electric Co. Exempt Facilities Project), “DT”, 3.875%, 5/31/2053 (Put Date 6/03/2030) | 1,000,000 | 953,566 | ||
| Michigan Strategic Fund Limited Obligation Rev. (I-75 Improvement Project), AGM, 4.125%, 6/29/2035 | 1,000,000 | 953,205 | ||
| $3,461,880 | ||||
| Minnesota - 2.1% | ||||
| Duluth, MN, Economic Development Authority Rev. (Benedictine Health System), “A”, 3%, 7/01/2026 | $ | 125,000 | $117,284 | |
| Minneapolis, MN, Health Care System Rev. (Allina Health System), “B”, 5%, 11/15/2053 (Put Date 11/15/2030) | 910,000 | 952,218 | ||
| Minnesota Housing Finance Agency, Rental Housing, “C”, GNMA, 3.8%, 2/01/2025 | 145,000 | 143,042 | ||
| Minnesota Housing Finance Agency, Residential Housing, “D”, 3%, 1/01/2052 | 225,000 | 211,687 | ||
| Minnesota Office of Higher Education Supplemental Student Loan Program Rev., 4%, 11/01/2042 | 1,000,000 | 867,517 | ||
| St. Paul, MN, Housing & Redevelopment Authority, Multi-Family Housing Rev. (Dale Street Project), 3.5%, 12/01/2025 (Put Date 6/01/2024) | 750,000 | 742,529 | ||
| $3,034,277 | ||||
| Mississippi - 0.1% | ||||
| Mississippi Development Bank Special Obligation (Jackson Water and Sewer System Rev. Bond Project), AGM, 6.875%, 12/01/2040 | $ | 65,000 | $65,201 | |
| Mississippi Home Corp., Single Family Mortgage Rev., “B”, GNMA, 3%, 6/01/2051 | 85,000 | 80,139 | ||
| $145,340 | ||||
14
Portfolio of Investments (unaudited)
– continued
| Issuer | Shares/Par | Value ($) | ||
| Municipal Bonds - continued | ||||
| Missouri - 0.9% | ||||
| Missouri Development Finance Board, Infrastructure Facilities Rev. (Crackerneck Creek Project), 5%, 3/01/2026 | $ | 150,000 | $149,700 | |
| Missouri Health & Educational Facilities Authority Health Facilities Rev. (Saint Luke's Health System, Inc.), 5%, 11/15/2029 | 655,000 | 666,718 | ||
| Plaza at Noah's Ark Community District, MO, Tax Increment and Improvement Rev., 3%, 5/01/2026 | 125,000 | 118,528 | ||
| Poplar Bluff, MO, Transportation Development District Convertible Transportation Sales Tax Refunding Rev., Taxable, “A”, 5%, 12/01/2027 | 220,000 | 215,310 | ||
| Poplar Bluff, MO, Transportation Development District Convertible Transportation Sales Tax Refunding & Improvement Rev., “B”, 3.375%, 12/01/2031 | 100,000 | 89,668 | ||
| $1,239,924 | ||||
| Nevada - 0.4% | ||||
| Clark County, NV, Jet Aviation Fuel Tax Refunding Rev., “A”, 5%, 7/01/2026 | $ | 455,000 | $461,004 | |
| Nevada Housing Division, Multi-Unit Housing Rev. (Woodcreek Apartments), 5%, 12/01/2025 (Put Date 12/01/2024) | 140,000 | 140,530 | ||
| $601,534 | ||||
| New Hampshire - 1.0% | ||||
| National Finance Authority, NV, Lease Rev. (NCCD - UNR Properties LLC - University of Nevada, Reno Project), “A”, BAM, 5.25%, 12/01/2042 | $ | 1,070,000 | $1,126,803 | |
| New Hampshire Business Finance Authority, Water Facility Rev. (Pennichuck Water Works, Inc. Project), “A”, 5%, 4/01/2027 | 105,000 | 105,762 | ||
| New Hampshire National Finance Authority Municipal Certificates, “1-A”, 4.375%, 9/20/2036 | 275,930 | 255,508 | ||
| $1,488,073 | ||||
| New Jersey - 3.8% | ||||
| Atlantic City, NJ, Tax Appeal Refunding Bonds, 5%, 12/01/2024 | $ | 85,000 | $84,410 | |
| Monmouth County, NJ, Improvement Authority Rev., Governmental Pooled Loan Project Notes, 4%, 3/15/2024 | 1,000,000 | 1,000,341 | ||
| New Jersey Economic Development Authority Rev. (Portal North Bridge Project), “A”, 5%, 11/01/2034 | 1,000,000 | 1,059,918 | ||
| New Jersey Economic Development Authority Rev. (School Facilities Construction), “SSS”, 5%, 6/15/2035 (w) | 1,000,000 | 1,032,721 | ||
| New Jersey Economic Development Authority, Water Facilities Rev. (AmericanWater Co., Inc. Project), “B”, 3.75%, 11/01/2034 (Put Date 6/01/2028) | 260,000 | 247,035 | ||
| New Jersey Higher Education Student Assistance Authority, Senior Student Loan Rev., “B”, 4%, 12/01/2041 | 600,000 | 567,563 | ||
15
Portfolio of Investments (unaudited)
– continued
| Issuer | Shares/Par | Value ($) | ||
| Municipal Bonds - continued | ||||
| New Jersey - continued | ||||
| New Jersey Transportation Trust Fund Authority, “A”, 5%, 12/15/2039 | $ | 65,000 | $66,680 | |
| Newark, NJ, Board of Education, Energy Savings Obligation Refunding, 5%, 7/15/2028 | 54,000 | 56,600 | ||
| Salem Country, NJ, Pollution Control Financing Authority Rev. (Philadelphia Electric Co. Project), “A”, 4.45%, 3/01/2025 (Put Date 3/01/2025) | 500,000 | 496,680 | ||
| South Jersey, NJ, Transportation Authority System Rev., “A”, BAM, 5%, 11/01/2036 | 410,000 | 433,546 | ||
| South Jersey, NJ, Transportation Authority System Rev., “A”, BAM, 5%, 11/01/2037 | 375,000 | 392,736 | ||
| $5,438,230 | ||||
| New Mexico - 1.2% | ||||
| Farmington, NM, Pollution Control Rev. (Public Service Company of New Mexico San Juan Project), “D”, 3.9%, 6/01/2040 (Put Date 6/01/2028) | $ | 1,000,000 | $969,953 | |
| New Mexico Mortgage Finance Authority, Single Family Mortgage Program Class I, “E”, GNMA, 6.25%, 9/01/2053 | 555,000 | 588,461 | ||
| New Mexico Mortgage Finance Authority, Single Family Mortgage Program, “D”, GNMA, 5.25%, 3/01/2053 | 110,000 | 111,839 | ||
| $1,670,253 | ||||
| New York - 4.9% | ||||
| Build NYC Resource Corp. Rev. (Grand Concourse Academy Charter School Project), “A”, 5%, 7/01/2032 | $ | 300,000 | $304,951 | |
| Build NYC Resource Corp. Rev. (KIPP NYC Public Schools Facilities - Canal West Project), 5%, 7/01/2036 | 750,000 | 758,171 | ||
| Dutchess County, NY, Local Development Corp. Rev. (Nuvance Health), “B”, 5%, 7/01/2028 | 330,000 | 331,800 | ||
| Genesse County, NY, Funding Corp. Rev. (Rochester Regional Health Project), Tax-Exempt, “A”, 5%, 12/01/2027 | 685,000 | 692,872 | ||
| Long Beach, NY, General Obligation, “B”, BAM, 5.25%, 7/15/2032 | 200,000 | 212,509 | ||
| Metropolitan Transportation Authority, NY, Transportation Refunding Rev. (Climate Bond Certified), “C-1”, 4%, 11/15/2035 | 500,000 | 473,812 | ||
| New York Energy Research and Development Authority, Pollution Control Rev. (New York State Electric & Gas Corp. Project), “C”, 4%, 4/01/2034 (Put Date 4/01/2034) | 680,000 | 643,107 | ||
| New York Environmental Facilities Corp. Rev., Solid Waste Disposal (Casella Waste Management, Inc. Project), 2.75%, 9/01/2050 (Put Date 9/02/2025) (n) | 500,000 | 478,993 | ||
| New York State Housing Finance Agency Affordable Rev., “A-2”, 2.5%, 11/01/2060 (Put Date 5/01/2027) | 950,000 | 882,728 | ||
| New York State Housing Finance Agency, Affordable Housing Rev., “G-2”, HUD Section 8, 3.45%, 5/01/2062 (Put Date 5/01/2027) | 170,000 | 162,531 | ||
16
Portfolio of Investments (unaudited)
– continued
| Issuer | Shares/Par | Value ($) | ||
| Municipal Bonds - continued | ||||
| New York - continued | ||||
| New York Transportation Development Corp., Special Facilities Rev. (Delta Airlines, Inc. LaGuardia Airport Terminals C&D Redevelopment Project), 5%, 1/01/2025 | $ | 500,000 | $501,699 | |
| New York Transportation Development Corp., Special Facilities Rev. (Delta Airlines, Inc. LaGuardia Airport Terminals C&D Redevelopment Project), 5%, 10/01/2040 | 250,000 | 239,504 | ||
| New York Transportation Development Corp., Special Facilities Rev. (John F. Kennedy International Airport Project), “A”, 5%, 12/01/2032 | 270,000 | 277,153 | ||
| New York, NY, Housing Development Corp., Multi-Family Housing Rev. (Sustainable Development), “F-2-A”, 3.4%, 10/31/2062 (Put Date 12/22/2026) | 560,000 | 533,605 | ||
| Suffolk, NY, Tobacco Asset Securitization Corp., Tobacco Settlement, Taxable, “A-1”, 1.015%, 6/01/2024 | 500,000 | 485,005 | ||
| $6,978,440 | ||||
| North Carolina - 1.1% | ||||
| Greater Asheville Regional Airport Authority, NC, Airport System Rev., AGM, 5.25%, 7/01/2039 | $ | 320,000 | $331,605 | |
| North Carolina Housing Finance Agency, Home Ownership Refunding Rev., “45”, GNMA, 1.9%, 7/01/2032 | 780,000 | 601,403 | ||
| North Carolina Medical Care Commission, Health Care Facilities First Mortgage Rev. (Lutheran Services for the Aging), “A”, 5%, 3/01/2028 | 125,000 | 121,528 | ||
| North Carolina Turnpike Authority, Triangle Expressway System Rev., Capital Appreciation, 0%, 1/01/2040 | 985,000 | 442,134 | ||
| $1,496,670 | ||||
| North Dakota - 0.9% | ||||
| Grand Forks, ND, Healthcare System Rev. (Altru Health System), AGM, 3%, 12/01/2039 | $ | 985,000 | $735,813 | |
| Horace, ND, Temporary Refunding Improvement, “B”, 4%, 1/01/2025 | 590,000 | 583,638 | ||
| $1,319,451 | ||||
| Ohio - 3.3% | ||||
| Allen County, OH, Hospital Facilities Rev. (Bon Secours Mercy Health, Inc.), “B-2”, 5%, 10/01/2051 (Put Date 6/04/2030) | $ | 500,000 | $516,115 | |
| Cuyahoga County, OH, Metropolitan Housing Authority, Multi-Family Housing Rev. (Carver Park Phase III Project), FHA, 4%, 6/01/2026 (Put Date 6/01/2025) | 350,000 | 344,372 | ||
| Cuyahoga County, OH, Metropolitan Housing Authority, Multi-Family Housing Rev. (Wade Park Apartments), 4.75%, 12/01/2027 (Put Date 12/01/2025) | 200,000 | 199,807 | ||
| Hamilton County, OH, Healthcare Rev. (Life Enriching Communities Project), “A”, 5.25%, 12/31/2037 | 750,000 | 723,688 | ||
17
Portfolio of Investments (unaudited)
– continued
| Issuer | Shares/Par | Value ($) | ||
| Municipal Bonds - continued | ||||
| Ohio - continued | ||||
| Ohio Air Quality Development Authority Refunding Rev. (Duke Energy Corp. Project), “A”, 4.25%, 11/01/2039 (Put Date 6/01/2027) | $ | 145,000 | $141,767 | |
| Ohio Air Quality Development Authority Refunding Rev. (Duke Energy Corp. Project), “B”, 4%, 9/01/2030 (Put Date 6/01/2027) | 170,000 | 166,192 | ||
| Ohio Air Quality Development Authority Rev. (American Electric Power Co.), “C”, 2.1%, 4/01/2028 (Put Date 10/01/2024) | 750,000 | 724,336 | ||
| Ohio Air Quality Development Authority Rev. (Dayton Power And Light Co. Project), “A”, 4.25%, 11/01/2040 (Put Date 6/01/2027) | 500,000 | 485,755 | ||
| Ohio Higher Educational Facility Rev. (Cleveland Institute of Music 2022 Project), 5%, 12/01/2032 | 600,000 | 587,402 | ||
| Ohio Housing Finance Agency Multi-Family Housing Rev. (Thornwood Commons), HUD Section 8, 5%, 12/01/2026 (Put Date 12/01/2025) | 205,000 | 206,512 | ||
| Ohio Housing Finance Agency Residential Mortgage Rev. (Mortgage-Backed Securities Program), “C”, FNMA, 5.75%, 3/01/2054 | 610,000 | 629,720 | ||
| $4,725,666 | ||||
| Oklahoma - 0.6% | ||||
| Norman, OK, Regional Hospital Authority Refunding Rev., 4%, 9/01/2037 | $ | 355,000 | $290,238 | |
| Rogers County, OK, Educational Facilities Lease Rev. (Catoosa Public Schools Project), 5%, 9/01/2032 | 500,000 | 535,583 | ||
| $825,821 | ||||
| Oregon - 0.6% | ||||
| Gilliam County, OR, Solid Waste Disposal Rev. (Waste Management, Inc. Project), “A”, 3.95%, 8/01/2025 (Put Date 5/01/2024) | $ | 225,000 | $223,741 | |
| Multnomah County, OR, Hospital Facilities Authority Refunding Rev. (Terwilliger Plaza - Parkview Project), “B-1”, 1.2%, 6/01/2028 | 5,000 | 4,187 | ||
| Multnomah County, OR, Hospital Facilities Authority Refunding Rev. (Terwilliger Plaza - Parkview Project), “B-2”, 0.95%, 6/01/2027 | 10,000 | 8,669 | ||
| Oregon Facilities Authority Lease Rent Rev. (Legacy Health System), “A”, 4.9%, 9/14/2035 | 430,000 | 428,235 | ||
| Oregon Health & Sciences University Rev., “B”, 3.375%, 7/01/2039 | 115,000 | 93,405 | ||
| Oregon Housing & Community Services Department, Multi-Family Housing Rev. (Plaza Los Amigos Apartments Project, “T-2”, 3%, 2/01/2026 (Put Date 2/01/2025) | 125,000 | 122,349 | ||
| $880,586 | ||||
18
Portfolio of Investments (unaudited)
– continued
| Issuer | Shares/Par | Value ($) | ||
| Municipal Bonds - continued | ||||
| Pennsylvania - 5.1% | ||||
| Allentown, PA, Commercial and Industrial Development Authority Education Facility Lease Rev. (Lincoln Leadership Academy Charter School Project), 5.5%, 6/14/2038 (n)(w) | $ | 500,000 | $487,560 | |
| Allentown, PA, Neighborhood Improvement Zone Development Authority Tax Refunding Rev., 5%, 5/01/2026 | 10,000 | 10,065 | ||
| Berks County, PA, Industrial Development Authority Health System Rev. (Tower Health Project), 5%, 11/01/2028 | 65,000 | 39,991 | ||
| Chester County, PA, Health & Education Facilities Authority Rev. (Simpson Senior Services Project), 4%, 12/01/2030 | 455,000 | 393,016 | ||
| Chester County, PA, Industrial Development Authority Educational Facilities Rev. (Avon Grove Charter School), “A”, 4.75%, 12/15/2037 | 80,000 | 72,645 | ||
| Delaware Valley, PA, Regional Finance Authority, “C”, FLR, 4.55% (67% of LIBOR - 3mo. + 0.75%), 6/01/2037 | 795,000 | 665,535 | ||
| Doylestown, PA, Hospital Authority Rev., “A”, 4%, 6/30/2045 | 10,000 | 7,128 | ||
| East Bethlehem, PA, Municipal Authority Sewer Rev., 1%, 12/01/2024 | 150,000 | 141,589 | ||
| Indiana County, PA Industrial Development Authority Rev. (Student Cooperative Association, Inc./Indiana University of Pennsylvania Project), BAM, 5%, 5/01/2031 | 440,000 | 454,598 | ||
| Indiana County, PA Industrial Development Authority Rev. (Student Cooperative Association, Inc./Indiana University of Pennsylvania Project), BAM, 5%, 5/01/2032 | 450,000 | 462,443 | ||
| Lancaster County, PA, Hospital Authority Health Center Rev. (Masonic Villages Project), 5%, 11/01/2023 | 125,000 | 125,055 | ||
| Pennsylvania Economic Development Financing Authority Rev. (Presbyterian Senior Living Project), “B-2”, 5%, 6/30/2038 | 1,000,000 | 978,494 | ||
| Pennsylvania Economic Development Financing Authority Rev. (Rapid Bridge Replacement Project), 5%, 12/31/2038 | 500,000 | 481,247 | ||
| Pennsylvania Economic Development Financing Authority, Private Activity Rev. (PennDOT Major Bridges Package One Project), 5%, 12/31/2033 | 1,000,000 | 1,047,034 | ||
| Pennsylvania Economic Development Financing Authority, Private Activity Rev. (Pennsylvania Rapid Bridge Replacement Project), 5%, 12/31/2028 | 150,000 | 150,458 | ||
| Pennsylvania Economic Development Financing Authority, Private Activity Rev. (Pennsylvania Rapid Bridge Replacement Project), 4%, 3/15/2034 | 85,000 | 82,406 | ||
| Pennsylvania Higher Educational Assistance Agency, Education Loan Rev., “A”, 5%, 6/01/2027 | 200,000 | 202,512 | ||
| Pennsylvania Higher Educational Assistance Agency, Education Loan Rev., “A”, 2.625%, 6/01/2042 | 10,000 | 7,999 | ||
| Pennsylvania Housing Finance Agency, Single Family Mortgage Rev., “135A”, 3%, 10/01/2051 | 265,000 | 254,243 | ||
19
Portfolio of Investments (unaudited)
– continued
| Issuer | Shares/Par | Value ($) | ||
| Municipal Bonds - continued | ||||
| Pennsylvania - continued | ||||
| Pennsylvania Housing Finance Agency, Single Family Mortgage Rev., “141A”, 5.75%, 10/01/2053 | $ | 615,000 | $636,559 | |
| Philadelphia, PA, Authority for Industrial Development Charter School Rev. (Green Woods Charter School Project), “A”, 5%, 6/15/2032 | 100,000 | 96,974 | ||
| Westmoreland County, PA, Industrial Development Authority Rev. (Redstone Presbyterian Seniorcare Obligated Group), 4%, 5/15/2026 | 500,000 | 483,578 | ||
| $7,281,129 | ||||
| Puerto Rico - 1.5% | ||||
| Commonwealth of Puerto Rico, General Obligation Restructured Bonds, Capital Appreciation, Series 2022A, 0%, 7/01/2024 | $ | 6,295 | $6,081 | |
| Commonwealth of Puerto Rico, General Obligation Restructured Bonds, Capital Appreciation, Series 2022A, 0%, 7/01/2033 | 49,801 | 29,351 | ||
| Commonwealth of Puerto Rico, General Obligation Restructured Bonds, Series 2022A, 5.625%, 7/01/2027 | 42,709 | 43,826 | ||
| Commonwealth of Puerto Rico, General Obligation Restructured Bonds, Series 2022A, 5.625%, 7/01/2029 | 292,016 | 301,742 | ||
| Commonwealth of Puerto Rico, General Obligation Restructured Bonds, Series 2022A, 5.75%, 7/01/2031 | 40,810 | 42,619 | ||
| Commonwealth of Puerto Rico, General Obligation Restructured Bonds, Series 2022A, 4%, 7/01/2033 | 38,698 | 34,686 | ||
| Commonwealth of Puerto Rico, General Obligation Restructured Bonds, Series 2022A, 4%, 7/01/2035 | 34,785 | 30,230 | ||
| Commonwealth of Puerto Rico, General Obligation Restructured Bonds, Series 2022A, 4%, 7/01/2037 | 29,854 | 25,061 | ||
| Commonwealth of Puerto Rico, General Obligation Restructured Bonds, Series 2022A, 4%, 7/01/2041 | 40,591 | 32,636 | ||
| Commonwealth of Puerto Rico, General Obligation Restructured Bonds, Series 2022A, 4%, 7/01/2046 | 42,214 | 32,546 | ||
| Puerto Rico Aqueduct and Sewer Authority Rev., “A”, 5%, 7/01/2025 (n) | 500,000 | 501,369 | ||
| Puerto Rico Electric Power Authority Refunding Rev., “DDD”, 5%, 7/01/2020 (a)(d) | 10,000 | 2,500 | ||
| Puerto Rico Electric Power Authority Refunding Rev., “DDD”, 5%, 7/01/2021 (a)(d) | 100,000 | 25,000 | ||
| Puerto Rico Electric Power Authority Refunding Rev., “DDD”, 5%, 7/01/2022 (a)(d) | 165,000 | 41,250 | ||
| Puerto Rico Electric Power Authority Refunding Rev., “VV”, NPFG, 5.25%, 7/01/2034 | 10,000 | 9,862 | ||
| Puerto Rico Electric Power Authority Rev., “A”, 5%, 7/01/2029 (a)(d) | 260,000 | 65,000 | ||
| Puerto Rico Electric Power Authority Rev., “A”, 5%, 7/01/2042 (a)(d) | 40,000 | 10,000 | ||
| Puerto Rico Electric Power Authority Rev., “AAA”, 5.25%, 7/01/2021 (a)(d) | 20,000 | 5,000 | ||
20
Portfolio of Investments (unaudited)
– continued
| Issuer | Shares/Par | Value ($) | ||
| Municipal Bonds - continued | ||||
| Puerto Rico - continued | ||||
| Puerto Rico Electric Power Authority Rev., “AAA”, 5.25%, 7/01/2030 (a)(d) | $ | 10,000 | $2,500 | |
| Puerto Rico Electric Power Authority Rev., “CCC”, 5.25%, 7/01/2027 (a)(d) | 90,000 | 22,500 | ||
| Puerto Rico Electric Power Authority Rev., “TT”, 5%, 7/01/2021 (a)(d) | 40,000 | 10,000 | ||
| Puerto Rico Electric Power Authority Rev., “TT”, 5%, 7/01/2023 (a)(d) | 40,000 | 10,000 | ||
| Puerto Rico Electric Power Authority Rev., “TT”, 5%, 7/01/2027 (a)(d) | 10,000 | 2,500 | ||
| Puerto Rico Electric Power Authority Rev., “TT”, 5%, 7/01/2037 (a)(d) | 130,000 | 32,500 | ||
| Puerto Rico Electric Power Authority Rev., “WW”, 5.375%, 7/01/2022 (a)(d) | 10,000 | 2,500 | ||
| Puerto Rico Electric Power Authority Rev., “WW”, 5.25%, 7/01/2025 (a)(d) | 15,000 | 3,750 | ||
| Puerto Rico Electric Power Authority Rev., “ZZ”, 5%, 7/01/2018 (a)(d) | 65,000 | 16,250 | ||
| Puerto Rico Electric Power Authority Rev., “ZZ”, 5.25%, 7/01/2023 (a)(d) | 70,000 | 17,500 | ||
| Puerto Rico Electric Power Authority Rev., “ZZ”, 5.25%, 7/01/2024 (a)(d) | 20,000 | 5,000 | ||
| Puerto Rico Electric Power Authority Rev., “ZZ”, 5.25%, 7/01/2026 (a)(d) | 60,000 | 15,000 | ||
| Puerto Rico Electric Power Authority Rev., Taxable, “EEE”, 6.05%, 7/01/2032 (a)(d) | 50,000 | 12,500 | ||
| Puerto Rico Sales Tax Financing Corp., Restructured Sales Tax Rev., “2019A-1”, 4.55%, 7/01/2040 | 23,000 | 21,162 | ||
| Puerto Rico Sales Tax Financing Corp., Restructured Sales Tax Rev., “2019A-1”, 4.75%, 7/01/2053 | 20,000 | 17,681 | ||
| Puerto Rico Sales Tax Financing Corp., Restructured Sales Tax Rev., “2019A-1”, 5%, 7/01/2058 | 164,000 | 148,352 | ||
| Puerto Rico Sales Tax Financing Corp., Restructured Sales Tax Rev., “2019A-2”, 4.329%, 7/01/2040 | 76,000 | 68,070 | ||
| Puerto Rico Sales Tax Financing Corp., Restructured Sales Tax Rev., “2019A-2”, 4.536%, 7/01/2053 | 1,000 | 853 | ||
| Puerto Rico Sales Tax Financing Corp., Restructured Sales Tax Rev., “2019A-2”, 4.784%, 7/01/2058 | 39,000 | 34,041 | ||
| Puerto Rico Sales Tax Financing Corp., Restructured Sales Tax Rev., Capital Appreciation, “2019A-1”, 0%, 7/01/2024 | 2,000 | 1,936 | ||
| Puerto Rico Sales Tax Financing Corp., Restructured Sales Tax Rev., Capital Appreciation, “2019A-1”, 0%, 7/01/2027 | 41,000 | 34,911 | ||
| Puerto Rico Sales Tax Financing Corp., Restructured Sales Tax Rev., Capital Appreciation, “2019A-1”, 0%, 7/01/2029 | 7,000 | 5,443 | ||
| Puerto Rico Sales Tax Financing Corp., Restructured Sales Tax Rev., Capital Appreciation, “2019A-1”, 0%, 7/01/2031 | 597,000 | 422,931 | ||
| University of Puerto Rico Rev., “P”, NPFG, 5%, 6/01/2025 | 15,000 | 15,013 | ||
| $2,161,652 | ||||
21
Portfolio of Investments (unaudited)
– continued
| Issuer | Shares/Par | Value ($) | ||
| Municipal Bonds - continued | ||||
| Rhode Island - 1.1% | ||||
| Rhode Island Housing and Mortgage Finance Corp., Home Ownership Opportunity, “78-A”, 5.5%, 10/01/2052 | $ | 750,000 | $767,222 | |
| Rhode Island Student Loan Authority, Education Loan Rev., “A”, 4.125%, 12/01/2042 | 1,000,000 | 862,256 | ||
| $1,629,478 | ||||
| South Carolina - 0.5% | ||||
| Orangeburg County, SC, Facilities Corp. Installment Purchase Rev. (Detention Center Project), 4%, 12/01/2042 | $ | 335,000 | $285,770 | |
| South Carolina Jobs & Economic Development Authority, Residential Care Facilities Refunding Rev. (South Carolina Episcopal Home at Still Hopes), “A”, 5%, 4/01/2038 | 280,000 | 245,976 | ||
| South Carolina Ports Authority Rev., 5%, 7/01/2025 | 135,000 | 136,266 | ||
| $668,012 | ||||
| South Dakota - 0.0% | ||||
| South Dakota Educational Enhancement Funding Corp., Tobacco Settlement Rev., Taxable, 0.961%, 6/01/2024 | $ | 65,000 | $62,891 | |
| Tennessee - 6.6% | ||||
| Chattanooga, TN, Health, Educational & Housing Facility Board Rev. (Catholic Health Initiatives), “A”, 5%, 10/01/2044 | $ | 1,000,000 | $904,299 | |
| Chattanooga, TN, Health, Educational & Housing Facility Board Rev. (CDFI Phase I LLC, University of Tennessee at Chattanooga), 5%, 10/01/2035 | 500,000 | 502,917 | ||
| Jackson, TN, Hospital Rev. (Jackson-Madison County General Hospital), 4%, 4/01/2041 | 415,000 | 349,082 | ||
| Jackson, TN, Hospital Rev. (Jackson-Madison County General Hospital), ETM, 4%, 4/01/2041 (Prerefunded 4/01/2025) | 10,000 | 10,008 | ||
| Knox County, TN, Health, Educational & Housing Facility Board Rev. (University Health Systems, Inc.), 5%, 4/01/2036 | 750,000 | 754,061 | ||
| Knox County, TN, Health, Educational & Housing Facility Board Rev. (University Health Systems, Inc.), 5%, 9/01/2036 | 1,000,000 | 1,004,577 | ||
| Knox County, TN, Health, Educational & Housing Facility Board, Multi-Family Housing Rev. (Westview Towers Project), 3.95%, 12/01/2027 (Put Date 12/01/2025) | 70,000 | 68,188 | ||
| Memphis-Shelby County, TN, Economic Development Growth Engine Industrial Development Board, Senior Tax Rev. (Graceland Project), “A”, 4.75%, 7/01/2027 | 300,000 | 252,038 | ||
| Memphis-Shelby County, TN, Economic Development Growth Engine Industrial Development Board, Senior Tax Rev. (Graceland Project), “A”, 5.5%, 7/01/2037 | 100,000 | 66,812 | ||
22
Portfolio of Investments (unaudited)
– continued
| Issuer | Shares/Par | Value ($) | ||
| Municipal Bonds - continued | ||||
| Tennessee - continued | ||||
| Metropolitan Government of Nashville & Davidson County, TN, Health & Educational Facilities Board Rev. (Lipscomb University Project), “A”, 5%, 10/01/2041 | $ | 1,000,000 | $921,593 | |
| Metropolitan Nashville, TN, Airport Authority Improvement Rev., “B”, 5.25%, 6/30/2033 | 1,150,000 | 1,233,796 | ||
| Metropolitan Nashville, TN, Airport Authority Special Facilities Rev. (Aero Nashville LLC Project), 5.2%, 7/01/2026 | 290,000 | 291,999 | ||
| Nashville, TN, Metropolitan Development and Housing Agency Rev. (Fifth & Broadway Development), 5.125%, 6/01/2036 (n) | 500,000 | 488,365 | ||
| Shelby County, TN, Health, Educational & Housing Facility Board, Residential Care Facility Mortgage Rev. (Village at Germantown), 5.25%, 12/01/2049 | 550,000 | 463,418 | ||
| Tennergy Corp., TN, Gas Supply Rev., “A”, 5.5%, 10/01/2053 (Put Date 12/01/2030) | 685,000 | 695,725 | ||
| Tennessee Energy Acquisition Corp., Gas Project Rev., “A-1”, 5%, 5/01/2053 (Put Date 5/01/2028) | 750,000 | 748,257 | ||
| Tennessee Energy Acquisition Corp., Gas Rev., “C”, 5%, 2/01/2027 | 80,000 | 78,882 | ||
| Tennessee Housing Development Agency, Residential Finance Program Rev., “4”, 4%, 7/01/2043 | 645,000 | 608,461 | ||
| $9,442,478 | ||||
| Texas - 6.5% | ||||
| Arlington, TX, Housing Finance Corp. Multi-Family Housing Rev. (6900 Matlock Road Project), 4.5%, 4/01/2041 (Put Date 4/01/2027) | $ | 500,000 | $497,569 | |
| Central Texas Regional Mobility Authority Subordinate Lien Rev., “D”, 5%, 1/01/2024 | 100,000 | 100,207 | ||
| Dallas and Fort Worth, TX, International Airport Rev., “A”, 5.25%, 11/01/2030 | 85,000 | 85,032 | ||
| Dallas, TX, Housing Finance Corp., Multi-Family Housing Rev. (Highpoint at Wynnewood), 3.5%, 2/01/2044 (Put Date 2/01/2026) | 145,000 | 140,940 | ||
| Dowdell, TX, Public Utility District, “A”, BAM, 2%, 9/01/2026 | 200,000 | 181,898 | ||
| El Paso County, TX, Hospital District Rev., 5%, 8/15/2033 | 100,000 | 99,354 | ||
| Fort Bend County, TX, Lamar Consolidated Independent School District, Unlimited Tax Schoolhouse, 5%, 2/15/2037 | 95,000 | 101,046 | ||
| Fort Bend County, TX, Lamar Consolidated Independent School District, Unlimited Tax Schoolhouse, 5%, 2/15/2038 | 70,000 | 73,449 | ||
| Harlandale, TX, Independent School District, Maintenance Tax, BAM, 2%, 8/15/2040 (Put Date 8/15/2024) | 75,000 | 73,619 | ||
| Horizon, TX, Regional Municipal Utility District, BAM, 3%, 2/01/2025 | 200,000 | 195,373 | ||
| Houston, TX, Airport System Subordinate Lien Rev., “A”, AGM, 5%, 7/01/2038 | 665,000 | 679,235 | ||
| Houston, TX, Convention & Entertainment Facilities Department, Hotel Occupancy Tax and Special Refunding Rev., 4%, 9/01/2027 | 60,000 | 60,256 | ||
23
Portfolio of Investments (unaudited)
– continued
| Issuer | Shares/Par | Value ($) | ||
| Municipal Bonds - continued | ||||
| Texas - continued | ||||
| Houston, TX, Independent School District, “A-2”, Texas PSF, 3.5%, 6/01/2039 (Put Date 6/01/2025) | $ | 400,000 | $395,172 | |
| Matagorda County, TX, Navigation District Number One Pollution Control Refunding Rev. (Central Power & Light Co. Project), 4.25%, 4/30/2030 | 500,000 | 477,233 | ||
| McLennan County, TX, Waco Independent School District, Unlimited Tax School Building Bonds, Texas PSF, 3%, 8/15/2035 | 500,000 | 430,338 | ||
| McLennan County, TX, Waco Independent School District, Unlimited Tax School Building Bonds, Texas PSF, 3%, 8/15/2036 | 500,000 | 420,352 | ||
| Mission, TX, Economic Development Corp., Solid Waste Disposal Rev. (Waste Management, Inc. Project), 4.25%, 6/01/2048 (Put Date 6/03/2024) | 185,000 | 184,496 | ||
| North Texas, TX, Municipal Water District Savine Creek Regional Wastewater System Contract Rev., AGM, 5%, 6/01/2032 | 500,000 | 545,053 | ||
| Port Beaumont, TX, Industrial Development Authority Facility Rev., Taxable (Jefferson Gulf Coast Energy Project), “B”, 4.1%, 1/01/2028 (n) | 200,000 | 158,149 | ||
| Port Houston, TX, First Lien Rev., 4%, 10/01/2038 | 1,000,000 | 937,698 | ||
| Reeves & Ward Counties, TX, Pecos-Barstow-Toyah Independent School District, Unlimited Tax School Building Bonds, Texas PSF, 5%, 2/14/2038 | 1,550,000 | 1,565,163 | ||
| Tarrant County, TX, Cultural Education Facilities Finance Corp. (Christus Health), “A”, 5%, 7/01/2053 (Put Date 7/01/2032) | 105,000 | 109,501 | ||
| Tarrant County, TX, Cultural Education Facilities Finance Corp., Hospital Rev. (Baylor Scott & White Health Project), “F”, 5%, 11/15/2052 (Put Date 11/15/2030) | 250,000 | 265,182 | ||
| Texas Public Finance Authority Rev. (Texas Southern University), BAM, 5.25%, 4/30/2034 | 1,000,000 | 1,056,038 | ||
| Texas Public Finance Authority Rev. (Texas Southern University), “A”, BAM, 5%, 4/30/2026 | 125,000 | 125,868 | ||
| Texas Public Finance Authority, Financing System Refunding Rev. (Midwestern State University), “A”, 4%, 12/01/2033 | 75,000 | 71,901 | ||
| Travis County, TX, Housing Finance Corp., Multi-Family Housing Rev. (Airport Gateway Apartments), 4.125%, 6/01/2045 (Put Date 6/01/2027) | 335,000 | 322,674 | ||
| $9,352,796 | ||||
| U.S. Virgin Islands - 0.1% | ||||
| Matching Fund Special Purpose Securitization Corp., “A”, 5%, 10/01/2025 | $ | 100,000 | $100,596 | |
24
Portfolio of Investments (unaudited)
– continued
| Issuer | Shares/Par | Value ($) | ||
| Municipal Bonds - continued | ||||
| Utah - 1.5% | ||||
| Mapleton City, UT, Municipal Energy Sales Tax & Telecommunications Fee Rev., 3%, 6/15/2025 | $ | 200,000 | $193,969 | |
| Salt Lake City, UT, Airport Rev. (International Airport), “A”, 5.25%, 6/30/2037 | 1,000,000 | 1,061,601 | ||
| Utah Housing Corp., Tax Exempt Mortgage-Backed Securities, “I”, GNMA, 2.5%, 8/21/2051 | 14,295 | 11,172 | ||
| Utah Housing Corp., Tax Exempt Mortgage-Backed Securities, “I”, GNMA, 5%, 9/21/2052 | 723,198 | 683,683 | ||
| Utah Infrastructure Agency Telecommunications & Franchise Tax Rev. (Pleasant Grove City Project), 2%, 10/15/2025 | 125,000 | 117,338 | ||
| $2,067,763 | ||||
| Vermont - 1.9% | ||||
| Vermont Student Assistance Corp., Education Loan Rev., “A”, 5%, 6/15/2032 | $ | 1,700,000 | $1,714,170 | |
| Vermont Student Assistance Corp., Education Loan Rev., Tax-Exempt, “A”, 5%, 6/15/2032 | 1,000,000 | 1,004,112 | ||
| $2,718,282 | ||||
| Virginia - 1.7% | ||||
| Charles City County, VA, Industrial Development Authority, Solid Waste Disposal Rev. (Waste Management, Inc. Project), “A”, 3.95%, 8/01/2027 (Put Date 5/01/2024) | $ | 75,000 | $74,693 | |
| Chesapeake, VA, Economic Development Authority Pollution Control Rev. (Virginia Electric and Power Company Project), “A”, 3.65%, 2/01/2032 (Put Date 10/01/2027) | 305,000 | 295,287 | ||
| Gloucester County, VA, Industrial Development Authority Rev. (Waste Management Disposal Services of Virginia, Inc.), “A”, 3.95%, 9/01/2038 (Put Date 5/01/2024) | 60,000 | 59,809 | ||
| Louisa, VA, Industrial Development Authority, Pollution Control Refunding Rev. (Virginia Electric and Power Co. Project), “A”, 3.65%, 11/01/2035 (Put Date 10/01/2027) | 85,000 | 82,293 | ||
| Sussex County, VA, Industrial Development Authority Solid Waste Disposal Rev. (Atlantic Waste Disposal, Inc. Project), “A”, 3.95%, 6/01/2028 (Put Date 5/01/2024) | 100,000 | 99,591 | ||
| Virginia Beach, VA, Development Authority Residential Care Facility Refunding Rev. (Westminster-Canterbury on Chesapeake Bay), 5%, 9/01/2029 | 95,000 | 93,377 | ||
| Virginia Small Business Financing Authority Rev. (Hampton University), 5.25%, 10/01/2029 | 180,000 | 181,249 | ||
| Virginia Small Business Financing Authority, Environmental Facilities Rev. (Pure Salmon Virginia LLC Project), 3.5%, 11/01/2052 (Put Date 11/01/2023) | 1,000,000 | 999,154 | ||
25
Portfolio of Investments (unaudited)
– continued
| Issuer | Shares/Par | Value ($) | ||
| Municipal Bonds - continued | ||||
| Virginia - continued | ||||
| York, VA, Economic Development Authority Pollution Control Rev. (Virginia Electric and Power Company Project), “A”, 3.65%, 5/01/2033 (Put Date 10/01/2027) | $ | 610,000 | $590,573 | |
| $2,476,026 | ||||
| Washington - 2.2% | ||||
| Everett, WA, Housing Authority Refunding Rev. (Huntington Park Apartments Project), 4%, 7/01/2037 | $ | 210,000 | $183,992 | |
| Seattle, WA, Housing Authority Rev. (Lam Bow Apartments Project), 4%, 6/01/2027 | 185,000 | 182,998 | ||
| Washington Economic Development Finance Authority, Environmental Facilities Refunding Rev. (Mura Cascade ELP LLC Project), 3.9%, 12/01/2042 (Put Date 12/08/2023) (n) | 680,000 | 678,357 | ||
| Washington Higher Education Facilities Authority Refunding Rev., (Gonzaga University Project), 4%, 4/01/2041 | 1,000,000 | 865,326 | ||
| Washington State Housing Finance Commission Non-Profit Housing Refunding Rev. (Eastside Retirement Association DBA Emerald Heights Project), “A”, 4.75%, 6/30/2027 | 430,000 | 422,985 | ||
| Washington State Housing Finance Commission Non-Profit Housing Rev. (Eastside Retirement Association DBA Emerald Heights Project), “B-1”, 5%, 6/30/2038 | 795,000 | 797,733 | ||
| $3,131,391 | ||||
| West Virginia - 0.2% | ||||
| West Virginia Economic Development Authority, Solid Waste Disposal Facilities Refunding Rev. (Wheeling Power Co. - Mitchell Project), “A”, 3%, 6/01/2037 (Put Date 6/18/2027) | $ | 330,000 | $303,391 | |
| Wisconsin - 3.5% | ||||
| Wisconsin Health & Educational Facilities Authority Refunding Rev. (Froedtert Health, Inc. Obligated Group), “A”, 4%, 4/01/2040 | $ | 1,000,000 | $886,229 | |
| Wisconsin Health & Educational Facilities Authority Refunding Rev. (Saint John's Communities, Inc.), “B”, 4%, 9/15/2024 | 205,000 | 202,967 | ||
| Wisconsin Health & Educational Facilities Authority Refunding Rev. (Saint John's Communities, Inc.), “B”, 4%, 9/15/2027 | 290,000 | 277,411 | ||
| Wisconsin Health & Educational Facilities Authority Refunding Rev. (Saint John's Communities, Inc.), “B”, 4%, 9/15/2028 | 195,000 | 184,246 | ||
| Wisconsin Health & Educational Facilities Authority Refunding Rev. (Saint John's Communities, Inc.), “B”, 4%, 9/15/2029 | 310,000 | 289,204 | ||
| Wisconsin Health & Educational Facilities Authority Rev. (Bellin Memorial Hospital, Inc.), “A”, 5%, 12/01/2037 | 200,000 | 202,883 | ||
| Wisconsin Health & Educational Facilities Authority Rev. (Milwaukee Science Education Consortium, Inc.), “A”, 4.5%, 3/15/2033 | 175,000 | 168,699 | ||
26
Portfolio of Investments (unaudited)
– continued
| Issuer | Shares/Par | Value ($) | ||
| Municipal Bonds - continued | ||||
| Wisconsin - continued | ||||
| Wisconsin Health & Educational Facilities Authority Rev. (Oakwood Lutheran Senior Ministries), 4%, 1/01/2030 | $ | 400,000 | $358,427 | |
| Wisconsin Public Finance Authority Air Cargo Obligated Group Rev. (AFCO Airport Real Estate Group), 5%, 7/01/2033 | 750,000 | 749,774 | ||
| Wisconsin Public Finance Authority Education Rev. (Triad Educational Services, Inc.), 5%, 6/15/2032 | 500,000 | 488,924 | ||
| Wisconsin Public Finance Authority Entrance Fee Principal Redemption Accredited Rev. (Searstone CCRC Project), “B2”, 2.25%, 6/01/2027 (n) | 55,000 | 50,497 | ||
| Wisconsin Public Finance Authority Entrance Fee Principal Redemption Accredited Rev., Taxable (Searstone CCRC Project), “C”, 2.75%, 6/01/2026 (n) | 25,000 | 24,305 | ||
| Wisconsin Public Finance Authority Hospital Rev., Taxable (UNC Health Southeastern), “B”, 1.143%, 2/01/2024 | 125,000 | 119,938 | ||
| Wisconsin Public Finance Authority Limited Obligation Grant Rev. (American Dream at Meadowlands Project), “A”, 6.25%, 8/01/2027 (a)(d)(n) | 105,000 | 80,194 | ||
| Wisconsin Public Finance Authority Project Rev. (Eastern Michigan University Student Housing Project), “A-1”, 5.25%, 7/01/2037 | 670,000 | 712,793 | ||
| Wisconsin Public Finance Authority Retirement Facilities First Mortgage Rev. (United Methodist Retirement Homes), “A”, 4%, 10/01/2030 | 270,000 | 251,654 | ||
| $5,048,145 | ||||
| Total Municipal Bonds (Identified Cost, $146,282,217) | $138,970,071 | |||
| Bonds – 0.4% | ||||
| Consumer Services – 0.4% | ||||
| Toll Road Investors Partnership II LP, Capital Appreciation, NPFG, 0%, 2/15/2025 (n) | $ | 149,000 | $134,166 | |
| Toll Road Investors Partnership II LP, Capital Appreciation, NPFG, 0%, 2/15/2028 (n) | 500,000 | 360,838 | ||
| Toll Road Investors Partnership II LP, Capital Appreciation, NPFG, 0%, 2/15/2043 (n) | 378,198 | 124,327 | ||
| Total Bonds (Identified Cost, $650,245) | $619,331 | |||
| Other Municipal Bonds – 0.1% | ||||
| Multi-Family Housing Revenue – 0.1% | ||||
| Affordable Housing Opportunities Trust Certificates, AH-01, “A”, 3.527%, 4/30/2039 (n) (Identified Cost, $223,432) | $ | 280,000 | $216,720 | |
27
Portfolio of Investments (unaudited)
– continued
| Issuer | Shares/Par | Value ($) | ||
| Contingent Value Instruments - 0.1% | ||||
| General Obligations - General Purpose – 0.1% | ||||
| Commonwealth of Puerto Rico, General Obligation Contingent Value Instrument, 11/01/2043 (Identified Cost, $108,712) | $ | 183,229 | $95,050 | |
| Investment Companies (h) - 2.0% | ||||
| Money Market Funds – 2.0% | ||||
| MFS Institutional Money Market Portfolio, 5.4% (v) (Identified Cost, $2,897,845) | 2,897,664 | $2,898,244 | ||
| Other Assets, Less Liabilities - 0.3% | 373,558 | |||
| Net Assets - 100.0% | $143,172,974 | |||
| (a) | Non-income producing security. |
| (d) | In default. |
| (h) | An affiliated issuer, which may be considered one in which the fund owns 5% or more of the outstanding voting securities, or a company which is under common control. At period end, the aggregate values of the fund's investments in affiliated issuers and in unaffiliated issuers were $2,898,244 and $139,901,172, respectively. |
| (n) | Securities exempt from registration under Rule 144A of the Securities Act of 1933. These securities may be sold in the ordinary course of business in transactions exempt from registration, normally to qualified institutional buyers. At period end, the aggregate value of these securities was $7,128,782, representing 5.0% of net assets. |
| (v) | Affiliated issuer that is available only to investment companies managed by MFS. The rate quoted for the MFS Institutional Money Market Portfolio is the annualized seven-day yield of the fund at period end. |
| (w) | When-issued security. |
| The following abbreviations are used in this report and are defined: | |
| AAC | Ambac Assurance Corp. |
| AGM | Assured Guaranty Municipal |
| BAM | Build America Mutual |
| COP | Certificate of Participation |
| ETM | Escrowed to Maturity |
| FHA | Federal Housing Administration |
| FLR | Floating Rate. Interest rate resets periodically based on the parenthetically disclosed reference rate plus a spread (if any). The period-end rate reported may not be the current rate. All reference rates are USD unless otherwise noted. |
| FNMA | Federal National Mortgage Assn. |
| GNMA | Government National Mortgage Assn. |
| LIBOR | London Interbank Offered Rate |
| NPFG | National Public Finance Guarantee Corp. |
| PSF | Permanent School Fund |
| VRDN | Variable rate demand note that may be puttable to the issuer at the option of the holder. The stated interest rate, which generally resets either daily or weekly, represents the rate in effect at period end and may not be the current rate. |
See Notes to Financial Statements
28
Financial Statements
Statement of Assets and
Liabilities
At 9/30/23 (unaudited)
This statement represents your
fund’s balance sheet, which details the assets and liabilities comprising the total value of the fund.
| Assets | |
| Investments in unaffiliated issuers, at value (identified cost, $147,264,606) | $139,901,172 |
| Investments in affiliated issuers, at value (identified cost, $2,897,845) | 2,898,244 |
| Cash | 823 |
| Receivables for | |
| Investments sold | 1,291,195 |
| Fund shares sold | 82,187 |
| Interest | 1,854,515 |
| Receivable from investment adviser | 13,944 |
| Other assets | 148 |
| Total assets | $146,042,228 |
| Liabilities | |
| Payables for | |
| Distributions | $13,069 |
| Investments purchased | 767,092 |
| When-issued investments purchased | 1,564,245 |
| Fund shares reacquired | 409,246 |
| Payable to affiliates | |
| Administrative services fee | 253 |
| Shareholder servicing costs | 26,694 |
| Distribution and service fees | 2,203 |
| Accrued expenses and other liabilities | 86,452 |
| Total liabilities | $2,869,254 |
| Net assets | $143,172,974 |
| Net assets consist of | |
| Paid-in capital | $153,628,024 |
| Total distributable earnings (loss) | (10,455,050) |
| Net assets | $143,172,974 |
| Shares of beneficial interest outstanding | 16,359,787 |
29
Statement of Assets and Liabilities (unaudited) – continued
| Net assets | Shares outstanding | Net asset value per share (a) | |
| Class A | $105,030,530 | 11,999,008 | $8.75 |
| Class C | 565,547 | 64,732 | 8.74 |
| Class I | 29,717,332 | 3,397,070 | 8.75 |
| Class R6 | 7,859,565 | 898,977 | 8.74 |
| (a) | Maximum offering price per share was equal to the net asset value per share for all share classes, except for Class A, for which the maximum offering price per share was $9.14 [100 / 95.75 x $8.75]. On sales of $100,000 or more, the maximum offering price of Class A shares is reduced. A contingent deferred sales charge may be imposed on redemptions of Class A and Class C shares. Redemption price per share was equal to the net asset value per share for Classes I and R6. |
See Notes to Financial Statements
30
Financial Statements
Statement of Operations
Six months ended 9/30/23
(unaudited)
This statement describes how much
your fund earned in investment income and accrued in expenses. It also describes any gains and/or losses generated by fund operations.
| Net investment income (loss) | |
| Income | |
| Interest | $2,675,586 |
| Dividends from affiliated issuers | 84,387 |
| Total investment income | $2,759,973 |
| Expenses | |
| Management fee | $252,550 |
| Distribution and service fees | 131,817 |
| Shareholder servicing costs | 49,159 |
| Administrative services fee | 15,518 |
| Independent Trustees' compensation | 2,197 |
| Custodian fee | 20,185 |
| Shareholder communications | 5,069 |
| Audit and tax fees | 30,539 |
| Legal fees | 913 |
| Registration fees | 46,283 |
| Miscellaneous | 14,431 |
| Total expenses | $568,661 |
| Reduction of expenses by investment adviser | (116,066) |
| Net expenses | $452,595 |
| Net investment income (loss) | $2,307,378 |
| Realized and unrealized gain (loss) | |
| Realized gain (loss) (identified cost basis) | |
| Unaffiliated issuers | $(401,557) |
| Affiliated issuers | (1,097) |
| Net realized gain (loss) | $(402,654) |
| Change in unrealized appreciation or depreciation | |
| Unaffiliated issuers | $(6,734,585) |
| Affiliated issuers | (10) |
| Net unrealized gain (loss) | $(6,734,595) |
| Net realized and unrealized gain (loss) | $(7,137,249) |
| Change in net assets from operations | $(4,829,871) |
See Notes to Financial Statements
31
Financial Statements
Statements of Changes in Net
Assets
These statements describe the
increases and/or decreases in net assets resulting from operations, any distributions, and any shareholder transactions.
| Six months ended | Year ended | |
| 9/30/23 (unaudited) | 3/31/23 | |
| Change in net assets | ||
| From operations | ||
| Net investment income (loss) | $2,307,378 | $2,519,712 |
| Net realized gain (loss) | (402,654) | (1,671,391) |
| Net unrealized gain (loss) | (6,734,595) | 837,124 |
| Change in net assets from operations | $(4,829,871) | $1,685,445 |
| Total distributions to shareholders | $(2,282,611) | $(2,542,750) |
| Change in net assets from fund share transactions | $11,913,709 | $63,763,962 |
| Total change in net assets | $4,801,227 | $62,906,657 |
| Net assets | ||
| At beginning of period | 138,371,747 | 75,465,090 |
| At end of period | $143,172,974 | $138,371,747 |
See Notes to Financial Statements
32
Financial Statements
Financial Highlights
The financial highlights table is
intended to help you understand the fund's financial performance for the semiannual period and the past 5 fiscal years (or life of a particular share class, if shorter). Certain information reflects financial results
for a single fund share. The total returns in the table represent the rate that an investor would have earned (or lost) on an investment in the fund share class (assuming reinvestment of all distributions) held for
the entire period.
| Class A | Six months ended | Year ended | |
| 9/30/23 (unaudited) | 3/31/23 | 3/31/22(c) | |
| Net asset value, beginning of period | $9.19 | $9.41 | $10.00 |
| Income (loss) from investment operations | |||
| Net investment income (loss) (d) | $0.14 | $0.22 | $0.13 |
| Net realized and unrealized gain (loss) | (0.44) | (0.22) | (0.59) |
| Total from investment operations | $(0.30) | $0.00(w) | $(0.46) |
| Less distributions declared to shareholders | |||
| From net investment income | $(0.14) | $(0.21) | $(0.08) |
| From net realized gain | — | (0.01) | (0.05) |
| Total distributions declared to shareholders | $(0.14) | $(0.22) | $(0.13) |
| Net asset value, end of period (x) | $8.75 | $9.19 | $9.41 |
| Total return (%) (r)(s)(t)(x) | (3.30)(n) | (0.05) | (4.62)(n) |
| Ratios (%) (to average net assets) and Supplemental data: | |||
| Expenses before expense reductions (f) | 0.86(a) | 0.93 | 0.97(a) |
| Expenses after expense reductions (f) | 0.70(a) | 0.70 | 0.70(a) |
| Net investment income (loss) | 3.13(a) | 2.38 | 1.46(a) |
| Portfolio turnover | 17(n) | 39 | 165(n) |
| Net assets at end of period (000 omitted) | $105,031 | $97,424 | $54,967 |
See Notes to Financial Statements
33
Financial Highlights – continued
| Class C | Six months ended | Year ended | |
| 9/30/23 (unaudited) | 3/31/23 | 3/31/22(c) | |
| Net asset value, beginning of period | $9.18 | $9.39 | $10.00 |
| Income (loss) from investment operations | |||
| Net investment income (loss) (d) | $0.11 | $0.16 | $0.03 |
| Net realized and unrealized gain (loss) | (0.44) | (0.22) | (0.56) |
| Total from investment operations | $(0.33) | $(0.06) | $(0.53) |
| Less distributions declared to shareholders | |||
| From net investment income | $(0.11) | $(0.14) | $(0.03) |
| From net realized gain | — | (0.01) | (0.05) |
| Total distributions declared to shareholders | $(0.11) | $(0.15) | $(0.08) |
| Net asset value, end of period (x) | $8.74 | $9.18 | $9.39 |
| Total return (%) (r)(s)(t)(x) | (3.66)(n) | (0.69) | (5.32)(n) |
| Ratios (%) (to average net assets) and Supplemental data: | |||
| Expenses before expense reductions (f) | 1.61(a) | 1.68 | 1.82(a) |
| Expenses after expense reductions (f) | 1.45(a) | 1.45 | 1.43(a) |
| Net investment income (loss) | 2.38(a) | 1.79 | 0.36(a) |
| Portfolio turnover | 17(n) | 39 | 165(n) |
| Net assets at end of period (000 omitted) | $566 | $659 | $74 |
See Notes to Financial Statements
34
Financial Highlights – continued
| Class I | Six months ended | Year ended | |
| 9/30/23 (unaudited) | 3/31/23 | 3/31/22(c) | |
| Net asset value, beginning of period | $9.19 | $9.40 | $10.00 |
| Income (loss) from investment operations | |||
| Net investment income (loss) (d) | $0.15 | $0.23 | $0.15 |
| Net realized and unrealized gain (loss) | (0.44) | (0.20) | (0.60) |
| Total from investment operations | $(0.29) | $0.03 | $(0.45) |
| Less distributions declared to shareholders | |||
| From net investment income | $(0.15) | $(0.23) | $(0.10) |
| From net realized gain | — | (0.01) | (0.05) |
| Total distributions declared to shareholders | $(0.15) | $(0.24) | $(0.15) |
| Net asset value, end of period (x) | $8.75 | $9.19 | $9.40 |
| Total return (%) (r)(s)(t)(x) | (3.17)(n) | 0.30 | (4.53)(n) |
| Ratios (%) (to average net assets) and Supplemental data: | |||
| Expenses before expense reductions (f) | 0.61(a) | 0.68 | 0.72(a) |
| Expenses after expense reductions (f) | 0.45(a) | 0.45 | 0.45(a) |
| Net investment income (loss) | 3.37(a) | 2.58 | 1.70(a) |
| Portfolio turnover | 17(n) | 39 | 165(n) |
| Net assets at end of period (000 omitted) | $29,717 | $34,682 | $20,041 |
See Notes to Financial Statements
35
Financial Highlights – continued
| Class R6 | Six months ended | Year ended | |
| 9/30/23 (unaudited) | 3/31/23 | 3/31/22(c) | |
| Net asset value, beginning of period | $9.18 | $9.40 | $10.00 |
| Income (loss) from investment operations | |||
| Net investment income (loss) (d) | $0.16 | $0.27 | $0.08 |
| Net realized and unrealized gain (loss) | (0.45) | (0.25) | (0.52) |
| Total from investment operations | $(0.29) | $0.02 | $(0.44) |
| Less distributions declared to shareholders | |||
| From net investment income | $(0.15) | $(0.23) | $(0.11) |
| From net realized gain | — | (0.01) | (0.05) |
| Total distributions declared to shareholders | $(0.15) | $(0.24) | $(0.16) |
| Net asset value, end of period (x) | $8.74 | $9.18 | $9.40 |
| Total return (%) (r)(s)(t)(x) | (3.16)(n) | 0.25 | (4.49)(n) |
| Ratios (%) (to average net assets) and Supplemental data: | |||
| Expenses before expense reductions (f) | 0.54(a) | 0.60 | 0.85(a) |
| Expenses after expense reductions (f) | 0.38(a) | 0.37 | 0.37(a) |
| Net investment income (loss) | 3.44(a) | 2.94 | 0.93(a) |
| Portfolio turnover | 17(n) | 39 | 165(n) |
| Net assets at end of period (000 omitted) | $7,860 | $5,607 | $383 |
| (a) | Annualized. |
| (c) | For the period from the commencement of the fund’s investment operations, May 18, 2021, through the stated period end. |
| (d) | Per share data is based on average shares outstanding. |
| (f) | Ratios do not reflect reductions from fees paid indirectly, if applicable. See Note 2 in the Notes to Financial Statements for additional information. |
| (n) | Not annualized. |
| (r) | Certain expenses have been reduced without which performance would have been lower. |
| (s) | From time to time the fund may receive proceeds from litigation settlements, without which performance would be lower. |
| (t) | Total returns do not include any applicable sales charges. |
| (w) | Per share amount was less than $0.01. |
| (x) | The net asset values and total returns have been calculated on net assets which include adjustments made in accordance with U.S. generally accepted accounting principles required at period end for financial reporting purposes. |
See Notes to Financial Statements
36
Notes to Financial Statements
(unaudited)
(1) Business and
Organization
MFS Municipal Intermediate
Fund (the fund) is a diversified series of MFS Municipal Series Trust (the trust). The trust is organized as a Massachusetts business trust and is registered under the Investment Company Act of 1940,
as amended, as an open-end management investment company.
The fund is an investment company
and accordingly follows the investment company accounting and reporting guidance of the Financial Accounting Standards Board (FASB) Accounting Standards Codification Topic 946 Financial Services - Investment
Companies.
(2) Significant Accounting
Policies
General — The preparation of financial statements in conformity with U.S. generally accepted accounting principles requires management to make estimates and assumptions that affect the
reported amounts of assets and liabilities, and disclosure of contingent assets and liabilities at the date of the financial statements and the reported amounts of increases and decreases in net assets from operations
during the reporting period. Actual results could differ from those estimates. In the preparation of these financial statements, management has evaluated subsequent events occurring after the date of the fund’s
Statement of Assets and Liabilities through the date that the financial statements were issued. The fund invests primarily in municipal instruments, which generally trade in the over-the-counter market. The value of municipal instruments can be affected by changes in their actual or
perceived credit quality. The credit quality of, and the ability to pay principal and interest when due by, an issuer of a municipal instrument depends on the credit quality of the entity supporting the municipal
instrument, how essential any services supported by the municipal instrument are, the sufficiency of any revenues or taxes that support the municipal instrument, and/or the willingness or ability of the appropriate
government entity to approve any appropriations necessary to support the municipal instrument. Municipal instruments may be supported by insurance which typically guarantees the timely payment of all principal and
interest due on the underlying municipal instrument. The value of a municipal instrument can be volatile and significantly affected by adverse tax changes or court rulings, legislative or political changes, changes in
specific or general market and economic conditions in the region where the instrument is issued, and the financial condition of municipal issuers and of municipal instrument insurers of which there are a limited
number. Also, because many municipal instruments are issued to finance similar projects, conditions in certain industries can significantly affect the fund and the overall municipal market. If the Internal Revenue
Service determines an issuer of a municipal instrument has not complied with the applicable tax requirements, interest from the security could become taxable, the security could decline in value, and distributions
made by the fund could be taxable to shareholders.
Balance Sheet Offsetting — The fund's accounting policy with respect to balance sheet offsetting is that, absent an event of default by the counterparty or a termination of the agreement, the International
Swaps and Derivatives Association (ISDA) Master Agreement, or similar agreement, does not result in an offset of reported amounts of financial assets and financial liabilities in the Statement of Assets and
Liabilities across transactions between the fund and the applicable counterparty. The fund's right to setoff may be restricted or prohibited by the bankruptcy or insolvency laws of the
37
Notes to Financial
Statements (unaudited) - continued
particular jurisdiction to which a specific master
netting agreement counterparty is subject. Balance sheet offsetting disclosures, to the extent applicable to the fund, have been included in the fund’s Significant Accounting Policies note under the captions for
each of the fund’s in-scope financial instruments and transactions.
Investment Valuations — Subject to its oversight, the fund's Board of Trustees has delegated primary responsibility for determining or causing to be determined the value of the fund’s investments to MFS as
the fund's adviser, pursuant to the fund’s valuation policy and procedures which have been adopted by the adviser and approved by the Board. In accordance with Rule 2a-5 under the Investment Company Act of
1940, the Board of Trustees designated the adviser as the “valuation designee” of the fund. If the adviser, as valuation designee, determines that reliable market quotations are not readily available for
an investment, the investment is valued at fair value as determined in good faith by the adviser in accordance with the adviser’s fair valuation policy and procedures.
Under the fund's valuation policy
and procedures, debt instruments and floating rate loans, including restricted debt instruments, are generally valued at an evaluated or composite bid as provided by a third-party pricing service. Short-term
instruments with a maturity at issuance of 60 days or less may be valued at amortized cost, which approximates market value. Open-end investment companies are generally valued at net asset value per share.
Under the fund’s valuation
policy and procedures, market quotations are not considered to be readily available for debt instruments, floating rate loans, and many types of derivatives. These investments are generally valued at fair value based
on information from third-party pricing services or otherwise determined by the adviser in accordance with the adviser’s fair valuation policy and procedures. Securities and other assets generally valued on the
basis of information from a third-party pricing service may also be valued at a broker/dealer bid quotation. In determining values, third-party pricing services can utilize both transaction data and market information
such as yield, quality, coupon rate, maturity, type of issue, trading characteristics, spreads and other market data. An investment may also be valued at fair value if the adviser determines that the
investment’s value has been materially affected by events occurring after the close of the exchange or market on which the investment is principally traded (such as foreign exchange or market) and prior to the
determination of the fund’s net asset value, or after the halt of trading of a specific security where trading does not resume prior to the close of the exchange or market on which the security is principally
traded. The adviser generally relies on third-party pricing services or other information (such as the correlation with price movements of similar securities in the same or other markets; the type, cost and investment
characteristics of the security; the business and financial condition of the issuer; and trading and other market data) to assist in determining whether to fair value and at what value to fair value an investment. The
value of an investment for purposes of calculating the fund’s net asset value can differ depending on the source and method used to determine value. When fair valuation is used, the value of an investment used
to determine the fund’s net asset value may differ from quoted or published prices for the same investment. There can be no assurance that the fund could obtain the fair value assigned to an investment if it
were to sell the investment at the same time at which the fund determines its net asset value per share.
38
Notes to Financial
Statements (unaudited) - continued
Various inputs are used in
determining the value of the fund's assets or liabilities. These inputs are categorized into three broad levels. In certain cases, the inputs used to measure fair value may fall into different levels of the fair value
hierarchy. In such cases, an investment's level within the fair value hierarchy is based on the lowest level of input that is significant to the fair value measurement. The fund's assessment of the significance of a
particular input to the fair value measurement in its entirety requires judgment, and considers factors specific to the investment. Level 1 includes unadjusted quoted prices in active markets for identical assets or
liabilities. Level 2 includes other significant observable market-based inputs (including quoted prices for similar securities, interest rates, prepayment speed, and credit risk). Level 3 includes significant
unobservable inputs, which may include the adviser's own assumptions in determining the fair value of investments. The following is a summary of the levels used as of September 30, 2023 in valuing the fund's assets
and liabilities:
| Financial Instruments | Level 1 | Level 2 | Level 3 | Total |
| Municipal Bonds | $— | $139,281,841 | $— | $139,281,841 |
| U.S. Corporate Bonds | — | 619,331 | — | 619,331 |
| Mutual Funds | 2,898,244 | — | — | 2,898,244 |
| Total | $2,898,244 | $139,901,172 | $— | $142,799,416 |
For further information regarding
security characteristics, see the Portfolio of Investments.
Indemnifications — Under the fund's organizational documents, its officers and Trustees may be indemnified against certain liabilities and expenses arising out of the performance of their duties to
the fund. Additionally, in the normal course of business, the fund enters into agreements with service providers that may contain indemnification clauses. The fund's maximum exposure under these agreements is unknown
as this would involve future claims that may be made against the fund that have not yet occurred.
Investment Transactions and
Income — Interest income is recorded on the accrual basis. All premium and discount is amortized or accreted for financial statement purposes in accordance with U.S. generally accepted accounting principles. Interest payments received in additional securities are recorded on the ex-interest date in an amount equal to the value of the security on such date. Debt obligations may be placed on non-accrual status or set to accrue at a rate of interest less than the contractual coupon when the collection of all or a portion of interest has become
doubtful. Interest income for those debt obligations may be further reduced by the write-off of the related interest receivables when deemed uncollectible.
The fund may receive proceeds from
litigation settlements. Any proceeds received from litigation involving portfolio holdings are reflected in the Statement of Operations in realized gain/loss if the security has been disposed of by the fund or in
unrealized gain/loss if the security is still held by the fund. Any other proceeds from litigation not related to portfolio holdings are reflected as other income in the Statement of Operations.
Investment transactions are recorded
on the trade date. In determining the net gain or loss on securities sold, the cost of securities is determined on the identified cost basis.
39
Notes to Financial
Statements (unaudited) - continued
The fund may purchase or sell
securities on a when-issued or delayed delivery basis. In these extended settlement transactions, the receipt or delivery of the securities by the fund and related payments occur at a future date, usually beyond
the customary settlement period. The price of such security and the date that the security will be settled are generally fixed at the time the transaction is negotiated. The value of the security varies with market
fluctuations and for debt securities no interest accrues to the fund until settlement takes place. When the fund sells securities on a when-issued or delayed delivery basis, the fund typically owns or has the right to
acquire securities equivalent in kind and amount to the securities sold. Purchase and sale commitments for when-issued or delayed delivery securities are held at carrying amount, which approximates fair value and are
categorized as level 2 within the fair value hierarchy, and included in When-issued investments purchased and When-issued investments sold in the Statement of Assets and Liabilities, as applicable. Losses may arise
due to changes in the value of the underlying securities prior to settlement date or if the counterparty does not perform under the contract’s terms, or if the issuer does not issue the securities due to
political, economic or other factors.
Legal fees and other related
expenses incurred to preserve and protect the value of a security owned are added to the cost of the security; other legal fees are expensed. Capital infusions made directly to the security issuer, which are generally
non-recurring, incurred to protect or enhance the value of high-yield debt securities, are reported as additions to the cost basis of the security. Costs that are incurred to negotiate the terms or conditions of
capital infusions or that are expected to result in a plan of reorganization are reported as realized losses. Ongoing costs incurred to protect or enhance an investment, or costs incurred to pursue other claims or
legal actions, are expensed.
Fees Paid Indirectly — The fund's custody fee may be reduced by a credit earned under an arrangement that measures the value of U.S. dollars deposited with the custodian by the fund. For the six months
ended September 30, 2023, custody fees were not reduced.
Tax Matters and Distributions — The fund intends to qualify as a regulated investment company, as defined under Subchapter M of the Internal Revenue Code, and to distribute all of its taxable and tax-exempt
income, including realized capital gains. As a result, no provision for federal income tax is required. The fund’s federal tax returns, when filed, will remain subject to examination by the Internal Revenue
Service for a three year period. Management has analyzed the fund’s tax positions taken on federal and state tax returns for all open tax years and does not believe that there are any uncertain tax positions
that require recognition of a tax liability.
Distributions to shareholders are
recorded on the ex-dividend date. Income and capital gain distributions are determined in accordance with income tax regulations, which may differ from U.S. generally accepted accounting principles. Certain capital
accounts in the financial statements are periodically adjusted for permanent differences in order to reflect their tax character. These adjustments have no impact on net assets or net asset value per share. Temporary
differences which arise from recognizing certain items of income, expense, gain or loss in different periods for financial statement and tax purposes will reverse at some time in the future.
Book/tax differences primarily
relate to defaulted bonds.
40
Notes to Financial
Statements (unaudited) - continued
The tax character of distributions
made during the current period will be determined at fiscal year end. The tax character of distributions declared to shareholders for the last fiscal year is as follows:
| Year ended 3/31/23 | |
| Ordinary income (including any short-term capital gains) | $71,363 |
| Tax-exempt income | 2,404,782 |
| Long-term capital gains | 66,605 |
| Total distributions | $2,542,750 |
The federal tax cost and the tax
basis components of distributable earnings were as follows:
| As of 9/30/23 | |
| Cost of investments | $150,164,269 |
| Gross appreciation | 209,687 |
| Gross depreciation | (7,574,540) |
| Net unrealized appreciation (depreciation) | $(7,364,853) |
| As of 3/31/23 | |
| Undistributed ordinary income | 75,432 |
| Undistributed tax-exempt income | 349,589 |
| Capital loss carryforwards | (2,644,977) |
| Other temporary differences | (349,713) |
| Net unrealized appreciation (depreciation) | (772,899) |
The aggregate cost above includes
prior fiscal year end tax adjustments, if applicable.
As of March 31, 2023, the fund had
capital loss carryforwards available to offset future realized gains. These net capital losses may be carried forward indefinitely and their character is retained as short-term and/or long-term losses. Such losses are
characterized as follows:
| Short-Term | $(1,521,564) |
| Long-Term | (1,123,413) |
| Total | $(2,644,977) |
Multiple Classes of Shares of
Beneficial Interest — The fund offers multiple classes of shares, which differ in their respective distribution and service fees. The fund's income and common expenses are allocated to shareholders based
on the value of settled shares outstanding of each class. The fund's realized and unrealized gain (loss) are allocated to shareholders based on the daily net assets of each class. Dividends are declared separately for
each class. Differences in per share dividend rates are generally due to differences in separate class expenses. Class C shares will convert to Class A
41
Notes to Financial
Statements (unaudited) - continued
shares approximately eight years after purchase.
The fund’s distributions declared to shareholders as reported in the Statements of Changes in Net Assets are presented by class as follows:
| Six months ended 9/30/23 | Year ended 3/31/23 | ||
| Class A | $1,587,580 | $1,713,170 | |
| Class C | 7,419 | 6,455 | |
| Class I | 563,298 | 760,370 | |
| Class R6 | 124,314 | 62,755 | |
| Total | $2,282,611 | $2,542,750 |
(3) Transactions with
Affiliates
Investment Adviser — The fund has an investment advisory agreement with MFS to provide overall investment management and related administrative services and facilities to the fund. The management fee is computed daily and paid monthly at the following annual rates based on the fund's average daily net assets:
| Up to $1 billion | 0.35% |
| In excess of $1 billion and up to $2.5 billion | 0.325% |
| In excess of $2.5 billion | 0.30% |
MFS has agreed in writing to reduce
its management fee by a specified amount if certain MFS mutual fund assets exceed thresholds agreed to by MFS and the fund's Board of Trustees. MFS has also agreed in writing to waive at least 0.01% of its management
fee as part of this agreement. The agreement to waive at least 0.01% of the management fee will continue until modified by the fund's Board of Trustees, but such agreement will continue at least until July 31, 2024.
For the six months ended September 30, 2023, this management fee reduction amounted to $9,065, which is included in the reduction of total expenses in the Statement of Operations. The management fee incurred for the
six months ended September 30, 2023 was equivalent to an annual effective rate of 0.34% of the fund's average daily net assets.
The investment adviser has agreed in
writing to pay a portion of the fund’s total annual operating expenses, excluding interest, taxes, extraordinary expenses, brokerage and transaction costs, certain tax reclaim recovery expenses (including
contingency fees and closing agreement expenses), and investment-related expenses, such that total fund operating expenses do not exceed the following rates annually of each class’s average daily net assets:
| Classes | |||
| A | C | I | R6 |
| 0.70% | 1.45% | 0.45% | 0.38% |
This written agreement will continue
until modified by the fund’s Board of Trustees, but such agreement will continue at least until July 31, 2024. For the six months ended September 30, 2023, this reduction amounted to $107,001, which is included
in the reduction of total expenses in the Statement of Operations.
Distributor — MFS Fund Distributors, Inc. (MFD), a wholly-owned subsidiary of MFS, as distributor, received $1,212 for the six months ended September 30, 2023, as its portion of the initial
sales charge on sales of Class A shares of the fund.
42
Notes to Financial
Statements (unaudited) - continued
The Board of Trustees has adopted a
distribution plan for certain share classes pursuant to Rule 12b-1 of the Investment Company Act of 1940.
The fund's distribution plan
provides that the fund will pay MFD for services provided by MFD and financial intermediaries in connection with the distribution and servicing of certain share classes. One component of the plan is a
distribution fee paid to MFD and another component of the plan is a service fee paid to MFD. MFD may subsequently pay all, or a portion, of the distribution and/or service fees to financial intermediaries. The
distribution and service fees are computed daily and paid monthly.
Distribution Plan Fee Table:
| Distribution Fee Rate (d) | Service Fee Rate (d) | Total Distribution Plan (d) | Annual Effective Rate (e) | Distribution and Service Fee | |
| Class A | — | 0.25% | 0.25% | 0.25% | $ 128,654 |
| Class C | 0.75% | 0.25% | 1.00% | 1.00% | 3,163 |
| Total Distribution and Service Fees | $131,817 |
| (d) | In accordance with the distribution plan for certain classes, the fund pays distribution and/or service fees equal to these annual percentage rates of each class’s average daily net assets. The distribution and service fee rates disclosed by class represent the current rates in effect at the end of the reporting period. Any rate changes, if applicable, are detailed below. |
| (e) | The annual effective rates represent actual fees incurred under the distribution plan for the six months ended September 30, 2023 based on each class's average daily net assets. MFD has voluntarily agreed to rebate a portion of each class's 0.25% service fee attributable to accounts for which there is no financial intermediary specified on the account except for accounts attributable to MFS or its affiliates' seed money. There were no service fee rebates for the six months ended September 30, 2023. |
Certain Class A shares are
subject to a contingent deferred sales charge (CDSC) in the event of a shareholder redemption within 18 months of purchase. Class C shares are subject to a CDSC in the event of a shareholder redemption within 12
months of purchase. All contingent deferred sales charges are paid to MFD and during the six months ended September 30, 2023, were as follows:
| Amount | |
| Class A | $3,807 |
| Class C | — |
Shareholder Servicing Agent — MFS Service Center, Inc. (MFSC), a wholly-owned subsidiary of MFS, receives a fee from the fund for its services as shareholder servicing agent calculated as a percentage of the
average daily net assets of the fund as determined periodically under the supervision of the fund's Board of Trustees. For the six months ended September 30, 2023, the fee was $1,230, which equated to 0.0017% annually
of the fund's average daily net assets. MFSC also receives reimbursement from the fund for out-of-pocket expenses, sub-accounting and other shareholder servicing costs which may be paid to affiliated and unaffiliated
service providers. Class R6 shares do not incur sub-accounting fees. For the six months ended September 30, 2023, these out-of-pocket expenses, sub-accounting and other shareholder servicing costs amounted to
$47,929.
43
Notes to Financial
Statements (unaudited) - continued
Administrator — MFS provides certain financial, legal, shareholder communications, compliance, and other administrative services to the fund. Under an administrative services agreement, the
fund reimburses MFS the costs incurred to provide these services. The fund is charged an annual fixed amount of $17,500 plus a fee based on average daily net assets. The administrative services fee is
computed daily and paid monthly. The administrative services fee incurred for the six months ended September 30, 2023 was equivalent to an annual effective rate of 0.0215% of the fund's average daily net
assets.
Trustees’ and Officers’
Compensation — The fund pays compensation to independent Trustees in the form of a retainer, attendance fees, and additional compensation to Board and Committee chairpersons.
Independent Trustees’ compensation is accrued daily and paid subsequent to each Trustee Board meeting. The fund does not pay compensation directly to Trustees or officers of the fund who are also officers
of the investment adviser, all of whom receive remuneration from MFS for their services to the fund. Certain officers and Trustees of the fund are officers or directors of MFS, MFD, and MFSC.
Other — The fund invests in the MFS Institutional Money Market Portfolio which is managed by MFS and seeks current income consistent with preservation of capital and liquidity. This money
market fund does not pay a management fee to MFS but does incur investment and operating costs.
On the following dates, MFS redeemed
fund shares:
| Class | Date | Shares | Amount |
| Class A | 8/03/22 | 5,143 | $48,190 |
| Class I | 8/03/22 | 5,118 | $47,904 |
| Class R6 | 6/23/23 | 5,232 | $47,664 |
(4) Portfolio Securities
For the six months ended September
30, 2023, purchases and sales of investments, other than short-term obligations, aggregated $36,594,715 and $24,433,130, respectively.
(5) Shares of Beneficial
Interest
The fund's Declaration of Trust
permits the Trustees to issue an unlimited number of full and fractional shares of beneficial interest. Transactions in fund shares were as follows:
| Six months ended 9/30/23 | Year ended 3/31/23 | ||||
| Shares | Amount | Shares | Amount | ||
| Shares sold | |||||
| Class A | 2,208,205 | $20,050,642 | 6,581,655 | $59,636,823 | |
| Class C | 9,540 | 86,566 | 89,863 | 814,675 | |
| Class I | 390,811 | 3,555,861 | 4,925,766 | 44,887,807 | |
| Class R6 | 405,402 | 3,690,950 | 584,308 | 5,246,385 | |
| 3,013,958 | $27,384,019 | 12,181,592 | $110,585,690 | ||
44
Notes to Financial
Statements (unaudited) - continued
| Six months ended 9/30/23 | Year ended 3/31/23 | ||||
| Shares | Amount | Shares | Amount | ||
| Shares issued to shareholders in reinvestment of distributions | |||||
| Class A | 168,330 | $1,517,657 | 176,051 | $1,600,706 | |
| Class C | 824 | 7,419 | 711 | 6,455 | |
| Class I | 62,284 | 561,751 | 83,396 | 757,235 | |
| Class R6 | 13,589 | 122,308 | 6,738 | 61,260 | |
| 245,027 | $2,209,135 | 266,896 | $2,425,656 | ||
| Shares reacquired | |||||
| Class A | (973,991) | $(8,846,793) | (2,003,541) | $(18,220,517) | |
| Class C | (17,481) | (157,299) | (26,579) | (239,408) | |
| Class I | (830,552) | (7,492,871) | (3,366,717) | (30,594,693) | |
| Class R6 | (130,561) | (1,182,482) | (21,298) | (192,766) | |
| (1,952,585) | $(17,679,445) | (5,418,135) | $(49,247,384) | ||
| Net change | |||||
| Class A | 1,402,544 | $12,721,506 | 4,754,165 | $43,017,012 | |
| Class C | (7,117) | (63,314) | 63,995 | 581,722 | |
| Class I | (377,457) | (3,375,259) | 1,642,445 | 15,050,349 | |
| Class R6 | 288,430 | 2,630,776 | 569,748 | 5,114,879 | |
| 1,306,400 | $11,913,709 | 7,030,353 | $63,763,962 | ||
(6) Line of Credit
The fund and certain other funds
managed by MFS participate in a $1.45 billion unsecured committed line of credit of which $1.2 billion is reserved for use by the fund and certain other MFS U.S. funds. The line of credit is provided by a syndicate of
banks under a credit agreement. Borrowings may be made for temporary financing needs. Interest is charged to each fund, based on its borrowings, generally at a rate equal to the highest of 1) Daily Simple SOFR
(Secured Overnight Financing Rate) plus 0.10%, 2) the Federal Funds Effective Rate, or 3) the Overnight Bank Funding Rate, each plus an agreed upon spread. A commitment fee, based on the average daily unused portion
of the committed line of credit, is allocated among the participating funds. The line of credit expires on March 14, 2024 unless extended or renewed. In addition, the fund and other funds managed by MFS have
established unsecured uncommitted borrowing arrangements with certain banks for temporary financing needs. Interest is charged to each fund, based on its borrowings, at rates equal to customary reference rates plus an
agreed upon spread. For the six months ended September 30, 2023, the fund’s commitment fee and interest expense were $338 and $0, respectively, and are included in “Miscellaneous” expense in the
Statement of Operations.
45
Notes to Financial
Statements (unaudited) - continued
(7) Investments in Affiliated
Issuers
An affiliated issuer may be
considered one in which the fund owns 5% or more of the outstanding voting securities, or a company which is under common control. For the purposes of this report, the following were affiliated issuers:
| Affiliated Issuers | Beginning Value | Purchases | Sales Proceeds | Realized Gain (Loss) | Change in Unrealized Appreciation or Depreciation | Ending Value |
| MFS Institutional Money Market Portfolio | $3,049,111 | $33,410,405 | $33,560,165 | $(1,097) | $(10) | $2,898,244 |
| Affiliated Issuers | Dividend Income | Capital Gain Distributions |
| MFS Institutional Money Market Portfolio | $84,387 | $— |
(8) LIBOR Transition
The London Interbank Offered Rate
(LIBOR) was intended to represent the rate at which contributing banks may obtain short-term borrowings from each other in the London interbank market. Certain of the fund's investments, payment obligations, and
financing terms were historically based on LIBOR. In 2017, the United Kingdom Financial Conduct Authority (FCA) announced plans to transition away from LIBOR by the end of 2021. LIBOR's administrator, ICE Benchmark
Administration (IBA), ceased publication (on a representative basis) of many of its LIBOR settings as of December 31, 2021 and ceased publication (on a representative basis) of the remaining U.S. dollar LIBOR settings
as of June 30, 2023. In addition, global regulators announced that, with limited exceptions, no new LIBOR-based contracts should be entered into after 2021. Although the FCA has announced that it will require the IBA
to continue to publish certain select LIBOR rates on a synthetic basis after the relevant cessation dates, such synthetic rates are not considered to be representative of the underlying market and economic reality
they are intended to measure, are expected to be published for a limited time period, and are intended solely for use on a limited basis for legacy transactions.
Regulators and industry groups have
implemented measures to facilitate the transition away from LIBOR and other interbank offered rates to alternative reference rates, such as the Secured Overnight Financing Rate (SOFR). SOFR is a broad measure of the
cost of borrowing cash overnight collateralized by U.S. Treasury securities in the repurchase agreement (repo) market. SOFR is published in various forms including as a daily, compounded, and forward-looking term
rate. The transition to alternative reference rates may affect the liquidity and valuation of investments that were tied to LIBOR or other interbank offered rates and may lead to other consequences affecting
securities and credit markets more broadly. For example, while some investments that were tied to LIBOR provided for an alternative or “fallback” rate-setting methodology in the event LIBOR is not
available, there is uncertainty regarding the effectiveness of any such alternative methodologies to replace LIBOR and certain investments tied to LIBOR may not have fallback provisions. While legislation passed in
the United States facilitates by operation of law the replacement of U.S. dollar LIBOR settings in certain legacy instruments with a specified replacement rate, such as SOFR, there is uncertainty
46
Notes to Financial
Statements (unaudited) - continued
regarding the effectiveness of such legislation.
There also remains uncertainty regarding the willingness and ability of parties to add or amend fallback provisions in certain other legacy instruments maturing after the cessation of the applicable LIBOR rates, which
could create market and litigation risk.
It is difficult to quantify or
predict the impact on the fund resulting from the transition from LIBOR to alternative reference rates and the potential effects of the transition from LIBOR on the fund, or on certain instruments in which
the fund invests, are not known. The transition process may involve, among other things, increased volatility or illiquidity in markets for instruments that relied on LIBOR to determine interest rates. The
transition may also result in a reduction in value of certain LIBOR-related investments held by the fund or reduce the effectiveness of related transactions such as hedges. Any such effects of the transition away from
LIBOR and the adoption of alternative reference rates, as well as other unforeseen effects, could have an adverse impact on the fund's performance.
With respect to the fund’s
accounting for investments, including investments in certain debt instruments and derivatives, as well as borrowings by the fund and any other contractual arrangements of the fund that undergo reference
rate-related modifications as a result of the transition, management has and will continue to rely upon the relief provided by FASB Codification Topic 848 – Reference Rate Reform (Topic 848). The guidance in
Topic 848 permits the fund to account for such contract modifications made on or before December 31, 2024 as a continuation of the existing contracts. The situation remains fluid, and management believes, based on
best available information, that the impact of the transition will not be material to the fund.
47
Board Review of Investment Advisory
Agreement
MFS Municipal Intermediate Fund
The Investment Company Act of 1940
requires that both the full Board of Trustees and a majority of the non-interested (“independent”) Trustees, voting separately, annually approve the continuation of the Fund’s investment advisory
agreement with MFS. The Trustees consider matters bearing on the Fund and its advisory arrangements at their meetings throughout the year, including a review of performance data at each regular meeting. In
addition, the independent Trustees met several times over the course of three months beginning in May and ending in July, 2023 (“contract review meetings”) for the specific purpose of considering whether
to approve the continuation of the investment advisory agreement for the Fund and the other investment companies that the Board oversees (the “MFS Funds”). The independent Trustees were assisted in
their evaluation of the Fund’s investment advisory agreement by independent legal counsel, from whom they received separate legal advice and with whom they met separately from MFS during various contract review
meetings. The independent Trustees were also assisted in this process by an independent consultant who was retained by and reported to the independent Trustees.
In connection with their
deliberations regarding the continuation of the investment advisory agreement, the Trustees, including the independent Trustees, considered such information and factors as they believed, in light of the legal advice
furnished to them and their own business judgment, to be relevant. The investment advisory agreement for the Fund was considered separately, although the Trustees also took into account the common interests of
all MFS Funds in their review. As described below, the Trustees considered the nature, quality, and extent of the various investment advisory, administrative, and shareholder services performed by MFS under the
existing investment advisory agreement and other arrangements with the Fund.
In connection with their contract
review meetings, the Trustees received and relied upon materials that included, among other items: (i) information provided by Broadridge Financial Solutions, Inc. (“Broadridge”), an independent third
party, on the investment performance of the Fund for the one-year period ended December 31, 2022 and the investment performance of a group of funds with substantially similar investment classifications/objectives (the
“Broadridge performance universe”), (ii) information provided by Broadridge on the Fund’s advisory fees and other expenses and the advisory fees and other expenses of comparable funds identified by
Broadridge as well as all other funds in the same investment classification/category (the “Broadridge expense group and universe”), (iii) information provided by MFS on the advisory fees of portfolios of
other clients of MFS, including institutional separate accounts and other clients, (iv) information as to whether and to what extent applicable expense waivers, reimbursements or fee “breakpoints” are
observed for the Fund, (v) information regarding MFS’ financial results and financial condition, including MFS’ and certain of its affiliates’ estimated profitability from services performed for the
Fund and the MFS Funds as a whole, and compared to MFS’ institutional business, (vi) MFS’ views regarding the outlook for the mutual fund industry and the strategic business plans of MFS, (vii)
descriptions of various functions performed by MFS for the Funds, such as compliance monitoring and portfolio trading practices, and (viii) information regarding the overall organization of MFS, including information
about
48
Board Review of Investment Advisory
Agreement - continued
MFS’ senior management and other personnel
providing investment advisory, administrative and other services to the Fund and the other MFS Funds. The comparative performance, fee and expense information prepared and provided by Broadridge was not
independently verified and the independent Trustees did not independently verify any information provided to them by MFS.
The Trustees’ conclusion as to
the continuation of the investment advisory agreement was based on a comprehensive consideration of all information provided to the Trustees and not the result of any single factor. Some of the factors that
figured particularly in the Trustees’ deliberations are described below, although individual Trustees may have evaluated the information presented differently from one another, giving different weights to
various factors. It is also important to recognize that the fee arrangements for the Fund and other MFS Funds are the result of years of review and discussion between the independent Trustees and MFS, that
certain aspects of such arrangements may receive greater scrutiny in some years than in others, and that the Trustees’ conclusions may be based, in part, on their consideration of these same arrangements during
the course of the year and in prior years.
Based on information provided by
Broadridge and MFS, the Trustees reviewed the Fund’s total return investment performance as well as the Broadridge performance universe over the one-year period ended December 2022. The total return
performance of the Fund’s Class I shares was in the 2nd quintile relative to the other funds in the universe for this one-year period (the 1st quintile being the best performers and the 5th quintile being the
worst performers). The Fund commenced operations on May 18, 2021, and has a limited operating history and performance record; therefore, no performance data for the three- or five-year periods was available.
Because of the passage of time, these performance results may differ from the performance results for more recent periods, including those shown elsewhere in this report.
In the course of their
deliberations, the Trustees took into account information provided by MFS in connection with the contract review meetings, as well as during investment review meetings conducted with portfolio management personnel
during the course of the year regarding the Fund’s performance. After reviewing these and related factors, the Trustees concluded, within the context of their overall conclusions regarding the investment
advisory agreement, that they were satisfied with MFS’ responses and efforts relating to investment performance.
In assessing the reasonableness of
the Fund’s advisory fee, the Trustees considered, among other information, the Fund’s advisory fee and the total expense ratio of the Fund’s Class I shares as a percentage of average daily net assets
and the advisory fee and total expense ratios of the Broadridge expense group based on information provided by Broadridge. The Trustees considered that MFS currently observes an expense limitation for the Fund,
which may not be changed without the Trustees’ approval. The Trustees also considered that, according to the data provided by Broadridge (which takes into account any fee reductions or expense limitations
that were in effect during the Fund’s last fiscal-year period), the Fund’s effective advisory fee rate was lower than the Broadridge expense group median and the Fund’s total expense ratio was
approximately at the Broadridge expense group median.
49
Board Review of Investment Advisory
Agreement - continued
The Trustees also considered the
advisory fees charged by MFS to any institutional separate accounts advised by MFS (“separate accounts”) and unaffiliated investment companies for which MFS serves as subadviser (“subadvised
funds”) that have comparable investment strategies to the Fund, if any. In comparing these fees, the Trustees considered information provided by MFS as to the generally broader scope of services provided
by MFS to the Fund, as well as the more extensive regulatory burdens imposed on MFS in managing the Fund, in comparison to separate accounts and subadvised funds. The Trustees also considered the higher demands
placed on MFS’ investment personnel and trading infrastructure as a result of the daily cash in-flows and out-flows of the Fund in comparison to separate accounts.
The Trustees also considered whether
the Fund may benefit from any economies of scale in the management of the Fund in the event of growth in assets of the Fund and/or growth in assets of the MFS Funds as a whole. They noted that the Fund’s
advisory fee rate schedule is subject to contractual breakpoints that reduce the Fund’s advisory fee rate on average daily net assets over $1 billion and $2.5 billion. The Trustees also noted that MFS has
agreed in writing to waive a portion of the management fees of certain MFS Funds, including the Fund, if the total combined assets of certain funds within the MFS Funds’ complex increase above agreed upon
thresholds (the “group fee waiver”), enabling the Fund’s shareholders to share in the benefits from any economies of scale at the complex level. The group fee waiver is reviewed and renewed
annually between the Board and MFS. The Trustees concluded that the breakpoints and the group fee waiver were sufficient to allow the Fund to benefit from economies of scale as its assets and overall complex
assets grow.
The Trustees also considered
information prepared by MFS relating to MFS’ costs and profits with respect to the Fund, the MFS Funds considered as a group, and other investment companies and accounts advised by MFS, as well as MFS’
methodologies used to determine and allocate its costs to the MFS Funds, the Fund and other accounts and products for purposes of estimating profitability.
After reviewing these and other
factors described herein, the Trustees concluded, within the context of their overall conclusions regarding the investment advisory agreement, that the advisory fees charged to the Fund represent reasonable
compensation in light of the services being provided by MFS to the Fund.
In addition, the Trustees considered
MFS’ resources and related efforts to continue to retain, attract and motivate capable personnel to serve the Fund. The Trustees also considered current and developing conditions in the financial services
industry, including the presence of large and well-capitalized companies which are spending, and appear to be prepared to continue to spend, substantial sums to engage personnel and to provide services to competing
investment companies. In this regard, the Trustees also considered the financial resources of MFS and its ultimate parent, Sun Life Financial Inc. The Trustees also considered the advantages and possible
disadvantages to the Fund of having an adviser that also serves other investment companies as well as other accounts.
The Trustees also considered the
nature, quality, cost, and extent of administrative, transfer agency, and distribution services provided to the Fund by MFS and its affiliates under agreements and plans other than the investment advisory agreement,
including any 12b-1 fees the Fund pays to MFS Fund Distributors, Inc., an affiliate of MFS. The Trustees also considered the nature, extent and quality of certain other services
50
Board Review of Investment Advisory
Agreement - continued
MFS performs or arranges for on the Fund’s
behalf, which may include securities lending programs, directed expense payment programs, class action recovery programs, and MFS’ interaction with third-party service providers, principally custodians and
sub-custodians. The Trustees concluded that the various non-advisory services provided by MFS and its affiliates on behalf of the Fund were satisfactory.
The Trustees considered so-called
“fall-out benefits” to MFS such as reputational value derived from serving as investment manager to the MFS Funds. The Trustees also considered that MFS discontinued its historic practice of
obtaining investment research from portfolio brokerage commissions paid by certain MFS Funds effective January 2018, and directly pays or voluntarily reimburses a Fund, if applicable, for the costs of external
research acquired through the use of the Fund’s portfolio brokerage commissions.
Based on their evaluation of factors
that they deemed to be material, including those factors described above, the Board of Trustees, including the independent Trustees, concluded that the Fund’s investment advisory agreement with MFS should be
continued for an additional one-year period, commencing August 1, 2023.
51
Proxy Voting Policies and
Information
MFS votes proxies on behalf of the
fund pursuant to proxy voting policies and procedures that are available without charge, upon request, by calling 1-800-225-2606, by visiting mfs.com/proxyvoting, or by visiting the SEC’s Web site at http://www.sec.gov.
Information regarding how the fund
voted proxies relating to portfolio securities during the most recent twelve-month period ended June 30 is available by August 31 of each year without charge by visiting mfs.com/proxyvoting, or by visiting the SEC’s Web site at http://www.sec.gov.
Quarterly Portfolio
Disclosure
The fund files a complete schedule
of portfolio holdings with the SEC for the first and third quarters of each fiscal year as an exhibit to its reports on Form N-PORT. The fund's Form N-PORT reports are available on the SEC's Web site at http://www.sec.gov. A shareholder can obtain the portfolio holdings report for the first and third quarters of the fund's fiscal year at mfs.com/openendfunds by choosing the fund's name and then scrolling to the “Resources” section and clicking on the “Prospectus and Reports” tab.
Further Information
From time to time, MFS may post
important information about the fund or the MFS Funds on the MFS Web site (mfs.com). This information is available at https://www.mfs.com/announcements or at mfs.com/openendfunds by choosing the fund’s name and then scrolling to the “Resources” section and clicking on the “Announcements” tab, if any.
Information About Fund
Contracts and Legal Claims
The fund has entered into
contractual arrangements with an investment adviser, administrator, distributor, shareholder servicing agent, and custodian who each provide services to the fund. Unless expressly stated otherwise, shareholders are
not parties to, or intended beneficiaries of these contractual arrangements, and these contractual arrangements are not intended to create any shareholder right to enforce them against the service providers or to seek
any remedy under them against the service providers, either directly or on behalf of the fund.
Under the Trust’s By-Laws and
Declaration of Trust, any claims asserted against or on behalf of the MFS Funds, including claims against Trustees and Officers, must be brought in state and federal courts located within the Commonwealth of
Massachusetts.
Provision of Financial
Reports and Summary Prospectuses
The fund produces financial reports
every six months and updates its summary prospectus and prospectus annually. To avoid sending duplicate copies of materials to households, only one copy of the fund’s annual and semiannual report and summary
prospectus may be mailed to shareholders having the same last name and residential address on the fund’s records. However, any shareholder may contact MFSC (please see back cover for address and telephone
number) to request that copies of these reports and summary prospectuses be sent personally to that shareholder.
52

