WEXPRO II AGREEMENT
This Wexpro II Agreement (Wexpro II Agreement or Agreement) is entered into on September 12, 2012, between Wexpro Company (Wexpro), Questar Gas Company (Questar Gas or the Company), the Utah Division of Public Utilities (Division), and the Wyoming Office of Consumer Advocate (OCA) (singly a Party and collectively the Parties). This Wexpro II Agreement shall be effective upon the entry of a final order of approval by the Utah Public Service Commission (Utah Commission) and the Wyoming Public Service Commission (Wyoming Commission) (together Commissions) as set forth below.
RECITALS
A. This Wexpro II Agreement derives from the Wexpro Stipulation and Agreement executed October 14, 1981 and approved October 28, 1981 by the Wyoming Public Service Commission and December 31, 1981 by the Utah Public Service Commission (hereinafter Wexpro I or Wexpro I Agreement). The Wexpro I Agreement and accompanying guideline letters provide, among other things, the establishment of terms and conditions for a “self-governing means of encouraging the development of natural gas to be made available to Questar Gas’ retail distribution customers” at established contractual prices, subject to the ratemaking and other authority of utility regulatory agencies. Over the past thirty years, Wexpro has drilled, developed and operated properties under the Wexpro I Agreement for the benefit of both Questar Gas’ customers and Wexpro.
B. Wexpro I and the accompanying guideline letters govern the rights and obligations of the parties to the Wexpro I Agreement in and with respect to expressly defined and identified oil and gas properties.
C. As the Wexpro I Agreement properties mature and continue to be depleted, the Parties desire to supplement the Wexpro I Agreement properties with new properties that would be developed and operated by Wexpro under terms similar to the Wexpro I Agreement, all as set forth herein.
D. Oil and gas property acquisitions, which if approved by the Utah and Wyoming Commissions, will be identified as Wexpro II Properties subject to this Wexpro II Agreement and are believed to have significant potential value for Questar Gas’ retail distribution customers.
E. The intent of this Wexpro II Agreement is to produce additional natural gas for the benefit of both Questar Gas’ customers and Wexpro.
Therefore, in order to establish a process by which Wexpro II Properties may be identified, evaluated and submitted for approved development and management, the undersigned Parties agree as follows.
1
I. DEFINITIONS
For purposes of this Agreement, the following definitions will apply to the indicated terms wherever they appear.
Products
I-1. Natural Gas. A gaseous substance whose major constituent is methane.
I-2. Natural Gas Liquids. All liquids extracted from a natural gas stream except liquids (including condensate) recovered by surface separators.
I-3. Oil. The generic term used to describe all products including minerals and hydrocarbons other than natural gas or natural gas liquids.
I-4. Hydrocarbons. A generic term used to refer to natural gas, natural gas liquids and oil collectively.
Hydrocarbon-Producing Properties and Related Terms
I-5. Well. The well bore and all underground and surface materials and facilities installed in connection with drilling into the earth’s surface for the production or injection of hydrocarbons and other substances. The term “well” includes all appurtenant facilities.
I-6. Appurtenant Facilities. Those facilities, downstream from the wellhead, to and including the delivery point, that are necessary to make the products acceptable for delivery including, but not limited to, compression, transportation, gathering, separation, treating and certain processing facilities.
I-7. Delivery Point. That point, under standard industry practice, at which a purchaser of oil or natural gas liquids or natural gas takes delivery from the producer.
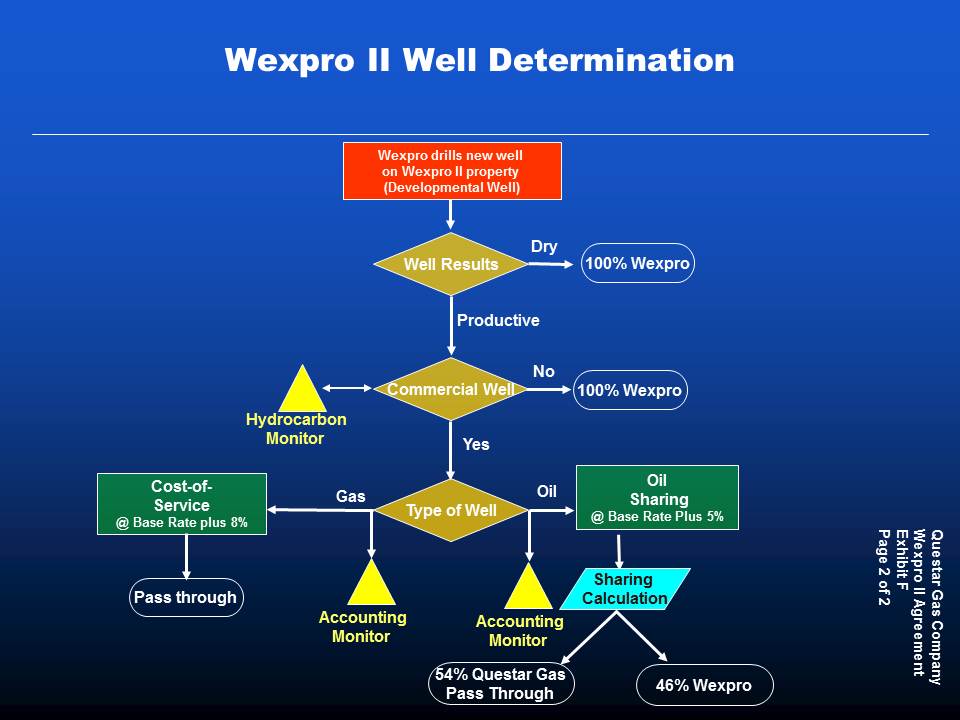
I-8. Completed Well. (a) A well ready for and capable of producing hydrocarbons in commercial quantities regardless of whether the necessary equipment and machinery is installed to permit continuous production and marketing of hydrocarbons or (b) a dry hole.
I-9. Development Well. A well drilled under the terms of this Agreement for carrying out development oil or development gas drilling, as those terms are defined in Section I-18 and I-19 .
I-10. Dry Hole. A development well that (i) upon completion is clearly uneconomical to produce and is plugged and abandoned while the drilling rig is in place, or (ii) is otherwise not determined to be a commercial well under the procedures set forth in Section I-11. If a commercial well is completed in a productive reservoir above the total depth drilled, that portion of the well below the lowest productive reservoir to total well depth will be considered a dry hole.
2
I-11. Commercial Well. A development well that, upon completion, (i) clearly produces sufficient quantities to pay, at market prices for the products, all costs of drilling, development and operation of the well, or (ii) requires further determination for classification as a commercial well or dry hole.
A well will be classified as a commercial well in the latter case under the following procedure:
(a) It will be produced for 30 days after stimulation (or such lesser time as state oil and gas regulatory authority requires).
(b) Using the then-available test data for the last 10 days of the test period and economic analysis methods normally used in the industry, Wexpro will make an economic evaluation of the potential value of hydrocarbon production from the well. If the economic evaluation shows that production from the well, when valued at market prices, will pay the expenses of operating the well, including royalties and taxes, plus 50% of the drilling costs to completion to the wellhead, the well will be deemed a commercial well.
(c) If the well does not meet the test set forth in paragraph (b), Wexpro will notify the Parties and the Staff of the Wyoming Commission of its intent to classify the well as a dry hole and will supply to each Party the economic evaluation and the factual basis for the conclusion. Information that is available at such time will be supplied and will include, if available, drilling costs to date, cost for completion, test data, projected life of the well, the decline curve based on field history, and such other data as would be relevant by industry standards.
(d) Disputes concerning the accuracy, completeness and analysis of the data furnished, or the classification made by Wexpro, under paragraphs (b) and (c) may be the subject of the arbitration procedure set forth in Section V-13 of this Agreement. In no event, however, will wells be subject to reclassification as a result of production and other physical and economic data that become known or available after the analysis performed in paragraph (b) of this Section.
I-12. Wexpro II Property. Any Wexpro II Oil Property or Wexpro II Gas Property.
(a) Wexpro II Oil Property. Any Acquired Wexpro II Oil Property and any well classified as a development oil well.
(b) Acquired Wexpro II Oil Property. An oil property acquired by Wexpro and approved for inclusion in this Agreement.
(c) Wexpro II Gas Property. Any Acquired Wexpro II Gas Property and any well classified as a development gas well.
(d) Acquired Wexpro II Gas Property. A gas property acquired by Wexpro and approved for inclusion in this Agreement.
3
I-13. Acquired Wexpro II Dry Hole. A dry hole that is included in a Wexpro II Property, which was drilled prior to the acquisition by Wexpro.
I-14. Pool. An underground accumulation of hydrocarbons in a single, separate natural reservoir characterized by a single pressure system. Each zone of a geologic formation which is completely separated from any other zone in the formation is a separate pool.
I-15. Productive Oil Reservoir. All productive oil reservoirs as identified in the Wexpro I Agreement.
I-16. Productive Gas Reservoir. All productive gas reservoirs as identified in the Wexpro I Agreement.
Hydrocarbon Operations and Transactions
I-17. Wexpro II Development Drilling Area.
(a) Wexpro II Development Drilling Area has the same definition as Development Drilling Area used in the Wexpro I Agreement.
I-18. Development Oil Drilling. Any drilling completed or recompleted on a Wexpro II Property; and:
(a) | targeted and completed in a productive oil reservoir, or |
(b) completed as a commercial well outside a productive oil or gas reservoir that produces primarily oil during the first 30 days of production based on the current product allocation methodology defined in Section I-35.
I-19. Development Gas Drilling. Any drilling completed or recompleted in a Wexpro II Property; and:
(a) Targeted and completed in a productive gas reservoir, or
(b) completed as a commercial well outside a productive oil or gas reservoir that produces primarily gas during the first 30 days of production based on the current product allocation methodology defined in Section I-35.
I-20. Enhanced Oil Recovery Facilities. Such facilities as are necessary in connection with “secondary” and “tertiary” petroleum hydrocarbon recovery techniques. These techniques involve man-induced pressure changes or improved sweep efficiency using injected fluids within a productive oil or gas reservoir, often through injection of foreign materials or injection of natural gas for the purpose of increasing the yield from the reservoir. Such techniques do not refer to stimulation procedures used prior to completion to make a well commercial even if essentially similar procedures used on an already commercial well would be classified as "enhanced recovery procedures."
4
I-21. Farmout. The common petroleum industry transaction by which an oil and gas lease owner contracts to assign a lease or some portion of it to another who undertakes drilling obligations. The assignor usually retains an interest such as an overriding royalty, production payment or working interest.
Accounting and Ratemaking
I-22. Depreciation. A means by which the capital investment in an asset is recovered over the useful life of the asset. Depreciation is generally an expense deduction for federal and state income tax purposes and is also an element of cost-of-service ratemaking for utilities. As used in this Agreement, depreciation will refer to the standard methods being used by Wexpro, and which are recognized and approved by the accounting profession and agencies having jurisdiction over such procedures, except as otherwise provided in this Agreement.
I-23. Amortization. A means by which intangible capital investments or other sums are recovered over the life of a related tangible asset or otherwise eliminated over a period of time. Standard accounting methods will be used to implement amortization as necessary. For purposes of this Agreement, exploration and development costs associated with dry holes will not be amortized.
I-24. Royalty. Generally, a percentage of the gross revenues generated from production from a lease. The royalty owner or recipient remains legally responsible for its pro-rata share of handling and transportation costs (if taken in kind) and production related taxes, including but not limited to severance, ad valorem, and windfall-profits taxes. For those leases from which production is owned only in part by Wexpro, a royalty provided for in this Agreement will apply only to production attributable to Wexpro’s respective net interest, as the case may be.
I-25. Taxes. All exactions resulting from levies by government, including but not limited to taxes on income, property, production, operations, occupation, franchise, license, privilege, excise and payroll.
I-26. AFUDC. Allowance for funds used during construction. AFUDC is an amount equal to the base rate of return (r), as defined in Section I-32, applied to funds used for construction purposes. No AFUDC charges will be included upon expenditures for construction projects that have been abandoned. When only a part of plant or project is placed in operation or is completed and ready for service but the construction work as a whole is incomplete, that part of the cost of the property placed in operation or ready for service will be treated as investment in Wexpro and AFUDC thereon as a charge to construction will cease. AFUDC on that part of the cost of the plant which is incomplete may be continued as a charge to construction until such time as it is placed in operation or is ready for service, except as otherwise limited in this provision.
I-27. Marginal Composite Income Tax Rate. The tax rate
t = tf(1-ts) + ts,
where:
5
(a) tf is the federal income tax rate for U.S. corporations that would apply to Wexpro’s highest level of taxable income if Wexpro were to file a separate tax return, without regard to the actual tax rate (on August 31, 2012, this rate was 35%); and
(b) ts is the weighted state tax rate calculated according to the formula given on Exhibit C. ts will be fixed for each calendar year on the basis of data for the immediately previous calendar year. The rate fixed for the remainder of 2012 is 1.6272%, as shown in the sample calculation on Exhibit C.
I-28. Investment of Wexpro. The investment base, designated portions of which will serve as the base to which various rates of return, as specified in this Agreement, will be applied. All investment in Wexpro II Properties will include acquisition costs and future capital, net of depreciation, invested by Wexpro to produce hydrocarbons from Wexpro II Properties and will be as otherwise provided in this Agreement. This will include all depreciated investment in plant and AFUDC in development well drilling and enhanced recovery facilities. New increments of deferred taxes or other tax “timing” reserves related to investments in Wexpro II Property will be subtracted from those investments prior to inclusion in the investment of Wexpro. New increments of the investment of Wexpro will not include any capitalized dry-hole costs.
I-29. Return. As used in this Agreement, the net from proceeds after they have been reduced by all applicable expenses (but not long-or short-term debt and preferred stock expense), depreciation, amortization and taxes.
I-30. Rate of Return. As a percentage, the return divided by the applicable investment.
I-31. Commission-Allowed Rate of Return. The weighted average of the then current Utah and Wyoming Commission-allowed rates of return will be determined each year as of July 31, using the previous calendar year’s volumetric firm sales. (On August 1, 2012, this rate was 8.428%.)
I-32. Base Rate of Return (r). A percentage to be (i) applied to specified investment bases or (ii) used as a basis for determining other rates of return as required in this Agreement. The base rate of return (r) is determined by the following method:
r will be determined as of July 31 each year according to the following formula:
r = 16.00 + (i - 14.35),
where i is the following index:
The arithmetic average of the rate of return on common equity as authorized by the indicated regulatory agency for the 20 utility and natural gas companies listed on Exhibit E, such rates of return to be those in effect by valid order of the respective agencies on May 31 of the calendar year in which the average is being determined.
6
To the extent that the companies listed in Exhibit E cease to exist under the corporate names indicated, they will be replaced by the successor or assignee company if that successor or assignee continues to provide the same utility service to the majority of customers served by the previous company in the relevant jurisdiction. Successor state regulatory agencies for those state-regulated utilities listed in Exhibit E will not affect the computation under this provision. If, however, any state-regulated utility becomes federally regulated or unregulated, the Parties will choose a replacement state-regulated utility. (On August 1, 2012, the base rate of return was 12.41%.)
I-33. Market Price. The wellhead price per unit for hydrocarbons produced, as determined by the following provisions:
(a) The price upon which third-party royalty payments are to be made for production from the well, as such royalty price is established from time to time.
(b) If a price is not determinable under paragraph (a) at the time of delivery, the average of the three highest prices (if available) paid by a purchaser to a seller (neither of which is an affiliate of the Company) for a product of comparable quality in the same county of delivery or the same producing field, whichever is larger.
(c) If a price is not determinable under paragraphs (a) or (b) at the time of delivery, the highest price paid for the product of comparable quality in the nearest producing area.
I-34. Cost-of-Service. Economic value determined by the aggregation of the actual costs incurred in producing or providing a product. The cost-of-service formulation to be applied under the terms of this Agreement is set forth in Exhibits A and D.
I-35. Product Allocation. The method to be used for purposes of allocating costs, expenses, depreciation and investments, so that products jointly produced from common facilities can be accounted for separately, each carrying an appropriate allocation of the costs associated with that production. Allocations will be made on the following basis:
(a) The equivalent ratio between natural gas and oil will be established on the basis of market price.
I-36. Overriding Royalty. A royalty interest in oil and gas and other minerals at the wellhead in addition to the usual landowners’ royalty reserved to the lessor.
II. WEXPRO II OIL PROPERTIES
II-1. Ownership of Oil, Natural Gas Liquids and Natural Gas. All oil, natural gas liquids and natural gas produced from Wexpro II oil properties will be the property of and be sold or otherwise disposed of by Wexpro.
7
II-2. Oil and Natural Gas Liquids Proceeds. The total proceeds from the sale of oil and natural gas liquids from Wexpro II oil properties, less royalties, will be subject to the following provisions:
(a) Proceeds will first be used to pay the costs and expenses of holding and operating the Wexpro II oil properties. Such costs and expenses will include an allocation to Wexpro of expenses, depreciation, taxes, royalties and other reasonable business expenses of production. The procedures set forth in Exhibit A will serve as guidelines for this determination. In no event will deductible expenses include any exploration and development expenses associated with dry holes.
(b) As an example of the allocation to be performed under paragraph (a), where Wexpro employees are engaged in the operation and maintenance of producing oil wells and productive oil reservoirs and contemporaneously engaged in other activities of Wexpro, Wexpro will maintain accurate and complete time and other records for properly allocating the time and expenses of employees among such operations. Costs that can be directly assigned, such as investments in fractionating towers which benefit only natural gas liquids products, will be directly accounted for as a cost of producing that product.
(c) The investment of Wexpro and Wexpro’s operating expense in Wexpro II oil properties will be allocated to the hydrocarbons produced in accordance with the product allocation method defined in Section I-35.
(d) It is agreed that the investment of Wexpro in Wexpro II oil properties will be depreciated by the unit-of-production method for proven developed reserves only. For purposes of calculating the return provided by paragraph (e) of this Section, this investment will be determined on a monthly basis, after additions and depreciation as provided herein.
(e) From the proceeds of the sale of oil and natural gas liquids (after deduction of expenses and all royalties as provided in this Section), Wexpro will deduct an amount sufficient to provide the applicable return on that portion of the investment of Wexpro allocated to oil and natural gas liquids production. Such returns will be calculated for each monthly income statement and will be the product of one-twelfth of that portion of the investment of Wexpro allocated to oil and natural gas liquids production at the end of that month.
(f) Any remaining Wexpro oil and natural gas liquids net revenues will be allocated as follows:
(i) 54% of such remainder will be allocated to the Company and placed by the Company in an account used solely for the purposes of reducing natural gas rates, or disposed of otherwise by Commission order.
(ii) The remaining 46% will be retained by Wexpro as its separate property and will not be considered utility income or used to reduce natural gas rates.
8
(iii) To account appropriately for the income tax impact on the 54% allocation set forth in subparagraph (i) above, the sum paid to the Company by Wexpro will be the 54% described in subparagraph (i) divided by a tax-adjustment factor: 1.0 minus the marginal composite income tax rate, as defined in Section I-27. (See Exhibit B.)
(iv) Wexpro’s income statement for purposes of this Agreement will not include the resultant tax-adjusted sum paid to the Company as an expense under this paragraph, although it may so appear for income tax purposes or other purposes not covered by this Agreement.
(g) The royalty, expense and return treatment and the 54%-46% allocation described in this Section will be referred to in this Agreement as the “54-46 formula.” The accounting procedure set forth in this Section is illustrated by the sample calculations shown on Exhibit B.
II-3. Pricing of Gas from Oil Wells.
(a) Except for field and repressurization use, any and all natural gas produced by Wexpro from Wexpro II oil properties will be priced at cost-of-service (see Exhibit A) and sold by Wexpro to the Company, subject to such federal law and regulations as may be applicable to such a sale. In the event that the average monthly cost-of-service for all natural gas sold under this paragraph is in excess of average monthly market price for that natural gas, the difference between the average cost of service and the average market price will be treated as an expense of Wexpro for the purposes of the “54-46 formula,” and such difference will not be included in the cost-of-service calculation.
(b) The Company may, at its discretion, enter into suitable transportation arrangements with third parties or any Company affiliate for transporting gas produced under this Section to its system.
II-4. Enhanced Recovery Procedures. It may be necessary or desirable to implement enhanced recovery procedures for Wexpro II oil properties in order to maximize the recovery of oil. The investment in such procedures may be substantial and the results of these operations may not always be successful. If the revenues from the additional oil recovered as a result of such procedures do not cover the expenses, royalties and return as they are related to the enhanced recovery procedures, the initiation of such procedures would result in more of the total Wexpro oil production revenues being allocated to a return on this new capital, with less available for the “54-46 formula.” To assure that investment for enhanced recovery procedures will be prudently made, the following terms will apply:
(a) The capital investment required for enhanced recovery facilities will be made entirely by Wexpro. In lieu of the base rate of return (r), such enhanced recovery investment will be assigned a rate of return as follows:
(i) If, at the time an authority for expenditure (AFE) for an enhanced recovery project is executed, the total of the amounts described in subparagraphs II-2(f)(i) and (ii) for the prior 12 months have been less than 3.00% of the average investment of Wexpro allocated to oil production for such a 12-month period, the rate of return to apply only to that enhanced recovery investment will be the base rate of return plus a 2.00% risk premium (r + 2.00).
9
(ii) In all other cases, the base rate of return (r) will apply.
(b) The aggregate enhanced recovery facilities investment will look to all natural gas liquids and oil production for recovery of investment, expenses and return. Each amount invested will be deemed made on the first day of the month closest to the date when it was made and will be depreciated on the basis of individual enhanced recovery projects.
II-5. Uneconomical Production. When any Wexpro II oil property is depleted to a point where, in the prudent judgment of Wexpro, it is no longer economically feasible to produce such a reservoir, production from that reservoir may be terminated, and the investment of Wexpro will be adjusted by the net difference between salvage value and abandonment or dismantling costs.
II-6. Development Oil Drilling. Any development oil drilling will be subject to the following provisions:
(a) If a development well is required in the judgment of Wexpro to produce hydrocarbons more efficiently, Wexpro will drill such a well and assume the total risk of unsuccessful drilling, including dry-hole costs.
(b) If a commercial well results, the investment in such a development oil well will be included in the investment of Wexpro on the first day of the month nearest the date the well is qualified as a commercial well. The rate of return on commercial development oil wells will be equal to the base rate of return plus a risk premium of 5.00% (r + 5.00).
(c) For each development oil well spudded, Wexpro will keep detailed accounts of the funds used during drilling of such a well in accordance with the treatment of AFUDC set forth in Section I-26. Where a well is deemed to be a commercial well, the accumulated AFUDC for that well will be added to the investment of Wexpro along with the capital invested in the well.
(d) If production from any well drilled under the terms of this Section occurs and the well is determined to be a dry hole (as defined in Section I-10), paragraph (b) of this Section will not apply. Wexpro may, at its discretion, plug and abandon the well, or produce the well, and the well and all production from the well will be the sole property of Wexpro to dispose of at its discretion and to retain any proceeds.
(e) Wexpro will use prudent judgment in determining the desirability and necessity of development drilling under this Section as well as the timing and methods to be used in any such drilling.
II-7. Gas for Repressurization. Gas being produced from a Wexpro II oil property may be used to repressure the pool without compensation or obligation to the Company so long as no natural gas is consumed except for field or lease use. When such repressurization ceases and such natural gas is finally produced, it will be delivered to the Company at cost-of-service.
II-8. Delivery. The delivery of natural gas produced under the provisions of this Article II will be at the delivery point (defined in Section I-7), and all costs of receiving the natural gas and
10
all the necessary investment at and downstream from such a point will be the responsibility of the Company.
III. WEXPRO II GAS PROPERTIES
III-1. Wexpro will fund and drill or cause to be funded and drilled all necessary and appropriate development wells on these properties and provide the necessary facilities which in its opinion will be reasonably and prudently necessary to efficiently produce the hydrocarbons in the Wexpro II gas properties.
III-2. Development Gas Drilling. Any investment made in Wexpro II gas properties, will be capitalized by Wexpro, and Wexpro will be compensated for these investments by the Company as provided in Section III-3. Necessary facilities installed downstream from the delivery point will be capitalized in the Company’s utility accounts.
III-3. Pricing of Gas from Gas Wells. Any and all natural gas produced by Wexpro from Wexpro II gas properties will be priced at cost-of-service and sold by Wexpro to the Company, subject to such federal law and regulations as may be applicable to such a sale.
III-4. Operator Service Fee.
(a) As operator, Wexpro will bill the Company for the services it performs and for the use of the facilities it has installed to produce natural gas, natural gas liquids and oil from the Wexpro II gas properties.
(b) Billing for services will be on a monthly cost-of-service basis and will follow, to the extent applicable and practicable, the methods and practices employed by the Utah and Wyoming Commissions in determining the Company's cost of service prior to the effective date of this Agreement. Exhibit D sets forth the general guidelines for the cost-of-service charges to be made under this Section.
(c) The monthly billing for services will specifically include a return on investment on approved acquisition costs at the current commission-allowed rate of return.
(d) The monthly billing for services will also include a return on investment for costs incurred for new facilities at the current commission-allowed rate of return, except that investment in commercial development wells will be entitled to a base rate of return plus an additional 8.00% (r + 8.00).
III-5. Depreciation. For purposes of this Agreement, Wexpro’s investment in commercial development wells and appurtenant facilities will be depreciated monthly by the unit of production method for proved developed producing reserves only, except as otherwise provided in Section I-22.
11
III-6. Delivery. The delivery of natural gas and natural gas liquids produced under the provisions of Article III will be at the delivery point (defined in Section I-7), and all costs of receiving, processing and gathering the natural gas and natural gas liquids and all the necessary investment at and downstream from such a point will be the responsibility of the Company.
III-7. Development Gas Drilling.
(a) Wexpro will exercise prudent judgment in determining the desirability and necessity of development gas drilling under this Section, as well as the timing and methods to be used in any such drilling as provided in Section V-10.
(b) It is acknowledged that development drilling for natural gas often involves deep, time consuming drilling that may not result in a commercial well. If any development gas well becomes a commercial well, the investment in the well (and in the appurtenant facilities up to the delivery point) will be capitalized in the investment of Wexpro in the same manner and under the same conditions as for a development oil well.
(c) If production from any well drilled under the terms of this Section occurs and the well is determined to be a dry hole (as defined in Section I-10), Wexpro may, at its discretion, plug and abandon the well or produce the well, and the well and all production from the well will be the sole property of Wexpro to dispose of at its discretion and to retain the proceeds.
III-8. “New Oil” from Development Gas Drilling.
(a) Oil from commercial wells completed on a Wexpro II gas property will be sold by Wexpro, and the resulting revenues will be apportioned between the Company and Wexpro as provided by the “54-46 formula.”
(b) Oil produced under this Section will bear a share of the Wexpro II gas properties’ expenses and investment, determined by the product allocation method defined in Section I-35.
(c) Any allocated oil investment related to development gas drilling (under Section III-2) will carry with it the entitlement to apply a 5.00% risk premium in the “54-46 formula” as specified for development oil drilling in Article II.
(d) Any facilities that may be installed to separate or treat oil and natural gas liquids downstream from the delivery point will be installed by the Company and will be included in the Company’s utility accounts.
III-9. Termination of Production. Should any production from Wexpro II gas properties that is achieved by use of facilities installed by Wexpro be terminated, such investment of Wexpro in Wexpro II gas properties will be adjusted by the net difference between salvage value and abandonment or dismantling costs related to such facilities.
12
III-10. Off-System Natural Gas Production. If natural gas is developed from Wexpro II gas properties at any time that cannot be economically delivered into the Company's distribution system, or which is being sold to third parties, such natural gas will be sold by Wexpro, and the revenues less expenses will be used solely to reduce natural gas rates or as otherwise directed by Commission order.
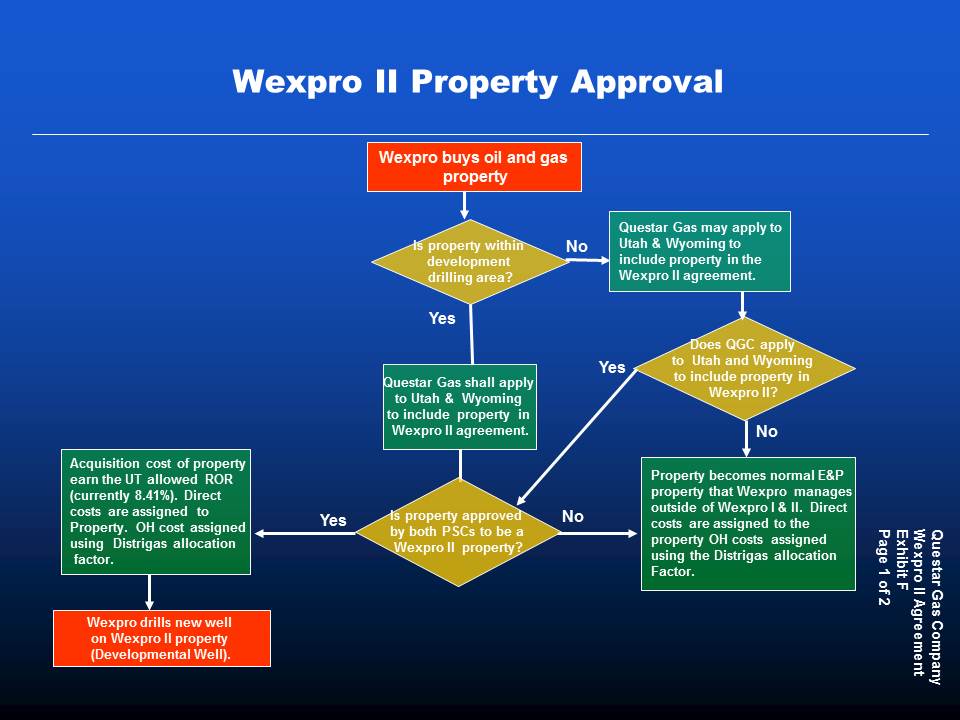
IV. WEXPRO II PROPERTY ACQUISITION
IV-1. Property Acquisition. Wexpro will acquire oil and gas properties or undeveloped leases at its own risk.
(a) | Questar Gas shall apply to the Utah and Wyoming Commissions for approval to include under this Agreement any oil and gas property that Wexpro acquires within the Wexpro I development drilling areas. |
(b) Wexpro may also acquire additional oil and gas properties or undeveloped leases outside the Wexpro I development drilling areas. Questar Gas may apply for Commission approval to include these properties under this Agreement.
IV-2. Application. Questar Gas will file an application with the Utah and Wyoming Commissions requesting approval to include proposed properties under this Agreement. The application shall include the following:
(a) | Purchase price and gas pricing assumption; |
(b) | Locations of current and future wells; |
(c) | Historical production and remaining reserves of current wells; |
(d) | Forecasted production/reserves for future wells; |
(e) | Forecasted decline curves for current and future wells; |
(f) | Estimated drilling (capital) costs per well; |
(g) | Estimated operating expenses for current and future wells; |
(h) | Gross working interest and net revenue interest for current and future wells; |
(i) | Estimated production tax per Dth for current and future wells; |
(j) | Estimated gathering/processing cost per Dth for current and future wells; |
(k) | Description of any land lease, title, and legal issues related to real property, including but not limited to a description of the terms under which the property is acquired by Wexpro and whether there are any time limits, such as option expirations, effecting the availability of the properties for inclusion as a Wexpro II property; |
(l) | Forecasted long-term cost-of-service analysis; |
(m) | Impact on Questar Gas’ gas supply; |
(n) | Geologic data; |
(o) | Future development plan for the proposed properties; and |
(p) | Other data as requested or as may be appropriate to an evaluation of the property. |
13
The application and supporting information shall be filed by the Company. The Company will seek any confidential protections as may be necessary pursuant to applicable Utah and Wyoming statutes and administrative rules.
IV-3. Application Procedure. The following procedures will govern the procedure for filing and responding to the application.
(a) The application shall be filed as a formal proceeding and may include a request for an initial prehearing and scheduling conference, including a request that the proceeding be expedited. Parties agree that formal or informal discovery may begin immediately upon the filing and service of the application.
(b) At the time the application is filed with the Commissions, a confidential copy shall be served upon the Division and the OCA. A confidential copy shall also be provided to the hydrocarbon monitor/evaluator designated by the Parties under Section V-12.
(c) Within seven business days following receipt of the application, the hydrocarbon monitor/evaluator shall provide Questar Gas, the Division, and the OCA with an evaluation of the application and the properties proposed for treatment as Wexpro II properties.
(d) The Division and the OCA shall respond to the application in the manner consistent with their statutory authority and responsibility by recommending its approval or its rejection, in whole or in part, or by requesting additional evaluation.
(e) In any proceeding upon an application filed pursuant to this Wexpro II Agreement, Wexpro shall not be a named applicant nor may Wexpro intervene as a party. However, Wexpro shall make itself available to any Party for the purpose of evaluating the application.
IV-4. Hydrocarbon Monitor/Evaluator. The independent hydrocarbon monitor will evaluate new properties and within seven business days following the filing of Questar Gas’ application, will file an independent review of the assumptions, data, and analysis identified in Section IV-2 above for the proposed properties, but will not provide a recommendation.
IV-5. Withdrawal of Properties. If the proposed properties are not approved by both Commissions within 60 days of the filing of the application, Questar Gas may, in its sole discretion, withdraw the proposed properties from consideration for Wexpro II Agreement inclusion.
IV-6. Acquisition Costs. The acquisition costs for Wexpro II properties will earn the current commission-allowed rate of return approved for Questar Gas in its most recent general rate case. Acquisition costs include the costs of acquiring leasehold interests, mineral rights, and currently producing properties. The acquisition costs will be depreciated on a unit of production method using only the reserves from proved developed producing wells at the time of acquisition.
IV-7. Title. Wexpro will retain title to and associated operating rights of the Wexpro II properties. Wexpro will maintain and update a schedule of Wexpro II properties.
14
IV-8. Management of Gas Volumes. Wexpro II gas volumes will be managed under the direction of Questar Gas.
IV-9. Accounting and Regulatory Treatment.
(a) The investment base of Wexpro II properties will be recorded separately from Wexpro I Agreement properties and will include capital, net of depreciation, invested by Wexpro to acquire, produce, and deliver hydrocarbons from commercial wells.
(b) All royalties or income received from Wexpro under the Wexpro II Agreement, as well as costs associated with natural gas delivered to the Company by Wexpro, will be accounted for under the Account 191 balancing account adjustment provisions of the Company's tariffs on file with and approved by the Commissions in the same manner as natural gas costs incurred by the Company in the purchase of natural gas from third parties.
(c) If a proposed property is not approved for inclusion in this Wexpro II Agreement by both the Utah and Wyoming Commissions then all direct costs associated with that property will be assigned to that property, and common and/or general and administrative costs will be allocated to the property using the Utah Commission-approved Distrigas formula.
IV-10. Wexpro II Property Approval and Well Determination Process. The Wexpro II property approval process as described above and the Wexpro II well-determination process as described in Articles II and III are illustrated on Exhibit F.
V. MISCELLANEOUS PROVISIONS
V-1. Successor and Assigns. This Agreement will be binding upon the Parties and their successors and assigns. No assignment of any right or obligation under this Agreement will be valid if it operates to relieve the assignee of the obligations so assigned.
V-2. Integrated Provisions. The terms and conditions of this Agreement are to be treated as an integrated whole. To the extent that any singular provision is found to be unenforceable or voidable by a court or agency with proper jurisdiction, it is the intent of the Parties that the remaining terms of this Agreement will remain in force and be enforceable by the Parties. Failure of any part of this Agreement will not cause failure of the entire Agreement unless otherwise agreed to by the Parties.
V-3. Filing Reports. Wexpro and the Company will cooperate in providing, in a timely manner when requested, information necessary for the preparation and filing of reports required by appropriate governmental bodies.
V-4. Remedies. The Parties may seek appropriate remedies at law and equity for breaches of the terms of this Agreement in accordance with Section V-13; except that, rescission will not be sought under any condition (except mutual assent), and no transfer, conveyance, grant or reservation executed under this Agreement may be rescinded.
15
V-5. Field and Lease Use. Wexpro may consume for field or lease use, without compensation or other obligation to the Company, reasonable quantities of any natural gas produced in connection with the production of hydrocarbons from Wexpro II properties.
V-6. Force Majeure. If Wexpro is rendered unable, wholly or in part, by force majeure to carry out its obligations under this Agreement, other than the obligation to make money payments, then Wexpro will give to the other Parties prompt written notice of the force majeure with reasonably full particulars concerning it. Thereupon, the obligations of Wexpro, so far as it is affected by the force majeure, will be suspended during, but no longer than, the continuance of the force majeure. Wexpro will use all possible diligence to remove the force majeure as quickly as possible.
The requirement that any force majeure will be remedied with all reasonable dispatch will not require the settlement of strikes, lockouts, or other labor difficulty by Wexpro contrary to its wishes. Such difficulties will be handled entirely within prudent and reasonable judgment of Wexpro.
The term “force majeure” means an act of God, strike, lockout, or other industrial disturbance, act of public enemy, war, blockade, public riot, lightning, fire, storm, flood, mechanical breakdown, explosion, governmental restraint, or any other cause, whether of the kind specifically enumerated above or otherwise, which is not reasonably within the control of Wexpro.
V-7. Auditing Costs. Any billing to the Company by Wexpro for services under this Agreement or other determination of expenses may include, as a business expense, the allocated costs of auditing of only the properties and transactions covered by this Agreement by independent certified public accountants and other auditors as such audits may be required under the terms of this Agreement.
V-8. Farmouts. Nothing in this Agreement will be construed to preclude Wexpro from entering into farmout agreements with third parties to explore and develop undrilled properties for the benefit of customers.
V-9. Wexpro II Properties. Unless otherwise herein provided to the contrary, Wexpro agrees at its sole cost, risk, and expense, to perform and comply with any and all legally binding lease or other contractual obligations pertaining to the Wexpro II properties and will comply with all laws, rules, and regulations relating to the production of oil and natural gas from such properties and facilities. However, Wexpro will be at liberty to determine for itself the nature, extent, and applicability of such obligations, whether contractual or otherwise.
V-10. Standard of Operation. Wexpro will drill and operate in accordance with prudent, standard and accepted field and reservoir management and engineering practices, and with due regard for the benefits provided the Company’s utility operations in consultation with the Company.
V-11. Functional Accounting. For purposes of carrying out the terms and conditions of this Agreement, Wexpro will maintain appropriate separate functional accounting of the transactions required under this Agreement.
16
V-12. Monitoring Of Performance Under Agreement.
(a) The OCA and the Division will be entitled to monitor the performance of the Company and Wexpro under the Wexpro II Agreement. To facilitate that monitoring, the books and accounts of Wexpro pertaining to the Wexpro II properties will be made available for examination by the OCA and the Division when requested at reasonable times and places designated by Wexpro. In addition, Wexpro and the Company will provide the OCA and the Division with a report within 60 days of the end of every calendar quarter setting out production of the Wexpro II properties, the financial benefits from the Wexpro II properties, and reporting on the operation of each element of the Agreement. Wexpro will have its accounts with respect to all matters under the Agreement audited annually by a firm of independent certified public accountants. The Division and OCA will receive copies of the audit report when completed. All costs of the audit will be borne by Wexpro and will be considered to be normal business expenses of Wexpro for purposes of the Agreement's formulae. This expense item will be strictly restricted, however, to reflect solely the costs of auditing compliance with the Agreement.
(b) If the OCA or the Division desire further monitoring, they will select two monitors, an independent certified public accountant and an independent hydrocarbon industry consulting firm, to review the performance of the Agreement and to advise all Parties with respect thereto. Any monitor selected will be professionally trained and qualified, and will be nationally recognized as a reputable and independent expert in the subject matter of the function monitored. The two monitors will be paid actual and reasonable fees and expenses incurred in evaluating the proposed properties under Article IV of this Wexpro II Agreement, and monitoring the performance of this Agreement and the Wexpro I Agreement by Wexpro which will be considered to be normal business expenses of Wexpro in determining the cost-of-service of natural gas to be delivered or sold to the Company under the Agreement.
(c) Wexpro will cooperate with the monitors in providing reasonable access to its books, accounts, and records with respect to the Wexpro II Properties and in attempting to obtain other relevant information reasonably requested by the monitors. The monitors will be obligated under their retainer agreements to keep information disclosed to them confidential except in connection with necessary reports made to the Division, the OCA, the Company or Wexpro in performing their duties as monitors or with Wexpro’s prior approval.
(d) Monitors may be removed with or without cause by the Division and the OCA acting jointly, and with cause by the Company and Wexpro. For purposes of this paragraph, cause will include, but not be limited to, lack of professional qualification, lack of competence, unauthorized disclosure or use of confidential information, and a pattern of unreasonable, harassing or oppressive conduct by the monitor in performing its responsibilities. If a monitor is removed or is unable to continue to act, the Division and the OCA, may select a successor upon the same terms and conditions as an original monitor could be selected.
17
V-13. Dispute Resolution.
Parties acknowledge that from time to time disputes may arise regarding the performance of this Agreement. In the event that any Party claims that there is a default by Questar Gas of any of its contractual obligations under the terms or intent of this Agreement, such dispute will be adjudicated before the Commissions. In the event that any Party claims that there is any default by Wexpro of any of its contractual obligations under the terms or intent of this Agreement, the following procedure will be followed:
(a) The charging Party will give notice of the claimed default, and Wexpro will be allowed 30 days or such longer time as the charging and defaulting Parties may stipulate to correct its default.
(b) If the default is not corrected to the satisfaction of the charging Party, the matter will be submitted to arbitration on the following terms:
(i) The charging Party will select a person professionally trained and qualified in the subject matter of the dispute but who has not been employed or retained by the Parties within the previous 12 months, to act as an arbitrator, such selection to be within 60 days of the date upon which notice of default was given or such longer time as the Parties may specify.
(ii) Wexpro will similarly select a person professionally trained and qualified in the subject matter of the dispute to act as an arbitrator under the same restrictions and within the same time limit.
(iii) The two arbitrators selected will together select a third person professionally trained and qualified in the subject matter of the dispute to act as an arbitrator, such selection to be within 15 days of the date the latter of the two arbitrators was selected by the Parties. In the event no agreement can be reached on the selection of the third arbitrator within the time permitted, such selection will be made by the Chief Judge of the United States District Court for the District of Utah upon the application of any Party.
(iv) The three arbitrators will give the Parties reasonable opportunity to present their positions and will thereafter decide the matters in dispute by a majority vote. The arbitrators will not engage in investigations or audits themselves but will render their decision based upon information presented to them by the Parties. It is understood that the arbitrators may request the Parties to prepare and present additional evidence if needed for their decision and that arbitrators will keep information presented to them confidential.
(v) Each Party will bear the costs of its own attorneys and witnesses in the arbitration proceedings. The salary and expenses of the arbitrator selected by each of the Parties will be paid by the Party or Parties selecting the arbitrator. The salary and expenses of the third arbitrator will be paid by Wexpro and considered a normal business expense of Wexpro for purposes of the Agreement’s “54-46 formula” unless the formula at that time is not returning to Wexpro the full return provided in the Agreement on its investment base, in which event the charging Party will share the expenses of the third arbitrator equally with Wexpro.
18
(c) Except as otherwise specifically provided in this Section V-13, the arbitration procedure contemplated by this Agreement will comply with Chapter 11 of Title 78B of the Utah Code or any successor provision of Utah law governing arbitration.
(d) The decision of the arbitrators may be presented by any Party to the Commission in an application for any action by the Commission with respect to the claimed default by the charging Party of the Agreement or to a court of competent jurisdiction for any action with respect to a claimed default by Wexpro of the Agreement. In proceedings before the Commission or court with respect to the arbitrated matter, the decision of the arbitrators will be binding upon the Parties except with respect to matters covered by Utah Code Ann. §78B-11-124 and §78B-11-125 and any other claim of impropriety, irregularity or arbitrariness and capriciousness in the arbitration proceedings.
(e) Among the remedies available under arbitration there is specifically excluded any form of rescission of the terms of property transfer of the Agreement.
(f) The Parties agree that separate arbitration proceedings in Utah and Wyoming or between different Parties will not be initiated on the same subject. All Parties to this Agreement should receive notice of any arbitration proceeding initiated by any Party in either state. Any Party that chooses not to participate in the arbitration proceeding will be bound by the decision of the arbitrators as if it had participated.
(g) In deciding any controversy brought before them, the arbitrators, Commission or other administrative or judicial body may consider, as appropriate, that one Party or the other to the proceeding may have superior knowledge or access to the properties, assets or information which is the subject of the proceeding. They may also consider that the Parties to this Agreement have a duty to perform their respective responsibilities in good faith.
(h) Dispute resolution subparagraphs (a)-(g) shall be limited to claims of breach of contract asserted against Wexpro under this Agreement.
V-14. Confidential Information. The Company and Wexpro are obligated under this Agreement to provide the other Parties, its monitors and arbitrators; with information, reports, and notices regarding Wexpro’s exploration and development of the properties, and will comply with applicable Utah and Wyoming statutes and administrative rules to protect such information as confidential. It is understood and agreed that the Parties will keep such information, reports, and notices, including information received from monitors and presented in arbitration proceedings, strictly confidential and will use them only in connection with its review of matters under this Agreement. It is understood that the Parties may utilize such information in arbitration proceedings and pursuant to the confidentiality rules of the respective Commissions.
19
V-15. Guideline Letters.
(a) The Parties acknowledge that from time to time issues may arise regarding Wexpro’s interests in Wexpro II properties that may be addressed by guideline letters. All current confidential Wexpro I guideline letters applicable to Wexpro II shall be incorporated herein. A copy of all guideline letters will be maintained by Wexpro, the Division, and the Wyoming Commission Staff.
(b) Future Wexpro II guideline letters will be developed with the Parties, and Wyoming Commission Staff, and in consultation with the independent monitors, as necessary. All Parties must approve a guideline letter before it becomes effective. A copy of the index of current confidential guideline letters is attached as Exhibit G.
V-16. Nothing in this Wexpro II Agreement is intended, nor shall it be construed, interpreted or argued, to subject Wexpro or Wexpro activities to the public utility regulation of any state.
V-17. Nothing in this Wexpro II Agreement is intended, nor shall it be construed, interpreted or argued, to alter, amend or modify Wexpro I.
V-18. Amendment. The Parties agree that this Wexpro II Agreement may by mutual consent and subject to Utah and Wyoming Commissions’ approval, be amended to address, explain, clarify or to accommodate applications, approvals, development or production of and from Wexpro II properties, or to address, explain, clarify or to accommodate appropriate regulation for ratemaking purposes of Questar Gas’ rights with respect to Wexpro II properties or other benefits from such properties. In the event such amendment is necessary or requested, Parties shall meet and confer for the purpose of drafting and considering proposed amendments.
V-19. Nothing in this Wexpro II Agreement is intended, nor shall it be construed, interpreted or argued, to restrict the Division and the OCA in the performance of their statutory authorities and responsibilities.
VI. EFFECTIVE DATE
This Agreement will be effective upon the entry of a final order of approval by the Utah Public Service Commission and the Wyoming Public Service Commission.
VII. EXHIBITS
VII-1. Exhibits. Attached to and made a part of this Agreement by reference are the following exhibits:
Exhibit Title
A Cost-of-Service Formulation for Gas from Oil Reservoirs
B Sample Calculation of Productive Oil Reservoir Accounting
20
C Marginal Composite Income Tax Rate Calculation
D Operator Service Fee
E Base Rate of Return Index Companies
F Wexpro II Property Approval and Wexpro II Well Determination
G Index of Wexpro Agreement Guideline Letters
21
This Wexpro II Agreement has been duly executed by the parties this 12th day of September, 2012.
/s/Craig C. Wagstaff | /s/Chris Parker | |
Craig C. Wagstaff Executive Vice President & Chief Operating Officer Questar Gas Company | Chris Parker Division Director Utah Division of Public Utilities | |
/s/James R. Livsey | /s/Bryce Freeman | |
James R. Livsey Executive Vice President & Chief Operating Officer Wexpro Company | Bryce Freeman Administrator Wyoming Office of Consumer Advocate | |
22
Questar Gas Company
Wexpro II Agreement
Exhibit A
Page 1 of 3
EXHIBIT A
COST-OF-SERVICE FORMULATION
FOR GAS FROM OIL RESERVOIRS
The monthly cost-of-service charge directly attributable to the sale to Questar Gas Company of natural gas provided by Wexpro Company from certain properties as set forth in the Agreement will include the following costs. (Section references are to the relevant portions of the Agreement to which this exhibit is attached.)
1. Operating Expenses. Reasonable and necessary operating expenses incurred by Wexpro and allocated to the production, gathering, treatment and disposition of natural gas. Such expenses will include operating and maintenance expenses, administrative and general expenses, royalties (including compensatory royalties) and fees based on the monthly level of production, and other common business expenses.
2. Depreciation. The allocated monthly depreciation expense as computed by the unit-of-production method for proved developed producing reserves only where applicable or one-twelfth of any annual depreciation expense computed using applicable depreciation methods other than the unit-of-production method as allowed by and computed under the terms of the Agreement.
3. Amortization and Depletion. The allocated monthly accrual recorded for the billing month as amortization and depletion of producing lands and land rights, amortization of intangible gas plant and other amortized expenses.
4. Taxes.
(a) Taxes Other than Income Taxes. Accruals recorded for the billing month with respect to taxes other than federal and state income taxes allocated to natural gas operations, adjustments of such accruals for tax expenses previously billed, and such taxes paid but not previously billed, including any state and local income taxes.
(b) Federal and State Income Taxes. Federal and state income taxes for the billing month attributable to the investment of Wexpro allocated to natural gas production facilities, computed by multiplying the return by the marginal composite income tax rate (Section I-27) divided by 1.0 minus the marginal composite income tax rate.
5. Return. Return is computed using the Commission-allowed rate of return (Section I-31) as adjusted from time to time under the procedure specified in the Agreement. For natural gas that is produced from enhanced recovery facilities to which a base rate of return plus 2% adjustment is applicable (Section II-4(a)(i)), the 2% risk premium applies to those facilities only. For natural gas that is produced from development gas wells to which a base rate of return
Questar Gas Company
Wexpro II Agreement
Exhibit A
Page 2 of 3
plus 5% risk adjustment is applicable (Section II-6(b)), the 5% risk premium applies to those facilities only.
The investment used as a base to which a rate of return is applied will be computed in total for each category of investment subject to (i) Commission-allowed rate of return, (ii) the base rate of return plus 2% risk premium, and (iii) the base rate of return plus 5% risk premium, and will be one-twelfth of the sum of:
(a) The allocated, actual original investment including AFUDC in wells, well facilities and plant facilities utilized or held for future use in connection with the production, gathering, treatment and disposition of natural gas and oil, less accumulated reserves for depreciation and amortization of such plant facilities; plus
(b) A general plant allowance calculated by multiplying the amount in paragraph (a) above by 6.3%; plus
(c) A cash working capital allowance for each category of investment, (Commission-allowed rate of return, the base rate of return, the base rate of return plus 2% risk premium, and the base rate of return plus 5% risk premium) equal to 45/365 of the allocated operating expenses, identified in paragraph 1 above, less royalties and annualized by multiplying the monthly amounts by 12; plus
(d) A credit for the balance of accumulated deferred income taxes and other tax-timing reserves, for each category of investment (Commission-allowed rate of return, base rate of return, the base rate of return plus 2% risk premium, and the base rate of return plus 5% risk premium).
6. Cost Allocation. Costs, expenses and investments will be allocated only when direct assignment cannot be made to specific products. When any cost, expense or investment is related to the production of joint products and direct assignment cannot be made, the product allocation procedure (Section I-35) will be used.
7. Page 3 of this exhibit is an example of the calculations to be used for natural gas that is subject to this cost-of-service determination. The individual numbers are illustrative only and do not represent any actual circumstances.
Questar Gas Company
Wexpro II Agreement
Exhibit A
Page 3 of 3


Questar Gas Company
Wexpro II Agreement
Exhibit B
SAMPLE COST - OF- SERVICE CALCULATION
GAS SOLD BY WEXPRO TO THE COMPANY
FROM PRODUCTIVE OIL RESERVOIRS 1/
Questar Gas Company
Wexpro II Agreement
Exhibit C
Page 1 of 2
Exhibit C
Marginal Composite Income Tax Rate Calculation
Rate Calculation
For determining the marginal composite tax rate defined in section I-27, the composite state tax rate t(s) is determined by summing the computed effective corporate income tax rate imposed by each of the states in which Wexpro is doing business.
The following table shows the states in which Wexpro is doing business, the stated statutory tax and the weighted effective rate as of July 31, 2012.
Marginal | |||||||||||
Statutory | Composite | ||||||||||
State | Tax Rate | State Rate | Composite Tax Rate Formula 1 | ||||||||
Utah | 5 | % | 0.832 | % | ri =(Invi +Rcpti + Wi) / 3 | ||||||
Wyoming | — | % | — | % | ri = 0 | ||||||
Colorado | 4.63 | % | 0.795 | % | ri =Rcpti | ||||||
Montana | 6 | % | — | % | ri =(Invi +Rcpti + Wi) / 3 | ||||||
New Mexico | 7.6 | % | 0.0002 | % | ri =(Invi +Rcpti + Wi) / 3 | ||||||
Nevada | — | % | — | % | ri = 0 | ||||||
Effective Tax Rate | 1.6272 | % | |||||||||
1 | Invi | is the percentage of Wexpro's total-company investment in state i | |||||||||
Rcpti | is the percentage of Wexpro's total-company gross receipts in state i | ||||||||||
Wi | is the percentage of Wexpro's total-company wages in state i | ||||||||||
ri | is the marginal effective state tax rate applicable to state i | ||||||||||
Note: The marginal composite state income tax rate for each state is based on that state’s currently applicable statutes and regulations. See Composite Tax Rate Calculation on page 2 of Exhibit C. | |||||||||||
Questar Gas Company
Wexpro II Agreement
Exhibit C
Page 2 of 2


Questar Gas Company
Wexpro II Agreement
Exhibit D
Page 1 of 2
EXHBIT D
OPERATOR SERVICE FEE
The monthly operator service fee to be charged to Questar Gas Company by Wexpro for the production of hydrocarbons from certain properties as set forth in Section III of the Agreement will include the costs detailed below. Any reference to investment and facilities in this determination will be only to Wexpro II Gas Properties. No leasehold carrying costs or exploration and development expenses related to dry holes will be included as costs or expenses in this determination.
1. Operating Expenses. Reasonable and necessary operating expenses incurred by Wexpro and allocated to the production, gathering, treatment and disposition of hydrocarbons. Such expenses will include operating and maintenance expenses, administrative and general expenses, royalties (including compensatory royalties) and fees based on the monthly level of production, and other common business expenses.
2. Depreciation. The allocated monthly depreciation expense as computed by the unit-of-production method for proved developed producing reserves only where applicable or one-twelfth of any annual depreciation expense computed using applicable depreciation methods other than the unit-of-production method as allowed by and computed under the terms of the Agreement.
3. Amortization and Depletion. The allocated monthly accrual recorded for the billing month as amortization and depletion of producing lands and land rights, amortization of intangible gas plant and other amortized expenses.
4. Taxes.
(a) Taxes Other than Income Taxes. Accruals recorded for the billing month with respect to taxes other than federal and state income taxes allocated to natural gas operations, adjustments of such accruals for tax expenses previously billed, and such taxes paid but not previously billed, including any state and local income taxes.
(b) Federal and State Income Taxes. Federal and state income taxes for the billing month attributable to applicable investment in hydrocarbon production facilities, computed by multiplying the return by the marginal composite income tax rate (Section I-27) divided by 1.0 minus the marginal composite income tax rate.
Questar Gas Company
Wexpro II Agreement
Exhibit D
Page 2 of 2
5. Return. Wexpro’s investment in Acquired Wexpro II Gas Properties is computed using the Commission-allowed rate of return (Section I-31). For investment in commercial development gas wells, the return is computed on the basis of the base rate of return plus a risk premium of 8.00% (r + 8.00).
The investment used as a base to which a rate of return is applied will be computed in total for each category of investment subject to (i) Commission-allowed rate of return, and (ii) the base rate of return plus a 8% risk premium, and will be one-twelfth of the sum of:
(a) The actual original investment including AFUDC in wells, well facilities and plant facilities utilized or held for future use in connection with the production, gathering, treatment and disposition of natural gas, natural gas liquids and oil, less accumulated reserves for depreciation and amortization of such plant facilities; plus
(b) A general plant allowance of 6.3% times the sum of the amount in paragraph (a);
(d) A cash working capital allowance for each category of investment (no risk premium, and 8% risk premium) equal to 45/365 of the allocated operating expenses, identified in paragraph 1 above, less royalties and annualized by multiplying the monthly amounts by 12; plus
(c) A credit for the balance of accumulated deferred income taxes and other tax-timing reserves, for each category of investment (Commission-allowed rate of return, the base rate of return plus 8% risk premium).
6. Costs, expenses and investments will be allocated where appropriate, but only when direct assignment cannot be made.
EXHIBIT E
Base Rate of Return Index Companies
Company Name | Activity | Regulatory Agency | Authorized BRR on Common Equity on May 31, 1981 | Authorized BRR on Common Equity on May 31, 2011 | Notes | |
1. | Idaho Power Company | Electric Services | Idaho PSC | 14.5% | 10.5% | |
2. | Intermountain Gas Co. | Gas Distribution | Idaho PSC | 14.5% | 14.85% | |
3. | Montana Power Company | Electric Services | Montana PSC | 13.45% | 10.25% | Renamed Northwestern Energy Corp. |
4. | Montana-Dakota Utilities Co. | Gas Distribution | Montana PSC | 13.5% | 12% | Renamed MDU Resources |
5. | Pacific Power & Light | Electric Services | Wyoming PSC | 14.2% | 10.6% | Using Replacement Index1 |
6. | Northern Utilities, Inc. | Gas Distribution | Wyoming PSC | 13.5% | 9.92% | Renamed SourceGas Distribution, LLC |
7. | Nevada Power Company | Electric Services | Nevada PSC | 15% | 10.8% | |
8. | Southwest Gas Corp. | Gas Distribution | Nevada PSC | 15.2% | 10.15% | |
9. | Utah Power & Light Co. | Electric Services | Utah PSC | 16.8% | 10.6% | Renamed Pacificorp-Utah |
10. | Mountain States Tel. & Tel. Co. | Tele- communications | Utah PSC | 13.47% | 10.67% | Using Replacement Index1 |
11. | Public Service Co. of Colorado | Gas Distribution | Colorado PSC | 15.45% | 10.25% | |
12. | Mountain States Tel & Tel. | Tele-communications | Colorado PSC | 11.9% | 11.25% | Renamed CenturyLink |
13. | Arizona Public Service Co. | Electric Services | Arizona PSC | 15% | 11% | |
14. | Southwest Gas Corp. | Gas Distribution | Arizona PSC | 16% | 10% | |
15. | Public Service Co. of New Mexico | Electric Services | New Mexico PSC | 15.5% | 10.5% | |
16. | Southern Union Gas Co. | Gas Distribution | New Mexico PSC | 15.5% | 9.53% | Renamed Public Service of New Mexico |
17. | Colorado Interstate Corp. | Gas Transmission | FERC | 13.47% | 10.67% | Using Replacement Index1 |
18. | Northwest Pipeline Corp. | Gas Transmission | FERC | 13.47% | 10.67% | Using Replacement Index1 |
19. | Kansas-Nebraska Natural Gas Co. | Gas Transmission | FERC | 13.47% | 10.67% | Using Replacement Index1 |
20. | Transwestern Pipeline Co. | Gas Transmission | FERC | 13.47% | 10.67% | Using Replacement Index1 |
1 Replacement index per 5/29/92 Wexpro I Guideline Letter
Questar Gas Company
Wexpro II Agreement
Exhibit E
149862
Questar Gas Company
Wexpro II Agreement
Exhibit G
Revised April 2, 2012
Index of Wexpro Agreement
Guideline Letters
Guideline Letters
Date | Title |
06/14/11 | QEP Assignment of F. Wilson #37 Marginal Well Interest to Wexpro |
10/24/11 | QEP Assignment of the Lance Formation to Wexpro (Jacks Draw #18) |
03/15/11 | QEP Assignment of the Lance Formation to Wexpro (Government #17) |
03/15/11 | QEP Assignment of the Lance Formation to Wexpro (Musser #73) |
03/15/11 | QEP Assignment of the Lance Formation to Wexpro (Musser #72) |
03/15/11 | QEP Assignment of the Lance Formation to Wexpro (Musser #42) |
03/15/11 | QEP Assignment of the Lance Formation to Wexpro (Musser #35) |
03/15/11 | QEP Assignment of the Lance Formation to Wexpro (Musser #34) |
03/15/11 | QEP Assignment of the Lance Formation to Wexpro (Government #15) |
10/07/10 | QEP Assignment of Sugarloaf Government #18 Marginal Well Interest toWexpro |
10/07/10 | QEP Assignment of Sugarloaf Government #17 Marginal Well Interest toWexpro |
08/31/10 | Wexpro Acquisition of Non-Consent Interest in Kinney #4 Recompletion |
07/27/10 | QEP Assignment of Bruff Unit 50 Marginal Well Interest to Wexpro |
07/10/10 | QEP Assignment of Bruff Unit 48 Marginal Well Interest to Wexpro |
07/01/10 | Wexpro Acquisition of Non-Consent Interest in Clifton Federal 34-6 Well |
06/22/10 | QEP Assignment of Bruff Unit 63 Marginal Well Interest to Wexpro |
06/14/10 | QEP Assignment of F. Wilson #37 Marginal Well Interest to Wexpro |
04/09/10 | Wexpro Acquisition of Non-Consent Interest in Church Buttes 184 Well |
1
Questar Gas Company
Wexpro II Agreement
Exhibit G
03/04/10 | QEP Assignment of Bruff Unit 55 Marginal Well Interest to Wexpro |
02/16/10 | Wexpro Acquisition of Non-Consent Interest in Bruff Unit 53 Well |
10/09/09 | Wexpro Acquisition of Non-Consent Interest in Lansdale 4-7 Well |
07/30/09 | Wexpro Acquisition of Non-Consent Interest in Lansdale 4-5 Well |
07/30/09 | Wexpro Acquisition of Non-Consent Interest in Lansdale 4-8 Well |
07/09/09 | Wexpro Acquisition of Non-Consent Interest in Bruff Unit 54 Well |
06/08/09 | Wexpro Acquisition of Non-Consent Interest in Church Buttes 166 Well |
05/27/09 | Wexpro Acquisition of Non-Consent Interest in Bruff Unit 56 Well |
05/25/09 | Wexpro Acquisition of Non-Consent Interest in Bruff Unit 71 Well |
05/20/09 | Wexpro Acquisition of Non-Consent Interest in MFS 10-5 Well |
04/30/09 | Wexpro Acquisition of Non-Consent Interest in Bruff Unit 51 Well |
04/14/09 | Wexpro Acquisition of Non-Consent Interest in Trail 04D-16W Well |
04/08/09 | QEP Assignment of Bruff Unit 51 Marginal Well Interest to Wexpro |
03/26/09 | Wexpro Acquisition of Non-Consent Interest in Church Buttes 183 Well |
03/26/09 | Wexpro Acquisition of Non-Consent Interest in Church Buttes 179 Well |
01/15/09 | Wexpro Acquisition of Non-Consent in Pando 32-8 Well |
12/08/08 | Wexpro Acquisition of Non-Consent Interest in Clifton Federal 34-7 Well |
12/08/08 | Wexpro Acquisition of Non-Consent Interest in Clifton Federal 34-5 Well |
12/08/08 | Wexpro Acquisition of Non-Consent Interest in Clifton Federal 28-6 Well |
12/08/08 | Assignment of Clifton Federal 28-8 Marginal QEP Interest to Wexpro |
06/02/08 | 3D Seismic Program, Dry Piney Unit, Sublette County, Wyoming |
03/01/08 | Wexpro Acquisition of Non-Consent Interest in Church Buttes 173 Well |
01/06/08 | Wexpro Acquisition of Non-Consent Interest in Clifton-Federal 34-8 Well |
2
Questar Gas Company
Wexpro II Agreement
Exhibit G
01/03/08 | Wexpro Acquisition of Non-Consent Interest in Church Buttes 149 Well |
10/02/07 | Guideline Letter for Wexpro Monitor Fee Amount |
09/11/07 | Wheeler Farmout Guideline Letter - Assignment of marginal intervals in West Hiawatha to Wexpro to facilitate Development Gas Drilling under the terms of the Wexpro Agreement |
07/05/07 | Wexpro Acquisition of Non-Consent Interest in Church Buttes 148 Well |
04/23/07 | Wexpro Acquisition of Non-Consent Interest in Church Buttes 162 Well |
04/17/07 | Wexpro Acquisition of Non-Consent Interest in Trail Unit 03C-10J Well |
01/12/07 | Assignment of Working Interest to Wexpro to Facilitate Developmentn Gas Drilling (Hydrocarbon Monitor approval of assignment of Anadarko's non-consent interest in Church Buttes 89 Well) |
03/15/06 | Hydrocarbon Monitor approval of assignment of ExxonMobil's non-consent interest in Dry Piney 5 Well |
03/15/06 | Hydrocarbon Monitor approval of assignment of Exxon Mobil's non-consent interest in Dry Piney 27 Well |
03/14/06 | Hydrocarbon Monitor approval of assignment of interest in the Upper Mesaverde Formation in West Hiawatha wells Lasher 11 and 12 |
01/20/06 | Hydrocarbon Monitor approval of assignment of interest in the Upper Mesaverde Formation in Hiawatha State Land 7 Well |
08/24/05 | Hydrocarbon Monitor approval of assignment of interest in the Bear River Formation in Dry Piney #32 & #35 Wells |
08/09/04 | Guideline Letter regarding assignment of marginal intervals to Wexpro to facilitate Development Gas Drilling under the terms of the Wexpro Agreement |
3
Questar Gas Company
Wexpro II Agreement
Exhibit G
07/26/04 | Pre-participation approval by Hydrocarbon Monitor to participate in the 3D Seismic program over Canyon Creek Unit |
02/20/04 | Guideline Letter Governing the Adoption of Financial Accounting Standards Board Statement #143, Accounting for Asset Retirement Obligations Under the Wexpro Agreement |
10/08/02 | Election to designate the Mesaverde Formation as a "Productive Gas Reservoir" in the Participating Area A, Island Unit, Uintah County, Utah |
09/30/02 | The Mesa Unit (Pinedale) Upper Mesaverde Guideline Letter |
06/26/02 | Guideline Letter for Coal Bed Methane Development Under the Wexpro Agreement |
06/26/02 | Guideline Letter relating to ownership in the Mesaverde Formation within Jackknife Springs Unit |
04/04/01 | Guideline Letter Relating to Development and Ownership of the Mesaverde Formation within the Island Unit, Uintah County, Utah |
05/31/00 | Guideline Letter relating to The Mesa Unit (Pinedale) Lance Formation Ownership |
08/18/99 | 3D Seismic program in Pinedale Anticline |
04/27/99 | I-47 Product Allocation Ratio |
11/13/98 | Division Sign Off of Birch Creek #117 as D-24 |
06/25/98 | Guideline Letter Relating to Island Unit — Deepening Wells |
01/22/98 | Acquisition of 3-D Seismic Data, Brady Field, Wyoming |
10/17/94 | Guideline Letter Relating to 3-D Seismic Projects |
05/16/94 | Development Program, Johnson Ridge Field, Wyoming |
4
Questar Gas Company
Wexpro II Agreement
Exhibit G
05/29/92 | Refund of Excess Deferred Taxes – Whole-Well Approach for Determining Commerciality in the Church Buttes Unit – Replacement Index Method for Determining Base Rate of Return |
12/19/89 | 1989-90 Base Rate of Return Under the Wexpro Agreement |
11/21/89 | Joint Account Overhead Fees Guideline Letter |
08/25/89 | Wexpro Agreement Guideline Letters |
07/11/89 | Wexpro Agreement — Federal Royalty Assessment of Brady Liquids — Adjustment to Manufacturing Allowance |
10/27/88 | Wexpro Agreement Guideline for Expanding Participating Areas Inside Federal Units |
10/16/87 | Nonstatus Well Guidance Letter Dated May 7, 1986 |
05/07/86 | Wexpro Agreement – Accounting of Pre-July 31, 1981, Overriding Royalty Interests – and Nonstatus Wells |
03/03/86 | The Wexpro Bug Field, San Juan County, Utah |
02/27/86 | Accounting for Production Taxes |
09/07/84 | Well Completions in the Hiawatha & Powder Wash Oil and Gas Fields |
09/07/84 | Tentative Plan to Fracture Stimulate Mesa Unit Well #2, Sublette County, Wyoming |
07/16/84 | East Hiawatha Enhanced Recovery Project |
12/14/83 | Delivery Point at the Butcher Knife & Church Buttes Fields, Sweetwater County, Wyoming |
5