NEWS RELEASE
For information contact:
Kevin B. Habicht
Chief Financial Officer
(407) 265-7348 FOR IMMEDIATE RELEASE
February 12, 2019
RECORD ANNUAL RESULTS
ANNOUNCED BY NATIONAL RETAIL PROPERTIES, INC.
Orlando, Florida, February 12, 2019 – National Retail Properties, Inc. (NYSE: NNN), a real estate investment trust, today announced operating results for the quarter and year ended December 31, 2018. Highlights include:
Operating Results:
• | Revenues and net earnings, FFO, Core FFO and AFFO available to common stockholders and diluted per share amounts: |
Quarter Ended | Year Ended | ||||||||||||||
December 31, | December 31, | ||||||||||||||
2018 | 2017 | 2018 | 2017 | ||||||||||||
(in thousands, except per share data) | |||||||||||||||
Revenues | $ | 158,976 | $ | 150,247 | $ | 622,661 | $ | 584,933 | |||||||
Net earnings available to common stockholders | $ | 27,980 | $ | 63,586 | $ | 258,120 | $ | 217,193 | |||||||
Net earnings per common share | $ | 0.17 | $ | 0.42 | $ | 1.65 | $ | 1.45 | |||||||
FFO available to common stockholders | $ | 82,491 | $ | 95,267 | $ | 395,337 | $ | 359,179 | |||||||
FFO per common share | $ | 0.52 | $ | 0.63 | $ | 2.53 | $ | 2.40 | |||||||
Core FFO available to common stockholders | $ | 101,001 | $ | 95,459 | $ | 414,590 | $ | 376,991 | |||||||
Core FFO per common share | $ | 0.63 | $ | 0.63 | $ | 2.65 | $ | 2.52 | |||||||
AFFO available to common stockholders | $ | 103,523 | $ | 95,692 | $ | 418,702 | $ | 379,083 | |||||||
AFFO per common share | $ | 0.65 | $ | 0.63 | $ | 2.68 | $ | 2.54 | |||||||
• | Portfolio occupancy was 98.2% at December 31, 2018 as compared to 98.7% at September 30, 2018, and 99.1% at December 31, 2017 |
2018 Highlights:
• | Increased annual net earnings per common share 13.8% |
• | Increased annual FFO per common share 5.4% |
• | Increased annual Core FFO per common share 5.2% |
• | Increased annual AFFO per common share 5.5% |
• | Dividend yield of 4.0% at December 31, 2018 |
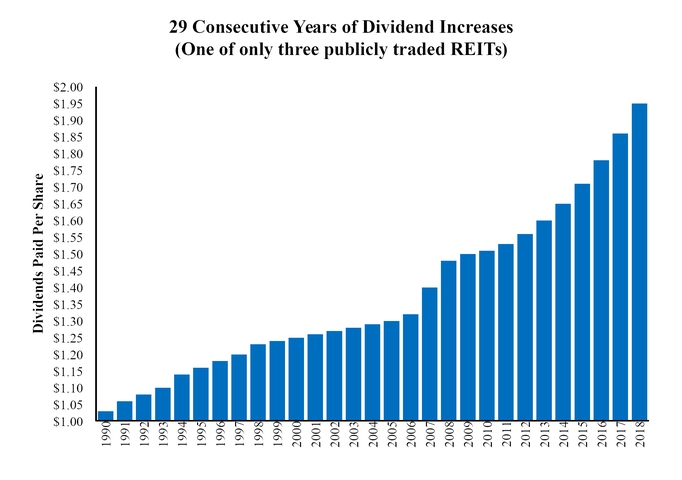
• | Annual dividend per common share increased 4.8% to $1.95 marking the 29th consecutive year of annual dividend increases - making the company one of only three equity REITs and 86 publicly traded companies in America to have increased annual dividends for 29 or more consecutive years |
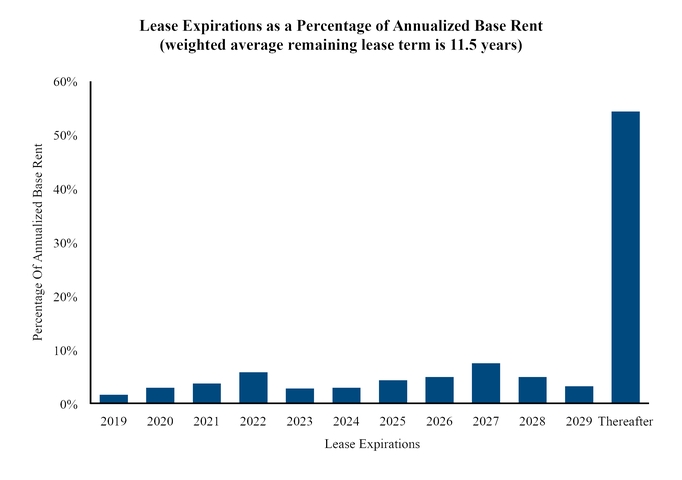
• | Maintained high occupancy levels at 98.2% with a weighted average remaining lease term of 11.5 years |
2018 Highlights (continued):
• | Invested $715.6 million in 265 properties with an aggregate gross leasable area of approximately 2,167,000 square feet at an initial cash yield of 6.8% |
• | Sold 61 properties for $147.6 million, producing $65.1 million of gains on sale, at a cap rate of 5.1% |
• | Raised $1,027.4 million of new long-term capital at attractive pricing |
◦ | Raised $341.5 million in net proceeds from the issuance of 7,689,211 common shares |
◦ | Raised $393.5 million in net proceeds from the issuance of 4.30% senior unsecured notes due 2028 |
◦ | Raised $292.4 million in net proceeds from the issuance of 4.80% senior unsecured notes due 2048 |
• | Paid off $300 million principal amount of 5.500% senior unsecured notes due 2021 |
• | $900 million availability on bank credit facility at December 31, 2018 |
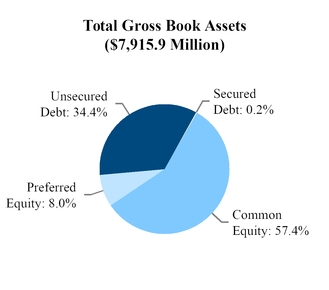
• | 99.7% of properties are unencumbered with secured mortgage debt |
• | Total average annual shareholder return of 12.8% over the past 25 years exceeds industry and general equity averages |
Selected Highlights for the quarter ended December 31, 2018:
• | Investments: |
◦ | $319.5 million in property investments, including the acquisition of 136 properties with an aggregate gross leasable area of approximately 902,000 square feet at an initial cash yield of 6.7% |
• | Dispositions: |
◦ | Sold 15 properties with net proceeds of $26.5 million, producing $8.0 million of gains on sales at a cap rate of 6.2% |
• | Long-term capital: |
◦ | Raised $123.8 million in net proceeds from the issuance of 2,567,167 common shares |
Jay Whitehurst, Chief Executive Officer, commented: "After a busy and productive fourth quarter, National Retail Properties once again delivered above average returns to our investors while taking below average risk. Our commitment to consistent per share growth on a multi-year basis produced an annual dividend increase of 4.8% and annual AFFO per share growth of 5.5% in 2018, all while maintaining our low leverage, conservatively financed balance sheet. Driven by our consistent strategy and focused execution, we are well positioned to continue producing total shareholder returns that we believe will exceed the REIT averages over the long term."
National Retail Properties invests primarily in high-quality retail properties subject generally to long-term, net leases. As of December 31, 2018, the company owned 2,969 properties in 48 states with a gross leasable area of approximately 30.5 million square feet and with a weighted average remaining lease term of 11.5 years. For more information on the company, visit www.nnnreit.com.
Management will hold a conference call on February 12, 2019, at 10:30 a.m. ET to review these results. The call can be accessed on the National Retail Properties web site live at http://www.nnnreit.com. For those unable to listen to the live broadcast, a replay will be available on the company’s web site. In addition, a summary of any earnings guidance given on the call will be posted to the company’s web site.
Statements in this press release that are not strictly historical are “forward-looking” statements. These statements generally are
characterized by the use of terms such as "believe," "expect," "intend," "may," "estimated," or other similar words or expressions. Forward-looking statements involve known and unknown risks, which may cause the company’s actual future results to differ materially from expected results. These risks include, among others, general economic conditions, local real estate conditions, changes in interest rates, increases in operating costs, the preferences and financial condition of the company's tenants, the availability of capital and risks related to the company's status as a REIT. Additional information concerning these and other factors that could cause actual results to differ materially from these forward-looking statements is contained from time to time in the company’s Securities and Exchange Commission (the “Commission”) filings, including, but not limited to, the company’s Annual Report on Form 10-K. Copies of each filing may be obtained from the company or the Commission. Such forward-looking statements should be regarded solely as reflections of the company’s current operating plans and estimates. Actual operating results may differ materially from what is expressed or forecast in this press release. National Retail Properties, Inc. undertakes no obligation to publicly release the results of any revisions to these forward-looking statements that may be made to reflect events or circumstances after the date these statements were made.
The reported results are preliminary and not final and there can be no assurance that the results will not vary from the final information filed on Form 10-K with the Commission for the quarter and year ended December 31, 2018. In the opinion of management, all adjustments considered necessary for a fair presentation of these reported results have been made.
Funds From Operations, commonly referred to as FFO, is a relative non-GAAP financial measure of operating performance of an equity REIT in order to recognize that income-producing real estate historically has not depreciated on the basis determined under GAAP. FFO is defined by the National Association of Real Estate Investment Trusts (“NAREIT”) and is used by the company as follows: net earnings (computed in accordance with GAAP) plus depreciation and amortization of assets unique to the real estate industry, excluding gains (or
2
including losses), any applicable taxes and noncontrolling interests on the disposition of certain assets, the company’s share of these items from the company’s unconsolidated partnerships and any impairment charges on a depreciable real estate asset.
FFO is generally considered by industry analysts to be the most appropriate measure of performance of real estate companies. FFO does not necessarily represent cash provided by operating activities in accordance with GAAP and should not be considered an alternative to net earnings as an indication of the company’s performance or to cash flow as a measure of liquidity or ability to make distributions. Management considers FFO an appropriate measure of performance of an equity REIT because it primarily excludes the assumption that the value of the real estate assets diminishes predictably over time, and because industry analysts have accepted it as a performance measure. The company’s computation of FFO may differ from the methodology for calculating FFO used by other equity REITs, and therefore, may not be comparable to such other REITs. A reconciliation of net earnings (computed in accordance with GAAP) to FFO, as defined by NAREIT, is included in the financial information accompanying this release.
Core Funds From Operations (“Core FFO”) is a non-GAAP measure of operating performance that adjusts FFO to eliminate the impact of certain GAAP income and expense amounts that the company believes are infrequent and unusual in nature and/or not related to its core real estate operations. Exclusion of these items from similar FFO-type metrics is common within the REIT industry, and management believes that presentation of Core FFO provides investors with a potential metric to assist in their evaluation of the company’s operating performance across multiple periods and in comparison to the operating performance of its peers because it removes the effect of unusual items that are not expected to impact the company’s operating performance on an ongoing basis. Core FFO is used by management in evaluating the performance of the company’s core business operations and is a factor in determining management compensation. Items included in calculating FFO that may be excluded in calculating Core FFO may include items like transaction related gains, income or expense, impairments on land or commercial mortgage residual interests, preferred stock redemption costs or other non-core amounts as they occur. The company’s computation of Core FFO may differ from the methodology for calculating Core FFO used by other equity REITs, and therefore, may not be comparable to such other REITs. A reconciliation of net earnings (computed in accordance with GAAP) to Core FFO is included in the financial information accompanying this release.
Adjusted Funds From Operations (“AFFO”) is a non-GAAP financial measure of operating performance used by many companies in the REIT industry. AFFO adjusts FFO for certain non-cash items that reduce or increase net income in accordance with GAAP. AFFO should not be considered an alternative to net earnings, as an indication of the company's performance or to cash flow as a measure of liquidity or ability to make distributions. Management considers AFFO a useful supplemental measure of the company’s performance. The company’s computation of AFFO may differ from the methodology for calculating AFFO used by other equity REITs, and therefore, may not be comparable to such other REITs. A reconciliation of net earnings (computed in accordance with GAAP) to AFFO is included in the financial information accompanying this release.
3
National Retail Properties, Inc. (in thousands, except per share data) (unaudited) | ||||||||||||||||
Quarter Ended | Year Ended | |||||||||||||||
December 31, | December 31, | |||||||||||||||
2018 | 2017 | 2018 | 2017 | |||||||||||||
Income Statement Summary | ||||||||||||||||
Revenues: | ||||||||||||||||
Rental and earned income | $ | 153,684 | $ | 145,187 | $ | 604,615 | $ | 568,083 | ||||||||
Real estate expense reimbursement from tenants | 5,143 | 4,338 | 16,784 | 15,512 | ||||||||||||
Interest and other income from real estate transactions | 149 | 722 | 1,262 | 1,338 | ||||||||||||
158,976 | 150,247 | 622,661 | 584,933 | |||||||||||||
Operating expenses: | ||||||||||||||||
General and administrative | 8,267 | 8,712 | 34,248 | 33,805 | ||||||||||||
Real estate | 7,649 | 6,465 | 25,099 | 23,105 | ||||||||||||
Depreciation and amortization | 44,117 | 43,843 | 174,398 | 173,720 | ||||||||||||
Impairment losses – real estate and other charges, net of recoveries | 18,494 | 7,708 | 28,211 | 8,955 | ||||||||||||
Retirement severance costs | 270 | 192 | 1,013 | 7,845 | ||||||||||||
78,797 | 66,920 | 262,969 | 247,430 | |||||||||||||
Gain on disposition of real estate | 8,020 | 15,791 | 65,070 | 36,655 | ||||||||||||
Earnings from operations | 88,199 | 99,118 | 424,762 | 374,158 | ||||||||||||
Other expenses (revenues): | ||||||||||||||||
Interest and other income | (1,553 | ) | (83 | ) | (1,810 | ) | (322 | ) | ||||||||
Interest expense | 34,940 | 27,016 | 115,847 | 109,109 | ||||||||||||
Loss on early extinguishment of debt | 18,240 | — | 18,240 | — | ||||||||||||
51,627 | 26,933 | 132,277 | 108,787 | |||||||||||||
Net earnings | 36,572 | 72,185 | 292,485 | 265,371 | ||||||||||||
Earnings attributable to noncontrolling interests | (10 | ) | (17 | ) | (38 | ) | (398 | ) | ||||||||
Net earnings attributable to NNN | 36,562 | 72,168 | 292,447 | 264,973 | ||||||||||||
Series D preferred stock dividends | — | — | — | (3,598 | ) | |||||||||||
Series E preferred stock dividends | (4,097 | ) | (4,097 | ) | (16,387 | ) | (16,387 | ) | ||||||||
Series F preferred stock dividends | (4,485 | ) | (4,485 | ) | (17,940 | ) | (17,940 | ) | ||||||||
Excess of redemption value over carrying value of Series D preferred shares redeemed | — | — | — | (9,855 | ) | |||||||||||
Net earnings available to common stockholders | $ | 27,980 | $ | 63,586 | $ | 258,120 | $ | 217,193 | ||||||||
Weighted average common shares outstanding: | ||||||||||||||||
Basic | 159,193 | 151,791 | 155,745 | 149,111 | ||||||||||||
Diluted | 159,772 | 152,148 | 156,296 | 149,433 | ||||||||||||
Net earnings per share available to common stockholders: | ||||||||||||||||
Basic | $ | 0.17 | $ | 0.42 | $ | 1.65 | $ | 1.45 | ||||||||
Diluted | $ | 0.17 | $ | 0.42 | $ | 1.65 | $ | 1.45 | ||||||||
4
National Retail Properties, Inc. (in thousands, except per share data) (unaudited) | ||||||||||||||||
Quarter Ended | Year Ended | |||||||||||||||
December 31, | December 31, | |||||||||||||||
2018 | 2017 | 2018 | 2017 | |||||||||||||
Funds From Operations (FFO) Reconciliation: | ||||||||||||||||
Net earnings available to common stockholders | $ | 27,980 | $ | 63,586 | $ | 258,120 | $ | 217,193 | ||||||||
Real estate depreciation and amortization: | 44,037 | 43,764 | 174,076 | 173,404 | ||||||||||||
Gain on disposition of real estate, net of noncontrolling interests | (8,020 | ) | (15,791 | ) | (65,070 | ) | (36,258 | ) | ||||||||
Impairment losses – depreciable real estate, net of recoveries | 18,494 | 3,708 | 28,211 | 4,840 | ||||||||||||
Total FFO adjustments | 54,511 | 31,681 | 137,217 | 141,986 | ||||||||||||
FFO available to common stockholders | $ | 82,491 | $ | 95,267 | $ | 395,337 | $ | 359,179 | ||||||||
FFO per common share: | ||||||||||||||||
Basic | $ | 0.52 | $ | 0.63 | $ | 2.54 | $ | 2.41 | ||||||||
Diluted | $ | 0.52 | $ | 0.63 | $ | 2.53 | $ | 2.40 | ||||||||
Core Funds from Operations Reconciliation: | ||||||||||||||||
Net earnings available to common stockholders | $ | 27,980 | $ | 63,586 | $ | 258,120 | $ | 217,193 | ||||||||
Total FFO adjustments | 54,511 | 31,681 | 137,217 | 141,986 | ||||||||||||
FFO available to common stockholders | 82,491 | 95,267 | 395,337 | 359,179 | ||||||||||||
Excess of redemption value over carrying value of preferred share redemption | — | — | — | 9,855 | ||||||||||||
Impairment losses – non-depreciable real estate | — | — | — | 112 | ||||||||||||
Retirement severance costs | 270 | 192 | 1,013 | 7,845 | ||||||||||||
Loss on early extinguishment of debt | 18,240 | — | 18,240 | — | ||||||||||||
Total Core FFO adjustments | 18,510 | 192 | 19,253 | 17,812 | ||||||||||||
Core FFO available to common stockholders | $ | 101,001 | $ | 95,459 | $ | 414,590 | $ | 376,991 | ||||||||
Core FFO per common share: | ||||||||||||||||
Basic | $ | 0.63 | $ | 0.63 | $ | 2.66 | $ | 2.53 | ||||||||
Diluted | $ | 0.63 | $ | 0.63 | $ | 2.65 | $ | 2.52 | ||||||||
5
National Retail Properties, Inc. (in thousands, except per share data) (unaudited) | ||||||||||||||||
Quarter Ended | Year Ended | |||||||||||||||
December 31, | December 31, | |||||||||||||||
2018 | 2017 | 2018 | 2017 | |||||||||||||
Adjusted Funds From Operations (AFFO) Reconciliation: | ||||||||||||||||
Net earnings available to common stockholders | $ | 27,980 | $ | 63,586 | $ | 258,120 | $ | 217,193 | ||||||||
Total FFO adjustments | 54,511 | 31,681 | 137,217 | 141,986 | ||||||||||||
Total Core FFO adjustments | 18,510 | 192 | 19,253 | 17,812 | ||||||||||||
Core FFO available to common stockholders | 101,001 | 95,459 | 414,590 | 376,991 | ||||||||||||
Straight-line accrued rent | 124 | (552 | ) | (747 | ) | (1,752 | ) | |||||||||
Net capital lease rent adjustment | 220 | 223 | 874 | 884 | ||||||||||||
Below market rent amortization | (288 | ) | (659 | ) | (2,622 | ) | (3,355 | ) | ||||||||
Stock based compensation expense | 2,641 | 1,962 | 9,282 | 8,750 | ||||||||||||
Capitalized interest expense | (175 | ) | (741 | ) | (2,675 | ) | (2,435 | ) | ||||||||
Total AFFO adjustments | 2,522 | 233 | 4,112 | 2,092 | ||||||||||||
AFFO available to common stockholders | $ | 103,523 | $ | 95,692 | $ | 418,702 | $ | 379,083 | ||||||||
AFFO per common share: | ||||||||||||||||
Basic | $ | 0.65 | $ | 0.63 | $ | 2.69 | $ | 2.54 | ||||||||
Diluted | $ | 0.65 | $ | 0.63 | $ | 2.68 | $ | 2.54 | ||||||||
Other Information: | ||||||||||||||||
Percentage rent | $ | 543 | $ | 715 | $ | 1,561 | $ | 1,700 | ||||||||
Amortization of debt costs | $ | 1,917 | $ | 891 | $ | 4,611 | $ | 3,502 | ||||||||
Scheduled debt principal amortization (excluding maturities) | $ | 138 | $ | 130 | $ | 538 | $ | 510 | ||||||||
Non-real estate depreciation expense | $ | 83 | $ | 82 | $ | 332 | $ | 327 | ||||||||
2019 Earnings Guidance (Unchanged from November 2018): | ||||||||||||||||
Guidance is based on current plans and assumptions and subject to risks and uncertainties more fully described in this press release and the company's reports filed with the Securities and Exchange Commission. | ||||||||||||||||
2019 Guidance | ||||||||||||||||
Net earnings per common share excluding any gains on disposition of real estate and impairment charges | $1.60 - $1.65 per share | |||||||||||||||
Real estate depreciation and amortization per share | $1.11 per share | |||||||||||||||
Core FFO per share | $2.71 - $2.76 per share | |||||||||||||||
AFFO per share | $2.76 - $2.81 per share | |||||||||||||||
G&A expenses | $35.5 - $36.5 Million | |||||||||||||||
Real estate expenses, net of tenant reimbursements | $8.5 - $9.0 Million | |||||||||||||||
Acquisition volume | $550 - $650 Million | |||||||||||||||
Disposition volume | $80 - $120 Million | |||||||||||||||
6
National Retail Properties, Inc. (in thousands) (unaudited) | ||||||||
December 31, 2018 | December 31, 2017 | |||||||
Balance Sheet Summary | ||||||||
Assets: | ||||||||
Real estate: | ||||||||
Accounted for using the operating method, net of accumulated depreciation and amortization | $ | 6,853,757 | $ | 6,403,638 | ||||
Accounted for using the direct financing method | 8,069 | 9,650 | ||||||
Real estate held for sale | 13,606 | 29,373 | ||||||
Cash and cash equivalents | 114,267 | 1,364 | ||||||
Receivables, net of allowance | 3,797 | 4,317 | ||||||
Accrued rental income, net of allowance | 25,387 | 25,916 | ||||||
Debt costs, net of accumulated amortization | 4,081 | 5,380 | ||||||
Other assets | 80,474 | 80,896 | ||||||
Total assets | $ | 7,103,438 | $ | 6,560,534 | ||||
Liabilities: | ||||||||
Line of credit payable | $ | — | $ | 120,500 | ||||
Mortgages payable, including unamortized premium and net of unamortized debt cost | 12,694 | 13,300 | ||||||
Notes payable, net of unamortized discount and unamortized debt costs | 2,838,701 | 2,446,407 | ||||||
Accrued interest payable | 19,519 | 20,311 | ||||||
Other liabilities | 77,919 | 119,106 | ||||||
Total liabilities | 2,948,833 | 2,719,624 | ||||||
Stockholders’ equity of NNN | 4,154,250 | 3,840,593 | ||||||
Noncontrolling interests | 355 | 317 | ||||||
Total equity | 4,154,605 | 3,840,910 | ||||||
Total liabilities and equity | $ | 7,103,438 | $ | 6,560,534 | ||||
Common shares outstanding | 161,504 | 153,577 | ||||||
Gross leasable area, Property Portfolio (square feet) | 30,487 | 29,093 | ||||||
7
National Retail Properties, Inc. Debt Summary As of December 31, 2018 (in thousands) (unaudited) | ||||||||||||||
Unsecured Debt | Principal | Principal, Net of Unamortized Discount | Stated Rate | Effective Rate | Maturity Date | |||||||||
Line of credit payable | $ | — | $ | — | L + 87.5 bps | 2.823% | January 2022 | |||||||
Unsecured notes payable: | ||||||||||||||
2022 | 325,000 | 322,903 | 3.800% | 3.985% | October 2022 | |||||||||
2023 | 350,000 | 348,780 | 3.300% | 3.388% | April 2023 | |||||||||
2024 | 350,000 | 349,583 | 3.900% | 3.924% | June 2024 | |||||||||
2025 | 400,000 | 399,301 | 4.000% | 4.029% | November 2025 | |||||||||
2026 | 350,000 | 346,818 | 3.600% | 3.733% | December 2026 | |||||||||
2027 | 400,000 | 398,550 | 3.500% | 3.548% | October 2027 | |||||||||
2028 | 400,000 | 397,215 | 4.300% | 4.388% | October 2028 | |||||||||
2048 | 300,000 | 295,778 | 4.800% | 4.890% | October 2048 | |||||||||
Total | 2,875,000 | 2,858,928 | ||||||||||||
Total unsecured debt | $ | 2,875,000 | $ | 2,858,928 | ||||||||||
Debt costs | (26,932 | ) | ||||||||||||
Accumulated amortization | 6,705 | |||||||||||||
Debt costs, net of accumulated amortization | (20,227 | ) | ||||||||||||
Notes payable, net of unamortized discount and unamortized debt costs (1) | $ | 2,838,701 | ||||||||||||
(1) Unsecured notes payable have a weighted average interest rate of 4.0% and a weighted average maturity of 9.3 years | ||||||||||||||
Mortgages Payable | Principal Balance | Interest Rate | Maturity Date | |||||
Mortgage(1) | $ | 12,768 | 5.230% | July 2023 | ||||
Debt costs | (147 | ) | ||||||
Accumulated amortization | 73 | |||||||
Debt costs, net of accumulated amortization | (74 | ) | ||||||
Mortgages payable, including unamortized premium and net of unamortized debt costs | $ | 12,694 | ||||||
(1) Includes unamortized premium | ||||||||
8
National Retail Properties, Inc.
Property Portfolio
Top 20 Lines of Trade
As of December 31, | ||||||||
Line of Trade | 2018(1) | 2017(2) | ||||||
1. | Convenience stores | 18.0 | % | 18.1 | % | |||
2. | Restaurants - full service | 11.4 | % | 12.1 | % | |||
3. | Restaurants - limited service | 8.9 | % | 7.6 | % | |||
4. | Automotive service | 8.6 | % | 6.9 | % | |||
5. | Family entertainment centers | 7.1 | % | 6.4 | % | |||
6. | Health and fitness | 5.6 | % | 5.6 | % | |||
7. | Theaters | 5.0 | % | 4.8 | % | |||
8. | Automotive parts | 3.4 | % | 3.6 | % | |||
9. | Recreational vehicle dealers, parts and accessories | 3.4 | % | 3.4 | % | |||
10. | Wholesale clubs | 2.3 | % | 2.2 | % | |||
11. | Medical service providers | 2.2 | % | 2.4 | % | |||
12. | Home improvement | 2.2 | % | 1.8 | % | |||
13. | Equipment rental | 1.9 | % | 2.0 | % | |||
14. | Drug stores | 1.8 | % | 1.9 | % | |||
15. | Travel plazas | 1.7 | % | 1.8 | % | |||
16. | Furniture | 1.7 | % | 1.9 | % | |||
17. | Bank | 1.6 | % | 2.5 | % | |||
18. | Consumer electronics | 1.6 | % | 1.8 | % | |||
19. | General merchandise | 1.6 | % | 1.8 | % | |||
20. | Home furnishings | 1.5 | % | 1.6 | % | |||
Other | 8.5 | % | 9.8 | % | ||||
Total | 100.0 | % | 100.0 | % | ||||
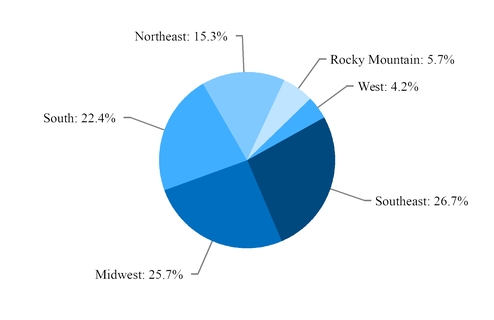
Top 10 States
State | % of Total(1) | State | % of Total(1) | |||||||||
1. | Texas | 17.3 | % | 6. | Georgia | 4.5 | % | |||||
2. | Florida | 8.7 | % | 7. | Tennessee | 3.9 | % | |||||
3. | Ohio | 5.7 | % | 8. | Indiana | 3.9 | % | |||||
4. | Illinois | 5.2 | % | 9. | Virginia | 3.7 | % | |||||
5. | North Carolina | 4.6 | % | 10. | Alabama | 3.1 | % | |||||
(1) | Based on the annualized base rent for all leases in place as of December 31, 2018. |
(2) | Based on the annualized base rent for all leases in place as of December 31, 2017. |
9
National Retail Properties, Inc.
Property Portfolio
Top Tenants (≥ 2.0%)
Properties | % of Total (1) | ||||
7-Eleven | 140 | 5.4% | |||
Mister Car Wash | 106 | 4.4% | |||
Camping World | 47 | 4.3% | |||
LA Fitness | 30 | 4.0% | |||
Flynn Restaurant Group (Taco Bell/Arby's) | 201 | 3.6% | |||
GPM Investments (Convenience Stores) | 151 | 3.6% | |||
AMC Theatres | 20 | 3.2% | |||
Couche-Tard (Pantry) | 86 | 3.0% | |||
Sunoco | 61 | 2.4% | |||
BJ's Wholesale Club | 9 | 2.3% | |||
Chuck E. Cheese's | 53 | 2.2% | |||
Lease Expirations(2)
% of Total(1) | # of Properties | Gross Leasable Area (3) | % of Total(1) | # of Properties | Gross Leasable Area (3) | |||||||||||
2019 | 1.7% | 51 | 648,000 | 2025 | 4.4% | 129 | 1,130,000 | |||||||||
2020 | 3.0% | 116 | 1,498,000 | 2026 | 5.0% | 179 | 1,697,000 | |||||||||
2021 | 3.8% | 121 | 1,317,000 | 2027 | 7.6% | 193 | 2,600,000 | |||||||||
2022 | 5.9% | 124 | 1,636,000 | 2028 | 5.0% | 162 | 1,188,000 | |||||||||
2023 | 2.9% | 113 | 1,420,000 | 2029 | 3.3% | 73 | 1,208,000 | |||||||||
2024 | 3.0% | 75 | 1,284,000 | Thereafter | 54.4% | 1,578 | 13,813,000 | |||||||||
(1) | Based on the annual base rent of $626,451,000, which is the annualized base rent for all leases in place as of December 31, 2018. |
(2) | As of December 31, 2018, the weighted average remaining lease term is 11.5 years. |
(3) | Square feet. |
10