EXHIBIT 99.1
 |
PRESS RELEASE |
Magna Announces Fourth Quarter 2022 Results and 2023 Outlook
Fourth Quarter 2022 Highlights
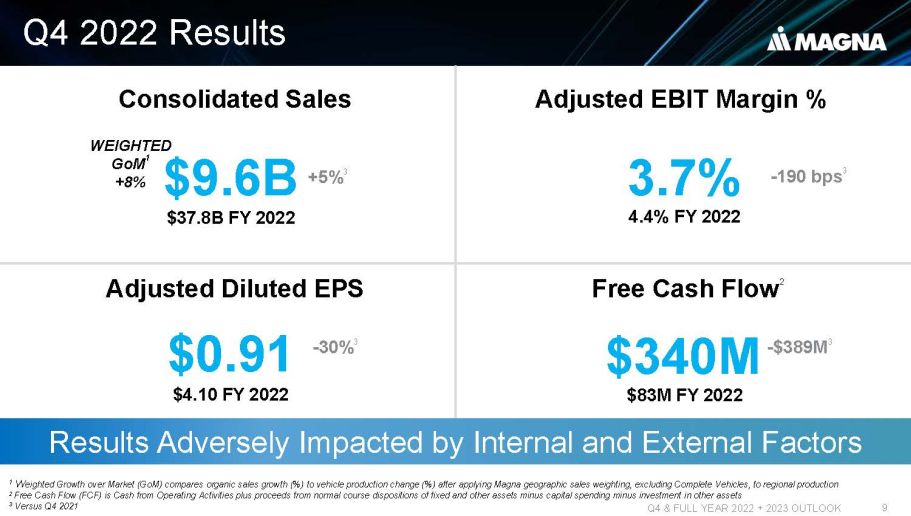
- Sales increased 5% to $9.6 billion
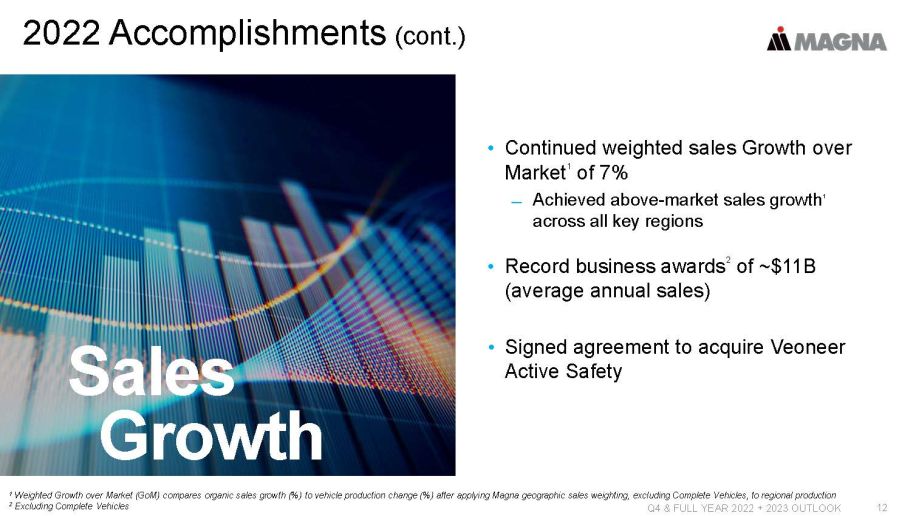
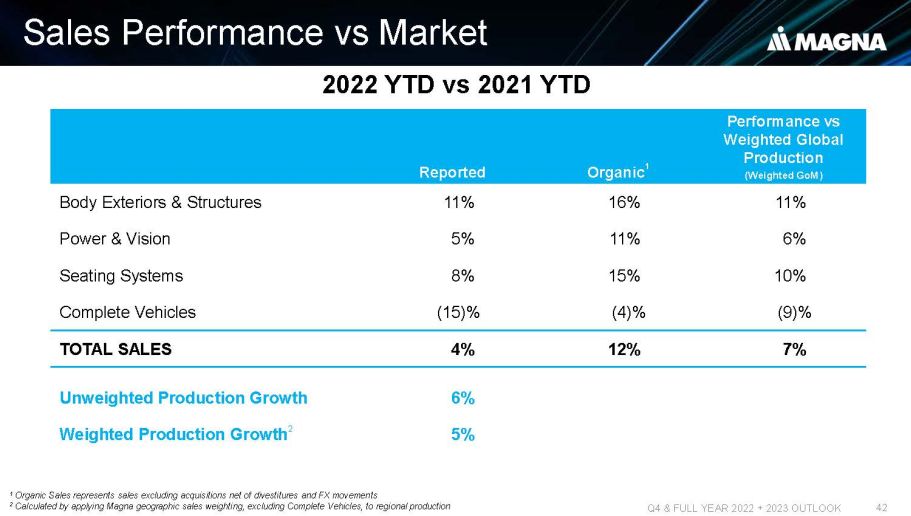
- Excluding foreign currency translation sales increased 13%, compared to a global light vehicle production increase of 5%
- Diluted earnings per share and Adjusted diluted earnings per share decreased to $0.33 and $0.91, respectively, compared to $1.54 and $1.30 last year
- Returned $131 million to shareholders through dividends and share repurchases
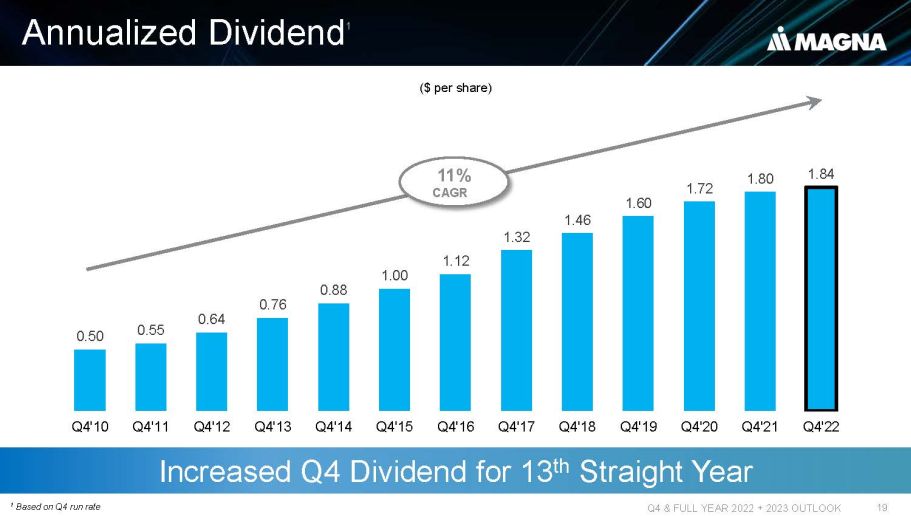
- Raised quarterly cash dividend to $0.46 per share
2023 Outlook Highlights
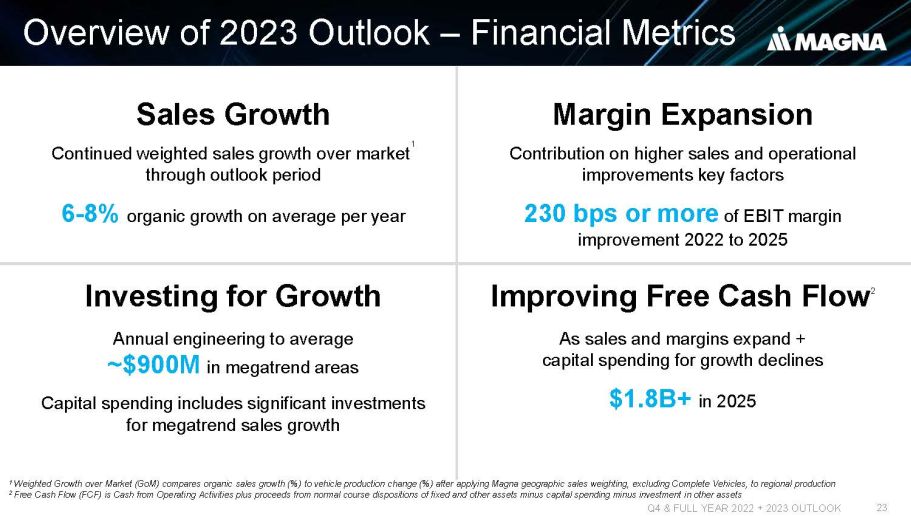
- Sales expected to continue to outgrow global light vehicle production through outlook period
- Expect Adjusted EBIT Margin to expand by 230 basis points or more by 2025
AURORA, Ontario, Feb. 10, 2023 (GLOBE NEWSWIRE) -- Magna International Inc. (TSX: MG; NYSE: MGA) today reported financial
results for the fourth quarter and year ended December 31, 2022.
| THREE
MONTHS ENDED DECEMBER 31, |
YEAR
ENDED DECEMBER 31, | |||||||||||||||
| 2022 | 2021 | 2022 | 2021 | |||||||||||||
| Reported | ||||||||||||||||
| Sales | $ | 9,568 | $ | 9,110 | $ | 37,840 | $ | 36,242 | ||||||||
| Income from operations before income taxes | $ | 146 | $ | 576 | $ | 878 | $ | 1,948 | ||||||||
| Net income attributable to Magna International Inc. | $ | 95 | $ | 464 | $ | 592 | $ | 1,514 | ||||||||
| Diluted earnings per share | $ | 0.33 | $ | 1.54 | $ | 2.03 | $ | 5.00 | ||||||||
| Non-GAAP Financial Measures(1) | ||||||||||||||||
| Adjusted EBIT | $ | 356 | $ | 508 | $ | 1,662 | $ | 2,064 | ||||||||
| Adjusted diluted earnings per share | $ | 0.91 | $ | 1.30 | $ | 4.10 | $ | 5.13 | ||||||||
All results are reported in millions of U.S. dollars, except per share figures, which are in U.S. dollars.
(1) Adjusted EBIT and Adjusted diluted earnings per share are Non-GAAP financial measures that have no standardized meaning under U.S. GAAP, and as a result may not be comparable to the calculation of similar measures by other companies. A reconciliation of these Non-GAAP financial measures is included in the back of this press release.
 |
“2022 was another difficult year for the auto industry as inflation climbed to levels not experienced for decades, geopolitical issues contributed to unprecedented European energy prices and OEM production schedules remained volatile. Nevertheless, we once again generated above-market sales growth, and booked a record amount of business. In 2023, we are highly focused on improving underperforming operations, limiting discretionary costs and securing further inflation recoveries from our customers. At the same time, we continue to invest to support the significant amount of business growth in front of us.” - Swamy Kotagiri, Magna’s Chief Executive Officer
|
THREE MONTHS ENDED DECEMBER 31, 2022
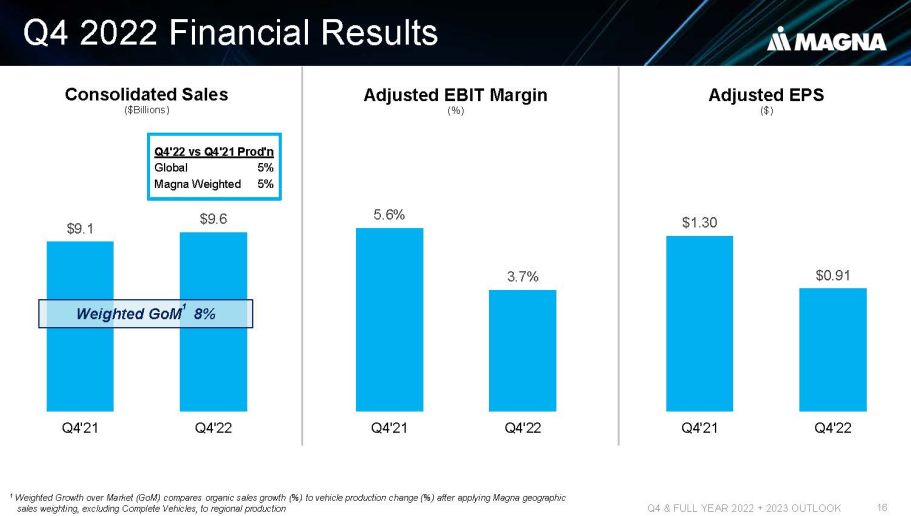
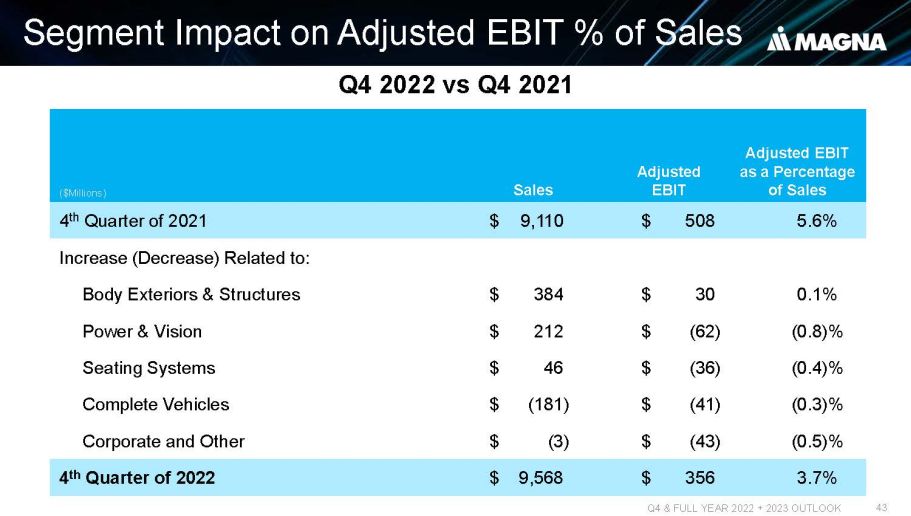
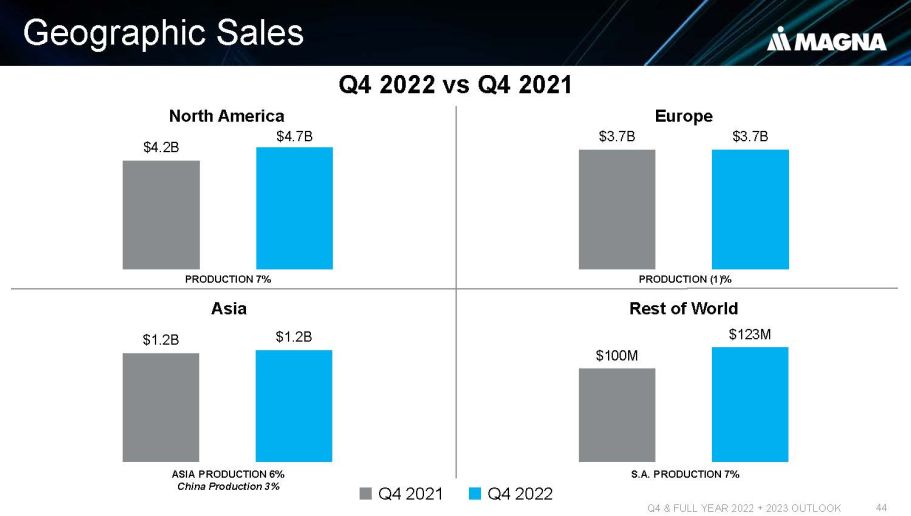
We recorded consolidated sales of $9.6 billion in the fourth quarter of 2022, an increase of 5% over the fourth quarter of 2021. Excluding the impact of foreign currency translation, sales increased 13% compared to global light vehicle production that increased 5%.
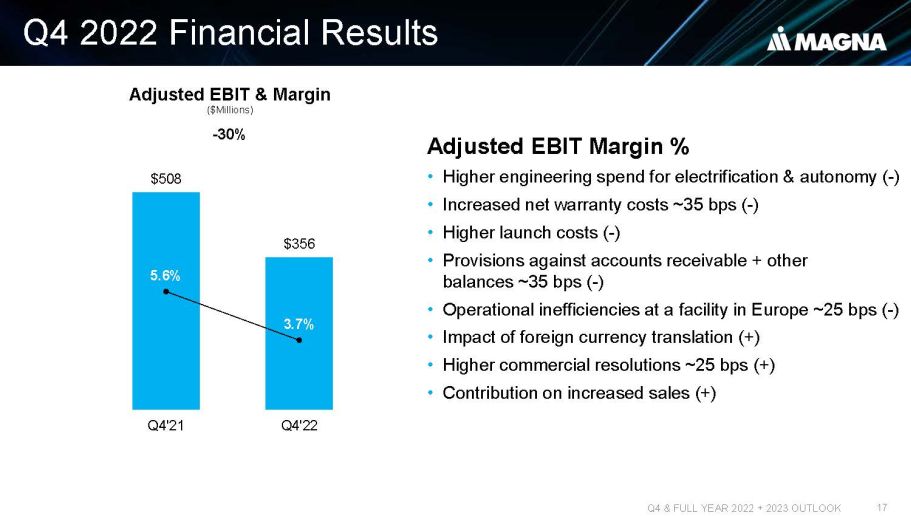
Adjusted EBIT decreased to $356 million in the fourth quarter of 2022 compared to $508 million in the fourth quarter of 2021. This decrease mainly reflects higher net engineering costs related to our electrification and ADAS businesses, including at certain equity-accounted entities, higher net warranty costs, higher launch costs, operating inefficiencies at a facility in Europe, and provisions against certain accounts receivable and other balances. These factors were partially offset by earnings on higher sales and higher net favourable commercial resolutions.
Income from operations before income taxes was $146 million in the fourth quarter of 2022 compared to $576 million in the fourth quarter of 2021. Included in income from operations before income taxes in the fourth quarter of 2022 was Other expense, net of $193 million, comprised of net losses on the revaluation of certain public and private company warrants and equity investments, a loss on the sale of a business operation, and restructuring and impairment costs (see "Non-GAAP Financial Measures" section included in this Press Release). In comparison, in the fourth quarter of 2021 we recorded, Other income, net of $90 million, comprised of merger agreement termination fee income and net gains on the revaluation of certain public and private company warrants and equity investments, partially offset by restructuring and impairment costs. Excluding Other expense (income), net from both periods, income from operations before income taxes decreased $147 million in the fourth quarter of 2022 compared to the fourth quarter of 2021.
Net income attributable to Magna International Inc. was $95 million in the fourth quarter of 2022 compared to $464 million in the fourth quarter of 2021. Included in net income attributable to Magna International Inc. in the fourth quarter of 2022 was Other expense, net of $166 million after tax, compared to Other income, net of $60 million and Adjustments to Deferred Tax Valuation Allowances of $13 million in the fourth quarter of 2021. Excluding Other expense (income), net and Adjustments to Deferred Tax Valuation Allowances from both periods, net income attributable to Magna International Inc. decreased $130 million in the fourth quarter of 2022 compared to the fourth quarter of 2021.
Diluted earnings per share decreased to $0.33 in the fourth quarter of 2022 compared to $1.54 in the comparable period and Adjusted diluted earnings per share decreased to $0.91 compared to $1.30.
In the fourth quarter of 2022, we generated $1.3 billion in cash from operating activities after changes in operating assets and liabilities. Investment activities in the fourth quarter of 2022 included $750 million in fixed asset additions, and $186 million for investments, other assets and intangible assets.
YEAR ENDED DECEMBER 31, 2022
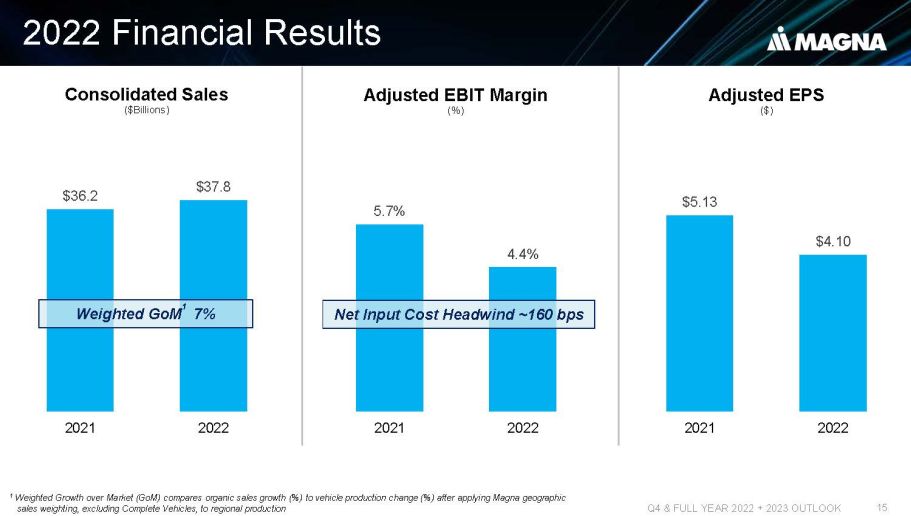
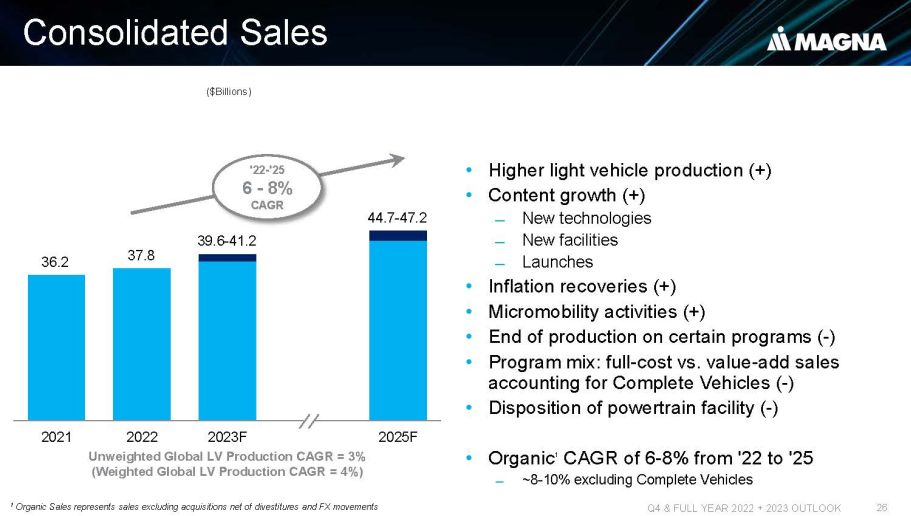
We recorded consolidated sales of $37.8 billion for the year ended December 31, 2022, an increase of 4% from the year ended December 31, 2021. Excluding the impact of foreign currency translation, sales increased 11% compared to global light vehicle production that increased 6%.
Adjusted EBIT decreased to $1.66 billion in 2022 compared to $2.06 billion in 2021. This decrease mainly reflects higher net production input costs, including energy, commodity, labour and freight costs, inefficiencies and other costs at certain underperforming facilities, higher net engineering costs related to our electrification and ADAS businesses, including at certain equity-accounted entities, the net weakening of foreign currencies against the U.S. dollar, reduced earnings as a result of the substantial idling of our Russian operations, and lower equity income. These factors were partially offset by earnings on higher sales, higher net favourable commercial resolutions and a $45 million provision on engineering service contracts with the automotive unit of Evergrande in 2021.
During 2022, income from operations before income taxes was $878 million and net income attributable to Magna International Inc. was $592 million, down $1.07 billion and $922 million compared to 2021, respectively.
Diluted earnings per share decreased to $2.03 in 2022 compared to $5.00 in 2021 and adjusted diluted earnings per share
decreased to $4.10 compared to $5.13.
During 2022, we generated cash from operations of $2.1 billion including changes in operating assets and liabilities. Investment activities in 2022 included $1.7 billion in fixed asset additions, $455 million in investments, other assets and intangible assets, and $29 million in public and private equity investments.
RETURN OF CAPITAL TO SHAREHOLDERS
During the year ended December 31, 2022, we repurchased 12.6 million shares for $780 million. In addition, we paid dividends of $126 million and $514 million for the three months and year ended December 31, 2022, respectively.
Our Board of Directors declared a fourth quarter dividend of $0.46 per Common Share. The dividend is payable on March 10, 2023 to shareholders of record as of the close of business on February 24, 2023.
2023 AND 2025 OUTLOOK
Our current year Outlook is provided annually and updated quarterly; our 2025 Outlook is provided below, but not updated quarterly. Our outlook does not incorporate material unannounced acquisitions or divestitures. It also excludes the pending acquisition of Veoneer Active Safety announced on December 20, 2022.
2023 and 2025 Outlook Assumptions
| 2023 | 2025 | ||||
| Light Vehicle Production (millions of units) North America Europe China |
14.9 16.2 26.2 |
16.5 17.5 29.0 | |||
| Average Foreign exchange rates: 1 Canadian dollar equals 1 euro equals |
US$0.750 US$1.070 |
US$0.750 US$1.070 | |||
2023 and 2025 Outlook
| 2023 | 2025 | ||||
| Segment Sales Body Exteriors & Structures Power & Vision Seating Systems Complete Vehicles |
$16.7 - $17.3 billion $13.0 - $13.4 billion $5.5 - $5.8 billion $4.9 - $5.2 billion |
$20.0 - $21.0 billion $14.8 - $15.4 billion $6.2 - $6.6 billion $4.0 - $4.5 billion | |||
| Total Sales | $39.6 - $41.2 billion | $44.7 - $47.2 billion | |||
| Adjusted EBIT Margin(2) | 4.1% - 5.1% | 6.7% - 7.8% | |||
| Equity Income (included in EBIT) | $95 - $125 million | $180 - $225 million | |||
| Interest Expense, net | Approximately $150 million | ||||
| Income Tax Rate(3) | Approximately 21% | ||||
| Net Income attributable to Magna(4) | $1.1 - $1.4 billion | ||||
| Capital Spending | Approximately $2.4 billion | ||||
| Notes: (2) Adjusted EBIT Margin is the ratio of Adjusted EBIT to Total Sales (3) The Income Tax Rate has been calculated using Adjusted EBIT and is based on current tax legislation (4) Net Income attributable to Magna excludes Other expense (income), net | |||||
Our Outlook is intended to provide information about management's current expectations and plans and may not be appropriate for other purposes. Although considered reasonable by Magna as of the date of this document, the 2023 and 2025 Outlook above and the underlying assumptions may prove to be inaccurate. Accordingly, our actual results could differ materially from our expectations as set forth herein. The risks identified in the “Forward-Looking Statements” section below represent the primary factors which we believe could cause actual results to differ materially from our expectations.
Key Drivers of Our Business
Our operating results are primarily dependent on the levels of North American, European and Chinese car and light truck production by our customers. While we supply systems and components to every major original equipment manufacturer ["OEM"], we do not supply systems and components for every vehicle, nor is the value of our content consistent from one vehicle to the next. As a result, customer and program mix relative to market trends, as well as the value of our content on specific vehicle production programs, are also important drivers of our results.
Ordinarily OEM production volumes are aligned with vehicle sales levels and thus affected by changes in such levels. Aside from vehicle sales levels, production volumes are typically impacted by a range of factors, including: general economic and political conditions; labour disruptions; free trade arrangements; tariffs; relative currency values; commodities prices; supply chains and infrastructure; availability and relative cost of skilled labour; regulatory considerations, including those related to environmental emissions and safety standards; and other factors. Additionally, COVID-19 can impact vehicle production volumes, including through: mandatory stay-at-home orders which restrict production; elevated employee absenteeism; and supply chain disruptions, such as the semiconductor chip shortage currently impacting global vehicle production volumes.
Overall vehicle sales levels are significantly affected by changes in consumer confidence levels, which may in turn be impacted by consumer perceptions and general trends related to the job, housing and stock markets, as well as other macroeconomic and political factors. Other factors which typically impact vehicle sales levels and thus production volumes include: interest rates and/or availability of credit; fuel and energy prices; relative currency values; regulatory restrictions on use of vehicles in certain megacities; and other factors. Additionally, COVID-19 can impact vehicle sales, including through: mandatory stay-at-home orders which restrict operations of car dealerships, as well as through a deterioration in consumer confidence.
Segment Analysis
[All amounts in U.S. dollars and all tabular amounts in millions unless otherwise
noted]
Body Exteriors & Structures
| For the three months | ||||||||||||
| ended December 31, | ||||||||||||
| 2022 | 2021 | Change | ||||||||||
| Sales | $ | 4,004 | $ | 3,620 | $ | 384 | + | 11 | % | |||
| Adjusted EBIT | $ | 198 | $ | 168 | $ | 30 | + | 18 | % | |||
| Adjusted EBIT as a percentage of sales (i) | 4.9 | % | 4.6 | % | + | 0.3 | % | |||||
(i) Adjusted EBIT as a percentage of sales is calculated as Adjusted EBIT divided by Sales.
Sales for Body Exteriors & Structures increased 11% or $384 million to $4.00 billion in the fourth quarter of 2022 compared to $3.62 billion in 2021. The increase in sales was primarily due to higher global light vehicle production, the launch of new programs during or subsequent to the fourth quarter of 2021, including the Rivian R1T and R1S, Honda CR-V, Ford F-150 Lightning and Jeep Grand Cherokee, and customer input cost recoveries. These factors were partially offset by a $224 million decrease in reported U.S. dollar sales as a result of the weakening of foreign currencies against the U.S. dollar and net customer price concessions.
Adjusted EBIT increased $30 million to $198 million for the fourth quarter of 2022 compared to $168 million in the fourth quarter of 2021 and Adjusted EBIT as a percentage of sales increased to 4.9% from 4.6%. The increase is primarily due to earnings on higher sales, lower net warranty costs and higher net favourable commercial settlements. These were partially offset by higher net production input costs, including labour, commodity, freight and energy costs, inefficiencies and other costs at certain underperforming facilities, provisions against certain accounts receivable and other balances, and higher launch costs.
Power & Vision
| For the three months | ||||||||||||
| ended December 31, | ||||||||||||
| 2022 | 2021 | Change | ||||||||||
| Sales | $ | 3,016 | $ | 2,804 | $ | 212 | + | 8 | % | |||
| Adjusted EBIT | $ | 109 | $ | 171 | $ | (62 | ) | - | 36 | % | ||
| Adjusted EBIT as a percentage of sales | 3.6 | % | 6.1 | % | - | 2.5 | % | |||||
Sales for Power & Vision increased 8% or $212 million to $3.02 billion in the fourth quarter
of 2022 compared to $2.80 billion in 2021. The increase in sales was primarily due to higher global light vehicle production,
the launch of new programs during or subsequent to the fourth quarter of 2021, including the Chery Arrizo 8, BMW X5 and Nio ES7, and customer
input cost recoveries. These factors were partially offset by a $235 million decrease in reported U.S. dollar sales as a result
of the weakening of foreign currencies against the U.S. dollar and net customer price concessions.
Adjusted EBIT decreased $62 million to $109 million for the fourth quarter of 2022 compared to $171 million for the fourth quarter of 2021 and Adjusted EBIT as a percentage of sales decreased to 3.6% from 6.1%. These decreases are primarily due to higher net warranty costs, higher net engineering costs related to our electrification and ADAS businesses, including at certain equity-accounted entities, lower equity income and higher launch costs. These were partially offset by earnings on higher sales, customer recoveries in excess of increased net production input costs, including commodity, energy, freight and labour costs and higher net favourable commercial settlements.
Seating Systems
| For the three months | ||||||||||||
| ended December 31, | ||||||||||||
| 2022 | 2021 | Change | ||||||||||
| Sales | $ | 1,345 | $ | 1,299 | $ | 46 | + | 4 | % | |||
| Adjusted EBIT | $ | 13 | $ | 49 | $ | (36 | ) | - | 73 | % | ||
| Adjusted EBIT as a percentage of sales | 1.0 | % | 3.8 | % | - | 2.8 | % | |||||
Sales for Seating Systems increased 4% or $46 million to $1.35 billion in the fourth quarter of
2022 compared to $1.30 billion in 2021. The increase in sales was primarily due to higher global light vehicle production, and
the launch of new programs during or subsequent to the fourth quarter of 2021, including the BYD Qin Plus, BYD Atto 3 and Changan Shenlan
SL03. These factors were partially offset by a $97 million decrease in reported U.S. dollar sales as a result of the weakening of
foreign currencies against the U.S. dollar and net customer price concessions.
Adjusted EBIT decreased $36 million to $13 million for the fourth quarter of 2022 compared to $49 million for the fourth quarter of 2021 and Adjusted EBIT as a percentage of sales decreased to 1.0% from 3.8%. These decreases are primarily due to inefficiencies and other costs at an underperforming facility, higher net production input costs, including freight, labour, energy and commodity costs, higher launch costs and provisions against certain accounts receivable and other balances, partially offset by higher net favourable commercial settlements.
Complete Vehicles
| For the three months | ||||||||||||
| ended December 31, | ||||||||||||
| 2022 | 2021 | Change | ||||||||||
| Complete Vehicle Assembly Volumes (thousands of units) | 27.0 | 32.7 | - | 17 | % | |||||||
| Sales | $ | 1,330 | $ | 1,511 | $ | (181 | ) | - | 12 | % | ||
| Adjusted EBIT | $ | 57 | $ | 98 | $ | (41 | ) | - | 42 | % | ||
| Adjusted EBIT as a percentage of sales | 4.3 | % | 6.5 | % | - | 2.2 | % | |||||
Sales for Complete Vehicles decreased 12% or $181 million to $1.33 billion in the fourth quarter
of 2022 compared to $1.51 billion in the fourth quarter of 2021 and assembly volumes decreased 17% or 5,700 units. This sales
decline was primarily due to a $164 million decrease in reported U.S. dollar sales as a result of the weakening of the euro against the
U.S. dollar and the impact of lower assembly volumes, partially offset by favourable program mix.
Adjusted EBIT decreased $41 million to $57 million for the fourth quarter of 2022 compared to $98 million for the fourth quarter of 2021 and Adjusted EBIT as a percentage of sales decreased to 4.3% from 6.5% primarily due to lower government research and development incentives, higher net production input costs, including energy and labour costs, and lower net favourable commercial settlements.
Corporate and Other
Adjusted EBIT decreased $43 million to a loss of $21 million for the fourth quarter of 2022 compared to income of $22 million for the fourth quarter of 2021 primarily due to higher incentive compensation and labour costs, higher costs to accelerate our operational excellence initiatives and a decrease in fees received from our divisions, partially offset by transactional foreign exchange gains in the fourth quarter of 2022 compared to losses in the fourth quarter of 2021.
MAGNA INTERNATIONAL INC.
CONSOLIDATED STATEMENTS OF INCOME
[Unaudited]
[U.S.
dollars in millions, except per share figures]
| Three months ended | Year ended | ||||||||||||
| December 31, | December 31, | ||||||||||||
| 2022 | 2021 | 2022 | 2021 | ||||||||||
| Sales | $ | 9,568 | $ | 9,110 | $ | 37,840 | $ | 36,242 | |||||
| Costs and expenses | |||||||||||||
| Cost of goods sold | 8,403 | 7,822 | 33,188 | 31,097 | |||||||||
| Depreciation and amortization | 349 | 389 | 1,419 | 1,512 | |||||||||
| Selling, general and administrative | 477 | 414 | 1,660 | 1,717 | |||||||||
| Interest expense, net | 17 | 22 | 81 | 78 | |||||||||
| Equity income | (17 | ) | (23 | ) | (89 | ) | (148 | ) | |||||
| Other expense (income), net [i] | 193 | (90 | ) | 703 | 38 | ||||||||
| Income from operations before income taxes | 146 | 576 | 878 | 1,948 | |||||||||
| Income taxes | 35 | 98 | 237 | 395 | |||||||||
| Net income | 111 | 478 | 641 | 1,553 | |||||||||
| Income attributable to non-controlling interests | (16 | ) | (14 | ) | (49 | ) | (39 | ) | |||||
| Net income attributable to Magna International Inc. | $ | 95 | $ | 464 | $ | 592 | $ | 1,514 | |||||
| Earnings per Common Share: | |||||||||||||
| Basic | $ | 0.33 | $ | 1.55 | $ | 2.04 | $ | 5.04 | |||||
| Diluted | $ | 0.33 | $ | 1.54 | $ | 2.03 | $ | 5.00 | |||||
| Cash dividends paid per Common Share | $ | 0.45 | $ | 0.43 | $ | 1.80 | $ | 1.72 | |||||
| Weighted average number of Common Shares outstanding during the period [in millions]: | |||||||||||||
| Basic | 285.9 | 299.7 | 290.4 | 300.6 | |||||||||
| Diluted | 286.3 | 301.5 | 291.2 | 302.8 | |||||||||
[i] See "Other (income) expense, net" information included in this Press Release.
MAGNA INTERNATIONAL INC.
CONSOLIDATED BALANCE SHEETS
[Unaudited]
[U.S. dollars
in millions]
| As at | As at | ||||||
| December
31, |
December
31, |
||||||
| 2022 | 2021 | ||||||
| ASSETS | |||||||
| Current assets | |||||||
| Cash and cash equivalents | $ | 1,234 | $ | 2,948 | |||
| Accounts receivable | 6,791 | 6,307 | |||||
| Inventories | 4,180 | 3,969 | |||||
| Prepaid expenses and other | 320 | 278 | |||||
| 12,525 | 13,502 | ||||||
| Investments | 1,429 | 1,593 | |||||
| Fixed assets, net | 8,173 | 8,293 | |||||
| Operating lease right-of-use assets | 1,595 | 1,700 | |||||
| Intangible assets, net | 452 | 493 | |||||
| Goodwill | 2,031 | 2,122 | |||||
| Deferred tax assets | 491 | 421 | |||||
| Other assets | 1,093 | 962 | |||||
| $ | 27,789 | $ | 29,086 | ||||
| LIABILITIES AND SHAREHOLDERS' EQUITY | |||||||
| Current liabilities | |||||||
| Short-term borrowing | $ | 8 | $ | — | |||
| Accounts payable | 6,999 | 6,465 | |||||
| Other accrued liabilities | 2,118 | 2,156 | |||||
| Accrued salaries and wages | 850 | 851 | |||||
| Income taxes payable | 93 | 200 | |||||
| Long‑term debt due within one year | 654 | 455 | |||||
| Current portion of operating lease liabilities | 276 | 274 | |||||
| 10,998 | 10,401 | ||||||
| Long‑term debt | 2,847 | 3,538 | |||||
| Operating lease liabilities | 1,288 | 1,406 | |||||
| Long-term employee benefit liabilities | 548 | 700 | |||||
| Other long‑term liabilities | 461 | 376 | |||||
| Deferred tax liabilities | 312 | 440 | |||||
| 16,454 | 16,861 | ||||||
| Shareholders' equity | |||||||
| Capital stock | |||||||
| Common Shares | |||||||
| [issued: 285,931,816; December 31, 2021 – 297,871,776] | 3,299 | 3,403 | |||||
| Contributed surplus | 111 | 102 | |||||
| Retained earnings | 8,639 | 9,231 | |||||
| Accumulated other comprehensive loss | (1,114 | ) | (900 | ) | |||
| 10,935 | 11,836 | ||||||
| Non-controlling interests | 400 | 389 | |||||
| 11,335 | 12,225 | ||||||
| $ | 27,789 | $ | 29,086 | ||||
MAGNA INTERNATIONAL INC.
CONSOLIDATED STATEMENTS OF CASH FLOWS
[Unaudited]
[U.S.
dollars in millions]
| Three months ended | Year ended | ||||||||||||
| December 31, | December 31, | ||||||||||||
| 2022 | 2021 | 2022 | 2021 | ||||||||||
| Cash provided from (used for): | |||||||||||||
| OPERATING ACTIVITIES | |||||||||||||
| Net income | $ | 111 | $ | 478 | $ | 641 | $ | 1,553 | |||||
| Items not involving current cash flows | 406 | 371 | 1,776 | 1,576 | |||||||||
| 517 | 849 | 2,417 | 3,129 | ||||||||||
| Changes in operating assets and liabilities | 739 | 502 | (322 | ) | (189 | ) | |||||||
| Cash provided from operating activities | 1,256 | 1,351 | 2,095 | 2,940 | |||||||||
| INVESTMENT ACTIVITIES | |||||||||||||
| Fixed asset additions | (750 | ) | (549 | ) | (1,681 | ) | (1,372 | ) | |||||
| Increase in equity method investments | — | (63 | ) | — | (517 | ) | |||||||
| Increase in investments, other assets and intangible assets | (186 | ) | (105 | ) | (455 | ) | (403 | ) | |||||
| Increase in public and private equity investments | — | (45 | ) | (29 | ) | (68 | ) | ||||||
| Proceeds from dispositions | 20 | 32 | 124 | 81 | |||||||||
| Business combinations | (3 | ) | (31 | ) | (3 | ) | (13 | ) | |||||
| Proceeds on (funding for) disposal of facilities | — | — | 6 | (41 | ) | ||||||||
| Settlement of long-term receivable from non-consolidated JV | — | — | — | 50 | |||||||||
| Cash used for investing activities | (919 | ) | (761 | ) | (2,038 | ) | (2,283 | ) | |||||
| FINANCING ACTIVITIES | |||||||||||||
| Issues of debt | 9 | 21 | 54 | 55 | |||||||||
| Increase (decrease) in short-term borrowings | 8 | — | 11 | (101 | ) | ||||||||
| Repayments of debt | (39 | ) | (16 | ) | (456 | ) | (121 | ) | |||||
| Issue of Common Shares on exercise of stock options | 3 | 10 | 8 | 146 | |||||||||
| Tax witholdings on vesting of equity awards | — | (1 | ) | (15 | ) | (13 | ) | ||||||
| Repurchase of Common Shares | (5 | ) | (251 | ) | (780 | ) | (517 | ) | |||||
| Contributions to subsidiaries by non-controlling interests | — | 8 | 5 | 8 | |||||||||
| Dividends paid to non-controlling interests | (24 | ) | (39 | ) | (46 | ) | (49 | ) | |||||
| Dividends paid | (126 | ) | (127 | ) | (514 | ) | (514 | ) | |||||
| Cash used for financing activities | (174 | ) | (395 | ) | (1,733 | ) | (1,106 | ) | |||||
| Effect of exchange rate changes on cash, cash equivalents and restricted cash equivalents | (31 | ) | 5 | (38 | ) | 23 | |||||||
| Net increase (decrease) in cash and cash equivalents during the period | 132 | 200 | (1,714 | ) | (426 | ) | |||||||
| Cash, cash equivalents and restricted cash equivalents, beginning of period | 1,102 | 2,748 | 2,948 | 3,374 | |||||||||
| Cash and cash equivalents, end of period | $ | 1,234 | $ | 2,948 | $ | 1,234 | $ | 2,948 | |||||
MAGNA INTERNATIONAL INC.
SUPPLEMENTAL DATA
[Unaudited]
[All amounts in U.S.
dollars and all tabular amounts in millions unless otherwise noted]
OTHER EXPENSE (INCOME), NET
| Three months ended | Year ended | ||||||||||||||
| December 31, | December 31, | ||||||||||||||
| 2022 | 2021 | 2022 | 2021 | ||||||||||||
| Restructuring and impairments | [a] | $ | 34 | $ | 18 | $ | 424 | $ | 101 | ||||||
| Net losses (gains) on investments | [b] | 101 | (8 | ) | 221 | 2 | |||||||||
| Loss on sale of business | [c] | 58 | — | 58 | 75 | ||||||||||
| Merger agreement termination fee | [d] | — | (100 | ) | — | (100 | ) | ||||||||
| Gain on business combinations | [e] | — | — | — | (40 | ) | |||||||||
| $ | 193 | $ | (90 | ) | $ | 703 | $ | 38 | |||||||
| [a] Restructuring and impairments | |||||||||||||||
| Three months ended | Year ended | ||||||||||||||
| December 31, | December 31, | ||||||||||||||
| 2022 | 2021 | 2022 | 2021 | ||||||||||||
| Body Exteriors & Structures | $ | 12 | $ | — | $ | 185 | $ | 16 | |||||||
| Power & Vision | 22 | 4 | 26 | 67 | |||||||||||
| Seating Systems | — | 14 | 10 | 18 | |||||||||||
| Corporate | — | — | 203 | — | |||||||||||
| Other expense, net | 34 | 18 | 424 | 101 | |||||||||||
| Tax effect | — | (1 | ) | (17 | ) | (18 | ) | ||||||||
| Net loss attributable to Magna | $ | 34 | $ | 17 | $ | 407 | $ | 83 | |||||||
| Included in the table above, the Company recorded a $376 million [$361 million after tax] impairment charge related to its investment in Russia during the second quarter of 2022. This included net asset impairments of $173 million and a $203 million reserve against the related foreign currency translation losses that are included in accumulated other comprehensive loss. The net asset impairments consisted of $163 million and $10 million in our Body Exteriors & Structures segment and our Seating segment, respectively. | |||||||||||||||
| [b] Net losses (gains) on investments | |||||||||||||||
| Three months ended | Year ended | ||||||||||||||
| December 31, | December 31, | ||||||||||||||
| 2022 | 2021 | 2022 | 2021 | ||||||||||||
| Revaluation of public company warrants | $ | 77 | $ | (14 | ) | $ | 173 | $ | (4 | ) | |||||
| Revaluation of public and private equity investments | 24 | 6 | 48 | 6 | |||||||||||
| Other expense (income), net | 101 | (8 | ) | 221 | 2 | ||||||||||
| Tax effect | (26 | ) | 6 | (53 | ) | 7 | |||||||||
| Net loss (income) attributable to Magna | $ | 75 | $ | (2 | ) | $ | 168 | $ | 9 | ||||||
| [c] Loss on sale of business | |||||||||||||||
| During the fourth quarter of 2022, the Company
entered into an agreement to sell a European Power & Vision operation in early 2023. Under the terms of the arrangement, the Company
expects to provide the buyer with $42 million of funding, resulting in a loss of $58 million [$57 million after tax]. During the third quarter of 2021, the Company sold three Body Exteriors & Structures operations in Germany. Under the terms of the arrangement, the Company provided the buyer with $41 million of funding, resulting in a loss on disposal of $75 million. [$75 million after tax]. | |||||||||||||||
| [d] Merger agreement termination fee | |||||||||||||||
| During the fourth quarter of 2021, Veoneer, Inc. (“Veoneer”) terminated its merger agreement with Magna. In connection with the termination of the merger agreement, Veoneer paid the Company a termination fee which, net of the Company’s associated transaction costs, amounted to $100 million [ $75 million after tax]. | |||||||||||||||
| [e] Gain on business combinations | |||||||||||||||
| During the first quarter of 2021, the Company
acquired a 65% equity interest and a controlling financial interest in Chongqing Hongli Zhixin Scientific Technology Development Group
LLC. The acquisition included an additional 15% equity interest in two entities for which the Company previously used equity accounting.
On the change in basis of accounting, the Company recognized a $22 million gain [$22 million after tax]. Also during the first quarter of 2021, the Company recorded a gain of $18 million [$18 million after tax] in connection with the distribution of substantially all of the assets of the Company's European joint venture, Getrag Ford Transmission GmbH. | |||||||||||||||
SEGMENTED INFORMATION
Magna is a global automotive supplier which has complete vehicle engineering and contract manufacturing expertise, as well as product capabilities which include body, chassis, exterior, seating, powertrain, active driver assistance, electronics, mirrors & lighting, mechatronics and roof systems. Magna also has electronic and software capabilities across many of these areas.
The Company is organized under four operating segments: Body Exteriors & Structures, Power & Vision, Seating Systems and Complete Vehicles. These segments have been determined on the basis of technological opportunities, product similarities, and market and operating factors, and are also the Company's reportable segments.
The Company's chief operating decision maker uses Adjusted Earnings before Interest and Income Taxes ["Adjusted EBIT"] as the measure of segment profit or loss, since management believes Adjusted EBIT is the most appropriate measure of operational profitability or loss for its reporting segments. Adjusted EBIT is calculated by taking Net income and adding back Income taxes, Interest expense, net, and Other expense (income), net.
The following tables show segment information for the Company's reporting segments: See Non-GAAP Financial Measures section for a reconciliation of Adjusted EBIT to the Company’s consolidated net income.
| Three months ended December 31, 2022 | |||||||||||||||||||
| Total sales |
External sales |
Adjusted EBIT [ii] |
Depreciation and amortization |
Equity (income) loss |
Fixed asset additions |
||||||||||||||
| Body Exteriors & Structures | $ | 4,004 | $ | 3,945 | $ | 198 | $ | 171 | $ | — | $ | 442 | |||||||
| Power & Vision | 3,016 | 2,961 | 109 | 124 | (5 | ) | 203 | ||||||||||||
| Seating Systems | 1,345 | 1,344 | 13 | 20 | (6 | ) | 43 | ||||||||||||
| Complete Vehicles | 1,330 | 1,318 | 57 | 28 | (7 | ) | 52 | ||||||||||||
| Corporate & Other [i] | (127 | ) | — | (21 | ) | 6 | 1 | 10 | |||||||||||
| Total Reportable Segments | $ | 9,568 | $ | 9,568 | $ | 356 | $ | 349 | $ | (17 | ) | $ | 750 | ||||||
| Three months ended December 31, 2021 | |||||||||||||||||||
| Total sales |
External sales |
Adjusted EBIT [ii] |
Depreciation and amortization |
Equity loss (income) |
Fixed asset additions |
||||||||||||||
| Body Exteriors & Structures | $ | 3,620 | $ | 3,558 | $ | 168 | $ | 189 | $ | 5 | $ | 311 | |||||||
| Power & Vision | 2,804 | 2,757 | 171 | 145 | (18 | ) | 181 | ||||||||||||
| Seating Systems | 1,299 | 1,294 | 49 | 23 | (2 | ) | 34 | ||||||||||||
| Complete Vehicles | 1,511 | 1,500 | 98 | 27 | (7 | ) | 20 | ||||||||||||
| Corporate & Other [i] | (124 | ) | 1 | 22 | 5 | (1 | ) | 3 | |||||||||||
| Total Reportable Segments | $ | 9,110 | $ | 9,110 | $ | 508 | $ | 389 | $ | (23 | ) | $ | 549 | ||||||
| Year ended December 31, 2022 | |||||||||||||||||||
| Total sales |
External sales |
Adjusted EBIT [ii] |
Depreciation and amortization |
Equity loss (income) |
Fixed asset additions |
||||||||||||||
| Body Exteriors & Structures | $ | 16,004 | $ | 15,763 | $ | 843 | $ | 706 | $ | 10 | $ | 928 | |||||||
| Power & Vision | 11,861 | 11,636 | 471 | 504 | (77 | ) | 544 | ||||||||||||
| Seating Systems | 5,269 | 5,252 | 99 | 84 | (15 | ) | 101 | ||||||||||||
| Complete Vehicles | 5,221 | 5,180 | 235 | 107 | (10 | ) | 94 | ||||||||||||
| Corporate & Other [i] | (515 | ) | 9 | 14 | 18 | 3 | 14 | ||||||||||||
| Total Reportable Segments | $ | 37,840 | $ | 37,840 | $ | 1,662 | $ | 1,419 | $ | (89 | ) | $ | 1,681 | ||||||
| Year ended December 31, 2021 | |||||||||||||||||||
| Total sales |
External sales |
Adjusted EBIT [ii] |
Depreciation and amortization |
Equity loss (income) |
Fixed asset additions |
||||||||||||||
| Body Exteriors & Structures | $ | 14,477 | $ | 14,196 | $ | 820 | $ | 743 | $ | 13 | $ | 711 | |||||||
| Power & Vision | 11,342 | 11,129 | 738 | 554 | (134 | ) | 522 | ||||||||||||
| Seating Systems | 4,891 | 4,851 | 152 | 92 | (9 | ) | 73 | ||||||||||||
| Complete Vehicles | 6,106 | 6,057 | 287 | 103 | (10 | ) | 54 | ||||||||||||
| Corporate & Other [i] | (574 | ) | 9 | 67 | 20 | (8 | ) | 12 | |||||||||||
| Total Reportable Segments | $ | 36,242 | $ | 36,242 | $ | 2,064 | $ | 1,512 | $ | (148 | ) | $ | 1,372 | ||||||
| [i] Included in Corporate
and Other Adjusted EBIT are intercompany fees charged to the automotive segments. [ii] For a definition and reconciliation of Adjusted EBIT, refer to our Non-GAAP financial measures reconciliation included in the “Supplemental Data” section of this Press Release. | |||||||||||||||||||
MAGNA INTERNATIONAL INC.
SUPPLEMENTAL DATA
[Unaudited]
[All amounts in U.S.
dollars and all tabular amounts in millions unless otherwise noted]
NON-GAAP FINANCIAL MEASURES
In addition to the financial results reported in accordance with U.S. GAAP, this press release contains references to the Non-GAAP financial measures reconciled below. We believe the Non-GAAP financial measures used in this press release are useful to both management and investors in their analysis of the Company’s financial position and results of operations, and to improve comparability between fiscal periods. In particular, management believes that Adjusted EBIT and Adjusted diluted earnings per share, are useful measures in assessing the Company’s financial performance by excluding certain items that are not indicative of the Company's core operating performance. The presentation of Non-GAAP financial measures should not be considered in isolation, or as a substitute for the Company’s related financial results prepared in accordance with U.S. GAAP.
The following table reconciles Net income to Adjusted EBIT:
| Three months ended | Year ended | ||||||||||||
| December 31, | December 31, | ||||||||||||
| 2022 | 2021 | 2022 | 2021 | ||||||||||
| Net Income | $ | 111 | $ | 478 | $ | 641 | $ | 1,553 | |||||
| Add: | |||||||||||||
| Interest expense, net | 17 | 22 | 81 | 78 | |||||||||
| Other expense (income), net | 193 | (90 | ) | 703 | 38 | ||||||||
| Income taxes | 35 | 98 | 237 | 395 | |||||||||
| Adjusted EBIT | $ | 356 | $ | 508 | $ | 1,662 | $ | 2,064 | |||||
| The following table reconciles Net income attributable to Magna International Inc. to Adjusted diluted earnings per share: | |||||||||||||
| Three months ended | Year ended | ||||||||||||
| December 31, | December 31, | ||||||||||||
| 2022 | 2021 | 2022 | 2021 | ||||||||||
| Net income attributable to Magna International Inc. | $ | 95 | $ | 464 | $ | 592 | $ | 1,514 | |||||
| Add: | |||||||||||||
| Other expense (income), net | 193 | (90 | ) | 703 | 38 | ||||||||
| Tax effect on Other expense (income), net | (27 | ) | 30 | (71 | ) | 14 | |||||||
| Adjustments to Deferred Tax Valuation Allowances [i] | — | (13 | ) | (29 | ) | (13 | ) | ||||||
| Adjusted net income attributable to Magna International Inc. | 261 | 391 | 1,195 | 1,553 | |||||||||
| Diluted weighted average number of Common Shares | |||||||||||||
| outstanding during the period (millions): | 286.3 | 301.5 | 291.2 | 302.8 | |||||||||
| Adjusted diluted earnings per share | $ | 0.91 | $ | 1.30 | $ | 4.10 | $ | 5.13 | |||||
| [i] During 2022 and 2021, the Company recorded adjustments to the valuation allowance against its deferred tax assets in certain European and North America countries. The net effect of these adjustments was a reduction in income tax expense of $29 million and $13 million, respectively [‘‘Adjustments to Deferred Tax Valuation Allowances’’]. | |||||||||||||
Certain of the forward-looking financial measures above are provided on a Non-GAAP basis. We do not provide a reconciliation of such forward-looking measures to the most directly comparable financial measures calculated and presented in accordance with U.S. GAAP. To do so would be potentially misleading and not practical given the difficulty of projecting items that are not reflective of on-going operations in any future period. The magnitude of these items, however, may be significant.
This press release together with our Management’s Discussion and Analysis of Results of Operations and Financial Position and our Interim Financial Statements are available in the Investor Relations section of our website at www.magna.com/company/investors and filed electronically through the System for Electronic Document Analysis and Retrieval (SEDAR) which can be accessed at www.sedar.com as well as on the United States Securities and Exchange Commission’s Electronic Data Gathering, Analysis and Retrieval System (EDGAR), which can be accessed at www.sec.gov.
We will hold a conference call for interested analysts and shareholders to discuss our fourth quarter and year ended December 31, 2022 results on Friday, February 10, 2023 at 8:00 a.m. ET. The conference call will be chaired by Swamy Kotagiri, Chief Executive Officer. The number to use for this call from North America is 1-800-891-9945. International callers should use 1-416-981-9017. Please call in at least 10 minutes prior to the call start time. We will also webcast the conference call at www.magna.com. The slide presentation accompanying the conference call as well as our financial review summary will be available on our website Friday prior to the call.
TAGS
Quarterly earnings, financial results, vehicle production, outlook
INVESTOR CONTACT
Louis Tonelli, Vice-President, Investor Relations
louis.tonelli@magna.com
│ 905.726.7035
MEDIA CONTACT
Tracy Fuerst, Vice-President, Corporate Communications & PR
tracy.fuerst@magna.com
│ 248.761.7004
WEBCAST CONTACT
Nancy Hansford, Executive Assistant, Investor Relations
nancy.hansford@magna.com │
905.726.7108
OUR BUSINESS (5)
Magna is more than one of the world’s largest suppliers in the
automotive space. We are a mobility technology company with a global, entrepreneurial-minded team of over 168,000(6) employees
and an organizational structure designed to innovate like a startup. With 65+ years of expertise, and a systems approach to design, engineering
and manufacturing that touches nearly every aspect of the vehicle, we are positioned to support advancing mobility in a transforming industry.
Our global network includes 343 manufacturing operations and 88 product development, engineering and sales centres spanning 29 countries.
For further information about Magna (NYSE:MGA; TSX:MG), please visit www.magna.com or follow us on Twitter @MagnaInt.
(5) Manufacturing operations, product development, engineering and sales centres include
certain operations accounted for under the equity method.
(6) Number of employees includes approximately 158,000
employees at our wholly owned or controlled entities and over 10,000 employees at certain operations accounted for under the equity method.
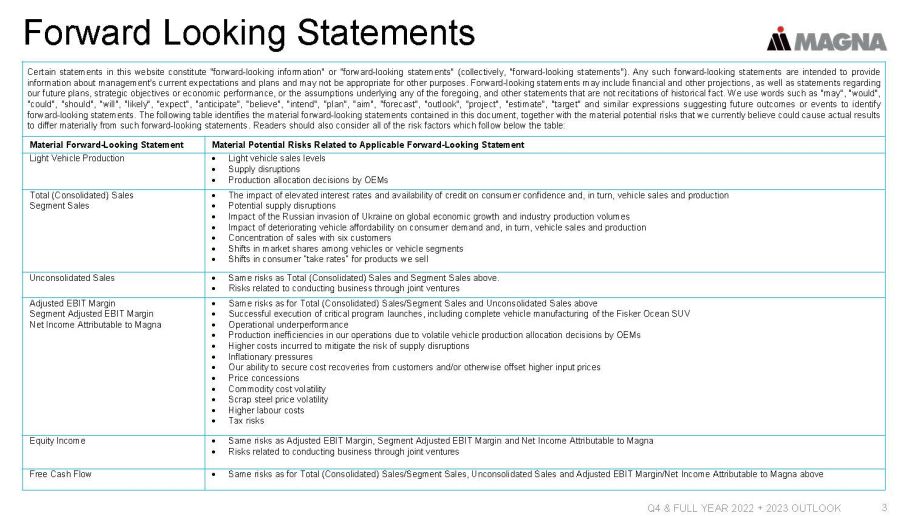
FORWARD-LOOKING STATEMENTS
Certain statements in this press release constitute "forward-looking information"
or "forward-looking statements" (collectively, "forward-looking statements"). Any such forward-looking statements are intended to provide
information about management's current expectations and plans and may not be appropriate for other purposes. Forward-looking statements
may include financial and other projections, as well as statements regarding our future plans, strategic objectives or economic performance,
or the assumptions underlying any of the foregoing, and other statements that are not recitations of historical fact. We use words such
as "may", "would", "could", "should", "will", "likely", "expect", "anticipate", "believe", "intend", "plan", "aim", "forecast", "outlook",
"project", "estimate", "target" and similar expressions suggesting future outcomes or events to identify forward-looking statements. The
following table identifies the material forward-looking statements contained in this document, together with the material potential risks
that we currently believe could cause actual results to differ materially from such forward-looking statements. Readers should also consider
all of the risk factors which follow below the table:
| Material
Forward-Looking Statement |
Material Potential Risks Related to Applicable Forward-Looking Statement |
| Light Vehicle Production |
|
| Total
Sales Segment Sales |
|
| Adjusted
EBIT Margin Net Income Attributable to Magna |
|
| Equity Income |
|
Forward-looking statements are based on information currently available to us and are based on assumptions and analyses made by us in light of our experience and our perception of historical trends, current conditions and expected future developments, as well as other factors we believe are appropriate in the circumstances. While we believe we have a reasonable basis for making any such forward-looking statements, they are not a guarantee of future performance or outcomes. In addition to the factors in the table above, whether actual results and developments conform to our expectations and predictions is subject to a number of risks, assumptions and uncertainties, many of which are beyond our control, and the effects of which can be difficult to predict, including, without limitation:
Risks Related to the Automotive Industry
|
Pricing Risks
|
In evaluating forward-looking statements or forward-looking information, we caution readers not to place undue
reliance on any forward-looking statement. Additionally, readers should specifically consider the various factors which could cause actual
events or results to differ materially from those indicated by such forward-looking statements, including the risks, assumptions and uncertainties
above which are:
- discussed under the “Industry Trends and Risks” heading of our Management’s Discussion and Analysis; and
- set out in our Annual Information Form filed with securities commissions in Canada, our annual report on Form 40-F filed with the United States Securities and Exchange Commission, and subsequent filings.
Readers should also consider discussion of our risk mitigation activities with respect to certain risk factors, which can be also found in our Annual Information Form.