QuickLinks -- Click here to rapidly navigate through this document
Exhibit 22.1

Notice of Annual and Special Meeting of Shareholders
| Date: | Thursday, May 5, 2016 |
Time: |
10:00 a.m. (Toronto time) |
Place: |
The Westin Prince 900 York Mills Road Toronto, Ontario Canada |
The Meeting is being held to:
| 1. | receive Magna's consolidated financial statements and the independent auditors' report thereon for the fiscal year ended December 31, 2015; | |
2. |
elect ten directors; |
|
3. |
reappoint Deloitte LLP as our independent auditors and authorize the Audit Committee to fix the independent auditors' remuneration; |
|
4. |
vote, in an advisory, non-binding manner, on Magna's approach to executive compensation described in the accompanying Management Information Circular/Proxy Statement; |
|
5. |
vote on a special resolution to approve the amendment of Magna's articles of incorporation; |
|
6. |
vote on a resolution ratifying and confirming a new general by-law; and |
|
7. |
transact any other business that may properly come before the Meeting. |
As a holder of record of Magna Common Shares at the close of business on March 18, 2016, you are entitled to receive notice of and vote at the Meeting.
If you are unable to attend the Meeting and want to ensure that your shares are voted, please submit your votes by proxy as described under "How to Vote Your Shares" in the accompanying circular. To be valid, our transfer agent, Computershare Trust Company of Canada, must receive your proxy by 5:00 p.m. (Toronto time) on May 3, 2016. If the Meeting is adjourned or postponed, Computershare must receive your proxy not later than 48 hours (excluding Saturdays, Sundays and holidays) prior to the time of the adjourned or postponed Meeting. The time limit for deposit of proxies may be waived or extended by the Chair of the Meeting at his or her discretion, without notice.
A live webcast of the Meeting will also be available through Magna's website at www.magna.com.
Accompanying this Notice of Annual and Special Meeting is Magna's Management Information Circular/Proxy Statement, which contains more information on the matters to be addressed at the Meeting.
By order of the Board of Directors.
/s/ "Bassem A. Shakeel" |
|
| March 28, 2016 | BASSEM A. SHAKEEL |
| Aurora, Ontario | Vice-President and Corporate Secretary |
Management Information Circular/Proxy Statement
This Circular is being provided to you in connection with the Annual and Special Meeting of Magna's shareholders (the "Meeting"), which will be held on Thursday, May 5, 2016 commencing at 10:00 a.m. (Toronto time) at The Westin Prince, 900 York Mills Road, Toronto, Ontario, Canada.
Voting Information
| Record Date | March 18, 2016 is the record date for the Meeting (the "Record Date"). Only holders of our Common Shares as of the close of business on the Record Date are entitled to receive notice of and to attend (in person or by proxy) and vote at the Meeting. | |
Shares and Votes |
As of the Record Date, 398,592,739 Magna Common Shares were issued and outstanding. Each Magna Common Share is entitled to one vote. |
|
Principal Shareholders |
To our knowledge, no shareholder beneficially owns or exercises control or direction, directly or indirectly, over 10% or more of Magna's Common Shares outstanding as at the Record Date. |
|
All of Magna's directors and executive officers as a group (19 persons) owned beneficially or exercised control or direction over 3,155,005 Common Shares representing approximately 0.8% of the class as at the Record Date. |
||
The Magna Deferred Profit Sharing Plan (Canada) and Employees Deferred Profit Sharing Plan (U.S.) (the "NADPSPs"), deferred profit sharing plans for Magna's participating employees, collectively hold 20,678,502 Magna Common Shares representing approximately 5.2% of the class as at the Record Date. The shares held by the NADPSPs will be voted FOR each of the items to be voted on at the Meeting. |
Meeting Information 3
How To Vote Your Shares
| Your Vote Is Important | Your vote is important. Please read the information below to ensure your shares are properly voted. | |
Registered vs. Non-Registered Shareholder |
How you vote your shares depends on whether you are a registered shareholder or a non-registered shareholder. In either case, there are two ways you can vote at the Meeting – by appointing a proxyholder or by attending in person, although the specifics may differ slightly. |
|
Registered Shareholder: You are a registered shareholder if you hold one or more share certificates which indicate your name and the number of Magna Common Shares which you own. As a registered shareholder, you will receive a form of proxy from Computershare Trust Company of Canada ("Computershare") representing the shares you hold. If you are a registered shareholder, refer to "How to Vote – Registered Shareholders". |
||
Non-Registered Shareholder: You are a non-registered shareholder if a securities dealer, broker, bank, trust company or other nominee holds your shares for you, or for someone else on your behalf. As a non-registered shareholder, you will most likely receive a Voting Instruction Form from either Broadridge Canada or Broadridge US, although in some cases you may receive a form of proxy from the securities dealer, broker, bank, trust company or other nominee holding your shares. If you are a non-registered shareholder, refer to "How to Vote – Non-Registered Shareholders". |
||
Proxies Are Being Solicited by Management |
Management is soliciting your proxy in connection with the matters to be addressed at the Meeting (or any adjournment(s) or postponement(s) thereof) to be held at the time and place set out in the accompanying Notice of Annual Meeting. We will bear all costs incurred in connection with Management's solicitation of proxies, including the cost of preparing and mailing this Circular and accompanying materials. Proxies will be solicited primarily by mail, although our officers and employees may (for no additional compensation) also directly solicit proxies by phone, fax or other electronic methods. Banks, brokerage houses and other custodians, nominees or fiduciaries will be requested to forward proxy solicitation material to the persons on whose behalf they hold Magna shares and to obtain authorizations for the execution of proxies. These institutions will be reimbursed for their reasonable expenses in doing so. |
|
Proxy Solicitor – Kingsdale |
Magna has also retained Kingsdale as proxy solicitation agent and will pay a fee of C$22,050 for such service, in addition to certain out-of-pocket expenses. Magna may also reimburse brokers and other persons holding Common Shares in their name or in the name of nominees for their costs incurred in sending proxy material to their principals in order to obtain their proxies. If you have any questions about the information contained in this Circular or need assistance in completing your proxy form, please contact Kingsdale by e-mail at contactus@kingsdaleshareholder.com or at the following telephone numbers: |
|
• within Canada or the U.S. (toll-free): 1-888-518-1552 |
||
• outside Canada and the U.S. (by collect call): 416-867-2272 |
4 Meeting Information
These securityholder materials are being sent to both registered
and non-registered owners of Magna Common Shares.
HOW TO VOTE – REGISTERED SHAREHOLDERS |
HOW TO VOTE – NON-REGISTERED SHAREHOLDERS |
|
|---|---|---|
| If you are a registered shareholder, you may vote either by proxy or in person at the Meeting. Submitting Votes by Proxy There are three ways to submit your vote by proxy: in accordance with the instructions on the form of proxy. If you are voting by phone or internet, you will need the pre-printed Control Number, Holder Account Number and Access Number on your form of proxy. A proxy submitted by mail must be in writing, dated the date on which you signed it and be signed by you (or your authorized attorney). If such a proxy is being submitted on behalf of a corporate shareholder, the proxy must be signed by an authorized officer or attorney of that corporation. If a proxy submitted by mail is not dated, it will be deemed to bear the date on which it was sent to you. If you are voting your shares by proxy, you must ensure that your completed and signed proxy form or your phone or internet vote is received by Computershare not later than 5:00 p.m. (Toronto time) on May 3, 2016. If the Meeting is adjourned or postponed, you must ensure that your completed and signed proxy form or your phone or internet vote is received by Computershare not later than 48 hours (excluding Saturdays, Sundays and holidays) prior to the time of the Meeting. Appointment of Proxyholder Unless you specify a different proxyholder or specify how you want your shares to be voted, the Magna officers whose names are pre-printed on the form of proxy will vote your shares: • FOR the election to the Magna Board of Directors of all of the nominees named in this Circular; • FOR the reappointment of Deloitte as Magna's independent auditors and the authorization of the Audit Committee to fix the independent auditors' remuneration; • FOR the advisory resolution to accept the approach to executive compensation disclosed in this Circular; • FOR the special resolution amending the articles; and • FOR the resolution ratifying and confirming the new general by-law. You have the right to appoint someone else (who need not be a shareholder) as your proxyholder; however, if you do, that person must vote your shares in person on your behalf at the Meeting. To appoint someone else as your proxyholder, insert the person's name in the blank space provided on the form of proxy or complete, sign, date and submit another proper form of proxy naming that person as your proxyholder. |
If you are a non-registered shareholder, the intermediary holding on your behalf (and not Magna) has assumed responsibility for (i) delivering these materials to you and (ii) executing your
proper voting instructions. Submitting Voting Instructions There are three ways to submit your vote by Voting Instruction Form: in accordance with the instructions on the Voting Instruction Form. If you are a non-registered shareholder and have received a Voting Instruction Form from Broadridge, you must complete and submit your vote by phone, internet or mail, in accordance with the instructions on the form. We have been advised by Broadridge that, on receipt of a properly completed and submitted form, a form of proxy will be submitted on your behalf. You must ensure that your completed, signed and dated Voting Instruction Form or your phone or internet vote is received by no later than any deadline specified by Broadridge, which we expect will be 5:00 p.m. (Toronto time) on May 2, 2016. If the Meeting is adjourned or postponed, you must ensure that your completed, signed and dated Voting Instruction Form or your phone or internet vote is received by Broadridge Canada or Broadridge US, as applicable, not later than 72 hours (excluding Saturdays, Sundays and holidays) prior to the time of the Meeting. If a Voting Instruction Form submitted by mail or fax is not dated, it will be deemed to bear the date on which it was sent to you. In some cases, you may have received a form of proxy instead of a Voting Instruction Form, even though you are a non-registered shareholder. Such a form of proxy will likely be stamped by the securities dealer, broker, bank, trust company or other nominee or intermediary holding your shares and be restricted as to the number of shares to which it relates. In this case, you must complete the form of proxy and submit it to Computershare as described to the left under "How to Vote – Registered Shareholders – Submitting Votes By Proxy". |
Meeting Information 5
HOW TO VOTE – REGISTERED SHAREHOLDERS (cont'd) |
HOW TO VOTE – NON-REGISTERED SHAREHOLDERS (cont'd) |
|
|---|---|---|
| Appointment of Proxyholder (cont'd) If you choose to vote by proxy, you are giving the person (referred to as a "proxyholder") or people named on your form of proxy the authority to vote your shares on your behalf at the Meeting (including any adjournment or postponement of the Meeting). You may indicate on the form of proxy how you want your proxyholder to vote your shares, or you can let your proxyholder decide for you. If you do not specify on the form of proxy how you want your shares to be voted, your proxyholder will have the discretion to vote your shares as they see fit. The form of proxy accompanying this Circular gives the proxyholder discretion with respect to any amendments or changes to matters described in the Notice of Annual Meeting and with respect to any other matters which may properly come before the Meeting (including any adjournment or postponement of the Meeting). As of the date of this Circular, we are not aware of any amendments, changes or other matters to be addressed at the Meeting. Voting in Person If you attend in person, you do not need to complete or return your form of proxy. When you arrive at the Meeting, a Computershare representative will register your attendance before you enter the Meeting. If you vote in person at the Meeting and had previously completed and returned your form of proxy, your proxy will be automatically revoked and any votes you cast on a poll at the Meeting will count. Revoking a Vote Made by Proxy You have the right to revoke a proxy by ANY of the following methods: • Vote again by phone or internet not later than 5:00 p.m. (Toronto time) on May 3, 2016 (or not later than 48 hours prior to the time of the adjourned or postponed Meeting); • Deliver by mail another completed and signed form of proxy, dated later than the first form of proxy, such that it is received by Computershare not later than 5:00 p.m. (Toronto time) on May 3, 2016 (or not later than 48 hours prior to the time of the adjourned or postponed Meeting); • Deliver to us at the following address a signed written notice revoking the proxy, provided it is received not later than 5:00 p.m. (Toronto time) on May 4, 2016 (or not later than 5:00 p.m. on the last business day prior to the date of the adjourned or postponed Meeting): Magna International Inc. 337 Magna Drive Aurora, Ontario, Canada L4G 7K1 Attention: Corporate Secretary • Deliver a signed written notice revoking the proxy to the scrutineers of the Meeting, to the attention of the Chair of the Meeting, at or prior to the commencement of the Meeting (including in the case of any adjournment or postponement of the Meeting). |
Voting in Person If you have received a Voting Instruction Form from your Canadian intermediary and wish to attend the Meeting in person or have someone else attend on your behalf, you must complete, sign and return the Voting Instruction Form or complete the equivalent electronic form online, in each case in accordance with the instructions on the form. If you have received a Voting Instruction Form from your US intermediary and wish to attend the Meeting in person or have someone else attend on your behalf, you must complete, sign and return the Voting Instruction Form in accordance with the instructions on the form. Your intermediary will send you a legal proxy giving you or your designate the right to attend the meeting. If you have received a form of proxy and wish to attend the Meeting in person or have someone else attend on your behalf, you must insert your name, or the name of the person you wish to attend on your behalf, in the blank space provided on the form of proxy. If you are voting your shares by proxy, you must ensure that your completed and signed proxy form or your phone or internet vote is received by Computershare not later than 5:00 p.m. (Toronto time) on May 3, 2016. If the Meeting is adjourned or postponed, you must ensure that: • your completed and signed Voting Instruction Form (or equivalent electronic form online) is received by Broadridge Canada or Broadridge US, as applicable, not later than 72 hours (excluding Saturdays, Sundays and holidays) prior to the time of the adjourned or postponed Meeting; or • your completed and signed proxy form or your phone or internet vote is received by Computershare not later than 48 hours (excluding Saturdays, Sundays and holidays) prior to any adjournment or postponement of the Meeting. When you arrive at the Meeting, a Computershare representative will register your attendance before you enter the Meeting. Revoking a Voting Instruction Form or Proxy If you wish to revoke a Voting Instruction Form or form of proxy for any matter on which a vote has not already been cast, you must contact your securities dealer, broker, bank, trust company or other nominee or intermediary (for a form of proxy sent to you by such intermediary) and comply with any applicable requirements relating to the revocation of votes made by Voting Instruction Form or proxy. |
6 Meeting Information
Business of the Meeting
Purpose of the Meeting |
The Meeting is being held for shareholders to: 1. receive Magna's consolidated financial statements and the independent auditors' report thereon for the fiscal year ended December 31, 2015; |
|
2. elect ten directors; |
||
3. reappoint Deloitte as our independent auditors and authorize the Audit Committee to fix the independent auditors' remuneration; |
||
4. vote, in an advisory, non-binding manner, on Magna's approach to executive compensation described in this Circular; |
||
5. vote on a special resolution to approve the amendment of Magna's articles of incorporation; |
||
6. vote on a resolution ratifying and confirming a new general by-law; and |
||
7. transact any other business that may properly come before the Meeting. |
||
As of the date of this Circular, we are not aware of any other business to be transacted at the Meeting. |
||
1. Financial Statements |
Magna's consolidated financial statements and the independent auditors' report thereon for the fiscal year ended December 31, 2015 are included in the Annual Report, which was provided to shareholders with this Circular. The financial statements will be presented at the Meeting, but no shareholder vote is required in connection with them. |
|
2. Election of Directors |
Directors are elected by shareholders to act as stewards of the company. The Board is Magna's highest decision-making body, except to the extent certain rights have been reserved for shareholders under applicable law or Magna's articles of incorporation or by-laws. Among other things, the Board is responsible for appointing our Chief Executive Officer and overseeing Management. In fulfilling their duties, directors are required under applicable law to act in the best interests of the company. |
|
Board Size and Term |
||
The CGCNC is responsible for making recommendations to the Board regarding optimal Board size and candidates for service on the Board. Some of the factors relevant to the CGCNC's consideration of optimal Board size include the scale and complexity of Magna's business, the markets in which it operates, the company's strategic priorities, the need for a diverse range of skills and perspectives, Committee staffing needs and other factors. Magna's articles of incorporation permit the Board to determine its size within a range of five to fifteen directors. Over the last ten years, the Board size has ranged between nine and fourteen, with an average of eleven directors. The number of directors to be elected at the Meeting is ten and the CGCNC believes that to be an appropriate size at the present time. |
||
Meeting Information 7
|
Each director is elected for a one-year term expiring at our next annual meeting of shareholders. 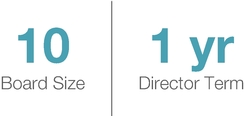
Minimum Qualifications for Service as a Director of Magna In addition to the minimum qualifications specified in the OBCA, our Board Charter requires that each director possess the following attributes: • personal and professional integrity; • significant achievement in his or her field; • experience and expertise relevant to our business; • a reputation for sound and mature business judgment; • the commitment and ability to devote the necessary time and effort in order to conduct his or her duties effectively; and • financial literacy. |
|
2016 Nominees The CGCNC has unanimously recommended, and the Board has unanimously approved, the nomination of the following individuals for election at the Meeting: |
| • Scott B. Bonham • Peter G. Bowie • Hon. J. Trevor Eyton • Lady Barbara Judge • Dr. Kurt J. Lauk |
• Cynthia A. Niekamp • Dr. Indira V. Samarasekera • Donald J. Walker • Lawrence D. Worrall • William L. Young |
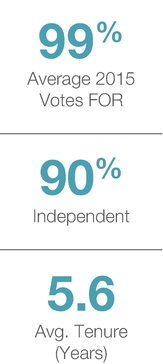
All of the nominees for election at the Meeting were previously elected at our 2015 annual meeting of shareholders. On average, the nominees received 99% support at our 2015 annual meeting of shareholders. Two of our directors (Ms. Samarasekera and Mr. Bonham) serve together on one other board, but no directors serve on any other board together with a member of Magna's Management. |
||
One director who was elected at our 2015 annual meeting of shareholders, V. Peter Harder, resigned effective March 21, 2016 to accept an appointment to the Senate of Canada and thus is not standing for re-election. |
||
8 Meeting Information
In recommending the ten nominees to the Board, the CGCNC considered a number of factors, including: • the nominees' respective skills, expertise and experience, as well as the extent to which the nominees meet the minimum qualifications described above; • results of the Board's annual self-assessment process, which incorporates both a self-evaluation and a peer review process; • individual voting results from the 2015 annual meeting; and • feedback from the Board's independent advisors and others. The CGCNC and the Board are confident that each of the ten nominees: • exceeds the minimum requirements set out in our Board Charter and the OBCA; • has skills, experience and expertise that provide the Board with the necessary insight to effectively carry out its mandate; and • will, if elected, provide responsible oversight as a steward of the corporation, including prudent oversight of Management. Refer to "Nominees for Election to the Board" for detailed information regarding the skills, expertise and other relevant information which you should consider in casting your vote for each nominee. |
||
CGCNC / Board Recommendation |
||
The CGCNC and the Board of Directors unanimously recommend that shareholders vote FOR the election of each nominee listed above and described in detail in "Nominees for Election to the Board" below. |
||
Unless otherwise instructed, the Magna officers whose names have been pre-printed on the form of proxy or Voting Instruction Form intend to vote FOR each such nominee. |
||
Individual Elections, Majority Voting and Disclosure of Voting Results |
||

|
At the Meeting, you will have the opportunity to vote for each nominee individually. We do not utilize slate voting. Under Ontario corporate law, shareholders can only vote "for" or "withhold" (i.e. abstain) their vote for director nominees. As a result, a single "for" vote can result in a nominee being elected, no matter how many votes were withheld. We have adopted a majority voting policy under which we treat "withhold" votes as if they were votes against a nominee in the case of an uncontested election (i.e. one in which the number of nominees equals the number of Board positions). A nominee who receives more "withhold" votes than "for" votes must promptly tender a resignation to the Chair of the CGCNC for its consideration. Our majority voting policy is described in further detail below under "Corporate Governance" and each nominee has agreed to abide by such policy. Detailed voting results are promptly disclosed after shareholder meetings, so that shareholders can easily understand the level of support for each nominee, as well as each other item of business at the meeting. |
|
Meeting Information 9
3. Reappointment of Deloitte as Magna's Independent Auditors |
Deloitte, an Independent Registered Public Accounting Firm, was first appointed Magna's independent auditors on May 8, 2014 and has audited Magna's consolidated financial statements for the fiscal years ended December 31, 2014 and 2015. Services provided by independent auditors may fall into one of the following categories: |
|
Audit Services: |
services performed in order to comply with the standards of the Public Company Accounting Oversight Board (United States) ("PCAOB"), including integrated audit of the consolidated financial statements, quarterly reviews and statutory audits of foreign subsidiaries. In some cases, these may include an appropriate allocation of fees for tax services or accounting consultations, to the extent such services were necessary to comply with the standards of the PCAOB. This category includes the audit of our internal control over financial reporting for purposes of Section 404 of the Sarbanes-Oxley Act of 2002. |
|
Audit- Related Services: |
assurance and related services, including such things as due diligence relating to mergers and acquisitions, accounting consultations and audits in connection with acquisitions, attest services that are not required by statute or regulation and consultation concerning financial accounting and reporting standards. Audit-related services actually provided by Deloitte in respect of 2015 consisted of: assurance services and procedures related to the audit of carve-out financial statements for Magna's interiors business, issuance of comfort letters for prospectus supplements, assessments in connection with the COSO 2013 Internal Controls Integrated Framework and other assurance services. |
|
Tax Services: |
tax compliance, planning and advisory services, excluding any such services required in order to comply with the standards of the PCAOB which are included under "Audit Services". The tax services actually provided by Deloitte in respect of 2015 consisted of: domestic and international tax advisory, compliance and research services, as well as transfer pricing advisory services. |
|
Other Permitted Services: |
all permitted services not falling under any of the previous categories. |
|
10 Meeting Information
|
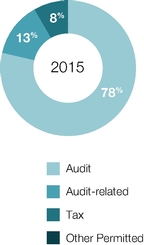
Deloitte's Independence In order to protect Deloitte's independence from being compromised by engagements for other services, the Audit Committee has established and maintains a process for the review and pre-approval of all services and related fees to be paid to Deloitte. Pursuant to this approval process, the Audit Committee approved and Magna was billed the following fees for services provided by Deloitte in respect of 2015: |
| 2015 | 2014 | |||||||
| TYPE OF SERVICES |
FEES ($) |
% OF TOTAL |
FEES ($) |
% OF TOTAL |
||||
| Audit | 10,016,000 | 78 | 12,159,000 | 91 | ||||
| Audit-related | 1,726,000 | 13 | 99,000 | 1 | ||||
| Tax | 1,044,000 | 8 | 1,075,000 | 8 | ||||
| Other Permitted | 49,000 | <1 | 4,000 | <1 | ||||
| Total | 12,835,000 | 100 | 13,337,000 | 100 | ||||
The Audit Committee has also established a process to pre-approve the future hiring (if any) of current and former partners and employees of Deloitte engaged on Magna's account. No such partners or employees were hired in 2015. |
||
Audit Committee Recommendation |
||
The Audit Committee unanimously recommends that shareholders vote FOR the resolution reappointing Deloitte as Magna's independent auditors and authorizing the Audit Committee to fix Deloitte's remuneration. |
||
Unless otherwise instructed, the persons designated in the form of proxy or Voting Instruction Form intend to vote FOR the resolution reappointing Deloitte. |
||
Representatives of Deloitte are expected to attend the Meeting, will have the opportunity to make a statement if they so desire and are expected to be available to respond to appropriate questions from shareholders. |
||
Meeting Information 11
4. Advisory Vote on Approach to Executive Compensation |
At the Meeting, shareholders will again have the opportunity to cast an advisory, non-binding vote on Magna's approach to executive compensation – this is often referred to as "say on pay". Although the vote is non-binding, the CGCNC will consider the results when assessing future compensation decisions. The text of the resolution reads as follows: "Resolved, on an advisory basis and not to diminish the roles and responsibilities of the board of directors, that the shareholders accept the approach to executive compensation disclosed in the accompanying Management Information Circular/Proxy Statement." |
|
Our approach to executive compensation is set out in detail in the Compensation and Performance Report and the Compensation Discussion & Analysis in this Circular. Included in the Compensation and Performance Report is a detailed discussion and benchmarking results demonstrating the strong connection between executive compensation and corporate performance over a three-year period. We encourage you to carefully read these sections of this Circular. |
||
We most recently held an advisory vote on executive compensation at our May 7, 2015 annual meeting of shareholders. The say on pay resolution was supported by a significant majority (93%) of the votes cast on the resolution. |
||
Board Recommendation |
||
The Board of Directors unanimously recommends that shareholders vote FOR the resolution relating to Magna's approach to executive compensation. |
||
Unless otherwise instructed, the Magna officers whose names have been pre-printed on the form of proxy or Voting Instruction Form intend to vote FOR such resolution. |
||
5. Amendment of Articles of Incorporation |
At the Meeting, shareholders will be asked to approve the following special resolution amending Magna's articles to remove the Corporate Constitution: "Resolved as a special resolution that the articles of the corporation be amended to remove the Corporate Constitution contained in Section 10 thereof." A special resolution requires the support of two-thirds of the votes cast at the Meeting. |
12 Meeting Information
Our Corporate Constitution was adopted by shareholders as part of the articles in 1984. At that time, Magna was a controlled company through a dual class share structure and, in that context, the Corporate Constitution served to balance the interests of various stakeholders, including shareholders, employees and management by prescribing their respective rights to participate in our profits. The Corporate Constitution also acted as a restraint on the exercise of voting power by our former controlling shareholder, who had sufficient votes through multiple voting shares to elect the entire board of directors. For example, one of the key features of the Corporate Constitution was a provision which gave minority shareholders the right to separately elect two directors to our Board if we failed to fulfill certain obligations to shareholders. This provision was deleted from the Corporate Constitution when Magna became a widely-held company with a single class of shares in August 2010. In the years which followed the elimination of the dual class share structure, we have adopted multiple corporate governance best practices aimed at enhancing board oversight and direct accountability to shareholders, including a minimum two-thirds board independence requirement, majority voting and say on pay. In light of all of these factors, the Board believes that the Corporate Constitution is no longer necessary as it does not provide relevant or meaningful protections and its removal from our articles will not adversely affect the corporation or the rights of shareholders. The Corporate Constitution contains a dividend policy which requires distribution annually of 10% and, on average over a three-year period not less than 20%, of our after-tax profits. We intend to continue paying a quarterly dividend from our cash flow from operations, with the aim of regularly increasing the dividend consistent with our practice since 2010. The declaration and payment of dividends, including the dividend rate, is subject to the Board's discretion taking into account our cash flow, earnings, capital requirements, financial condition and other relevant factors. One element of the Corporate Constitution that remains relevant is the 10% profit sharing for eligible employees. Employee profit sharing remains a core element of our unique corporate culture and, accordingly, we intend to maintain it as a way of incenting, motivating and rewarding employees for their contribution to our success. Employee profit sharing remains entrenched in our Employee's Charter, a key continuing policy articulating our operating philosophy and approach towards employees. The Employee's Charter is reinforced by our Operational Principles, another continuing policy which articulates core elements of our operating philosophy and culture. Magna's unique culture, including the core principles on which the company's success was built, is not expected to change and will continue to be reflected in the Employee's Charter and Operational Principles. |
||
Board Recommendation |
||
The Board of Directors unanimously recommends that shareholders vote FOR the special resolution approving the amendment of Magna's articles of incorporation to remove the Corporate Constitution contained in Section 10 thereof. |
||
Unless otherwise instructed, the Magna officers whose names have been pre-printed on the form of proxy or Voting Instruction Form intend to vote FOR such special resolution. |
||
Meeting Information 13
6. Adoption of New General By-Laws |
Magna's former general by-law, By-Law No. 1B-92 (the "Former By-Law"), largely dates back to 1992, with minor amendments made in 2007 and 2010. The Former By-law did not reflect a state-of-the-art public company by-law, contained some provisions which reflected the company's prior status as a controlled company and omitted some elements which are advisable for a widely-held public company. Accordingly, Magna's Board adopted a new by-law on March 17, 2016 ("By-Law No. 1"), which is included as an appendix to this Circular, and shareholders are being asked to approve the following resolution at the Meeting: |
|
"Resolved that the repeal of By-Law 1B-92 and the adoption of By-Law No. 1 are hereby ratified and confirmed." |
||
The most significant change reflected in By-Law No. 1 is the inclusion of an advance notice provision relating to nominations of directors by shareholders. This advance notice provision has been drafted to comply with best practices in Canada aimed at: • enabling all shareholders to have sufficient notice regarding the intention of a shareholder to nominate one or more directors at a shareholder meeting; and • not unduly restricting shareholders from exercising their right to nominate directors. |
||
In order for a shareholder's nomination of a director to be valid, notice must generally be given to the company at least 30 days prior to the date of the company's annual shareholder meeting. Where an annual shareholder meeting has been called on less than 50 days' notice, a shareholder's nomination of a director will be valid if the shareholder notifies the company by the close of business on the tenth day following the first public announcement of the meeting. Where the company has called a special meeting, a shareholder's nomination of a director will be valid if the shareholder notifies the company by close of business on the fifteenth day following the first public announcement of the special shareholders' meeting. There is no maximum notice period for a shareholder's nomination of a director. |
||
In addition to the advance notice provision, By-Law No. 1 provides a more complete set of default rules relating to procedural matters than the Former By-Law, including: |
||
• Calling Directors' Meetings — each of the Chair, Chief Executive Officer and any director, or the Secretary on the direction of one of the foregoing, now has the power to call a directors' meeting. The Former By-Law did not permit any director (other than the Chair) to call a directors' meeting, requiring instead a quorum of such directors to call such a meeting. |
||
• Participation in Directors' Meetings by Electronic Means — By-Law No. 1 contains an express provision allowing directors to participate in directors' meetings by electronic means which permit simultaneous/instantaneous communication among participants. |
||
• Voting at Directors' Meetings — By-Law No. 1 expressly states that the Chair does not have a second/casting vote in the event of a deadlock on any matter voted on at a directors' meeting. |
14 Meeting Information
• Delegation to Board Committees — By-Law No. 1 lists specific matters which cannot lawfully be delegated to a committee of the board. |
||
• Issuance of Securities — in contemplation of the future transition away from physical share certificates for registered shareholders, By-Law No. 1 specifically gives the board the authority to provide by resolution that any securities of the company can be represented by uncertificated securities. |
||
• Shareholder Meetings by Electronic Means — similar to the provision allowing for directors' meetings held by electronic means, By-Law No. 1 expressly allows for shareholder meetings to be held by electronic means that permit all participants to adequately communicate with each other. |
||
• More Detailed Provisions Relating to Shareholder Meetings — By-Law No. 1 contains more detailed provisions relating to matters such as the notice period for shareholder meetings, the impact of an accidental omission in giving notice, rights of representatives of corporate shareholders, rights of joint security holders, the use and revocation of proxies, as well as matters relating to shareholder meeting procedure, including votes by show of hands and use of ballots. |
||
• Quorum and Voting at Shareholder Meetings — consistent with current best practices, By-Law No. 1 sets quorum for shareholder meetings at two shareholders representing at least 25% of the issued and outstanding votes eligible to be cast at the meeting. Additionally, in the event of a deadlock on any matter voted at a shareholder meeting, the Chair does not have a second/casting vote. |
||
• Unclaimed Dividends — By-Law No. 1 states that dividends which remain unclaimed two years after the date they were declared will be forfeited. The two-year period is consistent with the current statutory limitation period in Ontario, but represents a change from the six-year period under the Former By-Law, which reflected the former statutory limitation period. |
||
Board Recommendation |
||
The Board of Directors unanimously recommends that shareholders vote FOR the resolution ratifying and confirming the repeal of By-Law 1B-92 and the adoption of By-Law No. 1. |
||
Unless otherwise instructed, the Magna officers whose names have been pre-printed on the form of proxy or Voting Instruction Form intend to vote FOR such resolution. |
Meeting Information 15
Nominees for Election to the Board
Board Skills and Expertise
The CGCNC seeks to recruit candidates who reflect a diversity of skills, experience and perspectives which are relevant to Magna's business. While the specific mix may vary from time to time and alternative categories may be considered in addition to or instead of those below, the following skills and types of experience are generally sought by the CGCNC:
- •
- Accounting/Audit: accounting and audit expertise are valued in order to enable the Board to oversee Management's handling
of
financial and financial reporting matters, including by: critically assessing Magna's financial performance and projections; understanding the company's critical accounting policies, as well as
technical issues relevant to the internal and external audit; and evaluating the robustness of the company's internal controls.
- •
- Automotive: as substantially all of Magna's business is derived from sales within the automotive
industry, the CGCNC seeks
candidates who possess a solid understanding of industry dynamics on a global and regional basis, preferably gained through management or board service with the company's customers or with other
automotive suppliers. Automotive expertise also serves to align the Board with one of Magna's key strategic priorities – achieving World Class Manufacturing
excellence on a consistent basis, globally. From time to time, we may also consider candidates with experience in capital-intensive manufacturing industries, since the experience gained in such
industries is typically applicable to the automotive industry.
- •
- Emerging Markets: the CGCNC values candidates who have a track record of success in markets other than
North America and
Western Europe, since much of our and the automotive industry's growth is forecast to be in such markets. Priority markets include China and India, but the automotive industry continues to grow in
other markets such as Indonesia, Thailand and Turkey, as well as various countries in Eastern Europe.
- •
- Finance/Financial Advisory: while we generally seek to ensure that all candidates have a baseline level
of financial
literacy, we value candidates who have experience in senior financial roles and/or in financial advisory roles. Such experience enhances the Board's oversight of financial performance, assists it in
its assessment of strategic opportunities and risks and allows it to more effectively address issues relevant to capital and capital structure.
- •
- Governance/Board: in light of the competing demands of stakeholders and the increasingly complex
governance environment in
which public companies operate, the CGCNC values candidates who possess a sophisticated understanding of corporate governance practices and norms, and/or board expertise.
- •
- Large Cap Company: while experience with companies of different scale can be valuable, the CGCNC seeks candidates who have board, management and/or other applicable experience with companies that have a market capitalization in excess of $10 billion. Magna's own market capitalization significantly exceeds that threshold and the CGCNC's prioritization of large cap company experience reflects the fact that companies of such size face different challenges and opportunities than small and mid-cap companies.
16 Meeting Information
- •
- Legal/Regulatory/Public Policy: Magna operates in, and is required to comply with, the laws of dozens of countries around
the
world. Candidates who possess an understanding of different legal systems and regulatory perspectives are valued by the CGCNC since such experiences assist the Board in more effectively carrying out
its compliance oversight responsibilities. Additionally, the CGCNC values candidates with experience in relevant areas of government and public policy to support the Board in understanding the
regulatory trends shaping the automotive industry and assessing the company's strategic response to such trends.
- •
- Mergers & Acquisitions ("M&A"): the CGCNC views board-level M&A expertise as
critical to the Board's ability to
effectively fulfill its oversight responsibilities relating to corporate strategy, particularly since Magna intends to pursue strategic M&A opportunities in certain automotive product areas.
- •
- R&D/Innovation/Technology: Magna has a long history of developing and bringing to market innovative
automotive products and
manufacturing techniques which have been significant contributors to the company's historic success. The CGCNC seeks candidates with technological expertise and skill to support the Board in assessing
Magna's efforts to build upon its technological advantages and thus further enhance long-term value. Board-level expertise and skill in technology/innovation also serves to align the Board with one of
Magna's key strategic priorities – innovation.
- •
- Risk Management: the CGCNC seeks candidates with practical expertise in enterprise risk management
frameworks, systems,
processes, tools and techniques, to assist the Board in understanding and assessing the risks and opportunities faced by the company generally, including those inherent in its strategic plan.
- •
- Senior/Executive Leadership: the CGCNC seeks business and other leaders who have demonstrated
leadership, mature judgment,
operating success and an understanding of complex organizations in progressively challenging roles. Such individuals are believed to provide the most effective counsel to Management, as well as
critical oversight on behalf of stakeholders.
- •
- Strategy Development: recognizing the importance of the Board's oversight role with respect to
corporate strategy, the CGCNC
seeks candidates who possess board, senior management and/or other experience in strategy development or analysis.
- •
- Talent Management/Compensation: the CGCNC values candidates with hands-on roles in developing, managing, compensating and motivating employees. Such skills and experience assist the Board in fulfilling its responsibility to ensure that the company maintains effective incentive programs which attract, motivate and retain top talent, while at the same time reinforcing the company's strategic priorities. Talent management and compensation expertise also serve to align the Board with one of Magna's key strategic priorities – leadership development/succession planning.
Meeting Information 17
A skills matrix showing the skills, expertise and qualifications for each of the nominees is set forth below.
| |
|
|
|
|
|
|
|
|
|
|
|
|
|
|
||||||||||||||
|---|---|---|---|---|---|---|---|---|---|---|---|---|---|---|---|---|---|---|---|---|---|---|---|---|---|---|---|---|
| Scott B. Bonham | /*/ | /*/ | /*/ | /*/ | /*/ | /*/ | /*/ | /*/ | /*/ | /*/ | /*/ | /*/ | MBA | |||||||||||||||
| Peter G. Bowie | /*/ | /*/ | /*/ | /*/ | /*/ | /*/ | /*/ | /*/ | /*/ | FCA, MBA | ||||||||||||||||||
| Hon. J. Trevor Eyton | /*/ | /*/ | /*/ | /*/ | /*/ | /*/ | /*/ | /*/ | /*/ | /*/ | JD | |||||||||||||||||
| Lady Barbara Judge | /*/ | /*/ | /*/ | /*/ | /*/ | /*/ | /*/ | /*/ | /*/ | /*/ | /*/ | JD | ||||||||||||||||
| Dr. Kurt J. Lauk | /*/ | /*/ | /*/ | /*/ | /*/ | /*/ | /*/ | /*/ | /*/ | /*/ | /*/ | /*/ | MBA, PhD | |||||||||||||||
| Cynthia A. Niekamp | /*/ | /*/ | /*/ | /*/ | /*/ | /*/ | /*/ | /*/ | /*/ | /*/ | /*/ | MBA | ||||||||||||||||
| Dr. Indira V. Samarasekera | /*/ | /*/ | /*/ | /*/ | /*/ | /*/ | /*/ | PhD, PEng | ||||||||||||||||||||
| Donald J. Walker | /*/ | /*/ | /*/ | /*/ | /*/ | /*/ | /*/ | /*/ | /*/ | /*/ | PEng | |||||||||||||||||
| Lawrence D. Worrall | /*/ | /*/ | /*/ | /*/ | /*/ | /*/ | /*/ | /*/ | CMA | |||||||||||||||||||
| William L. Young | /*/ | /*/ | /*/ | /*/ | /*/ | /*/ | MBA, PEng | |||||||||||||||||||||
Nominee Independence
Nine out of ten, or 90%, of the nominees for election at the Meeting are independent. A summary of the independence determination for each nominee is set forth below:
| NOMINEE NAME |
INDEPENDENT |
NON- INDEPENDENT |
BASIS FOR DETERMINATION |
|||
|---|---|---|---|---|---|---|
| Scott B. Bonham | ü | No material relationship | ||||
| Peter G. Bowie | ü | No material relationship | ||||
| Hon. J. Trevor Eyton | ü | No material relationship | ||||
| Lady Barbara Judge | ü | No material relationship | ||||
| Dr. Kurt J. Lauk | ü | No material relationship | ||||
| Cynthia A. Niekamp | ü | No material relationship | ||||
| Dr. Indira V. Samarasekera | ü | No material relationship | ||||
| Donald J. Walker | ü | Management | ||||
| Lawrence D. Worrall | ü | No material relationship | ||||
| William L. Young | ü | No material relationship | ||||
18 Meeting Information
Nominees' Meeting Attendance
Directors are expected to attend all Board meetings, as well as all meetings of standing Committees on which they serve, and are welcome to attend any other Committee meetings. However, we recognize that scheduling conflicts are unavoidable from time to time, particularly where meetings are called on short notice. Our Board Charter requires Directors to attend a minimum of 75% of regularly scheduled Board and applicable standing Committee meetings, except where an absence is due to medical or other valid reason. The ten nominees standing for re-election at the Meeting achieved 100% attendance at all Board and applicable Committee meetings (in aggregate), as set forth below.
| BOARD | AUDIT(1) | CGCNC(1) | EROC(1) | TOTAL |
||||||||||||||||
| NOMINEE | # | % | # | % | # | % | # | % | # | % | ||||||||||
| Scott B. Bonham | 7/7 | 100 | 6/6 | 100 | – | – | 6/6 | 100 | 19/19 | 100 | ||||||||||
| Peter G. Bowie | 7/7 | 100 | 6/6 | 100 | – | – | – | – | 13/13 | 100 | ||||||||||
| Hon. J. Trevor Eyton | 7/7 | 100 | – | – | 8/8 | 100 | – | – | 15/15 | 100 | ||||||||||
| Lady Barbara Judge | 7/7 | 100 | – | – | – | – | 6/6 | 100 | 13/13 | 100 | ||||||||||
| Dr. Kurt J. Lauk | 7/7 | 100 | 6/6 | 100 | – | – | – | – | 13/13 | 100 | ||||||||||
| Cynthia A. Niekamp | 7/7 | 100 | – | – | – | – | 6/6 | 100 | 13/13 | 100 | ||||||||||
| Dr. Indira V. Samarasekera | 7/7 | 100 | – | – | 8/8 | 100 | – | – | 15/15 | 100 | ||||||||||
| Donald J. Walker | 7/7 | 100 | – | – | – | – | – | – | 7/7 | 100 | ||||||||||
| Lawrence D. Worrall | 7/7 | 100 | 6/6 | 100 | – | – | 6/6 | 100 | 19/19 | 100 | ||||||||||
| William L. Young | 7/7 | 100 | – | – | 8/8 | 100 | – | – | 15/15 | 100 | ||||||||||
Notes:
- 1.
- Attendance figures for Audit, CGCNC and EROC include only those directors who served as members of such committees during 2015.
2015 Annual Meeting Vote Results
Each of the ten nominees standing for re-election received a substantial majority of votes "for" his or her election at our 2015 annual meeting of shareholders, as set forth in the table below.
| 2015 | ||||
| VOTES FOR (%) |
VOTES WITHHELD (%) |
|||
| Scott B. Bonham | 99.5 | 0.5 | ||
| Peter G. Bowie | 99.9 | 0.1 | ||
| Hon. J. Trevor Eyton | 97.8 | 2.2 | ||
| Lady Barbara Judge | 99.9 | 0.1 | ||
| Dr. Kurt J. Lauk | 99.5 | 0.5 | ||
| Cynthia A. Niekamp | 99.9 | 0.1 | ||
| Dr. Indira V. Samarasekera | 99.9 | 0.1 | ||
| Donald J. Walker | 99.9 | 0.1 | ||
| Lawrence D. Worrall | 99.7 | 0.3 | ||
| William L. Young | 99.3 | 0.7 | ||
Meeting Information 19
Nominees' Magna Equity Ownership
We believe it is important that each Independent Director be economically aligned with shareholders. We try to achieve such alignment in two principal ways:
- •
- Deferred Share Units ("DSUs"): 60% of the Independent Director annual retainer is paid in the form of DSUs. DSUs are
notional
units, the value of which is tied to the market value of our Common Shares. The value represented by an Independent Director's DSUs can only be realized following his or her retirement from the Board
and remains "at risk" until that time.
- •
- Equity Maintenance Requirement: Each Independent Director other than the Chairman is required to hold a minimum of $750,000 of Magna Common Shares and/or DSUs within five years of joining the Board. The Chairman is required to hold a minimum of $1,500,000 of Magna Common Shares and/or DSUs within three years of becoming Chairman.
Each of Magna's nominees is in compliance with the minimum equity maintenance requirement and many exceed it. New directors are entitled to a five year period in which to accumulate the minimum required value of Common Shares and/or DSUs.
The ten nominees held Magna Common Shares and/or DSUs with the following total value, as of December 31, 2015:
| |
COMMON SHARES |
DSUS |
TOTAL EQUITY "AT RISK"(1) ($) |
EQUITY MAINTENANCE REQUIREMENT |
||||
|---|---|---|---|---|---|---|---|---|
| Scott B. Bonham | – | 32,778 | 1,329,000 | Exceeds | ||||
| Peter G. Bowie | 7,000 | 25,388 | 1,314,000 | Exceeds | ||||
| Hon. J. Trevor Eyton | – | 26,355 | 1,069,000 | Exceeds | ||||
| Lady Barbara Judge | 8,000 | 101,814 | 4,454,000 | Exceeds | ||||
| Dr. Kurt J. Lauk | 110 | 19,835 | 809,000 | Exceeds | ||||
| Cynthia A. Niekamp | 1,000 | 2,905 | 158,000 | Complies | ||||
| Dr. Indira V. Samarasekera | – | 8,310 | 337,000 | Complies | ||||
| Donald J. Walker | 1,400,210 | 244,305 | (2) | 66,702,000 | Exceeds | |||
| Lawrence D. Worrall | 13,628 | 46,535 | 2,440,000 | Exceeds | ||||
| William L. Young | 1,860 | 59,708 | 2,497,000 | Exceeds | ||||
Notes:
- 1.
- In
calculating the value of total equity at risk, we have used the closing price of Magna Common Shares on NYSE on December 31, 2015.
- 2.
- Represents Mr. Walker's RSUs, as discussed further in the Compensation Discussion & Analysis section of this Circular.
20 Meeting Information
Biographies of 2016 Nominees
| Independent | ||

|
Scott B. Bonham California, U.S.A. Age: 54 Director Since: May 10, 2012 |
Mr. Bonham brings to the Board a technology/innovation-centred perspective which reflects his deep understanding of the long-term value creation potential possessed by some of the world's most innovative companies.
Mr. Bonham is the Co-Founder and Partner of The Fueling Station, a real estate management company that manages properties serving Canadian entrepreneurs and start-up companies. He co-founded GGV Capital, an expansion stage venture capital firm with investments in the U.S. and China, where he served as a Venture Partner (2011-2015) and a Partner (2000-2011). Prior to co-founding GGV in 2000, Mr. Bonham served as Vice-President of the Capital Group of Companies, where he managed technology investments across several mutual funds (1996-2000). Mr. Bonham also previously served in various marketing roles at Silicon Graphics (1992-1996), as a manufacturing and information systems strategy consultant at Booz, Allen & Hamilton (1989-1992) and systems engineer and maintenance foreman at General Motors of Canada. Mr. Bonham has previously served on a number of private and public company boards and audit committees, including Hurray! Holding Co. Ltd., the shares of which were quoted on the Nasdaq National Market. He is currently a board member of the C100, an association that connects Canadian entrepreneurs and companies with its Silicon Valley network. Mr. Bonham has a B.Sc in electrical engineering (Queen's) and an MBA (Harvard).
Mr. Bonham serves as a director of the Bank of Nova Scotia, which provides routine banking services to Magna. Magna's fees to the Bank of Nova Scotia in 2015 amounted to approximately $2.5 million, in relation to the bank's total 2015 revenues of over $24 billion. In the event of a conflict of interest on any matter, Mr. Bonham will not participate in the portion of the meeting at which the matter is discussed, nor in any Board decision on the matter. No such issues arose in 2015.
Other Public Company Boards: Bank of Nova Scotia
| Independent | ||

|
Peter G. Bowie Ontario, Canada Age: 69 Director Since: May 10, 2012 |
Mr. Bowie brings to the Board financial expertise, a dedication to Audit Committee excellence, a strong understanding of strategy and risk, as well as detailed insight of political and economic dynamics within China.
Mr. Bowie is a corporate director who most recently served as the Chief Executive of Deloitte China from 2003 to 2008, as well as senior partner and a member of the board and the management committee of Deloitte China until his retirement from the firm in 2010. Mr. Bowie was previously Chairman of Deloitte Canada (1998-2000), a member of the firm's management committee and a member of the board and governance committees of Deloitte International. He is a past member of the board of the Asian Corporate Governance Association and has served on a variety of boards in the private and non-governmental organization sectors. Mr. Bowie has a B.Comm (St. Mary's), as well as an MBA (Ottawa) and has received an honorary doctorate (Ottawa). Mr. Bowie completed the Advanced Management Program (Harvard) and is a Fellow of the Institute of Chartered Accountants of Ontario, as well as the Australian Institute of Corporate Directors.
Other Public Company Boards: China COSCO Holding Company Ltd. (Strategic Development (Chair); Risk)
Meeting Information 21
| Independent | ||

|
Hon. J. Trevor Eyton Ontario, Canada Age: 81 Director Since: May 6, 2010 |
Mr. Eyton brings to the Board broad-based counsel which reflects his extensive legal expertise, business acumen and "blue-chip" board experience. He also brings a balanced perspective reflecting a strong appreciation for issues from the perspectives of both senior management and board.
Mr. Eyton is a corporate director who served as a Member of the Senate of Canada from 1990 until his retirement in 2009. He is highly respected for his lengthy service with Brascan Limited, now known as Brookfield Asset Management, a Canadian-based, global asset manager focused on property, renewable power, infrastructure assets and private equity. Mr. Eyton served as Brascan's President and Chief Executive Officer (1979 to 1991), as well as its Chairman and Senior Chairman (to 1997) and as a director (to 2014). Prior to his service with Brascan, Mr. Eyton was a partner with the law firm Torys and has served on numerous public and private company boards, including that of General Motors Canada. Mr. Eyton has been appointed an Officer of the Order of Canada and Queen's Counsel for Ontario. He has a B.A. (Toronto), as well as a J.D. (Toronto) and has received two honorary doctorates of law (Waterloo; King's College (Dalhousie)).
Other Public Company Boards: Silver Bear Resources Inc. (Audit; Compensation; Governance & Environmental); LeadFX (Compensation (Chair)); Cancana Resources Corp. (Audit, Compensation & Governance); and Brookfield Real Estate Services Inc. (Compensation and Governance)
| Independent | ||

|
Lady Barbara Judge London, England Age: 69 Director Since: September 20, 2007 |
Lady Judge brings to the Board a broad-based global business perspective, complemented by significant legal and regulatory expertise, as well as practical corporate governance and risk management experience. Lady Judge's risk awareness and understanding of risk management processes, drawn in part from her experience in the nuclear industry and as a securities regulator, have been particularly valuable to the EROC, which she chairs.
Lady Judge is a corporate director who previously enjoyed a successful international career as a law firm partner, senior executive, chairman and non-executive director in both the private and public sectors and is highly regarded for her governance expertise. In 2015, Lady Judge assumed the role of National Chair of the Institute of Directors (U.K.), a representative organization for directors with approximately 38,000 members in the U.K. and elsewhere. Lady Judge previously served as Chairman of the Board of the United Kingdom Atomic Energy Authority (from 2004 to 2010), prior to which she was a Board member (since 2002). In addition, Lady Judge formerly served as a Commissioner of the U.S. Securities Exchange Commission and Deputy Chairman of the U.K. Financial Reporting Council. In 2010, she was appointed a Commander of the Order of the British Empire for her contributions to the financial services and nuclear industries. Lady Judge has a B.A. (U. Penn) and a J.D. (NYU School of Law).
Lady Judge serves as the non-executive chair of the U.K. Pension Protection Fund (the "PPF"), but will retire in June 2016. In 2015, Magna purchased a U.K.-based automotive supplier, Stadco Automotive Limited, the largest shareholder of which was the PPF. Lady Judge declared her interest, recused herself from the discussion of the transaction and abstained from approval of the transaction.
Other Public Company Boards*: Portmeirion Group plc (Audit; Compensation); Lixil Group Corporation
- *
- Lady Judge also serves on the Board of Bekaert NV, from which she will retire on May 4, 2016.
22 Meeting Information
| Independent | ||

|
Dr. Kurt J. Lauk Baden-Württemberg, Germany Age: 69 Director Since: May 4, 2011 |
Dr. Lauk brings to the Board valuable insights regarding the European automotive industry and the global activities of European OEMs and suppliers, together with a focus on long-term strategy and a strong understanding of technology/innovation both within and outside the automotive industry. Dr. Lauk's analytical perspective also draws upon his significant expertise in global political, economic and strategic affairs.
Dr. Lauk is the co-founder and President of Globe CP GmbH, a private investment firm. He possesses extensive European automotive industry experience, primarily through his positions as Member of the Board of Management and Head of World Wide Commercial Vehicles Division of Daimler Chrysler (1996-1999), as well as Deputy Chief Executive Officer and Chief Financial Officer (with responsibility for finance, controlling and marketing) of Audi AG (1989-1992). Dr. Lauk has other extensive senior management experience, including as Chief Financial Officer and Controller of Veba AG (now known as E.On AG) (1992-1996), Chief Executive Officer of Zinser Textil Machinery GmbH (1984-1989) and as a Partner and Vice-President of the German practice of Boston Consulting Group (1978-1984). Dr. Lauk served as a Member of European Parliament (2004-2009), including as a Member of the Economic and Monetary Affairs Committee and Deputy Member of the Foreign and Security Affairs Committee. He currently serves as a Trustee of the International Institute for Strategic Studies in London and is an honorary professor with a chair for international studies at the prestigious European Business School in Reichartshausen, Germany. Dr. Lauk possesses both a PhD in international politics (Kiel), as well as an MBA (Stanford).
Other Public Company Boards*: Solera Holdings Inc. (Audit; Corporate Governance)
- *
- Dr. Lauk was a director of Papierfabrik Scheuffelen GmbH, a private company, when it filed for bankruptcy protection under German law on July 17, 2008.
| Independent | ||

|
Cynthia A. Niekamp Michigan, U.S.A. Age: 56 Director Since: May 8, 2014 |
Ms. Niekamp brings to the Board extensive senior management experience within the automotive parts industry, including a highly technical understanding of operational matters derived from her engineering background.
Ms. Niekamp is a corporate director who most recently served as the Senior Vice-President, Automotive Coatings, of PPG Industries, Inc. She possesses over 30 years of automotive and other industrial manufacturing experience through her prior roles at PPG (2009 to 2016); BorgWarner, where she served as President & General Manager, BorgWarner Torq Transfer Systems (2004 to 2008); MeadWestvaco Corporation, where she served in various roles (1995 to 2004), including Senior Vice-President & Chief Financial Officer (2003 to 2004) and President, Special Paper Division (1998 to 2002); TRW (1990 to 1995); and General Motors (1983 to 1990). Ms. Niekamp currently serves as a Trustee of Kettering University and previously served on the boards of Rockwood Holdings, Delphi Corp. and Cooper Tire and Rubber, as well as Berkshire Applied Technology Council. Ms. Niekamp has a B.S. in industrial engineering (Purdue), as well as an MBA (Harvard).
During 2015, Ms. Niekamp was employed by PPG Industries, which is a supplier to Magna with global sales to the company of approximately $75 million on consolidated sales of over $15 billion. No conflicts of interest arose during 2015 in respect of Ms. Niekamp's role as an officer of PPG and service as a director of Magna.
Other Public Company Boards: None
Meeting Information 23
| Independent | ||

|
Dr. Indira V. Samarasekera British Columbia, Canada Age: 63 Director Since: May 8, 2014 |
Dr. Samarasekera brings to the Board a proven record of technical expertise, demonstrated leadership success, tangible success in building international relationships and a long-standing commitment to R&D/innovation, which is one of the company's top priorities.
Dr. Samarasekera is a corporate director and Senior Advisor at Bennett Jones, LLP, who most recently served as the President and Vice-Chancellor of the University of Alberta (2005 to 2015). Dr. Samarasekera is internationally recognized as a leading metallurgical engineer, including for her work on steel process engineering for which she was appointed an Officer of the Order of Canada. Prior to becoming the President of the University of Alberta, Dr. Samarasekera was Vice-President Research and held the Dofasco Chair in Advanced Steel Processing at the University of British Columbia (1996 to 2001). Among other things, Dr. Samarasekera formerly served as Chair of the Worldwide Universities Network and was previously a member of Canada's Science, Technology and Innovation Council as well as Canada's Global Commerce Strategy. Dr. Samarasekera has an M.Sc in mechanical engineering (California), as well as a PhD in metallurgical engineering (British Columbia) and is a Professional Engineer (P.Eng) who has been elected as a Foreign Associate of the National Academy of Engineering in the U.S.
Dr. Samarasekera serves as a director at the Bank of Nova Scotia, which provides routine banking services to Magna. Magna's fees to the Bank of Nova Scotia in 2015 amounted to approximately $2.5 million, in relation to the bank's total 2015 revenues of over $24 billion. In the event of a potential conflict of interest on any matter, Dr. Samarasekera will not participate in the portion of the meeting at which the matter is discussed, nor in any Board decision on the matter. No such issues arose in 2015.
Other Public Company Boards: Bank of Nova Scotia (Human Resources; Corporate Governance); TransCanada Corporation
| Management | ||

|
Donald J. Walker Ontario, Canada Age: 59 Director Since: November 7, 2005 |
Mr. Walker, Magna's Chief Executive Officer, is Management's sole representative on the Board. He brings extensive knowledge and understanding of the automotive industry, as well as the company's culture, operations, key personnel, customers, suppliers and the complex drivers of its success. He has demonstrated a commitment to transparent and effective leadership, responsiveness to the Board and integrity in all aspects of the company's business, while pushing the organization to reach its full potential through World Class Manufacturing, innovation and leadership development. Mr. Walker continues to actively shape Magna's strategic vision and mission in conjunction with the Board, with an unwavering focus on excellence in execution/implementation and legal/regulatory compliance, as well as prudence in stewardship over the company's assets, employees, reputation and value. Mr. Walker was Canada's 2014 Outstanding CEO of the Year™ and named to Fortune Magazine's Businessperson of the Year list in 2015.
Mr. Walker previously served as Magna's Co-Chief Executive Officer (2005-2010) and President and Chief Executive Officer (1994-2001). He was formerly the President, Chief Executive Officer and Chairman of Intier Automotive Inc. (2001-2005), one of Magna's former "spinco" public subsidiaries. Prior to joining Magna in 1987, Mr. Walker spent seven years at General Motors in various engineering and manufacturing positions. He is currently the Chair (since October 2011, previously Co-Chair since 2002), of the Canadian Automotive Partnership Council (CAPC) with the Canadian federal and provincial governments, which serves to identify both short- and long-term priorities to help ensure the future health of the automotive industry in Canada. Mr. Walker is also the past Chairman of the Automotive Parts Manufacturers Association (APMA). Mr. Walker is a professional engineer with a B.Sc in mechanical engineering (Waterloo).
Other Public Company Boards: None
24 Meeting Information
| Independent | ||

|
Lawrence D. Worrall Ontario, Canada Age: 72 Director Since: November 7, 2005 |
Mr. Worrall brings to the Board extensive automotive industry experience, together with a dedication to Audit Committee excellence and a commitment to the integrity of Magna's financial statements. As Chairman of Magna's Audit Committee, Mr. Worrall worked extensively with representatives of Deloitte and Management to help maximize the benefits to the Board, Audit Committee and the company's shareholders arising from the rotation of auditors in 2014.
Mr. Worrall is a corporate director and certified management accountant who formerly served as the Vice-President, Purchasing, Strategic Planning and Operations, as well as a Director of General Motors of Canada Limited (1995-2000). In his capacity as an officer of GM Canada, Mr. Worrall had responsibility for a number of significant matters, including: purchasing, logistics, GM Canada's manufacturing facilities, forward product planning and the execution of the manufacturing plan for all plants.
Other Public Company Boards: None
| Independent | ||

|
William L. Young Massachusetts, U.S.A. Age: 61 Director Since: May 4, 2011 |
Mr. Young, the Chairman of the Board (since 2012), brings to the Board a highly effective consensus-building leadership style anchored by strong business acumen developed across a broad range of businesses and industries. He has been highly effective in cultivating a constructive but independent relationship with Management, as well as an open, constructive dialogue with shareholders, potential investors, shareholder representative organizations and others in the corporate governance community. In his capacity as Chairman of the CGCNC, Mr. Young has been active in engagement with shareholders and instrumental in the evolution of Magna's unique compensation structure in a manner which reasonably preserves its core elements while responsively addressing constructive feedback received from shareholders and others.
Mr. Young is a co-founder and partner of Monitor Clipper Partners, a private equity firm established in 1998. Through his role at Monitor Clipper Partners, together with roles as founding partner of Westbourne Management Group (since 1988) and a partner in the European practice of Bain & Company (1981-1988), Mr. Young possesses significant operational experience, as well as extensive mergers and acquisitions experience. He is Chair Emeritus of the Board of Trustees of Queen's University (Kingston, Ontario) (which he chaired from 2006 to 2012) and has significant private company board and board leadership experience over the last 20 years, including a number of European and U.S.-based companies. Mr. Young has a B.Sc in chemical engineering (Queen's) and an MBA (Harvard).
Other Public Company Boards*: None
- *
- Mr. Young was a director of American Fiber & Yarns and Recycled Paper Greetings, both of which were private companies, when they filed voluntary petitions for bankruptcy protection under Chapter 11 of the U.S. Bankruptcy Code on September 23, 2008 and January 2, 2009, respectively.
Meeting Information 25
Director Compensation
Objectives of Director Compensation
We have structured the compensation for our Independent Directors with the aim of attracting and retaining skilled independent directors and aligning their interests with the interests of our long-term shareholders. To accomplish these objectives, we believe that such compensation must be competitive with that paid by our S&P/TSX60 peer companies, as well as the global automotive and industrial peers in our executive compensation peer group. Additionally, we believe that the majority of such compensation must be deferred until retirement, thus tying the redemption value to the market value of our Common Shares and placing it "at risk" to align the interests of Independent Directors with those of shareholders. Management directors do not receive any compensation for serving as directors.
Compensation Structure
We compensate Independent Directors through a combination of:
- •
- Annual Retainer: Since 2008, this retainer has been fixed at $150,000, of which $90,000 (60%) is automatically deferred
until
retirement in the form of DSUs and $60,000 (40%) is paid in cash. In addition to the portion automatically deferred in the form of DSUs, Independent Directors may defer up to 100% of their cash
compensation in the form of DSUs.
- •
- Board Chair Retainer: The Chair is paid a flat annual retainer of $500,000 for all work performed in
any capacity other than
as a special committee chair. Of such amount, $300,000 (60%) is automatically deferred in the form of DSUs and $200,000 (40%) is paid in cash, subject to the Chair's election to defer up to 100% of
his cash compensation in the form of DSUs.
- •
- Committee Chair and Committee Member Retainers: In recognition of the additional workload of our
Committee Chairs and
Committee members, additional retainers are paid to each Independent Director acting in any such capacity. These retainers are set at $25,000 for each standing Board Committee. In the case of special
committees which may be formed from time to time, the retainer is set at $25,000, unless otherwise determined by the Board. Committee Chair retainers are payable in cash, subject to an Independent
Director's election to defer up to 100% of his or her cash compensation in the form of DSUs.
- •
- Meeting and Work Fees: Meeting and work fees are intended to compensate Independent Directors based on their respective contributions of time and effort to Magna matters. The amounts of these fees are listed in the fee schedule below and are payable in cash, subject to an Independent Director's election to defer up to 100% of his or her cash compensation in the form of DSUs.
The CGCNC has responsibility for reviewing Independent Director compensation and typically reviews it approximately every two years. When last reviewed in 2014, the CGCNC engaged its independent compensation advisor, Hugessen Consulting, to review and benchmark Magna's compensation for Independent Directors against two peer groups – one consisting of large capitalization companies in the S&P/TSX60 index and the other consisting of the global automotive and industrial peers in Magna's executive compensation peer group. Hugessen reviewed both the structure of Magna's director compensation program and actual compensation earned against the two peer groups. Its analysis found that while director compensation levels in the industry peer group were
26 Meeting Information
higher than those of the S&P/TSX60 peer group, Magna fell within the competitive norms of both peer groups. Hugessen also noted that Magna's Independent Directors had a greater proportion of their compensation paid in equity (DSUs) and they were subject to more stringent equity maintenance requirements than their peers. Based on Hugessen's review, the CGCNC kept Magna's Independent Director compensation unchanged.
The current schedule of retainers and fees payable to our Independent Directors is set forth below.
| RETAINER/FEE TYPE |
AMOUNT ($) |
||
|---|---|---|---|
| Comprehensive Board Chair annual retainer (minimum 60% DSUs; maximum 40% cash) | 500,000 | ||
| Independent Director annual retainer (minimum 60% DSUs; maximum 40% cash) | 150,000 | ||
| Committee member annual retainer | 25,000 | ||
| Additional Committee Chair annual retainer | |||
| Audit | 25,000 | ||
| CGCNC | 25,000 | ||
| EROC | 25,000 | ||
| Special Committees (unless otherwise determined by the Board) | 25,000 | ||
| Per meeting fee | 2,000 | ||
| Written resolution | 400 | ||
| Additional services (per day) | 4,000 | ||
| Travel days (per day) | 4,000 | ||
2015 Independent Directors' Compensation
The following table sets forth a summary of the compensation earned by all individuals who served as Independent Directors during the year ended December 31, 2015.
| FEES EARNED(1) |
SHARE- BASED AWARDS(2) |
||||||||||||||||||
| NAME | ($) | % OF FEES |
($) | % OF FEES |
OPTION- BASED AWARDS ($) |
NON-EQUITY INCENTIVE PLAN COMPENSATION ($) |
PENSION VALUE ($) |
ALL OTHER(3) ($) |
TOTAL ($) |
||||||||||
| Scott B. Bonham | NIL | – | 394,000 | 100% | NIL | NIL | NIL | NIL | 394,000 | (3) | |||||||||
| Peter G. Bowie | NIL | – | 219,000 | 100% | NIL | NIL | NIL | NIL | 219,000 | ||||||||||
| Hon. J. Trevor Eyton | 66,000 | 30% | 156,000 | 70% | NIL | NIL | NIL | NIL | 222,000 | ||||||||||
| V. Peter Harder | NIL | – | 276,000 | 100% | NIL | NIL | NIL | NIL | 276,000 | ||||||||||
| Lady Barbara Judge | NIL | – | 277,000 | 100% | NIL | NIL | NIL | NIL | 277,000 | ||||||||||
| Dr. Kurt J. Lauk | 43,000 | 16% | 218,000 | 84% | NIL | NIL | NIL | NIL | 261,000 | ||||||||||
| Cynthia A. Niekamp | 137,000 | 60% | 90,000 | 40% | NIL | NIL | NIL | NIL | 227,000 | ||||||||||
| Dr. Indira V. Samarasekara | – | – | 261,000 | 100% | NIL | NIL | NIL | NIL | 261,000 | ||||||||||
| Lawrence D. Worrall | 191,000 | 68% | 90,000 | 32% | NIL | NIL | NIL | NIL | 281,000 | ||||||||||
| William L. Young | 200,000 | 40% | 300,000 | 60% | NIL | NIL | NIL | NIL | 500,000 | ||||||||||
Notes:
- 1.
- Consists
of all retainers and fees paid to the director in cash. NIL indicates that 100% of the retainers and fees earned were deferred in the form of DSUs.
- 2.
- Consists
of retainers and fees deferred in the form of DSUs pursuant to the DSU Plan (as defined under "Deferred Share Units").
- 3.
- In addition to performing his duties on two Committees, Mr. Bonham has actively supported the Board's objective of enhancing Magna's approach to innovation. This has included introducing members of Management to potential product and technology partners, investee companies and others, globally. Accordingly, Mr. Bonham's director compensation includes incremental work and travel days, resulting in higher total 2015 compensation than the average of his fellow Independent Directors.
Meeting Information 27
Deferred Share Units
Mandatory Deferral Creates Alignment With Shareholders
We maintain a Non-Employee Director Share-Based Compensation Plan (the "DSU Plan") which governs the retainers and fees that are deferred in the form of DSUs. In addition to the 60% of the annual retainer that is automatically deferred, each Independent Director may annually elect to defer up to 100% (in increments of 25%) of his or her total annual cash compensation from Magna (including Board and Committee retainers, meeting attendance fees, work and travel day payments and written resolution fees). All DSUs are fully vested on the date allocated to an Independent Director under the DSU Plan. Amounts deferred under the DSU Plan cannot be redeemed until an Independent Director's retirement from the Board. The mandatory deferral until retirement aims to align the interests of Independent Directors with those of shareholders.
DSU Value is "At Risk"
DSUs are notional stock units. The value of a DSU increases or decreases in relation to the NYSE market price of one Magna Common Share and dividend equivalents are credited in the form of additional DSUs at the same times and in the same amounts as dividends that are declared and paid on our Common Shares. Upon an Independent Director's retirement from the Board, we will deliver Magna Common Shares equal to the number of whole DSUs credited to the Independent Director in satisfaction of the redemption value of the DSUs.
Director Stock Options
We previously granted stock options to Independent Directors, with the last such grant having been made in May 2010. We amended and restated our 2009 Stock Option Plan in 2013 to, among other things, eliminate Independent Directors as eligible participants for future awards under the plan. A total of 20,000 previously granted options are fully vested, remain unexercised and will expire in May 2017 if not exercised prior to the expiry date.
Outstanding Option-Based & Share-Based Awards
Outstanding option-based and share-based awards (DSUs) for each of our Independent Directors as of December 31, 2015 were as follows:
| OPTION-BASED AWARDS | SHARE-BASED AWARDS | |||||||||||||
| NAME |
NUMBER OF SECURITIES UNDERLYING UNEXERCISED OPTIONS (#) |
OPTION EXERCISE PRICE (C$) |
OPTION EXPIRATION DATE (MM/DD/YY) |
VALUE OF UNEXERCISED IN-THE- MONEY OPTIONS(1) ($) |
NUMBER OF SHARES OR UNITS THAT HAVE NOT VESTED (#) |
MARKET OR PAYOUT VALUE OF SHARE- BASED AWARDS THAT HAVE NOT VESTED ($) |
MARKET OR PAYOUT VALUE OF VESTED SHARE-BASED AWARDS NOT PAID OUT OR DISTRIBUTED(2) ($) |
|||||||
| Scott B. Bonham | NIL | NIL | NIL | NIL | NIL | NIL | 1,329,000 | |||||||
| Peter G. Bowie | NIL | NIL | NIL | NIL | NIL | NIL | 1,030,000 | |||||||
| Hon. J. Trevor Eyton | NIL | NIL | NIL | NIL | NIL | NIL | 1,069,000 | |||||||
| V. Peter Harder | NIL | NIL | NIL | NIL | NIL | NIL | 1,178,000 | |||||||
| Lady Barbara Judge | 20,000 | 17.99 | 05/09/17 | 551,000 | NIL | NIL | 4,130,000 | |||||||
| Dr. Kurt J. Lauk | NIL | NIL | NIL | NIL | NIL | NIL | 805,000 | |||||||
| Cynthia A. Niekamp | NIL | NIL | NIL | NIL | NIL | NIL | 118,000 | |||||||
| Dr. Indira V. Samarasekera | NIL | NIL | NIL | NIL | NIL | NIL | 337,000 | |||||||
| Lawrence D. Worrall | NIL | NIL | NIL | NIL | NIL | NIL | 1,887,000 | |||||||
| William L. Young | NIL | NIL | NIL | NIL | NIL | NIL | 2,422,000 | |||||||
Notes:
- 1.
- Determined
using the closing price of Magna Common Shares on the TSX on December 31, 2015 and the BoC noon spot rate on such date, since these options are denominated
in C$.
- 2.
- Represents the value of Independent Directors' DSUs based on the closing price of Magna Common Shares on the NYSE on December 31, 2015.
28 Meeting Information
Incentive Plan-Awards – Value Vested During the Year
The values of option-based and share-based awards (DSUs) which vested in the year ended December 31, 2015 are set forth below in respect of each of our Independent Directors:
| NAME |
OPTION-BASED AWARDS – VALUE VESTED DURING THE YEAR ($) |
SHARE-BASED AWARDS – VALUE VESTED DURING THE YEAR(1) ($) |
NON-EQUITY INCENTIVE PLAN COMPENSATION – VALUE EARNED DURING THE YEAR ($) |
|||
|---|---|---|---|---|---|---|
| Scott B. Bonham | NIL | 419,000 | NIL | |||
| Peter G. Bowie | NIL | 239,000 | NIL | |||
| Hon. J. Trevor Eyton | NIL | 175,000 | NIL | |||
| V. Peter Harder | NIL | 299,000 | NIL | |||
| Lady Barbara Judge | NIL | 364,000 | NIL | |||
| Dr. Kurt J. Lauk | NIL | 231,000 | NIL | |||
| Cynthia A. Niekamp | NIL | 92,000 | NIL | |||
| Dr. Indira V. Samarasekera | NIL | 265,000 | NIL | |||
| Lawrence D. Worrall | NIL | 125,000 | NIL | |||
| William L. Young | NIL | 343,000 | NIL |
|||
Note:
- 1.
- Represents the aggregate grant date value of retainers and fees deferred in the form of DSUs in 2015, together with dividends credited in the form of additional DSUs on Independent Directors' aggregate DSU balance, which includes DSUs granted in prior years.
Trading Blackouts and Restriction on Hedging Magna Securities
Trading Blackouts
Directors are subject to the terms of our Insider Trading and Reporting Policy and Code of Conduct & Ethics, both of which restrict directors from trading in Magna securities while they have knowledge of material, non-public information. One way in which we enforce trading restrictions is by imposing trading "blackouts" on directors for specified periods prior to the release of our financial statements and as required in connection with material acquisitions, divestitures or other transactions. The regular quarterly trading blackouts commence at 11:59 p.m. on the last day of each fiscal quarter and end 48 hours after the public release of our quarterly financial statements. Special trading blackouts related to material transactions extend to 48 hours after the public disclosure of the material transaction or other conclusion of the transaction.
Anti-Hedging Restrictions
Directors are not permitted to engage in activities which would enable them to improperly profit from changes in our stock price or reduce their economic exposure to a decrease in our stock price. Prohibited activities include "puts", "collars", equity swaps, hedges, derivative transactions and any transaction aimed at limiting a director's exposure to a loss or risk of loss in the value of the Magna securities which he or she holds.
Meeting Information 29
Corporate Governance Overview
Magna believes that strong corporate governance practices are essential to fostering stakeholder trust and confidence, management accountability and long-term shareholder value. Since 2010, Magna has embarked on a program of corporate governance renewal which has been well-received by shareholders and recognized in the corporate governance community as well as the media. We believe that our current corporate governance practices reflect virtually all corporate governance best practices recognized in Canada and the significant improvement in third-party corporate governance rankings and ratings of our governance evidences this. Nevertheless, we will continue to monitor and, where appropriate, adapt our practices as corporate governance practices in Canada continue to evolve.
Governance Regulation
Magna's Common Shares are listed on the TSX (stock symbol: MG) and the NYSE (stock symbol: MGA). In addition to being subject to regulation by these stock exchanges, we are subject to securities and corporate governance regulation by the Canadian Securities Administrators ("CSA"), including the Ontario Securities Commission, which is Magna's primary securities regulator. Magna is also regulated by the United States Securities and Exchange Commission ("SEC") as a "foreign private issuer".
We meet or exceed all of the guidelines established by the CSA in National Policy 58-201 – Corporate Governance Guidelines. Additionally, although we are not required to comply with most of NYSE's Corporate Governance Standards, our practices do not differ significantly from them. Any such differences are discussed in the "Statement of Significant Governance Differences (NYSE)" which can be found on our website (www.magna.com) under "Corporate Governance".
Magna also monitors the voting policies, corporate governance guidelines and recommended best practices of our largest institutional shareholders, shareholder representative organizations, such as the Canadian Coalition for Good Governance, as well as proxy advisory firms, such as Institutional Shareholder Services and Glass Lewis & Co.
Approach to Corporate Governance
Board's Stewardship Role
The Board is responsible for the overall stewardship of Magna. To this end, the Board: supervises the management of the business and affairs of Magna in accordance with the legal requirements set out in the Business Corporations Act (Ontario) ("OBCA"), as well as other applicable law; and, jointly with Management, seeks to create long-term shareholder value. The Board's stewardship role, specific responsibilities, compositional requirements and various other matters are set forth in the Board Charter, which can be found on our website (www.magna.com) under "Corporate Governance".
Consistent with the standard of care for directors under the OBCA, each director on the Board seeks to act honestly and in good faith with a view to the best interests of the corporation and to exercise the care, diligence and skill that a reasonably prudent person would exercise in comparable circumstances. The standard of care under Ontario corporate law differs from that of some other common law jurisdictions, by requiring directors to act in the "best interests of the corporation" as opposed to the "best interests of shareholders". This distinction effectively recognizes that while individual shareholders may have conflicting interests, investment intents and
30 Corporate Governance
investing horizons, the stewards of a corporation must act with a view to the interests of the corporation as a whole. Consistent with case law developed under the OBCA and equivalent federal and provincial corporate statutes in Canada, Magna's Board seeks to consider and balance the impact of its decisions on its affected stakeholders, including shareholders, other security holders and employees.
Board Charter
Our corporate governance framework is set forth in our Board Charter, which has been filed on SEDAR (www.sedar.com) and is available on our website (www.magna.com) under "Corporate Governance". The Board Charter articulates the stewardship role mentioned above and identifies specific responsibilities to be fulfilled by the Board, including:
- •
- Corporate Culture and Approach to Corporate Governance: Magna maintains a unique entrepreneurial corporate culture which we
believe has been critical to our past success and expect will be critical to our future success. The Board oversees and reinforces that culture and Magna's overall approach to corporate governance,
including by determining the specific policies and practices which the Board believes to be in the best interests of the company. The Board has delegated to the CGCNC the responsibility for making
recommendations with respect to corporate governance matters.
- •
- Oversight of Executive Management: The Board selects our Chief Executive Officer and provides oversight
and advice to the
Chief Executive Officer regarding other members of the executive management team. Additionally, the Board is responsible for satisfying itself as to the integrity of each member of Executive
Management and the creation by the Executive Management team of a culture of integrity and ethical business conduct throughout the company.
- •
- Executive Compensation: The Board seeks to ensure that our system of executive compensation is
effective in attracting,
retaining and motivating skilled executives to responsibly achieve the long-term objectives established through the company's strategic planning process. In fulfilling its responsibilities, the Board
considers the policies and practices which have been proven effective over Magna's history, general trends and developments in executive compensation, the advice of the Board's independent advisors,
as well as feedback received from shareholders and investors through the company's annual advisory vote on executive compensation and shareholder engagement efforts. The Board has delegated to the
CGCNC the responsibility for making recommendations on executive compensation matters.
- •
- Succession Planning: The Board satisfies itself that our Chief Executive Officer has developed
appropriate succession plans
identifying potential future candidates for his own position, as well as the positions of other members of Executive Management, management of Magna's Operating Groups and other key positions in the
company. In fulfilling these responsibilities, the Board aims to:
- •
- enable
itself to promptly address an unplanned succession event involving the Chief Executive Officer;
- •
- satisfy
itself that Executive Management maintains robust and effective talent management practices to identify, reward, retain and promote high-performing
employees; and
- •
- familiarize itself with and oversee the development of such employees.
The Board receives regular updates on Magna's leadership development and succession planning activities, from our Chief Executive Officer and our Chief Human Resources Officer. Overall, the Board is satisfied that Magna has in place appropriate succession plans addressing key positions within the company, including the Chief Executive Officer's, as well as a leadership development system which supports the company's succession planning objectives more generally. The Board has had the
Corporate Governance 31
- •
- Strategic Planning: The Board is responsible for overseeing the company's long-term strategy. In fulfilling this responsibility, the Board meets with Executive Management and Operating Group management in a dedicated business and strategic planning session held early each calendar year. At this session, the Board aims to enhance its understanding of trends, opportunities and risks over a three to seven-year horizon. It also provides Executive Management and Operating Group management with such advice and counsel needed to help ensure that any business and strategic plans approved by the Board fully reflect the Board's strategic priorities and appropriately address the trends, opportunities and risks facing the company. The Board receives regular updates from the Chief Executive Officer and other members of Executive Management regarding progress in achieving the company's strategic priorities. Implementation of the strategic plan and achievement of strategic priorities identified by the Board are factors considered and assessed by the CGCNC and Board in making long-term incentive grants.
opportunity to engage with a number of future potential leaders of the company and is satisfied that there is a pool of qualified internal candidates to fill critical Management positions which become available from time to time.
- •
- Enterprise Risk Management: The Board is responsible for ensuring the existence of appropriate and effective systems to manage Magna's enterprise risks. In fulfilling its oversight responsibility, the Board satisfies itself that Management has implemented effective strategies to address the strategic and competitive challenges faced by the company over different time horizons, manage day-to-day operational risks, promote legal and regulatory compliance and ethical conduct, safeguard corporate assets and maintain appropriate financial and internal controls designed to protect the integrity of Magna's financial statements. The Board's approach to enterprise risk recognizes that risk and reward are "flip sides of the same coin", but that management decision-making must be infused with both an awareness and understanding of such risks, as well as a clear understanding of the limits of risk that the Board will accept.
The Board also oversees the allocation of capital and annually approves the capital expenditures budget for that fiscal year at the business and strategic planning session. In approving capital, the Board is focused on ensuring that the company can deliver on the Board-approved strategic priorities and meet its product and program commitments to customers. Updates regarding changes in capital expenditure needs are presented quarterly and further Board approval is required where the company's capital expenditures are forecast to exceed the Board-approved amount for that year.
- •
- Shareholder Engagement: We value constructive dialogue with shareholders and investors and regularly engage with shareholders throughout the year to better understand their perspectives regarding Magna. Where possible, we consider the feedback received from such meetings in refining Magna's policies, practices and/or public disclosures.
The Board has delegated specific areas of risk oversight to its standing Committees so that the directors on such Committees can bring their particular knowledge and expertise to the risks falling within the Committee's authority. For example, the Board has delegated to the Audit Committee the oversight responsibility for financial and financial reporting risks, while the CGCNC has been delegated oversight responsibilities for governance, compensation and succession risks. The EROC has been delegated oversight responsibility for health, safety, environmental, legal/regulatory compliance and operational risks, as well as risks not falling within the other Committees' mandates and it seeks to coordinate with the Audit Committee and CGCNC in respect of their risk responsibilities. Directors have been cross-appointed between the Audit Committee and EROC, as well as the CGCNC and EROC, to assist the Committees in sharing their risk management knowledge and coordinating their risk oversight activities.
32 Corporate Governance
The Board's shareholder engagement activities are led by Mr. Young, the Chairman of the Board and the CGCNC. Board-led discussions typically relate to matters such as corporate governance and executive compensation. Significant shareholder and investor outreach is also conducted by members of our Executive Management team as part of our regular investor relations activities. Feedback communicated by shareholders and investors to the Executive Management team is shared with the CGCNC on a quarterly basis and the Chairman of the Board reports to the CGCNC and the full Board on a quarterly basis regarding shareholder engagement activities conducted by him.
In addition to identifying the above responsibilities, the Board Charter helps to define the role of the Board with respect to various fundamental actions, such as financial statements, material public disclosure documents, business plans and capital expenditure budgets, material financing documents, major organizational restructurings, material acquisitions and divestitures, as well as major corporate policies. We believe that the identification and definition of Board responsibility for the foregoing items promotes Board independence.
Shareholder Democracy
Magna's approach to corporate governance reflects the following basic principles of shareholder democracy:
- •
- One Share, One Vote: We have a single class of shares, with each share entitled to one vote.
- •
- Majority Voting: Under applicable corporate law, shareholders can only vote "for" or "withhold" their vote for director nominees. A "withhold" vote is an abstention or non-vote instead of a vote against the nominee. As a result, a single "for" vote can result in a nominee being elected, no matter how many votes were withheld. We have adopted a majority voting policy in our Board Charter, under which we treat "withhold" votes as if they were votes against a nominee in the case of an uncontested election (i.e. one in which the number of nominees equals the number of Board positions). A nominee who is legally elected as a director but receives more "withhold" votes than "for" votes must promptly tender a resignation to the Chair of the CGCNC for its consideration. Detailed voting results are promptly disclosed after shareholder meetings, so that shareholders can easily understand the level of support for each nominee, as well as each other item of business at the meeting.
- •
- leave
the resulting vacancy unfilled;
- •
- fill
the vacancy by appointing someone other than the director who resigned; or
- •
- call
a special meeting of shareholders at which a nominee other than the one who resigned will be proposed for election.
- •
- Shareholder Proposals: Subject to meeting certain technical requirements, shareholders are entitled under applicable corporate law to put forward proposals to be voted on at a meeting of shareholders.
A director who has tendered a resignation under our majority voting policy is not permitted to participate in the CGCNC's consideration of how to handle the resignation. Unless there are extraordinary circumstances, the CGCNC will recommend that the Independent Directors accept the resignation, effective within no more than 90 days after the annual meeting. We will promptly disclose in a press release the determination made by the Independent Directors and, in the event they reject a resignation under the majority voting policy, we will disclose the reasons for the rejection.
Where the CGCNC accepts a director's resignation under our majority voting policy, it may recommend and the Independent Directors may accept one of the following three outcomes:
Corporate Governance 33
- •
- Corporate Transactions Involving the Issuance of 25% or More of Our Issued and Outstanding Common Shares: We recognize that corporate transactions involving the issuance of a significant proportion of Common Shares may be material and should be approved by shareholders. In the event of a transaction which would involve the issuance of 25% or more of our issued and outstanding Common Shares, we will obtain shareholder approval before proceeding with the transaction.
The Board will give serious consideration to the voting results for shareholder proposals, even if they are only advisory in nature.
Ethical Business Conduct
We maintain a Code of Conduct & Ethics, which is disclosed on the corporate governance section of our website (www.magna.com) in multiple languages. The Code, which is administered and overseen by the EROC, applies equally to all of our directors, officers and employees. The Code is reviewed at least annually and proposed amendments must be approved by the Board. Any waivers of the Code for directors or executive officers must be approved by the EROC, while waivers for other employees must be approved by our Chief Legal Officer, Corporate Secretary or Chief Human Resources Officer. No waivers of the Code were granted in 2015.
The EROC also oversees our compliance training program, which aims to assist employees in understanding the values, standards and principles underlying the Code of Conduct & Ethics, as well as the application of such values, standards and principles to real-life situations encountered by employees in different roles. Our compliance program involves multiple elements, including live and online training, with live training typically conducted by external and/or in-house lawyers.
We maintain a confidential and anonymous whistle-blowing line known as the Good Business Lines ("GBL"), which is overseen by the Audit Committee. Stakeholders may make submissions to the GBL by phone or internet. The intake of all such submissions is managed by a third-party service provider and submissions are investigated by Magna's Internal Audit Department and/or external counsel (where applicable).
Corporate Social Responsibility
For decades, Magna has not only believed in the principle of being a good corporate citizen, but has demonstrated that commitment through our support for numerous social and charitable causes, primarily in the communities around the world in which our employees live and work. Through our donations and sponsorships, we provide significant support to local communities in areas such as health/wellness, youth sports, technical and vocational training and education, as well as culture. Aside from our local communities, we recognize the devastation that may be inflicted on communities by natural disasters and thus have contributed significant amounts to reputable charitable organizations, in support of refugee aid, as well as earthquake, tsunami, hurricane and other disaster relief.
In addition to such charitable giving, Magna's commitment to social responsibility is reflected in our approach to the following issues.
- •
- The Environment: Our Health, Safety and Environmental Policy (the "HSE Policy") articulates the company's goal of being an industry leader in health, safety and environmental practices, with the intention of minimizing the impact of our operations on the environment and providing safe and healthful working conditions. The HSE Policy also commits Magna to regular evaluation and monitoring of its activities impacting employee health and safety and the environment, the efficient use of natural resources, minimization of waste streams and emissions and innovation to reduce the environmental impact of our products. A rigorous system of environmental controls and best practices applies to all of our facilities globally, which has been supplemented by a program of regular third party and internal audits
34 Corporate Governance
- •
- Carbon Emissions and Water Use: Our manufacturing facilities are not significant greenhouse gas
emitters or water users. Nevertheless, we participate in the Carbon Disclosure Project, a not-for-profit project providing investors with information relating to corporate greenhouse gas emissions and
perceived corporate risk due to climate change.
- •
- Employee Health & Safety / Global Working Conditions: Our commitment regarding the health and
safety of our people is also
reflected in our Employee's Charter, Code of Conduct & Ethics, as well as our Global Working Conditions. The Employee's Charter reiterates our promise to provide employees with a safe and
healthful working environment. To the extent an employee believes we have not fulfilled our promise, he or she has numerous avenues to elevate the concern, including our Employee Hotline. Our Global
Working Conditions reflect our commitment to providing working conditions and standards that result in dignified and respectful treatment of all of our employees globally, as well as those within our
supply chain. Our Global Working Conditions, together with our Code of Conduct & Ethics, prohibit use of child, underage, slave or forced labour. Among other things, the Global Working
Conditions also articulate our belief that workers have the right to associate freely and join labour unions or workers' councils in accordance with applicable laws. Our Global Working Conditions are
an integral part of our supplier package and a failure by any of our suppliers to comply with its terms can result in the termination by Magna of the supply relationship.
- •
- United Nations Global Compact ("UNGC"): Magna supports the ten principles underlying the UNGC, a
public-private initiative
offering a policy framework for the development, implementation and disclosure of
sustainability principles and practices related to four core areas: human rights, labour, the environment and anti-corruption. The ten principles of the UNGC include: respect for internationally
proclaimed human rights; non-complicity in human rights abuses; upholding the freedom of association and right to collective bargaining; elimination of all forms of forced and compulsory labour;
abolition of child labour; elimination of discrimination in employment; support for a precautionary approach to environmental challenges; undertaking initiatives to promote greater environmental
responsibility; encouraging the development and diffusion of environmentally friendly technologies; and working against all forms of corruption.
- •
- Conflict Minerals: Magna also supports efforts to rid automotive parts and assemblies of conflict minerals such as gold, tantalite, tungsten and tin which are sourced from mines under the control of armed groups in the Democratic Republic of Congo and certain neighboring countries. We continue to work with our customers, suppliers and other fellow members of the Automotive Industry Action Group ("AIAG") to identify products and materials which contain such "conflict minerals" and to increase awareness and accuracy of conflict minerals reporting. Magna's approach to conflict minerals is annually reported to the CGCNC.
and inspections, the results of which are reported to the EROC. In connection with our commitment to environmental stewardship, 198 or 68% of our manufacturing facilities were ISO 14001 certified as at December 31, 2015 and 23 facilities were ISO 50001 certified as of such date.
Corporate Governance 35
Diversity
Magna is committed to an operating philosophy, reflected in the company's long-standing Employee's Charter, which is based on fairness and concern for people. One of the core principles in the Employee's Charter is that of fair treatment – Magna offers equal opportunities based on an individual's qualifications and performance, free from discrimination or favouritism. Employees' personal career growth and advancement are intended to be based on merit. Any employee who believes that the company is not living up to any of the principles in the Employee's Charter, including the principle of fair treatment, can seek redress through the Hotline, a confidential and anonymous process established to give employees a mechanism to hold Magna accountable for implementing the principles in the Employee's Charter.
In light of the principles underlying Magna's fair enterprise culture and the arbitrariness of targets, Magna has not adopted targets regarding gender or other forms of diversity in its workforce generally, or within the ranks of its executive officers. Currently, one of twenty-five (4%) corporate officers is female and none of the senior managers of Magna's Operating Groups is female. Nevertheless, the subject of gender diversity within management ranks is one which is considered by both Management and the Board in the context of succession planning for key positions throughout the company.
Board Leadership
We believe that an independent Board Chair is a necessity for a high-functioning, independent and effective Board. Accordingly, the Independent Directors elected at each annual meeting select from among themselves one Independent Director who will serve as Chair of the Board. William Young has acted in that capacity since May 2012.
The primary duties and responsibilities of the Board Chair are set out in a position description contained in our Board Charter and include:
- •
- representing
the Board in discussions with third parties;
- •
- representing
the Board in discussions with Executive Management;
- •
- generally
ensuring that the Board functions independently of Management;
- •
- assisting
in recruiting to the Board director candidates who have been identified by the CGCNC; and
- •
- overseeing the annual evaluation process of the Board and its Committees.
The Board can delegate additional responsibilities to the Board Chair at any time. Any change to the basic responsibilities listed in the Board Charter must be approved by the Board.
Board Independence
Shareholders are best served by a strong Board which exercises independent judgment, as well as prudent and effective oversight on behalf of shareholders. Assuming all of the Nominees listed in this Circular are re-elected with a majority of votes, nine out of ten, or 90%, of the directors on our Board will be "independent". This exceeds the minimum two-thirds independence requirement contained in our Board Charter and recommended by the Canadian Coalition for Good Governance, as well as the recommendation in National Policy 58-201 that a majority of directors be independent.
36 Corporate Governance
Definition of Independence
A Magna director is considered to be independent only after the Board has affirmatively determined that the director has no direct or indirect material relationship which could interfere with the exercise of his or her independent judgment. This approach to determining director independence draws upon the definition contained in Section 1.4 of National Instrument 52-110 ("NI 52-110") and Section 303A.02 of the NYSE's Corporate Governance Listing Standards, as well as the specific relationships identified in those instruments as precluding a person from being determined to be an independent director.
Audit Committee members are subject to a higher standard of independence than other directors, consistent with Section 1.5 of NI 52-110. Under this standard, a person cannot be considered an independent director for purposes of Audit Committee membership if he or she is a partner, member, executive officer, managing director or person in similar position at an accounting, consulting, legal, investment banking or financial advisory services firm providing services to Magna (including any subsidiary) for consulting, advisory or other compensatory fees.
In determining whether any candidate for service on the Board is independent, information is typically compiled from a variety of sources, including: written questionnaires completed by directors/candidates; information previously provided to us by directors; our records relating to relationships with accounting, consulting, legal, investment banking or financial advisory services firms, together with information provided to us by such firms; and publicly available information. The CGCNC is provided with a summary of all such relationships (whether or not material) known by Magna based on the foregoing sources. Following the CGCNC's consideration and assessment of such information, it presents its recommendation to the Board for approval.
Additional Ways In Which Independence is Fostered
Aside from the two-thirds independence requirement, there are other ways in which Board independence is fostered, including:
- •
- separation
of the roles of Board Chair and Chief Executive Officer, together with position descriptions defining such roles;
- •
- a
requirement that the Chief Executive Officer resign from the Board when he or she retires from Management;
- •
- the
use of in camera sessions at every Board and Committee meeting;
- •
- the
right of the Board and each Committee to engage independent legal, financial and other advisors at Magna's expense;
- •
- limitations
on board interlocks;
- •
- the
Board and Committee Chair's authority over meeting agendas and attendees; and
- •
- Independent Directors' right to discuss any matter with any employee or any advisor to the company (in addition to independent advisors).
CEO Position Description
A position description has been developed for the Chief Executive Officer to further promote the independence of the Board and to define the limits of Mr. Walker's authority. His basic duties and responsibilities include:
- •
- overall
direction of Magna's operations, including top-level customer contact;
- •
- development
and implementation of Magna's product, geographic, customer, merger/acquisition and growth strategies;
- •
- promotion of Magna's decentralized, entrepreneurial corporate culture;
Corporate Governance 37
- •
- development
of Magna's management reporting structure;
- •
- management
succession planning;
- •
- together
with the CGCNC, determination of compensation for members of Corporate Management;
- •
- human
resources management;
- •
- interaction
with the Board on behalf of Management; and
- •
- communication with key stakeholders.
Director Conflicts of Interest and Related Party Transactions
Where a director has a conflict of interest regarding any matter before the Board, the conflicted director must declare his or her interest, depart the portion of the meeting during which the matter is discussed and abstain from voting on the matter. However, as permitted by the OBCA, directors are permitted to vote on their own compensation for serving as directors.
The CGCNC is generally responsible for reviewing and making recommendations to the Board regarding related party transactions. In the case of a related party transaction which is material in value, the unconflicted members of the Board may choose to establish a special committee composed only of Independent Directors to review and make recommendations to the Board. Related party transactions include those between Magna (including any subsidiary) and a director, officer or person owning more than 10% of our Common Shares. In reviewing and making recommendations regarding related party transactions, the CGCNC seeks to ensure that transaction terms reflect those which would typically be negotiated between arm's length parties, any value paid in the transaction represents fair market value and that the transaction is in the best interests of the company. There were no such related party transactions during 2015.
Board Renewal and Director Recruitment
Board Renewal
Magna's Board has undergone significant renewal in the last five years, the result of which is that the average tenure of directors on the Board is 5.6 years. The CGCNC believes that the average age of our Directors (65 years) is appropriate and that there is a reasonable balance of relevant skills/expertise, gender and geographic expertise.
Nomination Process
The CGCNC is responsible for recommending to the Board the nominees for election at each annual meeting of the company's shareholders. The CGCNC annually considers the composition of the Board and makes an assessment as to any potential skill/expertise gaps which may need to be filled through recruitment of one or more additional directors. In making its assessment, the CGCNC considers input received from the Board as a whole, including through the Board's most recent Board self-assessment process, as well as from shareholders and other stakeholders.
Where the CGCNC decides that there may be a skill/expertise gap which needs to be addressed, it typically retains a professional search firm to help identify the broadest range of candidates with the skill/expertise being sought. Potential candidates may also be recommended by existing directors, members of Management, external advisors, shareholders or others. Additionally, the Corporate Secretary maintains an "evergreen" list of potential candidates, which includes candidates from prior searches, in addition to those recommended by any of the foregoing parties. The names of candidates coming from other sources are provided to the search firm retained by the CGCNC for its recommendation as to suitability. The CGCNC will typically interview a short list of three to five candidates for each Board seat it seeks to fill. Once the CGCNC has identified its preferred candidate(s), it will
38 Corporate Governance
seek feedback from the Board as a whole and will use its best efforts to provide Board members with an opportunity to meet the preferred candidate(s) in person. Feedback from any such meetings is considered by the CGCNC before making its formal recommendation to the Board.
Board Diversity
We value and welcome a diversity of views and perspectives on the Board and, accordingly, the CGCNC aims to recruit candidates who reflect a range of views, perspectives, expertise, experience and backgrounds. The Board has not adopted a diversity policy, nor has it set specific targets to be met with respect to diverse candidates, since such targets may be arbitrary. Instead, the CGCNC has focused on reinforcing a Board culture in which candidates of all backgrounds are valued equally and on professionalizing the director search process. In doing so, the CGCNC seeks to ensure that the broadest possible range of qualified candidates is considered, with no qualified candidate excluded based on any personal characteristic or attribute which is unrelated to the individual's ability to effectively carry out his or her duties as a director. This view frames the CGCNC's approach to the recruitment of female directors. Currently, three of nine (33%) Independent Directors and three of ten (30%) members of the Board as a whole, are female directors.
Age and Term Limits
We have not established age or term limits for directors, since such targets may be arbitrary. However, the CGCNC is committed to ensuring that Independent Directors remain active, engaged and effective participants and that they are able to function independently of Management. In considering whether to nominate a director for re-election, the CGCNC will take into account the director's level of engagement and participation in the Board's activities, including on the basis of feedback received through the Board's annual self-assessment process, which includes peer review components. The CGCNC will also consider whether the length of an Independent Director's tenure on the Board could or could reasonably be viewed as affecting his or her independence.
Annual Board Effectiveness Assessment
Magna maintains an annual Board effectiveness assessment process which aims to assist in the identification of short and long-term Board priorities, as well as the assessment of the overall functioning of the Board, its Committees and individual directors. The effectiveness assessment, which is overseen by the CGCNC, typically consists of three components:

|
• a detailed, standardized questionnaire completed by each director, which includes self-assessment and peer review components; • confidential one-on-one interviews of each director by the Board Chair to follow-up on comments received by each director in his or her questionnaire, elicit any other feedback which a director may prefer to communicate in person and communicate to each director general feedback from the peer review questions in the questionnaire; and • confidential one-on-one interviews of each director by an external facilitator, to elicit feedback regarding the Board Chair's performance, as well as any other feedback which a director may prefer to communicate anonymously. Following completion of the effectiveness assessment process, the Board Chair and the external facilitator will review overall findings with the CGCNC. Such findings and the CGCNC's recommendations are then presented to and discussed with the Board, following which the Board Chair and the Chief Executive Officer meet to agree on an action plan to address the feedback and implement the Board's recommendations. |
Corporate Governance 39
Board Structure and Effectiveness
In order to enable it to effectively fulfill its responsibilities, the Board has established three standing Committees – Audit Committee, CGCNC and EROC. The mandate of each standing Committee is detailed in a Committee charter, which has been filed on SEDAR (www.sedar.com) and is available on our website (www.magna.com) under "Corporate Governance".
Committee Composition and Independence
The CGCNC makes recommendations to the Board regarding the staffing of Board Committees with Independent Directors. Management directors are not allowed to serve on any Board Committees.
The CGCNC considers the skills and experience of each Independent Director in relation to each Committee's mandate and aims to place Independent Directors on the Committee(s) for which their skills and expertise are most relevant. Several Independent Directors currently serve on more than one Committee – for example, two Audit Committee members also serve on the EROC and one CGCNC member served on EROC during 2015. Such cross-appointments are intended to facilitate the sharing of knowledge and expertise between Committees, as well as to better enable a Committee such as EROC to coordinate its activities across the Board's Committees. Committee membership was as follows during 2015:
| NAME |
AUDIT |
CGCNC |
EROC |
|||
|---|---|---|---|---|---|---|
| Scott B. Bonham | /*/ | /*/ | ||||
| Peter G. Bowie | /*/ | |||||
| Hon. J. Trevor Eyton | /*/ | |||||
| V. Peter Harder | /*/ | /*/ | ||||
| Lady Barbara Judge | Chair | |||||
| Dr. Kurt J. Lauk | /*/ | |||||
| Cynthia A. Niekamp | /*/ | |||||
| Dr. Indira V. Samarasekera | /*/ | |||||
| Lawrence D. Worrall | Chair | /*/ | ||||
| William L. Young | Chair | |||||
The Board believes that Committee independence is critical to enabling the Board to exercise prudent and effective oversight. In addition to permitting only Independent Directors to serve on Committees, Committee independence is promoted in a number of ways, including the:
- •
- use
of in camera sessions at every Committee meeting;
- •
- right
of each Committee to retain independent advisors at Magna's expense;
- •
- inclusion
in each Committee Charter of a position description for the Committee Chair;
- •
- Committee
Chairs' authority over meeting agendas and attendees;
- •
- Committee
members' right to discuss any matter with any employee or any advisor to the company (in addition to independent advisors); and
- •
- right of any Committee member to call a Committee meeting.
40 Corporate Governance
Special Committees
In addition to its standing Committees, the Board has from time to time established special committees composed entirely of Independent Directors to review and make recommendations on specific matters or transactions. There were no special committees during 2015.
Director Attendance
We expect directors to attend all Board meetings, as well as all meetings of the Committees on which they serve, and are welcome to attend any other Committee meeting. However, we recognize that scheduling conflicts are unavoidable from time to time, particularly where meetings are called on short notice. Our Board Charter contains a minimum attendance requirement of 75% for all regularly scheduled Board and Committee meetings, except where an absence is due to a medical or other valid reason. In 2015, attendance by directors at all Board and Committee meetings (in aggregate) was 99%.
Director Orientation and Education
We are committed to ensuring that Independent Directors are provided with a comprehensive orientation aimed at providing them with a solid understanding of a broad range of topics, including:
- •
- our
business and operations;
- •
- consolidated
and Operating Group strategic and business plans;
- •
- trends
and risks impacting the automotive industry;
- •
- our
capital structure;
- •
- key
enterprise risks and risk mitigation policies and practices;
- •
- our
system of internal controls;
- •
- our
internal audit program;
- •
- the
external auditors' audit approach and areas of emphasis;
- •
- our
human resources policies and practices, including succession planning;
- •
- our
environmental and health/safety policies and practices;
- •
- our
Code of Conduct & Ethics, as well as our legal compliance program;
- •
- our
system of corporate governance;
- •
- fiduciary
duties and legal responsibilities applicable to directors of an Ontario corporation; and
- •
- other matters.
We also aim to provide all directors with a continuing education program to assist them in furthering their understanding of our business and operations and the automotive industry, as well as emerging trends and issues in such areas as:
- •
- corporate
governance;
- •
- risk
management;
- •
- development
of human capital;
- •
- executive
compensation;
- •
- ethics
and compliance;
- •
- mergers
and acquisitions; and
- •
- legal/regulatory matters.
Corporate Governance 41
Our director education program is developed based on priorities identified by the Board and may include various elements, including: site visits to our facilities or those of our customers or suppliers; in-boardroom presentations by members of Management, external advisors or others; third-party led training programs; membership in organizations representing independent directors; and subscriptions to relevant periodicals or other educational resources.
Independent Directors are encouraged to participate in additional director education activities of their choosing, at our expense. We maintain Board memberships to the Institute of Corporate Directors ("ICD"), as well as the National Association of Corporate Directors and encourage Independent Directors to attend conferences, seminars and webinars organized by such organizations. Additionally, directors are routinely provided with reading materials on a range of topics from a number of respected external sources, including: investor representative organizations such as the Canadian Coalition for Good Governance; various Canadian and U.S. law, accounting, management consulting and executive compensation firms; automotive industry news sources; and general publications relating to public companies. Further, we regularly distribute media articles relating to Magna and the automotive industry, as well as analyst reports and updates relating to Magna, its competitors and the automotive industry.
Board education topics during 2015 included the following:
- •
- global
macroeconomic updates;
- •
- the
"car of the future";
- •
- global
automotive industry trends;
- •
- detailed
overviews of each of Magna's Operating Groups;
- •
- cyber
security;
- •
- sustainability;
- •
- capital
structure; and
- •
- legal/regulatory compliance.
Additionally, Magna seeks opportunities to provide Independent Directors with tours of Magna's facilities. In 2015, the Board toured Magna's Tech Centre near Detroit, Michigan, at which time they received demonstrations of various innovative technologies and products. Given the high number of Magna manufacturing facilities globally, it is often difficult for Independent Directors to tour more than a few facilities each year. As a result, Magna prepares brief video overviews of a number of facilities each year and makes such videos available to Independent Directors.
Committee Reports
A report of each standing Board Committee follows. Each report summarizes the Committee's mandate, composition and principal activities in respect of 2015 and to date in 2016. In addition, a separate CGCNC report on compensation and performance precedes the Compensation Discussion & Analysis section of this Circular.
42 Corporate Governance
Report of the Audit Committee
Mandate
The Audit Committee assists the Board in fulfilling its oversight responsibilities with respect to financial and financial reporting matters. The mandate of the Audit Committee, which has been filed on SEDAR (www.sedar.com) and is available on the corporate governance section of Magna's website (www.magna.com), includes oversight responsibilities relating to:
- •
- Magna's independent auditors and internal audit department;
- •
- internal control over financial reporting;
- •
- critical accounting policies;
- •
- material risk exposures relating to financial and financial reporting matters, as well as information technology, and Magna's actions to identify, monitor and mitigate such exposures; and
- •
- whistle-blowing and financial integrity, including the Good Business Line.
Composition
The Audit Committee Charter requires that the committee be composed of between three and five Independent Directors, each of whom is "financially literate" and at least one of whom is a "financial expert", as those terms are defined under applicable law. Audit Committee members cannot serve on the audit committees of more than three boards of public companies in total. The Audit Committee complied with these requirements in 2015.
| MEMBERS |
INDEPENDENT |
FINANCIALLY LITERATE |
FINANCIAL EXPERT |
SERVES ON 3 OR FEWER AUDIT COMMITTEES |
2015 ATTENDANCE |
|||||
|---|---|---|---|---|---|---|---|---|---|---|
| Lawrence D. Worrall (Chairman) | ü | ü | ü | ü | 100% | |||||
| Scott B. Bonham | ü | ü | ü | ü | 100% | |||||
| Peter G. Bowie | ü | ü | ü | ü | 100% | |||||
| Dr. Kurt J. Lauk | ü | ü | ü | ü | 100% | |||||
In appointing the current members to the Audit Committee, the Board considered the relevant expertise brought to the Audit Committee by each member, including through the financial leadership and oversight experience gained by each of them in their principal occupations and/or other boards on which they serve, as described in their biographies elsewhere in this Circular. Messrs. Worrall and Bonham have been cross-appointed to the EROC to help maximize the effectiveness of risk oversight activities, as well as the coordination of such activities across the Board's Committees.
2015 Accomplishments and Key Areas of Focus
The Audit Committee's primary role is to satisfy itself on behalf of shareholders that the company's financial statements are accurate in all material respects and can be relied upon by shareholders. This necessarily involves diligent oversight of the company's system of internal controls, finance and accounting policies, internal and external audits, financial risk mitigation strategies and the integrity of its financial reports and disclosures. Through the Audit Committee's work during 2015 and the first few months of 2016, the Audit Committee has fulfilled all of the requirements under its charter, including satisfying itself regarding the integrity of Magna's financial statements
Corporate Governance 43
and financial reporting. Accordingly, the Audit Committee recommended and the Board approved Magna's 2015 consolidated audited financial statements. Some of the specific elements of work in this regard included:
- •
- Interaction with Management: Meeting with and reviewing presentations from the company's Chief Financial Officer and other members of Magna's Finance Department at each quarterly Audit Committee meeting and, in the case of the Audit Committee Chairman, between such quarterly meetings as well.
- •
- Selecting Head of Internal Audit: Interviewing candidates for the role of Vice-President, Internal Audit and selecting from among the interviewees one candidate to fill such role reporting to the Audit Committee.
- •
- Interaction with Internal Audit: Discussing internal audit, accounting and internal controls matters with the company's Vice-President, Internal Audit, including during in camera sessions at each quarterly Audit Committee meeting and in meetings and discussions between the Audit Committee Chairman and the Vice-President, Internal Audit between such quarterly meetings.
- •
- Internal Audit Effectiveness: Reviewing and approving the Internal Audit Department's ("IAD") annual work plan and following-up quarterly with the Vice-President, Internal Audit regarding the status and effectiveness of Management's follow-up on items identified by the IAD.
- •
- Interaction with External Auditor: Discussing audit, accounting and internal controls matters with Deloitte, including during in camera sessions at each quarterly Audit Committee meeting and in meetings and discussions between the Audit Committee Chairman and representatives of Deloitte between such quarterly meetings.
- •
- Internal Controls: Reviewing with Deloitte the effectiveness of Magna's systems of internal controls, Management's assessment of the effectiveness of such controls, as well as Deloitte's audits of the company's internal controls over financial reporting and consolidated financial statements. The Audit Committee also monitored the company's transition to the COSO 2013 Internal Controls Integrated Framework.
- •
- Financial Disclosures: Reviewing, discussing with Management and Deloitte and approving Magna's quarterly and annual financial statements and MD&A, earnings press releases, annual and quarterly outlooks, annual information form / annual report on Form 40-F and other items.
- •
- Finance / Financial Reporting Risk: Considering and assessing key financial and financial reporting risks, as well as Management's risk mitigation activities.
- •
- Critical Accounting Policies: Reviewing Magna's critical accounting policies, as well as pending and emerging regulatory developments related to accounting and audit matters.
- •
- Whistleblowing Line: Receiving summaries of matters reported through Magna's GBL, monitoring investigations of such matters, generally overseeing the administration of the GBL and satisfying itself that the GBL provides an effective whistleblowing mechanism.
In addition to its core efforts related to the integrity of Magna's financial statements, the Audit Committee also addressed the following topics in 2015:
- •
- IT Transformation and IT Risks: The Audit Committee received periodic updates regarding the status of the company's IT transformation project, as well as: the company's critical data assets; IT general controls; IT security risks and risk mitigation activities; as well as staffing and stewardship of the company's IT function.
- •
- Data Analytics: The Audit Committee met with representatives from Magna's Finance department, IAD and Deloitte in a session reviewing the ways in which data analytics is being used to enhance the effectiveness and efficiency of the internal and external audits.
- •
- Group Finance Personnel: The Audit Committee instituted a schedule of meetings with and presentations from finance personnel of Magna's Operating Groups. The purpose of such meetings is to assist the Audit Committee in developing a deeper understanding of the strength of the Operating Group finance teams, as well as the key issues from their perspectives.
44 Corporate Governance
For 2016, the Audit Committee will continue to focus on the various elements of work aimed at ensuring the company's financial statements continue to be accurate in all material respects and can be relied upon by shareholders. In addition, the Audit Committee has identified the following areas of focus for 2016:
- •
- Getrag Acquisition: Early in 2016, Magna completed the purchase of the Getrag Group of Companies ("Getrag"), the company's largest acquisition. In addition to focusing on the purchase accounting for the transaction, the Audit Committee anticipates spending time on key accounting issues related to Getrag's business, as well as meeting key Getrag finance personnel.
- •
- IT Transformation: Magna continues to make progress in enhancing its IT environment. The Audit Committee will continue to monitor such progress generally, while paying specific attention to the opportunities and risks arising from the rationalization in the number of different enterprise resource planning and manufacturing execution systems across the organization.
Committee Approval of Report
Management is responsible for the preparation and presentation of Magna's consolidated financial statements, the financial reporting process and the development and maintenance of Magna's system of internal controls. The company's external auditors are responsible for performing an independent audit on, and issuing their reports in respect of:
- •
- Magna's consolidated financial statements in accordance with the standards of the Public Company Accounting Oversight Board (United States) ("PCAOB"); and
- •
- the effectiveness of Magna's internal control over financial reporting, in accordance with the standards of the PCAOB.
The Audit Committee monitors and oversees these processes in accordance with the Audit Committee Charter and applicable law.
Based on these reviews and discussions, including a review of Deloitte's Report on Financial Statements and Report on Internal Controls, the Audit Committee has recommended to the Board and the Board has approved the following in respect of the fiscal year ended December 31, 2015:
- •
- inclusion of the consolidated financial statements in Magna's Annual Report;
- •
- MD&A;
- •
- Annual Information Form/Form 40-F in respect of 2015; and
- •
- other forms and reports required to be filed with applicable Canadian securities commissions, the SEC, the TSX and NYSE.
The Audit Committee is satisfied that it has fulfilled the duties and responsibilities assigned to it under its charter in respect of the year ended December 31, 2015. This Audit Committee report is dated as of March 17, 2016 and is submitted by the Audit Committee.

Lawrence D. Worrall (Chairman) |

Scott B. Bonham |

Peter G. Bowie |

Dr. Kurt J. Lauk |
Corporate Governance 45
Report of the Corporate Governance, Compensation and Nominating Committee
Mandate
The CGCNC assists the Board in fulfilling its oversight responsibilities with respect to corporate governance and executive compensation, as well as recruitment and nomination of individuals to serve as directors. The mandate of the CGCNC, which has been filed on SEDAR and is available on the corporate governance section of Magna's website (www.magna.com), includes oversight responsibilities relating to:
- •
- Magna's
overall system of corporate governance;
- •
- the
relationship between the Board and Executive Management;
- •
- the
effectiveness of the Board and its Committees;
- •
- compensation
for Executive Management, as well as incentive and equity compensation generally;
- •
- Independent
Director compensation;
- •
- executive
succession planning; and
- •
- nomination of candidates for election by shareholders.
Composition
The CGCNC Charter mandates a committee of between three and five Independent Directors. The CGCNC complied with this requirement in 2015.
| MEMBERS |
INDEPENDENT |
2015 ATTENDANCE |
||
|---|---|---|---|---|
| William L. Young (Chairman) | ü | 100% | ||
| Hon. J. Trevor Eyton | ü | 100% | ||
| V. Peter Harder | ü | 100% | ||
| Dr. Indira V. Samarasekera | ü | 100% | ||
In appointing the current members to the CGCNC, the Board considered the relevant expertise brought to the CGCNC by each member, including through the leadership, compensation and governance experience gained by each of them in their principal occupations and/or other boards on which they serve, as described in their biographies elsewhere in this Circular.
2015 Accomplishments and Key Areas of Focus
During 2015, the CGCNC fulfilled all of the requirements under its Charter, including with respect to Magna's overall system of corporate governance, executive and incentive compensation, Board composition, succession planning and other matters. Some of the CGCNC's significant activities and accomplishments in these areas in respect of 2015 include:
- •
- Alignment Between Pay and Performance: The CGCNC engaged its compensation advisor to assist it in verifying the link between executive compensation and corporate performance. The CGCNC satisfied itself that Magna's compensation system continues to generate compensation outcomes that are aligned with the company's performance.
46 Corporate Governance
- •
- Performance Evaluation: As discussed further in the Compensation Discussion & Analysis section of this Circular,
the
CGCNC annually defines the criteria to be applied in determining the size of the long-term incentive pool. The criteria identified by the CGCNC relate to long-term objectives identified by the Board
as a whole in the company's strategic planning process and thus are intended to establish a direct connection between executive compensation and achievement of board-defined objectives. The CGCNC
oversaw the completion of the evaluation by the Independent Directors and applied the outcome to the stock option grant in respect of 2015.
- •
- Performance-Vested Options: Early in 2015, the CGCNC finalized and implemented a new framework for
long-term incentives which
is aimed at better aligning long-term compensation for the company's most senior executives with shareholder interests. Under the framework, performance options only vest if total shareholder return
is at or above the 60th percentile for the applicable vesting period, relative to an appropriate industry peer group. The CGCNC has granted performance-vested options under the
framework as part of executive compensation packages for our 2014 and 2015 fiscal years.
- •
- Succession Planning: In addition to receiving regular updates regarding the continued implementation of
the company's
broad-based Leadership Development and Succession program ("LDS"), the
CGCNC worked with its external advisor, as well as Magna's Chief Executive Officer and Chief Human Resources Officer, to establish leadership development plans for the company's top leadership
candidates.
- •
- Future Compensation Framework: In conjunction with the Board's continuing focus on long-term strategy
and the CGCNC's focus
on succession planning for key management positions, the CGCNC continues to review Magna's executive compensation system with the aim of satisfying itself that the system will continue to provide
appropriate incentives to the company's next generation of senior executives to achieve the company's long-terms objectives.
- •
- Shareholder Engagement: Mr. Young, in his capacity as Chairman of the Board and the CGCNC,
directly engaged with
institutional shareholders during 2015 in order to better understand their views regarding corporate governance, executive compensation, board oversight of strategy and other matters.
- •
- Board Effectiveness: As in prior years, the CGCNC oversaw the Board's three-part self-assessment process, described earlier in this Circular. The results of the Board's self-assessment process continue to be used in determining the Board's nominees for election by shareholders, as well as in identifying enhancements in Board practices and governance.
Looking forward, the CGCNC expects that Magna's future compensation framework, succession planning, Board effectiveness and shareholder engagement will continue to be key areas of focus for the Committee during 2016.
Committee Approval of Report
Based on the foregoing and all other activities undertaken or overseen by the CGCNC, the CGCNC is satisfied that it has fulfilled the duties and responsibilities assigned to it under its charter in respect of the year ended December 31, 2015. This CGCNC Committee report is dated as of March 17, 2016 and is submitted by the CGCNC.

William L. Young (Chairman) |

Hon. J. Trevor Eyton |

V. Peter Harder |

Dr. Indira V. Samarasekera |
Corporate Governance 47
Report of the Enterprise Risk Oversight Committee
Mandate
The EROC assists the Board in fulfilling its risk oversight responsibilities, including by coordinating with the Board's other Committees in connection with their respective risk oversight activities. Financial as well as financial reporting risks fall within the mandate of the Audit Committee, and corporate governance, compensation and succession risks fall within the mandate of the CGCNC. The mandate of the EROC, which has been filed on SEDAR and is available on the corporate governance section of Magna's website (www.magna.com), includes various oversight responsibilities relating to:
- •
- identification,
monitoring and mitigation of Magna's material risk exposures; and
- •
- administration of our Code of Conduct, as well as legal and regulatory compliance.
Composition
The EROC Charter mandates a committee composed of between three and five Independent Directors. The EROC complied with this requirement in 2015.
| MEMBERS |
INDEPENDENT |
2015 ATTENDANCE |
||
|---|---|---|---|---|
| Lady Barbara Judge (Chair) | ü | 100% | ||
| Scott B. Bonham | ü | 100% | ||
| V. Peter Harder | ü | 83% | ||
| Cynthia A. Niekamp | ü | 100% | ||
| Lawrence D. Worrall | ü | 100% | ||
In appointing the current members to the EROC, the Board considered the relevant expertise brought to the EROC by each member, including through the leadership and risk management experience gained by each of them in their principal occupations and/or other boards on which they serve, as described in their biographies elsewhere in this Circular. Messrs. Worrall and Bonham also serve on the Audit Committee, while Mr. Harder also served on the CGCNC.
Such cross-appointments are intended to promote the effectiveness of each Committee in its respective risk oversight areas, as well as the coordination of such activities across the Board's Committees.
2015 Accomplishments and Key Areas of Focus
The EROC fulfilled all of the requirements under its Charter and significantly enhanced its risk oversight activities in 2015 by identifying key strategic and other risks from the Board's perspective and structuring its work plan for the year to prioritize detailed reviews of such risks and the company's related risk mitigation processes. While continuing to receive updates and presentations from Management on risk topics of general importance, including macroeconomic conditions and risks, the EROC dedicated a significant portion of its meeting time in 2015 to the following topics:
- •
- Occupational Health/Safety and Environmental ("HSE") Compliance: Given Magna's long-standing commitment to safe workplaces and responsible environmental practices, the EROC continued to focus
48 Corporate Governance
- •
- Regulatory Compliance Risks: Throughout 2015, the EROC engaged with Management and external counsel to review the status of
outstanding regulatory investigations related to legacy antitrust risks, as well as Magna's internal antitrust risk review.
- •
- Compliance Training Program: The EROC received in-depth presentations from the corporation's
Vice-President, Ethics and Chief
Compliance Officer regarding the scope and substance of the corporation's compliance training program.
- •
- Risks of Conducting Business in Emerging Markets: Magna's strategic plan continues to prioritize growth
in geographic markets
such as China and India, which are forecast to experience higher growth rates than the company's traditional markets of North America and Europe. In light of the elevated business risk profiles of
emerging markets, the EROC interacted with Management to better understand the risks and opportunities in such markets. Among other things, the EROC reviewed with Management the company's quantitative
and qualitative approaches to assessing and managing such risks in each country where it operates, including through country risk profiles and internal investment hurdle rates used by Management in
allocating capital and quoting new business in various countries around the world.
- •
- Geographic Risks: The EROC satisfied itself that the corporation's manufacturing base is evolving to
meet geographic shifts
in vehicle production by Magna's customers, including by: assessing data demonstrating such customers' forecast growth rates in each region; reviewing forecast changes in Magna's manufacturing
footprint; and reviewing with Management the growth rates of China's domestic vehicle manufacturers and prospects for them to expand outside China.
- •
- Product Delivery Processes: Recognizing that the lifecycle of a production program, from the time of
initial quote to the
end-of-production, carries multiple risks, the EROC requested members of certain of Magna's operating groups to demonstrate to the committee how the groups' product delivery processes, mitigate
applicable risks.
- •
- Product Quality and Warranty: The EROC engaged with the corporation's Vice-President, Quality Improvement, to better understand the processes and systems used by Magna to produce high quality products. The Committee also reviewed with management its processes to minimize product warranty claims/expense.
on the company's practices to minimize risks in these areas. The EROC received regular reports relating to the results of HSE audits, as well as Management's responses to any issues identified. The EROC remains satisfied that Magna's HSE policies, practices, systems and monitoring are mature and effective in achieving their intended goals.
Committee Approval of Report
Based on the foregoing and all other activities undertaken or overseen by the EROC, the EROC is satisfied that it has fulfilled the duties and responsibilities assigned to it under its charter in respect of the year ended December 31, 2015. This EROC report is dated as of March 17, 2016 and is submitted by the EROC.

Lady Barbara Judge (Chair) |
Scott B. Bonham |
V. Peter Harder |

Cynthia A. Niekamp |
Lawrence D. Worrall |
Corporate Governance 49
Compensation and Performance Report
March 17, 2016
Dear Shareholder,
In connection with the Meeting, you are being asked to approve an advisory vote on Magna's executive compensation system. Before casting your vote, we encourage you to read this report together with the Compensation Discussion & Analysis section of this Circular.
Magna's Approach to Executive Compensation
Magna's approach to executive compensation reflects the company's entrepreneurial corporate culture, including:
- •
- minimal
fixed compensation in the form of salaries;
- •
- annual
profit-based incentive bonuses, a portion of which is deferred for almost three years and delivered in the form of equity;
- •
- long-term
incentives in the form of stock options; and
- •
- the absence of pensions or other retirement benefits.
To ensure that executives' interests are aligned with the best interests of the company, impairment charges, restructuring costs, regulatory fines/penalties and other expenses and charges typically reduce Magna's bonus pool on a dollar-for-dollar basis. We believe that this structure promotes responsible decision-making by directly connecting the impact of management decisions with executive compensation, including in areas such as operations management, acquisition due diligence and integration, legal compliance as well as health, safety and environmental management.
In typical years, the largest component of an executive's compensation will come from the annual profit-based incentive. However, Magna's executive compensation structure is highly variable, meaning that annual bonuses will decrease as Magna's profits decrease, potentially resulting in compensation for an executive which is well below the median of Magna's compensation peers for an executive in a comparable role. As Magna's profit increases, annual bonuses will increase as well, but compensation will not grow at the same rate as profit growth, due to the profit sharing "step-downs" discussed in Section C of the CD&A section of this Circular. This "direct drive" compensation structure is a long-standing element of Magna's entrepreneurial compensation system and culture, which the CGCNC believes creates a true pay for performance system. The CGCNC's belief in this regard has been validated by data demonstrating strong alignment between executive compensation and performance as measured by relative Total Shareholder Return, as you will read in the "Alignment Between Pay and Performance" section of this report.
Magna's 2015 Say on Pay Result
Through the Board's engagement with shareholders and through recent "say on pay" votes, shareholders have sent a strong message of support for Magna's approach to compensation. For example, at Magna's 2015 annual meeting, almost 93% of the votes cast on the advisory shareholder vote were in favour of Magna's approach to executive compensation. Magna held similar votes in the prior two years and the 2015 result represented an improvement over the votes held in 2014 (82% in favour) and 2013 (78% in favour). The "Business of the Meeting" section earlier in this Circular includes the Board's recommendation that you vote for the resolution relating to Magna's approach to executive compensation and the CGCNC reiterates that recommendation.
50 Performance
Magna's Named Executive Officers and Compensation Outcomes in 2015
Magna's 2015 NEOs consisted of the following:
- •
- Donald
Walker – Chief Executive Officer
- •
- Vincent
Galifi – Executive Vice-President and Chief Financial Officer
- •
- Tommy
Skudutis – Chief Operating Officer, Exteriors, Seating, Mirrors, Closures and Cosma
- •
- Jeffrey
Palmer – Executive Vice-President and Chief Legal Officer
- •
- James J. Tobin – Chief Marketing Officer and President, Magna Asia
The accompanying Compensation Discussion & Analysis contains a detailed discussion of 2015 pay outcomes for Magna's five most highly compensated executive officers and the Summary Compensation Table summarizes compensation for each NEO in each of 2015, 2014 and 2013.
Magna's Operating and Financial Performance in 2015
Magna's 2015 fiscal year was characterized by significant progress in executing on long-term strategic objectives related to the repositioning of the company's product portfolio and realignment of its capital structure. During 2015, Magna reached an agreement to enter the transmissions product area through its purchase of the Getrag Group of Companies ("Getrag") while also completing the sale of substantially all of its interiors business (excluding seating). The effect of these transactions was to expand in a product segment which is expected to grow more rapidly, while exiting a product segment which was not viewed as critical to the company's future. In terms of capital structure, with the completion of the Getrag transaction at the start of 2016, Magna achieved an Adjusted Debt to Adjusted EBITDA ratio which was roughly in the middle of the range the company had previously disclosed as its target, as well as a reduction of its cash to a more appropriate level. The target capital structure was reached through a combination of investments for future growth in the form of capital spending and acquisitions, as well as return of capital through dividends and share repurchases.
In addition to the progress on long-term objectives, Magna had a strong year in terms of its operating and financial performance. Excluding the impact of foreign currency translation, Magna's 2015 Sales grew at a rate of 3% as compared to 2014. While Magna reports its financial results in U.S. dollars, it generates sales in various other currencies, including the euro and Canadian dollar. In light of the impact of foreign currency translation, Magna's Sales as reported in its financial statements decreased 7% to $32.13 billion in 2015.
Magna's short- and mid-term incentive compensation for NEO's is driven by Pre-Tax Profits Before Profit Sharing. This metric is derived from Net Income as reported in Magna's financial statements, adjusted to (among other things) add-back the provisions for income taxes and minority interests, employee profit sharing and aggregate incentive bonuses for Executive Management. Magna's reported Net Income increased 1% to $1.9 billion in 2015 compared to 2014, but decreased by 7% on a normalized basis excluding unusual items. Some of the factors underlying the decrease in normalized Net Income include the impact of foreign currency translation, higher program launch costs, operational inefficiencies at certain of Magna's body and chassis operations and other factors. For a full discussion of Magna's 2015 results, please refer to Magna's Management Discussion & Analysis of Results of Operations and Financial Position.
Performance 51
2015 Compensation Outcomes
NEO compensation for 2015 was generally aligned with Magna's operating and financial results with an average decrease in total compensation of 3%. Base salaries were unchanged from 2014 at $325,000 for each NEO, including Magna's Chief Executive Officer. Annual NEO profit sharing bonuses (cash and RSUs) decreased by 2.5% on average in 2015 compared to 2014. The decrease in profit sharing bonuses directionally reflects the factors which reduced normalized Net Income, including foreign currency translation, program launch costs, operational inefficiencies and other factors. The average dollar value of long-term incentives granted to the NEOs in the form of performance stock options decreased by 8% for 2015 as compared to 2014. Details of the process used by the Board to determine performance stock option grants is described in detail in Section B the CD&A of this Circular.
The company's performance-vested stock options are structured to vest in tranches on the later of: (1) the first/second/third anniversaries of the grant and (2) satisfaction of the performance condition, being a relative one/two/three-year TSR greater than or equal to the 60th percentile relative to the performance stock option peer group identified in the CD&A. Since Magna's TSR for calendar 2015 fell below the 60th percentile of the peer group, the first tranche of the performance-vested stock options granted to the NEOs in respect of 2014 did not vest on the earliest potential vesting date. However, the NEOs remain incented to achieve superior TSR performance for the benefit of all shareholders since the option tranche which failed to vest may vest at a future date if the relative TSR condition is met for a period running from January 1, 2015 to such future date.
Alignment Between Pay and Performance
There are different ways in which the alignment between pay and performance can be measured. One of the more widely accepted methods involves an assessment of compensation rank (percentile) against TSR rank (percentile). We have shown (below) CEO compensation against relative TSR for both our compensation peer group and also the S&P/TSX60 companies. Additionally, we have shown average NEO compensation against relative TSR for our compensation per group. Measurement of pay/performance alignment against S&P/TSX60 companies recognizes that while we compete against companies which are largely U.S.-based companies, Magna is an Ontario company which is often assessed against other Canadian companies in terms of compensation and corporate governance.
In the graphs below, the diagonal line from bottom left to top right represents perfect alignment, while the space between the dashed lines generally represents an acceptable range of alignment. Since 2015 compensation information for many of the comparator companies was not yet available at the time the analysis was completed, the graphs below depict the three-year period ended December 31, 2014. These graphs demonstrate close alignment between Magna's pay and performance on a three-year basis.
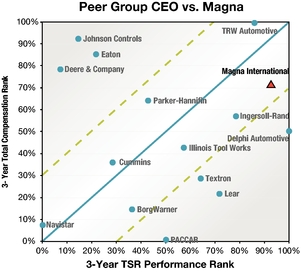
|
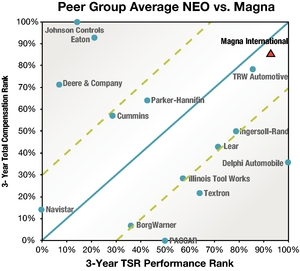
|
52 Performance
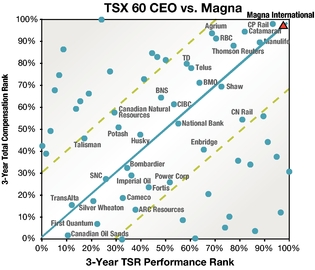
|
In light of the fact that the above TSR analysis covers a three-year period ending December 31, 2014, the CGCNC considered Magna's relative TSR performance for 2015 as compared to the foregoing peer groups. On a one-year basis, Magna's TSR was at the 23rd percentile and 42nd percentile in comparison to Magna's compensation peer group and the S&P/TSX60 index, respectively. Magna's NEO compensation is driven primarily by actual profitability for a year, whereas TSR reflects investors' forward-looking sentiment as to the company's expected performance, as well as macro-economic, industry and other general factors. As a result, compensation and TSR will not necessarily show a direct corelation from one year to the next.
Magna's stock price appears to have been significantly impacted by two key events in 2015. Market perceptions as to Magna's prospects for 2015 and beyond appear to have caused its stock price to diverge from the average of its publicly-traded automotive parts peer companies when Magna announced its outlook in January 2015. One of the significant contributing factors to such divergence appears to have been the market's interpretation of the impact of foreign currency translation on Magna's sales and the other elements of its outlook. While the gap between Magna's stock price and the average of its peers closed partially on announcement of first quarter results in May 2015, the gap expanded significantly following release of Magna's third quarter results and revised guidance in November 2015. Among other things, the third quarter results reflected the impact of the higher launch costs and operational inefficiencies at certain of Magna's body and chassis operations, which reduced NEO compensation in 2015, as intended. Demonstration of such a direct link between operational performance and compensation reinforces the CGCNC's view that Magna's compensation system is aligned with performance. This conclusion was further reinforced by the CGCNC's consideration of the impact of stock price performance on NEOs wealth-at-risk and on the first tranche of the 2014 performance-vested stock options.
2015 Total Shareholder Return
If a shareholder had invested C$100 in Magna Common Shares on the TSX on December 31, 2010, the cumulative value of that investment would be C$239, which is more than double the cumulative return of C$112 for the S&P/TSX60 index. In the case of an investment of $100 in Magna Common Shares on the NYSE on the same date, the total cumulative shareholder value of that investment would be $172, which is lower than the cumulative return of $181 for the S&P500 composite index. The difference in Magna's TSR performance against such indices reflects significant differences in the composition of the indices, foreign currency translation and other factors. In each case the total cumulative return assumes the reinvestment of dividends.
Performance 53
The graph below shows the five-year returns of Magna Common Shares on the TSX and NYSE as compared to the S&P/TSX and S&P500 composite indices, respectively, assuming investment of C$100 and $100 on December 31, 2010 and reinvestment of dividends.
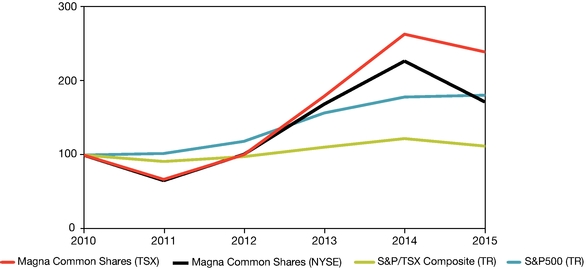
| FISCAL YEARS |
DECEMBER 31, 2011 |
DECEMBER 31, 2012 |
DECEMBER 31, 2013 |
DECEMBER 31, 2014 |
DECEMBER 31, 2015 |
|||||
|---|---|---|---|---|---|---|---|---|---|---|
| Magna Common Shares (TSX) | C$67.10 | C$100.50 | C$179.40 | C$263.10 | C$239.20 | |||||
| S&P/TSX Total Return |
||||||||||
| Magna Common Shares (NYSE) | $65.60 | $101.00 | $168.70 | $226.80 | $171.80 | |||||
| S&P500 Total Return | $102.10 | $118.50 | $156.80 | $178.30 | $180.80 | |||||
Looking Forward – Compensation in 2016 and Beyond
The CGCNC has spent considerable time and effort working with its advisors and Executive Management over the last few years to refine the company's approach to executive compensation. The CGCNC believes that Magna's approach to compensation is effective in achieving desired outcomes, a view validated by the level of shareholder support for Magna's 2015 advisory vote on executive compensation.
The CGCNC and Executive Management previously reached a common understanding that, as part of the Board's review of the terms of any proposed material acquisition or disposition, the CGCNC will work with Executive Management to identify potential changes to NEOs' current employment contracts to ensure executive compensation arrangements remain appropriate following such transactions. This includes the possibility of adjusting the NEOs' profit sharing percentages to take into account the anticipated impact of such transactions on the company's strategy and financial position, as well as on overall compensation levels. The CGCNC reviewed business plan forecasts and compensation forecasts for 2016 through 2018, such forecasts reflecting Magna's acquisitions/dispositions in 2015, including the purchase of Getrag and sale of substantially all of Magna's interiors business. Based on the net impact of all acquisitions/disposition in 2015, the CGCNC does not believe that profit sharing percentages need to be adjusted at this time. However, the CGCNC will continue to monitor the impact of these and other transactions on executive compensation.
54 Performance
In parallel with the CGCNC's ongoing work on succession planning, the Committee is reviewing potential compensation redesign alternatives for future NEOs as part of its efforts to satisfy itself that Magna's executive compensation system will continue to appropriately incent the company's next generation of senior executives to achieve the company's long-term objectives. One of the CGCNC's areas of focus is the balance of compensation paid over the short, medium and long-term, an area highlighted by several shareholders in our shareholder engagement meetings.
Lastly, the CGCNC intends to continue to engage with shareholders throughout 2016 to hear their perspectives regarding the company's corporate governance, approach to executive compensation board oversight of strategy and other matters.
In Closing
At our May 5, 2016 annual meeting, you will have the opportunity to express your views on Magna's approach to executive compensation through the advisory "say on pay" vote. In casting your vote, we trust that you will consider:
- •
- Magna's
strong operating and financial performance in 2015;
- •
- the
reduction in NEO compensation from 2014 to 2015;
- •
- the
alignment between pay and performance generated by Magna's compensation system; and
- •
- the CGCNC's efforts to evolve Magna's compensation system in response to feedback from shareholders, while maintaining the core elements of a system which the CGCNC continues to believe is successful in achieving its underlying objectives.
We look forward to your support at our 2016 annual meeting.
| William L. Young (Chairman) |
||||
Hon. J. Trevor Eyton |
V. Peter Harder |
Dr. Indira V. Samarasekera |
Performance 55
Compensation Discussion & Analysis
Key Terms Used in This Section
| CD&A: | the Compensation Discussion & Analysis section of this Circular | |
executive compensation peer group: |
the group of 13 companies discussed in Section B of this CD&A, against which the compensation of our Executives is compared or benchmarked |
|
Fasken: |
the CGCNC's independent legal advisors, Fasken Martineau DuMoulin LLP |
|
Hugessen: |
the CGCNC's independent compensation advisor, Hugessen Consulting |
|
LTIs: |
long-term incentives |
|
Named Executive Officers or NEOs: |
our five most highly compensated executive officers |
|
performance stock option peer group: |
the group of 12 companies discussed in Section B of this CD&A, against which Magna's TSR is measured in order to determine the vesting of performance-vested stock options |
|
RSUs: |
restricted stock units |
|
TSR: |
Total Shareholder Return |
Section Summary
This CD&A is divided into the following sub-sections:
| SUB-SECTION |
DESCRIPTION |
PAGE |
||
|---|---|---|---|---|
| A | Discusses the role of compensation in our corporate culture, the centrality of entrepreneurialism to our compensation program and the objectives of our executive compensation program and other matters | 57 | ||
| B | Addresses the Board's responsibility for executive compensation, as well as the scope of the CGCNC's role and discusses the CGCNC's process for making compensation decisions | 58 | ||
| C | Provides an overview and detailed description of the elements of our executive compensation program | 64 | ||
| D | Describes our compensation risk mitigation practices | 78 | ||
The Summary Compensation Table follows on page 80.
56 Compensation
A. Compensation Philosophy & Objectives
Corporate Culture and Compensation
Our unique, entrepreneurial corporate culture seeks to balance the interests of key stakeholders, such as shareholders, employees and management, including by defining such stakeholders' entitlements to share in our profitability. We believe that our corporate culture has been a critical factor in our past growth and success and expect it will continue to be a critical factor in our ability to create long-term shareholder value. In particular, the employee and management profit sharing elements of our culture have proven to be essential to our ability to attract and retain our skilled, entrepreneurial employees and managers, as well as to create effective incentives for them to achieve strong performance in a cyclical and highly competitive industry.
Executive Compensation Philosophy
Our executive compensation program has been structured to attract, motivate and retain world-class, entrepreneurial managers, align their interests with those of our long-term shareholders and directly link their compensation with our performance. Some of the ways we seek to achieve these objectives include:
- •
- minimal
fixed compensation, as reflected in below-market base salaries;
- •
- highly
variable, annual profit-sharing bonuses paid in cash;
- •
- deferred
equity awards (RSUs), the initial value of which is determined based on our annual profitability, but the realizable value of which is tied to our share price over
a two to three year period;
- •
- performance
stock options, the vesting of which depends on our TSR performance relative to a group of industry peers; and
- •
- significant personal wealth "at risk" through equity ownership – for example, our Chief Executive Officer held over $66 million of Magna equity as of December 31, 2015, directly aligning his interests with those of all shareholders.
Consistent with our overall philosophy, we do not provide executives with any pension or retirement benefits.
What Does the Executive Compensation Program Reward?
The combination of minimal fixed compensation and highly variable annual incentive compensation is intended to reward the consistent achievement of profitability, while the deferred equity awards and performance stock options are intended to reward mid- to long-term growth as well as relative TSR outperformance compared to peer companies. At the same time, all of these elements are intended to align the interests of Executive Management with those of the company's shareholders.
As discussed earlier, our executive compensation program was developed within the context of an entrepreneurial culture which, by definition, requires some degree of risk-taking in order to achieve growth. Recognizing that the consequences of excessive risk-taking may be felt most acutely by shareholders, our executive compensation program seeks to encourage and reward responsible business decision-making and reasonable risk-taking. We seek to achieve this through a variety of methods, including stringent equity ownership requirements.
Compensation 57
B. Compensation Decision-Making: Responsibility and Process
Role of Our Board
Our Board is responsible for overseeing our system of executive compensation including by ensuring that it is consistent with the long-standing compensation principles which are critical to our corporate culture, while remaining effective in attracting, retaining and motivating skilled executives. The Board also annually assesses the company's performance and that of the Chief Executive Officer in relation to pre-defined objectives approved by the Board. This performance assessment is one of the factors considered by the CGCNC in granting long-term incentive awards to the Chief Executive Officer.
Role of the CGCNC
The Board has delegated to the CGCNC responsibility for annually reviewing, considering and making recommendations related to executive compensation matters generally. More specifically, the CGCNC has been delegated responsibility for making recommendations with respect to the application of our executive compensation program to certain members of Corporate Management, including the NEOs discussed in this CD&A.
While some NEOs, such as our Chief Executive Officer and Chief Financial Officer, are invited to participate in CGCNC meetings, final compensation decisions affecting NEOs are typically made by the CGCNC without any NEOs present in order to ensure the independence of the decision-making process.
Role of Our Chief Executive Officer
The CGCNC looks to the Chief Executive Officer to assess the performance of and make recommendations regarding the compensation levels of his direct reports. Such performance assessments will be considered by the CGCNC in the context of long-term incentive awards to members of the executive team, as well as proposed compensation changes for such executives. The CGCNC also looks to the Chief Executive Officer to put forward his general recommendation regarding long-term incentive awards to all other proposed recipients.
CGCNC Selects and Retains Its Own Independent Advisors
In reviewing, considering and making recommendations on executive compensation matters, the CGCNC considers the advice of its independent advisors, Hugessen and Fasken, both of which have been selected and retained directly by the CGCNC. The CGCNC met in camera with its independent advisors as part of each of the CGCNC's meetings attended by them during 2015.
Role of the Independent Compensation Advisor
The CGCNC selected and has retained Hugessen as its compensation advisor since December 2012. Hugessen only provides board-side advice, had no relationship with Magna or its Board prior to December 2012 and does not provide any services to Magna other than the advisory services provided to the CGCNC. One or more representatives of Hugessen are invited to attend CGCNC meetings at which executive compensation matters are to be discussed. Hugessen reports directly to and seeks its instructions directly from the CGCNC and communicates as needed with the CGCNC Chair between meetings.
The scope of Hugessen's services generally includes advice related to executive and director compensation program structure and design, benchmarking data and observations, as well as pay for performance analytics. In addition, Hugessen provides the CGCNC with contextual information relating to compensation best practices and emerging trends. The services provided by Hugessen to the CGCNC in respect of 2015 included:
- •
- review and benchmarking of Magna's compensation practices;
58 Compensation
- •
- analysis
of Magna's relative performance and compensation;
- •
- advice
related to Magna's performance stock option program; and
- •
- ongoing review and advice on compensation recommendations presented for CGCNC approval.
Hugessen's advice was only one of a number of factors (discussed below) which were reviewed and considered by the CGCNC in making its executive compensation recommendations to the Board.
The fees billed by Hugessen for the services it provided to the CGCNC in respect of 2015 and 2014 were:
| DESCRIPTION OF SERVICES | 2015 | 2014 | |||||||
| ($)(1) | (%) | ($)(2) | (%) | ||||||
| Executive compensation services provided to CGCNC | 196,000 | 100 | 270,000 | 100 | |||||
| All other services for Magna | NIL | NIL | NIL | NIL | |||||
| Total | 196,000 | 270,000 | |||||||
Notes:
- 1.
- Converted
from C$ at the BoC noon spot rate on December 31, 2015.
- 2.
- Converted from C$ at the BoC noon spot rate on December 31, 2014.
CGCNC Considers a Wide Range of Factors in its Executive Compensation Decisions
In connection with executive compensation decisions, the CGCNC will normally consider a wide range of factors, including:
- •
- core
operating and compensation philosophies and principles developed since our founding, such as entrepreneurialism, operational decentralization and profit sharing;
- •
- alignment
of management, employee and shareholder interests to create long-term shareholder value;
- •
- our
financial, operating and stock price/TSR performance;
- •
- considerations
related to the relationship between incentive compensation and achievement of long-term strategic objectives;
- •
- compensation
risk considerations;
- •
- compensation
benchmarking data;
- •
- pay
for performance alignment data;
- •
- the
recommendations of our Chief Executive Officer with respect to his direct reports;
- •
- the
advice and recommendations of the CGCNC's independent advisors;
- •
- feedback
received from shareholders and other stakeholders; and
- •
- general information relating to executive compensation trends and developments.
Compensation 59
In making recommendations to the Independent Directors, the CGCNC does not rely solely on any one of the above or other factors. In a typical year, the key executive compensation matters to be decided by the CGCNC based on its review and consideration of the above factors are:
- •
- appropriateness
of base salary levels;
- •
- the
size of the LTI pool; and
- •
- the amounts to be delivered to the NEOs and other key executives in the form of LTIs.
Annual Bonuses – Determined by Objective Profit-Based Formula, not Target-Setting
Annual bonuses in our executive compensation system are formula-based instead of target-based. The annual bonus for an executive is a specified percentage of our Pre-Tax Profits Before Profit Sharing under a formula which is discussed further in Section C of this CD&A. This formula-based approach helps to achieve a simple, objective and transparent compensation program which seeks to motivate executives to responsibly generate profits, which ultimately benefits all of our stakeholders.
When an executive first becomes a corporate "profit participator" – that is, entitled to an annual bonus based on Magna's profits, the CGCNC must determine the appropriate percentage of profits to be paid to him or her as an annual bonus. In addition to consideration of the general factors described above, the process of initially setting the executive's profit share typically involves:
- •
- analysis
by the CGCNC and its independent advisors of the forecast compensation level based on the proposed profit share forecast profit levels as per our most current
Board-approved three-year business plan;
- •
- benchmarking
of the proposed compensation for the executive as compared to equivalent positions within our compensation peer group; and
- •
- in the case of an executive who reports to our Chief Executive Officer, the Chief Executive Officer's recommendation regarding the level of compensation believed to be necessary to competitively compensate the executive.
Once an executive's profit sharing percentage has been approved by the CGCNC and the Independent Directors, it is not adjusted annually. However, if an executive changes responsibilities, his or her profit-share may need to be adjusted in order to ensure he or she is competitively compensated. In making an adjustment to an executive's profit sharing percentage, the CGCNC will typically follow a similar process to that used when a profit share is first established. Additionally, the CGCNC and Executive Management have a common understanding that, as part of the Board's review of the terms of any proposed material acquisition or disposition, the CGCNC will work with Executive Management to identify potential changes to executives' current employment contract terms, possibly including profit sharing percentages, to ensure that executive compensation arrangements remain appropriate following such transactions.
60 Compensation
CGCNC Discretion
The CGCNC maintains complete discretion with respect to the grant of LTIs, typically in the form of stock options. In connection with proposed stock option grants, the CGCNC considers a number of specific factors in addition to the general factors described earlier, including:
- •
- Magna's
financial, operating and stock price/TSR performance;
- •
- overall
profit sharing levels;
- •
- the
achievements of each executive in relation to long-term strategic and other criteria approved by the CGCNC (discussed below);
- •
- relative
proposed option grant awards among members of Executive Management and other optionees;
- •
- the
grant value of proposed options and recent prior option grants;
- •
- aggregate
stock option expense of the proposed grant and potential dilutive impact to shareholders; and
- •
- retention, succession and other relevant considerations.
The CGCNC's process around LTI grants seeks to enhance accountability for achievement of the company's strategic objectives and increase dialogue around the definition, refinement and measurement of strategic goals. In 2014, the CGCNC established a baseline stock option pool of $5.4 million for NEOs, based on a variety of considerations, including pay mix, historical grant sizes, dilution and quantum of total compensation. The CGCNC also established a baseline option pool of $10.2 million for all other optionees. The NEO baseline pool will be adjusted up or down based on the Board's annual assessment of Executive Management's performance on advancing strategic initiatives identified through the Board's strategic planning process, while the option pool for all other employees is expected to remain relatively stable year over year. Individual awards in each option pool are based on individual performance and other relevant considerations.
Executive Management's performance in respect of the five criteria below was assessed to determine the size of the 2015 NEO option pool. Quantitative performance ratings relative to the Board's target/expectations are submitted by Independent Directors to the Board Chair and then aggregated to determine a performance factor that is applied to the baseline stock option pool. The performance factor can range from 0% for performance well below target to 100% for performance which fully meets the target and up to a maximum of 140% for performance far in excess of target, with full gradation along that scale. The CGCNC maintains the discretion to adjust the performance multiplier to account for qualitative considerations, overall compensation levels or other factors, as it sees fit. Additionally, the CGNC may, from one year to the next, modify the strategic criteria used in determining NEO option pool size, or in the relative weighting of the criteria used.
| STRATEGIC CRITERIA |
WEIGHTING |
RAW PERFORMANCE FACTOR |
||
|---|---|---|---|---|
| Product Strategy | 15% | 95% | ||
Growth Strategy |
30% |
99% |
||
Operational Long-Term Improvement |
20% |
101.5% |
||
Succession Planning |
15% |
121.5% |
||
Innovation |
20% |
112.5% |
||
Raw Total |
100% |
105.9% |
||
Weighted Total |
105.4% |
|||
Compensation 61
The performance factor determined by the CGCNC is applied to the baseline option grant amount for the Chief Executive Officer to determine his award. The balance of the NEO option pool may be split among the four other NEOs based on their individual performance and other relevant considerations, as assessed by the CGCNC and the Chief Executive Officer. As noted, the above process is used by the CGCNC to determine the maximum NEO option pool size and award size. Actual option awards for NEOs are then subject to performance conditions prior to any options vesting, as discussed further in Section C of this CD&A.
The CGCNC exercised its discretion in several respects in connection with the grant of stock options in respect of 2015. In determining the value of each performance stock option, the CGCNC considered as a starting point the Black-Scholes value of a "plain vanilla" time-vested option. Since the inputs and assumptions disclosed in Note 2 to the Summary Compensation Table would have resulted in a Black-Scholes value per time-vested option which the CGCNC deemed to be unreasonably low, the CGCNC imposed a "floor" value of 20% of the exercise price. The impact of this determination by the CGCNC was to reduce the total number of options granted, moderating dilution from the option grant and reducing the potential for optionees to realize excessive gains over the option life. With respect to the performance stock options granted to the NEOs, the CGCNC also exercised its discretion in determining an appropriate discount to the "floor" value determined in respect of the time-vested options. Such discount was intended to reflect the fact that options with relative performance conditions and risk of forfeiture do not have the same economic value as time-vested options which have no risk of forfeiture. In assigning a 10% discount to the performance stock options, the CGCNC considered various valuation approaches, assumptions and scenarios, as well as the advice of its independent advisors and equity compensation consultants retained to assist Magna in determining the accounting value of the performance stock options.
How is Compensation Benchmarking Data Used by the CGCNC?
In light of Magna's formula-driven compensation system, compensation benchmarking data is not used for setting target pay within a range determined for a compensation peer group. However, compensation benchmarking data for senior officers is used to provide the CGCNC with a basis for determining Magna's pay for performance, including through "back-testing" of realizable pay, as well as a general market reference point to help it ensure that compensation falls within a reasonable competitive range.
Executive Compensation Peer Group Consists of 13 Automotive and Industrial Companies
Magna's executive compensation peer group consists of 13 companies from a broad comparator universe composed primarily of North American public companies which are direct industry peers or capital goods comparables. The broad universe of comparator companies was identified and screened by Hugessen using a three-tiered approach, with broader screening criteria for companies in the automotive industry and narrower criteria for companies in other industries, as follows:
| Automotive: | 1/5x to 5x Magna's Total Revenue and Total Enterprise Value ("TEV") | |
Close Capital Goods: |
1/3x to 3x Magna's Total Revenue and TEV |
|
Other Capital Goods: |
1/2x to 1.5x Magna's Total Revenue and TEV |
62 Compensation
In arriving at the peer group, Hugessen considered feedback from the CGCNC and Management and also applied its judgment to the numeric screens. Based on the above approach, the executive compensation peer group approved by the CGCNC consists of the following companies:
| 2015 EXECUTIVE COMPENSATION PEER GROUP(1) | ||
| BorgWarner Inc. | Johnson Controls Inc. | |
| Cummins Inc. | Lear Corp. | |
| Deere & Company | Navistar International Corp. | |
| Delphi Automotive PLC | PACCAR Inc. | |
| Eaton Corp. | Parker-Hannifin Corp. | |
| Illinois Tool Works Inc. | Textron Inc. | |
| Ingersoll-Rand PLC | ||
Note:
- 1.
- TRW Automotive Holdings Corp. was included in the above peer group until completion of its acquisition by a private company during 2015.
Performance Stock Option Peer Group Consists of 12 Automotive Companies
Magna's performance stock option peer group consists of 12 automotive companies selected from a comparator universe of publicly traded North American companies in the automotive industry. The selected peers are considered to be Magna's most direct competitors for business and investor capital, based on such factors as coverage by equity research analysts, as well as inclusion in industry indices and in the peer groups of peer companies.
The performance stock option peer group approved by the CGCNC consists of the following companies:
| 2015 PERFORMANCE STOCK OPTION PEER GROUP(1) | ||
| American Axle Manufacturing & Holdings Inc. | Johnson Controls Inc. | |
| Autoliv, Inc. | Lear Corp. | |
| BorgWarner Inc. | Linamar Corp. | |
| Dana Holding Corporation | Martinrea International Inc. | |
| Delphi Automotive plc | Tenneco Inc. | |
| Gentex Corp. | Visteon Corp. | |
Note:
- 1.
- TRW Automotive Holdings Corp. was included in the above peer group until completion of its acquisition by a private company during 2015.
Compensation 63
C. Elements of Magna's 2015 Executive Compensation Program
| 2015 NEOs | For 2015, our Named Executive Officers consisted of: | |||
• Donald J. Walker |
Chief Executive Officer |
|||
| • Vincent J. Galifi | Executive Vice-President and Chief Financial Officer | |||
| • Tommy J. Skudutis | Chief Operating Officer, Exteriors, Seating, Mirrors, Closures and Cosma | |||
| • Jeffrey O. Palmer | Executive Vice-President and Chief Legal Officer | |||
| • James J. Tobin | Chief Marketing Officer and President, Magna Asia | |||
| Mr. Tobin replaced Guenther Apfalter as an NEO for 2015, due in significant part to the impact of conversion of Mr. Apfalter's compensation from Euros to U.S. dollars. | ||
Employment Contracts |
Each NEO is subject to an employment agreement which specifies: |
|
• his base salary and profit sharing percentages, including the proportions of the annual profit sharing bonus payable in cash and RSUs; |
||
• standard benefits to be provided; |
||
• terms on which compensation can be clawed-back; |
||
• the securities maintenance formula applicable to the executive; and |
||
• the basis on which the executive's employment may be terminated. |
||
Overview |
Our 2015 compensation program for the NEOs consisted of the following elements: |
|
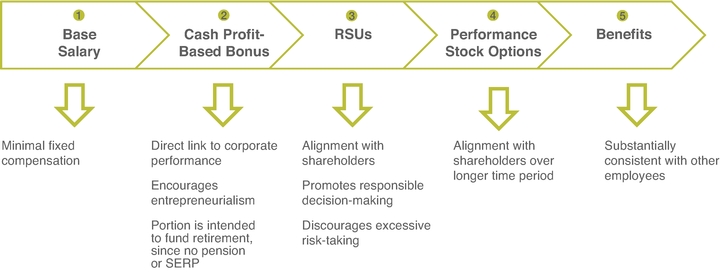
|
||
64 Compensation
The elements of compensation described above represented the following percentages of 2015 total compensation: |
||
Average NEO Total Compensation |
||
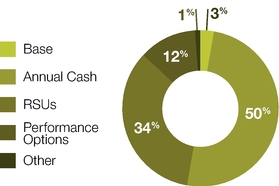
|
||
1. Base Salaries: |
We maintain base salaries for NEOs which are positioned significantly below base salaries in our peer group. These low base salaries are intended to: • maximize the incentive for each executive to pursue profitability for the benefit of all of Magna's stakeholders; |
|
• reinforce the link between executive pay and corporate performance; and |
||
• reflect and reinforce our entrepreneurial corporate culture. |
||
During 2015, the NEOs received identical base salaries of $325,000. |
| NAME |
BASE SALARY ($) |
|
|---|---|---|
| Donald J. Walker | 325,000 | |
| Vincent J. Galifi | 325,000 | |
| Tommy J. Skudutis | 325,000 | |
| Jeffrey O. Palmer | 325,000 | |
| James J. Tobin | 325,000 |
|
Compensation 65
| Annual Profit Sharing Bonus | Each NEO is contractually entitled to receive a specified percentage of our Pre-Tax Profits Before Profit Sharing as an annual profit sharing bonus. This measure is derived from Net Income as reported in our financial statements, adjusted to (among other things) add-back the provisions for income taxes and minority interests, employee profit sharing and aggregate incentive bonuses for specified members of our corporate management, including the NEOs. As disclosed earlier in this CD&A, the annual profit sharing bonus provides a direct link between an executive's compensation and the company's performance. Profit sharing bonuses are deeply rooted in our entrepreneurial culture – we believe that they have been a critical factor to our past success and will continue to be critical to our continued success in the future. These bonuses are highly variable – if Magna fails to generate a profit, no bonus will be paid. We believe this motivates executives to strive to achieve consistent profitability, as well as year over year profit growth. The CGCNC has implemented measures to moderate the growth of profit sharing bonuses above specified profit levels, as discussed further below. These measures, combined with measures described in Section D of this CD&A to manage compensation risk, seek to achieve a reasonable balance between risk and reward. | |
The specified profit sharing percentage represents the maximum percentage of our Pre-Tax Profits Before Profit Sharing that an executive is entitled to receive – his actual or effective profit sharing percentage may be lower in a year, since profit sharing declines as our Pre-Tax Profits Before Profit Sharing exceeds $1.5 billion, as follows: |
| PRE-TAX PROFITS BEFORE PROFIT SHARING |
PROPORTION OF SPECIFIED PROFIT SHARING PERCENTAGE |
|
|---|---|---|
| $0 to $1.5 billion | 100% | |
| $1.5 billion to $1.75 billion | 85% | |
| $1.75 billion to $2.0 billion | 70% | |
| $2.0 billion to $2.25 billion | 60% | |
| >$2.25 billion | 50% | |
| By way of example, our Chief Executive Officer's aggregate specified profit sharing bonus is 0.75% of our Pre-Tax Profits Before Profit Sharing. However, as a result of Magna's Pre-Tax Profits Before Profit Sharing exceeding $1.5 billion in 2015, Mr. Walker's effective profit sharing percentage was 0.6180% of our Pre-Tax Profits Before Profit Sharing. |
66 Compensation
Due to the impact of the foregoing profit sharing step-downs, the aggregate effective profit sharing percentages for NEOs were as follows in 2015: |
| NAME |
2015 AGGREGATE SPECIFIED PROFIT SHARING PERCENTAGE (%) |
2015 AGGREGATE EFFECTIVE PROFIT SHARING PERCENTAGE (%) |
||
|---|---|---|---|---|
| Donald J. Walker | 0.7500 | 0.6180 | ||
| Vincent J. Galifi | 0.3000 | 0.2472 | ||
| Tommy J. Skudutis | 0.3000 | 0.2472 | ||
| Jeffrey O. Palmer | 0.2025 | 0.1669 | ||
| James J. Tobin | 0.1100 | 0.0906 |
||
| For 2015, Mr. Palmer's profit sharing percentage was reduced by 10% compared to 2014 in connection with a mutually agreed pre-retirement leave arrangement. His profit share will reduce a further 10% in 2016 and continue at that level until his retirement. | ||
Annual Profit Share Split Between Cash and RSUs |
Sixty percent of the annual profit sharing bonus for each Corporate NEO was paid in cash, with the remaining 40% deferred in the form of RSUs. Since the value of compensation deferred in the form of RSUs is contingent on annual profitability, the RSUs are effectively front-end performance conditioned. |
|
Annual Profit Sharing Bonus "At Risk": |
In order to create maximum incentive to achieve profitability, profit sharing bonuses are earned from the first dollar of Pre-Tax Profits Before Profit Sharing generated by Magna and are completely "at risk" since they increase or decrease directly with changes in Magna's Pre-Tax Profits Before Profit Sharing. The combination of low base salaries, as discussed above, together with a highly variable annual profit sharing bonus can result in significant fluctuation in executive compensation from one year to the next, depending on our profitability. We believe that low base salaries combined with a highly variable annual profit sharing bonus motivates NEOs to strive for: |
|
• consistent profitability to achieve stable levels of annual compensation; and |
||
• long-term growth in profitability to achieve long-term compensation growth. |
||
Recognition of Individual and Team Performance: |
The specified percentage of our Pre-Tax Profits Before Profit Sharing which an executive is entitled to receive as an annual profit sharing bonus is intended to reflect the executive's individual contribution to management team performance. However, the direct link to Magna's Pre-Tax Profits Before Profit Sharing ultimately reflects Magna's overall performance. An executive's specified profit sharing percentage is not adjusted annually once it has been set, but may be adjusted from time to time if an executive's responsibilities change significantly. |
Compensation 67
2. Annual Profit Sharing Bonus – Cash Portion: |
Annual profit sharing bonuses paid in cash to NEOs were as follows in 2015: |
| NAME |
2015 EFFECTIVE PROFIT SHARING – CASH (%) |
2015 EFFECTIVE PROFIT SHARING – CASH ($) |
||
|---|---|---|---|---|
| Donald J. Walker | 0.3708 | 10,444,000 | ||
| Vincent J. Galifi | 0.1483 | 4,177,000 | ||
| Tommy J. Skudutis | 0.1483 | 4,177,000 | ||
| Jeffrey O. Palmer | 0.1001 | 2,820,000 | ||
| James J. Tobin | 0.0544 | 1,532,000 |
||
| Since Magna does not provide pensions, SERPs or other retirement benefits, a portion of the annual cash profit sharing bonus is intended to fund NEOs' retirement savings. We believe that this is an important consideration when comparing the structure of Magna's executive compensation against that of other companies which provide pensions, SERPs or other retirement benefits. | ||
Cash Portion Paid in Quarterly Installments |
The cash portion of the annual profit sharing bonus is paid in installments. Installments for the first three fiscal quarters of each year are paid to the Corporate NEOs following the end of each fiscal quarter, based on our year to date Pre-Tax Profits Before Profit Sharing. Following the end of each fiscal year, we calculate the profit sharing bonus each Corporate NEO is entitled to for that fiscal year, subtract the installments paid for the first three quarters and pay the difference as the final installment. |
|
3. Annual Profit Sharing Bonus – RSU Portion: |
Deferral of a portion of the annual profit-sharing bonus serves a number of important functions in our executive compensation program, including alignment of interests with shareholders, promotion of responsible decision-making, discouragement of excessive risk-taking, balancing the time horizon of different compensation tools, as well as motivation and retention of executives. |
|
The portion of the annual profit sharing bonus deferred in the form of RSUs is completely "at risk". The initial bonus value deferred into RSUs is dependent on Magna's annual profitability and, once credited, remains "at risk" since RSU value fluctuates with the market price of our Common Shares. RSUs are redeemed by delivery of Common Shares in December of the second year after the year of grant. For example, RSUs that were granted in 2015 will be redeemed in December 2017. |
||
Annual NEO profit sharing bonuses deferred in the form of RSUs were as follows in 2015: |
| NAME |
2015 EFFECTIVE PROFIT SHARING – RSUS (%) |
2015 EFFECTIVE PROFIT SHARING – RSUS ($) |
||
|---|---|---|---|---|
| Donald J. Walker | 0.2472 | 6,962,000 | ||
| Vincent J. Galifi | 0.0989 | 2,785,000 | ||
| Tommy J. Skudutis | 0.0989 | 2,785,000 | ||
| Jeffrey O. Palmer | 0.0668 | 1,880,000 | ||
| James J. Tobin | 0.0362 | 1,021,000 |
||
68 Compensation
| RSUs Deferred in Quarterly Installments | Installments of the RSU portion of the annual profit sharing bonus for the first three fiscal quarters of each year are credited to each NEO following the end of each fiscal quarter, based on our year to date Pre-Tax Profits Before Profit Sharing. The number of RSUs deferred is calculated by taking 40% of the dollar value of an NEO's quarterly profit share and dividing it by the average of the closing prices of our Common Shares on NYSE over the twenty trading days ending on the last business day of the fiscal quarter. Following the end of each fiscal year, we calculate the amount each NEO is entitled to for that fiscal year, subtract the installments credited for the first three quarters and defer an amount equal to the difference. Dividends on RSUs are paid in cash at the same time and in the same amounts as dividends on our Common Shares. |
| 4. Performance Stock Options: |
We utilize stock options as a long-term incentive. Stock options help ensure a medium (three years) to long (seven years) term focus on share returns, which serves to align the interest of management and shareholders over that time period. Stock options also support the goal of executive retention over the vesting period since an executive who resigns will forfeit unvested options. | |
Stock options are typically granted in late February or early March of a year in respect of the prior year. For example, stock options granted in February 2016 relate to the optionees' performance in 2015 and, in the case of NEOs, have been included as 2015 compensation in the Summary Compensation Table. Annual stock option grants are not expected to exceed 1% of our issued and outstanding shares. |
||
Commencing in February 2015, the CGCNC recommended and our Board approved a modified approach to option grants for our most senior executives, including the NEOs. This approach is intended to incent and reward executives for creating superior absolute and relative shareholder value, by imposing a relative TSR performance hurdle as a condition to vesting. Performance stock options are eligible to vest in tranches over the first three anniversaries of the grant date. However, a relative TSR threshold of 60th percentile must also be met before options can vest, as described below. Unlike our time-vested options, performance stock options vest in different proportions, with a greater proportion of performance stock options vesting on the later vesting dates. The relative TSR measurement periods for each vesting date are matched to the vesting period to incent the achievement of higher TSR over short and medium terms, as follows: |
| VESTING DATE |
PROPORTION OF OPTIONS VESTING |
PERFORMANCE HURDLE |
||
|---|---|---|---|---|
| First anniversary | 17% | 1-year TSR ³ 60th percentile | ||
| Second anniversary | 33% | 2-year TSR ³ 60th percentile | ||
| Third anniversary | 50% | 3-year TSR ³ 60th percentile | ||
Compensation 69
| If the relative TSR hurdle is not met at a vesting date, performance stock options will not vest. However, the performance stock options which did not vest at such anniversary date will vest and become exercisable at any date afterwards during the remaining term of the options if Magna's relative TSR measured from the grant date is at or above the 60th percentile of the performance stock option peer group. We believe this feature is important to provide a continuing incentive for NEOs to strive to achieve or exceed the missed performance hurdle. In addition to promoting alignment with shareholders, such a feature supports the objectives of retaining and motivating valued executives. | ||
The following graphic depicts the mechanics of the relative TSR performance hurdle, as applied to a theoretical grant of 60,000 options: |
||
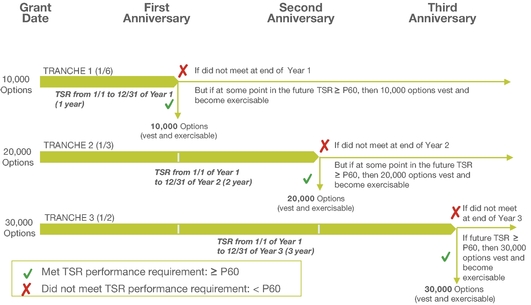
|
||
Stock options granted to NEOs prior to 2015 were only subject to time vesting. Time-vested stock options continue to be granted to certain other employees and managers who are not part of Executive Management. The following options were granted on February 29, 2016: |
| TYPE OF OPTION |
EXERCISE PRICE ($) |
ELIGIBLE OPTIONEES |
NO. OF OPTIONS |
OPTION BURN RATE(1) (%) |
|||||
|---|---|---|---|---|---|---|---|---|---|
| Performance-vested Options | 38.23 | 14 | 1,269,914 | 0.32 | |||||
| Time-vested Options | C$51.62 / 38.23 | 106 | 984,846 | 0.24 | |||||
| Total | — | 120 | 2,254,760 | 0.56 | |||||
Note: |
|||||||||
1. Represents the applicable number of options, stated as a percentage of Magna's issued and outstanding shares on the grant date. |
|||||||||
| For a discussion of the process and criteria used to determine the overall size of option grants, please refer to Section B of this CD&A. |
70 Compensation
A total of 809,884 of the 1,269,914 performance stock options granted on February 29, 2016 were granted to NEOs, as follows: |
| NAME |
NO. OF OPTIONS (#) |
COMPENSATION VALUE(1) ($) |
||
|---|---|---|---|---|
| Donald J. Walker | 417,878 | 2,875,000 | ||
| Vincent J. Galifi | 144,186 | 992,000 | ||
| Tommy J. Skudutis | 136,628 | 940,000 | ||
| Jeffrey O. Palmer | 49,419 | 340,000 | ||
| James J. Tobin | 61,773 | 425,000 |
||
Note: |
||||
1. Represents the compensation value intended to be conferred by the Board in the form of performance stock options. See Note 2 to "Summary Compensation Table" for details regarding the methodology and assumptions used to value the options granted to the NEOs. |
||||
| We typically grant stock options with a seven year term or life. The applicable option exercise price is the market price of our Common Shares on the TSX (for options denominated in C$) or NYSE (for options denominated in US$). We do not grant options at a discount to market price. | ||
Option Plan – Dilution and Overhang |
Taking into account the options granted on February 29, 2016, Magna's option dilution and overhang were as follows: |
|
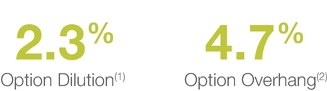
|
||
Notes: |
||
1. Represents all stock options previously granted but not exercised as of February 29, 2016, expressed as a proportion of the number of Magna's Common Shares which were issued and outstanding as of such date. |
||
2. Represents all stock options available for grant and all stock options previously granted but not exercised as of February 29, 2016, expressed as a proportion of the number of Magna's Common Shares which were issued and outstanding as of such date. |
||
Stock Option Plans |
Current stock option grants are made under our 2009 Incentive Stock Option Plan, which was approved by shareholders in May 2010, which is discussed in further detail under "Incentive Plan Awards". |
|
Option Exercise Increases an Executive's Securities Maintenance Requirement |
We treat a stock option gain (being market price at time of exercise, less exercise price and deemed taxes on the gain) as if it was income earned in the year of the option exercise. As a result, the number of shares to be held pursuant to an NEO's securities maintenance requirement will increase in respect of a year in which stock options are exercised. If the executive already owns a sufficient number of Common Shares and RSUs to meet this increased securities maintenance requirement, no further shares need to be held from the option exercise. If an NEO does not own enough shares to meet this increased securities maintenance requirement, the additional required number of shares will need to be held following the option exercise. |
Compensation 71
Post-Retirement Hold-Back |
If an NEO ceases to be employed by Magna (including any affiliates) within one year following the date of a stock option exercise, he must hold shares with a market value (at the exercise date) equal to the net after-tax gain until the one-year anniversary of the exercise date. |
|
Restricted Shares |
In the past, we made restricted share grants to Donald Walker, Vincent Galifi, Jeffrey Palmer and Tommy Skudutis. The last such grant was made in 2008. Restricted share grants are not expected to be an ongoing feature of our executive compensation program; however, previously granted restricted shares continue to be released to the Corporate NEOs in accordance with their original terms of grant. |
|
Forfeiture of Restricted Shares |
Restricted shares are released to an executive in equal 10% increments over a ten-year period immediately following an initial five-year qualification period. However, restricted shares are subject to forfeiture if: |
|
• during the ten-year release period, the executive competes with Magna, solicits Magna employees or discloses confidential Magna information to a third party; |
||
• while employed by Magna, the executive fails to devote his full time and attention to Magna's business; or |
||
• the executive's employment is terminated due to theft, bribery or fraud. |
||
Since the restricted shares were taxed in the year of grant, forfeiture of the shares also effectively results in forfeiture of amounts paid personally by the executive as taxes on the restricted shares. |
||
Anti-Hedging Restrictions |
Executives are not permitted to engage in activities which would enable them to improperly profit from changes in our stock price or reduce their economic exposure to a decrease in our stock price. Prohibited activities include "puts", "collars", equity swaps, hedges, derivative transactions and any transaction aimed at limiting an executive's exposure to a loss or risk of loss in the value of the Magna securities which he holds. |
|
Automatic Securities Disposition Plans |
Executives are permitted to enter into automatic securities disposition plans ("ASDPs"), which are also known as Rule 10b5-1 Plans. Such plans allow executives to establish a plan for the sale of Common Shares held by the executive and exercise of stock options granted to them, subject to meeting all legal requirements applicable to such plans. Among other things, an executive may only enter into, modify or terminate a plan while he or she is not under a trading blackout or otherwise in possession of material undisclosed information. |
|
5. Benefits |
Benefits provided to NEOs are the same as those provided to other employees in the same country, with a few exceptions discussed below. As discussed earlier, Magna does not provide a defined benefit pension plan or other retirement benefits to NEOs, consistent with our compensation approach to employees generally. |
|
Medical, Dental and Disability Benefits |
NEOs receive the same medical, dental and disability benefits as other employees in the same country. |
72 Compensation
CEO and CFO Life Insurance Premiums Are Reimbursed |
NEOs other than Donald Walker and Vincent Galifi receive the same insurance benefits as those available to other employees in the same country. In addition to these standard insurance benefits, we reimbursed life insurance premiums on insurance policies for Donald Walker and Vincent Galifi. During 2015, the premiums reimbursed were as follows: |
|
• Donald Walker: $120,000(1) |
||
• Vincent Galifi: $43,000(1) |
||
Note: |
||
1. Converted from C$ at the BoC noon spot rate on December 31, 2015. |
||
Life insurance premium reimbursements are not grossed-up for income tax. |
||
"Perks" are Limited |
We provide limited "perks" to NEOs consisting of occasional personal use of corporate aircraft and access to corporate facilities, in each case when not required for business purposes and subject to reimbursement as discussed below. |
|
Occasional Personal Use of Corporate Aircraft Is Subject to Partial Reimbursement |
NEOs are permitted occasional personal use of corporate aircraft, in accordance with policies approved by the CGCNC. Any such personal use must be reimbursed at 150% of an equivalent business class airfare for the same route. However, the difference between the "aggregate variable operating cost" of the personal flight and the amount reimbursed by the executive is treated as a "perk" and is disclosed in the Summary Compensation Table under "All Other Compensation". We add together all variable costs for operating the aircraft for a fiscal year, including fuel, maintenance, customs charges, landing and handling fees, data and communications charges and any other similar costs and divide that total by the number of hours flown during the year to calculate a cost per flight hour. The cost per flight hour multiplied by the flight hours for a personal flight, minus the amount reimbursed by the executive, is the value of the "perk". |
|
Occasional Access to Corporate Facilities Is Subject to Reimbursement |
During 2015, we held one property in North America which was available primarily for business purposes. Subject to availability, executives were allowed to rent such property for occasional personal use, based on a nightly rental rate that was set with reference to comparable facilities. Any personal use was billed to an executive and was reimbursed in full. The property was sold in 2015. |
|
NEOs are also entitled to access the Magna Golf Club adjacent to the Company's head office for business purposes. Applicable charges relating to personal use are paid for by the executive at the club's regular rates. |
Compensation 73
Executive Equity Ownership |
||
Executive Management Securities Maintenance Requirements |
Each NEO is subject to a securities maintenance requirement which takes one-third of his compensation in respect of each of the prior three calendar years consisting of base salary, profit sharing bonus and other incentive compensation, including gains realized from the exercise of stock options, after deducting income tax at a deemed rate of 50%, then divides the result by the average daily closing prices of our Common Shares on NYSE over those three years. In the event an NEO falls below the securities maintenance requirement, the NEO's bonus is withheld until he demonstrates compliance with the requirement. |
| NAME |
NO. OF SHARES AND RSUS TO BE HELD (#) |
NO. OF SHARES AND RSUS HELD AS OF 12/31/15 (#) |
STATUS |
12/31/15 VALUE(1) ($) |
||||
|---|---|---|---|---|---|---|---|---|
| Donald J. Walker | 246,957 | 1,644,515 | Exceeds | 66,702,000 | ||||
| Vincent J. Galifi | 238,054 | 1,016,375 | Exceeds | 41,224,000 | ||||
| Tommy J. Skudutis | 101,783 | 319,379 | Exceeds | 12,954,000 | ||||
| Jeffrey O. Palmer | 162,898 | 785,873 | Exceeds | 31,875,000 | ||||
| James J. Tobin(2) | 64,098 | 44,646 | Below | 1,811,000 |
||||
Note: |
||||||||
1. Based on the closing price of Magna Common Shares on the NYSE on December 31, 2015. |
||||||||
2. Mr. Tobin was unable to purchase shares to meet his requirement due to trading blackouts in 2015. He acquired 24,070 shares on February 29, 2016, following expiry of Magna's blackout relating to fourth quarter and full-year financial results. |
||||||||
| Termination/ Severance | ||
Termination/ Severance Payments are Limited to a Maximum of 24 Months Compensation |
Each Corporate NEO is entitled to 12 months' severance pay, plus one additional month of severance pay for each year employed by Magna (including any subsidiaries), to a maximum of 24 months' severance (the "Notice Period") in the event of termination without cause. Based on their years of service to Magna, each Corporate NEO would be entitled to 24 months' severance pay if terminated without cause. |
| NAME |
TENURE WITH (MAGNA) (YEARS) |
SEVERANCE ENTITLEMENT (# MONTHS) |
||
|---|---|---|---|---|
| Donald J. Walker | 28+ | 24 | ||
| Vincent J. Galifi | 26+ | 24 | ||
| Tommy J. Skudutis | 24+ | 24 | ||
| Jeffrey O. Palmer | 15+ | 24 | ||
| James J. Tobin | 13+ | 24 |
||
| Severance payments are based on the average of an NEO's total compensation excluding LTIs for the 12 fiscal quarters prior to the termination. |
74 Compensation
A summary showing the treatment of each compensation element in different termination scenarios is set forth below under "Summary of Treatment of Compensation on Resignation, Retirement, Termination or Change in Control". |
||
Change in Control Protections |
||
Double-Trigger |
We maintain "double trigger" change in control protection for the Corporate NEOs; however, such protection does not provide any enhanced severance. The primary benefit is the acceleration of any unvested stock options in the event that a change in control is followed by termination of employment or constructive dismissal for "good reason". In most foreseeable situations, all outstanding stock options would likely become automatically exercisable in the event of a Change in Control, in which case there would be no incremental benefit to the executive of such protection. |
|
The definition of "good reason" for purposes of the change in control protection covers a number of standard events that would ordinarily be a basis for constructive dismissal. In addition, the definition includes as an event of good reason the implementation of a financing, sale, merger, reorganization or other transaction related to a change in control, which would reasonably be expected to reduce Pre-Tax Profits Before Profit Sharing by 20% over the following two-year period from the last Board-approved business plan (a "Leverage Transaction"). The principal intent of this provision is to address a scenario whereby a purchaser of Magna could add significant debt to Magna's balance sheet, but could also include other restructuring transactions following a change in control, the effect of which in each case could be to materially reduce or eliminate profits and thus annual profit sharing bonuses for any Corporate NEO whose employment continued following the change in control. In any such scenario, there could be a misalignment of interests between Corporate NEOs and shareholders since Corporate NEOs could have a disincentive to support a change in control transaction involving a potential purchaser who plans to implement a Leverage Transaction following completion of the change in control. |
||
To address this concern, in the event a purchaser of Magna implements a Leverage Transaction following a change in control, any Corporate NEO whose employment continues could claim that the second "trigger" of the double-trigger protection had been activated, thus entitling him to standard severance. Additionally, if such Corporate NEO's stock options had not been automatically exercised in connection with the change in control, any unvested stock options other than performance stock options would then become exercisable. However, in most foreseeable situations, all outstanding stock options would be automatically exercised in connection with the completion of the change in control transaction. |
||
Compensation 75
Summary of Treatment of Compensation on Resignation, Retirement, Termination, or Change in Control |
| Element of Compensation |
Resignation |
Retirement |
Termination – Cause |
Termination – No Cause |
Termination Without Cause on Change in Control |
|||||
|---|---|---|---|---|---|---|---|---|---|---|
| Base Salary | Pro-rated to effective date | Pro-rated to effective date | Pro-rated to effective date | Average of compensation excluding LTIs for the last 12 fiscal quarters | Average of compensation excluding LTIs for the last 12 fiscal quarters | |||||
| Annual Bonus – Cash | Pro-rated to effective date | Pro-rated to effective date | Pro-rated to effective date | paid out over severance period (up to 24 months) as | paid out over severance period (up to 24 months) as | |||||
| Annual Bonus – RSUs | Pro-rated to effective date. Redeemed on regular payout date (2+ years after earned). | Pro-rated to effective date. Redeemed on regular payout date (2+ years after earned). | Pro-rated to effective date. Redeemed on regular payout date (2+ years after earned). | salary continuation (bi-weekly) or lump-sum. | salary continuation (bi-weekly) or lump-sum. | |||||
| Stock Options | Unvested and unexercised options expire on earlier of option expiry date and three months after effective date of resignation. | Unvested and unexercised options expire on earlier of option expiry date and three years after effective date of retirement. No acceleration of performance stock options. | All unexercised options expire on effective date of termination. | Unvested and unexercised options expire on earlier of option expiry date and three months after effective date of termination. No acceleration of performance stock options. | Vested options can be exercised until earlier of option expiry date and 12 months after Notice Period (as defined above). Unvested time-vested options accelerate and can be exercised until same date. No acceleration of performance stock options. | |||||
| Restricted Shares | After qualifying period, released in 1/10 tranches per year provided conditions of confidentiality, non-solicitation and non-competition are observed. | After qualifying period, released in 1/10 tranches per year provided conditions of confidentiality, non-solicitation and non-competition are observed. | After qualifying period, released in 1/10 tranches per year provided conditions of confidentiality, non-solicitation and non-competition are observed. Where termination is due to theft, bribery or fraud, unreleased restricted shares are forfeited. | After qualifying period, released in 1/10 tranches per year provided conditions of confidentiality, non-solicitation and non-competition are observed. | After qualifying period, released in 1/10 tranches per year provided conditions of confidentiality, non-solicitation and non-competition are observed. | |||||
| Benefits & Perks | None | None | None | None | None | |||||
| Pension | None | None | None | None | None | |||||
76 Compensation
| Summary of Incremental Severance, Termination and Change in Control Payments | The table below shows the value of the estimated incremental payments or benefits that would accrue to each NEO upon termination of his or her employment following resignation, normal retirement, termination without cause, termination with cause and termination without cause on change in control. For stock options, the values shown represent the in-the-money value of any grants the vesting of which would accelerate as a result of each termination circumstance below. |
| |
Resignation |
Retirement |
Termination – Cause |
Termination Without Cause |
Termination Without Cause on Change in Control |
|||||||
|---|---|---|---|---|---|---|---|---|---|---|---|---|
| Donald J. Walker | ||||||||||||
| Severance | NIL | NIL | NIL | 34,457,000 | 34,457,000 | |||||||
| RSUs | NIL | NIL | NIL | NIL | NIL | |||||||
| Stock Options | NIL | NIL | NIL | NIL | 3,011,000 | (1) | ||||||
| Benefits & Perks | NIL | NIL | NIL | NIL | NIL | |||||||
| Pension | NIL | NIL | NIL | NIL | NIL | |||||||
| Total | 37,468,000 | |||||||||||
| Vincent J. Galifi | ||||||||||||
| Severance | NIL | NIL | NIL | 14,172,000 | 14,172,000 | |||||||
| RSUs | NIL | NIL | NIL | NIL | NIL | |||||||
| Stock Options | NIL | NIL | NIL | NIL | 1,053,000 | (1) | ||||||
| Benefits & Perks | NIL | NIL | NIL | NIL | NIL | |||||||
| Pension | NIL | NIL | NIL | NIL | NIL | |||||||
| Total | 15,225,000 | |||||||||||
| Tommy J. Skudutis | ||||||||||||
| Severance | NIL | NIL | NIL | 14,172,000 | 14,172,000 | |||||||
| RSUs | NIL | NIL | NIL | NIL | NIL | |||||||
| Stock Options | NIL | NIL | NIL | NIL | 910,000 | (1) | ||||||
| Benefits & Perks | NIL | NIL | NIL | NIL | NIL | |||||||
| Pension | NIL | NIL | NIL | NIL | NIL | |||||||
| Total | 15,082,000 | |||||||||||
| Jeffrey O. Palmer | ||||||||||||
| Severance | NIL | NIL | NIL | 10,444,000 | 10,444,000 | |||||||
| RSUs | NIL | NIL | NIL | NIL | NIL | |||||||
| Stock Options | NIL | NIL | NIL | NIL | 452,000 | (1) | ||||||
| Benefits & Perks | NIL | NIL | NIL | NIL | NIL | |||||||
| Pension | NIL | NIL | NIL | NIL | NIL | |||||||
| Total | 10,896,000 | |||||||||||
| James J. Tobin | ||||||||||||
| Severance | NIL | NIL | NIL | 5,609,000 | 5,609,000 | |||||||
| RSUs | NIL | NIL | NIL | NIL | NIL | |||||||
| Stock Options | NIL | NIL | NIL | NIL | 256,000 | (1) | ||||||
| Benefits & Perks | NIL | NIL | NIL | NIL | NIL | |||||||
| Pension | NIL | NIL | NIL | NIL | NIL | |||||||
| Total | 5,865,000 | |||||||||||
| Note: | ||
1. Represents the in-the-money value of options, the vesting of which is accelerated as a result of a change in control, using the closing price of Magna Common Shares on the TSX on December 31, 2015, converted at the BoC noon spot rate on such date since these options are denominated in C$. |
Compensation 77
D. Compensation Risk Management
Overall Level of Compensation Risk is Reasonable in Light of Nature of Magna's Business and Industry |
The CGCNC has considered whether Magna's executive compensation system may encourage excessive risk taking. The CGCNC concluded that the potential risks created by any particular element of the system are appropriately mitigated by other elements and that the overall level of risk is reasonable in light of the nature of Magna's business and the automotive industry. In reaching this conclusion, the CGCNC considered the methods described below which are employed to help establish an appropriate balance between risk and reward, as well as to encourage responsible decision-making. |
|
Board/CGCNC Oversight Of Executive Compensation |
The Board maintains oversight responsibility for total compensation of the NEOs, profit sharing for all members of Executive Management and incentive compensation generally, including stock option grants for all employees. In fulfilling its oversight responsibilities with respect to executive compensation, the Board is assisted by the CGCNC, which makes its recommendations to the Board. The CGCNC is assisted by independent compensation and legal advisors selected and overseen directly by it. |
|
In connection with its general oversight responsibilities, the Board maintains approval responsibility for a number of matters which affect executive compensation, including long-term corporate strategy, consolidated business plans, Magna's annual capital expenditure budget, material acquisitions/dispositions, as well as financing strategy. The Board also monitors and receives regular updates on a broad range of financial and other measures, including return on funds employed, which assists the Board in assessing the company's performance on a risk-adjusted basis. |
||
Mix of Compensation |
Magna's compensation system includes a mix of short, medium and long-term compensation to incent performance over a range of time horizons. |
|
Profit Sharing Percentages Decline as Profits Increase |
As Magna's Pre-Tax Profits Before Profit Sharing exceed $1.5 billion, profit sharing percentages for Executive Management decline, which serves to mitigate the risks of an uncapped compensation system while still providing incentive to achieve profits in excess of that threshold. |
|
Impairments and Restructuring Charges Typically Reduce Executive Compensation |
Under Magna's profit sharing formula, impairments and restructuring charges typically reduce Pre-Tax Profits Before Profit Sharing and thus executive compensation. This outcome is desirable since it serves to align the interests of executives and shareholders and reinforce the link between pay and performance. |
|
Deferral of Significant Proportion of Annual Compensation |
The deferral of 40% of the annual profit sharing bonus in the form of RSUs for over two years serves to encourage longer-term decision-making and maintain alignment between NEOs and shareholders over the deferral period. |
78 Compensation
Clawback Provisions |
The employment contract between Magna and each NEO contains a clawback provision in the event of a financial restatement with respect to any fiscal year (excluding a restatement resulting from retroactive application of a change to GAAP). In this circumstance, each executive must return the difference between: (a) the compensation payable based on the restated financial statements, and (b) the amount actually paid to him. Moreover, the clawback extends to both the cash and RSU portions of the profit sharing bonus. Any amount to be clawed-back can be set-off by Magna against future compensation. |
|
Forfeiture Provisions |
Where an executive's employment is terminated for "cause", he or she forfeits his unreleased restricted shares. Since the restricted shares were taxed in the year of grant, forfeiture of the shares also effectively results in forfeiture of amounts paid personally by the executive as taxes on the restricted shares. The term "cause" for this purpose is defined as termination for theft, bribery or fraud. |
|
Additionally, unexercised stock options granted in 2012 and afterwards are subject to forfeiture in the event of theft, bribery and fraud, while options granted in 2015 and afterwards are also subject to forfeiture for a material breach of our Code of Conduct & Ethics. |
||
Significant Wealth "At Risk" |
The significant equity exposure faced by each NEO, as demonstrated by the value of all Common Shares and RSUs held by each such NEO, serves to create strong alignment between executives and shareholders generally. Additionally, the risk of loss of equity value creates a powerful incentive to make responsible business decisions and avoid excessive risk-taking. Equity-based wealth at risk for each NEO is as follows as of the Record Date: |
| NAME |
RECORD DATE VALUE OF COMMON SHARES(1) ($) |
RECORD DATE VALUE OF RSUS(1) ($) |
RECORD DATE IN- THE-MONEY VALUE OF OPTIONS(2) ($) |
AGGREGATE RECORD DATE WEALTH "AT RISK" ($) |
||||
|---|---|---|---|---|---|---|---|---|
| Donald J. Walker | 59,901,000 | 11,666,000 | 38,701,000 | 110,268,000 | ||||
| Vincent J. Galifi | 39,300,000 | 4,666,000 | 8,648,000 | 52,614,000 | ||||
| Tommy J. Skudutis | 9,482,000 | 4,666,000 | 997,000 | 15,145,000 | ||||
| Jeffrey O. Palmer | 16,074,000 | 3,328,000 | 300,000 | 19,702,000 | ||||
| James J. Tobin | 1,030,000 | 1,711,000 | 1,902,000 | 4,643,000 |
||||
| Notes: | ||
1. Calculated using the closing price of Magna Common Shares on the NYSE on the Record Date. 2. Calculated using the closing price of Magna Common Shares on the TSX or NYSE, as applicable, and the BoC noon spot rate on the Record Date for options denominated in C$. |
||
Stock Option Exercises Add to Securities Maintenance Requirement |
When an executive exercises stock options, the gain arising from the sale of underlying shares (being market price at time of exercise, less exercise price) is treated as if it was compensation earned in the year of option exercise. This has the effect of increasing the number of shares an executive is required to hold as part of his securities maintenance requirement, as described under "Executive Equity Ownership". |
|
Post-Retirement Holdback of Option Shares |
Where an executive ceases to be employed by Magna within one year following the date of a stock option exercise, a portion of the option shares must continue to be held by him or her until the first anniversary of the date of exercise. |
|
Anti-Hedging Restrictions |
Magna employees, including NEOs, are prohibited from hedging their exposure to declines in Magna's share price. This measure seeks to maintain alignment of interests between executives and shareholders. |
Compensation 79
Summary Compensation Table
The following table sets forth a summary of all compensation earned in respect of 2015, 2014 and 2013 by the individuals who were our Named Executive Officers in respect of 2015. All amounts are presented in U.S. dollars and any applicable amounts in other currencies have been converted to U.S. dollars.
| NON-EQUITY INCENTIVE PLAN COMPENSATION ($) |
||||||||||||||||||
| NAME AND PRINCIPAL POSITION |
YEAR |
SALARY ($) |
SHARE-BASED AWARDS(1) ($) |
OPTION-BASED AWARDS(2) ($) |
ANNUAL(3) ($) |
LONG- TERM ($) |
PENSION VALUE ($) |
ALL OTHER COMPENSATION ($) |
TOTAL COMPENSATION ($) |
|||||||||
| Donald J. Walker | 2015 | 325,000 | 6,962,000 | 2,875,000 | 10,444,000 | NIL | NIL | 155,000 | 20,761,000 | |||||||||
| Chief Executive Officer | 2014 | 325,000 | 7,024,000 | 3,145,000 | 10,535,000 | NIL | NIL | 175,000(4) | 21,204,000 | |||||||||
| 2013 | 325,000 | 6,298,000 | 2,727,000 | 9,447,000 | NIL | NIL | 182,000(4) | 18,979,000 | ||||||||||
| Vincent J. Galifi | 2015 | 325,000 | 2,785,000 | 992,000 | 4,177,000 | NIL | NIL | 66,000 | 8,345,000 | |||||||||
| Executive Vice-President | 2014 | 325,000 | 2,809,000 | 1,107,000 | 4,214,000 | NIL | NIL | 66,000(5) | 8,521,000 | |||||||||
| and Chief Financial Officer | 2013 | 325,000 | 2,519,000 | 950,000 | 3,779,000 | NIL | NIL | 88,000(5) | 7,661,000 | |||||||||
| Tommy J. Skudutis | 2015 | 325,000 | 2,785,000 | 940,000 | 4,177,000 | NIL | NIL | 4,000 | 8,231,000 | |||||||||
| Chief Operating Officer, | 2014 | 325,000 | 2,809,000 | 994,000 | 4,214,000 | NIL | NIL | 14,000(6) | 8,356,000 | |||||||||
| Exteriors, Seating, | 2013 | 325,000 | 2,519,000 | 868,000 | 3,779,000 | NIL | NIL | 11,000(6) | 7,502,000 | |||||||||
| Mirrors, Closures and Cosma | ||||||||||||||||||
| Jeffrey O. Palmer | 2015 | 325,000 | 1,880,000 | 340,000 | 2,820,000 | NIL | NIL | 23,000 | 5,388,000 | |||||||||
| Executive Vice-President | 2014 | 325,000 | 2,107,000 | 413,000 | 3,161,000 | NIL | NIL | NIL | 6,006,000 | |||||||||
| and Chief Legal Officer | 2013 | 325,000 | 1,889,000 | 413,000 | 2,834,000 | NIL | NIL | 35,000(7) | 5,496,000 | |||||||||
| James J. Tobin | 2015 | 325,000 | 1,021,000 | 425,000 | 1,532,000 | NIL | NIL | NIL | 3,303,000 | |||||||||
| Chief Marketing Officer | 2014 | 325,000 | 1,030,000 | 450,000 | 1,545,000 | NIL | NIL | NIL | 3,350,000 | |||||||||
| and President, Magna Asia | 2013 | 325,000 | 924,000 | 413,000 | 1,386,000 | NIL | NIL | NIL | 3,048,000 |
|||||||||
Notes:
- 1.
- Amounts
disclosed in this column represent the grant date fair value of annual profit sharing bonuses deferred in the form of RSUs.
- 2.
- Values
shown for 2015 and 2014 represent the compensation value intended to be conferred by the Board in the form of the performance stock options granted effective February 29,
2016 and February 27, 2015, respectively. In valuing such options, the CGCNC initially made reference to the value of a time-vested stock option determined using the Black-Scholes option
pricing model, as set forth in the table below. Since the inputs and assumptions used in the Black-Scholes option pricing model would have resulted in a value below 20% of the option exercise prices
for 2015 and 2014, which the CGCNC deemed to be unreasonably low, the CGCNC imposed a "floor" value of 20% of the exercise price. The CGCNC assigned a 10% discount to the "floor" value to reflect the
impact of the relative performance hurdle and risk of forfeiture inherent in the performance-vested stock options. In determining the discount to be 10%, the CGCNC considered various valuation
approaches, assumptions and scenarios, as well as the advice of its independent advisors and equity compensation consultants retained to assist Magna in determining the accounting value of the
performance stock options.
The compensation value of the options shown for 2015 and 2014, as determined above, differs from the accounting value of such options, which was determined using a Monte Carlo simulation model. A Monte Carlo simulation is a generally accepted statistical technique, which was used to simulate a range of possible future stock prices over the seven-year option term for Magna and the companies in its performance stock option peer group. The simulation generates an estimate of the fair value of a performance-vested stock option for purposes of financial accounting under the Financial Accounting Standards Board's ASC 718. The simulated fair value estimate per vesting tranche of the 2015 and 2014 options, based on exercise prices of $38.23 (being the NYSE closing price of Magna Common Shares on February 26, 2016) and $54.53 (being the NYSE closing price of Magna Common Shares on February 26, 2015) were as follows:
| 2015 SIMULATED FAIR VALUE |
2014 SIMULATED FAIR VALUE |
|||
| Tranche 1 | $7.89 | $11.92 | ||
| Tranche 2 | $8.29 | $12.58 | ||
| Tranche 3 | $8.54 | $13.12 | ||
Amounts disclosed in the "Option-Based Awards" column in respect of 2013 represent the grant date fair value of stock options, determined using the Black-Scholes option pricing model. This model requires the input of a number of assumptions, including expected dividend yields, expected stock price volatility, expected time until exercise and risk-free interest rates. Although the assumptions used reflect our best estimates, they involve
80 Compensation
inherent
uncertainties based on market conditions generally outside Magna's control. If other assumptions are used, the stock option value disclosed could be significantly impacted. Disclosure of the
value of stock options in our financial statements is also based on the grant date fair value determined using the Black-Scholes option pricing model and amortized to compensation expense from the
effective date of the grant to the final vesting date in selling, general and administrative expense, with a corresponding increase to contributed surplus. As stock options are exercised, the proceeds
received on exercise, in addition to the portion of the contributed surplus balance related to those stock options, is credited to Common Shares and released from contributed surplus.
The weighted average assumptions used in measuring the Black-Scholes fair value of stock options granted in respect of 2015, 2014 and 2013, as well as the "floor" value determined in respect of 2015
and 2014, are as follows:
| |
2015 |
2014 |
2013 |
|||
|---|---|---|---|---|---|---|
| Risk-free interest rate | 0.64% / 1.22% | 0.63% | 1.60% | |||
| Expected dividend yield | 2.00% | 2.00% | 2.00% | |||
| Expected volatility | 25% / 27% | 23% | 29% | |||
| Expected time until exercise | 4.5 years | 4.5 years | 4.5 years | |||
| Grant Date Fair Value per option (Black-Scholes) | C$8.81 / $7.33 | C$10.66 / $8.52 | C$11.47 / $10.33 | |||
| "Floor" Value | C$10.32 / $7.65 | C$13.65 / $10.91 | – | |||
- 3.
- Amounts
disclosed in this column represent annual profit sharing bonuses paid in cash.
- 4.
- These amounts are comprised of:
| DESCRIPTION |
2015 ($) |
2014 ($) |
2013 ($) |
||||
|---|---|---|---|---|---|---|---|
| Amounts reimbursed by Magna in respect of premiums paid by Mr. Walker on a life insurance policy | 120,000 | 143,000 | 156,000 | ||||
| Personal use of corporate aircraft | 35,000 | 32,000 | 26,000 | ||||
| Total | 155,000 | 175,000 | 182,000 | ||||
- 5.
- These amounts are comprised of:
| DESCRIPTION |
2015 ($) |
2014 ($) |
2013 ($) |
||||
|---|---|---|---|---|---|---|---|
| Amounts reimbursed by Magna in respect of premiums paid by Mr. Galifi on a life insurance policy | 43,000 | 52,000 | 56,000 | ||||
| Personal use of corporate aircraft | 23,000 | 14,000 | 32,000 | ||||
| Total | 66,000 | 66,000 | 88,000 | ||||
- 6.
- These amounts are comprised of:
| DESCRIPTION |
2015 ($) |
2014 ($) |
2013 ($) |
|||
|---|---|---|---|---|---|---|
| Personal use of corporate aircraft | 4,000 | 14,000 | 11,000 | |||
- 7.
- These amounts are comprised of:
| DESCRIPTION |
2015 ($) |
2014 ($) |
2013 ($) |
|||
|---|---|---|---|---|---|---|
| Personal use of corporate aircraft | 23,000 | NIL | 35,000 | |||
Compensation 81
Incentive Plans and Awards
| Stock Option Plans | Stock option grants are made under the 2009 Plan, which was approved by shareholders on May 6, 2010 and is administered by the CGCNC. | |
Prior to adoption of the 2009 Plan, options were granted under the 1987 Plan, which was approved by shareholders on December 10, 1987, and subsequently amended on May 18, 2000 and May 10, 2007. As of December 31, 2015, a total of 300,682 previously granted options were fully vested and remained unexercised under the 1987 Plan. However, as of the Record Date, all outstanding options under the 1987 Plan had been exercised and the plan has terminated. |
||
Eligible Participants Under 2009 Plan |
Under the 2009 Plan, stock options may be granted to employees of and consultants to Magna and its subsidiaries. The CGCNC does not foresee options being granted to consultants, except in limited circumstances such as where an individual performs services for Magna through a consulting arrangement for tax or other similar reasons. |
|
2009 Plan Limits |
The maximum number of Common Shares: |
|
• issued to Magna "insiders" within any one-year period; and |
||
• issuable to Magna insiders at any time, |
||
under the option plans and any other security-based compensation arrangements (as defined in the TSX Company Manual) cannot exceed 10% of our total issued and outstanding Common Shares, respectively. |
||
Option Exercise Prices are at or Above Market Price on Date of Grant |
Exercise prices are determined at the time of grant, but cannot be less than the closing price of a Common Share on the TSX (for options denominated in Canadian dollars) or NYSE (for options denominated in U.S. dollars) on the trading day immediately prior to the date of grant. |
|
3-Year Option Vesting; 7-Year Option Life |
Time-vested options granted under the 2009 Plan vest in equal proportions on each of the first three anniversaries of the grant date, unless otherwise determined by the CGCNC. Performance-vested options granted under the 2009 Plan vest as to one-sixth, one-third and one-half on the first three anniversaries of the grant date, respectively, subject to satisfaction of a relative TSR performance hurdle described in Section C of the CD&A. Subject to accelerated expiry of time-vested options in certain circumstances, options granted under the 2009 Plan expire seven years after grant, unless otherwise determined by the CGCNC. On cancellation or surrender of options under the 2009 Plan, the underlying shares are added back to the number of Common Shares reserved for issuance and are available for re-grant. |
82 Compensation
Amending the 2009 Plan |
The 2009 Plan gives the Board the power to amend the plan, except for the following types of amendments which require shareholder approval: |
|
• increases to the number of shares reserved for issuance under the plan (excluding an equitable increase in connection with certain capital reorganizations); |
||
• a reduction in the exercise price of an option; |
||
• an extension of an option term (excluding certain limited extensions to allow the exercise of options which expire during or within two business days after the end of a trading blackout); |
||
• an increase in the 10% limit on option shares issuable to insiders, as described above; and |
||
• amendment of the amending provision of the plan. |
||
There were no amendments to the 2009 Plan during 2015. |
||
Copies of Option Plans on Magna.com |
The full text of the amended and restated 2009 Plan is available on our website (www.magna.com). |
|
Equity Compensation Plan Information |
As of December 31, 2015 and the Record Date, compensation plans under which our Common Shares are authorized for issuance are as follows: |
| PLAN CATEGORY | NUMBER OF SECURITIES TO BE ISSUED UPON EXERCISE OF OUTSTANDING OPTIONS, WARRANTS AND RIGHTS |
WEIGHTED-AVERAGE EXERCISE PRICE OF OUTSTANDING OPTIONS, WARRANTS AND RIGHTS |
NUMBER OF SECURITIES REMAINING AVAILABLE FOR FUTURE ISSUANCE UNDER EQUITY COMPENSATION PLANS |
||||||||||||
| 12/31/2015 (#) |
RECORD DATE (#) |
12/31/2015 ($) |
RECORD DATE ($) |
12/31/2015 (#) |
RECORD DATE (#) |
||||||||||
| Equity compensation plans approved by securityholders: | |||||||||||||||
| 1987 Plan | 300,682 | – | C$8.27 | – | – | – | |||||||||
| 2009 Plan | 7,048,734 | 9,101,738 | C$39.88 | C$42.99 | 12,164,270 | 9,948,766 | |||||||||
| Total | 7,349,416 | 9,101,738 | C$38.59 | C$42.99 | 12,164,270 | 9,948,766 | |||||||||
Compensation 83
| Outstanding Option-Based Awards | Outstanding option-based awards for each of our Named Executive Officers as of December 31, 2015 were as follows: |
| |
OPTION-BASED AWARDS |
SHARE-BASED AWARDS |
||||||||||||
|---|---|---|---|---|---|---|---|---|---|---|---|---|---|---|
| |
NUMBER OF SECURITIES UNDERLYING EXERCISED OPTIONS (#) |
OPTION EXERCISE PRICE |
OPTION EXPIRATION DATE (MM/DD/YY) |
VALUE OF UNEXERCISED IN-THE- MONEY OPTIONS(1) ($) |
NUMBER OF SHARE-BASED AWARDS THAT HAVE NOT VESTED (#) |
MARKET OR PAYOUT VALUE OF SHARE-BASED AWARDS THAT HAVE NOT VESTED ($) |
MARKET OR PAYOUT VALUE OF VESTED SHARE-BASED AWARDS NOT PAID OUT OR DISTRIBUTED ($) |
|||||||
| Donald J. Walker | 500,000 | C$15.00 | 02/25/17 | 14,855,000 | NIL | NIL | 9,909,000 | |||||||
| 500,000 | C$24.11 | 03/01/19 | 11,564,000 | |||||||||||
| 400,000 | C$28.51 | 03/03/20 | 7,979,000 | |||||||||||
| 264,000 | C$53.35 | 03/04/21 | 527,000 | |||||||||||
| 320,414 | $54.53 | 02/25/22 | – | |||||||||||
| Total | 1,984,414 | |||||||||||||
| Vincent J. Galifi | 200,000 | C$24.11 | 03/01/19 | 4,625,000 | NIL | NIL | 3,964,000 | |||||||
| 140,000 | C$28.51 | 03/03/20 | 2,793,000 | |||||||||||
| 92,000 | C$53.35 | 03/04/21 | 184,000 | |||||||||||
| 112,782 | $54.53 | 02/25/22 | – | |||||||||||
| Total | 544,782 | |||||||||||||
| Tommy J. Skudutis | 40,000 | C$28.51 | 03/03/20 | 798,000 | NIL | NIL | 3,964,000 | |||||||
| 84,000 | C$53.35 | 03/04/21 | 168,000 | |||||||||||
| 101,270 | $54.53 | 02/25/22 | – | |||||||||||
| Total | 225,270 | |||||||||||||
| Jeffrey O. Palmer | 100,000 | C$24.11 | 03/01/19 | 2,313,000 | NIL | NIL | 2,845,000 | |||||||
| 60,000 | C$28.51 | 03/03/20 | 1,197,000 | |||||||||||
| 40,000 | C$53.35 | 03/04/21 | 80,000 | |||||||||||
| 42,076 | $54.53 | 02/25/22 | – | |||||||||||
| Total | 242,076 | |||||||||||||
| James J. Tobin | 34,014 | $6.59 | 02/26/16 | 1,156,000 | NIL | NIL | 1,453,000 | |||||||
| 55,576 | $24.44 | 03/01/19 | 896,000 | |||||||||||
| 40,000 | $27.76 | 03/03/20 | 512,000 | |||||||||||
| 40,000 | $48.05 | 03/04/21 | – | |||||||||||
| 45,846 | $54.53 | 02/25/22 | – | |||||||||||
| Total | 215,436 | |||||||||||||
Notes:
- 1.
- Determined
using the closing price of Magna Common Shares on the TSX on December 31, 2015 and the BoC noon spot rate on such date for options denominated in C$.
- 2.
- Represents the market value of previously granted, unreleased restricted shares and any RSUs which had not been redeemed as at December 31, 2015. The value shown was determined using the closing price of Magna Common Shares on the NYSE on December 31, 2015.
84 Compensation
| Incentive Plan Awards – Value Vested During the Year | The values of option-based and share-based awards which vested, and non-equity incentive plan compensation earned, during the year ended December 31, 2015, are set forth below: |
| NAME |
OPTION-BASED AWARDS – VALUE VESTED DURING THE YEAR(1) ($) |
SHARE-BASED AWARDS – VALUE VESTED DURING THE YEAR(2) ($) |
NON-EQUITY INCENTIVE PLAN COMPENSATION – VALUE EARNED DURING THE YEAR(3) ($) |
|||
|---|---|---|---|---|---|---|
| Donald J. Walker | 11,099,000 | 7,292,000 | 10,444,000 | |||
| Vincent J. Galifi | 4,182,000 | 2,917,000 | 4,177,000 | |||
| Tommy J. Skudutis | 3,347,000 | 2,917,000 | 4,177,000 | |||
| Jeffrey O. Palmer | 1,965,000 | 1,978,000 | 2,820,000 | |||
| James J. Tobin | 814,000 | 1,069,000 | 1,532,000 | |||
Notes:
- 1.
- Represents
the vesting date value of previouly granted stock options which vested during 2015 and assumes that any such options which were in-the-money were exercised on the vesting
date.
- 2.
- Represents
the value of profit sharing bonuses deferred in the form of RSUs in respect of 2015, all of which vested in 2015. Also includes dividends credited on NEO's aggregate
RSU balance, which includes RSUs granted in prior years.
- 3.
- Represents the value of profit sharing bonuses paid in cash in respect of 2015.
Compensation 85
Additional Information
Interests of Management and Other Insiders in Certain Transactions |
During 2015, non-independent trusts (the "Trusts") which exist to make orderly purchases of Magna shares for employees, either for transfer to Magna's Employee Equity and Profit Participation Program or to recipients of either bonuses or rights to purchase such shares from the Trusts, borrowed up to $55 million from Magna to facilitate the purchase of Common Shares. At December 31, 2015, the Trusts' indebtedness to Magna was $5 million. |
Indebtedness of Directors, Executive Officers and Employees |
None of Magna's present or former directors or executive officers (including any of their associates) were indebted at any time during 2015 to Magna or its subsidiaries. None of Magna's or its subsidiaries' present or former employees were indebted at any time during 2015 to Magna or its subsidiaries in connection with the purchase of Magna's securities or securities of any of Magna's subsidiaries. As at the Record Date, the aggregate amount of indebtedness to Magna and its subsidiaries was approximately $0.2 million in the case of present and former employees of Magna and its subsidiaries. |
|
Directors' and Officers' Insurance |
Effective September 1, 2015, Magna renewed its directors' and officers' liability insurance for a one-year renewal period. This insurance provides, among other coverages, coverage of up to $300 million (in the aggregate for all claims made during the policy year) for officers and directors of Magna and its subsidiaries, subject to a self-insured retention of $5 million for securities claims and $1 million for all other claims. This policy does not provide coverage for losses arising from the intentional breach of fiduciary responsibilities under statutory or common law or from violations of or the enforcement of pollutant laws and regulations. The aggregate premium payable in respect of the policy year September 1, 2015 to September 1, 2016 for the directors' and officers' liability portion of this insurance policy was approximately $2.1 million. |
|
Shareholder Proposals and Communication |
Proposals of shareholders intended to be presented at our Annual Meeting of Shareholders to be held in 2017 must be received by us at our principal executive offices on or before March 5, 2017 in order to be included in our 2017 Management Information Circular/Proxy Statement. |
|
Contacting the Board |
Shareholders wishing to communicate with any Independent Director may do so by contacting Magna's Chairman through the office of the Corporate Secretary at 337 Magna Drive, Aurora, Ontario, Canada, L4G 7K1, telephone (905) 726-7070. |
|
86 Additional Information
Approval of Circular |
The Board has approved the contents and mailing of this Circular. |
| /s/ "Bassem A. Shakeel" Bassem A. Shakeel Vice-President and Corporate Secretary March 28, 2016 |
Magna files an Annual Information Form with the Ontario Securities Commission and a Form 40-F with the U.S. Securities and Exchange Commission. A copy of Magna's most recent Annual Information Form, this Circular and the Annual Report containing Magna's consolidated financial statements and MD&A, will be sent to any person upon request in writing addressed to the Secretary at Magna's principal executive offices set out in this Circular. Such copies will be sent to any shareholder without charge. Copies of Magna's disclosure documents and additional information relating to Magna may be obtained by accessing the disclosure documents available on the internet on the Canadian System for Electronic Document Analysis and Retrieval (SEDAR) at www.sedar.com. Financial information is provided in Magna's comparative consolidated financial statements and MD&A for fiscal 2015. For more information about Magna, visit Magna's website at www.magna.com.
Additional Information 87
Definitions and Interpretation
| Certain Defined Terms | In this document, referred to as this "Circular", the terms "you" and "your" refer to the shareholder, while "we", "us", "our", the "company" and "Magna" refer to Magna International Inc. and, where applicable, its subsidiaries. In this Circular, a reference to "fiscal year" is a reference to the fiscal or financial year from January 1 to December 31 of the year stated. | |
We also use the following defined terms throughout this Circular: |
||
Board: |
our Board of Directors. |
|
BoC: |
the Bank of Canada. |
|
C$: |
Canadian dollars. |
|
CGCNC: |
the Corporate Governance, Compensation and Nominating Committee of our Board. |
|
Deloitte: |
Deloitte LLP |
|
DSUs: |
deferred share units. |
|
EROC: |
the Enterprise Risk Oversight Committee of our Board. |
|
Independent Directors: |
our directors or nominees who have been determined to be independent on the basis described under "Nominees for Election to the Board – Nominee Independence". |
|
Kingsdale: |
Kingsdale Shareholder Services, Magna's proxy solicitation agent for the Meeting. |
|
NYSE: |
The New York Stock Exchange. |
|
OBCA: |
the Business Corporations Act (Ontario). |
|
RSUs: |
restricted stock units. |
|
TSX: |
the Toronto Stock Exchange. |
|
Currency, Exchange Rates and Share Prices |
Dollar amounts in this Circular are stated in U.S. dollars, unless otherwise indicated, and have been rounded to the nearest thousand. In a number of instances in this Circular, information based on our share price has been calculated on the basis of the Canadian dollar closing price of our Common Shares on the TSX and converted to U.S. dollars based on the BoC noon spot rate on the applicable date. |
| REFERENCE DATE |
NYSE SHARE PRICE (US$) |
TSX SHARE PRICE (C$) |
BOC NOON SPOT RATE (C$1.00 = US$) |
|||
| December 31, 2015 | 40.56 | 56.12 | 0.7225 | |||
| March 18, 2016 | 42.78 | 55.78 | 0.7703 | |||
| Effective March 25, 2015, Magna's Common Shares were split on a two-for-one basis. All references in this Circular to a number or value of shares or options reflects the post-stock split number or value (as applicable) of shares or options. | ||
Information Currency |
The information in this Circular is current as of March 24, 2016, unless otherwise stated. |
88 Additional Information
Appendix
MAGNA INTERNATIONAL INC.
(the "Corporation")
BY-LAW NO. 1
Section
| 1 | Business of the Corporation | |
| 2 | Directors | |
| 3 | Delegation by the Board of Directors | |
| 4 | Officers | |
| 5 | Protection of Directors, Officers and Others | |
| 6 | Securities | |
| 7 | Meetings of Shareholders | |
| 8 | Dividends and Rights | |
| 9 | Notices | |
| 10 | Repeal and Effective Date | |
| 11 | General |
BE IT ENACTED as a by-law of the Corporation as follows:
SECTION 1
BUSINESS OF THE CORPORATION
- 1.1
- Financial Year. Until changed by resolution of the board, the financial year of the Corporation
shall end on December 31 in each year.
- 1.2
- Execution of Contracts, etc. Contracts, documents and other instruments in
writing requiring
execution by the Corporation may be signed by any two officers or directors and all contracts, documents or other instruments in writing so signed shall be binding upon the Corporation without any
further authorization or formality. Any one officer or director may sign certificates and similar instruments (other than share certificates) on the Corporation's behalf with respect to any factual
matters relating to the Corporation's business and affairs. The board may from time to time by resolution appoint any officer(s) or any other person(s) on behalf of the Corporation either to sign
contracts, documents or instruments in writing generally, or to sign specific contracts, documents or instruments in writing.
- 1.3
- Registered Office. The registered office of the Corporation is set out in
the articles of the
Corporation. The Corporation may from time to time:
- •
- by
resolution of the directors, change the location of the registered office of the Corporation within a municipality or geographic
township; and
- •
- by
special resolution, change the municipality or geographic township in which its registered office is located to another place
in Ontario.
- 1.4
- Corporate Seal. When required, the corporate seal of the Corporation may be affixed to contracts, documents or instruments in writing duly signed on behalf of the Corporation.
Appendix A- 1
- 1.5
- Banking Arrangements. The banking business of the Corporation including, without limitation, the
borrowing of money and the giving of security therefor, shall be transacted with such banks, trust companies or other bodies corporate or organizations and under such agreements, instructions and
delegations of powers as may from time to time be prescribed by the board or two officers of the Corporation, one of whom must be the chief executive officer, chief financial officer or the treasurer.
For greater certainty, the chief executive officer, chief financial officer or the treasurer together with any one other officer shall have the authority to appoint bankers, authorize facsimile
signatures on cheques, authorize signing officers to sign, endorse or deposit cheques, bills of exchange and similar documents, and attend to any other matters related to the Corporation's dealings
with its bankers.
- 1.6
- Borrowing Power. Without limiting the borrowing powers of the Corporation as
set forth in the Act, the directors may from
time to time on behalf of the Corporation and without authorization of the shareholders:
- •
- borrow
money upon the credit of the Corporation;
- •
- limit
or increase the amount to be borrowed;
- •
- issue,
reissue, sell or pledge bonds, debentures, notes or other debt obligations of the Corporation, whether secured or unsecured, for such sums
and on such terms, conditions, covenants and conditions and at such prices as may be deemed expedient;
- •
- give
a guarantee on behalf of the Corporation to secure payment or performance of an obligation to any such person; and
- •
- mortgage,
hypothecate, charge, pledge or otherwise create a security interest in all or any currently owned or subsequently acquired real and
personal, movable and immovable, property of the Corporation and the undertaking and rights of the Corporation, to secure any such bonds, debentures, notes or other debt obligations, or to secure any
present or future borrowing, liability or obligation of the Corporation.
- 1.7
- Voting Rights in Other Bodies Corporate. Unless otherwise determined by the board, all securities of any other body corporate or issuer of securities carrying voting rights held from time to time by the Corporation may be voted at all applicable meetings of security holders of such other body corporate or issuer and in such manner as determined by any of the chief executive officer, chief financial officer or an executive vice-president of the Corporation. Any one such officer, or the corporate secretary acting on the direction of such officer, may execute and deliver proxies and/or arrange for the issuance of voting certificates and/or other evidence of the right to vote in such names as they may determine without the necessity of a resolution or other action by the directors.
SECTION 2
DIRECTORS
- 2.1
- Number of Directors and Term. The number of directors of the Corporation shall be the number of
directors as specified in the articles or as may from time to time be determined in accordance with the Act. Whenever a minimum and maximum number of directors is provided for in the articles, the
number of directors shall be such number as may be determined by resolution of the directors and:
- •
- the
board may, between annual meetings of shareholders, appoint additional directors, provided that after such appointment the total number of
directors would not be greater than one and one-third times the number of directors required to have been elected at the last annual meeting, nor greater than the maximum number set out in the
articles; and
- •
- the number of directors to be elected at an annual meeting of shareholders shall be the number of directors last determined by the board.
Each director shall hold office until the close of the next annual meeting of shareholders following his or her election or appointment.
A-2 Appendix
- 2.2
- Qualifications of Directors. At least 25% of the number of directors shall be resident
Canadians.
No person shall be a director if that person:
- •
- is
less than 18 years of age;
- •
- has
been found under the Substitute Decisions Act, 1992, S.O. 1992, c.30 or under the Mental Health Act, R.S.O. 1990, c. M.7, in each case as may be amended from time to time, to be incapable of managing property or who has been
found to be incapable by a court in Canada or elsewhere;
- •
- is
not an individual; or
- •
- has
the status of bankrupt.
- 2.3
- Election and Term. Directors shall be elected to hold office for a term expiring at the
close of
the next annual meeting of shareholders following their election or appointment. If an election of directors is not held at an annual meeting of shareholders at which such election is required, the
incumbent directors shall continue in office until their successors are elected.
- 2.4
- Advance Notice for Nominations of Directors. Only individuals who are
nominated in accordance
with the procedures set out in this Section 2.4 and who, at the discretion of the board, satisfy the qualifications of a director as set out in the Act and the by-laws of the Corporation
shall be eligible for election as directors of the Corporation at any meeting of shareholders of the Corporation.
- 2.4.1
- When Nominations Can Be Made. Nominations of individuals for election to the board may be made
at any annual meeting of shareholders, or at any special meeting of shareholders if one of the purposes for which the special meeting was called was the election of directors:
- 2.4.1.1.
- by
or at the direction of the board, including pursuant to a notice of meeting;
- 2.4.1.2.
- by
or at the direction or request of one or more shareholders pursuant to a proposal made in accordance with the Act or a requisition of the
shareholders made in accordance with the Act; or
- 2.4.1.3.
- without
limiting the foregoing, by any person (a "Nominating Shareholder") who:
- •
- at
the close of business on the date of the giving of the notice provided for below in this Section 2.4 and on the record date for
notice of such meeting, is a registered holder of shares carrying the right to vote at such meeting on the election of directors; and
- •
- complies
with the notice procedures set forth in this Section 2.4.
- 2.4.2
- Timely Notice. In addition to any other applicable requirements, for a nomination to be made by a Nominating Shareholder, the Nominating Shareholder must have given timely notice thereof and in proper written form to the corporate secretary at the principal executive offices of the Corporation as set forth below.
- 2.4.2.1.
- in the case of an annual meeting of shareholders, not less than 30 days prior to the date of such annual meeting of shareholders; provided, however, that, if an annual meeting of shareholders is to be held on a date that is less than 50 days after the date on which the first public announcement of the date of the meeting was made (each such date being the "Notice Date"), notice by the Nominating Shareholder may be made not later than the 10th day following the applicable Notice Date; and
To give "timely notice", a Nominating Shareholder must give notice to the corporate secretary:
Appendix A- 3
- 2.4.2.2.
- in
the case of a special meeting (which is not also an annual meeting) of shareholders called for the purpose of electing directors (whether or not
called for other purposes), not later than the 15th day following the applicable Notice Date.
- 2.4.3
- Proper Written Form. To be in "proper written form", a Nominating Shareholder's notice to the
corporate secretary must set forth:
- 2.4.3.1.
- the
identity of the Nominating Shareholder and the number of voting securities held by the Nominating Shareholder;
- 2.4.3.2.
- if
the Nominating Shareholder is not the beneficial owner of all of those voting securities, the identity of the beneficial owner and the number of
voting securities beneficially owned by that beneficial owner;
- 2.4.3.3.
- with
respect to the Nominating Shareholder and, if applicable, any beneficial owner, the following:
- •
- the
class or series and number of any securities in the capital of the Corporation which are controlled, or over which control or direction is
exercised, directly or indirectly, by the Nominating Shareholder or beneficial owner, and each person acting jointly or in concert with any of them (and for each such person any options or
other rights to acquire shares in the capital of the Corporation, any derivatives or other securities, instruments or arrangements for which the price or value or delivery, payment or settlement
obligations are derived from, referenced to, or based on any such shares, and any hedging transactions, short positions and borrowing or lending arrangements relating to such shares) as of the record
date for the meeting of shareholders (if such date shall then have been made publicly available and shall have occurred) and as of the date of such notice;
- •
- any
proxy, contract, agreement, arrangement, understanding or relationship pursuant to which the Nominating Shareholder or beneficial owner has a
right to vote any shares in the capital of the Corporation on the election of directors;
- •
- in
the case of a special meeting of shareholders called for the purpose of electing directors, a statement as to whether the Nominating
Shareholder or beneficial owner intends to send an information circular and form of proxy to any shareholders of the Corporation in connection with the individual's nomination; and
- •
- any
other information relating to the Nominating Shareholder or beneficial owner that would be required to be disclosed in a dissident's proxy
circular or other filings to be made in connection with solicitations of proxies for election of directors pursuant to the Act and applicable securities laws.
- 2.4.3.4.
- as
to each individual whom the Nominating Shareholder proposes to nominate for election as a director:
- •
- the
name, age, business address and residential address of the individual;
- •
- the
principal occupation or employment of the individual;
- •
- the class or series and number of securities in the capital of the Corporation which are beneficially owned, or over which control or direction is exercised, directly or indirectly, by such individual as of the record date for the meeting of shareholders (if such date shall then have been made publicly available and shall have occurred) and as of the date of such notice; and
A-4 Appendix
- •
- any
other information relating to the individual that would be required to be disclosed in a dissident's proxy circular or other filings to be
made in connection with solicitations of proxies for election of directors pursuant to the Act and applicable securities laws.
- 2.4.4
- Nominee Independence. A Nominating Shareholder's notice to the corporate
secretary must also
state whether:
- 2.4.4.1.
- in
the opinion of the Nominating Shareholder and the proposed nominee, the proposed nominee would qualify to be an independent director of the
Corporation under sections 1.4 and 1.5 of National Instrument 52-110 – Audit Committees of the Canadian Securities Administrators
("NI 52-110"), Section 303A.02 of the New York Stock Exchange Company Manual and the commentary relating thereto and Rule 10A-3(b) under the Securities Exchange Act of
1934; and
- 2.4.4.2.
- with
respect to the Corporation, the proposed nominee has one or more of the relationships described in sections 1.4(3), 1.4(8) or 1.5 of
NI 52-110, Section 303A.02(b) of the New York Stock Exchange Company Manual and the commentary relating thereto and Rule 10A-3(b) under the Securities Exchange Act of 1934
and, if so, which ones.
- 2.4.5
- Determination of Validity of Nomination. Except as otherwise provided by the special
rights or
restrictions attached to the shares of any class or series of the Corporation, no individual shall be eligible for election as a director of the Corporation unless nominated in accordance with the
provisions of the by-laws of the Corporation; provided, however, that nothing in this Section 2.4 shall preclude discussion by a shareholder or proxy holder (as distinct from the
nomination of directors) at a meeting of shareholders of any matter in respect of which it would have been entitled to submit a proposal pursuant to the provisions of the Act. The chair of the meeting
shall have the power and duty to determine whether a nomination was made in accordance with the procedures set forth in the foregoing provisions and, if any proposed nomination is not in compliance
with such foregoing provisions, to declare that such defective nomination shall be disregarded. A duly appointed proxy holder of a Nominating Shareholder shall be entitled to nominate at a meeting of
shareholders the directors nominated by the Nominating Shareholder, provided that all of the requirements of this Section 2.4 have been satisfied. If the Nominating Shareholder or its duly
appointed proxy holder does not attend at the meeting of shareholders to present the nomination, the nomination shall be disregarded notwithstanding that proxies in respect of such nomination may have
been received by the Corporation.
- 2.4.6
- Compliance With Applicable Laws. In addition to the provisions of this
Section 2.4, a
Nominating Shareholder and any individual nominated by the Nominating Shareholder shall also comply with all of the applicable requirements of the Act, applicable securities laws and applicable stock
exchange rules regarding the matters set forth herein. For greater certainty, nothing in this Section 2.4 is intended to vary any minimum share ownership requirement applicable to a
Nominating Shareholders.
- 2.4.7
- Public Announcement. For purposes of this Section 2.4, "public
announcement" means
disclosure in a press release reported by a national news service in Canada, or in a document publicly filed by the Corporation under its issuer profile on the System for Electronic Document Analysis
and Retrieval at www.sedar.com ("SEDAR").
- 2.4.8
- Notice. Notwithstanding any other provision of the Corporation's by-laws, notice given to the corporate secretary by a Nominating Shareholder pursuant to this Section 2.4 may only be given by personal delivery (at the principal executive offices of the Corporation) or by e-mail (at the e-mail address set out in the Corporation's issuer profile on SEDAR), and shall be deemed to have been given and made only at the time it is so served by personal delivery to the corporate secretary or sent by e-mail to such e-mail address (provided that receipt of confirmation of such transmission has been received); provided that if such delivery or electronic communication is made on a day which is a not a business day or later than 5:00 p.m. (Toronto time) on a day which is a business day, then such delivery or electronic communication shall be deemed to have been made on the next following day that is a business day.
Appendix A- 5
- 2.4.9
- Board Discretion to Waive. Notwithstanding the foregoing, the board may, in its sole
discretion
and at any time, waive any requirement in this Section 2.4. For clarity, nothing in this Section 2.4 shall limit the right of the directors to fill a vacancy among the directors in
accordance with this by-law or the Act.
- 2.5
- Director Ceasing to Hold Office. A director ceases to hold office when he or she dies, resigns,
is removed or ceases to be qualified under the Act.
- 2.6
- Calling of Directors' Meetings. The chair, the chief executive officer, any
director, or the
corporate secretary on the direction of any of the foregoing, may at any time call a meeting of the board at such time and place as they may determine.
- 2.7
- Place of Directors' Meetings. Meetings of the board and of any committee of
the board may be held
at any place within or outside Ontario. Notwithstanding subsection 126(2) of the Act, it shall not be necessary for a majority of the meetings of the board or of any committee of the board in
any financial year to be held at a place within Canada.
- 2.8
- Notice of Meetings. Notice of the time and place for the holding of any
meeting of the board or a
committee of the board shall be sent to each director not less than 48 hours before the time of the meeting. Notwithstanding the foregoing, meetings of the board or a committee of the board may
be held at any time without notice if:
- •
- all
the directors are present, except where a director attends a meeting for the express purpose of objecting to the transaction of any business
on the grounds that the meeting is not lawfully called; or
- •
- all the absent directors waive notice.
Provided a quorum of directors is present, each newly elected board may without notice hold its first meeting without notice on the same day as the meeting of shareholders at which such board is elected.
- 2.9
- Waiver of Notice. Notice of a meeting of the board or a committee of the board, or any
irregularity in a meeting or in the notice thereof, may be waived in any manner by a director and such waiver may be validly given either before or after the meeting to which such waiver relates.
Attendance of a director at a meeting of the board or a committee of the board is a waiver of notice of such meeting, except where a director attends the meeting for the express purpose of objecting
to the transaction of business on the grounds that the meeting is not lawfully called.
- 2.10
- Participation by Electronic Means. A director may participate in a meeting
of the board or a
committee of the board by means of such telephone, videoconference or other electronic communications facilities as permit all persons participating in the meeting to communicate with each other
simultaneously and instantaneously, and a director participating in such a meeting by such means shall be deemed for the purposes of the Act to be present at that meeting.
- 2.11
- Quorum for Meetings. A majority of the number of directors shall constitute
a quorum for the
transaction of business at any meeting of the board. Subject to subsections 124(3) and 132(5.1) of the Act, no business shall be transacted by the directors except at a meeting of
directors at which a quorum is present.
- 2.12
- Chair and Secretary of Meetings. The chair of any meeting of the board
shall be the chair of the
board. If the chair of the board is not present or if he or she declines or is unable to act, the directors present shall choose one of their number to act as the chair of the meeting. The corporate
secretary shall act as secretary at any meeting of the board. If the corporate secretary is not present or if he or she declines or is unable to act, the chair of the meeting shall appoint a person
who need not be a director to act as secretary of the meeting.
- 2.13
- Voting. Questions arising at any meeting of the board shall be decided by a majority of votes. In case of an equality of votes, the chair of the meeting shall not have a second or casting vote in addition to the chair's original vote as a director. Any such question shall be decided by a show of hands unless a ballot is required or demanded by any director.
A-6 Appendix
- 2.14
- Resolutions in Writing. A resolution in writing, signed by all the directors entitled to vote
on
that resolution at a meeting of directors or a committee of directors, is as valid as if it had been passed at a meeting of directors or a committee of directors.
- 2.15
- Remuneration and Expenses. The remuneration to be paid to the independent directors of the Corporation shall be such as the board determines by resolution from time to time. A director who also serves as an officer or employee of the Corporation or any of its affiliates shall not receive any additional remuneration for service as a director of the Corporation. Directors shall also be entitled to be reimbursed their travelling and other out-of-pocket expenses properly incurred by them in connection with the affairs of the Corporation.
SECTION 3
DELEGATION BY THE BOARD OF DIRECTORS
- 3.1
- General. The directors may from time to time establish one or more committees of directors. The
directors may delegate to each such committee any of the powers of the directors, except that no such committee shall have the authority to:
- •
- submit
to the shareholders any question or matter requiring the approval of the shareholders;
- •
- fill
a vacancy among the directors or in the office of auditor or appoint or remove any of the chief executive officer, however designated, the
chief financial officer, however designated, the chair or the president (if any) of the Corporation;
- •
- subject
to section 184 of the Act, issue securities except in the manner and on the terms authorized by the directors;
- •
- declare
dividends;
- •
- purchase,
redeem or otherwise acquire shares issued by the Corporation;
- •
- pay
a commission referred to in section 37 of the Act;
- •
- approve
a management information circular referred to in Part VIII of the Act;
- •
- approve
a take-over bid circular, directors' circular or issuer bid circular referred to in Part XX of the Securities Act (Ontario);
- •
- approve
any financial statements referred to in clause 154(1)(b) of the Act and Part XVIII of the Securities
Act (Ontario);
- •
- approve
an amalgamation under section 177 or an amendment to the articles under subsection 168(2) or (4) of the
Act; or
- •
- adopt,
amend or repeal by-laws.
- 3.2
- Committee Mandates and Procedure. The mandate and procedure of each committee of the board
shall
be set forth in a written charter approved by the Board. Except as otherwise set out in a written committee charter, the procedure of each committee shall be governed by the provisions of
this by-law.
- 3.3
- Audit Committee. The board shall annually appoint an audit committee to be composed of not fewer than three directors, none of whom shall be officers or employees of the Corporation or its affiliates and all of whom meet all other requirements of applicable law. In addition to the powers and duties delegated by the board as set forth in the audit committee's charter, the audit committee shall have the powers and duties provided in the Act and other applicable laws.
Appendix A- 7
SECTION 4
OFFICERS
- 4.1
- Appointment of Officers. The board may annually, or as often as may be required, designate such
offices of the Corporation and appoint such officers as the board may consider advisable. None of such officers, other than the chair of the board, need be a director of the Corporation.
- 4.2
- Duties of Officers. The powers and duties of all officers shall be such as
the terms of their
engagement call for or as the board may specify. Any such officer may from time to time sub-delegate any of his or her powers and duties to another officer or employee of the Corporation or subsidiary
thereof, and such delegate may exercise and perform such powers and duties, unless the board otherwise directs.
- 4.3
- Term of Office. All officers shall be subject to removal by resolution of the directors at any time, with or without cause. The directors may appoint a person to an office to replace an officer who has been removed or who has ceased to be an officer for any other reason.
SECTION 5
PROTECTION OF DIRECTORS, OFFICERS AND OTHERS
- 5.1
- Limitation of Liability. No director, officer or employee shall be liable for the acts, receipts,
neglects or defaults of any other director, officer or employee, or for joining in any receipt or other act for conformity, or for any loss, damage or expense happening to the Corporation through the
insufficiency or deficiency of title to any property acquired for or on behalf of the Corporation, or for the insufficiency or deficiency of any security in or upon which any of the moneys of the
Corporation shall be invested, or for any loss or damage arising from the bankruptcy, insolvency or tortious acts of any person with whom any of the moneys, securities or effects of the Corporation
shall be invested, or for any loss or damage arising from the bankruptcy, insolvency or tortious acts of any person with whom any of the moneys, securities or effects of the Corporation shall be
deposited, or for any loss occasioned by any error in judgment or oversight on his part, or for any other loss, damage or misfortune whatever which shall happen in the execution of the duties of his
office or employment or in relation thereto, unless the same are occasioned by his own negligence or wilful default; provided that nothing herein shall relieve any director, officer or employee from
the duty to act in accordance with the Act or from liability for any breach thereof.
- 5.2
- Indemnification. The Corporation shall indemnify a director, officer, former director, former officer or a person who acts or acted at the Corporation's request as a director or officer or other similar executive for another body corporate or other organization of which the Corporation is or was a shareholder (or other type of equity-holder) or creditor, and such person's heirs and legal representatives, against all costs, charges and expenses, including an amount paid to settle an action or satisfy a judgment, reasonably incurred by such individual in respect of any civil, criminal or administrative action or proceeding to which such individual is made a party by reason of being or having been a director, officer or other similar executive of such body corporate or other organization, to the full extent permitted by law. The Corporation is authorized to enter into agreements evidencing its indemnity in favour of the foregoing persons to the full extent permitted by law and may purchase and maintain insurance against the risk of its liability to indemnify pursuant to this provision.
SECTION 6
SECURITIES
- 6.1
- Issuance. Subject to the Act and the articles of the Corporation, the board may from time to time issue shares of the Corporation, or grant options or rights to acquire unissued shares of the Corporation, at such times, to such persons and for such consideration as the board may determine; provided that no share shall be issued until it is fully paid as provided by the Act. The board may determine by resolution that any or all classes or series of securities issued by the Corporation shall be uncertificated securities; provided that no such resolution shall apply to securities represented by a certificate until such certificate has been surrendered to the Corporation or its transfer agent.
A-8 Appendix
- 6.2
- Security Certificates. Security certificates (and the form of transfer power on the
reverse side thereof) shall (subject to compliance with section 56 of the Act) be in such form as the board may from time to time by resolution approve and, subject to subsection 55(3)
of the Act, such certificates shall be signed by at least one director or officer of the Corporation and countersigned by or on behalf of a registrar, transfer agent, branch transfer agent or issuing
or other authenticating agent of the Corporation, or by a trustee who certifies it in accordance with a trust indenture. Any signatures required on a security certificate may be printed or otherwise
mechanically reproduced thereon. If a securities certificate contains a printed or mechanically reproduced signature of a person, the Corporation may issue the security certificate even though the
person has ceased to be a director or officer of the Corporation, and the securities certificate is as valid as if the person were a director or an officer at the date of its issue.
- 6.3
- Transfer Agents and Registrar. For each class of securities issued by the
Corporation, the board
may from time to time by resolution appoint or remove:
- •
- a
trustee, transfer agent or other agent to keep the securities register and the register of transfer and one or more persons or agents to keep
branch registers; and
- •
- a registrar, trustee or agent to maintain a record of issued security certificates,
and, subject to section 48 of the Act, one person may be appointed for both of the foregoing purposes in respect of all securities of the Corporation or any class or classes thereof.
- 6.4
- Surrender of Security Certificates. Subject to the provisions of the Securities Transfer Act, 2006, no transfer of a security issued by the Corporation shall be recorded or registered unless and until either:
- •
- the
security certificate representing the security to be transferred has been surrendered and cancelled, or
- •
- if
no security certificate has been issued by the Corporation in respect of such share, a duly executed security transfer power in respect thereof
has been presented for registration.
- 6.5
- Defaced, Destroyed, Stolen or Lost Security Certificates. In case of the defacement,
destruction,
theft or loss of a security certificate, the fact of such defacement, destruction, theft or loss shall be reported by the owner to the Corporation or to an agent of the Corporation appointed pursuant
to section 6.3 of this by-law, with a statement verified by oath or statutory declaration as to the defacement, destruction, theft or loss and the circumstances concerning the same and with a
request for the issuance of a new security certificate to replace the one so defaced, destroyed, stolen or lost. Upon the giving to the Corporation (or, if there is such an agent, then to the
Corporation and to such agent) of an indemnity bond of a surety company in such form as is approved by any authorized officer of the Corporation, indemnifying the Corporation (and such agent,
if any) against all loss, damage and expense, which the Corporation and/or such agent may suffer or be liable for by reason of the issuance of a new security certificate to such shareholder, and
provided the Corporation or such agent does not have notice that the security has been acquired by a bona fide purchaser, a new security
certificate may be issued in replacement of the one defaced, destroyed, stolen or lost, if such issuance is ordered and authorized by any authorized officer of the Corporation or by resolution of
the directors.
- 6.6
- Electronic, Book-Based or Other Non-Certificate Registered Positions. The Corporation and its agent(s) appointed pursuant to section 6.3 of this by-law may adopt such policies and procedures and take all steps as may be necessary or desirable in order to facilitate the adoption and maintenance of a securities registration system by electronic, book-based, direct registration system or other non-certificated means. If such a system is adopted, a registered securityholder may have its holdings of securities of the Corporation evidenced by an electronic, book-based, direct registration or other non-certificated entry or position in the applicable securities register.
Appendix A- 9
SECTION 7
MEETINGS OF SHAREHOLDERS
- 7.1
- Annual Meetings. The annual meeting of shareholders shall be held at such time in each year as
the board may from time to time determine, for the purpose of considering the financial statements and reports required by the Act to be placed before the annual meeting, electing directors,
appointing an auditor and transacting such other business as may properly be brought before the meeting.
- 7.2
- Special Meetings. The board may at any time call a special meeting of
shareholders to be held on
such day and at such time as the board may determine. Any special meeting of shareholder may be combined with an annual meeting of shareholders.
- 7.3
- Place of Meetings. Meetings of shareholders shall be held at such place as
the board may
determine from time to time. The board may, in its sole discretion, determine that a meeting shall not be held at any place, but may instead be held by means of electronic communication facility
pursuant to Section 7.4 of this by-law.
- 7.4
- Shareholder Meeting by Electronic Means. If:
- •
- authorized
by the board in its sole discretion; and
- •
- made available by the Corporation,
subject to the Act, as well as such guidelines and procedures as the board may adopt, shareholders and proxy holders not physically present at a meeting of shareholders may participate in a meeting of shareholders by means of a telephonic, videoconference or other electronic communication facility that permits all participants to communicate adequately with each other during the meeting. Such shareholders participating in a meeting of shareholders being conducted by means of an electronic communication facility shall be deemed for the purposes of the Act to be present in person at the meeting of shareholders.
- 7.5
- Notice of Meetings. Notice of the date, time and place (if any) of, as well as the nature
of business to be conducted at, every meeting of shareholders shall be sent to each:
- •
- shareholder
of the Corporation entitled to vote at the meeting;
- •
- director
of the Corporation; and
- •
- the auditor of the Corporation,
not less than 21 days and not more than 50 days before the date on which the meeting is to be held. Any notice sent pursuant to this Section 7.5 shall be addressed to the latest address of each applicable person as shown in the records of the Corporation or its transfer agent, or if no address is shown therein, then to the last address of each such person known to the corporate secretary.
- 7.6
- Omission of Notice. The accidental omission to give notice of any meeting to or the non-receipt
of any notice by any person shall not invalidate any resolution passed or any proceeding taken at any meeting of shareholders.
- 7.7
- Advance Notice for Proposals. No business may be transacted at an annual or
special meeting of
shareholders, other than as set forth in this Section 7.7.
- 7.7.1
- Annual Meeting Business. No business may be transacted at an annual meeting of shareholders,
other than business that is:
- •
- specified
in the Corporation's notice of meeting (or any supplement thereto) given by or at the direction of the board;
- •
- otherwise properly brought before the annual meeting by or at the direction of the board; or
A-10 Appendix
- •
- otherwise properly brought before the annual meeting by any shareholder of the Corporation who complies with the proposal procedures set forth in this Section 7.7.
- 7.7.2
- Special Meeting Business. At a special meeting of shareholders, only such business shall be
conducted as shall have been brought before the meeting pursuant to the Corporation's notice of meeting. Nominations of persons for election to the board may be made at a special meeting of
shareholders at which directors are to be elected pursuant to the Corporation's notice of meeting only pursuant to and in compliance with Section 2.4.
For business to be properly brought before an annual meeting by a shareholder of the Corporation, such shareholder must submit a proposal to the Corporation for inclusion in the Corporation's management information circular in accordance with the requirements of the Act; provided that any proposal that includes nominations for the election of directors shall be submitted to the Corporation in accordance with the requirements set forth in Section 2.4. The Corporation shall set out the proposal in the management information circular or attach the proposal thereto, subject to the exemptions and bases for refusal set forth in the Act.
- 7.8
- Chair, Secretary and Scrutineers. The chair of any meeting of shareholders shall be the first
mentioned of such of the following officers as have been appointed and who is present at the meeting: chair, vice-chair, chief executive officer, chief financial officer, an executive vice-president,
or a vice-president who is a shareholder. If no such officer is present within fifteen minutes from the time fixed for holding the meeting, the persons present and entitled to vote shall choose one of
their number to be chair. If present, the corporate secretary shall be secretary of the meeting. If the corporate secretary is absent, the chair of the meeting shall appoint another person, who need
not be a shareholder, to act as secretary of the meeting. If desired, one or more scrutineers, who need not be shareholders, may be appointed by a resolution or by the chair of the meeting.
- 7.9
- Persons Entitled to be Present. The only persons entitled to be present at a
meeting of the
shareholders shall be:
- •
- those
entitled to vote at such meeting;
- •
- the
directors of the Corporation;
- •
- the
auditor of the Corporation; and
- •
- others who, although not entitled to vote, are entitled or required under any provision of the Act or the articles or by-laws to be present at the meeting.
Other persons may be permitted to attend on the invitation of the chair of the meeting or with the consent of the meeting.
- 7.10
- Quorum. Two persons present and each holding or representing by proxy at least one issued share
of the Corporation shall be a quorum of any meeting of shareholders solely for the choice of a chair of the meeting and for the adjournment of the meeting to a fixed time and place, but such persons
may not transact any other business. For all other purposes, a quorum for any meeting shall be at least two persons present and holding or representing by proxy not less than 25% of the total number
of the issued shares of the Corporation possessing voting rights at such meeting. If a quorum is present at the opening of a meeting of shareholders, the shareholders present may proceed with the
business of the meeting, notwithstanding that a quorum is not present throughout the meeting.
- 7.11
- Shareholder Representatives. Where a body corporate or association is a shareholder, any individual authorized by a resolution of the directors or governing body of the body corporate or association may represent it at any meeting of shareholders and exercise at such meeting on behalf of the body corporate or association all the powers it could exercise if it were an individual shareholder, provided that the Corporation or the chair of the
Appendix A- 11
meeting may require such shareholder or such individual authorized by it to furnish a certified copy of such resolution or other appropriate evidence of the authority of such individual.
- 7.12
- Joint Shareholders. Where two or more persons hold the same share or shares jointly, any one of
such persons present at a meeting of shareholders has the right, in the absence of the other or others, to vote in respect of such share or shares, but if more than one of such persons are present or
represented by proxy and vote, they shall vote together as one on the share or shares jointly held by them.
- 7.13
- Appointment of Proxyholder. Every shareholder, including a shareholder that
is a body corporate,
entitled to vote at a meeting of shareholders may by means of a proxy appoint a proxyholder or proxyholders or one or more alternate proxyholders, who need not be shareholders, as the shareholder's
nominee to attend and act at the meeting in the manner, to the extent and with the authority conferred by the proxy.
- 7.14
- Form of Proxy. A form of proxy shall be in written or printed format or a
format generated by
telephonic or electronic means and shall comply with the regulations under the Act. A form of proxy becomes a proxy when completed and signed in writing or by electronic signature by the shareholder
or his/her attorney authorized by a document that is signed in writing or by electronic signature or, if the shareholder is a body corporate, by an officer or attorney thereof duly authorized. If a
proxy or document authorizing an attorney is signed by electronic signature, the means of electronic signature shall permit a reliable determination that the proxy or document was created or
communicated by or on behalf of the shareholder or the attorney, as the case may be.
- 7.15
- Time Limit for Deposit of Proxies. The directors may by resolution fix a
time not exceeding
48 hours, excluding Saturdays and holidays, preceding any meeting or adjourned meeting of shareholders before which time proxies to be used at that meeting must be deposited with the
Corporation or its agent (subject to the rights of shareholders to revoke proxies, as provided below), and any period of time so fixed shall be specified in the notice calling the meeting.
- 7.16
- Revocation of Proxy. A shareholder may revoke a proxy by an instrument in
writing or a
revocation signed in any manner that a proxy itself may be signed, as set out above, or in any other manner permitted by law. To be valid, such an instrument in writing or revocation must be:
- •
- received
at the registered office of the Corporation at any time up to and including 5:00 pm (Toronto time) on the last business day
preceding the date of the meeting (including in the case of an adjournment or postponement of the meeting) at which the proxy is to be used; or
- •
- delivered to the scrutineers of the meeting, to the attention of the chair of the meeting, at or prior to the commencement of the meeting (including in the case of an adjournment or postponement of the meeting).
Notwithstanding any specified time limits for the deposit of proxies by shareholders, the chair of any meeting or the chair of the board may, at his or her sole discretion, waive the time limits for the deposit of proxies by shareholders, including any deadline set out in the notice calling the meeting of shareholders or in any proxy circular, and any such waiver made in good faith shall be final and conclusive.
- 7.17
- Votes to Govern. At any meeting of shareholders every question shall, unless otherwise required
by the articles or by-laws or by law, be determined by a majority of the votes cast on the question, whether by a show of hands, or by ballot, as the case may be. In case of an equality of votes
either upon a show of hands or upon a ballot, the chair of the meeting shall not be entitled to a second or casting vote.
- 7.18
- Show of Hands. Subject to the provisions of the Act, any question at a meeting of shareholders shall be decided by a show of hands unless a ballot thereon is required or demanded as hereinafter provided. Upon a show of hands every person who is present and entitled to vote shall have one vote. Whenever a vote by show of hands shall have been taken upon a question, unless a ballot thereon is so required or demanded, a declaration by the chair of the meeting that the vote upon the question has been carried or carried by a particular majority or not carried and an entry to that effect in the minutes of the meeting shall be prima facie evidence of the fact
A-12 Appendix
without proof of the number or proportion of the votes recorded in favour of or against any resolution or other proceeding in respect of such question, and the result of the vote so taken shall be the decision of the shareholders upon such question.
- 7.19
- Ballots. On any question proposed for consideration at a meeting of shareholders, and whether
or
not a vote by show of hands has been taken thereon, a ballot may be required by the chair of the meeting or demanded by any shareholder or proxyholder entitled to vote at the meeting. A ballot so
required or demanded shall be taken in such manner as the chair of the meeting shall direct. A requirement or demand for a ballot may be withdrawn at any time prior to the taking of the ballot. If a
ballot is taken each person present shall be entitled, in respect of the shares which he or she is entitled to vote at the meeting upon the question, to that number of votes provided by the Act or the
articles, and the result of the ballot so taken shall be the decision of the shareholders upon such question.
- 7.20
- Adjournment. The chair of the meeting, may with the consent of the meeting, adjourn any meeting of shareholders from time to a fixed time and place. If a meeting of shareholders is adjourned for less than 30 days, no notice of the time and place for the holding of the adjourned meeting need be given to any shareholder, other than by announcement at the earliest meeting that is adjourned. If a meeting of shareholders is adjourned by one or more adjournments for an aggregate of 30 days or more, notice of the adjourned meeting shall be given as for an original meeting but, unless the meeting is adjourned by one or more adjournments for an aggregate of more than 90 days, Section 111 of the Act does not apply.
SECTION 8
DIVIDENDS AND RIGHTS
- 8.1
- Dividends and Other Distributions. Subject to the provisions of the Act and the articles, the
board may from time to time declare dividends or other distributions payable to the shareholders according to their respective rights and interest in the Corporation. Dividends or other distributions
may be paid in money or property or by issuing fully paid shares of the Corporation.
- 8.2
- Record Date for Dividends and Other Distributions. The directors may fix in
advance a date as a
record date for the determination of shareholders:
- •
- entitled
to receive payment of a dividend;
- •
- entitled
to participate in a liquidation or distribution; or
- •
- for any other purpose except the right to receive notice of or to vote at a meeting of shareholders,
but such record date shall not precede by more than 50 days the particular action to be taken. Such shareholders shall be determined as at the close of business on the date fixed by the directors, unless otherwise specified by the directors.
If no record date is fixed, the record date for the determination of shareholders for any purpose, other than to establish a record date for the determination of shareholders entitled to receive notice of a meeting of shareholders or to vote, shall be the close of business on the day on which the directors pass the resolution relating thereto.
- 8.3
- Payment of Dividends and Other Distributions. A dividend or other distribution payable in money shall be paid by cheque or by electronic means or by such other method as the directors may determine, and will be paid to the order of each registered holder of shares of the class or series in respect of which it has been declared. Cheques will be mailed by prepaid ordinary mail to such registered holder at such registered holder's recorded address, unless such holder otherwise directs. In the case of joint holders the payment shall, unless any applicable joint holder otherwise directs, be made payable to the order of all of such joint holders and, if applicable, be mailed to them at their recorded address, unless any applicable joint holder otherwise directs. The sending of the cheque or the sending of the payment by electronic means or other method determined by the directors as provided for above in an amount equal to the dividend or other distribution to be paid, less the amount of any tax
Appendix A- 13
that the Corporation is required to and does withhold shall, unless such payment is not paid on due presentation, if applicable, satisfy and discharge the liability for the payment.
- 8.4
- Non-receipt of Dividend Cheques. In the event of non-receipt of any dividend cheque by the
person
to whom it is sent, the Corporation shall issue to such person a replacement cheque for a like amount on such terms as to indemnity, reimbursement of expenses and evidence of non-receipt and of title
as the corporate secretary may from time to time prescribe.
- 8.5
- Unclaimed Dividends. Any dividend unclaimed after a period of two years from the date on which the same has been declared to be payable shall be forfeited and shall revert to the Corporation.
SECTION 9
NOTICES
- 9.1
- Notice to Directors, Officers and Auditors. Whenever under the Act, the regulations, the
articles
or these by-laws any notice, document or other information is required to be sent to a director, officer, or auditor, such notice may be sent either by:
- •
- hand
delivery, through the mail, or by a nationally recognized overnight delivery service for next day delivery; or
- •
- means of fax, e-mail or other form of electronic transmission.
- •
- if
given by hand delivery, when actually received by the director, officer or auditor;
- •
- if
sent through the mail addressed to the director, officer or auditor, at such individual's address appearing on the records of the Corporation,
at the time it would be delivered in the ordinary course of mail;
- •
- if
sent for next day delivery by a nationally recognized overnight delivery service addressed to the director, officer or auditor at such
individual's address appearing on the records of the Corporation, when delivered to such service;
- •
- if
sent by fax, when sent to the fax number for such director, officer or auditor appearing in the records of the Corporation and evidence of
delivery confirmation is received by sender's fax device;
- •
- if
sent by e-mail, when sent to the e-mail address for such director, officer or auditor appearing in the records of the Corporation; or
- •
- if
sent by any other form of electronic transmission, when sent to the address, location or number (as applicable) for such director,
officer or auditor appearing on the records of the Corporation.
A notice to a director, officer or auditor will be deemed to be received as follows:
- 9.2
- Notice to Shareholders. Unless the Act or these by-laws provide otherwise, any notice, document
or other information required or permitted by the Act, the regulations, the articles or these by-laws to be sent to a shareholder, may be sent by any one of the following methods:
- •
- by
hand delivery, through the mail, or by a nationally recognized overnight delivery service for next day delivery;
- •
- by
means of fax, e-mail, or other form of electronic transmission;
- •
- by providing or posting the notice, document or other information on or making it available through a generally accessible electronic source and providing notice of the availability and location of the notice, document or other information to the shareholder via any of the methods specified above, including by mail, delivery, fax, e-mail or other form of electronic transmission; or
A-14 Appendix
- •
- by any other method permitted by applicable law.
- •
- if
given by hand delivery, when actually received by the shareholder;
- •
- if
sent through the mail addressed to the shareholder at the shareholder's address appearing on the share register of the Corporation, at the time
it would be delivered in the ordinary course of mail;
- •
- if
sent for next day delivery by a nationally recognized overnight delivery service addressed to the shareholder at the shareholder's address
appearing on the share register of the Corporation, when delivered to such service;
- •
- if
faxed, when sent to a number at which the shareholder has consented to receive notice and evidence of delivery confirmation is received by
sender's fax device;
- •
- if
by e-mail, when sent to an e-mail address at which the shareholder has consented to receive notice;
- •
- if
sent by any other form of electronic transmission, when sent to the shareholder;
- •
- if
sent by posting it on or making it available through a generally accessible electronic source referred to above, on the day such person is sent
notice of the availability and location of such notice, document or other information is deemed to have been sent in accordance with one of the means above; or
- •
- if sent by any other method permitted by applicable law, at the time that such person is deemed to have received such notice pursuant to applicable law.
A notice to a shareholder shall be deemed to be received as follows:
If a shareholder has consented to a method for delivery of a notice, document or other information, the shareholder may revoke such shareholder's consent to receiving any notice, document or information by fax or e-mail by giving written notice of such revocation to the corporate secretary.
- 9.3
- Proof of Service. A certificate of the chair of the board, the chief executive officer, the
chief
financial officer, a vice-president, the corporate secretary or of any other officer of the Corporation in office at the time of the making of the certificate or of a transfer officer of any transfer
agent or branch transfer agent of shares of any class of the Corporation as to the facts in relation to the mailing or delivery of any notice or other document to any shareholder, director, officer or
auditor or publication of any notice or other document shall be conclusive evidence thereof and shall be binding on every shareholder, director, officer or auditor of the Corporation as the case
may be.
- 9.4
- Notice to Joint Shareholders. All notices with respect to shares registered
in more than one name
shall, if more than one address appears on the records of the Corporation in respect of such joint holdings, be given to all of such joint shareholders at the first address so appearing, and notice so
given shall be sufficient notice to the holders of such shares.
- 9.5
- Computation of Time. In computing the date when notice must be given under
any provision of this
by-law requiring a specified number of days' notice of any meeting or other event, the date of giving the notice and the last day of the notice period shall be excluded and, if the last day of the
notice period is a Sunday or a holiday, the notice period shall terminate on the next day following that is not a Sunday or a holiday.
- 9.6
- Undelivered Notices. If any notice given to a shareholder pursuant to this
by-law is returned on
three consecutive occasions because he cannot be found, the Corporation shall not be required to give any further notices to such shareholder until he informs the Corporation in writing of his
new address.
- 9.7
- Omissions and Errors. The accidental omission to give any notice to any shareholder, director, officer, auditor or member of a committee of the board or the non-receipt of any notice by any such person or any error in any
Appendix A- 15
notice not affecting the substance thereof shall not invalidate any action taken at any meeting held pursuant to such notice or otherwise founded thereon.
- 9.8
- Deceased Shareholders. Any notice or other document delivered or sent by post or left at the
address of any shareholder or sent by electronic means as the same appears in the records of the Corporation shall, notwithstanding that such shareholder be then deceased, and whether or not the
Corporation has notice of such shareholder's decease, be deemed to have been duly served in respect of the shares held by him or her (whether held solely or with any person or persons) until some
other person be entered in such shareholder's stead in the records of the Corporation as the holder or one of the holders thereof and such service shall for all purposes be deemed a sufficient service
of such notice or document on his or her heirs, executors or administrators and on all persons, if any, interested with him or her in such shares.
- 9.9
- Persons Entitled to Shares by Death or Operation of Law. Every person who,
by operation of law,
transfer, death of a shareholder or any other means whatsoever, shall become entitled to any share, shall be bound by every notice in respect of such share which shall have been duly given to the
shareholder from whom he derives his or her title to such share prior to his or her name and address being entered on the securities register (whether such notice was given before or after the
happening of the event upon which he became so entitled) and prior to his or her furnishing to the Corporation the proof of authority or evidence of his or her entitlement prescribed by
the Act.
- 9.10
- Waiver of Notice. Any shareholder (or any shareholder's duly appointed proxyholder), director, officer, auditor or member of a committee of the board may at any time waive any notice, or waive or abridge the time for any notice, required to be given to him or her under any provision of the Act, the regulations thereunder, the articles, the by-laws or otherwise and such waiver or abridgement, whether given before or after the meeting or other event of which notice is required to be given shall cure any default in the giving or in the time of such notice, as the case may be. Any such waiver or abridgement shall be in writing or given by electronic signature and may be sent by electronic means in such manner or through such communication facility as the board shall have approved or in accordance with the Electronic Commerce Act, 2000, S.O. 2000, c. 17, as from time to time amended, except a waiver of notice of a meeting of shareholders or of the board or of a committee of the board which may be given in any manner. Attendance of a director at a meeting of directors or of a shareholder or any person entitled to attend a meeting of shareholders is a waiver of notice of the applicable meeting except where such director, shareholder or other person, as the case may be, attends a meeting for the express purpose of objecting to the transaction of any business on the grounds that the meeting is not lawfully called.
SECTION 10
REPEAL AND EFFECTIVE DATE
- 10.1
- Repeal. Upon the enactment of this by-law by the board, By-law No. 1B-92 of the
Corporation is repealed, provided that such repeal shall not affect the previous operation of such by-law or affect the validity of any act done or right, privilege, obligation or liability acquired
or incurred under the validity of any contract or agreement made pursuant to such by-law prior to its repeal. All officers and persons acting under such by-law so repealed shall continue to act as if
appointed under the provisions of this by-law and all resolutions of the shareholders or board with continuing effect passed under such repealed by-law shall continue good and valid except to the
extent inconsistent with this by-law and until amended or repealed.
- 10.1
- Effective Date. This by-law shall become effective immediately upon its enactment by the board, but is subject to confirmation or rejection at the next meeting of shareholders.
SECTION 11
GENERAL
- 11.1
- Corporate Terms. In this by-law and all other by-laws of the Corporation, unless the context requires otherwise, the terms "articles", "auditors", "board", "chair", "chief executive officer", "chief financial officer", "directors", "employees", "executive vice-presidents", "officers", "corporate secretary", "shareholders", "special resolutions" and "vice-presidents" mean, respectively, the articles, auditors, board of directors, chair of the board, chief
A-16 Appendix
executive officer, chief financial officer, directors, employees, executive vice-presidents, officers, corporate secretary, shareholders, special resolutions and vice-presidents (if any) of the Corporation at the relevant time.
- 11.2
- Business Corporations Act. In this by-law, "Act" means the Business
Corporations Act (Ontario), R.S.O. 1990 c. B6, and the regulations thereto, as such may be amended or substituted from time to time. Unless otherwise defined in this
by-law or the context requires otherwise, words and expressions defined in the Act shall have the same meanings when used herein.
- 11.3
- Interpretation. In this by-law, words importing the singular include the
plural and vice versa;
words importing any gender include any other gender; and words importing persons include individuals, bodies corporate, partnerships, trusts and unincorporated organizations.
- 11.4
- Invalidity. The invalidity or unenforceability of any provision of this by-law shall not affect the validity or enforceability of the remaining provisions of this by-law.
APPROVED BY THE BOARD: |
March 17, 2016 |
Appendix A- 17