 Corporate Presentation
Welcome to Orbotech’s
Investor and Analyst Day
June 8
th
, 2010
Exhibit 99.1 |
 Corporate Presentation
2
Agenda
Company Overview
9:00 –
12:30
Market Analysis
12:30 –
1:10
DisplaySearch
Prismark
Lunch
1:10 –
2:00
Product Demonstrations
2:00 –
3:45
Conclusion
3:45 |
 Corporate Presentation
Orbotech Company Overview |
 Corporate Presentation
4
Disclaimer
Except
for
historical
information,
the
matters
discussed
in
this
presentation
are
forward-looking
statements
that
are
subject
to
certain
risks
and
uncertainties
which
could
cause
the
actual
results
to
differ
materially
from
those
projected,
including
industry
trends,
the
timing
and
strength
of
Orbotech’s
or
competitors’
new
product
and
service
offerings,
the
mix
of
product
and
service
revenues,
changes
in
Orbotech’s
or
competitors’
business
or
pricing
strategies,
changes
in
the
prevailing
political
and
regulatory
framework
in
which
Orbotech
(the
“Company”)
operates
or
in
economic
or
technological
trends
or
conditions,
including
currency
fluctuations,
inflation
and
consumer
confidence,
on
a
global,
regional
or
national
basis
and
other
risks
detailed
from
time
to
time
in
the
Company’s
reports
filed
with
the
SEC.
The
Company
assumes
no
obligation
to
update
the
information
herein
contained,
except
as
required
by
law.
Private Securities Litigation Reform Act of 1995
Safe Harbor |
 Corporate Presentation
Assets and Strategy
Rani
Cohen
President and CEO |
 Virtually Every Electronic Device in the World
Is Produced Using Orbotech Systems |
 Corporate Presentation
7
Over 25 Years of Leadership
A world leader in
yield-enhancing
and production solutions for
the electronics industry:
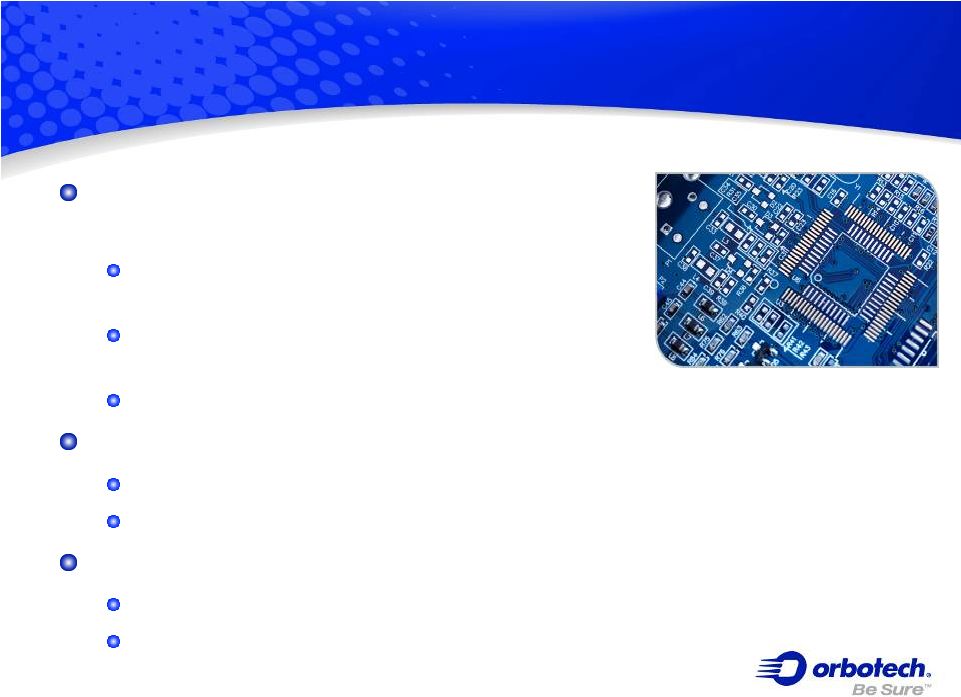
Bare PCB Production
Flat Panel Displays
Other Markets
Nuclear Medical Imaging –
A leading
provider of specialized application products
Check Processing & Business Process Outsourcing –
A leading provider of recognition software and services
A leading provider of machine vision, electro-optics,
artificial intelligence and imaging technologies |
 Corporate Presentation
8
World Wide Installed Base
Medical Imaging
2,000
Recognition
1,000
Bare PCB Production
9,000
FPD Manufacturing
1,400
Installations |
 Global
Infrastructure •
Over 1600 employees worldwide
in
more than 30 locations close to customers
Israel
610 Employees
Headquarters
Main R&D Center
& Production Center
Israel
610 Employees
Headquarters
Main R&D Center
& Production Center
Europe
150 Employees
6 Offices
3 CS Centers
3 R&D Centers
3 Production Centers
Europe
150 Employees
6 Offices
3 CS Centers
3 R&D Centers
3 Production Centers
N. America
220 Employees
2 Offices
4 CS Centers
1 R&D Center
1 Production Center
N. America
220 Employees
2 Offices
4 CS Centers
1 R&D Center
1 Production Center
Japan
100 Employees
1 Office
1 CS Center
1 R&D Center
Japan
100 Employees
1 Office
1 CS Center
1 R&D Center
Pacific
550 Employees
18 Offices
20 CS Centers
1 R&D Center
2 Production Centers
Pacific
550 Employees
18 Offices
20 CS Centers
1 R&D Center
2 Production Centers |
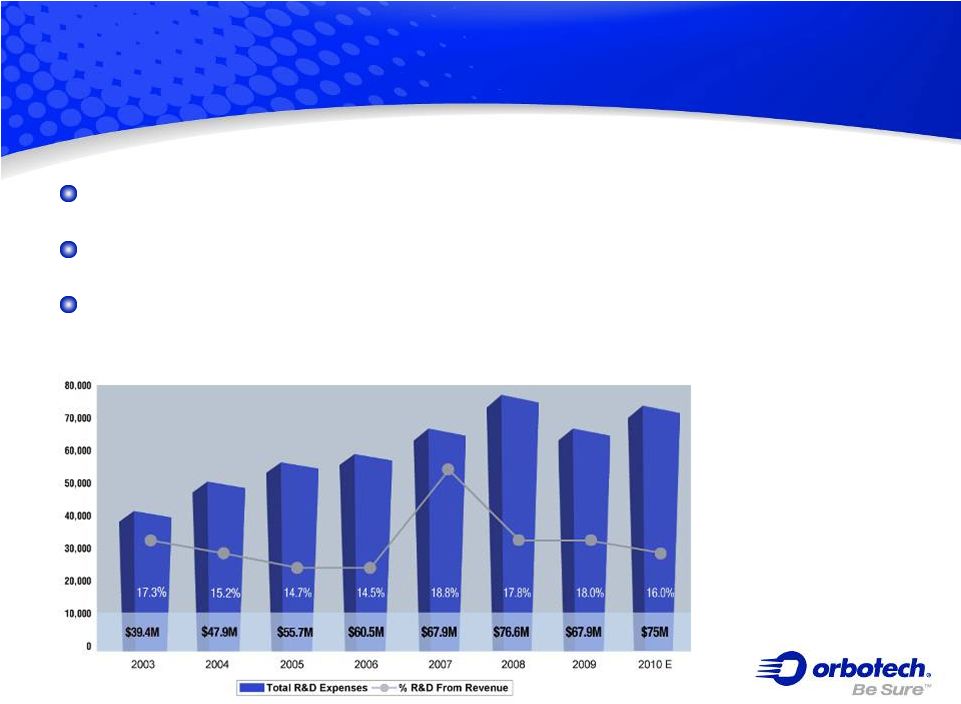 Continuous R&D Investment
Significant product sales are from products introduced recently
400 Scientists and Engineers
Commitment to continued investment despite economic downturns
|
 11
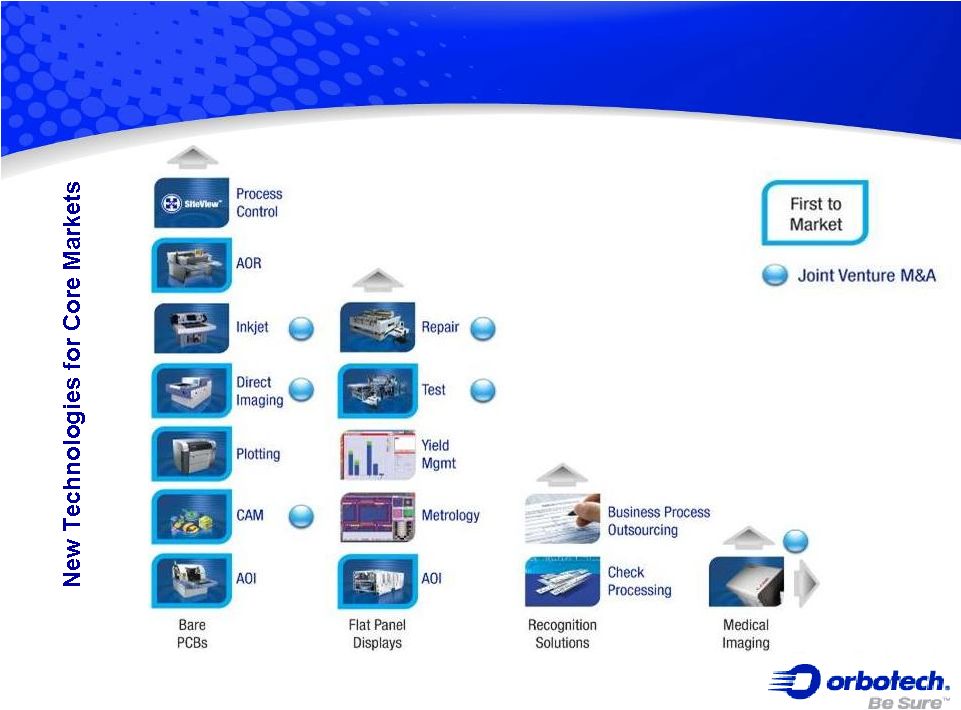
Growth Through Diversification
New Markets for Core
Technologies |
 Corporate Presentation
12
Key Success Factors |
 Corporate Presentation
13
Main Contributors
Technological innovation
Operational excellence
Professional customer support
Niche markets –
gain leadership
position
Prudent financial management |
 Corporate Presentation
14
Critical Factors
Ability to identify, change and adjust
Outsourcing
Shift to China
Products
Solutions
Local
Global
Product Life Cycle
People |
 Corporate Presentation
15
Looking Ahead |
 Corporate Presentation
16
The Environment
External
Global economic situation
Cyclicality, market shifts
Competitive landscape
Internal
National, cultural diversity
Truly global –
operations, R&D, distribution
Two big, different divisions together with “start-ups”
|
 Corporate Presentation
17
Our Strategy
Technological leadership and
innovation
Customer focus
Operational excellence
To be the leader in every industry we serve
Diversification
within
our
markets
New markets |
 Corporate Presentation
18
Well Positioned for Market Growth
Source: Management estimates
Orbotech’s Business is Leveraged
to
Electronics Markets that are Expecting Growth… |
 Corporate Presentation
19
Well Positioned for Continued Success
Leadership in all current industries
Significant on-going R&D investment
Proven ability to leverage:
Core technology competencies
Extensive global infrastructure
Operational performance and execution
Financial strength |
 Corporate Presentation
20
Thank You |
 Corporate Presentation
Printed Circuit Boards
Richard Klapholz
Corporate VP and President
PCB Division |
 Corporate Presentation
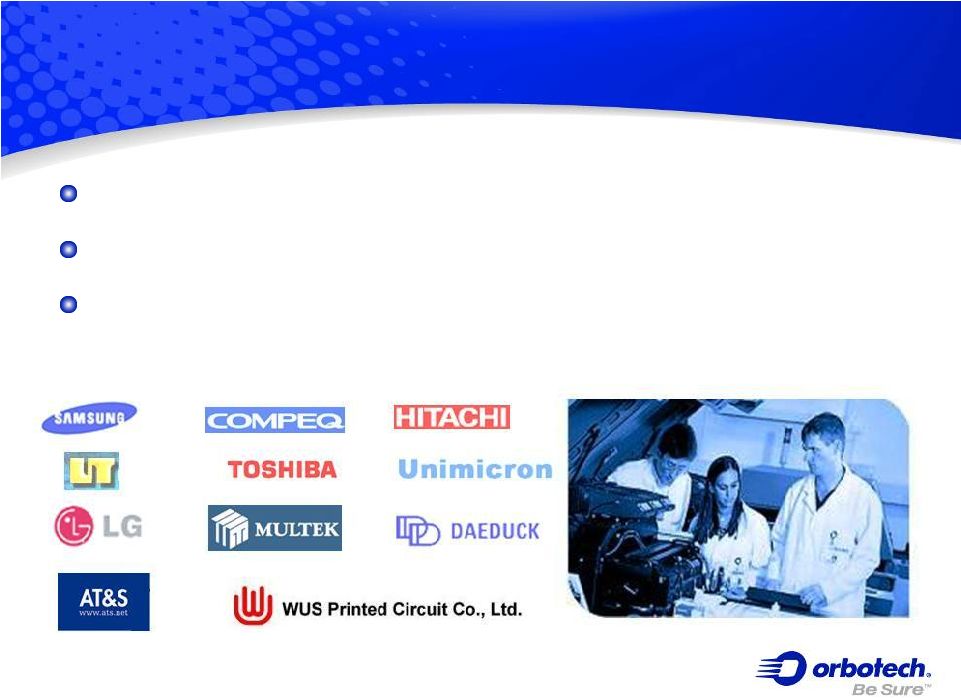
22
Orbotech Presence in PCB
Presence in all leading PCB shops worldwide
Proven solutions for multiple applications and production levels
Recognized supplier of “must-have”
enabling technologies for
advanced production |
 Corporate Presentation
23
PCB Market Overview
Pacific -
Fast recovery driven by stronger
demand + growing attractiveness
Utilization 85% + for computing, communication
and consumer products
Smartphone growth pushing expansion and
advancement in HDI and FC-CSP
Intel CULV technology increases HDI penetration to PC
Japan –
Slowly recovering
Capacity utilization has recovered to 80%
Capacity
expansions
continue
–
overseas
West -
Strongly hit by the financial crisis
Recession terminated any volume production
Industry maintained by low-volume niche markets
Source: Management estimates |
 PCB
Market Drivers Equipment Demand Capacity & Capability
Mobile phones
High continued unit growth expected
PCs
Mini-note PC’s (“NetBooks”)
as a significant new category
Consumer electronic “hits”
Flat screen TVs
e-Books
Sources: Industry sources and management estimates
(M Units) |
 Corporate Presentation
25
PCB Market Growth
Demand Driven by Growth in Consumer Electronics
New PCB plants are built
LDI
CAM & Engineering
LP
AOI
Verification
AOR
Inkjet |
 PCB
Market Trends Technology
Smart phones drive advanced HDI
Fine
pitch
packages
Finer
lines
and
spaces
Smaller vias
Increase in HDI usage in PCs
6/6 L/S in Intel’s roadmap for 2014
Prismark view: L/S won’t go below 10/10µm
Strong growth in FC-CSP segment
Sources: Industry sources and management estimates
26
400µm |
 Corporate Presentation
27
PCB Market Trends
Technology Example: iPhone
3G
One Main HDI PCB, Several Flex, Many IC Substrates
Source: Prismark (04/’
09) |
 28
PCB Market Trends
Technology Example: iPad
Main board using 1+8+1 HDI construction
Source: Prismark Discovery: iPad
(04/’10)
|
 Corporate Presentation
29
2008-2010 PCB Volume by Region [$M]
0
2,000
4,000
6,000
8,000
10,000
12,000
14,000
16,000
18,000
2008
2009
2010F
PCB Market Trends
Regional Growth -
Mainly in Pacific in 2010
Source: Prismark (05/’
10) NT Information (05/’10)
Growth is primarily in China
China’s Production will Exceed 2008 Peak
PCB Volume Growth by Region
7.7%
5.5%
8.2%
15.2%
8.0%
13.5%
9.5%
-17.5%
-30.1%
-18.4%
-4.7%
-1.6%
-19.9%
-4.4%
Americas
Europe
Japan
China
SE Asia
Taiwan
S.Korea
2009
2010F |
 Corporate Presentation
30
Ensure Advanced Product Capabilities
Keep pace with pattern miniaturization
Gain long-lasting investment protection
Minimize Cost of Operations
Guarantee highest production yields
Save on material and time
Maximize Productivity
Assure highest machine uptime
Benefit from digital production versatility
PCB Manufacturers’
Critical Requirements
“Increasing Business Profitability” |
 Corporate Presentation
31
Bare PCB Solutions |
 Corporate Presentation
33
PerFix™
Automated Optical Repair
Accurately repairs any type of
excess copper (short)
on fine-line PCBs
Overcomes traditional limitations
of manual repair
Opportunity for significant
customer cost-savings
by reducing panel scrap
The Industry’s Only Automated Solution |
 Corporate Presentation
34
Enabling technology for complex
and advanced applications
Increased adoption for
high-end
mainstream applications
Used in all segments
including
packaging and solder mask
Paragon™
Laser Direct Imaging (LDI) Systems
LDI Becoming a “Must Have”
Solution |
 Corporate Presentation
35
LDI: The New Photolithography Industry Standard
1990
2000
2010
2020
Automatic
Exposure
Effective T/P
Increased need for
patterning digitization
Improved LDI cost of
ownership
Laser Direct Imaging
will increasingly replace Automatic
Exposure at all production stages |
 Corporate Presentation
36
Sprint™
Inkjet Legend Printers
Next Generation Solution
High speed, high accuracy direct
legend imaging
Integrated UV ink curing
Prints fine features with tight registration
requirements and high yield
Significantly cuts cycle time –
cost effective
Supports the use of multiple commercial inks |
 Corporate Presentation
37
Future Annual Total
Addressable Market (TAM)
Near
Far
Legend
PCB
Soldermask
PCB
Etch Resist
PCB
Active Printed
Electronics
Full PCB
Production
Embedded
Passives PCB
Inkjet for Electronics –
The Vision
Inkjet will become a major patterning
technology in Electronics production |
 Corporate Presentation
38
PCB Market Outlook
5-10 Year Horizon
All additional exposure capacity for
advanced PCB’s will be LDI-based
The LDI revolution has just started
All legend printing will digitalized
No more “old”
silk screen printing
Inkjet as a major imaging technology
in PCB manufacture
All PCB makers will have moved
(at least partially) to digital repair
technologies
Sources: Management estimates |
 PCB
Market Outlook The Digital Path
AOI
CAM
LDI
Used by over 70% out of top 25
makers; more than 200 customers
Automated Optical Repair
Pre Engineering
Orbotech has the vision, capabilities and endurance to
commercialize innovative production technologies
Digital Production will play a larger
role in the future PCB production
Used by virtually all PCB makers
Used by dozens of PCB makers
Used by virtually all PCB makers
Used by virtually all PCB makers
Best selling Inkjet solution
The
only
automated
repair
solution
in
the market
New Manufacturing Solutions
Inkjet
Laser Plotter |
 Corporate Presentation
40
Thank You |
 Corporate Presentation
Flat Panel Displays
Jay Cho
VP/GM Tester & Repair Business Group
FPD Division |
 Corporate Presentation
42
Orbotech is a world leader in yield management
Automated Optical Inspection (AOI)
Test
Repair
Flat Panel Displays |
 Corporate Presentation
43
Orbotech Presence in FPD
Presence in all LCD fabs
Proven solutions for all generations
All platforms extendable to any & all glass sizes, support niche
applications as well as mainstream LCD |
 Corporate Presentation
44
FPD Market Overview
LCD
CAPEX
driven
sales
–
in
turn
driven
by Large Area (esp. TV)
Supply Chain drives cyclicality
LCD Equipment TAM:
~$10Bn avg
tool spending
~$1Bn of which is inspection, test,
measurement and repair
Main trends: Consumer demand growth,
cost & pricing pressures, product innovation
$6Bn~$12Bn/year
total LCD spending
Sources: Industry sources and management estimates
TFT Array Manufacturing
~50%
Color Filter
Manufacturing
~22%
Cell
Manufacturing
~22%
Module
Module
~6%
~6% |
 Corporate Presentation
45
FPD Market Outlook
Source: DisplaySearch
May 2010
Strong recovery 2010+2011
2010 CAPEX: over $13Bn
Expected similar
investment level in 2011
Based largely on China
Investment plans
Our own TAM –
out of above total spending:
~$350m/year out of ~$1Bn total TFT Test, Inspection and
Repair |
 Corporate Presentation
46
FPD Market Outlook
Regional Growth
Source: DisplaySearch
April 2010
Source: DisplaySearch
April 2010
Significant increase
in Chinese
investments |
 Corporate Presentation
47
Xining
Ürümqi
Lhasa
Kunming
Chengdu
Chongqing
Nanning
Guangzhou
Hong Kong
Fuzhou
Changsha
Xi‘an
Lanzhou
Yinchuan
Taiyuan
Tianjin
Hailar
Qingdao
Nanchang
Haikou
Shiquanhe
Kashi
Guiyang
Taipei
CATIC (SVA-NEC)
Shanghai G5
BOE OT
Beijing G5
IVO
Kunshan
G5
Wintek
Suzhou G3
Century Display
Shenzhen G5
Truly
Shanwei
G2.5
Tianma
Shanghai G4.5
BOE
Chengdu G4.5
Tianma
Chengdu G4.5
BOE B3 -
Hefei
Hefei
Zhengzhou
FPD Customer Base in China |
 48
FPD Market Outlook
2010-2011 Highlights
Xining
Ürümqi
Lhasa
Kunming
Chengdu
Chongqing
Nanning
Guangzhou
Hong Kong
Fuzhou
Changsha
Xi‘an
Lanzhou
Taiyuan
Tianjin
Hailar
Qingdao
Zhengzhou
Hefei
Nanchang
Haikou
Shiquanhe
Kashi
Wuhan
Guiyang
Taipei
BOE B4 –
Beijing
Largest Opportunity
LG P8E and P7 -
Korea
SEC T8-1 and T8-2 -
Korea
Chinastar
(CSOT) -
Shenzen
AUO 7K G7.5 -
Kunshan
Corporate Presentation
48 |
 FPD
Market Drivers Demand Growth Fuels Investments |
 Corporate Presentation
50
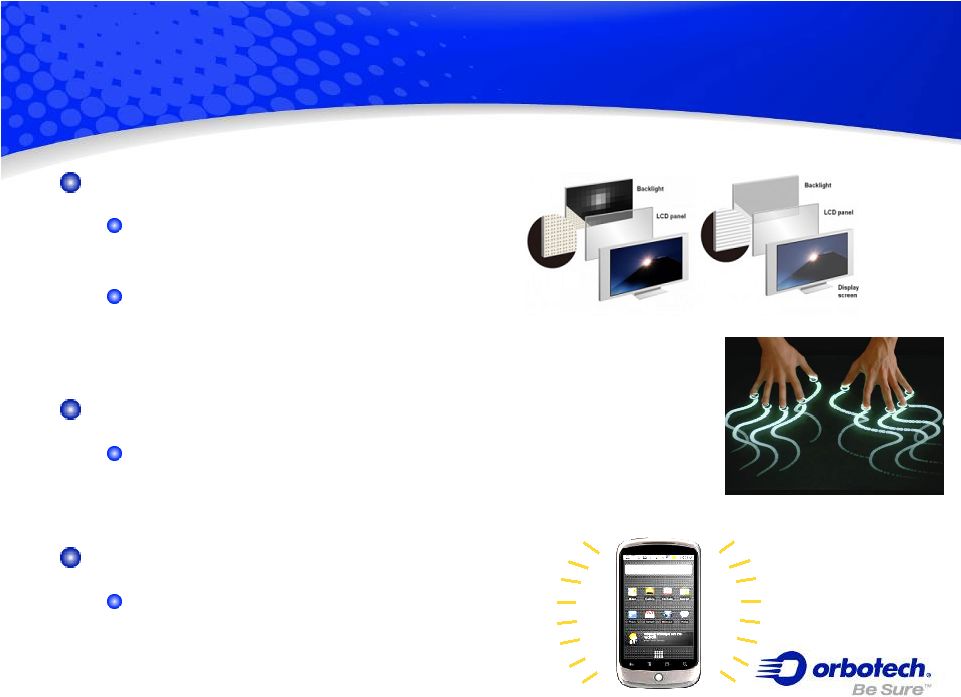
FPD Market Trends
Technology I: Increase Consumer’s Value
TV
LED Backlight -
improved
contrast & power consumption
3D TV –
based on 240Hz
sequential R/L + active eyeglasses
IT Segment
Touch for mobile IT -
proliferation of lower cost ,
higher performance
Touch technologies
Small Displays
AMOLED: eg
in Google Nexus One |
 Corporate Presentation
51
FPD Market Trends
Technology II: Decrease Costs & Price
Across the board
Multiple design & manufacturing cost reduction strategies
Significant cost-downs expected for larger size screens
TV-specific
4-primary Color –
improved brightness, power,
and Backlight cost (most expensive component)
IT Segment
Gate Driver Integration on Glass
Migration to G7 and larger (prev. for TV’s) |
 Corporate Presentation
52
FPD Solutions |
 Corporate Presentation
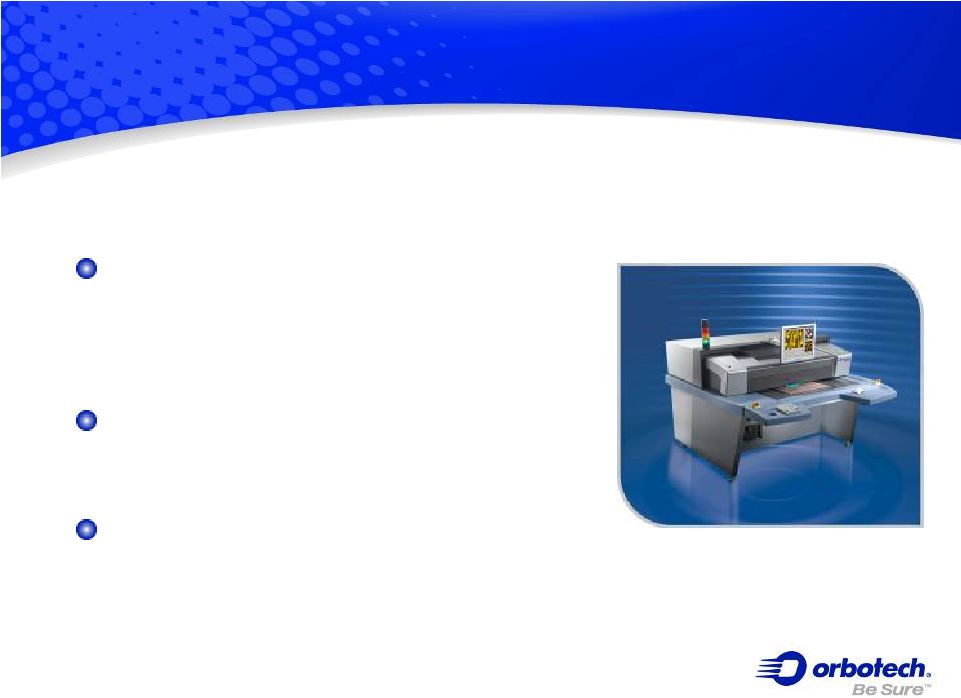
53
FPD Automated Optical Inspection (AOI)
In-line and off-line configurations
Models for all generations
Unmatched defect detection with
extremely accurate classification
at the highest throughput rates
Unique image acquisition and
image processing technologies
Industry’s Best Selling AOI Solutions |
 Corporate Presentation
54
FPD Testers
Industry-Leading Solution
Functional equivalence of semi-
finished panel to check electrical
functionality
Unique photo-voltaic
system,
IP protected
Quality assurance for 100% panels
Crucial QA step for yield/quality |
 Corporate Presentation
55
FPD Repair Systems
Production-proven Technology Leader
Laser cutting of electrical shorts
Multiple laser wavelengths
applied via imaging system
Enhanced with automated defect
classification and repair strategy
Directly increases product yield |
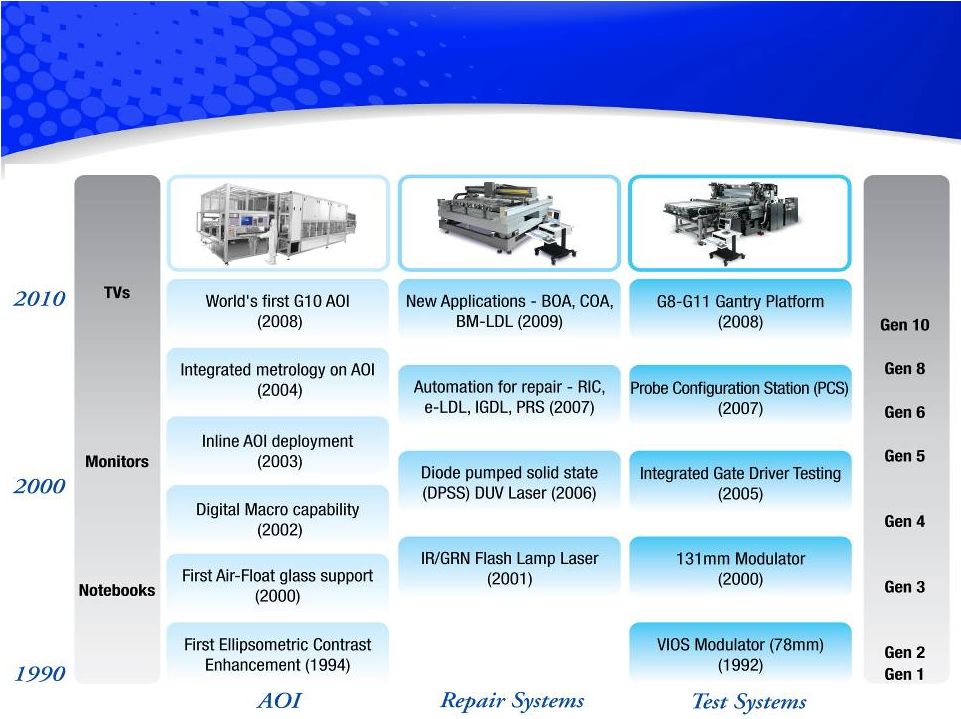 FPD
Roadmap In Sync with Market |
 Corporate Presentation
57
FPD Market Outlook
The Yield Enhancement Path
Leadership Through Product Innovation and Customer Focus
Corporate Presentation
57 |
 Corporate Presentation
58
Thank You |
 Corporate Presentation
Break |
 Corporate Presentation
Recognition Software
Barry Cohen
Co-General Manager
Orbograph |
 Corporate Presentation
61
Recognition Solutions
A leading provider of recognition-centric
software and services for the check
processing and forms processing markets
Converting handwritten information into
intelligent electronic data
Processing billions of checks and forms
annually
Orbograph Ltd. |
 Corporate Presentation
62
Orbograph
Presence
More
than
1000
financial
institutions
use
Orbograph
software
Used in 20 out of 30 of the top U.S. banks that have check
processing operations
Recognized as best-in-class industry leader and innovator
|
 Corporate Presentation
63
Secure Internet Connection
Orbograph
Key-Pay Hub
Orbograph
Key-Pay®
Workflow
Images captured (Distributed
& Central)
Back-office recognition
Snippets of image
routed to Key-Pay Hub
Image Capture
Application
Orbograph
Did the engine
read the item?
Result enhancement
Data verification
Average processing
time: 90 seconds
YES
NO
Enhancement Logic
NO
YES
Clip: |
 Corporate Presentation
64
Check Processing Automation
Designed to reduce costs from check
processing workflows by as much as
40% |
 Images captured
(Distributed & Central)
Automation Services
(recognition)
Data verification
Est. processing window:
1-10 minutes
Field snippets
routed to Key-Pay Hub
Enhancement Logic
Back
Counter/
Branch
Teller Capture
Centralized
Capture
Key Pay Hub
Enhancement
Logic
Data
Verification
Successfully Processed:
High Confidence Items
Low Confidence
Items in Process
A
B
B
Orbograph
Key-Pay Technology |
 Corporate Presentation
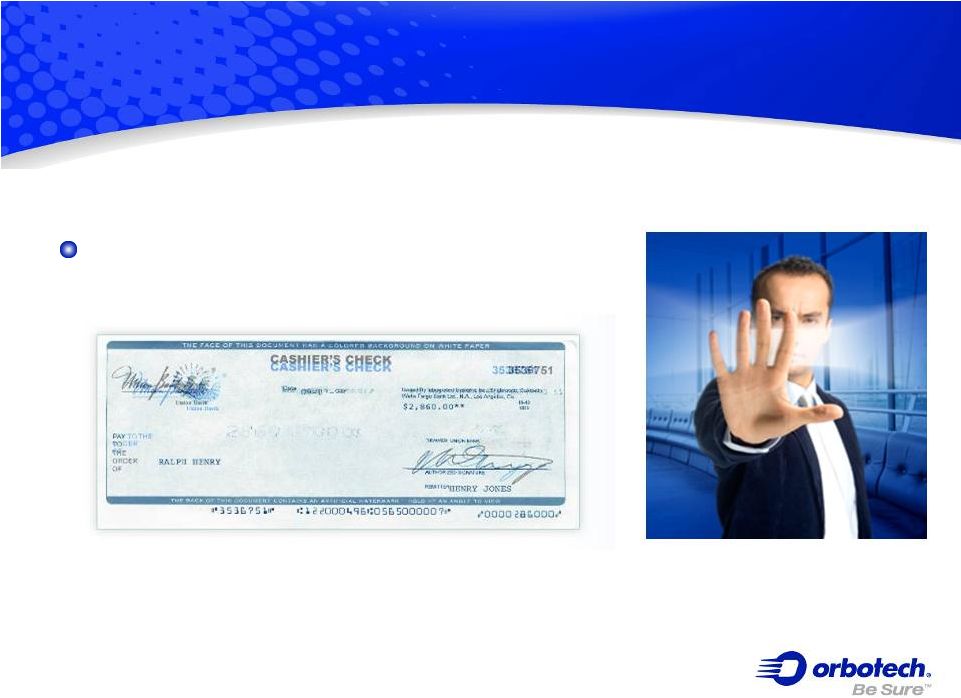
66
Recognition-based solution designed to
protect against fraudulent check transactions
Fraud Prevention |
 Corporate Presentation
67
Data Mining for Marketing
Utilize check image data to generate
focused customer lists for direct marketing
campaigns |
 Forms
Processing Automation Automating the labor-intensive manual
processing of hand-written forms
Maximize efficiencies for organizations
overwhelmed with data entry and data
correction requirements
Growth area for Orbograph
Corporate Presentation
68 |
 Corporate Presentation
69
Orbograph
Business Model
Sold primarily through industry resellers as
part
of
larger
integrated
solution
-
some
direct sales
Recent shift from selling licenses to
software as a service (SaaS) model
Addresses market need for increased
efficiency, lower labor costs and reduced
software capital investment
Provides recurring revenue stream
Combining Creative Technological
Deployment
with Innovative Business Models |
 Corporate Presentation
70
Thank You |
 Corporate Presentation
Solar Power
Wendell Blonigan
CEO
Orbotech LT Solar |
 Corporate Presentation
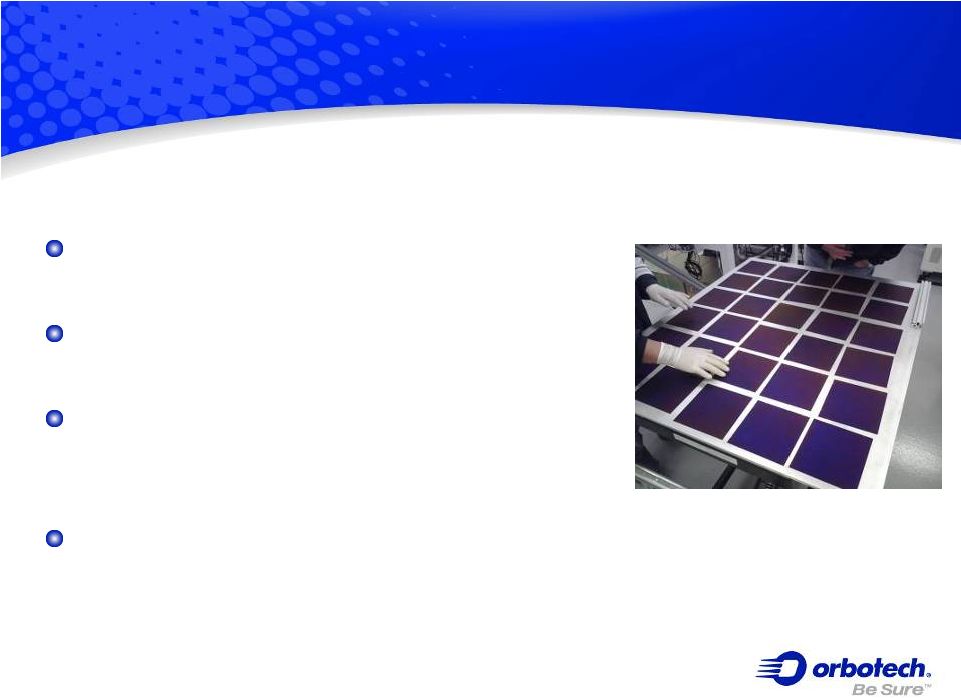
72
Solar Power
Orbotech LT Solar, LLC
Recent joint venture with LT Solar
Based in San Jose, CA
Involved in Crystalline Silicon Photovoltaic
(c-Si PV) manufacturing process
Employs some of the most talented
professionals in this field and experienced
management team |
 Q3/10
Q4/10
Q1/10
2005
2006
2007
2008
2009
2010
2011
Core I/P & Technology
Development
System & Process
Development
Product
Development
Product
Launch
LT Solar Formed
Core IP Developed
PHTN / LT Solar JDP
PHTN / LT Solar JDP Complete
PHTN Lab Facility Complete
ORBK Acquires PHTN
Orbotech LT Solar, LLC Formed
OLTS Evolution
Product and Company Timeline
ORBK has majority stock
holding in OLTS
OLTS 100% funded by
ORBK and fully
consolidated in results
Corporate Presentation
73 |
 PV
Industry
-
Supply
Chain
Wafer Based PV Modules
Raw material:
Silicon
Silicon purified,
conditioning in ingots
& then blocks
Sawing of
blocks to
obtain wafers
Solar cell
Obtained from
Wafer processing
Assembling of
cells in a module
Integration of
the module in
a system |
 Corporate Presentation
75
The PhotoVoltaic
Market
Solar Electric Energy
installations have consistently
grown by 20-25% annually,
forecasted to accelerate to 40%
Photovoltaic equipment forecast
to generate revenues of
$2.5 billion in 2010
In 2008, our targeted equipment
segment was $400M
We are researching additional
areas to apply our technology
and expertise
Sources: Management estimates and Solarbuzz, Yole
Development, EPIA, Navigant Consulting
40%
CAGR |
 Corporate Presentation
76
Crystalline Silicon PV Manufacturing
Capacity
Sources: Management estimates and Solarbuzz, Yole
Development, EPIA, Navigant Consulting
Crystalline Silicon continues
to be the dominant technology
in PV
New capacity investments
forecasted between 3 to 5 GW
annually, with an installed
capacity CAGR of >30%
In our target equipment segment,
each GW of capacity generates
$100M
Strong opportunity to reduce
the overall CoO in our targeted
segment |
 Corporate Presentation
77
Product Development: Aurora PECVD
Thin Film Deposition System
For the deposition on SiNx Anti-Reflective
Coating (ARC)
Coating is used to match refractive indexes,
and improve the efficiency of the solar cell
Applying thin film technology & large-area
industrial processing and equipment
expertise
Combining the high efficiency performance
of direct PECVD and the productivity of high
throughput operation |
 Corporate Presentation
78
Thank You |
 Corporate Presentation
China Market
Martin Yang
Senior VP PCB Business
Orbotech Pacific |
 Corporate Presentation
80
PCB Manufacturing Industry Migration
China’s global share has grown from 8.2% in 2000
to more than 31% in 2008 with a forecast of 37% by 2013
2000
2008
2000
2008
2000
2008
2000
2008
27%
9.3%
16%
6.7%
28%
21.1%
30%
62.9%
Source: Prismark
50%
28% |
 Corporate Presentation
81
2001-2010 Orbotech China Sales % of Pacific
China sales percentage in Orbotech’s
Pacific sales increasing in the last decade:
From >30% in 2001 to 60% in 2009
Expect to increase in 2010 |
 Corporate Presentation
82
China PCB Market will Keep Growing >10%
Source: Prismark (11/2009) NT Information (01/2010) |
 |
 Corporate Presentation
84
PCB Manufacturing in China
1,000 PCB Shops
Investment from Taiwan / HK / US / Europe / Japan / Korea
Local Chinese PCB Manufacturer
What did we experience in the past few years ?
Growth in both capacities and technology requirements
(HDI, Packaging)
Geographical spread (due to government promotion policy)
High rise in local PCB shops
Tough competition
price erosion in PCBs |
 Technology/Application Trends
Smartphones (0.4mm)
Meiko
Multek
Compeq
CCTC
Low cost phones (India, China)
Foxconn
Founder
Redboard
Meadville
E&E
More 3G infrastructure
Notebooks, Netbooks
Gold Circuit
Hannstar
Xing Ying
IC Substrates, Packaging
Kinsus
Nanya
UTC, Access, SCC, …
Corporate Presentation
85 |
 Corporate Presentation
86
Traditional PCB MFG area
New PCB MFG area
FPD MFG area
China PCB Manufacturing Locations |
 Corporate Presentation
87
The Rise of Local Chinese Makers
There are already 4 Chinese makers with >$100M in revenues:
Founder, CCTC, Shennan, Fast Print
Heavy investment to become global players by expanding capacity
and improving technology
Founder: from DS/SS and simple MLB to advanced HDI and IC
substrates
CCTC: an HDI PCB supplier to Nokia and others, checking entry to
IC
substrates
Fast Print: from QTA to mass production
Shennan: increase in layer count capability, HDI technology, entry to IC
substrate production
Many smaller makers are expected to reach this size in the short-
medium term |
 88
Founder PCB Industrial Park:
March 2008
1 campus: 3 factories (HDI, IC substrates, QTA/Sample)
6 plants in total, more are planned
Goal: #1 in China in 5 years
Founder PCB
Industrial Park |
 Corporate Presentation
89
SCC Industrial
Park |
 Corporate Presentation
90
FastPrint: The Biggest QTA PCB Shop on Earth |
 Corporate Presentation
91
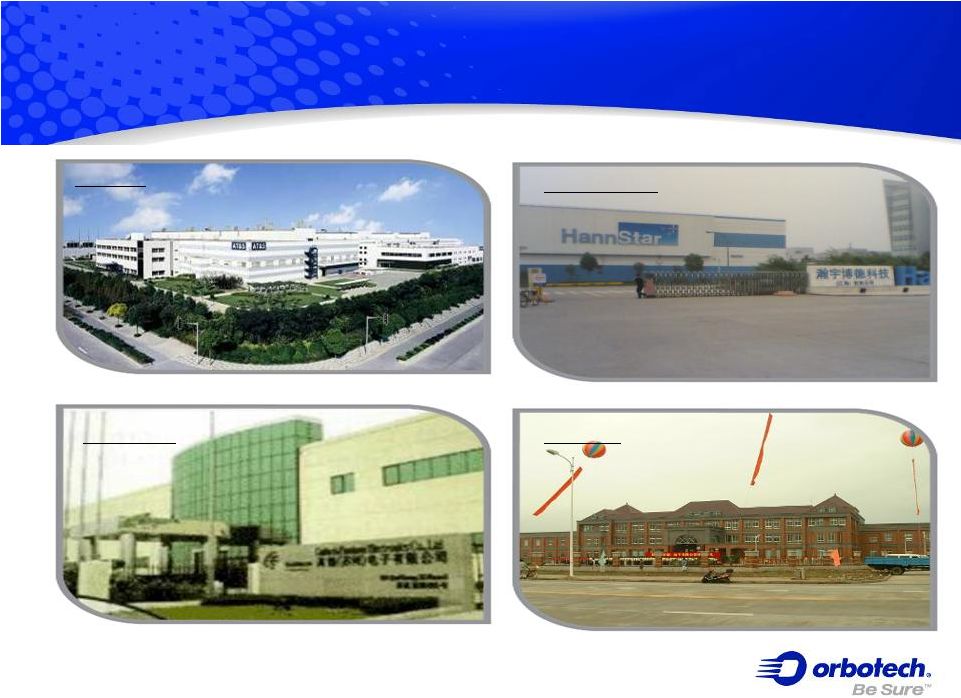
China -
Customers
HannStar
Tripod
AT&S
Gultech |
 Corporate Presentation
92
Semco-KS
Dynamic
Foxconn
WUS
China -
Customers |
 Corporate Presentation
93
Orbotech in China |
 Corporate Presentation
94
Sustained Success for 15 Years
First office
established
-
mid
1990’s
The widest product portfolio supplier with
facilities in China
Established Chinese
PCB manufacturers client base
China represents a large
percentage of Orbotech’s business
OPERATING
IN
GUANGZHOU
SINCE
MID
1990’s |
 Corporate Presentation
95
Orbotech China -
Market Status
Customers base
~400 potential customers
~250 active accounts
Very large installed base of Orbotech equipment
1200 Discovery AOI
65 Paragon LDI
Significant potential for further growth |
 Corporate Presentation
96
Employees
PCS ~160, 6 remote offices
PCN ~110. 4 remote offices
Two training centers
Pacific Response Center
Pacific R&D center, repair lab and
purchasing
Orbotech
China –
Organization |
 PCS
PCN
99% of PCS Customers:
-
ShenZhen
-
GuangZhou
-
ShaJing
-
HuiZhou
-
DongGuan
-
ZhuHai
-
Hong Kong
Orbotech China
Follow the Customers –
Couple of Years Ago
99% of PCN
Customers:
-
Shanghai
-
KunShan
-
SuZhou
-
WuXi
-
ChangShu
-
JianYin
-
NanJing
Corporate Presentation
97 |
 Corporate Presentation
98
PCS
PCN
PCB Square, HaiKou
Most PCS Customers
RedBoard, JiangXi
Dynamic, FuJian
Meiko, WuHan
Most PCN
Customers
Foxconn, HuaiAn
Foxconn, YanTai
Foxconn,
YinKou
and
Foxconn, QingHuangDao
Ibiden, BeiJing
TPC, TianJin
Orbotech China
Follow the Customers –
Today
Founder PCB |
 Corporate Presentation
99
Orbotech China
Strong Local R&D
and CS Presence
R&D and Engineering Support
R&D engineers are being trained
and deployed locally
Building local customer support
R&D centers in China are due to
open in 2010
More than 165 Customer Support
Engineers |
 Corporate Presentation
100
Orbotech China
China Oriented Product Portfolio |
 Corporate Presentation
101
Orbotech China
Summary
PCB market worldwide and manufacturing capabilities in China
continue to grow
Orbotech continues its partnership with overseas customers who
move to China
Build close relationship with local Chinese manufacturers
Well established organization and infrastructure in China –
Management, Customer Support, Sales, Operations, Engineering,
R&D
Product portfolio adjustments to match Chinese production needs
Orbotech is well positioned to serve the growing market and
increased demand in China |
 Corporate Presentation
102
Thank You |
 Corporate Presentation
Customer Support
Mike Butler
VP Customer Support
FPD Division |
 Corporate Presentation
104
Orbotech Customer Support Focus
World class professional organization
Provide profitable customer satisfaction
Achieve sure quality and delivery
Meet the company's business targets |
 Corporate Presentation
105
Customer Support Value to the Company
Strategically important for
customer relationships
Differentiating factor vs.
our competition
Source of recurring revenue
with high profitability |
 Corporate Presentation
106
Customer Support Infrastructure
Over 500 employees in 30 countries
Supporting over 8000 AOI systems, 600 Test & Repair systems,
400 LDI, 650 Plotters and 4000 CAM stations
5 response centers, 5 customer training centers
State-of-the-art support tools and programs
Highly Professional Worldwide Organization |
 107
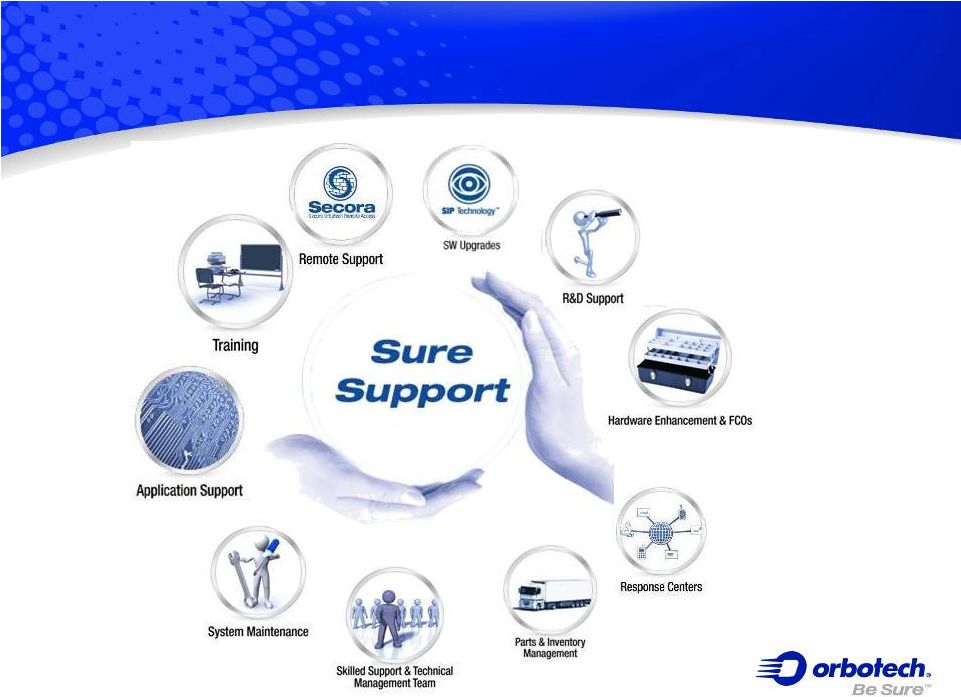
Customer Support Services |
 Corporate Presentation
108
Customer Support Value Proposition
Examples:
Remote Support Access
Response centers
Translates to:
Faster closed calls
Better Responsiveness
Improved operational efficiencies
Staff Expertise
Increasing Customer Satisfaction & Profitability |
 Corporate Presentation
109
Thank You |
 Corporate Presentation
Financials
Erez
Simha
Corporate VP & CFO |
 Corporate Presentation
111
333.3
83.2
266.5
94.2
323.0
106.5
268.0
109.6
348.0
117.0
0.0
100.0
200.0
300.0
400.0
2006
2007
2008*
2009
2010 (E)
Sales
Service
Annual Revenues ($M)
416.5M
377.6M
429.5M
360.7M
465M |
 Corporate Presentation
112
Quarterly Revenues ($M)
66.4
25.5
66.7
27.3
64.4
27.9
70.6
28.8
76.2
26.9
0.0
25.0
50.0
75.0
100.0
Q12009
Q22009
Q32009
Q42009
Q1 2010
Sales
Service
91.9M
99.4M
92.3M
94.0M
103.1M
Combined guidance for Q2-Q3/2010 -
$260-$270m |
 Corporate Presentation
113
Sales Distribution Q1/10
By Product Lines
FPD
45%
PCB
50%
Medical
Imaging
3%
Recognition
2% |
 Corporate Presentation
114
Sales Distribution Q1/10
By Region
Japan
5%
China
26%
Korea
17%
Europe
7%
North America
8%
Other
3%
Taiwan
34% |
 Corporate Presentation
115
Gross Margin Trend
100.5
105.1
94.7
129.2
91.9
94.0
92.3
99.4
103.1
40.7%
41.2%
38.1%
37.0%
39.1%
36.2%
38.1%
40.6%
35.1%
Q1/08
Q2/08
Q3/08
Q4/08
Q1/09
Q2/09
Q3/09
Q4/09
Q1/10
Rev ($M)
G.M (%) |
 Corporate Presentation
116
Margin Analysis (Percent)
7.9%
7.0%
12.5%
0%
5%
10%
15%
2008
2009
Q1/10
EBITDA
Non GAAP
Operating Income
4.9%
3.7%
9.3%
0%
5%
10%
15%
2008
2009
Q1/10
For a discussion of the EBITDA and Non-Gaap measures, their limitations and
reconciliation to the comparable GAAP
measures
-
see
our
annual
form
20-f
filings
and
6-k
filings
with
the
SEC.
For a
reconciliation of EBITDA to Net Income see last slide of the financial
presentation. 34.2M
26.5M
12.9M
20.9M
14.4M
9.6M |
     Corporate Presentation
117
Operating Model
2009
2010 (E)
Long
Term
Revenues ($M)
$378M
$460M-$470M
100%
100%
Gross Margin
37.6%
42%-43%
43%-45%
Net R&D as % of Revenues
18.0%
16.0%
14%-15%
SG&A % of Revenues
17.3%
14.5%
12%-13%
Non GAAP Operating Margin
3.7%
11.5%-12.5%
15%
GAAP Net Margin
(5.3%)
5%
10%
100% |
 Corporate Presentation
118
Financials Summary
Proven record of managing
the business throughout the
cycles
Significant operating leverage
Larger business opportunities
in 2010 |
  119
EBITDA Reconciliation –
Q1 2010
2010
Q1
Reported Net Income
1.6
Adjustments of Impairment
0.6
Stock Based compensation
1.4
Taxes
0.8
Financial Expenses
2.2
Depreciation
2.7
Amortization
3.6
EBITDA
12.9
% of Revenues
12.5%
($ Millions) |
 Corporate Presentation
120
Thank You |
 Corporate Presentation
Summary
Adrian Auman
Corporate VP IR |
 Corporate Presentation
122
Summary
Multiple growth drivers in PCB and FPD
Undisputed technology and proven market leadership
Diversified product portfolio
Strong operating and financial leverage
Highly experienced management team |
 Corporate Presentation
Break |
 Corporate Presentation
Q&A |
 Corporate Presentation
Thank You! |