



Wisconsin | 39-0971239 | |
(State of Incorporation) | (IRS Employer Identification No.) | |
¨ | Written communications pursuant to Rule 425 under the Securities Act (17 CFR 230.425) |
¨ | Soliciting material pursuant to Rule 14a-12 under the Exchange Act (17 CFR 240.14a-12) |
¨ | Pre-commencement communications pursuant to Rule 14d-2(b) under the Exchange Act (17 CFR 240.14d-2(b)) |
¨ | Pre-commencement communications pursuant to Rule 13e-4(c) under the Exchange Act (17 CFR 240.13e-4(c)) |
Item 2.02 | RESULTS OF OPERATIONS AND FINANCIAL CONDITION |
Item 7.01 | REGULATION FD DISCLOSURE |
Item 8.01 | OTHER EVENTS |
Item 9.01 | FINANCIAL STATEMENTS AND EXHIBITS |
EXHIBIT NUMBER | DESCRIPTION |
99.1 | Press Release of Brady Corporation, dated February 19, 2016, relating to second quarter fiscal 2016 financial results and increase in share buyback program. |
99.2 | Informational slides provided by Brady Corporation, dated February 19, 2016, relating to second quarter fiscal 2016 financial results. |
BRADY CORPORATION | ||
Date: February 19, 2016 | /s/ AARON J. PEARCE | |
Aaron J. Pearce | ||
Senior Vice President, Chief Financial Officer and Chief Accounting Officer | ||
EXHIBIT NUMBER | DESCRIPTION |
99.1 | Press Release of Brady Corporation, dated February 19, 2016, relating to second quarter fiscal 2016 financial results and increase in share buyback program. |
99.2 | Informational slides provided by Brady Corporation, dated February 19, 2016, relating to second quarter fiscal 2016 financial results. |
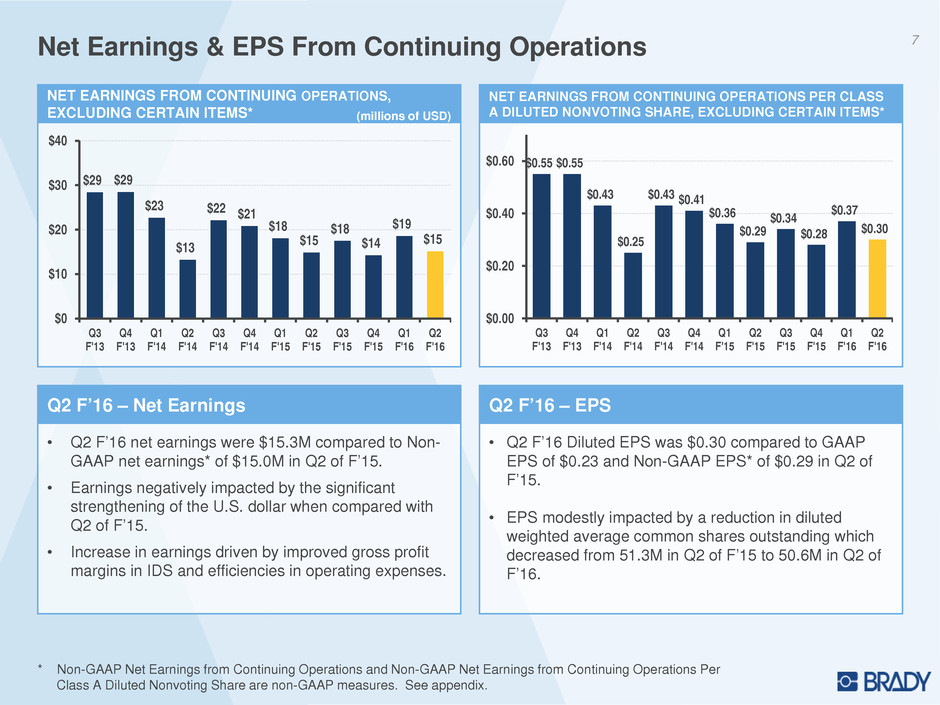
• | Earnings per diluted Class A Nonvoting Common Share of $0.30 in the second quarter of fiscal 2016 were up 30.4 percent and 3.4 percent compared to GAAP and non-GAAP earnings from continuing operations per diluted Class A Nonvoting Common Share* of $0.23 and $0.29, respectively, in the same quarter of the prior year. |
• | Organic revenue growth of 0.4 percent for the quarter ended January 31, 2016. |
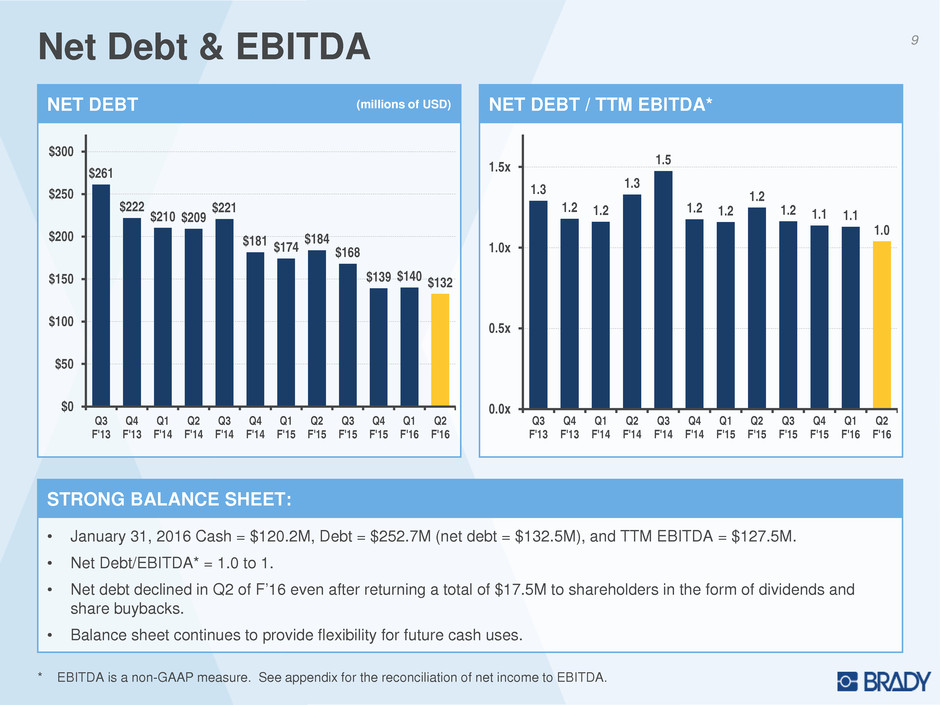
• | Net cash provided by operating activities was $27.9 million during the second quarter of fiscal 2016, compared to $5.3 million in the same quarter of the prior year. |
• | Returned $10.2 million to shareholders in the form of dividends and $7.2 million through the repurchase of 338,579 shares during the quarter ended January 31, 2016. |
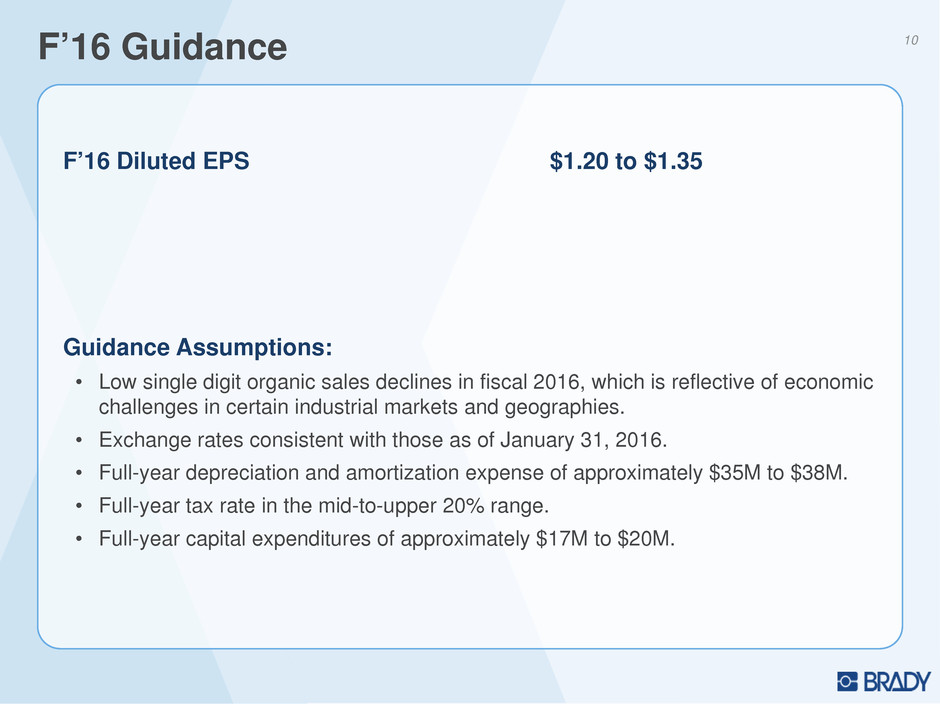
• | Earnings per diluted Class A Common Share guidance for the full year ending July 31, 2016, increased to a range of $1.20 to $1.35. |
Three months ended January 31, | Six months ended January 31, | ||||||||||||||
2016 | 2015 | 2016 | 2015 | ||||||||||||
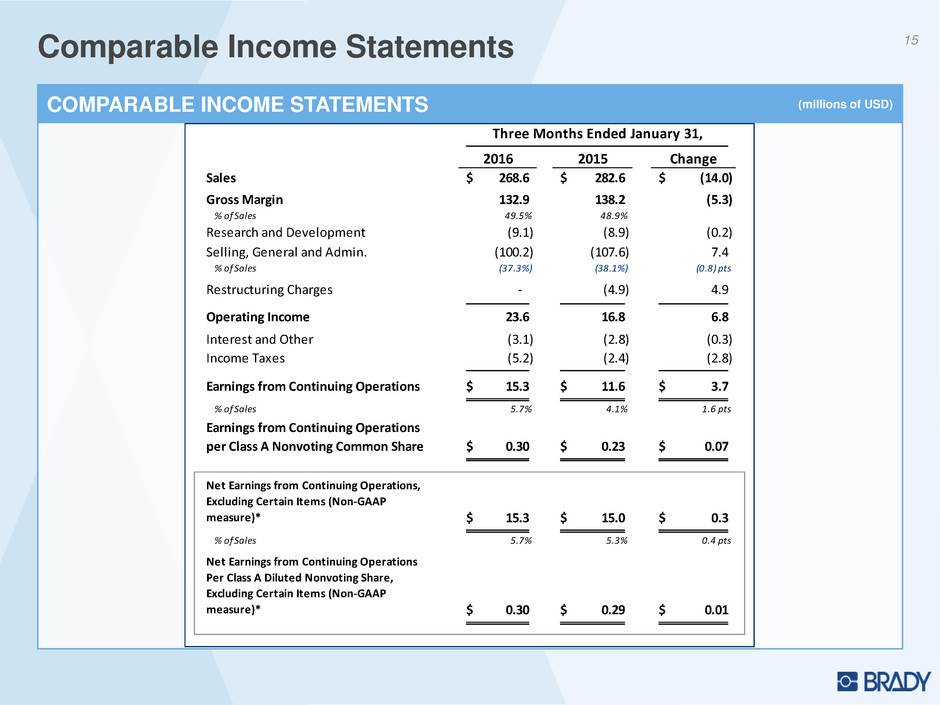
Net sales | $ | 268,630 | $ | 282,628 | $ | 551,703 | $ | 592,868 | |||||||
Cost of products sold | 135,738 | 144,425 | 279,462 | 304,503 | |||||||||||
Gross margin | 132,892 | 138,203 | 272,241 | 288,365 | |||||||||||
Operating expenses: | |||||||||||||||
Research and development | 9,097 | 8,948 | 17,666 | 18,579 | |||||||||||
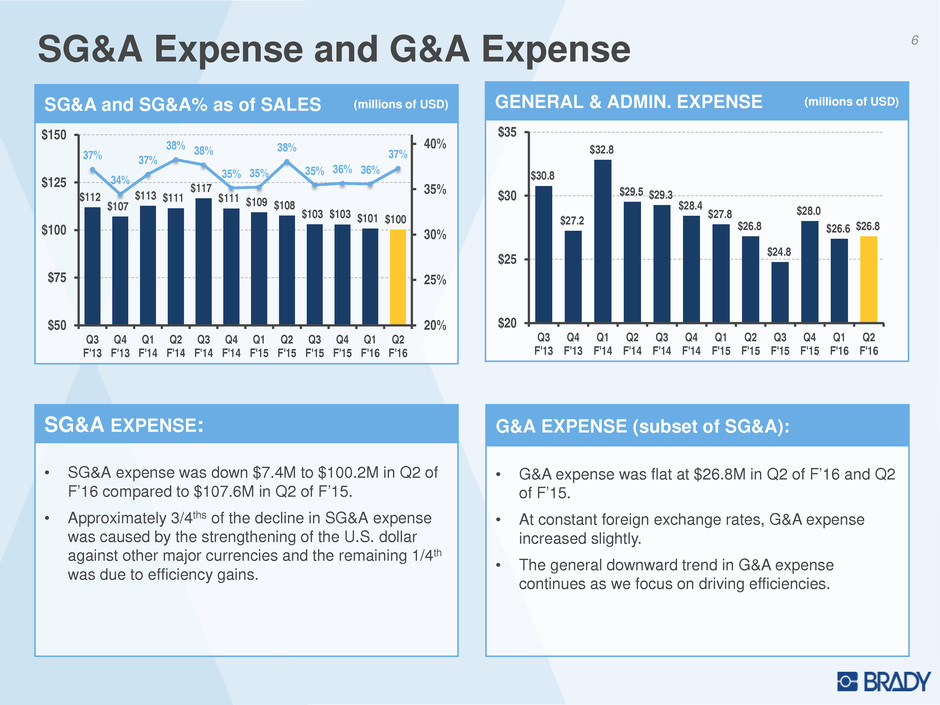
Selling, general and administrative | 100,206 | 107,565 | 200,884 | 216,846 | |||||||||||
Restructuring charges | — | 4,879 | — | 9,157 | |||||||||||
Total operating expenses | 109,303 | 121,392 | 218,550 | 244,582 | |||||||||||
Operating income | 23,589 | 16,811 | 53,691 | 43,783 | |||||||||||
Other (expense) income: | |||||||||||||||
Investment and other (expense) income | (992 | ) | 211 | (1,751 | ) | 535 | |||||||||
Interest expense | (2,130 | ) | (3,000 | ) | (4,281 | ) | (5,891 | ) | |||||||
Earnings from continuing operations before income taxes | 20,467 | 14,022 | 47,659 | 38,427 | |||||||||||
Income tax expense | 5,177 | 2,438 | 13,666 | 11,344 | |||||||||||
Earnings from continuing operations | $ | 15,290 | $ | 11,584 | $ | 33,993 | $ | 27,083 | |||||||
Loss from discontinued operations, net of income taxes | — | — | — | (1,915 | ) | ||||||||||
Net earnings | $ | 15,290 | $ | 11,584 | $ | 33,993 | $ | 25,168 | |||||||
Earnings from continuing operations per Class A Nonvoting Common Share: | |||||||||||||||
Basic | $ | 0.30 | $ | 0.23 | $ | 0.67 | $ | 0.53 | |||||||
Diluted | $ | 0.30 | $ | 0.23 | $ | 0.67 | $ | 0.53 | |||||||
Earnings from continuing operations per Class B Voting Common Share: | |||||||||||||||
Basic | $ | 0.30 | $ | 0.23 | $ | 0.65 | $ | 0.51 | |||||||
Diluted | $ | 0.30 | $ | 0.23 | $ | 0.65 | $ | 0.51 | |||||||
Loss from discontinued operations per Class A Nonvoting Common Share: | |||||||||||||||
Basic | $ | — | $ | — | $ | — | $ | (0.04 | ) | ||||||
Diluted | $ | — | $ | — | $ | — | $ | (0.04 | ) | ||||||
Loss from discontinued operations per Class B Voting Common Share: | |||||||||||||||
Basic | $ | — | $ | — | $ | — | $ | (0.03 | ) | ||||||
Diluted | $ | — | $ | — | $ | — | $ | (0.04 | ) | ||||||
Net earnings per Class A Nonvoting Common Share: | |||||||||||||||
Basic | $ | 0.30 | $ | 0.23 | $ | 0.67 | $ | 0.49 | |||||||
Diluted | $ | 0.30 | $ | 0.23 | $ | 0.67 | $ | 0.49 | |||||||
Dividends | $ | 0.20 | $ | 0.20 | $ | 0.41 | $ | 0.40 | |||||||
Net earnings per Class B Voting Common Share: | |||||||||||||||
Basic | $ | 0.30 | $ | 0.23 | $ | 0.65 | $ | 0.48 | |||||||
Diluted | $ | 0.30 | $ | 0.23 | $ | 0.65 | $ | 0.47 | |||||||
Dividends | $ | 0.20 | $ | 0.20 | $ | 0.39 | $ | 0.38 | |||||||
Weighted average common shares outstanding (in thousands): | |||||||||||||||
Basic | 50,527 | 51,272 | 50,778 | 51,262 | |||||||||||
Diluted | 50,647 | 51,348 | 50,868 | 51,330 | |||||||||||
January 31, 2016 | July 31, 2015 | ||||||
ASSETS | |||||||
Current assets: | |||||||
Cash and cash equivalents | $ | 120,198 | $ | 114,492 | |||
Accounts receivable—net | 150,615 | 157,386 | |||||
Inventories: | |||||||
Finished products | 62,127 | 66,700 | |||||
Work-in-process | 15,445 | 16,958 | |||||
Raw materials and supplies | 21,681 | 20,849 | |||||
Total inventories | 99,253 | 104,507 | |||||
Prepaid expenses and other current assets | 35,843 | 32,197 | |||||
Total current assets | 405,909 | 408,582 | |||||
Other assets: | |||||||
Goodwill | 427,460 | 433,199 | |||||
Other intangible assets | 63,630 | 68,888 | |||||
Deferred income taxes | 16,333 | 22,310 | |||||
Other | 16,497 | 18,704 | |||||
Property, plant and equipment: | |||||||
Cost: | |||||||
Land | 5,012 | 5,284 | |||||
Buildings and improvements | 92,672 | 94,423 | |||||
Machinery and equipment | 258,044 | 270,086 | |||||
Construction in progress | 2,577 | 2,164 | |||||
358,305 | 371,957 | ||||||
Less accumulated depreciation | 256,849 | 260,743 | |||||
Property, plant and equipment—net | 101,456 | 111,214 | |||||
Total | $ | 1,031,285 | $ | 1,062,897 | |||
LIABILITIES AND STOCKHOLDERS’ INVESTMENT | |||||||
Current liabilities: | |||||||
Notes payable | $ | 4,974 | $ | 10,411 | |||
Accounts payable | 66,189 | 73,020 | |||||
Wages and amounts withheld from employees | 33,767 | 30,282 | |||||
Taxes, other than income taxes | 6,682 | 7,250 | |||||
Accrued income taxes | 5,091 | 7,576 | |||||
Other current liabilities | 40,429 | 38,194 | |||||
Current maturities on long-term debt | — | 42,514 | |||||
Total current liabilities | 157,132 | 209,247 | |||||
Long-term obligations, less current maturities | 247,689 | 200,774 | |||||
Other liabilities | 63,976 | 65,188 | |||||
Total liabilities | 468,797 | 475,209 | |||||
Stockholders’ investment: | |||||||
Common Stock: | |||||||
Class A nonvoting common stock—Issued 51,261,487 and 51,261,487 shares, respectively and outstanding 46,705,559 and 47,781,184 shares, respectively | 513 | 513 | |||||
Class B voting common stock—Issued and outstanding, 3,538,628 shares | 35 | 35 | |||||
Additional paid-in capital | 314,905 | 314,403 | |||||
Earnings retained in the business | 427,637 | 414,069 | |||||
Treasury stock—4,555,928 and 3,480,303 shares, respectively of Class A nonvoting common stock, at cost | (114,547 | ) | (93,234 | ) | |||
Accumulated other comprehensive loss | (62,355 | ) | (45,034 | ) | |||
Other | (3,700 | ) | (3,064 | ) | |||
Total stockholders’ investment | 562,488 | 587,688 | |||||
Total | $ | 1,031,285 | $ | 1,062,897 | |||
Six months ended January 31, | |||||||
2016 | 2015 | ||||||
Operating activities: | |||||||
Net earnings | $ | 33,993 | $ | 25,168 | |||
Adjustments to reconcile net income to net cash provided by operating activities: | |||||||
Depreciation and amortization | 17,502 | 20,066 | |||||
Non-cash portion of stock-based compensation expense | 4,569 | 2,471 | |||||
Non-cash portion of restructuring charges | — | 896 | |||||
Loss on sale of business, net | — | 426 | |||||
Deferred income taxes | 3,338 | (781 | ) | ||||
Changes in operating assets and liabilities (net of effects of business acquisitions/divestitures): | |||||||
Accounts receivable | 3,204 | 10,918 | |||||
Inventories | 3,403 | (10,840 | ) | ||||
Prepaid expenses and other assets | (3,811 | ) | (3,053 | ) | |||
Accounts payable and accrued liabilities | (1,618 | ) | (15,423 | ) | |||
Income taxes | (2,326 | ) | (5,918 | ) | |||
Net cash provided by operating activities | 58,254 | 23,930 | |||||
Investing activities: | |||||||
Purchases of property, plant and equipment | (3,928 | ) | (17,808 | ) | |||
Sale of business, net of cash retained | — | 6,111 | |||||
Other | 2,521 | 4,173 | |||||
Net cash used in investing activities | (1,407 | ) | (7,524 | ) | |||
Financing activities: | |||||||
Payment of dividends | (20,425 | ) | (20,449 | ) | |||
Proceeds from issuance of common stock | 53 | 847 | |||||
Purchase of treasury stock | (23,397 | ) | — | ||||
Net (repayments) proceeds from borrowing on credit facilities | (437 | ) | 29,428 | ||||
Debt issuance costs | (803 | ) | — | ||||
Income tax on equity-based compensation, and other | (1,299 | ) | (3,830 | ) | |||
Net cash (used in) provided by financing activities | (46,308 | ) | 5,996 | ||||
Effect of exchange rate changes on cash | (4,833 | ) | (10,937 | ) | |||
Net increase in cash and cash equivalents | 5,706 | 11,465 | |||||
Cash and cash equivalents, beginning of period | 114,492 | 81,834 | |||||
Cash and cash equivalents, end of period | $ | 120,198 | $ | 93,299 | |||
Three months ended January 31, | Six months ended January 31, | ||||||||||||||
2016 | 2015 | 2016 | 2015 | ||||||||||||
SALES TO EXTERNAL CUSTOMERS | |||||||||||||||
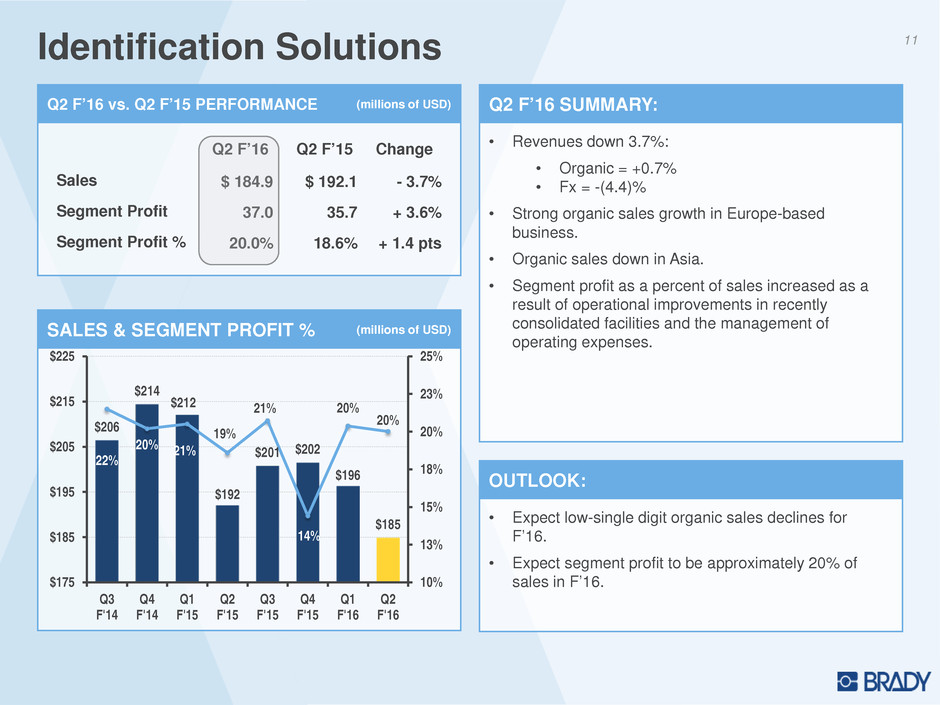
ID Solutions | $ | 184,880 | $ | 192,065 | $ | 381,207 | $ | 404,162 | |||||||
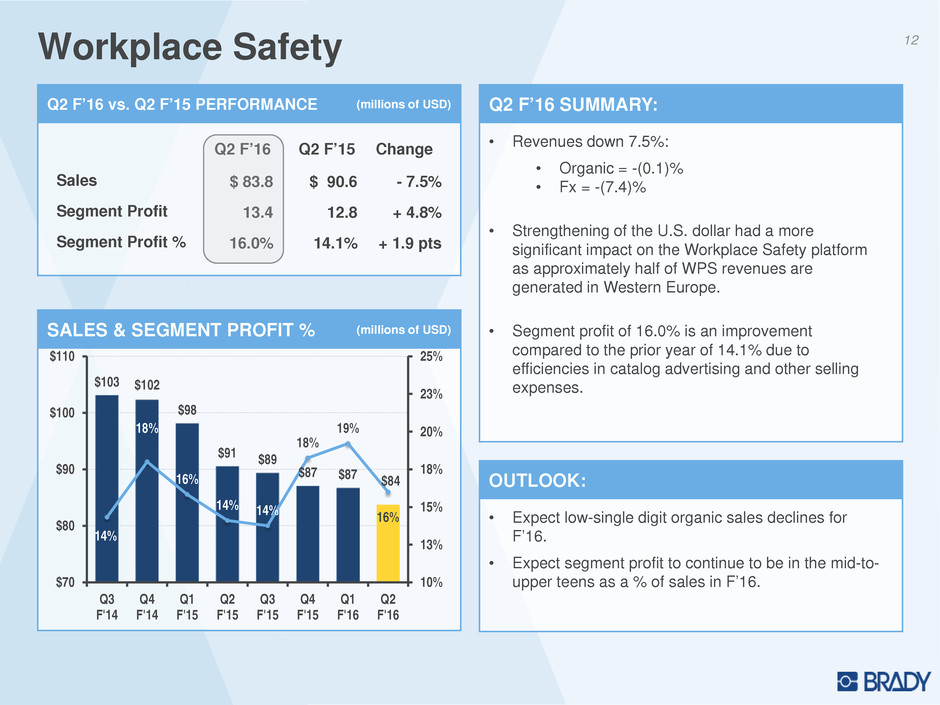
Workplace Safety | 83,750 | 90,563 | 170,496 | 188,706 | |||||||||||
Total | $ | 268,630 | $ | 282,628 | $ | 551,703 | $ | 592,868 | |||||||
SALES INFORMATION | |||||||||||||||
ID Solutions | |||||||||||||||
Organic | 0.7 | % | 1.9 | % | (0.9 | )% | 2.1 | % | |||||||
Currency | (4.4 | )% | (3.3 | )% | (4.8 | )% | (2.1 | )% | |||||||
Total | (3.7 | )% | (1.4 | )% | (5.7 | )% | — | % | |||||||
Workplace Safety | |||||||||||||||
Organic | (0.1 | )% | 0.6 | % | (0.9 | )% | 1.5 | % | |||||||
Currency | (7.4 | )% | (6.7 | )% | (8.7 | )% | (4.5 | )% | |||||||
Total | (7.5 | )% | (6.1 | )% | (9.6 | )% | (3.0 | )% | |||||||
Total Company | |||||||||||||||
Organic | 0.4 | % | 1.4 | % | (0.9 | )% | 1.9 | % | |||||||
Currency | (5.4 | )% | (4.3 | )% | (6.0 | )% | (2.9 | )% | |||||||
Total | (5.0 | )% | (2.9 | )% | (6.9 | )% | (1.0 | )% | |||||||
SEGMENT PROFIT | |||||||||||||||
ID Solutions | $ | 37,004 | $ | 35,719 | $ | 77,008 | $ | 79,186 | |||||||
Workplace Safety | 13,395 | 12,776 | 30,059 | 28,315 | |||||||||||
Total | $ | 50,399 | $ | 48,495 | $ | 107,067 | $ | 107,501 | |||||||
SEGMENT PROFIT AS A PERCENT OF SALES | |||||||||||||||
ID Solutions | 20.0 | % | 18.6 | % | 20.2 | % | 19.6 | % | |||||||
Workplace Safety | 16.0 | % | 14.1 | % | 17.6 | % | 15.0 | % | |||||||
Total | 18.8 | % | 17.2 | % | 19.4 | % | 18.1 | % | |||||||
Three months ended January 31, | Six months ended January 31, | ||||||||||||||
2016 | 2015 | 2016 | 2015 | ||||||||||||
Total segment profit | $ | 50,399 | $ | 48,495 | $ | 107,067 | $ | 107,501 | |||||||
Unallocated amounts: | |||||||||||||||
Administrative costs | (26,810 | ) | (26,805 | ) | (53,376 | ) | (54,561 | ) | |||||||
Restructuring charges | — | (4,879 | ) | — | (9,157 | ) | |||||||||
Investment and other (expense) income | (992 | ) | 211 | (1,751 | ) | 535 | |||||||||
Interest expense | (2,130 | ) | (3,000 | ) | (4,281 | ) | (5,891 | ) | |||||||
Earnings from continuing operations before income taxes | $ | 20,467 | $ | 14,022 | $ | 47,659 | $ | 38,427 | |||||||
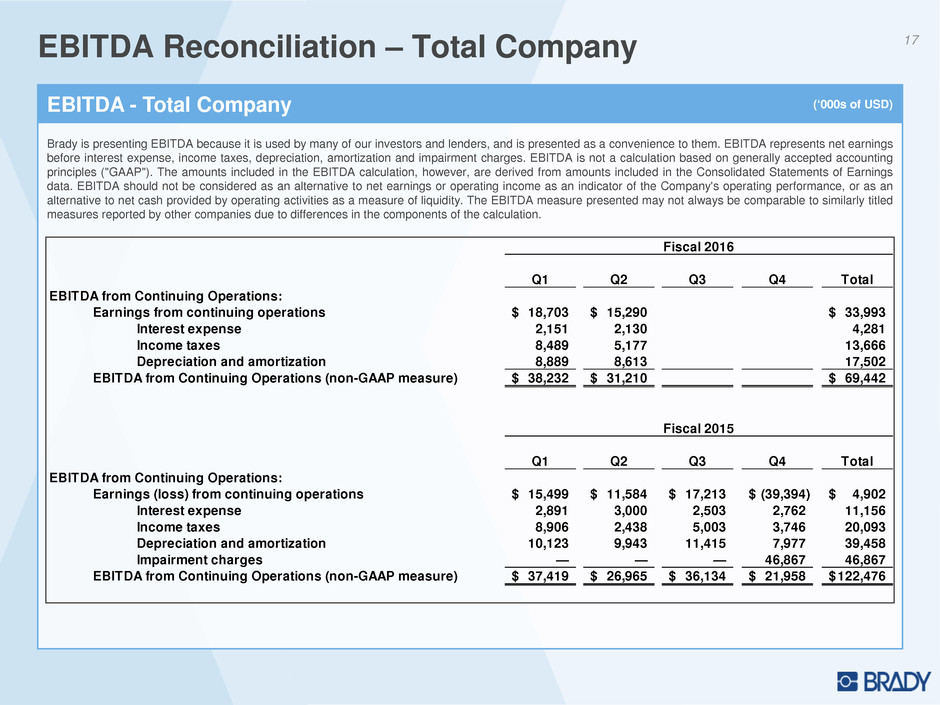
In accordance with the U.S. Securities and Exchange Commission’s Regulation G, the following provides definitions of the non-GAAP measures used in the earnings release and the reconciliation to the most closely related GAAP measure. | ||||||||||||
Earnings from Continuing Operations Before Income Taxes Excluding Certain Items: | ||||||||||||||||||
Brady is presenting the Non-GAAP measure "Earnings from Continuing Operations Before Income Taxes Excluding Certain Items." This is not a calculation based upon GAAP. The amounts included in this Non-GAAP measure are derived from amounts included in the Consolidated Financial Statements and supporting footnote disclosures. We do not view these items to be part of our sustainable results. We believe this profit measure provides an important perspective of underlying business trends and results and provides a more comparable measure from year to year. The table below provides a reconciliation of Earnings from Continuing Operations Before Income Taxes to Earnings from Continuing Operations Before Income Taxes Excluding Certain Items: | ||||||||||||||||||
Three Months Ended January 31, | Six Months Ended January 31, | |||||||||||||||||
2016 | 2015 | 2016 | 2015 | |||||||||||||||
Earnings from Continuing Operations Before Income Taxes (GAAP Measure) | $ | 20,467 | $ | 14,022 | $ | 47,659 | $ | 38,427 | ||||||||||
Restructuring charges | — | 4,879 | — | 9,157 | ||||||||||||||
Earnings from Continuing Operations Before Income Taxes Excluding Certain Items (non-GAAP measure) | $ | 20,467 | $ | 18,901 | $ | 47,659 | $ | 47,584 | ||||||||||
Income Taxes on Continuing Operations Excluding Certain Items: | |||||||||||||||||
Brady is presenting the Non-GAAP measure "Income Taxes on Continuing Operations Excluding Certain Items." This is not a calculation based upon GAAP. The amounts included in this Non-GAAP measure are derived from amounts included in the Consolidated Financial Statements and supporting footnote disclosures. We do not view these items to be part of our sustainable results. We believe this measure provides an important perspective of underlying business trends and results and provides a more comparable measure from year to year. The table below provides a reconciliation of Income Taxes on Continuing Operations to Income Taxes on Continuing Operations Excluding Certain Items: | |||||||||||||||||
Three Months Ended January 31, | Six Months Ended January 31, | ||||||||||||||||
2016 | 2015 | 2016 | 2015 | ||||||||||||||
Income Taxes on Continuing Operations (GAAP measure) | $ | 5,177 | $ | 2,438 | $ | 13,666 | $ | 11,344 | |||||||||
Restructuring charges | — | 1,434 | — | 2,770 | |||||||||||||
Income Taxes on Continuing Operations Excluding Certain Items (non-GAAP measure) | $ | 5,177 | $ | 3,872 | $ | 13,666 | $ | 14,114 | |||||||||
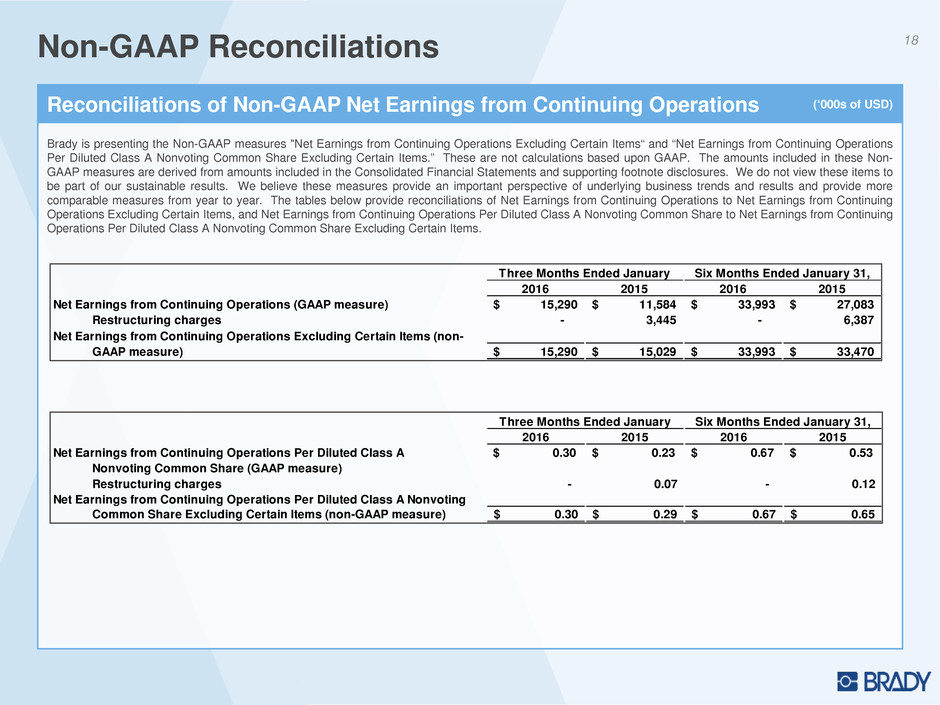
Net Earnings from Continuing Operations Excluding Certain Items: | ||||||||||||||||||
Brady is presenting the Non-GAAP measure "Net Earnings from Continuing Operations Excluding Certain Items." This is not a calculation based upon GAAP. The amounts included in this Non-GAAP measure are derived from amounts included in the Consolidated Financial Statements and supporting footnote disclosures. We do not view these items to be part of our sustainable results. We believe this measure provides an important perspective of underlying business trends and results and provides a more comparable measure from year to year. The table below provides a reconciliation of Net Earnings from Continuing Operations to Net Earnings from Continuing Operations Excluding Certain Items: | ||||||||||||||||||
Three Months Ended January 31, | Six Months Ended January 31, | |||||||||||||||||
2016 | 2015 | 2016 | 2015 | |||||||||||||||
Net Earnings from Continuing Operations (GAAP measure) | $ | 15,290 | $ | 11,584 | $ | 33,993 | $ | 27,083 | ||||||||||
Restructuring charges | — | 3,445 | — | 6,387 | ||||||||||||||
Net Earnings from Continuing Operations Excluding Certain Items (non-GAAP measure) | $ | 15,290 | $ | 15,029 | $ | 33,993 | $ | 33,470 | ||||||||||
Net Earnings from Continuing Operations Per Diluted Class A Nonvoting Common Share Excluding Certain Items: | |||||||||||||||||
Brady is presenting the Non-GAAP measure "Net Earnings from Continuing Operations Per Diluted Class A Nonvoting Common Share Excluding Certain Items." This is not a calculation based upon GAAP. The amounts included in this Non-GAAP measure are derived from amounts included in the Consolidated Financial Statements and supporting footnote disclosures. We do not view these items to be part of our sustainable results. We believe this measure provides an important perspective of underlying business trends and results and provides a more comparable measure from year to year. The table below provides a reconciliation of Net Earnings from Continuing Operations Per Diluted Class A Nonvoting Common Share to Net Earnings from Continuing Operations Per Diluted Class A Nonvoting Common Share Excluding Certain Items: | |||||||||||||||||
Three Months Ended January 31, | Six Months Ended January 31, | ||||||||||||||||
2016 | 2015 | 2016 | 2015 | ||||||||||||||
Net Earnings from Continuing Operations Per Diluted Class A Nonvoting Common Share (GAAP measure) | $ | 0.30 | $ | 0.23 | $ | 0.67 | $ | 0.53 | |||||||||
Restructuring charges | — | 0.07 | — | 0.12 | |||||||||||||
Net Earnings from Continuing Operations Per Diluted Class A Nonvoting Common Share Excluding Certain Items (non-GAAP measure) | $ | 0.30 | $ | 0.29 | $ | 0.67 | $ | 0.65 | |||||||||


>3)D?Q#A0KTF#U'
MRWLQR_ZN_P"'XDPM4FK'R7MSS]G=\2*.&7#ZY\5=?632EH875UTJ6P-=X1MZ
MOD/L:T.=\%+75Q"THRK3Y)$7:T)7-:-*/-GN+H+1=NX=Z,LVF;1$(K=:Z5E+
M",8)#1NX_P )QRXGS)7B%>M*XJRJSYR>3V"C2C0IQI0Y(OZP&8( @" (#%^)
MVA;;Q,T%>]+W6)DE%=*9],YSF!YB5](K7R>\ZR*VGO[^W]3TK0KGK[50?
M..WN["&_E7'?[J<.&X_O5<<_&%3'13T:WN_,B.DO.E[_ ,B%_D\03VI].8\*
M2M_0.4UTA_E\_%?,BM"]=C[_ )'KN.B\C/3SE $!;M1W^BTK8+C>;E,VFM]O
MIY*JHE>#6J[_-JS5%XO\&VU]=1EO=B%S!WQ8'