








Wisconsin | 39-0971239 | |
(State of Incorporation) | (IRS Employer Identification No.) | |
¨ | Written communications pursuant to Rule 425 under the Securities Act (17 CFR 230.425) |
¨ | Soliciting material pursuant to Rule 14a-12 under the Exchange Act (17 CFR 240.14a-12) |
¨ | Pre-commencement communications pursuant to Rule 14d-2(b) under the Exchange Act (17 CFR 240.14d-2(b)) |
¨ | Pre-commencement communications pursuant to Rule 13e-4(c) under the Exchange Act (17 CFR 240.13e-4(c)) |
Item 2.02 | RESULTS OF OPERATIONS AND FINANCIAL CONDITION |
Item 5.02 | DEPARTURE OF DIRECTORS OR CERTAIN OFFICERS; ELECTION OF DIRECTORS; APPOINTMENT OF CERTAN OFFICERS; COMPENSATORY ARRANGEMENTS OF CERTAIN OFFICERS |
Item 5.07 | SUBMISSIONS OF MATTERS TO A VOTE OF SECURITY HOLDERS |
Item 9.01 | FINANCIAL STATEMENTS AND EXHIBITS |
Exhibit No. | Description of Exhibit |
10.1 | Separation Agreement between the Company and Allan J. Klotsche dated as of November 20, 2013. |
99.1 | Press Release of Brady Corporation, dated November 21, 2013, relating to first quarter fiscal 2014 financial results. |
99.2 | Informational slides provided by Brady Corporation, dated November 21, 2013, relating to first quarter fiscal 2014 financial results |
BRADY CORPORATION | ||
Date: November 21, 2013 | ||
/s/ Thomas J. Felmer | ||
Thomas J. Felmer | ||
Interim President & Chief Executive Officer and Chief Financial Officer | ||
EXHIBIT NUMBER | DESCRIPTION |
10.1 | Separation Agreement between the Company and Allan J. Klotsche dated as of November 20, 2013. |
99.1 | Press Release of Brady Corporation, dated November 21, 2013, relating to first quarter fiscal 2014 financial results. |
99.2 | Informational slides provided by Brady Corporation, dated November 21, 2013, relating to first quarter fiscal 2014 financial results. |
(v) | other confidential and proprietary information or documents relating to the Company’s products, business and marketing plans and techniques, sales and distribution networks and any other information or documents which the Company protects as being confidential. |
(c) | Mr. Klotsche acknowledges and agrees that compliance with this paragraph 9 is necessary to protect the Company, and that a breach of any portion of this paragraph 9 will result in irreparable and continuing damage to the Company for which there will be no adequate remedy at law. In the event of a breach of this paragraph 9, or any part thereof, the Company, and its successors and assigns, shall be entitled to injunctive relief and to such other and further relief as is proper under the circumstances. The Company shall institute and prosecute proceedings in any Court of competent jurisdiction either in law or in equity to obtain damages for any such breach of this paragraph 9, or to enjoin Mr. Klotsche from performing services in breach of paragraph 9(b) during the term of employment and for a period of 12 months following the Separation Date. Mr. Klotsche hereby agrees to submit to the jurisdiction of any Court of competent jurisdiction in any disputes that arise under this Agreement. |
(d) | Mr. Klotsche further agrees that, in the event of a breach of this paragraph 9, the Company shall also be entitled to recover the value of any amounts previously paid or payable under this Agreement. |
(e) | MR. KLOTSCHE HAS READ THIS PARAGRAPH 9 AND AGREES THAT THE CONSIDERATION PROVIDED BY THE COMPANY IS FAIR AND REASONABLE AND FURTHER AGREES THAT GIVEN THE IMPORTANCE TO THE COMPANY OF ITS |
(Unaudited) | |||||||
Three months ended October 31, | |||||||
2013 | 2012 | ||||||
Net sales | $ | 305,974 | $ | 270,866 | |||
Cost of products sold | 149,029 | 121,342 | |||||
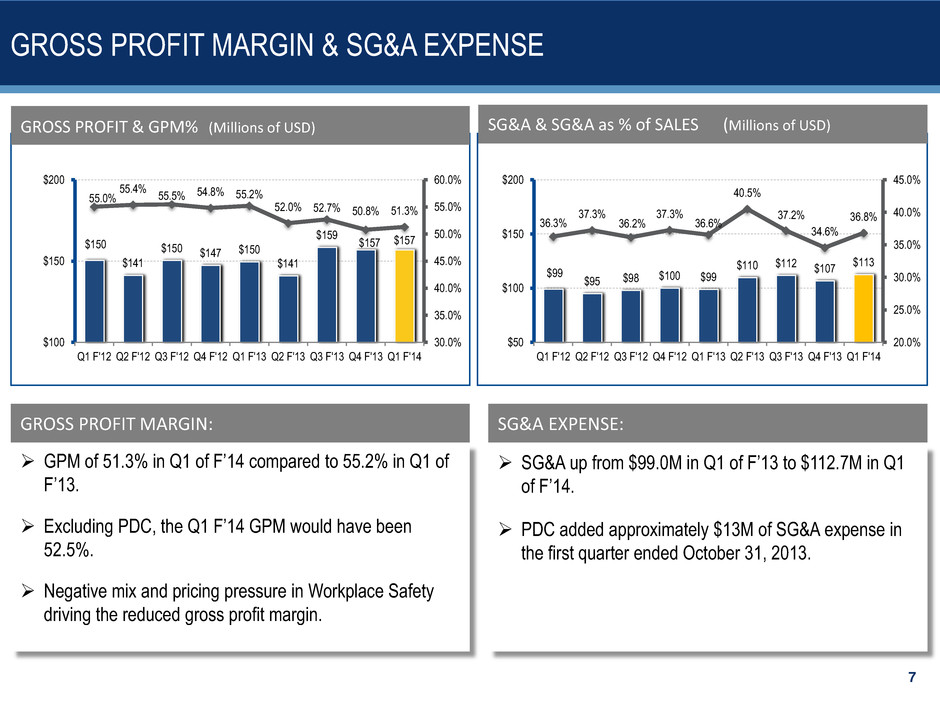
Gross margin | 156,945 | 149,524 | |||||
Operating expenses: | |||||||
Research and development | 8,587 | 7,887 | |||||
Selling, general and administrative | 112,687 | 99,009 | |||||
Restructuring charges | 6,840 | — | |||||
Total operating expenses | 128,114 | 106,896 | |||||
Operating income | 28,831 | 42,628 | |||||
Other income and (expense): | |||||||
Investment and other income | 762 | 397 | |||||
Interest expense | (3,721 | ) | (4,163 | ) | |||
Earnings from continuing operations before income taxes | 25,872 | 38,862 | |||||
Income tax expense | 8,449 | 13,077 | |||||
Earnings from continuing operations | $ | 17,423 | $ | 25,785 | |||
Earnings from discontinued operations, net of income taxes | 6,505 | 1,403 | |||||
Net earnings | $ | 23,928 | $ | 27,188 | |||
Earnings from continuing operations per Class A Nonvoting Commons Share: | |||||||
Basic | $ | 0.33 | $ | 0.50 | |||
Diluted | $ | 0.33 | $ | 0.50 | |||
Earnings from continuing operations per Class B Voting Common Share: | |||||||
Basic | $ | 0.32 | $ | 0.49 | |||
Diluted | $ | 0.32 | $ | 0.49 | |||
Earnings from discontinued operations per Class A Nonvoting Common Share: | |||||||
Basic | $ | 0.13 | $ | 0.03 | |||
Diluted | $ | 0.13 | $ | 0.03 | |||
Earnings from discontinued operations per Class B Voting Common Share: | |||||||
Basic | $ | 0.12 | $ | 0.03 | |||
Diluted | $ | 0.12 | $ | 0.02 | |||
Net Earnings per Class A Nonvoting Common Share: | |||||||
Basic | $ | 0.46 | $ | 0.53 | |||
Diluted | $ | 0.46 | $ | 0.53 | |||
Dividends | $ | 0.195 | $ | 0.19 | |||
Net Earnings per Class B Voting Common Share: | |||||||
Basic | $ | 0.44 | $ | 0.52 | |||
Diluted | $ | 0.44 | $ | 0.51 | |||
Dividends | $ | 0.178 | $ | 0.173 | |||
Weighted average common shares outstanding (in thousands): | |||||||
Basic | 52,071 | 51,039 | |||||
Diluted | 52,419 | 51,312 | |||||
(Unaudited) | |||||||
October 31, 2013 | July 31, 2013 | ||||||
ASSETS | |||||||
Current assets: | |||||||
Cash and cash equivalents | $ | 81,869 | $ | 91,058 | |||
Accounts receivable—net | 184,099 | 169,261 | |||||
Inventories: | |||||||
Finished products | 69,085 | 64,544 | |||||
Work-in-process | 17,757 | 14,776 | |||||
Raw materials and supplies | 18,102 | 15,387 | |||||
Total inventories | 104,944 | 94,707 | |||||
Assets held for sale | 132,616 | 119,864 | |||||
Prepaid expenses and other current assets | 46,671 | 37,600 | |||||
Total current assets | 550,199 | 512,490 | |||||
Other assets: | |||||||
Goodwill | 624,165 | 617,236 | |||||
Other intangible assets | 152,812 | 156,851 | |||||
Deferred income taxes | 10,469 | 8,623 | |||||
Other | 21,821 | 21,325 | |||||
Property, plant and equipment: | |||||||
Cost: | |||||||
Land | 7,978 | 7,861 | |||||
Buildings and improvements | 94,545 | 91,471 | |||||
Machinery and equipment | 270,371 | 266,787 | |||||
Construction in progress | 15,112 | 11,842 | |||||
388,006 | 377,961 | ||||||
Less accumulated depreciation | 263,112 | 255,803 | |||||
Property, plant and equipment—net | 124,894 | 122,158 | |||||
Total | $ | 1,484,360 | $ | 1,438,683 | |||
LIABILITIES AND STOCKHOLDERS’ INVESTMENT | |||||||
Current liabilities: | |||||||
Notes payable | $ | 26,442 | $ | 50,613 | |||
Accounts payable | 92,044 | 82,519 | |||||
Wages and amounts withheld from employees | 47,968 | 42,413 | |||||
Liabilities held for sale | 43,976 | 34,583 | |||||
Taxes, other than income taxes | 8,968 | 8,243 | |||||
Accrued income taxes | 8,996 | 7,056 | |||||
Other current liabilities | 39,531 | 36,806 | |||||
Current maturities on long-term debt | 61,264 | 61,264 | |||||
Total current liabilities | 329,189 | 323,497 | |||||
Long-term obligations, less current maturities | 204,413 | 201,150 | |||||
Other liabilities | 84,784 | 83,239 | |||||
Total liabilities | 618,386 | 607,886 | |||||
Stockholders’ investment: | |||||||
Common stock: | |||||||
Class A nonvoting common stock—Issued 51,261,487 and 51,261,487 shares, respectively and outstanding 48,594,617 and 48,408,544 shares, respectively | 513 | 513 | |||||
Class B voting common stock—Issued and outstanding, 3,538,628 shares | 35 | 35 | |||||
Additional paid-in capital | 308,835 | 306,191 | |||||
Earnings retained in the business | 552,291 | 538,512 | |||||
Treasury stock—2,435,203 and 2,626,276 shares, respectively of Class A nonvoting | (65,255 | ) | (69,797 | ) | |||
Accumulated other comprehensive income | 70,132 | 56,063 | |||||
Other | (577 | ) | (720 | ) | |||
Total stockholders’ investment | 865,974 | 830,797 | |||||
Total | $ | 1,484,360 | $ | 1,438,683 | |||
(Unaudited) | |||||||
Three months ended October 31, | |||||||
2013 | 2012 | ||||||
Operating activities: | |||||||
Net earnings | $ | 23,928 | $ | 27,188 | |||
Adjustments to reconcile net income to net cash provided by operating activities: | |||||||
Depreciation and amortization | 10,878 | 10,675 | |||||
Non-cash portion of stock-based compensation expense | 2,600 | 4,399 | |||||
Loss (gain) on sales of businesses | — | 3,138 | |||||
Deferred income taxes | (2,421 | ) | (109 | ) | |||
Changes in operating assets and liabilities (net of effects of business acquisitions/divestitures): | |||||||
Accounts receivable | (18,551 | ) | (18,426 | ) | |||
Inventories | (12,461 | ) | (8,141 | ) | |||
Prepaid expenses and other assets | (5,372 | ) | (2,710 | ) | |||
Accounts payable and accrued liabilities | 25,903 | 6,752 | |||||
Income taxes | 1,089 | (2,548 | ) | ||||
Net cash provided by operating activities | 25,593 | 20,218 | |||||
Investing Activities: | |||||||
Purchases of property, plant and equipment | (9,086 | ) | (6,177 | ) | |||
Sales of businesses, net of cash retained | — | 10,178 | |||||
Other | (70 | ) | (70 | ) | |||
Net cash (used in) provided by investing activities | (9,156 | ) | 3,931 | ||||
Financing Activities: | |||||||
Payment of dividends | (10,149 | ) | (9,705 | ) | |||
Proceeds from issuance of common stock | 5,209 | 1,684 | |||||
Purchase of treasury stock | — | (5,121 | ) | ||||
Repayment of borrowing on notes payable | (24,000 | ) | — | ||||
Income tax on the exercise of stock options and deferred comp distributions, and other | (719 | ) | 401 | ||||
Net cash used in financing activities | (29,659 | ) | (12,741 | ) | |||
Effect of exchange rate changes on cash | 4,033 | 4,001 | |||||
Net (decrease) increase in cash and cash equivalents | (9,189 | ) | 15,409 | ||||
Cash and cash equivalents, beginning of period | 91,058 | 305,900 | |||||
Cash and cash equivalents, end of period | $ | 81,869 | $ | 321,309 | |||
Supplemental disclosures: | |||||||
Cash paid during the period for: | |||||||
Interest, net of capitalized interest | $ | 4,151 | $ | 4,953 | |||
Income taxes, net of refunds | 10,006 | 12,199 | |||||
Three months ended October 31, | |||||||
2013 | 2012 | ||||||
SALES TO EXTERNAL CUSTOMERS | |||||||
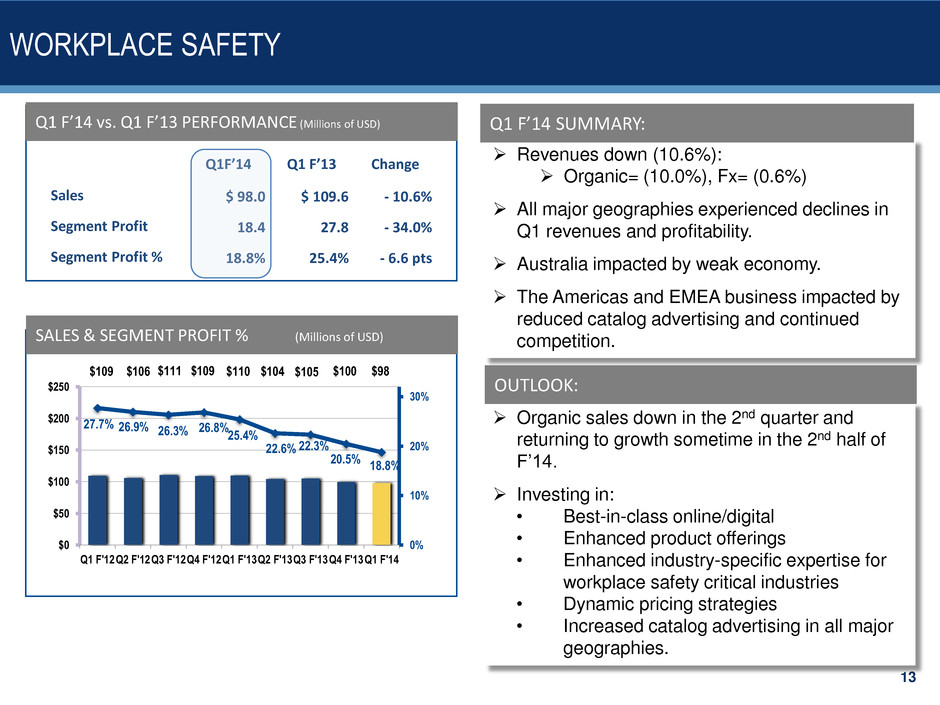
ID Solutions | $ | 207,990 | $ | 161,244 | |||
Workplace Safety | 97,984 | 109,622 | |||||
Total Company | $ | 305,974 | $ | 270,866 | |||
SALES INFORMATION | |||||||
ID Solutions | |||||||
Organic | 3.0 | % | 0.4 | % | |||
Currency | (0.2 | )% | (2.5 | )% | |||
Acquisitions | 26.2 | % | 0.4 | % | |||
Total | 29.0 | % | (1.7 | )% | |||
Workplace Safety | |||||||
Organic | (10.0 | )% | (3.3 | )% | |||
Currency | (0.6 | )% | (2.3 | )% | |||
Acquisitions | —% | 5.8 | % | ||||
Total | (10.6 | )% | 0.2 | % | |||
Total Company | |||||||
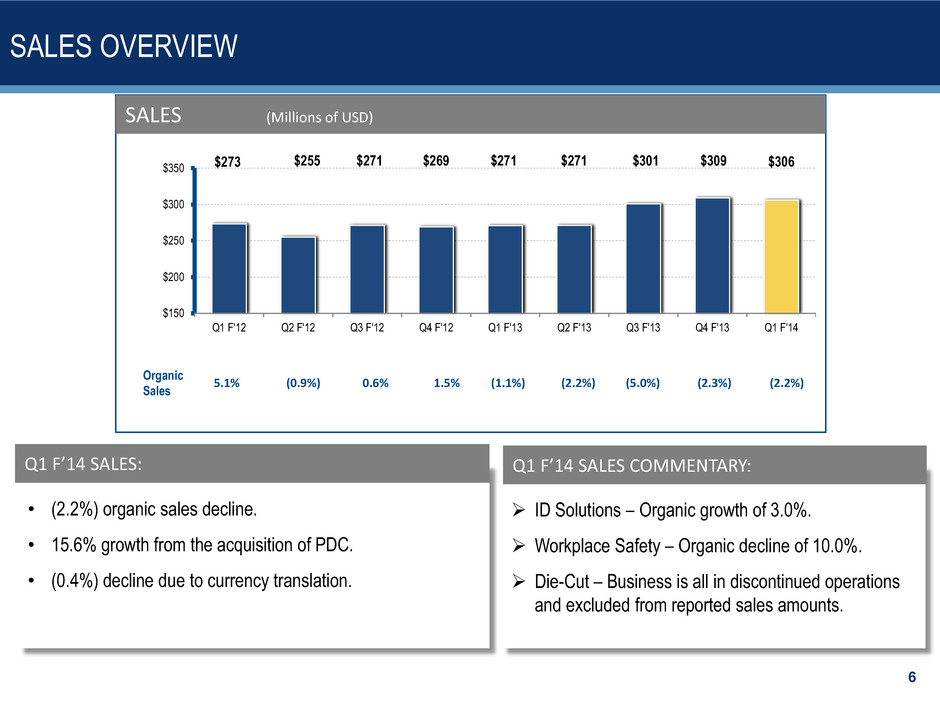
Organic | (2.2 | )% | (1.1 | )% | |||
Currency | (0.4 | )% | (2.4 | )% | |||
Acquisitions | 15.6 | % | 2.6 | % | |||
Total | 13.0 | % | (0.9 | )% | |||
SEGMENT PROFIT | |||||||
ID Solutions | $ | 50,110 | $ | 43,973 | |||
Workplace Safety | 18,374 | 27,829 | |||||
Total Company | $ | 68,484 | $ | 71,802 | |||
SEGMENT PROFIT AS PERCENT OF SALES | |||||||
ID Solutions | 24.1 | % | 27.3 | % | |||
Workplace Safety | 18.8 | % | 25.4 | % | |||
Total Company | 22.4 | % | 26.5 | % | |||
(Dollars in Thousands) | Three months ended October 31, | ||||||
2013 | 2012 | ||||||
Total segment profit | $ | 68,484 | $ | 71,802 | |||
Unallocated Amounts: | |||||||
Administrative costs | (32,813 | ) | (29,174 | ) | |||
Restructuring charges | (6,840 | ) | — | ||||
Investment and other income | 762 | 397 | |||||
Interest expense | (3,721 | ) | (4,163 | ) | |||
Earnings from continuing operations before income taxes | $ | 25,872 | $ | 38,862 | |||
In accordance with the U.S. Securities and Exchange Commission’s Regulation G, the following provides definitions of the non-GAAP measures used in the earnings release and the reconciliation to the most closely related GAAP measure. | |||||||||||||||||||||||
EBITDA from Continuing Operations | |||||||||||||||||||||||
Brady is presenting EBITDA from Continuing Operations because it is used by many of our investors and lenders, and is presented as a convenience to them. EBITDA from Continuing Operations represents earnings (loss) from continuing operations before interest expense, income taxes, depreciation, amortization and impairment charges. EBITDA from Continuing Operations is not a calculation based on generally accepted accounting principles ("GAAP"). The amounts included in the EBITDA from Continuing Operations calculation, however, are derived from amounts included in the Consolidated Financial Statements and supporting footnote disclosures. EBITDA from Continuing Operations should not be considered as an alternative to net earnings or operating income as an indicator of the Company's operating performance, or as an alternative to net cash provided by operating activities as a measure of liquidity. The EBITDA from Continuing Operations measure presented may not always be comparable to similarly titled measures reported by other companies due to differences in the components of the calculation. | |||||||||||||||||||||||
Fiscal 2014 | |||||||||||||||||||||||
Q1 | Q2 | Q3 | Q4 | Total | |||||||||||||||||||
EBITDA from Continuing Operations: | |||||||||||||||||||||||
Earnings from continuing operations | $ | 17,423 | $ | 17,423 | |||||||||||||||||||
Interest expense | 3,721 | 3,721 | |||||||||||||||||||||
Income taxes | 8,449 | 8,449 | |||||||||||||||||||||
Depreciation and amortization | 10,878 | 10,878 | |||||||||||||||||||||
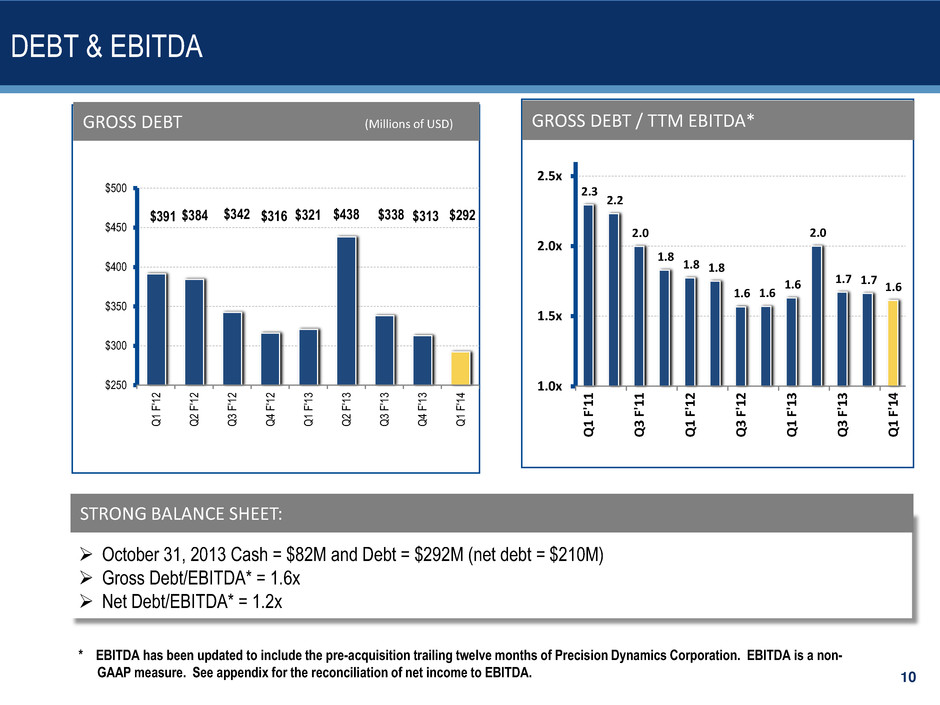
EBITDA from Continuing Operations (non-GAAP measure) | $ | 40,471 | $ | 40,471 | |||||||||||||||||||
Fiscal 2013 | |||||||||||||||||||||||
Q1 | Q2 | Q3 | Q4 | Total | |||||||||||||||||||
EBITDA from Continuing Operations: | |||||||||||||||||||||||
Earnings (loss) from continuing operations | $ | 25,785 | $ | (11,365 | ) | $ | 20,998 | $ | (176,234 | ) | $ | (140,816 | ) | ||||||||||
Interest expense | 4,163 | 4,406 | 4,186 | 3,886 | 16,641 | ||||||||||||||||||
Income taxes | 13,077 | 28,823 | 6,065 | (5,895 | ) | 42,070 | |||||||||||||||||
Depreciation and amortization | 7,684 | 8,490 | 11,065 | 12,688 | 39,927 | ||||||||||||||||||
Intangible asset write-down in restructuring charges | — | — | 3,207 | — | 3,207 | ||||||||||||||||||
Impairment charges | — | — | — | 204,448 | 204,448 | ||||||||||||||||||
EBITDA from Continuing Operations (non-GAAP measure) | $ | 50,709 | $ | 30,354 | $ | 45,521 | $ | 38,893 | $ | 165,477 | |||||||||||||
EBITDA from Discontinued Operations | |||||||||||||||||||||||
Brady is presenting EBITDA from Discontinued Operations because it is used by many of our investors and lenders, and is presented as a convenience to them. EBITDA from Discontinued Operations represents earnings (loss) from discontinued operations before interest expense, income taxes, depreciation, amortization, and impairment charges. EBITDA from Discontinued Operations is not a calculation based on generally accepted accounting principles ("GAAP"). The amounts included in the EBITDA from Discontinued Operations calculation, however, are derived from amounts included in the Consolidated Financial Statements and supporting footnote disclosures. EBITDA from Discontinued Operations should not be considered as an alternative to net earnings or operating income as an indicator of the Company's operating performance, or as an alternative to net cash provided by operating activities as a measure of liquidity. The EBITDA from Discontinued Operations measure presented may not always be comparable to similarly titled measures reported by other companies due to differences in the components of the calculation. | |||||||||||||||||||||||
Fiscal 2014 | |||||||||||||||||||||||
Q1 | Q2 | Q3 | Q4 | Total | |||||||||||||||||||
EBITDA from Discontinued Operations: | |||||||||||||||||||||||
Earnings from discontinued operations | $ | 6,505 | $ | 6,505 | |||||||||||||||||||
Interest expense | — | — | |||||||||||||||||||||
Income taxes | 2,680 | 2,680 | |||||||||||||||||||||
Depreciation and amortization | — | — | |||||||||||||||||||||
EBITDA from Discontinued Operations (non-GAAP measure) | $ | 9,185 | $ | 9,185 | |||||||||||||||||||
Fiscal 2013 | |||||||||||||||||||||||
Q1 | Q2 | Q3 | Q4 | Total | |||||||||||||||||||
EBITDA from Discontinued Operations: | |||||||||||||||||||||||
Earnings (loss) from discontinued operations | $ | 1,403 | $ | 2,680 | $ | (16,765 | ) | $ | (1,037 | ) | $ | (13,719 | ) | ||||||||||
Interest expense | — | — | — | — | — | ||||||||||||||||||
Income taxes | 404 | 1,802 | 1,530 | 1,478 | 5,214 | ||||||||||||||||||
Depreciation and amortization | 2,991 | 2,881 | 2,926 | — | 8,798 | ||||||||||||||||||
Loss on write-down of assets held for sale | — | — | 15,658 | — | 15,658 | ||||||||||||||||||
EBITDA from Discontinued Operations (non-GAAP measure) | $ | 4,798 | $ | 7,363 | $ | 3,349 | $ | 441 | $ | 15,951 | |||||||||||||
EBITDA: | |||||||||||||||||||||||
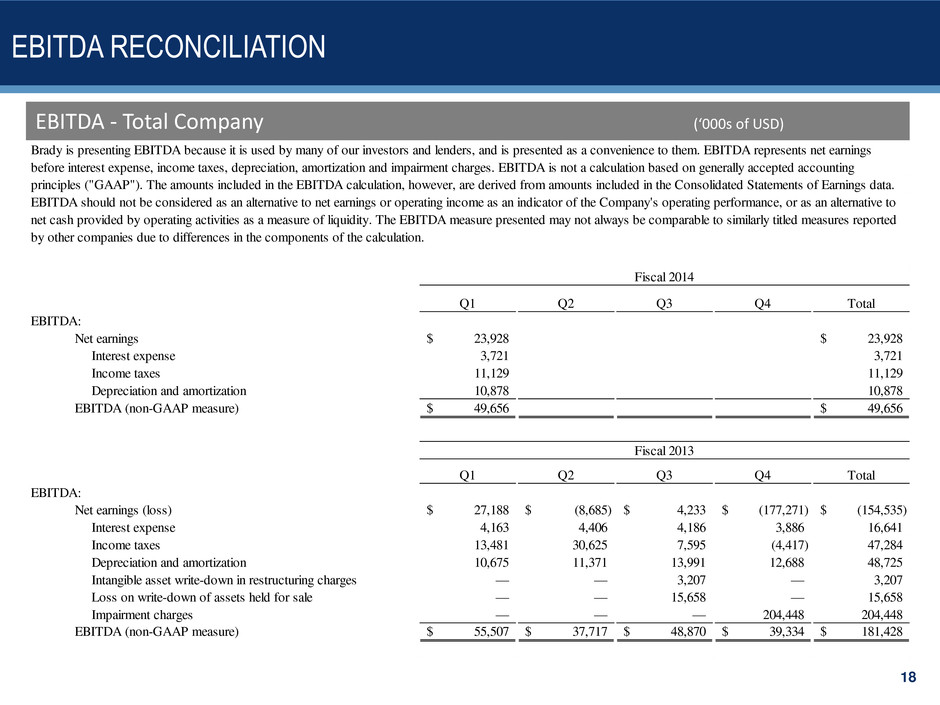
Brady is presenting EBITDA because it is used by many of our investors and lenders, and is presented as a convenience to them. EBITDA represents net earnings (loss) before interest expense, income taxes, depreciation, amortization and impairment charges. EBITDA is not a calculation based on generally accepted accounting principles ("GAAP"). The amounts included in the EBITDA calculation, however, are derived from amounts included in the Consolidated Financial Statements and supporting footnote disclosures. EBITDA should not be considered as an alternative to net earnings or operating income as an indicator of the Company's operating performance, or as an alternative to net cash provided by operating activities as a measure of liquidity. The EBITDA measure presented may not always be comparable to similarly titled measures reported by other companies due to differences in the components of the calculation. | |||||||||||||||||||||||
Fiscal 2014 | |||||||||||||||||||||||
Q1 | Q2 | Q3 | Q4 | Total | |||||||||||||||||||
EBITDA: | |||||||||||||||||||||||
Net earnings | $ | 23,928 | $ | 23,928 | |||||||||||||||||||
Interest expense | 3,721 | 3,721 | |||||||||||||||||||||
Income taxes | 11,129 | 11,129 | |||||||||||||||||||||
Depreciation and amortization | 10,878 | 10,878 | |||||||||||||||||||||
EBITDA (non-GAAP measure) | $ | 49,656 | $ | 49,656 | |||||||||||||||||||
Fiscal 2013 | |||||||||||||||||||||||
Q1 | Q2 | Q3 | Q4 | Total | |||||||||||||||||||
EBITDA: | |||||||||||||||||||||||
Net earnings (loss) | $ | 27,188 | $ | (8,685 | ) | $ | 4,233 | $ | (177,271 | ) | $ | (154,535 | ) | ||||||||||
Interest expense | 4,163 | 4,406 | 4,186 | 3,886 | 16,641 | ||||||||||||||||||
Income taxes | 13,481 | 30,625 | 7,595 | (4,417 | ) | 47,284 | |||||||||||||||||
Depreciation and amortization | 10,675 | 11,371 | 13,991 | 12,688 | 48,725 | ||||||||||||||||||
Intangible asset write-down in restructuring charges | — | — | 3,207 | — | 3,207 | ||||||||||||||||||
Loss on write-down of assets held for sale | — | — | 15,658 | — | 15,658 | ||||||||||||||||||
Impairment charges | — | — | — | 204,448 | 204,448 | ||||||||||||||||||
EBITDA (non-GAAP measure) | $ | 55,507 | $ | 37,717 | $ | 48,870 | $ | 39,334 | $ | 181,428 | |||||||||||||
Earnings from Continuing Operations Before Income Taxes Excluding Certain Items: | |||||||||||||||||
Brady is presenting the Non-GAAP measure "Earnings from Continuing Operations Before Income Taxes Excluding Certain Items." This is not a calculation based upon GAAP. The amounts included in this Non-GAAP measure are derived from amounts included in the Consolidated Financial Statements and supporting footnote disclosures. We do not view these items to be part of our sustainable results. We believe this profit measure provides an important perspective of underlying business trends and results and provides a more comparable measure from year to year. The table below provides a reconciliation of Earnings from Continuing Operations Before Income Taxes to Earnings from Continuing Operations Before Income Taxes Excluding Certain Items: | |||||||||||||||||
Three Months Ended October 31, | |||||||||||||||||
2013 | 2012 | ||||||||||||||||
Earnings from Continuing Operations Before Income Taxes (GAAP measure) | $ | 25,872 | $ | 38,862 | |||||||||||||
Restructuring charges | 6,840 | — | |||||||||||||||
Earnings from Continuing Operations Before Income Taxes Excluding Certain Items (non-GAAP measure) | $ | 32,712 | $ | 38,862 | |||||||||||||
Income Taxes on Continuing Operations Excluding Certain Items: | |||||||||||||||||
Brady is presenting the Non-GAAP measure "Income Taxes on Continuing Operations Excluding Certain Items." This is not a calculation based upon GAAP. The amounts included in this Non-GAAP measure are derived from amounts included in the Consolidated Financial Statements and supporting footnote disclosures. We do not view these items to be part of our sustainable results. We believe this measure provides an important perspective of underlying business trends and results and provides a more comparable measure from year to year. The table below provides a reconciliation of Income Taxes on Continuing Operations to Income Taxes on Continuing Operations Excluding Certain Items: | |||||||||||||||||
Three Months Ended October 31, | |||||||||||||||||
2013 | 2012 | ||||||||||||||||
Income Taxes on Continuing Operations (GAAP measure) | $ | 8,449 | $ | 13,077 | |||||||||||||
Restructuring charges | 2,205 | — | |||||||||||||||
Income Taxes on Continuing Operations Excluding Certain Items (non-GAAP measure) | $ | 10,654 | $ | 13,077 | |||||||||||||
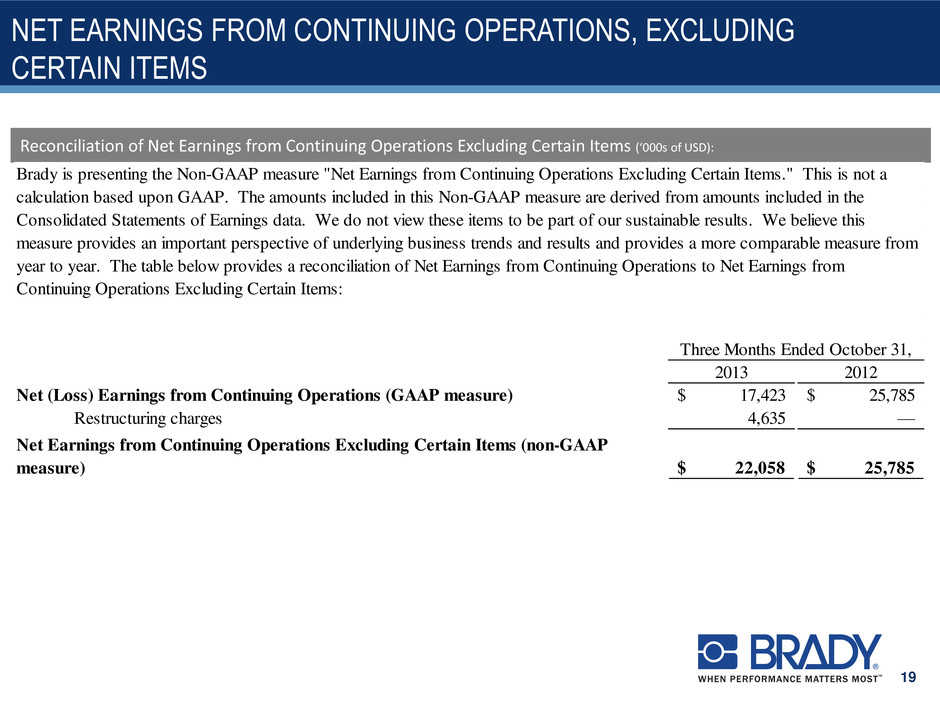
Net Earnings from Continuing Operations Excluding Certain Items: | |||||||||||||||||
Brady is presenting the Non-GAAP measure "Net Earnings from Continuing Operations Excluding Certain Items." This is not a calculation based upon GAAP. The amounts included in this Non-GAAP measure are derived from amounts included in the Consolidated Financial Statements and supporting footnote disclosures. We do not view these items to be part of our sustainable results. We believe this measure provides an important perspective of underlying business trends and results and provides a more comparable measure from year to year. The table below provides a reconciliation of Net Earnings from Continuing Operations to Net Earnings from Continuing Operations Excluding Certain Items: | |||||||||||||||||
Three Months Ended October 31, | |||||||||||||||||
2013 | 2012 | ||||||||||||||||
Net Earnings from Continuing Operations (GAAP measure) | $ | 17,423 | $ | 25,785 | |||||||||||||
Restructuring charges | 4,635 | — | |||||||||||||||
Net Earnings from Continuing Operations Excluding Certain Items (non-GAAP measure) | $ | 22,058 | $ | 25,785 | |||||||||||||
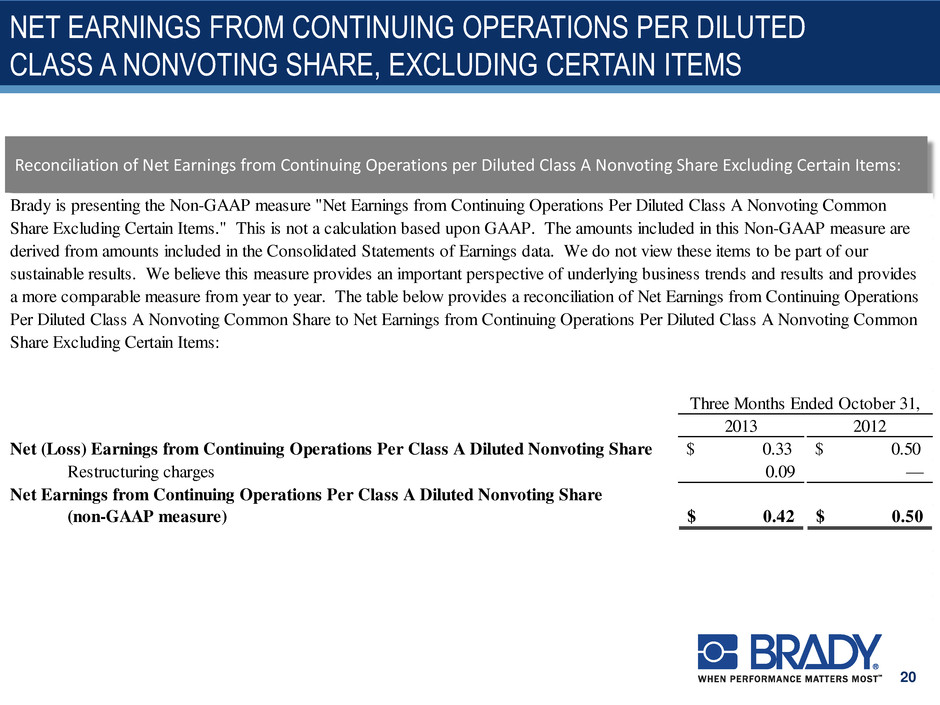
Net Earnings from Continuing Operations Per Diluted Class A Nonvoting Common Share Excluding Certain Items: | |||||||||||||||||
Brady is presenting the Non-GAAP measure "Net Earnings from Continuing Operations Per Diluted Class A Nonvoting Common Share Excluding Certain Items." This is not a calculation based upon GAAP. The amounts included in this Non-GAAP measure are derived from amounts included in the Consolidated Financial Statements and supporting footnote disclosures. We do not view these items to be part of our sustainable results. We believe this measure provides an important perspective of underlying business trends and results and provides a more comparable measure from year to year. The table below provides a reconciliation of Net Earnings from Continuing Operations Per Diluted Class A Nonvoting Common Share to Net Earnings from Continuing Operations Per Diluted Class A Nonvoting Common Share Excluding Certain Items: | |||||||||||||||||
Three Months Ended October 31, | |||||||||||||||||
2013 | 2012 | ||||||||||||||||
Net Earnings from Continuing Operations Per Diluted Class A Nonvoting Share (GAAP measure) | $ | 0.33 | $ | 0.50 | |||||||||||||
Restructuring charges | 0.09 | — | |||||||||||||||
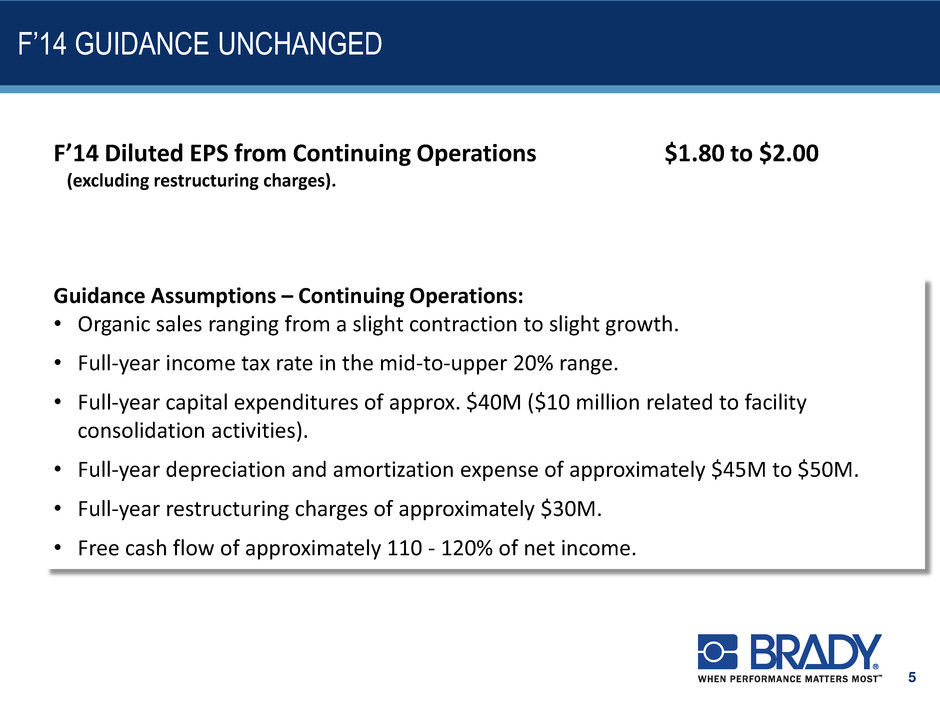
Net Earnings from Continuing Operations Per Diluted Class A Nonvoting Share Excluding Certain Items (non-GAAP measure) | $ | 0.42 | $ | 0.50 | |||||||||||||


EUF-LC(3>T7%K63X+ =46I`? U&I'J+#G!T]ZGF)2J'1,J9*LT3$TW-(+KA0VM:B00
M&&@-6NZB+JL-@/&.GH?\.;?2:E:XUAQJ4H\,]7O;[BVI=;6$MS-;XJIV8N>G
M2<:IE"GY>I8NPM3V9=50G'4MH2]+(3USNH"P5URU6L.(B8VE72N3>A2KW$-B
MC4FD6LY5SQ?#V(*FX#V
M5/$#U#:-;.9;C;BL1W&?9(H/T%RETD@&]QZS%DN(X%?G`C1@EVPN/.F=SQXF
M.GI?K*[F:5[Z%_`U1*_`I]4>DT^BB(3XFR>CK]7K+W\.2W].-:]]6J=S,UKZ
M>'>>L+BMA'GA,2CF39A?B0/EBQER.2ND)/=?CUML<6I8?*HQ$]5?GQ1(]/6(
M,UTDDGB!'#.PMY+T*NH$WWN.5H!K!)
-CS[Q&*1F7`YGZ0N!`K#K5:ED7XHZ=CNC4JO/3M
M+??)?ZI:>MEP.J(:4BQ!)!^QL;<^&T;4[:LZ>S)<##&I':SE%K%2]R:_,SLH
MVVZEQYQS1--A22%Z@==^-K[=T=.G"3IJ+-66-K.4=9Y:5J69RPIC;@<<4)9*
M`EI.HW"C'GE^MFXD2BV\ZFGV'/GE`YYJ;RQPFA(6%M5H@A0(XR[GQQOZ+Z>7
M=XFGJ2_E+O.+F?@T^J/1X\"&RXF8Y2HZW,:AHXDNJ'_9JCG:EZG4[O%&[8/%
MS!_O@>M56S(H'1]RFPO-8A\X3*%MB3`E6NL7UBD%9.FXV%C>/-&R9M9WE'0>
MESE1B`I2WBQB26K@FH,N,?*I-OEBB93!L:C8UP_B5M*Z37*;4DJX>:3;;A^(
M&\7#!>%**$DD$`^$497!C.,Z0[6J.ZW+*")I'OC*CPU#D?`\(T;FESD&C-2F
MH2RSE7%.`\+8BF9V5QE*3-.?;?$RW-2YT.L/IMI>0KD=DZK[*M?:(?5A5HO,
M=S1VZ<]K>C(\#XD;D<5R]5ILZQ4*U2TG6&%H4:A)J]-)`)[0()2"=CMP,2^Q
MKNM22?2.76H.$FY<']39=1RHI^+