|
Investor Contacts: Rusty Cloutier
President & CEO or
Jim McLemore, CFA
Sr. EVP & CFO
337.237.8343
|
|
MidSouth Bancorp, Inc. Reports First Quarter 2015 Results and Declares Quarterly Dividends
Quarterly Highlights
|
·
|
Diluted operating EPS $0.12 versus $0.31 for 4Q2014
|
|
·
|
Increased loan loss reserve to total loans to 1.23% with $6.0 million provision primarily for downgrades of five energy related credit relationships
|
|
·
|
Operating noninterest expenses $16.3 million versus $17.5 million for 1Q2014
|
|
·
|
Sequential period end loan growth of $26.5 million or 8.3% annualized
|
LAFAYETTE, LA., April 28, 2015/PRNewswire-FirstCall/ -- MidSouth Bancorp, Inc. ("MidSouth") (NYSE:MSL) today reported quarterly net earnings available to common shareholders of $1.3 million for the first quarter of 2015, compared to net earnings available to common shareholders of $6.7 million reported for the first quarter of 2014 and $3.5 million in net earnings available to common shareholders for the fourth quarter of 2014. Diluted earnings for the first quarter of 2015 were $0.12 per common share, compared to $0.57 per common share reported for the first quarter of 2014 and $0.30 per common share reported for the fourth quarter of 2014.
First quarter 2015 net earnings were impacted by a loan loss provision of $6.0 million which reflects MidSouth's concerns about the continuing downturn in energy related businesses, although there have been no material confirmed losses to date in its energy related loan portfolio.
Of the $6.0 million loan loss provision, approximately $4.0 million is the result of energy related credit downgrades on five relationships plus an increase of $500,000 to MidSouth's reserve for potential yet unidentified losses in its energy related portfolio.
C. R. Cloutier, President and CEO, commenting on first quarter earnings remarked, "Based on our 30 years of experience lending to the oilfield service industry and the current uncertainty regarding the length of the downturn in energy markets, we feel it is better to be proactive with downgrading credits and increasing reserve levels, although we have not yet confirmed any material energy related losses. We continue to be engaged in frequent dialogue with our energy related borrowers impacted by the downturn to attempt to mitigate or eliminate possible losses to the Bank.'
'Although we are very focused on resolving energy related credits, we continue to make good progress in improving our core profitability. On a pre-tax, pre-provision basis, the first quarter reflected $1.6 million improvement in operating performance versus a year ago due primarily to our continued efficiency efforts that resulted in decreased noninterest expenses of $1.2 million, or 6.7%, year-over-year."
-1-
Balance Sheet
Total consolidated assets at March 31, 2015 were $2.0 billion, compared to $1.9 billion at December 31, 2014 and March 31, 2014. Our stable core deposit base, which excludes time deposits, totaled $1.4 billion at March 31, 2015 and $1.3 billion at December 31, 2014 and accounted for 84.5% of deposits compared to 84.1% of deposits, respectively. Net loans totaled $1.3 billion at March 31, 2015 and December 31, 2014, compared to $1.2 billion at March 31, 2014. Total loans grew $26.5 million, or 2.1% for the quarter ended March 31, 2015. Excluding a CD secured loan of $20.0 million, loans grew $6.5 million, or 0.5% for the quarter ended March 31, 2015. The first quarter 2015 also included $3.9 million of paydowns on the indirect auto loan program, which the Bank exited at the end of 2014.
MidSouth's Tier 1 leverage capital ratio was 9.63% at March 31, 2015 compared to 9.52% at December 31, 2014. Tier 1 risk-based capital and total risk-based capital ratios were 12.30% and 13.38% at March 31, 2015, compared to 12.90% and 13.73% at December 31, 2014, respectively. Tier 1 common equity to total risk-weighted assets at March 31, 2015 was 8.12%. Tangible common equity totaled $120.6 million at March 31, 2015, compared to $118.6 million at December 31, 2014. Tangible book value per share at March 31, 2015 was $10.63 versus $10.46 at December 31, 2014.
Asset Quality
Nonperforming assets totaled $17.6 million at March 31, 2015, an increase of $2.5 million compared to $15.1 million reported at December 31, 2014. The increase resulted primarily from the addition of a commercial real estate (CRE) loan unrelated to energy that was placed on nonaccrual status during the quarter. Allowance coverage for nonperforming loans increased to 124.17% at March 31, 2015, compared to 103.10% at December 31, 2014. The ALLL/total loans ratio was 1.23 % at March 31, 2015 and 0.87% at December 31, 2014. Including valuation accounting adjustments on acquired loans, the total valuation accounting adjustment plus ALLL was 1.61% of loans at March 31, 2015. The ratio of annualized net charge-offs to total loans was 0.36% for the three months ended March 31, 2015 compared to 0.28% for the three months ended December 31, 2014.
Total nonperforming assets to total loans plus ORE and other assets repossessed was 1.34% at March 31, 2015 compared to 1.17% at December 31, 2014. Loans classified as troubled debt restructurings ("TDRs") totaled $407,000 at March 31, 2015 compared to $410,000 at December 31, 2014. Classified assets, including ORE, increased $41.1 million, or 122.3%, to $74.7 million at March 31, 2015 compared to $33.6 million at December 31, 2014. The increase in classified assets from the prior quarter is primarily due to the downgrade of five performing energy related credit relationships.
-2-
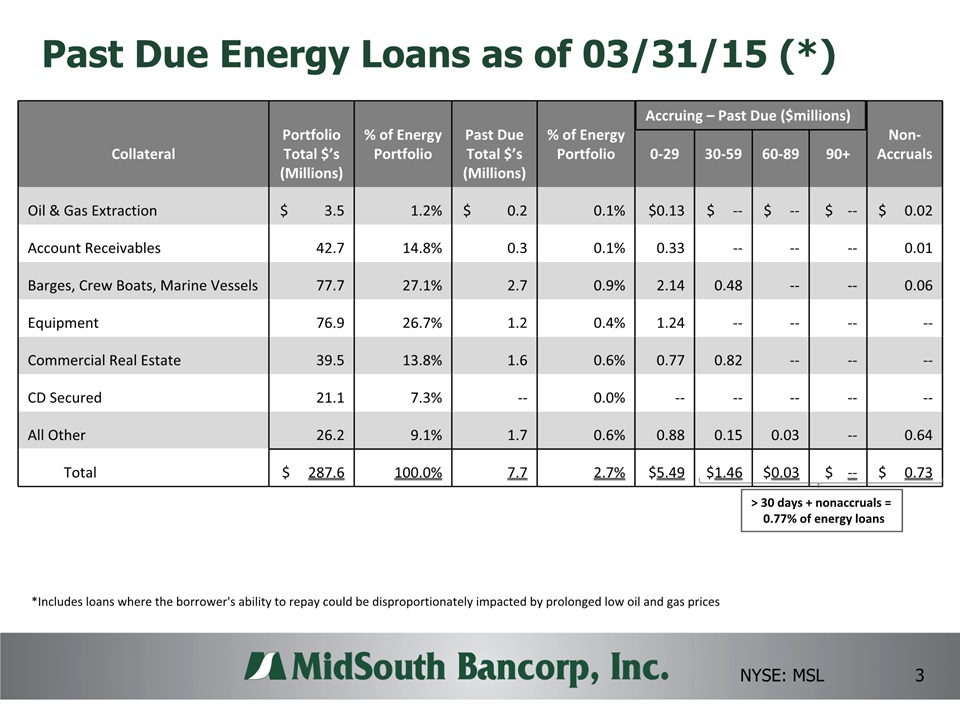
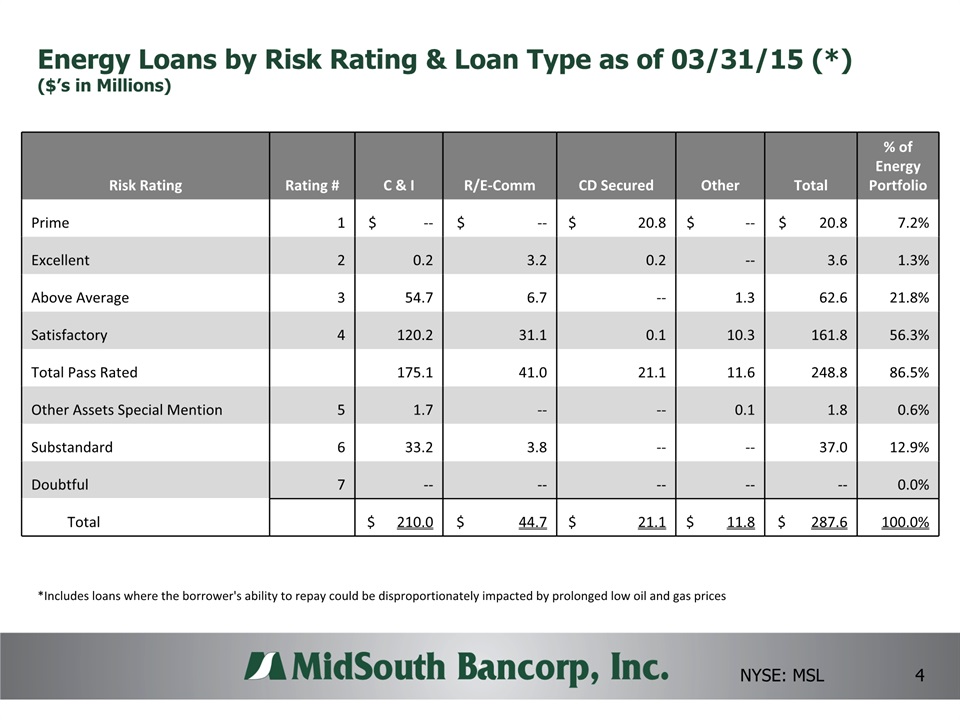
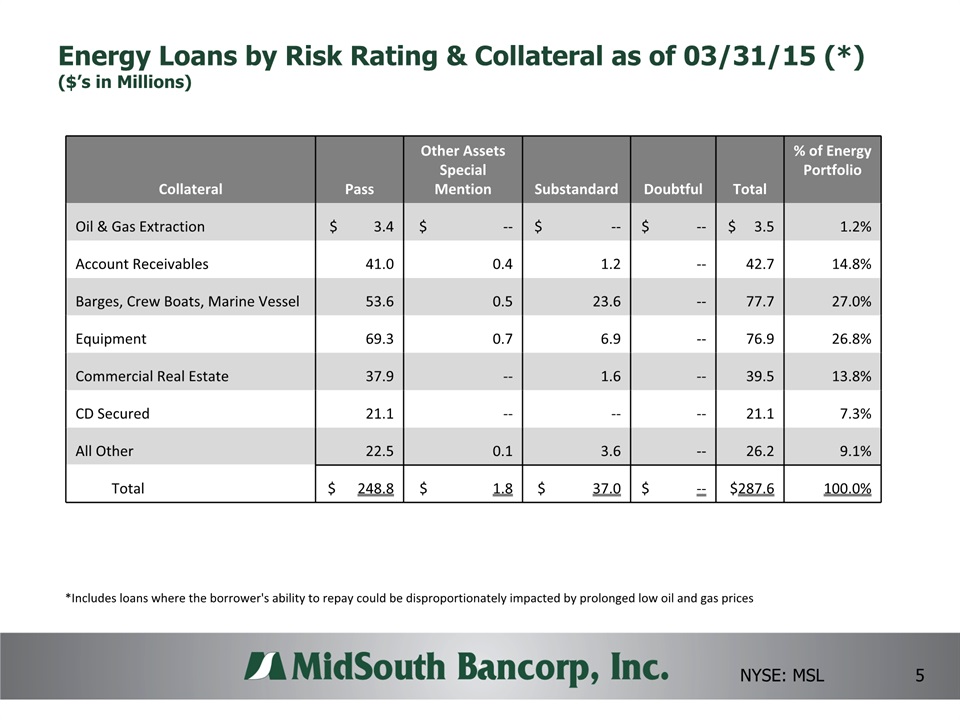
MidSouth's energy related loan portfolio at March 31, 2015 totaled $288 million, including a $20 million CD secured loan. The majority of MidSouth's energy lending is focused on oil field service companies. As a result of an ongoing review of our energy portfolio in the continued low oil price environment, an additional $4 million of loan loss provision related to credit downgrades was recorded during the first quarter 2015, as well as a $500,000 addition to the reserve for potential yet unidentified losses in our energy loan portfolio. Combined with an initial provision of $650,000 established in the fourth quarter of 2014, a total of $1.15 million is reserved for potential yet unidentified losses in MidSouth's energy related portfolio. Of the 488 total relationships in our energy related loan portfolio, 14 relationships totaling $37.0 million were classified with $0.7 million on nonaccrual status at March 31, 2015.
More information on our energy loan portfolio can be found on our website at MidSouthBank.com under Investor Relations/Presentations.
First Quarter 2015 vs. First Quarter 2014 Earnings Comparison
First quarter 2015 net earnings available to common shareholders totaled $1.3 million compared to $6.7 million for the first quarter of 2014. Excluding the $3.0 million in life insurance income recorded in the first quarter of 2014, revenues from consolidated operations increased $412,000 in quarterly comparison. Net interest income increased $362,000 in quarterly comparison, as decreases of $751,000 in loan valuation income and $320,000 in interest income on investment securities were offset primarily by a $1.3 million increase in interest income earned on a higher volume of loans and a $197,000 decrease in interest expense on junior subordinated debentures. Excluding the $3.0 million of life insurance income, noninterest income increased $50,000 in quarterly comparison, from $4.9 million for the three months ended March 31, 2014 to $5.0 million for the three months ended March 31, 2015. The increase in noninterest income consisted primarily of $127,000 in ATM/debit card income, $115,000 in gain on sales of securities and $104,000 in mortgage lending fees. The increases were partially offset primarily by a $260,000 decrease in service charges on deposit accounts.
Excluding non-operating expenses of $242,000 in the first quarter of 2014, first quarter 2015 noninterest expenses decreased $1.2 million compared to first quarter 2014 and primarily consisted of decreases of $732,000 in salaries and benefits costs, $106,000 in occupancy expenses and $75,000 in expenses on ORE and other repossessed assets, combined with smaller decreases in several other noninterest expense categories. The provision for loan losses increased $5.5 million in quarterly comparison, primarily due to energy related credit downgrades and an increase of $500,000 in a special reserve for potential yet unidentified losses in the energy related portfolio. Income tax expense decreased $1.3 million in quarterly comparison.
Dividends paid on the Series B Preferred Stock issued to the Treasury as a result of our participation in the Small Business Lending Fund ("SBLF") totaled $80,000 for the first quarter of 2015 based on a dividend rate of 1.00%. The dividend rate is set at 1.00% through February 25, 2016. The Series C Preferred Stock issued with the December 28, 2012 acquisition of PSB Financial Corporation ("PSB") paid dividends totaling $93,000 for the three months ended March 31, 2015.
Fully taxable-equivalent ("FTE") net interest income totaled $19.6 million and $19.3 million for the quarters ended March 31, 2015 and 2014, respectively. The FTE net interest income increased $304,000 in prior year quarterly comparison primarily due to a $571,000 increase in interest income on loans despite a $751,000 reduction in purchase accounting adjustments on acquired loans. The increased interest income on loans resulted from a $151.3 million increase in the average volume of loans in quarterly comparison. The average yield on loans decreased 54 basis points, from 6.18% to 5.64%. The purchase accounting adjustments added 13 basis points to the average yield on loans for the first quarter of 2015 and 42 basis points to the average yield on loans for the first quarter of 2014. Net of the impact of the purchase accounting adjustments, average loan yields declined 25 basis points in prior year quarterly comparison, from 5.76% to 5.51%. Loan yields have declined primarily as the result of a sustained low interest rate environment.
Investment securities totaled $437.3 million, or 21.9% of total assets at March 31, 2015, versus $483.7 million, or 25.6% of total assets at March 31, 2014. The investment portfolio had an effective duration of 3.5 years and a net unrealized gain of $6.0 million at March 31, 2015. The average volume of investment securities decreased $74.1 million in prior year quarterly comparison. The average tax equivalent yield on investment securities increased 10 basis points, from 2.61% to 2.71%. The $74.1 million decrease in the average volume of investment securities was used to fund loan growth during the same period.
The average yield on all earning assets decreased 25 basis points in prior year quarterly comparison, from 5.02% for the first quarter of 2014 to 4.77% for the first quarter of 2015. Net of the impact of purchase accounting adjustments, the average yield on total earning assets decreased 7 basis points, from 4.74% to 4.67% for the three month periods ended March 31, 2014 and 2015, respectively, due to a decline in the average rate earned on loans.
The impact to interest expense of a $59.5 million increase in the average volume of interest- bearing liabilities was offset by a 4 basis point decrease in the average rate paid on interest- bearing liabilities, from 0.47% at March 31, 2014 to 0.43% at March 31, 2015. Net of purchase accounting adjustments on acquired certificates of deposit and FHLB borrowings, the average rate paid on interest-bearing liabilities was 0.53% for the first quarter of 2014 and declined to 0.47% for the first quarter of 2015.
As a result of these changes in volume and yield on earning assets and interest-bearing liabilities, the FTE net interest margin decreased 22 basis points, from 4.66% for the first quarter of 2014 to 4.44% for the first quarter of 2015. Net of purchase accounting adjustments on loans, deposits and FHLB borrowings, the FTE margin decreased 1 basis point, from 4.33% for the first quarter of 2014 to 4.32% for the first quarter of 2015.
First Quarter 2015 vs. Fourth Quarter 2014 Earnings Comparison
In sequential-quarter comparison, net earnings available to common shareholders decreased $2.2 million primarily due to a $3.3 million increase in the provision for loan losses. Additionally, the decrease in net earnings available to common shareholders resulted from a $903,000 decrease in net interest income. Noninterest income decreased $83,000 in sequential-quarter comparison as a $275,000 decrease in service charges on deposit accounts was partially offset by an $115,000 increase in gain on sales of securities and a $69,000 increase in letter of credit income.
Fourth quarter noninterest expenses included efficiency consultant expenses of $156,000. Excluding these non-operating expenses, noninterest expense decreased $884,000 in sequential-quarter comparison and consisted primarily of decreases of $317,000 in salaries and benefits costs (including a $337,000 reduction in group health costs), $256,000 in marketing expenses, $65,000 in occupancy expenses and $61,000 in corporate development expense.
FTE net interest income decreased $931,000 in sequential-quarter comparison primarily due to a $748,000 decrease in interest income on loans, which included a $420,000 reduction in purchase accounting adjustments on acquired loans. The average yield on loans decreased 26 basis points, from 5.90% for the fourth quarter of 2014 to 5.64% for the first quarter of 2015. Net of purchase accounting adjustments, the loan yield declined 13 basis points, from 5.64% to 5.51% during the same period. The average yield on total earning assets decreased 18 basis points for the same period, from 4.95% to 4.77%, respectively. An average increase in interest-bearing liabilities of $39.9 million was primarily due to an average increase of $33.8 million in interest-bearing deposits and an average increase of $9.9 million in overnight repurchase agreements. As a result of these changes in volume and yield on earning assets and interest-bearing liabilities, the FTE net interest margin decreased 21 basis points, from 4.65% to 4.44%. Net of purchase accounting adjustments, the FTE net interest margin decreased 12 basis points, from 4.44% for the fourth quarter of 2014 to 4.32% for the first quarter of 2015.
Dividends
MidSouth's Board of Directors announced a cash dividend was declared in the amount of $0.09 per share to be paid on its common stock on July 1, 2015 to shareholders of record as of the close of business on June 15, 2015. Additionally, a quarterly cash dividend of 1.00% per preferred share on its 4.00% Non-Cumulative Perpetual Convertible Preferred Stock, Series C was declared payable on July 15, 2015 to shareholders of record as of the close of business on July 1, 2015. MidSouth's Series C Preferred Stock is quoted on the OTC Bulletin Board ("OTCBB") under the ticker symbol MSLXP.
About MidSouth Bancorp, Inc.
MidSouth Bancorp, Inc. is a financial holding company headquartered in Lafayette, Louisiana, with assets of $2.0 billion as of March 31, 2015. MidSouth Bancorp, Inc. trades on the NYSE under the symbol "MSL." MidSouth's Series C Preferred Stock is quoted on the OTC Bulletin Board ("OTCBB") under the ticker symbol MSLXP. Through its wholly owned subsidiary, MidSouth Bank, N.A., MidSouth offers a full range of banking services to commercial and retail customers in Louisiana and Texas. MidSouth Bank currently has 58 locations in Louisiana and Texas and is connected to a worldwide ATM network that provides customers with access to more than 55,000 surcharge-free ATMs. Additional corporate information is available at MidSouthBank.com.
Forward-Looking Statements
Certain statements contained herein are forward-looking statements within the meaning of Section 27A of the Securities Act of 1933 and Section 21E of the Securities Exchange Act of 1934 and subject to the safe harbor provisions of the Private Securities Litigation Reform Act of 1995, which involve risks and uncertainties. These statements include, among others, the expected loan loss provision and future operating results. Actual results may differ materially from the results anticipated in these forward-looking statements. Factors that might cause such a difference include, among other matters, changes in interest rates and market prices that could affect the net interest margin, asset valuation, and expense levels; changes in local economic and business conditions, including, without limitation, changes related to the oil and gas industries, that could adversely affect customers and their ability to repay borrowings under agreed upon terms, adversely affect the value of the underlying collateral related to their borrowings, and reduce demand for loans; the timing and ability to reach any agreement to restructure nonaccrual loans; increased competition for deposits and loans which could affect compositions, rates and terms; the timing and impact of future acquisitions, the success or failure of integrating operations, and the ability to capitalize on growth opportunities upon entering new markets; loss of critical personnel and the challenge of hiring qualified personnel at reasonable compensation levels; legislative and regulatory changes, including changes in banking, securities and tax laws and regulations and their application by our regulators, changes in the scope and cost of FDIC insurance and other coverage; and other factors discussed under the heading "Risk Factors" in MidSouth's Annual Report on Form 10-K for the year ended December 31, 2014 filed with the SEC on March 13, 2015 and in its other filings with the SEC. MidSouth does not undertake any obligation to publicly update or revise any of these forward-looking statements, whether to reflect new information, future events or otherwise, except as required by law.