
Armstrong World Industries Investor Presentation November 2023 Exhibit 99.2
Safe Harbor Statement Disclosures in this presentation contain forward-looking statements within the meaning of the Private Securities Litigation Reform Act of 1995, including without limitation, those relating to future financial and operational results, expected savings from cost management initiatives, the performance of our WAVE1 joint venture, market and broader economic conditions and guidance. Those statements provide our future expectations or forecasts and can be identified by our use of words such as “anticipate,” “estimate,” “expect,” “project,” “intend,” “plan,” “believe,” “outlook,” “target,” “predict,” “may,” “will,” “would,” “could,” “should,” “seek,” and other words or phrases of similar meaning in connection with any discussion of future operating or financial performance. This includes annual guidance. Forward-looking statements, by their nature, address matters that are uncertain and involve risks because they relate to events and depend on circumstances that may or may not occur in the future. As a result, our actual results may differ materially from our expected results and from those expressed in our forward-looking statements. A more detailed discussion of the risks and uncertainties that could cause our actual results to differ materially from those projected, anticipated or implied is included in the “Risk Factors” and “Management’s Discussion and Analysis” sections of our reports on Form 10-K and 10-Q filed with the U.S. Securities and Exchange Commission (“SEC”). Forward-looking statements speak only as of the date they are made. We undertake no obligation to update any forward-looking statements beyond what is required under applicable securities law. In addition, we will be referring to non-Generally Accepted Accounting Principles (“GAAP”) financial measures within the meaning of SEC Regulation G. A reconciliation of the differences between these measures with the most directly comparable financial measures calculated in accordance with GAAP are included within this presentation and available on the Investor Relations page of our website at www.armstrongceilings.com. The guidance in this presentation is only effective as of the date given, October 24, 2023, and will not be updated or affirmed unless and until we publicly announce updated or affirmed guidance. Worthington Armstrong Joint Venture (“WAVE”).
Basis of Presentation Explanation Results throughout this presentation are presented on a normalized basis. We remove the impact of certain discrete expenses and income in certain measures including adjusted Earnings Before Interest, Taxes, Depreciation and Amortization (“EBITDA”), adjusted diluted earnings per share (“EPS”) and adjusted free cash flow. The Company excludes certain acquisition related expenses (i.e. – changes in the fair value of contingent consideration and deferred compensation accruals1 for recent acquisitions). The Company excludes all acquisition-related amortization from adjusted earnings from continuing operations and in calculations of adjusted diluted EPS. Examples of other excluded items have included plant closures, restructuring charges and related costs, impairments, separation costs and other cost reduction initiatives, environmental site expenses and related insurance recoveries, endowment level charitable contributions, and certain other gains and losses. The Company also excludes income/expense from its U.S. Retirement Income Plan (“RIP”) in the non-GAAP results as it represents the actuarial net periodic benefit credit/cost recorded. Our tax rate may be adjusted for certain discrete items which are identified in the footnotes. Investors should not consider non-GAAP measures as a substitute for GAAP measures. Excluding adjusted diluted EPS, non-GAAP figures are rounded to the nearest million and corresponding percentages are based on unrounded figures. Operating Segments: “MF”: Mineral Fiber, “AS”: Architectural Specialties, “UC”: Unallocated Corporate All dollar figures throughout the presentation are in $ millions, expect per share data, and all comparisons are versus prior year unless otherwise noted. Figures may not sum due to rounding. The deferred compensation accruals are for cash and stock awards that will be recorded over each awards’ respective vesting period, as such payments are subject to the sellers’ and employees’ continued employment with the Company.
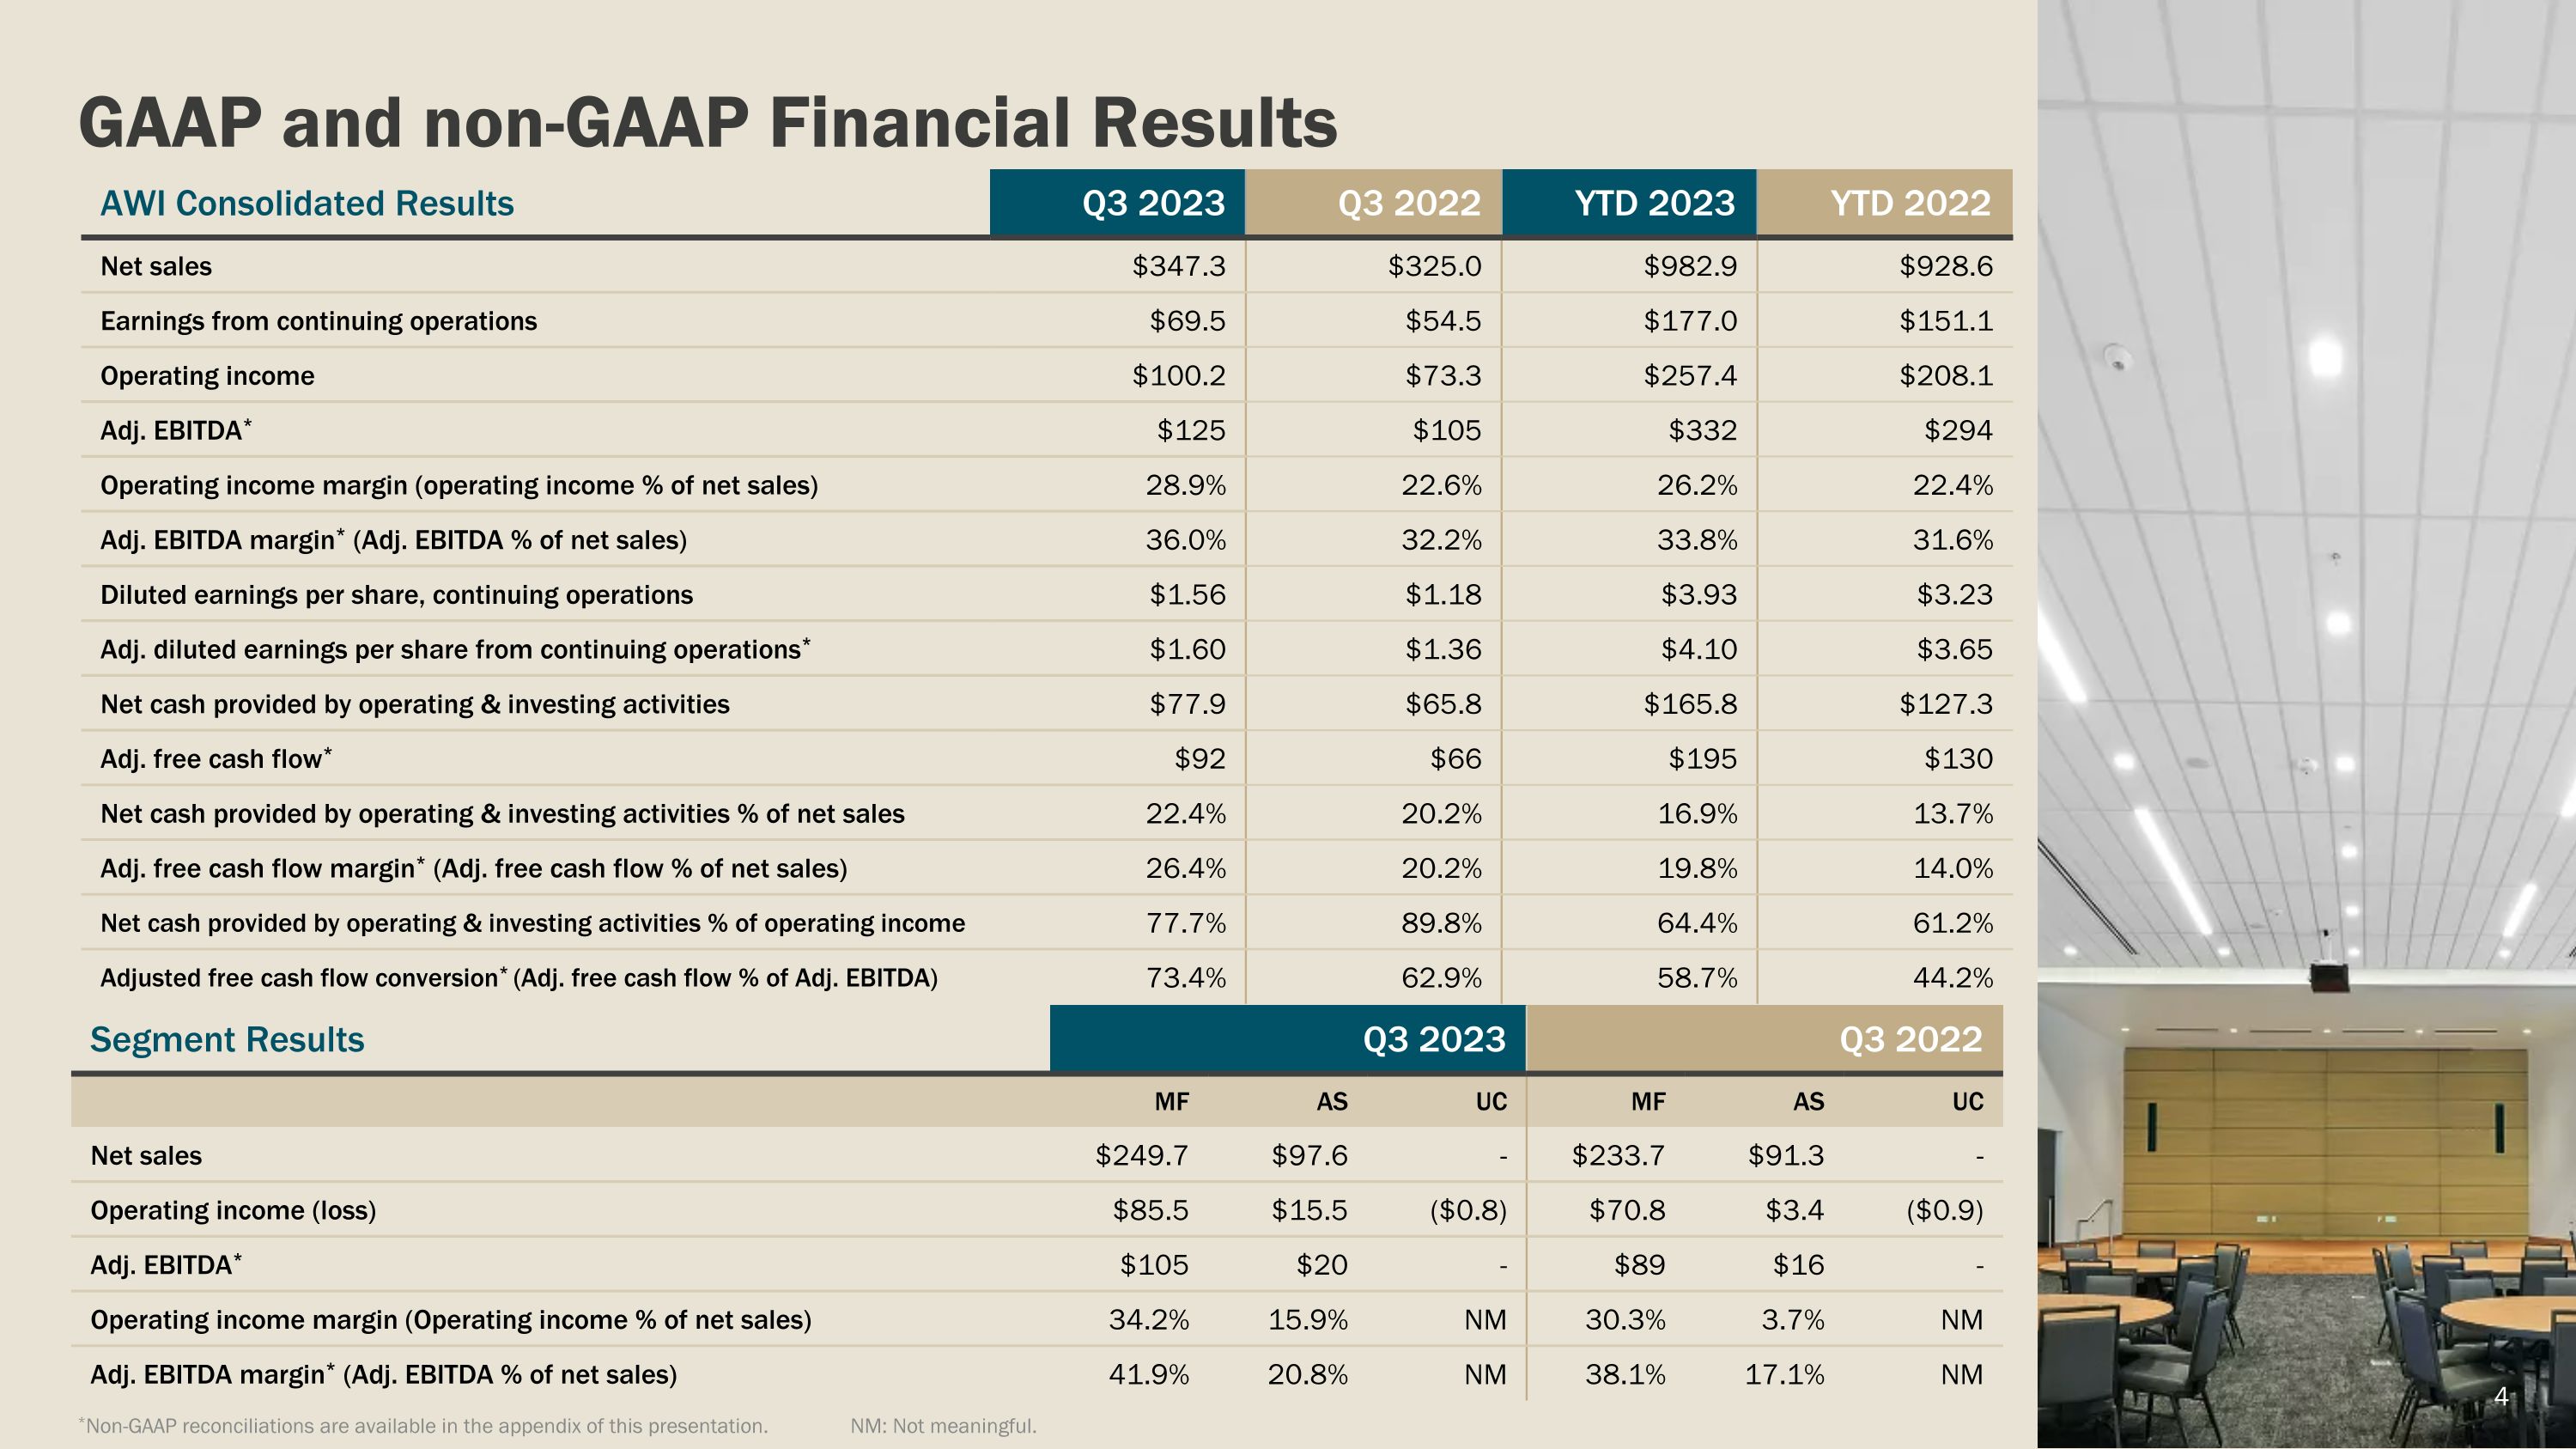
GAAP and non-GAAP Financial Results AWI Consolidated Results Q3 2023 Q3 2022 YTD 2023 YTD 2022 Net sales $347.3 $325.0 $982.9 $928.6 Earnings from continuing operations $69.5 $54.5 $177.0 $151.1 Operating income $100.2 $73.3 $257.4 $208.1 Adj. EBITDA* $125 $105 $332 $294 Operating income margin (operating income % of net sales) 28.9% 22.6% 26.2% 22.4% Adj. EBITDA margin* (Adj. EBITDA % of net sales) 36.0% 32.2% 33.8% 31.6% Diluted earnings per share, continuing operations $1.56 $1.18 $3.93 $3.23 Adj. diluted earnings per share from continuing operations* $1.60 $1.36 $4.10 $3.65 Net cash provided by operating & investing activities $77.9 $65.8 $165.8 $127.3 Adj. free cash flow* $92 $66 $195 $130 Net cash provided by operating & investing activities % of net sales 22.4% 20.2% 16.9% 13.7% Adj. free cash flow margin* (Adj. free cash flow % of net sales) 26.4% 20.2% 19.8% 14.0% Net cash provided by operating & investing activities % of operating income 77.7% 89.8% 64.4% 61.2% Adjusted free cash flow conversion* (Adj. free cash flow % of Adj. EBITDA) 73.4% 62.9% 58.7% 44.2% Segment Results Q3 2023 Q3 2022 MF AS UC MF AS UC Net sales $249.7 $97.6 - $233.7 $91.3 - Operating income (loss) $85.5 $15.5 ($0.8) $70.8 $3.4 ($0.9) Adj. EBITDA* $105 $20 - $89 $16 - Operating income margin (Operating income % of net sales) 34.2% 15.9% NM 30.3% 3.7% NM Adj. EBITDA margin* (Adj. EBITDA % of net sales) 41.9% 20.8% NM 38.1% 17.1% NM *Non-GAAP reconciliations are available in the appendix of this presentation. NM: Not meaningful.
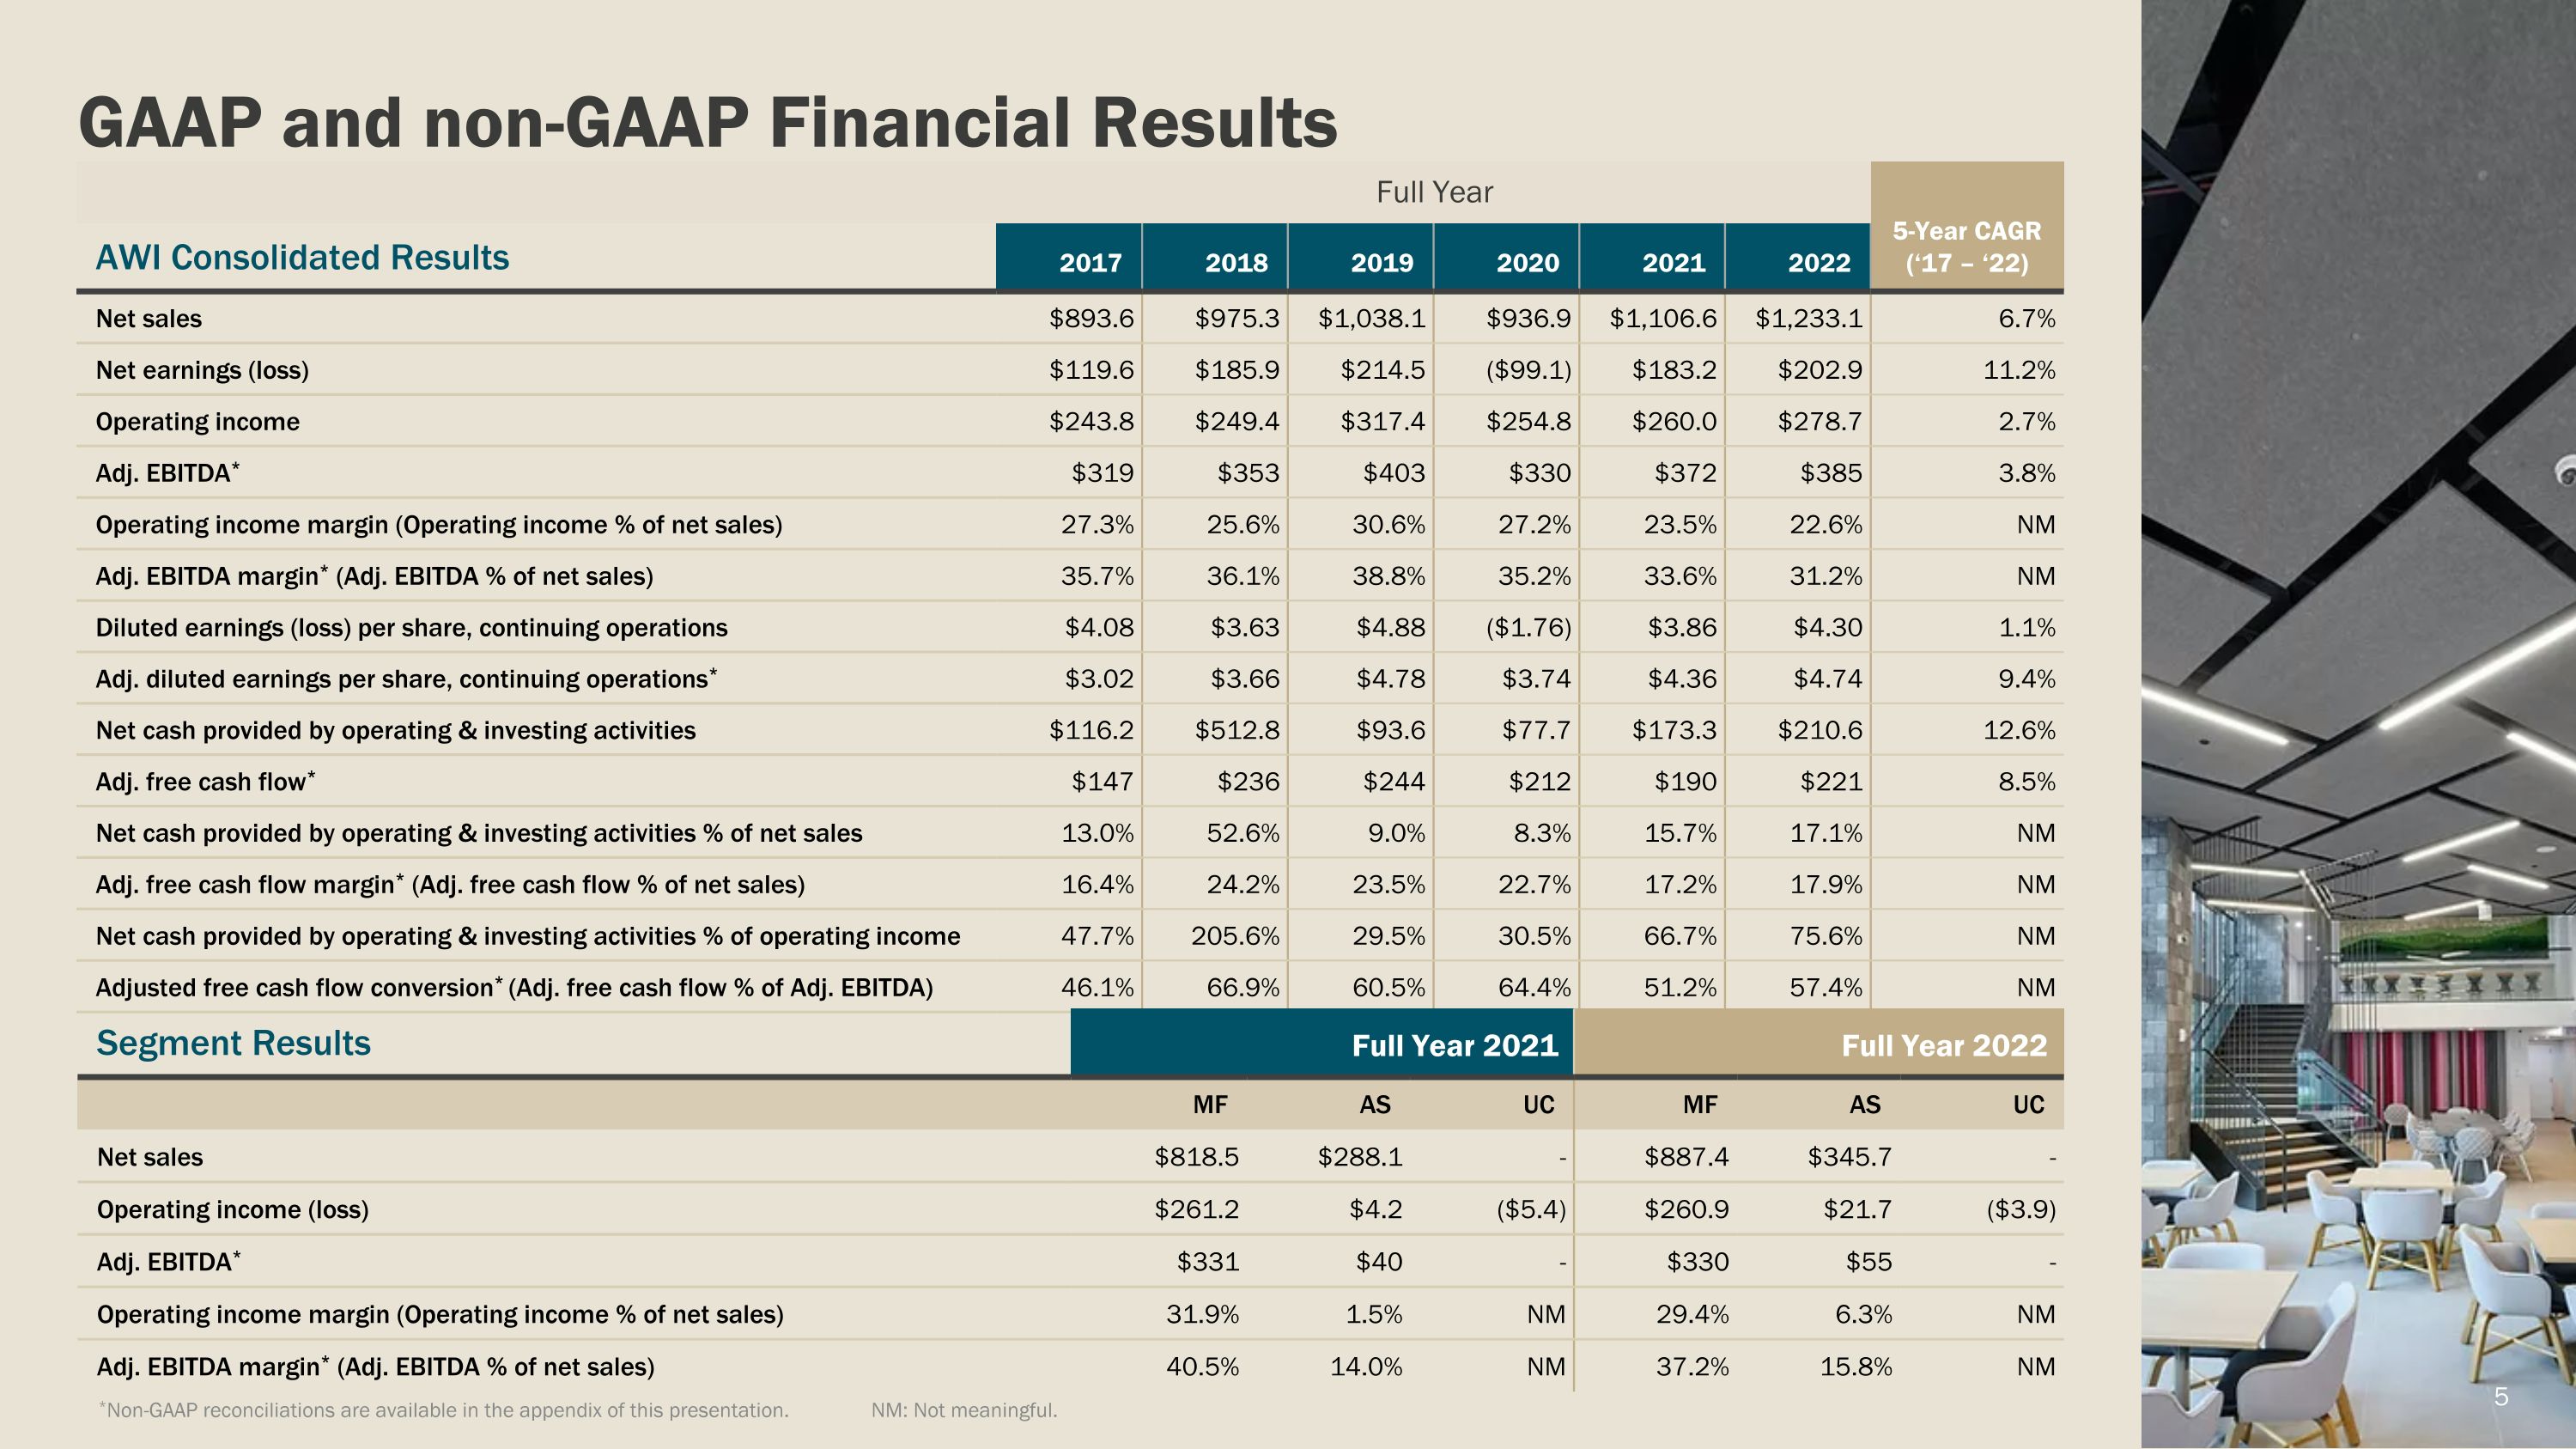
GAAP and non-GAAP Financial Results *Non-GAAP reconciliations are available in the appendix of this presentation. NM: Not meaningful. Full Year 5-Year CAGR (‘17 – ‘22) AWI Consolidated Results 2017 2018 2019 2020 2021 2022 Net sales $893.6 $975.3 $1,038.1 $936.9 $1,106.6 $1,233.1 6.7% Net earnings (loss) $119.6 $185.9 $214.5 ($99.1) $183.2 $202.9 11.2% Operating income $243.8 $249.4 $317.4 $254.8 $260.0 $278.7 2.7% Adj. EBITDA* $319 $353 $403 $330 $372 $385 3.8% Operating income margin (Operating income % of net sales) 27.3% 25.6% 30.6% 27.2% 23.5% 22.6% NM Adj. EBITDA margin* (Adj. EBITDA % of net sales) 35.7% 36.1% 38.8% 35.2% 33.6% 31.2% NM Diluted earnings (loss) per share, continuing operations $4.08 $3.63 $4.88 ($1.76) $3.86 $4.30 1.1% Adj. diluted earnings per share, continuing operations* $3.02 $3.66 $4.78 $3.74 $4.36 $4.74 9.4% Net cash provided by operating & investing activities $116.2 $512.8 $93.6 $77.7 $173.3 $210.6 12.6% Adj. free cash flow* $147 $236 $244 $212 $190 $221 8.5% Net cash provided by operating & investing activities % of net sales 13.0% 52.6% 9.0% 8.3% 15.7% 17.1% NM Adj. free cash flow margin* (Adj. free cash flow % of net sales) 16.4% 24.2% 23.5% 22.7% 17.2% 17.9% NM Net cash provided by operating & investing activities % of operating income 47.7% 205.6% 29.5% 30.5% 66.7% 75.6% NM Adjusted free cash flow conversion* (Adj. free cash flow % of Adj. EBITDA) 46.1% 66.9% 60.5% 64.4% 51.2% 57.4% NM Segment Results Full Year 2021 Full Year 2022 MF AS UC MF AS UC Net sales $818.5 $288.1 - $887.4 $345.7 - Operating income (loss) $261.2 $4.2 ($5.4) $260.9 $21.7 ($3.9) Adj. EBITDA* $331 $40 - $330 $55 - Operating income margin (Operating income % of net sales) 31.9% 1.5% NM 29.4% 6.3% NM Adj. EBITDA margin* (Adj. EBITDA % of net sales) 40.5% 14.0% NM 37.2% 15.8% NM 5
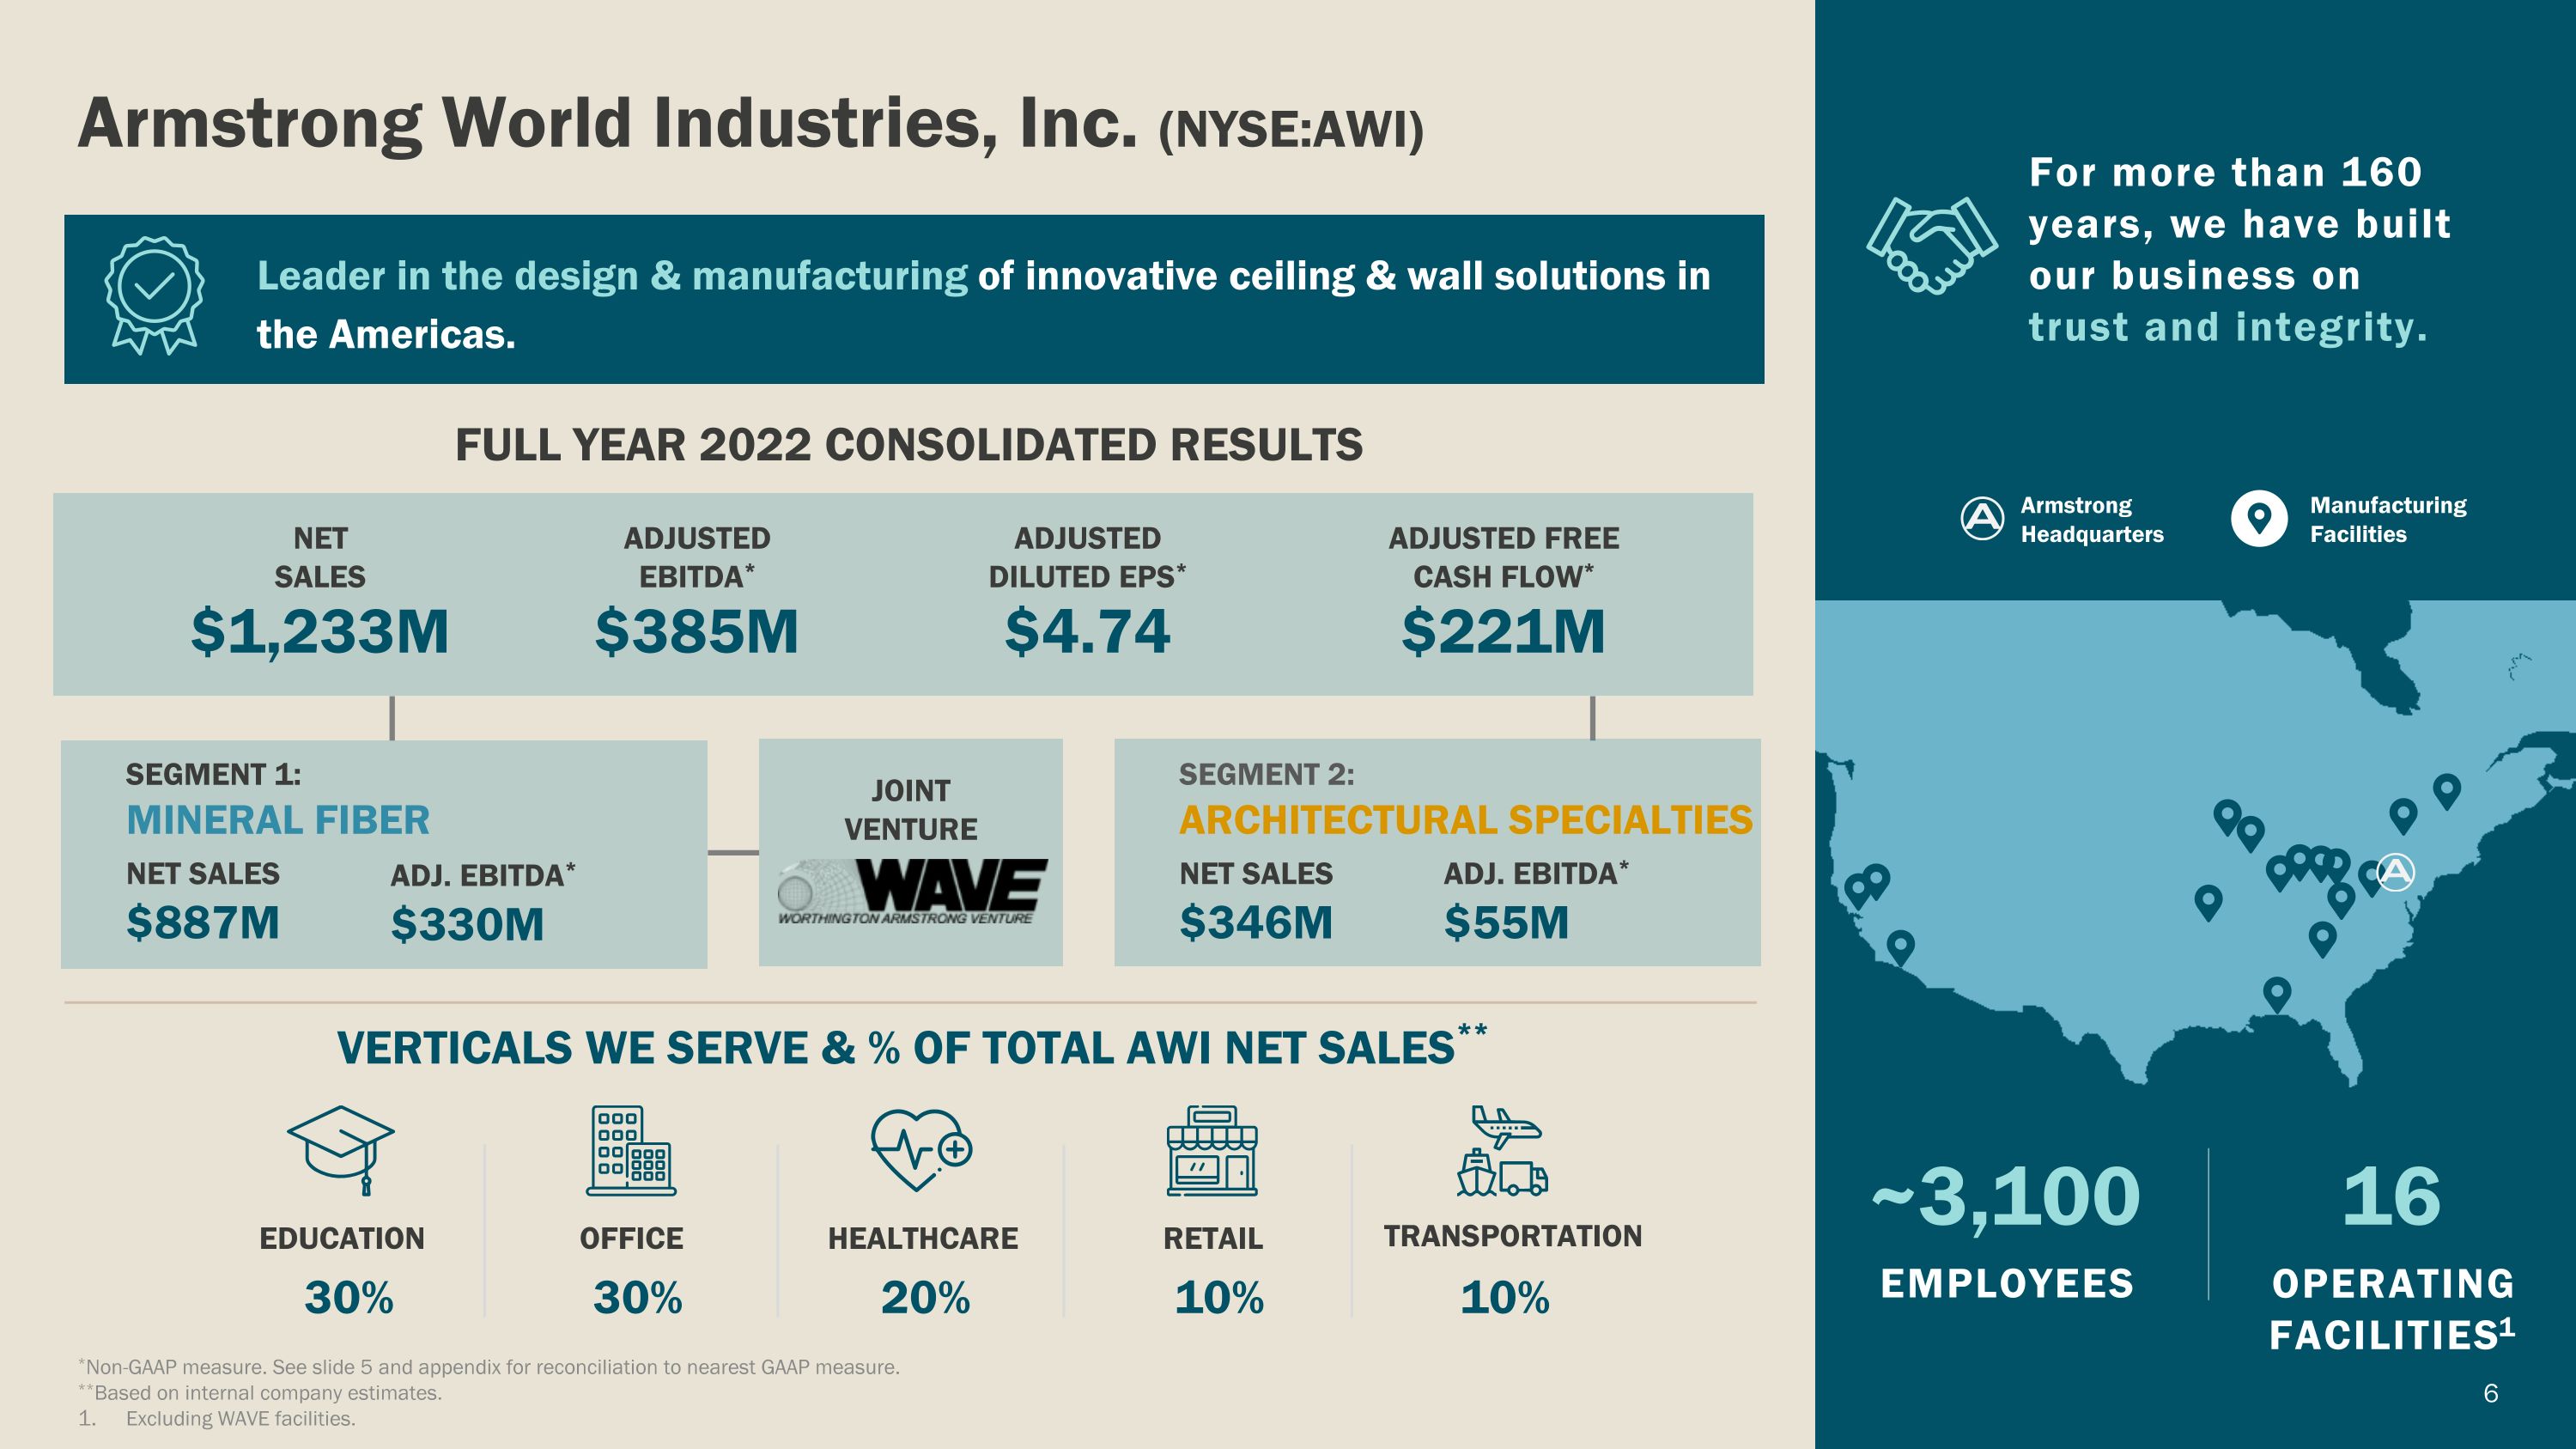
Armstrong World Industries, Inc. (NYSE:AWI) Leader in the design & manufacturing of innovative ceiling & wall solutions in the Americas. FULL YEAR 2022 CONSOLIDATED RESULTS VERTICALS WE SERVE & % OF TOTAL AWI NET SALES** $1,233M Net Sales $4.74 ADJUSTED DILUTED EPS* $221M ADJUSTED FREE CASH FLOW* $385M ADJUSTED EBITDA* For more than 160 years, we have built our business on trust and integrity. Operating Facilities1 16 ~3,100 Employees Manufacturing Facilities Armstrong Headquarters Segment 2: ARCHITECTURAL SPECIALTIES Net sales $346M Adj. EBITDA* $55M Net sales $887M Adj. EBITDA* $330M SEGMENT 1: MINERAL FIBER Joint Venture EDUCATION 30% TRANSPORTATION 10% OFFICE 30% RETAIL 10% HEALTHCARE 20% *Non-GAAP measure. See slide 5 and appendix for reconciliation to nearest GAAP measure. **Based on internal company estimates. Excluding WAVE facilities.
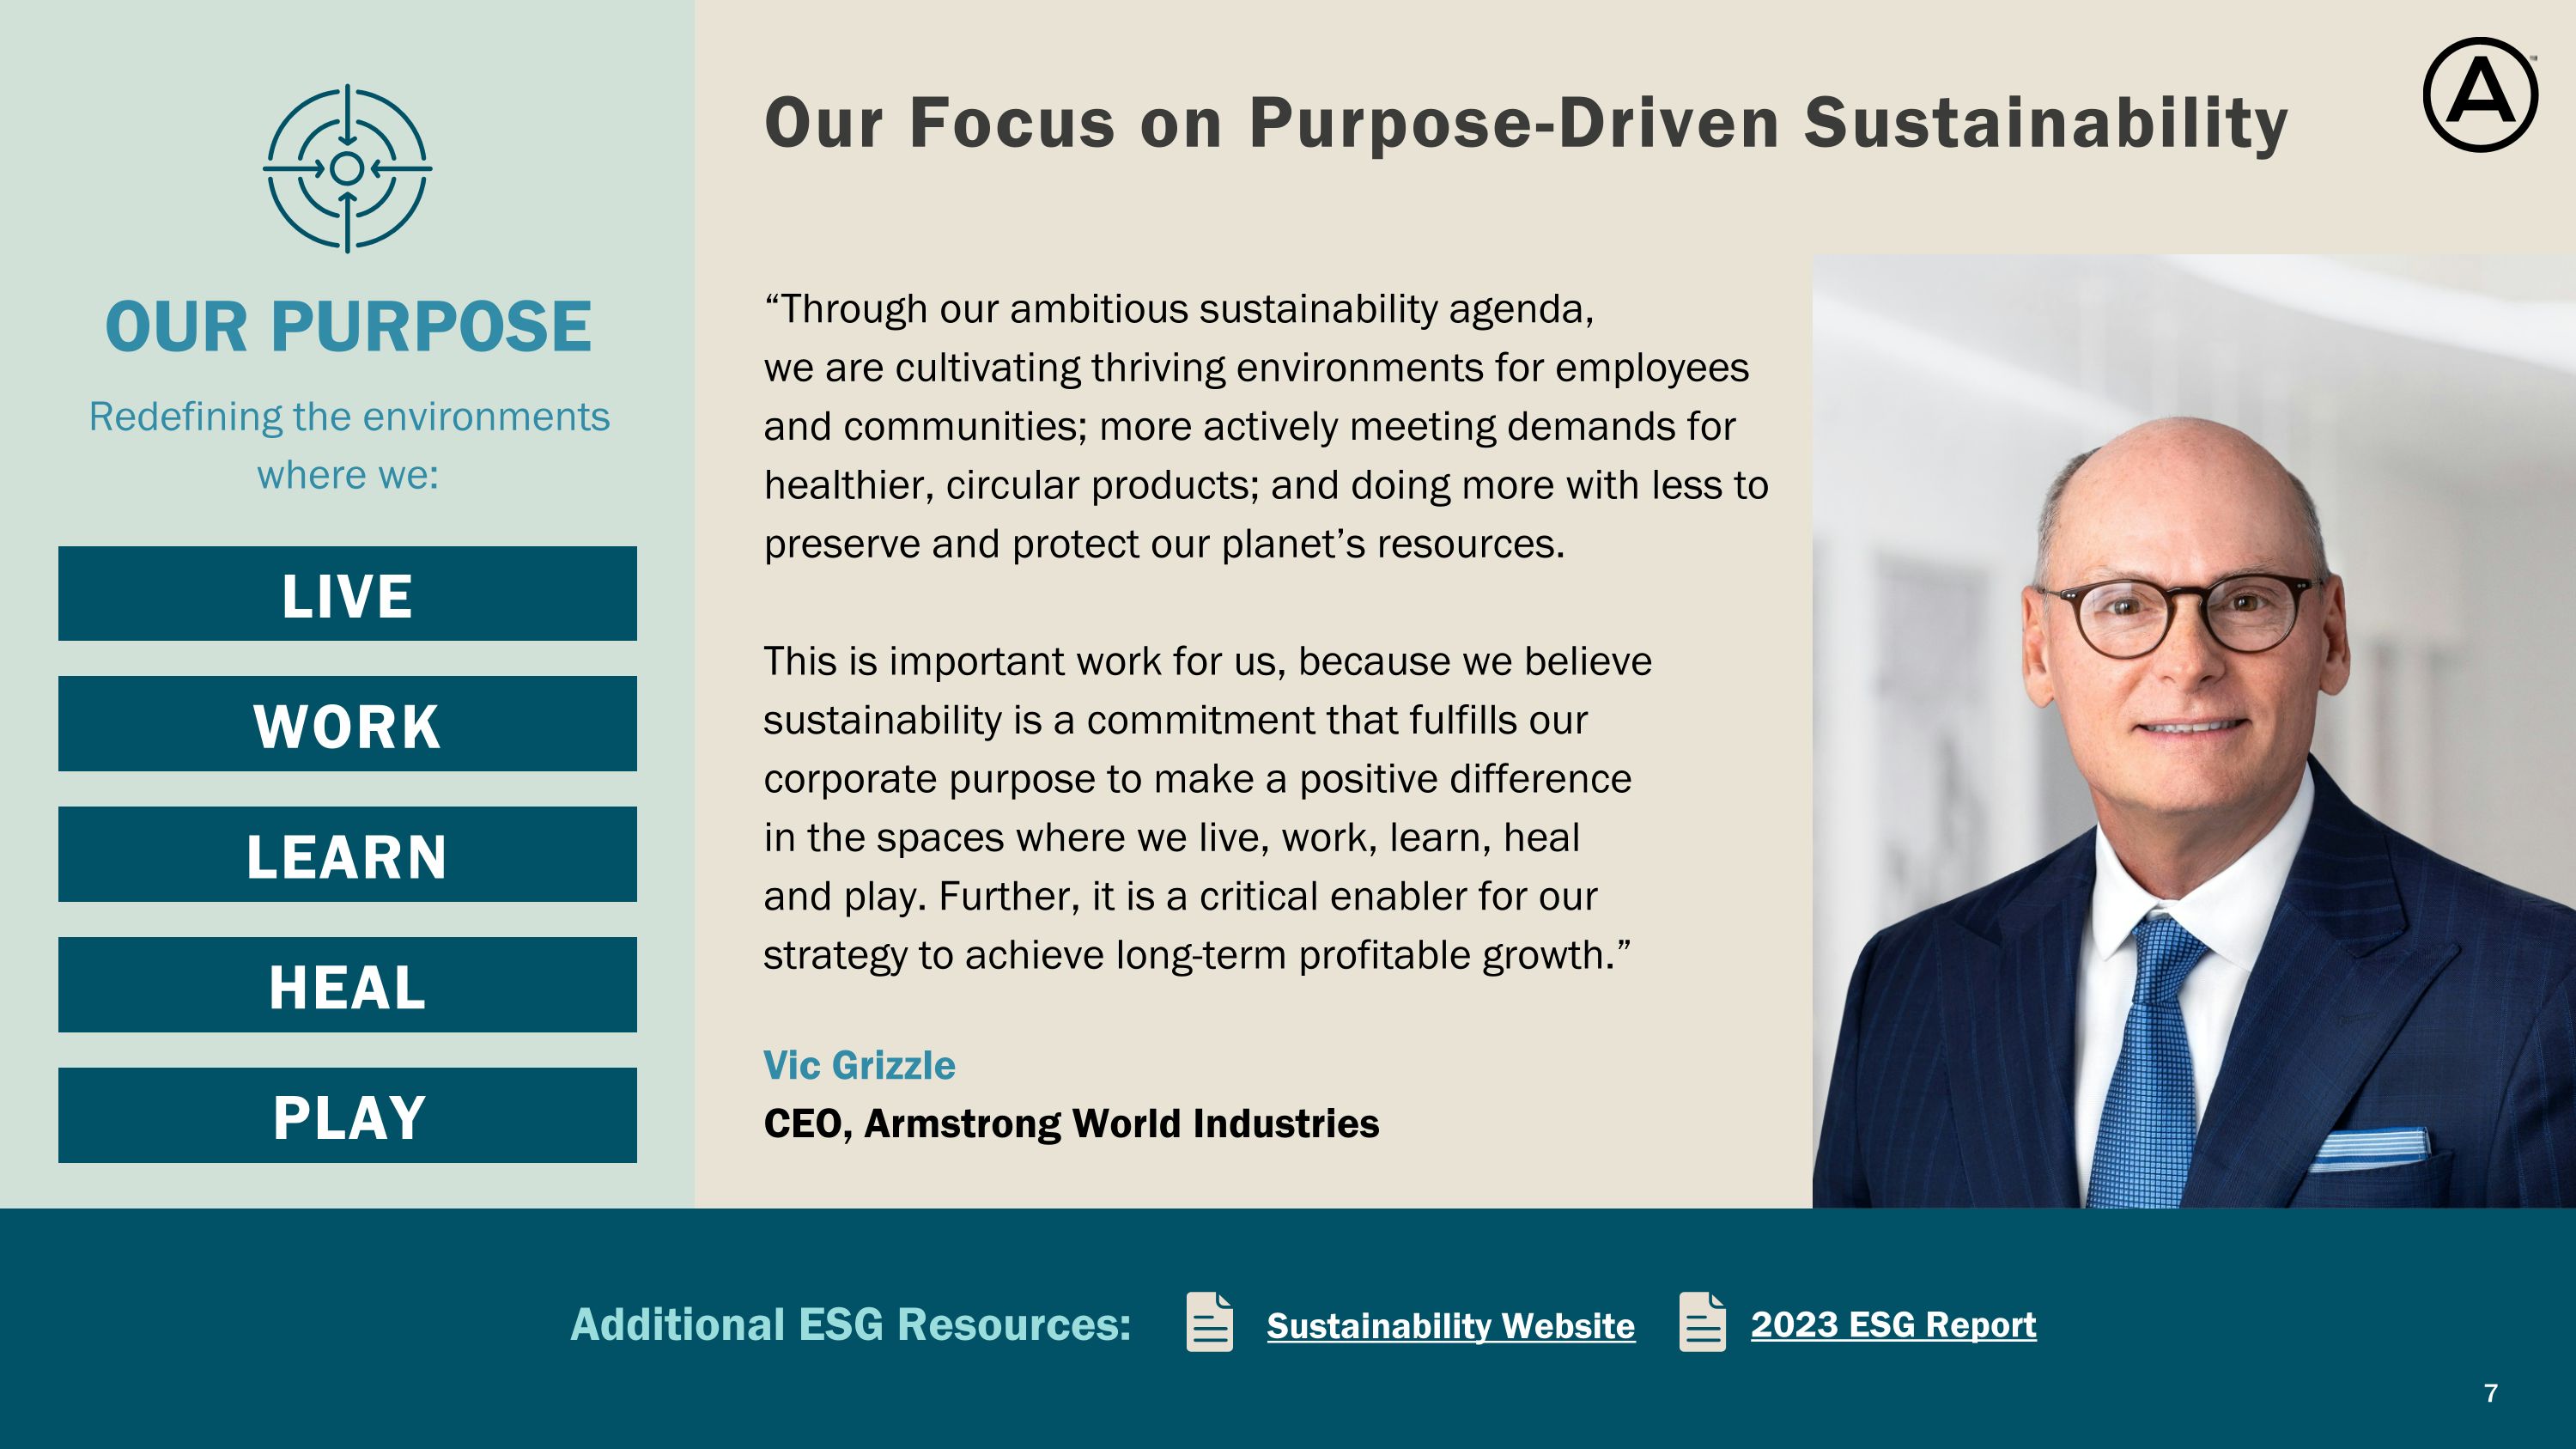
Our Focus on Purpose-Driven Sustainability “Through our ambitious sustainability agenda, we are cultivating thriving environments for employees and communities; more actively meeting demands for healthier, circular products; and doing more with less to preserve and protect our planet’s resources. This is important work for us, because we believe sustainability is a commitment that fulfills our corporate purpose to make a positive difference in the spaces where we live, work, learn, heal and play. Further, it is a critical enabler for our strategy to achieve long-term profitable growth.” Redefining the environments where we: Sustainability Website Additional ESG Resources: 2023 ESG Report LIVE WORK LEARN HEAL PLAY Vic Grizzle CEO, Armstrong World Industries OUR PURPOSE 7
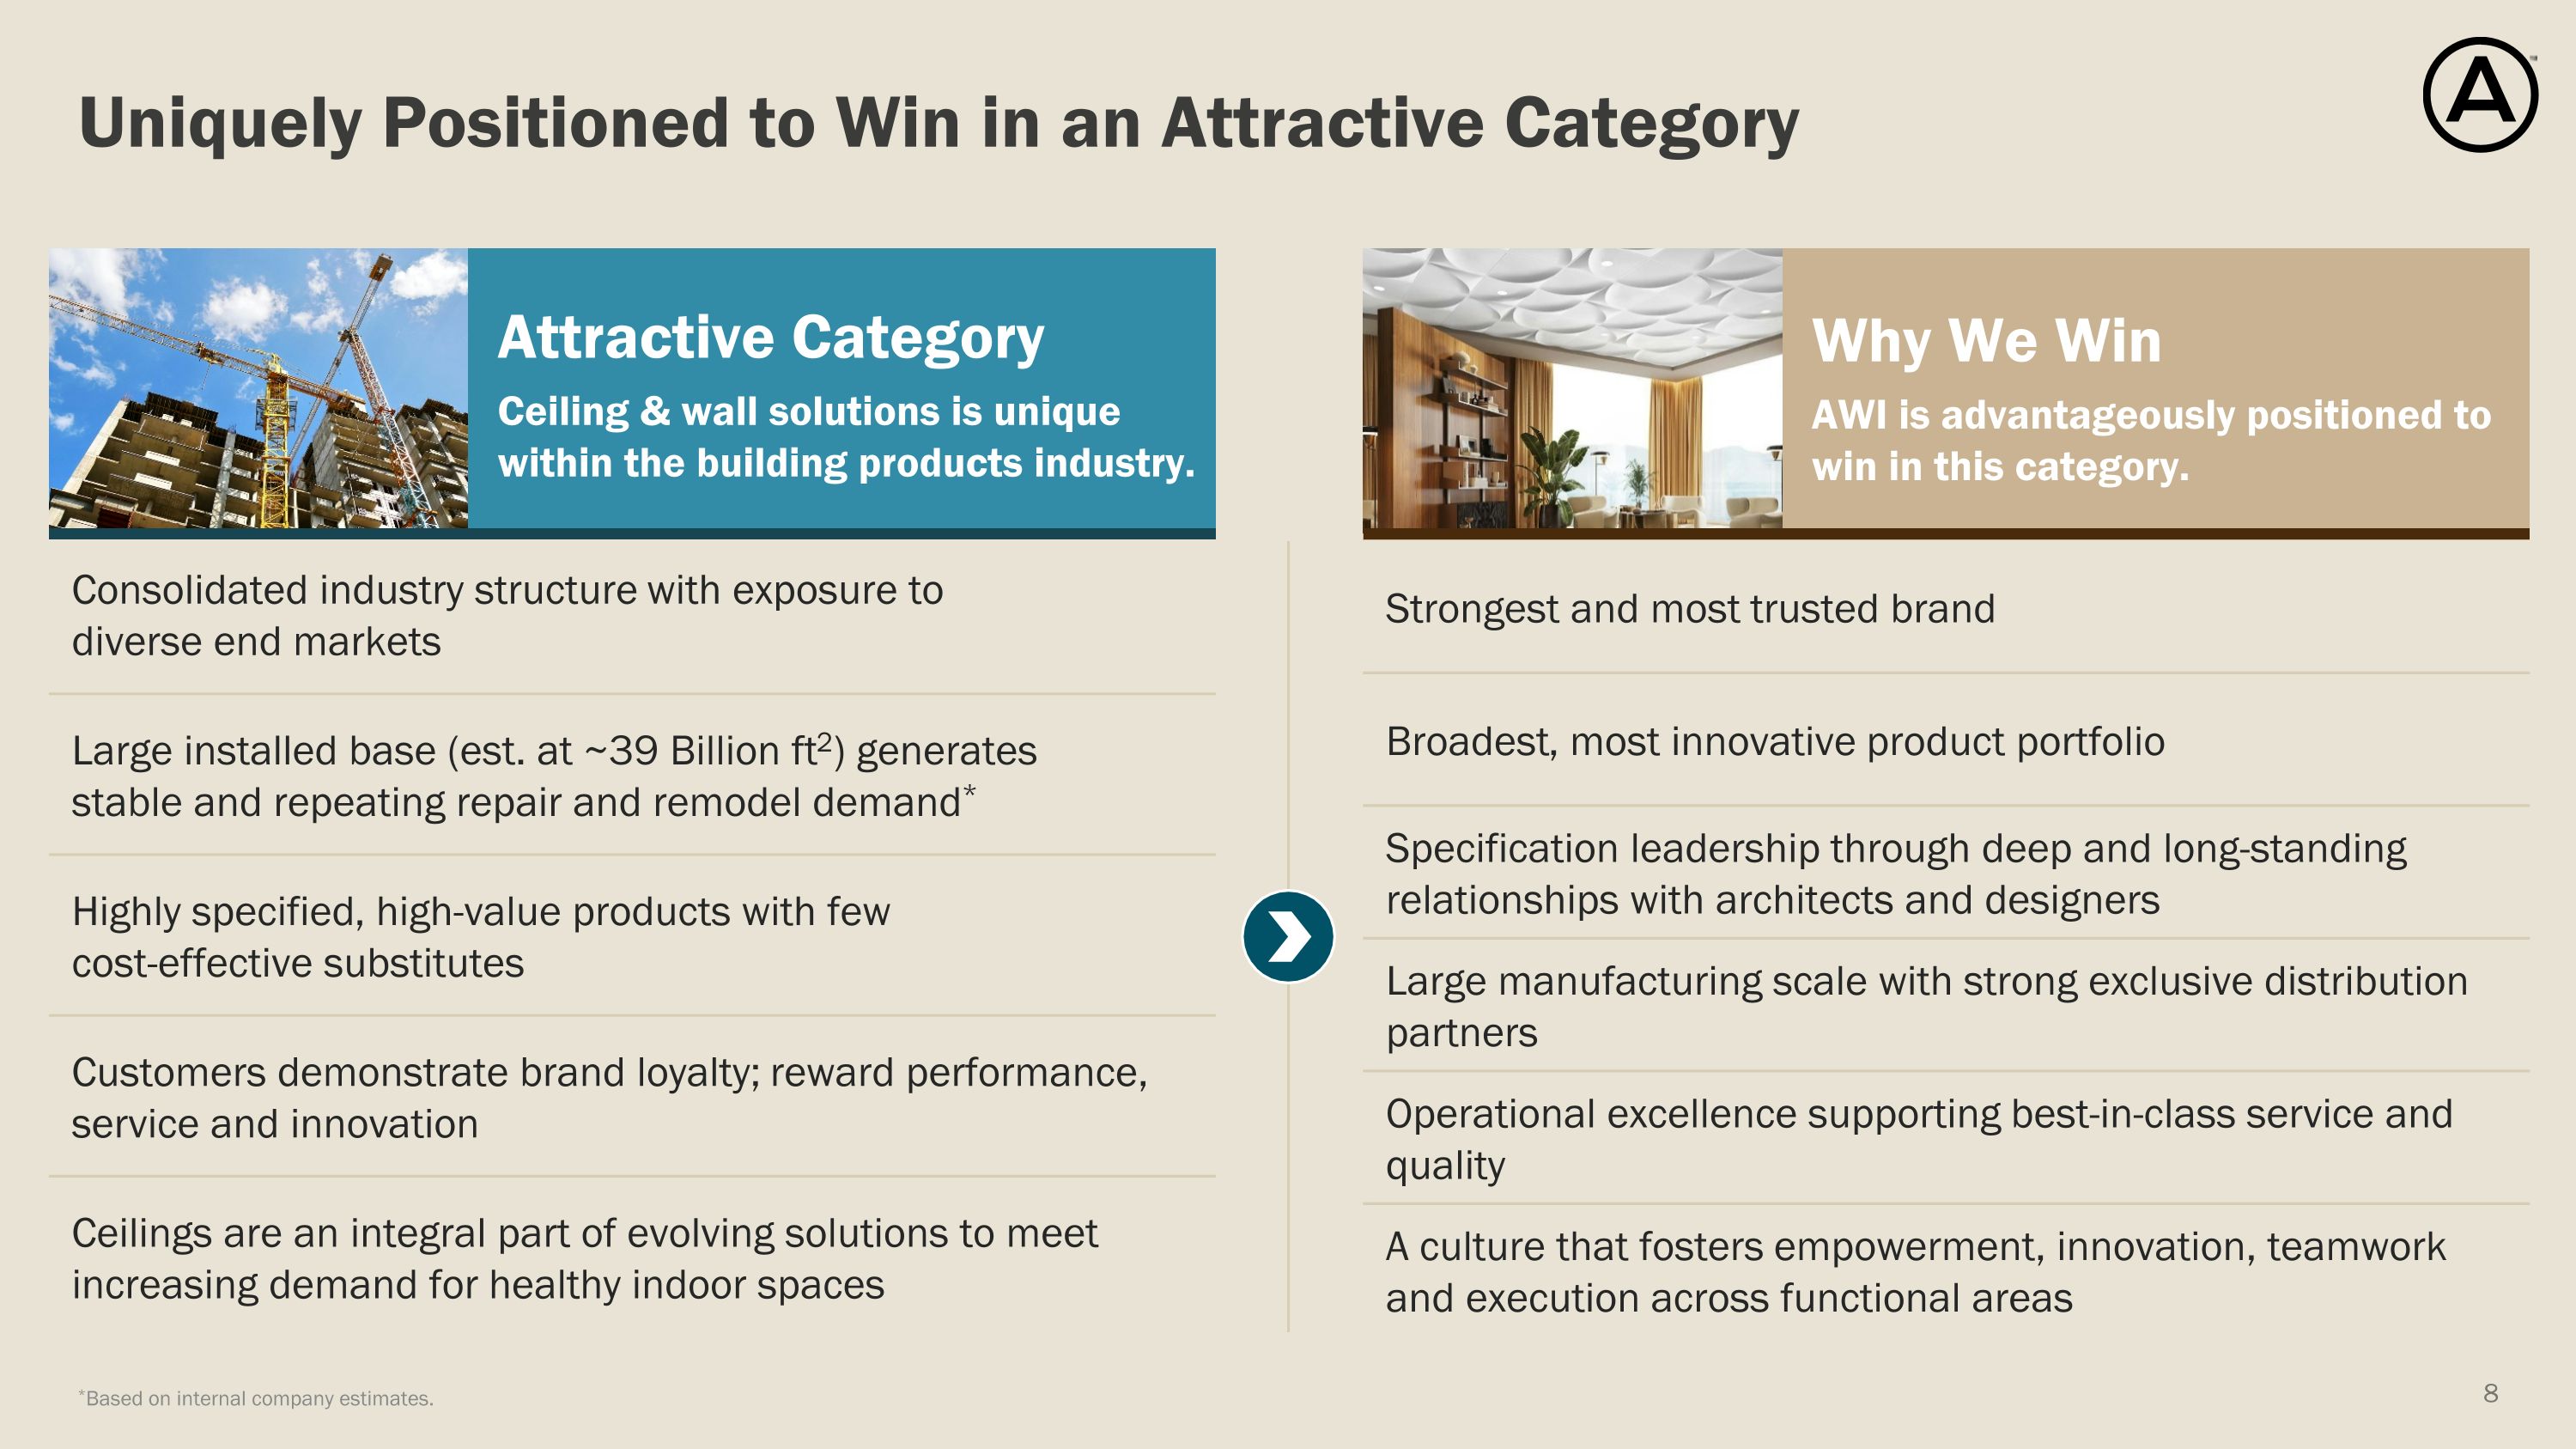
Why We Win AWI is advantageously positioned to win in this category. Strongest and most trusted brand Broadest, most innovative product portfolio Specification leadership through deep and long-standing relationships with architects and designers Large manufacturing scale with strong exclusive distribution partners Operational excellence supporting best-in-class service and quality A culture that fosters empowerment, innovation, teamwork and execution across functional areas Attractive Category Ceiling & wall solutions is unique within the building products industry. Consolidated industry structure with exposure to diverse end markets Large installed base (est. at ~39 Billion ft2) generates stable and repeating repair and remodel demand* Highly specified, high-value products with few cost-effective substitutes Customers demonstrate brand loyalty; reward performance, service and innovation Ceilings are an integral part of evolving solutions to meet increasing demand for healthy indoor spaces Uniquely Positioned to Win in an Attractive Category *Based on internal company estimates.
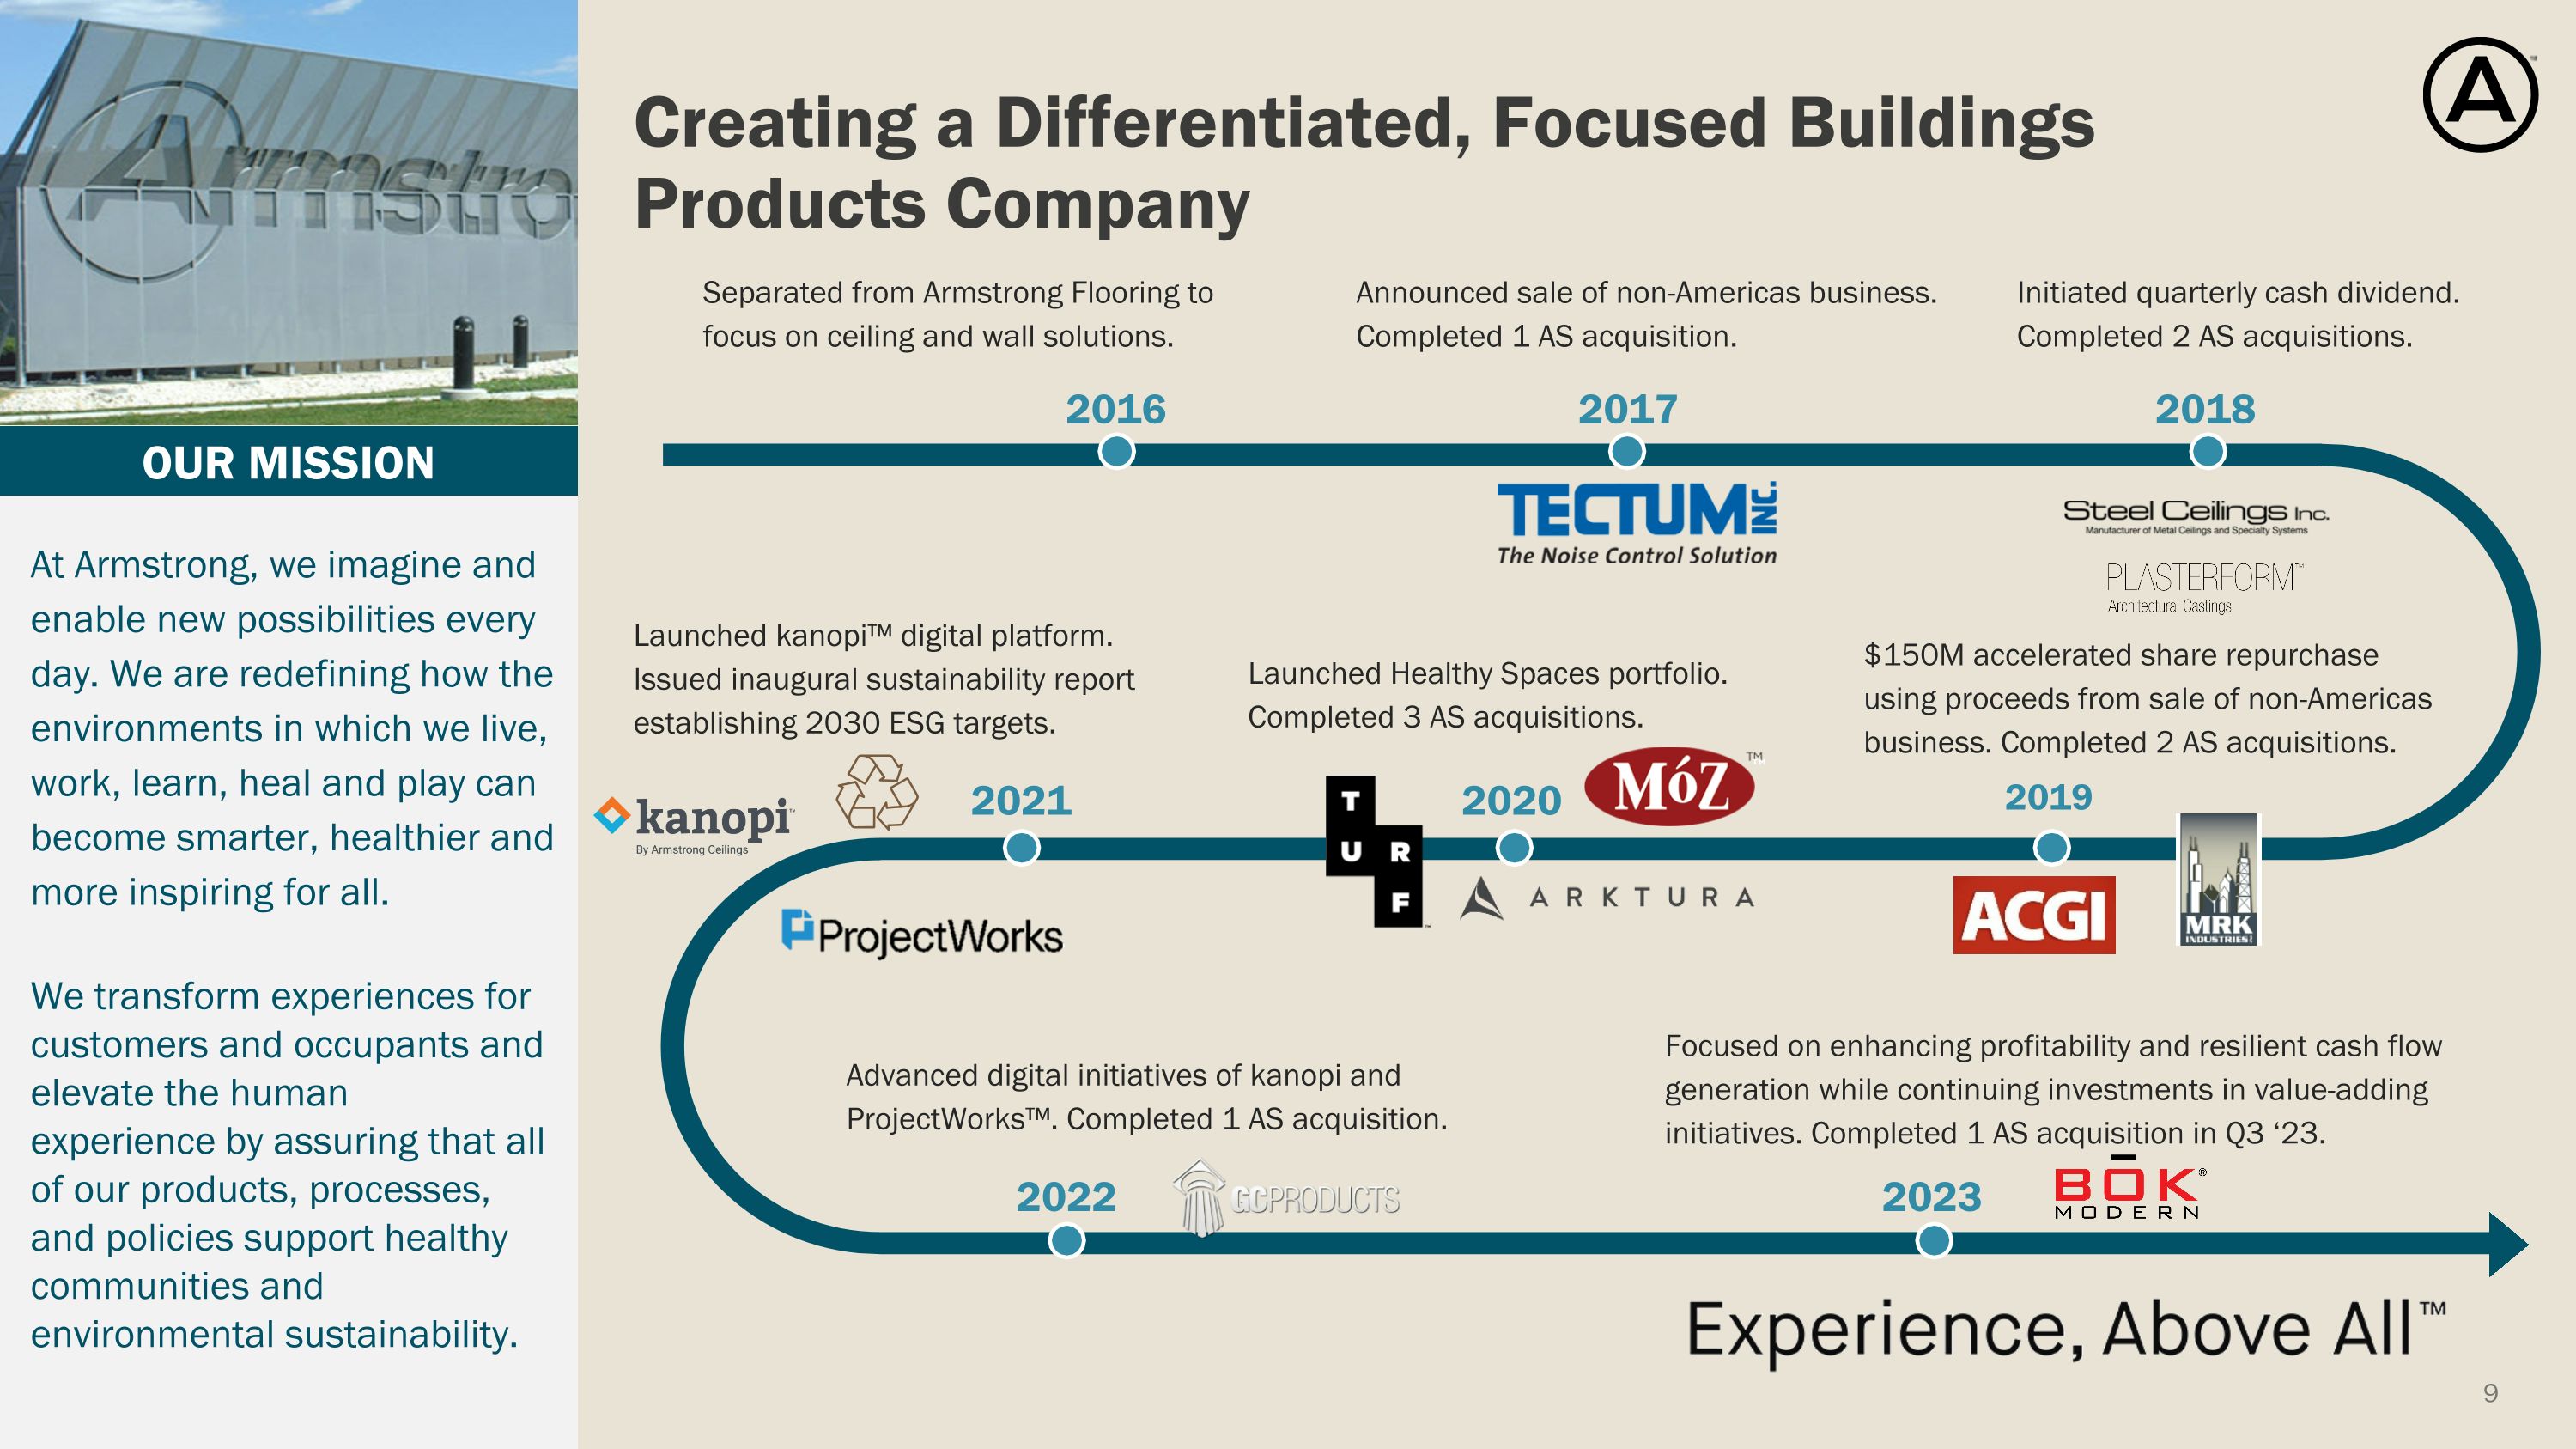
Creating a Differentiated, Focused Buildings Products Company At Armstrong, we imagine and enable new possibilities every day. We are redefining how the environments in which we live, work, learn, heal and play can become smarter, healthier and more inspiring for all. We transform experiences for customers and occupants and elevate the human experience by assuring that all of our products, processes, and policies support healthy communities and environmental sustainability. Advanced digital initiatives of kanopi and ProjectWorks™. Completed 1 AS acquisition. 2022 2021 Focused on enhancing profitability and resilient cash flow generation while continuing investments in value-adding initiatives. Completed 1 AS acquisition in Q3 ‘23. 2023 OUR MISSION 2020 2017 2019 2018 Separated from Armstrong Flooring to focus on ceiling and wall solutions. 2016 Announced sale of non-Americas business. Completed 1 AS acquisition. $150M accelerated share repurchase using proceeds from sale of non-Americas business. Completed 2 AS acquisitions. Launched Healthy Spaces portfolio. Completed 3 AS acquisitions. Launched kanopi™ digital platform. Issued inaugural sustainability report establishing 2030 ESG targets. Initiated quarterly cash dividend. Completed 2 AS acquisitions.
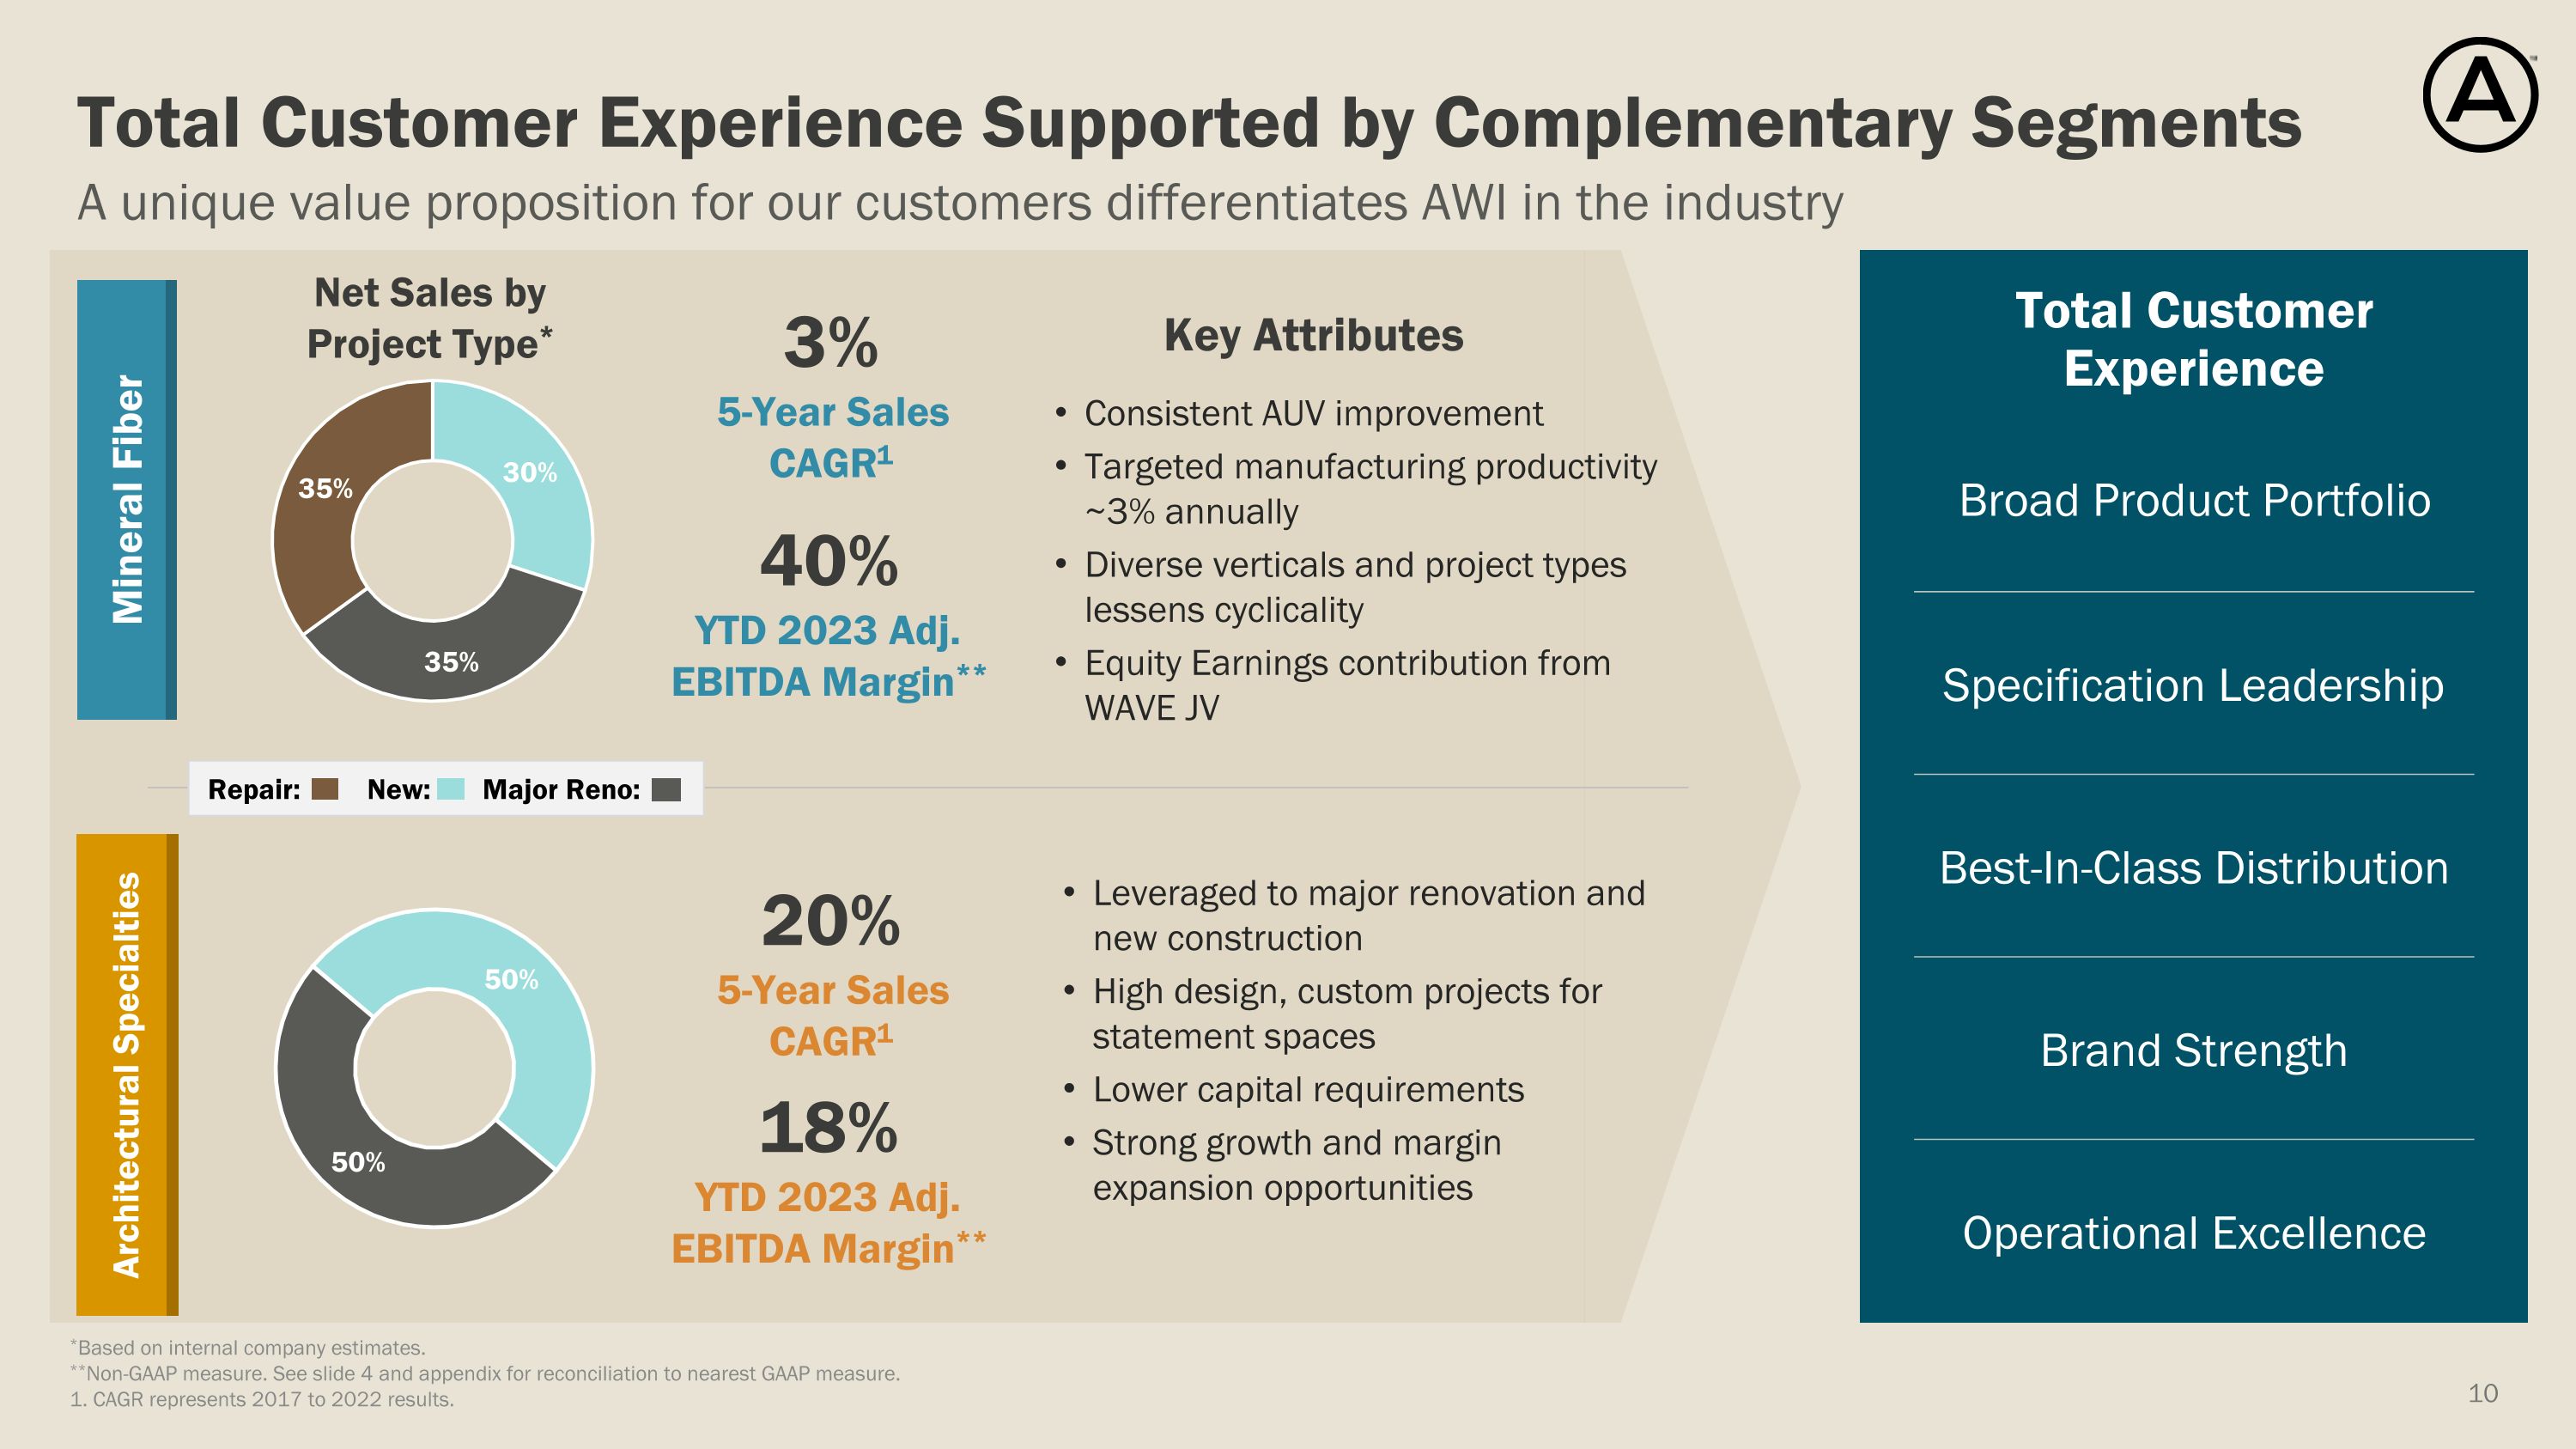
A unique value proposition for our customers differentiates AWI in the industry Total Customer Experience Supported by Complementary Segments Mineral Fiber Architectural Specialties Total Customer Experience Broad Product Portfolio Best-In-Class Distribution Brand Strength Operational Excellence Specification Leadership Key Attributes 40% YTD 2023 Adj. EBITDA Margin** 18% YTD 2023 Adj. EBITDA Margin** Net Sales by Project Type* Consistent AUV improvement Targeted manufacturing productivity ~3% annually Diverse verticals and project types lessens cyclicality Equity Earnings contribution from WAVE JV Leveraged to major renovation and new construction High design, custom projects for statement spaces Lower capital requirements Strong growth and margin expansion opportunities *Based on internal company estimates. **Non-GAAP measure. See slide 4 and appendix for reconciliation to nearest GAAP measure. 1. CAGR represents 2017 to 2022 results. Repair: New: Major Reno: 3% 5-Year Sales CAGR1 20% 5-Year Sales CAGR1
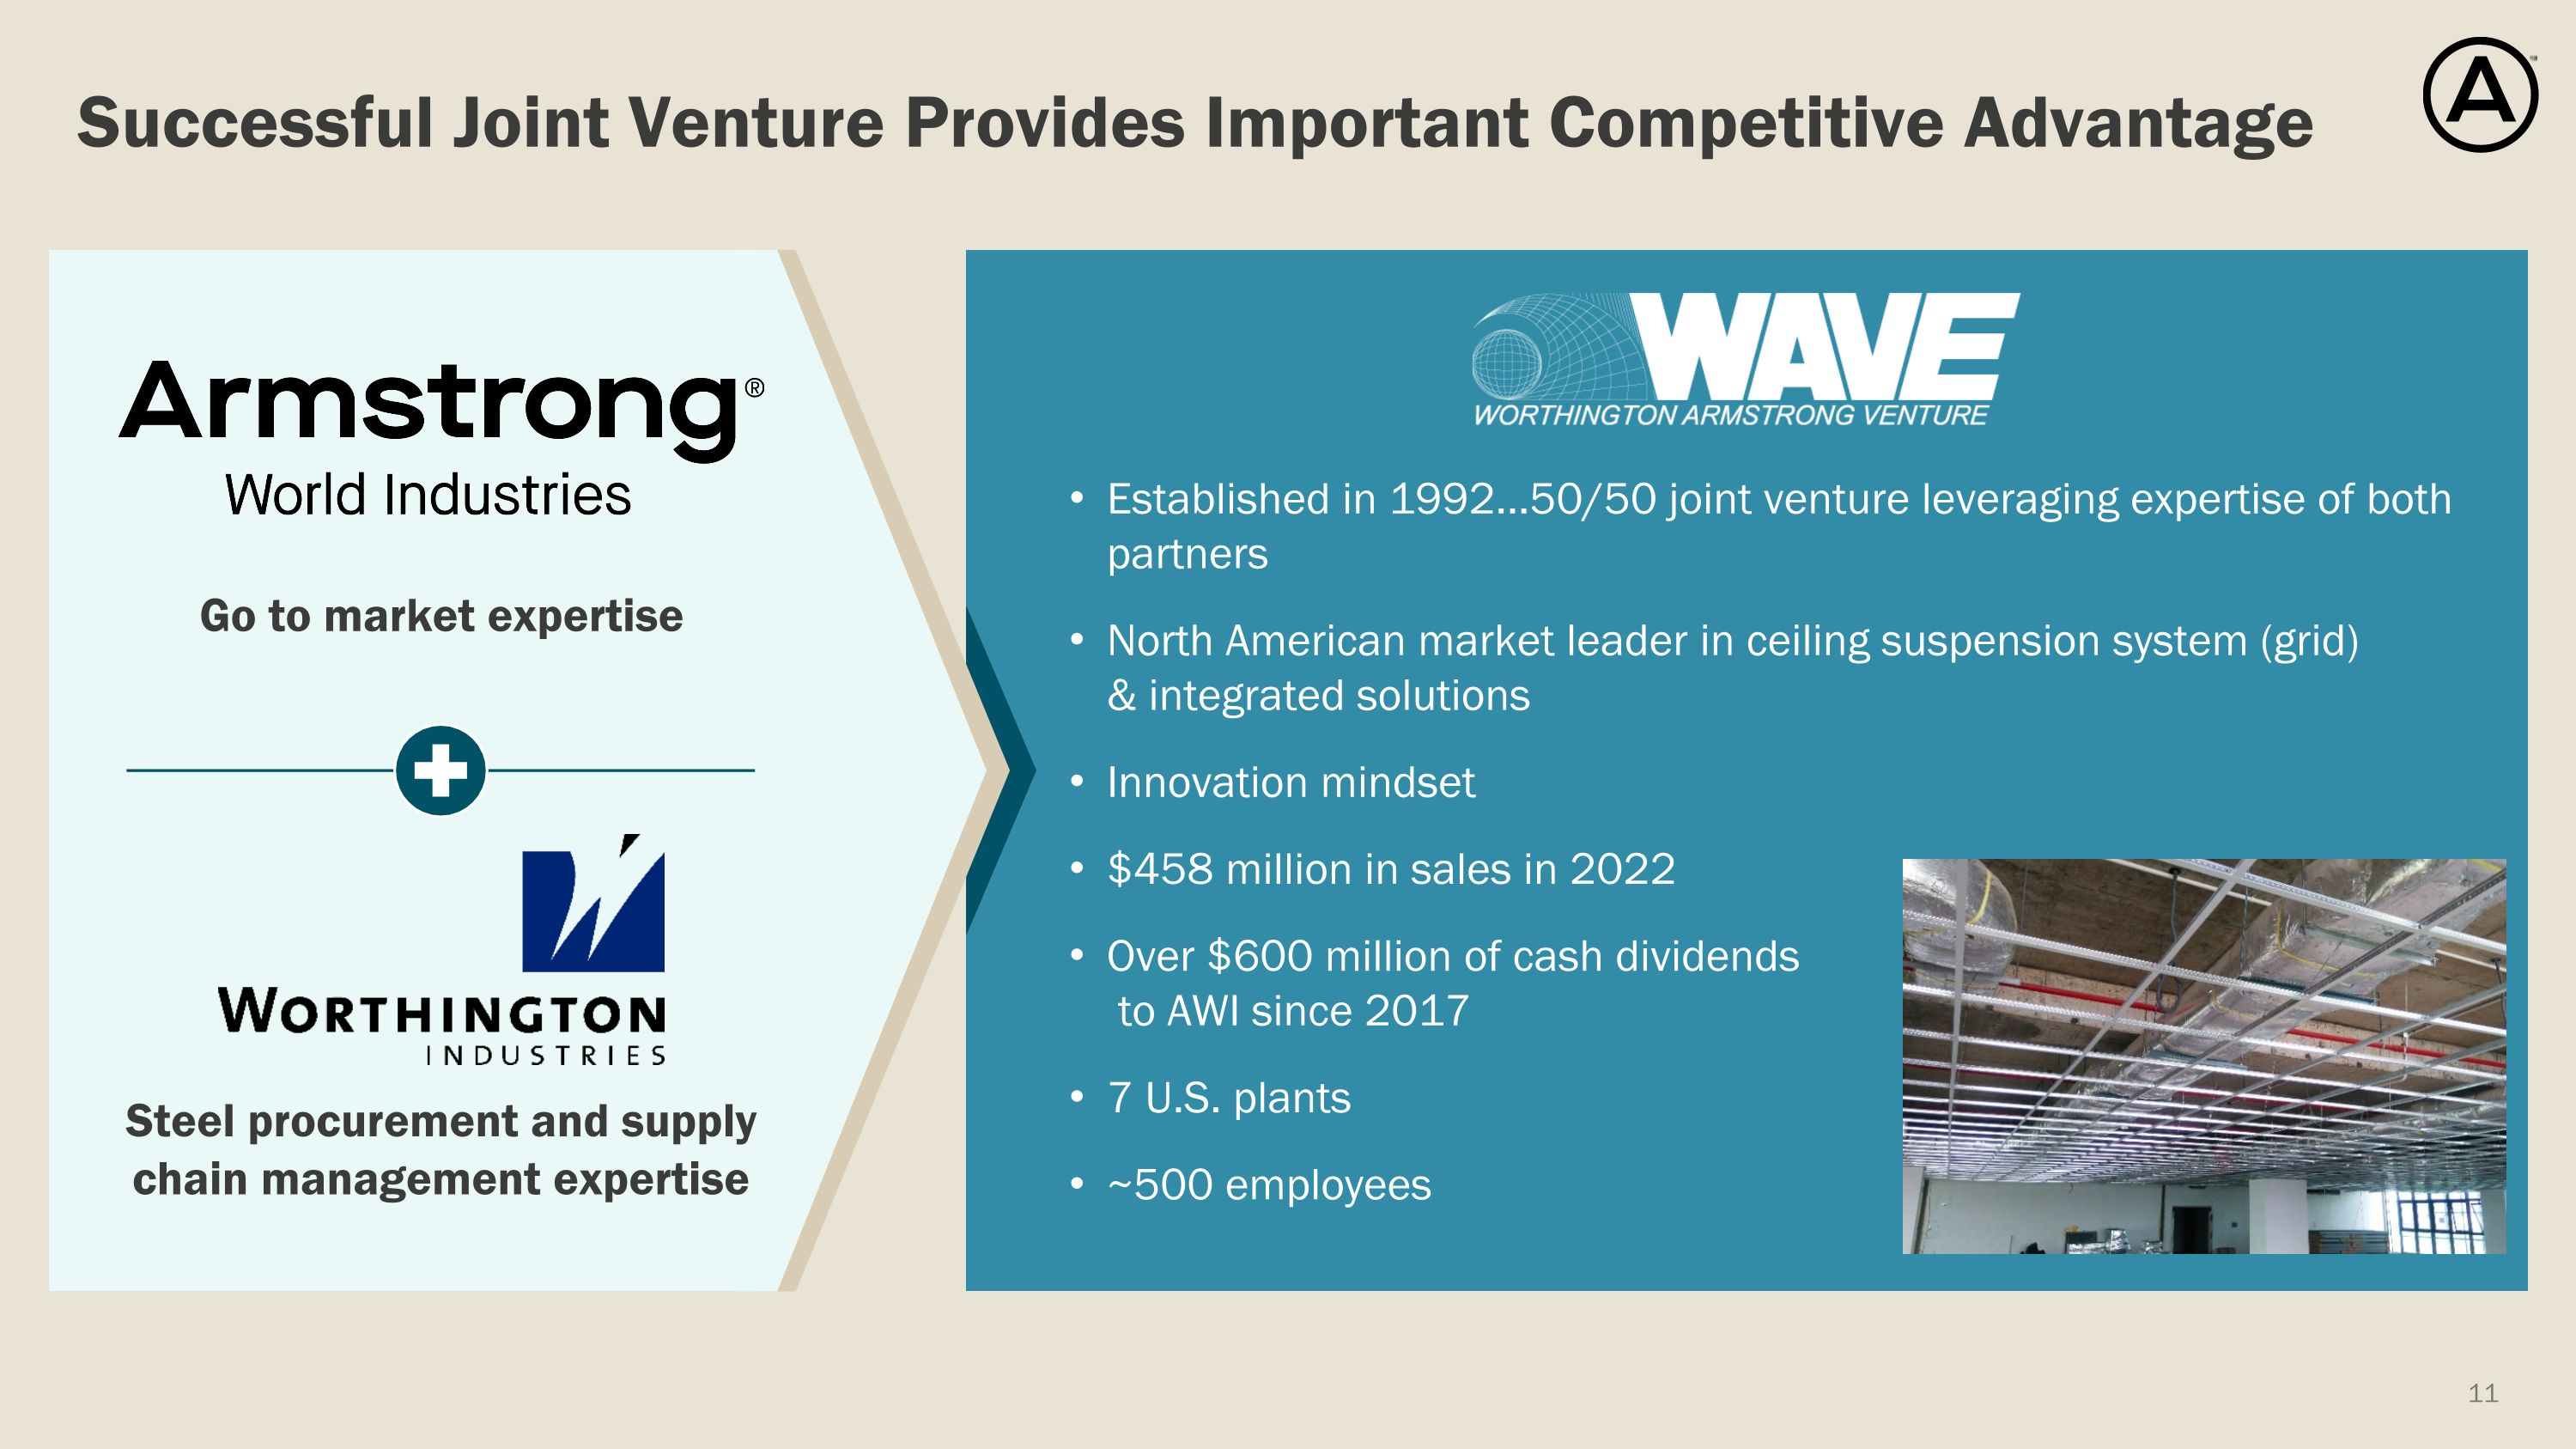
Successful Joint Venture Provides Important Competitive Advantage Go to market expertise Steel procurement and supply chain management expertise Established in 1992…50/50 joint venture leveraging expertise of both partners North American market leader in ceiling suspension system (grid) & integrated solutions Innovation mindset $458 million in sales in 2022 Over $600 million of cash dividends to AWI since 2017 7 U.S. plants ~500 employees
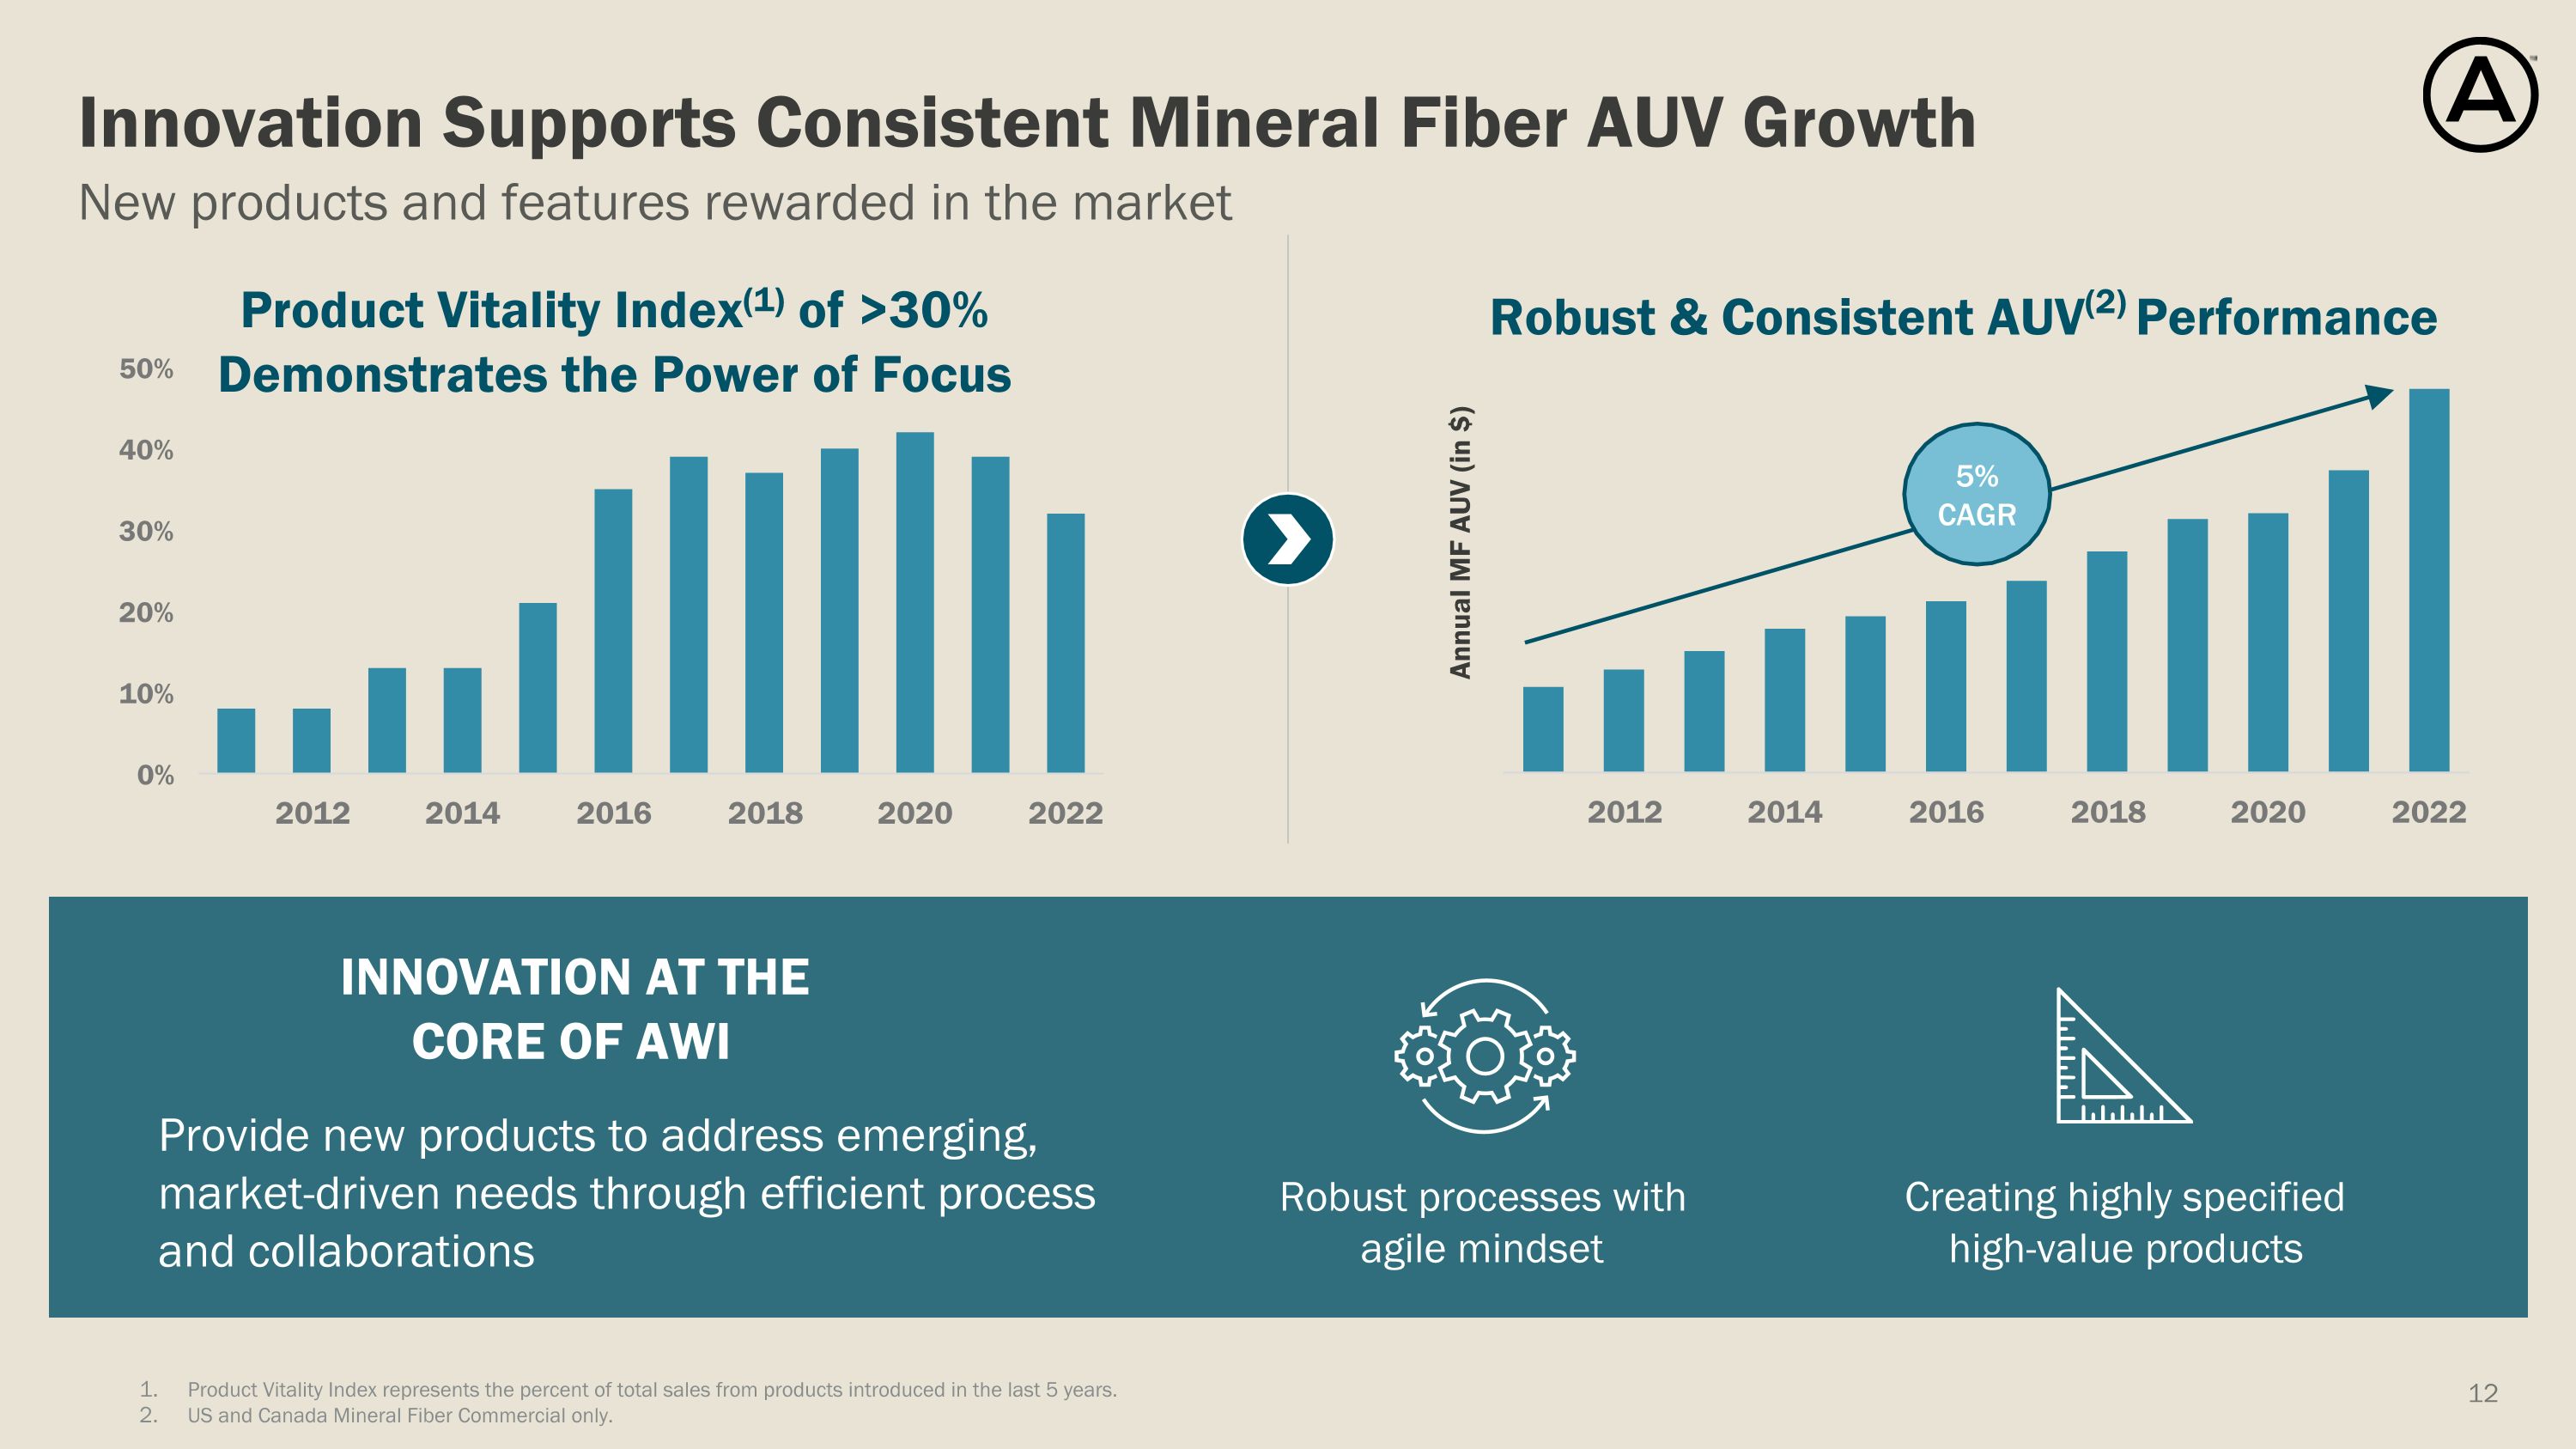
New products and features rewarded in the market Innovation Supports Consistent Mineral Fiber AUV Growth Robust & Consistent AUV(2) Performance Annual MF AUV (in $) Product Vitality Index(1) of >30% Demonstrates the Power of Focus Robust processes with agile mindset Creating highly specified high-value products Product Vitality Index represents the percent of total sales from products introduced in the last 5 years. US and Canada Mineral Fiber Commercial only. Provide new products to address emerging, market-driven needs through efficient process and collaborations INNOVATION AT THE CORE OF AWI 5% CAGR
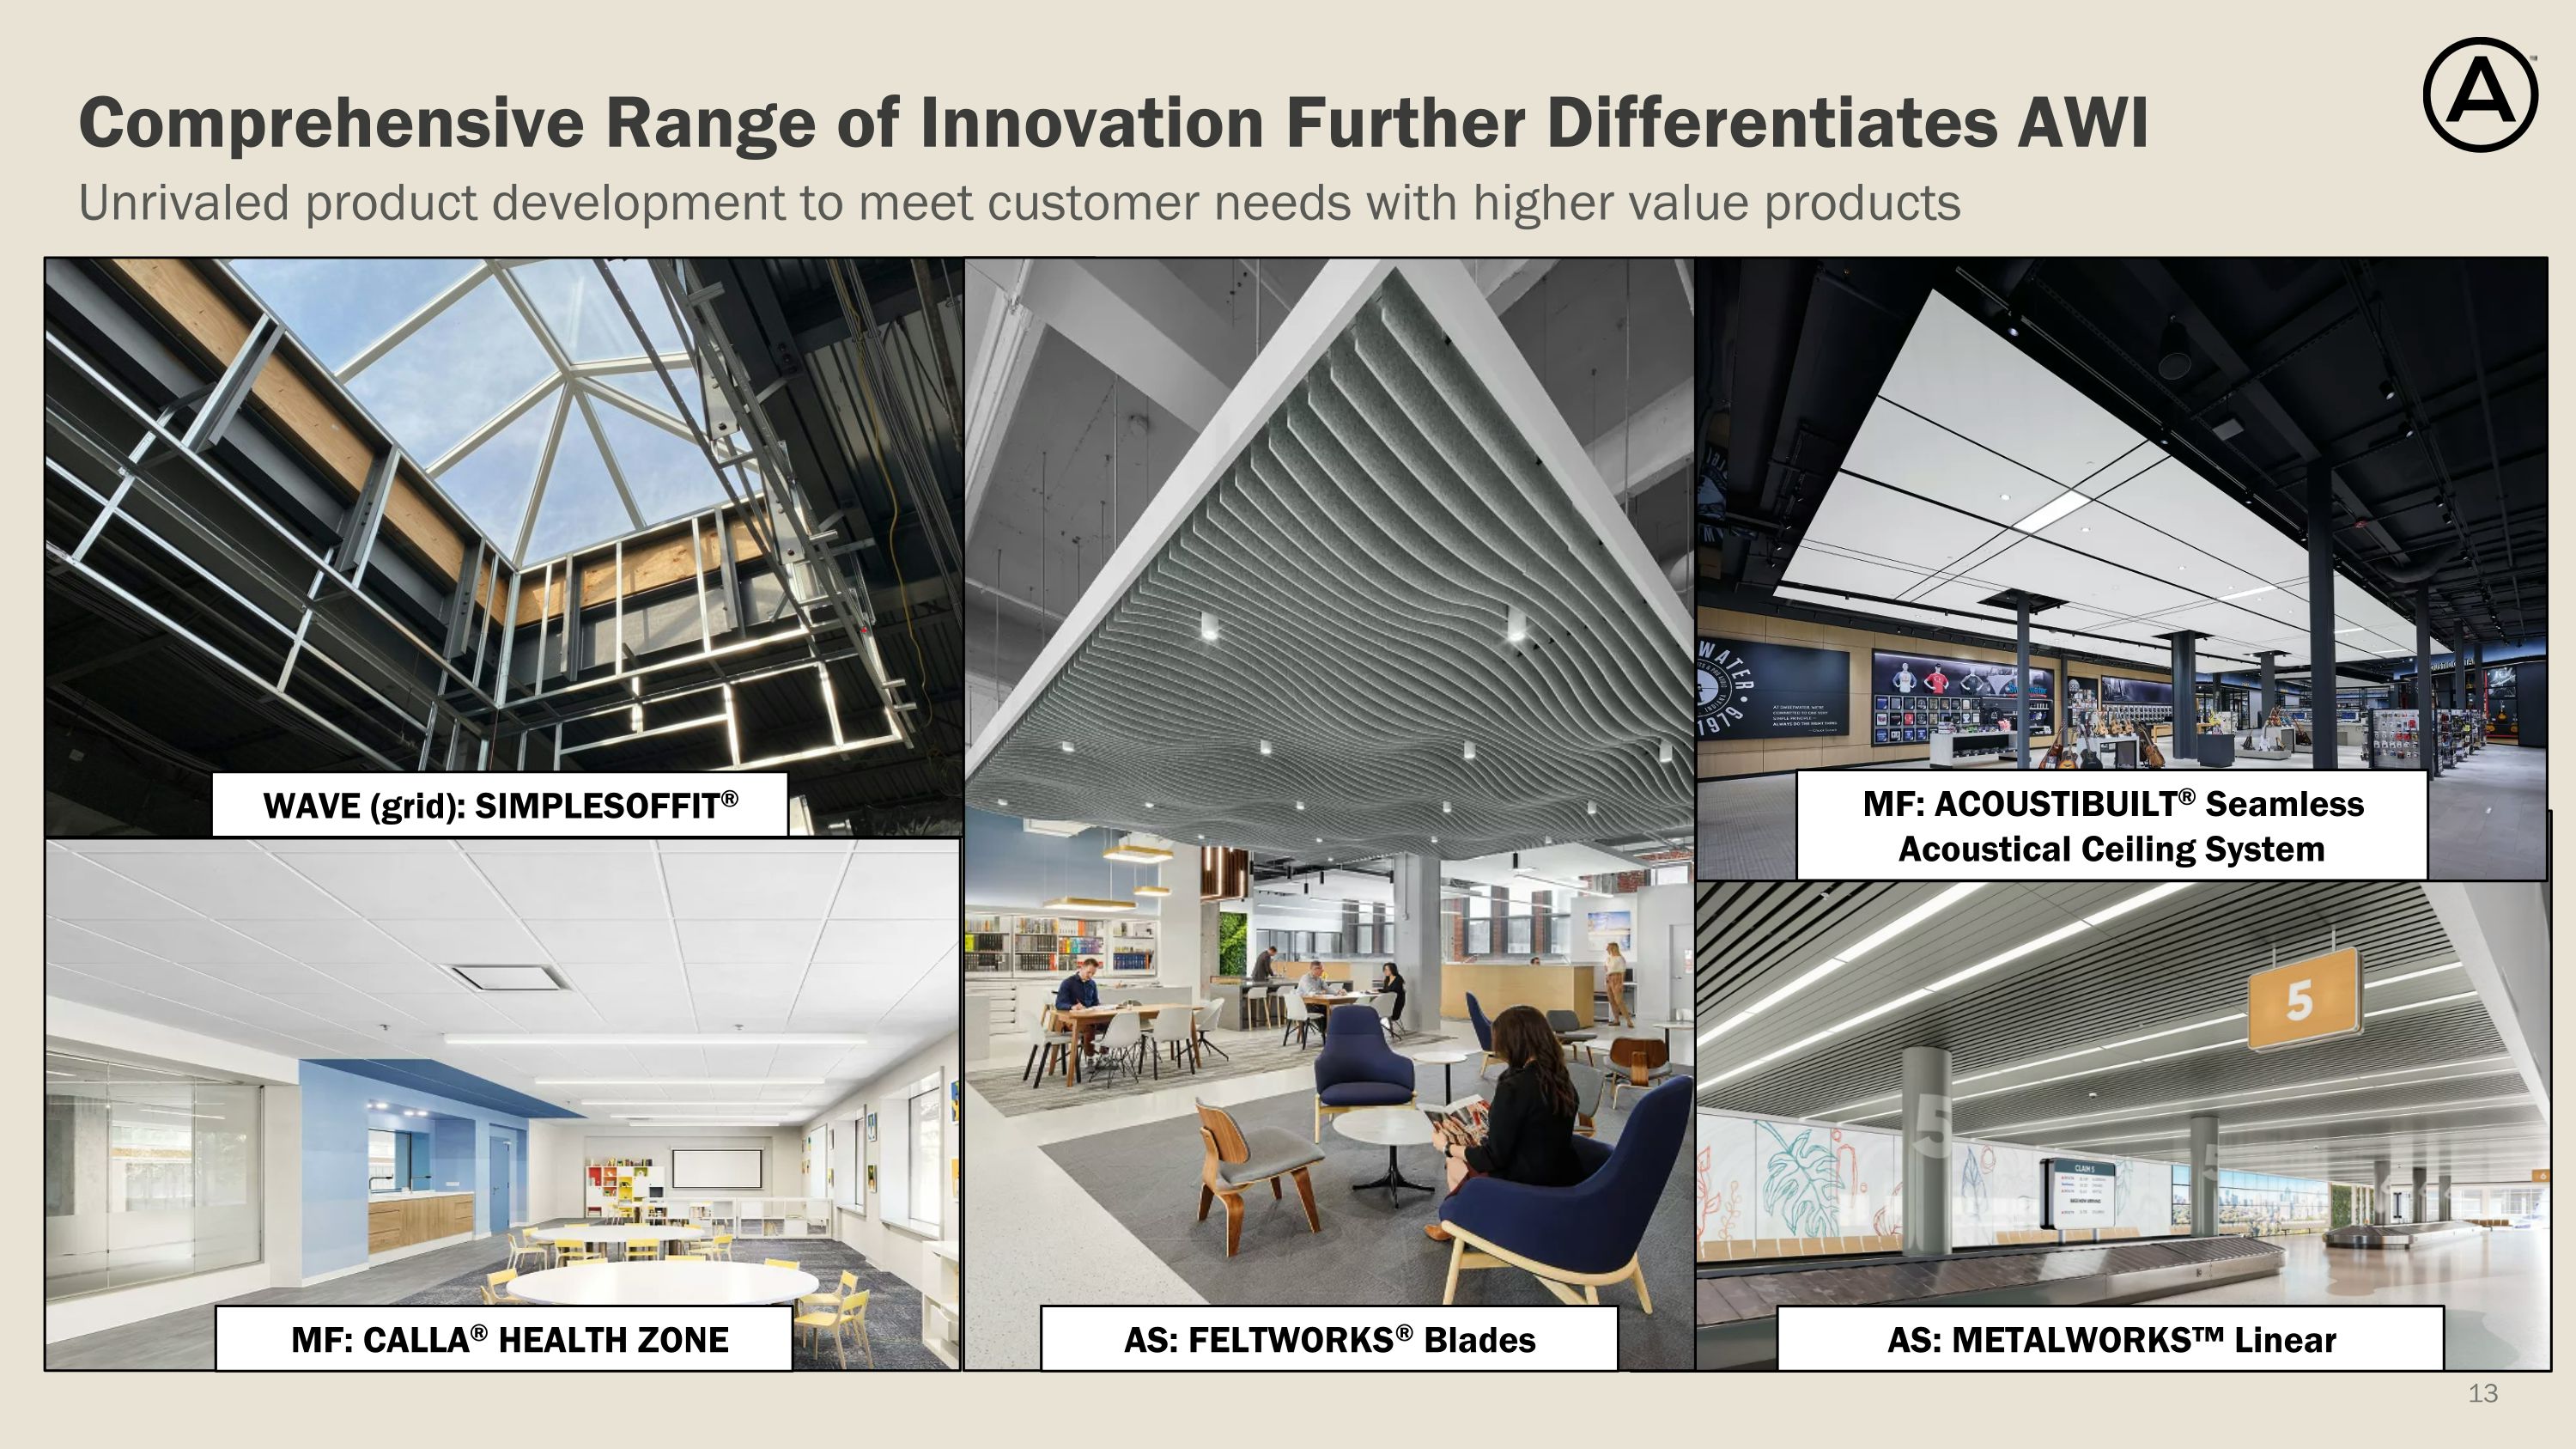
AS: METALWORKS™ Linear Unrivaled product development to meet customer needs with higher value products Comprehensive Range of Innovation Further Differentiates AWI AS: FELTWORKS® Blades WAVE (grid): SIMPLESOFFIT® MF: ACOUSTIBUILT® Seamless Acoustical Ceiling System MF: CALLA® HEALTH ZONE
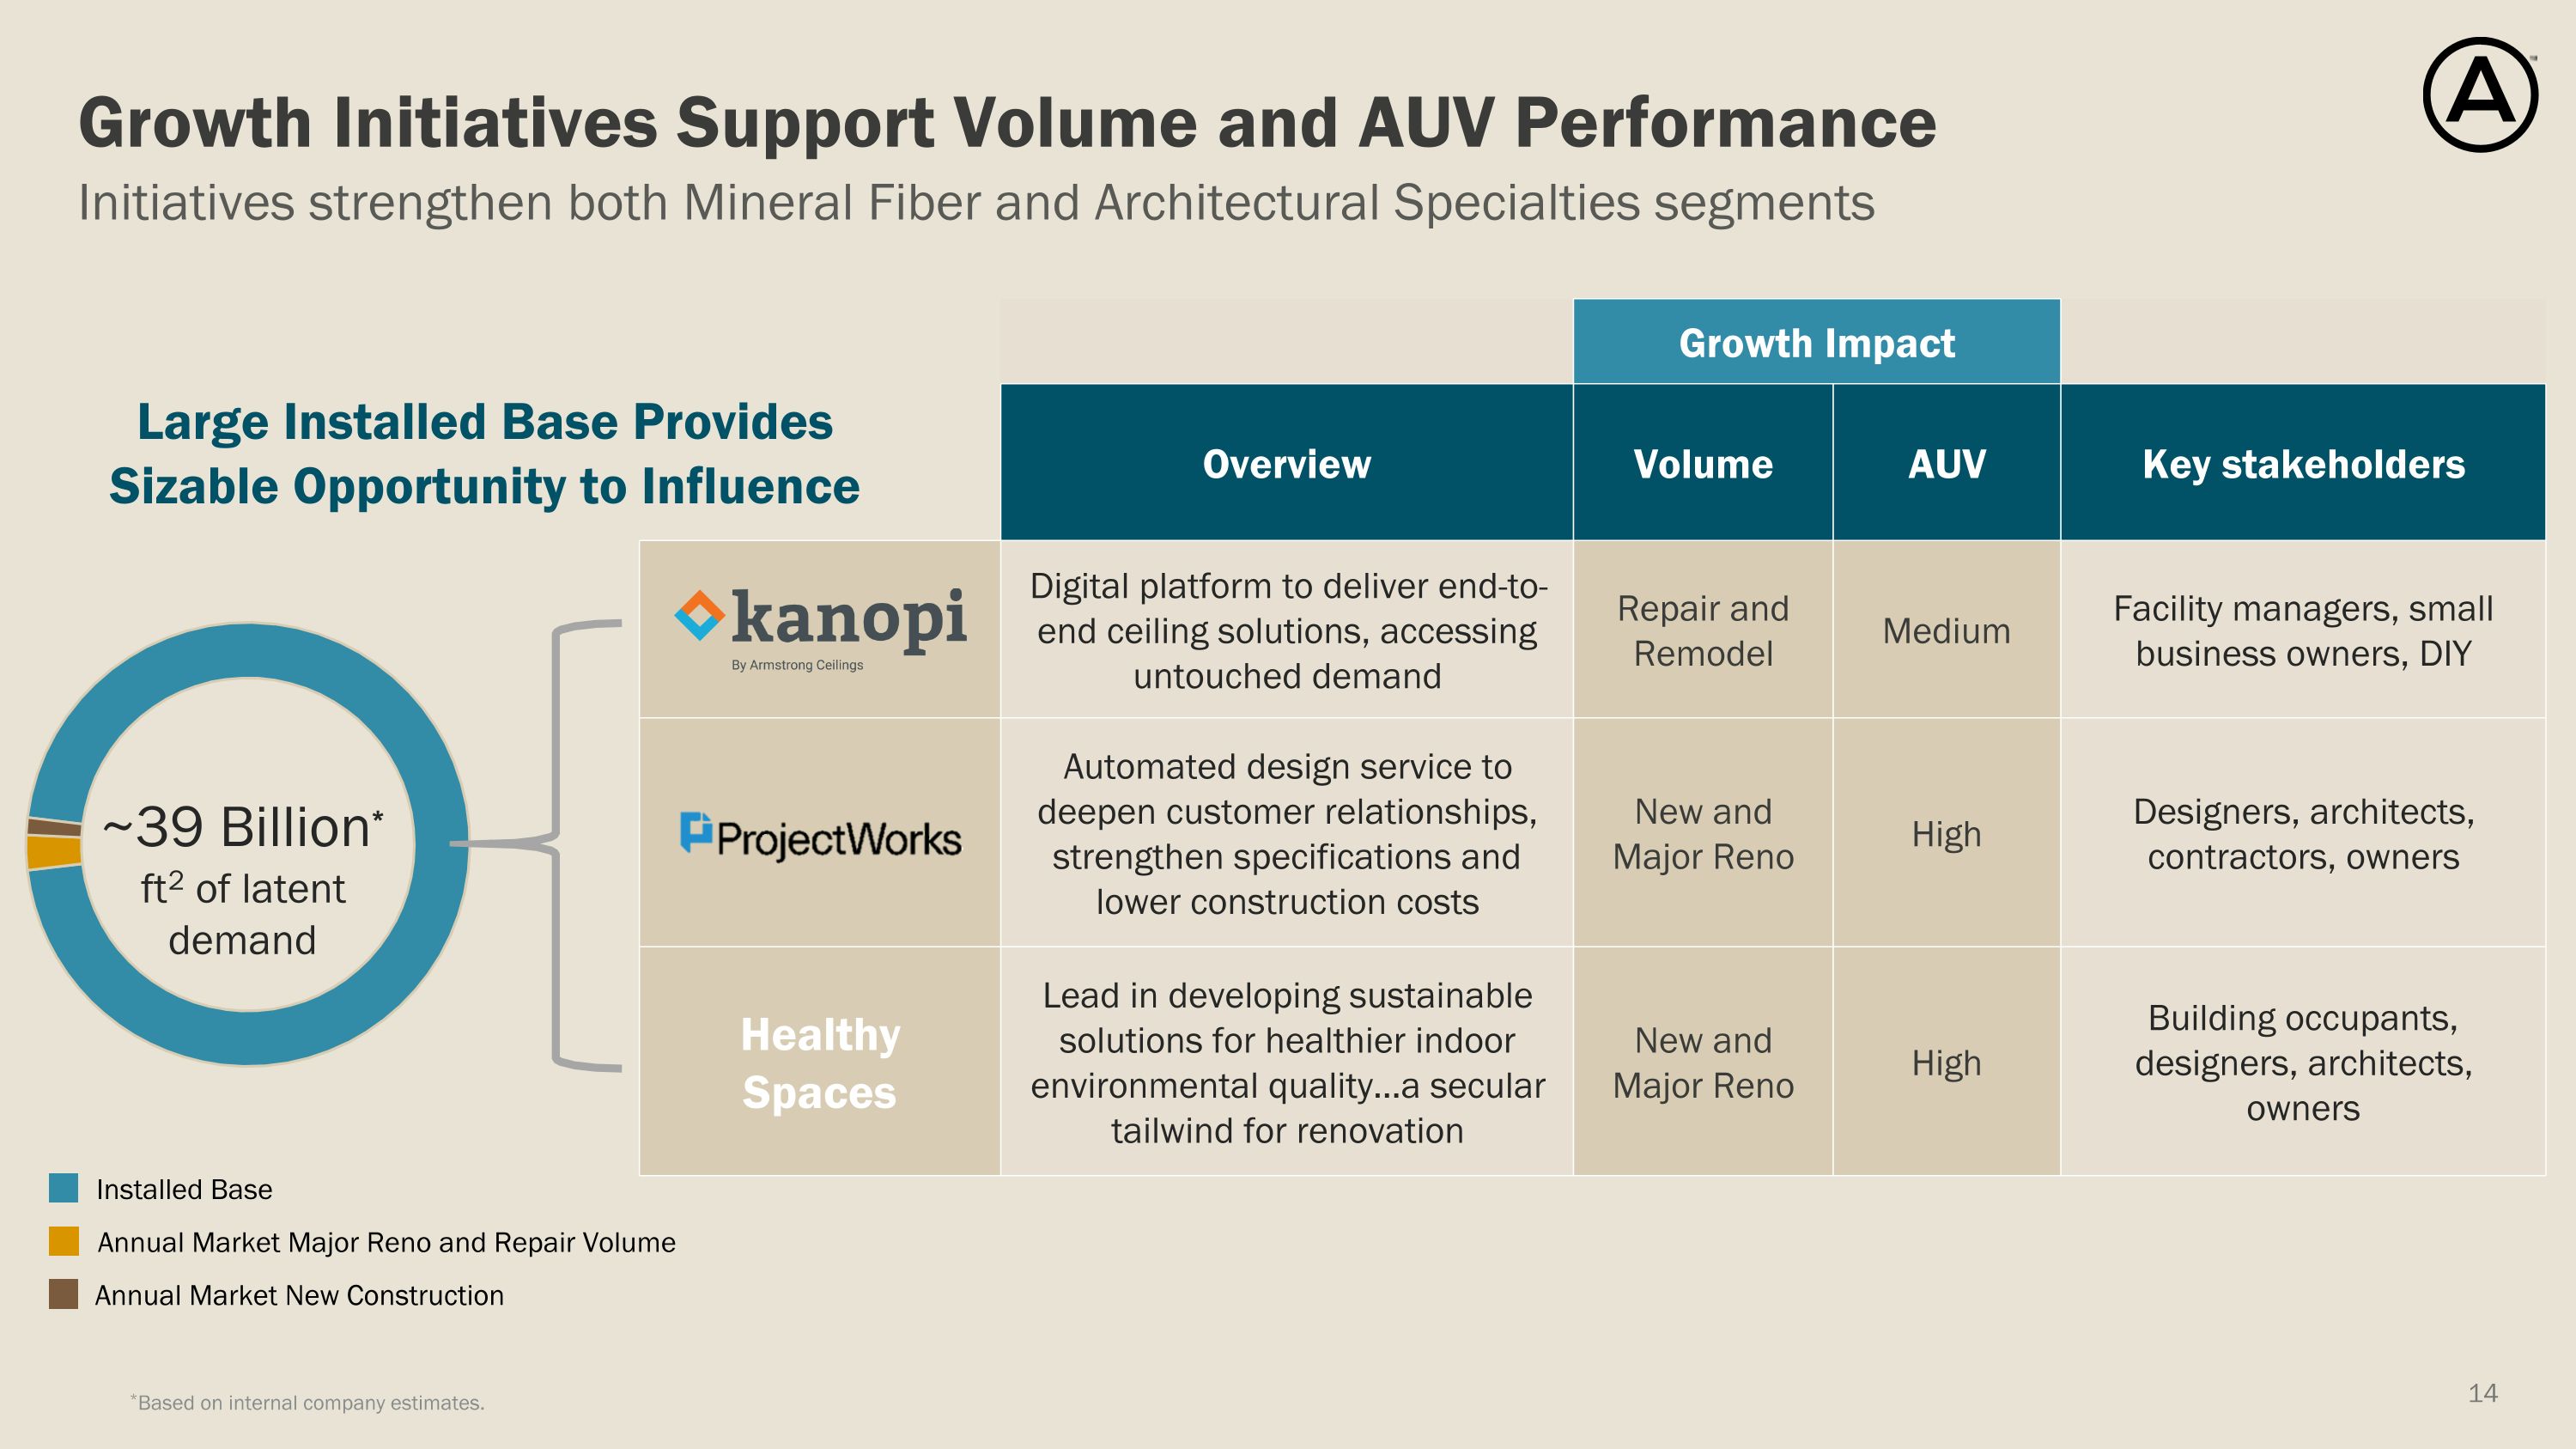
Initiatives strengthen both Mineral Fiber and Architectural Specialties segments Growth Initiatives Support Volume and AUV Performance Growth Impact Overview Volume AUV Key stakeholders Digital platform to deliver end-to-end ceiling solutions, accessing untouched demand Repair and Remodel Medium Facility managers, small business owners, DIY Automated design service to deepen customer relationships, strengthen specifications and lower construction costs New and Major Reno High Designers, architects, contractors, owners Healthy Spaces Lead in developing sustainable solutions for healthier indoor environmental quality…a secular tailwind for renovation New and Major Reno High Building occupants, designers, architects, owners Annual Market New Construction Annual Market Major Reno and Repair Volume Installed Base ~39 Billion* ft2 of latent demand Large Installed Base Provides Sizable Opportunity to Influence *Based on internal company estimates.
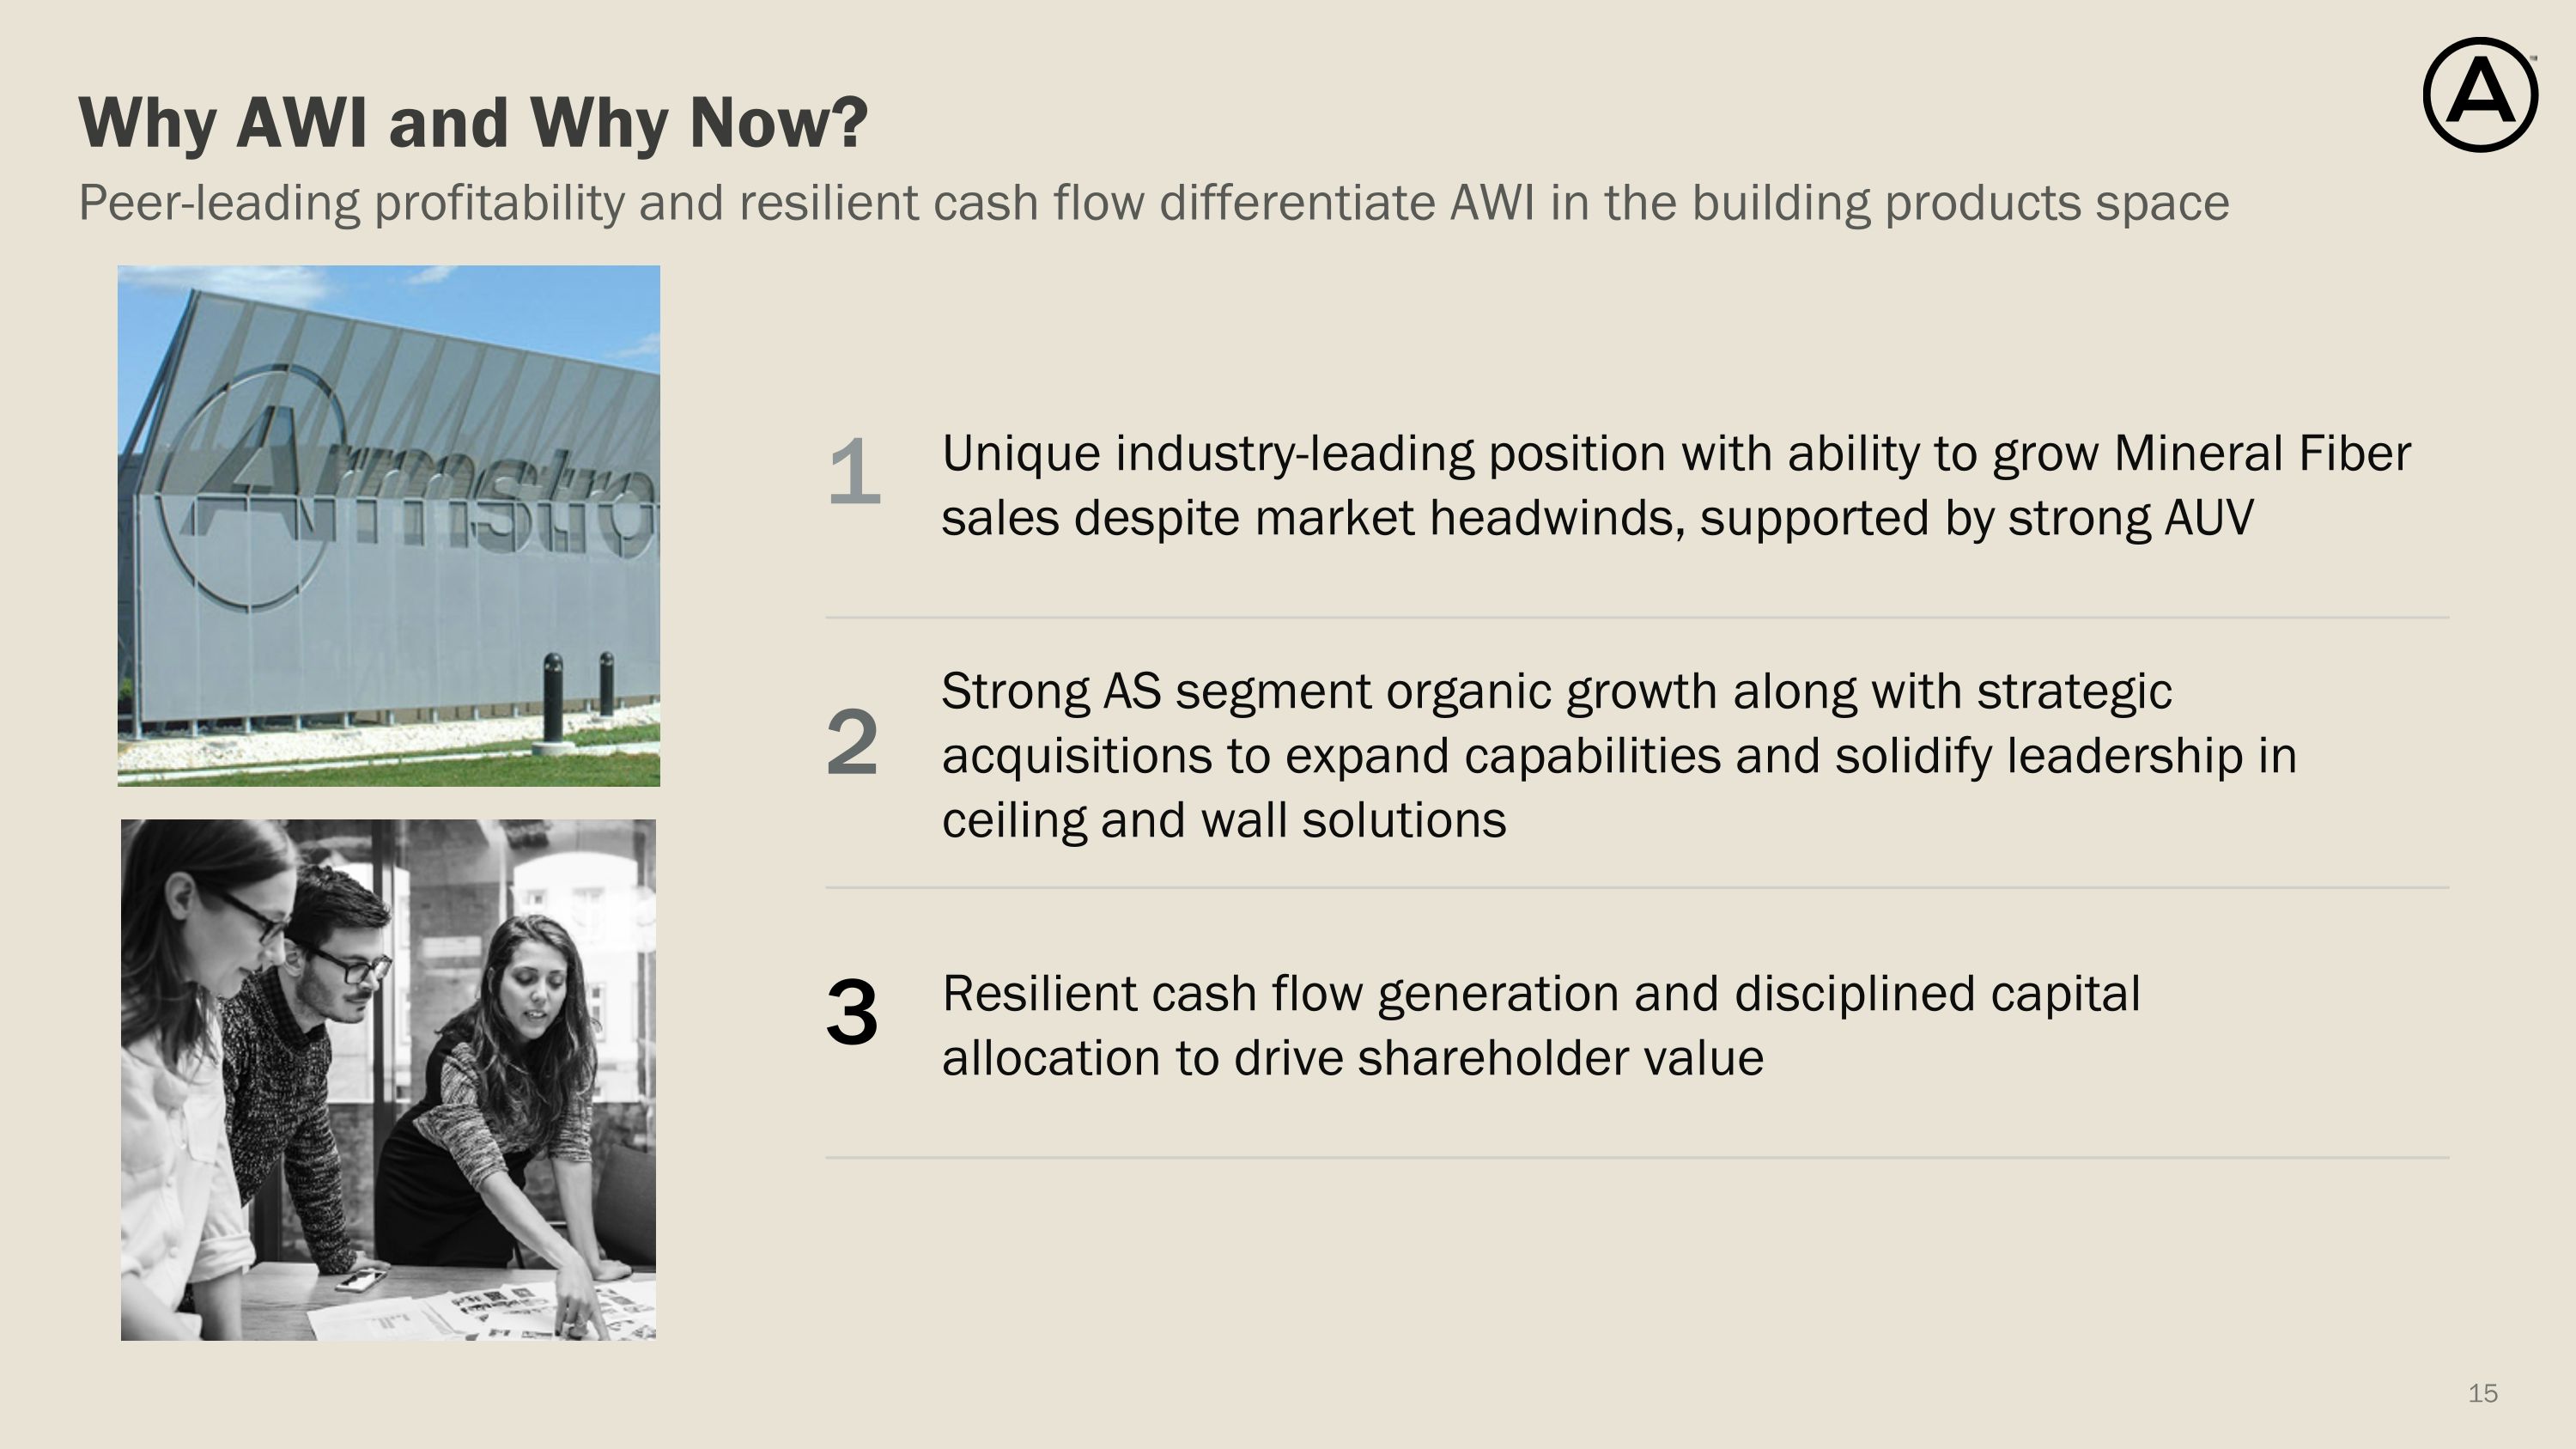
Peer-leading profitability and resilient cash flow differentiate AWI in the building products space Why AWI and Why Now? Unique industry-leading position with ability to grow Mineral Fiber sales despite market headwinds, supported by strong AUV 1 Strong AS segment organic growth along with strategic acquisitions to expand capabilities and solidify leadership in ceiling and wall solutions 2 Resilient cash flow generation and disciplined capital allocation to drive shareholder value 3
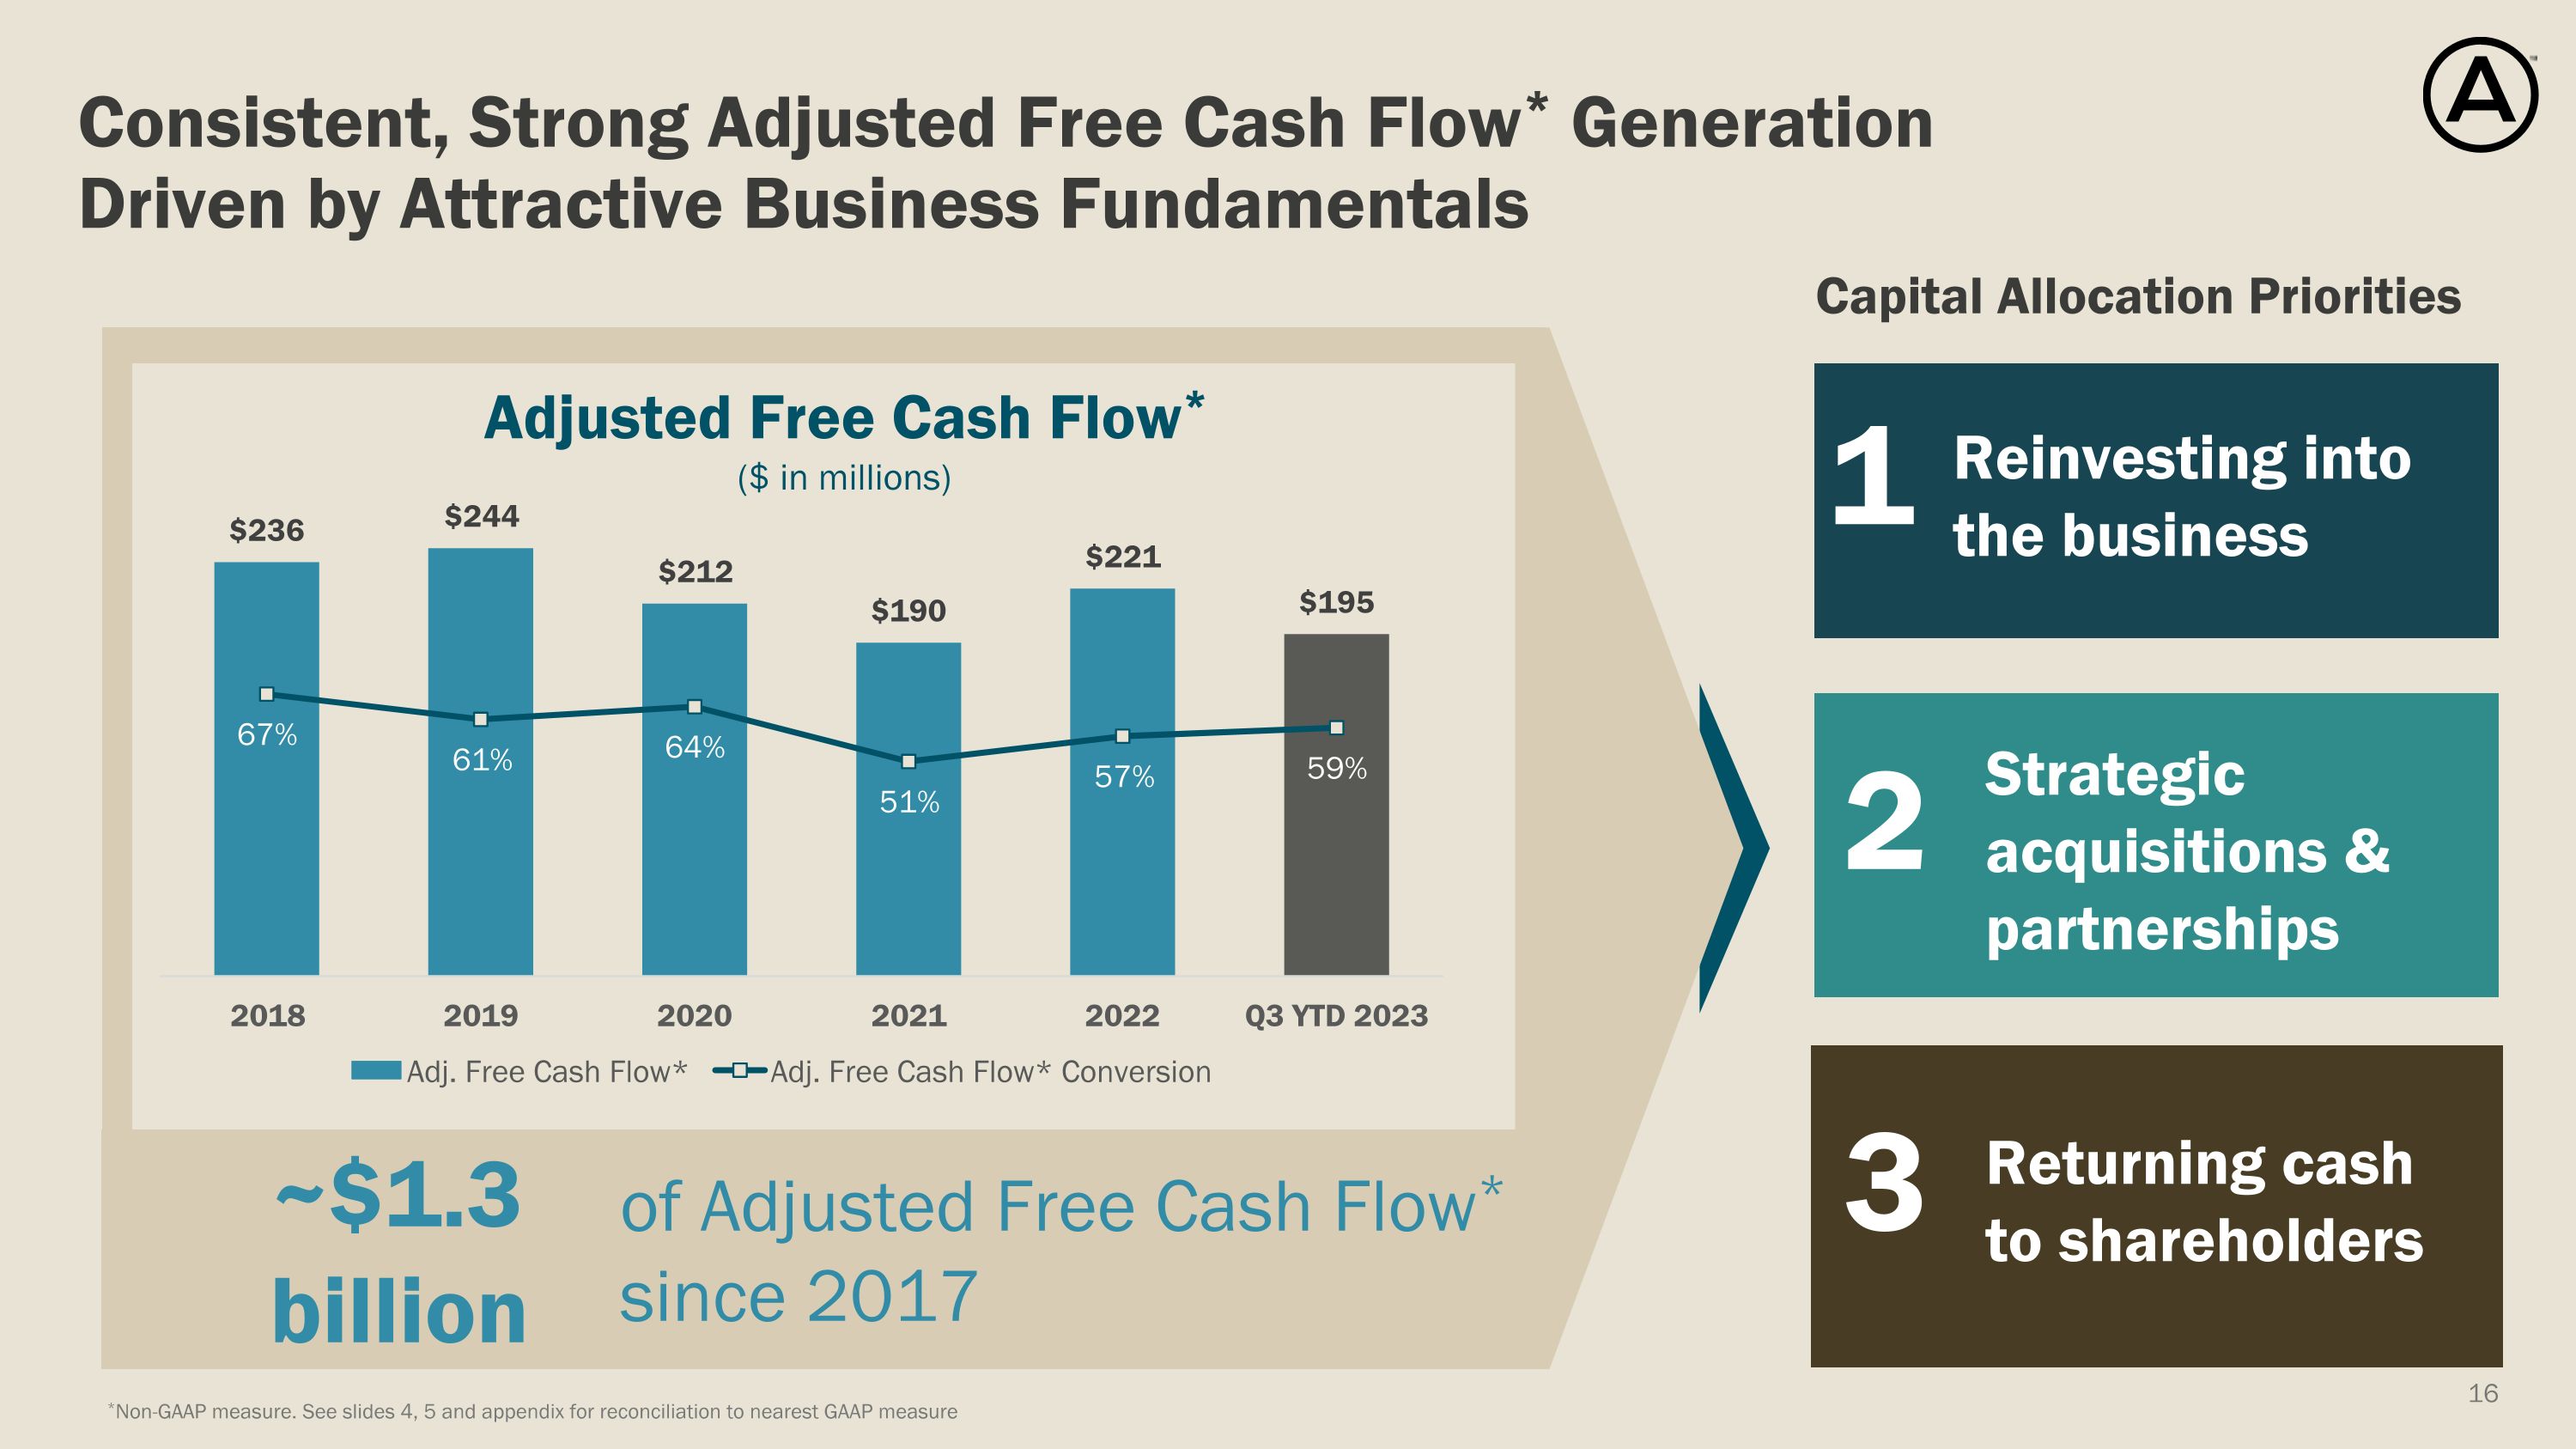
Consistent, Strong Adjusted Free Cash Flow* Generation Driven by Attractive Business Fundamentals Adjusted Free Cash Flow* ($ in millions) of Adjusted Free Cash Flow* since 2017 *Non-GAAP measure. See slides 4, 5 and appendix for reconciliation to nearest GAAP measure Reinvesting into the business 1 Strategic acquisitions & partnerships 2 Returning cash to shareholders 3 Capital Allocation Priorities ~$1.3 billion
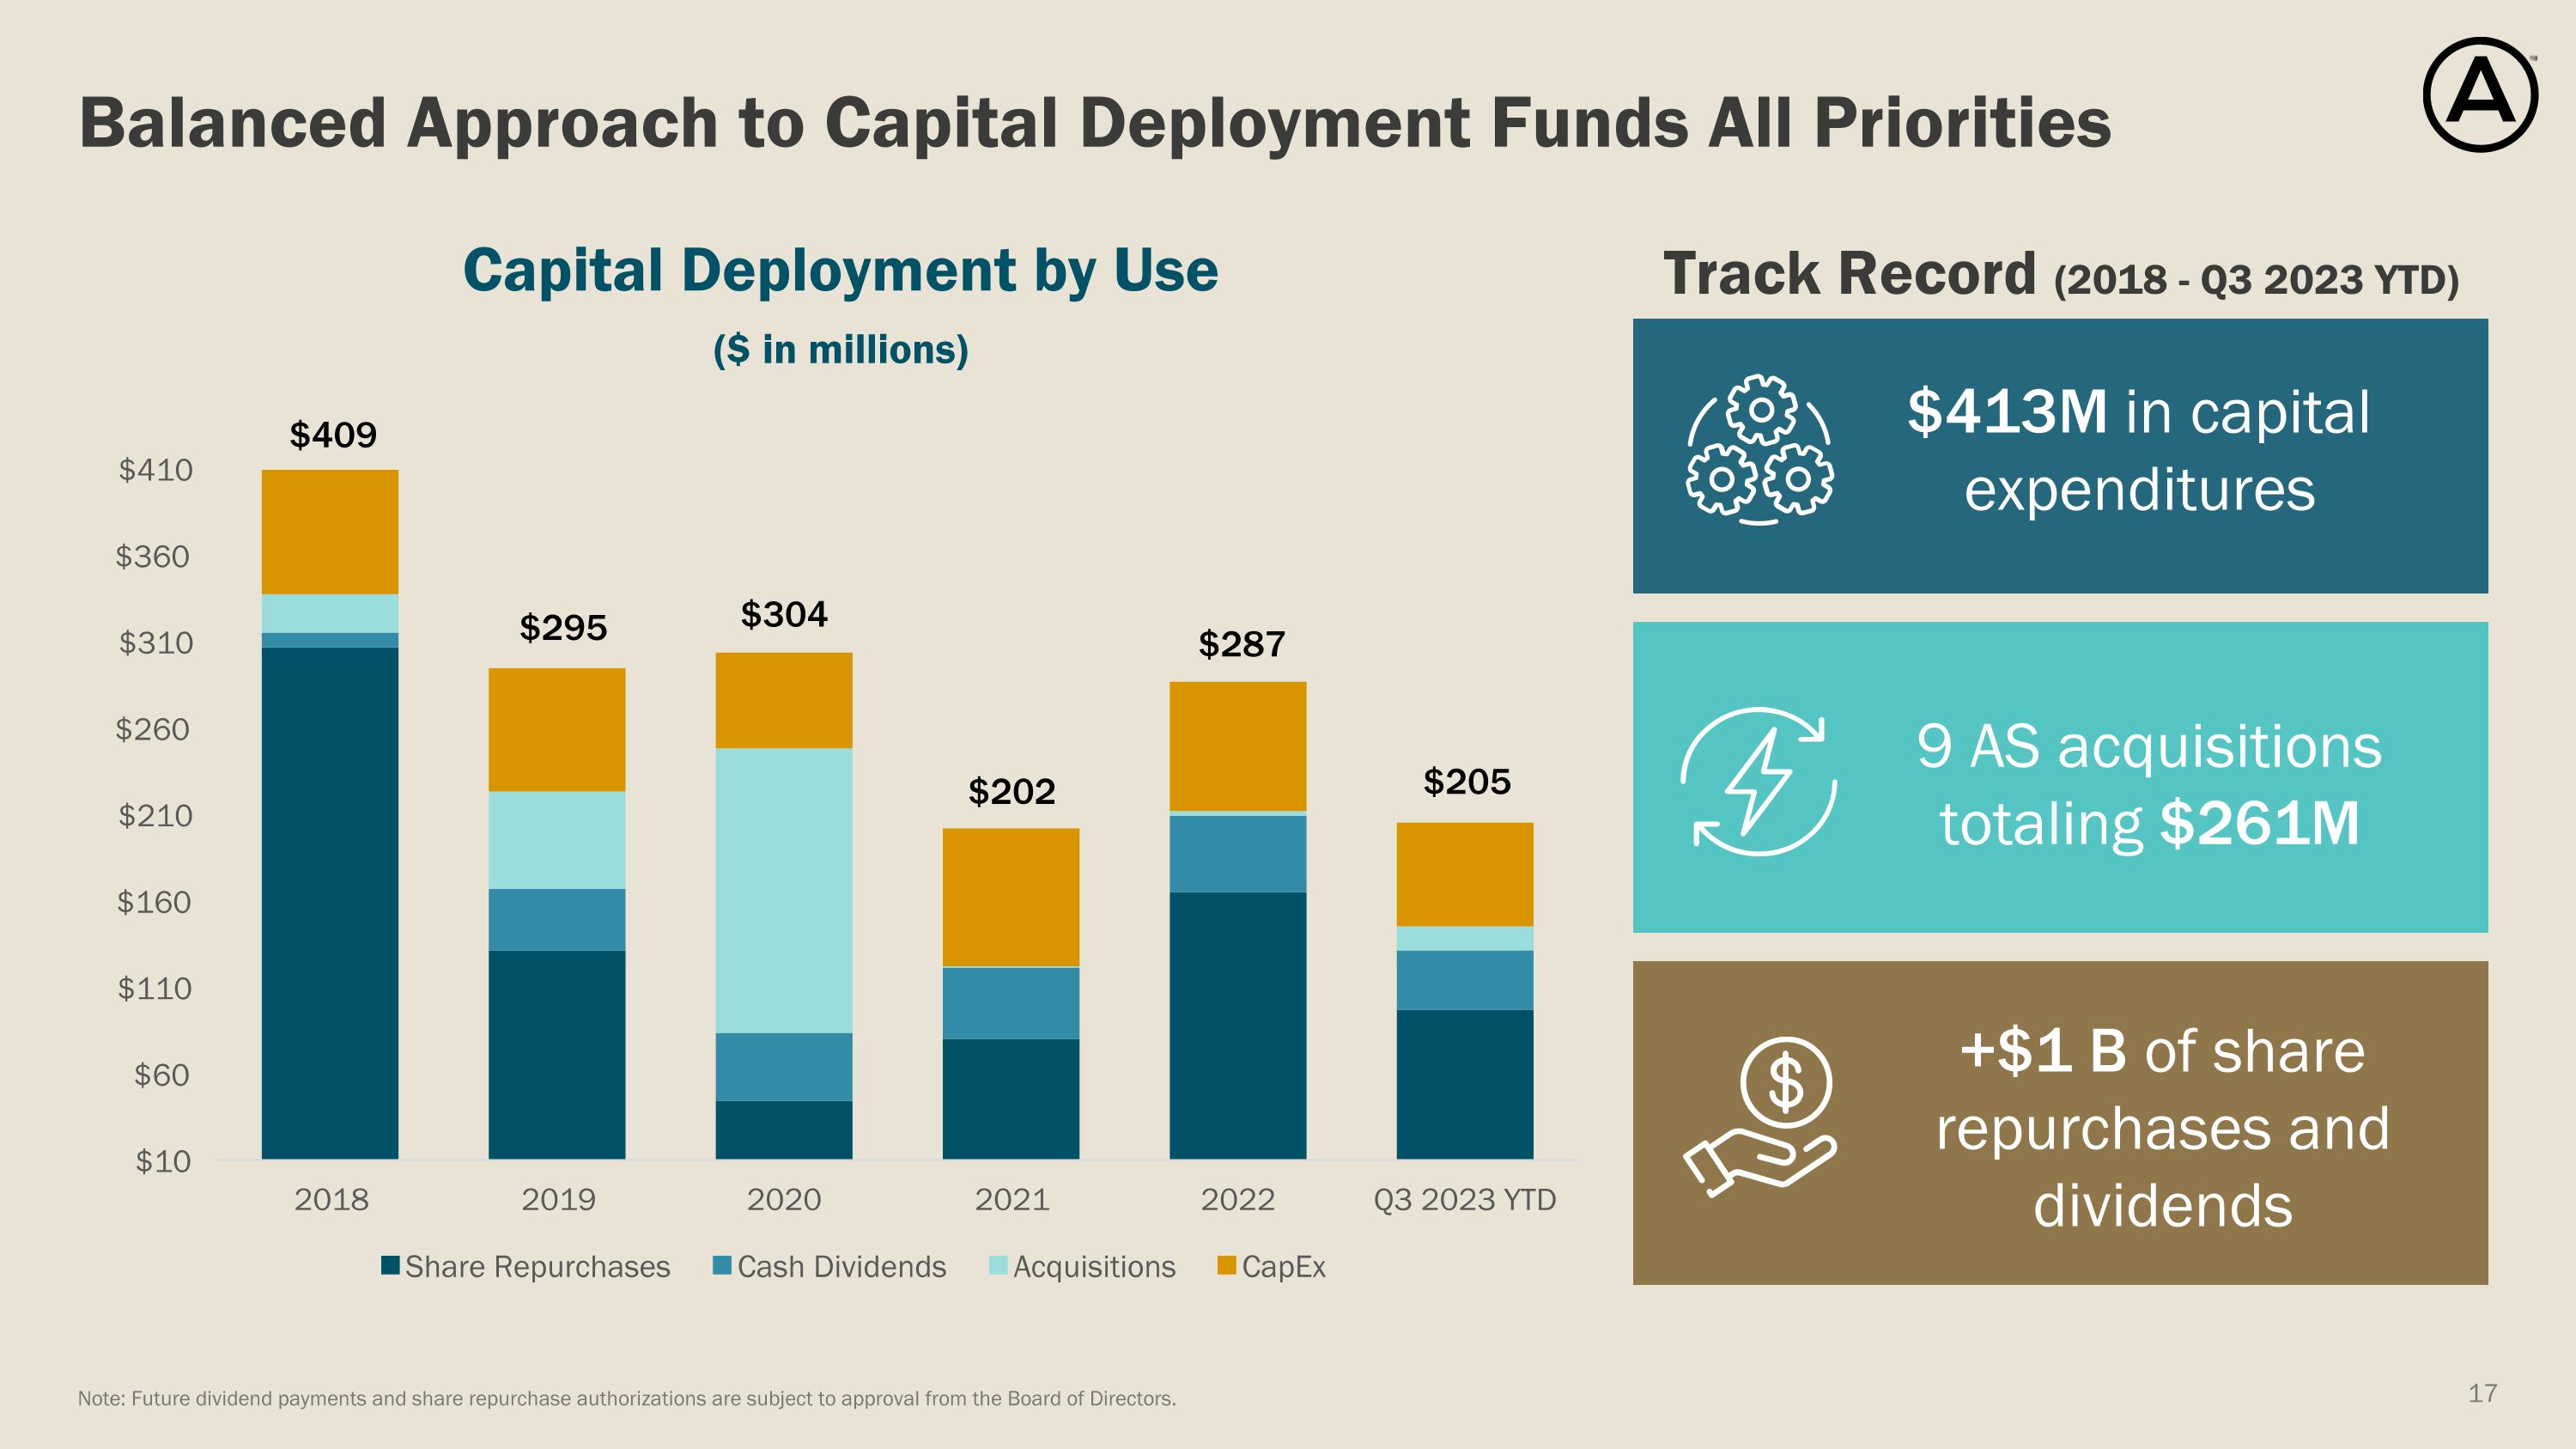
Balanced Approach to Capital Deployment Funds All Priorities Note: Future dividend payments and share repurchase authorizations are subject to approval from the Board of Directors. +$1 B of share repurchases and dividends 9 AS acquisitions totaling $261M Track Record (2018 - Q3 2023 YTD) $413M in capital expenditures $409 $295 $304 $202 $287 $205
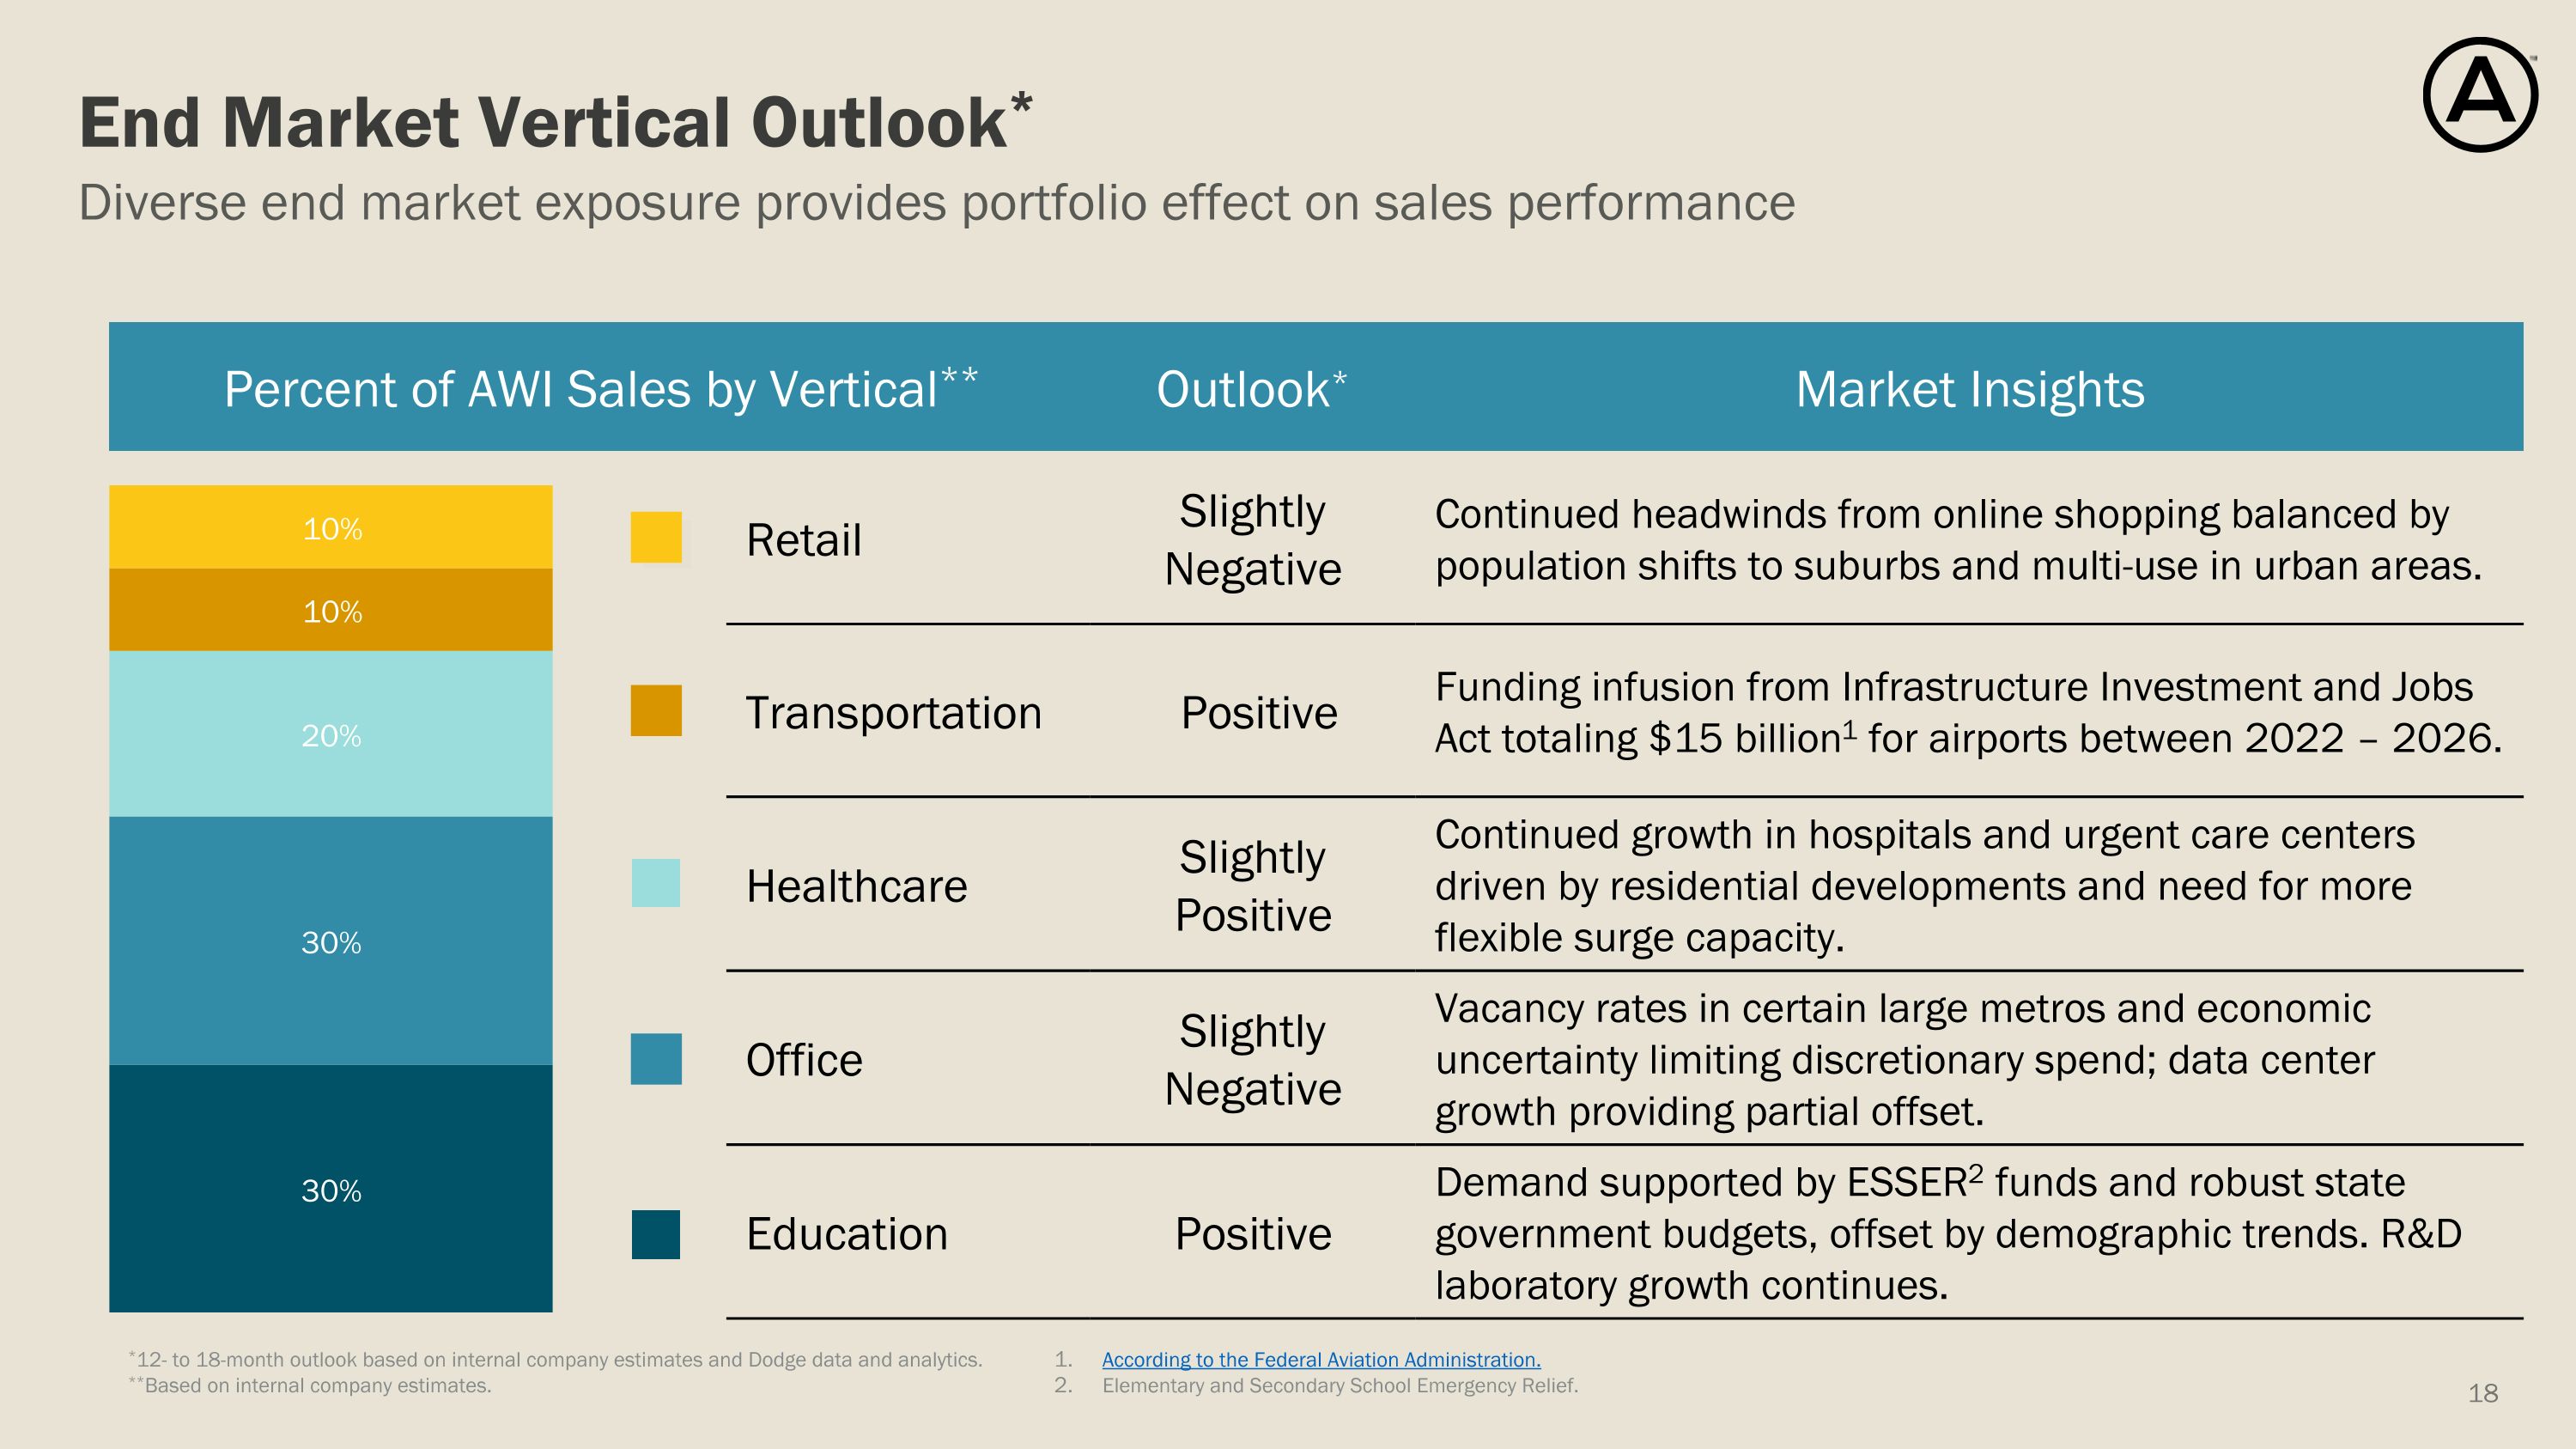
Percent of AWI Sales by Vertical** Vertical Outlook* Market Insights Retail Slightly Negative Continued headwinds from online shopping balanced by population shifts to suburbs and multi-use in urban areas. Transportation Positive Funding infusion from Infrastructure Investment and Jobs Act totaling $15 billion1 for airports between 2022 – 2026. Healthcare Slightly Positive Continued growth in hospitals and urgent care centers driven by residential developments and need for more flexible surge capacity. Office Slightly Negative Vacancy rates in certain large metros and economic uncertainty limiting discretionary spend; data center growth providing partial offset. Education Positive Demand supported by ESSER2 funds and robust state government budgets, offset by demographic trends. R&D laboratory growth continues. Diverse end market exposure provides portfolio effect on sales performance End Market Vertical Outlook* According to the Federal Aviation Administration. Elementary and Secondary School Emergency Relief. *12- to 18-month outlook based on internal company estimates and Dodge data and analytics. **Based on internal company estimates.
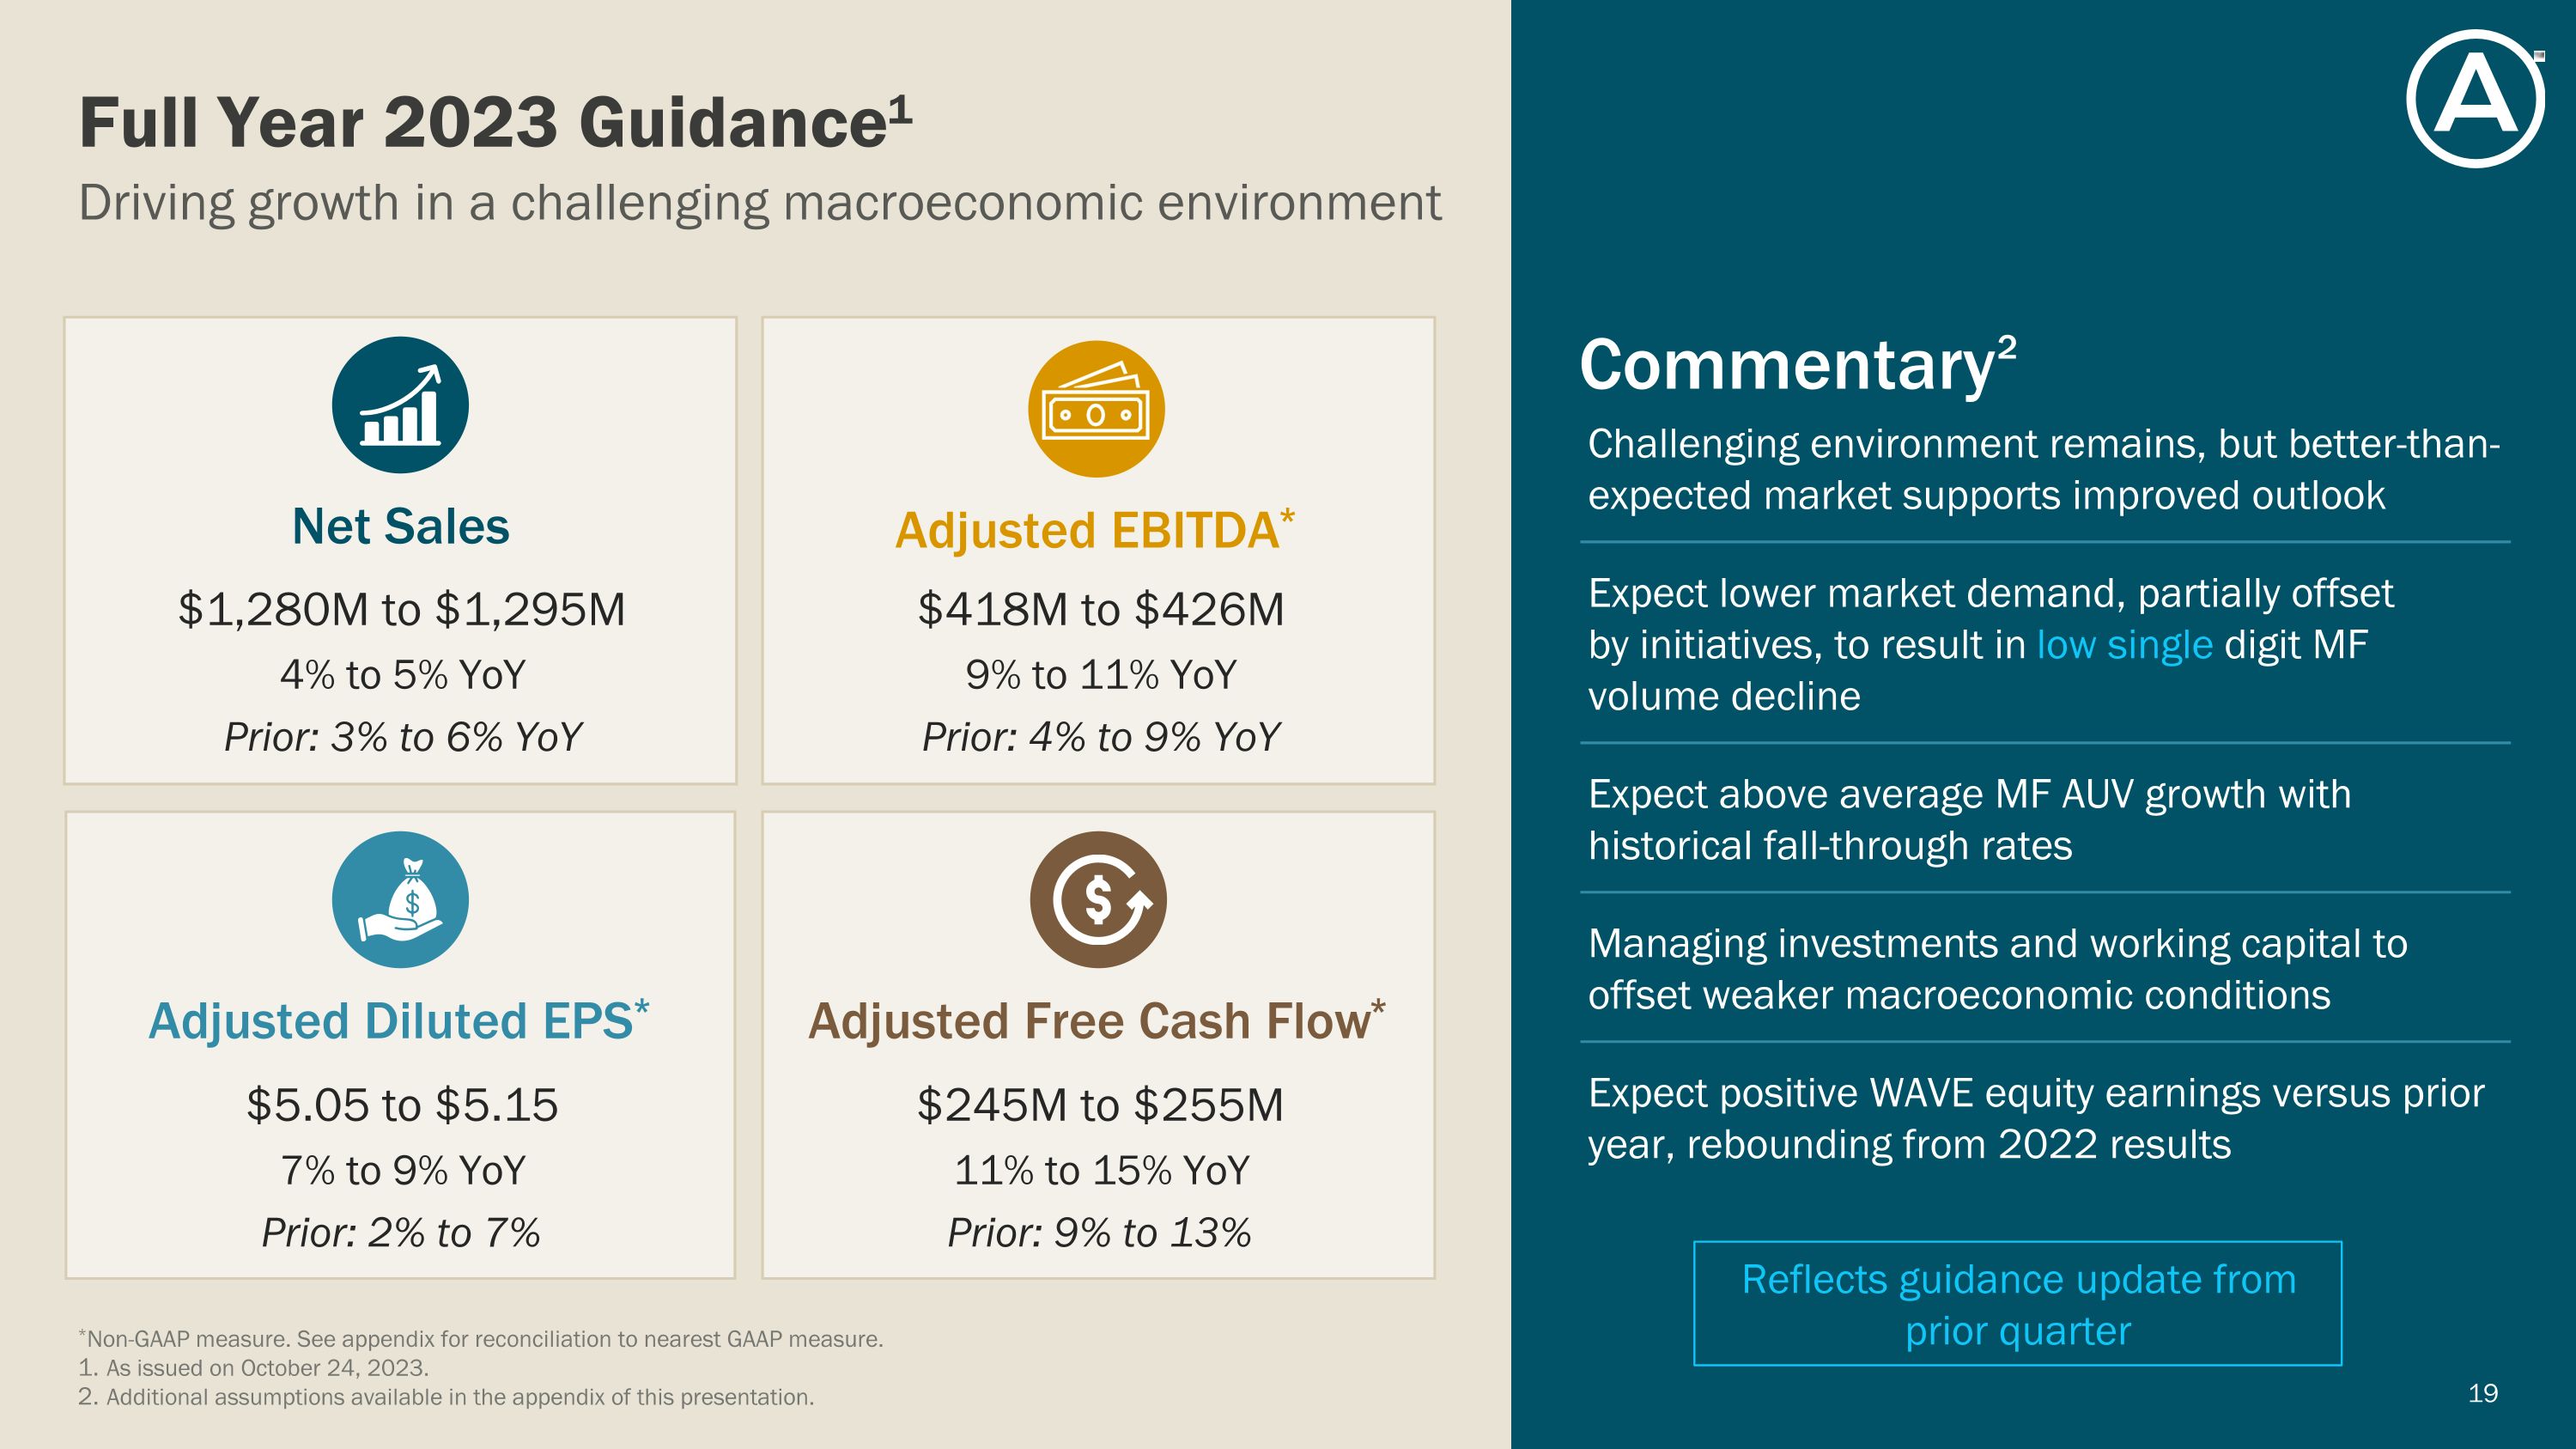
Driving growth in a challenging macroeconomic environment Full Year 2023 Guidance1 Commentary2 $1,280M to $1,295M 4% to 5% YoY Prior: 3% to 6% YoY Net Sales $5.05 to $5.15 7% to 9% YoY Prior: 2% to 7% Adjusted Diluted EPS* $418M to $426M 9% to 11% YoY Prior: 4% to 9% YoY Adjusted EBITDA* $245M to $255M 11% to 15% YoY Prior: 9% to 13% Adjusted Free Cash Flow* Challenging environment remains, but better-than-expected market supports improved outlook Expect lower market demand, partially offset by initiatives, to result in low single digit MF volume decline Expect above average MF AUV growth with historical fall-through rates Managing investments and working capital to offset weaker macroeconomic conditions Expect positive WAVE equity earnings versus prior year, rebounding from 2022 results *Non-GAAP measure. See appendix for reconciliation to nearest GAAP measure. As issued on October 24, 2023. Additional assumptions available in the appendix of this presentation. Reflects guidance update from prior quarter
Appendix
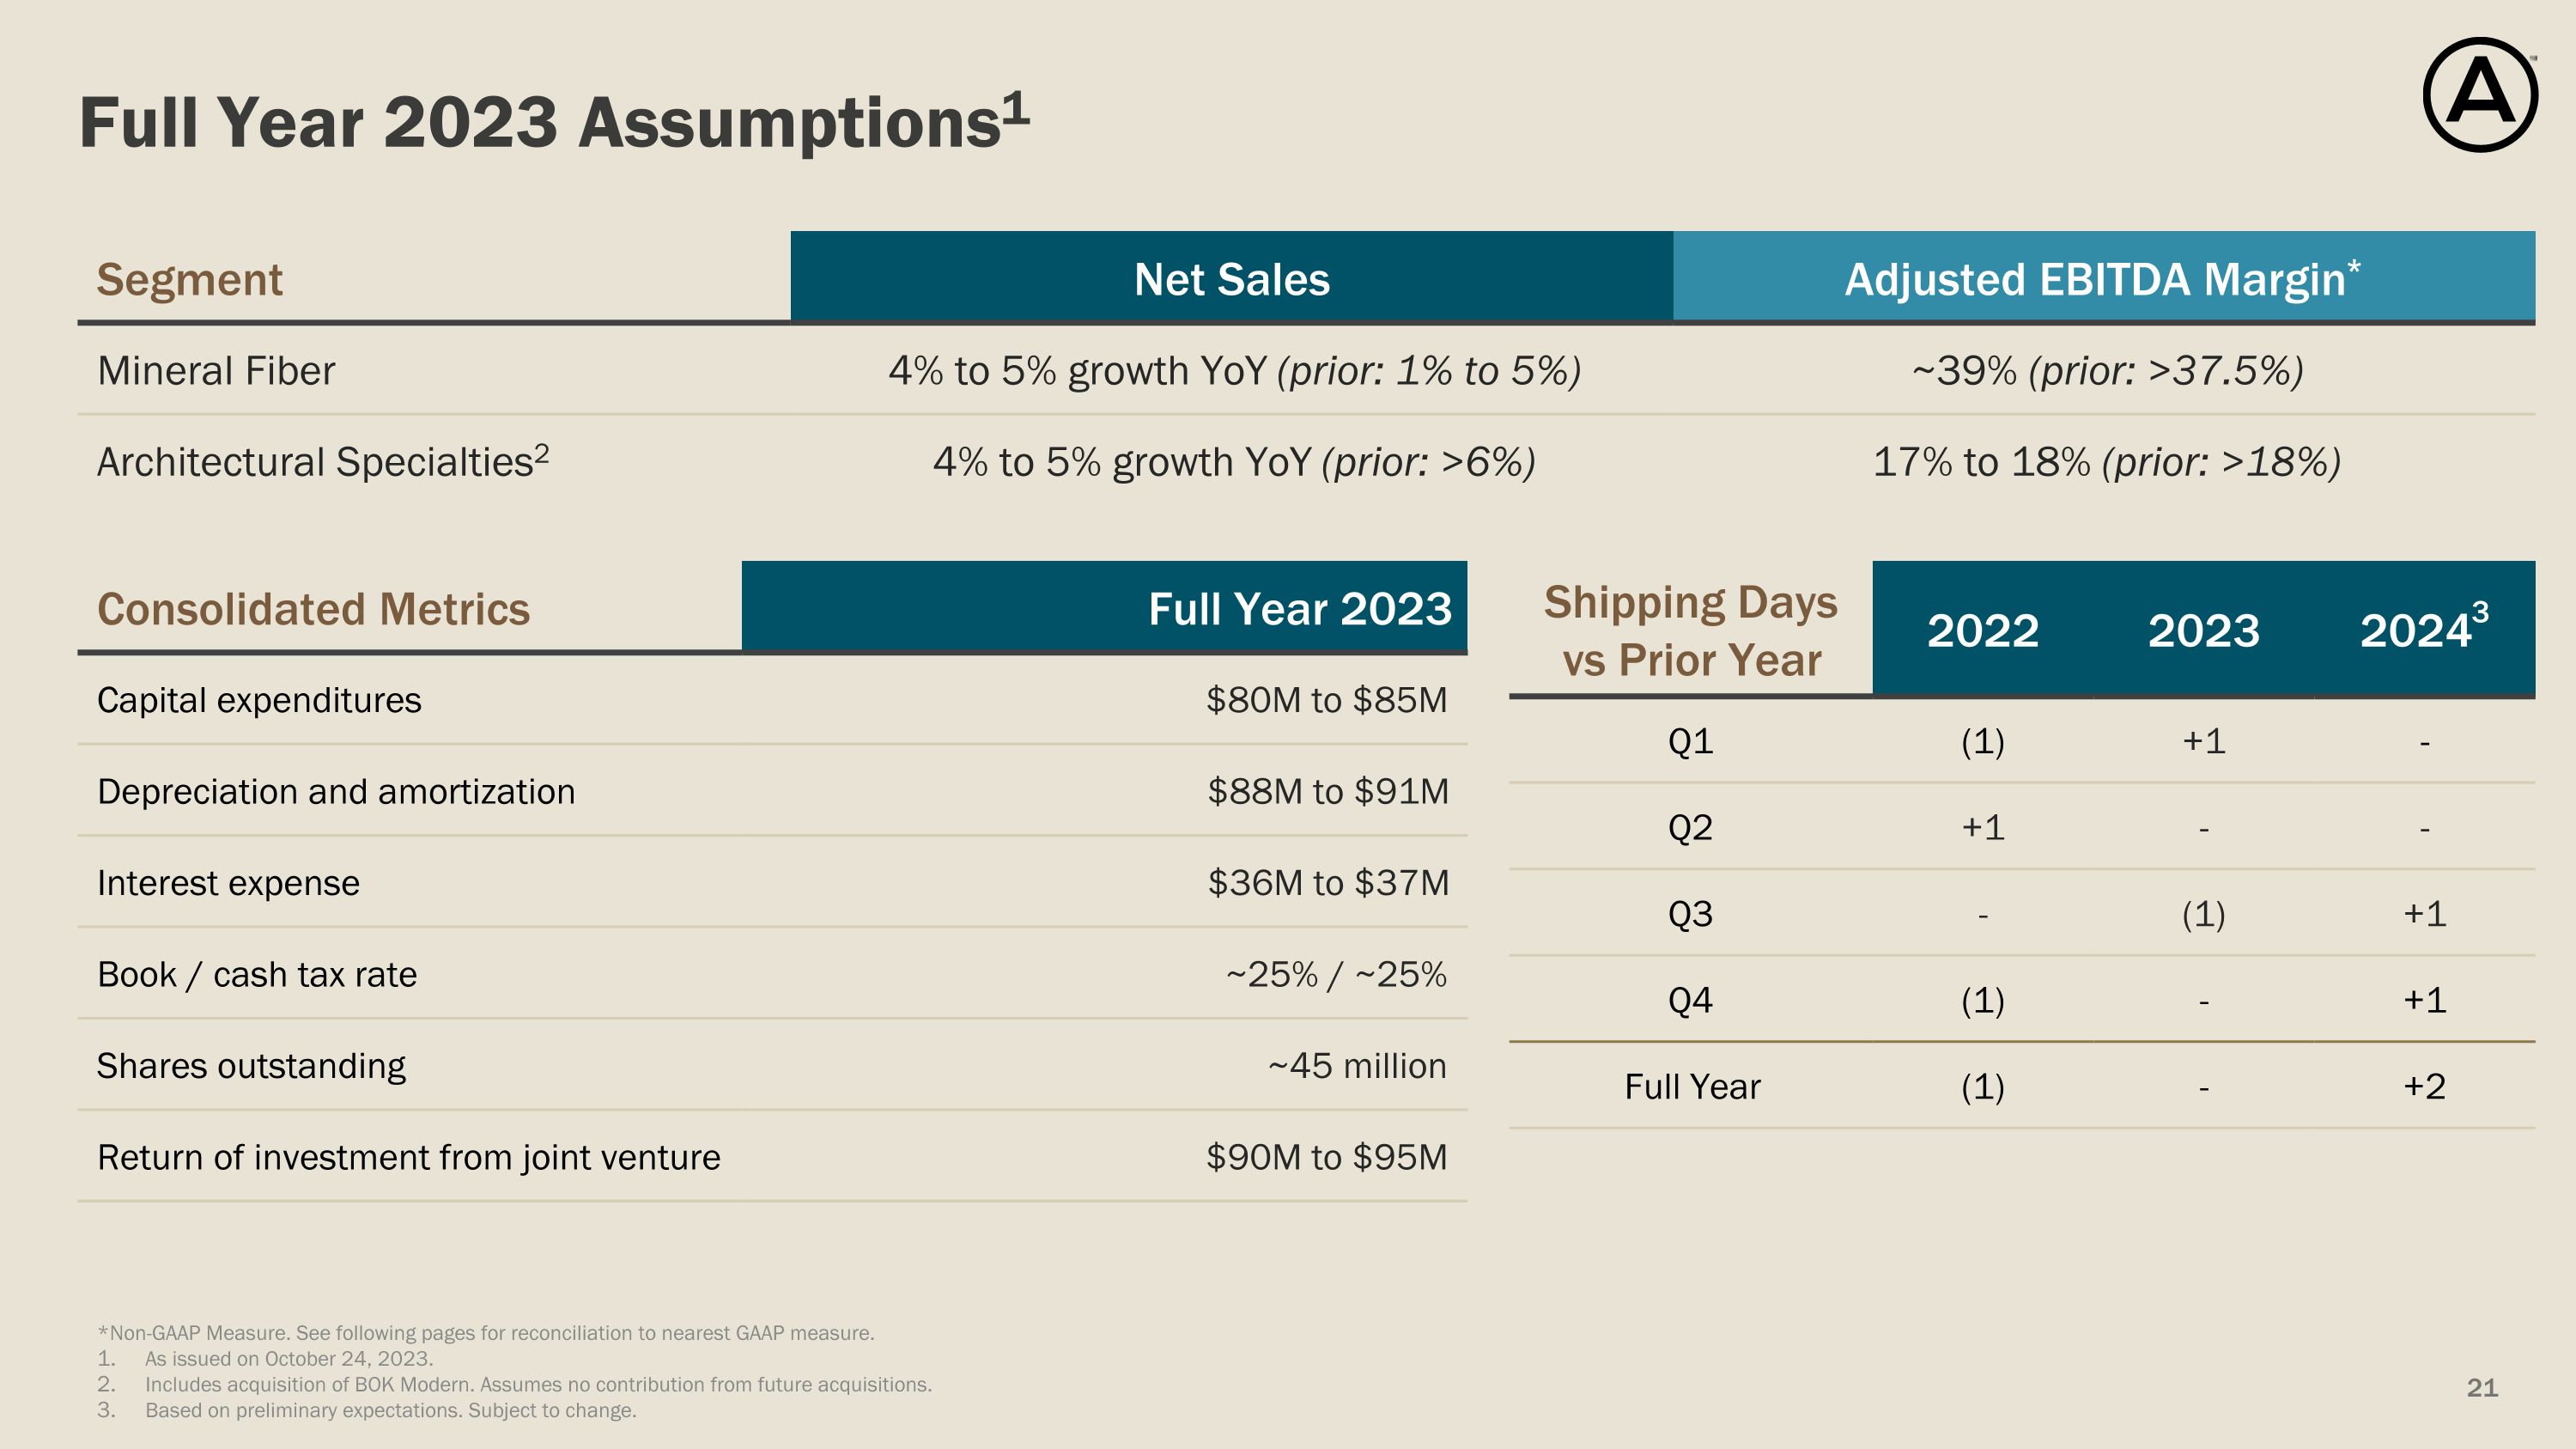
Full Year 2023 Assumptions1 Segment Net Sales Adjusted EBITDA Margin* Mineral Fiber 4% to 5% growth YoY (prior: 1% to 5%) ~39% (prior: >37.5%) Architectural Specialties2 4% to 5% growth YoY (prior: >6%) 17% to 18% (prior: >18%) Consolidated Metrics Full Year 2023 Capital expenditures $80M to $85M Depreciation and amortization $88M to $91M Interest expense $36M to $37M Book / cash tax rate ~25% / ~25% Shares outstanding ~45 million Return of investment from joint venture $90M to $95M Shipping Days vs Prior Year 2022 2023 20243 Q1 (1) +1 - Q2 +1 - - Q3 - (1) +1 Q4 (1) - +1 Full Year (1) - +2 21 *Non-GAAP Measure. See following pages for reconciliation to nearest GAAP measure. As issued on October 24, 2023. Includes acquisition of BOK Modern. Assumes no contribution from future acquisitions. Based on preliminary expectations. Subject to change.
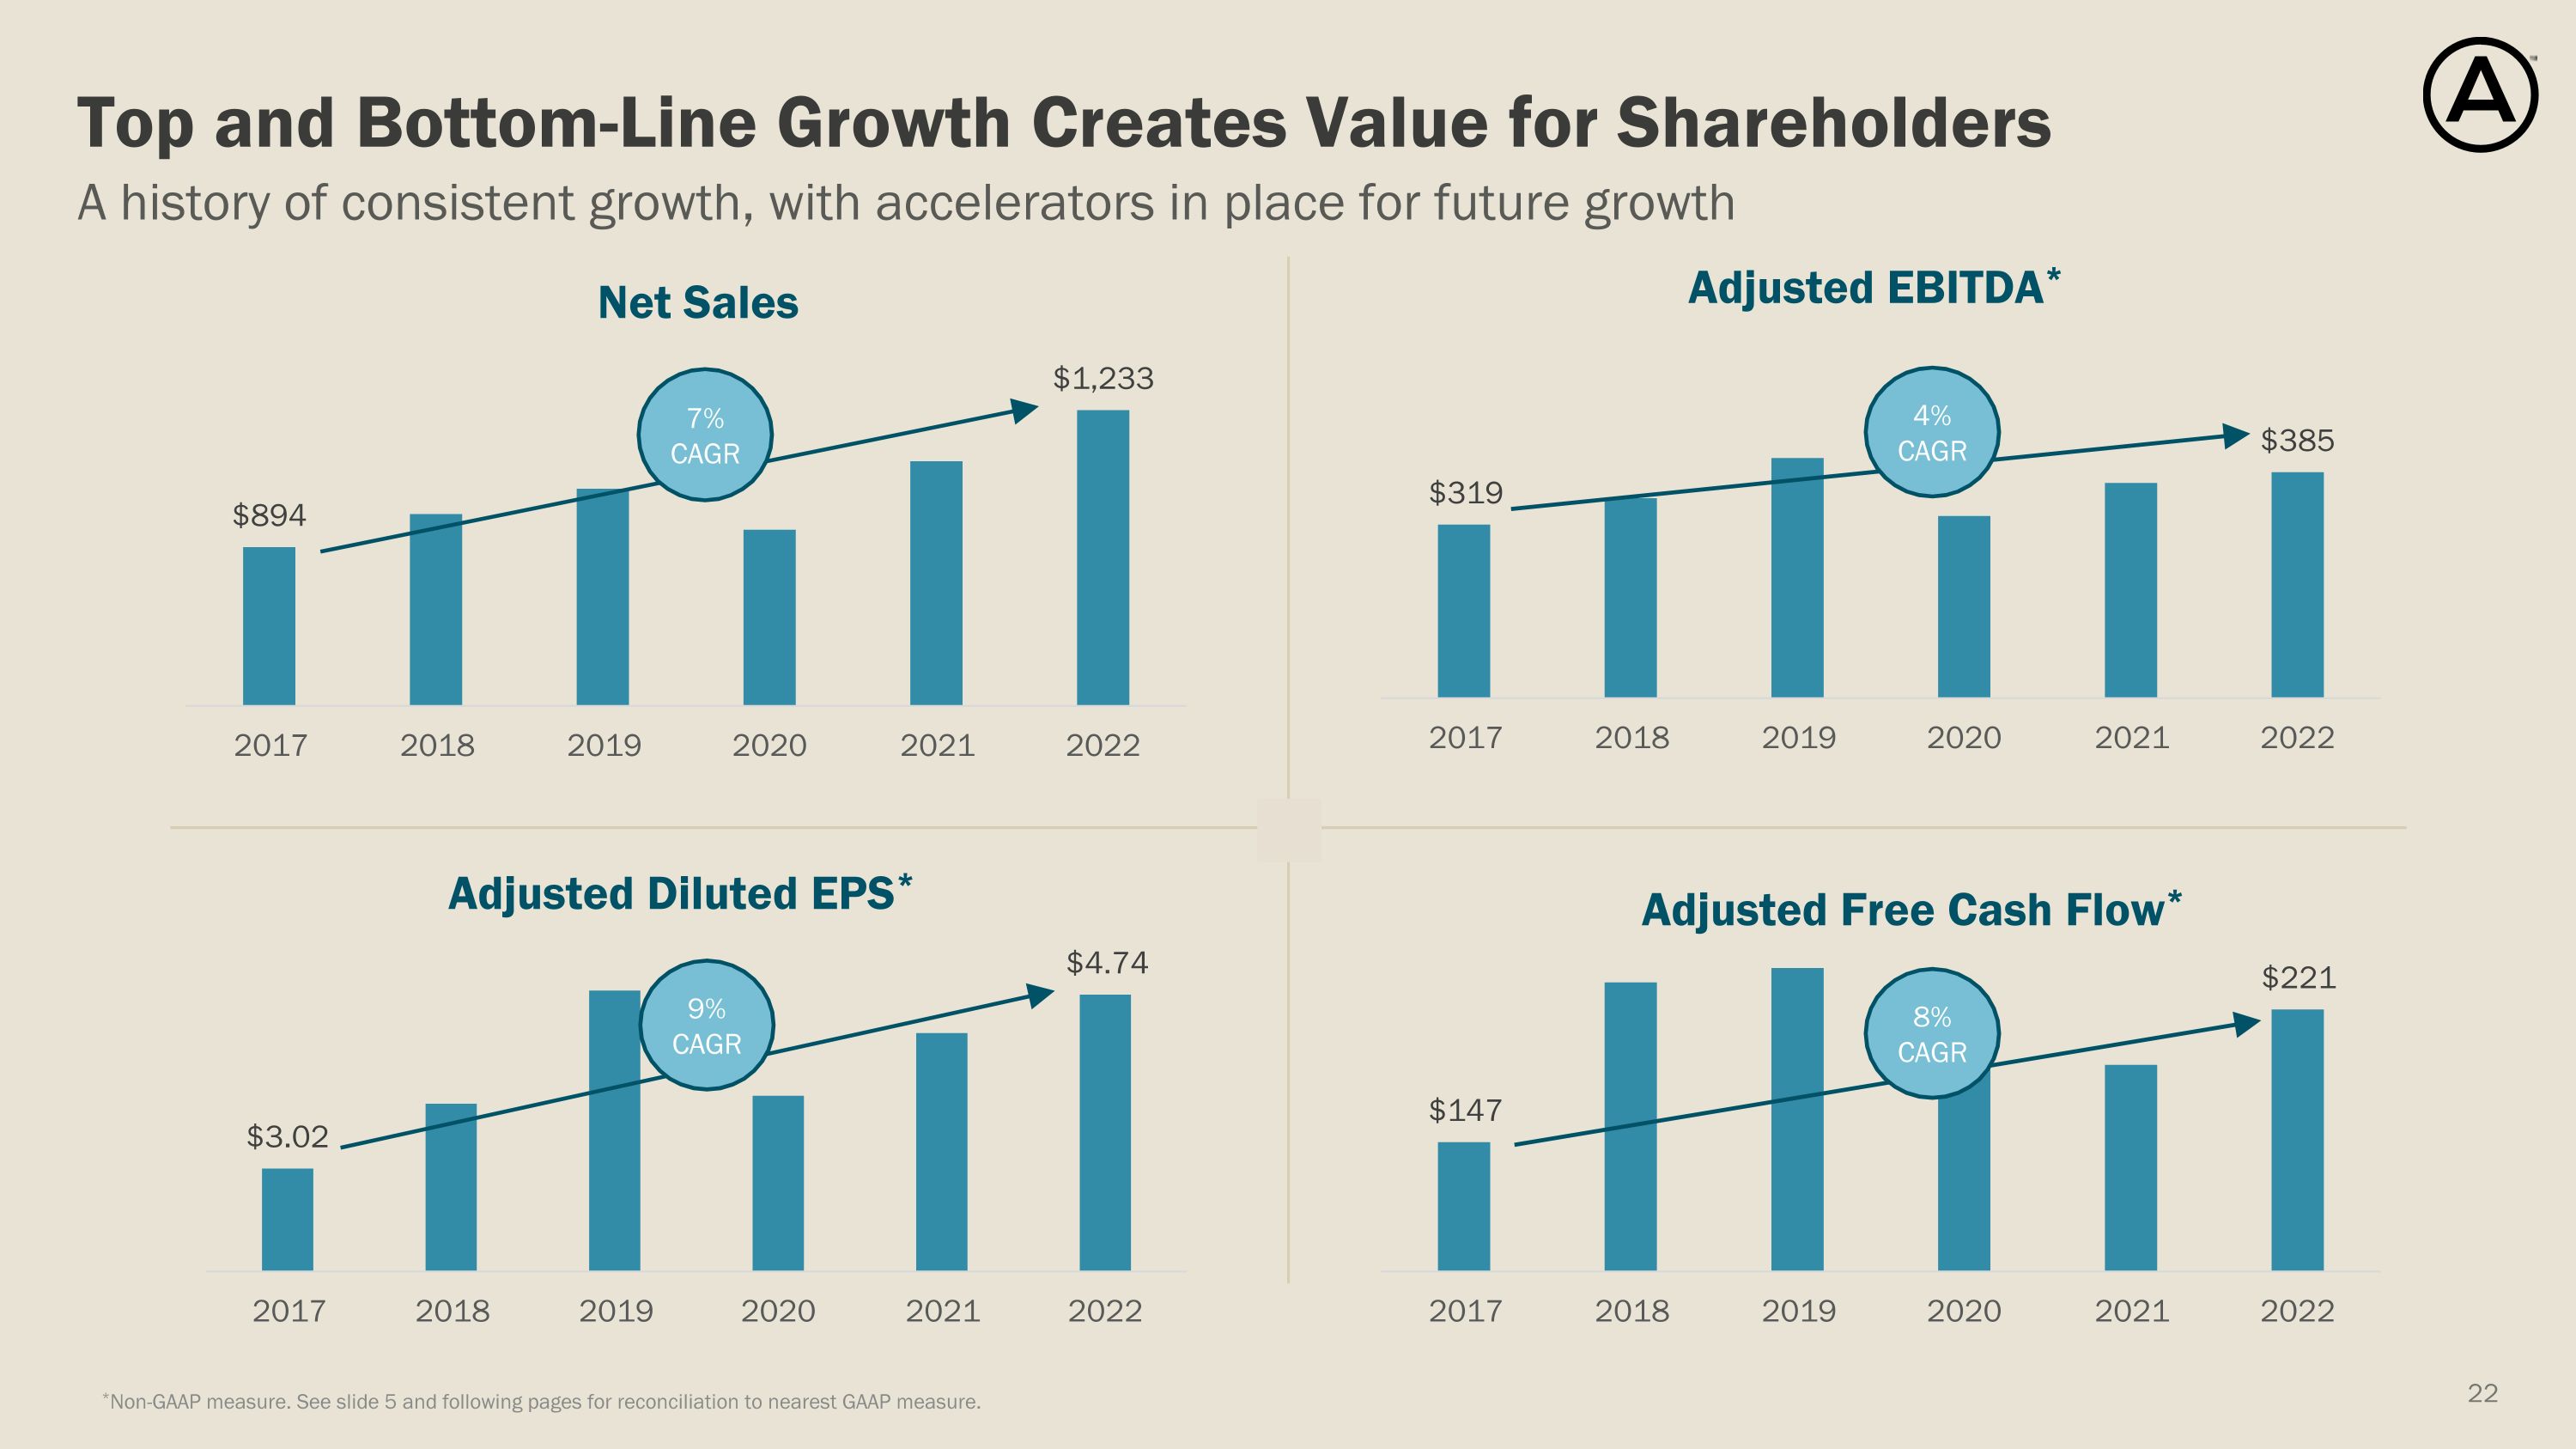
A history of consistent growth, with accelerators in place for future growth Top and Bottom-Line Growth Creates Value for Shareholders Net Sales 7% CAGR Adjusted EBITDA* 4% CAGR Adjusted Free Cash Flow* 8% CAGR 9% CAGR Adjusted Diluted EPS* *Non-GAAP measure. See slide 5 and following pages for reconciliation to nearest GAAP measure.
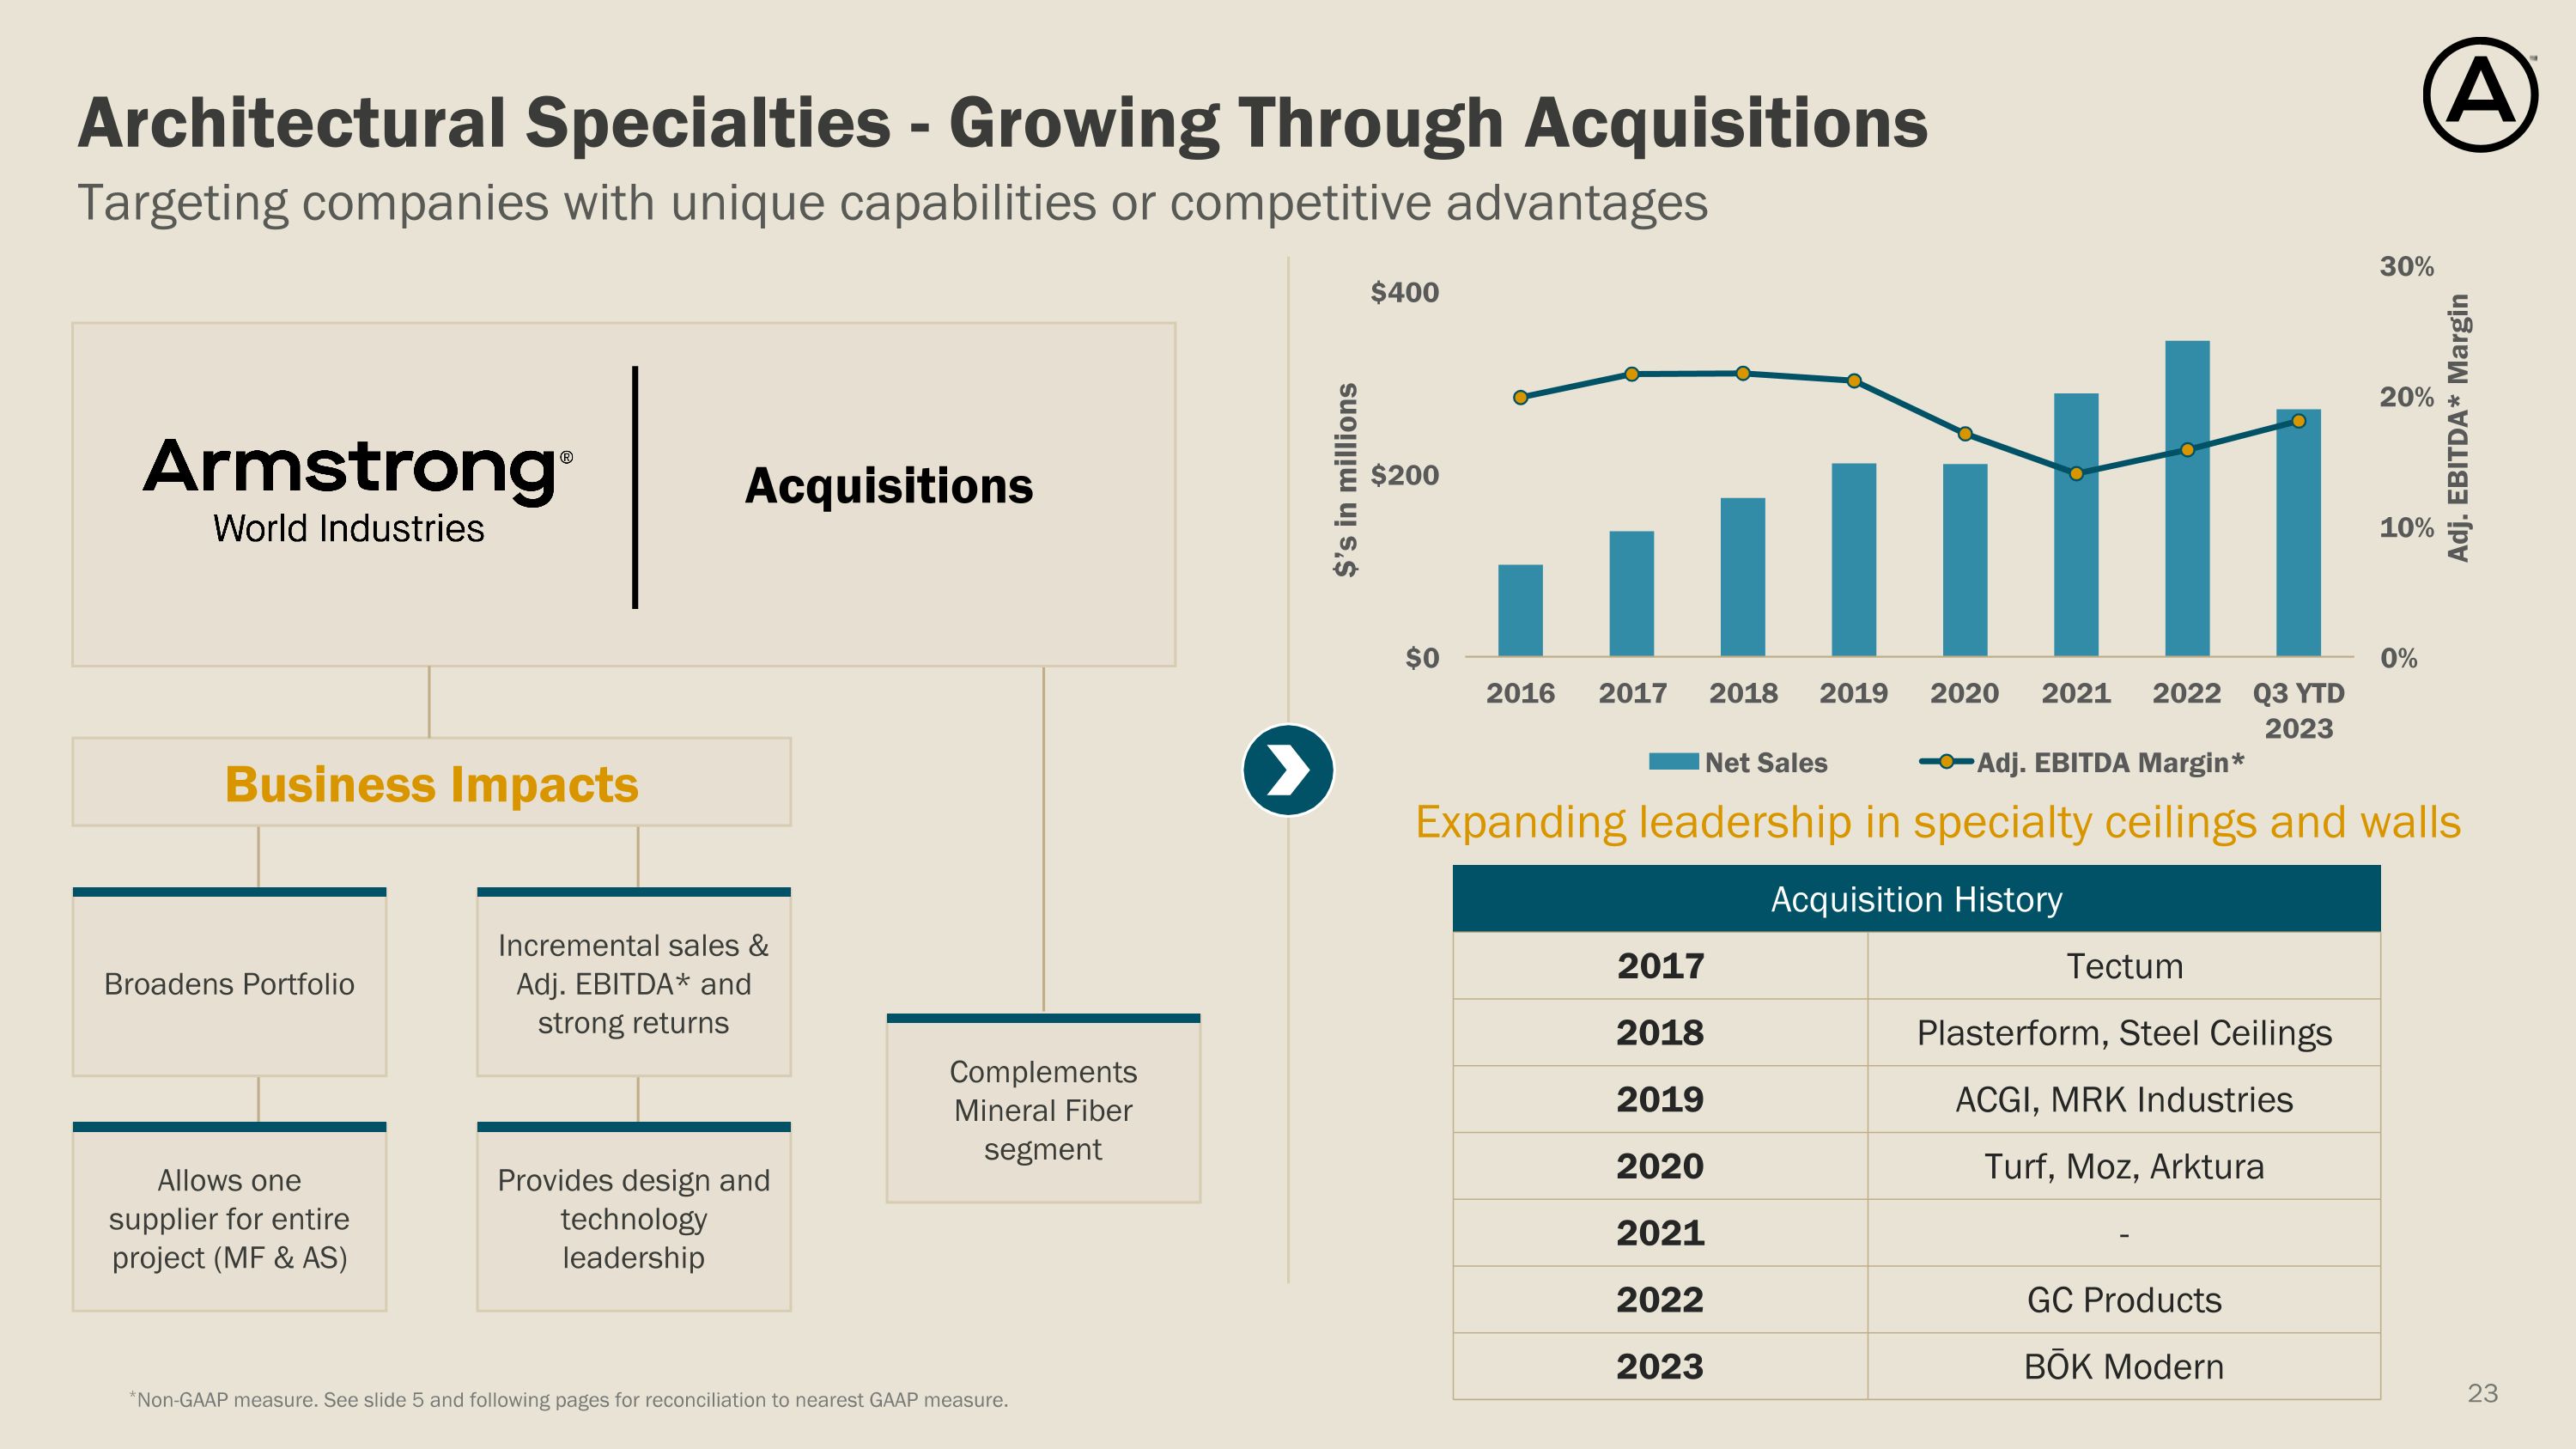
Targeting companies with unique capabilities or competitive advantages Architectural Specialties - Growing Through Acquisitions Expanding leadership in specialty ceilings and walls *Non-GAAP measure. See slide 5 and following pages for reconciliation to nearest GAAP measure. Broadens Portfolio Business Impacts Acquisition History 2017 Tectum 2018 Plasterform, Steel Ceilings 2019 ACGI, MRK Industries 2020 Turf, Moz, Arktura 2021 - 2022 GC Products 2023 BŌK Modern Acquisitions Incremental sales & Adj. EBITDA* and strong returns Provides design and technology leadership Allows one supplier for entire project (MF & AS) Complements Mineral Fiber segment
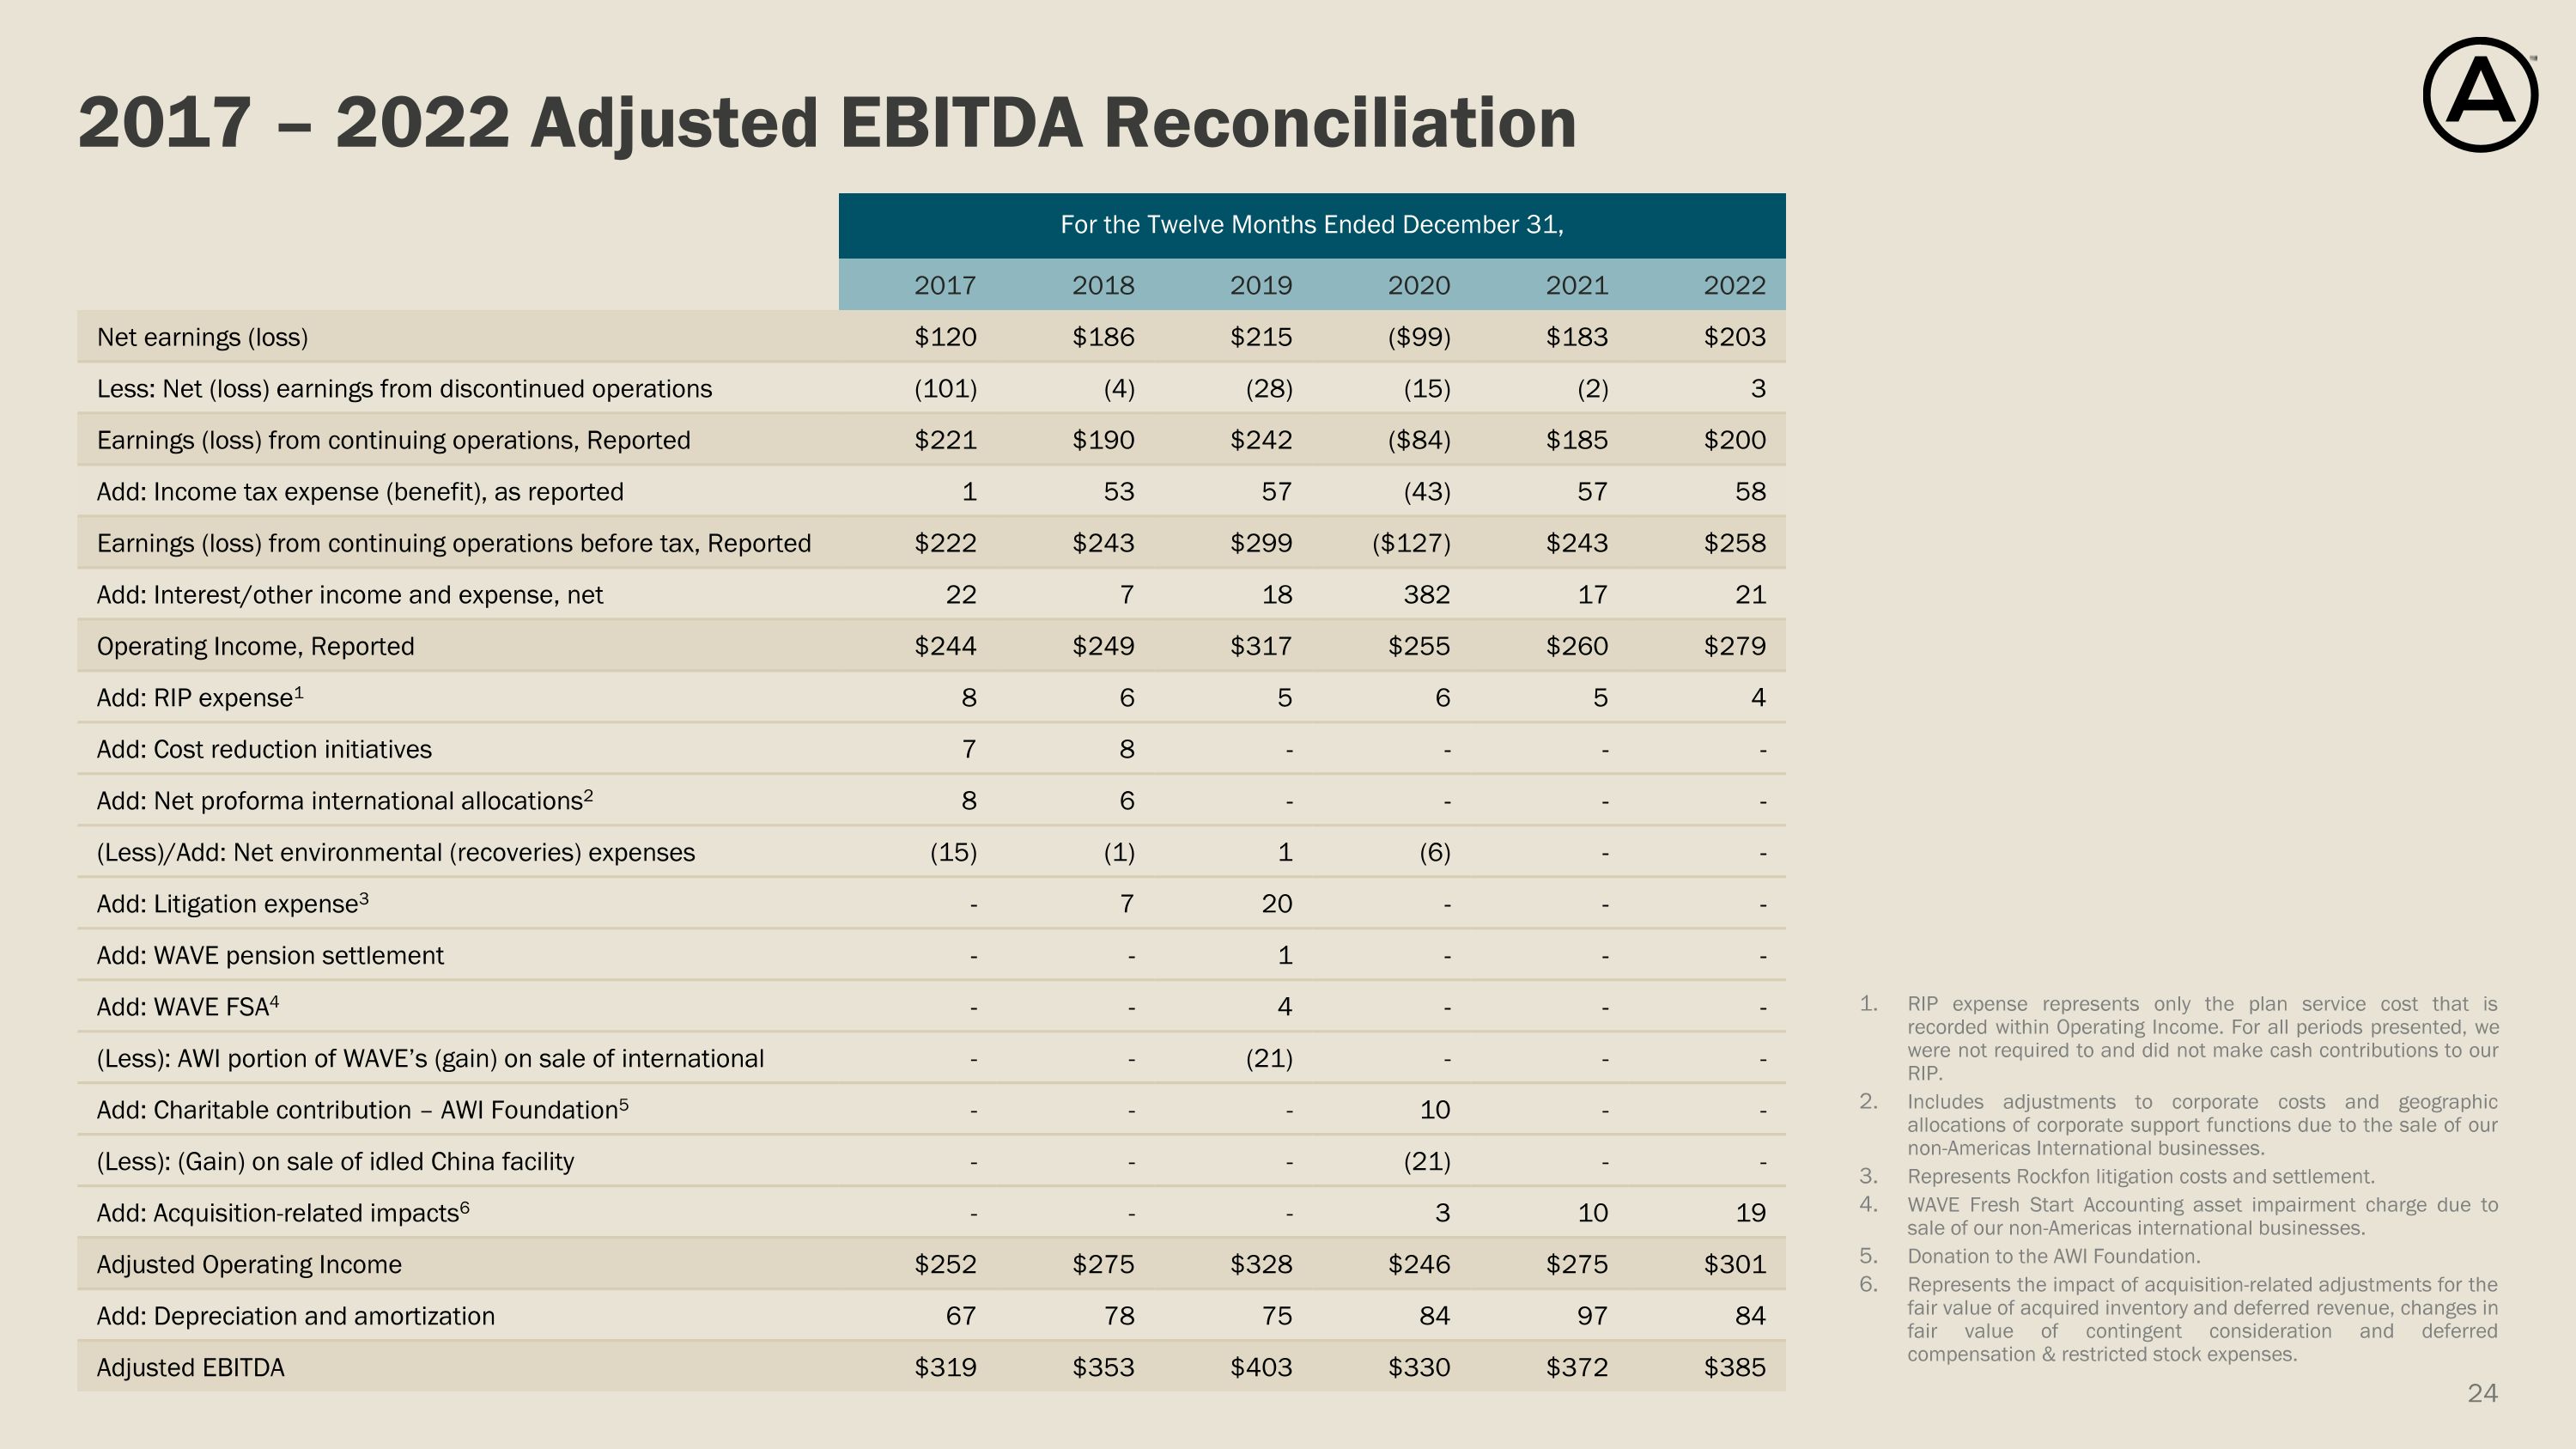
2017 – 2022 Adjusted EBITDA Reconciliation RIP expense represents only the plan service cost that is recorded within Operating Income. For all periods presented, we were not required to and did not make cash contributions to our RIP. Includes adjustments to corporate costs and geographic allocations of corporate support functions due to the sale of our non-Americas International businesses. Represents Rockfon litigation costs and settlement. WAVE Fresh Start Accounting asset impairment charge due to sale of our non-Americas international businesses. Donation to the AWI Foundation. Represents the impact of acquisition-related adjustments for the fair value of acquired inventory and deferred revenue, changes in fair value of contingent consideration and deferred compensation & restricted stock expenses. For the Twelve Months Ended December 31, For the Twelve Months Ended December 31, 2017 2018 2019 2020 2021 2022 Net earnings (loss) $120 $186 $215 ($99) $183 $203 Less: Net (loss) earnings from discontinued operations (101) (4) (28) (15) (2) 3 Earnings (loss) from continuing operations, Reported $221 $190 $242 ($84) $185 $200 Add: Income tax expense (benefit), as reported 1 53 57 (43) 57 58 Earnings (loss) from continuing operations before tax, Reported $222 $243 $299 ($127) $243 $258 Add: Interest/other income and expense, net 22 7 18 382 17 21 Operating Income, Reported $244 $249 $317 $255 $260 $279 Add: RIP expense1 8 6 5 6 5 4 Add: Cost reduction initiatives 7 8 - - - - Add: Net proforma international allocations2 8 6 - - - - (Less)/Add: Net environmental (recoveries) expenses (15) (1) 1 (6) - - Add: Litigation expense3 - 7 20 - - - Add: WAVE pension settlement - - 1 - - - Add: WAVE FSA4 - - 4 - - - (Less): AWI portion of WAVE’s (gain) on sale of international - - (21) - - - Add: Charitable contribution – AWI Foundation5 - - - 10 - - (Less): (Gain) on sale of idled China facility - - - (21) - - Add: Acquisition-related impacts6 - - - 3 10 19 Adjusted Operating Income $252 $275 $328 $246 $275 $301 Add: Depreciation and amortization 67 78 75 84 97 84 Adjusted EBITDA $319 $353 $403 $330 $372 $385
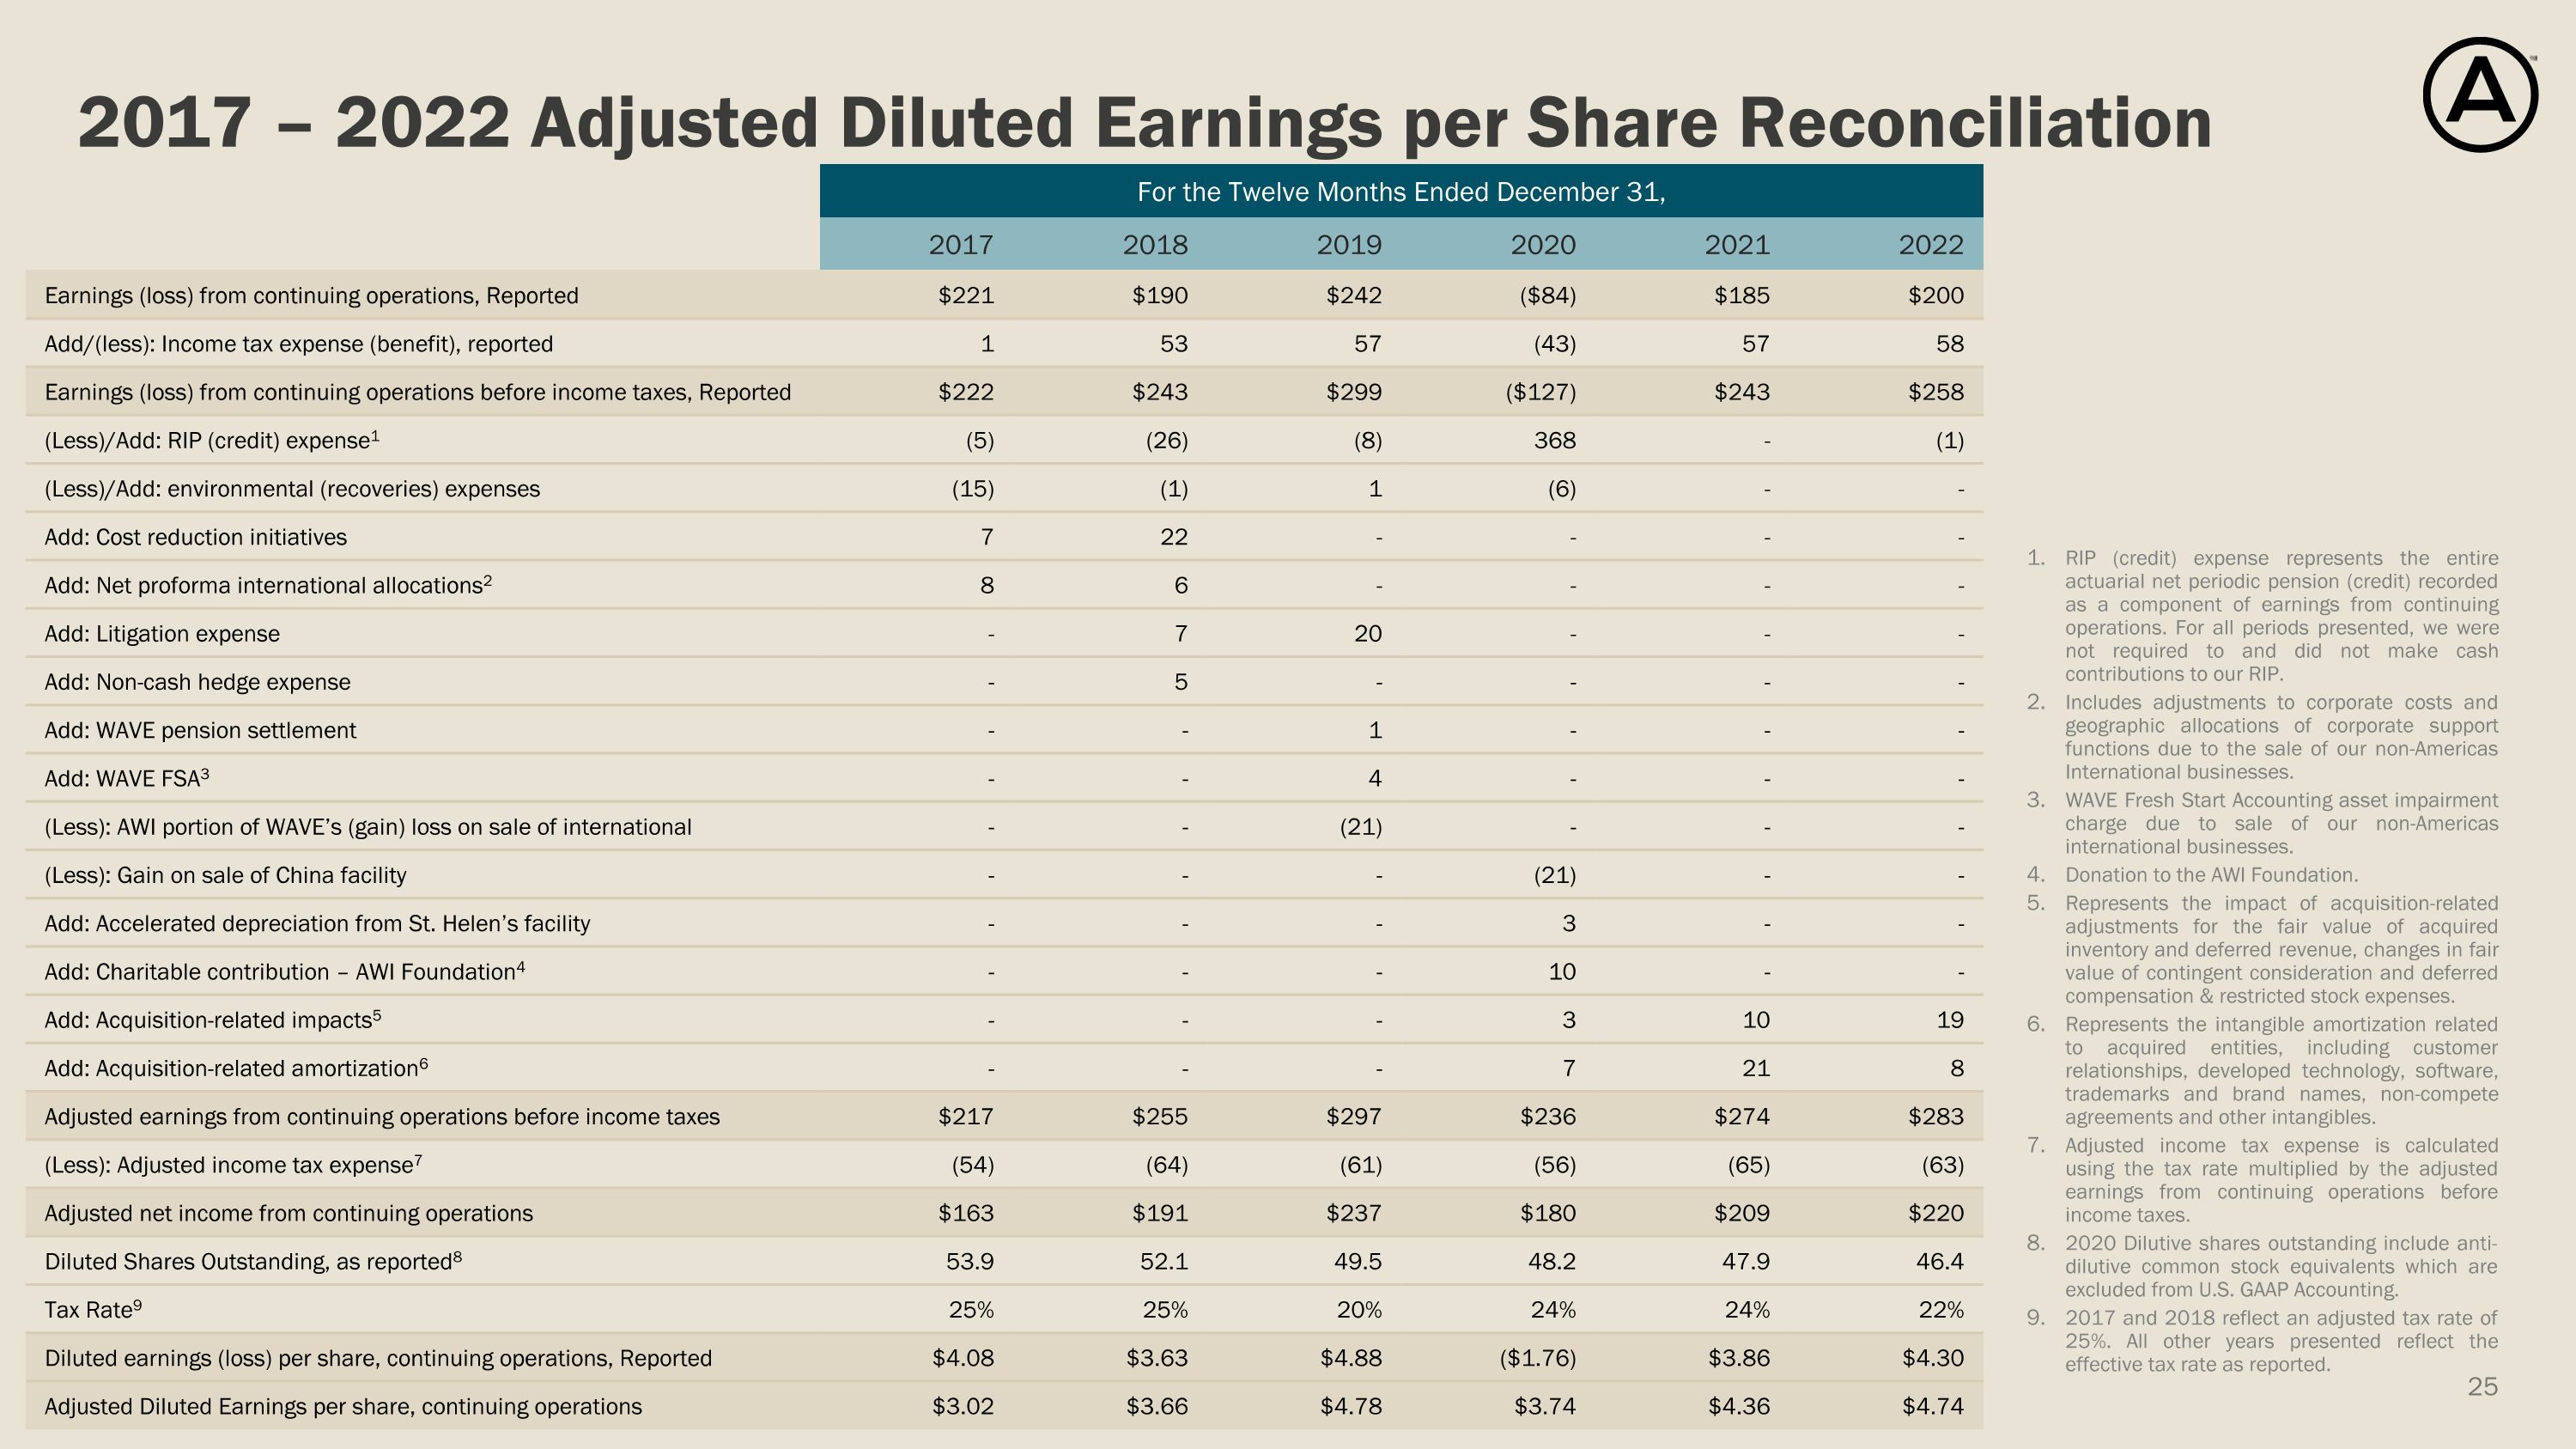
2017 – 2022 Adjusted Diluted Earnings per Share Reconciliation RIP (credit) expense represents the entire actuarial net periodic pension (credit) recorded as a component of earnings from continuing operations. For all periods presented, we were not required to and did not make cash contributions to our RIP. Includes adjustments to corporate costs and geographic allocations of corporate support functions due to the sale of our non-Americas International businesses. WAVE Fresh Start Accounting asset impairment charge due to sale of our non-Americas international businesses. Donation to the AWI Foundation. Represents the impact of acquisition-related adjustments for the fair value of acquired inventory and deferred revenue, changes in fair value of contingent consideration and deferred compensation & restricted stock expenses. Represents the intangible amortization related to acquired entities, including customer relationships, developed technology, software, trademarks and brand names, non-compete agreements and other intangibles. Adjusted income tax expense is calculated using the tax rate multiplied by the adjusted earnings from continuing operations before income taxes. 2020 Dilutive shares outstanding include anti-dilutive common stock equivalents which are excluded from U.S. GAAP Accounting. 2017 and 2018 reflect an adjusted tax rate of 25%. All other years presented reflect the effective tax rate as reported. For the Twelve Months Ended December 31, For the Twelve Months Ended December 31, 2017 2018 2019 2020 2021 2022 Earnings (loss) from continuing operations, Reported $221 $190 $242 ($84) $185 $200 Add/(less): Income tax expense (benefit), reported 1 53 57 (43) 57 58 Earnings (loss) from continuing operations before income taxes, Reported $222 $243 $299 ($127) $243 $258 (Less)/Add: RIP (credit) expense1 (5) (26) (8) 368 - (1) (Less)/Add: environmental (recoveries) expenses (15) (1) 1 (6) - - Add: Cost reduction initiatives 7 22 - - - - Add: Net proforma international allocations2 8 6 - - - - Add: Litigation expense - 7 20 - - - Add: Non-cash hedge expense - 5 - - - - Add: WAVE pension settlement - - 1 - - - Add: WAVE FSA3 - - 4 - - - (Less): AWI portion of WAVE’s (gain) loss on sale of international - - (21) - - - (Less): Gain on sale of China facility - - - (21) - - Add: Accelerated depreciation from St. Helen’s facility - - - 3 - - Add: Charitable contribution – AWI Foundation4 - - - 10 - - Add: Acquisition-related impacts5 - - - 3 10 19 Add: Acquisition-related amortization6 - - - 7 21 8 Adjusted earnings from continuing operations before income taxes $217 $255 $297 $236 $274 $283 (Less): Adjusted income tax expense7 (54) (64) (61) (56) (65) (63) Adjusted net income from continuing operations $163 $191 $237 $180 $209 $220 Diluted Shares Outstanding, as reported8 53.9 52.1 49.5 48.2 47.9 46.4 Tax Rate9 25% 25% 20% 24% 24% 22% Diluted earnings (loss) per share, continuing operations, Reported $4.08 $3.63 $4.88 ($1.76) $3.86 $4.30 Adjusted Diluted Earnings per share, continuing operations $3.02 $3.66 $4.78 $3.74 $4.36 $4.74
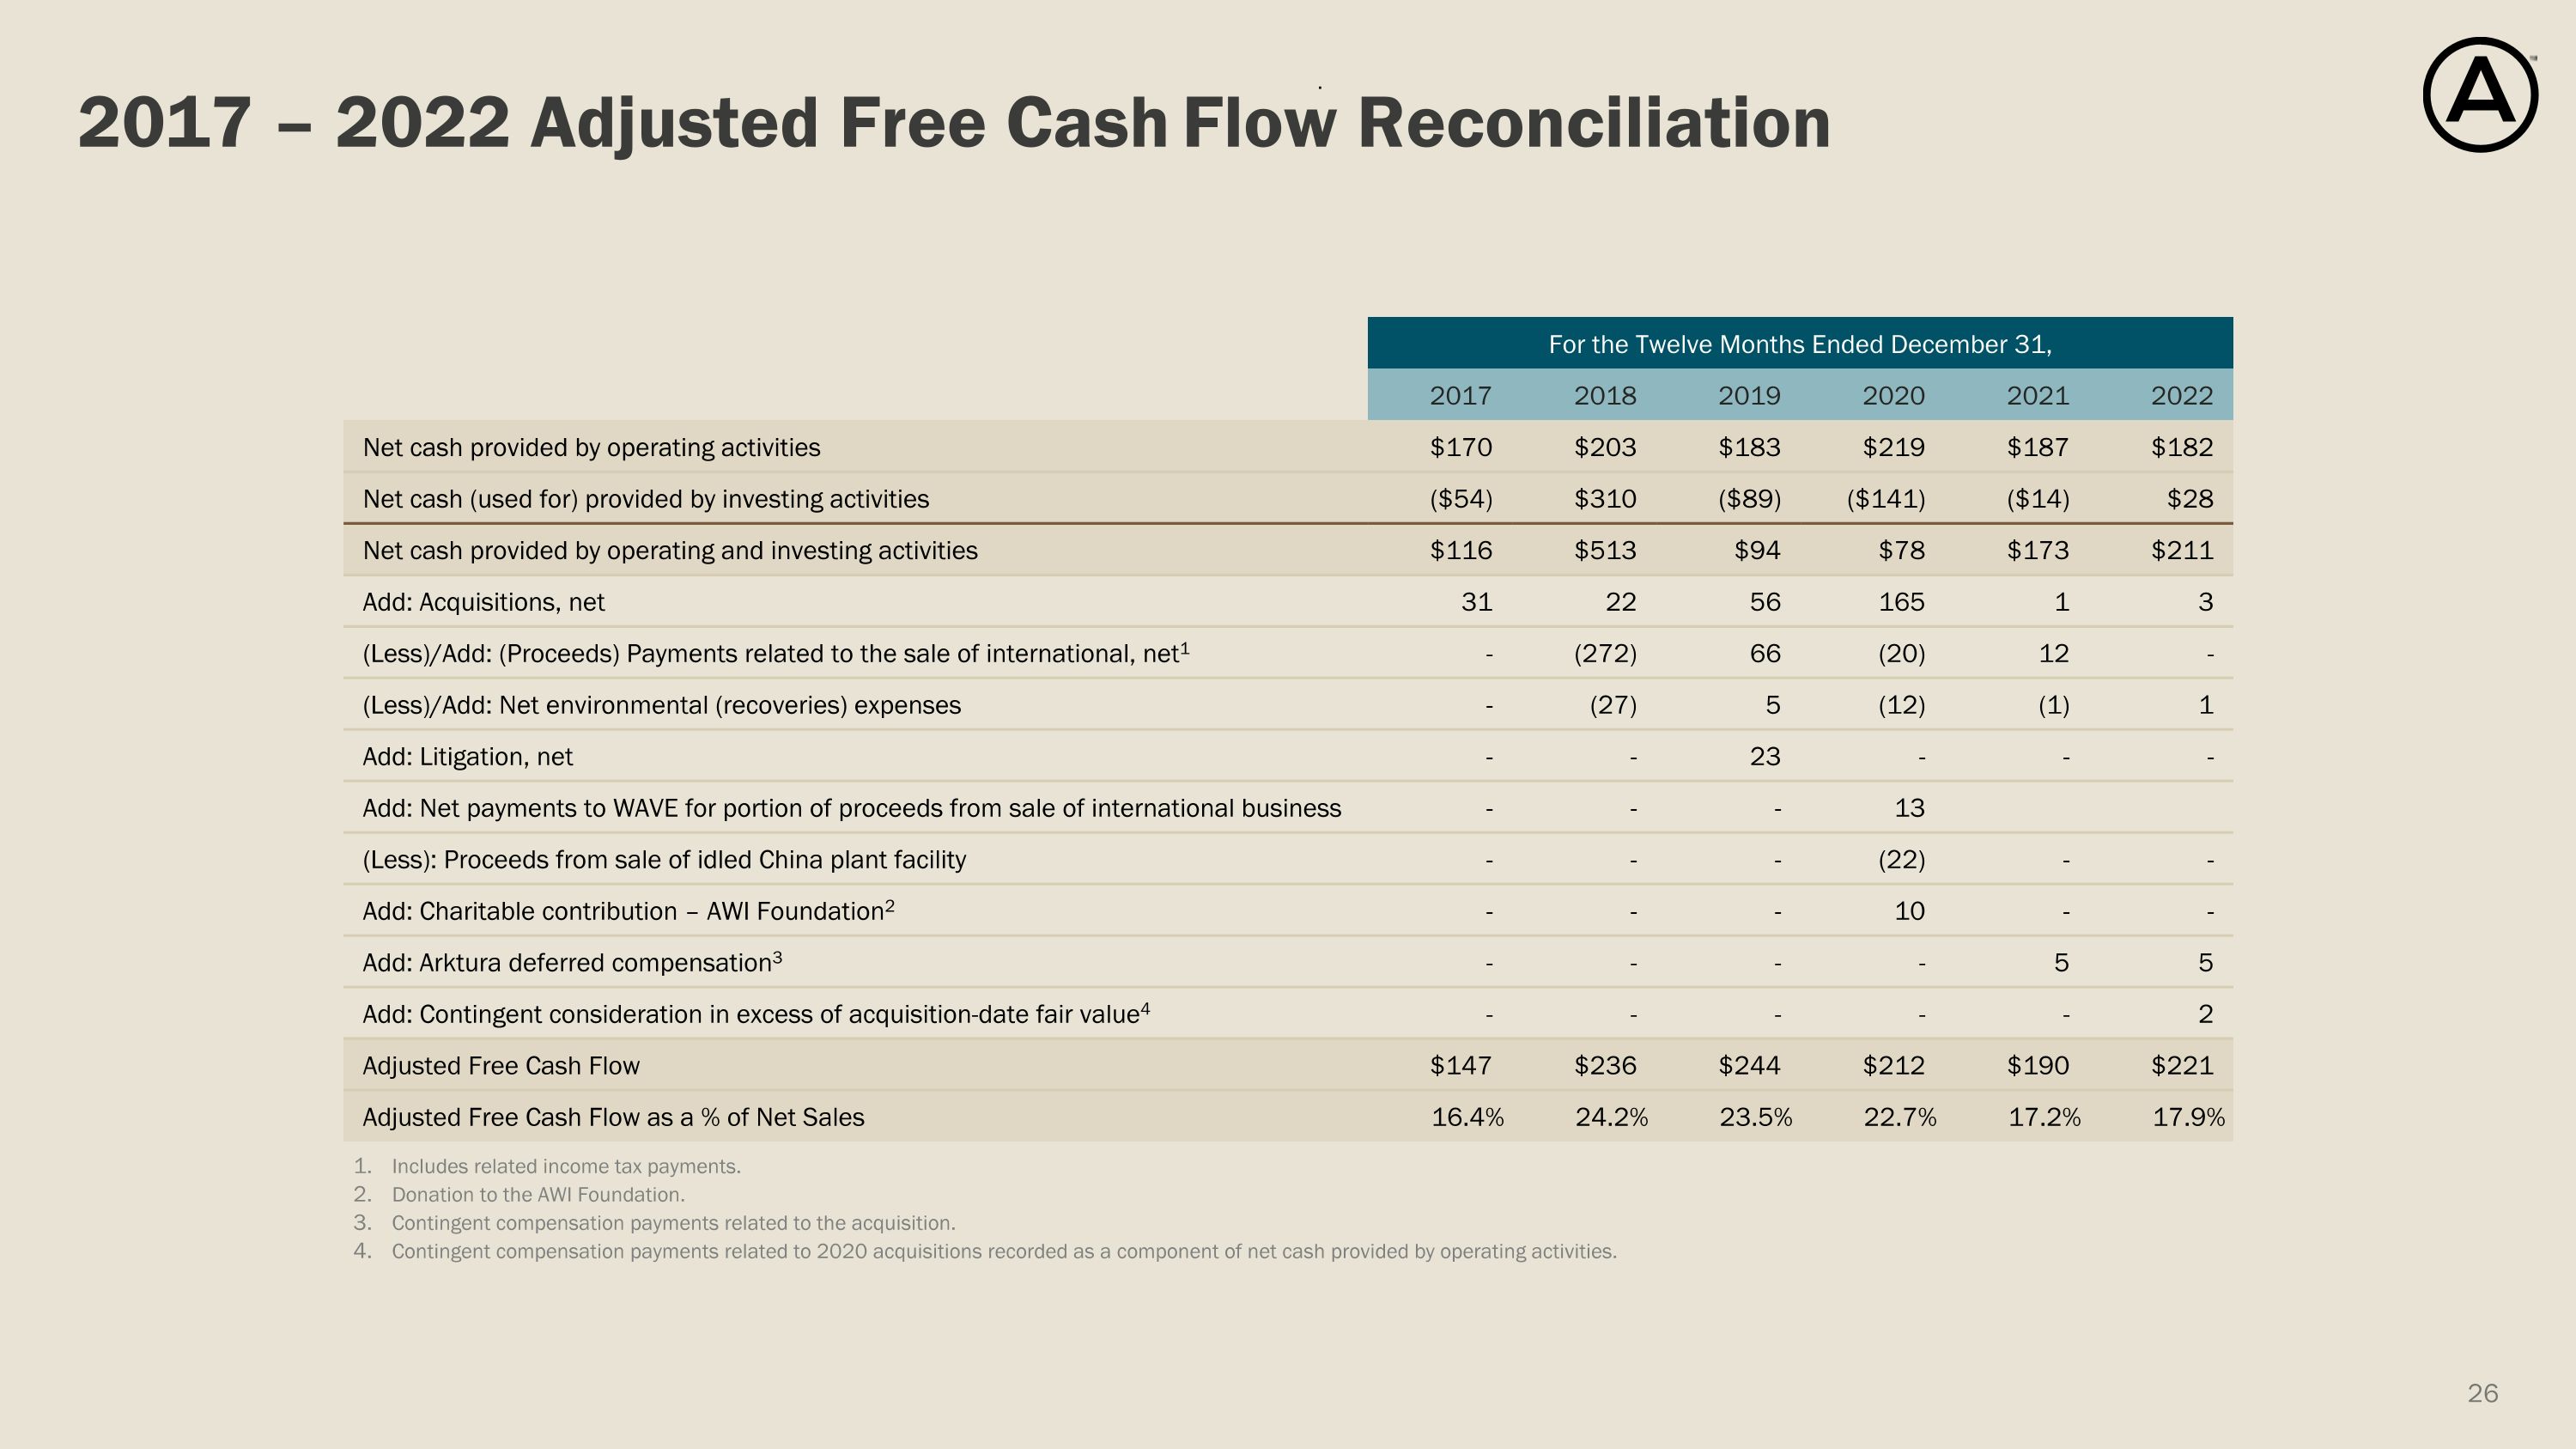
2017 – 2022 Adjusted Free Cash Flow Reconciliation Includes related income tax payments. Donation to the AWI Foundation. Contingent compensation payments related to the acquisition. Contingent compensation payments related to 2020 acquisitions recorded as a component of net cash provided by operating activities. . For the Twelve Months Ended December 31, For the Three Months Ended March 31: 2017 2018 2019 2020 2021 2022 Net cash provided by operating activities $170 $203 $183 $219 $187 $182 Net cash (used for) provided by investing activities ($54) $310 ($89) ($141) ($14) $28 Net cash provided by operating and investing activities $116 $513 $94 $78 $173 $211 Add: Acquisitions, net 31 22 56 165 1 3 (Less)/Add: (Proceeds) Payments related to the sale of international, net1 - (272) 66 (20) 12 - (Less)/Add: Net environmental (recoveries) expenses - (27) 5 (12) (1) 1 Add: Litigation, net - - 23 - - - Add: Net payments to WAVE for portion of proceeds from sale of international business - - - 13 (Less): Proceeds from sale of idled China plant facility - - - (22) - - Add: Charitable contribution – AWI Foundation2 - - - 10 - - Add: Arktura deferred compensation3 - - - - 5 5 Add: Contingent consideration in excess of acquisition-date fair value4 - - - - - 2 Adjusted Free Cash Flow $147 $236 $244 $212 $190 $221 Adjusted Free Cash Flow as a % of Net Sales 16.4% 24.2% 23.5% 22.7% 17.2% 17.9%
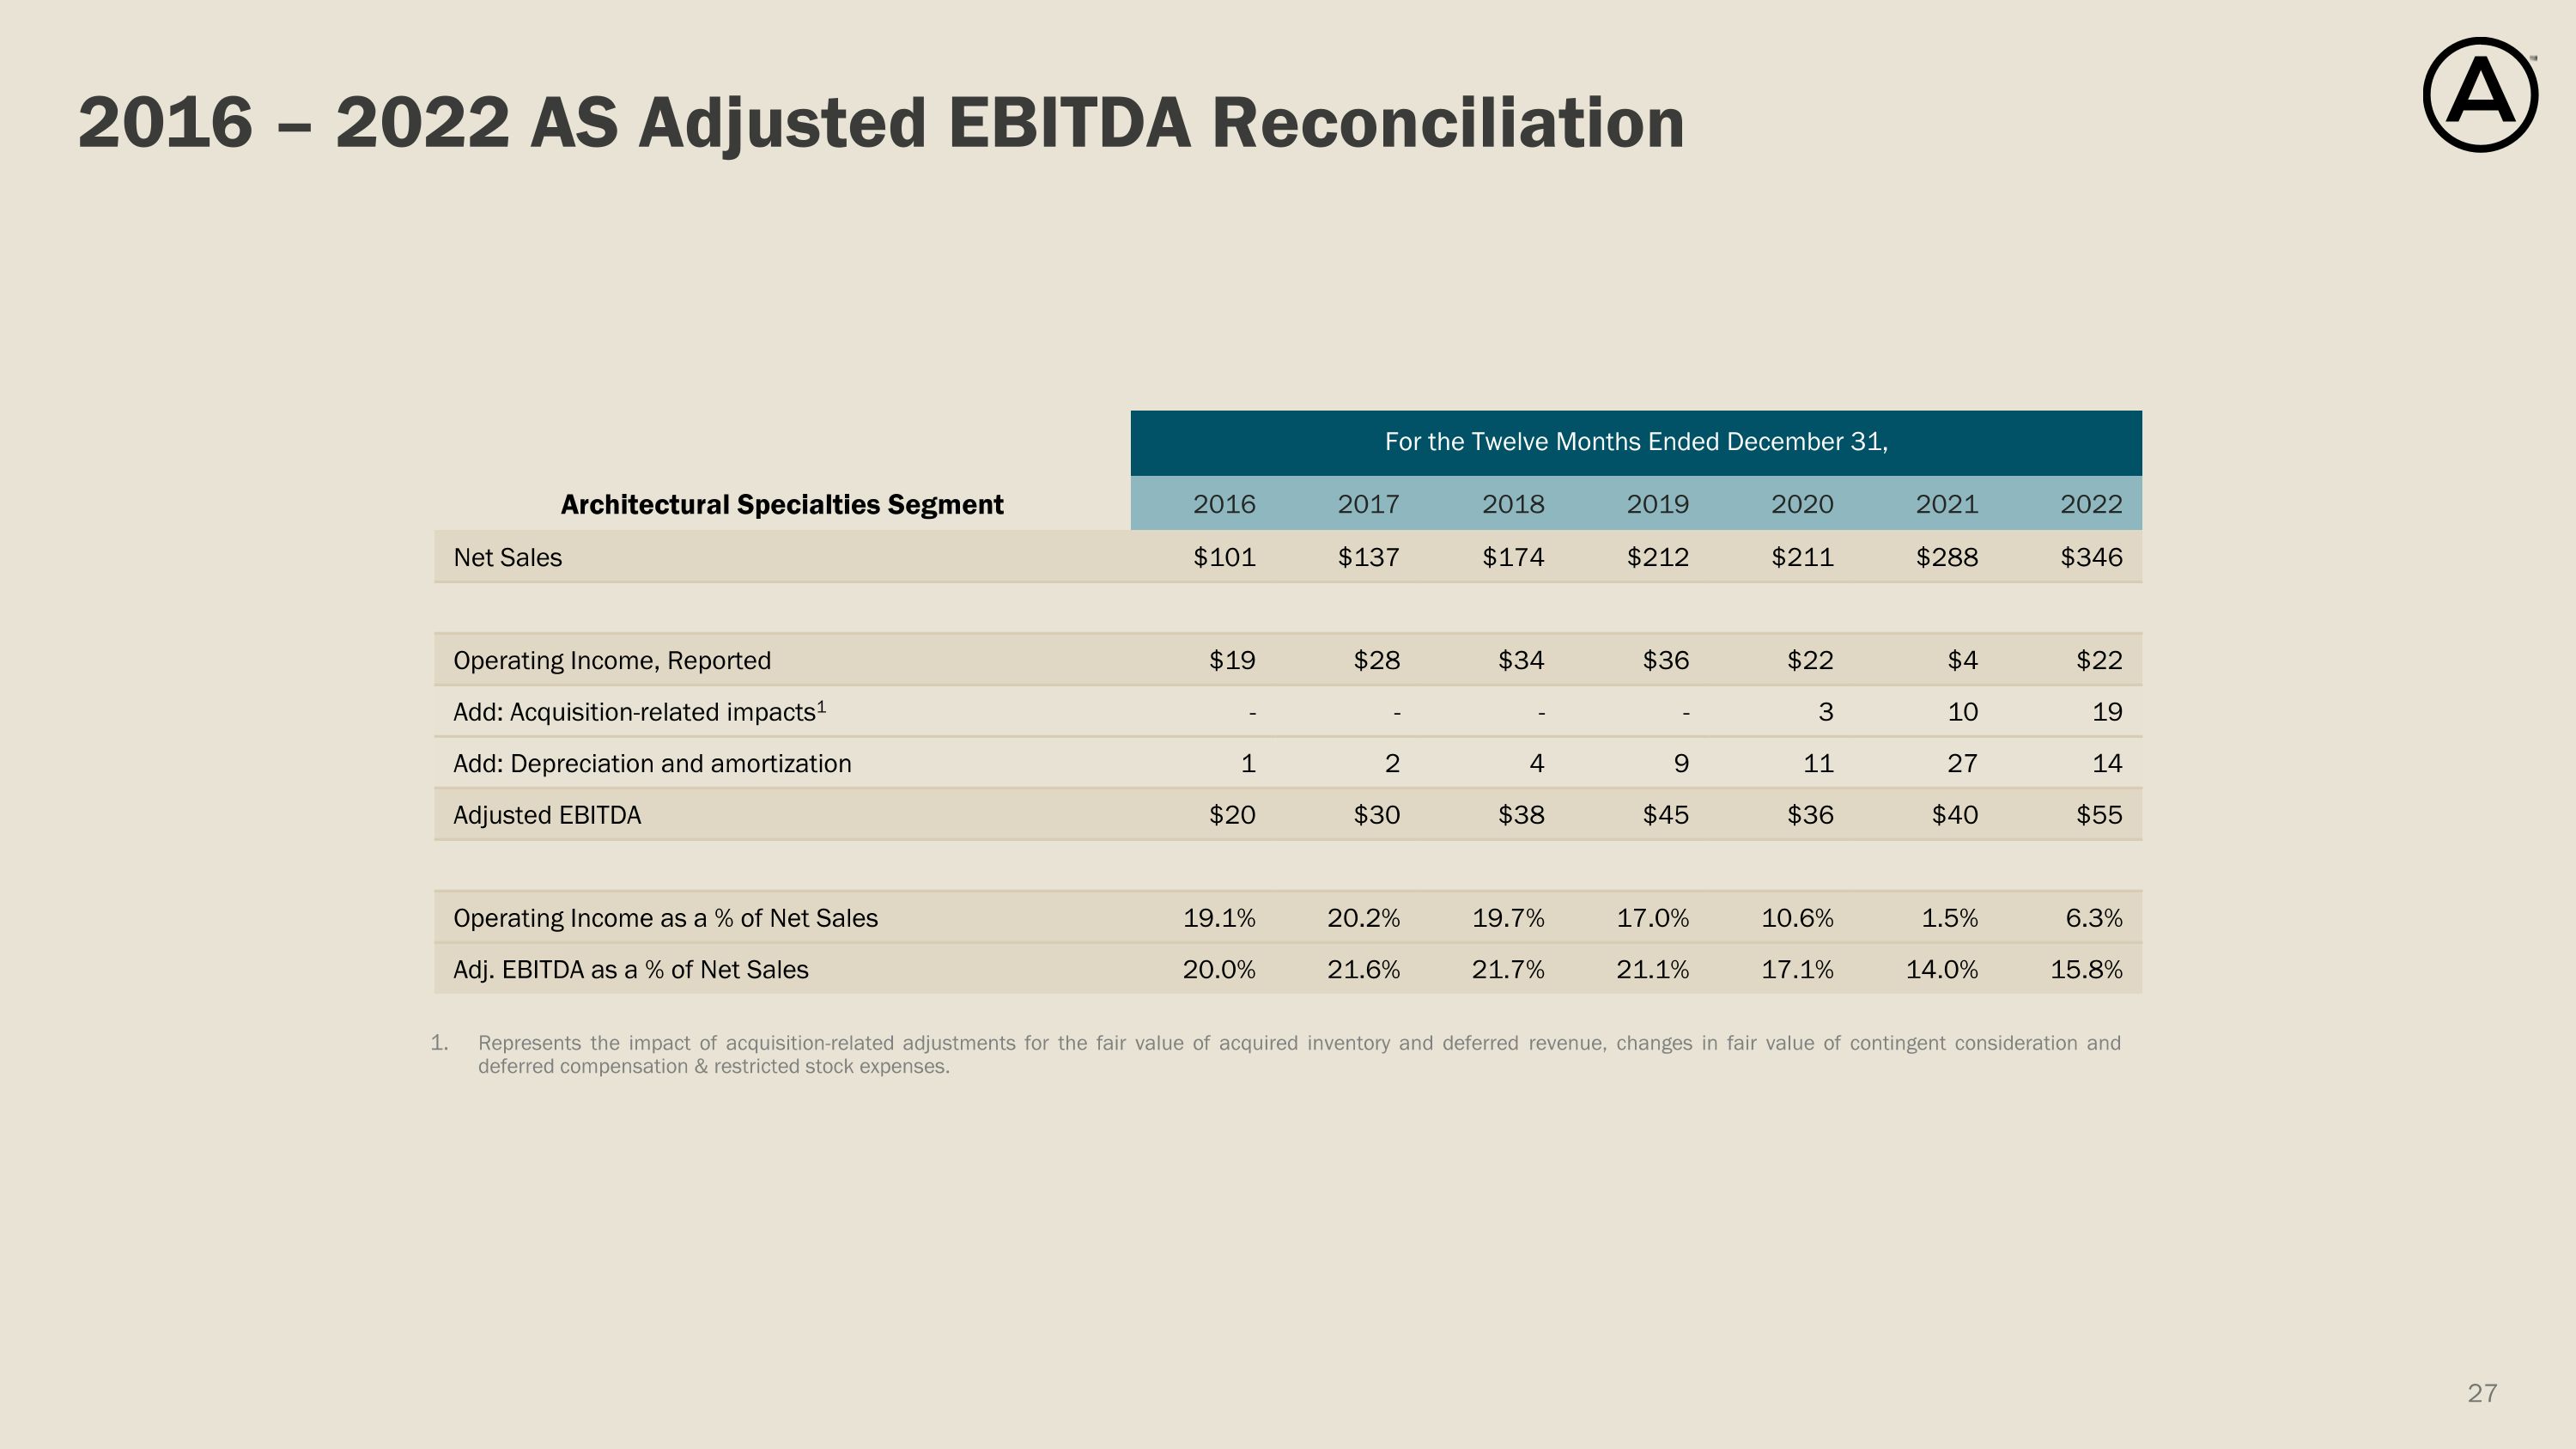
2016 – 2022 AS Adjusted EBITDA Reconciliation Represents the impact of acquisition-related adjustments for the fair value of acquired inventory and deferred revenue, changes in fair value of contingent consideration and deferred compensation & restricted stock expenses. For the Twelve Months Ended December 31, For the Twelve Months Ended December 31, For the Twelve Months Ended December 31, Architectural Specialties Segment 2016 2017 2018 2019 2020 2021 2022 Net Sales $101 $137 $174 $212 $211 $288 $346 Operating Income, Reported $19 $28 $34 $36 $22 $4 $22 Add: Acquisition-related impacts1 - - - - 3 10 19 Add: Depreciation and amortization 1 2 4 9 11 27 14 Adjusted EBITDA $20 $30 $38 $45 $36 $40 $55 Operating Income as a % of Net Sales 19.1% 20.2% 19.7% 17.0% 10.6% 1.5% 6.3% Adj. EBITDA as a % of Net Sales 20.0% 21.6% 21.7% 21.1% 17.1% 14.0% 15.8%
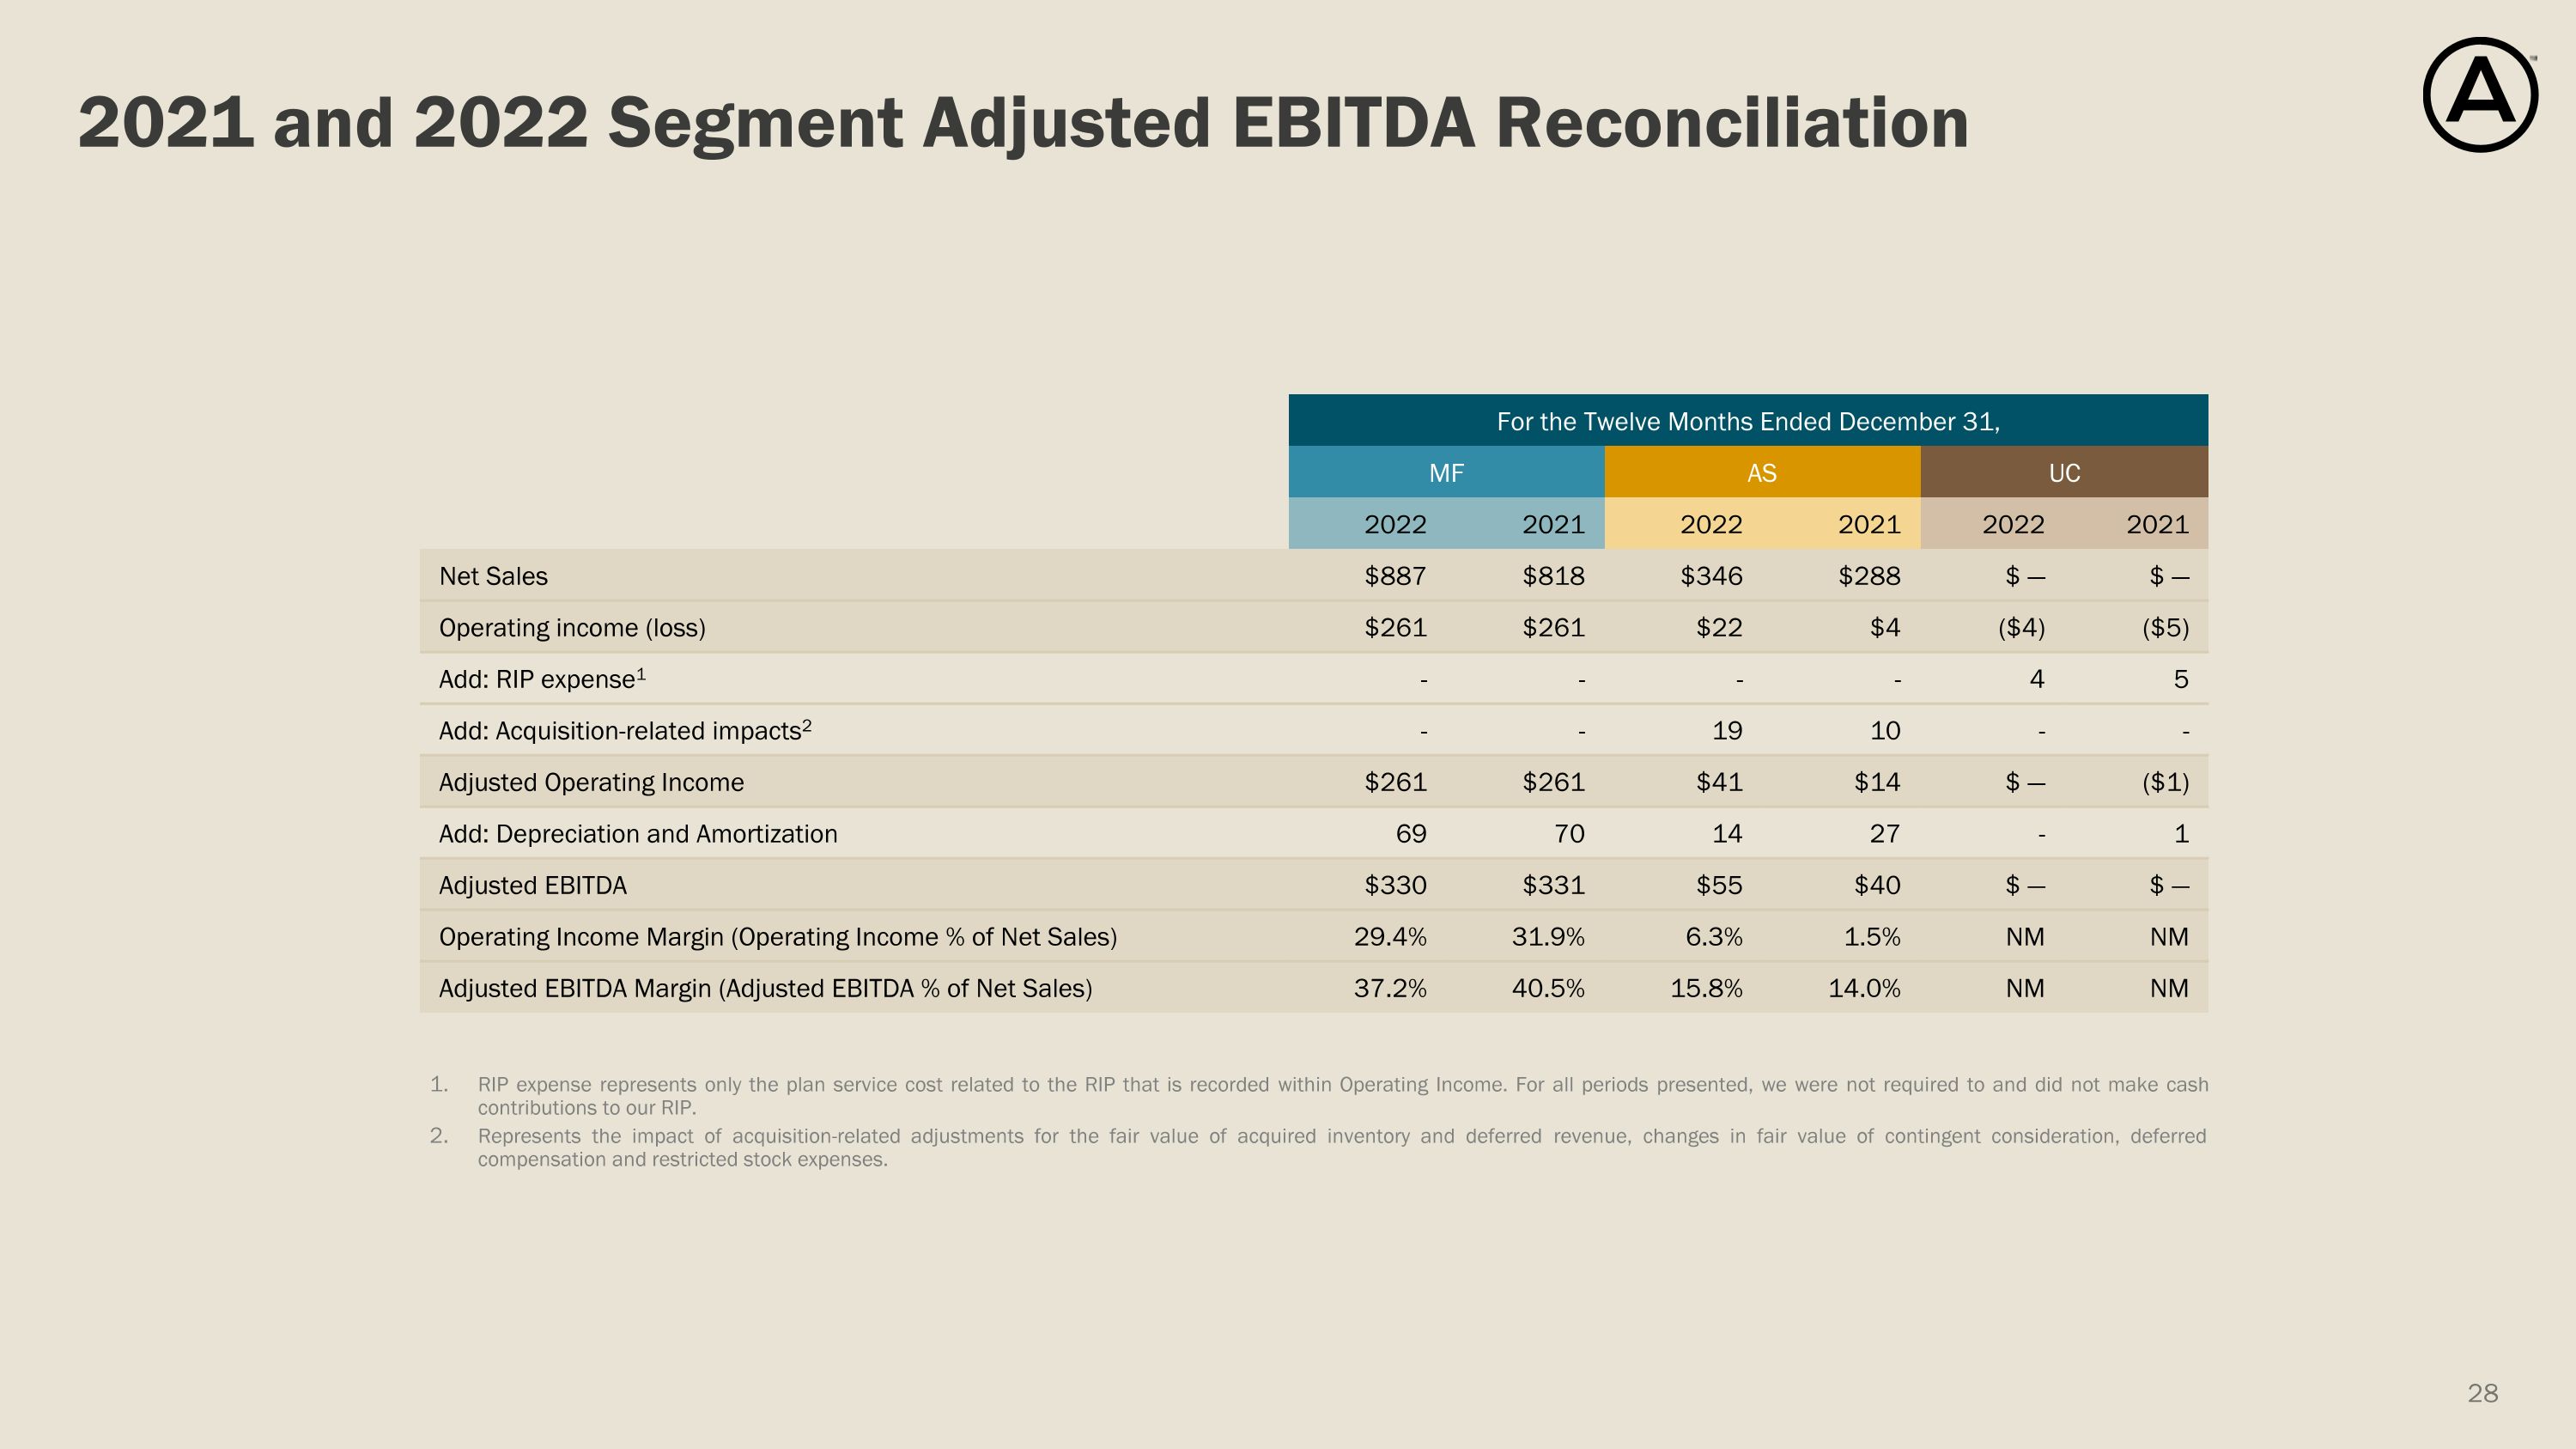
2021 and 2022 Segment Adjusted EBITDA Reconciliation RIP expense represents only the plan service cost related to the RIP that is recorded within Operating Income. For all periods presented, we were not required to and did not make cash contributions to our RIP. Represents the impact of acquisition-related adjustments for the fair value of acquired inventory and deferred revenue, changes in fair value of contingent consideration, deferred compensation and restricted stock expenses. For the Twelve Months Ended December 31, MF AS UC UNALLOCATED CORPORATE 2022 2021 2022 2021 2022 2021 Net Sales $887 $818 $346 $288 $ — $ — Operating income (loss) $261 $261 $22 $4 ($4) ($5) Add: RIP expense1 - - - - 4 5 Add: Acquisition-related impacts2 - - 19 10 - - Adjusted Operating Income $261 $261 $41 $14 $ — ($1) Add: Depreciation and Amortization 69 70 14 27 - 1 Adjusted EBITDA $330 $331 $55 $40 $ — $ — Operating Income Margin (Operating Income % of Net Sales) 29.4% 31.9% 6.3% 1.5% NM NM Adjusted EBITDA Margin (Adjusted EBITDA % of Net Sales) 37.2% 40.5% 15.8% 14.0% NM NM
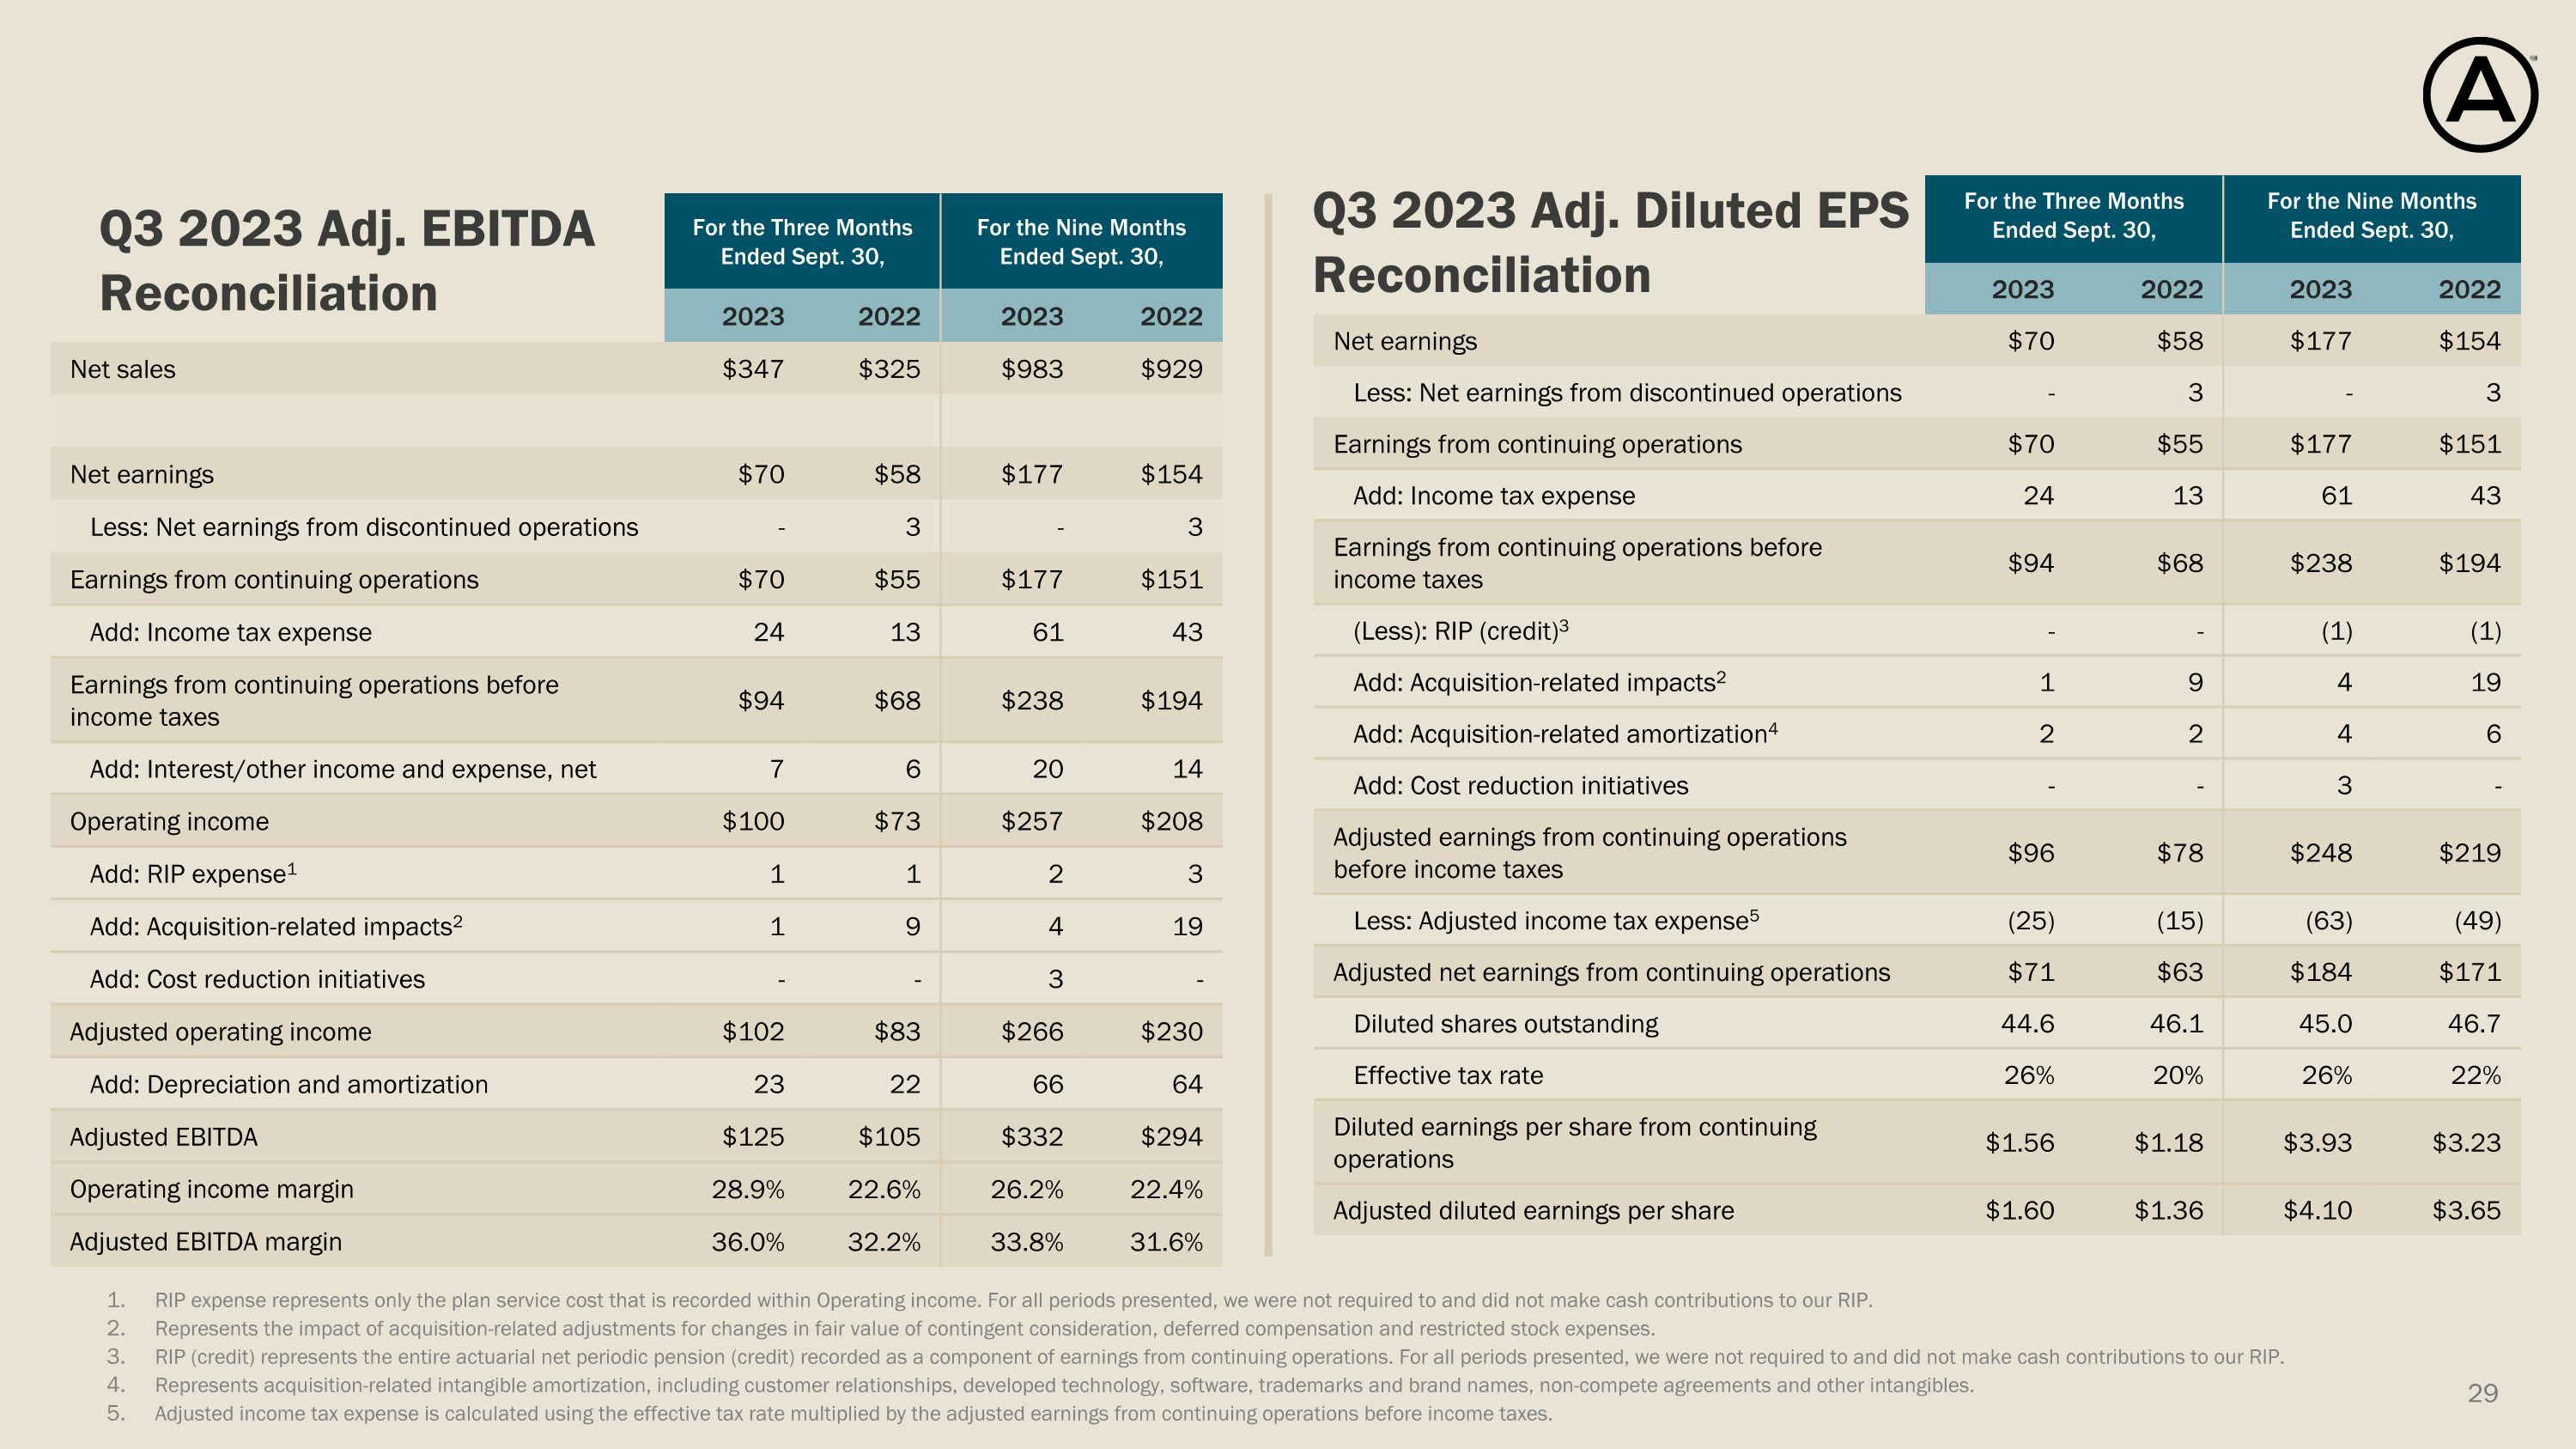
For the Three Months Ended Sept. 30, For the Nine Months Ended Sept. 30, 2023 2022 2023 2022 Net sales $347 $325 $983 $929 Net earnings $70 $58 $177 $154 Less: Net earnings from discontinued operations - 3 - 3 Earnings from continuing operations $70 $55 $177 $151 Add: Income tax expense 24 13 61 43 Earnings from continuing operations before income taxes $94 $68 $238 $194 Add: Interest/other income and expense, net 7 6 20 14 Operating income $100 $73 $257 $208 Add: RIP expense1 1 1 2 3 Add: Acquisition-related impacts2 1 9 4 19 Add: Cost reduction initiatives - - 3 - Adjusted operating income $102 $83 $266 $230 Add: Depreciation and amortization 23 22 66 64 Adjusted EBITDA $125 $105 $332 $294 Operating income margin 28.9% 22.6% 26.2% 22.4% Adjusted EBITDA margin 36.0% 32.2% 33.8% 31.6% For the Three Months Ended Sept. 30, For the Nine Months Ended Sept. 30, 2023 2022 2023 2022 Net earnings $70 $58 $177 $154 Less: Net earnings from discontinued operations - 3 - 3 Earnings from continuing operations $70 $55 $177 $151 Add: Income tax expense 24 13 61 43 Earnings from continuing operations before income taxes $94 $68 $238 $194 (Less): RIP (credit)3 - - (1) (1) Add: Acquisition-related impacts2 1 9 4 19 Add: Acquisition-related amortization4 2 2 4 6 Add: Cost reduction initiatives - - 3 - Adjusted earnings from continuing operations before income taxes $96 $78 $248 $219 Less: Adjusted income tax expense5 (25) (15) (63) (49) Adjusted net earnings from continuing operations $71 $63 $184 $171 Diluted shares outstanding 44.6 46.1 45.0 46.7 Effective tax rate 26% 20% 26% 22% Diluted earnings per share from continuing operations $1.56 $1.18 $3.93 $3.23 Adjusted diluted earnings per share $1.60 $1.36 $4.10 $3.65 Q3 2023 Adj. EBITDA Reconciliation Q3 2023 Adj. Diluted EPS Reconciliation RIP expense represents only the plan service cost that is recorded within Operating income. For all periods presented, we were not required to and did not make cash contributions to our RIP. Represents the impact of acquisition-related adjustments for changes in fair value of contingent consideration, deferred compensation and restricted stock expenses. RIP (credit) represents the entire actuarial net periodic pension (credit) recorded as a component of earnings from continuing operations. For all periods presented, we were not required to and did not make cash contributions to our RIP. Represents acquisition-related intangible amortization, including customer relationships, developed technology, software, trademarks and brand names, non-compete agreements and other intangibles. Adjusted income tax expense is calculated using the effective tax rate multiplied by the adjusted earnings from continuing operations before income taxes.
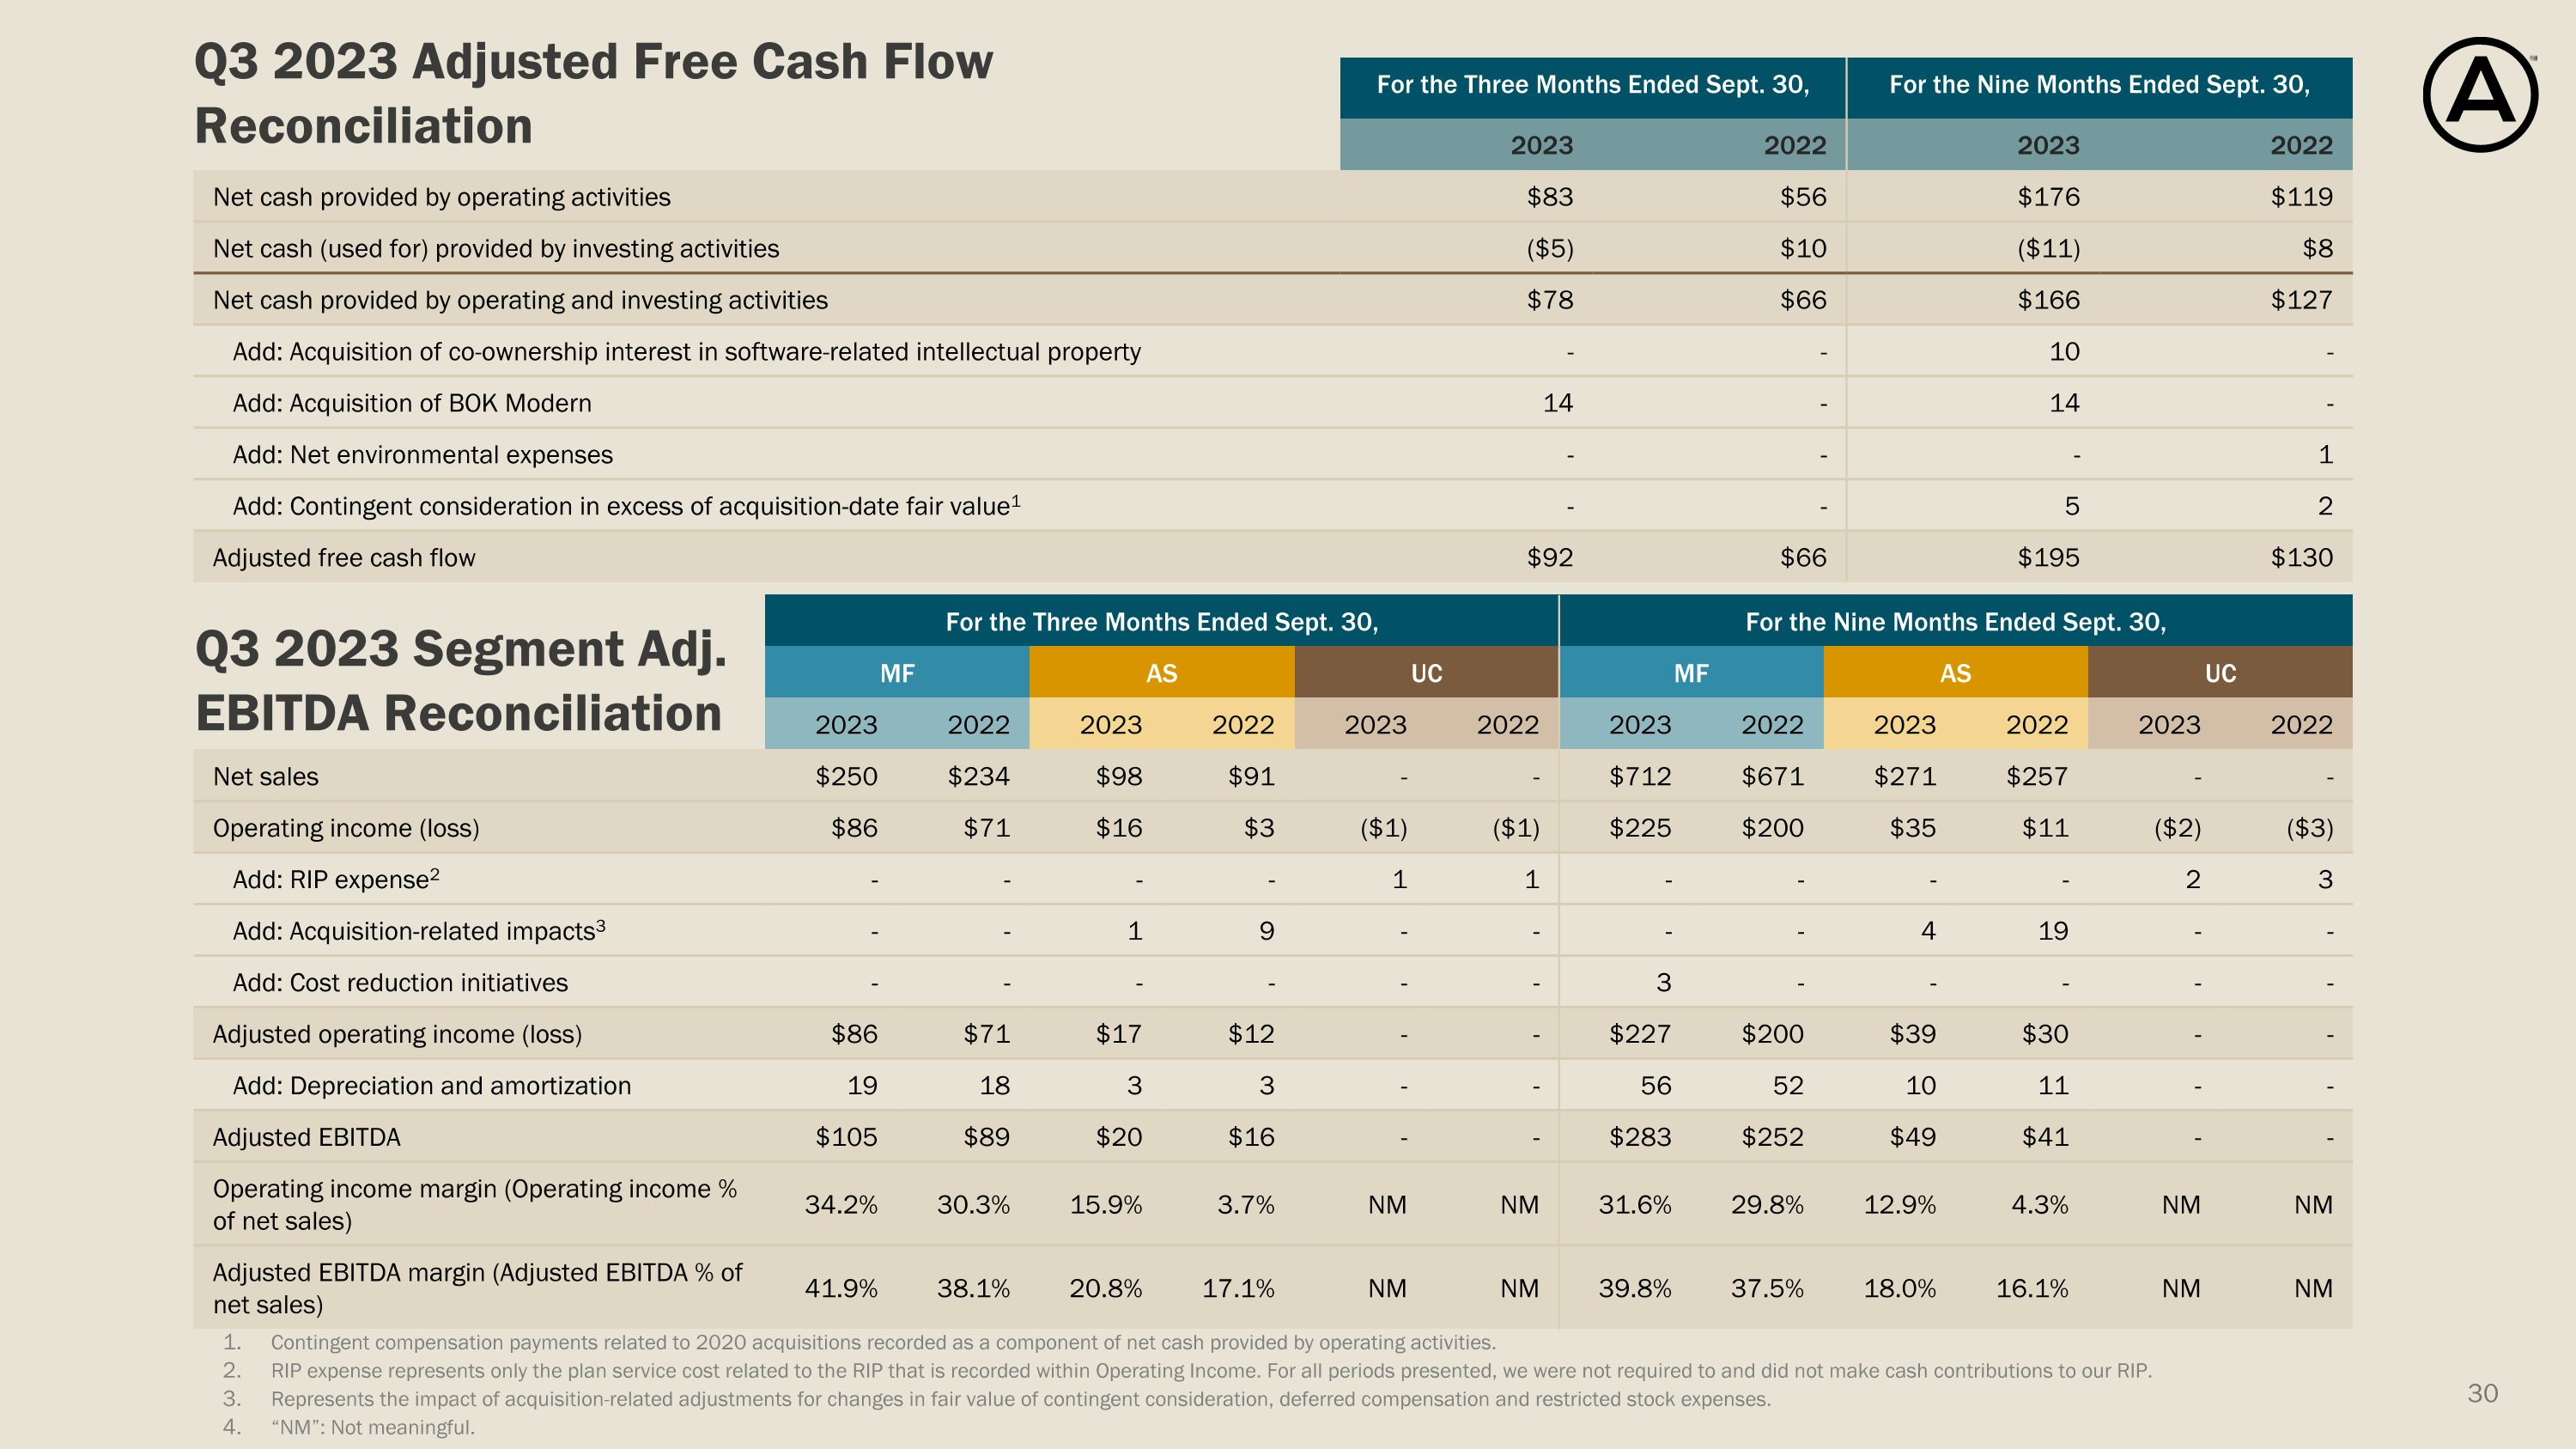
For the Three Months Ended Sept. 30, For the Nine Months Ended Sept. 30, 2023 2022 2023 2022 Net cash provided by operating activities $83 $56 $176 $119 Net cash (used for) provided by investing activities ($5) $10 ($11) $8 Net cash provided by operating and investing activities $78 $66 $166 $127 Add: Acquisition of co-ownership interest in software-related intellectual property - - 10 - Add: Acquisition of BOK Modern 14 - 14 - Add: Net environmental expenses - - - 1 Add: Contingent consideration in excess of acquisition-date fair value1 - - 5 2 Adjusted free cash flow $92 $66 $195 $130 For the Three Months Ended Sept. 30, For the Nine Months Ended Sept. 30, MF AS UC UNALLOCATED CORPORATE MF AS UC UNALLOCATED CORPORATE 2023 2022 2023 2022 2023 2022 2023 2022 2023 2022 2023 2022 Net sales $250 $234 $98 $91 - - $712 $671 $271 $257 - - Operating income (loss) $86 $71 $16 $3 ($1) ($1) $225 $200 $35 $11 ($2) ($3) Add: RIP expense2 - - - - 1 1 - - - - 2 3 Add: Acquisition-related impacts3 - - 1 9 - - - - 4 19 - - Add: Cost reduction initiatives - - - - - - 3 - - - - - Adjusted operating income (loss) $86 $71 $17 $12 - - $227 $200 $39 $30 - - Add: Depreciation and amortization 19 18 3 3 - - 56 52 10 11 - - Adjusted EBITDA $105 $89 $20 $16 - - $283 $252 $49 $41 - - Operating income margin (Operating income % of net sales) 34.2% 30.3% 15.9% 3.7% NM NM 31.6% 29.8% 12.9% 4.3% NM NM Adjusted EBITDA margin (Adjusted EBITDA % of net sales) 41.9% 38.1% 20.8% 17.1% NM NM 39.8% 37.5% 18.0% 16.1% NM NM Q3 2023 Adjusted Free Cash Flow Reconciliation Q3 2023 Segment Adj. EBITDA Reconciliation Contingent compensation payments related to 2020 acquisitions recorded as a component of net cash provided by operating activities. RIP expense represents only the plan service cost related to the RIP that is recorded within Operating Income. For all periods presented, we were not required to and did not make cash contributions to our RIP. Represents the impact of acquisition-related adjustments for changes in fair value of contingent consideration, deferred compensation and restricted stock expenses. “NM”: Not meaningful.
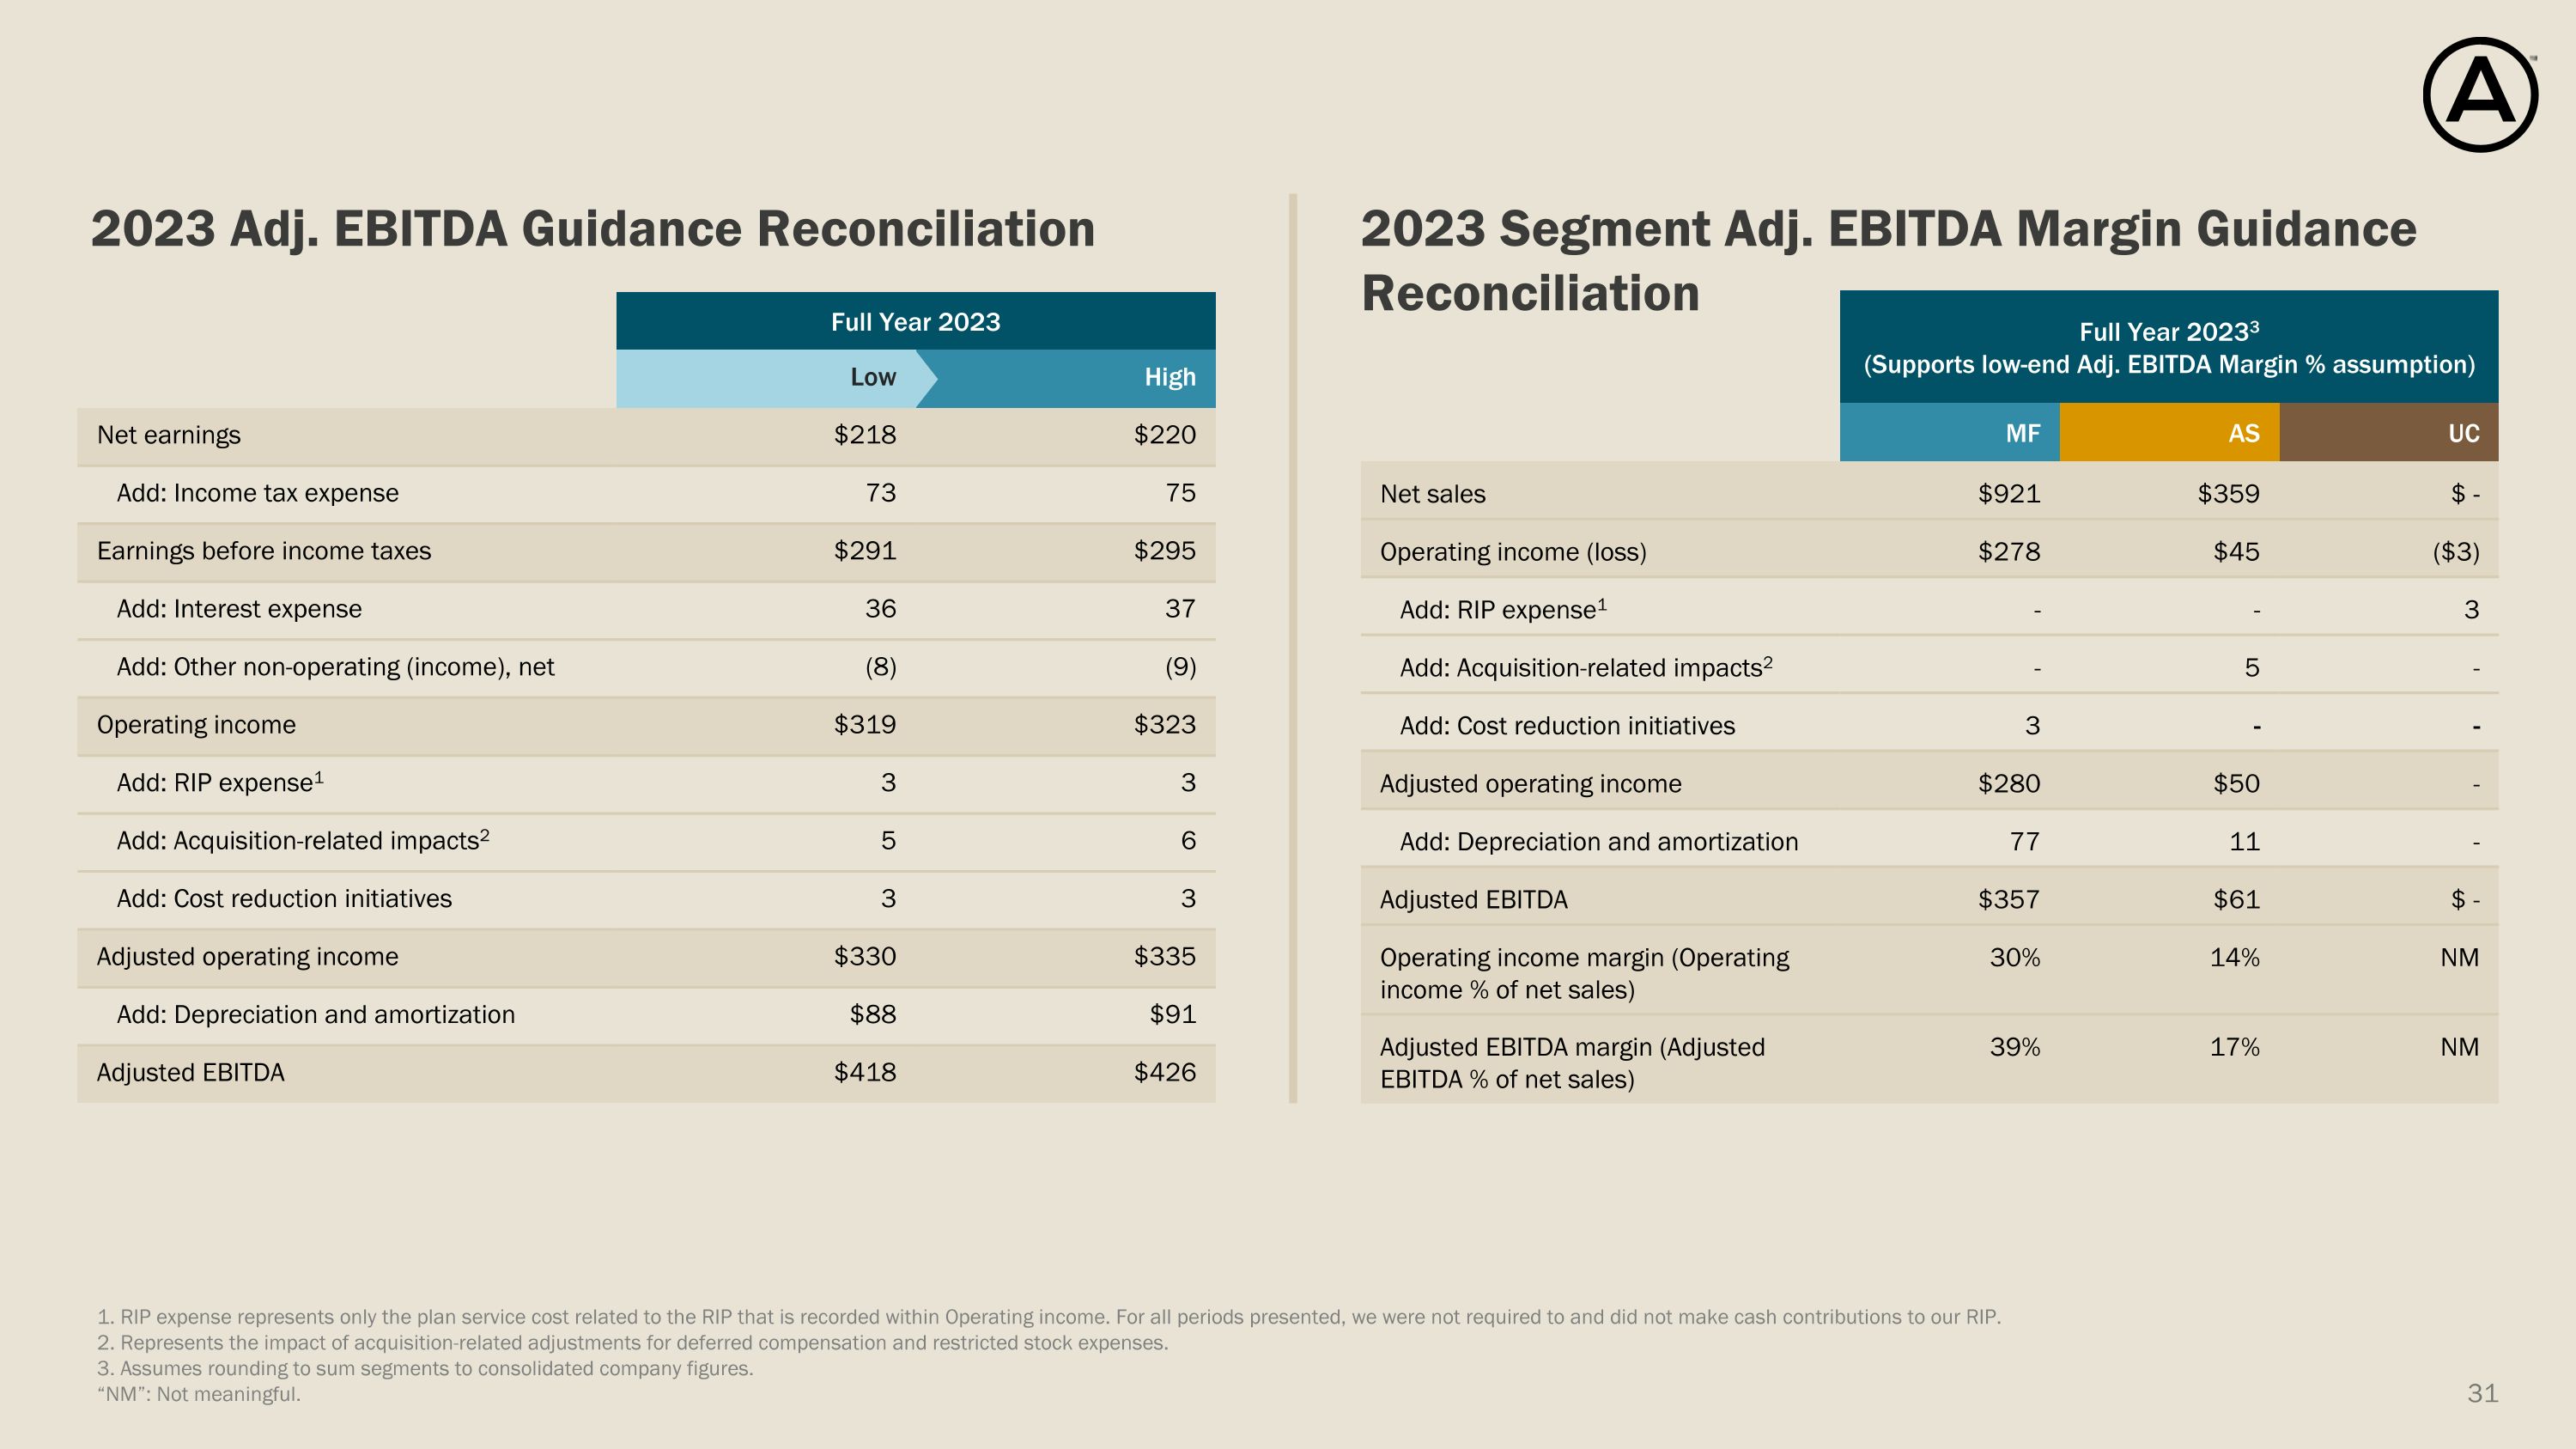
Full Year 2023 Low High Net earnings $218 $220 Add: Income tax expense 73 75 Earnings before income taxes $291 $295 Add: Interest expense 36 37 Add: Other non-operating (income), net (8) (9) Operating income $319 $323 Add: RIP expense1 3 3 Add: Acquisition-related impacts2 5 6 Add: Cost reduction initiatives 3 3 Adjusted operating income $330 $335 Add: Depreciation and amortization $88 $91 Adjusted EBITDA $418 $426 Full Year 20233 (Supports low-end Adj. EBITDA Margin % assumption) For the Three months Ended March 31, MF AS UC Net sales $921 $359 $ - Operating income (loss) $278 $45 ($3) Add: RIP expense1 - - 3 Add: Acquisition-related impacts2 - 5 - Add: Cost reduction initiatives 3 - - Adjusted operating income $280 $50 - Add: Depreciation and amortization 77 11 - Adjusted EBITDA $357 $61 $ - Operating income margin (Operating income % of net sales) 30% 14% NM Adjusted EBITDA margin (Adjusted EBITDA % of net sales) 39% 17% NM 2023 Adj. EBITDA Guidance Reconciliation 2023 Segment Adj. EBITDA Margin Guidance Reconciliation 1. RIP expense represents only the plan service cost related to the RIP that is recorded within Operating income. For all periods presented, we were not required to and did not make cash contributions to our RIP. 2. Represents the impact of acquisition-related adjustments for deferred compensation and restricted stock expenses. 3. Assumes rounding to sum segments to consolidated company figures. “NM”: Not meaningful.
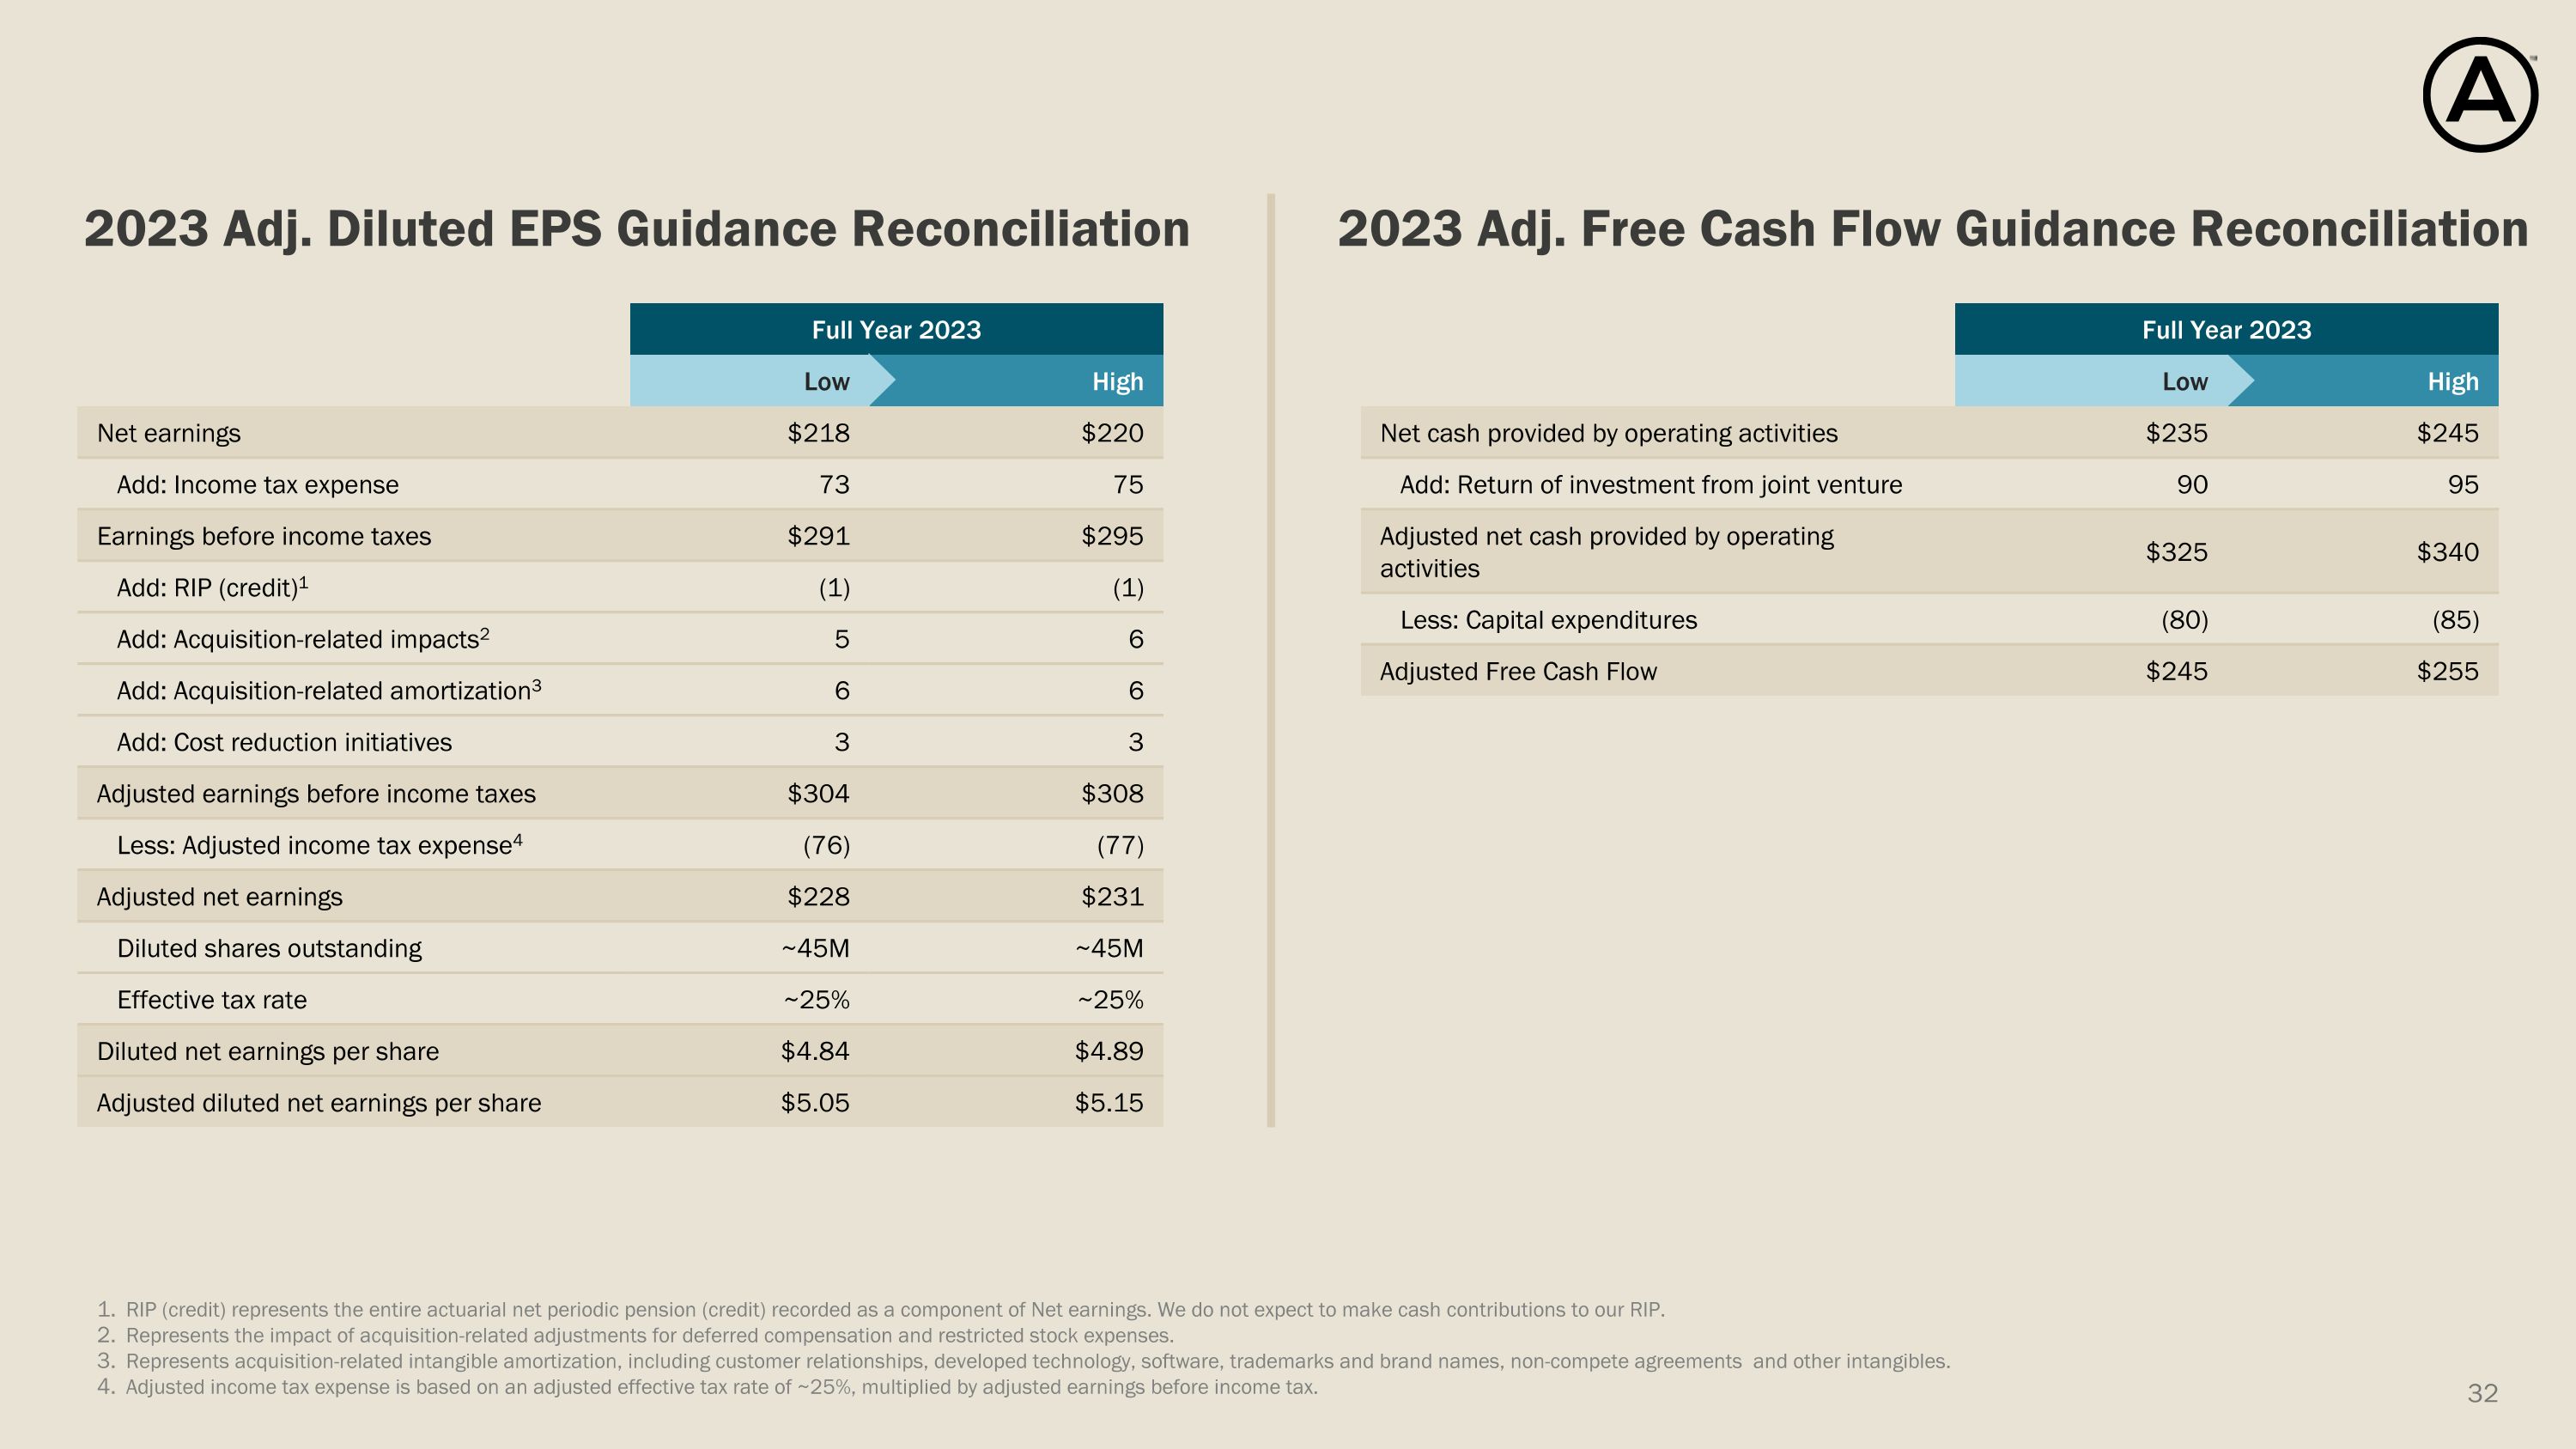
Full Year 2023 Low High Net earnings $218 $220 Add: Income tax expense 73 75 Earnings before income taxes $291 $295 Add: RIP (credit)1 (1) (1) Add: Acquisition-related impacts2 5 6 Add: Acquisition-related amortization3 6 6 Add: Cost reduction initiatives 3 3 Adjusted earnings before income taxes $304 $308 Less: Adjusted income tax expense4 (76) (77) Adjusted net earnings $228 $231 Diluted shares outstanding ~45M ~45M Effective tax rate ~25% ~25% Diluted net earnings per share $4.84 $4.89 Adjusted diluted net earnings per share $5.05 $5.15 Full Year 2023 Low High Net cash provided by operating activities $235 $245 Add: Return of investment from joint venture 90 95 Adjusted net cash provided by operating activities $325 $340 Less: Capital expenditures (80) (85) Adjusted Free Cash Flow $245 $255 2023 Adj. Diluted EPS Guidance Reconciliation 2023 Adj. Free Cash Flow Guidance Reconciliation RIP (credit) represents the entire actuarial net periodic pension (credit) recorded as a component of Net earnings. We do not expect to make cash contributions to our RIP. Represents the impact of acquisition-related adjustments for deferred compensation and restricted stock expenses. Represents acquisition-related intangible amortization, including customer relationships, developed technology, software, trademarks and brand names, non-compete agreements and other intangibles. Adjusted income tax expense is based on an adjusted effective tax rate of ~25%, multiplied by adjusted earnings before income tax.