Table of Contents

The Northwestern Mutual Life Insurance Company
VariableLife
June 30, 2007
Semi-Annual Reports
Northwestern Mutual Series Fund, Inc. Fidelity® VIP Mid Cap Portfolio Russell Investment Funds
Northwestern Mutual Variable Life Account
Northwestern Mutual Variable Life Account II
Northwestern Mutual®
90-1899 (0786) (REV 0707)
Table of Contents
How To Get More Information
Northwestern Mutual Express:
1-800-519-4665
Get up-to-date information about your Variable CompLife policy at your convenience with your policy number and your Personal Identification Number (PIN). Call toll-free to review policy values, fund performance information, and request a change to the allocations of your existing assets or future premiums/dividends.
Information on the Internet:
Northwestern Mutual Financial Network WWW.NMFN.COM
To obtain current performance information and information about Northwestern Mutual, visit us on our website. You can also visit us at our customer service section from our Web site for information on Policy values and current fund performance. This site also allows you to view past confirmation and policy statements, as well as transfer funds online.
To sign up for this service please call 1-866-424-2609 between 7 a.m. - 6 p.m. Central Time Monday – Friday. As always, your Investment Services representative of the Northwestern Mutual Financial Network is available to answer any questions you have about your variable life insurance policy or any of our products.
For inforce policy service on Variable CompLife, Custom Variable Universal Life, and Variable Whole Life, please call 1-866-424-2609, between 7 a.m. - 6 p.m. Central Time Monday – Friday.
For inforce policy service on Variable Executive Life, Variable Joint Life, Executive Variable Universal Life, and Survivorship Variable Universal Life, please call 1-866-464-3800, between 7:30 a.m. and 5:00 p.m. Central Time Monday - Friday.
Table of Contents
Contents
| Northwestern Mutual Series Fund, Inc. - Semi-Annual Report |
||
| Fidelity® VIP Mid Cap Portfolio - Semi-Annual Report (This report follows the end of the Northwestern Mutual Series Fund, Inc.) |
||
| Russell Investment Funds - Semi-Annual Report (This report follows the end of the Fidelity® VIP Mid Cap Portfolio.) |
||
| Prospectus Supplements |
||
The performance data quoted represents past performance. Past performance is historical and does not guarantee future performance. Investment return and principal value will fluctuate, so that shares, when redeemed, may be worth more or less than their original cost. Current performances may be lower or higher than the performance data quoted. For the most recent month-end performance information visit www.nmfn.com.
Table of Contents

Semi-Annual Report June 30, 2007

Northwestern Mutual Series Fund, Inc.
A Series Fund Offering Eighteen Portfolios
| · | Growth Stock Portfolio |
| · | Janus Capital Appreciation Portfolio |
| · | Large Cap Core Stock Portfolio |
| · | Index 500 Stock Portfolio |
| · | Capital Guardian Domestic Equity Portfolio |
| · | T. Rowe Price Equity Income Portfolio |
| · | Mid Cap Growth Stock Portfolio |
| · | Index 400 Stock Portfolio |
| · | AllianceBernstein Mid Cap Value Portfolio |
| · | Small Cap Growth Stock Portfolio |
| · | T. Rowe Price Small Cap Value Portfolio |
| · | International Growth Portfolio |
| · | Franklin Templeton International Equity Portfolio |
| · | Money Market Portfolio |
| · | Select Bond Portfolio |
| · | High Yield Bond Portfolio |
| · | Balanced Portfolio |
| · | Asset Allocation Portfolio |
Table of Contents
Letter to Policy Owners
June 30, 2007
Stocks managed solid returns during the six months ended June 30, 2007, despite a bumpy ride, while bonds produced modest but positive results. Once again, the riskiest, lowest-rated securities outperformed across virtually all markets. This ready acceptance of risk in pursuit of higher returns appears to us to be at odds with some important investment developments. Volatility is rising — reflecting the high degree of leverage in the system and fluidity of global capital flows — at a time when asset prices stand at lofty levels and the U.S. economy faces the challenge of a swooning housing market.
One way to see these trends at work is to look at the U.S. economy, where the effect of leverage is evident in housing. Home sales, housing starts, and price appreciation all hit records in 2005, and leverage worked to drive up asset prices as long as buyers had ready access to cheap financing. But with rates rising and lenders pulling back hard on credit, capital is no longer as cheap or easy to come by, with a predictable effect — prices of existing homes fell 2%
year-over-year through May, 2007. And with estimates of $500 billion or more in adjustable-rate sub-prime loans to reset next year, we think we have yet to see the full effect of higher rates on home prices and the economy.
With housing weighing on consumer spending and confidence, U.S. economic growth in the first quarter ran at the slowest pace in four years, though it appears to have bounced back in the second quarter. Call it a “mid-cycle slowdown” as the economy takes a breather from its extended recovery that began in 2002.
But even as U.S. growth slowed, the global economy appeared very healthy, so much so that many foreign central banks raised interest rates to keep their economies from overheating. Rapid growth among emerging market countries in particular helped drive positive performance for companies in Energy, Materials, and Industrials, which were three of the four best-performing sectors in the S&P 500® Index. This U.S. stock benchmark returned 6.29% for the six months and touched a record high.
In addition, equities continued to benefit from a ready supply of investment capital — demand from sources as diverse as foreign central banks, hedge funds and private equity firms, corporate cash, petrodollars, and overseas household savings provided a boost to global asset prices. And while there is no widely available gauge of leverage in the system, our sense is that it is another key factor keeping asset prices across many markets in the neighborhood of all-time highs.
These effects were not limited to U.S. markets — emerging market stocks attracted massive global asset flows, helping them outperform shares in developed economies. For the six months, the MSCI Emerging Market Index returned 16.11%, compared with 10.89% for the MSCI EAFE Index, a measure of performance in developed countries. As a result, many European and emerging market stock indices reached record highs in recent months.
In the U.S. bond market too, volatility and acceptance of risk were dominant themes. In terms of volatility, in May and June alone the yield on the bellwether 10-year Treasury note jumped from around 4.65% to 5.30%, before finishing the period at 5.02%. For the six months, the investment-grade Lehman Aggregate Bond Index returned just 0.98% while a measure of “junk bond” performance returned almost three times that amount, as Lehman’s U.S. Corporate High-Yield Index returned 2.87%.
With prices and leverage in so many markets at lofty levels, it makes sense to be on guard against complacency — in the euphoria of rising markets, it’s easy to forget that asset prices can also go down. This is especially true because with yields rising and bond investors seemingly less receptive to the large debt offerings used to finance headline-grabbing buyouts, the cheap capital that has supported stock performance may be increasingly hard to come by.
But of course, there’s no way to know when, or even if, the effects of global capital flows and leverage will reverse themselves. One famous example worth recalling here is former Fed Chairman Alan Greenspan’s “irrational exuberance” speech — more than three years before the market peaked in 2000. In this environment, it makes sense to take a prudent, measured approach that doesn’t leave you overexposed to any single area or segment of the market. Your financial representative can work with you to regularly review your insurance and investment goals and help evaluate your portfolio’s composition and its suitability for your financial objectives.


Mark G. Doll
Senior Vice President
Investments
The Northwestern Mutual Life Insurance Company
(Northwestern Mutual)

Table of Contents
Northwestern Mutual Series Fund, Inc.
Table of Contents
| Series Fund Overview and Schedules of Investments: |
||
| 1 | ||
| 4 | ||
| 6 | ||
| 9 | ||
| 14 | ||
| 17 | ||
| 20 | ||
| 23 | ||
| 28 | ||
| 31 | ||
| 34 | ||
| 38 | ||
| 41 | ||
| 44 | ||
| 46 | ||
| 55 | ||
| 60 | ||
| 75 | ||
| 92 | ||
| 96 | ||
| 100 | ||
| 106 | ||
| 109 | ||
| 115 | ||
| 116 | ||
| 118 | ||
| Approval and Continuance of Investment Advisory and Sub-Advisory Agreements |
120 | |
Table of Contents
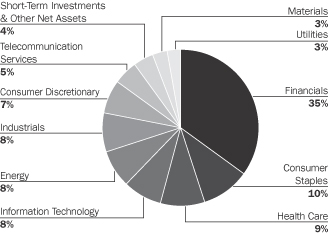
Sector Allocation 6/30/07
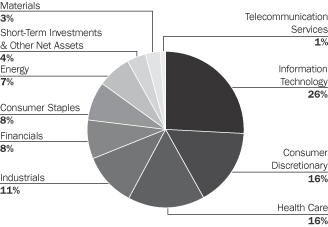
Sector Allocation is based on Net Assets.
Sector Allocation is subject to change.
Expense Example
As a shareholder of the Portfolio, you incur two types of costs: (1) transaction costs and (2) ongoing costs, including management fees and other Portfolio expenses. This Example is intended to help you understand your ongoing costs (in dollars) of investing in the Portfolio and to compare these costs with the ongoing costs of investing in other mutual funds.
The Example is based on an investment of $1,000 invested at the beginning of the period and held for the entire period (January 1, 2007 to June 30, 2007).
Actual Expenses
The first line of the table below provides information about actual account values and actual expenses. You may use the information in this line, together with the amount you invested, to estimate the expenses that you paid over the period. Simply divide your account value by $1,000 (for example, an $8,600 account value divided by $1,000 = 8.6), then multiply the result by the number in the first line under the heading entitled “Expenses Paid During Period” to estimate the expenses you paid on your account during this period.
Hypothetical Example for Comparison Purposes
The second line of the table below provides information about hypothetical account values and hypothetical expenses based on the Portfolio’s actual expense ratio and an assumed rate of return of 5% per year before expenses, which is not the Portfolio’s actual return. The hypothetical account values and expenses may not be used to estimate the actual ending account balance or expenses you paid for the period. You may use this information to compare the ongoing costs of investing in the Portfolio and other funds. To do so, compare this 5% hypothetical example with the 5% hypothetical examples that appear in the shareholder reports of the other funds.
Please note that the expenses shown in the table are meant to highlight your ongoing costs only and do not reflect any transactional costs or separate account charges. Therefore, the second line of the table is useful in comparing ongoing costs only, and will not help you determine the relative total costs of owning different funds. In addition, if these transactional costs or separate account charges were included, your costs would have been higher.
| Beginning Account Value January 1, 2007 |
Ending Account Value June 30, 2007 |
Expenses 2007* | |||||||
| Actual |
$ | 1,000.00 | $ | 1,067.90 | $ | 2.15 | |||
| Hypothetical (5% return before expenses) |
$ | 1,000.00 | $ | 1,022.71 | $ | 2.11 | |||
| * | Expenses are equal to the Portfolio’s annualized expense ratio of 0.42%, multiplied by the average account value over the period, multiplied by 181/365 (to reflect the one-half year period). |
Growth Stock Portfolio
1
Table of Contents
Growth Stock Portfolio
Northwestern Mutual Series Fund, Inc.
Schedule of Investments
June 30, 2007 (unaudited)
| Common Stocks (96.3%) | Shares/ $ Par |
Value $ (000’s) | ||
| Consumer Discretionary (15.6%) | ||||
| Abercrombie & Fitch Co. |
80,500 | 5,875 | ||
| *Comcast Corp. — Class A |
278,550 | 7,833 | ||
| Fortune Brands, Inc. |
69,200 | 5,700 | ||
| Hilton Hotels Corp. |
299,800 | 10,034 | ||
| International Game Technology |
162,200 | 6,439 | ||
| J.C. Penney Co., Inc. |
86,000 | 6,225 | ||
| Johnson Controls, Inc. |
99,900 | 11,566 | ||
| *Kohl’s Corp. |
91,800 | 6,521 | ||
| The McGraw-Hill Companies, Inc. |
129,200 | 8,796 | ||
| News Corp. — Class A |
353,600 | 7,500 | ||
| NIKE, Inc. — Class B |
116,000 | 6,762 | ||
| Omnicom Group, Inc. |
88,000 | 4,657 | ||
| Staples, Inc. |
296,850 | 7,044 | ||
| *Starbucks Corp. |
157,900 | 4,143 | ||
| Starwood Hotels & Resorts Worldwide, Inc. |
57,900 | 3,883 | ||
| Target Corp. |
126,800 | 8,064 | ||
| Time Warner, Inc. |
329,200 | 6,926 | ||
| Total |
117,968 | |||
| Consumer Staples (7.8%) |
||||
| Altria Group, Inc. |
77,900 | 5,464 | ||
| Avon Products, Inc. |
236,000 | 8,673 | ||
| CVS/Caremark Corp. |
309,129 | 11,268 | ||
| PepsiCo, Inc. |
193,400 | 12,542 | ||
| The Procter & Gamble Co. |
162,400 | 9,937 | ||
| Walgreen Co. |
127,100 | 5,534 | ||
| Wal-Mart Stores, Inc. |
118,300 | 5,691 | ||
| Total |
59,109 | |||
| Energy (7.5%) |
||||
| Baker Hughes, Inc. |
102,300 | 8,606 | ||
| ConocoPhillips |
50,316 | 3,950 | ||
| Diamond Offshore Drilling, Inc. |
51,900 | 5,271 | ||
| EOG Resources, Inc. |
92,000 | 6,722 | ||
| Exxon Mobil Corp. |
124,034 | 10,404 | ||
| Schlumberger, Ltd. |
106,500 | 9,046 | ||
| Valero Energy Corp. |
97,900 | 7,231 | ||
| XTO Energy, Inc. |
91,400 | 5,493 | ||
| Total |
56,723 | |||
| Financials (8.3%) |
||||
| American Express Co. |
146,400 | 8,957 | ||
| American International Group, Inc. |
81,900 | 5,735 | ||
| *The Blackstone Group LP |
25,800 | 755 | ||
| Chicago Mercantile Exchange Holdings, Inc. |
6,900 | 3,687 | ||
| Genworth Financial, Inc. |
70,400 | 2,422 | ||
| The Goldman Sachs Group, Inc. |
43,100 | 9,342 | ||
| Legg Mason, Inc. |
68,000 | 6,690 | ||
| Common Stocks (96.3%) | Shares/ $ Par |
Value $ (000’s) | ||
| Financials continued |
||||
| Lehman Brothers Holdings, Inc. |
95,100 | 7,087 | ||
| NYSE Euronext |
49,900 | 3,674 | ||
| Prudential Financial, Inc. |
77,100 | 7,496 | ||
| UBS AG |
113,000 | 6,781 | ||
| Total |
62,626 | |||
| Health Care (16.1%) |
||||
| Abbott Laboratories |
135,500 | 7,256 | ||
| *Amgen, Inc. |
66,600 | 3,682 | ||
| Baxter International, Inc. |
113,800 | 6,411 | ||
| *Celgene Corp. |
85,500 | 4,902 | ||
| *Genentech, Inc. |
129,400 | 9,790 | ||
| *Genzyme Corp. |
81,600 | 5,255 | ||
| *Gilead Sciences, Inc. |
264,800 | 10,267 | ||
| Johnson & Johnson |
132,200 | 8,146 | ||
| Medtronic, Inc. |
188,400 | 9,770 | ||
| Merck & Co., Inc. |
204,800 | 10,200 | ||
| Novartis AG, ADR |
147,600 | 8,276 | ||
| *St. Jude Medical, Inc. |
135,000 | 5,601 | ||
| *Thermo Fisher Scientific, Inc. |
189,600 | 9,806 | ||
| UnitedHealth Group, Inc. |
111,000 | 5,677 | ||
| Wyeth |
134,100 | 7,689 | ||
| *Zimmer Holdings, Inc. |
102,600 | 8,710 | ||
| Total |
121,438 | |||
| Industrials (11.3%) |
||||
| The Boeing Co. |
95,300 | 9,164 | ||
| Danaher Corp. |
129,600 | 9,785 | ||
| FedEx Corp. |
76,000 | 8,434 | ||
| General Electric Co. |
331,300 | 12,682 | ||
| Honeywell International, Inc. |
173,300 | 9,753 | ||
| Roper Industries, Inc. |
140,200 | 8,005 | ||
| *Spirit AeroSystems Holdings, Inc. |
225,700 | 8,136 | ||
| Textron, Inc. |
69,000 | 7,598 | ||
| United Technologies Corp. |
167,500 | 11,881 | ||
| Total |
85,438 | |||
| Information Technology (25.6%) |
||||
| Accenture, Ltd. — Class A |
219,911 | 9,432 | ||
| *Adobe Systems, Inc. |
44,900 | 1,803 | ||
| *Amdocs, Ltd. |
228,600 | 9,103 | ||
| *Apple, Inc. |
65,100 | 7,945 | ||
| *Autodesk, Inc. |
99,000 | 4,661 | ||
| *BEA Systems, Inc. |
421,100 | 5,765 | ||
| *Broadcom Corp. — Class A |
241,250 | 7,057 | ||
| *Cisco Systems, Inc. |
495,500 | 13,799 | ||
| *Corning, Inc. |
282,100 | 7,208 | ||
| *eBay, Inc. |
248,200 | 7,987 | ||
| *Electronic Arts, Inc. |
130,300 | 6,166 | ||
| *Google, Inc. — Class A |
37,842 | 19,805 | ||
| Hewlett-Packard Co. |
260,500 | 11,624 | ||
| Intel Corp. |
161,000 | 3,825 | ||
| Common Stocks (96.3%) | Shares/ $ Par |
Value $ (000’s) |
|||
| Information Technology continued |
|||||
| International Business Machines Corp. |
69,800 | 7,346 | |||
| KLA-Tencor Corp. |
139,600 | 7,671 | |||
| Maxim Integrated Products, Inc. |
211,300 | 7,060 | |||
| Microsoft Corp. |
378,200 | 11,146 | |||
| *Oracle Corp. |
397,300 | 7,831 | |||
| QUALCOMM, Inc. |
270,700 | 11,745 | |||
| Telefonaktiebolaget LM Ericsson, ADR |
198,700 | 7,926 | |||
| Texas Instruments, Inc. |
232,600 | 8,753 | |||
| *Yahoo!, Inc. |
241,810 | 6,560 | |||
| Total |
192,218 | ||||
| Materials (2.6%) |
|||||
| Monsanto Co. |
164,100 | 11,083 | |||
| Praxair, Inc. |
113,600 | 8,178 | |||
| Total |
19,261 | ||||
| Telecommunication Services (1.5%) |
|||||
| *NII Holdings, Inc. |
141,400 | 11,417 | |||
| Total |
11,417 | ||||
| Total Common Stocks |
726,198 | ||||
| Money Market Investments (3.8%) | |||||
| Federal Government & Agencies (0.2%) |
| ||||
| Fannie Mae, |
1,700,000 | 1,681 | |||
| Total |
1,681 | ||||
| Finance Lessors (2.0%) |
|||||
| (b)Thunder Bay Funding, Inc., 5.31%, 7/16/07 |
15,000,000 | 14,965 | |||
| Total |
14,965 | ||||
| National Commercial Banks (1.6%) |
|||||
| (b)UBS Finance LLC, 5.35%, 7/2/07 |
12,200,000 | 12,196 | |||
| Total |
12,196 | ||||
| Total Money Market Investments (Cost: $28,841) |
28,842 | ||||
| Total Investments (100.1%) (Cost $601,549)(a) |
755,040 | ||||
| Other Assets, Less Liabilities (-0.1%) |
(915 | ) | |||
| Net Assets (100.0%) |
754,125 | ||||
| * | Non-Income Producing |
ADR after the name of a security represents — American Depositary Receipt.
The Accompanying Notes are an Integral Part of the Financial Statements.
2
Growth Stock Portfolio
Table of Contents
Growth Stock Portfolio
| (a) | At June 30, 2007 the aggregate cost of securities for federal tax purposes (in thousands) was $601,549 and the net unrealized appreciation of investments based on that cost was $153,491 which is comprised of $162,455 aggregate gross unrealized appreciation and $8,964 aggregate gross unrealized depreciation. |
| (b) | All or a portion of the securities have been committed as collateral for open futures positions or when-issued securities. Information regarding open futures contracts as of period end is summarized below. |
| Issuer (000’s) | Number of Contracts |
Expiration Date |
Unrealized Appreciation/ (Depreciation) (000’s) |
|||||
| S&P 500 Index |
46 | 9/07 | $ | (111 | ) | |||
| (Total Notional Value at |
||||||||
The Accompanying Notes are an Integral Part of the Financial Statements.
Growth Stock Portfolio
3
Table of Contents
Janus Capital Appreciation Portfolio
Sector Allocation 6/30/07
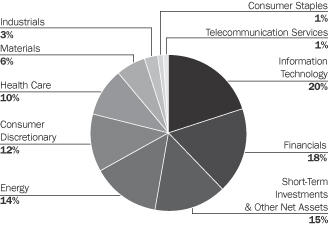
Sector Allocation is based on Net Assets.
Sector Allocation is subject to change.
Expense Example
As a shareholder of the Portfolio, you incur two types of costs: (1) transaction costs and (2) ongoing costs, including management fees and other Portfolio expenses. This Example is intended to help you understand your ongoing costs (in dollars) of investing in the Portfolio and to compare these costs with the ongoing costs of investing in other mutual funds.
The Example is based on an investment of $1,000 invested at the beginning of the period and held for the entire period (January 1, 2007 to June 30, 2007).
Actual Expenses
The first line of the table below provides information about actual account values and actual expenses. You may use the information in this line, together with the amount you invested, to estimate the expenses that you paid over the period. Simply divide your account value by $1,000 (for example, an $8,600 account value divided by $1,000 = 8.6), then multiply the result by the number in the first line under the heading entitled “Expenses Paid During Period” to estimate the expenses you paid on your account during this period.
Hypothetical Example for Comparison Purposes
The second line of the table below provides information about hypothetical account values and hypothetical expenses based on the Portfolio’s actual expense ratio and an assumed rate of return of 5% per year before expenses, which is not the Portfolio’s actual return. The hypothetical account values and expenses may not be used to estimate the actual ending account balance or expenses you paid for the period. You may use this information to compare the ongoing costs of investing in the Portfolio and other funds. To do so, compare this 5% hypothetical example with the 5% hypothetical examples that appear in the shareholder reports of the other funds.
Please note that the expenses shown in the table are meant to highlight your ongoing costs only and do not reflect any transactional costs or separate account charges. Therefore, the second line of the table is useful in comparing ongoing costs only, and will not help you determine the relative total costs of owning different funds. In addition, if these transactional costs or separate account charges were included, your costs would have been higher.
| Beginning Account Value January 1, 2007 |
Ending Account Value June 30, 2007 |
Expenses June 30, 2007* | |||||||
| Actual |
$ | 1,000.00 | $ | 1,097.70 | $ | 4.16 | |||
| Hypothetical (5% return before expenses) |
$ | 1,000.00 | $ | 1,020.83 | $ | 4.01 | |||
| * | Expenses are equal to the Portfolio’s annualized expense ratio of 0.80%, multiplied by the average account value over the period, multiplied by 181/365 (to reflect the one-half year period). |
4
Janus Capital Appreciation Portfolio
Table of Contents
Janus Capital Appreciation Portfolio
Northwestern Mutual Series Fund, Inc.
Schedule of Investments
June 30, 2007 (unaudited)
| Common Stocks (85.0%) | Shares/ $ Par |
Value $ (000’s) | ||
| Consumer Discretionary (12.0%) |
||||
| Abercrombie & Fitch Co. — Class A |
56,920 | 4,154 | ||
| Boyd Gaming Corp. |
61,050 | 3,003 | ||
| Harrah’s Entertainment, Inc. |
42,820 | 3,651 | ||
| J.C. Penney Co., Inc. |
74,525 | 5,393 | ||
| *Lamar Advertising Co. — Class A |
46,535 | 2,921 | ||
| *Melco PBL Entertainment, ADR |
64,645 | 812 | ||
| Sony Corp., ADR |
14,520 | 746 | ||
| Total |
20,680 | |||
| Consumer Staples (1.3%) |
||||
| Bunge, Ltd. |
27,580 | 2,331 | ||
| Total |
2,331 | |||
| Energy (14.0%) |
||||
| Apache Corp. |
21,895 | 1,786 | ||
| ConocoPhillips |
67,485 | 5,298 | ||
| *Continental Resources, Inc. |
206,100 | 3,298 | ||
| EOG Resources, Inc. |
24,805 | 1,812 | ||
| Hess Corp. |
38,165 | 2,250 | ||
| Occidental Petroleum Corp. |
40,250 | 2,330 | ||
| Suncor Energy, Inc. |
57,655 | 5,184 | ||
| Valero Energy Corp. |
31,185 | 2,303 | ||
| Total |
24,261 | |||
| Financials (17.5%) |
||||
| The Bear Stearns Companies, Inc. |
24,610 | 3,445 | ||
| The Goldman Sachs Group, Inc. |
31,510 | 6,830 | ||
| KKR Private Equity Investors LP |
24,936 | 561 | ||
| Lehman Brothers Holdings, Inc. |
49,775 | 3,709 | ||
| Merrill Lynch & Co., Inc. |
42,590 | 3,560 | ||
| Moody’s Corp. |
70,410 | 4,380 | ||
| Wells Fargo & Co. |
222,450 | 7,823 | ||
| Total |
30,308 | |||
| Health Care (10.0%) |
||||
| Alcon, Inc. |
28,535 | 3,850 | ||
| *Amylin Pharmaceuticals, Inc. |
5,775 | 238 | ||
| *Celgene Corp. |
80,330 | 4,605 | ||
| *Genentech, Inc. |
36,440 | 2,757 | ||
| *Gilead Sciences, Inc. |
150,010 | 5,816 | ||
| Total |
17,266 | |||
| Industrials (2.5%) |
||||
| Precision Castparts Corp. |
35,580 | 4,318 | ||
| Total |
4,318 | |||
| Information Technology (19.9%) |
||||
| *Akamai Technologies, Inc. |
70,105 | 3,410 | ||
| Common Stocks (85.0%) | Shares/ $ Par |
Value $ (000’s) | ||
| Information Technology continued |
||||
| *Apple, Inc. |
136,425 | 16,649 | ||
| *Electronic Arts, Inc. |
29,695 | 1,405 | ||
| *Google, Inc. — Class A |
9,805 | 5,132 | ||
| QUALCOMM, Inc. |
57,970 | 2,515 | ||
| *Research in Motion, Ltd. |
25,250 | 5,050 | ||
| Total |
34,161 | |||
| Materials (6.3%) |
||||
| Monsanto Co. |
51,355 | 3,469 | ||
| Potash Corp. of Saskatchewan, Inc. |
96,000 | 7,485 | ||
| Total |
10,954 | |||
| Telecommunication Services (1.5%) |
||||
| *Time Warner Telecom, Inc. — Class A |
130,410 | 2,621 | ||
| Total |
2,621 | |||
| Total Common Stocks |
146,900 | |||
| Money Market Investments (11.3%) | ||||
| Federal Government & Agencies (10.7%) | ||||
| Federal Home Loan Bank, 5.16%, 7/13/07 |
5,400,000 | 5,390 | ||
| Federal Home Loan Bank, 5.15%, 7/18/07 |
13,100,000 | 13,066 | ||
| Total |
18,456 | |||
| National Commercial Banks (0.6%) |
||||
| UBS Finance LLC, 5.35%, 7/2/07 |
1,100,000 | 1,100 | ||
| Total |
1,100 | |||
| Total Money Market Investments (Cost: $19,556) |
19,556 | |||
| Total Investments (96.3%) (Cost $132,758)(a) |
166,456 | |||
| Other Assets, Less Liabilities (3.7%) |
6,386 | |||
| Net Assets (100.0%) |
172,842 | |||
| * | Non-Income Producing |
ADR after the name of a security represents — American Depositary Receipt.
| (a) | At June 30, 2007 the aggregate cost of securities for federal tax purposes (in thousands) was $132,758 and the net unrealized appreciation of investments based on that cost was $33,698 which is comprised of $35,732 aggregate gross unrealized appreciation and $2,034 aggregate gross unrealized depreciation. |
The Accompanying Notes are an Integral Part of the Financial Statements.
Janus Capital Appreciation Portfolio
5
Table of Contents
Large Cap Core Stock Portfolio
Sector Allocation 6/30/07
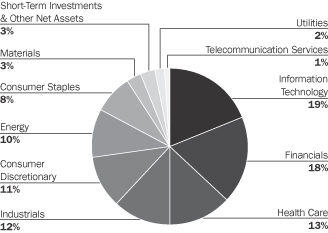
Sector Allocation is based on Net Assets.
Sector Allocation is subject to change.
Expense Example
As a shareholder of the Portfolio, you incur two types of costs: (1) transaction costs and (2) ongoing costs, including management fees and other Portfolio expenses. This Example is intended to help you understand your ongoing costs (in dollars) of investing in the Portfolio and to compare these costs with the ongoing costs of investing in other mutual funds.
The Example is based on an investment of $1,000 invested at the beginning of the period and held for the entire period (January 1, 2007 to June 30, 2007).
Actual Expenses
The first line of the table below provides information about actual account values and actual expenses. You may use the information in this line, together with the amount you invested, to estimate the expenses that you paid over the period. Simply divide your account value by $1,000 (for example, an $8,600 account value divided by $1,000 = 8.6), then multiply the result by the number in the first line under the heading entitled “Expenses Paid During Period” to estimate the expenses you paid on your account during this period.
Hypothetical Example for Comparison Purposes
The second line of the table below provides information about hypothetical account values and hypothetical expenses based on the Portfolio’s actual expense ratio and an assumed rate of return of 5% per year before expenses, which is not the Portfolio’s actual return. The hypothetical account values and expenses may not be used to estimate the actual ending account balance or expenses you paid for the period. You may use this information to compare the ongoing costs of investing in the Portfolio and other funds. To do so, compare this 5% hypothetical example with the 5% hypothetical examples that appear in the shareholder reports of the other funds.
Please note that the expenses shown in the table are meant to highlight your ongoing costs only and do not reflect any transactional costs or separate account charges. Therefore, the second line of the table is useful in comparing ongoing costs only, and will not help you determine the relative total costs of owning different funds. In addition, if these transactional costs or separate account charges were included, your costs would have been higher.
| Beginning Account Value January 1, 2007 |
Ending Account Value June 30, 2007 |
Expenses Paid During Period January 1, 2007 to June 30, 2007* | |||||||
| Actual |
$ | 1,000.00 | $ | 1,069.70 | $ | 2.21 | |||
| Hypothetical (5% return before expenses) |
$ | 1,000.00 | $ | 1,022.66 | $ | 2.16 | |||
| * | Expenses are equal to the Portfolio’s annualized expense ratio of 0.43%, multiplied by the average account value over the period, multiplied by 181/365 (to reflect the one-half year period). |
6
Large Cap Core Stock Portfolio
Table of Contents
Large Cap Core Stock Portfolio
Northwestern Mutual Series Fund, Inc.
Schedule of Investments
June 30, 2007 (unaudited)
| Common Stocks (96.8%) | Shares/ $ Par |
Value $ (000’s) | ||
| Consumer Discretionary (11.3%) | ||||
| Abercrombie & Fitch Co. — Class A |
13,200 | 963 | ||
| *Comcast Corp. |
211,500 | 5,947 | ||
| Hilton Hotels Corp. |
158,900 | 5,318 | ||
| International Game Technology |
116,600 | 4,629 | ||
| J.C. Penney Co., Inc. |
63,300 | 4,582 | ||
| Johnson Controls, Inc. |
71,700 | 8,301 | ||
| News Corp. — Class A |
317,200 | 6,728 | ||
| NIKE, Inc. — Class B |
60,800 | 3,544 | ||
| Omnicom Group, Inc. |
72,600 | 3,842 | ||
| Staples, Inc. |
199,800 | 4,741 | ||
| Starwood Hotels & Resorts Worldwide, Inc. |
61,200 | 4,105 | ||
| Target Corp. |
87,800 | 5,584 | ||
| Time Warner, Inc. |
237,600 | 4,999 | ||
| Total |
63,283 | |||
| Consumer Staples (7.9%) | ||||
| Altria Group, Inc. |
80,600 | 5,653 | ||
| Avon Products, Inc. |
170,300 | 6,259 | ||
| CVS/Caremark Corp. |
225,222 | 8,209 | ||
| Loews Corp. — Carolina Group |
56,200 | 4,343 | ||
| PepsiCo, Inc. |
110,200 | 7,146 | ||
| The Procter & Gamble Co. |
140,662 | 8,607 | ||
| Walgreen Co. |
85,000 | 3,701 | ||
| Total |
43,918 | |||
| Energy (9.5%) | ||||
| Baker Hughes, Inc. |
74,400 | 6,259 | ||
| ConocoPhillips |
54,888 | 4,309 | ||
| Diamond Offshore Drilling, Inc. |
37,400 | 3,798 | ||
| EOG Resources, Inc. |
68,100 | 4,975 | ||
| Exxon Mobil Corp. |
215,300 | 18,060 | ||
| Schlumberger, Ltd. |
76,700 | 6,515 | ||
| Valero Energy Corp. |
71,000 | 5,244 | ||
| XTO Energy, Inc. |
65,800 | 3,955 | ||
| Total |
53,115 | |||
| Financials (17.5%) | ||||
| American Express Co. |
88,500 | 5,414 | ||
| American International Group, Inc. |
105,200 | 7,367 | ||
| Bank of America Corp. |
175,400 | 8,576 | ||
| *The Blackstone Group LP |
18,800 | 550 | ||
| Chicago Mercantile Exchange Holdings, Inc. |
5,000 | 2,672 | ||
| Citigroup, Inc. |
96,700 | 4,960 | ||
| Genworth Financial, Inc. |
52,900 | 1,820 | ||
| The Goldman Sachs Group, Inc. |
31,500 | 6,828 | ||
| Host Hotels & Resorts, Inc. |
177,102 | 4,095 | ||
| JPMorgan Chase & Co. |
153,296 | 7,427 | ||
| Legg Mason, Inc. |
49,200 | 4,840 | ||
| Lehman Brothers Holdings, Inc. |
74,200 | 5,529 | ||
| Common Stocks (96.8%) | Shares/ $ Par |
Value $ (000’s) | ||
| Financials continued | ||||
| Prudential Financial, Inc. |
87,100 | 8,469 | ||
| State Street Corp. |
77,500 | 5,301 | ||
| The Travelers Companies, Inc. |
107,800 | 5,767 | ||
| U.S. Bancorp |
115,300 | 3,799 | ||
| UBS AG |
81,900 | 4,915 | ||
| Wachovia Corp. |
90,600 | 4,643 | ||
| Wells Fargo & Co. |
139,900 | 4,920 | ||
| Total |
97,892 | |||
| Health Care (12.5%) | ||||
| Abbott Laboratories |
98,700 | 5,285 | ||
| Baxter International, Inc. |
81,800 | 4,609 | ||
| Bristol-Myers Squibb Co. |
84,700 | 2,673 | ||
| Cardinal Health, Inc. |
38,300 | 2,706 | ||
| *Celgene Corp. |
98,100 | 5,624 | ||
| *Express Scripts, Inc. |
53,500 | 2,676 | ||
| *Genentech, Inc. |
45,500 | 3,443 | ||
| *Gilead Sciences, Inc. |
112,000 | 4,342 | ||
| *Hospira, Inc. |
41,600 | 1,624 | ||
| Johnson & Johnson |
74,400 | 4,585 | ||
| Medtronic, Inc. |
77,500 | 4,019 | ||
| Merck & Co., Inc. |
152,400 | 7,589 | ||
| Pfizer, Inc. |
169,500 | 4,334 | ||
| *St. Jude Medical, Inc. |
86,600 | 3,593 | ||
| *Thermo Fisher Scientific, Inc. |
133,600 | 6,909 | ||
| Wyeth |
96,600 | 5,539 | ||
| Total |
69,550 | |||
| Industrials (12.4%) | ||||
| The Boeing Co. |
88,500 | 8,510 | ||
| Canadian National Railway Co. |
102,100 | 5,200 | ||
| Danaher Corp. |
74,000 | 5,587 | ||
| FedEx Corp. |
44,400 | 4,927 | ||
| General Electric Co. |
329,000 | 12,594 | ||
| Honeywell International, Inc. |
124,890 | 7,029 | ||
| Roper Industries, Inc. |
99,700 | 5,693 | ||
| *Spirit AeroSystems Holdings, Inc. |
120,000 | 4,326 | ||
| Textron, Inc. |
62,400 | 6,871 | ||
| United Technologies Corp. |
120,400 | 8,540 | ||
| Total |
69,277 | |||
| Information Technology (19.1%) | ||||
| Accenture, Ltd. |
135,400 | 5,807 | ||
| *Adobe Systems, Inc. |
76,000 | 3,051 | ||
| *Amdocs, Ltd. |
146,000 | 5,814 | ||
| *Autodesk, Inc. |
71,500 | 3,366 | ||
| *BEA Systems, Inc. |
182,700 | 2,501 | ||
| *Broadcom Corp. |
217,250 | 6,355 | ||
| *Cisco Systems, Inc. |
285,700 | 7,957 | ||
| *Corning, Inc. |
204,700 | 5,230 | ||
| *Electronic Arts, Inc. |
98,300 | 4,652 | ||
| *Google, Inc. — Class A |
13,600 | 7,118 | ||
| Hewlett-Packard Co. |
193,100 | 8,615 | ||
| Common Stocks (96.8%) | Shares/ $ Par |
Value $ (000’s) | ||
| Information Technology continued | ||||
| Intel Corp. |
81,000 | 1,925 | ||
| International Business Machines Corp. |
50,500 | 5,315 | ||
| KLA-Tencor Corp. |
100,800 | 5,539 | ||
| Maxim Integrated Products, Inc. |
129,200 | 4,317 | ||
| Microsoft Corp. |
279,300 | 8,231 | ||
| *Oracle Corp. |
293,500 | 5,785 | ||
| QUALCOMM, Inc. |
157,100 | 6,817 | ||
| Texas Instruments, Inc. |
170,100 | 6,401 | ||
| *Yahoo!, Inc. |
46,900 | 1,272 | ||
| Total |
106,068 | |||
| Materials (3.2%) | ||||
| International Paper Co. |
70,500 | 2,753 | ||
| Monsanto Co. |
150,600 | 10,171 | ||
| Praxair, Inc. |
69,800 | 5,025 | ||
| Total |
17,949 | |||
| Telecommunication Services (1.2%) | ||||
| AT&T, Inc. |
164,000 | 6,806 | ||
| Total |
6,806 | |||
| Utilities (2.2%) | ||||
| Exelon Corp. |
87,900 | 6,382 | ||
| PG&E Corp. |
132,300 | 5,993 | ||
| Total |
12,375 | |||
| Total Common Stocks |
540,233 | |||
| Money Market Investments (3.1%) | ||||
| Autos (1.7%) | ||||
| (b)Fcar Owner Trust 1, 5.30%, 7/16/07 |
10,000,000 | 9,977 | ||
| Total |
9,977 | |||
| Federal Government & Agencies (0.3%) | ||||
| Fannie Mae, 5.13%, 9/19/07 |
1,500,000 | 1,483 | ||
| Total |
1,483 | |||
| National Commercial Banks (1.1%) | ||||
| UBS Finance LLC, 5.35%, 7/2/07 |
5,900,000 | 5,898 | ||
| Total |
5,898 | |||
| Total Money Market |
17,358 | |||
| Total Investments (99.9%) |
557,591 | |||
| Other Assets, Less Liabilities |
755 | |||
| Net Assets (100.0%) |
558,346 | |||
The Accompanying Notes are an Integral Part of the Financial Statements.
Large Cap Core Stock Portfolio
7
Table of Contents
Large Cap Core Stock Portfolio
| * | Non-Income Producing |
| (a) | At June 30, 2007 the aggregate cost of securities for federal tax purposes (in thousands) was $429,408 and the net unrealized appreciation of investments based on that cost was $128,183 which is comprised of $131,768 aggregate gross unrealized appreciation and $3,585 aggregate gross unrealized depreciation. |
| (b) | All or a portion of the securities have been committed as collateral for open futures positions or when-issued securities. Information regarding open futures contracts as of period end is summarized below. |
| Issuer (000’s) | Number of Contracts |
Expiration Date |
Unrealized Appreciation/ (Depreciation) (000’s) |
|||||
| S&P 500 Index Futures (Long) |
16 | 9/07 | $ | (39 | ) | |||
| (Total Notional Value at June 30, 2007, $6,100) |
||||||||
The Accompanying Notes are an Integral Part of the Financial Statements.
8
Large Cap Core Stock Portfolio
Table of Contents
Sector Allocation 6/30/07
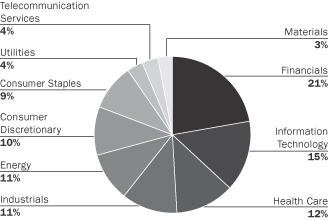
Sector Allocation is based on equities.
Sector Allocation is subject to change.
Expense Example
As a shareholder of the Portfolio, you incur two types of costs: (1) transaction costs and (2) ongoing costs, including management fees and other Portfolio expenses. This Example is intended to help you understand your ongoing costs (in dollars) of investing in the Portfolio and to compare these costs with the ongoing costs of investing in other mutual funds.
The Example is based on an investment of $1,000 invested at the beginning of the period and held for the entire period (January 1, 2007 to June 30, 2007).
Actual Expenses
The first line of the table below provides information about actual account values and actual expenses. You may use the information in this line, together with the amount you invested, to estimate the expenses that you paid over the period. Simply divide your account value by $1,000 (for example, an $8,600 account value divided by $1,000 = 8.6), then multiply the result by the number in the first line under the heading entitled “Expenses Paid During Period” to estimate the expenses you paid on your account during this period.
Hypothetical Example for Comparison Purposes
The second line of the table below provides information about hypothetical account values and hypothetical expenses based on the Portfolio’s actual expense ratio and an assumed rate of return of 5% per year before expenses, which is not the Portfolio’s actual return. The hypothetical account values and expenses may not be used to estimate the actual ending account balance or expenses you paid for the period. You may use this information to compare the ongoing costs of investing in the Portfolio and other funds. To do so, compare this 5% hypothetical example with the 5% hypothetical examples that appear in the shareholder reports of the other funds.
Please note that the expenses shown in the table are meant to highlight your ongoing costs only and do not reflect any transactional costs or separate account charges. Therefore, the second line of the table is useful in comparing ongoing costs only, and will not help you determine the relative total costs of owning different funds. In addition, if these transactional costs or separate account charges were included, your costs would have been higher.
| Beginning Account Value January 1, 2007 |
Ending Account Value June 30, 2007 |
Expenses June 30, | |||||||
| Actual |
$ | 1,000.00 | $ | 1,069.60 | $ | 1.03 | |||
| Hypothetical (5% return before expenses) |
$ | 1,000.00 | $ | 1,023.80 | $ | 1.00 | |||
| * | Expenses are equal to the Portfolio’s annualized expense ratio of 0.20%, multiplied by the average account value over the period, multiplied by 181/365 (to reflect the one-half year period). |
Index 500 Stock Portfolio
9
Table of Contents
Index 500 Stock Portfolio
Northwestern Mutual Series Fund, Inc.
Schedule of Investments
June 30, 2007 (unaudited)
| Common Stocks (98.3%) | Shares/ $ Par |
Value $ (000’s) | ||
| Consumer Discretionary (10.0%) |
||||
| Abercrombie & Fitch Co. — Class A |
14,100 | 1,029 | ||
| *Amazon.com, Inc. |
49,800 | 3,407 | ||
| *Apollo Group, Inc. —Class A |
22,400 | 1,309 | ||
| *AutoNation, Inc. |
24,229 | 544 | ||
| *AutoZone, Inc. |
7,625 | 1,042 | ||
| *Bed Bath & Beyond, Inc. |
43,900 | 1,580 | ||
| Best Buy Co., Inc. |
64,875 | 3,028 | ||
| *Big Lots, Inc. |
17,500 | 515 | ||
| The Black & Decker Corp. |
10,600 | 936 | ||
| Brunswick Corp. |
14,500 | 473 | ||
| Carnival Corp. |
70,909 | 3,458 | ||
| CBS Corp. — Class B |
117,424 | 3,913 | ||
| Centex Corp. |
19,100 | 766 | ||
| Circuit City Stores, Inc. |
22,200 | 335 | ||
| Clear Channel Communications, Inc. |
79,550 | 3,009 | ||
| *Coach, Inc. |
59,500 | 2,820 | ||
| *Comcast Corp. — Class A |
498,705 | 14,023 | ||
| D.R. Horton, Inc. |
43,800 | 873 | ||
| Darden Restaurants, Inc. |
22,650 | 996 | ||
| Dillard’s, Inc. — Class A |
9,764 | 351 | ||
| *The DIRECTV Group, Inc. |
123,500 | 2,854 | ||
| Dollar General Corp. |
50,448 | 1,106 | ||
| Dow Jones & Co., Inc. |
10,520 | 604 | ||
| The E.W. Scripps Co. — Class A |
13,400 | 612 | ||
| Eastman Kodak Co. |
46,083 | 1,282 | ||
| Family Dollar Stores, Inc. |
24,200 | 831 | ||
| *Ford Motor Co. |
301,294 | 2,838 | ||
| Fortune Brands, Inc. |
24,467 | 2,015 | ||
| Gannett Co., Inc. |
37,650 | 2,069 | ||
| The Gap, Inc. |
84,975 | 1,623 | ||
| General Motors Corp. |
90,627 | 3,426 | ||
| Genuine Parts Co. |
27,300 | 1,354 | ||
| *The Goodyear Tire & Rubber Co. |
33,100 | 1,151 | ||
| H&R Block, Inc. |
51,700 | 1,208 | ||
| Harley-Davidson, Inc. |
41,300 | 2,462 | ||
| Harman International Industries, Inc. |
10,400 | 1,215 | ||
| Harrah’s Entertainment, Inc. |
29,950 | 2,554 | ||
| Hasbro, Inc. |
25,525 | 802 | ||
| Hilton Hotels Corp. |
62,450 | 2,090 | ||
| The Home Depot, Inc. |
316,294 | 12,445 | ||
| *IAC/InterActiveCorp |
35,000 | 1,211 | ||
| International Game Technology |
53,300 | 2,116 | ||
| *The Interpublic Group of Companies, Inc. |
75,100 | 856 | ||
| J.C. Penney Co., Inc. |
36,050 | 2,609 | ||
| Johnson Controls, Inc. |
31,600 | 3,658 | ||
| Jones Apparel Group, Inc. |
17,400 | 492 | ||
| KB HOME |
12,300 | 484 | ||
| *Kohl’s Corp. |
51,667 | 3,670 | ||
| Leggett & Platt, Inc. |
28,433 | 627 | ||
| Common Stocks (98.3%) | Shares/ $ Par |
Value $ (000’s) | ||
| Consumer Discretionary continued |
||||
| Lennar Corp. — Class A |
22,300 | 815 | ||
| Limited Brands, Inc. |
54,887 | 1,507 | ||
| Liz Claiborne, Inc. |
16,800 | 627 | ||
| Lowe’s Companies, Inc. |
241,200 | 7,402 | ||
| Macy’s Inc. |
73,646 | 2,930 | ||
| Marriott International, Inc. — Class A |
52,600 | 2,274 | ||
| Mattel, Inc. |
62,988 | 1,593 | ||
| McDonald’s Corp. |
191,278 | 9,709 | ||
| The McGraw-Hill Companies, Inc. |
55,020 | 3,746 | ||
| Meredith Corp. |
6,200 | 382 | ||
| The New York Times Co. — Class A |
23,070 | 586 | ||
| Newell Rubbermaid, Inc. |
44,692 | 1,315 | ||
| News Corp. — Class A |
373,200 | 7,916 | ||
| NIKE, Inc. — Class B |
60,800 | 3,544 | ||
| Nordstrom, Inc. |
35,934 | 1,837 | ||
| *Office Depot, Inc. |
44,257 | 1,341 | ||
| OfficeMax, Inc. |
12,100 | 476 | ||
| Omnicom Group, Inc. |
53,000 | 2,805 | ||
| Polo Ralph Lauren Corp. |
9,800 | 961 | ||
| Pulte Homes, Inc. |
34,000 | 763 | ||
| RadioShack Corp. |
21,700 | 719 | ||
| *Sears Holdings Corp. |
13,180 | 2,234 | ||
| The Sherwin-Williams Co. |
17,513 | 1,164 | ||
| Snap-on, Inc. |
9,317 | 471 | ||
| The Stanley Works |
13,350 | 810 | ||
| Staples, Inc. |
114,650 | 2,721 | ||
| *Starbucks Corp. |
118,700 | 3,115 | ||
| Starwood Hotels & Resorts Worldwide, Inc. |
34,500 | 2,314 | ||
| Target Corp. |
136,457 | 8,679 | ||
| Tiffany & Co. |
21,867 | 1,160 | ||
| Time Warner, Inc. |
606,600 | 12,762 | ||
| The TJX Companies, Inc. |
72,900 | 2,005 | ||
| Tribune Co. |
13,525 | 398 | ||
| VF Corp. |
14,257 | 1,306 | ||
| *Viacom, Inc. — Class B |
110,424 | 4,597 | ||
| The Walt Disney Co. |
317,557 | 10,841 | ||
| Wendy’s International, Inc. |
13,950 | 513 | ||
| Whirlpool Corp. |
12,644 | 1,406 | ||
| *Wyndham Worldwide Corp. |
29,186 | 1,058 | ||
| Yum! Brands, Inc. |
83,960 | 2,747 | ||
| Total |
218,220 | |||
| Consumer Staples (9.1%) |
||||
| Altria Group, Inc. |
337,022 | 23,639 | ||
| Anheuser-Busch Companies, Inc. |
121,749 | 6,350 | ||
| Archer-Daniels-Midland Co. |
104,603 | 3,461 | ||
| Avon Products, Inc. |
70,300 | 2,584 | ||
| Brown-Forman Corp. — Class B |
12,618 | 922 | ||
| Campbell Soup Co. |
34,722 | 1,348 | ||
| The Clorox Co. |
24,350 | 1,512 | ||
| The Coca-Cola Co. |
321,975 | 16,843 | ||
| Common Stocks (98.3%) | Shares/ $ Par |
Value $ (000’s) | ||
| Consumer Staples continued |
||||
| Coca-Cola Enterprises, Inc. |
44,700 | 1,073 | ||
| Colgate-Palmolive Co. |
81,922 | 5,313 | ||
| ConAgra Foods, Inc. |
79,767 | 2,143 | ||
| *Constellation Brands, Inc. — Class A |
31,000 | 753 | ||
| Costco Wholesale Corp. |
71,564 | 4,188 | ||
| CVS/Caremark Corp. |
247,361 | 9,016 | ||
| Dean Foods Co. |
20,800 | 663 | ||
| The Estee Lauder Companies, Inc. — Class A |
18,900 | 860 | ||
| General Mills, Inc. |
55,467 | 3,240 | ||
| H.J. Heinz Co. |
52,017 | 2,469 | ||
| The Hershey Co. |
27,500 | 1,392 | ||
| Kellogg Co. |
40,157 | 2,080 | ||
| Kimberly-Clark Corp. |
73,056 | 4,887 | ||
| Kraft Foods, Inc. — Class A |
256,996 | 9,059 | ||
| The Kroger Co. |
113,405 | 3,190 | ||
| McCormick & Co., Inc. |
20,900 | 798 | ||
| Molson Coors Brewing Co. — Class B |
7,600 | 703 | ||
| The Pepsi Bottling Group, Inc. |
21,100 | 711 | ||
| PepsiCo, Inc. |
261,030 | 16,928 | ||
| The Procter & Gamble Co. |
504,564 | 30,873 | ||
| Reynolds American, Inc. |
27,400 | 1,786 | ||
| Safeway, Inc. |
70,800 | 2,409 | ||
| Sara Lee Corp. |
117,735 | 2,049 | ||
| SUPERVALU, Inc. |
33,270 | 1,541 | ||
| Sysco Corp. |
99,025 | 3,267 | ||
| Tyson Foods, Inc. — Class A |
40,500 | 933 | ||
| UST, Inc. |
25,667 | 1,379 | ||
| Walgreen Co. |
160,346 | 6,981 | ||
| Wal-Mart Stores, Inc. |
388,500 | 18,691 | ||
| Whole Foods Market, Inc. |
22,700 | 869 | ||
| Wm. Wrigley Jr. Co. |
34,558 | 1,911 | ||
| Total |
198,814 | |||
| Energy (10.6%) |
||||
| Anadarko Petroleum Corp. |
74,324 | 3,864 | ||
| Apache Corp. |
53,046 | 4,328 | ||
| Baker Hughes, Inc. |
51,330 | 4,318 | ||
| BJ Services Co. |
47,000 | 1,337 | ||
| Chesapeake Energy Corp. |
65,600 | 2,270 | ||
| Chevron Corp. |
344,414 | 29,013 | ||
| ConocoPhillips |
261,938 | 20,562 | ||
| CONSOL Energy, Inc. |
29,200 | 1,346 | ||
| Devon Energy Corp. |
71,300 | 5,582 | ||
| El Paso Corp. |
112,171 | 1,933 | ||
| ENSCO International, Inc. |
23,900 | 1,458 | ||
| EOG Resources, Inc. |
39,220 | 2,865 | ||
| Exxon Mobil Corp. |
902,656 | 75,715 | ||
| Halliburton Co. |
146,438 | 5,052 | ||
| Hess Corp. |
43,700 | 2,577 | ||
| Marathon Oil Corp. |
109,966 | 6,594 | ||
| Murphy Oil Corp. |
30,100 | 1,789 | ||
| *Nabors Industries, Ltd. |
45,100 | 1,505 | ||
The Accompanying Notes are an Integral Part of the Financial Statements.
10
Index 500 Stock Portfolio
Table of Contents
Index 500 Stock Portfolio
| Common Stocks (98.3%) | Shares/ $ Par |
Value $ (000’s) | ||
| Energy continued |
||||
| *National-Oilwell Varco, Inc. |
28,500 | 2,971 | ||
| Noble Corp. |
21,450 | 2,092 | ||
| Occidental Petroleum Corp. |
133,640 | 7,735 | ||
| Peabody Energy Corp. |
42,500 | 2,056 | ||
| Rowan Companies, Inc. |
17,750 | 727 | ||
| Schlumberger, Ltd. |
188,834 | 16,040 | ||
| Smith International, Inc. |
32,100 | 1,882 | ||
| Spectra Energy Corp. |
101,236 | 2,628 | ||
| Sunoco, Inc. |
19,500 | 1,554 | ||
| *Transocean, Inc. |
46,151 | 4,891 | ||
| Valero Energy Corp. |
88,000 | 6,500 | ||
| *Weatherford International, Ltd. |
54,000 | 2,983 | ||
| The Williams Companies, Inc. |
96,000 | 3,036 | ||
| XTO Energy, Inc. |
61,399 | 3,690 | ||
| Total |
230,893 | |||
| Financials (20.4%) |
||||
| ACE, Ltd. |
52,200 | 3,264 | ||
| AFLAC, Inc. |
78,350 | 4,027 | ||
| The Allstate Corp. |
97,328 | 5,987 | ||
| Ambac Financial Group, Inc. |
16,300 | 1,421 | ||
| American Express Co. |
190,475 | 11,653 | ||
| American International Group, Inc. |
415,730 | 29,113 | ||
| Ameriprise Financial, Inc. |
37,655 | 2,394 | ||
| Aon Corp. |
47,000 | 2,003 | ||
| Apartment Investment & Management Co. — Class A |
15,600 | 787 | ||
| Archstone-Smith Trust |
35,700 | 2,110 | ||
| Assurant, Inc. |
15,900 | 937 | ||
| AvalonBay Communities, Inc. |
12,800 | 1,522 | ||
| Bank of America Corp. |
711,067 | 34,763 | ||
| The Bank of New York Co., Inc. |
121,153 | 5,021 | ||
| BB&T Corp. |
86,900 | 3,535 | ||
| The Bear Stearns Companies, Inc. |
19,095 | 2,673 | ||
| Boston Properties, Inc. |
19,100 | 1,951 | ||
| Capital One Financial Corp. |
66,229 | 5,195 | ||
| *CB Richard Ellis Group, Inc. |
30,000 | 1,095 | ||
| The Charles Schwab Corp. |
162,139 | 3,327 | ||
| Chicago Mercantile Exchange Holdings, Inc. |
5,700 | 3,046 | ||
| The Chubb Corp. |
64,300 | 3,481 | ||
| Cincinnati Financial Corp. |
27,475 | 1,192 | ||
| CIT Group, Inc. |
30,700 | 1,683 | ||
| Citigroup, Inc. |
792,648 | 40,654 | ||
| Comerica, Inc. |
24,950 | 1,484 | ||
| Commerce Bancorp, Inc. |
30,700 | 1,136 | ||
| Compass Bancshares, Inc. |
21,100 | 1,455 | ||
| Countrywide Financial Corp. |
95,100 | 3,457 | ||
| Developers Diversified Realty Corp. |
20,000 | 1,054 | ||
| *E*TRADE Financial Corp. |
68,400 | 1,511 | ||
| Equity Residential |
46,600 | 2,126 | ||
| Fannie Mae |
155,948 | 10,188 | ||
| Common Stocks (98.3%) | Shares/ $ Par |
Value $ (000’s) | ||
| Financials continued |
||||
| Federated Investors, Inc. — Class B |
14,200 | 544 | ||
| Fifth Third Bancorp |
88,134 | 3,505 | ||
| First Horizon National Corp. |
20,200 | 788 | ||
| Franklin Resources, Inc. |
26,450 | 3,504 | ||
| Freddie Mac |
105,986 | 6,433 | ||
| Genworth Financial, Inc. |
67,000 | 2,305 | ||
| The Goldman Sachs Group, Inc. |
65,500 | 14,197 | ||
| The Hartford Financial Services Group, Inc. |
50,750 | 4,999 | ||
| Host Hotels & Resorts, Inc. |
83,700 | 1,935 | ||
| Hudson City Bancorp, Inc. |
77,600 | 948 | ||
| Huntington Bancshares, Inc. |
37,842 | 861 | ||
| Janus Capital Group, Inc. |
29,729 | 828 | ||
| JPMorgan Chase & Co. |
547,397 | 26,520 | ||
| KeyCorp |
62,875 | 2,158 | ||
| Kimco Realty Corp. |
36,300 | 1,382 | ||
| Legg Mason, Inc. |
21,100 | 2,076 | ||
| Lehman Brothers Holdings, Inc. |
85,344 | 6,360 | ||
| Lincoln National Corp. |
43,430 | 3,081 | ||
| Loews Corp. |
71,401 | 3,640 | ||
| M&T Bank Corp. |
12,100 | 1,293 | ||
| Marsh & McLennan Companies, Inc. |
88,980 | 2,748 | ||
| Marshall & Ilsley Corp. |
41,500 | 1,977 | ||
| MBIA, Inc. |
20,950 | 1,304 | ||
| Mellon Financial Corp. |
66,668 | 2,933 | ||
| Merrill Lynch & Co., Inc. |
139,500 | 11,659 | ||
| MetLife, Inc. |
118,836 | 7,663 | ||
| MGIC Investment Corp. |
13,300 | 756 | ||
| Moody’s Corp. |
36,850 | 2,292 | ||
| Morgan Stanley |
168,913 | 14,168 | ||
| National City Corp. |
92,297 | 3,075 | ||
| Northern Trust Corp. |
30,250 | 1,943 | ||
| Plum Creek Timber Co., Inc. |
28,300 | 1,179 | ||
| PNC Financial Services Group, Inc. |
55,267 | 3,956 | ||
| Principal Financial Group, Inc. |
42,900 | 2,501 | ||
| The Progressive Corp. |
118,000 | 2,824 | ||
| ProLogis |
41,100 | 2,339 | ||
| Prudential Financial, Inc. |
74,900 | 7,283 | ||
| Public Storage, Inc. |
19,700 | 1,513 | ||
| Regions Financial Corp. |
112,890 | 3,737 | ||
| SAFECO Corp. |
17,050 | 1,062 | ||
| Simon Property Group, Inc. |
35,800 | 3,331 | ||
| SLM Corp. |
65,942 | 3,797 | ||
| Sovereign Bancorp, Inc. |
57,880 | 1,224 | ||
| State Street Corp. |
53,900 | 3,687 | ||
| SunTrust Banks, Inc. |
57,133 | 4,899 | ||
| Synovus Financial Corp. |
52,350 | 1,607 | ||
| T. Rowe Price Group, Inc. |
42,600 | 2,211 | ||
| Torchmark Corp. |
15,350 | 1,028 | ||
| The Travelers Companies, Inc. |
106,410 | 5,693 | ||
| U.S. Bancorp |
278,621 | 9,181 | ||
| Unum Group |
54,931 | 1,434 | ||
| Vornado Realty Trust |
20,900 | 2,296 | ||
| Wachovia Corp. |
306,647 | 15,716 | ||
| Common Stocks (98.3%) | Shares/ $ Par |
Value $ (000’s) | ||
| Financials continued |
||||
| Washington Mutual, Inc. |
142,454 | 6,074 | ||
| Wells Fargo & Co. |
535,160 | 18,822 | ||
| XL Capital, Ltd. — Class A |
29,800 | 2,512 | ||
| Zions Bancorporation |
17,600 | 1,354 | ||
| Total |
444,380 | |||
| Health Care (11.5%) | ||||
| Abbott Laboratories |
246,850 | 13,219 | ||
| Aetna, Inc. |
82,708 | 4,086 | ||
| Allergan, Inc. |
49,234 | 2,838 | ||
| AmerisourceBergen Corp. |
30,600 | 1,514 | ||
| *Amgen, Inc. |
185,817 | 10,274 | ||
| Applera Corp. — Applied Biosystems Group |
29,433 | 899 | ||
| *Barr Pharmaceuticals, Inc. |
17,600 | 884 | ||
| Bausch & Lomb, Inc. |
8,700 | 604 | ||
| Baxter International, Inc. |
104,400 | 5,882 | ||
| Becton, Dickinson and Co. |
39,250 | 2,924 | ||
| *Biogen Idec, Inc. |
54,790 | 2,931 | ||
| Biomet, Inc. |
39,345 | 1,799 | ||
| *Boston Scientific Corp. |
190,122 | 2,916 | ||
| Bristol-Myers Squibb Co. |
315,408 | 9,954 | ||
| C. R. Bard, Inc. |
16,500 | 1,363 | ||
| Cardinal Health, Inc. |
61,625 | 4,353 | ||
| *Celgene Corp. |
60,900 | 3,491 | ||
| CIGNA Corp. |
46,087 | 2,407 | ||
| *Coventry Health Care, Inc. |
25,100 | 1,447 | ||
| Eli Lilly and Co. |
158,106 | 8,835 | ||
| *Express Scripts, Inc. |
43,500 | 2,175 | ||
| *Forest Laboratories, Inc. |
50,966 | 2,327 | ||
| *Genzyme Corp. |
42,100 | 2,711 | ||
| *Gilead Sciences, Inc. |
149,600 | 5,800 | ||
| *Hospira, Inc. |
24,965 | 975 | ||
| *Humana, Inc. |
26,900 | 1,638 | ||
| IMS Health, Inc. |
31,467 | 1,011 | ||
| Johnson & Johnson |
464,137 | 28,601 | ||
| *King Pharmaceuticals, Inc. |
39,066 | 799 | ||
| *Laboratory Corp. of America Holdings |
18,800 | 1,471 | ||
| Manor Care, Inc. |
11,700 | 764 | ||
| McKesson Corp. |
47,305 | 2,821 | ||
| *Medco Health Solutions, Inc. |
44,872 | 3,500 | ||
| Medtronic, Inc. |
184,500 | 9,568 | ||
| Merck & Co., Inc. |
347,320 | 17,297 | ||
| *Millipore Corp. |
8,600 | 646 | ||
| Mylan Laboratories, Inc. |
39,800 | 724 | ||
| *Patterson Companies, Inc. |
22,300 | 831 | ||
| PerkinElmer, Inc. |
19,200 | 500 | ||
| Pfizer, Inc. |
1,124,634 | 28,758 | ||
| Quest Diagnostics, Inc. |
25,300 | 1,307 | ||
| Schering-Plough Corp. |
238,650 | 7,265 | ||
| *St. Jude Medical, Inc. |
54,200 | 2,249 | ||
| Stryker Corp. |
47,900 | 3,022 | ||
| *Tenet Healthcare Corp. |
75,750 | 493 | ||
| *Thermo Fisher Scientific, Inc. |
67,600 | 3,496 | ||
| UnitedHealth Group, Inc. |
214,744 | 10,982 | ||
| *Varian Medical Systems, Inc. |
20,400 | 867 | ||
The Accompanying Notes are an Integral Part of the Financial Statements.
Index 500 Stock Portfolio
11
Table of Contents
Index 500 Stock Portfolio
| Common Stocks (98.3%) | Shares/ $ Par |
Value $ (000’s) | ||
| Health Care continued | ||||
| *Waters Corp. |
16,200 | 962 | ||
| *Watson Pharmaceuticals, Inc. |
16,400 | 533 | ||
| *WellPoint, Inc. |
98,300 | 7,847 | ||
| Wyeth |
215,529 | 12,358 | ||
| *Zimmer Holdings, Inc. |
37,937 | 3,220 | ||
| Total |
250,138 | |||
| Industrials (11.2%) | ||||
| 3M Co. |
115,376 | 10,013 | ||
| *Allied Waste Industries, Inc. |
40,950 | 551 | ||
| American Standard Companies, Inc. |
28,200 | 1,663 | ||
| Avery Dennison Corp. |
14,650 | 974 | ||
| The Boeing Co. |
126,176 | 12,133 | ||
| Burlington Northern Santa Fe Corp. |
57,085 | 4,860 | ||
| C.H. Robinson Worldwide, Inc. |
27,400 | 1,439 | ||
| Caterpillar, Inc. |
102,576 | 8,032 | ||
| Cintas Corp. |
21,633 | 853 | ||
| Cooper Industries, Ltd. — Class A |
29,300 | 1,673 | ||
| CSX Corp. |
70,100 | 3,160 | ||
| Cummins, Inc. |
16,700 | 1,690 | ||
| Danaher Corp. |
38,200 | 2,884 | ||
| Deere & Co. |
36,060 | 4,354 | ||
| Dover Corp. |
32,767 | 1,676 | ||
| Eaton Corp. |
23,500 | 2,186 | ||
| Emerson Electric Co. |
127,400 | 5,962 | ||
| Equifax, Inc. |
23,300 | 1,035 | ||
| FedEx Corp. |
49,320 | 5,473 | ||
| Fluor Corp. |
14,100 | 1,570 | ||
| General Dynamics Corp. |
64,900 | 5,076 | ||
| General Electric Co. |
1,648,606 | 63,109 | ||
| Goodrich Corp. |
20,100 | 1,197 | ||
| Honeywell International, Inc. |
124,950 | 7,032 | ||
| Illinois Tool Works, Inc. |
66,000 | 3,577 | ||
| Ingersoll-Rand Co., Ltd. — Class A |
48,360 | 2,651 | ||
| ITT Corp. |
29,100 | 1,987 | ||
| L-3 Communications Holdings, Inc. |
20,000 | 1,948 | ||
| Lockheed Martin Corp. |
56,908 | 5,357 | ||
| Masco Corp. |
60,500 | 1,722 | ||
| *Monster Worldwide, Inc. |
20,967 | 862 | ||
| Norfolk Southern Corp. |
63,057 | 3,315 | ||
| Northrop Grumman Corp. |
55,320 | 4,308 | ||
| PACCAR, Inc. |
39,810 | 3,465 | ||
| Pall Corp. |
19,650 | 904 | ||
| Parker Hannifin Corp. |
18,575 | 1,819 | ||
| Pitney Bowes, Inc. |
35,237 | 1,650 | ||
| Precision Castparts Corp. |
22,000 | 2,670 | ||
| R. R. Donnelley & Sons Co. |
35,234 | 1,533 | ||
| Raytheon Co. |
71,100 | 3,832 | ||
| Robert Half International, Inc. |
26,640 | 972 | ||
| Rockwell Automation, Inc. |
25,250 | 1,753 | ||
| Common Stocks (98.3%) | Shares/ $ Par |
Value $ (000’s) | ||
| Industrials continued | ||||
| Rockwell Collins, Inc. |
26,850 | 1,897 | ||
| Ryder System, Inc. |
9,800 | 527 | ||
| Southwest Airlines Co. |
125,167 | 1,866 | ||
| *Terex Corp. |
16,500 | 1,341 | ||
| Textron, Inc. |
20,150 | 2,219 | ||
| Tyco International, Ltd. |
317,708 | 10,735 | ||
| Union Pacific Corp. |
43,360 | 4,993 | ||
| United Parcel Service, Inc. — Class B |
169,700 | 12,388 | ||
| United Technologies Corp. |
159,334 | 11,302 | ||
| W.W. Grainger, Inc. |
11,400 | 1,061 | ||
| Waste Management, Inc. |
82,885 | 3,237 | ||
| Total |
244,486 | |||
| Information Technology (15.2%) | ||||
| *ADC Telecommunications, Inc. |
18,764 | 344 | ||
| *Adobe Systems, Inc. |
94,250 | 3,784 | ||
| *Advanced Micro Devices, Inc. |
88,200 | 1,261 | ||
| *Affiliated Computer Services, Inc. — Class A |
15,900 | 902 | ||
| *Agilent Technologies, Inc. |
63,437 | 2,439 | ||
| Altera Corp. |
56,911 | 1,259 | ||
| Analog Devices, Inc. |
52,457 | 1,974 | ||
| *Apple, Inc. |
138,600 | 16,915 | ||
| Applied Materials, Inc. |
221,400 | 4,399 | ||
| *Autodesk, Inc. |
37,068 | 1,745 | ||
| Automatic Data Processing, Inc. |
88,650 | 4,297 | ||
| *Avaya, Inc. |
72,116 | 1,214 | ||
| *BMC Software, Inc. |
32,660 | 990 | ||
| *Broadcom Corp. — Class A |
74,600 | 2,182 | ||
| CA, Inc. |
65,892 | 1,702 | ||
| *Ciena Corp. |
13,685 | 494 | ||
| *Cisco Systems, Inc. |
972,900 | 27,095 | ||
| *Citrix Systems, Inc. |
28,920 | 974 | ||
| *Cognizant Technology Solutions Corp. — Class A |
23,000 | 1,727 | ||
| *Computer Sciences Corp. |
27,750 | 1,641 | ||
| *Compuware Corp. |
48,257 | 572 | ||
| *Convergys Corp. |
21,950 | 532 | ||
| *Corning, Inc. |
252,000 | 6,439 | ||
| *Dell, Inc. |
364,033 | 10,393 | ||
| *eBay, Inc. |
181,400 | 5,837 | ||
| *Electronic Arts, Inc. |
49,700 | 2,352 | ||
| Electronic Data Systems Corp. |
81,567 | 2,262 | ||
| *EMC Corp. |
336,274 | 6,087 | ||
| Fidelity National Information Services, Inc. |
26,200 | 1,422 | ||
| First Data Corp. |
120,932 | 3,951 | ||
| *Fiserv, Inc. |
26,925 | 1,529 | ||
| *Google, Inc. — Class A |
34,900 | 18,266 | ||
| Hewlett-Packard Co. |
419,626 | 18,724 | ||
| Intel Corp. |
930,963 | 22,120 | ||
| International Business Machines Corp. |
218,939 | 23,043 | ||
| *Intuit, Inc. |
54,900 | 1,651 | ||
| Jabil Circuit, Inc. |
28,767 | 635 | ||
| *JDS Uniphase Corp. |
33,850 | 455 | ||
| Common Stocks (98.3%) | Shares/ $ Par |
Value $ (000’s) | ||
| Information Technology continued | ||||
| *Juniper Networks, Inc. |
90,700 | 2,283 | ||
| KLA-Tencor Corp. |
30,700 | 1,687 | ||
| *Lexmark International, Inc. — Class A |
15,200 | 750 | ||
| Linear Technology Corp. |
40,650 | 1,471 | ||
| *LSI Logic Corp. |
123,400 | 927 | ||
| Maxim Integrated Products, Inc. |
51,400 | 1,717 | ||
| *MEMC Electronic Materials, Inc. |
36,000 | 2,200 | ||
| *Micron Technology, Inc. |
121,150 | 1,518 | ||
| Microsoft Corp. |
1,348,992 | 39,755 | ||
| Molex, Inc. |
22,750 | 683 | ||
| Motorola, Inc. |
370,877 | 6,565 | ||
| National Semiconductor Corp. |
44,686 | 1,263 | ||
| *NCR Corp. |
28,800 | 1,513 | ||
| *Network Appliance, Inc. |
59,500 | 1,737 | ||
| *Novell, Inc. |
55,800 | 435 | ||
| *Novellus Systems, Inc. |
20,200 | 573 | ||
| *NVIDIA Corp. |
58,200 | 2,404 | ||
| *Oracle Corp. |
634,325 | 12,503 | ||
| Paychex, Inc. |
54,435 | 2,129 | ||
| *PMC-Sierra, Inc. |
34,200 | 264 | ||
| *QLogic Corp. |
25,500 | 425 | ||
| QUALCOMM, Inc. |
267,134 | 11,591 | ||
| *SanDisk Corp. |
36,600 | 1,791 | ||
| *Sanmina-SCI Corp. |
84,900 | 266 | ||
| *Solectron Corp. |
144,900 | 533 | ||
| *Sun Microsystems, Inc. |
572,097 | 3,009 | ||
| *Symantec Corp. |
144,354 | 2,916 | ||
| Tektronix, Inc. |
13,060 | 441 | ||
| *Tellabs, Inc. |
70,192 | 755 | ||
| *Teradyne, Inc. |
30,450 | 535 | ||
| Texas Instruments, Inc. |
229,700 | 8,644 | ||
| *Unisys Corp. |
55,750 | 510 | ||
| *VeriSign, Inc. |
39,300 | 1,247 | ||
| Western Union Co. |
123,832 | 2,579 | ||
| *Xerox Corp. |
150,200 | 2,776 | ||
| Xilinx, Inc. |
47,700 | 1,277 | ||
| *Yahoo!, Inc. |
193,800 | 5,258 | ||
| Total |
330,538 | |||
| Materials (3.1%) |
||||
| Air Products and Chemicals, Inc. |
34,667 | 2,786 | ||
| Alcoa, Inc. |
139,307 | 5,646 | ||
| Allegheny Technologies, Inc. |
16,417 | 1,722 | ||
| Ashland, Inc. |
9,000 | 576 | ||
| Ball Corp. |
16,332 | 868 | ||
| Bemis Co., Inc. |
16,800 | 557 | ||
| The Dow Chemical Co. |
152,709 | 6,753 | ||
| E. I. du Pont de Nemours and Co. |
148,028 | 7,525 | ||
| Eastman Chemical Co. |
13,525 | 870 | ||
| Ecolab, Inc. |
28,100 | 1,200 | ||
| Freeport-McMoRan Copper & Gold, Inc. |
60,188 | 4,985 | ||
| *Hercules, Inc. |
18,700 | 367 | ||
The Accompanying Notes are an Integral Part of the Financial Statements.
12
Index 500 Stock Portfolio
Table of Contents
Index 500 Stock Portfolio
| Common Stocks (98.3%) | Shares/ $ Par |
Value $ (000’s) | ||
| Materials continued |
||||
| International Flavors & Fragrances, Inc. |
12,400 | 647 | ||
| International Paper Co. |
69,766 | 2,724 | ||
| MeadWestvaco Corp. |
29,579 | 1,045 | ||
| Monsanto Co. |
87,106 | 5,883 | ||
| Newmont Mining Corp. |
72,280 | 2,823 | ||
| Nucor Corp. |
48,332 | 2,835 | ||
| *Pactiv Corp. |
20,900 | 667 | ||
| PPG Industries, Inc. |
26,267 | 1,999 | ||
| Praxair, Inc. |
51,100 | 3,679 | ||
| Rohm and Haas Co. |
22,780 | 1,246 | ||
| Sealed Air Corp. |
25,842 | 802 | ||
| Sigma-Aldrich Corp. |
21,000 | 896 | ||
| Temple-Inland, Inc. |
17,000 | 1,046 | ||
| United States Steel Corp. |
18,950 | 2,061 | ||
| Vulcan Materials Co. |
15,300 | 1,752 | ||
| Weyerhaeuser Co. |
34,580 | 2,729 | ||
| Total |
66,689 | |||
| Telecommunication Services (3.7%) | ||||
| ALLTEL Corp. |
55,357 | 3,739 | ||
| AT&T, Inc. |
987,975 | 41,002 | ||
| CenturyTel, Inc. |
17,600 | 863 | ||
| Citizens Communications Co. |
54,900 | 838 | ||
| Embarq Corp. |
24,230 | 1,535 | ||
| *Qwest Communications International, Inc. |
248,935 | 2,415 | ||
| Sprint Nextel Corp. |
463,702 | 9,603 | ||
| Verizon Communications, Inc. |
465,242 | 19,154 | ||
| Windstream Corp. |
76,392 | 1,128 | ||
| Total |
80,277 | |||
| Utilities (3.5%) | ||||
| *The AES Corp. |
107,000 | 2,341 | ||
| *Allegheny Energy, Inc. |
26,600 | 1,376 | ||
| Ameren Corp. |
33,067 | 1,621 | ||
| Common Stocks (98.3%) | Shares/ $ Par |
Value $ (000’s) | ||
| Utilities continued | ||||
| American Electric Power Co., Inc. |
63,940 | 2,880 | ||
| CenterPoint Energy, Inc. |
51,362 | 894 | ||
| CMS Energy Corp. |
36,000 | 619 | ||
| Consolidated Edison, Inc. |
43,350 | 1,956 | ||
| Constellation Energy Group |
29,000 | 2,528 | ||
| Dominion Resources, Inc. |
56,095 | 4,842 | ||
| DTE Energy Co. |
28,250 | 1,362 | ||
| Duke Energy Corp. |
201,773 | 3,692 | ||
| *Dynegy, Inc. |
64,500 | 609 | ||
| Edison International |
52,220 | 2,931 | ||
| Entergy Corp. |
31,609 | 3,393 | ||
| Exelon Corp. |
107,824 | 7,827 | ||
| FirstEnergy Corp. |
48,865 | 3,163 | ||
| FPL Group, Inc. |
65,114 | 3,695 | ||
| Integrys Energy Group, Inc. |
12,132 | 615 | ||
| KeySpan Corp. |
28,200 | 1,184 | ||
| Nicor, Inc. |
7,250 | 311 | ||
| NiSource, Inc. |
43,873 | 909 | ||
| PG&E Corp. |
56,325 | 2,552 | ||
| Pinnacle West Capital Corp. |
16,100 | 642 | ||
| PPL Corp. |
61,668 | 2,885 | ||
| Progress Energy, Inc. |
40,692 | 1,855 | ||
| Public Service Enterprise Group, Inc. |
40,536 | 3,558 | ||
| Questar Corp. |
27,600 | 1,459 | ||
| Sempra Energy |
42,302 | 2,506 | ||
| The Southern Co. |
120,500 | 4,132 | ||
| TECO Energy, Inc. |
33,600 | 577 | ||
| TXU Corp. |
73,530 | 4,948 | ||
| Xcel Energy, Inc. |
65,520 | 1,341 | ||
| Total |
75,203 | |||
| Total Common Stocks |
2,139,638 | |||
| Money Market Investments (1.6%) |
Shares/ $ Par |
Value $ (000’s) | ||
| Federal Government & Agencies (0.1%) | ||||
| (b)Fannie Mae, |
3,300,000 | 3,261 | ||
| Total |
3,261 | |||
| Finance Lessors (0.5%) | ||||
| (b)Ranger Funding Co. LLC, 5.34%, 7/12/07 |
10,000,000 | 9,982 | ||
| Total |
9,982 | |||
| Finance Services (0.5%) | ||||
| (b)Ciesco LP, 5.28%, 8/16/07 |
10,000,000 | 9,931 | ||
| Total |
9,931 | |||
| National Commercial Banks (0.1%) | ||||
| (b)UBS Finance LLC, 5.35%, 7/2/07 |
1,400,000 | 1,400 | ||
| Total |
1,400 | |||
| Short Term Business Credit (0.4%) | ||||
| (b)Sheffield Receivables, 5.35%, 7/10/07 |
10,000,000 | 9,985 | ||
| Total |
9,985 | |||
| Total Money Market Investments (Cost: $34,558) |
34,559 | |||
| Total Investments (99.9%) (Cost $1,419,010)(a) |
2,174,197 | |||
| Other Assets, Less Liabilities (0.1%) |
2,009 | |||
| Net Assets (100.0%) |
2,176,206 | |||
| * | Non-Income Producing |
| (a) | At June 30, 2007 the aggregate cost of securities for federal tax purposes (in thousands) was $1,419,010 and the net unrealized appreciation of investments based on that cost was $755,187 which is comprised of $842,012 aggregate gross unrealized appreciation and $86,825 aggregate gross unrealized depreciation. |
| (b) | All or a portion of the securities have been committed as collateral for open futures positions or when-issued securities. Information regarding open futures contracts as of period end is summarized below. |
| Issuer (000’s) | Number of Contracts |
Expiration Date |
Unrealized Appreciation/ (Depreciation) (000’s) |
|||||
| S&P 500 Index Futures (Long) |
91 | 9/07 | $ | (173 | ) | |||
| (Total Notional Value at June 30, 2007, $34,475) |
||||||||
The Accompanying Notes are an Integral Part of the Financial Statements.
Index 500 Stock Portfolio
13
Table of Contents
Capital Guardian Domestic Equity Portfolio
Sector Allocation 6/30/07
Sector Allocation is based on Net Assets.
Sector Allocation is subject to change.
Expense Example
As a shareholder of the Portfolio, you incur two types of costs: (1) transaction costs and (2) ongoing costs, including management fees and other Portfolio expenses. This Example is intended to help you understand your ongoing costs (in dollars) of investing in the Portfolio and to compare these costs with the ongoing costs of investing in other mutual funds.
The Example is based on an investment of $1,000 invested at the beginning of the period and held for the entire period (January 1, 2007 to June 30, 2007).
Actual Expenses
The first line of the table below provides information about actual account values and actual expenses. You may use the information in this line, together with the amount you invested, to estimate the expenses that you paid over the period. Simply divide your account value by $1,000 (for example, an $8,600 account value divided by $1,000 = 8.6), then multiply the result by the number in the first line under the heading entitled “Expenses Paid During Period” to estimate the expenses you paid on your account during this period.
Hypothetical Example for Comparison Purposes
The second line of the table below provides information about hypothetical account values and hypothetical expenses based on the Portfolio’s actual expense ratio and an assumed rate of return of 5% per year before expenses, which is not the Portfolio’s actual return. The hypothetical account values and expenses may not be used to estimate the actual ending account balance or expenses you paid for the period. You may use this information to compare the ongoing costs of investing in the Portfolio and other funds. To do so, compare this 5% hypothetical example with the 5% hypothetical examples that appear in the shareholder reports of the other funds.
Please note that the expenses shown in the table are meant to highlight your ongoing costs only and do not reflect any transactional costs or separate account charges. Therefore, the second line of the table is useful in comparing ongoing costs only, and will not help you determine the relative total costs of owning different funds. In addition, if these transactional costs or separate account charges were included, your costs would have been higher.
| Beginning Account Value January 1, 2007 |
Ending Account Value June 30, 2007 |
Expenses Paid During Period January 1, 2007 to June 30, 2007* | |||||||
| Actual |
$ | 1,000.00 | $ | 1,069.70 | $ | 2.87 | |||
| Hypothetical (5% return before expenses) |
$ | 1,000.00 | $ | 1,022.02 | $ | 2.81 | |||
| * | Expenses are equal to the Portfolio’s annualized expense ratio of 0.56%, multiplied by the average account value over the period, multiplied by 181/365 (to reflect the one-half year period). |
14
Capital Guardian Domestic Equity Portfolio
Table of Contents
Capital Guardian Domestic Equity Portfolio
Northwestern Mutual Series Fund, Inc.
Schedule of Investments
June 30, 2007 (unaudited)
| Common Stocks (96.3%) | Shares/ $ Par |
Value $ (000’s) | ||
| Consumer Discretionary (7.1%) |
||||
| Carnival Corp. |
67,600 | 3,297 | ||
| CBS Corp. — Class B |
81,900 | 2,729 | ||
| Fortune Brands, Inc. |
32,300 | 2,661 | ||
| General Motors Corp. |
82,400 | 3,115 | ||
| *Jarden Corp. |
253,300 | 10,894 | ||
| Johnson Controls, Inc. |
46,700 | 5,406 | ||
| Leggett & Platt, Inc. |
74,300 | 1,638 | ||
| McDonald’s Corp. |
35,300 | 1,792 | ||
| *Time Warner Cable, Inc. — Class A |
64,100 | 2,511 | ||
| Total |
34,043 | |||
| Consumer Staples (10.1%) |
||||
| Altria Group, Inc. |
136,600 | 9,581 | ||
| Avon Products, Inc. |
74,000 | 2,720 | ||
| General Mills, Inc. |
48,600 | 2,839 | ||
| Kraft Foods, Inc. — Class A |
468,372 | 16,510 | ||
| Loews Corp. — Carolina Group |
9,300 | 719 | ||
| Sara Lee Corp. |
591,000 | 10,283 | ||
| Unilever NV |
187,200 | 5,807 | ||
| Total |
48,459 | |||
| Energy (7.9%) |
||||
| Chevron Corp. |
31,346 | 2,641 | ||
| ConocoPhillips |
68,600 | 5,385 | ||
| Exxon Mobil Corp. |
45,300 | 3,800 | ||
| Royal Dutch Shell PLC, ADR |
86,700 | 7,040 | ||
| Royal Dutch Shell PLC, ADR B |
62,728 | 5,228 | ||
| Spectra Energy Corp. |
89,600 | 2,326 | ||
| *Transocean, Inc. |
57,100 | 6,051 | ||
| *Weatherford International, Ltd. |
98,600 | 5,447 | ||
| Total |
37,918 | |||
| Financials (35.1%) |
||||
| Ambac Financial Group, Inc. |
22,300 | 1,944 | ||
| American Capital Strategies, Ltd. |
126,500 | 5,379 | ||
| American International Group, Inc. |
152,600 | 10,687 | ||
| *AmeriCredit Corp. |
100,800 | 2,676 | ||
| *Berkshire Hathaway, Inc. |
34 | 3,722 | ||
| Capital One Financial Corp. |
91,100 | 7,146 | ||
| Compass Bancshares, Inc. |
3,100 | 214 | ||
| Douglas Emmett, Inc. |
126,600 | 3,132 | ||
| Fifth Third Bancorp |
139,200 | 5,536 | ||
| General Growth Properties, Inc. |
99,520 | 5,270 | ||
| The Goldman Sachs Group, Inc. |
9,900 | 2,146 | ||
| The Hartford Financial Services Group, Inc. |
17,100 | 1,685 | ||
| Host Hotels & Resorts, Inc. |
119,200 | 2,756 | ||
| Hudson City Bancorp, Inc. |
502,300 | 6,138 | ||
| Common Stocks (96.3%) | Shares/ $ Par |
Value $ (000’s) | ||
| Financials continued |
||||
| IndyMac Bancorp, Inc. |
212,700 | 6,204 | ||
| JPMorgan Chase & Co. |
273,588 | 13,255 | ||
| Lehman Brothers Holdings, Inc. |
33,800 | 2,519 | ||
| Marsh & McLennan Companies, Inc. |
323,000 | 9,974 | ||
| MBIA, Inc. |
29,800 | 1,854 | ||
| Merrill Lynch & Co., Inc. |
53,900 | 4,505 | ||
| The Progressive Corp. |
383,000 | 9,165 | ||
| RenaissanceRe Holdings, Ltd. |
62,600 | 3,881 | ||
| SLM Corp. |
75,000 | 4,319 | ||
| SunTrust Banks, Inc. |
127,600 | 10,940 | ||
| Wachovia Corp. |
228,109 | 11,691 | ||
| Washington Mutual, Inc. |
402,300 | 17,154 | ||
| Wells Fargo & Co. |
267,300 | 9,401 | ||
| XL Capital, Ltd. — Class A |
64,600 | 5,445 | ||
| Total |
168,738 | |||
| Health Care (9.1%) |
||||
| AstraZeneca PLC, ADR |
79,300 | 4,241 | ||
| Merck & Co., Inc. |
182,100 | 9,069 | ||
| *Millennium Pharmaceuticals, Inc. |
180,700 | 1,910 | ||
| Pfizer, Inc. |
502,300 | 12,844 | ||
| Sanofi-Aventis, ADR |
312,300 | 12,576 | ||
| *WellPoint, Inc. |
41,300 | 3,297 | ||
| Total |
43,937 | |||
| Industrials (8.1%) |
||||
| 3M Co. |
27,300 | 2,369 | ||
| Caterpillar, Inc. |
31,700 | 2,482 | ||
| Emerson Electric Co. |
46,600 | 2,181 | ||
| General Electric Co. |
416,100 | 15,928 | ||
| Illinois Tool Works, Inc. |
94,900 | 5,143 | ||
| Parker Hannifin Corp. |
31,500 | 3,084 | ||
| Siemens AG, ADR |
21,900 | 3,133 | ||
| Tyco International, Ltd. |
75,100 | 2,538 | ||
| Union Pacific Corp. |
20,000 | 2,303 | ||
| Total |
39,161 | |||
| Information Technology (8.3%) |
||||
| *Advanced Micro Devices, Inc. |
163,100 | 2,332 | ||
| *Affiliated Computer Services, Inc. — Class A |
36,300 | 2,059 | ||
| *Fairchild Semiconductor International, Inc. |
149,100 | 2,881 | ||
| *Flextronics International, Ltd. |
650,500 | 7,025 | ||
| Hewlett-Packard Co. |
89,000 | 3,971 | ||
| Intel Corp. |
460,800 | 10,949 | ||
| Jabil Circuit, Inc. |
247,100 | 5,453 | ||
| Seagate Technology |
230,800 | 5,025 | ||
| Total |
39,695 | |||
| Common Stocks (96.3%) | Shares/ $ Par |
Value $ (000’s) | ||
| Materials (2.9%) |
||||
| Air Products and Chemicals, Inc. |
36,700 | 2,950 | ||
| Alcoa, Inc. |
59,800 | 2,424 | ||
| The Dow Chemical Co. |
44,200 | 1,955 | ||
| E. I. du Pont de Nemours and Co. |
26,700 | 1,357 | ||
| Lyondell Chemical Co. |
102,800 | 3,815 | ||
| Methanex Corp. |
58,600 | 1,473 | ||
| Total |
13,974 | |||
| Telecommunication Services (4.4%) |
||||
| AT&T, Inc. |
413,800 | 17,173 | ||
| Verizon Communications, Inc. |
101,900 | 4,195 | ||
| Total |
21,368 | |||
| Utilities (3.3%) |
||||
| CMS Energy Corp. |
236,500 | 4,068 | ||
| Edison International |
111,100 | 6,234 | ||
| MDU Resources Group, Inc. |
44,100 | 1,237 | ||
| NiSource, Inc. |
110,600 | 2,291 | ||
| Pinnacle West Capital Corp. |
46,300 | 1,845 | ||
| Total |
15,675 | |||
| Total Common Stocks (Cost: $397,244) |
462,968 | |||
| Convertible Corporate Bonds (1.2%) | ||||
| Automobiles And Other Motor Vehicles (1.2%) | ||||
| Ford Motor Co., 4.25%, 12/15/36 |
4,580,000 | 5,736 | ||
| Total Convertible Corporate Bonds (Cost: $4,656) |
5,736 | |||
| Money Market Investments (3.2%) | ||||
| Federal Government & Agencies (2.6%) | ||||
| Federal Home Loan Bank, 5.15%, 7/18/07 |
9,700,000 | 9,674 | ||
| Federal Home Loan Bank, 5.16%, 7/13/07 |
2,800,000 | 2,795 | ||
| Total |
12,469 | |||
| Finance Services (0.5%) | ||||
| Ciesco LP, 5.28%, 8/16/07 |
2,500,000 | 2,483 | ||
| Total |
2,483 | |||
The Accompanying Notes are an Integral Part of the Financial Statements.
Capital Guardian Domestic Equity Portfolio
15
Table of Contents
Capital Guardian Domestic Equity Portfolio
| Money Market Investments (3.2%) |
Shares/ $ Par |
Value $ (000’s) |
|||
| National Commercial Banks (0.1%) |
| ||||
| UBS Finance LLC, 5.35%, 7/2/07 |
600,000 | 600 | |||
| Total |
600 | ||||
| Total Money Market Investments (Cost: $15,552) |
15,552 | ||||
| Total Investments (100.7%) (Cost $417,452)(a) |
484,256 | ||||
| Other Assets, Less Liabilities (-0.7%) |
(3,506 | ) | |||
| Net Assets (100.0%) |
480,750 | ||||
| * | Non-Income Producing |
ADR after the name of a security represents — American Depositary Receipt.
| (a) | At June 30, 2007 the aggregate cost of securities for federal tax purposes (in thousands) was $417,452 and the net unrealized appreciation of investments based on that cost was $66,804 which is comprised of $73,445 aggregate gross unrealized appreciation and $6,641 aggregate gross unrealized depreciation. |
The Accompanying Notes are an Integral Part of the Financial Statements.
16
Capital Guardian Domestic Equity Portfolio
Table of Contents
T. Rowe Price Equity Income Portfolio
Sector Allocation 6/30/07
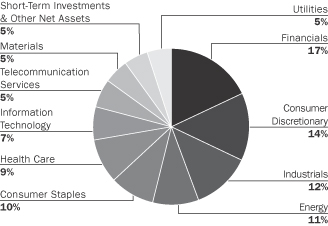
Sector Allocation is based on Net Assets.
Sector Allocation is subject to change.
Expense Example
As a shareholder of the Portfolio, you incur two types of costs: (1) transaction costs and (2) ongoing costs, including management fees and other Portfolio expenses. This Example is intended to help you understand your ongoing costs (in dollars) of investing in the Portfolio and to compare these costs with the ongoing costs of investing in other mutual funds.
The Example is based on an investment of $1,000 invested at the beginning of the period and held for the entire period (January 1, 2007 to June 30, 2007).
Actual Expenses
The first line of the table below provides information about actual account values and actual expenses. You may use the information in this line, together with the amount you invested, to estimate the expenses that you paid over the period. Simply divide your account value by $1,000 (for example, an $8,600 account value divided by $1,000 = 8.6), then multiply the result by the number in the first line under the heading entitled “Expenses Paid During Period” to estimate the expenses you paid on your account during this period.
Hypothetical Example for Comparison Purposes
The second line of the table below provides information about hypothetical account values and hypothetical expenses based on the Portfolio’s actual expense ratio and an assumed rate of return of 5% per year before expenses, which is not the Portfolio’s actual return. The hypothetical account values and expenses may not be used to estimate the actual ending account balance or expenses you paid for the period. You may use this information to compare the ongoing costs of investing in the Portfolio and other funds. To do so, compare this 5% hypothetical example with the 5% hypothetical examples that appear in the shareholder reports of the other funds.
Please note that the expenses shown in the table are meant to highlight your ongoing costs only and do not reflect any transactional costs or separate account charges. Therefore, the second line of the table is useful in comparing ongoing costs only, and will not help you determine the relative total costs of owning different funds. In addition, if these transactional costs or separate account charges were included, your costs would have been higher.
| Beginning Account Value January 1, 2007 |
Ending Account Value June 30, 2007 |
Expenses June 30, 2007* | |||||||
| Actual |
$ | 1,000.00 | $ | 1,081.20 | $ | 3.41 | |||
| Hypothetical (5% return before expenses) |
$ | 1,000.00 | $ | 1,021.52 | $ | 3.31 | |||
| * | Expenses are equal to the Portfolio’s annualized expense ratio of 0.66%, multiplied by the average account value over the period, multiplied by 181/365 (to reflect the one-half year period). |
T. Rowe Price Equity Income Portfolio
17
Table of Contents
T. Rowe Price Equity Income Portfolio
Northwestern Mutual Series Fund, Inc.
Schedule of Investments
June 30, 2007 (unaudited)
| Common Stocks (95.2%) | Shares/ $ Par |
Value $ (000’s) | ||
| Consumer Discretionary (13.6%) |
||||
| *Bed Bath & Beyond, Inc. |
39,700 | 1,429 | ||
| CBS Corp. — Class B |
50,950 | 1,698 | ||
| Citadel Broadcasting Corp. |
4,707 | 30 | ||
| D.R. Horton, Inc. |
38,200 | 761 | ||
| Dow Jones & Co., Inc. |
42,300 | 2,430 | ||
| Eastman Kodak Co. |
59,300 | 1,650 | ||
| Ford Motor Co. |
67,600 | 637 | ||
| Fortune Brands, Inc. |
22,100 | 1,820 | ||
| Gannett Co., Inc. |
35,100 | 1,929 | ||
| The Gap, Inc. |
24,900 | 476 | ||
| Genuine Parts Co. |
25,000 | 1,240 | ||
| H&R Block, Inc. |
74,200 | 1,734 | ||
| The Home Depot, Inc. |
53,700 | 2,113 | ||
| Mattel, Inc. |
62,100 | 1,571 | ||
| The New York Times Co. |
81,200 | 2,062 | ||
| Newell Rubbermaid, Inc. |
66,800 | 1,966 | ||
| Sony Corp., ADR |
29,000 | 1,490 | ||
| Time Warner, Inc. |
135,800 | 2,857 | ||
| Tribune Co. |
36,495 | 1,073 | ||
| *Viacom, Inc. — Class B |
36,650 | 1,526 | ||
| The Walt Disney Co. |
61,300 | 2,093 | ||
| Total |
32,585 | |||
| Consumer Staples (9.5%) |
||||
| Anheuser-Busch Companies, Inc. |
46,300 | 2,415 | ||
| Archer-Daniels-Midland Co. |
18,300 | 606 | ||
| Avon Products, Inc. |
46,300 | 1,702 | ||
| Brown-Forman Corp. |
9,500 | 694 | ||
| Campbell Soup Co. |
25,500 | 990 | ||
| The Coca-Cola Co. |
43,700 | 2,286 | ||
| Colgate-Palmolive Co. |
44,000 | 2,852 | ||
| General Mills, Inc. |
34,200 | 1,998 | ||
| The Hershey Co. |
9,600 | 486 | ||
| Kimberly-Clark Corp. |
19,900 | 1,331 | ||
| Kraft Foods, Inc. — Class A |
41,600 | 1,466 | ||
| McCormick & Co., Inc. |
21,700 | 829 | ||
| The Procter & Gamble Co. |
23,500 | 1,438 | ||
| Sysco Corp. |
16,300 | 538 | ||
| UST, Inc. |
18,400 | 988 | ||
| Wal-Mart Stores, Inc. |
43,800 | 2,107 | ||
| Total |
22,726 | |||
| Energy (11.4%) |
||||
| Anadarko Petroleum Corp. |
36,800 | 1,913 | ||
| BJ Services Co. |
37,000 | 1,052 | ||
| BP PLC, ADR |
27,400 | 1,977 | ||
| Chevron Corp. |
61,100 | 5,147 | ||
| Exxon Mobil Corp. |
56,600 | 4,748 | ||
| Hess Corp. |
45,300 | 2,671 | ||
| Murphy Oil Corp. |
32,600 | 1,938 | ||
| Royal Dutch Shell PLC, ADR |
47,900 | 3,889 | ||
| Schlumberger, Ltd. |
23,100 | 1,962 | ||
| Spectra Energy Corp. |
34,750 | 902 | ||
| Common Stocks (95.2%) | Shares/ $ Par |
Value $ (000’s) | ||
| Energy continued |
||||
| Statoil ASA, ADR |
32,600 | 1,011 | ||
| Total |
27,210 | |||
| Financials (16.9%) |
||||
| American International Group, Inc. |
41,500 | 2,906 | ||
| Capital One Financial Corp. |
4,700 | 369 | ||
| The Charles Schwab Corp. |
107,700 | 2,210 | ||
| The Chubb Corp. |
17,500 | 947 | ||
| Citigroup, Inc. |
51,500 | 2,641 | ||
| Countrywide Financial Corp. |
23,200 | 843 | ||
| Fannie Mae |
18,100 | 1,182 | ||
| Fifth Third Bancorp |
61,300 | 2,438 | ||
| Genworth Financial, Inc. |
16,300 | 561 | ||
| JPMorgan Chase & Co. |
108,788 | 5,272 | ||
| Legg Mason, Inc. |
9,400 | 925 | ||
| Lincoln National Corp. |
29,976 | 2,127 | ||
| Marsh & McLennan Companies, Inc. |
115,200 | 3,557 | ||
| Mellon Financial Corp. |
58,300 | 2,565 | ||
| National City Corp. |
29,000 | 966 | ||
| The Progressive Corp. |
47,800 | 1,144 | ||
| State Street Corp. |
25,800 | 1,765 | ||
| SunTrust Banks, Inc. |
21,600 | 1,852 | ||
| The Travelers Companies, Inc. |
34,727 | 1,858 | ||
| U.S. Bancorp |
75,000 | 2,471 | ||
| Unum Group |
50,900 | 1,329 | ||
| Wells Fargo & Co. |
23,500 | 826 | ||
| Total |
40,754 | |||
| Health Care (9.2%) |
||||
| Abbott Laboratories |
25,600 | 1,371 | ||
| *Amgen, Inc. |
38,100 | 2,107 | ||
| Baxter International, Inc. |
29,300 | 1,651 | ||
| *Boston Scientific Corp. |
49,100 | 753 | ||
| Bristol-Myers Squibb Co. |
59,800 | 1,887 | ||
| Eli Lilly and Co. |
53,200 | 2,973 | ||
| Johnson & Johnson |
39,300 | 2,422 | ||
| Merck & Co., Inc. |
71,700 | 3,570 | ||
| Pfizer, Inc. |
110,300 | 2,820 | ||
| Wyeth |
41,800 | 2,397 | ||
| Total |
21,951 | |||
| Industrials (12.4%) |
||||
| 3M Co. |
41,700 | 3,618 | ||
| Avery Dennison Corp. |
28,800 | 1,915 | ||
| Cooper Industries, Ltd. |
20,100 | 1,148 | ||
| General Electric Co. |
189,100 | 7,238 | ||
| Honeywell International, Inc. |
35,200 | 1,981 | ||
| Illinois Tool Works, Inc. |
32,400 | 1,756 | ||
| Ingersoll-Rand Co., Ltd. |
25,300 | 1,387 | ||
| Masco Corp. |
65,600 | 1,868 | ||
| Norfolk Southern Corp. |
10,000 | 526 | ||
| Pall Corp. |
20,000 | 920 | ||
| Common Stocks (95.2%) | Shares/ $ Par |
Value $ (000’s) | ||
| Industrials continued |
||||
| Raytheon Co. |
29,600 | 1,595 | ||
| Southwest Airlines Co. |
46,300 | 690 | ||
| Union Pacific Corp. |
20,500 | 2,361 | ||
| United Parcel Service, Inc. |
9,300 | 679 | ||
| *USG Corp. |
10,100 | 495 | ||
| Waste Management, Inc. |
37,000 | 1,445 | ||
| Total |
29,622 | |||
| Information Technology (7.0%) |
||||
| Analog Devices, Inc. |
48,700 | 1,833 | ||
| Applied Materials, Inc. |
41,000 | 815 | ||
| *Computer Sciences Corp. |
16,500 | 976 | ||
| *Dell, Inc. |
73,600 | 2,101 | ||
| Intel Corp. |
48,400 | 1,150 | ||
| International Business Machines Corp. |
8,100 | 853 | ||
| Microsoft Corp. |
136,800 | 4,032 | ||
| Motorola, Inc. |
68,100 | 1,205 | ||
| Nokia OYJ, ADR |
73,000 | 2,052 | ||
| *Yahoo!, Inc. |
62,600 | 1,698 | ||
| Total |
16,715 | |||
| Materials (5.4%) |
||||
| Alcoa, Inc. |
42,700 | 1,731 | ||
| Chemtura Corp. |
6,699 | 74 | ||
| E. I. du Pont de Nemours and Co. |
46,600 | 2,369 | ||
| International Flavors & Fragrances, Inc. |
37,000 | 1,929 | ||
| International Paper Co. |
96,700 | 3,776 | ||
| MeadWestvaco Corp. |
34,700 | 1,226 | ||
| Vulcan Materials Co. |
15,800 | 1,810 | ||
| Total |
12,915 | |||
| Telecommunication Services (5.3%) |
||||
| ALLTEL Corp. |
19,600 | 1,324 | ||
| AT&T, Inc. |
117,235 | 4,866 | ||
| *Qwest Communications International, Inc. |
228,400 | 2,215 | ||
| Sprint Nextel Corp. |
90,300 | 1,870 | ||
| Verizon Communications, Inc. |
50,900 | 2,096 | ||
| Windstream Corp. |
27,804 | 410 | ||
| Total |
12,781 | |||
| Utilities (4.5%) |
||||
| Ameren Corp. |
6,900 | 338 | ||
| Duke Energy Corp. |
63,600 | 1,164 | ||
| Entergy Corp. |
20,000 | 2,147 | ||
| FirstEnergy Corp. |
20,300 | 1,314 | ||
| NiSource, Inc. |
92,900 | 1,924 | ||
| Pinnacle West Capital Corp. |
18,800 | 749 | ||
| Progress Energy, Inc. |
33,600 | 1,532 | ||
| TECO Energy, Inc. |
21,800 | 375 | ||
The Accompanying Notes are an Integral Part of the Financial Statements.
18
T. Rowe Price Equity Income Portfolio
Table of Contents
T. Rowe Price Equity Income Portfolio
| Common Stocks (95.2%) | Shares/ $ Par |
Value $ (000’s) |
|||
| Utilities continued |
|||||
| Xcel Energy, Inc. |
59,900 | 1,226 | |||
| Total |
10,769 | ||||
| Total Common Stocks |
228,028 | ||||
| Convertible Corporate Bonds (0.1%) | |||||
| Automobiles And Other Motor Vehicles (0.1%) |
| ||||
| Ford Motor Co., |
247,000 | 309 | |||
| Total Convertible Corporate Bonds (Cost: $247) |
309 | ||||
| Money Market Investments (4.8%) | |||||
| Other Holdings (4.8%) |
|||||
| Reserve Investment Fund |
11,587,063 | 11,587 | |||
| Total Money Market Investments (Cost: $11,587) |
11,587 | ||||
| Total Investments (100.1%) |
239,924 | ||||
| Other Assets, Less |
(348 | ) | |||
| Net Assets (100.0%) |
239,576 | ||||
| * | Non-Income Producing |
ADR after the name of a security represents — American Depositary Receipt.
| (a) | At June 30, 2007 the aggregate cost of securities for federal tax purposes (in thousands) was $200,957 and the net unrealized appreciation of investments based on that cost was $38,967 which is comprised of $41,019 aggregate gross unrealized appreciation and $2,052 aggregate gross unrealized depreciation. |
The Accompanying Notes are an Integral Part of the Financial Statements.
T. Rowe Price Equity Income Portfolio
19
Table of Contents
Mid Cap Growth Stock Portfolio
(formerly named Aggressive Growth Stock Portfolio)
Sector Allocation 6/30/07
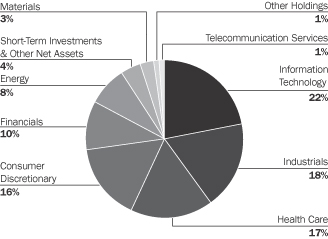
Sector Allocation is based on Net Assets.
Sector Allocation is subject to change.
Expense Example
As a shareholder of the Portfolio, you incur two types of costs: (1) transaction costs and (2) ongoing costs, including management fees and other Portfolio expenses. This Example is intended to help you understand your ongoing costs (in dollars) of investing in the Portfolio and to compare these costs with the ongoing costs of investing in other mutual funds.
The Example is based on an investment of $1,000 invested at the beginning of the period and held for the entire period (January 1, 2007 to June 30, 2007).
Actual Expenses
The first line of the table below provides information about actual account values and actual expenses. You may use the information in this line, together with the amount you invested, to estimate the expenses that you paid over the period. Simply divide your account value by $1,000 (for example, an $8,600 account value divided by $1,000 = 8.6), then multiply the result by the number in the first line under the heading entitled “Expenses Paid During Period” to estimate the expenses you paid on your account during this period.
Hypothetical Example for Comparison Purposes
The second line of the table below provides information about hypothetical account values and hypothetical expenses based on the Portfolio’s actual expense ratio and an assumed rate of return of 5% per year before expenses, which is not the Portfolio’s actual return. The hypothetical account values and expenses may not be used to estimate the actual ending account balance or expenses you paid for the period. You may use this information to compare the ongoing costs of investing in the Portfolio and other funds. To do so, compare this 5% hypothetical example with the 5% hypothetical examples that appear in the shareholder reports of the other funds.
Please note that the expenses shown in the table are meant to highlight your ongoing costs only and do not reflect any transactional costs or separate account charges. Therefore, the second line of the table is useful in comparing ongoing costs only, and will not help you determine the relative total costs of owning different funds. In addition, if these transactional costs or separate account charges were included, your costs would have been higher.
| Beginning Account Value January 1, 2007 |
Ending Account Value June 30, 2007 |
Expenses Paid During Period January 1, 2007 to June 30, 2007* | |||||||
| Actual |
$ | 1,000.00 | $ | 1,120.60 | $ | 2.73 | |||
| Hypothetical (5% return before expenses) |
$ | 1,000.00 | $ | 1,022.22 | $ | 2.61 | |||
| * | Expenses are equal to the Portfolio’s annualized expense ratio of 0.52%, multiplied by the average account value over the period, multiplied by 181/365 (to reflect the one-half year period). |
20
Mid Cap Growth Stock Portfolio
Table of Contents
Mid Cap Growth Stock Portfolio
(formerly named Aggressive Growth Stock Portfolio)
Northwestern Mutual Series Fund, Inc.
Schedule of Investments
June 30, 2007 (unaudited)
| Common Stocks (96.1%) | Shares/ $ Par |
Value $ (000’s) | ||
| Consumer Discretionary (16.2%) |
||||
| Abercrombie & Fitch Co. |
133,900 | 9,772 | ||
| *Bare Escentuals, Inc. |
406,500 | 13,882 | ||
| *Coach, Inc. |
343,300 | 16,269 | ||
| *Dollar Tree Stores, Inc. |
430,000 | 18,727 | ||
| *Focus Media Holding, Ltd., ADR |
436,100 | 22,023 | ||
| *GameStop Corp. — Class A |
769,900 | 30,103 | ||
| International Game Technology |
396,400 | 15,737 | ||
| *Jack in the Box, Inc. |
95,800 | 6,796 | ||
| *O’Reilly Automotive, Inc. |
418,160 | 15,284 | ||
| Orient-Express Hotels, Ltd. — Class A |
241,000 | 12,869 | ||
| *Payless ShoeSource, Inc. |
350,800 | 11,068 | ||
| Pool Corp. |
225,400 | 8,797 | ||
| Starwood Hotels & Resorts Worldwide, Inc. |
168,500 | 11,301 | ||
| *Urban Outfitters, Inc. |
352,800 | 8,478 | ||
| Total |
201,106 | |||
| Energy (8.6%) |
||||
| *Cameron International Corp. |
336,500 | 24,050 | ||
| Diamond Offshore Drilling, Inc. |
213,000 | 21,632 | ||
| Range Resources Corp. |
556,100 | 20,804 | ||
| Smith International, Inc. |
436,500 | 25,596 | ||
| *Southwestern Energy Co. |
341,300 | 15,188 | ||
| Total |
107,270 | |||
| Financials (9.8%) |
||||
| Chicago Mercantile Exchange Holdings, Inc. |
27,900 | 14,909 | ||
| The Colonial BancGroup, Inc. |
376,000 | 9,389 | ||
| *IntercontinentalExchange, Inc. |
69,283 | 10,243 | ||
| *Investment Technology Group, Inc. |
468,340 | 20,294 | ||
| Legg Mason, Inc. |
133,970 | 13,180 | ||
| SEI Investments Co. |
555,200 | 16,123 | ||
| *SVB Financial Group |
351,500 | 18,668 | ||
| T. Rowe Price Group, Inc. |
353,700 | 18,353 | ||
| Total |
121,159 | |||
| Health Care (16.6%) |
||||
| *Celgene Corp. |
220,800 | 12,658 | ||
| *DaVita, Inc. |
641,900 | 34,585 | ||
| *Express Scripts, Inc. |
470,600 | 23,535 | ||
| *Immucor, Inc. |
388,600 | 10,869 | ||
| *Intuitive Surgical, Inc. |
176,300 | 24,465 | ||
| *Kyphon, Inc. |
222,720 | 10,724 | ||
| *Lincare Holdings, Inc. |
600,300 | 23,922 | ||
| *Pediatrix Medical Group, Inc. |
328,700 | 18,128 | ||
| *Psychiatric Solutions, Inc. |
544,981 | 19,761 | ||
| *VCA Antech, Inc. |
480,600 | 18,114 | ||
| *Ventana Medical Systems, Inc. |
115,938 | 8,959 | ||
| Total |
205,720 | |||
| Common Stocks (96.1%) | Shares/ $ Par |
Value $ (000’s) | ||
| Industrials (18.3%) |
||||
| C.H. Robinson Worldwide, Inc. |
310,700 | 16,318 | ||
| *Corrections Corp. of America |
319,550 | 20,167 | ||
| Expeditors International of Washington, Inc. |
396,560 | 16,378 | ||
| Harsco Corp. |
173,900 | 9,043 | ||
| J.B. Hunt Transport Services, Inc. |
512,800 | 15,035 | ||
| Joy Global, Inc. |
239,100 | 13,947 | ||
| Knight Transportation, Inc. |
1,031,200 | 19,985 | ||
| The Manitowoc Co., Inc. |
180,000 | 14,468 | ||
| *Monster Worldwide, Inc. |
179,000 | 7,357 | ||
| MSC Industrial Direct Co., Inc. — Class A |
429,302 | 23,611 | ||
| Ritchie Bros. Auctioneers, Inc. |
361,900 | 22,662 | ||
| Robert Half International, Inc. |
390,900 | 14,268 | ||
| *Spirit AeroSystems Holdings, Inc. |
516,700 | 18,627 | ||
| *Stericycle, Inc. |
335,200 | 14,903 | ||
| Total |
226,769 | |||
| Information Technology (21.8%) |
||||
| *Activision, Inc. |
913,610 | 17,057 | ||
| Amphenol Corp. |
581,400 | 20,727 | ||
| *Autodesk, Inc. |
200,500 | 9,440 | ||
| *Citrix Systems, Inc. |
468,600 | 15,778 | ||
| *Cognizant Technology Solutions Corp. |
240,000 | 18,022 | ||
| *Digital River, Inc. |
199,900 | 9,045 | ||
| FactSet Research Systems, Inc. |
306,000 | 20,915 | ||
| Harris Corp. |
229,500 | 12,519 | ||
| KLA-Tencor Corp. |
329,880 | 18,127 | ||
| *MEMC Electronic Materials, Inc. |
346,800 | 21,196 | ||
| *Mettler-Toledo International, Inc. |
120,400 | 11,499 | ||
| Microchip Technology, Inc. |
667,195 | 24,714 | ||
| *Network Appliance, Inc. |
314,700 | 9,189 | ||
| *NVIDIA Corp. |
349,800 | 14,450 | ||
| *ValueClick, Inc. |
1,119,460 | 32,980 | ||
| *VeriFone Holdings, Inc. |
467,300 | 16,472 | ||
| Total |
272,130 | |||
| Materials (2.8%) |
||||
| *Owens-Illinois, Inc. |
274,000 | 9,590 | ||
| Praxair, Inc. |
346,540 | 24,947 | ||
| Total |
34,537 | |||
| Other Holdings (1.0%) | ||||
| SPDR Metals & Mining ETF |
192,700 | 12,017 | ||
| Total |
12,017 | |||
| Common Stocks (96.1%) | Shares/ $ Par |
Value $ (000’s) | ||
| Telecommunication Services (1.0%) | ||||
| *NeuStar, Inc. |
432,600 | 12,532 | ||
| Total |
12,532 | |||
| Total Common Stocks |
1,193,240 | |||
| Money Market Investments (3.5%) | ||||
| Federal Government & Agencies (0.2%) | ||||
| Fannie Mae, |
2,500,000 | 2,472 | ||
| Total |
2,472 | |||
| Finance Services (2.4%) |
||||
| Alpine Securitization, 5.30%, 7/9/07 |
10,000,000 | 9,987 | ||
| (b)Barton Capital LLC, 5.35%, 7/12/07 |
10,000,000 | 9,982 | ||
| (b)Bryant Park Funding LLC, 5.35%, 7/12/07 |
10,000,000 | 9,982 | ||
| Total |
29,951 | |||
| National Commercial Banks (0.9%) | ||||
| UBS Finance LLC, 5.35%, 7/2/07 |
10,700,000 | 10,697 | ||
| Total |
10,697 | |||
| Total Money Market Investments (Cost: $43,119) |
43,120 | |||
| Total Investments (99.6%) |
1,236,360 | |||
| Other Assets, Less Liabilities (0.4%) |
5,450 | |||
| Net Assets (100.0%) |
1,241,810 | |||
| * | Non-Income Producing |
ADR after the name of a security represents — American Depositary Receipt.
| (a) | At June 30, 2007 the aggregate cost of securities for federal tax purposes (in thousands) was $1,053,906 and the net unrealized appreciation of investments based on that cost was $182,453 which is comprised of $195,075 aggregate gross unrealized appreciation and $12,622 aggregate gross unrealized depreciation. |
| (b) | All or a portion of the securities have been committed as collateral for open futures positions or when-issued securities. Information regarding open futures contracts as of period end is summarized below. |
The Accompanying Notes are an Integral Part of the Financial Statements.
Mid Cap Growth Stock Portfolio
21
Table of Contents
Mid Cap Growth Stock Portfolio
(formerly named Aggressive Growth Stock Portfolio)
| Issuer (000’s) | Number of Contracts |
Expiration Date |
Unrealized Appreciation/ (Depreciation) (000’s) |
|||||
| Midcap 400 Index |
38 | 9/07 | $ | (94 | ) | |||
| (Total Notional Value at |
||||||||
The Accompanying Notes are an Integral Part of the Financial Statements.
22
Mid Cap Growth Stock Portfolio
Table of Contents
Sector Allocation 6/30/07
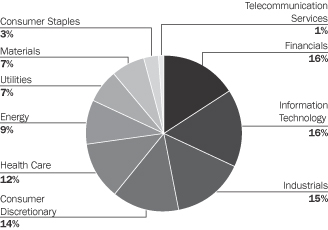
Sector Allocation is based on equities.
Sector Allocation is subject to change.
Expense Example
As a shareholder of the Portfolio, you incur two types of costs: (1) transaction costs and (2) ongoing costs, including management fees and other Portfolio expenses. This Example is intended to help you understand your ongoing costs (in dollars) of investing in the Portfolio and to compare these costs with the ongoing costs of investing in other mutual funds.
The Example is based on an investment of $1,000 invested at the beginning of the period and held for the entire period (January 1, 2007 to June 30, 2007).
Actual Expenses
The first line of the table below provides information about actual account values and actual expenses. You may use the information in this line, together with the amount you invested, to estimate the expenses that you paid over the period. Simply divide your account value by $1,000 (for example, an $8,600 account value divided by $1,000 = 8.6), then multiply the result by the number in the first line under the heading entitled “Expenses Paid During Period” to estimate the expenses you paid on your account during this period.
Hypothetical Example for Comparison Purposes
The second line of the table below provides information about hypothetical account values and hypothetical expenses based on the Portfolio’s actual expense ratio and an assumed rate of return of 5% per year before expenses, which is not the Portfolio’s actual return. The hypothetical account values and expenses may not be used to estimate the actual ending account balance or expenses you paid for the period. You may use this information to compare the ongoing costs of investing in the Portfolio and other funds. To do so, compare this 5% hypothetical example with the 5% hypothetical examples that appear in the shareholder reports of the other funds.
Please note that the expenses shown in the table are meant to highlight your ongoing costs only and do not reflect any transactional costs or separate account charges. Therefore, the second line of the table is useful in comparing ongoing costs only, and will not help you determine the relative total costs of owning different funds. In addition, if these transactional costs or separate account charges were included, your costs would have been higher.
| Beginning Account Value January 1, 2007 |
Ending Account Value June 30, 2007 |
Expenses Paid During Period January 1, 2007 to June 30, 2007* | |||||||
| Actual |
$ | 1,000.00 | $ | 1,118.50 | $ | 1.37 | |||
| Hypothetical (5% return before expenses) |
$ | 1,000.00 | $ | 1,023.51 | $ | 1.30 | |||
| * | Expenses are equal to the Portfolio’s annualized expense ratio of 0.26%, multiplied by the average account value over the period, multiplied by 181/365 (to reflect the one-half year period). |
Index 400 Stock Portfolio
23
Table of Contents
Index 400 Stock Portfolio
Northwestern Mutual Series Fund, Inc.
Schedule of Investments
June 30, 2007 (unaudited)
| Common Stocks (93.9%) | Shares/ $ Par |
Value $ (000’s) | ||
| Consumer Discretionary (13.5%) |
||||
| *99 Cents Only Stores |
21,533 | 282 | ||
| (b)Advance Auto Parts, Inc. |
48,900 | 1,982 | ||
| *Aeropostale, Inc. |
23,700 | 988 | ||
| American Eagle Outfitters, Inc. |
90,450 | 2,322 | ||
| American Greetings Corp. |
26,100 | 739 | ||
| *AnnTaylor Stores Corp. |
29,750 | 1,054 | ||
| Applebee’s International, Inc. |
34,300 | 827 | ||
| ArvinMeritor, Inc. |
32,850 | 729 | ||
| Barnes & Noble, Inc. |
23,600 | 908 | ||
| Beazer Homes USA, Inc. |
18,000 | 444 | ||
| Belo Corp. — Class A |
40,400 | 832 | ||
| Blyth, Inc. |
11,600 | 308 | ||
| Bob Evans Farms, Inc. |
16,400 | 604 | ||
| Borders Group, Inc. |
27,300 | 520 | ||
| BorgWarner, Inc. |
26,600 | 2,290 | ||
| Boyd Gaming Corp. |
19,700 | 969 | ||
| Brinker International, Inc. |
52,175 | 1,527 | ||
| Callaway Golf Co. |
28,200 | 502 | ||
| *Career Education Corp. |
43,700 | 1,476 | ||
| *CarMax, Inc. |
98,800 | 2,520 | ||
| Catalina Marketing Corp. |
16,900 | 532 | ||
| CBRL Group, Inc. |
11,226 | 477 | ||
| *Charming Shoppes, Inc. |
59,100 | 640 | ||
| *The Cheesecake Factory, Inc. |
33,050 | 810 | ||
| *Chico’s FAS, Inc. |
80,900 | 1,969 | ||
| *Coldwater Creek, Inc. |
27,800 | 646 | ||
| *Corinthian Colleges, Inc. |
39,800 | 648 | ||
| DeVry, Inc. |
27,400 | 932 | ||
| *Dick’s Sporting Goods, Inc. |
18,100 | 1,053 | ||
| *Dollar Tree Stores, Inc. |
47,200 | 2,057 | ||
| Entercom Communications Corp. |
12,800 | 319 | ||
| Foot Locker, Inc. |
71,100 | 1,550 | ||
| Furniture Brands International, Inc. |
22,200 | 315 | ||
| *GameStop Corp. — Class A |
70,100 | 2,742 | ||
| Gentex Corp. |
65,600 | 1,292 | ||
| *Hanesbrands, Inc. |
44,300 | 1,197 | ||
| Harte-Hanks, Inc. |
21,750 | 559 | ||
| *Hovnanian Enterprises, Inc. — Class A |
16,800 | 278 | ||
| International Speedway Corp. — Class A |
16,400 | 864 | ||
| *ITT Educational Services, Inc. |
14,700 | 1,725 | ||
| John Wiley & Sons, Inc. |
20,300 | 980 | ||
| *Laureate Education, Inc. |
23,619 | 1,456 | ||
| *Lear Corp. |
35,200 | 1,253 | ||
| Lee Enterprises, Inc. |
21,200 | 442 | ||
| M.D.C. Holdings, Inc. |
16,200 | 783 | ||
| Matthews International Corp. — Class A |
14,500 | 632 | ||
| Media General, Inc. |
10,400 | 346 | ||
| Modine Manufacturing Co. |
15,100 | 341 | ||
| Common Stocks (93.9%) | Shares/ $ Par |
Value $ (000’s) | ||
| Consumer Discretionary continued |
||||
| *Mohawk Industries, Inc. |
24,700 | 2,491 | ||
| *Netflix, Inc. |
27,800 | 539 | ||
| *NVR, Inc. |
2,200 | 1,495 | ||
| *O’Reilly Automotive, Inc. |
52,500 | 1,919 | ||
| *Pacific Sunwear of California, Inc. |
32,400 | 713 | ||
| *Payless ShoeSource, Inc. |
30,342 | 957 | ||
| PetSmart, Inc. |
62,500 | 2,028 | ||
| Phillips-Van Heusen Corp. |
25,500 | 1,545 | ||
| Regis Corp. |
20,400 | 780 | ||
| *Rent-A-Center, Inc. |
32,300 | 847 | ||
| Ross Stores, Inc. |
64,200 | 1,977 | ||
| Ruby Tuesday, Inc. |
25,000 | 658 | ||
| The Ryland Group, Inc. |
19,300 | 721 | ||
| *Saks, Inc. |
65,400 | 1,396 | ||
| *Scholastic Corp. |
12,000 | 431 | ||
| *Scientific Games Corp. |
31,000 | 1,083 | ||
| Sotheby’s |
26,400 | 1,215 | ||
| Strayer Education, Inc. |
6,600 | 869 | ||
| Thor Industries, Inc. |
16,100 | 727 | ||
| *The Timberland Co. |
23,100 | 582 | ||
| *Toll Brothers, Inc. |
58,400 | 1,459 | ||
| Tupperware Brands Corp. |
28,200 | 810 | ||
| *Urban Outfitters, Inc. |
51,800 | 1,245 | ||
| *Valassis Communications, Inc. |
22,000 | 378 | ||
| The Washington Post Co. |
2,600 | 2,018 | ||
| Westwood One, Inc. |
32,500 | 234 | ||
| Williams-Sonoma, Inc. |
50,800 | 1,604 | ||
| Total |
79,382 | |||
| Consumer Staples (2.6%) |
||||
| Alberto-Culver Co. |
37,400 | 887 | ||
| *BJ’s Wholesale Club, Inc. |
29,600 | 1,066 | ||
| Church & Dwight Co., Inc. |
30,250 | 1,466 | ||
| *Energizer Holdings, Inc. |
25,900 | 2,581 | ||
| *Hansen Natural Corp. |
27,700 | 1,191 | ||
| Hormel Foods Corp. |
33,500 | 1,251 | ||
| The J.M. Smucker Co. |
25,996 | 1,655 | ||
| Lancaster Colony Corp. |
10,700 | 448 | ||
| *NBTY, Inc. |
26,000 | 1,123 | ||
| PepsiAmericas, Inc. |
27,700 | 680 | ||
| Ruddick Corp. |
16,500 | 497 | ||
| *Smithfield Foods, Inc. |
54,700 | 1,684 | ||
| Tootsie Roll Industries, Inc. |
12,483 | 346 | ||
| Universal Corp. |
11,900 | 725 | ||
| Total |
15,600 | |||
| Energy (8.3%) |
||||
| Arch Coal, Inc. |
65,500 | 2,279 | ||
| *Cameron International Corp. |
50,600 | 3,616 | ||
| Cimarex Energy Co. |
38,300 | 1,509 | ||
| *Denbury Resources, Inc. |
55,700 | 2,089 | ||
| *Encore Acquisition Co. |
24,400 | 678 | ||
| *FMC Technologies, Inc. |
29,869 | 2,366 | ||
| Common Stocks (93.9%) | Shares/ $ Par |
Value $ (000’s) | ||
| Energy continued |
||||
| *Forest Oil Corp. |
34,800 | 1,471 | ||
| Frontier Oil Corp. |
50,600 | 2,215 | ||
| *Grant Prideco, Inc. |
58,600 | 3,154 | ||
| *Hanover Compressor Co. |
47,500 | 1,133 | ||
| Helmerich & Payne, Inc. |
47,400 | 1,679 | ||
| *Newfield Exploration Co. |
59,700 | 2,719 | ||
| Noble Energy, Inc. |
78,500 | 4,899 | ||
| Overseas Shipholding Group, Inc. |
11,500 | 936 | ||
| Patterson-UTI Energy, Inc. |
72,000 | 1,887 | ||
| Pioneer Natural Resources Co. |
56,700 | 2,762 | ||
| *Plains Exploration & Production Co. |
33,000 | 1,578 | ||
| Pogo Producing Co. |
26,900 | 1,366 | ||
| *Pride International, Inc. |
76,200 | 2,854 | ||
| *Quicksilver Resources, Inc. |
25,500 | 1,137 | ||
| *Southwestern Energy Co. |
77,300 | 3,440 | ||
| *Superior Energy Services, Inc. |
37,100 | 1,481 | ||
| Tidewater, Inc. |
26,400 | 1,871 | ||
| Total |
49,119 | |||
| Financials (15.4%) |
||||
| A.G. Edwards, Inc. |
34,600 | 2,926 | ||
| AMB Property Corp. |
45,800 | 2,437 | ||
| American Financial Group, Inc. |
32,450 | 1,108 | ||
| *AmeriCredit Corp. |
54,200 | 1,439 | ||
| Arthur J. Gallagher & Co. |
45,200 | 1,260 | ||
| Associated Banc-Corp. |
58,563 | 1,915 | ||
| Astoria Financial Corp. |
38,500 | 964 | ||
| Bank of Hawaii Corp. |
22,800 | 1,177 | ||
| Brown & Brown, Inc. |
52,900 | 1,330 | ||
| Cathay General Bancorp |
23,500 | 788 | ||
| City National Corp. |
18,800 | 1,430 | ||
| The Colonial BancGroup, Inc. |
70,300 | 1,755 | ||
| Commerce Group, Inc. |
22,000 | 764 | ||
| Cousins Properties, Inc. |
20,100 | 583 | ||
| Cullen/Frost Bankers, Inc. |
27,600 | 1,476 | ||
| Eaton Vance Corp. |
57,800 | 2,555 | ||
| Equity One, Inc. |
17,000 | 434 | ||
| Everest Re Group, Ltd. |
29,000 | 3,152 | ||
| Fidelity National Financial, Inc. |
101,791 | 2,412 | ||
| First American Corp. |
44,400 | 2,198 | ||
| First Niagara Financial Group, Inc. |
50,900 | 667 | ||
| FirstMerit Corp. |
37,000 | 774 | ||
| Greater Bay Bancorp |
23,500 | 654 | ||
| The Hanover Insurance Group, Inc. |
23,700 | 1,156 | ||
| HCC Insurance Holdings, Inc. |
51,550 | 1,722 | ||
| Highwoods Properties, Inc. |
26,100 | 979 | ||
The Accompanying Notes are an Integral Part of the Financial Statements.
24
Index 400 Stock Portfolio
Table of Contents
Index 400 Stock Portfolio
| Common Stocks (93.9%) | Shares/ $ Par |
Value $ (000’s) | ||
| Financials continued |
||||
| Horace Mann Educators Corp. |
19,900 | 423 | ||
| Hospitality Properties Trust |
43,100 | 1,788 | ||
| IndyMac Bancorp, Inc. |
33,200 | 968 | ||
| Investors Financial Services Corp. |
30,800 | 1,899 | ||
| Jefferies Group, Inc. |
49,000 | 1,322 | ||
| Leucadia National Corp. |
74,700 | 2,634 | ||
| Liberty Property Trust |
42,300 | 1,858 | ||
| The Macerich Co. |
32,900 | 2,713 | ||
| Mack-Cali Realty Corp. |
31,200 | 1,357 | ||
| Mercury General Corp. |
16,300 | 898 | ||
| Nationwide Health Properties, Inc. |
41,000 | 1,115 | ||
| New York Community Bancorp, Inc. |
126,721 | 2,157 | ||
| Nuveen Investments, Inc. |
36,500 | 2,268 | ||
| Ohio Casualty Corp. |
27,500 | 1,191 | ||
| Old Republic International Corp. |
106,275 | 2,259 | ||
| The PMI Group, Inc. |
39,900 | 1,782 | ||
| Potlatch Corp. |
17,947 | 773 | ||
| Protective Life Corp. |
32,100 | 1,535 | ||
| Radian Group, Inc. |
36,900 | 1,993 | ||
| Raymond James Financial, Inc. |
42,725 | 1,320 | ||
| Rayonier, Inc. |
35,566 | 1,605 | ||
| Regency Centers Corp. |
31,900 | 2,249 | ||
| SEI Investments Co. |
58,300 | 1,693 | ||
| StanCorp Financial Group, Inc. |
24,600 | 1,291 | ||
| *SVB Financial Group |
15,900 | 844 | ||
| TCF Financial Corp. |
51,600 | 1,434 | ||
| UDR, Inc. |
62,400 | 1,641 | ||
| Unitrin, Inc. |
18,300 | 900 | ||
| W.R. Berkley Corp. |
78,550 | 2,557 | ||
| Waddell & Reed Financial, Inc. — Class A |
38,600 | 1,004 | ||
| Washington Federal, Inc. |
40,165 | 976 | ||
| Webster Financial Corp. |
26,000 | 1,109 | ||
| Weingarten Realty Investors |
35,000 | 1,439 | ||
| Westamerica Bancorporation |
13,800 | 611 | ||
| Wilmington Trust Corp. |
31,600 | 1,312 | ||
| Total |
90,973 | |||
| Health Care (10.9%) |
||||
| *Advanced Medical Optics, Inc. |
27,512 | 960 | ||
| *Affymetrix, Inc. |
31,500 | 784 | ||
| *Apria Healthcare Group, Inc. |
20,100 | 578 | ||
| Beckman Coulter, Inc. |
28,500 | 1,843 | ||
| *Cephalon, Inc. |
30,400 | 2,443 | ||
| *Cerner Corp. |
30,100 | 1,670 | ||
| *Charles River Laboratories International, Inc. |
30,900 | 1,595 | ||
| *Community Health Systems, Inc. |
43,200 | 1,747 | ||
| *Covance, Inc. |
29,200 | 2,002 | ||
| *Cytyc Corp. |
53,000 | 2,285 | ||
| DENTSPLY International, Inc. |
69,800 | 2,670 | ||
| Common Stocks (93.9%) | Shares/ $ Par |
Value $ (000’s) | ||
| Health Care continued |
||||
| *Edwards Lifesciences Corp. |
26,500 | 1,308 | ||
| *Endo Pharmaceuticals Holdings, Inc. |
61,500 | 2,105 | ||
| *Gen-Probe, Inc. |
24,100 | 1,456 | ||
| Health Management Associates, Inc. — Class A |
111,400 | 1,266 | ||
| *Health Net, Inc. |
51,600 | 2,723 | ||
| *Henry Schein, Inc. |
40,800 | 2,180 | ||
| Hillenbrand Industries, Inc. |
28,300 | 1,840 | ||
| *Intuitive Surgical, Inc. |
17,200 | 2,387 | ||
| *Invitrogen Corp. |
21,500 | 1,586 | ||
| *Kindred Healthcare, Inc. |
14,500 | 445 | ||
| *LifePoint Hospitals, Inc. |
26,500 | 1,025 | ||
| *Lincare Holdings, Inc. |
38,500 | 1,534 | ||
| Medicis Pharmaceutical Corp. |
25,700 | 785 | ||
| *Millennium Pharmaceuticals, Inc. |
147,600 | 1,560 | ||
| Omnicare, Inc. |
55,900 | 2,016 | ||
| *Par Pharmaceutical Companies, Inc. |
16,100 | 455 | ||
| *PDL BioPharma, Inc. |
53,600 | 1,249 | ||
| Perrigo Co. |
34,900 | 683 | ||
| Pharmaceutical Product Development, Inc. |
47,800 | 1,829 | ||
| *Psychiatric Solutions, Inc. |
25,000 | 907 | ||
| *ResMed, Inc. |
35,800 | 1,477 | ||
| *Sepracor, Inc. |
48,900 | 2,006 | ||
| STERIS Corp. |
29,800 | 912 | ||
| *Techne Corp. |
18,100 | 1,036 | ||
| *Triad Hospitals, Inc. |
41,039 | 2,206 | ||
| Universal Health Services, Inc. — Class B |
24,800 | 1,525 | ||
| *Valeant Pharmaceuticals International |
43,500 | 726 | ||
| *Varian, Inc. |
14,000 | 768 | ||
| *VCA Antech, Inc. |
38,600 | 1,455 | ||
| *Ventana Medical Systems, Inc. |
15,200 | 1,175 | ||
| *Vertex Pharmaceuticals, Inc. |
60,200 | 1,719 | ||
| *Wellcare Health Plans, Inc. |
15,400 | 1,394 | ||
| Total |
64,315 | |||
| Industrials (14.4%) |
||||
| *AGCO Corp. |
42,000 | 1,823 | ||
| *AirTran Holdings, Inc. |
42,000 | 459 | ||
| *Alaska Air Group, Inc. |
18,600 | 518 | ||
| Alexander & Baldwin, Inc. |
19,700 | 1,046 | ||
| *Alliant Techsystems, Inc. |
15,200 | 1,507 | ||
| AMETEK, Inc. |
49,050 | 1,946 | ||
| *Avis Budget Group, Inc. |
46,570 | 1,324 | ||
| The Brink’s Co. |
22,300 | 1,380 | ||
| Carlisle Companies, Inc. |
28,500 | 1,326 | ||
| *ChoicePoint, Inc. |
34,900 | 1,482 | ||
| Con-way, Inc. |
21,000 | 1,055 | ||
| *Copart, Inc. |
32,700 | 1,000 | ||
| The Corporate Executive Board Co. |
17,600 | 1,142 | ||
| Crane Co. |
23,100 | 1,050 | ||
| Deluxe Corp. |
23,700 | 962 | ||
| Donaldson Co., Inc. |
31,700 | 1,127 | ||
| Common Stocks (93.9%) | Shares/ $ Par |
Value $ (000’s) | ||
| Industrials continued |
||||
| DRS Technologies, Inc. |
18,600 | 1,065 | ||
| The Dun & Bradstreet Corp. |
27,300 | 2,811 | ||
| Expeditors International of Washington, Inc. |
98,000 | 4,047 | ||
| Fastenal Co. |
57,600 | 2,411 | ||
| Federal Signal Corp. |
21,900 | 347 | ||
| Flowserve Corp. |
26,200 | 1,876 | ||
| GATX Corp. |
23,500 | 1,157 | ||
| Graco, Inc. |
30,600 | 1,233 | ||
| Granite Construction, Inc. |
15,600 | 1,001 | ||
| Harsco Corp. |
38,700 | 2,012 | ||
| Herman Miller, Inc. |
29,200 | 923 | ||
| HNI Corp. |
22,000 | 902 | ||
| Hubbell, Inc. — Class B |
27,400 | 1,486 | ||
| J.B. Hunt Transport Services, Inc. |
46,700 | 1,369 | ||
| *Jacobs Engineering Group, Inc. |
54,400 | 3,129 | ||
| *JetBlue Airways Corp. |
82,025 | 964 | ||
| Joy Global, Inc. |
49,950 | 2,914 | ||
| *KBR, Inc. |
77,000 | 2,020 | ||
| Kelly Services, Inc. |
9,900 | 272 | ||
| Kennametal, Inc. |
17,900 | 1,468 | ||
| *Korn/Ferry International |
22,200 | 583 | ||
| Lincoln Electric Holdings, Inc. |
19,600 | 1,455 | ||
| Manpower, Inc. |
38,800 | 3,579 | ||
| Mine Safety Appliances Co. |
13,700 | 600 | ||
| MSC Industrial Direct Co., Inc. — Class A |
24,500 | 1,348 | ||
| *Navigant Consulting, Inc. |
19,900 | 369 | ||
| Nordson Corp. |
15,500 | 777 | ||
| Oshkosh Truck Corp. |
34,000 | 2,139 | ||
| Pentair, Inc. |
45,900 | 1,770 | ||
| *Quanta Services, Inc. |
54,900 | 1,684 | ||
| Republic Services, Inc. |
77,400 | 2,372 | ||
| Rollins, Inc. |
13,525 | 308 | ||
| Roper Industries, Inc. |
40,600 | 2,318 | ||
| *Sequa Corp. — Class A |
3,200 | 358 | ||
| SPX Corp. |
26,200 | 2,301 | ||
| *Stericycle, Inc. |
40,300 | 1,792 | ||
| Teleflex, Inc. |
18,000 | 1,472 | ||
| *Thomas & Betts Corp. |
23,300 | 1,351 | ||
| The Timken Co. |
43,300 | 1,564 | ||
| Trinity Industries, Inc. |
36,950 | 1,609 | ||
| *United Rentals, Inc. |
30,600 | 996 | ||
| Werner Enterprises, Inc. |
22,250 | 448 | ||
| *YRC Worldwide, Inc. |
26,400 | 972 | ||
| Total |
84,719 | |||
| Information Technology (14.9%) |
||||
| *3Com Corp. |
183,300 | 757 | ||
| *Activision, Inc. |
115,866 | 2,163 | ||
| Acxiom Corp. |
31,702 | 839 | ||
| *ADC Telecommunications, Inc. |
57,100 | 1,047 | ||
| ADTRAN, Inc. |
28,200 | 732 | ||
| *Advent Software, Inc. |
9,000 | 293 | ||
| *Alliance Data Systems Corp. |
30,400 | 2,349 | ||
| Amphenol Corp. — Class A |
82,200 | 2,930 | ||
The Accompanying Notes are an Integral Part of the Financial Statements.
Index 400 Stock Portfolio
25
Table of Contents
Index 400 Stock Portfolio
| Common Stocks (93.9%) | Shares/ $ Par |
Value $ (000’s) | ||
| Information Technology continued |
||||
| *Andrew Corp. |
71,600 | 1,034 | ||
| *Arrow Electronics, Inc. |
56,500 | 2,171 | ||
| *Atmel Corp. |
196,900 | 1,095 | ||
| *Avnet, Inc. |
59,800 | 2,370 | ||
| *Avocent Corp. |
23,200 | 673 | ||
| *The BISYS Group, Inc. |
55,700 | 659 | ||
| Broadridge Financial Solutions, Inc. |
64,000 | 1,224 | ||
| *Cadence Design Systems, Inc. |
127,900 | 2,809 | ||
| CDW Corp. |
28,000 | 2,379 | ||
| *Ceridian Corp. |
65,900 | 2,307 | ||
| *CheckFree Corp. |
40,400 | 1,624 | ||
| *CommScope, Inc. |
28,100 | 1,640 | ||
| *Cree, Inc. |
38,700 | 1,000 | ||
| *CSG Systems International, Inc. |
19,900 | 528 | ||
| *Cypress Semiconductor Corp. |
69,500 | 1,619 | ||
| Diebold, Inc. |
30,200 | 1,576 | ||
| *Digital River, Inc. |
18,600 | 842 | ||
| *DST Systems, Inc. |
24,900 | 1,972 | ||
| *Dycom Industries, Inc. |
18,700 | 561 | ||
| *F5 Networks, Inc. |
19,200 | 1,548 | ||
| Fair Isaac Corp. |
26,400 | 1,059 | ||
| *Fairchild Semiconductor International, Inc. |
56,900 | 1,099 | ||
| *Gartner, Inc. |
23,900 | 588 | ||
| Global Payments, Inc. |
31,500 | 1,249 | ||
| Harris Corp. |
61,700 | 3,366 | ||
| Imation Corp. |
16,200 | 597 | ||
| *Ingram Micro, Inc. — Class A |
65,700 | 1,426 | ||
| *Integrated Device Technology, Inc. |
90,930 | 1,389 | ||
| *International Rectifier Corp. |
33,300 | 1,241 | ||
| Intersil Corp. — Class A |
62,100 | 1,954 | ||
| Jack Henry & Associates, Inc. |
35,400 | 912 | ||
| *KEMET Corp. |
38,500 | 271 | ||
| *Lam Research Corp. |
62,100 | 3,192 | ||
| *Lattice Semiconductor Corp. |
52,700 | 301 | ||
| *Macrovision Corp. |
24,400 | 733 | ||
| *McAfee, Inc. |
73,300 | 2,580 | ||
| *Mentor Graphics Corp. |
39,200 | 516 | ||
| Micrel, Inc. |
26,000 | 331 | ||
| Microchip Technology, Inc. |
99,312 | 3,679 | ||
| MoneyGram International, Inc. |
38,300 | 1,070 | ||
| *MPS Group, Inc. |
47,100 | 630 | ||
| National Instruments Corp. |
26,250 | 855 | ||
| *Palm, Inc. |
47,500 | 760 | ||
| *Parametric Technology Corp. |
52,800 | 1,141 | ||
| Plantronics, Inc. |
22,000 | 577 | ||
| *Polycom, Inc. |
42,100 | 1,415 | ||
| *Powerwave Technologies, Inc. |
59,900 | 401 | ||
| *RF Micro Devices, Inc. |
88,700 | 553 | ||
| *Semtech Corp. |
28,900 | 501 | ||
| *Silicon Laboratories, Inc. |
25,200 | 872 | ||
| Common Stocks (93.9%) | Shares/ $ Par |
Value $ (000’s) | ||
| Information Technology continued |
||||
| *SRA International, Inc. |
19,100 | 482 | ||
| *Sybase, Inc. |
42,000 | 1,003 | ||
| *Synopsys, Inc. |
65,900 | 1,742 | ||
| *Tech Data Corp. |
25,300 | 973 | ||
| *Transaction Systems Architects, Inc. |
17,100 | 576 | ||
| *TriQuint Semiconductor, Inc. |
63,911 | 323 | ||
| *UTStarcom, Inc. |
48,900 | 274 | ||
| *ValueClick, Inc. |
45,900 | 1,352 | ||
| *Vishay Intertechnology, Inc. |
84,987 | 1,344 | ||
| *Western Digital Corp. |
102,000 | 1,974 | ||
| *Wind River Systems, Inc. |
34,500 | 380 | ||
| *Zebra Technologies Corp. |
31,700 | 1,228 | ||
| Total |
87,650 | |||
| Materials (6.2%) |
||||
| Airgas, Inc. |
36,100 | 1,729 | ||
| Albemarle Corp. |
36,500 | 1,406 | ||
| Bowater, Inc. |
25,800 | 644 | ||
| Cabot Corp. |
29,600 | 1,411 | ||
| Carpenter Technology Corp. |
11,800 | 1,538 | ||
| Chemtura Corp. |
110,863 | 1,232 | ||
| Commercial Metals Co. |
54,300 | 1,834 | ||
| Cytec Industries, Inc. |
19,400 | 1,237 | ||
| Ferro Corp. |
19,800 | 494 | ||
| Florida Rock Industries, Inc. |
22,700 | 1,532 | ||
| FMC Corp. |
17,600 | 1,573 | ||
| Louisiana-Pacific Corp. |
47,900 | 906 | ||
| The Lubrizol Corp. |
31,800 | 2,053 | ||
| Lyondell Chemical Co. |
98,800 | 3,668 | ||
| Martin Marietta Materials, Inc. |
19,600 | 3,176 | ||
| Minerals Technologies, Inc. |
8,800 | 589 | ||
| Olin Corp. |
33,900 | 712 | ||
| Packaging Corp. of America |
37,700 | 954 | ||
| Reliance Steel & Aluminum Co. |
29,800 | 1,677 | ||
| RPM International, Inc. |
55,600 | 1,285 | ||
| The Scotts Miracle-Gro Co. — Class A |
20,200 | 867 | ||
| Sensient Technologies Corp. |
21,600 | 548 | ||
| Sonoco Products Co. |
46,000 | 1,969 | ||
| Steel Dynamics, Inc. |
39,100 | 1,639 | ||
| The Valspar Corp. |
46,100 | 1,310 | ||
| Worthington Industries, Inc. |
31,800 | 688 | ||
| Total |
36,671 | |||
| Telecommunication Services (0.8%) |
||||
| Cincinnati Bell, Inc. |
113,800 | 658 | ||
| *NeuStar, Inc. |
29,500 | 855 | ||
| Telephone and Data Systems, Inc. |
47,800 | 2,990 | ||
| Total |
4,503 | |||
| Common Stocks (93.9%) | Shares/ $ Par |
Value $ (000’s) | ||
| Utilities (6.9%) |
||||
| AGL Resources, Inc. |
35,800 | 1,449 | ||
| Alliant Energy Corp. |
53,400 | 2,075 | ||
| Aqua America, Inc. |
60,933 | 1,370 | ||
| *Aquila, Inc. |
172,200 | 704 | ||
| Black Hills Corp. |
17,300 | 688 | ||
| DPL, Inc. |
51,900 | 1,471 | ||
| Energy East Corp. |
72,600 | 1,894 | ||
| Equitable Resources, Inc. |
55,900 | 2,770 | ||
| Great Plains Energy, Inc. |
39,500 | 1,150 | ||
| Hawaiian Electric Industries, Inc. |
37,400 | 886 | ||
| IDACORP, Inc. |
20,100 | 644 | ||
| MDU Resources Group, Inc. |
83,600 | 2,344 | ||
| National Fuel Gas Co. |
38,400 | 1,663 | ||
| Northeast Utilities |
70,900 | 2,011 | ||
| NSTAR |
49,100 | 1,593 | ||
| OGE Energy Corp. |
42,200 | 1,547 | ||
| ONEOK, Inc. |
51,000 | 2,571 | ||
| Pepco Holdings, Inc. |
88,500 | 2,496 | ||
| PNM Resources, Inc. |
35,250 | 980 | ||
| Puget Energy, Inc. |
53,600 | 1,296 | ||
| SCANA Corp. |
53,600 | 2,052 | ||
| *Sierra Pacific Resouces |
101,681 | 1,786 | ||
| Vectren Corp. |
35,200 | 948 | ||
| Westar Energy, Inc. |
40,200 | 976 | ||
| WGL Holdings, Inc. |
22,600 | 738 | ||
| Wisconsin Energy Corp. |
53,700 | 2,375 | ||
| Total |
40,477 | |||
| Total Common Stocks |
553,409 | |||
| Money Market Investments (6.2%) | ||||
| Federal Government & Agencies (0.5%) | ||||
| (b)Fannie Mae, |
3,000,000 | 2,967 | ||
| Total |
2,967 | |||
| Finance Lessors (1.7%) |
||||
| (b)Ranger Funding Co. LLC, 5.34%, 7/12/07 |
10,000,000 | 9,982 | ||
| Total |
9,982 | |||
| Finance Services (1.7%) |
||||
| (b)Ciesco LP, |
10,000,000 | 9,931 | ||
| Total |
9,931 | |||
| National Commercial Banks (0.6%) | ||||
| (b)UBS Finance LLC, 5.35%, 7/2/07 |
3,700,000 | 3,699 | ||
| Total |
3,699 | |||
The Accompanying Notes are an Integral Part of the Financial Statements.
26
Index 400 Stock Portfolio
Table of Contents
Index 400 Stock Portfolio
| Money Market Investments (6.2%) |
Shares/ $ Par |
Value $ (000’s) |
|||
| Short Term Business Credit (1.7%) |
| ||||
| (b)Sheffield Receivables, 5.35%, 7/10/07 |
10,000,000 | 9,985 | |||
| Total |
9,985 | ||||
| Total Money Market Investments (Cost: $36,563) |
36,564 | ||||
| Total Investments (100.1%) |
589,973 | ||||
| Other Assets, Less Liabilities (-0.1%) |
(558 | ) | |||
| Net Assets (100.0%) |
589,415 | ||||
| * | Non-Income Producing |
| (a) | At June 30, 2007 the aggregate cost of securities for federal tax purposes (in thousands) was $450,388 and the net unrealized appreciation of investments based on that cost was $139,585 which is comprised of $162,777 aggregate gross unrealized appreciation and $23,192 aggregate gross unrealized depreciation. |
| (b) | All or a portion of the securities have been committed as collateral for open futures positions or when-issued securities. Information regarding open futures contracts as of period end is summarized below. |
| Issuer (000’s) | Number of Contracts |
Expiration Date |
Unrealized Appreciation/ (Depreciation) (000’s) |
|||||
| Midcap 400 Index |
81 | 9/07 | $ | (202 | ) | |||
| (Total Notional Value at June 30, 2007, $36,620 ) |
||||||||
The Accompanying Notes are an Integral Part of the Financial Statements.
Index 400 Stock Portfolio
27
Table of Contents
AllianceBernstein Mid Cap Value Portfolio
Sector Allocation 6/30/07
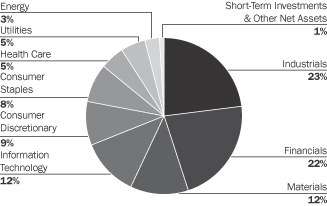
Sector Allocation is based on Net Assets.
Sector Allocation is subject to change.
Expense Example
As a shareholder of the Portfolio, you incur two types of costs: (1) transaction costs and (2) ongoing costs, including management fees and other Portfolio expenses. This Example is intended to help you understand your ongoing costs (in dollars) of investing in the Portfolio and to compare these costs with the ongoing costs of investing in other mutual funds.
The Example is based on an investment of $1,000 invested at the beginning of the period and held for the entire period (January 1, 2007 to June 30, 2007).
Actual Expenses
The first line of the table below provides information about actual account values and actual expenses. You may use the information in this line, together with the amount you invested, to estimate the expenses that you paid over the period. Simply divide your account value by $1,000 (for example, an $8,600 account value divided by $1,000 = 8.6), then multiply the result by the number in the first line under the heading entitled “Expenses Paid During Period” to estimate the expenses you paid on your account during this period.
Hypothetical Example for Comparison Purposes
The second line of the table below provides information about hypothetical account values and hypothetical expenses based on the Portfolio’s actual expense ratio and an assumed rate of return of 5% per year before expenses, which is not the Portfolio’s actual return. The hypothetical account values and expenses may not be used to estimate the actual ending account balance or expenses you paid for the period. You may use this information to compare the ongoing costs of investing in the Portfolio and other funds. To do so, compare this 5% hypothetical example with the 5% hypothetical examples that appear in the shareholder reports of the other funds.
Please note that the expenses shown in the table are meant to highlight your ongoing costs only and do not reflect any transactional costs or separate account charges. Therefore, the second line of the table is useful in comparing ongoing costs only, and will not help you determine the relative total costs of owning different funds. In addition, if these transactional costs or separate account charges were included, your costs would have been higher.
| Beginning Account Value January 1, 2007 |
Ending Account Value June 30, 2007 |
Expenses 2007* | |||||||
| Actual |
$ | 1,000.00 | $ | 1,132.90 | $ | 4.60 | |||
| Hypothetical (5% return before expenses) |
$ | 1,000.00 | $ | 1,020.48 | $ | 4.36 | |||
| * | Expenses are equal to the Portfolio’s annualized expense ratio of 0.87%, multiplied by the average account value over the period, multiplied by 181/365 (to reflect the one-half year period). |
28
AllianceBernstein Mid Cap Value Portfolio
Table of Contents
AllianceBernstein Mid Cap Value Portfolio
Northwestern Mutual Series Fund, Inc.
Schedule of Investments
June 30, 2007 (unaudited)
| Common Stocks (98.7%) | Shares/ $ Par |
Value $ (000’s) | ||
| Consumer Discretionary (8.7%) |
||||
| ArvinMeritor, Inc. |
115,000 | 2,554 | ||
| Autoliv, Inc. |
12,500 | 711 | ||
| *AutoNation, Inc. |
33,703 | 756 | ||
| Dillard’s, Inc. — Class A |
23,000 | 826 | ||
| Furniture Brands International, Inc. |
60,100 | 853 | ||
| *Jack in the Box, Inc. |
15,800 | 1,121 | ||
| KB HOME |
10,000 | 394 | ||
| *Office Depot, Inc. |
21,400 | 648 | ||
| *Papa John’s International, Inc. |
46,300 | 1,332 | ||
| *TRW Automotive Holdings Corp. |
66,300 | 2,442 | ||
| *Vail Resorts, Inc. |
14,000 | 852 | ||
| VF Corp. |
13,900 | 1,273 | ||
| Total |
13,762 | |||
| Consumer Staples (8.2%) |
||||
| Corn Products International, Inc. |
52,500 | 2,386 | ||
| Molson Coors Brewing Co. — Class B |
25,300 | 2,339 | ||
| *Performance Food Group Co. |
69,700 | 2,265 | ||
| Ruddick Corp. |
65,300 | 1,967 | ||
| SUPERVALU, Inc. |
39,900 | 1,848 | ||
| Universal Corp. |
36,600 | 2,230 | ||
| Total |
13,035 | |||
| Energy (3.0%) |
||||
| *Hanover Compressor Co. |
76,800 | 1,832 | ||
| Hess Corp. |
13,800 | 814 | ||
| *Oil States International, Inc. |
19,000 | 785 | ||
| Rowan Companies, Inc. |
16,700 | 684 | ||
| *Todco |
12,200 | 576 | ||
| Total |
4,691 | |||
| Financials (22.1%) |
||||
| A.G. Edwards, Inc. |
22,500 | 1,902 | ||
| *Arch Capital Group, Ltd. |
37,800 | 2,742 | ||
| Ashford Hospitality Trust, Inc. |
67,500 | 794 | ||
| Aspen Insurance Holdings, Ltd. |
65,300 | 1,833 | ||
| Astoria Financial Corp. |
54,250 | 1,358 | ||
| Central Pacific Financial Corp. |
42,400 | 1,400 | ||
| Digital Realty Trust, Inc. |
19,300 | 727 | ||
| FelCor Lodging Trust, Inc. |
69,800 | 1,817 | ||
| Fidelity National Financial, Inc. |
70,500 | 1,671 | ||
| Highland Hospitality Corp. |
44,000 | 845 | ||
| Mid-America Apartment Communities, Inc. |
18,700 | 981 | ||
| Old Republic International Corp. |
101,500 | 2,158 | ||
| Common Stocks (98.7%) | Shares/ $ Par |
Value $ (000’s) | ||
| Financials continued |
||||
| Platinum Underwriters Holdings, Ltd. |
71,500 | 2,485 | ||
| Provident Financial Services, Inc. |
85,000 | 1,340 | ||
| Radian Group, Inc. |
27,800 | 1,501 | ||
| RenaissanceRe Holdings, Ltd. |
10,100 | 626 | ||
| The South Financial Group, Inc. |
58,500 | 1,324 | ||
| Sovereign Bancorp, Inc. |
13,800 | 292 | ||
| StanCorp Financial Group, Inc. |
38,000 | 1,994 | ||
| Strategic Hotels & Resorts, Inc. |
26,500 | 596 | ||
| Susquehanna Bancshares, Inc. |
76,700 | 1,716 | ||
| Trustmark Corp. |
48,400 | 1,252 | ||
| UnionBanCal Corp. |
17,000 | 1,015 | ||
| Webster Financial Corp. |
36,700 | 1,566 | ||
| Whitney Holding Corp. |
39,850 | 1,199 | ||
| Total |
35,134 | |||
| Health Care (5.2%) |
||||
| *Endo Pharmaceuticals Holdings, Inc. |
18,561 | 635 | ||
| *Genesis HealthCare Corp. |
23,000 | 1,574 | ||
| *Kindred Healthcare, Inc. |
45,000 | 1,382 | ||
| *King Pharmaceuticals, Inc. |
32,600 | 667 | ||
| *Molina Healthcare, Inc. |
35,838 | 1,094 | ||
| PerkinElmer, Inc. |
80,600 | 2,101 | ||
| Universal Health Services, Inc. — Class B |
12,300 | 756 | ||
| Total |
8,209 | |||
| Industrials (23.2%) |
||||
| Acuity Brands, Inc. |
26,600 | 1,603 | ||
| *AGCO Corp. |
19,000 | 825 | ||
| *Alaska Air Group, Inc. |
38,100 | 1,061 | ||
| Arkansas Best Corp. |
41,000 | 1,598 | ||
| *Avis Budget Group, Inc. |
69,000 | 1,962 | ||
| Briggs & Stratton Corp. |
56,200 | 1,774 | ||
| *Continental Airlines, Inc. — Class B |
34,600 | 1,172 | ||
| Con-way, Inc. |
39,200 | 1,969 | ||
| Cooper Industries, Ltd. — Class A |
24,000 | 1,370 | ||
| GATX Corp. |
44,900 | 2,211 | ||
| Goodrich Corp. |
24,900 | 1,483 | ||
| Kelly Services, Inc. — Class A |
28,000 | 769 | ||
| Kennametal, Inc. |
33,100 | 2,715 | ||
| Laidlaw International, Inc. |
22,700 | 784 | ||
| Mueller Industries, Inc. |
44,400 | 1,529 | ||
| *Quebecor World, Inc. |
64,000 | 778 | ||
| Regal-Beloit Corp. |
44,000 | 2,048 | ||
| Ryder System, Inc. |
35,800 | 1,926 | ||
| SkyWest, Inc. |
30,000 | 715 | ||
| SPX Corp. |
30,400 | 2,669 | ||
| *Terex Corp. |
24,500 | 1,992 | ||
| Common Stocks (98.7%) | Shares/ $ Par |
Value $ (000’s) | ||
| Industrials continued |
||||
| *United Stationers, Inc. |
30,500 | 2,033 | ||
| Werner Enterprises, Inc. |
85,000 | 1,713 | ||
| Total |
36,699 | |||
| Information Technology (11.3%) |
||||
| *Amkor Technology, Inc. |
50,000 | 788 | ||
| *Andrew Corp. |
135,100 | 1,951 | ||
| *Arrow Electronics, Inc. |
39,400 | 1,514 | ||
| AVX Corp. |
20,100 | 337 | ||
| *Celestica, Inc. |
53,500 | 334 | ||
| *Checkpoint Systems, Inc. |
36,900 | 932 | ||
| *CommScope, Inc. |
34,900 | 2,036 | ||
| *Covansys Corp. |
30,500 | 1,035 | ||
| IKON Office Solutions, Inc. |
149,500 | 2,334 | ||
| *Sanmina-SCI Corp. |
124,900 | 391 | ||
| Siliconware Precision Industries Co., ADR |
56,200 | 618 | ||
| *Spansion, Inc. — Class A |
64,000 | 710 | ||
| *Tech Data Corp. |
13,500 | 519 | ||
| *Teradyne, Inc. |
50,000 | 879 | ||
| *Vishay Intertechnology, Inc. |
126,000 | 1,993 | ||
| *Zoran Corp. |
81,600 | 1,635 | ||
| Total |
18,006 | |||
| Materials (11.7%) |
||||
| Ashland, Inc. |
29,600 | 1,893 | ||
| Celanese Corp. |
64,900 | 2,517 | ||
| Chaparral Steel Co. |
6,800 | 489 | ||
| Commercial Metals Co. |
28,300 | 956 | ||
| Cytec Industries, Inc. |
34,600 | 2,206 | ||
| The Lubrizol Corp. |
41,500 | 2,678 | ||
| Metal Management, Inc. |
36,500 | 1,609 | ||
| *Rockwood Holdings, Inc. |
65,500 | 2,394 | ||
| Silgan Holdings, Inc. |
35,600 | 1,968 | ||
| Steel Dynamics, Inc. |
45,000 | 1,886 | ||
| Total |
18,596 | |||
| Utilities (5.3%) |
||||
| *Allegheny Energy, Inc. |
15,200 | 786 | ||
| Northeast Utilities |
71,200 | 2,019 | ||
| Puget Energy, Inc. |
68,700 | 1,661 | ||
| *Reliant Energy, Inc. |
91,500 | 2,467 | ||
| Wisconsin Energy Corp. |
34,000 | 1,504 | ||
| Total |
8,437 | |||
| Total Common Stocks |
156,569 | |||
The Accompanying Notes are an Integral Part of the Financial Statements.
AllianceBernstein Mid Cap Value Portfolio
29
Table of Contents
AllianceBernstein Mid Cap Value Portfolio
| Money Market Investments (1.1%) |
Shares/ $ Par |
Value $ (000’s) | ||
| Federal Government & Agencies (1.1%) | ||||
| Federal Home Loan Bank, 5.15%, 7/18/07 |
1,800,000 | 1,795 | ||
| Total Money Market Investments (Cost: $1,795) |
1,795 | |||
| Total Investments (99.8%) (Cost $131,114)(a) |
158,364 | |||
| Other Assets, Less Liabilities (0.2%) |
340 | |||
| Net Assets (100.0%) |
158,704 | |||
| * | Non-Income Producing |
ADR after the name of a security represents — American Depositary Receipt.
| (a) | At June 30, 2007 the aggregate cost of securities for federal tax purposes (in thousands) was $131,114 and the net unrealized appreciation of investments based on that cost was $27,250 which is comprised of $31,086 aggregate gross unrealized appreciation and $3,836 aggregate gross unrealized depreciation. |
The Accompanying Notes are an Integral Part of the Financial Statements.
30
AllianceBernstein Mid Cap Value Portfolio
Table of Contents
Small Cap Growth Stock Portfolio
Sector Allocation 6/30/07
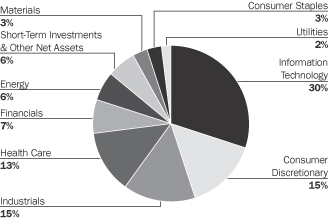
Sector Allocation is based on Net Assets.
Sector Allocation is subject to change.
Stocks of smaller or newer companies, such as those held in this Portfolio, are more likely to realize more substantial growth as well as suffer more significant losses than larger or more established issuers. Investments in such companies can be both more volatile and more speculative. Investing in small company stocks involves a greater degree of risk than investing in medium or large company stocks.
Expense Example
As a shareholder of the Portfolio, you incur two types of costs: (1) transaction costs and (2) ongoing costs, including management fees and other Portfolio expenses. This Example is intended to help you understand your ongoing costs (in dollars) of investing in the Portfolio and to compare these costs with the ongoing costs of investing in other mutual funds.
The Example is based on an investment of $1,000 invested at the beginning of the period and held for the entire period (January 1, 2007 to June 30, 2007).
Actual Expenses
The first line of the table below provides information about actual account values and actual expenses. You may use the information in this line, together with the amount you invested, to estimate the expenses that you paid over the period. Simply divide your account value by $1,000 (for example, an $8,600 account value divided by $1,000 = 8.6), then multiply the result by the number in the first line under the heading entitled “Expenses Paid During Period” to estimate the expenses you paid on your account during this period.
Hypothetical Example for Comparison Purposes
The second line of the table below provides information about hypothetical account values and hypothetical expenses based on the Portfolio’s actual expense ratio and an assumed rate of return of 5% per year before expenses, which is not the Portfolio’s actual return. The hypothetical account values and expenses may not be used to estimate the actual ending account balance or expenses you paid for the period. You may use this information to compare the ongoing costs of investing in the Portfolio and other funds. To do so, compare this 5% hypothetical example with the 5% hypothetical examples that appear in the shareholder reports of the other funds.
Please note that the expenses shown in the table are meant to highlight your ongoing costs only and do not reflect any transactional costs or separate account charges. Therefore, the second line of the table is useful in comparing ongoing costs only, and will not help you determine the relative total costs of owning different funds. In addition, if these transactional costs or separate account charges were included, your costs would have been higher.
| Beginning Account Value January 1, 2007 |
Ending Account Value June 30, 2007 |
Expenses Paid During Period January 1, 2007 to June 30, 2007* | |||||||
| Actual |
$ | 1,000.00 | $ | 1,096.90 | $ | 2.86 | |||
| Hypothetical (5% return before expenses) |
$ | 1,000.00 | $ | 1,022.07 | $ | 2.76 | |||
| * | Expenses are equal to the Portfolio’s annualized expense ratio of 0.55%, multiplied by the average account value over the period, multiplied by 181/365 (to reflect the one-half year period). |
Small Cap Growth Stock Portfolio
31
Table of Contents
Small Cap Growth Stock Portfolio
Northwestern Mutual Series Fund, Inc.
Schedule of Investments
June 30, 2007 (unaudited)
| Common Stocks (94.6%) | Shares/ $ Par |
Value $ (000’s) | ||
| Consumer Discretionary (15.4%) | ||||
| *California Pizza Kitchen, Inc. |
113,900 | 2,447 | ||
| *Capella Education Co. |
129,600 | 5,965 | ||
| *Citi Trends, Inc. |
82,300 | 3,124 | ||
| *Force Protection, Inc. |
127,400 | 2,630 | ||
| *GSI Commerce, Inc. |
116,744 | 2,651 | ||
| *Hibbett Sports, Inc. |
143,900 | 3,940 | ||
| *J. Crew Group, Inc. |
66,200 | 3,581 | ||
| *Life Time Fitness, Inc. |
133,400 | 7,101 | ||
| *LKQ Corp. |
233,200 | 5,751 | ||
| *Morton’s Restaurant Group, Inc. |
321,300 | 5,819 | ||
| *National CineMedia, Inc. |
181,000 | 5,070 | ||
| Orient-Express Hotels, Ltd. — Class A |
109,137 | 5,828 | ||
| *Pinnacle Entertainment, Inc. |
174,100 | 4,901 | ||
| Sotheby’s |
43,900 | 2,020 | ||
| *The9 Ltd., ADR |
95,700 | 4,427 | ||
| *Tween Brands, Inc. |
70,900 | 3,162 | ||
| *Volcom, Inc. |
180,500 | 9,047 | ||
| *Zumiez, Inc. |
215,000 | 8,123 | ||
| Total |
85,587 | |||
| Consumer Staples (2.9%) |
||||
| *Central European Distribution Corp. |
196,300 | 6,796 | ||
| *TreeHouse Foods, Inc. |
87,321 | 2,324 | ||
| UAP Holding Corp. |
234,900 | 7,079 | ||
| Total |
16,199 | |||
| Energy (5.8%) |
||||
| *Dril-Quip, Inc. |
157,600 | 7,084 | ||
| *Global Industries, Ltd. |
334,300 | 8,967 | ||
| *Oceaneering International, Inc. |
139,500 | 7,343 | ||
| *T-3 Energy Services, Inc. |
119,712 | 4,004 | ||
| World Fuel Services Corp. |
108,800 | 4,576 | ||
| Total |
31,974 | |||
| Financials (7.1%) |
||||
| *FCStone Group, Inc. |
67,400 | 3,863 | ||
| *Global Cash Access Holdings, Inc. |
450,700 | 7,220 | ||
| Greater Bay Bancorp |
162,200 | 4,516 | ||
| Greenhill & Co., Inc. |
97,100 | 6,672 | ||
| *Interactive Brokers Group, Inc. — Class A |
69,000 | 1,872 | ||
| *KBW, Inc. |
129,793 | 3,813 | ||
| optionsXpress Holdings, Inc. |
199,200 | 5,111 | ||
| Portfolio Recovery Associates, Inc. |
90,300 | 5,420 | ||
| PrivateBancorp, Inc. |
27,800 | 801 | ||
| Total |
39,288 | |||
| Health Care (13.2%) |
||||
| *Adams Respiratory Therapeutics, Inc. |
87,992 | 3,466 | ||
| Common Stocks (94.6%) | Shares/ $ Par |
Value $ (000’s) | ||
| Health Care continued |
||||
| *Allscripts Healthcare Solutions, Inc. |
160,700 | 4,095 | ||
| *Digene Corp. |
144,300 | 8,665 | ||
| *Hologic, Inc. |
38,400 | 2,124 | ||
| *Kyphon, Inc. |
131,200 | 6,317 | ||
| Meridian Bioscience, Inc. |
145,850 | 3,159 | ||
| *Natus Medical, Inc. |
342,200 | 5,448 | ||
| *Noven Pharmaceuticals, Inc. |
233,000 | 5,464 | ||
| *Obagi Medical Products, Inc. |
151,345 | 2,682 | ||
| *Pediatrix Medical Group, Inc. |
99,200 | 5,471 | ||
| *Providence Service Corp. |
349,585 | 9,341 | ||
| *Psychiatric Solutions, Inc. |
359,500 | 13,035 | ||
| *Thoratec Corp. |
203,000 | 3,733 | ||
| Total |
73,000 | |||
| Industrials (14.8%) |
||||
| *The Advisory Board Co. |
172,484 | 9,583 | ||
| *American Commercial Lines, Inc. |
76,600 | 1,995 | ||
| Bucyrus International, Inc. — Class A |
142,770 | 10,105 | ||
| C.H. Robinson Worldwide, Inc. |
69,872 | 3,670 | ||
| *Corrections Corp. of America |
203,575 | 12,847 | ||
| *Houston Wire & Cable Co. |
191,300 | 5,435 | ||
| *Huron Consulting Group, Inc. |
80,900 | 5,907 | ||
| Interface, Inc. — Class A |
318,600 | 6,009 | ||
| Knight Transportation, Inc. |
317,167 | 6,147 | ||
| Knoll, Inc. |
348,500 | 7,806 | ||
| *Marlin Business Services Corp. |
409,820 | 8,733 | ||
| *VistaPrint, Ltd. |
103,700 | 3,967 | ||
| Total |
82,204 | |||
| Information Technology (30.1%) |
||||
| *Aruba Networks, Inc. |
129,900 | 2,611 | ||
| *Bankrate, Inc. |
77,768 | 3,727 | ||
| *Blackboard, Inc. |
356,600 | 15,019 | ||
| *comScore, Inc. |
3,088 | 71 | ||
| *Comtech Group, Inc. |
218,700 | 3,611 | ||
| *Cymer, Inc. |
61,300 | 2,464 | ||
| *Data Domain, Inc. |
17,900 | 412 | ||
| *DealerTrack Holdings, Inc. |
323,600 | 11,921 | ||
| *Diodes, Inc. |
182,396 | 7,619 | ||
| *Forrester Research, Inc. |
131,900 | 3,710 | ||
| *IHS, Inc. — Class A |
57,700 | 2,654 | ||
| *Kenexa Corp. |
370,589 | 13,974 | ||
| *Limelight Networks, Inc. |
238,298 | 4,714 | ||
| *LoopNet, Inc. |
109,000 | 2,543 | ||
| *Macrovision Corp. |
164,500 | 4,945 | ||
| *Mellanox Technologies, Ltd. |
64,100 | 1,328 | ||
| *MKS Instruments, Inc. |
95,450 | 2,644 | ||
| *Netlogic Microsystems, Inc. |
350,060 | 11,146 | ||
| *Polycom, Inc. |
62,800 | 2,110 | ||
| Common Stocks (94.6%) | Shares/ $ Par |
Value $ (000’s) | ||
| Information Technology continued |
||||
| *Riverbed Technology, Inc. |
71,900 | 3,151 | ||
| *Silicon Image, Inc. |
313,000 | 2,686 | ||
| *SIRF Technology Holdings, Inc. |
186,100 | 3,860 | ||
| *Sohu.com, Inc. |
278,500 | 8,909 | ||
| *SonicWALL, Inc. |
370,400 | 3,182 | ||
| *Spreadtrum Communications, Inc. |
17,900 | 260 | ||
| *Switch & Data, Inc. |
409,500 | 7,858 | ||
| *Synaptics, Inc. |
96,200 | 3,443 | ||
| *Synchronoss Technologies, Inc. |
150,900 | 4,427 | ||
| Syntel, Inc. |
41,300 | 1,255 | ||
| *Tessera Technologies, Inc. |
287,500 | 11,658 | ||
| *THQ, Inc. |
305,950 | 9,338 | ||
| *The Ultimate Software Group, Inc. |
210,667 | 6,095 | ||
| *ValueClick, Inc. |
119,200 | 3,512 | ||
| Total |
166,857 | |||
| Materials (3.2%) |
||||
| A.M. Castle & Co. |
41,808 | 1,501 | ||
| Airgas, Inc. |
183,750 | 8,802 | ||
| Silgan Holdings, Inc. |
138,000 | 7,629 | ||
| Total |
17,932 | |||
| Telecommunication Services (0.4%) |
||||
| *Glu Mobile, Inc. |
169,484 | 2,356 | ||
| Total |
2,356 | |||
| Utilities (1.7%) |
||||
| ITC Holdings Corp. |
227,300 | 9,235 | ||
| Total |
9,235 | |||
| Total Common Stocks |
524,632 | |||
| Money Market Investments (6.7%) | ||||
| Federal Government & Agencies (0.4%) | ||||
| Fannie Mae, |
2,500,000 | 2,472 | ||
| Total |
2,472 | |||
| Finance Lessors (1.8%) | ||||
| Windmill Funding Corp., 5.28%, 7/18/07 |
10,000,000 | 9,974 | ||
| Total |
9,974 | |||
| Finance Services (2.4%) | ||||
| Alpine securitization, 5.25%, 7/12/07 |
3,000,000 | 2,995 | ||
The Accompanying Notes are an Integral Part of the Financial Statements.
32
Small Cap Growth Stock Portfolio
Table of Contents
Small Cap Growth Stock Portfolio
| Money Market Investments (6.7%) |
Shares/ $ Par |
Value $ (000’s) |
|||
| Finance Services continued |
| ||||
| (b)Barton Capital LLC, 5.27%, 7/2/07 |
10,000,000 | 9,997 | |||
| Total |
12,992 | ||||
| National Commercial Banks (0.3%) |
| ||||
| UBS Finance LLC, 5.35%, 7/2/07 |
1,700,000 | 1,699 | |||
| Total |
1,699 | ||||
| Short Term Business Credit (1.8%) |
| ||||
| (b)Sheffield Receivables, 5.28%, 7/9/07 |
10,000,000 | 9,987 | |||
| Total |
9,987 | ||||
| Total Money Market Investments (Cost: $37,123) |
37,124 | ||||
| Total Investments (101.3%) |
561,756 | ||||
| Other Assets, Less |
(6,992 | ) | |||
| Net Assets (100.0%) |
554,764 | ||||
| * | Non-Income Producing |
ADR after the name of a security represents — American Depositary Receipt.
| (a) | At June 30, 2007 the aggregate cost of securities for federal tax purposes (in thousands) was $492,690 and the net unrealized appreciation of investments based on that cost was $69,066 which is comprised of $74,664 aggregate gross unrealized appreciation and $5,598 aggregate gross unrealized depreciation. |
| (b) | All or a portion of the securities have been committed as collateral for open futures positions or when-issued securities. Information regarding open futures contracts as of period end is summarized below. |
| Issuer (000’s) | Number of Contracts |
Expiration Date |
Unrealized Appreciation/ (Depreciation) (000’s) | ||||
| Russell 2000 Index |
41 | 9/07 | $ | 3 | |||
| (Total Notional Value at June 30, 2007, $17,260) |
|||||||
The Accompanying Notes are an Integral Part of the Financial Statements.
Small Cap Growth Stock Portfolio
33
Table of Contents
T. Rowe Price Small Cap Value Portfolio
Sector Allocation 6/30/07
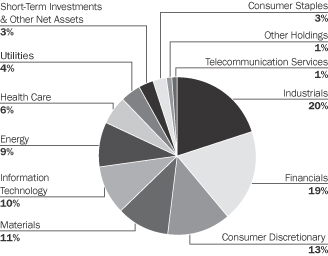
Sector Allocation is based on Net Assets.
Sector Allocation is subject to change.
Stocks of smaller or newer companies, such as those held in this Portfolio, are more likely to realize more substantial growth as well as suffer more significant losses than larger or more established issuers. Investments in such companies can be both more volatile and more speculative. Investing in small company stocks involves a greater degree of risk than investing in medium or large company stocks.
Expense Example
As a shareholder of the Portfolio, you incur two types of costs: (1) transaction costs and (2) ongoing costs, including management fees and other Portfolio expenses. This Example is intended to help you understand your ongoing costs (in dollars) of investing in the Portfolio and to compare these costs with the ongoing costs of investing in other mutual funds.
The Example is based on an investment of $1,000 invested at the beginning of the period and held for the entire period (January 1, 2007 to June 30, 2007).
Actual Expenses
The first line of the table below provides information about actual account values and actual expenses. You may use the information in this line, together with the amount you invested, to estimate the expenses that you paid over the period. Simply divide your account value by $1,000 (for example, an $8,600 account value divided by $1,000 = 8.6), then multiply the result by the number in the first line under the heading entitled “Expenses Paid During Period” to estimate the expenses you paid on your account during this period.
Hypothetical Example for Comparison Purposes
The second line of the table below provides information about hypothetical account values and hypothetical expenses based on the Portfolio’s actual expense ratio and an assumed rate of return of 5% per year before expenses, which is not the Portfolio’s actual return. The hypothetical account values and expenses may not be used to estimate the actual ending account balance or expenses you paid for the period. You may use this information to compare the ongoing costs of investing in the Portfolio and other funds. To do so, compare this 5% hypothetical example with the 5% hypothetical examples that appear in the shareholder reports of the other funds.
Please note that the expenses shown in the table are meant to highlight your ongoing costs only and do not reflect any transactional costs or separate account charges. Therefore, the second line of the table is useful in comparing ongoing costs only, and will not help you determine the relative total costs of owning different funds. In addition, if these transactional costs or separate account charges were included, your costs would have been higher.
| Beginning Account Value January 1, 2007 |
Ending Account Value June 30, 2007 |
Expenses Paid During Period January 1, 2007 to June 30, 2007* | |||||||
| Actual |
$ | 1,000.00 | $ | 1,077.80 | $ | 4.43 | |||
| Hypothetical (5% return before expenses) |
$ | 1,000.00 | $ | 1,020.53 | $ | 4.31 | |||
| * | Expenses are equal to the Portfolio’s annualized expense ratio of 0.86%, multiplied by the average account value over the period, multiplied by 181/365 (to reflect the one-half year period). |
34
T. Rowe Price Small Cap Value Portfolio
Table of Contents
T. Rowe Price Small Cap Value Portfolio
Northwestern Mutual Series Fund, Inc.
Schedule of Investments
June 30, 2007 (unaudited)
| Common Stocks (95.5%) | Shares/ $ Par |
Value $ (000’s) | ||
| Consumer Discretionary (13.3%) |
||||
| Aaron Rents, Inc. |
169,600 | 4,951 | ||
| Aaron Rents, Inc. — Class A |
4,725 | 123 | ||
| *Amazon.com, Inc. |
7,900 | 540 | ||
| *Apollo Group, Inc. |
14,800 | 865 | ||
| Brunswick Corp. |
29,700 | 969 | ||
| Building Materials Holding Corp. |
80,200 | 1,138 | ||
| *Career Education Corp. |
11,600 | 392 | ||
| *Cox Radio, Inc., — Class A |
19,300 | 275 | ||
| CSS Industries, Inc. |
49,200 | 1,949 | ||
| *Culp, Inc. |
46,400 | 418 | ||
| *Discovery Holding Co. |
32,700 | 752 | ||
| Dollar General Corp. |
17,200 | 377 | ||
| Dow Jones & Co., Inc. |
13,500 | 776 | ||
| *Drew Industries, Inc. |
26,300 | 872 | ||
| The E.W. Scripps Co. |
25,400 | 1,161 | ||
| Eastman Kodak Co. |
16,900 | 470 | ||
| *Echostar Communications Corp. |
7,800 | 338 | ||
| Family Dollar Stores, Inc. |
18,900 | 649 | ||
| Fred’s, Inc. |
73,500 | 983 | ||
| The Gap, Inc. |
44,900 | 858 | ||
| *Gemstar-TV Guide International, Inc. |
68,100 | 335 | ||
| H&R Block, Inc. |
33,200 | 776 | ||
| Haverty Furniture Companies, Inc. |
113,500 | 1,325 | ||
| Journal Register Co. |
81,000 | 363 | ||
| *Lamar Advertising Co. |
2,200 | 138 | ||
| *Liberty Media Holding Corp. |
2,106 | 248 | ||
| *Live Nation, Inc. |
31,000 | 694 | ||
| Liz Claiborne, Inc. |
4,500 | 168 | ||
| M/I Homes, Inc. |
54,400 | 1,447 | ||
| Mattel, Inc. |
17,500 | 443 | ||
| Matthews International Corp. — Class A |
89,200 | 3,890 | ||
| The McClatchy Co. |
7,200 | 182 | ||
| Meredith Corp. |
1,600 | 99 | ||
| The New York Times Co. |
18,000 | 457 | ||
| Newell Rubbermaid, Inc. |
7,900 | 232 | ||
| Pearson PLC, ADR |
9,900 | 167 | ||
| Pool Corp. |
77,225 | 3,014 | ||
| *RARE Hospitality International, Inc. |
99,450 | 2,662 | ||
| Ruby Tuesday, Inc. |
48,200 | 1,269 | ||
| *Saga Communications, Inc. — Class A |
94,400 | 925 | ||
| *Scholastic Corp. |
20,600 | 740 | ||
| Skyline Corp. |
34,500 | 1,035 | ||
| Stanley Furniture Co., Inc. |
68,600 | 1,409 | ||
| Stein Mart, Inc. |
161,600 | 1,981 | ||
| The TJX Companies, Inc. |
8,100 | 223 | ||
| Common Stocks (95.5%) | Shares/ $ Par |
Value $ (000’s) | ||
| Consumer Discretionary continued |
||||
| Tribune Co. |
15,821 | 465 | ||
| *TRW Automotive Holdings Corp. |
14,100 | 519 | ||
| Weight Watchers International, Inc. |
12,985 | 660 | ||
| *Winn-Dixie Stores, Inc. |
47,300 | 1,386 | ||
| Winnebago Industries, Inc. |
76,000 | 2,244 | ||
| *XM Satellite Radio Holdings, Inc. |
65,000 | 765 | ||
| Total |
49,117 | |||
| Consumer Staples (2.9%) |
||||
| Alberto-Culver Co. |
5,300 | 126 | ||
| *Alliance One International, Inc. |
105,100 | 1,056 | ||
| Brown-Forman Corp. |
7,000 | 512 | ||
| Casey’s General Stores, Inc. |
70,100 | 1,911 | ||
| The Clorox Co. |
14,000 | 869 | ||
| Coca-Cola Enterprises, Inc. |
48,500 | 1,164 | ||
| ConAgra Foods, Inc. |
37,800 | 1,015 | ||
| McCormick & Co., Inc. |
7,000 | 267 | ||
| Nash Finch Co. |
42,000 | 2,079 | ||
| Sara Lee Corp. |
56,600 | 985 | ||
| Tootsie Roll Industries, Inc. |
6,800 | 188 | ||
| *Wild Oats Markets, Inc. |
37,500 | 629 | ||
| Total |
10,801 | |||
| Energy (8.6%) |
||||
| *Atwood Oceanics, Inc. |
32,000 | 2,196 | ||
| BJ Services Co. |
24,700 | 702 | ||
| CARBO Ceramics, Inc. |
31,800 | 1,393 | ||
| *Compton Petroleum Corp. |
17,300 | 172 | ||
| *Forest Oil Corp. |
78,550 | 3,320 | ||
| *Geomet, Inc. |
54,000 | 414 | ||
| *Hanover Compressor Co. |
41,100 | 980 | ||
| Hess Corp. |
11,800 | 696 | ||
| *Mariner Energy, Inc. |
58,793 | 1,426 | ||
| Murphy Oil Corp. |
22,700 | 1,349 | ||
| Penn Virginia Corp. |
123,600 | 4,969 | ||
| Pogo Producing Co. |
15,100 | 767 | ||
| Spectra Energy Corp. |
12,600 | 327 | ||
| *TETRA Technologies, Inc. |
158,900 | 4,481 | ||
| *Todco |
65,600 | 3,097 | ||
| *Union Drilling, Inc. |
28,500 | 468 | ||
| *W-H Energy Services, Inc. |
40,500 | 2,507 | ||
| *Whiting Petroleum Corp. |
60,300 | 2,443 | ||
| Total |
31,707 | |||
| Financials (18.6%) |
||||
| Ares Capital Corp. |
84,000 | 1,415 | ||
| Axis Capital Holdings, Ltd. |
15,100 | 614 | ||
| Boston Private Financial Holdings, Inc. |
49,700 | 1,335 | ||
| Cincinnati Financial Corp. |
9,000 | 391 | ||
| Citizens Republic Bancorp, Inc. |
9,000 | 165 | ||
| Common Stocks (95.5%) | Shares/ $ Par |
Value $ (000’s) | ||
| Financials continued |
||||
| Commerce Bancshares, Inc. |
13,634 | 618 | ||
| Compass Diversified Trust |
67,700 | 1,207 | ||
| Cullen/Frost Bankers, Inc. |
5,900 | 315 | ||
| *Discover Financial Services — W/I |
9,300 | 265 | ||
| East West Bancorp, Inc. |
99,700 | 3,876 | ||
| Employers Holdings, Inc. |
13,000 | 276 | ||
| First Financial Fund, Inc. |
122,500 | 1,686 | ||
| First Horizon National Corp. |
33,600 | 1,310 | ||
| First Niagara Financial Group, Inc. |
29,600 | 388 | ||
| First Potomac Realty Trust |
79,000 | 1,840 | ||
| First Republic Bank |
91,700 | 4,920 | ||
| Genworth Financial, Inc. |
6,200 | 213 | ||
| Hercules Technology Growth Capital, Inc. |
100,600 | 1,359 | ||
| Home Bancshares, Inc. |
37,900 | 855 | ||
| IndyMac Bancorp, Inc. |
28,300 | 826 | ||
| Innkeepers USA Trust |
8,500 | 151 | ||
| Investors Financial Services Corp. |
10,300 | 635 | ||
| James River Group, Inc. |
2,400 | 80 | ||
| Janus Capital Group, Inc. |
29,200 | 813 | ||
| JMP Group, Inc. |
32,500 | 340 | ||
| Kilroy Realty Corp. |
64,400 | 4,561 | ||
| Kohlberg Capital Corp. |
109,000 | 2,022 | ||
| Lasalle Hotel Properties |
64,900 | 2,818 | ||
| Lincoln National Corp. |
6,363 | 451 | ||
| *Markel Corp. |
4,500 | 2,181 | ||
| Marsh & McLennan Companies, Inc. |
56,300 | 1,739 | ||
| Max Capital Group, Ltd. |
81,000 | 2,292 | ||
| The Midland Co. |
50,800 | 2,385 | ||
| National Interstate Corp. |
5,500 | 143 | ||
| NewAlliance Bancshares, Inc. |
8,800 | 130 | ||
| Northern Trust Corp. |
11,500 | 739 | ||
| Ohio Casualty Corp. |
10,800 | 468 | ||
| OneBeacon Insurance Group, Ltd. |
6,500 | 165 | ||
| Parkway Properties, Inc. |
27,300 | 1,311 | ||
| Potlatch Corp. |
58,600 | 2,523 | ||
| *ProAssurance Corp. |
86,000 | 4,787 | ||
| Regions Financial Corp. |
10,500 | 348 | ||
| SLM Corp. |
7,300 | 420 | ||
| The St. Joe Co. |
15,900 | 737 | ||
| Strategic Hotels & Resorts, Inc. |
102,800 | 2,312 | ||
| *SVB Financial Group |
78,000 | 4,143 | ||
| Synovus Financial Corp. |
12,800 | 393 | ||
| The Travelers Companies, Inc. |
9,330 | 499 | ||
| Unum Group |
7,900 | 206 | ||
| Valley National Bancorp |
5,569 | 125 | ||
| Waddell & Reed Financial, Inc. — Class A |
2,800 | 73 | ||
The Accompanying Notes are an Integral Part of the Financial Statements.
T. Rowe Price Small Cap Value Portfolio
35
Table of Contents
T. Rowe Price Small Cap Value Portfolio
| Common Stocks (95.5%) | Shares/ $ Par |
Value $ (000’s) | ||
| Financials continued |
||||
| Washington Real Estate Investment Trust |
57,000 | 1,938 | ||
| Westamerica Bancorporation |
12,800 | 566 | ||
| Willis Group Holdings, Ltd. |
17,400 | 767 | ||
| Wilmington Trust Corp. |
8,600 | 357 | ||
| Wintrust Financial Corp. |
31,500 | 1,381 | ||
| XL Capital, Ltd. — Class A |
2,400 | 202 | ||
| Total |
69,075 | |||
| Health Care (6.4%) |
||||
| *Affymetrix, Inc. |
4,900 | 122 | ||
| Analogic Corp. |
17,300 | 1,272 | ||
| Arrow International, Inc. |
42,500 | 1,627 | ||
| *Barr Pharmaceuticals, Inc. |
6,900 | 347 | ||
| *Exelixis, Inc. |
98,800 | 1,195 | ||
| Health Management Associates, |
87,500 | 994 | ||
| *HEALTHSOUTH Corp. |
39,360 | 713 | ||
| *Invitrogen Corp. |
4,300 | 317 | ||
| *Lincare Holdings, Inc. |
23,200 | 925 | ||
| *Myriad Genetics, Inc. |
81,200 | 3,019 | ||
| *Neurocrine Biosciences, Inc. |
5,200 | 58 | ||
| Omnicare, Inc. |
7,400 | 267 | ||
| *OSI Pharmaceuticals, Inc. |
8,000 | 290 | ||
| Owens & Minor, Inc. |
102,400 | 3,577 | ||
| *Pharmion Corp. |
53,000 | 1,534 | ||
| *Sepracor, Inc. |
13,000 | 533 | ||
| *St. Jude Medical, Inc. |
20,800 | 863 | ||
| *Triad Hospitals, Inc. |
7,600 | 409 | ||
| Universal Health Services, Inc. — Class B |
16,400 | 1,009 | ||
| *Valeant Pharmaceuticals International |
36,700 | 613 | ||
| *Varian Medical Systems, Inc. |
7,400 | 315 | ||
| *Verenium Corp. |
114,000 | 578 | ||
| West Pharmaceutical Services, Inc. |
57,300 | 2,702 | ||
| *Zimmer Holdings, Inc. |
2,300 | 195 | ||
| Total |
23,474 | |||
| Industrials (20.2%) |
||||
| *Accuride Corp. |
52,500 | 809 | ||
| *AirTran Holdings, Inc. |
136,000 | 1,485 | ||
| *Allied Waste Industries, Inc. |
49,000 | 660 | ||
| Ameron International Corp. |
31,700 | 2,859 | ||
| *Beacon Roofing Supply, Inc. |
82,000 | 1,393 | ||
| Belden, Inc. |
75,300 | 4,168 | ||
| *C&D Technologies, Inc. |
76,500 | 428 | ||
| *Casella Waste Systems, |
110,200 | 1,188 | ||
| Cintas Corp. |
14,100 | 556 | ||
| *Dollar Thrifty Automotive Group, Inc. |
70,000 | 2,859 | ||
| EDO Corp. |
34,700 | 1,141 | ||
| Electro Rent Corp. |
108,000 | 1,570 | ||
| Equifax, Inc. |
12,900 | 573 | ||
| Franklin Electric Co., Inc. |
57,100 | 2,694 | ||
| *FTI Consulting, Inc. |
87,400 | 3,324 | ||
| Common Stocks (95.5%) | Shares/ $ Par |
Value $ (000’s) | ||
| Industrials continued |
||||
| G & K Services, Inc. |
58,000 | 2,292 | ||
| *Genesee & Wyoming, Inc. |
95,500 | 2,850 | ||
| *The Genlyte Group, Inc. |
35,500 | 2,788 | ||
| Gibraltar Industries, Inc. |
91,600 | 2,029 | ||
| *Hertz Global Holdings, Inc. |
49,300 | 1,310 | ||
| IDEX Corp. |
91,500 | 3,526 | ||
| *Insituform Technologies, Inc. — Class A |
113,200 | 2,469 | ||
| *Kirby Corp. |
103,900 | 3,989 | ||
| Laidlaw International, Inc. |
20,000 | 691 | ||
| Landstar System, Inc. |
128,600 | 6,204 | ||
| Macquarie Infrastructure Co. LLC |
32,200 | 1,336 | ||
| McGrath Rentcorp |
104,100 | 3,507 | ||
| Nordson Corp. |
65,300 | 3,275 | ||
| *Owens Corning, Inc. |
18,000 | 605 | ||
| Raytheon Co. |
7,200 | 388 | ||
| Southwest Airlines Co. |
97,900 | 1,460 | ||
| Universal Forest Products, Inc. |
42,300 | 1,788 | ||
| *USG Corp. |
6,300 | 309 | ||
| UTI Worldwide, Inc. |
112,320 | 3,009 | ||
| *Waste Connections, Inc. |
71,600 | 2,165 | ||
| Woodward Governor Co. |
59,900 | 3,215 | ||
| Total |
74,912 | |||
| Information Technology (9.7%) |
||||
| *Advanced Energy Industries, Inc. |
81,200 | 1,840 | ||
| *ATMI, Inc. |
42,400 | 1,272 | ||
| AVX Corp. |
41,400 | 693 | ||
| *Brooks Automation, Inc. |
167,400 | 3,038 | ||
| *Fairchild Semiconductor International, Inc. |
42,400 | 819 | ||
| *GSI Group, Inc. |
156,200 | 1,529 | ||
| *Intuit, Inc. |
16,100 | 484 | ||
| *Ixia |
126,400 | 1,170 | ||
| Landauer, Inc. |
25,900 | 1,276 | ||
| *Littelfuse, Inc. |
54,000 | 1,824 | ||
| Methode Electronics, |
29,400 | 460 | ||
| *Micron Technology, Inc. |
28,700 | 360 | ||
| Molex, Inc. — Class A |
38,100 | 1,012 | ||
| *MPS Group, Inc. |
198,300 | 2,651 | ||
| *Nortel Networks Corp. |
32,530 | 782 | ||
| *Novellus Systems, Inc. |
12,900 | 366 | ||
| *Packeteer, Inc. |
55,500 | 433 | ||
| *Progress Software Corp. |
94,300 | 2,998 | ||
| *QLogic Corp. |
23,400 | 390 | ||
| Seagate Technology |
42,000 | 914 | ||
| *SPSS, Inc. |
69,925 | 3,086 | ||
| StarTek, Inc. |
71,900 | 776 | ||
| *Sun Microsystems, Inc. |
165,000 | 868 | ||
| *Tellabs, Inc. |
36,600 | 394 | ||
| *Teradyne, Inc. |
44,700 | 786 | ||
| *Websense, Inc. |
92,800 | 1,972 | ||
| *Wind River Systems, Inc. |
209,400 | 2,303 | ||
| Xilinx, Inc. |
7,200 | 193 | ||
| *Xyratex, Ltd. |
53,200 | 1,183 | ||
| Total |
35,872 | |||
| Common Stocks (95.5%) | Shares/ $ Par |
Value $ (000’s) | ||
| Materials (10.8%) |
||||
| Airgas, Inc. |
75,900 | 3,637 | ||
| American Vanguard Corp. |
87,800 | 1,257 | ||
| AngloGold Ashanti Limited ADR |
19,500 | 737 | ||
| AptarGroup, Inc. |
98,000 | 3,486 | ||
| Arch Chemicals, Inc. |
68,700 | 2,414 | ||
| Bowater, Inc. |
16,600 | 414 | ||
| Carpenter Technology Corp. |
29,800 | 3,884 | ||
| Chesapeake Corp. |
24,600 | 309 | ||
| Deltic Timber Corp. |
42,600 | 2,335 | ||
| *Domtar Corp. |
42,600 | 475 | ||
| Florida Rock Industries, Inc. |
47,700 | 3,220 | ||
| Gold Fields, Ltd., ADR |
31,200 | 490 | ||
| Innospec, Inc. |
54,000 | 3,197 | ||
| International Paper Co. |
38,600 | 1,507 | ||
| Louisiana-Pacific Corp. |
39,800 | 753 | ||
| *Meridian Gold, Inc. |
73,900 | 2,038 | ||
| Metal Management, Inc. |
72,100 | 3,177 | ||
| Myers Industries, Inc. |
87,900 | 1,943 | ||
| Nalco Holding Co. |
54,000 | 1,482 | ||
| *Smurfit-Stone Container Corp. |
58,800 | 783 | ||
| *Symyx Technologies, Inc. |
78,200 | 900 | ||
| Wausau Paper Corp. |
105,600 | 1,415 | ||
| Total |
39,853 | |||
| Other Holdings (0.5%) |
||||
| Russell 2000 Value Index |
23,400 | 1,922 | ||
| Total |
1,922 | |||
| Telecommunication Services (0.7%) | ||||
| *Premiere Global Services, Inc. |
167,100 | 2,176 | ||
| *Wireless Facilities, Inc. |
169,600 | 285 | ||
| Total |
2,461 | |||
| Utilities (3.8%) |
||||
| Ameren Corp. |
7,500 | 368 | ||
| Black Hills Corp. |
61,367 | 2,439 | ||
| Cleco Corp. |
86,700 | 2,124 | ||
| Duke Energy Corp. |
21,000 | 384 | ||
| *Dynegy, Inc. |
59,500 | 562 | ||
| *El Paso Electric Co. |
82,600 | 2,029 | ||
| Energy East Corp. |
7,000 | 183 | ||
| *Mirant Corp. |
8,100 | 345 | ||
| NiSource, Inc. |
29,900 | 619 | ||
| Pinnacle West Capital Corp. |
20,400 | 813 | ||
| Southwest Gas Corp. |
57,900 | 1,958 | ||
| TECO Energy, Inc. |
62,600 | 1,075 | ||
| Vectren Corp. |
41,900 | 1,128 | ||
| Total |
14,027 | |||
| Total Common Stocks |
353,221 | |||
The Accompanying Notes are an Integral Part of the Financial Statements.
36
T. Rowe Price Small Cap Value Portfolio
Table of Contents
T. Rowe Price Small Cap Value Portfolio
| Convertible Corporate Bonds (0.2%) |
Shares/ $ Par |
Value $ (000’s) |
|||
| Telephone and Telegraph Apparatus (0.2%) |
| ||||
| Lucent Technologies, 2.875%, 6/15/25 |
655,000 | 734 | |||
| Total Convertible Corporate Bonds (Cost: $660) |
734 | ||||
| Preferred Stocks (0.1%) | |||||
| Industrials (0.1%) |
| ||||
| Allied Waste Industrial |
900 | 317 | |||
| Total Preferred Stocks |
317 | ||||
| Money Market Investments (4.4%) | |||||
| Other Holdings (4.4%) |
|||||
| Reserve Investment Fund |
16,077,442 | 16,077 | |||
| Total Money Market Investments (Cost: $16,077) |
16,077 | ||||
| Total Investments (100.2%) |
370,349 | ||||
| Other Assets, Less Liabilities (-0.2%) |
(853 | ) | |||
| Net Assets (100.0%) |
369,496 | ||||
| * | Non-Income Producing |
ADR after the name of a security represents — American Depositary Receipt.
| (a) | At June 30, 2007 the aggregate cost of securities for federal tax purposes (in thousands) was $278,586 and the net unrealized appreciation of investments based on that cost was $91,763 which is comprised of $102,753 aggregate gross unrealized appreciation and $10,990 aggregate gross unrealized depreciation. |
The Accompanying Notes are an Integral Part of the Financial Statements.
T. Rowe Price Small Cap Value Portfolio
37
Table of Contents
International Growth Portfolio
Sector Allocation 6/30/07
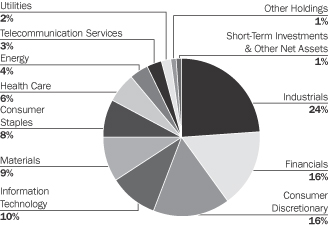
Sector Allocation is based on Net Assets.
Sector Allocation is subject to change.
Investors should be aware of the risks of investments in foreign securities, particularly investments in securities of companies in developing nations. These include the risks of currency fluctuation, of political and economic instability and of less well-developed government supervision and regulation of business and industry practices, as well as differences in accounting standards.
Expense Example
As a shareholder of the Portfolio, you incur two types of costs: (1) transaction costs and (2) ongoing costs, including management fees and other Portfolio expenses. This Example is intended to help you understand your ongoing costs (in dollars) of investing in the Portfolio and to compare these costs with the ongoing costs of investing in other mutual funds.
The Example is based on an investment of $1,000 invested at the beginning of the period and held for the entire period (January 1, 2007 to June 30, 2007).
Actual Expenses
The first line of the table below provides information about actual account values and actual expenses. You may use the information in this line, together with the amount you invested, to estimate the expenses that you paid over the period. Simply divide your account value by $1,000 (for example, an $8,600 account value divided by $1,000 = 8.6), then multiply the result by the number in the first line under the heading entitled “Expenses Paid During Period” to estimate the expenses you paid on your account during this period.
Hypothetical Example for Comparison Purposes
The second line of the table below provides information about hypothetical account values and hypothetical expenses based on the Portfolio’s actual expense ratio and an assumed rate of return of 5% per year before expenses, which is not the Portfolio’s actual return. The hypothetical account values and expenses may not be used to estimate the actual ending account balance or expenses you paid for the period. You may use this information to compare the ongoing costs of investing in the Portfolio and other funds. To do so, compare this 5% hypothetical example with the 5% hypothetical examples that appear in the shareholder reports of the other funds.
Please note that the expenses shown in the table are meant to highlight your ongoing costs only and do not reflect any transactional costs or separate account charges. Therefore, the second line of the table is useful in comparing ongoing costs only, and will not help you determine the relative total costs of owning different funds. In addition, if these transactional costs or separate account charges were included, your costs would have been higher.
| Beginning Account Value January 1, 2007 |
Ending Account Value June 30, 2007 |
Expenses 2007* | |||||||
| Actual |
$ | 1,000.00 | $ | 1,099.70 | $ | 4.16 | |||
| Hypothetical (5% return before expenses) |
$ | 1,000.00 | $ | 1,020.83 | $ | 4.01 | |||
| * | Expenses are equal to the Portfolio’s annualized expense ratio of 0.80%, multiplied by the average account value over the period, multiplied by 181/365 (to reflect the one-half year period). |
38
International Growth Portfolio
Table of Contents
International Growth Portfolio
Northwestern Mutual Series Fund, Inc.
Schedule of Investments
June 30, 2007 (unaudited)
| Foreign Common Stocks (98.8%) | Country | Shares/ $ Par |
Value $ (000’s) | |||
| Consumer Discretionary (15.7%) |
||||||
| British Sky Broadcasting Group PLC |
United Kingdom | 167,495 | 2,147 | |||
| Burberry Group PLC |
United Kingdom | 188,360 | 2,574 | |||
| *Central European Media Enterprises, Ltd. |
Czech Republic | 26,045 | 2,541 | |||
| Compagnie Financiere Richemont |
Switzerland | 37,245 | 2,225 | |||
| Esprit Holdings, Ltd. |
Hong Kong | 216,500 | 2,756 | |||
| Fiat SPA |
Italy | 156,215 | 4,648 | |||
| *Focus Media Holding, Ltd. |
China | 58,200 | 2,939 | |||
| Hugo Boss AG |
Germany | 34,385 | 2,059 | |||
| Inditex SA |
Spain | 55,525 | 3,276 | |||
| Intercontinental Hotels Group PLC |
United Kingdom | 98,535 | 2,448 | |||
| Kuoni Reisen Holding |
Switzerland | 3,700 | 2,221 | |||
| Makita Corp. |
Japan | 46,700 | 2,089 | |||
| Point, Inc. |
Japan | 34,760 | 2,057 | |||
| PPR |
France | 13,850 | 2,416 | |||
| Renault SA |
France | 9,390 | 1,505 | |||
| Sol Melia SA |
Spain | 126,260 | 2,808 | |||
| Swatch Group AG |
Switzerland | 9,825 | 2,790 | |||
| Toyota Motor Corp. |
Japan | 36,000 | 2,270 | |||
| *Urbi Desarollos Urbanos SA |
Mexico | 698,680 | 3,217 | |||
| WPP Group PLC |
United Kingdom | 136,035 | 2,035 | |||
| Total |
51,021 | |||||
| Consumer Staples (7.6%) |
||||||
| *Barry Callebaut AG |
Switzerland | 3,215 | 2,435 | |||
| Coca Cola Hellenic Bottling Co. SA |
Greece | 60,930 | 2,803 | |||
| Heineken NV |
Netherlands | 43,885 | 2,578 | |||
| Iaws Group PLC |
Ireland | 92,635 | 1,940 | |||
| Inbev NV |
Belgium | 30,940 | 2,450 | |||
| Kerry Group PLC |
Ireland | 61,695 | 1,722 | |||
| Reckitt Benckiser PLC |
United Kingdom | 71,735 | 3,929 | |||
| Tesco PLC |
United Kingdom | 342,295 | 2,865 | |||
| Unilever NV |
Netherlands | 40,700 | 1,266 | |||
| Woolworths, Ltd. |
Australia | 113,260 | 2,591 | |||
| Total |
24,579 | |||||
| Energy (3.9%) |
||||||
| *Artumas Group, Inc. |
Norway | 96,355 | 984 | |||
| Cameco Corp. |
Canada | 59,915 | 3,038 | |||
| *China Coal Energy Co. |
China | 1,344,000 | 2,015 | |||
| *Electromagnetic GeoServices AS |
Norway | 50,255 | 1,005 | |||
| Expro International Group |
United Kingdom | 67,925 | 1,324 | |||
| *Petroleum Geo-Services ASA |
Norway | 97,590 | 2,415 | |||
| Reliance Industries, Ltd. |
India | 31,270 | 1,302 | |||
| *Seajacks International, Ltd. |
Norway | 62,515 | 647 | |||
| Total |
12,730 | |||||
| Financials (15.5%) |
||||||
| Admiral Group PLC |
United Kingdom | 117,023 | 2,076 | |||
| Aeon Mall Co., Ltd. |
Japan | 79,100 | 2,426 | |||
| Allianz SE |
Germany | 13,315 | 3,120 | |||
| Foreign Common Stocks (98.8%) | Country | Shares/ $ Par |
Value $ (000’s) | |||
| Financials continued |
||||||
| Allied Irish Banks PLC |
Ireland | 51,935 | 1,412 | |||
| Anglo Irish Bank Corp. PLC |
Ireland | 247,814 | 5,042 | |||
| Ardepro Co., Ltd. |
Japan | 6,725 | 2,094 | |||
| AXA SA |
France | 65,345 | 2,804 | |||
| Azimut Holding SPA |
Italy | 192,115 | 3,268 | |||
| *Banca Popolare Italiana Scrl |
Italy | 79,780 | 1,225 | |||
| Banco Espanol de Credito SA |
Spain | 84,515 | 1,915 | |||
| Banco Espirito Santo SA |
Portugal | 59,825 | 1,333 | |||
| Banco Popolare di Verona e Novara Scrl |
Italy | 39,980 | 1,148 | |||
| Credit Suisse Group |
Switzerland | 42,960 | 3,047 | |||
| Erste Bank Der Oesterreichischen Sparkassen AG |
Austria | 37,535 | 2,930 | |||
| Hopson Development Holdings, Ltd. |
Hong Kong | 234,000 | 657 | |||
| Hypo Real Estate Holding AG |
Germany | 35,225 | 2,282 | |||
| Induntrial Bank of Korea |
Korea | 39,200 | 800 | |||
| Korean Reinsurance Co. |
Korea | 91,090 | 1,420 | |||
| Manulife Financial Corp. |
Canada | 35,995 | 1,343 | |||
| Piraeus Bank SA |
Greece | 82,835 | 3,031 | |||
| *Scandinavian Property Development ASA |
Norway | 126,125 | 984 | |||
| *TAG Tegernsee Immobilien Und Beteiligungs AG |
Germany | 118,775 | 1,463 | |||
| Toronto-Dominion Bank |
Canada | 26,440 | 1,808 | |||
| Uncredito Italiano SPA |
Italy | 285,775 | 2,546 | |||
| Total |
50,174 | |||||
| Health Care (6.0%) |
||||||
| *Actelion, Ltd. |
Switzerland | 29,650 | 1,323 | |||
| CSL, Ltd. |
Australia | 44,665 | 3,321 | |||
| Daiichi Sankyo Co., Ltd. |
Japan | 80,500 | 2,139 | |||
| Merck KGaA |
Germany | 14,405 | 1,981 | |||
| Nobel Biocare Holding AG |
Switzerland | 7,075 | 2,310 | |||
| Stada Arzneimittel AG |
Germany | 39,155 | 2,489 | |||
| Takeda Pharmaceutical Co., Ltd. |
Japan | 17,700 | 1,142 | |||
| Terumo Corp. |
Japan | 62,700 | 2,420 | |||
| *William Demant Holding A/S |
Denmark | 24,705 | 2,438 | |||
| Total |
19,563 | |||||
| Industrials (24.2%) |
||||||
| ABB, Ltd., ADR |
Switzerland | 198,965 | 4,497 | |||
| Aker Yards AS |
Norway | 90,500 | 1,563 | |||
| *Alstom |
France | 20,435 | 3,403 | |||
| Atlas Copco AB |
Sweden | 151,910 | 2,536 | |||
| Berlian Laju Tanker Tbk PT |
Indonesia | 7,913,500 | 1,796 | |||
| Bharat Heavy Electricals, Ltd. |
India | 68,690 | 2,586 | |||
| CAE, Inc. |
Canada | 263,940 | 3,518 | |||
| Capita Group PLC |
United Kingdom | 218,370 | 3,165 | |||
| China Infrastructure Machinery Holdings, Ltd. |
China | 622,000 | 1,361 | |||
| Companhia de Concessoes Rodoviarias |
Brazil | 164,660 | 3,031 | |||
| Cosco Corp., Singapore, Ltd. |
Singapore | 205,000 | 502 | |||
| Daewoo Shipbuilding & Marine Engineering Co. |
Korea | 42,230 | 2,388 | |||
The Accompanying Notes are an Integral Part of the Financial Statements.
International Growth Portfolio
39
Table of Contents
International Growth Portfolio
| Foreign Common Stocks (98.8%) | Country | Shares/ $ Par |
Value $ (000’s) | |||
| Industrials continued |
||||||
| *Deutz AG |
Germany | 45,220 | 586 | |||
| FlSmidth & Co A/S |
Denmark | 39,840 | 3,126 | |||
| *Grafton Group PLC |
Ireland | 103,595 | 1,478 | |||
| Hopewell Holdings |
Hong Kong | 453,000 | 1,846 | |||
| IVRCL Infrastructures & Projects, Ltd. |
India | 227,280 | 2,003 | |||
| Komatsu, Ltd. |
Japan | 88,700 | 2,569 | |||
| Kuehne & Nagel International AG |
Switzerland | 31,875 | 2,936 | |||
| LG Corp. |
Korea | 8,270 | 426 | |||
| Metso Oyj |
Finland | 55,040 | 3,232 | |||
| Michael Page International PLC |
United Kingdom | 325,225 | 3,419 | |||
| MTU Aero Engines Holding AG |
Germany | 51,190 | 3,321 | |||
| *Prysmian SPA |
Italy | 79,585 | 1,935 | |||
| Sembcorp Marine, Ltd. |
Singapore | 1,005,000 | 3,214 | |||
| SGS SA |
Switzerland | 2,545 | 3,012 | |||
| Siemens AG |
Germany | 27,535 | 3,961 | |||
| *Thielert AG |
Germany | 10,800 | 329 | |||
| Tianjin Development Holdings, Ltd. |
Hong Kong | 1,936,000 | 2,108 | |||
| TNT NV |
Netherlands | 54,765 | 2,470 | |||
| Vinci SA |
France | 45,920 | 3,425 | |||
| Wavin NV |
Netherlands | 108,515 | 2,610 | |||
| Total |
78,352 | |||||
| Information Technology (10.2%) |
||||||
| *Autonomy Corp. PLC |
United Kingdom | 201,620 | 2,888 | |||
| *Blinkx PLC |
United Kingdom | 201,620 | 176 | |||
| Cap Gemini SA |
France | 29,720 | 2,173 | |||
| EVS Broadcast Equipment SA |
Belgium | 15,965 | 1,313 | |||
| *Gresham Computing PLC |
United Kingdom | 197,485 | 501 | |||
| Hon Hai Precision Industry Co., Ltd. |
Taiwan | 271,000 | 2,341 | |||
| Kontron AG |
Germany | 179,510 | 3,375 | |||
| *LG.Philips Lcd Co., Ltd. |
Korea | 57,590 | 2,588 | |||
| Neopost SA |
France | 21,330 | 3,119 | |||
| Nippon Electric Glass Co., Ltd. |
Japan | 180,000 | 3,161 | |||
| Star Micronics Co., Ltd. |
Japan | 124,300 | 3,308 | |||
| Sumco Corp. |
Japan | 21,800 | 1,091 | |||
| Telechips, Inc. |
Korea | 43,309 | 1,022 | |||
| *Temenos Group AG |
Switzerland | 134,935 | 3,238 | |||
| Vtech Holdings, Ltd. |
Hong Kong | 334,000 | 2,825 | |||
| Total |
33,119 | |||||
| Materials (9.4%) |
||||||
| Akzo Nobel NV |
Netherlands | 28,480 | 2,457 | |||
| Anglo American PLC |
United Kingdom | 52,050 | 3,047 | |||
| BHP Billiton, Ltd. |
Australia | 108,035 | 3,225 | |||
| Compahnia Vale DO Rio |
Brazil | 88,500 | 3,943 | |||
| *Crew Minerals Asa |
Norway | 409,610 | 1,196 | |||
| CRH PLC |
Ireland | 72,760 | 3,585 | |||
| *Gammon Gold, Inc. |
Canada | 46,400 | 586 | |||
| Imperial Chemical Industries PLC |
United Kingdom | 247,655 | 3,083 | |||
| K+S AG |
Germany | 23,615 | 3,613 | |||
| Sika AG |
Switzerland | 960 | 1,959 | |||
| Foreign Common Stocks (98.8%) | Country | Shares/ $ Par |
Value $ (000’s) |
||||
| Materials continued |
|||||||
| *Smurfit Kappa Group PLC |
Ireland | 47,680 | 1,192 | ||||
| Syngenta AG |
Switzerland | 13,055 | 2,545 | ||||
| Total |
30,431 | ||||||
| Other Holdings (1.5%) |
|||||||
| Nomura ETF — Nikkei 225 |
Japan | 16,610 | 2,467 | ||||
| Nomura Topix ETF |
Japan | 156,500 | 2,274 | ||||
| Total |
4,741 | ||||||
| Telecommunication Services (3.0%) |
|||||||
| *Bharti Airtel, Ltd. |
India | 75,075 | 1,541 | ||||
| China Mobile, Ltd. |
Hong Kong | 149,000 | 1,608 | ||||
| *Freenet AG |
Germany | 74,885 | 2,456 | ||||
| Tele2 AB |
Sweden | 120,695 | 1,970 | ||||
| *Telenor ASA |
Norway | 118,428 | 2,311 | ||||
| Total |
9,886 | ||||||
| Utilities (1.8%) |
|||||||
| CEZ AS |
Czech Republic | 49,580 | 2,562 | ||||
| Perusahaan Gas Negara PT |
Indonesia | 596,000 | 623 | ||||
| Veolia Environnement |
France | 32,250 | 2,521 | ||||
| Total |
5,706 | ||||||
| Total Foreign Common Stocks (Cost: $252,076) |
320,302 | ||||||
| Money Market Investments (2.4%) | |||||||
| Federal Government and Agencies (2.4%) |
|||||||
| Federal Home Loan Bank, |
United States | 7,700,000 | 7,680 | ||||
| Total Money Market Investments |
7,680 | ||||||
| Total Investments (101.2%) |
327,982 | ||||||
| Other Assets, Less Liabilities (-1.2%) |
(3,786 | ) | |||||
| Net Assets (100.0%) |
324,196 | ||||||
| * | Non-Income Producing |
ADR after the name of a security represents — American Depositary Receipt.
| (a) | At June 30, 2007 the aggregate cost of securities for federal tax purposes (in thousands) was $259,756 and the net unrealized appreciation of investments based on that cost was $68,226 which is comprised of $71,166 aggregate gross unrealized appreciation and $2,940 aggregate gross unrealized depreciation. |
| (l) | As of June 30, 2007, portfolio securities with an aggregate market value of $286,095 (in thousands) were fair valued under procedures adopted by the Board of Directors. |
Investment Percentage by Country is based on Net Assets:
| United Kingdom |
11.1% | |
| Switzerland |
10.8% | |
| Japan |
9.8% | |
| Germany |
9.7% | |
| France |
6.7% | |
| Other |
51.9% | |
| Total |
100.0% | |
The Accompanying Notes are an Integral Part of the Financial Statements.
40
International Growth Portfolio
Table of Contents
Franklin Templeton International Equity Portfolio
Sector Allocation 6/30/07
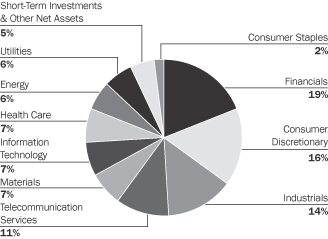
Sector Allocation is based on Net Assets.
Sector Allocation is subject to change.
Investors should be aware of the risks of investments in foreign securities, particularly investments in securities of companies in developing nations. These include the risks of currency fluctuation, of political and economic instability and of less well-developed government supervision and regulation of business and industry practices, as well as differences in accounting standards.
Expense Example
As a shareholder of the Portfolio, you incur two types of costs: (1) transaction costs and (2) ongoing costs, including management fees and other Portfolio expenses. This Example is intended to help you understand your ongoing costs (in dollars) of investing in the Portfolio and to compare these costs with the ongoing costs of investing in other mutual funds.
The Example is based on an investment of $1,000 invested at the beginning of the period and held for the entire period (January 1, 2007 to June 30, 2007).
Actual Expenses
The first line of the table below provides information about actual account values and actual expenses. You may use the information in this line, together with the amount you invested, to estimate the expenses that you paid over the period. Simply divide your account value by $1,000 (for example, an $8,600 account value divided by $1,000 = 8.6), then multiply the result by the number in the first line under the heading entitled “Expenses Paid During Period” to estimate the expenses you paid on your account during this period.
Hypothetical Example for Comparison Purposes
The second line of the table below provides information about hypothetical account values and hypothetical expenses based on the Portfolio’s actual expense ratio and an assumed rate of return of 5% per year before expenses, which is not the Portfolio’s actual return. The hypothetical account values and expenses may not be used to estimate the actual ending account balance or expenses you paid for the period. You may use this information to compare the ongoing costs of investing in the Portfolio and other funds. To do so, compare this 5% hypothetical example with the 5% hypothetical examples that appear in the shareholder reports of the other funds.
Please note that the expenses shown in the table are meant to highlight your ongoing costs only and do not reflect any transactional costs or separate account charges. Therefore, the second line of the table is useful in comparing ongoing costs only, and will not help you determine the relative total costs of owning different funds. In addition, if these transactional costs or separate account charges were included, your costs would have been higher.
| Beginning Account Value January 1, 2007 |
Ending Account Value June 30, 2007 |
Expenses Paid During Period January 1, 2007 to June 30, 2007* | |||||||
| Actual |
$ | 1,000.00 | $ | 1,145.40 | $ | 3.35 | |||
| Hypothetical (5% return before expenses) |
$ | 1,000.00 | $ | 1,021.67 | $ | 3.16 | |||
| * | Expenses are equal to the Portfolio’s annualized expense ratio of 0.63%, multiplied by the average account value over the period, multiplied by 181/365 (to reflect the one-half year period). |
Franklin Templeton International Equity Portfolio
41
Table of Contents
Franklin Templeton International Equity Portfolio
Northwestern Mutual Series Fund, Inc.
Schedule of Investments
June 30, 2007 (unaudited)
| Foreign Common Stocks (95.2%) |
Country | Shares/ $ Par |
Value $ (000’s) | |||
| Consumer Discretionary (16.1%) |
||||||
| Accor SA |
France | 173,000 | 15,290 | |||
| Bayerische Motoren Werke AG |
Germany | 380,920 | 24,713 | |||
| British Sky Broadcasting Group PLC |
United Kingdom | 1,225,270 | 15,703 | |||
| Burberry Group PLC |
United Kingdom | 738,190 | 10,087 | |||
| Compass Group PLC |
United Kingdom | 2,915,350 | 20,154 | |||
| Fujifilm Holdings Corp. |
Japan | 159,300 | 7,124 | |||
| GKN PLC |
United Kingdom | 2,091,540 | 16,682 | |||
| Hyundai Motor Co. |
South Korea | 264,580 | 20,865 | |||
| Kingfisher PLC |
United Kingdom | 3,825,490 | 17,296 | |||
| Koninklijke Philips Electronics NV |
Netherlands | 449,135 | 19,040 | |||
| Mediaset SPA |
Italy | 1,497,610 | 15,453 | |||
| Michelin SA |
France | 260,200 | 36,360 | |||
| Pearson PLC |
United Kingdom | 697,770 | 11,752 | |||
| Reed Elsevier NV |
Netherlands | 645,340 | 12,302 | |||
| Securitas Direct AB |
Sweden | 652,300 | 1,761 | |||
| Sony Corp. |
Japan | 323,400 | 16,618 | |||
| Thomson SA |
France | 1,088,780 | 20,458 | |||
| Valeo SA |
France | 135,280 | 7,242 | |||
| Wolters Kluwer NV |
Netherlands | 166,630 | 5,085 | |||
| Total |
293,985 | |||||
| Consumer Staples (2.2%) |
||||||
| Cadbury Schweppes PLC |
United Kingdom | 1,086,340 | 14,781 | |||
| Nestle SA |
Switzerland | 38,980 | 14,805 | |||
| Unilever PLC |
United Kingdom | 348,295 | 11,240 | |||
| Total |
40,826 | |||||
| Energy (6.2%) |
||||||
| BP PLC |
United Kingdom | 1,037,940 | 12,504 | |||
| China Shenhua Energy |
China | 7,378,000 | 25,532 | |||
| ENI SPA |
Italy | 414,535 | 15,026 | |||
| Repsol YPF SA |
Spain | 493,680 | 19,467 | |||
| Royal Dutch Shell |
United Kingdom | 410,435 | 17,139 | |||
| SBM Offshore NV |
Netherlands | 451,200 | 17,199 | |||
| Total SA |
France | 84,728 | 6,878 | |||
| Total |
113,745 | |||||
| Financials (19.6%) |
||||||
| ACE, Ltd. |
Bermuda | 234,580 | 14,666 | |||
| Australia & New Zealand Banking Group, Ltd. |
Australia | 89,588 | 2,196 | |||
| AXA SA |
France | 512,174 | 21,978 | |||
| Banco Santander Central Hispano SA |
Spain | 906,009 | 16,668 | |||
| Cheung Kong Holdings, Ltd. |
Hong Kong | 1,035,000 | 13,570 | |||
| Chinatrust Financial Holding Co., Ltd. |
Taiwan | 17,172,000 | 13,376 | |||
| DBS Group Holdings, Ltd. |
Singapore | 1,192,000 | 17,728 | |||
| HSBC Holdings PLC |
United Kingdom | 1,474,937 | 26,908 | |||
| ING Groep NV |
Netherlands | 683,040 | 30,077 | |||
| Kookmin Bank |
South Korea | 226,500 | 19,842 | |||
| Lloyds TSB Group PLC |
United Kingdom | 1,165,150 | 13,022 | |||
| Foreign Common Stocks (95.2%) |
Country | Shares/ $ Par |
Value $ (000’s) |
||||
| Financials continued |
|||||||
| Mitsubishi Tokyo Financial Group, ADR |
Japan | 222,000 | 2,446 | ||||
| Mitsubishi UFJ Financial Group Inc. |
Japan | 565 | 6,227 | ||||
| National Australia Bank, Ltd. |
Australia | 514,532 | 17,848 | ||||
| Nomura Holdings Inc. |
Japan | 332,400 | 6,452 | ||||
| Nordea Bank AB |
Sweden | 1,536,530 | 23,996 | ||||
| Old Mutual PLC |
South Africa | 4,953,850 | 16,689 | ||||
| Royal Bank of Scotland Group PLC |
United Kingdom | 1,816,680 | 22,975 | ||||
| Sompo Japan Insurance Inc. |
Japan | 1,103,000 | 13,507 | ||||
| Standard Chartered PLC |
United Kingdom | 370,360 | 12,084 | ||||
| Swire Pacific, Ltd. |
Hong Kong | 1,276,500 | 14,309 | ||||
| Swiss Reinsurance Co. |
Switzerland | 180,212 | 16,425 | ||||
| Unicredito Italiano SPA |
Italy | 860,800 | 7,669 | ||||
| XL Capital, Ltd. — Class A |
Bermuda | 94,850 | 7,995 | ||||
| Total |
358,653 | ||||||
| Health Care (6.7%) |
|||||||
| AGFA Gevaert NV |
Belgium | 291,272 | 7,521 | ||||
| Celesio AG |
Germany | 261,230 | 16,908 | ||||
| *CK Life Sciences International Holdings Inc. |
Hong Kong | 44,991 | 4 | ||||
| GlaxoSmithKline PLC |
United Kingdom | 621,430 | 16,279 | ||||
| Novartis AG |
Switzerland | 324,220 | 18,250 | ||||
| Olympus Corp. |
Japan | 236,500 | 9,207 | ||||
| Ono Pharmaceutical |
Japan | 94,800 | 5,019 | ||||
| Sanofi-Aventis |
France | 164,625 | 13,293 | ||||
| Shire PLC |
United Kingdom | 878,760 | 21,781 | ||||
| Symbion Health, Ltd. |
Australia | 10 | 0 | (m) | |||
| Takeda Pharmaceutical |
Japan | 208,500 | 13,456 | ||||
| Total |
121,718 | ||||||
| Industrials (13.6%) |
|||||||
| Atlas Copco AB |
Sweden | 1,330,560 | 22,208 | ||||
| BAE Systems PLC |
United Kingdom | 3,411,020 | 27,636 | ||||
| *British Airways PLC |
United Kingdom | 1,228,800 | 10,259 | ||||
| Deutsche Post AG |
Germany | 602,100 | 19,563 | ||||
| Empresa Brasiliera de AE ADR |
Brazil | 259,710 | 12,521 | ||||
| Hutchison Whampoa, Ltd. |
Hong Kong | 1,826,000 | 18,136 | ||||
| Qantas Airways, Ltd. |
Australia | 2,552,550 | 12,106 | ||||
| Rentokil Initial PLC |
United Kingdom | 2,672,940 | 8,551 | ||||
| Rolls-Royce Group PLC |
United Kingdom | 1,916,990 | 20,617 | ||||
| Rolls-Royce Group PLC — Class B |
United Kingdom | 113,485,808 | 0 | (m) | |||
| Securitas AB |
Sweden | 652,300 | 10,353 | ||||
| Securitas Systems AB |
Sweden | 652,300 | 2,220 | ||||
| Siemens AG ADR |
Germany | 199,230 | 28,501 | ||||
| Smiths Group PLC |
United Kingdom | 320,326 | 7,609 | ||||
| *Vestas Wind Systems AS |
Denmark | 419,800 | 27,496 | ||||
| Volvo AB |
Sweden | 999,200 | 19,841 | ||||
| Total |
247,617 | ||||||
The Accompanying Notes are an Integral Part of the Financial Statements.
42
Franklin Templeton International Equity Portfolio
Table of Contents
Franklin Templeton International Equity Portfolio
| Foreign Common Stocks (95.2%) |
Country | Shares/ $ Par |
Value $ (000’s) | |||
| Information Technology (7.2%) |
||||||
| *Check Point Software Technologies Ltd. |
Israel | 387,430 | 8,837 | |||
| Compal Electronics Inc. |
Taiwan | 5,975,495 | 6,455 | |||
| Hitachi, Ltd. |
Japan | 1,198,000 | 8,471 | |||
| *Infineon Technologies AG |
Germany | 1,122,690 | 18,676 | |||
| Lite-On Technology Corp. |
Taiwan | 4,895,950 | 6,307 | |||
| Mabuchi Motor Co., Ltd. |
Japan | 168,400 | 10,303 | |||
| Nintendo Co., Ltd. |
Japan | 64,600 | 23,593 | |||
| Samsung Electronics Co., Ltd. |
South Korea | 46,140 | 28,189 | |||
| Toshiba Corp. |
Japan | 2,350,000 | 20,452 | |||
| Total |
131,283 | |||||
| Materials (6.7%) |
||||||
| Akzo Nobel NV |
Netherlands | 111,700 | 9,637 | |||
| Alcan Inc. |
Canada | 255,260 | 20,824 | |||
| Alumina, Ltd. |
Australia | 1,908,930 | 12,646 | |||
| BASF AG |
Germany | 109,300 | 14,352 | |||
| Cia Vale DO Rio Doce Spon ADR |
Brazil | 440,500 | 16,607 | |||
| *Domtar Corp. |
United States | 1,006,610 | 11,179 | |||
| Norske Skogindustrier ASA |
Norway | 978,371 | 14,089 | |||
| Stora Enso OYJ — |
Finland | 658,140 | 12,343 | |||
| UPM-Kymmene OYJ |
Finland | 394,760 | 9,744 | |||
| Total |
121,421 | |||||
| Telecommunication Services (11.1%) |
||||||
| BCE Inc. |
Canada | 394,282 | 14,931 | |||
| China Telecom Corp., Ltd. |
China | 17,338,000 | 10,188 | |||
| Chunghwa Telecom ADR |
Taiwan | 301,430 | 5,685 | |||
| France Telecom SA |
France | 756,770 | 20,782 | |||
| KT Corp. Spons ADR |
South Korea | 385,100 | 9,034 | |||
| Nippon Telegraph & Telephone Corp. |
Japan | 1,930 | 8,552 | |||
| Portugal Telecom SGPS SA |
Portugal | 632,670 | 8,723 | |||
| SK Telecom Ltd. Sponsored ADR |
South Korea | 322,890 | 8,831 | |||
| Tele Norte Leste Participacoes SA, ADR |
Brazil | 1,006,600 | 19,095 | |||
| Telefonica SA Sponsored ADR |
Spain | 395,838 | 26,427 | |||
| Telefonos de Mexico SA de CV, ADR |
Mexico | 514,688 | 19,502 | |||
| Telenor ASA |
Norway | 1,208,610 | 23,588 | |||
| Vodafone Group PLC |
United Kingdom | 8,017,483 | 26,979 | |||
| Total |
202,317 | |||||
| Utilities (5.8%) |
||||||
| E.ON AG |
Germany | 146,700 | 24,650 | |||
| Electricite de France |
France | 258,050 | 27,904 | |||
| Iberdrola SA |
Spain | 170,560 | 9,525 | |||
| Korea Electric Power Corp. |
South Korea | 365,650 | 16,223 | |||
| National Grid PLC |
United Kingdom | 666,512 | 9,842 | |||
| Suez SA |
France | 314,910 | 17,989 | |||
| Total |
106,133 | |||||
| Total Foreign Common Stocks |
1,737,698 | |||||
| Money Market Investments (4.6%) |
Country | Shares/ $ Par |
Value $ (000’s) | |||
| Autos (0.5%) |
||||||
| Fcar Owner Trust 1, |
United States | 10,000,000 | 9,976 | |||
| Total |
9,976 | |||||
| Finance Lessors (1.2%) |
||||||
| Thunder Bay Funding, Inc., 5.28%, 7/16/07 |
United States | 10,000,000 | 9,976 | |||
| Windmill Funding Corp., 5.28%, 7/18/07 |
United States | 10,000,000 | 9,974 | |||
| Total |
19,950 | |||||
| Finance Services (1.7%) |
||||||
| Barton Capital LLC, |
United States | 10,000,000 | 9,998 | |||
| Bryant Park Funding LLC, 5.30%, 7/23/07 |
United States | 10,000,000 | 9,966 | |||
| Ciesco LP, 5.28%, 8/16/07 |
United States | 10,000,000 | 9,931 | |||
| Total |
29,895 | |||||
| Miscellaneous Business Credit Institutions (0.5%) |
||||||
| Park Avenue Receivables, |
United States | 10,000,000 | 9,985 | |||
| Total |
9,985 | |||||
| National Commercial Banks (0.2%) |
||||||
| UBS Finance LLC, |
United States | 3,300,000 | 3,299 | |||
| Total |
3,299 | |||||
| Short Term Business Credit (0.5%) |
||||||
| HSBC Finance Corp. |
United States | 10,000,000 | 9,997 | |||
| Total |
9,997 | |||||
| Total Money Market Investments |
83,102 | |||||
| Total Investments (99.8%) |
1,820,800 | |||||
| Other Assets, Less Liabilities (0.2%) |
3,862 | |||||
| Net Assets (100.0%) |
1,824,662 | |||||
| * | Non-Income Producing |
ADR after the name of a security represents — American Depositary Receipt.
| (a) | At June 30, 2007 the aggregate cost of securities for federal tax purposes (in thousands) was $1,109,308 and the net unrealized appreciation of investments based on that cost was $711,492 which is comprised of $724,106 aggregate gross unrealized appreciation and $12,614 aggregate gross unrealized depreciation. |
| (l) | As of June 30, 2007, portfolio securities with an aggregate market value of $1,510,616 (in thousands) were fair valued under procedures adopted by the Board of Directors. |
Investment Percentage by Country is based on Net Assets:
| United Kingdom |
21.3% | |
| France |
10.3% | |
| Japan |
8.3% | |
| Germany |
8.1% | |
| South Korea |
5.6% | |
| Netherlands |
5.1% | |
| Other |
41.3% | |
| Total |
100.0% | |
| (m) | Amount is less than one thousand. |
The Accompanying Notes are an Integral Part of the Financial Statements.
Franklin Templeton International Equity Portfolio
43
Table of Contents
An investment in the Money Market Portfolio is not insured or guaranteed by the Federal Deposit Insurance Corporation or any other government agency. Although the Money Market Portfolio seeks to preserve the value of your investment at $1.00 per share, it is possible to lose money by investing in the Money Market Portfolio.
Expense Example
As a shareholder of the Portfolio, you incur two types of costs: (1) transaction costs and (2) ongoing costs, including management fees and other Portfolio expenses. This Example is intended to help you understand your ongoing costs (in dollars) of investing in the Portfolio and to compare these costs with the ongoing costs of investing in other mutual funds.
The Example is based on an investment of $1,000 invested at the beginning of the period and held for the entire period (January 1, 2007 to June 30, 2007).
Actual Expenses
The first line of the table below provides information about actual account values and actual expenses. You may use the information in this line, together with the amount you invested, to estimate the expenses that you paid over the period. Simply divide your account value by $1,000 (for example, an $8,600 account value divided by $1,000 = 8.6), then multiply the result by the number in the first line under the heading entitled “Expenses Paid During Period” to estimate the expenses you paid on your account during this period.
Hypothetical Example for Comparison Purposes
The second line of the table below provides information about hypothetical account values and hypothetical expenses based on the Portfolio’s actual expense ratio and an assumed rate of return of 5% per year before expenses, which is not the Portfolio’s actual return. The hypothetical account values and expenses may not be used to estimate the actual ending account balance or expenses you paid for the period. You may use this information to compare the ongoing costs of investing in the Portfolio and other funds. To do so, compare this 5% hypothetical example with the 5% hypothetical examples that appear in the shareholder reports of the other funds.
Please note that the expenses shown in the table are meant to highlight your ongoing costs only and do not reflect any transactional costs or separate account charges. Therefore, the second line of the table is useful in comparing ongoing costs only, and will not help you determine the relative total costs of owning different funds. In addition, if these transactional costs or separate account charges were included, your costs would have been higher.
| Beginning Account Value January 1, 2007 |
Ending Account Value June 30, 2007 |
Expenses 2007* | |||||||
| Actual |
$ | 1,000.00 | $ | 1,025.20 | $ | 1.51 | |||
| Hypothetical (5% return before expenses) |
$ | 1,000.00 | $ | 1,023.31 | $ | 1.51 | |||
| * | Expenses are equal to the Portfolio’s annualized expense ratio of 0.30%, multiplied by the average account value over the period, multiplied by 181/365 (to reflect the one-half year period). |
44
Money Market Portfolio
Table of Contents
Money Market Portfolio
Northwestern Mutual Series Fund, Inc.
Schedule of Investments
June 30, 2007 (unaudited)
| Money Market Investments (99.9%) |
Shares/ $ Par |
Value $ (000’s) | ||
| Asset-Backed Securities (CMO’S) (2.2%) | ||||
| Honda Auto Receivables Owner Trust, |
1,932,056 | 1,932 | ||
| Nissan Auto Receivables Owner Trust, |
3,848,867 | 3,849 | ||
| World Omni Auto Receivables Trust, 5.32%, 2/15/08 |
3,570,777 | 3,571 | ||
| Total |
9,352 | |||
| Autos (13.2%) |
||||
| Daimler Chrysler Auto, 5.27%, 8/13/07 |
9,000,000 | 8,942 | ||
| Daimler Chrysler Auto, 5.27%, 8/17/07 |
9,500,000 | 9,433 | ||
| Fcar Owner Trust 1, 5.26%, 7/16/07 |
8,500,000 | 8,480 | ||
| Fcar Owner Trust 1, 5.29%, 7/20/07 |
10,000,000 | 9,971 | ||
| New Center Asset Trust, 5.25%, 7/17/07 |
9,500,000 | 9,476 | ||
| New Center Asset Trust, 5.26%, 7/19/07 |
9,000,000 | 8,975 | ||
| Total |
55,277 | |||
| Federal Government & Agencies (7.4%) | ||||
| Fannie Mae, |
3,800,000 | 3,781 | ||
| Federal Home Loan Bank, 5.25%, 2/5/08 |
3,800,000 | 3,800 | ||
| Federal Home Loan Bank, 5.50%, 12/27/07 Series 667 |
3,900,000 | 3,908 | ||
| Federal Home Loan Mtg Co., 4.975%, 3/3/08 |
4,000,000 | 3,864 | ||
| Federal Home Loan Mtg Co., 4.97%, 2/4/08 |
3,800,000 | 3,685 | ||
| Federal Home Loan Mtg Co., 4.995%, 9/18/07 |
3,900,000 | 3,857 | ||
| Federal Home Loan Mtg Co., 5.085%, 7/9/07 |
3,900,000 | 3,895 | ||
| Federal National Mortgage Association, 5.06%, 3/10/08 |
4,200,000 | 4,049 | ||
| Total |
30,839 | |||
| Finance Lessors (16.7%) | ||||
| American General Financial Corp., |
6,000,000 | 5,977 | ||
| American General Financial Corp., |
6,000,000 | 5,988 | ||
| Money Market Investments (99.9%) |
Shares/ $ Par |
Value $ (000’s) | ||
| Finance Lessors continued | ||||
| American General Financial Corp., |
6,000,000 | 5,990 | ||
| Ranger Funding Co. LLC, 5.26%, 7/26/07 |
8,500,000 | 8,468 | ||
| Ranger Funding Co. LLC, 5.34%, 7/12/07 |
7,739,000 | 7,725 | ||
| Thunder Bay Funding, Inc., 5.27%, 8/3/07 |
9,500,000 | 9,453 | ||
| Thunder Bay Funding, Inc., 5.28%, 8/9/07 |
8,500,000 | 8,450 | ||
| Windmill Funding Corp., 5.26%, 7/20/07 |
8,000,000 | 7,977 | ||
| Windmill Funding Corp., 5.28%, 7/11/07 |
10,000,000 | 9,984 | ||
| Total |
70,012 | |||
| Finance Services (20.5%) | ||||
| Alpine Securitization, 5.25%, 7/3/07 |
9,000,000 | 8,996 | ||
| Alpine Securitization, 5.28%, 7/25/07 |
9,500,000 | 9,465 | ||
| Barton Capital LLC, 5.30%, 7/10/07 |
9,500,000 | 9,486 | ||
| Barton Capital LLC, 5.30%, 7/11/07 |
8,931,000 | 8,917 | ||
| Bryant Park Funding LLC, 5.27%, 8/13/07 |
8,500,000 | 8,445 | ||
| Bryant Park Funding LLC, 5.29%, 7/16/07 |
10,000,000 | 9,977 | ||
| Ciesco LP, |
10,000,000 | 9,973 | ||
| Ciesco LP, |
9,500,000 | 9,458 | ||
| HBOS Treasury Services PLC, 5.31%, 4/9/08 |
3,400,000 | 3,400 | ||
| John Deere Capital Corp., 5.24%, 7/17/07 |
8,500,000 | 8,479 | ||
| Total |
86,596 | |||
| Miscellaneous Business Credit Institutions (5.6%) | ||||
| General Electric, 5.445%, 7/9/07 |
5,000,000 | 5,000 | ||
| Park Avenue Receivables, |
9,500,000 | 9,474 | ||
| Park Avenue Receivables, |
9,000,000 | 8,970 | ||
| Total |
23,444 | |||
| National Commercial Banks (13.9%) | ||||
| Bank of America, |
3,900,000 | 3,900 | ||
| Bankboston, |
3,600,000 | 3,631 | ||
| Money Market Investments (99.9%) |
Shares/ $ Par |
Value $ (000’s) | ||
| National Commercial Banks continued | ||||
| Berkshire Hathaway, 5.659%, 11/15/07 |
4,000,000,000 | 4,003 | ||
| Citigroup Funding, Inc., 5.24%, 7/10/07 |
9,000,000 | 8,987 | ||
| Citigroup Funding, Inc., 5.25%, 7/20/07 |
9,000,000 | 8,974 | ||
| Rabobank USA, 5.32%, 7/2/07 |
10,270,000 | 10,268 | ||
| UBS Finance LLC, 5.25%, 7/6/07 |
10,000,000 | 9,991 | ||
| UBS Finance LLC, 5.27%, 7/27/07 |
8,500,000 | 8,466 | ||
| Total |
58,220 | |||
| Personal Credit Institutions (2.3%) | ||||
| American Express Credit, |
9,500,000 | 9,482 | ||
| Total |
9,482 | |||
| Security Brokers and Dealers (5.4%) | ||||
| Bear Stearns Co. , Inc., 5.26%, 8/2/07 |
7,200,000 | 7,165 | ||
| The Goldman Sachs Group, Inc., |
4,000,000 | 3,974 | ||
| Merrill Lynch & Co., 6.56%, 12/16/07 |
3,250,000 | 3,268 | ||
| Morgan Stanley Dean Witter, |
3,800,000 | 3,740 | ||
| UBS AG Stamford, 5.29%, 6/16/08 |
4,465,000 | 4,465 | ||
| Total |
22,612 | |||
| Short Term Business Credit (12.7%) | ||||
| HSBC Finance Corp., 5.27%, 7/9/07 |
8,000,000 | 7,989 | ||
| HSBC Finance Corp., 5.27%, 7/12/07 |
9,500,000 | 9,483 | ||
| Old Line Funding Corp., |
9,500,000 | 9,484 | ||
| Old Line Funding Corp., |
9,000,000 | 8,968 | ||
| Sheffield Receivables, 5.27%, 7/10/07 |
17,500,000 | 17,475 | ||
| Total |
53,399 | |||
| Total Money Market Investments (Cost: $419,233) |
419,233 | |||
| Total Investments (99.9%) |
419,233 | |||
| Other Assets, Less |
312 | |||
| Net Assets (100.0%) |
419,545 | |||
The Accompanying Notes are an Integral Part of the Financial Statements.
Money Market Portfolio
45
Table of Contents
Sector Allocation 6/30/07
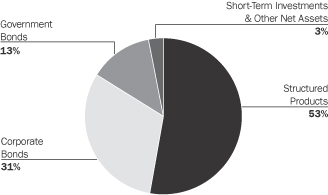
Sector Allocation is based on Net Assets.
Sector Allocation is subject to change.
The Corporate Bonds sector includes bonds of companies and governments headquartered outside the United States.
The Government and Structured Product categories include domestic taxable bonds.
Consistent with the Fund’s stated parameters, no more than 30% of the portfolio is invested in foreign securities, and no more than 20% is invested in high yield securities.
Return of principal is not guaranteed. Bond funds have the same interest rate, inflation and credit risks that are associated with the underlying bonds owned by the Portfolio. When interest rates rise, bond prices fall. With a fixed income fund, when interest rates rise, the value of the fund’s existing bonds drops, which could negatively affect overall fund performance.
Expense Example
As a shareholder of the Portfolio, you incur two types of costs: (1) transaction costs and (2) ongoing costs, including management fees and other Portfolio expenses. This Example is intended to help you understand your ongoing costs (in dollars) of investing in the Portfolio and to compare these costs with the ongoing costs of investing in other mutual funds.
The Example is based on an investment of $1,000 invested at the beginning of the period and held for the entire period (January 1, 2007 to June 30, 2007).
Actual Expenses
The first line of the table below provides information about actual account values and actual expenses. You may use the information in this line, together with the amount you invested, to estimate the expenses that you paid over the period. Simply divide your account value by $1,000 (for example, an $8,600 account value divided by $1,000 = 8.6), then multiply the result by the number in the first line under the heading entitled “Expenses Paid During Period” to estimate the expenses you paid on your account during this period.
Hypothetical Example for Comparison Purposes
The second line of the table below provides information about hypothetical account values and hypothetical expenses based on the Portfolio’s actual expense ratio and an assumed rate of return of 5% per year before expenses, which is not the Portfolio’s actual return. The hypothetical account values and expenses may not be used to estimate the actual ending account balance or expenses you paid for the period. You may use this information to compare the ongoing costs of investing in the Portfolio and other funds. To do so, compare this 5% hypothetical example with the 5% hypothetical examples that appear in the shareholder reports of the other funds.
Please note that the expenses shown in the table are meant to highlight your ongoing costs only and do not reflect any transactional costs or separate account charges. Therefore, the second line of the table is useful in comparing ongoing costs only, and will not help you determine the relative total costs of owning different funds. In addition, if these transactional costs or separate account charges were included, your costs would have been higher.
| Beginning Account Value January 1, 2007 |
Ending Account Value June 30, 2007 |
Expenses June 30, 2007* | |||||||
| Actual |
$ | 1,000.00 | $ | 1,008.30 | $ | 1.49 | |||
| Hypothetical (5% return before expenses) |
$ | 1,000.00 | $ | 1,023.31 | $ | 1.51 | |||
| * | Expenses are equal to the Portfolio’s annualized expense ratio of 0.30%, multiplied by the average account value over the period, multiplied by 181/365 (to reflect the one-half year period). |
46
Select Bond Portfolio
Table of Contents
Select Bond Portfolio
Northwestern Mutual Series Fund, Inc.
Schedule of Investments
June 30, 2007 (unaudited)
| Corporate Bonds (31.0%) | Shares/ $ Par |
Value $ (000’s) | ||
| Aerospace/Defense (1.8%) |
||||
| BAE Systems |
1,850,000 | 1,809 | ||
| Boeing Capital Corp., 4.75%, 8/25/08 |
3,067,000 | 3,046 | ||
| General Dynamics Corp., 3.00%, 5/15/08 |
3,660,000 | 3,586 | ||
| General Dynamics Corp., 4.25%, 5/15/13 |
600,000 | 562 | ||
| L-3 Communications Corp., 6.375%, 10/15/15 |
3,050,000 | 2,882 | ||
| Litton Industries, Inc., 6.75%, 4/15/18 |
1,000,000 | 1,060 | ||
| Lockheed Martin Corp., 6.15%, 9/1/36 |
735,000 | 733 | ||
| Lockheed Martin Corp., 7.65%, 5/1/16 |
875,000 | 985 | ||
| Raytheon Co., |
3,680,000 | 3,667 | ||
| Total |
18,330 | |||
| Auto Manufacturing (0.2%) |
||||
| DaimlerChrysler NA Holdings Corp., |
1,940,000 | 1,945 | ||
| DaimlerChrysler NA Holdings Corp., |
240,000 | 303 | ||
| Total |
2,248 | |||
| Banking (3.6%) |
||||
| BA Covered Bond Issuer, 5.50%, 6/14/12 144A |
2,040,000 | 2,047 | ||
| Bank of America Corp., 5.42%, 3/15/17 |
2,350,000 | 2,253 | ||
| Bank of America Corp., 5.625%, 10/14/16 |
2,045,000 | 2,013 | ||
| Bank of America NA, 5.30%, 3/15/17 |
790,000 | 754 | ||
| Bank of New York, |
1,050,000 | 1,034 | ||
| Bank One Corp., |
2,835,000 | 2,776 | ||
| Barclays Bank PLC, 5.926%, 12/15/16 144A |
1,030,000 | 995 | ||
| BB&T Corp., |
650,000 | 598 | ||
| BNP Paribas, |
200,000 | 202 | ||
| Citigroup, Inc., |
4,445,000 | 4,306 | ||
| Credit Agricole SA, 6.637%, 5/31/17 144A |
425,000 | 413 | ||
| Credit Suisse Guernsey, Ltd., |
165,000 | 159 | ||
| Corporate Bonds (31.0%) | Shares/ $ Par |
Value $ (000’s) | ||
| Banking continued |
||||
| Deutsche Bank Capital Funding Trust, |
645,000 | 614 | ||
| JP Morgan Chase & Co., 6.125%, 6/27/17 |
365,000 | 368 | ||
| JPMorgan Chase Bank NA, 5.875%, 6/13/16 |
2,155,000 | 2,159 | ||
| M&I Marshall & Ilsley Bank, 5.15%, 2/22/12 |
1,770,000 | 1,744 | ||
| Mellon Bank NA, |
1,190,000 | 1,160 | ||
| National Australia Bank, Ltd., |
2,449,000 | 2,413 | ||
| Northern Trust Corp., 5.30%, 8/29/11 |
580,000 | 578 | ||
| PNC Funding Corp., 5.625%, 2/1/17 |
490,000 | 480 | ||
| State Street Bank and Trust Co., |
1,385,000 | 1,345 | ||
| UnionBanCal Corp., |
565,000 | 550 | ||
| US Bank NA, |
2,155,000 | 2,017 | ||
| Wachovia Corp., |
950,000 | 945 | ||
| Wachovia Corp., |
2,225,000 | 2,195 | ||
| Washington Mutual Bank, 5.95%, 5/20/13 |
770,000 | 769 | ||
| Wells Fargo Bank NA, 5.75%, 5/16/16 |
370,000 | 369 | ||
| Zions Bancorporation, 5.50%, 11/16/15 |
1,520,000 | 1,461 | ||
| Total |
36,717 | |||
| Beverage/Bottling (1.2%) |
||||
| Anheuser-Busch Companies, Inc., |
1,415,000 | 1,323 | ||
| Anheuser-Busch Companies, Inc., |
400,000 | 367 | ||
| Anheuser-Busch Companies, Inc., |
110,000 | 104 | ||
| Anheuser-Busch Companies, Inc., |
3,025,000 | 3,269 | ||
| Bottling Group LLC, 5.50%, 4/1/16 |
815,000 | 796 | ||
| Constellation Brands, Inc., 7.25%, 9/1/16 |
1,180,000 | 1,151 | ||
| Diageo Capital PLC, 4.375%, 5/3/10 |
420,000 | 408 | ||
| PepsiAmericas, Inc., 4.875%, 1/15/15 |
1,710,000 | 1,609 | ||
| Corporate Bonds (31.0%) | Shares/ $ Par |
Value $ (000’s) | ||
| Beverage/Bottling continued |
||||
| PepsiCo, Inc., |
765,000 | 756 | ||
| SABMiller PLC, |
1,965,000 | 1,998 | ||
| Total |
11,781 | |||
| Building Products (0.1%) |
||||
| CRH America, Inc., |
575,000 | 569 | ||
| Total |
569 | |||
| Cable/Media/Broadcasting/Satellite (1.7%) | ||||
| CBS Corp., |
330,000 | 339 | ||
| Clear Channel Communications, Inc., 6.25%, 3/15/11 |
1,430,000 | 1,376 | ||
| Comcast Corp., |
3,015,000 | 2,921 | ||
| Cox Communications, Inc., 4.625%, 1/15/10 |
565,000 | 552 | ||
| Historic TW, Inc., |
230,000 | 223 | ||
| News America, Inc., |
75,000 | 69 | ||
| News America, Inc., |
470,000 | 448 | ||
| Rogers Cable, Inc., |
2,825,000 | 2,739 | ||
| Rogers Cable, Inc., |
155,000 | 156 | ||
| TCI Communications, Inc., 8.75%, 8/1/15 |
735,000 | 850 | ||
| Time Warner Cable, Inc., 5.40%, 7/2/12 144A |
530,000 | 520 | ||
| Time Warner Cable, Inc., 6.55%, 5/1/37 144A |
135,000 | 130 | ||
| Time Warner Entertainment Co. LP, 7.25%, 9/1/08 |
3,110,000 | 3,168 | ||
| Time Warner Entertainment Co. LP, 8.375%, 3/15/23 |
690,000 | 792 | ||
| Time Warner Entertainment Co. LP, 8.875%, 10/1/12 |
1,500,000 | 1,695 | ||
| Viacom, Inc., |
765,000 | 764 | ||
| Total |
16,742 | |||
| Conglomerate/Diversified Manufacturing (0.4%) | ||||
| General Electric Co., 5.00%, 2/1/13 |
2,000,000 | 1,939 | ||
| Honeywell International, Inc., 5.30%, 3/15/17 |
620,000 | 596 | ||
| United Technologies Corp., 4.875%, 5/1/15 |
250,000 | 237 | ||
The Accompanying Notes are an Integral Part of the Financial Statements.
Select Bond Portfolio
47
Table of Contents
Select Bond Portfolio
| Corporate Bonds (31.0%) | Shares/ $ Par |
Value $ (000’s) | ||
| Conglomerate/Diversified Manufacturing continued | ||||
| United Technologies Corp., 6.35%, 3/1/11 |
770,000 | 792 | ||
| Total |
3,564 | |||
| Consumer Products (0.6%) |
||||
| The Clorox Co., |
1,750,000 | 1,696 | ||
| Fortune Brands, Inc., 5.375%, 1/15/16 |
630,000 | 585 | ||
| The Gillette Co., |
3,300,000 | 3,212 | ||
| The Procter & Gamble Co., 5.55%, 3/5/37 |
460,000 | 433 | ||
| Total |
5,926 | |||
| Electric Utilities (4.9%) |
||||
| AEP Texas Central Co., 6.65%, 2/15/33 |
575,000 | 596 | ||
| Carolina Power & Light, Inc., 5.15%, 4/1/15 |
320,000 | 307 | ||
| Carolina Power & Light, Inc., 6.50%, 7/15/12 |
255,000 | 264 | ||
| CenterPoint Energy Houston Electric LLC, 5.70%, 3/15/13 |
200,000 | 199 | ||
| CenterPoint Energy Houston Electric LLC, 6.95%, 3/15/33 |
210,000 | 225 | ||
| CMS Energy Corp., 6.875%, 12/15/15 |
970,000 | 983 | ||
| Consolidated Edison Co. of New York, |
485,000 | 470 | ||
| Consolidated Edison Co. of New York, |
430,000 | 419 | ||
| Consumer Energy Co., 4.80%, 2/17/09 |
3,675,000 | 3,631 | ||
| The Detroit Edison Co., 5.45%, 2/15/35 |
105,000 | 94 | ||
| The Detroit Edison Co., 5.70%, 10/1/37 |
25,000 | 23 | ||
| DTE Energy Co., |
195,000 | 193 | ||
| DTE Energy Co., |
4,470,000 | 4,671 | ||
| Duke Energy Corp., |
1,225,000 | 1,258 | ||
| Duquesne Light Holdings, Inc., 5.50%, 8/15/15 |
640,000 | 597 | ||
| Entergy Mississippi, Inc., 6.25%, 4/1/34 |
660,000 | 624 | ||
| Florida Power & Light Co., 5.625%, 4/1/34 |
775,000 | 726 | ||
| Florida Power Corp., 4.50%, 6/1/10 |
2,115,000 | 2,057 | ||
| Florida Power Corp., 4.80%, 3/1/13 |
100,000 | 96 | ||
| FPL Group Capital, Inc., 5.551%, 2/16/08 |
2,815,000 | 2,813 | ||
| Corporate Bonds (31.0%) | Shares/ $ Par |
Value $ (000’s) | ||
| Electric Utilities continued |
||||
| Indiana Michigan Power, 5.05%, 11/15/14 |
1,560,000 | 1,463 | ||
| Kiowa Power Partners LLC, 4.811%, 12/30/13 144A |
719,242 | 692 | ||
| Kiowa Power Partners LLC, 5.737%, 3/30/21 144A |
975,000 | 936 | ||
| MidAmerican Energy Holdings Co., |
195,000 | 184 | ||
| Monongahela Power Co., 5.70%, 3/15/17 144A |
615,000 | 602 | ||
| Nevada Power Co., |
1,200,000 | 1,172 | ||
| Nevada Power Co., |
750,000 | 764 | ||
| Nevada Power Co., |
1,155,000 | 1,167 | ||
| Northern States Power Co., 5.25%, 10/1/18 |
190,000 | 178 | ||
| Ohio Edison Co., |
1,000,000 | 1,022 | ||
| Oncor Electric Delivery Co., 6.375%, 1/15/15 |
985,000 | 999 | ||
| Oncor Electric Delivery Co., 7.00%, 9/1/22 |
645,000 | 674 | ||
| Pacific Gas & Electric Co., 5.80%, 3/1/37 |
190,000 | 177 | ||
| Pacific Gas & Electric Co., 6.05%, 3/1/34 |
795,000 | 770 | ||
| PacifiCorp, |
3,000,000 | 2,956 | ||
| PacifiCorp, |
630,000 | 591 | ||
| PPL Electric Utilities Corp., 4.30%, 6/1/13 |
1,800,000 | 1,651 | ||
| PPL Electric Utilities Corp., 5.875%, 8/15/07 |
485,000 | 485 | ||
| PPL Electric Utilities Corp., 6.25%, 8/15/09 |
145,000 | 147 | ||
| PPL Energy Supply LLC, 6.00%, 12/15/36 |
310,000 | 279 | ||
| Progress Energy, Inc., 6.85%, 4/15/12 |
710,000 | 744 | ||
| Public Service Co. of Colorado, 5.50%, 4/1/14 |
955,000 | 940 | ||
| Public Service Electric & Gas Co., 5.00%, 1/1/13 |
1,000,000 | 967 | ||
| Public Service Electric & Gas Co., 5.70%, 12/1/36 |
1,160,000 | 1,089 | ||
| Puget Sound Energy, Inc., 3.363%, 6/1/08 |
1,380,000 | 1,353 | ||
| Puget Sound Energy, Inc., 6.274%, 3/15/37 |
765,000 | 754 | ||
| Sierra Pacific Power Co., 6.75%, 7/1/37 |
400,000 | 406 | ||
| Southern California Edison Co., |
1,495,000 | 1,412 | ||
| Corporate Bonds (31.0%) | Shares/ $ Par |
Value $ (000’s) | ||
| Electric Utilities continued |
||||
| Southern California |
230,000 | 212 | ||
| Tampa Electric Co., |
320,000 | 310 | ||
| Tampa Electric Co., |
385,000 | 393 | ||
| Toledo Edison Co. |
1,925,000 | 1,805 | ||
| Union Electric Co., |
140,000 | 143 | ||
| Virginia Electric & |
1,890,000 | 1,806 | ||
| Xcel Energy, Inc., |
590,000 | 597 | ||
| Total |
50,086 | |||
| Electronics (0.0%) |
||||
| Cisco Systems, Inc., |
200,000 | 195 | ||
| Total |
195 | |||
| Food Processors (0.8%) |
||||
| Delhaize America, Inc., 6.50%, 6/15/17 144A |
150,000 | 151 | ||
| General Mills, Inc., |
890,000 | 867 | ||
| Kellogg Co., |
3,610,000 | 3,733 | ||
| Kraft Foods, Inc., |
385,000 | 370 | ||
| Kraft Foods, Inc., |
2,585,000 | 2,627 | ||
| Total |
7,748 | |||
| Gaming/Lodging/Leisure (0.2%) |
||||
| Harrah’s Operating Co., Inc., 5.75%, 10/1/17 |
420,000 | 336 | ||
| Royal Caribbean Cruises, Ltd., 7.00%, 6/15/13 |
1,180,000 | 1,185 | ||
| Total |
1,521 | |||
| Gas Pipelines (0.5%) |
||||
| Consolidated Natural Gas Co., 5.00%, 12/1/14 |
1,340,000 | 1,266 | ||
| El Paso Natural Gas Co., 5.95%, 4/15/17 144A |
160,000 | 155 | ||
| Kinder Morgan Energy Partners LP, |
1,285,000 | 1,342 | ||
| Kinder Morgan Finance, 5.35%, 1/5/11 |
1,765,000 | 1,726 | ||
| Southern Natural Gas Co., 5.90%, 4/1/17 144A |
175,000 | 169 | ||
| Total |
4,658 | |||
| Independent Finance (0.6%) |
||||
| GMAC LLC, |
1,545,000 | 1,469 | ||
| HSBC Finance Corp., 4.125%, 11/16/09 |
2,330,000 | 2,262 | ||
The Accompanying Notes are an Integral Part of the Financial Statements.
48
Select Bond Portfolio
Table of Contents
Select Bond Portfolio
| Corporate Bonds (31.0%) | Shares/ $ Par |
Value $ (000’s) | ||
| Independent Finance continued |
||||
| International Lease Finance Corp., |
1,485,000 | 1,429 | ||
| iStar Financial, Inc., |
1,405,000 | 1,352 | ||
| Total |
6,512 | |||
| Industrials — Other (0.3%) |
||||
| Centex Corp., |
545,000 | 520 | ||
| Centex Corp., |
245,000 | 257 | ||
| DR Horton, Inc., |
385,000 | 361 | ||
| DR Horton, Inc., |
110,000 | 114 | ||
| KB HOME, |
1,160,000 | 1,154 | ||
| Lennar Corp., |
805,000 | 794 | ||
| Total |
3,200 | |||
| Information/Data Technology (0.1%) | ||||
| Seagate Technology HDD Holdings, 6.80%, 10/1/16 |
510,000 | 490 | ||
| Siemens AG, |
495,000 | 488 | ||
| Total |
978 | |||
| Machinery (0.1%) |
||||
| John Deere Capital Corp., 4.50%, 8/25/08 |
825,000 | 816 | ||
| John Deere Capital Corp., 5.50%, 4/13/17 |
400,000 | 390 | ||
| Total |
1,206 | |||
| Metals/Mining (0.3%) |
||||
| Alcoa, Inc., |
1,000,000 | 954 | ||
| Alcoa, Inc., |
720,000 | 682 | ||
| Alcoa, Inc., |
1,140,000 | 1,061 | ||
| Total |
2,697 | |||
| Mortgage Banking (0.4%) |
||||
| Countrywide Financial Corp., 5.80%, 6/7/12 |
575,000 | 571 | ||
| Residential Capital LLC, 6.00%, 2/22/11 |
1,715,000 | 1,659 | ||
| Residential Capital LLC, 6.50%, 4/17/13 |
1,500,000 | 1,450 | ||
| Total |
3,680 | |||
| Natural Gas Distributors (0.1%) |
||||
| NiSource Finance Corp., 5.40%, 7/15/14 |
590,000 | 567 | ||
| Total |
567 | |||
| Corporate Bonds (31.0%) | Shares/ $ Par |
Value $ (000’s) | ||
| Oil and Gas (2.5%) |
||||
| Anadarko Finance Co., 7.50%, 5/1/31 |
785,000 | 843 | ||
| Anadarko Petroleum Corp., 5.95%, 9/15/16 |
570,000 | 557 | ||
| Anadarko Petroleum Corp., 6.45%, 9/15/36 |
350,000 | 337 | ||
| Apache Corp., |
160,000 | 156 | ||
| Apache Corp., |
190,000 | 181 | ||
| Canadian Natural Resources, Ltd., |
290,000 | 281 | ||
| Canadian Natural Resources, Ltd., |
290,000 | 274 | ||
| Canadian Natural Resources, Ltd., |
240,000 | 236 | ||
| Conoco Funding Co., 6.35%, 10/15/11 |
3,105,000 | 3,203 | ||
| ConocoPhilips Canada Funding Co., |
565,000 | 559 | ||
| ConocoPhilips Canada Funding Co., |
360,000 | 354 | ||
| Devon Energy Corp., 7.95%, 4/15/32 |
200,000 | 234 | ||
| Devon Financing Corp. ULC, 6.875%, 9/30/11 |
1,830,000 | 1,910 | ||
| Encana Holdings Finance Corp., 5.80%, 5/1/14 |
760,000 | 756 | ||
| Hess Corp., |
260,000 | 273 | ||
| Marathon Oil Corp., 6.125%, 3/15/12 |
1,000,000 | 1,018 | ||
| Nexen, Inc., |
1,390,000 | 1,247 | ||
| Occidental Petroleum, 4.00%, 11/30/07 |
1,500,000 | 1,492 | ||
| Pemex Project Funding Master Trust, |
2,545,000 | 2,498 | ||
| Petro-Canada, |
690,000 | 635 | ||
| Pioneer Natural Resource, 6.875%, 5/1/18 |
1,340,000 | 1,270 | ||
| Suncoc, Inc., |
625,000 | 602 | ||
| Suncor Energy, Inc., 6.50%, 6/15/38 |
330,000 | 332 | ||
| Talisman Energy, Inc., 5.85%, 2/1/37 |
1,590,000 | 1,403 | ||
| Tesoro Corp., |
1,590,000 | 1,578 | ||
| Tesoro Corp., |
2,045,000 | 2,000 | ||
| Valero Energy Corp., 6.125%, 6/15/17 |
205,000 | 204 | ||
| Valero Energy Corp., 6.625%, 6/15/37 |
1,005,000 | 1,000 | ||
| Corporate Bonds (31.0%) | Shares/ $ Par |
Value $ (000’s) | ||
| Oil and Gas continued |
||||
| XTO Energy, Inc., |
195,000 | 186 | ||
| XTO Energy, Inc., |
100,000 | 102 | ||
| Total |
25,721 | |||
| Other Finance (0.3%) |
||||
| Capmark Financial Group, 6.30%, 5/10/17 144A |
255,000 | 251 | ||
| SLM Corp., |
425,000 | 364 | ||
| SLM Corp., |
3,020,000 | 2,796 | ||
| Total |
3,411 | |||
| Other Services (0.0%) |
||||
| Waste Management, Inc., 5.00%, 3/15/14 |
540,000 | 504 | ||
| Total |
504 | |||
| Paper and Forest Products (0.0%) |
||||
| Weyerhaeuser Co., 7.375%, 3/15/32 |
195,000 | 198 | ||
| Total |
198 | |||
| Pharmaceuticals (0.3%) |
||||
| Abbott Laboratories, 3.75%, 3/15/11 |
2,480,000 | 2,337 | ||
| Wyeth, 5.95%, 4/1/37 |
540,000 | 516 | ||
| Total |
2,853 | |||
| Property and Casualty Insurance (0.5%) | ||||
| Berkley (WR) Corp., 9.875%, 5/15/08 |
2,860,000 | 2,948 | ||
| Berkshire Hathaway Finance, 3.40%, 7/2/07 |
1,500,000 | 1,500 | ||
| The Progressive Corp., 6.70%, 6/15/37 |
245,000 | 243 | ||
| The Travelers Companies, Inc., 6.25%, 6/15/37 |
350,000 | 339 | ||
| Total |
5,030 | |||
| Railroads (1.3%) | ||||
| Burlington North Santa Fe, 6.125%, 3/15/09 |
3,000,000 | 3,032 | ||
| Burlington North Santa Fe, 6.15%, 5/1/37 |
325,000 | 316 | ||
| Canadian Pacific Railway Co., 5.95%, 5/15/37 |
290,000 | 273 | ||
| CSX Corp., 5.60%, 5/1/17 |
1,000,000 | 967 | ||
| CSX Corp., 6.15%, 5/1/37 |
650,000 | 624 | ||
| Norfolk Southern Corp., 6.20%, 4/15/09 |
565,000 | 571 | ||
| Union Pacific Corp., 3.875%, 2/15/09 |
3,000,000 | 2,932 | ||
| Union Pacific Corp., 5.65%, 5/1/17 |
840,000 | 816 | ||
| Union Pacific Corp., 6.65%, 1/15/11 |
565,000 | 583 | ||
| Union Pacific Corp., 7.375%, 9/15/09 |
3,000,000 | 3,130 | ||
| Total |
13,244 | |||
The Accompanying Notes are an Integral Part of the Financial Statements.
Select Bond Portfolio
49
Table of Contents
Select Bond Portfolio
| Corporate Bonds (31.0%) | Shares/ $ Par |
Value $ (000’s) | ||
| Real Estate Investment Trusts (1.6%) | ||||
| Archstone-Smith Operating Trust, |
575,000 | 569 | ||
| AvalonBay Communities, Inc., 5.50%, 1/15/12 |
360,000 | 358 | ||
| BRE Properties, Inc., 5.50%, 3/15/17 |
315,000 | 303 | ||
| Colonial Realty LP, 6.05%, 9/1/16 |
255,000 | 254 | ||
| Developers Diversified Realty Corp., |
1,000,000 | 980 | ||
| Duke Realty LP, |
615,000 | 613 | ||
| ERP Operating LP, |
1,325,000 | 1,277 | ||
| First Industrial LP, |
1,275,000 | 1,264 | ||
| Health Care Property Investors, Inc., |
290,000 | 284 | ||
| HRPT Properties Trust, 5.75%, 11/1/15 |
800,000 | 782 | ||
| ProLogis, 5.50%, 3/1/13 |
1,380,000 | 1,364 | ||
| ProLogis, 5.75%, 4/1/16 |
865,000 | 853 | ||
| Rouse Co. LP/TRC Co-Issuer, Inc., |
2,700,000 | 2,697 | ||
| Simon Property Group LP, 5.375%, 6/1/11 |
2,370,000 | 2,352 | ||
| Simon Property Group LP, 5.60%, 9/1/11 |
590,000 | 590 | ||
| Simon Property Group LP, 6.10%, 5/1/16 |
1,155,000 | 1,169 | ||
| Total |
15,709 | |||
| Retail Food and Drug (0.3%) | ||||
| CVS/Caremark Corp., 4.875%, 9/15/14 |
730,000 | 680 | ||
| CVS/Caremark Corp., 6.125%, 8/15/16 |
660,000 | 654 | ||
| CVS/Caremark Corp., 6.25%, 6/1/27 |
1,475,000 | 1,429 | ||
| The Kroger Co., |
65,000 | 66 | ||
| The Kroger Co., |
260,000 | 267 | ||
| Total |
3,096 | |||
| Retail Stores (1.8%) | ||||
| Costco Wholesale Corp., 5.30%, 3/15/12 |
170,000 | 169 | ||
| Costco Wholesale Corp., 5.50%, 3/15/17 |
1,665,000 | 1,623 | ||
| Federated Department Stores, Inc., |
3,790,000 | 3,826 | ||
| Federated Retail Holdings, Inc., 5.35%, 3/15/12 |
460,000 | 452 | ||
| Federated Retail Holdings, Inc., 5.90%, 12/1/16 |
385,000 | 375 | ||
| Corporate Bonds (31.0%) | Shares/ $ Par |
Value $ (000’s) | ||
| Retail Stores continued | ||||
| The Home Depot, Inc., 5.875%, 12/16/36 |
3,860,000 | 3,439 | ||
| JC Penney Corp., Inc., 5.75%, 2/15/18 |
105,000 | 101 | ||
| JC Penney Corp., Inc., 6.375%, 10/15/36 |
210,000 | 200 | ||
| JC Penney Corp., Inc., 6.875%, 10/15/15 |
490,000 | 506 | ||
| JC Penney Corp., Inc., 7.95%, 4/1/17 |
420,000 | 466 | ||
| Macy’s Retail Holdings, Inc., 7.00%, 2/15/28 |
95,000 | 92 | ||
| May Department Stores Co., 6.65%, 7/15/24 |
65,000 | 61 | ||
| Target Corp., 5.375%, 5/1/17 |
1,260,000 | 1,206 | ||
| Target Corp., |
4,555,000 | 4,549 | ||
| Wal-Mart Stores, Inc., 5.375%, 4/5/17 |
360,000 | 350 | ||
| Wal-Mart Stores, Inc., 5.875%, 4/5/27 |
935,000 | 904 | ||
| Total |
18,319 | |||
| Security Brokers and Dealers (1.5%) | ||||
| Goldman Sachs Group, Inc., 5.15%, 1/15/14 |
3,420,000 | 3,286 | ||
| Goldman Sachs Group, Inc., 5.625%, 1/15/17 |
2,540,000 | 2,434 | ||
| Goldman Sachs Group, Inc., 5.75%, 10/1/16 |
390,000 | 381 | ||
| Lehman Brothers Holdings, Inc., |
1,935,000 | 1,880 | ||
| Lehman Brothers Holdings, Inc., |
765,000 | 754 | ||
| Merrill Lynch & Co., Inc., 5.70%, 5/2/17 |
3,310,000 | 3,187 | ||
| Merrill Lynch & Co., Inc., 6.22%, 9/15/26 |
240,000 | 234 | ||
| Morgan Stanley, |
1,735,000 | 1,661 | ||
| Morgan Stanley, |
705,000 | 668 | ||
| Morgan Stanley, |
110,000 | 107 | ||
| Morgan Stanley, |
795,000 | 792 | ||
| Total |
15,384 | |||
| Telecommunications (2.5%) |
||||
| AT&T Corp., |
1,470,000 | 1,747 | ||
| AT&T Corp., |
1,500,000 | 1,597 | ||
| AT&T, Inc., |
1,625,000 | 1,550 | ||
| British Telecom PLC, 8.625%, 12/15/30 |
410,000 | 537 | ||
| Cingular Wireless LLC, 7.125%, 12/15/31 |
1,535,000 | 1,635 | ||
| Corporate Bonds (31.0%) | Shares/ $ Par |
Value $ (000’s) | ||
| Telecommunications continued |
||||
| Deutsche Telekom International Finance, 5.75%, 3/23/16 |
480,000 | 468 | ||
| Embarq Corp., |
610,000 | 622 | ||
| Embarq Corp., |
660,000 | 664 | ||
| Embarq Corp., |
635,000 | 644 | ||
| France Telecom SA, |
800,000 | 1,005 | ||
| Rogers Wireless, Inc., 6.375%, 3/1/14 |
1,250,000 | 1,263 | ||
| Sprint Capital Corp., |
2,150,000 | 2,129 | ||
| Sprint Capital Corp., 8.375%, 3/15/12 |
1,880,000 | 2,048 | ||
| Sprint Capital Corp., |
330,000 | 371 | ||
| Telecom Italia Capital, 4.00%, 1/15/10 |
1,565,000 | 1,504 | ||
| Telecom Italia Capital, 6.20%, 7/18/11 |
1,225,000 | 1,240 | ||
| Verizon Communications, Inc., 5.50%, 4/1/17 |
1,450,000 | 1,397 | ||
| Verizon Communications, Inc., 5.55%, 2/15/16 |
1,845,000 | 1,798 | ||
| Verizon Global Funding Corp., 5.85%, 9/15/35 |
1,135,000 | 1,041 | ||
| Vodafone Group PLC, 5.50%, 6/15/11 |
2,035,000 | 2,019 | ||
| Total |
25,279 | |||
| Tobacco (0.2%) |
||||
| Reynolds America, Inc., 6.75%, 6/15/17 |
150,000 | 152 | ||
| Reynolds America, Inc., 7.25%, 6/15/37 |
150,000 | 154 | ||
| Reynolds America, Inc., 7.625%, 6/1/16 |
1,735,000 | 1,838 | ||
| Total |
2,144 | |||
| Vehicle Parts (0.2%) |
||||
| Johnson Controls, Inc., 5.25%, 1/15/11 |
565,000 | 559 | ||
| Johnson Controls, Inc., 5.50%, 1/15/16 |
750,000 | 726 | ||
| Johnson Controls, Inc., 6.00%, 1/15/36 |
360,000 | 339 | ||
| Total |
1,624 | |||
| Yankee Sovereign (0.1%) |
||||
| United Mexican States, 5.625%, 1/15/17 |
1,480,000 | 1,449 | ||
| Total |
1,449 | |||
| Total Corporate Bonds |
312,890 | |||
The Accompanying Notes are an Integral Part of the Financial Statements.
50
Select Bond Portfolio
Table of Contents
Select Bond Portfolio
| Governments (12.4%) | Shares/ $ Par |
Value $ (000’s) | ||
| Governments (12.4%) |
||||
| Aid-Israel, |
1,910,000 | 1,892 | ||
| Housing & Urban Development, |
4,000,000 | 4,085 | ||
| Housing & Urban Development, |
3,000,000 | 3,089 | ||
| Overseas Private Investment, |
2,158,320 | 2,047 | ||
| (e)Tennessee Valley Authority Stripped, 8.25%, 4/15/42 |
3,600,000 | 2,886 | ||
| (g)US Treasury, |
12,780,000 | 12,542 | ||
| US Treasury, |
29,900,000 | 28,668 | ||
| US Treasury, |
7,803,000 | 7,065 | ||
| (g)US Treasury, |
20,000,000 | 19,370 | ||
| US Treasury, |
1,410,000 | 1,405 | ||
| (g)US Treasury, |
11,225,000 | 11,137 | ||
| (g)US Treasury, |
15,124,000 | 14,260 | ||
| US Treasury, |
16,500,000 | 16,455 | ||
| Total Governments |
124,901 | |||
| Structured Products (53.3%) | ||||
| Structured Products (53.3%) |
||||
| AEP Texas Central Transition Funding, 5.306%, 7/1/20 |
15,910,000 | 15,146 | ||
| Asset Securitization Corp., Series 1997-D5, Class PS1, |
66,520,999 | 2,225 | ||
| Banc of America Funding Corp., Series 2007-1, Class TA1A, |
3,086,228 | 3,086 | ||
| Banc of America Funding Corp., Series 2007-4, Class TA1A, |
3,998,233 | 3,998 | ||
| Banc of America Mortgage Securities, Series 2004-G, Class 2AG, |
3,817,000 | 3,761 | ||
| Bear Stearns Adjustable Rate Mortgage Trust, Series 2004-4, |
8,024,000 | 7,864 | ||
| Structured Products (53.3%) | Shares/ $ Par |
Value $ (000’s) | ||
| Structured Products continued |
||||
| Capital One Auto Finance Trust, Series 2006-A, Class A2, 5.31%, 5/15/09 |
1,169,566 | 1,170 | ||
| CenterPoint Energy Transition Bond Co. LLC, Series 2005-A, Class A4, 5.17%, 8/1/19 |
1,730,000 | 1,678 | ||
| Chase Manhattan Auto Owner Trust, Series 2004-A, Class A4, 2.83%, 9/15/10 |
2,564,092 | 2,531 | ||
| Chase Manhattan Auto Owner Trust, Series 2005-A, Class A3, 3.87%, 6/15/09 |
2,793,269 | 2,771 | ||
| Criimi Mae Commercial Mortgage Trust, Series 1998-C1, Class B, 7.00%, 6/2/33 144A |
4,000,000 | 4,040 | ||
| DLJ Commercial Mortgage Corp., Series 1998-CF1, Class S, 1.019%, 2/18/31 IO |
67,435,630 | 776 | ||
| DLJ Mortgage Acceptance Corp., Series 1997-CF2, |
26,075,566 | 338 | ||
| Fannie Mae Whole Loan, 6.25%, 5/25/42 |
5,946,792 | 5,979 | ||
| Federal Home Loan Mortgage Corp., |
1,685,787 | 1,562 | ||
| Federal Home Loan Mortgage Corp., |
2,028,036 | 1,930 | ||
| Federal Home Loan Mortgage Corp., |
5,612,479 | 5,329 | ||
| Federal Home Loan Mortgage Corp., |
2,900,313 | 2,810 | ||
| Federal Home Loan Mortgage Corp., |
495,986 | 480 | ||
| Federal Home Loan Mortgage Corp., |
1,782,737 | 1,724 | ||
| Federal Home Loan Mortgage Corp., |
2,474,913 | 2,394 | ||
| Federal Home Loan Mortgage Corp., |
1,104,574 | 1,067 | ||
| Federal Home Loan Mortgage Corp., |
632,029 | 595 | ||
| Federal Home Loan Mortgage Corp., |
8,810,252 | 8,280 | ||
| Structured Products (53.3%) | Shares/ $ Par |
Value $ (000’s) | ||
| Structured Products continued |
||||
| Federal Home Loan Mortgage Corp., |
12,591,710 | 11,834 | ||
| Federal Home Loan Mortgage Corp., |
29,363,183 | 27,597 | ||
| Federal Home Loan Mortgage Corp., |
925,404 | 914 | ||
| Federal Home Loan Mortgage Corp., |
2,470,592 | 2,438 | ||
| Federal Home Loan Mortgage Corp., |
415,090 | 410 | ||
| Federal Home Loan Mortgage Corp., |
3,459,896 | 3,410 | ||
| Federal Home Loan Mortgage Corp., |
2,912,291 | 2,869 | ||
| Federal Home Loan Mortgage Corp., |
3,683,017 | 3,627 | ||
| Federal Home Loan Mortgage Corp., |
2,310,311 | 2,233 | ||
| Federal Home Loan Mortgage Corp., |
20,190,442 | 19,483 | ||
| Federal Home Loan Mortgage Corp., |
11,932,740 | 11,509 | ||
| Federal Home Loan Mortgage Corp., |
6,223,216 | 6,002 | ||
| Federal Home Loan Mortgage Corp., |
5,498,710 | 5,443 | ||
| Federal Home Loan Mortgage Corp., |
6,288,208 | 6,224 | ||
| Federal Home Loan Mortgage Corp. Multifamily Structured Pass Through, |
6,786,169 | 6,801 | ||
| Federal Home Loan Mortgage Corp. TBA, 5.00%, 7/1/37 |
7,216,000 | 6,763 | ||
| Federal Home Loan Mortgage Corp. TBA, 6.00%, 8/1/37 |
21,880,000 | 21,654 | ||
| Federal Home Loan Mortgage Corp. TBA, 6.50%, 8/1/37 |
11,389,000 | 11,492 | ||
| Federal National Mortgage Association, |
1,132,635 | 1,051 | ||
| Federal National Mortgage Association, |
6,023,429 | 5,731 | ||
The Accompanying Notes are an Integral Part of the Financial Statements.
Select Bond Portfolio
51
Table of Contents
Select Bond Portfolio
| Structured Products (53.3%) | Shares/ $ Par |
Value $ (000’s) | ||
| Structured Products continued |
||||
| Federal National Mortgage Association, |
1,252,767 | 1,192 | ||
| Federal National Mortgage Association, |
651,589 | 620 | ||
| Federal National Mortgage Association, |
3,211,181 | 3,048 | ||
| Federal National Mortgage Association, |
4,384,278 | 4,162 | ||
| Federal National Mortgage Association, |
7,045,000 | 6,413 | ||
| Federal National Mortgage Association, 5.00%, 3/1/20 |
2,093,260 | 2,027 | ||
| Federal National Mortgage Association, |
890,334 | 861 | ||
| Federal National Mortgage Association, |
10,233,257 | 9,897 | ||
| Federal National Mortgage Association, |
2,405,327 | 2,260 | ||
| Federal National Mortgage Association, |
3,903,367 | 3,667 | ||
| Federal National Mortgage Association, |
2,582,764 | 2,427 | ||
| Federal National Mortgage Association, |
2,668,057 | 2,596 | ||
| Federal National Mortgage Association, |
7,772,090 | 7,634 | ||
| Federal National Mortgage Association, |
1,742,945 | 1,713 | ||
| Federal National Mortgage Association, |
1,954,000 | 1,951 | ||
| Federal National Mortgage Association, |
1,972,600 | 1,944 | ||
| Federal National Mortgage Association, |
1,553,859 | 1,504 | ||
| Federal National Mortgage Association, |
4,915,555 | 4,754 | ||
| Federal National Mortgage Association, |
1,153,196 | 1,115 | ||
| Federal National Mortgage Association, |
3,058,326 | 2,957 | ||
| Federal National Mortgage Association, |
17,359,943 | 16,787 | ||
| Structured Products (53.3%) | Shares/ $ Par |
Value $ (000’s) | ||
| Structured Products continued |
||||
| Federal National Mortgage Association, |
5,142,094 | 4,972 | ||
| Federal National Mortgage Association, |
13,722,335 | 13,268 | ||
| Federal National Mortgage Association, |
11,359,799 | 10,984 | ||
| Federal National Mortgage Association, |
5,048,814 | 4,872 | ||
| Federal National Mortgage Association, |
2,776,077 | 2,677 | ||
| Federal National Mortgage Association, |
19,375,989 | 18,388 | ||
| Federal National Mortgage Association, |
321,564 | 319 | ||
| Federal National Mortgage Association, |
55,429 | 55 | ||
| Federal National Mortgage Association, |
5,451,322 | 5,402 | ||
| Federal National Mortgage Association, |
507,157 | 503 | ||
| Federal National Mortgage Association, |
2,050,303 | 2,032 | ||
| Federal National Mortgage Association, 6.00%, 11/1/35 |
5,085,335 | 5,040 | ||
| Federal National Mortgage Association, |
3,689,106 | 3,652 | ||
| Federal National Mortgage Association, |
343,351 | 350 | ||
| Federal National Mortgage Association, |
2,167,873 | 2,191 | ||
| Federal National Mortgage Association, |
3,725,505 | 3,765 | ||
| Federal National Mortgage Association, |
1,241,221 | 1,253 | ||
| Federal National Mortgage Association, |
177,943 | 180 | ||
| Federal National Mortgage Association, |
675,247 | 682 | ||
| Federal National Mortgage Association, |
728,842 | 736 | ||
| Federal National Mortgage Association, |
8,613,575 | 8,695 | ||
| Structured Products (53.3%) | Shares/ $ Par |
Value $ (000’s) | ||
| Structured Products continued |
||||
| Federal National Mortgage Association, |
1,130,019 | 1,153 | ||
| Federal National Mortgage Association — Aces, Series 2006-M1, Class B, |
6,949,000 | 6,845 | ||
| Federal National Mortgage Association TBA, 6.00%, 7/1/36 |
30,377,000 | 30,046 | ||
| Final Maturity Amortizing Notes, 4.45%, 8/25/12 |
6,676,337 | 6,412 | ||
| First Horizon Alternative Mortgage Securities Trust, Series 2004-FA1, 6.25%, 10/25/34 |
3,186,527 | 3,203 | ||
| First Union-Lehman Brothers Commercial Mortgage Trust II, Commerical Mortgage Pass-Through Certificates, Series 1997-C2, |
1,910,000 | 1,918 | ||
| First Union National Bank Commercial Mortgage Trust, Series 1999-C4, Class E, 8.18%, 12/15/31 144A |
3,100,000 | 3,260 | ||
| Freddie Mac, Series 3065, Class TN, |
2,063,366 | 1,972 | ||
| Freddie Mac, Series 3248, Class LN, |
4,450,000 | 4,230 | ||
| Freddie Mac, Series 2840, Class LK, |
1,309,329 | 1,319 | ||
| Government National Mortgage Association, 5.50%, 10/15/31 |
57,262 | 56 | ||
| Government National Mortgage Association, 5.50%, 11/15/31 |
14,196 | 14 | ||
| Government National Mortgage Association, 5.50%, 12/15/31 |
197,669 | 193 | ||
| Government National Mortgage Association, 5.50%, 1/15/32 |
526,468 | 512 | ||
| Government National Mortgage Association, 5.50%, 2/15/32 |
183,064 | 179 | ||
| Government National Mortgage Association, 5.50%, 3/15/32 |
165,519 | 161 | ||
| Government National Mortgage Association, 5.50%, 4/15/32 |
17,674 | 17 | ||
The Accompanying Notes are an Integral Part of the Financial Statements.
52
Select Bond Portfolio
Table of Contents
Select Bond Portfolio
| Structured Products (53.3%) | Shares/ $ Par |
Value $ (000’s) | ||
| Structured Products continued |
||||
| Government National Mortgage Association, 5.50%, 7/15/32 |
31,295 | 30 | ||
| Government National Mortgage Association, 5.50%, 9/15/32 |
4,182,776 | 4,069 | ||
| Greenwich Capital Commerical Funding Corp., Series 2006-FL4A, Class A1, |
2,026,730 | 2,028 | ||
| Honda Auto Receivables Owner Trust, Series 2004-1, Class A4, 3.06%, 10/21/09 |
1,605,408 | 1,596 | ||
| Honda Auto Receivables Owner Trust, Series 2005-1, Class A3, 3.53%, 10/21/08 |
1,351,633 | 1,348 | ||
| John Deere Owner Trust, Series 2007-A, Class A3, |
13,100,000 | 13,029 | ||
| Massachusetts RRB Special Purpose Trust, Series 2001-1, Class A, 6.53%, 6/1/15 |
1,204,135 | 1,244 | ||
| Merrill Lynch Alternative Note Asset, Series 2007-A1, Class A2A, 5.391%, 1/25/37 |
3,314,668 | 3,314 | ||
| Midland Realty Acceptance Corp., Series 1996-C2, |
1,142,351 | 0 | ||
| Mid-State Trust, Series 6, Class A3, 7.54%, 7/1/35 |
427,962 | 451 | ||
| Nissan Auto Receivables Owner Trust, Series 2006-A, Class A3, 4.74%, 9/15/09 |
20,500,000 | 20,416 | ||
| RMF Commercial Mortgage Pass-Through, Series 1997-1, Class F, 7.47%, 1/15/19 144A |
1,800,000 | 900 | ||
| Rural Housing Trust 1987-1, Series 1, |
56,346 | 56 | ||
| TBW Mortgage Backed Pass Through Certification, Series 2007-1, Class A1, 5.41%, 3/25/37 |
3,193,748 | 3,194 | ||
| Wachovia Auto Loan Owner Trust, Series 2006-2A, Class A2, 5.35%, 5/20/10 |
3,494,653 | 3,494 | ||
| Structured Products (53.3%) | Shares/ $ Par |
Value $ (000’s) | ||
| Structured Products continued |
||||
| Washington Mutual Asset Securities Corp., Series 2003-C1A, Class A, 3.83%, 1/25/35 144A |
3,591,767 | 3,474 | ||
| Washington Mutual Asset Securities Corp., Series 2003-AR10, Class A6, |
1,912,000 | 1,883 | ||
| Wells Fargo Mortgage Backed Securities, Series 2004-N, |
5,728,000 | 5,579 | ||
| WFS Financial Owner Trust, Series 2003-3, Class A4, |
2,678,598 | 2,671 | ||
| Total Structured Products (Cost: $548,751) |
538,830 | |||
| Money Market Investments (14.4%) | ||||
| Autos (2.0%) |
||||
| (b)Daimler Chrysler Auto, 5.27%, 7/19/07 |
5,000,000 | 4,986 | ||
| (b)Daimler Chrysler Auto, 5.28%, 7/12/07 |
5,000,000 | 4,991 | ||
| (b)Fcar Owner Trust I, 5.30%, 7/27/07 |
5,000,000 | 4,980 | ||
| (b)New Center Asset Trust, 5.26%, 7/9/07 |
5,000,000 | 4,994 | ||
| Total |
19,951 | |||
| Federal Government & Agencies (0.1%) | ||||
| (b)Federal National Mortgage Association, 5.10%, 9/24/07 |
1,000,000 | 988 | ||
| Total |
988 | |||
| Finance Lessors (3.5%) |
||||
| (b)American General Financial Corp, |
5,000,000 | 4,991 | ||
| Ranger Funding Co. LLC, 5.26%, 8/2/07 |
5,000,000 | 4,976 | ||
| Ranger Funding Co. LLC, 5.29%, 7/20/07 |
5,000,000 | 4,985 | ||
| Thunder Bay Funding, Inc., 5.28%, 7/16/07 |
5,000,000 | 4,988 | ||
| Thunder Bay Funding, Inc., 5.28%, 7/25/07 |
5,000,000 | 4,982 | ||
| Windmill Funding Corp., 5.26%, 7/19/07 |
5,000,000 | 4,986 | ||
| Windmill Funding Corp., 5.27%, 7/31/07 |
5,000,000 | 4,977 | ||
| Total |
34,885 | |||
| Finance Services (4.3%) |
||||
| (b)Alpine Securitization, 5.25%, 7/12/07 |
10,000,000 | 9,983 | ||
| (b)Barton Capital LLC, 5.30%, 7/10/07 |
10,000,000 | 9,985 | ||
| Money Market Investments (14.4%) |
Shares/ $ Par |
Value $ (000’s) |
|||
| Finance Services continued |
|||||
| (b)Bryant Park Funding LLC, 5.27%, 8/15/07 |
5,000,000 | 4,966 | |||
| (b)Bryant Park Funding LLC, 5.28%, 7/12/07 |
5,000,000 | 4,991 | |||
| (b)Ciesco LLC, 5.30%, 7/11/07 |
5,000,000 | 4,992 | |||
| (b)John Deere Capital Corp., 5.26%, 7/19/07 |
10,000,000 | 9,972 | |||
| Total |
44,889 | ||||
| Miscellaneous Business Credit Institutions (1.0%) |
| ||||
| Park Avenue Receivables, |
5,000,000 | 4,988 | |||
| Park Avenue Receivables, |
5,002,000 | 4,993 | |||
| Total |
9,981 | ||||
| National Commercial Banks (0.5%) |
| ||||
| UBS Finance LLC, 5.35%, 7/2/07 |
4,940,000 | 4,939 | |||
| Total |
4,939 | ||||
| Personal Credit Institutions (1.0%) |
| ||||
| (b)American Express Credit, |
10,000,000 | 9,983 | |||
| Total |
9,983 | ||||
| Short Term Business Credit (2.0%) |
| ||||
| Old Line Funding Corp., 5.26%, 7/12/07 |
5,000,000 | 4,991 | |||
| Old Line Funding Corp., 5.28%, 7/13/07 |
5,000,000 | 4,990 | |||
| Sheffield Receivables, 5.27%, 7/10/07 |
10,000,000 | 9,986 | |||
| Total |
19,967 | ||||
| Total Money Market Investments |
145,583 | ||||
| Total Investments (111.1%) |
1,122,204 | ||||
| Other Assets, Less |
(112,389 | ) | |||
| Net Assets (100.0%) |
1,009,815 | ||||
144A after the name of a security represents a security exempt from registration under Rule 144A of the Securities Act of 1933. These securities may be resold as transactions exempt from registration, normally to qualified institutional buyers. At June 30, 2007 the value of these securities (in thousands) was $43,975, representing 4.35% of the net assets.
IO — Interest Only Security
The Accompanying Notes are an Integral Part of the Financial Statements.
Select Bond Portfolio
53
Table of Contents
Select Bond Portfolio
| (a) | At June 30, 2007 the aggregate cost of securities for federal tax purposes (in thousands) was $1,141,304 and the net unrealized depreciation of investments based on that cost was $19,101 which is comprised of $1,950 aggregate gross unrealized appreciation and $21,051 aggregate gross unrealized depreciation. |
| (b) | All or a portion of the securities have been committed as collateral for open futures positions or when-issued securities. Information regarding open futures contracts as of period end is summarized below. |
| Issuer (000’s) | Number of Contracts |
Expiration Date |
Unrealized Appreciation/ (Depreciation) (000’s) |
|||||
| US Ten Year Treasury Note (Short) (Total Notional Value at June 30, 2007, $7,927 ) |
75 | 9/07 | $ | (1 | ) | |||
| (e) | Step bond security that presently receives no coupon payments. At the predetermined date the stated coupon rate becomes effective. |
| (g) | All or portion of the securities have been loaned. See Note 7 in the Notes to Financial Statements. |
The Accompanying Notes are an Integral Part of the Financial Statements.
54
Select Bond Portfolio
Table of Contents
Sector Allocation 6/30/07
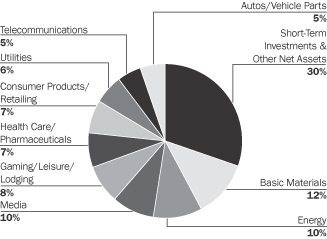
Sector Allocation is based on Net Assets.
Sector Allocation is subject to change.
Bonds and other debt obligations are affected by changes in interest rates, inflation risk and the creditworthiness of their issuers. High yield bonds generally have greater price swings and higher default risks than investment grade bonds. Return of principal is not guaranteed. When interest rates rise, bond prices fall. With a fixed income fund, when interest rates rise, the value of the fund’s existing bonds drops, which could negatively affect overall fund performance. In contrast to owning individual bonds, there are ongoing fees and expenses associated with owning shares of bond funds.
Expense Example
As a shareholder of the Portfolio, you incur two types of costs: (1) transaction costs and (2) ongoing costs, including management fees and other Portfolio expenses. This Example is intended to help you understand your ongoing costs (in dollars) of investing in the Portfolio and to compare these costs with the ongoing costs of investing in other mutual funds.
The Example is based on an investment of $1,000 invested at the beginning of the period and held for the entire period (January 1, 2007 to June 30, 2007).
Actual Expenses
The first line of the table below provides information about actual account values and actual expenses. You may use the information in this line, together with the amount you invested, to estimate the expenses that you paid over the period. Simply divide your account value by $1,000 (for example, an $8,600 account value divided by $1,000 = 8.6), then multiply the result by the number in the first line under the heading entitled “Expenses Paid During Period” to estimate the expenses you paid on your account during this period.
Hypothetical Example for Comparison Purposes
The second line of the table below provides information about hypothetical account values and hypothetical expenses based on the Portfolio’s actual expense ratio and an assumed rate of return of 5% per year before expenses, which is not the Portfolio’s actual return. The hypothetical account values and expenses may not be used to estimate the actual ending account balance or expenses you paid for the period. You may use this information to compare the ongoing costs of investing in the Portfolio and other funds. To do so, compare this 5% hypothetical example with the 5% hypothetical examples that appear in the shareholder reports of the other funds.
Please note that the expenses shown in the table are meant to highlight your ongoing costs only and do not reflect any transactional costs or separate account charges. Therefore, the second line of the table is useful in comparing ongoing costs only, and will not help you determine the relative total costs of owning different funds. In addition, if these transactional costs or separate account charges were included, your costs would have been higher.
| Beginning Account Value January 1, 2007 |
Ending Account Value June 30, 2007 |
Expenses Paid During Period January 1, 2007 to June 30, 2007* | |||||||
| Actual |
$ | 1,000.00 | $ | 1,021.80 | $ | 2.31 | |||
| Hypothetical (5% return before expenses) |
$ | 1,000.00 | $ | 1,022.51 | $ | 2.31 | |||
| * | Expenses are equal to the Portfolio’s annualized expense ratio of 0.46%, multiplied by the average account value over the period, multiplied by 181/365 (to reflect the one-half year period). |
High Yield Bond Portfolio
55
Table of Contents
High Yield Bond Portfolio
Northwestern Mutual Series Fund, Inc.
Schedule of Investments
June 30, 2007 (unaudited)
| Bonds (93.8%) | Shares/ $ Par |
Value $ (000’s) | ||
| Aerospace/Defense (1.8%) |
||||
| Bombardier, Inc., |
469,000 | 485 | ||
| DRS Technologies, Inc., 7.625%, 2/1/18 |
680,000 | 687 | ||
| Hawker Beechcraft Acquisition Co., LLC/Hawker Beechcraft Notes Co., 8.50%, 4/1/15 144A |
412,000 | 425 | ||
| (c)Hawker Beechcraft Acquisition Co., LLC/Hawker Beechcraft Notes Co., 8.875%, 4/1/15 144A |
272,000 | 280 | ||
| L-3 Communications Corp., 6.375%, 10/15/15 |
2,275,000 | 2,150 | ||
| L-3 Communications Corp., 7.625%, 6/15/12 |
1,335,000 | 1,367 | ||
| Total |
5,394 | |||
| Autos/Vehicle Parts (5.1%) |
||||
| American Axle & Manufacturing, Inc., 7.875%, 3/1/17 |
926,000 | 910 | ||
| Arvinmeritor, Inc., |
489,000 | 494 | ||
| Cooper Tire & Rubber Co., 8.00%, 12/15/19 |
680,000 | 663 | ||
| Ford Motor Co., |
2,020,000 | 1,613 | ||
| Ford Motor Credit Co., 8.00%, 12/15/16 |
1,345,000 | 1,288 | ||
| Ford Motor Credit Co., 8.625%, 11/1/10 |
710,000 | 721 | ||
| Ford Motor Credit Co., 9.875%, 8/10/11 |
2,980,000 | 3,128 | ||
| General Motors Corp., 8.375%, 7/15/33 |
1,815,000 | 1,656 | ||
| The Goodyear Tire & Rubber Co., |
604,000 | 636 | ||
| Lear Corp., |
1,126,000 | 1,081 | ||
| Lear Corp., |
872,000 | 831 | ||
| TRW Automotive, Inc., 7.25%, 3/15/17 144A |
1,700,000 | 1,619 | ||
| Visteon Corp., |
445,000 | 442 | ||
| Total |
15,082 | |||
| Basic Materials (12.4%) |
||||
| Abitibi-Consolidated, Inc., 7.75%, 6/15/11 |
1,837,000 | 1,681 | ||
| Abitibi-Consolidated, Inc., 8.375%, 4/1/15 |
670,000 | 586 | ||
| Arch Western Finance LLC, 6.75%, 7/1/13 |
1,395,000 | 1,339 | ||
| Bonds (93.8%) | Shares/ $ Par |
Value $ (000’s) | ||
| Basic Materials continued |
||||
| Berry Plastics Holding Corp., 8.875%, 9/15/14 |
590,000 | 597 | ||
| Bowater Canada Finance, 7.95%, 11/15/11 |
780,000 | 734 | ||
| Cascades, Inc., |
504,000 | 490 | ||
| Catalyst Paper Corp., 8.625%, 6/15/11 |
340,000 | 329 | ||
| Crown Americas, Inc., 7.625%, 11/15/13 |
1,062,000 | 1,073 | ||
| Crown Americas, Inc., 7.75%, 11/15/15 |
825,000 | 829 | ||
| Equistar Chemicals LP, 10.625%, 5/1/11 |
905,000 | 953 | ||
| FMG Finance Property, Ltd., 10.625%, 9/1/16 144A |
1,995,000 | 2,374 | ||
| Freeport-McMoRan Copper & Gold, Inc., 8.25%, 4/1/15 |
1,360,000 | 1,435 | ||
| Freeport-McMoRan Copper & Gold, Inc., 8.375%, 4/1/17 |
2,505,000 | 2,675 | ||
| Georgia-Pacific Corp., 7.00%, 1/15/15 144A |
1,853,000 | 1,784 | ||
| Georgia-Pacific Corp., 7.125%, 1/15/17 144A |
1,329,000 | 1,276 | ||
| Graphic Packaging International Corp., |
881,000 | 915 | ||
| Hexion US Finance Corp./Hexion Nova Scotia Finance ULC, |
1,955,000 | 2,023 | ||
| Huntsman LLC, |
745,000 | 827 | ||
| Invista, 9.25%, 5/1/12 144A |
875,000 | 925 | ||
| Lyondell Chemical Co., 6.875%, 6/15/17 |
1,440,000 | 1,390 | ||
| Lyondell Chemical Co., 8.00%, 9/15/14 |
1,545,000 | 1,587 | ||
| Massey Energy Co., 6.875%, 12/15/13 |
1,190,000 | 1,090 | ||
| Momentive Performance Materials, Inc., |
445,000 | 449 | ||
| (c)Momentive Performance Materials, Inc., |
560,000 | 561 | ||
| Mosaic Global Holdings, Inc., 7.375%, 12/1/14 144A |
335,000 | 338 | ||
| Mosaic Global Holdings, Inc., 7.625%, 12/1/16 144A |
785,000 | 803 | ||
| Norampac, Inc., |
625,000 | 596 | ||
| Bonds (93.8%) | Shares/ $ Par |
Value $ (000’s) | ||
| Basic Materials continued |
||||
| Novelis, Inc., |
748,000 | 768 | ||
| Owens-Brockway Glass Container, Inc., |
1,064,000 | 1,037 | ||
| Owens-Brockway Glass Container, Inc., |
1,555,000 | 1,596 | ||
| Peabody Energy Corp., 7.375%, 11/1/16 |
935,000 | 954 | ||
| Smurfit-Stone Container, 8.375%, 7/1/12 |
955,000 | 956 | ||
| Stone Container, |
680,000 | 660 | ||
| VeraSun Energy Corp., 9.375%, 6/1/17 144A |
555,000 | 516 | ||
| Total |
36,146 | |||
| Builders/Building Materials (1.5%) |
||||
| Beazer Homes USA, Inc., 6.50%, 11/15/13 |
557,000 | 479 | ||
| Beazer Homes USA, Inc., 6.875%, 7/15/15 |
223,000 | 192 | ||
| Beazer Homes USA, Inc., 8.375%, 4/15/12 |
205,000 | 194 | ||
| K. Hovnanian Enterprises, 7.75%, 5/15/13 |
1,491,000 | 1,304 | ||
| KB HOME, |
1,030,000 | 1,025 | ||
| Standard Pacific Corp., 6.25%, 4/1/14 |
565,000 | 497 | ||
| Standard Pacific Corp., 7.75%, 3/15/13 |
715,000 | 658 | ||
| Total |
4,349 | |||
| Capital Goods (2.0%) |
||||
| Ashtead Capital, Inc., 9.00%, 8/15/16 144A |
540,000 | 566 | ||
| Belden CDT, Inc., |
340,000 | 335 | ||
| Clarke American Corp., 9.50%, 5/15/15 144A |
212,000 | 204 | ||
| Clarke American Corp., 10.106%, 5/15/15 144A |
265,000 | 256 | ||
| DA-Lite Screen Co., Inc., 9.50%, 5/15/11 |
675,000 | 709 | ||
| Rental Service Corp., 9.50%, 12/1/14 144A |
837,000 | 854 | ||
| Terex Corp., |
610,000 | 610 | ||
| United Rentals North America, Inc., |
2,545,000 | 2,499 | ||
| Total |
6,033 | |||
The Accompanying Notes are an Integral Part of the Financial Statements.
56
High Yield Bond Portfolio
Table of Contents
High Yield Bond Portfolio
| Bonds (93.8%) | Shares/ $ Par |
Value $ (000’s) | ||
| Consumer Products/Retailing (6.5%) | ||||
| Albertson’s Inc., |
1,335,000 | 1,360 | ||
| Claire’s Stores, Inc., |
380,000 | 361 | ||
| (c)Claire’s Stores, Inc., 9.625%, 6/1/15 144A |
435,000 | 402 | ||
| Claire’s Stores, Inc., 10.50%, 6/1/17 144A |
540,000 | 493 | ||
| Delhaize America, Inc., 9.00%, 4/15/31 |
841,000 | 1,016 | ||
| Dollar General Corp., 10.625%, 7/15/15 144A |
1,075,000 | 1,037 | ||
| Education Management LLC, 10.25%, 6/1/16 |
1,280,000 | 1,347 | ||
| GSC Holdings Corp., 8.00%, 10/1/12 |
1,105,000 | 1,155 | ||
| Jostens IH Corp., |
844,000 | 840 | ||
| Levi Strauss & Co., |
1,275,000 | 1,307 | ||
| Michaels Stores, Inc., 10.00%, 11/1/14 144A |
804,000 | 824 | ||
| Oxford Industries, Inc., 8.875%, 6/1/11 |
1,693,000 | 1,749 | ||
| Phillips Van Heusen Corp., 8.125%, 5/1/13 |
200,000 | 208 | ||
| Rent-A-Center, |
497,000 | 504 | ||
| Rite Aid Corp., |
1,017,000 | 981 | ||
| Rite Aid Corp., |
1,505,000 | 1,523 | ||
| Rite Aid Corp., |
336,000 | 314 | ||
| Rite Aid Corp., |
540,000 | 518 | ||
| Rite Aid Corp., |
485,000 | 466 | ||
| Smithfield Foods, Inc., 7.75%, 7/1/17 |
760,000 | 760 | ||
| SUPERVALU, Inc., |
1,120,000 | 1,148 | ||
| Warnaco, Inc., |
755,000 | 798 | ||
| Total |
19,111 | |||
| Energy (9.9%) |
||||
| AmeriGas Partners LP, 7.25%, 5/20/15 |
940,000 | 931 | ||
| Basic Energy Services, Inc., 7.125%, 4/15/16 |
1,220,000 | 1,165 | ||
| Chaparral Energy, Inc., 8.875%, 2/1/17 144A |
1,220,000 | 1,205 | ||
| Chesapeake Energy Corp., 6.375%, 6/15/15 |
823,000 | 785 | ||
| Chesapeake Energy Corp., 6.625%, 1/15/06 |
1,405,000 | 1,352 | ||
| Chesapeake Energy Corp., 7.50%, 9/15/13 |
620,000 | 631 | ||
| Chesapeake Energy Corp., 7.625%, 7/15/13 |
655,000 | 671 | ||
| Bonds (93.8%) | Shares/ $ Par |
Value $ (000’s) | ||
| Energy continued |
||||
| Cimarex Energy Co., 7.125%, 5/1/17 |
275,000 | 268 | ||
| Compagnie Generale de Geophysique-Veritas, 7.50%, 5/15/15 |
405,000 | 405 | ||
| Compagnie Generale de Geophysique-Veritas, 7.75%, 5/15/17 |
675,000 | 683 | ||
| Complete Production Services, Inc., 8.00%, 12/15/16 144A |
803,000 | 811 | ||
| Denbury Resources, Inc., 7.50%, 12/15/15 |
750,000 | 748 | ||
| Forest Oil Corp., 7.25%, 6/15/19 144A |
650,000 | 631 | ||
| Hanover Compressor Co., 7.50%, 4/15/13 |
427,000 | 429 | ||
| Hanover Compressor Co., 9.00%, 6/1/14 |
665,000 | 703 | ||
| Kinder Morgan Finance Co. ULC, 5.70%, 1/5/16 |
675,000 | 622 | ||
| Mariner Energy, Inc., 8.00%, 5/15/17 |
725,000 | 720 | ||
| Newfield Exploration Co., 6.625%, 9/1/14 |
190,000 | 183 | ||
| Newfield Exploration Co., 6.625%, 4/15/16 |
1,045,000 | 1,006 | ||
| OPTI Canada, Inc., 8.25%, 12/15/14 144A |
1,010,000 | 1,025 | ||
| Petrohawk Energy Corp., 9.125%, 7/15/13 |
1,636,000 | 1,730 | ||
| Petroplus Finance, Ltd., 7.00%, 5/1/17 144A |
528,000 | 508 | ||
| Petroplus Finance, Ltd., 6.75%, 5/1/14 144A |
633,000 | 609 | ||
| Pioneer Natural Resources Co., 6.65%, 3/15/17 |
1,016,000 | 961 | ||
| Plains Exploration & Production Co., |
680,000 | 644 | ||
| Plains Exploration & Production Co., |
900,000 | 893 | ||
| Pogo Producing Co., 7.875%, 5/1/13 |
726,000 | 741 | ||
| Range Resources Corp., 6.375%, 3/15/15 |
1,119,000 | 1,060 | ||
| Range Resources Corp., 7.50%, 5/15/16 |
235,000 | 238 | ||
| Seitel, Inc., |
340,000 | 337 | ||
| Sesi LLC, 6.875%, 6/1/14 |
1,145,000 | 1,114 | ||
| Stallion Oilfield Services/Stallion Oilfield Finance Corp., 9.75%, 2/1/15 144A |
1,235,000 | 1,260 | ||
| Tesoro Corp., |
1,225,000 | 1,213 | ||
| W&T Offshore, Inc., |
1,040,000 | 1,027 | ||
| Whiting Petroleum Corp., 7.25%, 5/1/13 |
1,379,000 | 1,310 | ||
| Bonds (93.8%) | Shares/ $ Par |
Value $ (000’s) | ||
| Energy continued |
||||
| Williams Partners LP/Williams Partners Financial Corp., |
538,000 | 541 | ||
| Total |
29,160 | |||
| Financials (4.4%) |
||||
| Crum & Forster Holdings Corp., 7.75%, 5/1/17 144A |
772,000 | 755 | ||
| E*Trade Financial Corp., 7.875%, 12/1/15 |
1,210,000 | 1,260 | ||
| General Motors Acceptance Corp. LLC, 6.75%, 12/1/14 |
905,000 | 867 | ||
| General Motors Acceptance Corp. LLC, |
1,295,000 | 1,274 | ||
| General Motors Acceptance Corp. LLC, |
2,825,000 | 2,888 | ||
| LaBranche & Co., Inc., 9.50%, 5/15/09 |
375,000 | 388 | ||
| LaBranche & Co., Inc., 11.00%, 5/15/12 |
561,000 | 595 | ||
| Residential Capital LLC, 6.50%, 4/17/13 |
905,000 | 875 | ||
| Residential Capital LLC, 6.875%, 6/30/15 |
905,000 | 878 | ||
| Residential Capital LLC, 7.187%, 4/17/09 144A |
1,301,000 | 1,294 | ||
| SLM Corp., |
1,370,000 | 1,174 | ||
| UnumProvident |
825,000 | 843 | ||
| Total |
13,091 | |||
| Foods (3.9%) |
||||
| Constellation Brands Inc., 7.25%, 5/15/17 144A |
925,000 | 902 | ||
| Constellation Brands, Inc., 7.25%, 9/1/16 |
1,235,000 | 1,204 | ||
| Dean Foods Co., |
915,000 | 874 | ||
| Dole Foods Co., |
1,965,000 | 1,959 | ||
| Outback Steakhouse, Inc., 10.00%, 6/15/15 144A |
254,000 | 243 | ||
| Pilgrim’s Pride Corp., 7.625%, 5/1/15 |
843,000 | 841 | ||
| Pilgrim’s Pride Corp., 8.375%, 5/1/17 |
405,000 | 401 | ||
| Pinnacle Foods Finance LLC/Pinnacle Foods Finance Corp., |
1,465,000 | 1,414 | ||
| Pinnacle Foods Finance LLC/Pinnacle Foods Finance Corp., |
685,000 | 659 | ||
The Accompanying Notes are an Integral Part of the Financial Statements.
High Yield Bond Portfolio
57
Table of Contents
High Yield Bond Portfolio
| Bonds (93.8%) | Shares/ $ Par |
Value $ (000’s) | ||
| Foods continued |
||||
| Reynolds America, Inc., 7.625%, 6/1/16 |
1,545,000 | 1,636 | ||
| Smithfield Foods, Inc., 7.75%, 5/15/13 |
1,310,000 | 1,330 | ||
| Total |
11,463 | |||
| Gaming/Leisure/Lodging (8.1%) |
||||
| AMC Entertainment, Inc., 11.00%, 2/1/16 |
728,000 | 804 | ||
| American Casino & Entertainment, |
780,000 | 801 | ||
| Boyd Gaming Corp., |
1,355,000 | 1,389 | ||
| Corrections Corp. of America, 6.25%, 3/15/13 |
1,398,000 | 1,342 | ||
| Felcor Lodging LP, |
1,117,000 | 1,174 | ||
| Fontainebleau Las Vegas Holdings LLC, |
810,000 | 798 | ||
| Hertz Corp., |
1,295,000 | 1,350 | ||
| Host Marriot LP, |
2,865,000 | 2,862 | ||
| Mandalay Resort Group, 9.375%, 2/15/10 |
660,000 | 696 | ||
| MGM Mirage, Inc., |
1,485,000 | 1,418 | ||
| MGM Mirage, Inc., |
1,800,000 | 1,708 | ||
| Park Place Entertainment Corp., 8.125%, 5/15/11 |
1,775,000 | 1,853 | ||
| Pinnacle Entertainment, Inc., 7.50%, 6/15/15 144A |
635,000 | 613 | ||
| Pokagon Gaming Authority, 10.375%, 6/15/14 144A |
384,000 | 423 | ||
| Royal Caribbean Cruises, Ltd., 7.00%, 6/15/13 |
875,000 | 879 | ||
| Seminole Hard Rock Entertainment, |
540,000 | 544 | ||
| Station Casinos, Inc., 6.625%, 3/15/18 |
615,000 | 529 | ||
| Station Casinos, Inc., 6.875%, 3/1/16 |
685,000 | 605 | ||
| Universal City |
907,000 | 961 | ||
| Universal City Florida, 8.375%, 5/1/10 |
400,000 | 409 | ||
| Wimar Opco LLC/Wimar Opco Finance Corp., 9.625%, 12/15/14 144A |
675,000 | 650 | ||
| Wynn Las Vegas LLC, 6.625%, 12/1/14 |
2,200,000 | 2,120 | ||
| Total |
23,928 | |||
| Bonds (93.8%) | Shares/ $ Par |
Value $ (000’s) | ||
| Health Care/Pharmaceuticals (6.5%) | ||||
| Community Health Systems, Inc., |
2,215,000 | 2,245 | ||
| FMC Finance III SA, 6.875%, 7/15/17 144A |
1,265,000 | 1,240 | ||
| Fresenius Medical Capital Trust IV, |
410,000 | 424 | ||
| HCA, Inc., |
905,000 | 824 | ||
| HCA, Inc., |
782,000 | 822 | ||
| HCA, Inc., |
3,164,000 | 3,369 | ||
| (c)HCA, Inc., |
1,273,000 | 1,368 | ||
| OMEGA Healthcare Investors, Inc., |
285,000 | 284 | ||
| OMEGA Healthcare Investors, Inc., |
750,000 | 746 | ||
| Omnicare, Inc., |
825,000 | 788 | ||
| PTS Acquisition Corp., 9.50%, 4/15/15 144A |
997,000 | 980 | ||
| Service Corp. International, |
855,000 | 824 | ||
| Senior Housing Properties Trust, 8.625%, 1/15/12 |
610,000 | 653 | ||
| Service Corp. International, |
825,000 | 782 | ||
| Service Corp. International, |
175,000 | 176 | ||
| Tenet Healthcare Corp., 7.375%, 2/1/13 |
985,000 | 890 | ||
| Tenet Healthcare Corp., 9.875%, 7/1/14 |
675,000 | 668 | ||
| US Oncology, Inc., |
940,000 | 968 | ||
| Ventas Realty LP/Capital Corp., 6.50%, 6/1/16 |
340,000 | 332 | ||
| Ventas Realty LP/Capital Corp., 9.00%, 5/1/12 |
750,000 | 819 | ||
| Total |
19,202 | |||
| Media (10.4%) |
||||
| CCH I Holdings LLC, 11.75%, 5/15/14 |
1,075,000 | 1,056 | ||
| Charter Communications Holdings LLC, |
1,740,000 | 1,816 | ||
| Charter Communications Holdings LLC, |
1,525,000 | 1,589 | ||
| CSC Holdings, Inc., 7.625%, 4/1/11 |
2,055,000 | 2,040 | ||
| Bonds (93.8%) | Shares/ $ Par |
Value $ (000’s) | ||
| Media continued |
||||
| CSC Holdings, Inc., 7.875%, 2/15/18 |
1,660,000 | 1,602 | ||
| CSC Holdings, Inc., 8.125%, 7/15/09 |
780,000 | 796 | ||
| CSC Holdings, Inc., 8.125%, 8/15/09 |
408,000 | 416 | ||
| The DIRECTV Group, Inc., 6.375%, 6/15/15 |
440,000 | 414 | ||
| Echostar DBS Corp., 7.00%, 10/1/13 |
935,000 | 921 | ||
| EchoStar DBS Corp., 7.125%, 2/1/16 |
555,000 | 543 | ||
| Idearc, Inc., |
3,745,000 | 3,782 | ||
| Intelsat Bermuada, Ltd., 8.50%, 1/15/13 |
934,000 | 948 | ||
| Intelsat Bermuada, Ltd., 11.25%, 6/15/16 |
658,000 | 737 | ||
| Intelsat Bermuada, Ltd., 11.409%, 6/15/13 |
878,000 | 931 | ||
| Kabel Deutschland GMBH, 10.625%, 7/1/14 |
845,000 | 925 | ||
| Lamar Media Corp., 6.625%, 8/15/15 |
1,305,000 | 1,236 | ||
| LIN Television Corp., 6.50%, 5/15/13 |
1,170,000 | 1,144 | ||
| Mediacom Broadband LLC/Corp., |
785,000 | 789 | ||
| Mediacom Broadband |
400,000 | 402 | ||
| Mediacom LLC/Capital Corp., 7.875%, 2/15/11 |
390,000 | 388 | ||
| Quebecor World, Inc., 9.75%, 1/15/15 144A |
900,000 | 911 | ||
| R.H. Donnelley Corp., 6.875%, 1/15/13 |
3,850,000 | 3,648 | ||
| R.H. Donnelley Corp., 8.875%, 1/15/16 |
695,000 | 723 | ||
| Sinclair Broadcast Group, 8.00%, 3/15/12 |
561,000 | 578 | ||
| (c)Univision Communications, |
1,910,000 | 1,886 | ||
| Videotron Ltee, |
340,000 | 323 | ||
| Total |
30,544 | |||
| Real Estate (1.3%) |
||||
| American Real Estate Partners LP, |
390,000 | 376 | ||
| American Real Estate Partners, LP, |
1,120,000 | 1,081 | ||
| The Rouse Co., |
1,175,000 | 1,206 | ||
| Rouse Co. LP/TRC Co-Issuer, Inc., |
1,035,000 | 1,034 | ||
| Total |
3,697 | |||
The Accompanying Notes are an Integral Part of the Financial Statements.
58
High Yield Bond Portfolio
Table of Contents
High Yield Bond Portfolio
| Bonds (93.8%) | Shares/ $ Par |
Value $ (000’s) | ||
| Services (2.6%) |
||||
| Allied Waste North America, Inc., |
815,000 | 789 | ||
| Allied Waste North America, Inc., |
1,411,000 | 1,397 | ||
| ARAMARK Corp., |
607,000 | 618 | ||
| ARAMARK Corp., |
405,000 | 411 | ||
| Realogy Corp., |
1,925,000 | 1,833 | ||
| Realogy Corp., |
910,000 | 830 | ||
| Travelport LLC, |
885,000 | 977 | ||
| WCA Waste Corp., |
880,000 | 915 | ||
| Total |
7,770 | |||
| Structured Product (0.9%) |
||||
| Dow Jones Credit Derivative High Yield, 8.25%, 12/29/10 |
2,670,000 | 2,707 | ||
| Total |
2,707 | |||
| Technology (3.2%) |
||||
| Flextronics International, Ltd., 6.50%, 5/15/13 |
1,130,000 | 1,065 | ||
| Freescale Semiconductor, Inc., 8.875%, 12/15/14 144A |
981,000 | 937 | ||
| (c)Freescale Semiconductor, Inc., 9.125%, 12/15/14 144A |
1,442,000 | 1,356 | ||
| Freescale Semiconductor, Inc., 10.125%, 12/15/16 144A |
335,000 | 315 | ||
| Nortel Networks, Ltd., 10.75%, 7/15/16 144A |
440,000 | 486 | ||
| NXP BV, |
1,240,000 | 1,221 | ||
| NXP BV, |
615,000 | 606 | ||
| Sabre Holdings Corp., 6.35%, 3/15/16 |
915,000 | 824 | ||
| Sanmina Corp., |
510,000 | 474 | ||
| Stats Chippac, Inc., |
662,000 | 667 | ||
| Sungard Data Systems, Inc., 9.125%, 8/15/13 |
1,315,000 | 1,346 | ||
| Total |
9,297 | |||
| Telecommunications (5.2%) |
||||
| Citizens Communications, 9.00%, 8/15/31 |
2,205,000 | 2,272 | ||
| Citizens Communications, 9.25%, 5/15/11 |
2,025,000 | 2,187 | ||
| Embarq Corp., |
1,360,000 | 1,380 | ||
| Qwest Capital Funding, Inc., 7.90%, 8/15/10 |
870,000 | 885 | ||
| Bonds (93.8%) | Shares/ $ Par |
Value $ (000’s) | ||
| Telecommunications continued |
||||
| Qwest Communications International, Inc., |
375,000 | 377 | ||
| Qwest Corp., |
1,035,000 | 986 | ||
| Qwest Corp., |
221,000 | 227 | ||
| Qwest Corp., |
986,000 | 1,028 | ||
| Rogers Wireless, Inc., 8.00%, 12/15/12 |
1,220,000 | 1,298 | ||
| Sprint Capital Corp., 6.90%, 5/1/19 |
1,445,000 | 1,430 | ||
| Windstream Corp., |
680,000 | 649 | ||
| Windstream Corp., 8.125%, 8/1/13 |
1,150,000 | 1,202 | ||
| Windstream Corp., 8.625%, 8/1/16 |
1,220,000 | 1,290 | ||
| Total |
15,211 | |||
| Transportation-Rail & Other (2.1%) | ||||
| American Railcar Industries, Inc., |
680,000 | 677 | ||
| Grupo Transportacion Ferroviaria Mexicana, SA de CV (TFM), |
933,000 | 998 | ||
| Kansas City Southern de Mexico SA de CV, 7.625%, 12/1/13 144A |
470,000 | 469 | ||
| Kansas City Southern de Mexico, 7.375%, 6/1/14 144A |
1,150,000 | 1,141 | ||
| Ship Finance International, Ltd., 8.50%, 12/15/13 |
545,000 | 561 | ||
| Stena AB, 7.50%, 11/1/13 |
2,305,000 | 2,329 | ||
| Total |
6,175 | |||
| Utilities (6.0%) |
||||
| The AES Corp., |
860,000 | 915 | ||
| Aquila, Inc., |
78,000 | 84 | ||
| Dynegy Holdings, Inc., 7.50%, 6/1/15 144A |
545,000 | 513 | ||
| Dynegy Holdings, Inc., 7.75%, 6/1/19 144A |
815,000 | 758 | ||
| Dynegy Holdings, Inc., 8.375%, 5/1/16 |
910,000 | 890 | ||
| Edison Mission Energy, 7.00%, 5/15/17 144A |
1,585,000 | 1,494 | ||
| Edison Mission Energy, 7.20%, 5/15/19 144A |
1,846,000 | 1,735 | ||
| Elwood Energy LLC, 8.159%, 7/5/26 |
1,160,309 | 1,219 | ||
| Indiantown Cogeneration LP, 9.77%, 12/15/20 |
2,175,000 | 2,455 | ||
| NRG Energy, Inc., |
925,000 | 927 | ||
| NRG Energy, Inc., 7.375%, 1/15/17 |
2,606,000 | 2,616 | ||
| NRG Energy, Inc., 7.375%, 2/1/16 |
430,000 | 431 | ||
| Bonds (93.8%) | Shares/ $ Par |
Value $ (000’s) | ||
| Utilities continued |
||||
| NSG Holdings LLC, 7.75%, 12/15/25 144A |
948,000 | 957 | ||
| PSEG Energy Holdings LLC, 8.50%, 6/15/11 |
291,000 | 308 | ||
| Sierra Pacific Resources, 8.625%, 3/15/14 |
392,000 | 421 | ||
| TXU Corp., |
2,450,000 | 2,080 | ||
| Total |
17,803 | |||
| Total Bonds |
276,163 | |||
| Money Market Investments (4.9%) | ||||
| Finance Lessors (1.7%) |
||||
| Thunder Bay Funding, Inc., 5.31%, 7/16/07 |
5,000,000 | 4,988 | ||
| Total |
4,988 | |||
| Finance Services (1.6%) |
||||
| Alpine Securitization, 5.29%, 7/6/07 |
5,000,000 | 4,995 | ||
| Total |
4,995 | |||
| National Commercial Banks (1.6%) |
||||
| UBS Finance LLC, |
4,600,000 | 4,599 | ||
| Total |
4,599 | |||
| Total Money Market Investments |
14,582 | |||
| Total Investments (98.7%) |
290,745 | |||
| Other Assets, Less Liabilities (1.3%) |
3,955 | |||
| Net Assets (100.0%) |
294,700 | |||
144A after the name of a security represents a security exempt from registration under Rule 144A of the Securities Act of 1933. These securities may be resold as transactions exempt from registration, normally to qualified institutional buyers. At June 30, 2007 the value of these securities (in thousands) was $66,341, representing 22.51% of the net assets.
| (a) | At June 30, 2007 the aggregate cost of securities for federal tax purposes (in thousands) was $292,312 and the net unrealized depreciation of investments based on that cost was $1,567 which is comprised of $3,629 aggregate gross unrealized appreciation and $5,196 aggregate gross unrealized depreciation. |
| (c) | PIK — Denotes a security that has the option to pay-in-kind. |
The Accompanying Notes are an Integral Part of the Financial Statements.
High Yield Bond Portfolio
59
Table of Contents
Sector Allocation 6/30/07
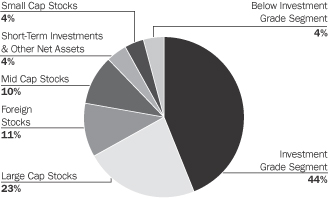
Sector Allocation is based on Net Assets.
Sector Allocation is subject to change.
Expense Example
As a shareholder of the Portfolio, you incur two types of costs: (1) transaction costs and (2) ongoing costs, including management fees and other Portfolio expenses. This Example is intended to help you understand your ongoing costs (in dollars) of investing in the Portfolio and to compare these costs with the ongoing costs of investing in other mutual funds.
The Example is based on an investment of $1,000 invested at the beginning of the period and held for the entire period (January 1, 2007 to June 30, 2007).
Actual Expenses
The first line of the table below provides information about actual account values and actual expenses. You may use the information in this line, together with the amount you invested, to estimate the expenses that you paid over the period. Simply divide your account value by $1,000 (for example, an $8,600 account value divided by $1,000 = 8.6), then multiply the result by the number in the first line under the heading entitled “Expenses Paid During Period” to estimate the expenses you paid on your account during this period.
Hypothetical Example for Comparison Purposes
The second line of the table below provides information about hypothetical account values and hypothetical expenses based on the Portfolio’s actual expense ratio and an assumed rate of return of 5% per year before expenses, which is not the Portfolio’s actual return. The hypothetical account values and expenses may not be used to estimate the actual ending account balance or expenses you paid for the period. You may use this information to compare the ongoing costs of investing in the Portfolio and other funds. To do so, compare this 5% hypothetical example with the 5% hypothetical examples that appear in the shareholder reports of the other funds.
Please note that the expenses shown in the table are meant to highlight your ongoing costs only and do not reflect any transactional costs or separate account charges. Therefore, the second line of the table is useful in comparing ongoing costs only, and will not help you determine the relative total costs of owning different funds. In addition, if these transactional costs or separate account charges were included, your costs would have been higher.
| Beginning Account Value January 1, 2007 |
Ending Account Value June 30, 2007 |
Expenses Paid During Period January 1, 2007 to June 30, 2007* | |||||||
| Actual |
$ | 1,000.00 | $ | 1,038.50 | $ | 1.52 | |||
| Hypothetical (5% return before expenses) |
$ | 1,000.00 | $ | 1,023.31 | $ | 1.51 | |||
| * | Expenses are equal to the Portfolio’s annualized expense ratio of 0.30%, multiplied by the average account value over the period, multiplied by 181/365 (to reflect the one-half year period). |
60
Balanced Portfolio
Table of Contents
Balanced Portfolio
Northwestern Mutual Series Fund, Inc.
Schedule of Investments
June 30, 2007 (unaudited)
| Domestic Common Stocks and Warrants (38.0%) |
Shares/ $ Par |
Value $ (000’s) | ||
| Large Cap Common Stocks (25.6%) | ||||
| Consumer Discretionary (3.9%) | ||||
| Abercrombie & Fitch Co. — Class A |
86,100 | 6,284 | ||
| *Comcast Corp. — Class A |
307,500 | 8,647 | ||
| Fortune Brands, Inc. |
74,100 | 6,104 | ||
| Hilton Hotels Corp. |
229,400 | 7,678 | ||
| International Game Technology |
174,100 | 6,911 | ||
| J.C. Penney Co., Inc. |
93,600 | 6,775 | ||
| Johnson Controls, Inc. |
94,600 | 10,953 | ||
| *Kohl’s Corp. |
100,200 | 7,117 | ||
| The McGraw-Hill Companies, Inc. |
108,600 | 7,393 | ||
| News Corp. — Class A |
423,200 | 8,976 | ||
| NIKE, Inc. — Class B |
118,000 | 6,878 | ||
| Omnicom Group, Inc. |
108,600 | 5,747 | ||
| Staples, Inc. |
277,600 | 6,587 | ||
| Starwood Hotels & Resorts Worldwide, Inc. |
61,800 | 4,144 | ||
| Target Corp. |
135,700 | 8,631 | ||
| Time Warner, Inc. |
353,900 | 7,446 | ||
| Total |
116,271 | |||
| Consumer Staples (2.5%) | ||||
| Altria Group, Inc. |
137,600 | 9,651 | ||
| Avon Products, Inc. |
247,500 | 9,096 | ||
| CVS Caremark Corp. |
335,600 | 12,233 | ||
| Loews Corp. — Carolina Group |
84,300 | 6,514 | ||
| PepsiCo, Inc. |
208,800 | 13,541 | ||
| The Procter & Gamble Co. |
175,100 | 10,714 | ||
| Walgreen Co. |
136,700 | 5,952 | ||
| Wal-Mart Stores, Inc. |
129,200 | 6,216 | ||
| Total |
73,917 | |||
| Energy (2.3%) | ||||
| Baker Hughes, Inc. |
110,500 | 9,296 | ||
| ConocoPhillips |
54,300 | 4,263 | ||
| Diamond Offshore Drilling, Inc. |
55,200 | 5,606 | ||
| EOG Resources, Inc. |
101,100 | 7,386 | ||
| Exxon Mobil Corp. |
205,000 | 17,195 | ||
| Schlumberger, Ltd. |
113,300 | 9,624 | ||
| Valero Energy Corp. |
104,900 | 7,748 | ||
| XTO Energy, Inc. |
96,800 | 5,818 | ||
| Total |
66,936 | |||
| Financials (2.4%) | ||||
| American Express Co. |
132,000 | 8,076 | ||
| American International Group, Inc. |
86,500 | 6,058 | ||
| *The Blackstone Group LP |
27,100 | 793 | ||
| CME Group, Inc. |
7,200 | 3,847 | ||
| Genworth Financial, Inc. |
77,200 | 2,656 | ||
| The Goldman Sachs Group, Inc. |
46,800 | 10,145 | ||
| Large Cap Common Stocks (25.6%) |
Shares/ $ Par |
Value $ (000’s) | ||
| Financials continued | ||||
| Host Hotels & Resorts, Inc. |
258,600 | 5,979 | ||
| JPMorgan Chase & Co. |
124,600 | 6,037 | ||
| Legg Mason, Inc. |
73,000 | 7,182 | ||
| Lehman Brothers Holdings, Inc. |
104,900 | 7,817 | ||
| Prudential Financial, Inc. |
83,300 | 8,099 | ||
| UBS AG-REG |
93,600 | 5,617 | ||
| Total |
72,306 | |||
| Health Care (4.0%) |
||||
| Abbott Laboratories |
150,700 | 8,070 | ||
| *Amgen, Inc. |
70,900 | 3,920 | ||
| Baxter International, Inc. |
124,500 | 7,014 | ||
| *Celgene Corp. |
90,600 | 5,195 | ||
| *Genentech, Inc. |
88,900 | 6,726 | ||
| *Gilead Sciences, Inc. |
249,000 | 9,653 | ||
| Johnson & Johnson |
138,600 | 8,541 | ||
| Medtronic, Inc. |
165,700 | 8,593 | ||
| Merck & Co., Inc. |
213,400 | 10,626 | ||
| Novartis AG, ADR |
131,100 | 7,351 | ||
| Pfizer, Inc. |
190,600 | 4,874 | ||
| *St. Jude Medical, Inc. |
127,300 | 5,282 | ||
| *Thermo Fisher Scientific, Inc. |
176,000 | 9,102 | ||
| UnitedHealth Group, Inc. |
121,700 | 6,224 | ||
| Wyeth |
145,100 | 8,320 | ||
| *Zimmer Holdings, Inc. |
98,300 | 8,345 | ||
| Total |
117,836 | |||
| Industrials (2.9%) |
||||
| The Boeing Co. |
99,589 | 9,576 | ||
| Burlington Northern Santa Fe Corp. |
73,000 | 6,215 | ||
| Danaher Corp. |
129,200 | 9,755 | ||
| FedEx Corp. |
81,400 | 9,033 | ||
| General Electric Co. |
352,700 | 13,502 | ||
| Honeywell International, Inc. |
182,400 | 10,265 | ||
| *Spirit Aerosystems Holdings, Inc. |
167,300 | 6,032 | ||
| Textron, Inc. |
72,700 | 8,005 | ||
| United Technologies Corp. |
176,400 | 12,513 | ||
| Total |
84,896 | |||
| Information Technology (6.1%) |
||||
| Accenture, Ltd. — Class A |
229,700 | 9,852 | ||
| *Adobe Systems, Inc. |
47,200 | 1,895 | ||
| *Amdocs, Ltd. |
232,200 | 9,246 | ||
| *Apple, Inc. |
68,900 | 8,409 | ||
| *Autodesk, Inc. |
104,100 | 4,901 | ||
| *BEA Systems, Inc. |
436,800 | 5,980 | ||
| *Broadcom Corp. — Class A |
256,200 | 7,494 | ||
| *Cisco Systems, Inc. |
415,700 | 11,577 | ||
| *Corning, Inc. |
299,500 | 7,652 | ||
| *eBay, Inc. |
164,800 | 5,303 | ||
| *Electronic Arts, Inc. |
128,300 | 6,071 | ||
| *Google, Inc. — Class A |
28,100 | 14,708 | ||
| Large Cap Common Stocks (25.6%) |
Shares/ $ Par |
Value $ (000’s) | ||
| Information Technology continued |
||||
| Hewlett-Packard Co. |
271,700 | 12,123 | ||
| Intel Corp. |
170,900 | 4,061 | ||
| International Business Machines Corp. |
74,000 | 7,789 | ||
| KLA-Tencor Corp. |
152,600 | 8,385 | ||
| Maxim Integrated Products, Inc. |
224,700 | 7,507 | ||
| Microsoft Corp. |
411,900 | 12,139 | ||
| *Oracle Corp. |
431,600 | 8,507 | ||
| QUALCOMM, Inc. |
227,500 | 9,871 | ||
| Telefonaktiebolaget LM Ericsson, ADR |
212,500 | 8,477 | ||
| Texas Instruments, Inc. |
250,000 | 9,408 | ||
| Total |
181,355 | |||
| Materials (0.7%) |
||||
| Monsanto Co. |
176,900 | 11,948 | ||
| Praxair, Inc. |
122,600 | 8,825 | ||
| Total |
20,773 | |||
| Telecommunication Services (0.5%) |
||||
| AT&T, Inc. |
207,800 | 8,623 | ||
| *NII Holdings, Inc. |
83,300 | 6,726 | ||
| Total |
15,349 | |||
| Utilities (0.3%) |
||||
| Exelon Corp. |
126,400 | 9,176 | ||
| Total |
9,176 | |||
| Total Large Cap |
758,815 | |||
| Mid Cap Common Stocks (9.4%) | ||||
| Consumer Discretionary (1.7%) |
||||
| Abercrombie & Fitch |
32,700 | 2,386 | ||
| *Bare Escentuals, Inc. |
96,600 | 3,299 | ||
| *Coach, Inc. |
83,300 | 3,948 | ||
| *Dollar Tree Stores, Inc. |
104,900 | 4,568 | ||
| *Focus Media Holding, Ltd., ADR |
110,500 | 5,579 | ||
| *GameStop Corp. — Class A |
179,100 | 7,003 | ||
| International Game Technology |
97,800 | 3,883 | ||
| *Jack in the Box, Inc. |
22,400 | 1,589 | ||
| *O’Reilly Automotive, Inc. |
105,100 | 3,841 | ||
| Orient-Express Hotels, Ltd. — Class A |
60,900 | 3,252 | ||
| *Payless ShoeSource, Inc. |
106,600 | 3,363 | ||
| Pool Corp. |
55,100 | 2,151 | ||
| Starwood Hotels & Resorts Worldwide, Inc. |
41,800 | 2,804 | ||
| *Urban Outfitters, Inc. |
103,100 | 2,477 | ||
| Total |
50,143 | |||
| Energy (0.8%) |
||||
| *Cameron International Corp. |
81,200 | 5,803 | ||
| Diamond Offshore Drilling, Inc. |
52,300 | 5,312 | ||
The Accompanying Notes are an Integral Part of the Financial Statements.
Balanced Portfolio
61
Table of Contents
Balanced Portfolio
| Mid Cap Common Stocks (9.4%) |
Shares/ $ Par |
Value $ (000’s) | ||
| Energy continued |
||||
| Range Resources Corp. |
136,900 | 5,121 | ||
| Smith International, Inc. |
90,300 | 5,295 | ||
| *Southwestern Energy Co. |
78,200 | 3,480 | ||
| Total |
25,011 | |||
| Financials (1.0%) |
||||
| CME Group, Inc. |
7,000 | 3,741 | ||
| The Colonial BancGroup, Inc. |
94,400 | 2,357 | ||
| *IntercontinentalExchange, Inc. |
17,500 | 2,587 | ||
| *Investment Technology Group, Inc. |
112,700 | 4,883 | ||
| Legg Mason, Inc. |
34,800 | 3,424 | ||
| SEI Investments Co. |
132,200 | 3,839 | ||
| *SVB Financial Group |
67,600 | 3,590 | ||
| T. Rowe Price Group, Inc. |
84,100 | 4,364 | ||
| Total |
28,785 | |||
| Health Care (1.6%) |
||||
| *Celgene Corp. |
54,900 | 3,147 | ||
| *DaVita, Inc. |
144,700 | 7,796 | ||
| *Express Scripts, Inc. |
113,400 | 5,671 | ||
| *Immucor, Inc. |
97,200 | 2,719 | ||
| *Intuitive Surgical, Inc. |
35,800 | 4,968 | ||
| *Kyphon, Inc. |
60,000 | 2,889 | ||
| *Lincare Holdings, Inc. |
136,300 | 5,432 | ||
| *Pediatrix Medical Group, Inc. |
80,400 | 4,434 | ||
| *Psychiatric Solutions, Inc. |
137,700 | 4,993 | ||
| *VCA Antech, Inc. |
102,400 | 3,859 | ||
| *Ventana Medical Systems, Inc. |
27,100 | 2,094 | ||
| Total |
48,002 | |||
| Industrials (1.8%) |
||||
| C.H. Robinson Worldwide, Inc. |
77,300 | 4,060 | ||
| *Corrections Corp. of America |
77,800 | 4,910 | ||
| Expeditors International of Washington, Inc. |
98,800 | 4,080 | ||
| Harsco Corp. |
42,200 | 2,194 | ||
| J.B. Hunt Transport Services, Inc. |
128,600 | 3,771 | ||
| Joy Global, Inc. |
55,000 | 3,208 | ||
| Knight Transportation, Inc. |
245,200 | 4,752 | ||
| The Manitowoc Co., Inc. |
45,600 | 3,665 | ||
| *Monster Worldwide, Inc. |
51,000 | 2,096 | ||
| MSC Industrial Direct Co., Inc. — Class A |
97,500 | 5,363 | ||
| Ritchie Bros. Auctioneers, Inc. |
46,600 | 2,918 | ||
| Robert Half International, Inc. |
79,700 | 2,909 | ||
| *Spirit Aerosystems Holdings, Inc. |
119,900 | 4,323 | ||
| *Stericycle, Inc. |
81,000 | 3,601 | ||
| Total |
51,850 | |||
| Information Technology (2.1%) |
||||
| *Activision, Inc. 209,200 |
3,906 | |||
| Amphenol Corp. — Class A |
137,000 | 4,884 | ||
| Mid Cap Common Stocks (9.4%) |
Shares/ $ Par |
Value $ (000’s) | ||
| Information Technology continued |
||||
| *Autodesk, Inc. |
46,600 | 2,194 | ||
| *Citrix Systems, Inc. |
107,200 | 3,609 | ||
| *Cognizant Technology Solutions Corp. — Class A |
59,800 | 4,490 | ||
| *Digital River, Inc. |
46,700 | 2,113 | ||
| FactSet Research Systems, Inc. |
74,000 | 5,058 | ||
| Harris Corp. |
56,900 | 3,104 | ||
| KLA-Tencor Corp. |
76,500 | 4,204 | ||
| *MEMC Electronic Materials, Inc. |
88,200 | 5,391 | ||
| *Mettler-Toledo International, Inc. |
27,200 | 2,598 | ||
| Microchip Technology, Inc. |
154,800 | 5,734 | ||
| *Network Appliance, Inc. |
75,200 | 2,196 | ||
| *NVIDIA Corp. |
81,200 | 3,354 | ||
| *ValueClick, Inc. |
162,900 | 4,799 | ||
| *VeriFone Holdings, Inc. |
114,600 | 4,040 | ||
| Total |
61,674 | |||
| Materials (0.2%) |
||||
| *Owens-Illinois, Inc. |
64,200 | 2,247 | ||
| Praxair, Inc. |
72,400 | 5,212 | ||
| Total |
7,459 | |||
| Other Holdings (0.1%) |
||||
| SPDR Metals & Mining ETF |
44,700 | 2,787 | ||
| Total |
2,787 | |||
| Telecommunication Services (0.1%) |
||||
| *NeuStar, Inc. — Class A |
101,200 | 2,932 | ||
| Total |
2,932 | |||
| Total Mid Cap Common Stocks |
278,643 | |||
| Small Cap Common Stocks (3.0%) | ||||
| Consumer Discretionary (0.5%) |
||||
| *California Pizza Kitchen, Inc. |
19,050 | 409 | ||
| *Capella Education Co. |
21,000 | 967 | ||
| *Citi Trends, Inc. |
13,800 | 524 | ||
| *Force Protection, Inc. |
29,300 | 605 | ||
| *GSI Commerce, Inc. |
19,800 | 450 | ||
| *Hibbett Sports Inc. |
15,300 | 419 | ||
| *J. Crew Group, Inc. |
11,100 | 600 | ||
| *LIFE TIME FITNESS, Inc. |
26,000 | 1,384 | ||
| *LKQ Corp. |
50,500 | 1,245 | ||
| *Morton’s Restaurant Group, Inc. |
26,700 | 484 | ||
| *National CineMedia, Inc. |
30,300 | 849 | ||
| Orient-Express Hotels, |
23,600 | 1,260 | ||
| *Pinnacle Entertainment, Inc. |
29,400 | 828 | ||
| Sotheby’s |
7,500 | 345 | ||
| *The9 Ltd., ADR |
16,200 | 749 | ||
| *Tween Brands, Inc. |
23,000 | 1,026 | ||
| *Volcom, Inc. |
31,900 | 1,599 | ||
| *Zumiez, Inc. |
33,900 | 1,281 | ||
| Total |
15,024 | |||
| Small Cap Common Stocks (3.0%) |
Shares/ $ Par |
Value $ (000’s) | ||
| Consumer Staples (0.1%) |
||||
| *Central European Distribution Corp. |
33,200 | 1,149 | ||
| *TreeHouse Foods, Inc. |
14,500 | 386 | ||
| UAP Holding Corp. |
44,500 | 1,341 | ||
| Total |
2,876 | |||
| Energy (0.2%) |
||||
| *Dril-Quip, Inc. |
25,600 | 1,151 | ||
| *Global Industries, Ltd. |
54,500 | 1,462 | ||
| *Oceaneering International, Inc. |
30,300 | 1,595 | ||
| *T-3 Energy Services, Inc. |
20,286 | 679 | ||
| World Fuel Services Corp. |
25,900 | 1,089 | ||
| Total |
5,976 | |||
| Financials (0.2%) |
||||
| *FCStone Group, Inc. |
11,400 | 653 | ||
| *Global Cash Access Holdings, Inc. |
81,300 | 1,302 | ||
| Greater Bay Bancorp |
17,250 | 480 | ||
| Greenhill & Co., Inc. |
16,500 | 1,134 | ||
| *Interactive Brokers Group, Inc. — Class A |
11,400 | 309 | ||
| *KBW, Inc. |
28,200 | 829 | ||
| optionsXpress Holdings, Inc. |
34,000 | 872 | ||
| *Portfolio Recovery Associates, Inc. |
15,000 | 900 | ||
| PrivateBancorp, Inc. |
4,800 | 138 | ||
| Total |
6,617 | |||
| Health Care (0.4%) |
||||
| *Adams Respiratory Therapeutics, Inc. |
14,800 | 583 | ||
| *Allscripts Healthcare Solutions, Inc. |
28,600 | 729 | ||
| *Digene Corp. |
27,000 | 1,621 | ||
| *Hologic, Inc. |
6,500 | 360 | ||
| *Kyphon, Inc. |
28,500 | 1,372 | ||
| Meridian Bioscience, Inc. |
31,650 | 686 | ||
| *Natus Medical, Inc. |
74,300 | 1,183 | ||
| *Noven Pharmaceuticals, Inc. |
41,900 | 983 | ||
| *Obagi Medical Products, Inc. |
36,700 | 650 | ||
| *Pediatrix Medical Group, Inc. |
17,400 | 960 | ||
| *Providence Service Corp. |
54,400 | 1,454 | ||
| *Psychiatric Solutions, Inc. |
38,100 | 1,382 | ||
| *Thoratec Corp. |
34,300 | 631 | ||
| Total |
12,594 | |||
| Industrials (0.5%) |
||||
| *The Advisory Board Co. |
28,600 | 1,589 | ||
| *American Commercial Lines, Inc. |
18,200 | 474 | ||
| Bucyrus International, |
21,100 | 1,493 | ||
| C.H. Robinson Worldwide, Inc. |
16,500 | 866 | ||
| *Corrections Corp. of America |
24,200 | 1,527 | ||
| *Houston Wire & Cable Co. |
36,900 | 1,048 | ||
| *Huron Consulting Group, Inc. |
18,600 | 1,358 | ||
| Interface, Inc. — Class A |
75,800 | 1,430 | ||
The Accompanying Notes are an Integral Part of the Financial Statements.
62
Balanced Portfolio
Table of Contents
Balanced Portfolio
| Small Cap Common Stocks (3.0%) |
Shares/ $ Par |
Value $ (000’s) | ||
| Industrials continued |
||||
| Knight Transportation, Inc. |
69,100 | 1,339 | ||
| Knoll, Inc. |
51,800 | 1,160 | ||
| *Marlin Business Services Corp. |
38,600 | 823 | ||
| *VistaPrint, Ltd. |
18,100 | 692 | ||
| Total |
13,799 | |||
| Information Technology (0.9%) |
||||
| *Aruba Networks, Inc. |
33,000 | 663 | ||
| *Bankrate, Inc. |
17,900 | 858 | ||
| *Blackboard, Inc. |
52,000 | 2,190 | ||
| *comScore, Inc. |
523 | 12 | ||
| *Comtech Group, Inc. |
39,700 | 655 | ||
| *Cymer, Inc. |
14,100 | 567 | ||
| *Data Domain, Inc. |
3,100 | 71 | ||
| *DealerTrack Holdings, Inc. |
54,200 | 1,997 | ||
| *Diodes, Inc. |
30,700 | 1,282 | ||
| *Forrester Research, Inc. |
22,800 | 641 | ||
| *IHS, Inc. — Class A |
9,800 | 451 | ||
| *Kenexa Corp. |
62,800 | 2,368 | ||
| *Limelight Networks, Inc. |
41,906 | 829 | ||
| *Loopnet, Inc. |
18,200 | 425 | ||
| *Macrovision Corp. |
35,700 | 1,073 | ||
| Small Cap Common Stocks (3.0%) |
Shares/ $ Par |
Value $ (000’s) | ||
| Information Technology continued |
||||
| *Mellanox Technologies, Ltd. |
25,700 | 533 | ||
| *MKS Instruments, Inc. |
16,300 | 452 | ||
| *Netlogic Microsystems, Inc. |
28,700 | 914 | ||
| *Polycom, Inc. |
10,600 | 356 | ||
| *Riverbed Technology, Inc. |
12,100 | 530 | ||
| *Silicon Image, Inc. |
72,100 | 619 | ||
| *SiRF Technology Holdings, Inc. |
31,600 | 655 | ||
| *Sohu.com, Inc. |
45,400 | 1,452 | ||
| *SonicWALL, Inc. |
62,400 | 536 | ||
| *Spreadtrum Communications, Inc. |
3,100 | 45 | ||
| *Switch & Data Facilities Co. |
71,300 | 1,368 | ||
| *Synaptics, Inc. |
19,100 | 684 | ||
| *Synchronoss Technologies, Inc. |
34,700 | 1,018 | ||
| Syntel, Inc. |
9,878 | 300 | ||
| *Tessera Technologies, Inc. |
20,100 | 592 | ||
| *THQ, Inc. |
52,000 | 1,587 | ||
| *The Ultimate Software Group, Inc. |
45,700 | 1,322 | ||
| *ValueClick, Inc. |
20,100 | 592 | ||
| Total |
27,888 | |||
| Small Cap Common Stocks (3.0%) |
Shares/ $ Par |
Value $ (000’s) | ||
| Materials (0.1%) |
||||
| A.M. Castle & Co. |
7,100 | 255 | ||
| Airgas, Inc. |
30,100 | 1,442 | ||
| Silgan Holdings, Inc. |
15,500 | 857 | ||
| Total |
2,554 | |||
| Telecommunication Services (0.0%) | ||||
| *Glu Mobile, Inc. |
27,986 | 389 | ||
| Total |
389 | |||
| Utilities (0.1%) |
||||
| ITC Holdings Corp. |
42,300 | 1,719 | ||
| Total |
1,719 | |||
| Total Small Cap |
89,436 | |||
| Total Domestic Common Stocks and Warrants (Cost: $871,973) |
1,126,894 | |||
| Foreign Common Stocks (11.1%) | Country | Shares/ $ Par |
Value $ (000’s) | |||
| Consumer Discretionary (1.8%) |
||||||
| British Sky Broadcasting Group PLC |
United Kingdom | 162,970 | 2,050 | |||
| Burberry Group PLC |
United Kingdom | 191,280 | 2,614 | |||
| *Central European Media Enterprises, Ltd. |
Czech Republic | 26,715 | 2,607 | |||
| Compagnie Financiere Richemont SA |
Switzerland | 38,025 | 2,288 | |||
| Esprit Holdings, Ltd. |
Hong Kong | 221,200 | 2,816 | |||
| Fiat SPA |
Italy | 164,175 | 4,891 | |||
| *Focus Media Holding, Ltd. |
China | 62,300 | 3,147 | |||
| Hugo Boss AG |
Germany | 37,270 | 2,231 | |||
| Inditex SA |
Spain | 54,830 | 3,234 | |||
| Intercontinental Hotels Group PLC |
United Kingdom | 97,323 | 2,408 | |||
| Kuoni Reisen Holding |
Switzerland | 3,645 | 2,188 | |||
| Makita Corp. |
Japan | 45,500 | 2,035 | |||
| Point, Inc. |
Japan | 36,850 | 2,181 | |||
| PPR |
France | 14,610 | 2,549 | |||
| Renault SA |
France | 9,610 | 1,541 | |||
| Sol Melia SA |
Spain | 124,470 | 2,768 | |||
| Swatch Group AG |
Switzerland | 10,025 | 2,847 | |||
| Toyota Motor Corp. |
Japan | 35,800 | 2,257 | |||
| *Urbi Desarollos Urbanos SA |
Mexico | 708,400 | 3,200 | |||
| WPP Group PLC |
United Kingdom | 145,485 | 2,161 | |||
| Total |
52,013 | |||||
| Consumer Staples (0.8%) |
||||||
| *Barry Callebaut AG |
Switzerland | 3,600 | 2,727 | |||
| Coca Cola Hellenic Bottling Co. SA |
Greece | 59,930 | 2,757 | |||
| Heineken NV |
Netherlands | 43,985 | 2,584 | |||
| Iaws Group PLC |
Ireland | 89,880 | 1,882 | |||
| InBev NV |
Belgium | 31,690 | 2,509 | |||
| Kerry Group PLC |
Ireland | 63,175 | 1,764 | |||
| Foreign Common Stocks (11.1%) | Country | Shares/ $ Par |
Value $ (000’s) | |||
| Consumer Staples continued |
||||||
| Reckitt Benckiser PLC |
United Kingdom | 71,210 | 3,899 | |||
| Tesco PLC |
United Kingdom | 338,310 | 2,814 | |||
| Unilever NV |
Netherlands | 39,750 | 1,236 | |||
| Woolworths, Ltd. |
Australia | 113,925 | 2,607 | |||
| Total |
24,779 | |||||
| Energy (0.4%) |
||||||
| *Artumas Group, Inc. |
Norway | 98,200 | 991 | |||
| Cameco Co. |
Canada | 61,355 | 3,110 | |||
| *China Coal Energy Co. |
China | 1,308,000 | 1,961 | |||
| *Electromagnetic GeoServices AS |
Norway | 51,550 | 1,031 | |||
| Expro International Group |
United Kingdom | 69,650 | 1,357 | |||
| *Petroleum Geo-Services ASA |
Norway | 100,500 | 2,487 | |||
| Reliance Industries, Ltd. |
India | 30,355 | 1,264 | |||
| *Seajacks International, Ltd. |
Norway | 18,050 | 187 | |||
| Total |
12,388 | |||||
| Financials (1.7%) |
||||||
| Admiral Group PLC |
United Kingdom | 114,451 | 2,031 | |||
| Aeon Mall Co., Ltd. |
Japan | 80,500 | 2,469 | |||
| Allianz SE |
Germany | 15,045 | 3,526 | |||
| Allied Irish Banks PLC |
Ireland | 51,205 | 1,392 | |||
| Anglo Irish Bank Corp PLC |
Ireland | 256,470 | 5,215 | |||
| Ardepro Co., Ltd. |
Japan | 6,550 | 2,039 | |||
| AXA SA |
France | 66,645 | 2,860 | |||
| Azimut Holding SPA |
Italy | 201,030 | 3,404 | |||
| *Banca Popolare Italiana Scrl |
Italy | 84,890 | 1,297 | |||
| Banco Espanol de Credito SA |
Spain | 81,000 | 1,835 | |||
| Banco Espirito Santo SA |
Portugal | 57,475 | 1,280 | |||
| Banco Popolare di Verona e Novara Scrl |
Italy | 42,540 | 1,232 | |||
| Credit Suisse Group |
Switzerland | 41,765 | 2,962 | |||
The Accompanying Notes are an Integral Part of the Financial Statements.
Balanced Portfolio
63
Table of Contents
Balanced Portfolio
| Foreign Common Stocks (11.1%) | Country | Shares/ $ Par |
Value $ (000’s) | |||
| Financials continued |
||||||
| Erste Bank Der Oesterreichischen Sparkassen AG |
Austria | 38,390 | 2,997 | |||
| Hopson Development Holdings, Ltd. |
Hong Kong | 240,000 | 674 | |||
| Hypo Real Estate Holding AG |
Germany | 36,600 | 2,371 | |||
| Manulife Financial Corp. |
Canada | 38,000 | 1,418 | |||
| Piraeus Bank SA |
Greece | 82,670 | 3,025 | |||
| *Scandinavian Property Development ASA |
Norway | 74,060 | 590 | |||
| *TAG Tegernsee Immobilien Und Beteiligungs AG |
Germany | 102,669 | 1,264 | |||
| The Toronto-Dominion Bank |
Canada | 26,900 | 1,839 | |||
| Uncredito Italiano Spa |
Italy | 300,970 | 2,677 | |||
| Total |
48,397 | |||||
| Health Care (0.7%) |
||||||
| *Actelion, Ltd. |
Switzerland | 30,410 | 1,357 | |||
| CSL, Ltd. |
Australia | 47,105 | 3,502 | |||
| Daiichi Sankyo Co., Ltd. |
Japan | 85,500 | 2,272 | |||
| Merck KGaA |
Germany | 15,260 | 2,099 | |||
| Nobel Biocare Holding AG |
Switzerland | 7,235 | 2,362 | |||
| Stada Arzneimittel AG |
Germany | 41,215 | 2,620 | |||
| Takeda Pharmaceutical Co., Ltd. |
Japan | 19,400 | 1,252 | |||
| Terumo Corp. |
Japan | 62,500 | 2,412 | |||
| *William Demant Holding A/S |
Denmark | 25,325 | 2,499 | |||
| Total |
20,375 | |||||
| Industrials (2.5%) |
||||||
| ABB, Ltd., ADR |
Switzerland | 196,200 | 4,433 | |||
| Aker Yards ASA |
Norway | 92,900 | 1,605 | |||
| *Alstom |
France | 20,060 | 3,340 | |||
| Atlas Copco AB |
Sweden | 151,800 | 2,534 | |||
| Bharat Heavy Electricals, Ltd. |
India | 66,700 | 2,511 | |||
| CAE, Inc. |
Canada | 258,500 | 3,497 | |||
| Capita Group PLC |
United Kingdom | 215,665 | 3,126 | |||
| China Infrastructure Machinery Holdings, Ltd. |
China | 606,000 | 1,326 | |||
| Cosco Corp., Singapore, Ltd. |
Singapore | 204,000 | 500 | |||
| *Deutz AG |
Germany | 52,365 | 679 | |||
| Flsmidth & Co A/S |
Denmark | 42,400 | 3,327 | |||
| *Grafton Group PLC |
Ireland | 101,675 | 1,462 | |||
| Hopewell Holdings |
Hong Kong | 445,000 | 1,813 | |||
| IVCRL Infrastructures & Projects, Ltd. |
India | 220,945 | 1,944 | |||
| Komatsu, Ltd. |
Japan | 86,400 | 2,502 | |||
| Kuehne & Nagel International AG |
Switzerland | 33,600 | 3,095 | |||
| Metso Oyj |
Finland | 52,690 | 3,094 | |||
| Michael Page International PLC |
United Kingdom | 320,678 | 3,371 | |||
| MTU Aero Engines Holding AG |
Germany | 54,460 | 3,533 | |||
| *Prysmian SPA |
Italy | 68,330 | 1,674 | |||
| PT Berlian Laju Tanker Tbk |
Indonesia | 8,391,000 | 1,905 | |||
| Sembcorp Marine, Ltd. |
Singapore | 990,000 | 3,166 | |||
| SGS SA |
Switzerland | 2,490 | 2,947 | |||
| Siemens AG |
Germany | 28,050 | 4,034 | |||
| *Thielert AG |
Germany | 11,300 | 345 | |||
| Tianjin Development Holdings, Ltd. |
Hong Kong | 1,907,000 | 2,076 | |||
| Foreign Common Stocks (11.1%) | Country | Shares/ $ Par |
Value $ (000’s) | |||
| Industrials continued |
||||||
| TNT NV |
Netherlands | 53,950 | 2,433 | |||
| Vinci SA |
France | 45,540 | 3,397 | |||
| Wavin NV |
Netherlands | 110,735 | 2,664 | |||
| Total |
72,333 | |||||
| Information Technology (0.9%) |
||||||
| *Autonomy Corp. PLC |
United Kingdom | 215,865 | 3,092 | |||
| *Blinkx PLC |
United Kingdom | 215,865 | 189 | |||
| Cap Gemini SA |
France | 29,890 | 2,186 | |||
| EVS Broadcast Equipment SA |
Belgium | 16,180 | 1,330 | |||
| *Gresham Computing PLC |
United Kingdom | 126,002 | 318 | |||
| Kontron AG |
Germany | 182,410 | 3,429 | |||
| Neopost SA |
France | 20,710 | 3,029 | |||
| Nippon Electric Glass Co., Ltd. |
Japan | 186,000 | 3,266 | |||
| Star Micronics Co., Ltd. |
Japan | 130,800 | 3,481 | |||
| Sumco Corp. |
Japan | 21,200 | 1,061 | |||
| *Temenos Group AG |
Switzerland | 146,550 | 3,517 | |||
| Vtech Holdings, Ltd. |
Hong Kong | 338,000 | 2,859 | |||
| Total |
27,757 | |||||
| Materials (1.0%) |
||||||
| Akzo Nobel NV |
Netherlands | 29,185 | 2,518 | |||
| Anglo American PLC |
United Kingdom | 50,675 | 2,930 | |||
| BHP Billiton, Ltd. |
Australia | 110,635 | 3,302 | |||
| Companhia Vale do Rio Doce, ADR |
Brazil | 87,500 | 3,898 | |||
| *Crew Minerals ASA |
Norway | 433,100 | 1,265 | |||
| CRH PLC |
Ireland | 68,685 | 3,398 | |||
| *Gammon Gold, Inc. |
Canada | 50,575 | 638 | |||
| Imperial Chemical Industries PLC |
United Kingdom | 243,845 | 3,005 | |||
| K+S AG |
Germany | 26,905 | 4,116 | |||
| Sika AG |
Switzerland | 940 | 1,918 | |||
| *Smurfit Kappa Group PLC |
Ireland | 48,940 | 1,224 | |||
| Syngenta AG |
Switzerland | 12,665 | 2,469 | |||
| Total |
30,681 | |||||
| Other Holdings (0.8%) |
||||||
| iShares MSCI Brazil Index Fund |
Brazil | 116,590 | 7,161 | |||
| iShares MSCI South Korea Index Fund |
South Korea | 133,635 | 8,059 | |||
| iShares MSCI Taiwan Index Fund |
Taiwan | 165,390 | 2,646 | |||
| Nomura ETF — Nikkei 225 |
Japan | 16,960 | 2,519 | |||
| Nomura Topix ETF |
Japan | 164,200 | 2,386 | |||
| Total |
22,771 | |||||
| Telecommunications (0.3%) |
||||||
| *Bharti Airtel, Ltd. |
India | 72,885 | 1,496 | |||
| China Mobile, Ltd. |
Hong Kong | 152,000 | 1,635 | |||
| *Freenet AG |
Germany | 79,530 | 2,590 | |||
| Tele2 AB |
Sweden | 123,740 | 2,019 | |||
| *Telenor ASA |
Norway | 116,600 | 2,276 | |||
| Total |
10,016 | |||||
| Utilities (0.2%) |
||||||
| Cez |
Czech Republic | 51,715 | 2,672 | |||
| PT Perusahaan Gas Negara |
Indonesia | 606,500 | 634 | |||
| Veolia Environnement |
France | 33,055 | 2,584 | |||
| Total |
5,890 | |||||
| Total Foreign Common Stocks |
327,400 | |||||
The Accompanying Notes are an Integral Part of the Financial Statements.
64
Balanced Portfolio
Table of Contents
Balanced Portfolio
| Investment Grade Segment (16.2%) |
Shares/ $ Par |
Value $ (000’s) | ||
| Aerospace/Defense (0.9%) |
||||
| BAE Systems Holdings, Inc., |
2,565,000 | 2,508 | ||
| Boeing Capital Corp., |
3,359,000 | 3,336 | ||
| General Dynamics Corp., |
6,398,000 | 6,270 | ||
| General Dynamics Corp., |
890,000 | 833 | ||
| L-3 Communications Corp., 6.375%, 10/15/15 |
5,735,000 | 5,420 | ||
| L-3 Communications Corp., 7.625%, 6/15/12 |
850,000 | 870 | ||
| Lockheed Martin Corp., |
1,720,000 | 1,715 | ||
| Raytheon Co., |
4,584,000 | 4,566 | ||
| Total |
25,518 | |||
| Auto Manufacturing (0.1%) |
||||
| DaimlerChrysler NA Holdings Corp., |
2,590,000 | 2,597 | ||
| DaimlerChrysler NA Holdings Corp., |
315,000 | 398 | ||
| Total |
2,995 | |||
| Banking (1.7%) |
||||
| BA Covered Bond Issuer, |
2,605,000 | 2,614 | ||
| Bank of America Corp., |
2,880,000 | 2,761 | ||
| Bank of America Corp., |
2,680,000 | 2,638 | ||
| Bank of America NA, |
1,055,000 | 1,007 | ||
| Bank of New York, |
1,550,000 | 1,527 | ||
| Bank One Corp., |
4,480,000 | 4,387 | ||
| Barclays Bank PLC, |
1,405,000 | 1,358 | ||
| BB&T Corp., |
975,000 | 897 | ||
| BNP Paribas, |
300,000 | 303 | ||
| Citigroup, Inc., |
5,360,000 | 5,190 | ||
| Credit Argicole SA, 6.637%, 5/31/17 144A |
525,000 | 510 | ||
| Credit Suisse Guernsey Ltd., 5.86%, 5/15/49 |
210,000 | 202 | ||
| Deutsche Bank Capital Funding Trust, |
880,000 | 838 | ||
| JP Morgan Chase & Co., 6.125%, 6/27/17 |
470,000 | 474 | ||
| JPMorgan Chase Bank NA, 5.875%, 6/13/16 |
3,055,000 | 3,060 | ||
| Investment Grade Segment (16.2%) |
Shares/ $ Par |
Value $ (000’s) | ||
| Banking continued |
||||
| M&I Marshall & Ilsley Bank, 5.15%, 2/22/12 |
2,480,000 | 2,443 | ||
| Mellon Bank NA, |
1,640,000 | 1,599 | ||
| National Australia Bank, Ltd., 4.80%, 4/6/10 144A |
4,208,000 | 4,147 | ||
| Northern Trust Corp., 5.30%, 8/29/11 |
795,000 | 792 | ||
| PNC Funding Corp., 5.625%, 2/1/17 |
650,000 | 637 | ||
| State Street Bank and Trust Co., 5.30%, 1/15/16 |
1,780,000 | 1,729 | ||
| UnionBanCal Corp., 5.25%, 12/16/13 |
810,000 | 788 | ||
| US Bank NA, |
2,680,000 | 2,509 | ||
| Washington Mutual Bank, 5.95%, 5/20/13 |
1,690,000 | 1,687 | ||
| Wachovia Corp., |
3,080,000 | 3,064 | ||
| Wachocvia Corp., |
1,610,000 | 1,588 | ||
| Wells Fargo Bank NA, 5.75%, 5/16/16 |
90,000 | 90 | ||
| Zions Bancorporation, 5.50%, 11/16/15 |
2,290,000 | 2,201 | ||
| Total |
51,040 | |||
| Beverage/Bottling (0.4%) |
||||
| Anheuser-Busch Companies, Inc., |
2,000,000 | 1,870 | ||
| Anheuser-Busch Companies, Inc., |
515,000 | 473 | ||
| Anheuser-Busch Companies, Inc., |
155,000 | 146 | ||
| Bottling Group LLC, 5.50%, 4/1/16 |
1,120,000 | 1,093 | ||
| Constellation Brands, Inc., 7.25%, 9/1/16 |
2,370,000 | 2,311 | ||
| Diageo Capital PLC, 4.375%, 5/3/10 |
1,578,000 | 1,533 | ||
| PepsiAmericas, Inc., 4.875%, 1/15/15 |
2,175,000 | 2,046 | ||
| PepsiCo, Inc., |
1,075,000 | 1,062 | ||
| SABMiller PLC, |
2,595,000 | 2,639 | ||
| Total |
13,173 | |||
| Building Products (0.0%) |
||||
| CRH America, Inc., 6.00%, 9/30/16 |
810,000 | 801 | ||
| Total |
801 | |||
| Cable/Media/Broadcasting/Satellite (0.8%) | ||||
| CBS Corp., |
460,000 | 472 | ||
| Investment Grade Segment (16.2%) |
Shares/ $ Par |
Value $ (000’s) | ||
| Cable/Media/Broadcasting/Satellite continued | ||||
| Clear Channel Communications, Inc., 6.25%, 3/15/11 |
3,275,000 | 3,152 | ||
| Comcast Corp., |
3,560,000 | 3,448 | ||
| Cox Communications, Inc., 4.625%, 1/15/10 |
1,390,000 | 1,358 | ||
| Historic TW, Inc., |
325,000 | 316 | ||
| News America, Inc., |
640,000 | 609 | ||
| News America, Inc., |
110,000 | 101 | ||
| Rogers Cable, Inc., |
3,970,000 | 3,850 | ||
| Rogers Cable, Inc., |
200,000 | 202 | ||
| TCI Communications, Inc., 8.75%, 8/1/15 |
1,030,000 | 1,191 | ||
| Time Warner Cable, Inc., 5.40%, 7/2/12 144A |
1,310,000 | 1,286 | ||
| Time Warner Cable, Inc., 6.55%, 5/1/37 144A |
230,000 | 222 | ||
| Time Warner Entertainment Co. LP, 7.25%, 9/1/08 |
5,435,000 | 5,535 | ||
| Time Warner Entertainment Co. LP, 8.375%, 3/15/23 |
1,650,000 | 1,894 | ||
| Viacom Inc., |
1,080,000 | 1,078 | ||
| Total |
24,714 | |||
| Conglomerate/Diversified Manufacturing (0.1%) | ||||
| General Electric Co., 5.00%, 2/1/13 |
1,000,000 | 970 | ||
| Honeywell International, Inc., 5.30%, 3/15/17 |
515,000 | 495 | ||
| United Technologies Corp., 6.35%, 3/1/11 |
1,120,000 | 1,152 | ||
| Total |
2,617 | |||
| Consumer Products (0.3%) | ||||
| The Clorox Co., |
3,365,000 | 3,260 | ||
| Fortune Brands, Inc., 5.375%, 1/15/16 |
935,000 | 868 | ||
| The Gillette Co., |
5,000,000 | 4,867 | ||
| The Procter & Gamble Co., 5.55%, 3/5/37 |
645,000 | 607 | ||
| Total |
9,602 | |||
| Electric Utilities (2.3%) |
||||
| Carolina Power & Light, Inc., 5.15%, 4/1/15 |
420,000 | 403 | ||
| Carolina Power & Light, Inc., 6.50%, 7/15/12 |
415,000 | 430 | ||
The Accompanying Notes are an Integral Part of the Financial Statements.
Balanced Portfolio
65
Table of Contents
Balanced Portfolio
| Investment Grade Segment (16.2%) |
Shares/ $ Par |
Value $ (000’s) | ||
| Electric Utilities continued |
||||
| CenterPoint Energy Houston Electric LLC, 5.70%, 3/15/13 |
260,000 | 259 | ||
| CenterPoint Energy Houston Electric LLC, 6.95%, 3/15/33 |
270,000 | 290 | ||
| CMS Energy Corp., 6.875%, 12/15/15 |
1,270,000 | 1,287 | ||
| Consolidated Edison Co. of New York, |
560,000 | 543 | ||
| Consolidated Edison Co. of New York, |
605,000 | 589 | ||
| Consumer Energy Co., 4.80%, 2/17/09 |
6,580,000 | 6,500 | ||
| DTE Energy Co., |
7,520,000 | 7,856 | ||
| Duke Energy Corp., |
1,675,000 | 1,721 | ||
| Duquesne Light Holdings, Inc., 5.50%, 8/15/15 |
1,000,000 | 933 | ||
| Entergy Mississippi, Inc., 6.25%, 4/1/34 |
1,030,000 | 974 | ||
| Florida Power & Light Co., 5.625%, 4/1/34 |
1,065,000 | 998 | ||
| Florida Power Corp., 4.50%, 6/1/10 |
3,636,000 | 3,536 | ||
| FPL Group Capital, Inc., 5.551%, 2/16/08 |
4,245,000 | 4,242 | ||
| Indiana Michigan Power, 5.05%, 11/15/14 |
2,660,000 | 2,495 | ||
| Kiowa Power Partners LLC, |
1,361,710 | 1,311 | ||
| Kiowa Power Partners LLC, |
1,185,000 | 1,138 | ||
| MidAmerican Energy Holdings Co., |
260,000 | 245 | ||
| Monongahela Power Co., 5.70%, 3/15/17 144A |
860,000 | 842 | ||
| Nevada Power Co., |
1,830,000 | 1,788 | ||
| Nevada Power Co., |
1,560,000 | 1,576 | ||
| Northern States Power Co., 5.25%, 10/1/18 |
270,000 | 253 | ||
| Oncor Electric Delivery Co., 6.375%, 1/15/15 |
1,340,000 | 1,359 | ||
| Oncor Electric Delivery Co., 7.00%, 9/1/22 |
880,000 | 919 | ||
| Pacific Gas & Electric Co., 5.80%, 3/1/37 |
255,000 | 238 | ||
| Pacific Gas & Electric Co., 6.05%, 3/1/34 |
1,035,000 | 1,003 | ||
| PacifiCorp, 5.45%, 9/15/13 |
4,040,000 | 3,980 | ||
| PacifiCorp, 5.75%, 4/1/37 |
840,000 | 787 | ||
| PPL Electric Utilities Corp., 4.30%, 6/1/13 |
2,475,000 | 2,270 | ||
| Investment Grade Segment (16.2%) |
Shares/ $ Par |
Value $ (000’s) | ||
| Electric Utilities continued |
||||
| PPL Electric Utilities Corp., 5.875%, 8/15/07 |
725,000 | 725 | ||
| PPL Electric Utilities Corp., 6.25%, 8/15/09 |
215,000 | 219 | ||
| PPL Energy Supply LLC, 6.00%, 12/15/36 |
425,000 | 383 | ||
| Progress Energy, Inc., 6.85%, 4/15/12 |
1,155,000 | 1,211 | ||
| Public Service Co. of Colorado, 5.50%, 4/1/14 |
1,320,000 | 1,299 | ||
| Public Service Electric & Gas Co., 5.00%, 1/1/13 |
1,500,000 | 1,450 | ||
| Public Service Electric & Gas Co., 5.70%, 12/1/36 |
1,600,000 | 1,502 | ||
| Puget Sound Energy, Inc., 3.363%, 6/1/08 |
2,465,000 | 2,418 | ||
| Puget Sound Energy, Inc., 6.274%, 3/15/37 |
1,125,000 | 1,109 | ||
| Sierra Pacific Power Co., 6.75%, 7/1/37 |
525,000 | 533 | ||
| Southern California Edison Co., 5.00%, 1/15/16 |
2,055,000 | 1,941 | ||
| Southern California Edison Co., 5.55%, 1/15/37 |
320,000 | 296 | ||
| Tampa Electric Co., |
385,000 | 373 | ||
| Tampa Electric Co., |
520,000 | 531 | ||
| Toledo Edison Co. |
2,675,000 | 2,508 | ||
| Union Electric Co., |
180,000 | 184 | ||
| Virginia Electric & Power Co., 6.00%, 5/15/37 |
2,370,000 | 2,265 | ||
| Xcel Energy, Inc., |
780,000 | 789 | ||
| Total |
70,501 | |||
| Electronics (0.0%) |
||||
| Cisco Systems, Inc., 5.50%, 2/22/16 |
280,000 | 273 | ||
| Total |
273 | |||
| Food Processors (0.4%) |
||||
| Delhaize America, Inc., 6.50%, 6/15/17 144A |
215,000 | 216 | ||
| General Mills, Inc., |
970,000 | 945 | ||
| Kellogg Co., 6.60%, 4/1/11 |
4,675,000 | 4,834 | ||
| Kraft Foods, Inc., |
560,000 | 538 | ||
| Kraft Foods, Inc., |
4,020,000 | 4,086 | ||
| Total |
10,619 | |||
| Gaming/Lodging/Leisure (0.1%) |
||||
| Harrah’s Operating Co., Inc., 5.75%, 10/1/17 |
590,000 | 472 | ||
| Royal Caribbean Cruises, Ltd., 7.00%, 6/15/13 |
1,555,000 | 1,562 | ||
| Total |
2,034 | |||
| Investment Grade Segment (16.2%) |
Shares/ $ Par |
Value $ (000’s) | ||
| Gas Pipelines (0.2%) |
||||
| Consolidated Natural Gas Co., 5.00%, 12/1/14 |
2,050,000 | 1,936 | ||
| Kinder Morgan Energy Partners LP, |
1,800,000 | 1,880 | ||
| Kinder Morgan Finance, 5.35%, 1/5/11 |
2,440,000 | 2,387 | ||
| Southern Natural Gas Co., 5.90%, 4/1/17 144A |
200,000 | 193 | ||
| Total |
6,396 | |||
| Independent Finance (0.4%) |
||||
| General Electric Capital Corp., 5.375%, 10/20/16 |
1,000,000 | 967 | ||
| GMAC LLC, |
2,135,000 | 2,030 | ||
| HSBC Finance Corp., 4.125%, 11/16/09 |
4,400,000 | 4,273 | ||
| International Lease Finance Corp., |
2,190,000 | 2,107 | ||
| iStar Financial, Inc., 5.15%, 3/1/12 |
1,900,000 | 1,828 | ||
| Total |
11,205 | |||
| Industrials — Other (0.2%) |
||||
| Centex Corp., |
765,000 | 730 | ||
| Centex Corp., |
335,000 | 352 | ||
| DR Horton, Inc., |
540,000 | 507 | ||
| DR Horton, Inc., |
160,000 | 166 | ||
| KB HOME, 7.75%, 2/1/10 |
2,250,000 | 2,238 | ||
| Lennar Corp., |
1,125,000 | 1,109 | ||
| Total |
5,102 | |||
| Information/Data Technology (0.0%) | ||||
| Seagate Technology HDD Holdings, 6.80%, 10/1/16 |
715,000 | 686 | ||
| Siemens AG, |
645,000 | 636 | ||
| Total |
1,322 | |||
| Machinery (0.1%) |
||||
| John Deere Capital Corp., 4.50%, 8/25/08 |
1,325,000 | 1,310 | ||
| John Deere Capital Corp., 5.50%, 4/13/17 |
525,000 | 512 | ||
| Total |
1,822 | |||
| Metals/Mining (0.1%) |
||||
| Alcoa, Inc., 5.55%, 2/1/17 |
1,000,000 | 954 | ||
| Alcoa, Inc., 5.72%, 2/23/19 |
630,000 | 597 | ||
| Alcoa, Inc., 5.90%, 2/1/27 |
1,035,000 | 963 | ||
| Total |
2,514 | |||
The Accompanying Notes are an Integral Part of the Financial Statements.
66
Balanced Portfolio
Table of Contents
Balanced Portfolio
| Investment Grade Segment (16.2%) |
Shares/ $ Par |
Value $ (000’s) | ||
| Mortgage Banking (0.2%) | ||||
| Countrywide Financial Corp., 5.80%, 6/7/12 |
730,000 | 725 | ||
| Residential Capital LLC, 6.00%, 2/22/11 |
2,285,000 | 2,211 | ||
| Residential Capital LLC, 6.50%, 4/17/13 |
2,090,000 | 2,020 | ||
| Total |
4,956 | |||
| Natural Gas Distributors (0.0%) | ||||
| NiSource Finance Corp., 5.40%, 7/15/14 |
785,000 | 755 | ||
| Total |
755 | |||
| Oil and Gas (1.2%) |
||||
| Anadarko Finance Co., 5.95%, 9/15/16 |
810,000 | 791 | ||
| Anadarko Petroleum Corp., 6.45%, 9/15/36 |
495,000 | 476 | ||
| Anadarko Petroleum Corp., 7.50%, 5/1/31 |
1,040,000 | 1,117 | ||
| Apache Corp., |
210,000 | 205 | ||
| Apache Corp., |
245,000 | 234 | ||
| Canadian Natural Resources, Ltd., |
400,000 | 387 | ||
| Canadian Natural Resources, Ltd., |
400,000 | 378 | ||
| Canadian Natural Resources, Ltd., |
315,000 | 309 | ||
| Conoco Funding Co., 6.35%, 10/15/11 |
3,230,000 | 3,332 | ||
| ConocoPhilips Canada Funding Co., |
1,390,000 | 1,374 | ||
| ConocoPhilips Canada Funding Co., |
365,000 | 359 | ||
| Devon Energy Corp., 7.95%, 4/15/32 |
250,000 | 292 | ||
| Devon Financing Corp. ULC, 6.875%, 9/30/11 |
3,040,000 | 3,175 | ||
| Encana Holdings Finance Corp., 5.80%, 5/1/14 |
1,075,000 | 1,070 | ||
| Hess Corp., |
355,000 | 373 | ||
| Nexen, Inc., |
1,955,000 | 1,754 | ||
| Occidental Petroleum, 4.00%, 11/30/07 |
2,800,000 | 2,784 | ||
| Pemex Project Funding Master Trust, |
3,540,000 | 3,474 | ||
| Petro-Canada, |
995,000 | 916 | ||
| Pioneer Natural Resource, 6.875%, 5/1/18 |
1,840,000 | 1,744 | ||
| Suncoc, Inc., |
825,000 | 795 | ||
| Investment Grade Segment (16.2%) |
Shares/ $ Par |
Value $ (000’s) | ||
| Oil and Gas continued | ||||
| Suncor Energy, Inc., 6.50%, 6/15/38 |
415,000 | 418 | ||
| Talisman Energy, Inc., 5.85%, 2/1/37 |
2,185,000 | 1,929 | ||
| Tesoro Corp., |
2,070,000 | 2,054 | ||
| Tesoro Corp., |
2,615,000 | 2,556 | ||
| Valero Energy Corp., 6.125%, 6/15/17 |
260,000 | 259 | ||
| Valero Energy Corp., 6.625%, 6/15/37 |
1,280,000 | 1,274 | ||
| XTO Energy, Inc., |
260,000 | 248 | ||
| Total |
34,077 | |||
| Other Finance (0.2%) |
||||
| Capmark Financial Group, |
320,000 | 315 | ||
| SLM Corp., |
1,300,000 | 1,114 | ||
| SLM Corp., |
4,560,000 | 4,222 | ||
| Total |
5,651 | |||
| Other Holdings (1.8%) |
||||
| CDX North America High Yield, |
25,000,000 | 23,656 | ||
| CDX North America High Yield, |
30,000,000 | 28,369 | ||
| Total |
52,025 | |||
| Other Services (0.0%) |
||||
| Waste Management, Inc., 5.00%, 3/15/14 |
855,000 | 798 | ||
| Total |
798 | |||
| Paper and Forest Products (0.0%) | ||||
| Weyerhaeuser Co., 7.375%, 3/15/32 |
130,000 | 132 | ||
| Total |
132 | |||
| Pharmaceuticals (0.1%) |
||||
| Abbott Laboratories, 3.75%, 3/15/11 |
3,750,000 | 3,533 | ||
| Wyeth, 5.95%, 4/1/37 |
750,000 | 717 | ||
| Total |
4,250 | |||
| Property and Casualty Insurance (0.3%) | ||||
| Berkley (WR) Corp., 9.875%, 5/15/08 |
4,310,000 | 4,442 | ||
| Berkshire Hathaway Finance, 3.40%, 7/2/07 |
2,500,000 | 2,500 | ||
| The Progressive Corp., 6.70%, 6/15/37 |
315,000 | 313 | ||
| The Travelers Companies, Inc., |
435,000 | 421 | ||
| Total |
7,676 | |||
| Investment Grade Segment (16.2%) |
Shares/ $ Par |
Value $ (000’s) | ||
| Railroads (0.7%) |
||||
| Burlington North Santa Fe, 6.125%, 3/15/09 |
5,600,000 | 5,658 | ||
| Burlington North Santa Fe, 6.15%, 5/1/37 |
415,000 | 403 | ||
| Canadian Pacific Railway Co., 5.95%, 5/15/37 |
370,000 | 348 | ||
| CSX Corp., 6.15%, 5/1/37 |
830,000 | 797 | ||
| Norfolk Southern Corp., 6.20%, 4/15/09 |
1,390,000 | 1,406 | ||
| Union Pacific Corp., 3.875%, 2/15/09 |
5,600,000 | 5,472 | ||
| Union Pacific Corp., 5.65%, 5/1/17 |
1,045,000 | 1,016 | ||
| Union Pacific Corp., |
1,390,000 | 1,434 | ||
| Union Pacific Corp., 7.375%, 9/15/09 |
2,750,000 | 2,870 | ||
| Total |
19,404 | |||
| Real Estate Investment Trusts (0.8%) | ||||
| Archstone-Smith Operating Trust, |
860,000 | 851 | ||
| AvalonBay Communities, Inc., 5.50%, 1/15/12 |
500,000 | 497 | ||
| BRE Properties, Inc., 5.50%, 3/15/17 |
420,000 | 404 | ||
| Colonial Realty LP, |
360,000 | 358 | ||
| Developers Diversified Realty Corp., |
1,535,000 | 1,504 | ||
| Duke Realty LP, |
835,000 | 832 | ||
| ERP Operating LP, |
1,950,000 | 1,879 | ||
| First Industrial LP, |
1,925,000 | 1,908 | ||
| Health Care Property Investors, Inc., |
400,000 | 392 | ||
| HRPT Properties Trust, 5.75%, 11/1/15 |
1,225,000 | 1,198 | ||
| ProLogis, 5.50%, 3/1/13 |
2,000,000 | 1,977 | ||
| ProLogis, 5.75%, 4/1/16 |
1,190,000 | 1,174 | ||
| Rouse Co. LP/TRC Co-Issuer, Inc., |
4,640,000 | 4,635 | ||
| Simon Property Group LP, 5.375%, 6/1/11 |
3,555,000 | 3,528 | ||
| Simon Property Group LP, 5.60%, 9/1/11 |
890,000 | 890 | ||
| Simon Property Group LP, 6.10%, 5/1/16 |
1,560,000 | 1,579 | ||
| Total |
23,606 | |||
| Retail Food and Drug (0.1%) |
||||
| CVS/Caremark Corp., 4.875%, 9/15/14 |
985,000 | 919 | ||
| CVS/Caremark Corp., 6.125%, 8/15/16 |
890,000 | 882 | ||
The Accompanying Notes are an Integral Part of the Financial Statements.
Balanced Portfolio
67
Table of Contents
Balanced Portfolio
| Investment Grade Segment (16.2%) |
Shares/ $ Par |
Value $ (000’s) | ||
| Retail Food and Drug continued |
||||
| CVS/Caremark Corp., 6.25%, 6/1/27 |
715,000 | 693 | ||
| The Kroger Co., |
90,000 | 91 | ||
| The Kroger Co., |
375,000 | 384 | ||
| Total |
2,969 | |||
| Retail Stores (0.7%) |
||||
| Costco Wholesale Corp., 5.30%, 3/15/12 |
195,000 | 194 | ||
| Costco Wholesale Corp., 5.50%, 3/15/17 |
1,730,000 | 1,687 | ||
| Federated Department Stores, Inc., |
535,000 | 521 | ||
| Federated Retail Holdings, Inc., 5.35%, 3/15/12 |
645,000 | 634 | ||
| Federated Retail Holdings, Inc., 6.30%, 4/1/09 |
3,785,000 | 3,821 | ||
| The Home Depot, Inc., 5.875%, 12/16/36 |
5,340,000 | 4,757 | ||
| JC Penney Corp., Inc., 5.75%, 2/15/18 |
130,000 | 126 | ||
| JC Penney Corp., Inc., 6.375%, 10/15/36 |
260,000 | 248 | ||
| JC Penney Corp., Inc., 6.875%, 10/15/15 |
515,000 | 532 | ||
| JC Penny Corp., Inc., 7.95%, 4/1/17 |
610,000 | 676 | ||
| Macy’s Retail Holdings Inc., 7.00%, 2/15/28 |
120,000 | 116 | ||
| May Department Stores Co., 6.65%, 7/15/24 |
90,000 | 85 | ||
| Target Corp., |
1,510,000 | 1,445 | ||
| Target Corp., |
5,605,000 | 5,597 | ||
| Wal-Mart Stores, Inc., 5.375%, 4/5/17 |
375,000 | 364 | ||
| Wal-Mart Stores, Inc., 5.875%, 4/5/27 |
790,000 | 764 | ||
| Total |
21,567 | |||
| Security Brokers and Dealers (0.6%) | ||||
| Goldman Sachs Group, Inc., 5.15%, 1/15/14 |
3,660,000 | 3,518 | ||
| Goldman Sachs Group, Inc., 5.625%, 1/15/17 |
2,140,000 | 2,051 | ||
| Goldman Sachs Group, Inc., 5.75%, 10/1/16 |
1,170,000 | 1,143 | ||
| Lehman Brothers Holdings, Inc., |
2,385,000 | 2,317 | ||
| Lehman Brothers Holdings, Inc., |
1,010,000 | 995 | ||
| Merrill Lynch & Co. Inc., 5.70%, 5/2/17 |
3,385,000 | 3,259 | ||
| Merrill Lynch & Co., Inc., 6.22%, 9/15/26 |
375,000 | 365 | ||
| Investment Grade Segment (16.2%) |
Shares/ $ Par |
Value $ (000’s) | ||
| Security Brokers and Dealers continued | ||||
| Morgan Stanley, |
1,735,000 | 1,661 | ||
| Morgan Stanley, |
765,000 | 724 | ||
| Morgan Stanley, |
330,000 | 322 | ||
| Morgan Stanley, |
1,035,000 | 1,031 | ||
| Total |
17,386 | |||
| Telecommunications (1.1%) |
||||
| AT&T Corp., |
2,380,000 | 2,829 | ||
| British Telecom PLC, 8.625%, 12/15/30 |
515,000 | 674 | ||
| Cingular Wireless LLC, 7.125%, 12/15/31 |
2,740,000 | 2,919 | ||
| Deutsche Telekom International Finance, 5.75%, 3/23/16 |
665,000 | 649 | ||
| Embarq Corp., |
835,000 | 851 | ||
| Embarq Corp., |
1,940,000 | 1,951 | ||
| Embarq Corp., |
1,230,000 | 1,248 | ||
| France Telecom SA, 8.50%, 3/1/31 |
975,000 | 1,225 | ||
| Rogers Wireless, Inc., 6.375%, 3/1/14 |
1,755,000 | 1,774 | ||
| Sprint Capital Corp., 6.90%, 5/1/19 |
2,535,000 | 2,509 | ||
| Sprint Capital Corp., 8.375%, 3/15/12 |
2,830,000 | 3,083 | ||
| Sprint Capital Corp., 8.75%, 3/15/32 |
470,000 | 528 | ||
| Telecom Italia Capital, 4.00%, 1/15/10 |
3,360,000 | 3,230 | ||
| Telecom Italia Capital, 6.20%, 7/18/11 |
1,620,000 | 1,640 | ||
| Verizon Communications, Inc., 5.50%, 4/1/17 |
1,470,000 | 1,417 | ||
| Verizon Communications, Inc., 5.55%, 2/15/16 |
2,135,000 | 2,080 | ||
| Verizon Global Funding Corp., 5.85%, 9/15/35 |
1,425,000 | 1,307 | ||
| Vodafone Group PLC, 5.50%, 6/15/11 |
2,820,000 | 2,797 | ||
| Total |
32,711 | |||
| Tobacco (0.1%) |
||||
| Reynolds America, Inc., 6.75%, 6/15/17 |
215,000 | 218 | ||
| Reynolds America, Inc., 7.25%, 6/15/37 |
215,000 | 221 | ||
| Reynolds America, Inc., 7.625%, 6/1/16 |
2,175,000 | 2,303 | ||
| Total |
2,742 | |||
| Investment Grade Segment (16.2%) |
Shares/ $ Par |
Value $ (000’s) | ||
| Vehicle Parts (0.1%) |
||||
| Johnson Controls, Inc., 5.25%, 1/15/11 |
1,390,000 | 1,376 | ||
| Johnson Controls, Inc., 5.50%, 1/15/16 |
1,090,000 | 1,055 | ||
| Johnson Controls, Inc., 6.00%, 1/15/36 |
520,000 | 490 | ||
| Total |
2,921 | |||
| Yankee Sovereign (0.1%) |
||||
| United Mexican States, 5.625%, 1/15/17 |
2,050,000 | 2,007 | ||
| Total |
2,007 | |||
| Total Investment Grade Segment (Cost: $491,204) |
477,881 | |||
| Governments (4.2%) | ||||
| Governments (4.2%) |
||||
| Aid-Israel, |
11,600,000 | 4,993 | ||
| Aid-Israel, |
11,500,000 | 4,686 | ||
| Aid-Israel, |
9,840,000 | 9,749 | ||
| Housing & Urban Development, |
14,981,000 | 15,427 | ||
| Overseas Private Investment, |
3,253,120 | 3,086 | ||
| (e)Tennessee Valley Authority Stripped, 8.25%, 4/15/42 |
6,100,000 | 4,890 | ||
| (g)US Treasury, |
23,030,000 | 22,872 | ||
| (g)US Treasury, |
10,905,000 | 10,702 | ||
| (g)US Treasury, |
19,150,000 | 18,360 | ||
| (g)US Treasury, |
15,820,000 | 14,325 | ||
| US Treasury, |
740,000 | 738 | ||
| US Treasury, |
14,500,000 | 14,387 | ||
| Total Governments |
124,215 | |||
| Structured Products (23.2%) | ||||
| Structured Products (23.2%) |
||||
| AEP Texas Central Transition Funding, 5.306%, 7/1/20 |
22,665,000 | 21,576 | ||
| Asset Securitization Corp., Series 1997-D5, Class PS1, |
92,779,305 | 3,104 | ||
The Accompanying Notes are an Integral Part of the Financial Statements.
68
Balanced Portfolio
Table of Contents
Balanced Portfolio
| Structured Products (23.2%) |
Shares/ $ Par |
Value $ (000’s) | ||
| Structured Products continued |
||||
| Banc of America Funding Corp., Series 2007-1, Class TA1A, 5.38%, 1/25/37 |
4,469,258 | 4,469 | ||
| Banc of America Funding Corp., Series 2007-4, Class TA1A, 5.41%, 5/25/37 |
5,046,902 | 5,047 | ||
| Banc of America Mortgage Securities, Series 2004-G, Class 2AG, 4.657%, 8/25/34 |
5,332,000 | 5,254 | ||
| Bear Stearns Adjustable Rate Mortgage Trust, Series 2004-4, Class A6, 3.516%, 6/25/34 |
11,842,000 | 11,606 | ||
| Capital One Auto Finance Trust, Series 2006-A, Class A2, 5.31%, 5/15/09 |
1,666,045 | 1,667 | ||
| CenterPoint Energy Transition Bond Co. LLC, Series 2005-A, Class A4, |
2,580,000 | 2,502 | ||
| Chase Manhattan Auto Owner Trust, Series 2004-A, Class A4, 2.83%, 9/15/10 |
3,649,819 | 3,602 | ||
| Chase Manhattan Auto Owner Trust, Series 2005-A, Class A3, 3.87%, 6/15/09 |
3,978,969 | 3,948 | ||
| Criimi Mae Commercial Mortgage Trust, Series 1998-C1, Class B, 7.00%, 6/2/33 144A |
5,700,000 | 5,756 | ||
| DLJ Commerical Mortgage Corp., Series 1998-CF1, Class S, 1.019%, 2/18/31 IO |
142,759,119 | 1,644 | ||
| DLJ Mortgage Acceptance Corp., Series 1997-CF2, Class S, 0.649%, 10/15/30 IO 144A |
4,673,776 | 61 | ||
| Fannie Mae Whole Loan, 6.25%, 5/25/42 |
8,306,812 | 8,352 | ||
| Federal Home Loan Mortgage Corp., 4.00%, 10/1/20 |
2,309,111 | 2,139 | ||
| Federal Home Loan Mortgage Corp., 4.50%, 5/1/19 |
2,952,820 | 2,810 | ||
| Federal Home Loan Mortgage Corp., 4.50%, 7/1/20 |
7,689,170 | 7,301 | ||
| Federal Home Loan Mortgage Corp., 5.00%, 10/1/19 |
3,261,087 | 3,160 | ||
| Structured Products (23.2%) |
Shares/ $ Par |
Value $ (000’s) | ||
| Structured Products continued |
||||
| Federal Home Loan Mortgage Corp., |
913,362 | 883 | ||
| Federal Home Loan Mortgage Corp., |
3,287,473 | 3,179 | ||
| Federal Home Loan Mortgage Corp., |
1,762,251 | 1,704 | ||
| Federal Home Loan Mortgage Corp., |
38,087,083 | 35,795 | ||
| Federal Home Loan Mortgage Corp., |
20,593,115 | 19,354 | ||
| Federal Home Loan Mortgage Corp., |
1,223,922 | 1,208 | ||
| Federal Home Loan Mortgage Corp., |
2,285,406 | 2,255 | ||
| Federal Home Loan Mortgage Corp., |
383,666 | 379 | ||
| Federal Home Loan Mortgage Corp., |
3,199,365 | 3,154 | ||
| Federal Home Loan Mortgage Corp., |
9,192,975 | 9,054 | ||
| Federal Home Loan Mortgage Corp., |
4,337,356 | 4,193 | ||
| Federal Home Loan Mortgage Corp., |
29,678,731 | 28,640 | ||
| Federal Home Loan Mortgage Corp., |
642,088 | 653 | ||
| Federal Home Loan Mortgage Corp. Multifamily Structured Pass Through, |
9,485,708 | 9,506 | ||
| Federal Home Loan Mortgage Corp. TBA, 5.00%, 7/1/2037 |
7,606,000 | 7,128 | ||
| Federal Home Loan Mortgage Corp. TBA, 6.00%, 8/1/2037 |
56,477,000 | 55,896 | ||
| Federal Home Loan Mortgage Corp. TBA, 6.50%, 8/1/37 |
5,464,000 | 5,514 | ||
| Federal National Mortgage Association, 4.00%, 6/1/19 |
1,510,180 | 1,401 | ||
| Federal National Mortgage Association, 4.50%, 6/1/19 |
11,201,285 | 10,657 | ||
| Structured Products (23.2%) |
Shares/ $ Par |
Value $ (000’s) | ||
| Structured Products continued |
||||
| Federal National Mortgage Association, |
1,630,245 | 1,551 | ||
| Federal National Mortgage Association, |
1,256,729 | 1,196 | ||
| Federal National Mortgage Association, |
4,710,086 | 4,471 | ||
| Federal National Mortgage Association, 4.50%, 7/1/35 |
2,000,001 | 1,820 | ||
| Federal National Mortgage Association, 4.50%, 12/1/35 |
1,523,000 | 1,386 | ||
| Federal National Mortgage Association, 5.00%, 3/1/20 |
3,859,562 | 3,736 | ||
| Federal National Mortgage Association, 5.00%, 4/1/20 |
1,639,806 | 1,586 | ||
| Federal National Mortgage Association, 5.00%, 5/1/20 |
6,052,857 | 5,854 | ||
| Federal National Mortgage Association, 5.00%, 4/1/35 |
4,431,681 | 4,164 | ||
| Federal National Mortgage Association, 5.00%, 7/1/35 |
5,769,527 | 5,421 | ||
| Federal National Mortgage Association, 5.00%, 10/1/35 |
2,388,829 | 2,244 | ||
| Federal National Mortgage Association, 5.00%, 2/1/37 |
4,999,999 | 4,685 | ||
| Federal National Mortgage Association, 5.00%, 5/1/37 |
11,999,999 | 11,244 | ||
| Federal National Mortgage Association, 5.17%, 1/1/16 |
4,133,098 | 4,022 | ||
| Federal National Mortgage Association, 5.285%, 4/1/16 |
10,823,117 | 10,630 | ||
| Federal National Mortgage Association, 5.32%, 4/1/14 |
2,700,136 | 2,653 | ||
| Federal National Mortgage Association, 5.38%, 1/1/17 |
2,848,000 | 2,844 | ||
| Federal National Mortgage Association, 5.50%, 4/1/21 |
2,771,428 | 2,731 | ||
| Federal National Mortgage Association, 5.50%, 9/1/34 |
1,208,557 | 1,170 | ||
| Federal National Mortgage Association, 5.50%, 3/1/35 |
10,012,282 | 9,681 | ||
The Accompanying Notes are an Integral Part of the Financial Statements.
Balanced Portfolio
69
Table of Contents
Balanced Portfolio
| Structured Products (23.2%) |
Shares/ $ Par |
Value $ (000’s) | ||
| Structured Products continued |
||||
| Federal National Mortgage Association, 5.50%, 7/1/35 |
2,064,803 | 1,997 | ||
| Federal National Mortgage Association, 5.50%, 8/1/35 |
3,795,964 | 3,670 | ||
| Federal National Mortgage Association, 5.50%, 9/1/35 |
21,144,630 | 20,446 | ||
| Federal National Mortgage Association, 5.50%, 10/1/35 |
9,645,919 | 9,327 | ||
| Federal National Mortgage Association, 5.50%, 11/1/35 |
22,838,507 | 22,084 | ||
| Federal National Mortgage Association, 5.50%, 12/1/36 |
8,795,810 | 8,487 | ||
| Federal National Mortgage Association, 5.50%, 1/1/37 |
4,836,354 | 4,665 | ||
| Federal National Mortgage Association, 5.50%, 2/1/37 |
15,480,774 | 14,933 | ||
| Federal National Mortgage Association, 6.00%, 5/1/35 |
598,863 | 593 | ||
| Federal National Mortgage Association, 6.00%, 6/1/35 |
1,331,441 | 1,319 | ||
| Federal National Mortgage Association, 6.00%, 7/1/35 |
8,482,683 | 8,406 | ||
| Federal National Mortgage Association, 6.00%, 8/1/35 |
747,820 | 741 | ||
| Federal National Mortgage Association, 6.00%, 10/1/35 |
1,906,891 | 1,890 | ||
| Federal National Mortgage Association, 6.00%, 11/1/35 |
9,445,178 | 9,360 | ||
| Federal National Mortgage Association, 6.00%, 9/1/36 |
5,252,215 | 5,199 | ||
| Federal National Mortgage Association, 6.50%, 9/1/31 |
1,383,480 | 1,410 | ||
| Federal National Mortgage Association, 6.50%, 11/1/35 |
2,055,162 | 2,077 | ||
| Federal National Mortgage Association, 6.50%, 12/1/35 |
2,822,914 | 2,853 | ||
| Federal National Mortgage Association, 6.50%, 4/1/36 |
1,922,871 | 1,942 | ||
| Federal National Mortgage Association, 6.50%, 11/1/36 |
718,350 | 725 | ||
| Structured Products (23.2%) |
Shares/ $ Par |
Value $ (000’s) | ||
| Structured Products continued |
||||
| Federal National Mortgage Association, 6.50%, 12/1/36 |
2,721,266 | 2,748 | ||
| Federal National Mortgage Association, 6.50%, 2/1/37 |
2,937,186 | 2,966 | ||
| Federal National Mortgage Association, 6.50%, 3/1/37 |
34,697,084 | 35,027 | ||
| Federal National Mortgage Association, 6.75%, 4/25/18 |
2,636,711 | 2,690 | ||
| Federal National Mortgage Association — Aces, Series 2006-M1, Class B, |
10,762,000 | 10,600 | ||
| Federal National Mortgage Association TBA, 6.00%, 7/1/36 |
9,074,000 | 8,975 | ||
| Final Maturity Amortizing Notes, 4.45%, 8/25/12 |
8,742,822 | 8,397 | ||
| First Horizon Alternative Mortgage Securities Trust, Series 2004-FA1, 6.25%, 10/25/34 |
4,437,991 | 4,460 | ||
| First Union National Bank, Series 1999-C4, Class E, 8.18%, |
3,100,000 | 3,260 | ||
| First Union-Lehman Brothers Commercial Mortgage Trust II, Commerical Mortgage Pass-Through Certificates, Series 1997-C2, |
2,667,000 | 2,679 | ||
| Freddie Mac, |
2,223,020 | 2,125 | ||
| Freddie Mac, Series — 2840, Class LK, |
3,684,130 | 3,713 | ||
| Freddie Mac, Series 3248, Class LN, |
15,550,000 | 14,780 | ||
| Government National Mortgage Association, 5.00%, 7/15/33 |
2,254,947 | 2,138 | ||
| Government National Mortgage Association, 5.50%, 1/15/32 |
196,936 | 192 | ||
| Government National Mortgage Association, 5.50%, 2/15/32 |
2,280,223 | 2,219 | ||
| Government National Mortgage Association, 5.50%, 9/15/32 |
62,524 | 61 | ||
| Structured Products (23.2%) |
Shares/ $ Par |
Value $ (000’s) | ||
| Structured Products continued |
||||
| Greenwich Capital Commerical Funding Corp., Series 2006-FL4A, Class A1, 5.44%, 11/5/21 144A |
2,920,728 | 2,922 | ||
| Honda Auto Receivables Owner Trust, Series 2005-1, Class A3, 3.53%, 10/21/08 |
1,925,533 | 1,920 | ||
| Massachusetts RRB Special Purpose Trust, Series 2001-1, Class A, 6.53%, 6/1/15 |
1,868,899 | 1,930 | ||
| Merrill Lynch Alternative Note Asset, Series 2007-A1, Class A2A, 5.391%, 1/25/37 |
4,784,347 | 4,783 | ||
| Midland Realty Acceptance Corp., Series 1996-C2, Class AEC, 1.334%, 1/25/29 IO 144A |
2,284,703 | — | ||
| Nissan Auto Receivables Owner Trust, Series 2006-A, Class A3, 4.74%, 9/15/09 |
27,500,000 | 27,388 | ||
| RMF Commercial Mortgage Pass-Through, Series 1997-1, Class F, 7.47%, 1/15/19 144A |
1,800,000 | 900 | ||
| Rural Housing Trust 1987-1, Series 1, Class D, 6.33%, 4/1/26 |
208,811 | 208 | ||
| TBW Mortgage Backed Pass Through Certification, Series 2007-1, Class A1, 5.41%, 3/25/37 |
4,609,811 | 4,611 | ||
| Wachovia Auto Loan Owner Trust, |
4,974,998 | 4,975 | ||
| Washington Mutual Asset Securities Corp., Series 2003-AR10, Class A6, 4.058%, 10/25/33 |
2,662,000 | 2,622 | ||
| Washington Mutual Asset Securities Corp., Series 2003-C1A, Class A, 3.83%, 1/25/35 144A |
5,317,886 | 5,144 | ||
| Wells Fargo Mortgage Backed Securities, Series 2004-N, Class A6, |
8,006,000 | 7,797 | ||
| WFS Financial Owner Trust, Series 2003-3, Class A4, |
3,760,408 | 3,750 | ||
The Accompanying Notes are an Integral Part of the Financial Statements.
70
Balanced Portfolio
Table of Contents
Balanced Portfolio
| Structured Products (23.2%) |
Shares/ $ Par |
Value $ (000’s) | ||
| Structured Products continued |
||||
| World Omni Auto Receivables Trust, Series 2006-A, Class A3, |
8,915,706 | 8,896 | ||
| Total Structured Products (Cost: $697,638) |
684,640 | |||
| Below Investment Grade Segment (3.7%) | ||||
| Aerospace/Defense (0.0%) | ||||
| DRS Technologies, Inc., 7.625%, 2/1/18 |
500,000 | 505 | ||
| Total |
505 | |||
| Autos/Vehicle Parts (0.3%) |
||||
| American Axle & Manufacturing, Inc., 7.875%, 3/1/17 |
790,000 | 776 | ||
| Arvinmeritor, Inc., |
150,000 | 152 | ||
| Ford Motor Co., |
750,000 | 599 | ||
| Ford Motor Credit Co., 8.00%, 12/15/16 |
750,000 | 718 | ||
| Ford Motor Credit Co., 9.875%, 8/10/11 |
2,000,000 | 2,098 | ||
| General Motors Corp., 8.375%, 7/15/33 |
1,100,000 | 1,004 | ||
| Lear Corp., 8.50%, 12/1/13 |
435,000 | 418 | ||
| Lear Corp., 8.75%, 12/1/16 |
1,000,000 | 953 | ||
| TRW Automotive, Inc., 7.25%, 3/15/17 144A |
1,000,000 | 953 | ||
| Total |
7,671 | |||
| Basic Materials (0.5%) |
||||
| Abitibi-Consolidated, Inc., 7.75%, 6/15/11 |
1,100,000 | 1,007 | ||
| Abitibi-Consolidated, Inc., 8.375%, 4/1/15 |
400,000 | 350 | ||
| Berry Plastics Holding Corp., 8.875%, 9/15/14 |
450,000 | 456 | ||
| Bowater Canada Finance, 7.95%, 11/15/11 |
500,000 | 471 | ||
| Cascades, Inc., |
350,000 | 340 | ||
| Crown Americas, Inc., 7.625%, 11/15/13 |
650,000 | 657 | ||
| FMG Finance Property, Ltd., 10.625%, 9/1/16 144A |
1,000,000 | 1,190 | ||
| Freeport-McMoRan Copper & Gold, Inc., 8.375%, 4/1/17 |
1,750,000 | 1,867 | ||
| Georgia-Pacific Corp., 7.00%, 1/15/15 144A |
1,250,000 | 1,203 | ||
| Georgia-Pacific Corp., 7.125%, 1/15/17 144A |
825,000 | 792 | ||
| Hexion US Finance Corp./Hexion Nova Scotia Finance ULC, |
1,250,000 | 1,294 | ||
| Below Investment Grade Segment (3.7%) |
Shares/ $ Par |
Value $ (000’s) | ||
| Basic Materials continued |
||||
| Lyondell Chemical Co., 6.875%, 6/15/17 |
875,000 | 844 | ||
| Lyondell Chemical Co., 8.00%, 9/15/14 |
1,000,000 | 1,028 | ||
| Massey Energy Co., 6.875%, 12/15/13 |
750,000 | 687 | ||
| Mosaic Global Holdings, Inc., 7.625%, 12/1/16 144A |
750,000 | 767 | ||
| Peabody Energy Corp., 7.375%, 11/1/16 |
750,000 | 765 | ||
| VeraSun Energy Corp., 9.375%, 6/1/17 144A |
300,000 | 279 | ||
| Total |
13,997 | |||
| Builders/Building Materials (0.1%) | ||||
| Beazer Homes USA, Inc., 6.50%, 11/15/13 |
500,000 | 430 | ||
| Beazer Homes USA, Inc., 8.375%, 4/15/12 |
350,000 | 331 | ||
| K. Hovnanian Enterprises, 7.75%, 5/15/13 |
819,000 | 716 | ||
| Standard Pacific Corp., 7.75%, 3/15/13 |
500,000 | 460 | ||
| Total |
1,937 | |||
| Capital Goods (0.1%) |
||||
| Clarke American Corp., 9.50%, 5/15/15 144A |
140,000 | 134 | ||
| Clarke American Corp., 10.106%, 5/15/15 144A |
175,000 | 169 | ||
| United Rentals North America, Inc., |
1,750,000 | 1,720 | ||
| Total |
2,023 | |||
| Consumer Products/Retailing (0.2%) | ||||
| Albertson’s Inc., |
750,000 | 764 | ||
| Claire’s Stores, Inc., 10.50%, 6/1/17 144A |
325,000 | 297 | ||
| Claire’s Stores, Inc., |
230,000 | 219 | ||
| Claire’s Stores, Inc., 9.625%, 6/1/15 144A |
260,000 | 241 | ||
| Dollar General Corp., 10.625%, 7/15/15 144A |
660,000 | 637 | ||
| Education Management LLC, 10.25%, 6/1/16 |
875,000 | 920 | ||
| Levi Strauss & Co., |
850,000 | 871 | ||
| Rite Aid Corp., |
325,000 | 312 | ||
| Rite Aid Corp., 9.50%, 6/15/17 144A |
290,000 | 278 | ||
| Smithfield Foods, Inc., 7.75%, 7/1/17 |
455,000 | 455 | ||
| Total |
4,994 | |||
| Below Investment Grade Segment (3.7%) |
Shares/ $ Par |
Value $ (000’s) | ||
| Energy (0.4%) |
||||
| AmeriGas Partners LP, 7.25%, 5/20/15 |
625,000 | 619 | ||
| Basic Energy Services, Inc., 7.125%, 4/15/16 |
825,000 | 788 | ||
| Chaparral Energy, Inc., 8.875%, 2/1/17 144A |
800,000 | 790 | ||
| Chesapeake Energy Corp., 6.625%, 1/15/06 |
1,000,000 | 963 | ||
| Cimarex Energy Co., 7.125%, 5/1/17 |
150,000 | 146 | ||
| Complete Production Services, Inc., 8.00%, 12/15/16 144A |
500,000 | 505 | ||
| Forest Oil Corp., |
390,000 | 378 | ||
| Mariner Energy, Inc., 8.00%, 5/15/17 |
448,000 | 445 | ||
| Newfield Exploration Co., 6.625%, 4/15/16 |
850,000 | 818 | ||
| Petrohawk Energy Corp., 9.125%, 7/15/13 |
1,150,000 | 1,216 | ||
| Petroplus Finance, Ltd., 7.00%, 5/1/17 |
350,000 | 337 | ||
| Petroplus Finance, Ltd., 6.75%, 5/1/14 144A |
420,000 | 404 | ||
| Pioneer Natural Resources Co., 6.65%, 3/15/17 |
700,000 | 662 | ||
| Plains Exploration & Production Co., |
550,000 | 546 | ||
| Pogo Producing Co., 7.875%, 5/1/13 |
500,000 | 510 | ||
| Range Resources Corp., 6.375%, 3/15/15 |
750,000 | 711 | ||
| Stallion Oilfield Services/Stallion Oilfield Finance Corp., 9.75%, 2/1/15 144A |
810,000 | 826 | ||
| W&T Offshore, Inc., 8.25%, 6/15/14 144A |
620,000 | 612 | ||
| Whiting Petroleum Corp., 7.25%, 5/1/13 |
850,000 | 808 | ||
| Total |
12,084 | |||
| Financials (0.1%) |
||||
| Crum & Forster Holdings Corp., 7.75%, 5/1/17 144A |
562,000 | 549 | ||
| E*Trade Financial Corp., 7.875%, 12/1/15 |
750,000 | 781 | ||
| General Motors Acceptance Corp. LLC, |
515,000 | 507 | ||
| General Motors Acceptance Corp. LLC, |
1,755,000 | 1,795 | ||
| Residential Capital LLC, 6.875%, 6/30/15 |
650,000 | 630 | ||
| Total |
4,262 | |||
The Accompanying Notes are an Integral Part of the Financial Statements.
Balanced Portfolio
71
Table of Contents
Balanced Portfolio
| Below Investment Grade Segment (3.7%) |
Shares/ $ Par |
Value $ (000’s) | ||
| Foods (0.2%) |
||||
| Constellation Brands Inc., 7.25%, 5/15/17 144A |
610,000 | 595 | ||
| Dean Foods Co., |
1,250,000 | 1,194 | ||
| Dole Foods Co., |
1,250,000 | 1,246 | ||
| Outback Steakhouse, Inc., 10.00%, 6/15/15 144A |
150,000 | 143 | ||
| Pinnacle Foods Finance LLC/Pinnacle Foods Finance Corp., |
500,000 | 481 | ||
| Pinnacle Foods Finance LLC/Pinnacle Foods Finance Corp., |
900,000 | 869 | ||
| Smithfield Foods, Inc., 7.75%, 5/15/13 |
850,000 | 863 | ||
| Total |
5,391 | |||
| Gaming/Leisure/Lodging (0.3%) | ||||
| Boyd Gaming Corp., |
850,000 | 871 | ||
| Corrections Corp. of America, 6.25%, 3/15/13 |
900,000 | 864 | ||
| Felcor Lodging LP, |
750,000 | 788 | ||
| Fontainebleau Las Vegas Holdings LLC, |
490,000 | 483 | ||
| Host Marriot LP, |
1,000,000 | 999 | ||
| MGM Mirage Inc., |
1,100,000 | 1,044 | ||
| MGM Mirage, Inc., |
1,230,000 | 1,175 | ||
| Park Place Entertainment Corp., 8.125%, 5/15/11 |
1,250,000 | 1,304 | ||
| Pinnacle Entertainment, Inc., 7.50%, 6/15/15 144A |
375,000 | 362 | ||
| Wynn Las Vegas LLC, 6.625%, 12/1/14 |
1,350,000 | 1,301 | ||
| Total |
9,191 | |||
| Healthcare/Pharmaceuticals (0.3%) | ||||
| Community Health Systems, Inc., |
1,335,000 | 1,353 | ||
| FMC Finance III SA, 6.875%, 7/15/17 144A |
760,000 | 745 | ||
| HCA, Inc., 6.75%, 7/15/13 |
650,000 | 592 | ||
| HCA, Inc., |
2,250,000 | 2,396 | ||
| HCA, Inc., |
900,000 | 968 | ||
| Omnicare, Inc., |
750,000 | 716 | ||
| Service Corp. International, |
600,000 | 578 | ||
| Below Investment Grade Segment (3.7%) |
Shares/ $ Par |
Value $ (000’s) | ||
| Healthcare/Pharmaceuticals continued | ||||
| Tenet Healthcare Corp., 7.375%, 2/1/13 |
550,000 | 497 | ||
| Total |
7,845 | |||
| Media (0.4%) |
||||
| CCH I Holdings LLC, 11.75%, 5/15/14 |
660,000 | 648 | ||
| Charter Communications Holding LLC, |
1,250,000 | 1,305 | ||
| Charter Communications Holdings LLC, |
1,250,000 | 1,302 | ||
| CSC Holdings, Inc., 7.625%, 4/1/11 |
2,250,000 | 2,233 | ||
| CSC Holdings, Inc., 7.875%, 2/15/18 |
1,000,000 | 965 | ||
| EchoStar DBS Corp., 7.125%, 2/1/16 |
375,000 | 367 | ||
| Idearc, Inc., |
2,500,000 | 2,524 | ||
| Intelsat Bermuada, Ltd., 8.50%, 1/15/13 |
600,000 | 609 | ||
| Lamar Media Corp., 6.625%, 8/15/15 |
800,000 | 758 | ||
| LIN Television Corp., 6.50%, 5/15/13 |
750,000 | 733 | ||
| Mediacom Broadband LLC/Corp., |
600,000 | 603 | ||
| R.H. Donnelley Corp., 6.875%, 1/15/13 |
2,750,000 | 2,605 | ||
| Univision Communications, |
1,150,000 | 1,136 | ||
| Total |
15,788 | |||
| Real Estate (0.0%) |
||||
| American Real Estate Partners, LP, |
500,000 | 483 | ||
| Total |
483 | |||
| Services (0.1%) |
||||
| Allied Waste North America, Inc., |
500,000 | 484 | ||
| Allied Waste North America, Inc., |
1,000,000 | 990 | ||
| ARAMARK Corp., |
500,000 | 509 | ||
| Realogy Corp., |
1,150,000 | 1,094 | ||
| Realogy Corp., |
600,000 | 548 | ||
| Total |
3,625 | |||
| Technology (0.1%) |
||||
| Flextronics International, Ltd., 6.50%, 5/15/13 |
750,000 | 707 | ||
| Below Investment Grade Segment (3.7%) |
Shares/ $ Par |
Value $ (000’s) | ||
| Technology continued |
||||
| Freescale Semiconductor, Inc., 8.875%, 12/15/14 144A |
650,000 | 621 | ||
| Freescale Semiconductor, Inc., 9.125%, 12/15/14 144A |
900,000 | 846 | ||
| NXP BV, |
850,000 | 837 | ||
| NXP BV, |
375,000 | 369 | ||
| Sabre Holdings Corp., 6.35%, 3/15/16 |
500,000 | 450 | ||
| Total |
3,830 | |||
| Telecommunications (0.2%) |
||||
| Citizens Communications, 9.00%, 8/15/31 |
1,480,000 | 1,524 | ||
| Citizens Communications, 9.25%, 5/15/11 |
1,370,000 | 1,480 | ||
| Qwest Corp., |
750,000 | 714 | ||
| Windstream Corp., |
500,000 | 478 | ||
| Windstream Corp., 8.625%, 8/1/16 |
865,000 | 915 | ||
| Total |
5,111 | |||
| Transportation (0.1%) |
||||
| American Railcar Industries, Inc., |
500,000 | 498 | ||
| Kansas City Southern de Mexico, 7.375%, 6/1/14 144A |
1,500,000 | 1,488 | ||
| Total |
1,986 | |||
| Utilities (0.3%) |
||||
| Dynegy Holdings, Inc., 7.50%, 6/1/15 144A |
325,000 | 306 | ||
| Dynegy Holdings, Inc., 7.75%, 6/1/19 144A |
485,000 | 451 | ||
| Dynegy Holdings, Inc., 8.375%, 5/1/16 |
750,000 | 733 | ||
| Edison Mission Energy, 7.00%, 5/15/17 144A |
1,050,000 | 990 | ||
| Edison Mission Energy, 7.20%, 5/15/19 144A |
1,225,000 | 1,152 | ||
| Elwood Energy LLC, 8.159%, 7/5/26 |
589,988 | 620 | ||
| Indiantown Cogeneration LP, 9.77%, 12/15/20 |
1,600,000 | 1,805 | ||
| NRG Energy, Inc., |
500,000 | 501 | ||
| NRG Energy, Inc., 7.375%, 1/15/17 |
1,725,000 | 1,731 | ||
| TXU Corp., |
1,650,000 | 1,401 | ||
| Total |
9,690 | |||
| Total Below Investment Grade Segment (Cost: $114,417) |
110,413 | |||
The Accompanying Notes are an Integral Part of the Financial Statements.
72
Balanced Portfolio
Table of Contents
Balanced Portfolio
| Money Market Investments (7.5%) |
Shares/ $ Par |
Value $ (000’s) | ||
| Asset-Backed Securities (CMO’s) (0.1%) | ||||
| (b) Nissan Auto Receivables Owner Trust, |
1,539,547 | 1,540 | ||
| (k)World Omni Auto Receivables Trust, 5.319%, 2/15/08 Series |
1,428,311 | 1,429 | ||
| Total |
2,969 | |||
| Autos (0.2%) |
||||
| (k)Daimler Chrysler Auto, 5.28%, 7/12/07 |
5,000,000 | 4,991 | ||
| Total |
4,991 | |||
| Federal Government and Agencies (0.7%) | ||||
| (b) Fannie Mae, |
2,400,000 | 2,386 | ||
| (b) Fannie Mae, |
5,000,000 | 4,945 | ||
| (b) Federal Home Loan, 4.97%, 3/3/08 |
2,300,000 | 2,222 | ||
| (b) Federal Home Loan, 4.97%, 2/4/08 |
2,200,000 | 2,133 | ||
| (b) Federal Home Loan, 4.99%, 9/18/07 |
2,250,000 | 2,225 | ||
| (b) Federal Home Loan, 5.08%, 7/9/07 |
2,200,000 | 2,197 | ||
| (b) Federal Home Loan Bank, 5.25%, 2/5/08 |
2,250,000 | 2,248 | ||
| (b) Federal Home Loan Bank, 5.50%, 12/27/07 Series 667 |
2,250,000 | 2,251 | ||
| Total |
20,607 | |||
| Money Market Investments (7.5%) |
Shares/ $ Par |
Value $ (000’s) | ||
| Finance Lessors (1.5%) | ||||
| (b) Ranger Funding Co. LLC, 5.26%, 8/2/07 |
15,000,000 | 14,928 | ||
| (b) Thunder Bay Funding, Inc., 5.31%, 7/16/07 |
15,000,000 | 14,964 | ||
| (b) Windmill Funding Corp., 5.26%, 8/1/07 |
15,000,000 | 14,930 | ||
| Total |
44,822 | |||
| Finance Services (2.0%) | ||||
| (b) Alpine securitization, 5.27%, 7/12/07 |
15,000,000 | 14,974 | ||
| (b) Barton Capital LLC, 5.30%, 7/10/07 |
15,000,000 | 14,979 | ||
| (b) Bryant Park Funding LLC, 5.29%, 7/16/07 |
10,000,000 | 9,976 | ||
| (b) Ciesco LP, |
15,000,000 | 14,960 | ||
| HBOS Treasury Services PLC, 5.31%, 4/9/08 |
3,000,000 | 3,001 | ||
| Total |
57,890 | |||
| Miscellaneous Business Credit Institutions (0.5%) | ||||
| Park Avenue Receivables, |
15,000,000 | 14,956 | ||
| Total |
14,956 | |||
| National Commercial Banks (0.8%) | ||||
| Bank of America, |
2,400,000 | 2,400 | ||
| BankBoston, |
1,800,000 | 1,812 | ||
| UBS Finance LLC, 5.35%, 7/2/07 |
18,930,000 | 18,924 | ||
| Total |
23,136 | |||
| Money Market Investments (7.5%) |
Shares/ $ Par |
Value $ (000’s) |
|||
| Security Brokers and Dealers (0.7%) |
| ||||
| Bear Stearns Co., Inc., 5.26%, 8/2/07 |
15,000,000 | 14,927 | |||
| The Goldman Sachs Group, Inc., |
2,300,000 | 2,286 | |||
| Merrill Lynch & Co., 6.56%, 12/16/07 |
1,750,000 | 1,758 | |||
| Morgan Stanley Dean Witter, |
2,400,000 | 2,361 | |||
| Total |
21,332 | ||||
| Short Term Business Credit (1.0%) |
| ||||
| HSBC Finance Corp., 5.27%, 7/12/07 |
15,000,000 | 14,974 | |||
| Sheffield Receivables, 5.27%, 7/5/07 |
15,000,000 | 14,989 | |||
| Total |
29,963 | ||||
| Total Money Market Investments |
220,666 | ||||
| Total Investments (103.9%) |
3,072,109 | ||||
| Other Assets, Less |
(114,941 | ) | |||
| Total Net Assets (100.0%) |
2,957,168 | ||||
| * | Non-Income Producing |
ADR after the name of a security represents—American Depositary Receipt.
144A after the name of a security represents a security exempt from registration under Rule 144A of the Securities Act of 1933. These securities may be resold as transactions exempt from registration, normally to qualified institutional buyers. At June 30, 2007 the value of these securities (in thousands) was $74,242, representing 2.51% of the net assets.
IO—Interest Only Security
| (a) | At June 30, 2007 the aggregate cost of securities for federal tax purposes (in thousands) was $2,850,062 and the net unrealized appreciation of investments based on that cost was $222,047 which is comprised of $286,740 aggregate gross unrealized appreciation and $64,693 aggregate gross unrealized depreciation. |
| (b) | All or a portion of the securities have been committed as collateral for open futures positions or when-issued securities. Information regarding open futures contracts as of period end is summarized below. |
| Issuer (000’s) | Number of Contracts |
Expiration Date |
Unrealized Appreciation/ (Depreciation) (000’s) |
|||||
| US Ten Year Treasury Note (Short) (Total Notional Value at June 30, 2007, $5,284) |
50 | 9/07 | $ | 1 | ||||
| S&P 500 Index Futures (Long) (Total Notional Value at June 30, 2007, $16,013) |
42 | 9/07 | $ | (102 | ) | |||
| (e) | Step bond security that presently receives no coupon payments. At the predetermined date the stated coupon rate becomes effective. |
| (g) | All or portion of the securities have been loaned. See Note 7 in the Notes to Financial Statements. |
The Accompanying Notes are an Integral Part of the Financial Statements.
Balanced Portfolio
73
Table of Contents
Balanced Portfolio
| Swap | agreements outstanding on June 30, 2007: |
Total Return Swaps
| Counterparty | Reference Entity | Payments Made by the Fund |
Payments Received by the Fund |
Expiration Date |
Notional Amount (000’s) |
Unrealized Appreciation (Depreciation) (000’s) |
||||||||
| Credit Suisse Securities (Europe) Ltd. |
Russell Midcap Value Index | 1 Month USD-LIBOR- 5 Basis Points (BPS) |
Russell Midcap Value Index Total Return | 5/2008 | 87,227 | $ | (3,894 | ) | ||||||
| Credit Suisse Securities (Europe) Ltd. |
Russell Midcap Growth Index | Russell Midcap Growth Total Return | 1 Month USD-LIBOR- 45 BPS |
5/2008 | 87,922 | 2,993 | ||||||||
| Credit Suisse Securities (Europe) Ltd. |
Russell 1000 Value Index | 1 Month USD-LIBOR + 4 BPS | Russell 1000 Value Index Total Return | 5/2008 | 231,411 | (8,702 | ) | |||||||
| Credit Suisse Securities (Europe) Ltd. |
Russell 1000 Growth Index | Russell 1000 Growth Index Total Return | 1 Month USD-LIBOR - 19 BPS |
5/2008 | 231,450 | 6,345 | ||||||||
| Goldman Sachs International |
Russell Midcap Value Index | 1 Month USD-LIBOR + 15 BPS | Russell Midcap Value Index Total Return | 5/2008 | 51,305 | (2,077 | ) | |||||||
| Goldman Sachs International |
Russell Midcap Growth Index | Russell Midcap Growth Total Return | 1 Month USD-LIBOR- 35 BPS |
5/2008 | 51,697 | 1,537 | ||||||||
| Goldman Sachs International |
Russell 1000 Value Index | 1 Month USD-LIBOR + 10 BPS | Russell 1000 Value Index Total Return | 5/2008 | 154,224 | 4,039 | ||||||||
| Goldman Sachs International |
Russell 1000 Growth Index | Russell 1000 Growth Index Total Return | 1 Month USD-LIBOR- 15 BPS |
5/2008 | 154,259 | (5,253 | ) | |||||||
| Goldman Sachs International |
Smallcap Value Synthetic Return | 1 Month USD-LIBOR- 25 BPS |
Smallcap Value Synthetic Total Return | 5/2008 | 39,983 | (1,412 | ) | |||||||
| Goldman Sachs International |
Smallcap Growth Synthetic Return | Smallcap Growth Synthetic Total Return | 1 Month USD-LIBOR - 80 BPS |
5/2008 | 40,373 | 668 | ||||||||
| $ | (5,756 | ) | ||||||||||||
| (k) | Securities with an aggregate market value of $6,420 (in thousands) have been pledged as collateral for swap contracts outstanding on June 30, 2007. |
| (l) | As of June 30, 2007, portfolio securities with an aggregate market value of $274,751 (in thousands) were fair valued under procedures adopted by the Board of Directors. |
The Accompanying Notes are an Integral Part of the Financial Statements.
74
Balanced Portfolio
Table of Contents
Sector Allocation 6/30/07
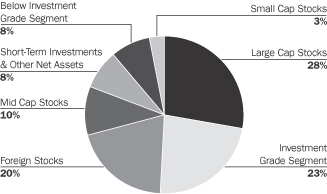
Sector Allocation is based on Net Assets.
Sector Allocation is subject to change.
Expense Example
As a shareholder of the Portfolio, you incur two types of costs: (1) transaction costs and (2) ongoing costs, including management fees and other Portfolio expenses. This Example is intended to help you understand your ongoing costs (in dollars) of investing in the Portfolio and to compare these costs with the ongoing costs of investing in other mutual funds.
The Example is based on an investment of $1,000 invested at the beginning of the period and held for the entire period (January 1, 2007 to June 30, 2007).
Actual Expenses
The first line of the table below provides information about actual account values and actual expenses. You may use the information in this line, together with the amount you invested, to estimate the expenses that you paid over the period. Simply divide your account value by $1,000 (for example, an $8,600 account value divided by $1,000 = 8.6), then multiply the result by the number in the first line under the heading entitled “Expenses Paid During Period” to estimate the expenses you paid on your account during this period.
Hypothetical Example for Comparison Purposes
The second line of the table below provides information about hypothetical account values and hypothetical expenses based on the Portfolio’s actual expense ratio and an assumed rate of return of 5% per year before expenses, which is not the Portfolio’s actual return. The hypothetical account values and expenses may not be used to estimate the actual ending account balance or expenses you paid for the period. You may use this information to compare the ongoing costs of investing in the Fund and other funds. To do so, compare this 5% hypothetical example with the 5% hypothetical examples that appear in the shareholder reports of the other funds.
Please note that the expenses shown in the table are meant to highlight your ongoing costs only and do not reflect any transactional costs or separate account charges. Therefore, the second line of the table is useful in comparing ongoing costs only, and will not help you determine the relative total costs of owning different funds. In addition, if these transactional costs or separate account charges were included, your costs would have been higher.
| Beginning Account Value January 1, 2007 |
Ending Account Value June 30, 2007 |
Expenses Paid During Period January 1, 2007 to June 30, 2007* | |||||||
| Actual |
$ | 1,000.00 | $ | 1,059.00 | $ | 2.81 | |||
| Hypothetical (5% return before expenses) |
$ | 1,000.00 | $ | 1,022.07 | $ | 2.76 | |||
| * | Expenses are equal to the Portfolio’s annualized expense ratio of 0.55%, multiplied by the average account value over the period, multiplied by 181/365 (to reflect the one-half year period). |
Asset Allocation Portfolio
75
Table of Contents
Asset Allocation Portfolio
Northwestern Mutual Series Fund, Inc.
Schedule of Investments
June 30, 2007 (unaudited)
| Domestic Common Stocks and Warrants (41.2%) |
Shares/ $ Par |
Value $ (000’s) | ||
| Large Cap Common Stocks (27.8%) | ||||
| Consumer Discretionary (4.2%) |
||||
| Abercrombie & Fitch Co. — Class A |
9,200 | 671 | ||
| *Comcast Corp. — Class A |
32,850 | 924 | ||
| Fortune Brands, Inc. |
7,900 | 651 | ||
| Hilton Hotels Corp. |
24,500 | 820 | ||
| International Game Technology |
18,600 | 738 | ||
| J.C. Penney Co., Inc. |
10,000 | 724 | ||
| Johnson Controls, Inc. |
10,100 | 1,170 | ||
| *Kohl’s Corp. |
10,700 | 760 | ||
| The McGraw-Hill Companies, Inc. |
11,600 | 790 | ||
| News Corp. — Class A |
45,200 | 959 | ||
| NIKE, Inc. — Class B |
12,600 | 734 | ||
| Omnicom Group, Inc. |
11,600 | 614 | ||
| Staples, Inc. |
29,650 | 704 | ||
| Starwood Hotels & Resorts Worldwide, Inc. |
6,600 | 443 | ||
| Target Corp. |
14,500 | 922 | ||
| Time Warner, Inc. |
37,800 | 795 | ||
| Total |
12,419 | |||
| Consumer Staples (2.7%) |
||||
| Altria Group, Inc. |
14,700 | 1,031 | ||
| Avon Products, Inc. |
26,600 | 978 | ||
| CVS Caremark Corp. |
35,805 | 1,305 | ||
| Loews Corp. — Carolina Group |
9,000 | 695 | ||
| PepsiCo, Inc. |
22,300 | 1,446 | ||
| The Procter & Gamble Co. |
18,700 | 1,144 | ||
| Walgreen Co. |
14,600 | 636 | ||
| Wal-Mart Stores, Inc. |
13,800 | 664 | ||
| Total |
7,899 | |||
| Energy (2.4%) |
||||
| Baker Hughes, Inc. |
11,800 | 993 | ||
| ConocoPhillips |
5,800 | 455 | ||
| Diamond Offshore Drilling, Inc. |
5,900 | 599 | ||
| EOG Resources, Inc. |
10,800 | 789 | ||
| Exxon Mobil Corp. |
21,900 | 1,837 | ||
| Schlumberger, Ltd. |
12,100 | 1,028 | ||
| Valero Energy Corp. |
11,200 | 827 | ||
| XTO Energy, Inc. |
10,400 | 625 | ||
| Total |
7,153 | |||
| Financials (2.6%) |
||||
| American Express Co. |
14,100 | 863 | ||
| American International Group, Inc. |
9,300 | 651 | ||
| *The Blackstone Group LP |
2,900 | 85 | ||
| Chicago Mercantile Exchange Holdings, Inc. |
800 | 427 | ||
| Genworth Financial, Inc. |
8,200 | 282 | ||
| Large Cap Common Stocks (27.8%) |
Shares/ $ Par |
Value $ (000’s) | ||
| Financials continued |
||||
| The Goldman Sachs Group, Inc. |
5,000 | 1,085 | ||
| Host Hotels & Resorts, Inc. |
27,619 | 639 | ||
| JPMorgan Chase & Co. |
13,300 | 644 | ||
| Legg Mason, Inc. |
7,800 | 767 | ||
| Lehman Brothers Holdings, Inc. |
11,200 | 835 | ||
| Prudential Financial, Inc. |
8,900 | 866 | ||
| UBS AG-REG |
10,000 | 600 | ||
| Total |
7,744 | |||
| Health Care (4.3%) |
||||
| Abbott Laboratories |
16,100 | 862 | ||
| *Amgen, Inc. |
7,500 | 415 | ||
| Baxter International, Inc. |
13,300 | 749 | ||
| *Celgene Corp. |
9,700 | 556 | ||
| *Genentech, Inc. |
9,500 | 719 | ||
| Gilead Sciences, Inc. |
26,600 | 1,031 | ||
| Johnson & Johnson |
14,800 | 912 | ||
| Medtronic, Inc. |
17,700 | 918 | ||
| Merck & Co., Inc. |
23,000 | 1,145 | ||
| Novartis AG, ADR |
14,000 | 785 | ||
| Pfizer, Inc. |
20,300 | 519 | ||
| *St. Jude Medical, Inc. |
13,600 | 564 | ||
| *Thermo Fisher Scientific, Inc. |
18,800 | 972 | ||
| UnitedHealth Group, Inc. |
13,000 | 665 | ||
| Wyeth |
15,500 | 889 | ||
| *Zimmer Holdings, Inc. |
10,500 | 891 | ||
| Total |
12,592 | |||
| Industrials (3.1%) |
||||
| The Boeing Co. |
10,800 | 1,039 | ||
| Burlington Northern Santa Fe Corp. |
7,800 | 664 | ||
| Danaher Corp. |
13,800 | 1,042 | ||
| FedEx Corp. |
8,700 | 965 | ||
| General Electric Co. |
37,800 | 1,446 | ||
| Honeywell International, Inc. |
19,600 | 1,103 | ||
| Spirit Aerosystems Holdings, Inc. |
18,000 | 649 | ||
| Textron, Inc. |
7,800 | 859 | ||
| United Technologies Corp. |
19,000 | 1,347 | ||
| Total |
9,114 | |||
| Information Technology (6.8%) |
||||
| Accenture, Ltd. — Class A |
24,700 | 1,059 | ||
| *Adobe Systems, Inc. |
5,100 | 205 | ||
| *Amdocs, Ltd. |
24,800 | 988 | ||
| *Apple, Inc. |
7,400 | 903 | ||
| *Autodesk, Inc. |
11,200 | 527 | ||
| *BEA Systems, Inc. |
47,100 | 645 | ||
| *Broadcom Corp. — Class A |
27,500 | 804 | ||
| *Cisco Systems, Inc. |
44,400 | 1,237 | ||
| *Corning, Inc. |
32,200 | 823 | ||
| Large Cap Common Stocks (27.8%) |
Shares/ $ Par |
Value $ (000’s) | ||
| Information Technology continued | ||||
| *eBay, Inc. |
17,600 | 566 | ||
| *Electronic Arts, Inc. |
13,700 | 648 | ||
| *Google, Inc. — Class A |
3,000 | 1,569 | ||
| Hewlett-Packard Co. |
29,200 | 1,302 | ||
| Intel Corp. |
18,400 | 437 | ||
| International Business Machines Corp. |
8,000 | 842 | ||
| KLA-Tencor Corp. |
16,300 | 896 | ||
| Maxim Integrated Products, Inc. |
24,000 | 802 | ||
| Microsoft Corp. |
44,000 | 1,297 | ||
| *Oracle Corp. |
46,100 | 909 | ||
| QUALCOMM, Inc. |
24,300 | 1,054 | ||
| Telefonaktiebolaget LM Ericsson, ADR |
22,700 | 906 | ||
| Texas Instruments, Inc. |
26,700 | 1,005 | ||
| *Yahoo!, Inc. |
17,566 | 477 | ||
| Total |
19,901 | |||
| Materials (0.8%) |
||||
| Monsanto Co. |
18,900 | 1,276 | ||
| Praxair, Inc. |
13,100 | 942 | ||
| Total |
2,218 | |||
| Telecommunication Services (0.6%) | ||||
| AT&T, Inc. |
22,200 | 922 | ||
| *NII Holdings, Inc. |
8,900 | 719 | ||
| Total |
1,641 | |||
| Utilities (0.3%) |
||||
| Exelon Corp. |
13,500 | 980 | ||
| Total |
980 | |||
| Total Large Cap |
81,661 | |||
| Mid Cap Common Stocks (10.5%) | ||||
| Consumer Discretionary (1.8%) |
||||
| Abercrombie & Fitch Co. — Class A |
3,200 | 234 | ||
| *Bare Escentuals, Inc. |
10,300 | 352 | ||
| *Coach, Inc. |
8,300 | 393 | ||
| *Dollar Tree Stores, Inc. |
11,200 | 488 | ||
| *Focus Media Holding, Ltd., ADR |
10,400 | 525 | ||
| *GameStop Corp. — Class A |
20,100 | 786 | ||
| International Game Technology |
10,200 | 405 | ||
| *Jack in the Box, Inc. |
2,400 | 170 | ||
| *O’Reilly Automotive, Inc. |
11,500 | 420 | ||
| Orient-Express Hotels, Ltd. — Class A |
6,500 | 347 | ||
| *Payless ShoeSource, Inc. |
8,800 | 278 | ||
| Pool Corp. |
7,300 | 285 | ||
The Accompanying Notes are an Integral Part of the Financial Statements.
76
Asset Allocation Portfolio
Table of Contents
Asset Allocation Portfolio
| Mid Cap Common Stocks (10.5%) |
Shares/ $ Par |
Value $ (000’s) | ||
| Consumer Discretionary continued |
||||
| Starwood Hotels & Resorts Worldwide, Inc. |
4,400 | 295 | ||
| *Urban Outfitters, Inc. |
8,300 | 199 | ||
| Total |
5,177 | |||
| Energy (0.9%) |
||||
| *Cameron International Corp. |
8500 | 607 | ||
| Diamond Offshore Drilling, Inc. |
5,400 | 548 | ||
| Range Resources Corp. |
14,400 | 539 | ||
| Smith International, Inc. |
11,500 | 674 | ||
| *Southwestern Energy Co. |
8,800 | 392 | ||
| Total |
2,760 | |||
| Financials (1.1%) |
||||
| Chicago Mercantile Exchange Holdings, Inc. |
700 | 374 | ||
| The Colonial BancGroup, Inc. |
9,800 | 245 | ||
| *IntercontinentalExchange, Inc. |
1,815 | 268 | ||
| *Investment Technology Group, Inc. |
12,400 | 537 | ||
| Legg Mason, Inc. |
3,400 | 334 | ||
| SEI Investments Co. |
13,600 | 395 | ||
| *SVB Financial Group |
9,100 | 483 | ||
| T. Rowe Price Group, Inc. |
9,100 | 472 | ||
| Total |
3,108 | |||
| Health Care (2.0%) |
||||
| *Celgene Corp. |
5,400 | 310 | ||
| *DaVita, Inc. |
32,550 | 1,754 | ||
| *Express Scripts, Inc. |
12,200 | 610 | ||
| *Immucor, Inc. |
9,100 | 255 | ||
| *Intuitive Surgical, Inc. |
4,500 | 624 | ||
| *Kyphon, Inc. |
5,000 | 241 | ||
| *Lincare Holdings, Inc. |
16,200 | 646 | ||
| *Pediatrix Medical Group, Inc. |
8,300 | 458 | ||
| *Psychiatric Solutions, Inc. |
13,700 | 497 | ||
| *VCA Antech, Inc. |
11,200 | 422 | ||
| *Ventana Medical Systems, Inc. |
3,000 | 232 | ||
| Total |
6,049 | |||
| Industrials (2.0%) |
||||
| C.H. Robinson Worldwide, Inc. |
8,650 | 454 | ||
| Corrections Corp. of America |
8,000 | 505 | ||
| Expeditors International of Washington, Inc. |
9,800 | 405 | ||
| Harsco Corp. |
4,300 | 224 | ||
| J.B. Hunt Transport Services, Inc. |
11,600 | 340 | ||
| Joy Global, Inc. |
6,000 | 350 | ||
| Knight Transportation, Inc. |
33,400 | 647 | ||
| The Manitowoc Co., Inc. |
4,300 | 346 | ||
| *Monster Worldwide, Inc. |
4,400 | 181 | ||
| MSC Industrial Direct Co., Inc. — Class A |
11,500 | 633 | ||
| Mid Cap Common Stocks (10.5%) |
Shares/ $ Par |
Value $ (000’s) | ||
| Industrials continued |
||||
| Ritchie Bros. Auctioneers, Inc. |
7,400 | 463 | ||
| Robert Half International, Inc. |
9,375 | 342 | ||
| *Spirit Aerosystems Holdings, Inc. |
13,100 | 472 | ||
| *Stericycle, Inc. |
8,200 | 365 | ||
| Total |
5,727 | |||
| Information Technology (2.2%) |
||||
| *Activision, Inc. |
23,221 | 434 | ||
| Amphenol Corp. — Class A |
14,700 | 524 | ||
| *Autodesk, Inc. |
5,100 | 240 | ||
| *Citrix Systems, Inc. |
11,900 | 401 | ||
| *Cognizant Technology Solutions Corp. — Class A |
6,100 | 458 | ||
| *Digital River, Inc. |
5,200 | 235 | ||
| FactSet Research Systems, Inc. |
7,200 | 492 | ||
| Harris Corp. |
6,100 | 333 | ||
| KLA-Tencor Corp. |
8,400 | 462 | ||
| *MEMC Electronic Materials, Inc. |
8,900 | 544 | ||
| *Mettler-Toledo International, Inc. |
3,000 | 287 | ||
| Microchip Technology, Inc. |
17,000 | 630 | ||
| *Network Appliance, Inc. |
7,800 | 228 | ||
| *NVIDIA Corp. |
8,900 | 368 | ||
| *ValueClick, Inc. |
18,400 | 542 | ||
| *VeriFone Holdings, Inc. |
12,100 | 427 | ||
| Total |
6,605 | |||
| Materials (0.3%) |
||||
| *Owens-Illinois, Inc. |
7,100 | 249 | ||
| Praxair, Inc. |
7,400 | 533 | ||
| Total |
782 | |||
| Other Holdings (0.1%) |
||||
| SPDR Metals & Mining ETF |
4,900 | 306 | ||
| Total |
306 | |||
| Telecommunication Services (0.1%) | ||||
| *NeuStar, Inc. — Class A |
11,200 | 324 | ||
| Total |
324 | |||
| Total Mid Cap Common Stocks |
30,838 | |||
| Small Cap Common Stocks (2.9%) | ||||
| Consumer Discretionary (0.5%) |
||||
| *California Pizza Kitchen, Inc. |
1,800 | 39 | ||
| *Capella Education Co. |
2,000 | 92 | ||
| *Citi Trends, Inc. |
1,300 | 49 | ||
| *Force Protection, Inc. |
2,400 | 50 | ||
| Small Cap Common Stocks (2.9%) |
Shares/ $ Par |
Value $ (000’s) | ||
| Consumer Discretionary continued |
||||
| *GSI Commerce, Inc. |
1,901 | 43 | ||
| *Hibbett Sports Inc. |
2,400 | 66 | ||
| *J. Crew Group, Inc. |
1,100 | 59 | ||
| *LIFE TIME FITNESS, Inc. |
2,400 | 128 | ||
| *LKQ Corp. |
3,200 | 79 | ||
| *Morton’s Restaurant Group, Inc. |
4,200 | 76 | ||
| *National CineMedia, Inc. |
2,900 | 81 | ||
| Orient-Express Hotels, Ltd. — Class A |
1,500 | 80 | ||
| *Pinnacle Entertainment, Inc. |
2,800 | 79 | ||
| Sotheby’s |
700 | 32 | ||
| *The9 Ltd., ADR |
1,500 | 69 | ||
| *Tween Brands, Inc. |
1,100 | 49 | ||
| *Volcom, Inc. |
2,700 | 135 | ||
| *Zumiez, Inc. |
3,500 | 132 | ||
| Total |
1,338 | |||
| Consumer Staples (0.1%) |
||||
| *Central European Distribution Corp. |
3,000 | 104 | ||
| *TreeHouse Foods, Inc. |
1,479 | 39 | ||
| UAP Holding Corp. |
3,700 | 112 | ||
| Total |
255 | |||
| Energy (0.2%) |
||||
| *Dril-Quip, Inc. |
2,600 | 117 | ||
| *Global Industries, Ltd. |
5,500 | 148 | ||
| *Oceaneering International, Inc. |
2,400 | 126 | ||
| *T-3 Energy Services, Inc. |
1,900 | 64 | ||
| World Fuel Services Corp. |
2,100 | 88 | ||
| Total |
543 | |||
| Financials (0.2%) |
||||
| *FCStone Group, Inc. |
1,100 | 63 | ||
| *Global Cash Access Holdings, Inc. |
7,300 | 117 | ||
| Greater Bay Bancorp |
2,700 | 75 | ||
| Greenhill & Co., Inc. |
1,500 | 103 | ||
| *Interactive Brokers Group, Inc. — Class A |
1,100 | 30 | ||
| *KBW, Inc. |
1,991 | 58 | ||
| *optionsXpress Holdings, Inc. |
3,161 | 81 | ||
| *Portfolio Recovery Associates, Inc. |
1,400 | 84 | ||
| PrivateBancorp, Inc. |
400 | 12 | ||
| Total |
623 | |||
| Health Care (0.4%) |
||||
| *Adams Respiratory Therapeutics, Inc. |
1,366 | 54 | ||
| *Allscripts Healthcare Solutions, Inc. |
2,700 | 69 | ||
| *Digene Corp. |
2,400 | 144 | ||
| *Hologic, Inc. |
600 | 33 | ||
| *Kyphon, Inc. |
2,200 | 106 | ||
| Meridian Bioscience, Inc. |
2,100 | 45 | ||
| *Natus Medical, Inc. |
5,300 | 84 | ||
| *Noven Pharmaceuticals, Inc. |
3,800 | 89 | ||
The Accompanying Notes are an Integral Part of the Financial Statements.
Asset Allocation Portfolio
77
Table of Contents
Asset Allocation Portfolio
| Small Cap Common Stocks (2.9%) |
Shares/ $ Par |
Value $ (000’s) | ||
| Health Care continued |
||||
| *Obagi Medical Products, Inc. |
2,700 | 48 | ||
| *Pediatrix Medical Group, Inc. |
1,600 | 88 | ||
| *Providence Service Corp. |
6,100 | 163 | ||
| *Psychiatric Solutions, Inc. |
5,300 | 192 | ||
| *Thoratec Corp. |
3,200 | 59 | ||
| Total |
1,174 | |||
| Industrials (0.5%) |
||||
| *The Advisory Board Co. |
2,700 | 150 | ||
| *American Commercial Lines, Inc. |
1,300 | 34 | ||
| Bucyrus International, Inc. — Class A |
2,600 | 184 | ||
| C.H. Robinson Worldwide, Inc. |
1,200 | 63 | ||
| *Corrections Corp. of America |
3,500 | 221 | ||
| *Houston Wire & Cable Co. |
3,000 | 85 | ||
| *Huron Consulting Group, Inc. |
1,300 | 95 | ||
| Interface, Inc. — Class A |
5,700 | 108 | ||
| Knight Transportation, Inc. |
5,137 | 100 | ||
| Knoll, Inc. |
6,200 | 139 | ||
| *Marlin Business Services Corp. |
6,100 | 130 | ||
| *VistaPrint, Ltd. |
1,700 | 65 | ||
| Total |
1,374 | |||
| Small Cap Common Stocks (2.9%) |
Shares/ $ Par |
Value $ (000’s) | ||
| Information Technology (0.9%) |
||||
| *Aruba Networks, Inc. |
2,100 | 42 | ||
| *Bankrate, Inc. |
900 | 43 | ||
| *Blackboard, Inc. |
5,700 | 240 | ||
| *comScore, Inc. |
49 | 1 | ||
| *Comtech Group, Inc. |
3,400 | 56 | ||
| *Cymer, Inc. |
700 | 28 | ||
| *Data Domain, Inc. |
400 | 9 | ||
| *DealerTrack Holdings, Inc. |
5,300 | 195 | ||
| *Diodes, Inc. |
2,900 | 121 | ||
| *Forrester Research, Inc. |
2,200 | 62 | ||
| *IHS, Inc. — Class A |
900 | 41 | ||
| *Kenexa Corp. |
6,200 | 234 | ||
| *Limelight Networks, Inc. |
3,910 | 77 | ||
| *Loopnet, Inc. |
1,800 | 42 | ||
| *Macrovision Corp. |
2,500 | 75 | ||
| *Mellanox Technologies, Ltd. |
900 | 19 | ||
| *MKS Instruments, Inc. |
1,500 | 42 | ||
| *Netlogic Microsystems, Inc. |
4,500 | 143 | ||
| *Polycom, Inc. |
1,000 | 34 | ||
| *Riverbed Technology, Inc. |
1,100 | 48 | ||
| *Silicon Image, Inc. |
5,800 | 50 | ||
| *SiRF Technology Holdings, Inc. |
3,000 | 62 | ||
| *Sohu.com, Inc. |
4,300 | 138 | ||
| *SonicWALL, Inc. |
5,990 | 51 | ||
| *Spreadtrum Communications, Inc. |
300 | 4 | ||
| *Switch & Data Facilities Co. |
6,432 | 123 | ||
| *Synaptics, Inc. |
1,600 | 57 | ||
| Small Cap Common Stocks (2.9%) |
Shares/ $ Par |
Value $ (000’s) | ||
| Information Technology continued |
||||
| *Synchronoss Technologies, Inc. |
1,900 | 56 | ||
| Syntel, Inc. |
800 | 24 | ||
| *Tessera Technologies, Inc. |
5,100 | 207 | ||
| *THQ, Inc. |
5,046 | 154 | ||
| *The Ultimate Software Group, Inc. |
3,350 | 97 | ||
| *ValueClick, Inc. |
1,900 | 56 | ||
| Total |
2,631 | |||
| Materials (0.1%) |
||||
| A.M. Castle & Co. |
700 | 25 | ||
| Airgas, Inc. |
3,000 | 144 | ||
| Silgan Holdings, Inc. |
2,200 | 122 | ||
| Total |
291 | |||
| Telecommunication Services (0.0%) | ||||
| *Glu Mobile, Inc. |
2,827 | 39 | ||
| Total |
39 | |||
| Utilities (0.0%) |
||||
| ITC Holdings Corp. |
3,600 | 146 | ||
| Total |
146 | |||
| Total Small Cap Common Stocks |
8,414 | |||
| Total Domestic Common Stocks and Warrants (Cost: $100,020) |
120,913 | |||
| Foreign Common Stocks (19.9%) | Country | Shares/ $ Par |
Value $ (000’s) | |||
| Consumer Discretionary (3.2%) |
||||||
| British Sky Broadcasting Group PLC |
United Kingdom |
30,575 | 385 | |||
| Burberry Group PLC |
United Kingdom |
34,930 | 477 | |||
| *Central European Media Enterprises, Ltd. |
Czech Republic |
4,755 | 464 | |||
| Compagnie Financiere Richemont SA |
Switzerland | 6,795 | 409 | |||
| Esprit Holdings, Ltd. |
Hong Kong | 38,500 | 490 | |||
| Fiat SPA |
Italy | 28,055 | 836 | |||
| Focus Media Holding, Ltd. |
China | 11,500 | 581 | |||
| Hugo Boss AG |
Germany | 6,330 | 379 | |||
| Inditex SA |
Spain | 9,965 | 588 | |||
| Intercontinental Hotels Group PLC |
United Kingdom |
17,951 | 444 | |||
| Kuoni Reisen Holding |
Switzerland | 665 | 399 | |||
| Makita Corp. |
Japan | 8,500 | 380 | |||
| Point, Inc. |
Japan | 6,300 | 373 | |||
| PPR |
France | 2,670 | 466 | |||
| Renault SA |
France | 1,710 | 274 | |||
| Sol Melia SA |
Spain | 22,680 | 504 | |||
| Swatch Group AG |
Switzerland | 1,800 | 511 | |||
| Toyota Motor Corp. |
Japan | 6,700 | 422 | |||
| *Urbi Desarollos Urbanos SA |
Mexico | 118,515 | 535 | |||
| WPP Group PLC |
United Kingdom |
24,745 | 368 | |||
| Total |
9,285 | |||||
| Foreign Common Stocks (19.9%) | Country | Shares/ $ Par |
Value $ (000’s) | |||
| Consumer Staples (1.5%) |
||||||
| Barry Callebaut AG |
Switzerland | 630 | 477 | |||
| Coca Cola Hellenic Bottling Co. SA |
Greece | 11,550 | 531 | |||
| Heineken NV |
Netherlands | 8,030 | 472 | |||
| Iaws Group PLC |
Ireland | 16,920 | 354 | |||
| InBev NV |
Belgium | 5,655 | 448 | |||
| Kerry Group PLC |
Ireland | 11,265 | 314 | |||
| Reckitt Benckiser PLC |
United Kingdom | 13,090 | 717 | |||
| Tesco PLC |
United Kingdom | 61,760 | 514 | |||
| Unilever NV |
Netherlands | 7,430 | 231 | |||
| Woolworths, Ltd. |
Australia | 21,440 | 491 | |||
| Total |
4,549 | |||||
| Energy (0.8%) |
||||||
| *Artumas Group, Inc. |
Norway | 17,620 | 178 | |||
| Cameco Co. |
Canada | 10,930 | 554 | |||
| *China Coal Energy Co. |
China | 246,000 | 369 | |||
| *Electromagnetic Geo |
Norway | 9,185 | 184 | |||
| Expro International Group |
United Kingdom | 12,425 | 242 | |||
| *Petroleum Geo-Services ASA |
Norway | 18,285 | 452 | |||
| Reliance Industries, Ltd. |
India | 5,705 | 238 | |||
| *Seajacks International, Ltd. |
Norway | 11,435 | 118 | |||
| Total |
2,335 | |||||
The Accompanying Notes are an Integral Part of the Financial Statements.
78
Asset Allocation Portfolio
Table of Contents
Asset Allocation Portfolio
| Foreign Common Stocks (19.9%) | Country | Shares/ $ Par |
Value $ (000’s) | |||
| Financials (3.1%) |
||||||
| Admiral Group PLC |
United Kingdom | 20,467 | 363 | |||
| Aeon Mall Co., Ltd. |
Japan | 14,700 | 451 | |||
| Allianz SE |
Germany | 2,765 | 648 | |||
| Allied Irish Banks PLC |
Ireland | 9,325 | 253 | |||
| Anglo Irish Bank Corp. PLC |
Ireland | 45,000 | 917 | |||
| Ardepro Co., Ltd. |
Japan | 1,173 | 365 | |||
| AXA SA |
France | 11,945 | 513 | |||
| Azimut Holding SPA |
Italy | 34,250 | 580 | |||
| Banca Popolare Italiana Scrl |
Italy | 14,430 | 220 | |||
| Banco Espanol de Credito SA |
Spain | 14,825 | 336 | |||
| Banco Espirito Santo SA |
Portugal | 10,925 | 243 | |||
| Banco Popolare di Verona e Novara Scrl |
Italy | 7,235 | 209 | |||
| Credit Suisse Group |
Switzerland | 7,675 | 544 | |||
| Erste Bank Der Oesterreichischen Sparkassen AG |
Austria | 7,405 | 578 | |||
| Hopson Development |
Hong Kong | 42,000 | 118 | |||
| Hypo Real Estate Holding AG |
Germany | 6,635 | 430 | |||
| Induntrial Bank of Korea |
Korea | 7,160 | 146 | |||
| Korean Reinsurance Co. |
Korea | 16,320 | 254 | |||
| Manulife Financial Corp. |
Canada | 5,945 | 222 | |||
| Piraeus Bank SA |
Greece | 15,110 | 553 | |||
| *Scandinavian Property Development ASA |
Norway | 23,060 | 184 | |||
| *TAG Tegernsee Immobilien Und Beteiligungs AG |
Germany | 21,360 | 263 | |||
| The Toronto-Dominion Bank |
Canada | 4,930 | 337 | |||
| Uncredito Italiano Spa |
Italy | 51,290 | 456 | |||
| Total |
9,183 | |||||
| Health Care (1.2%) |
||||||
| *Actelion, Ltd. |
Switzerland | 5,450 | 243 | |||
| CSL, Ltd. |
Australia | 8,270 | 614 | |||
| Daiichi Sankyo Co., Ltd. |
Japan | 14,600 | 388 | |||
| Merck KGaA |
Germany | 2,620 | 360 | |||
| Nobel Biocare Holding AG |
Switzerland | 1,390 | 454 | |||
| Stada Arzneimittel AG |
Germany | 7,150 | 455 | |||
| Takeda Pharmaceutical Co., Ltd. |
Japan | 3,200 | 207 | |||
| Terumo Corp. |
Japan | 11,300 | 436 | |||
| *William Demant Holding A/S |
Denmark | 4,520 | 446 | |||
| Total |
3,603 | |||||
| Industrials (4.8%) |
||||||
| ABB, Ltd., ADR |
Switzerland | 35,740 | 809 | |||
| Aker Yards ASA |
Norway | 16,500 | 285 | |||
| *Alstom |
France | 3,650 | 608 | |||
| Atlas Copco AB |
Sweden | 27,600 | 461 | |||
| Bharat Heavy Electricals, Ltd. |
India | 12,550 | 472 | |||
| CAE, Inc. |
Canada | 47,075 | 637 | |||
| Capita Group PLC |
United Kingdom | 37,305 | 541 | |||
| China Infrastructure Machinery Holdings, Ltd. |
China | 114,000 | 249 | |||
| Companhia de Concessoes Rodoviarias |
Brazil | 31,380 | 581 | |||
| Cosco Corp., Singapore, Ltd. |
Singapore | 38,000 | 93 | |||
| Daewoo Shipbuilding & Marine Engineering Co. |
Korea | 7,660 | 433 | |||
| *Deutz AG |
Germany | 8,185 | 106 | |||
| Foreign Common Stocks (19.9%) | Country | Shares/ $ Par |
Value $ (000’s) | |||
| Industrials continued |
||||||
| Flsmidth & Co A/S |
Denmark | 7,260 | 570 | |||
| *Grafton Group PLC |
Ireland | 18,460 | 265 | |||
| Hopewell Holdings |
Hong Kong | 83,000 | 338 | |||
| IVCRL Infrastructures & Projects, Ltd. |
India | 41,490 | 365 | |||
| Komatsu, Ltd. |
Japan | 16,000 | 463 | |||
| Kuehne & Nagel International AG |
Switzerland | 5,810 | 535 | |||
| LG Corp. |
Korea | 1,510 | 78 | |||
| Metso Oyj |
Finland | 9,710 | 570 | |||
| Michael Page International PLC |
United Kingdom | 58,360 | 614 | |||
| MTU Aero Engines Holding AG |
Germany | 9,335 | 606 | |||
| *Prysmian SPA |
Italy | 14,540 | 356 | |||
| PT Berlian Laju Tanker Tbk |
Indonesia | 1,493,500 | 339 | |||
| Sembcorp Marine, Ltd. |
Singapore | 179,000 | 572 | |||
| SGS SA |
Switzerland | 450 | 533 | |||
| Siemens AG |
Germany | 5,000 | 719 | |||
| *Thielert AG |
Germany | 1,965 | 60 | |||
| Tianjin Development Holdings, Ltd. |
Hong Kong | 347,000 | 378 | |||
| TNT NV |
Netherlands | 9,800 | 442 | |||
| Vinci SA |
France | 8,060 | 601 | |||
| Wavin NV |
Netherlands | 19,830 | 477 | |||
| Total |
14,156 | |||||
| Information Technology (2.1%) |
||||||
| *Autonomy Corp. PLC |
United Kingdom | 37,017 | 530 | |||
| *Blinkx PLC |
United Kingdom | 37,017 | 32 | |||
| Cap Gemini SA |
France | 5,520 | 404 | |||
| EVS Broadcast Equipment SA |
Belgium | 2,975 | 245 | |||
| *Gresham Computing PLC |
United Kingdom | 38,450 | 97 | |||
| Hon Hai Precision Industry Co., Ltd. |
Taiwan | 52,000 | 449 | |||
| Kontron AG |
Germany | 32,311 | 607 | |||
| *LG.Philips LCD Co., Ltd. |
Korea | 10,520 | 473 | |||
| Neopost SA |
France | 3,880 | 567 | |||
| Nippon Electric Glass Co., Ltd. |
Japan | 34,000 | 597 | |||
| Star Micronics Co., Ltd. |
Japan | 22,300 | 594 | |||
| Sumco Corp. |
Japan | 4,000 | 200 | |||
| Telechips, Inc. |
Korea | 8,501 | 201 | |||
| *Temenos Group AG |
Switzerland | 25,130 | 603 | |||
| Vtech Holdings, Ltd. |
Hong Kong | 59,000 | 499 | |||
| Total |
6,098 | |||||
| Materials (1.9%) |
||||||
| Akzo Nobel NV |
Netherlands | 5,200 | 449 | |||
| Anglo American PLC |
United Kingdom | 9,500 | 549 | |||
| BHP Billiton, Ltd. |
Australia | 19,735 | 589 | |||
| Companhia Vale do Rio Doce, ADR |
Brazil | 16,100 | 717 | |||
| *Crew Minerals ASA |
Norway | 74,755 | 218 | |||
| CRH PLC |
Ireland | 12,038 | 596 | |||
| *Gammon Gold, Inc. |
Canada | 8,550 | 108 | |||
| Imperial Chemical Industries PLC |
United Kingdom | 44,509 | 548 | |||
| K+S AG |
Germany | 4,985 | 763 | |||
| Sika AG |
Switzerland | 175 | 357 | |||
The Accompanying Notes are an Integral Part of the Financial Statements.
Asset Allocation Portfolio
79
Table of Contents
Asset Allocation Portfolio
| Foreign Common Stocks (19.9%) | Country | Shares/ $ Par |
Value $ (000’s) | |||
| Materials continued |
||||||
| *Smurfit Kappa Group PLC |
Ireland | 8,720 | 218 | |||
| Syngenta AG |
Switzerland | 2,365 | 461 | |||
| Total |
5,573 | |||||
| Other Holdings (0.3%) |
||||||
| Nomura ETF — Nikkei 225 |
Japan | 3,040 | 452 | |||
| Nomura Topix ETF |
Japan | 28,700 | 417 | |||
| Total |
869 | |||||
| Telecommunications (0.6%) |
||||||
| *Bharti Airtel, Ltd. |
India | 13,700 | 281 | |||
| China Mobile, Ltd. |
Hong Kong | 27,000 | 290 | |||
| *Freenet AG |
Germany | 13,565 | 442 | |||
| Foreign Common Stocks (19.9%) | Country | Shares/ $ Par |
Value $ (000’s) | |||
| Telecommunications continued |
||||||
| Tele2 AB |
Sweden | 22,055 | 360 | |||
| *Telenor ASA |
Norway | 21,290 | 416 | |||
| Total |
1,789 | |||||
| Utilities (0.4%) |
||||||
| Cez |
Czech Republic | 9,750 | 504 | |||
| PT Perusahaan Gas Negara |
Indonesia | 109,000 | 114 | |||
| Veolia Environnement |
France | 5,895 | 461 | |||
| Total |
1,079 | |||||
| Total Foreign Common Stocks |
58,519 | |||||
| Investment Grade Segment (8.3%) |
Shares/ $ Par |
Value $ (000’s) | ||
| Aerospace/Defense (0.6%) |
||||
| BAE Systems Holdings, Inc., 4.75%, 8/15/10 144A |
145,000 | 142 | ||
| Boeing Capital Corp., |
255,000 | 253 | ||
| General Dynamics Corp., |
305,000 | 299 | ||
| General Dynamics Corp., |
50,000 | 47 | ||
| L-3 Communications Corp., 6.375%, 10/15/15 |
410,000 | 387 | ||
| L-3 Communications Corp., 7.625%, 6/15/12 |
105,000 | 107 | ||
| Lockheed Martin Corp., |
100,000 | 113 | ||
| Raytheon Co., |
305,000 | 304 | ||
| Total |
1,652 | |||
| Auto Manufacturing (0.1%) |
||||
| DaimlerChrysler NA Holdings Corp., 5.75%, 5/18/09 |
155,000 | 156 | ||
| DaimlerChrysler NA Holdings Corp., 8.50%, 1/18/31 |
20,000 | 25 | ||
| Total |
181 | |||
| Banking (1.2%) |
||||
| BA Covered Bond Issuer, |
140,000 | 140 | ||
| Bank of America Corp., |
235,000 | 225 | ||
| Bank of America Corp., |
150,000 | 148 | ||
| Bank of New York, |
75,000 | 74 | ||
| Bank One Corp., |
235,000 | 230 | ||
| Barclays Bank PLC, |
100,000 | 97 | ||
| Investment Grade Segment (8.3%) |
Shares/ $ Par |
Value $ (000’s) | ||
| Banking continued |
||||
| BB&T Corp., |
55,000 | 51 | ||
| Citigroup, Inc., |
320,000 | 309 | ||
| Credit Suisse Guernsey Ltd., |
10,000 | 10 | ||
| Deutsche Bank Capital Funding Trust, |
50,000 | 48 | ||
| JP Morgan Chase & Co., |
25,000 | 25 | ||
| JPMorgan Chase Bank NA, |
145,000 | 145 | ||
| M&I Marshall & Ilsley Bank, 5.25%, 9/4/12 |
250,000 | 247 | ||
| Mellon Funding Corp., |
260,000 | 267 | ||
| National Australia Bank, Ltd., 4.80%, 4/6/10 144A |
199,000 | 196 | ||
| Northern Trust Corp., |
45,000 | 45 | ||
| PNC Funding Corp., |
50,000 | 49 | ||
| State Street Bank and Trust Co., 5.30%, 1/15/16 |
250,000 | 243 | ||
| UnionBanCal Corp., |
50,000 | 49 | ||
| US Bank NA, |
90,000 | 84 | ||
| Wachovia Corp., |
175,000 | 174 | ||
| Wachocvia Corp., |
90,000 | 89 | ||
| Washington Mutual, Inc., 5.00%, 3/22/12 |
70,000 | 67 | ||
| Wells Fargo Bank NA, 5.75%, 5/16/16 |
15,000 | 15 | ||
| Zions Bancorporation, 5.50%, 11/16/15 |
125,000 | 120 | ||
| Total |
3,147 | |||
| Investment Grade Segment (8.3%) |
Shares/ $ Par |
Value $ (000’s) | ||
| Beverage/Bottling (0.2%) |
||||
| Anheuser-Busch Companies, Inc., 4.375%, 1/15/13 |
25,000 | 23 | ||
| Anheuser-Busch Companies, Inc., 5.75%, 4/1/36 |
30,000 | 28 | ||
| Anheuser-Busch Companies, Inc., 5.95%, 1/15/33 |
15,000 | 14 | ||
| Bottling Group LLC, |
65,000 | 63 | ||
| Constellation Brands, Inc., |
180,000 | 176 | ||
| Diageo Capital PLC, 4.375%, 5/3/10 |
45,000 | 44 | ||
| PepsiAmericas, Inc., 4.875%, 1/15/15 |
150,000 | 141 | ||
| PepsiCo, Inc., |
65,000 | 64 | ||
| SABMiller PLC, |
155,000 | 158 | ||
| Total |
711 | |||
| Building Products (0.0%) |
||||
| CRH America, Inc., |
40,000 | 40 | ||
| Total |
40 | |||
| Cable/Media/Broadcasting/Satellite (0.4%) | ||||
| CBS Corp., |
25,000 | 26 | ||
| Clear Channel Communications, Inc., |
115,000 | 111 | ||
| Comcast Corp., |
195,000 | 189 | ||
| Cox Communications, Inc., |
45,000 | 44 | ||
| Historic TW, Inc., |
85,000 | 83 | ||
| News America, Inc., |
35,000 | 33 | ||
| News America, Inc., |
10,000 | 9 | ||
The Accompanying Notes are an Integral Part of the Financial Statements.
80
Asset Allocation Portfolio
Table of Contents
Asset Allocation Portfolio
| Investment Grade Segment (8.3%) |
Shares/ $ Par |
Value $ (000’s) | ||
| Cable/Media/Broadcasting/Satellite continued | ||||
| Rogers Cable, Inc., |
225,000 | 218 | ||
| Rogers Cable, Inc., |
10,000 | 10 | ||
| TCI Communications, Inc., |
60,000 | 69 | ||
| Time Warner Cable, Inc., |
40,000 | 39 | ||
| Time Warner Cable, Inc., |
15,000 | 14 | ||
| Time Warner Entertainment Co. LP, 7.25%, 9/1/08 |
255,000 | 260 | ||
| Time Warner Entertainment Co. LP, 8.375%, 3/15/23 |
55,000 | 63 | ||
| Viacom Inc., |
65,000 | 65 | ||
| Total |
1,233 | |||
| Conglomerate/Diversified Manufacturing (0.0%) | ||||
| Honeywell International, Inc., 5.30%, 3/15/17 |
30,000 | 29 | ||
| United Technologies Corp., |
60,000 | 62 | ||
| Total |
91 | |||
| Consumer Products (0.2%) |
||||
| The Clorox Co., |
150,000 | 145 | ||
| Fortune Brands, Inc., 5.375%, 1/15/16 |
45,000 | 42 | ||
| The Gillette Co., |
350,000 | 340 | ||
| The Procter & Gamble Co., |
40,000 | 38 | ||
| Total |
565 | |||
| Electric Utilities (1.4%) |
||||
| Carolina Power & Light, Inc., 5.15%, 4/1/15 |
25,000 | 24 | ||
| Carolina Power & Light, Inc., 6.50%, 7/15/12 |
20,000 | 21 | ||
| CenterPoint Energy Houston Electric LLC, |
15,000 | 15 | ||
| CenterPoint Energy Houston Electric LLC, |
15,000 | 16 | ||
| CMS Energy Corp., |
100,000 | 101 | ||
| Consolidated Edison Co. of New York, |
30,000 | 29 | ||
| Consolidated Edison Co. of New York, |
35,000 | 34 | ||
| Consumer Energy Co., 4.80%, 2/17/09 |
310,000 | 307 | ||
| Investment Grade Segment (8.3%) |
Shares/ $ Par |
Value $ (000’s) | ||
| Electric Utilities continued |
||||
| DTE Energy Co., |
380,000 | 398 | ||
| Duke Energy Corp., |
100,000 | 103 | ||
| Duquesne Light Holdings, Inc., 5.50%, 8/15/15 |
55,000 | 51 | ||
| Entergy Mississippi, Inc., 6.25%, 4/1/34 |
55,000 | 52 | ||
| Florida Power & Light Co., |
60,000 | 56 | ||
| Florida Power Corp., |
178,000 | 173 | ||
| FPL Group Capital, Inc., |
235,000 | 235 | ||
| Indiana Michigan Power, |
160,000 | 150 | ||
| Kiowa Power Partners LLC, |
60,610 | 58 | ||
| Kiowa Power Partners LLC, |
100,000 | 96 | ||
| MidAmerican Energy Holdings Co., |
15,000 | 14 | ||
| Monongahela Power Co., |
45,000 | 44 | ||
| Nevada Power Co., |
95,000 | 93 | ||
| Nevada Power Co., |
95,000 | 96 | ||
| Northern States Power Co., |
15,000 | 14 | ||
| Oncor Electric Delivery Co., |
75,000 | 76 | ||
| Oncor Electric Delivery Co., |
55,000 | 57 | ||
| Pacific Gas & Electric Co., 5.80%, 3/1/37 |
15,000 | 14 | ||
| Pacific Gas & Electric Co., 6.05%, 3/1/34 |
60,000 | 58 | ||
| PacifiCorp, 5.45%, 9/15/13 |
240,000 | 236 | ||
| PacifiCorp, 5.75%, 4/1/37 |
55,000 | 52 | ||
| PPL Electric Utilities Corp., |
125,000 | 115 | ||
| PPL Electric Utilities Corp., |
40,000 | 40 | ||
| PPL Electric Utilities Corp., |
10,000 | 10 | ||
| PPL Energy Supply LLC, |
25,000 | 23 | ||
| Progress Energy, Inc., 6.85%, 4/15/12 |
60,000 | 63 | ||
| Public Service Co. of Colorado, 5.50%, 4/1/14 |
110,000 | 108 | ||
| Public Service Electric & Gas Co., 5.00%, 1/1/13 |
100,000 | 97 | ||
| Public Service Electric & Gas Co., 5.70%, 12/1/36 |
95,000 | 89 | ||
| Puget Sound Energy, Inc., |
115,000 | 113 | ||
| Investment Grade Segment (8.3%) |
Shares/ $ Par |
Value $ (000’s) | ||
| Electric Utilities continued |
||||
| Puget Sound Energy, Inc., |
60,000 | 59 | ||
| Sierra Pacific Power Co., 6.75%, 7/1/37 |
30,000 | 30 | ||
| Southern California Edison Co., 5.00%, 1/15/16 |
115,000 | 109 | ||
| Southern California Edison Co., 5.55%, 1/15/37 |
20,000 | 18 | ||
| Tampa Electric Co., |
25,000 | 24 | ||
| Tampa Electric Co., |
30,000 | 31 | ||
| Toledo Edison Co. |
155,000 | 145 | ||
| Union Electric Co., |
10,000 | 10 | ||
| Virginia Electric & Power Co., 6.00%, 5/15/37 |
130,000 | 124 | ||
| Xcel Energy, Inc., |
50,000 | 51 | ||
| Total |
3,932 | |||
| Electronics (0.0%) |
||||
| Cisco Systems, Inc., |
15,000 | 15 | ||
| Total |
15 | |||
| Food Processors (0.2%) |
||||
| Delhaize America, Inc., 6.50%, 6/15/17 144A |
15,000 | 15 | ||
| General Mills, Inc., |
55,000 | 54 | ||
| Kellogg Co., 6.60%, 4/1/11 |
295,000 | 304 | ||
| Kraft Foods, Inc., |
30,000 | 29 | ||
| Kraft Foods, Inc., |
165,000 | 168 | ||
| Total |
570 | |||
| Gaming/Lodging/Leisure (0.1%) |
||||
| Harrah’s Operating Co., Inc., |
40,000 | 32 | ||
| Royal Caribbean Cruises, Ltd., 7.00%, 6/15/13 |
160,000 | 161 | ||
| Total |
193 | |||
| Gas Pipelines (0.1%) |
||||
| Consolidated Natural Gas Co., 5.00%, 12/1/14 |
130,000 | 123 | ||
| Kinder Morgan Energy Partners LP, |
100,000 | 104 | ||
| Kinder Morgan Finance, 5.35%, 1/5/11 |
135,000 | 133 | ||
| Southern Natural Gas Co., 5.90%, 4/1/17 144A |
20,000 | 19 | ||
| Total |
379 | |||
The Accompanying Notes are an Integral Part of the Financial Statements.
Asset Allocation Portfolio
81
Table of Contents
Asset Allocation Portfolio
| Investment Grade Segment (8.3%) |
Shares/ $ Par |
Value $ (000’s) | ||
| Independent Finance (0.2%) |
||||
| GMAC LLC, |
125,000 | 119 | ||
| HSBC Finance Corp., 4.125%, 11/16/09 |
195,000 | 189 | ||
| International Lease Finance Corp., 4.75%, 1/13/12 |
100,000 | 96 | ||
| iStar Financial, Inc., |
90,000 | 87 | ||
| Total |
491 | |||
| Industrials-Other (0.1%) |
||||
| Centex Corp., |
45,000 | 43 | ||
| Centex Corp., |
15,000 | 16 | ||
| DR Horton, Inc., |
30,000 | 28 | ||
| DR Horton, Inc., |
10,000 | 10 | ||
| KB HOME, 7.75%, 2/1/10 |
155,000 | 154 | ||
| Lennar Corp., |
70,000 | 69 | ||
| Total |
320 | |||
| Information/Data Technology (0.0%) | ||||
| Seagate Technology HDD Holdings, 6.80%, 10/1/16 |
40,000 | 38 | ||
| Total |
38 | |||
| Machinery (0.0%) |
||||
| John Deere Capital Corp., 4.50%, 8/25/08 |
70,000 | 69 | ||
| Total |
69 | |||
| Metals/Mining (0.0%) |
||||
| Alcoa, Inc., 5.72%, 2/23/19 |
100,000 | 95 | ||
| Alcoa, Inc., 5.90%, 2/1/27 |
55,000 | 51 | ||
| Total |
146 | |||
| Mortgage Banking (0.1%) |
||||
| Countrywide Financial Corp., 5.80%, 6/7/12 |
40,000 | 40 | ||
| Residential Capital LLC, 6.00%, 2/22/11 |
130,000 | 126 | ||
| Residential Capital LLC, 6.50%, 4/17/13 |
205,000 | 198 | ||
| Total |
364 | |||
| Natural Gas Distributors (0.0%) |
||||
| NiSource Finance Corp., 5.40%, 7/15/14 |
45,000 | 43 | ||
| Total |
43 | |||
| Oil and Gas (0.7%) |
||||
| Anadarko Finance Co., 5.95%, 9/15/16 |
45,000 | 44 | ||
| Anadarko Petroleum Corp., |
30,000 | 29 | ||
| Investment Grade Segment (8.3%) |
Shares/ $ Par |
Value $ (000’s) | ||
| Oil and Gas continued |
||||
| Anadarko Petroleum Corp., |
60,000 | 64 | ||
| Apache Corp., 5.625%, 1/15/17 |
15,000 | 15 | ||
| Apache Corp., 6.00%, 1/15/37 |
20,000 | 19 | ||
| Canadian Natural Resources, Ltd., |
25,000 | 24 | ||
| Canadian Natural Resources, Ltd., |
25,000 | 24 | ||
| Canadian Natural Resources, Ltd., |
40,000 | 39 | ||
| Conoco Funding Co., 6.35%, 10/15/11 |
215,000 | 221 | ||
| ConocoPhilips Canada Funding Co., 5.30%, 4/15/12 |
45,000 | 44 | ||
| ConocoPhilips Canada Funding Co., |
30,000 | 30 | ||
| Devon Energy Corp., 7.95%, 4/15/32 |
25,000 | 29 | ||
| Devon Financing Corp. ULC, 6.875%, 9/30/11 |
130,000 | 136 | ||
| Encana Holdings Finance Corp., 5.80%, 5/1/14 |
60,000 | 60 | ||
| Hess Corp., 7.125%, 3/15/33 |
20,000 | 21 | ||
| Nexen, Inc., 5.875%, 3/10/35 |
105,000 | 94 | ||
| Occidental Petroleum, 4.00%, 11/30/07 |
120,000 | 119 | ||
| Pemex Project Funding Master Trust, |
200,000 | 196 | ||
| Petro-Canada, 5.95%, 5/15/35 |
55,000 | 51 | ||
| Pioneer Natural Resource, |
110,000 | 104 | ||
| Suncoc, Inc., 5.75%, 1/15/17 |
65,000 | 63 | ||
| Suncor Energy, Inc., 6.50%, 6/15/38 |
20,000 | 20 | ||
| Talisman Energy, Inc., 5.85%, 2/1/37 |
123,000 | 109 | ||
| Tesoro Corp., 6.25%, 11/1/12 |
120,000 | 119 | ||
| Tesoro Corp., 6.50%, 6/1/17 144A |
140,000 | 137 | ||
| Valero Energy Corp., 6.125%, 6/15/17 |
15,000 | 15 | ||
| Valero Energy Corp., 6.625%, 6/15/37 |
100,000 | 100 | ||
| XTO Energy, Inc., 5.30%, 6/30/15 |
15,000 | 14 | ||
| Total |
1,940 | |||
| Investment Grade Segment (8.3%) |
Shares/ $ Par |
Value $ (000’s) | ||
| Other Finance (0.1%) |
||||
| Capmark Financial Group, |
5,000 | 5 | ||
| SLM Corp., 5.375%, 5/15/14 |
140,000 | 120 | ||
| SLM Corp., 5.45%, 4/25/11 |
255,000 | 236 | ||
| Total |
361 | |||
| Other Services (0.0%) |
||||
| Waste Management, Inc., 5.00%, 3/15/14 |
50,000 | 47 | ||
| Total |
47 | |||
| Pharmaceuticals (0.1%) |
||||
| Abbott Laboratories, 3.75%, 3/15/11 |
260,000 | 245 | ||
| Wyeth, 5.95%, 4/1/37 |
45,000 | 43 | ||
| Total |
288 | |||
| Property and Casualty Insurance (0.3%) | ||||
| Berkley (WR) Corp., 9.875%, 5/15/08 |
600,000 | 618 | ||
| Berkshire Hathaway Finance, 3.40%, 7/2/07 |
250,000 | 250 | ||
| The Progressive Corp., 6.70%, 6/15/37 |
15,000 | 15 | ||
| The Travelers Companies, Inc., 6.25%, 6/15/37 |
25,000 | 24 | ||
| Total |
907 | |||
| Railroads (0.3%) |
||||
| Burlington North Santa Fe, 6.125%, 3/15/09 |
240,000 | 243 | ||
| Burlington North Santa Fe, 6.15%, 5/1/37 |
25,000 | 24 | ||
| Canadian Pacific Railway Co., 5.95%, 5/15/37 |
15,000 | 14 | ||
| CSX Corp., 6.15%, 5/1/37 |
50,000 | 48 | ||
| Norfolk Southern Corp., |
45,000 | 46 | ||
| Union Pacific Corp., |
240,000 | 235 | ||
| Union Pacific Corp., |
25,000 | 24 | ||
| Union Pacific Corp., |
45,000 | 46 | ||
| Union Pacific Corp., |
240,000 | 250 | ||
| Total |
930 | |||
| Real Estate Investment Trusts (0.4%) | ||||
| Archstone-Smith Operating Trust, 5.25%, 12/1/10 |
50,000 | 50 | ||
| AvalonBay Communities, Inc., 5.50%, 1/15/12 |
25,000 | 25 | ||
| BRE Properties, Inc., |
25,000 | 24 | ||
| Colonial Realty LP, |
20,000 | 20 | ||
| Developers Diversified Realty Corp., |
80,000 | 78 | ||
The Accompanying Notes are an Integral Part of the Financial Statements.
82
Asset Allocation Portfolio
Table of Contents
Asset Allocation Portfolio
| Investment Grade Segment (8.3%) |
Shares/ $ Par |
Value $ (000’s) | ||
| Real Estate Investment Trusts continued | ||||
| Duke Realty LP, |
45,000 | 45 | ||
| ERP Operating LP, |
120,000 | 116 | ||
| First Industrial LP, |
50,000 | 50 | ||
| Health Care Property Investors, Inc., 6.00%, 1/30/17 |
25,000 | 24 | ||
| HRPT Properties Trust, |
65,000 | 64 | ||
| ProLogis, 5.50%, 3/1/13 |
115,000 | 114 | ||
| ProLogis, 5.75%, 4/1/16 |
65,000 | 64 | ||
| Rouse Co. LP/TRC Co-Issuer, Inc., 6.75%, 5/1/13 144A |
296,000 | 295 | ||
| Simon Property Group LP, 5.375%, 6/1/11 |
195,000 | 193 | ||
| Simon Property Group LP, 5.60%, 9/1/11 |
50,000 | 50 | ||
| Simon Property Group LP, 6.10%, 5/1/16 |
95,000 | 96 | ||
| Total |
1,308 | |||
| Retail Food and Drug (0.1%) |
||||
| CVS/Caremark Corp., 4.875%, 9/15/14 |
60,000 | 55 | ||
| CVS/Caremark Corp., 6.125%, 8/15/16 |
55,000 | 55 | ||
| CVS/Caremark Corp., 6.25%, 6/1/27 |
40,000 | 39 | ||
| The Kroger Co., 6.80%, 12/15/18 |
5,000 | 5 | ||
| The Kroger Co., 7.00%, 5/1/18 |
30,000 | 31 | ||
| Total |
185 | |||
| Retail Stores (0.4%) |
||||
| Costco Wholesale Corp., |
15,000 | 15 | ||
| Costco Wholesale Corp., |
50,000 | 49 | ||
| Federated Department Stores, Inc., 5.90%, 12/1/16 |
30,000 | 29 | ||
| Federated Retail Holdings, Inc., 5.35%, 3/15/12 |
40,000 | 39 | ||
| Federated Retail Holdings, Inc., 6.30%, 4/1/09 |
320,000 | 322 | ||
| The Home Depot, Inc., |
310,000 | 276 | ||
| JC Penney Corp., Inc., |
5,000 | 5 | ||
| JC Penney Corp., Inc., |
10,000 | 10 | ||
| JC Penney Corp., Inc., |
30,000 | 31 | ||
| JC Penny Corp., Inc., |
40,000 | 44 | ||
| Macy’s Retail Holdings Inc., 7.00%, 2/15/28 |
10,000 | 10 | ||
| Investment Grade Segment (8.3%) |
Shares/ $ Par |
Value $ (000’s) | ||
| Retail Stores continued |
||||
| May Department Stores Co., 6.65%, 7/15/24 |
5,000 | 5 | ||
| Target Corp., 5.375%, 5/1/17 |
95,000 | 91 | ||
| Target Corp., 5.40%, 10/1/08 |
215,000 | 215 | ||
| Wal-Mart Stores, Inc., |
30,000 | 29 | ||
| Wal-Mart Stores, Inc., |
60,000 | 58 | ||
| Total |
1,228 | |||
| Security Brokers and Dealers (0.3%) | ||||
| Goldman Sachs Group, Inc., 5.15%, 1/15/14 |
190,000 | 183 | ||
| Goldman Sachs Group, Inc., 5.625%, 1/15/17 |
125,000 | 120 | ||
| Lehman Brothers Holdings, Inc., 5.75%, 1/3/17 |
170,000 | 165 | ||
| Lehman Brothers Holdings, Inc., 5.875%, 11/15/17 |
60,000 | 59 | ||
| Merrill Lynch & Co. Inc., |
170,000 | 164 | ||
| Merrill Lynch & Co., Inc., 6.22%, 9/15/26 |
20,000 | 19 | ||
| Morgan Stanley, 5.375%, 10/15/15 |
135,000 | 129 | ||
| Morgan Stanley, 5.45%, 1/9/17 |
15,000 | 14 | ||
| Morgan Stanley, 6.25%, 8/9/26 |
60,000 | 60 | ||
| Total |
913 | |||
| Telecommunications (0.6%) | ||||
| AT&T Corp., 8.00%, 11/15/31 |
200,000 | 238 | ||
| British Telecom PLC, |
30,000 | 39 | ||
| Deutsche Telekom International Finance, 5.75%, 3/23/16 |
35,000 | 34 | ||
| Embarq Corp., 6.738%, 6/1/13 |
50,000 | 51 | ||
| Embarq Corp., 7.082%, 6/1/16 |
50,000 | 50 | ||
| Embarq Corp., 7.995%, 6/1/36 |
125,000 | 127 | ||
| France Telecom SA, 8.50%, 3/1/31 |
55,000 | 69 | ||
| Rogers Wireless, Inc., 6.375%, 3/1/14 |
100,000 | 101 | ||
| Sprint Capital Corp., 6.90%, 5/1/19 |
205,000 | 203 | ||
| Sprint Capital Corp., 8.375%, 3/15/12 |
185,000 | 202 | ||
| Sprint Capital Corp., 8.75%, 3/15/32 |
30,000 | 34 | ||
| Telecom Italia Capital, 4.00%, 1/15/10 |
130,000 | 125 | ||
| Investment Grade Segment (8.3%) |
Shares/ $ Par |
Value $ (000’s) | ||
| Telecommunications continued | ||||
| Telecom Italia Capital, 6.20%, 7/18/11 |
100,000 | 101 | ||
| Verizon Communications, Inc., 5.50%, 4/1/17 |
35,000 | 34 | ||
| Verizon Communications, Inc., 5.55%, 2/15/16 |
70,000 | 68 | ||
| Verizon Global Funding Corp., 5.85%, 9/15/35 |
80,000 | 73 | ||
| Vodafone Group PLC, 5.50%, 6/15/11 |
160,000 | 159 | ||
| Total |
1,708 | |||
| Tobacco (0.1%) |
||||
| Reynolds America, Inc., |
15,000 | 15 | ||
| Reynolds America, Inc., |
15,000 | 15 | ||
| Reynolds America, Inc., |
235,000 | 249 | ||
| Total |
279 | |||
| Vehicle Parts (0.0%) |
||||
| Johnson Controls, Inc., 5.25%, 1/15/11 |
45,000 | 45 | ||
| Johnson Controls, Inc., 5.50%, 1/15/16 |
60,000 | 58 | ||
| Johnson Controls, Inc., 6.00%, 1/15/36 |
30,000 | 28 | ||
| Total |
131 | |||
| Yankee Sovereign (0.0%) |
||||
| United Mexican States, |
110,000 | 108 | ||
| Total |
108 | |||
| Total Investment Grade Segment 24,513 | ||||
| Governments (2.4%) | ||||
| Governments (2.4%) |
||||
| Housing & Urban Development, |
100,000 | 102 | ||
| Overseas Private Investment, |
93,840 | 89 | ||
| (e)Tennessee Valley Authority Stripped, 8.25%, 4/15/42 |
1,000,000 | 802 | ||
| US Treasury, 4.50%, 5/15/17 |
1,110,000 | 1,064 | ||
| US Treasury, 4.50%, 2/15/36 |
1,442,000 | 1,306 | ||
The Accompanying Notes are an Integral Part of the Financial Statements.
Asset Allocation Portfolio
83
Table of Contents
Asset Allocation Portfolio
| Governments (2.4%) | Shares/ $ Par |
Value $ (000’s) | ||
| Governments continued |
||||
| US Treasury, 4.75%, 11/15/08 |
1,870,000 | 1,864 | ||
| US Treasury, 4.75%, 5/31/12 |
1,950,000 | 1,934 | ||
| Total Governments |
7,161 | |||
| Structured Products (12.2%) | ||||
| Structured Products (12.2%) |
||||
| AEP Texas Central Transition Funding, 5.306%, 7/1/20 |
1,183,000 | 1,126 | ||
| Asset Securitization Corp., Series 1997-D5, Class PS1, 1.635%, 2/14/43 IO |
5,251,412 | 176 | ||
| Banc of America Funding Corp., Series 2007-1, Class TA1A, |
239,103 | 239 | ||
| Banc of America Funding Corp., Series 2007-4, Class TA1A, |
285,379 | 285 | ||
| Banc of America Mortgage Securities, Series 2004-G, Class 2AG, 4.657%, 8/25/34 |
288,000 | 284 | ||
| Bear Stearns Adjustable Rate Mortgage Trust, Series 2004-4, Class A6, |
645,000 | 632 | ||
| Capital One Auto Finance Trust, Series 2006-A, Class A2, 5.31%, 5/15/09 |
87,069 | 87 | ||
| CenterPoint Energy Transition Bond Co. LLC, Series 2005-A, Class A4, |
140,000 | 136 | ||
| Chase Manhattan Auto Owner Trust, Series 2004-A, Class A4, |
190,514 | 188 | ||
| Chase Manhattan Auto Owner Trust, Series 2005-A, Class A3, |
207,997 | 206 | ||
| Fannie Mae Whole Loan, |
449,618 | 452 | ||
| Federal Home Loan Mortgage Corp., |
142,401 | 132 | ||
| Federal Home Loan Mortgage Corp., |
210,916 | 201 | ||
| Structured Products (12.2%) | Shares/ $ Par |
Value $ (000’s) | ||
| Structured Products continued |
||||
| Federal Home Loan Mortgage Corp., |
472,423 | 449 | ||
| Federal Home Loan Mortgage Corp., |
320,180 | 310 | ||
| Federal Home Loan Mortgage Corp., |
44,386 | 43 | ||
| Federal Home Loan Mortgage Corp., |
161,081 | 156 | ||
| Federal Home Loan Mortgage Corp., |
170,014 | 164 | ||
| Federal Home Loan Mortgage Corp., |
1,060,621 | 997 | ||
| Federal Home Loan Mortgage Corp., |
1,867,642 | 1,755 | ||
| Federal Home Loan Mortgage Corp., |
59,703 | 59 | ||
| Federal Home Loan Mortgage Corp., |
167,403 | 165 | ||
| Federal Home Loan Mortgage Corp., |
28,152 | 28 | ||
| Federal Home Loan Mortgage Corp., |
237,239 | 233 | ||
| Federal Home Loan Mortgage Corp., |
615,318 | 606 | ||
| Federal Home Loan Mortgage Corp., |
139,994 | 135 | ||
| Federal Home Loan Mortgage Corp., |
1,634,158 | 1,577 | ||
| Federal Home Loan Mortgage Corp. Multifamily Structured Pass Through, |
518,049 | 519 | ||
| Federal Home Loan Mortgage Corp. TBA, 6.00%, 8/1/2037 |
2,191,000 | 2,168 | ||
| Federal Home Loan Mortgage Corp. TBA, 6.50%, 8/1/37 |
559,000 | 564 | ||
| Federal National Mortgage Association, |
406,131 | 386 | ||
| Federal National Mortgage Association, |
45,787 | 44 | ||
| Structured Products (12.2%) | Shares/ $ Par |
Value $ (000’s) | ||
| Structured Products continued |
||||
| Federal National Mortgage Association, |
256,423 | 243 | ||
| Federal National Mortgage Association, |
188,364 | 182 | ||
| Federal National Mortgage Association, |
80,295 | 78 | ||
| Federal National Mortgage Association, |
314,655 | 304 | ||
| Federal National Mortgage Association, |
1,048,990 | 987 | ||
| Federal National Mortgage Association, |
162,418 | 153 | ||
| Federal National Mortgage Association, |
447,872 | 421 | ||
| Federal National Mortgage Association, |
81,884 | 77 | ||
| Federal National Mortgage Association, |
3,255,325 | 3,051 | ||
| Federal National Mortgage Association, |
213,250 | 208 | ||
| Federal National Mortgage Association, |
585,543 | 575 | ||
| Federal National Mortgage Association, |
139,055 | 137 | ||
| Federal National Mortgage Association, |
151,000 | 151 | ||
| Federal National Mortgage Association, |
183,051 | 180 | ||
| Federal National Mortgage Association, |
577,232 | 559 | ||
| Federal National Mortgage Association, |
191,923 | 185 | ||
| Federal National Mortgage Association, |
73,948 | 72 | ||
| Federal National Mortgage Association, |
131,596 | 127 | ||
| Federal National Mortgage Association, 5.50%, 9/1/35 |
1,280,455 | 1,239 | ||
| Federal National Mortgage Association, 5.50%, 10/1/35 |
1,375,609 | 1,331 | ||
The Accompanying Notes are an Integral Part of the Financial Statements.
84
Asset Allocation Portfolio
Table of Contents
Asset Allocation Portfolio
| Structured Products (12.2%) | Shares/ $ Par |
Value $ (000’s) | ||
| Structured Products continued |
||||
| Federal National Mortgage Association, |
968,090 | 936 | ||
| Federal National Mortgage Association, |
340,281 | 328 | ||
| Federal National Mortgage Association, |
187,118 | 180 | ||
| Federal National Mortgage Association, |
1,007,085 | 971 | ||
| Federal National Mortgage Association, |
560,239 | 556 | ||
| Federal National Mortgage Association, |
400,917 | 398 | ||
| Federal National Mortgage Association, |
21,651 | 21 | ||
| Federal National Mortgage Association, |
3,790 | 4 | ||
| Federal National Mortgage Association, |
222,038 | 220 | ||
| Federal National Mortgage Association, |
59,108 | 59 | ||
| Federal National Mortgage Association, |
167,746 | 166 | ||
| Federal National Mortgage Association, |
357,155 | 354 | ||
| Federal National Mortgage Association, |
277,440 | 275 | ||
| Federal National Mortgage Association, |
45,203 | 46 | ||
| Federal National Mortgage Association, |
152,443 | 154 | ||
| Federal National Mortgage Association, |
253,029 | 256 | ||
| Federal National Mortgage Association, 6.50%, 4/1/36 |
99,298 | 100 | ||
| Federal National Mortgage Association, |
23,249 | 23 | ||
| Federal National Mortgage Association, |
89,036 | 90 | ||
| Federal National Mortgage Association, |
95,541 | 96 | ||
| Structured Products (12.2%) | Shares/ $ Par |
Value $ (000’s) | ||
| Structured Products continued |
||||
| Federal National Mortgage Association, |
1,131,577 | 1,142 | ||
| Federal National Mortgage Association — Aces, Series 2006-M1, Class B, 5.355%, 2/25/16 |
555,000 | 547 | ||
| Final Maturity Amortizing Notes, |
423,895 | 407 | ||
| First Horizon Alternative Mortgage Securities Trust, Series 2004-FA1, 6.25%, 10/25/34 |
242,716 | 244 | ||
| First Union-Lehman Brothers Commercial Mortgage Trust II, Commercial Mortgage Pass-Through Certificates, Series 1997-C2, |
145,000 | 146 | ||
| Freddie Mac, |
118,574 | 113 | ||
| Freddie Mac, Series — 2840, Class LK, |
182,077 | 183 | ||
| Greenwich Capital Commerical Funding Corp., Series 2006-FL4A, Class A1, 5.44%, 11/5/21 144A |
159,873 | 160 | ||
| Honda Auto Receivables Owner Trust, Series 2005-1, Class A3, |
100,479 | 100 | ||
| Massachusetts RRB Special Purpose Trust, Series 2001-1, Class A, |
95,995 | 99 | ||
| Merrill Lynch Alternative Note Asset, Series 2007-A1, Class A2A, |
260,438 | 260 | ||
| TBW Mortgage Backed Pass Through Certification, Series 2007-1, Class A1, 5.41%, 3/25/37 |
250,937 | 251 | ||
| Washington Mutual Asset Securities Corp., Series 2003-AR10, Class A6, |
144,000 | 142 | ||
| Washington Mutual Asset Securities Corp., Series 2003-C1A, Class A, |
326,319 | 316 | ||
| Structured Products (12.2%) | Shares/ $ Par |
Value $ (000’s) | ||
| Structured Products continued |
||||
| Wells Fargo Mortgage Backed Securities, Series 2004-N, Class A6, |
437,000 | 426 | ||
| WFS Financial Owner Trust, Series 2003-3, Class A4, 3.25%, 5/20/11 |
217,160 | 217 | ||
| World Omni Auto Receivables Trust, Series 2006-A, Class A3, |
980,688 | 979 | ||
| Total Structured Products |
35,728 | |||
| Below Investment Grade Segment (7.3%) | ||||
| Aerospace/Defense (0.1%) |
||||
| Bombardier, Inc., |
35,000 | 36 | ||
| DRS Technologies, Inc., 7.625%, 2/1/18 |
55,000 | 55 | ||
| Hawker Beechcraft Acquisition Co., LLC/Hawker Beechcraft Notes Co., 8.50%, 4/1/15 144A |
32,000 | 33 | ||
| Hawker Beechcraft Acquisition Co., LLC/Hawker Beechcraft Notes Co., 8.875%, 4/1/15 144A |
22,000 | 23 | ||
| Total |
147 | |||
| Autos/Vehicle Parts (0.4%) |
||||
| American Axle & Manufacturing, Inc., 7.875%, 3/1/17 |
78,000 | 77 | ||
| Arvinmeritor, Inc., |
26,000 | 26 | ||
| Cooper Tire & Rubber Co., |
60,000 | 59 | ||
| Ford Motor Co., |
160,000 | 128 | ||
| Ford Motor Credit Co., 8.00%, 12/15/16 |
100,000 | 96 | ||
| Ford Motor Credit Co., 8.625%, 11/1/10 |
55,000 | 56 | ||
| Ford Motor Credit Co., 9.875%, 8/10/11 |
225,000 | 236 | ||
| General Motors Corp., 8.375%, 7/15/33 |
155,000 | 141 | ||
| The Goodyear Tire & Rubber Co., |
45,000 | 47 | ||
| Lear Corp., 8.50%, 12/1/13 |
90,000 | 86 | ||
| Lear Corp., 8.75%, 12/1/16 |
64,000 | 61 | ||
| TRW Automotive, Inc., 7.25%, 3/15/17 144A |
145,000 | 138 | ||
| Visteon Corp., 8.25%, 8/1/10 |
35,000 | 35 | ||
| Total |
1,186 | |||
The Accompanying Notes are an Integral Part of the Financial Statements.
Asset Allocation Portfolio
85
Table of Contents
Asset Allocation Portfolio
| Below Investment Grade Segment (7.3%) |
Shares/ $ Par |
Value $ (000’s) | ||
| Basic Materials (0.8%) |
||||
| Abitibi-Consolidated, Inc., |
119,000 | 109 | ||
| Abitibi-Consolidated, Inc., |
50,000 | 44 | ||
| Arch Western Finance LLC, 6.75%, 7/1/13 |
110,000 | 106 | ||
| Berry Plastics Holding Corp., 8.875%, 9/15/14 |
40,000 | 41 | ||
| Bowater Canada Finance, |
50,000 | 47 | ||
| Cascades, Inc., |
35,000 | 34 | ||
| Catalyst Paper Corp., 8.625%, 6/15/11 |
30,000 | 29 | ||
| Crown Americas, Inc., 7.625%, 11/15/13 |
71,000 | 72 | ||
| Crown Americas, Inc., 7.75%, 11/15/15 |
50,000 | 50 | ||
| Equistar Chemicals LP, 10.625%, 5/1/11 |
65,000 | 68 | ||
| FMG Finance Property, Ltd., |
155,000 | 184 | ||
| Freeport-McMoRan Copper & Gold, Inc., 8.25%, 4/1/15 |
115,000 | 121 | ||
| Freeport-McMoRan Copper & Gold, Inc., 8.375%, 4/1/17 |
205,000 | 219 | ||
| Georgia-Pacific Corp., 7.00%, 1/15/15 144A |
137,000 | 132 | ||
| Georgia-Pacific Corp., 7.125%, 1/15/17 144A |
112,000 | 108 | ||
| Graphic Packaging International Corp., 9.50%, 8/15/13 |
65,000 | 68 | ||
| Hexion US Finance Corp./Hexion Nova Scotia Finance ULC, |
145,000 | 150 | ||
| Huntsman LLC, 11.50%, 7/15/12 |
50,000 | 56 | ||
| Invista, |
55,000 | 58 | ||
| Lyondell Chemical Co., 6.875%, 6/15/17 |
115,000 | 111 | ||
| Lyondell Chemical Co., 8.00%, 9/15/14 |
115,000 | 118 | ||
| Massey Energy Co., 6.875%, 12/15/13 |
80,000 | 73 | ||
| Momentive Performance Materials, Inc., 9.75%, 12/1/14 144A |
35,000 | 35 | ||
| Momentive Performance Materials, Inc., 10.125%, 12/1/14 144A |
40,000 | 40 | ||
| Mosaic Global Holdings, Inc., |
25,000 | 25 | ||
| Below Investment Grade Segment (7.3%) |
Shares/ $ Par |
Value $ (000’s) | ||
| Basic Materials continued |
||||
| Mosaic Global Holdings, Inc., |
65,000 | 66 | ||
| Norampac, Inc., 6.75%, 6/1/13 |
45,000 | 43 | ||
| Novelis, Inc., 7.25%, 2/15/15 |
47,000 | 48 | ||
| Owens-Brockway Glass Container, Inc., 6.75%, 12/1/14 |
66,000 | 64 | ||
| Owens-Brockway Glass Container, Inc., 7.75%, 5/15/11 |
115,000 | 118 | ||
| Peabody Energy Corp., 7.375%, 11/1/16 |
70,000 | 71 | ||
| Smurfit-Stone Container, 8.375%, 7/1/12 |
70,000 | 70 | ||
| Stone Container, 8.00%, 3/15/17 |
55,000 | 53 | ||
| VeraSun Energy Corp., 9.375%, 6/1/17 144A |
45,000 | 42 | ||
| Total |
2,673 | |||
| Builders/Building Materials (0.1%) |
||||
| Beazer Homes USA, Inc., |
39,000 | 34 | ||
| Beazer Homes USA, Inc., |
16,000 | 14 | ||
| Beazer Homes USA, Inc., |
15,000 | 14 | ||
| K. Hovnanian Enterprises, |
105,000 | 91 | ||
| Standard Pacific Corp., 6.25%, 4/1/14 |
45,000 | 40 | ||
| Standard Pacific Corp., 7.75%, 3/15/13 |
61,000 | 56 | ||
| Total |
249 | |||
| Capital Goods (0.1%) |
||||
| Ashtead Capital, Inc., 9.00%, 8/15/16 144A |
40,000 | 42 | ||
| Belden CDT, Inc., 7.00%, 3/15/17 144A |
30,000 | 30 | ||
| Clarke American Corp., 9.50%, 5/15/15 144A |
16,000 | 15 | ||
| Clarke American Corp., |
20,000 | 19 | ||
| DA-Lite Screen Co., Inc., 9.50%, 5/15/11 |
45,000 | 47 | ||
| Rental Service Corp., 9.50%, 12/1/14 144A |
63,000 | 64 | ||
| Terex Corp., 7.375%, 1/15/14 |
45,000 | 45 | ||
| United Rentals North America, Inc., |
165,000 | 163 | ||
| Total |
425 | |||
| Below Investment Grade Segment (7.3%) |
Shares/ $ Par |
Value $ (000’s) | ||
| Consumer Products/Retailing (0.5%) | ||||
| Albertson’s Inc., 7.25%, 5/1/13 |
105,000 | 107 | ||
| Claire’s Stores, Inc., 10.50%, 6/1/17 144A |
45,000 | 41 | ||
| Claire’s Stores, Inc., 9.25%, 6/1/15 144A |
30,000 | 29 | ||
| Claire’s Stores, Inc., 9.625%, 6/1/15 144A |
35,000 | 32 | ||
| Delhaize America, Inc., 9.00%, 4/15/31 |
70,000 | 85 | ||
| Dollar General Corp., 10.625%, 7/15/15 144A |
90,000 | 87 | ||
| Education Management LLC, 10.25%, 6/1/16 |
85,000 | 89 | ||
| GSC Holdings Corp., 8.00%, 10/1/12 |
80,000 | 84 | ||
| Jostens IH Corp., 7.625%, 10/1/12 |
52,000 | 52 | ||
| Levi Strauss & Co., 8.875%, 4/1/16 |
90,000 | 92 | ||
| Michaels Stores, Inc., 10.00%, 11/1/14 144A |
60,000 | 62 | ||
| Oxford Industries, Inc., 8.875%, 6/1/11 |
118,000 | 121 | ||
| Phillips Van Heusen Corp., 8.125%, 5/1/13 |
50,000 | 52 | ||
| Rent-A-Center, 7.50%, 5/1/10 |
41,000 | 42 | ||
| Rite Aid Corp., 7.50%, 3/1/17 |
86,000 | 83 | ||
| Rite Aid Corp., 8.125%, 5/1/10 |
100,000 | 101 | ||
| Rite Aid Corp., 8.625%, 3/1/15 |
31,000 | 29 | ||
| Rite Aid Corp., 9.375%, 12/15/15 144A |
45,000 | 43 | ||
| Rite Aid Corp., 9.50%, 6/15/17 144A |
40,000 | 38 | ||
| Smithfield Foods, Inc., 7.75%, 7/1/17 |
60,000 | 60 | ||
| SUPERVALU, Inc., 7.50%, 11/15/14 |
80,000 | 82 | ||
| Warnaco, Inc., 8.875%, 6/15/13 |
50,000 | 53 | ||
| Total |
1,464 | |||
| Energy (0.8%) |
||||
| AmeriGas Partners LP, 7.25%, 5/20/15 |
80,000 | 79 | ||
| Basic Energy Services, Inc., 7.125%, 4/15/16 |
95,000 | 91 | ||
| Chaparral Energy, Inc., 8.875%, 2/1/17 144A |
90,000 | 89 | ||
| Chesapeake Energy Corp., 6.375%, 6/15/15 |
58,000 | 55 | ||
| Chesapeake Energy Corp., 6.625%, 1/15/06 |
99,000 | 95 | ||
| Chesapeake Energy Corp., 7.50%, 9/15/13 |
45,000 | 46 | ||
| Chesapeake Energy Corp., 7.625%, 7/15/13 |
50,000 | 51 | ||
The Accompanying Notes are an Integral Part of the Financial Statements.
86
Asset Allocation Portfolio
Table of Contents
Asset Allocation Portfolio
| Below Investment Grade Segment (7.5%) |
Shares/ $ Par |
Value $ (000’s) | ||
| Energy continued |
||||
| Cimarex Energy Co., 7.125%, 5/1/17 |
20,000 | 20 | ||
| Compagnie Generale de Geophysique-Veritas, 7.50%, 5/15/15 |
33,000 | 33 | ||
| Compagnie Generale de Geophysique-Veritas, 7.75%, 5/15/17 |
55,000 | 56 | ||
| Complete Production Services, Inc., |
60,000 | 61 | ||
| Denbury Resources, Inc., |
60,000 | 60 | ||
| Forest Oil Corp., 7.25%, 6/15/19 144A |
55,000 | 53 | ||
| Hanover Compressor Co., |
36,000 | 36 | ||
| Hanover Compressor Co., 9.00%, 6/1/14 |
50,000 | 53 | ||
| Kinder Morgan Finance Co. ULC, 5.70%, 1/5/16 |
50,000 | 46 | ||
| Mariner Energy, Inc., 8.00%, 5/15/17 |
59,000 | 59 | ||
| Newfield Exploration Co., |
15,000 | 14 | ||
| Newfield Exploration Co., |
65,000 | 63 | ||
| OPTI Canada, Inc., |
75,000 | 76 | ||
| Petrohawk Energy Corp., |
113,000 | 120 | ||
| Petroplus Finance, Ltd., |
42,000 | 40 | ||
| Petroplus Finance, Ltd., |
51,000 | 49 | ||
| Pioneer Natural Resources Co., 6.65%, 3/15/17 |
86,000 | 81 | ||
| Plains Exploration & Production Co., |
55,000 | 52 | ||
| Plains Exploration & Production Co., |
75,000 | 74 | ||
| Pogo Producing Co., 7.875%, 5/1/13 |
51,000 | 52 | ||
| Range Resources Corp., |
72,000 | 68 | ||
| Range Resources Corp., |
15,000 | 15 | ||
| Seitel, Inc., |
25,000 | 25 | ||
| Sesi LLC, 6.875%, 6/1/14 |
85,000 | 83 | ||
| Stallion Oilfield Services/Stallion Oilfield Finance Corp., |
101,000 | 103 | ||
| Tesoro Corp., 6.625%, 11/1/15 |
80,000 | 79 | ||
| W&T Offshore, Inc., 8.25%, 6/15/14 144A |
85,000 | 84 | ||
| Below Investment Grade Segment (7.5%) |
Shares/ $ Par |
Value $ (000’s) | ||
| Energy continued |
||||
| Whiting Petroleum Corp., 7.25%, 5/1/13 |
108,000 | 103 | ||
| Williams Partners LP/Williams Partners Financial Corp., 7.25%, 2/1/17 |
40,000 | 40 | ||
| Total |
2,204 | |||
| Financials (0.3%) |
||||
| Crum & Forster Holdings Corp., 7.75%, 5/1/17 144A |
64,000 | 63 | ||
| *ETrade Financial Corp., 7.875%, 12/1/15 |
90,000 | 94 | ||
| General Motors Acceptance Corp. LLC, 6.75%, 12/1/14 |
75,000 | 72 | ||
| General Motors Acceptance Corp. LLC, 6.875%, 9/15/11 |
90,000 | 89 | ||
| General Motors Acceptance Corp. LLC, 8.00%, 11/01/31 |
215,000 | 219 | ||
| LaBranche & Co., Inc., 9.50%, 5/15/09 |
25,000 | 26 | ||
| LaBranche & Co., Inc., 11.00%, 5/15/12 |
38,000 | 40 | ||
| Residential Capital LLC, |
75,000 | 73 | ||
| Residential Capital LLC, |
95,000 | 94 | ||
| UnumProvident Finance Co. PLC, |
60,000 | 61 | ||
| Total |
831 | |||
| Foods (0.2%) |
||||
| Constellation Brands Inc., |
75,000 | 73 | ||
| Dean Foods Co., 7.00%, 6/1/16 |
75,000 | 72 | ||
| Dole Foods Co., 8.625%, 5/1/09 |
155,000 | 154 | ||
| Outback Steakhouse, Inc., |
20,000 | 19 | ||
| Pilgrim’s Pride Corp., 7.625%, 5/1/15 |
69,000 | 69 | ||
| Pilgrim’s Pride Corp., 8.375%, 5/1/17 |
33,000 | 33 | ||
| Pinnacle Foods Finance LLC/Pinnacle Foods Finance Corp., 10.625%, 4/1/17 144A |
55,000 | 53 | ||
| Pinnacle Foods Finance LLC/Pinnacle Foods Finance Corp., 9.25%, 4/1/15 144A |
110,000 | 106 | ||
| Smithfield Foods, Inc., 7.75%, 5/15/13 |
83,000 | 84 | ||
| Total |
663 | |||
| Below Investment Grade Segment (7.5%) |
Shares/ $ Par |
Value $ (000’s) | ||
| Gaming/Leisure/Lodging (0.6%) |
||||
| AMC Entertainment, Inc., |
54,000 | 60 | ||
| American Casino & Entertainment, |
60,000 | 62 | ||
| Boyd Gaming Corp., 7.75%, 12/15/12 |
100,000 | 103 | ||
| Corrections Corp. of America, 6.25%, 3/15/13 |
111,000 | 107 | ||
| Felcor Lodging LP, 8.50%, 6/1/11 |
83,000 | 87 | ||
| Fontainebleau Las Vegas Holdings LLC, |
65,000 | 64 | ||
| Hertz Corp., 8.875%, 1/1/14 |
95,000 | 99 | ||
| Host Marriot LP, 7.125%, 11/1/13 |
210,000 | 209 | ||
| Mandalay Resort Group, 9.375%, 2/15/10 |
50,000 | 53 | ||
| MGM Mirage Inc., 7.5%, 6/1/16 |
145,000 | 138 | ||
| MGM Mirage, Inc., 6.75%, 9/1/12 |
105,000 | 100 | ||
| Park Place Entertainment Corp., 8.125%, 5/15/11 |
135,000 | 141 | ||
| Pinnacle Entertainment, Inc., |
50,000 | 48 | ||
| Pokagon Gaming Authority, |
28,000 | 31 | ||
| Seminole Hard Rock Entertainment, |
45,000 | 45 | ||
| Station Casinos, Inc., 6.625%, 3/15/18 |
45,000 | 39 | ||
| Station Casinos, Inc., 6.875%, 3/1/16 |
45,000 | 40 | ||
| Universal City Development Corp., 11.75%, 4/1/10 |
44,000 | 47 | ||
| Universal City Florida, 8.375%, 5/1/10 |
33,000 | 34 | ||
| Wimar Opco LLC/Wimar Opco Finance Corp., 9.625%, 12/15/14 144A |
50,000 | 48 | ||
| Wynn Las Vegas LLC, 6.625%, 12/1/14 |
155,000 | 148 | ||
| Total |
1,703 | |||
| Health Care/Pharmaceuticals (0.5%) | ||||
| Community Health Systems, Inc., 8.875%, 7/15/15 144A |
180,000 | 182 | ||
| FMC Finance III SA, 6.875%, 7/15/17 144A |
105,000 | 103 | ||
| Fresenius Medical Capital Trust IV, 7.875%, 6/15/11 |
30,000 | 31 | ||
| HCA, Inc., 6.75%, 7/15/13 |
75,000 | 68 | ||
The Accompanying Notes are an Integral Part of the Financial Statements.
Asset Allocation Portfolio
87
Table of Contents
Asset Allocation Portfolio
| Below Investment Grade Segment (7.5%) |
Shares/ $ Par |
Value $ (000’s) | ||
| Health Care/Pharmaceuticals continued | ||||
| HCA, Inc., |
58,000 | 61 | ||
| HCA, Inc., |
233,000 | 248 | ||
| HCA, Inc., |
87,000 | 94 | ||
| OMEGA Healthcare Investors, Inc., 7.00%, 4/1/14 |
50,000 | 50 | ||
| OMEGA Healthcare Investors, Inc., 7.00%, 1/15/16 |
20,000 | 20 | ||
| Omnicare, Inc., |
60,000 | 57 | ||
| PTS Acquisition Corp., 9.50%, 4/15/15 144A |
79,000 | 78 | ||
| Senior Housing Properties Trust, 8.625%, 1/15/12 |
45,000 | 48 | ||
| Service Corp. International, |
60,000 | 57 | ||
| Service Corp. International, |
15,000 | 15 | ||
| Service Corp. International, |
70,000 | 67 | ||
| Tenet Healthcare Corp., 7.375%, 2/1/13 |
85,000 | 77 | ||
| Tenet Healthcare Corp., 9.875%, 7/1/14 |
50,000 | 50 | ||
| US Oncology, Inc., |
60,000 | 62 | ||
| Ventas Realty LP/Capital Corp., 6.50%, 6/1/16 |
25,000 | 24 | ||
| Ventas Realty LP/Capital Corp., 9.00%, 5/1/12 |
50,000 | 55 | ||
| Total |
1,447 | |||
| Media (0.7%) |
||||
| CCH I Holdings LLC, 11.75%, 5/15/14 |
90,000 | 88 | ||
| Charter Communications Holding LLC, |
125,000 | 130 | ||
| Charter Communications Holdings LLC, |
125,000 | 131 | ||
| CSC Holdings, Inc., 7.625%, 4/1/11 |
150,000 | 149 | ||
| CSC Holdings, Inc., 7.875%, 2/15/18 |
127,000 | 123 | ||
| CSC Holdings, Inc., 8.125%, 7/15/09 |
60,000 | 61 | ||
| CSC Holdings, Inc., 8.125%, 8/15/09 |
30,000 | 31 | ||
| The DIRECTV Group, Inc., 6.375%, 6/15/15 |
30,000 | 28 | ||
| Echostar DBS Corp., 7.00%, 10/1/13 |
85,000 | 84 | ||
| EchoStar DBS Corp., 7.125%, 2/1/16 |
30,000 | 29 | ||
| Below Investment Grade Segment (7.5%) |
Shares/ $ Par |
Value $ (000’s) | ||
| Media continued |
||||
| Idearc, Inc., 8.00%, 11/15/16 |
286,000 | 289 | ||
| Intelsat Bermuada, Ltd., 8.50%, 1/15/13 |
60,000 | 61 | ||
| Intelsat Bermuada, Ltd., 11.25%, 6/15/16 |
51,000 | 57 | ||
| Intelsat Bermuada, Ltd., |
65,000 | 69 | ||
| Kabel Deutschland GMBH, |
60,000 | 66 | ||
| Lamar Media Corp., |
75,000 | 71 | ||
| LIN Television Corp., |
90,000 | 88 | ||
| Mediacom Broadband LLC/Corp., |
55,000 | 55 | ||
| Mediacom Broadband LLC/Corp., |
30,000 | 30 | ||
| Mediacom LLC/Capital Corp., 7.875%, 2/15/11 |
30,000 | 30 | ||
| Quebecor World, Inc., 9.75%, 1/15/15 144A |
65,000 | 66 | ||
| R.H. Donnelley Corp., 6.875%, 1/15/13 |
280,000 | 265 | ||
| R.H. Donnelley Corp., 8.875%, 1/15/16 |
35,000 | 36 | ||
| Sinclair Broadcast Group, 8.00%, 3/15/12 |
40,000 | 41 | ||
| Univision Communications, |
150,000 | 148 | ||
| Videotron Ltee, |
25,000 | 24 | ||
| Total |
2,250 | |||
| Real Estate (0.1%) |
||||
| American Real Estate Partners LP, |
20,000 | 19 | ||
| American Real Estate Partners, LP, |
90,000 | 87 | ||
| The Rouse Co., |
85,000 | 87 | ||
| Total |
193 | |||
| Services (0.2%) |
||||
| Allied Waste North America, Inc., |
70,000 | 68 | ||
| Allied Waste North America, Inc., |
70,000 | 69 | ||
| ARAMARK Corp., |
45,000 | 46 | ||
| ARAMARK Corp., |
30,000 | 30 | ||
| Realogy Corp., |
145,000 | 138 | ||
| Below Investment Grade Segment (7.5%) |
Shares/ $ Par |
Value $ (000’s) | ||
| Services continued |
||||
| Realogy Corp., |
75,000 | 68 | ||
| Travelport LLC, |
65,000 | 72 | ||
| WCA Waste Corp., |
65,000 | 68 | ||
| Total |
559 | |||
| Structured Product (0.7%) |
||||
| Dow Jones Credit Derivative High Yield, 7.125%, 12/29/11 144A |
1,000,000 | 985 | ||
| Dow Jones Credit Derivative High Yield, 8.00%, 12/29/11 144A |
1,000,000 | 983 | ||
| Dow Jones Credit Derivative High Yield, 8.25%, 12/29/10 |
160,000 | 162 | ||
| Total |
2,130 | |||
| Technology (0.2%) |
||||
| Flextronics International, Ltd., 6.50%, 5/15/13 |
75,000 | 71 | ||
| Freescale Semiconductor, Inc., 8.875%, 12/15/14 144A |
80,000 | 76 | ||
| Freescale Semiconductor, Inc., 9.125%, 12/15/14 144A |
99,000 | 93 | ||
| Freescale Semiconductor, Inc., 10.125%, 12/15/16 144A |
25,000 | 24 | ||
| Nortel Networks, Ltd., 10.75%, 7/15/16 144A |
35,000 | 39 | ||
| NXP BV, 7.875%, 10/15/14 |
105,000 | 103 | ||
| NXP BV, |
50,000 | 49 | ||
| Sabre Holdings Corp., 6.35%, 3/15/16 |
75,000 | 68 | ||
| Sanmina Corp., |
35,000 | 33 | ||
| Stats Chippac, Inc., |
43,000 | 43 | ||
| Sungard Data Systems, Inc., 9.125%, 8/15/13 |
95,000 | 97 | ||
| Total |
696 | |||
| Telecommunications (0.3%) |
||||
| Citizens Communications, |
165,000 | 170 | ||
| Citizens Communications, |
145,000 | 157 | ||
| Qwest Capital Funding, Inc., 7.90%, 8/15/10 |
65,000 | 66 | ||
| Qwest Communications International, Inc., 7.50%, 11/1/08 |
25,000 | 25 | ||
The Accompanying Notes are an Integral Part of the Financial Statements.
88
Asset Allocation Portfolio
Table of Contents
Asset Allocation Portfolio
| Below Investment Grade Segment (7.5%) |
Shares/ $ Par |
Value $ (000’s) | ||
| Telecommunications continued |
||||
| Qwest Corp., 7.50%, 10/1/14 |
16,000 | 16 | ||
| Qwest Corp., 6.50%, 6/1/17 144A |
85,000 | 81 | ||
| Qwest Corp., 7.875%, 9/1/11 |
67,000 | 70 | ||
| Rogers Wireless, Inc., |
74,000 | 79 | ||
| Windstream Corp., 7.00%, 3/15/19 |
55,000 | 53 | ||
| Windstream Corp., 8.125%, 8/1/13 |
85,000 | 89 | ||
| Windstream Corp., 8.625%, 8/1/16 |
95,000 | 100 | ||
| Total |
906 | |||
| Transportation (0.2%) |
||||
| American Railcar Industries, Inc., |
55,000 | 55 | ||
| Grupo Transportacion Ferroviaria Mexicana, SA de CV (TFM), |
67,000 | 72 | ||
| Kansas City Southern de Mexico SA de CV, 7.625%, 12/1/13 144A |
35,000 | 35 | ||
| Kansas City Southern de Mexico, |
95,000 | 94 | ||
| Ship Finance International, Ltd., 8.50%, 12/15/13 |
40,000 | 41 | ||
| Stena AB, 7.50%, 11/1/13 |
190,000 | 192 | ||
| Total |
489 | |||
| Utilities (0.5%) |
||||
| The AES Corp., 9.375%, 9/15/10 |
55,000 | 59 | ||
| Aquila, Inc., 9.95%, 2/1/11 |
6,000 | 6 | ||
| Dynegy Holdings, Inc., |
45,000 | 42 | ||
| Dynegy Holdings, Inc., |
65,000 | 60 | ||
| Dynegy Holdings, Inc., |
65,000 | 64 | ||
| Edison Mission Energy, |
125,000 | 118 | ||
| Edison Mission Energy, |
149,000 | 140 | ||
| Elwood Energy LLC, 8.159%, 7/5/26 |
98,331 | 103 | ||
| Indiantown Cogeneration LP, 9.77%, 12/15/20 |
165,000 | 186 | ||
| NRG Energy, Inc., 7.25%, 2/1/14 |
65,000 | 65 | ||
| NRG Energy, Inc., 7.375%, 2/1/16 |
30,000 | 30 | ||
| NRG Energy, Inc., 7.375%, 1/15/17 |
216,000 | 218 | ||
| Below Investment Grade Segment (7.5%) |
Shares/ $ Par |
Value $ (000’s) |
|||
| Utilities continued |
|||||
| NSG Holdings LLC, |
81,000 | 82 | |||
| PSEG Energy Holdings LLC, 8.50%, 6/15/11 |
22,000 | 23 | |||
| Sierra Pacific Resources, |
27,000 | 29 | |||
| TXU Corp., 5.55%, 11/15/14 |
200,000 | 170 | |||
| Total |
1,395 | ||||
| Total Below Investment Grade Segment |
21,610 | ||||
| Bank Loan Obligation (0.2%) |
Principal Amount (000’s) |
||||
| Freeport-McMoRan Copper & Gold, Inc. |
517,600 | 518 | |||
| Total |
518 | ||||
| Total Bank Loan |
518 | ||||
| Money Market Investments (9.2%) |
Shares/ $ Par |
||||
| Federal Government and Agencies (8.9%) |
| ||||
| Fannie Mae, 5.13%, 9/19/07 |
1,000,000 | 989 | |||
| (b) Federal Home Loan Bank, 5.16%, 7/13/07 |
3,000,000 | 2,994 | |||
| Federal Home Loan Bank, 5.15%, 7/18/07 |
22,000,000 | 21,943 | |||
| Total |
25,926 | ||||
| National Commercial Banks (0.3%) |
| ||||
| UBS Finance LLC, 5.35%, 7/2/07 |
1,000,000 | 1,000 | |||
| Total |
1,000 | ||||
| Total Money Market Investments |
26,926 | ||||
| Total Investments (100.7%) |
295,888 | ||||
| Other Assets, Less |
(2,164 | ) | |||
| Net Assets (100.0%) |
293,724 | ||||
| * | Non-Income Producing |
ADR after the name of a security represents — American Depositary Receipt.
144A after the name of a security represents a security exempt from registration under Rule 144A of the Securities Act of 1933. These securities may be resold as transactions exempt from registration, normally to qualified institutional buyers. At June 30, 2007 the value of these securities (in thousands) was $9,844, representing 3.35% of the net assets.
IO — Interest Only Security
| (a) | At June 30, 2007 the aggregate cost of securities for federal tax purposes (in thousands) was $262,583 and the net unrealized appreciation of investments based on that cost was $33,305 which is comprised of $37,209 aggregate gross unrealized appreciation and $3,904 aggregate gross unrealized depreciation. |
The Accompanying Notes are an Integral Part of the Financial Statements.
Asset Allocation Portfolio
89
Table of Contents
Asset Allocation Portfolio
| (b) | All or a portion of the securities have been committed as collateral for open futures positions or when-issued securities. Information regarding open futures contracts as of period end is summarized below. |
| Issuer (000’s) | Number of Contracts |
Expiration Date |
Unrealized Appreciation/ (Depreciation) (000’s) |
|||||
| US Ten Year Treasury |
12 | 9/07 | $ | — | ||||
| S&P 500 Index Futures (Long) (Total Notional Value at June 30, 2007, $16,776) |
44 | 9/07 | $ | (106 | ) | |||
| (c) | PIK — Denotes a security that has the option to pay-in-kind. |
| (e) | Step bond security that presently receives no coupon payments. At the predetermined date the stated coupon rate becomes effective. |
| (l) | As of June 30, 2007, portfolio securities with an aggregate market value of $51,367 (in thousands) were fair valued under procedures adopted by the Board of Directors. |
The Accompanying Notes are an Integral Part of the Financial Statements.
90
Asset Allocation Portfolio
Table of Contents
[THIS PAGE INTENTIONALLY LEFT BLANK]
91
Table of Contents
Statements of Assets and Liabilities
Northwestern Mutual Series Fund, Inc.
June 30, 2007 (Unaudited)
(in thousands)
| Growth Stock Portfolio |
Janus Capital Appreciation Portfolio |
Large Cap Core Stock Portfolio |
Index 500 Stock Portfolio |
||||||||||||
| Assets |
|||||||||||||||
| Investments, at value (1) |
$ | 755,040 | $ | 166,456 | $ | 557,591 | $ | 2,174,197 | |||||||
| Cash & Cash Equivalents |
882 | 44 | — | — | |||||||||||
| Due from Sale of Securities |
1,748 | 6,414 | 5,310 | — | |||||||||||
| Dividends and Interest Receivables |
513 | 45 | 589 | 2,690 | |||||||||||
| Total Assets |
758,183 | 172,959 | 563,490 | 2,176,887 | |||||||||||
| Liabilities |
|||||||||||||||
| Due on Purchase of Securities |
3,772 | — | 4,936 | 276 | |||||||||||
| Due to Investment Advisor |
254 | 106 | 191 | 349 | |||||||||||
| Accrued Expenses |
11 | 11 | 10 | 15 | |||||||||||
| Outstanding Swap Contracts, at Fair Value |
— | — | — | — | |||||||||||
| Futures Variation Margin |
21 | — | 7 | 41 | |||||||||||
| Total Liabilities |
4,058 | 117 | 5,144 | 681 | |||||||||||
| Net Assets |
$ | 754,125 | $ | 172,842 | $ | 558,346 | $ | 2,176,206 | |||||||
| Represented By: |
|||||||||||||||
| Aggregate Paid in Capital (3), (4) |
$ | 574,629 | $ | 133,938 | $ | 531,175 | $ | 1,276,582 | |||||||
| Undistributed Net Investment Income (Loss) |
10,318 | 357 | 10,431 | 53,521 | |||||||||||
| Undistributed Accumulated Net Realized Gain (Loss) on Investments |
15,799 | 4,849 | (111,404 | ) | 91,090 | ||||||||||
| Net Unrealized Appreciation (Depreciation) of: |
|||||||||||||||
| Investment Securities |
153,491 | 33,698 | 128,183 | 755,187 | |||||||||||
| Futures Contracts |
(112 | ) | — | (39 | ) | (174 | ) | ||||||||
| Swap Contracts |
— | — | — | — | |||||||||||
| Net Assets for Shares Outstanding (3) |
$ | 754,125 | $ | 172,842 | $ | 558,346 | $ | 2,176,206 | |||||||
| Net Asset Value, Offering and Redemption Price per Share |
$ | 2.45 | $ | 1.78 | $ | 1.44 | $ | 3.49 | |||||||
| (1) Investments, at cost |
$ | 601,549 | $ | 132,758 | $ | 429,408 | $ | 1,419,010 | |||||||
| (2) Securities on loan |
— | — | — | — | |||||||||||
| (3) Shares outstanding |
307,212 | 97,298 | 387,241 | 624,152 | |||||||||||
| (4) Shares authorized, $.01 par value |
2,000,000 | 2,000,000 | 2,000,000 | 2,000,000 | |||||||||||
| # | Formerly named Aggressive Growth Stock Portfolio |
The Accompanying Notes are an Integral Part of the Financial Statements.
92
Statements of Assets and Liabilities (Prepared from Unaudited Figures)
Table of Contents
| Capital Guardian Domestic Equity Portfolio |
T. Rowe Price Equity Income Portfolio |
Mid Cap Growth Stock Portfolio# |
Index 400 Stock Portfolio |
AllianceBernstein Mid Cap Value Portfolio |
Small Cap Growth Stock Portfolio |
T. Rowe Price Small Cap Value Portfolio | |||||||||||||||
| $ | 484,256 | $ | 239,924 | $ | 1,236,360 | $ | 589,973 | $ | 158,363 | $ | 561,756 | $ | 370,349 | ||||||||
| 113 | 416 | — | 13,011 | 313 | 673 | 36 | |||||||||||||||
| 16,376 | 457 | 24,535 | 1,507 | 1,609 | 11,709 | 953 | |||||||||||||||
| 1,105 | 434 | 281 | 374 | 148 | 86 | 390 | |||||||||||||||
| 501,850 | 241,231 | 1,261,176 | 604,865 | 160,433 | 574,224 | 371,728 | |||||||||||||||
| 20,880 | 1,520 | 18,807 | 15,244 | 1,608 | 19,147 | 1,970 | |||||||||||||||
| 210 | 123 | 513 | 118 | 111 | 237 | 251 | |||||||||||||||
| 10 | 12 | 12 | 13 | 10 | 10 | 11 | |||||||||||||||
| — | — | — | — | — | — | — | |||||||||||||||
| — | — | 34 | 75 | — | 66 | — | |||||||||||||||
| 21,100 | 1,655 | 19,366 | 15,450 | 1,729 | 19,460 | 2,232 | |||||||||||||||
| $ | 480,750 | $ | 239,576 | $ | 1,241,810 | $ | 589,415 | $ | 158,704 | $ | 554,764 | $ | 369,496 | ||||||||
| $ | 365,656 | $ | 187,706 | $ | 865,547 | $ | 385,703 | $ | 120,714 | $ | 397,270 | $ | 246,272 | ||||||||
| 11,223 | 2,054 | 11,979 | 11,795 | 494 | 930 | 3,069 | |||||||||||||||
| 37,067 | 10,849 | 181,925 | 52,534 | 10,246 | 87,495 | 28,392 | |||||||||||||||
| 66,804 | 38,967 | 182,454 | 139,585 | 27,250 | 69,066 | 91,763 | |||||||||||||||
| — | — | (95 | ) | (202 | ) | — | 3 | — | |||||||||||||
| — | — | — | — | — | — | — | |||||||||||||||
| $ | 480,750 | $ | 239,576 | $ | 1,241,810 | $ | 589,415 | $ | 158,704 | $ | 554,764 | $ | 369,496 | ||||||||
| $ | 1.40 | $ | 1.65 | $ | 3.77 | $ | 1.77 | $ | 1.73 | $ | 2.61 | $ | 1.98 | ||||||||
| $ | 417,452 | $ | 200,957 | $ | 1,053,906 | $ | 450,388 | $ | 131,114 | $ | 492,690 | $ | 278,586 | ||||||||
| — | — | — | — | — | — | — | |||||||||||||||
| 344,073 | 145,127 | 329,188 | 332,315 | 91,740 | 212,233 | 186,509 | |||||||||||||||
| 2,000,000 | 2,000,000 | 2,000,000 | 2,000,000 | 2,000,000 | 2,000,000 | 2,000,000 | |||||||||||||||
The Accompanying Notes are an Integral Part of the Financial Statements.
Statements of Assets and Liabilities
93
Table of Contents
Statements of Assets and Liabilities
Northwestern Mutual Series Fund, Inc.
June 30, 2007 (Unaudited)
(in thousands)
| International Growth Portfolio |
Franklin Templeton International Equity Portfolio |
Money Market Portfolio |
Select Bond Portfolio |
High Yield Bond Portfolio |
Balanced Portfolio |
Asset Allocation Portfolio |
||||||||||||||||||||
| Assets |
||||||||||||||||||||||||||
| Investments, at value (1) |
$ | 327,982 | $ | 1,820,800 | $ | 419,233 | $ | 1,122,204 | $ | 290,745 | $ | 3,072,109 | $ | 295,888 | ||||||||||||
| Cash & Cash Equivalents |
1,215 | 4,392 | 30 | 70 | 80 | 16 | 449 | |||||||||||||||||||
| Collateral for Outstanding Swap Contracts |
— | — | — | — | — | 2,290 | — | |||||||||||||||||||
| Due from Sale of Fund Shares |
— | 450 | — | — | — | — | — | |||||||||||||||||||
| Due from Sale of Securities |
4,883 | 9,900 | — | 38,052 | 6,333 | 84,205 | 5,518 | |||||||||||||||||||
| Due from Sale of Foreign Currency |
12,221 | — | — | — | — | 13 | 2 | |||||||||||||||||||
| Futures Variation Margin |
— | — | — | 51 | — | 117 | — | |||||||||||||||||||
| Outstanding Options Written, at Fair Value |
— | — | — | — | — | — | — | |||||||||||||||||||
| Outstanding Swap Contracts, at Fair Value |
— | — | — | — | — | 15,582 | — | |||||||||||||||||||
| Dividends and Interest Receivables |
578 | 3,849 | 381 | 8,257 | 4,977 | 14,416 | 1,157 | |||||||||||||||||||
| Total Assets |
346,879 | 1,839,391 | 419,644 | 1,168,634 | 302,135 | 3,188,748 | 303,014 | |||||||||||||||||||
| Liabilities |
||||||||||||||||||||||||||
| Due on Purchase of Securities |
9,236 | 13,228 | — | 109,049 | 7,310 | 156,439 | 9,138 | |||||||||||||||||||
| Payable for Collateral on Securities on Loan (2) |
— | — | — | 49,500 | — | 53,028 | — | |||||||||||||||||||
| Due on Purchase of Foreign Currency |
13,164 | — | — | 7 | — | 15 | 1 | |||||||||||||||||||
| Due on Redemption of Fund Shares |
— | 597 | — | — | — | — | — | |||||||||||||||||||
| Due to Investment Advisor |
170 | 847 | 99 | 238 | 107 | 707 | 96 | |||||||||||||||||||
| Accrued Expenses |
113 | 57 | — | 25 | 18 | — | 38 | |||||||||||||||||||
| Outstanding Options Written, at Fair Value |
— | — | — | — | — | — | — | |||||||||||||||||||
| Outstanding Swap Contracts, at Fair Value |
— | — | — | — | — | 21,338 | — | |||||||||||||||||||
| Futures Variation Margin |
— | — | — | — | — | 53 | 17 | |||||||||||||||||||
| Total Liabilities |
22,683 | 14,729 | 99 | 158,819 | 7,435 | 231,580 | 9,290 | |||||||||||||||||||
| Net Assets |
$ | 324,196 | $ | 1,824,662 | $ | 419,545 | $ | 1,009,815 | $ | 294,700 | $ | 2,957,168 | $ | 293,724 | ||||||||||||
| Represented By: |
||||||||||||||||||||||||||
| Aggregate Paid in Capital (3), (4) |
$ | 213,891 | $ | 983,478 | $ | 419,545 | $ | 988,199 | $ | 334,434 | $ | 1,904,758 | $ | 226,012 | ||||||||||||
| Undistributed Net Investment Income (Loss) |
4,891 | 61,713 | — | 65,497 | 28,297 | 136,705 | 10,481 | |||||||||||||||||||
| Undistributed Accumulated Net Realized Gain (Loss) on Investments |
37,199 | 67,970 | — |
|
(24,778 |
) |
(66,464 | ) | 699,516 | 24,033 | ||||||||||||||||
| Net Unrealized Appreciation (Depreciation) of: |
||||||||||||||||||||||||||
| Investment Securities |
68,226 | 711,492 | — | (19,100 | ) | (1,567 | ) | 222,047 | 33,305 | |||||||||||||||||
| Futures Contracts |
— | — | — | (1 | ) | — | (103 | ) | (107 | ) | ||||||||||||||||
| Options Written |
— | — | — | — | — | — | — | |||||||||||||||||||
| Swap Contracts |
— | — | — | — | — | (5,756 | ) | — | ||||||||||||||||||
| Foreign Currency Transactions |
(11 | ) | 9 | — | (2 | ) | — | 1 | — | |||||||||||||||||
| Net Assets for Shares Outstanding (3) |
$ | 324,196 | $ | 1,824,662 | $ | 419,545 | $ | 1,009,815 | $ | 294,700 | $ | 2,957,168 | $ | 293,724 | ||||||||||||
| Net Asset Value, Offering and Redemption Price per Share |
$ | 1.94 | $ | 2.67 | $ | 1.00 | $ | 1.21 | $ | 0.75 | $ | 2.05 | $ | 1.29 | ||||||||||||
| (1) Investments, at cost |
$ | 259,756 | $ | 1,109,308 | $ | 419,233 | $ | 1,141,304 | $ | 292,312 | $ | 2,850,062 | $ | 262,583 | ||||||||||||
| (2) Securities on loan |
— | — | — | 48,341 | — | 51,829 | — | |||||||||||||||||||
| (3) Shares outstanding |
166,912 | 683,150 | 419,558 | 834,741 | 392,792 | 1,443,342 | 227,100 | |||||||||||||||||||
| (4) Shares authorized, $.01 par value |
2,000,000 | 2,000,000 | 2,000,000 | 2,000,000 | 2,000,000 | 3,000,000 | 2,000,000 | |||||||||||||||||||
The Accompanying Notes are an Integral Part of the Financial Statements.
94
Statements of Assets and Liabilities (Prepared from Unaudited Figures)
Table of Contents
[THIS PAGE INTENTIONALLY LEFT BLANK]
95
Table of Contents
Northwestern Mutual Series Fund, Inc.
For the Six Months Ended June 30, 2007 (Unaudited)
(in thousands)
| Growth Stock Portfolio |
Janus Capital Appreciation Portfolio |
Large Cap Core Stock Portfolio |
Index 500 Stock Portfolio |
|||||||||||||
| Investment Income |
||||||||||||||||
| Income |
||||||||||||||||
| Interest |
$ | 953 | $ | 314 | $ | 922 | $ | 1,005 | ||||||||
| Dividends (1) |
4,271 | 636 | 4,331 | 20,124 | ||||||||||||
| Total Income |
5,224 | 950 | 5,253 | 21,129 | ||||||||||||
| Expenses |
||||||||||||||||
| Management Fees |
1,544 | 586 | 1,152 | 2,100 | ||||||||||||
| Custodian Fees |
7 | 5 | 6 | 12 | ||||||||||||
| Audit Fees |
8 | 8 | 8 | 8 | ||||||||||||
| Other Expenses |
1 | 1 | 2 | 2 | ||||||||||||
| Total Expenses |
1,560 | 600 | 1,168 | 2,122 | ||||||||||||
| Less Waived Fees: |
||||||||||||||||
| Paid by Affiliate |
— | — | — | — | ||||||||||||
| Paid Indirectly |
(1 | ) | (1 | ) | (1 | ) | (2 | ) | ||||||||
| Total Net Expenses |
1,559 | 599 | 1,167 | 2,120 | ||||||||||||
| Net Investment Income (Loss) |
3,665 | 351 | 4,086 | 19,009 | ||||||||||||
| Realized and Unrealized Gain (Loss) on Investments |
||||||||||||||||
| Net Realized Gain (Loss) on: |
||||||||||||||||
| Investment Securities |
24,533 | 4,667 | 15,765 | 18,500 | ||||||||||||
| Futures Contracts |
832 | — | 816 | 1,865 | ||||||||||||
| Swap Contracts |
— | — | — | — | ||||||||||||
| Net Realized Gain (Loss) on Investments |
25,365 | 4,667 | 16,581 | 20,365 | ||||||||||||
| Net Unrealized Appreciation (Depreciation) of: |
||||||||||||||||
| Investment Securities |
20,047 | 9,140 | 15,855 | 103,954 | ||||||||||||
| Futures Contracts |
(137 | ) | — | (18 | ) | (217 | ) | |||||||||
| Swap Contracts |
— | — | — | — | ||||||||||||
| Net Change in Unrealized Appreciation (Depreciation) of Investments |
19,910 | 9,140 | 15,837 | 103,737 | ||||||||||||
| Net Gain (Loss) on Investments |
45,275 | 13,807 | 32,418 | 124,102 | ||||||||||||
| Net Increase (Decrease) in Net Assets Resulting from Operations |
$ | 48,940 | $ | 14,158 | $ | 36,504 | $ | 143,111 | ||||||||
| (1) Less Foreign dividend tax |
$ | 141 | $ | 18 | $ | 66 | $ | — | ||||||||
| (2) For the Period from April 30, 2007 (Commencement of Operations) through June 30, 2007. |
||||||||||||||||
| # | Formerly named Aggressive Growth Stock Portfolio |
The Accompanying Notes are an Integral Part of the Financial Statements.
96
Statements of Operations (Prepared from Unaudited Figures)
Table of Contents
| Capital Guardian Domestic Equity Portfolio |
T. Rowe Price Equity Income Portfolio |
Mid Cap Growth Stock Portfolio# |
Index 400 Stock Portfolio |
AllianceBernstein Mid Cap Value Portfolio |
Small Cap Growth Stock Portfolio |
T. Rowe Price Small Cap Value Portfolio |
||||||||||||||||||||
| $ | 576 | $ | 333 | $ | 2,177 | $ | 1,184 | $ | 195 | $ | 1,250 | $ | 344 | |||||||||||||
| 5,302 | 2,441 | 3,508 | 4,276 | 944 | 703 | 2,660 | ||||||||||||||||||||
| 5,878 | 2,774 | 5,685 | 5,460 | 1,139 | 1,953 | 3,004 | ||||||||||||||||||||
| 1,215 | 730 | 3,129 | 701 | 633 | 1,427 | 1,464 | ||||||||||||||||||||
| 5 | 8 | 7 | 10 | 4 | 10 | 13 | ||||||||||||||||||||
| 8 | 8 | 9 | 8 | 8 | 8 | 8 | ||||||||||||||||||||
| 1 | 2 | 1 | 2 | 2 | 2 | 2 | ||||||||||||||||||||
| 1,229 | 748 | 3,146 | 721 | 647 | 1,447 | 1,487 | ||||||||||||||||||||
| — | — | — | — | — | — | — | ||||||||||||||||||||
| (1 | ) | (2 | ) | (2 | ) | (3 | ) | (2 | ) | (1 | ) | (5 | ) | |||||||||||||
| 1,228 | 746 | 3,144 | 718 | 645 | 1,446 | 1,482 | ||||||||||||||||||||
| 4,650 | 2,028 | 2,541 | 4,742 | 494 | 507 | 1,522 | ||||||||||||||||||||
| 17,382 | 9,117 | 74,715 | 19,954 | 8,141 | 39,140 | 9,866 | ||||||||||||||||||||
| — | — | 2,337 | 2,818 | — | (39 | ) | — | |||||||||||||||||||
| — | — | — | — | — | — | — | ||||||||||||||||||||
| 17,382 | 9,117 | 77,052 | 22,772 | 8,141 | 39,101 | 9,866 | ||||||||||||||||||||
| 8,740 | 6,968 | 58,580 | 34,552 | 10,102 | 9,828 | 14,303 | ||||||||||||||||||||
| — | — | 445 | 720 | — | 272 | — | ||||||||||||||||||||
| — | — | — | — | — | — | — | ||||||||||||||||||||
| 8,740 | 6,968 | 59,025 | 35,272 | 10,102 | 10,100 | 14,303 | ||||||||||||||||||||
| 26,122 | 16,085 | 136,077 | 58,044 | 18,243 | 49,201 | 24,169 | ||||||||||||||||||||
| $ | 30,772 | $ | 18,113 | $ | 138,618 | $ | 62,786 | $ | 18,737 | $ | 49,708 | $ | 25,691 | |||||||||||||
| $ | 96 | $ | 30 | $ | 20 | $ | 2 | $ | — | $ | — | $ | — | |||||||||||||
The Accompanying Notes are an Integral Part of the Financial Statements.
Statements of Operations
97
Table of Contents
Statements of Operations
Northwestern Mutual Series Fund, Inc.
For the Six Months Ended June 30, 2007 (Unaudited)
(in thousands)
| International Growth Portfolio |
Franklin Templeton International Equity Portfolio |
Money Market Portfolio |
Select Bond Portfolio |
High Yield Bond Portfolio |
Balanced Portfolio |
Asset Allocation Portfolio |
|||||||||||||||||||||
| Investment Income |
|||||||||||||||||||||||||||
| Income |
|||||||||||||||||||||||||||
| Interest |
$ | 237 | $ | 2,266 | $ | 10,444 | $ | 26,291 | $ | 11,021 | $ | 38,057 | $ | 3,496 | |||||||||||||
| Dividends (1) |
3,663 | 31,604 | — | — | — | 13,784 | 1,256 | ||||||||||||||||||||
| Total Income |
3,900 | 33,870 | 10,444 | 26,291 | 11,021 | 51,841 | 4,752 | ||||||||||||||||||||
| Expenses |
|||||||||||||||||||||||||||
| Management Fees |
987 | 5,445 | 586 | 1,438 | 649 | 4,379 | 741 | ||||||||||||||||||||
| Custodian Fees |
179 | 350 | — | — | 8 | — | 51 | ||||||||||||||||||||
| Audit Fees |
9 | 9 | — | — | 10 | — | 9 | ||||||||||||||||||||
| Other Expenses |
3 | 3 | — | — | 2 | — | 4 | ||||||||||||||||||||
| Total Expenses |
1,178 | 5,807 | 586 | 1,438 | 669 | 4,379 | 805 | ||||||||||||||||||||
| Less Waived Fees: |
|||||||||||||||||||||||||||
| Paid by Affiliate |
— | (546 | ) | — | — | — | — | (25 | ) | ||||||||||||||||||
| Paid Indirectly |
— | — | — | — | (2 | ) | — | (2 | ) | ||||||||||||||||||
| Total Net Expenses |
1,178 | 5,261 | 586 | 1,438 | 667 | 4,379 | 778 | ||||||||||||||||||||
| Net Investment Income (Loss) |
2,722 | 28,609 | 9,858 | 24,853 | 10,354 | 47,462 | 3,974 | ||||||||||||||||||||
| Realized and Unrealized Gain (Loss) on Investments and Foreign Currencies |
|||||||||||||||||||||||||||
| Net Realized Gain (Loss) on: |
|||||||||||||||||||||||||||
| Investment Securities |
13,137 | 48,126 | — | (3,347 | ) | 2,254 | 653,139 | 9,587 | |||||||||||||||||||
| Futures Contracts |
— | — | — | 149 | — | 540 | 803 | ||||||||||||||||||||
| Swap Contracts |
— | — | — | — | — | (1,691 | ) | — | |||||||||||||||||||
| Foreign Currency Transactions |
(25 | ) | 82 | — | (144 | ) | — | (200 | ) | (19 | ) | ||||||||||||||||
| Net Realized Gain (Loss) on Investments and Foreign Currencies |
13,112 | 48,208 | — |
|
(3,342 |
) |
2,254 | 651,788 | 10,371 | ||||||||||||||||||
| Net Unrealized Appreciation (Depreciation) of: |
|||||||||||||||||||||||||||
| Investment Securities |
12,886 | 152,282 | — | (14,323 | ) | (6,509 | ) | (581,751 | ) | 2,428 | |||||||||||||||||
| Futures Contracts |
— | — | — | (90 | ) | — | (221 | ) | (140 | ) | |||||||||||||||||
| Options Written |
— | — | — | — | — | — | — | ||||||||||||||||||||
| Swap Contracts |
— | — | — | — | — | (5,756 | ) | — | |||||||||||||||||||
| Foreign Currency Transactions |
(25 | ) | (22 | ) | — | (2 | ) | — | 1 | — | |||||||||||||||||
| Net Change in Unrealized Appreciation (Depreciation) of Investments |
12,861 | 152,260 | — |
|
(14,415 |
) |
(6,509 | ) | (587,727 | ) | 2,288 | ||||||||||||||||
| Net Gain (Loss) on Investments |
25,973 | 200,468 | — | (17,757 | ) | (4,255 | ) | 64,061 | 12,659 | ||||||||||||||||||
| Net Increase (Decrease) in Net Assets Resulting from Operations |
$ | 28,695 | $ | 229,077 | $ | 9,858 | $ | 7,096 | $ | 6,099 | $ | 111,523 | $ | 16,633 | |||||||||||||
| (1) Less Foreign dividend tax |
$ | 156 | $ | 1,353 | $ | — | $ | — | $ | — | $ | 261 | $ | 124 | |||||||||||||
The Accompanying Notes are an Integral Part of the Financial Statements.
98
Statements of Operations (Prepared from Unaudited Figures)
Table of Contents
[THIS PAGE INTENTIONALLY LEFT BLANK]
99
Table of Contents
Statements of Changes in Net Assets
Northwestern Mutual Series Fund, Inc.
(Amounts in thousands)
| Growth Stock Portfolio |
Janus Capital Appreciation Portfolio | |||||||||||||||
| For the Six Months Ended June 30, 2007 (Unaudited) |
For the Year Ended December 31, 2006 |
For the Six Months Ended June 30, 2007 (Unaudited) |
For the Year Ended December 31, 2006 |
|||||||||||||
| Change in Net Assets |
||||||||||||||||
| Operations |
||||||||||||||||
| Net Investment Income (Loss) |
$ | 3,665 | $ | 6,654 | $ | 351 | $ | 517 | ||||||||
| Net Realized Gain (Loss) on Investments and Foreign Currencies |
25,365 | 46,480 | 4,667 | 6,849 | ||||||||||||
| Net Change in Unrealized Appreciation (Depreciation) of Investments |
19,910 | 11,813 | 9,140 | (1,469 | ) | |||||||||||
| Net Increase (Decrease) in Net Assets Resulting from Operations |
48,940 | 64,947 | 14,158 | 5,897 | ||||||||||||
| Distributions to Shareholders from: |
||||||||||||||||
| Net Investment Income |
— | (5,333 | ) | — | (513 | ) | ||||||||||
| Net Realized Gain on Investments |
— | — | — | (6,622 | ) | |||||||||||
| Net Decrease in Net Assets Resulting from Distributions to Shareholders |
— | (5,333 | ) | — | (7,135 | ) | ||||||||||
| Capital Transactions: |
||||||||||||||||
| Shares Sold |
23,093 | 49,574 | 32,751 | 57,936 | ||||||||||||
| Reinvestment of Distributions Paid |
— | 5,333 | — | 7,135 | ||||||||||||
| Shares Redeemed |
(52,963 | ) | (81,992 | ) | (12,648 | ) | (57,931 | ) | ||||||||
| Net Increase (Decrease) in Net Assets Resulting from Capital Transactions |
(29,870 | ) | (27,085 | ) | 20,103 | 7,140 | ||||||||||
| Total Increase (Decrease) in Net Assets |
19,070 | 32,529 | 34,261 | 5,902 | ||||||||||||
| Net Assets |
||||||||||||||||
| Beginning of Period |
735,055 | 702,526 | 138,581 | 132,679 | ||||||||||||
| End of Period |
$ | 754,125 | $ | 735,055 | $ | 172,842 | $ | 138,581 | ||||||||
| Accumulated Undistributed Net Investment Income |
$ | 10,318 | $ | 6,654 | $ | 357 | $ | 6 | ||||||||
| Fund Share Transactions: |
||||||||||||||||
| Shares Sold |
73,071 | 23,055 | 19,157 | 35,916 | ||||||||||||
| Reinvestment of Distributions Paid |
— | 2,470 | — | 4,399 | ||||||||||||
| Shares Redeemed |
(85,613 | ) | (38,065 | ) | (7,488 | ) | (36,279 | ) | ||||||||
| Net Increase (Decrease) in Shares Resulting from Fund Share Transactions |
(12,542 | ) | (12,540 | ) | 11,669 | 4,036 | ||||||||||
The Accompanying Notes are an Integral Part of the Financial Statements.
100
Statements of Changes in Net Assets
Table of Contents
| Large Cap Core Stock Portfolio | |
Capital Guardian Domestic Equity Portfolio |
T. Rowe Price Equity Income Portfolio |
|||||||||||||||||||||||||||
| For the Six Months Ended June 30, 2007 (Unaudited) |
For the Year Ended December 31, 2006 |
For the Six Months Ended June 30, 2007 (Unaudited) |
For the Year Ended December 31, 2006 |
For the Six Months Ended June 30, 2007 (Unaudited) |
For the Year Ended December 31, 2006 |
For the Six Months Ended June 30, 2007 (Unaudited) |
For the Year Ended December 31, 2006 |
|||||||||||||||||||||||
| $ | 4,086 | $ | 6,350 | $ | 19,009 | $ | 34,674 | $ | 4,650 | $ | 6,667 | $ | 2,028 | $ | 2,986 | |||||||||||||||
| 16,581 | 35,150 | 20,365 | 75,474 | 17,382 | 20,054 | 9,117 | 5,755 | |||||||||||||||||||||||
| 15,837 | 14,646 | 103,737 | 176,338 | 8,740 | 26,100 | 6,968 | 20,259 | |||||||||||||||||||||||
| 36,504 | 56,146 | 143,111 | 286,486 | 30,772 | 52,821 | 18,113 | 29,000 | |||||||||||||||||||||||
| — | (5,437 | ) | — | (31,068 | ) | — | — | — | (2,858 | ) | ||||||||||||||||||||
| — | — | — | (69,810 | ) | — | (3,594 | ) | — | (4,487 | ) | ||||||||||||||||||||
| — | (5,437 | ) | — | (100,878 | ) | — | (3,594 | ) | — | (7,345 | ) | |||||||||||||||||||
| 20,335 | 42,366 | 73,923 | 121,647 | 64,500 | 116,555 | 46,945 | 55,854 | |||||||||||||||||||||||
| — | 5,437 | — | 100,878 | — | 3,594 | — | 7,345 | |||||||||||||||||||||||
| (33,946 | ) | (57,079 | ) | (122,227 | ) | (230,375 | ) | (24,359 | ) | (33,474 | ) | (25,989 | ) | (17,270 | ) | |||||||||||||||
|
|
(13,611 |
) |
(9,276 | ) | (48,304 | ) | (7,850 | ) | 40,141 | 86,675 | 20,956 | 45,929 | ||||||||||||||||||
| 22,893 | 41,433 | 94,807 | 177,758 | 70,913 | 135,902 | 39,069 | 67,584 | |||||||||||||||||||||||
| 535,453 | 494,020 | 2,081,399 | 1,903,641 | 409,837 | 273,934 | 200,507 | 132,923 | |||||||||||||||||||||||
| $ | 558,346 | $ | 535,453 | $ | 2,176,206 | $ | 2,081,399 | $ | 480,750 | $ | 409,836 | $ | 239,576 | $ | 200,507 | |||||||||||||||
| $ | 10,431 | $ | 6,345 | $ | 53,521 | $ | 34,511 | $ | 11,223 | $ | 6,574 | $ | 2,054 | $ | 26 | |||||||||||||||
| 14,529 | 33,623 | 22,003 | 40,000 | 48,106 | 96,847 | 29,795 | 38,621 | |||||||||||||||||||||||
| — | 4,298 | — | 33,840 | — | 3,000 | — | 4,805 | |||||||||||||||||||||||
| (24,384 | ) | (45,202 | ) | (36,329 | ) | (75,990 | ) | (17,896 | ) | (27,853 | ) | (15,947 | ) | (12,051 | ) | |||||||||||||||
|
|
(9,855 |
) |
(7,281 | ) | (14,326 | ) | (2,150 | ) | 30,210 | 71,994 | 13,848 | 31,375 | ||||||||||||||||||
The Accompanying Notes are an Integral Part of the Financial Statements.
Statements of Changes in Net Assets
101
Table of Contents
Statements of Changes in Net Assets
Northwestern Mutual Series Fund, Inc.
(Amounts in thousands)
| Mid Cap Growth Stock Portfolio# |
Index 400 Stock Portfolio | |||||||||||||||
| For the Six Months Ended June 30, 2007 (Unaudited) |
For the Year Ended December 31, 2006 |
For the Six Months Ended June 30, 2007 (Unaudited) |
For the Year Ended December 31, 2006 |
|||||||||||||
| Change in Net Assets |
||||||||||||||||
| Operations |
||||||||||||||||
| Net Investment Income (Loss) |
$ | 2,541 | $ | 9,438 | $ | 4,742 | $ | 7,356 | ||||||||
| Net Realized Gain (Loss) on Investments and Foreign Currencies |
77,052 | 106,624 | 22,772 | 32,092 | ||||||||||||
| Net Change in Unrealized Appreciation (Depreciation) of Investments |
59,025 | (62,717 | ) | 35,272 | 9,525 | |||||||||||
| Net Increase (Decrease) in Net Assets Resulting from Operations |
138,618 | 53,345 | ) | 62,786 | 48,973 | |||||||||||
| Distributions to Shareholders from: |
||||||||||||||||
| Net Investment Income |
— | (1,541 | ) | — | (5,572 | ) | ||||||||||
| Net Realized Gain on Investments |
— | (28,368 | ) | — | (31,856 | ) | ||||||||||
| Net Decrease in Net Assets Resulting from Distributions to Shareholders |
— | (29,909 | ) | — | (37,428 | ) | ||||||||||
| Capital Transactions: |
||||||||||||||||
| Shares Sold |
26,723 | 53,116 | 32,101 | 54,105 | ||||||||||||
| Reinvestment of Distributions Paid |
— | 29,909 | — | 37,428 | ||||||||||||
| Shares Redeemed |
(107,015 | ) | (175,679 | ) | (39,212 | ) | (59,964 | ) | ||||||||
| Net Increase (Decrease) in Net Assets Resulting from Capital Transactions |
(80,292 | ) | (92,654 | ) | (7,111 | ) | 31,569 | |||||||||
| Total Increase (Decrease) in Net Assets |
58,326 | (69,218 | ) | 55,675 | 43,114 | |||||||||||
| Net Assets |
||||||||||||||||
| Beginning of Period |
1,183,484 | 1,252,702 | 533,740 | 490,626 | ||||||||||||
| End of Period |
$ | 1,241,810 | $ | 1,183,484 | $ | 589,415 | $ | 533,740 | ||||||||
| Accumulated Undistributed Net Investment Income |
$ | 11,979 | $ | 9,438 | $ | 11,795 | $ | 7,053 | ||||||||
| Fund Share Transactions: |
||||||||||||||||
| Shares Sold |
7,427 | 15,795 | 18,929 | 34,605 | ||||||||||||
| Reinvestment of Distributions Paid |
— | 8,413 | — | 23,629 | ||||||||||||
| Shares Redeemed |
(29,817 | ) | (52,429 | ) | (23,141 | ) | (38,898 | ) | ||||||||
| Net Increase (Decrease) in Shares Resulting from Fund Share Transactions |
(22,390 | ) | (28,221 | ) | (4,212 | ) | 19,336 | |||||||||
| # | Formerly named Aggressive Growth Stock Portfolio |
The Accompanying Notes are an Integral Part of the Financial Statements.
102
Statements of Changes in Net Assets
Table of Contents
| AllianceBernstein Mid Cap Value Portfolio |
Small Cap Growth Stock Portfolio | T. Rowe Price Small Cap Value Portfolio | International Growth Portfolio | |||||||||||||||||||||||||||
| For the Six Months Ended June 30, 2007 (Unaudited) |
For the Year Ended December 31, 2006 |
For the Six Months Ended June 30, 2007 (Unaudited) |
For the Year Ended December 31, 2006 |
For the Six Months Ended June 30, 2007 (Unaudited) |
For the Year Ended December 31, 2006 |
For the Six Months Ended June 30, 2007 (Unaudited) |
For the Year Ended December 31, 2006 |
|||||||||||||||||||||||
| $ | 494 | $ | 1,424 | $ | 507 | $ | 423 | $ | 1,522 | $ | 1,887 | $ | 2,722 | $ | 2,541 | |||||||||||||||
| 8,141 | 9,122 |
|
39,101 |
|
48,800 | 9,866 | 18,386 | 13,112 | 24,088 | |||||||||||||||||||||
| 10,102 | 4,790 | 10,100 | (16,219 | ) | 14,303 | 22,237 | 12,861 | 17,154 | ||||||||||||||||||||||
| 18,737 | 15,336 | 49,708 | 33,004 | 25,691 | 42,510 | 28,695 | 43,783 | |||||||||||||||||||||||
| — | (1,410 | ) | — | — | — | (672 | ) | — | (451 | ) | ||||||||||||||||||||
| — | (8,997 | ) | — | (66,952 | ) | — | (10,289 | ) | — | (3,118 | ) | |||||||||||||||||||
| — | (10,407 | ) | — | (66,952 | ) | — | (10,961 | ) | — | (3,569 | ) | |||||||||||||||||||
| 37,191 | 26,498 | 20,902 | 59,700 | 37,750 | 63,688 | 42,761 | 88,769 | |||||||||||||||||||||||
| — | 10,407 | — | 66,952 | — | 10,961 | — | 3,569 | |||||||||||||||||||||||
| (28,240 | ) | (8,375 | ) | (44,458 | ) | (67,100 | ) | (18,918 | ) | (26,266 | ) | (20,142 | ) | (27,220 | ) | |||||||||||||||
| |
8,951 |
|
28,530 | (23,556 | ) | 59,552 | 18,832 | 48,383 | 22,619 | 65,118 | ||||||||||||||||||||
| 27,688 | 33,459 | 26,152 | 25,604 | 44,523 | 79,932 | 51,314 | 105,332 | |||||||||||||||||||||||
| 131,016 | 97,557 | 528,612 | 503,008 | 324,973 | 245,041 | 272,882 | 167,550 | |||||||||||||||||||||||
| $ | 158,704 | $ | 131,016 | $ | 554,764 | $ | 528,612 | $ | 369,496 | $ | 324,973 | $ | 324,196 | $ | 272,882 | |||||||||||||||
| $ | 494 | $ | — | $ | 930 | $ | 423 | $ | 3,069 | $ | 1,546 | $ | 4,891 | $ | 2,170 | |||||||||||||||
| 22,606 | 17,295 | 8,506 | 24,255 | 19,628 | 36,280 | 23,413 | 56,242 | |||||||||||||||||||||||
| — | 6,734 | — | 26,696 | — | 6,046 | — | 2,115 | |||||||||||||||||||||||
| (16,673 | ) | (5,509 | ) | (18,082 | ) | (27,963 | ) | (9,905 | ) | (15,130 | ) | (11,030 | ) | (17,336 | ) | |||||||||||||||
| |
5,933 |
|
18,520 | (9,576 | ) | 22,988 | 9,723 | 27,196 | 12,383 | 41,021 | ||||||||||||||||||||
The Accompanying Notes are an Integral Part of the Financial Statements.
Statements of Changes in Net Assets
103
Table of Contents
Statements of Changes in Net Assets
Northwestern Mutual Series Fund, Inc.
(Amounts in thousands)
| Franklin Templeton International Equity Portfolio |
Money Market Portfolio | |||||||||||||||
| For the Six Months Ended June 30, 2007 (Unaudited) |
For the Year Ended December 31, 2006 |
For the Six Months Ended June 30, 2007 (Unaudited) |
For the Year Ended December 31, 2006 |
|||||||||||||
| Change in Net Assets |
||||||||||||||||
| Operations |
||||||||||||||||
| Net Investment Income (Loss) |
$ | 28,609 | $ | 33,360 | $ | 9,858 | $ | 17,568 | ||||||||
| Net Realized Gain (Loss) on Investments and Foreign Currencies |
48,208 | 72,743 | — | — | ||||||||||||
| Net Change in Unrealized Appreciation (Depreciation) of Investments |
152,260 | 252,828 | — | — | ||||||||||||
| Net Increase (Decrease) in Net Assets Resulting from Operations |
229,077 | 358,931 | 9,858 | 17,568 | ||||||||||||
| Distributions to Shareholders from: |
||||||||||||||||
| Net Investment Income |
— | (22,771 | ) | (9,858 | ) | (17,568 | ) | |||||||||
| Net Realized Gain on Investments |
— | — | — | — | ||||||||||||
| Net Decrease in Net Assets Resulting from Distributions to Shareholders |
— | (22,771 | ) | (9,858 | ) | (17,568 | ) | |||||||||
| Capital Transactions: |
||||||||||||||||
| Shares Sold |
120,288 | 170,977 | 114,517 | 202,463 | ||||||||||||
| Reinvestment of Distributions Paid |
— | 22,771 | 9,858 | 17,568 | ||||||||||||
| Shares Redeemed |
(80,933 | ) | (112,938 | ) | (95,419 | ) | (169,300 | ) | ||||||||
| Net Increase (Decrease) in Net Assets Resulting from Capital Transactions |
39,355 | 80,810 | 28,956 | 50,731 | ||||||||||||
| Total Increase (Decrease) in Net Assets |
268,432 | 416,970 | 28,956 | 50,731 | ||||||||||||
| Net Assets |
||||||||||||||||
| Beginning of Period |
1,556,230 | 1,139,260 | 390,589 | 339,858 | ||||||||||||
| End of Period |
$ | 1,824,662 | $ | 1,556,230 | $ | 419,545 | $ | 390,589 | ||||||||
| Accumulated Undistributed Net Investment Income |
$ | 61,713 | $ | 33,103 | $ | — | $ | — | ||||||||
| Fund Share Transactions: |
||||||||||||||||
| Shares Sold |
48,449 | 83,552 | 114,517 | 202,462 | ||||||||||||
| Reinvestment of Distributions Paid |
— | 10,906 | 9,858 | 17,568 | ||||||||||||
| Shares Redeemed |
(32,678 | ) | (55,742 | ) | (95,419 | ) | (169,300 | ) | ||||||||
| Net Increase (Decrease) in Shares Resulting from Fund Share Transactions |
15,771 | 38,716 | 28,956 | 50,730 | ||||||||||||
The Accompanying Notes are an Integral Part of the Financial Statements.
104
Statements of Changes in Net Assets
Table of Contents
| Select Bond Portfolio |
High Yield Bond Portfolio | Balanced Portfolio | Asset Allocation Portfolio | |||||||||||||||||||||||||||
| For the Six Months Ended June 30, 2007 (Unaudited) |
For the Year Ended December 31, 2006 |
For the Six Months Ended June 30, 2007 (Unaudited) |
For the Year Ended December 31, 2006 |
For the Six Months Ended June 30, 2007 (Unaudited) |
For the Year Ended December 31, 2006 |
For the Six Months Ended June 30, 2007 (Unaudited) |
For the Year Ended December 31, 2006 |
|||||||||||||||||||||||
| $ | 24,853 | $ | 40,889 | $ | 10,354 | $ | 17,959 | $ | 47,462 | $ | 89,658 | $ | 3,974 | $ | 6,635 | |||||||||||||||
| (3,342 | ) | (12,062 | ) | 2,254 | (2,091 | ) | 651,788 | 50,365 | 10,371 | 13,952 | ||||||||||||||||||||
| (14,415 | ) | 3,753 | (6,509 | ) | 8,393 | (587,727 | ) | 147,315 | 2,288 | 4,510 | ||||||||||||||||||||
| 7,096 | 32,580 | 6,099 | 24,261 | 111,523 | 287,338 | 16,633 | 25,097 | |||||||||||||||||||||||
| — | (31,072 | ) | — | (16,968 | ) | — | (82,263 | ) | — | (4,818 | ) | |||||||||||||||||||
| — | — | — | — | — | (31,791 | ) | — | (6,398 | ) | |||||||||||||||||||||
| — | (31,072 | ) | — | (16,968 | ) | — | (114,054 | ) | — | (11,216 | ) | |||||||||||||||||||
| 120,608 | 190,670 | 31,045 | 38,921 | 79,794 | 152,535 | 16,903 | 51,019 | |||||||||||||||||||||||
| — | 31,072 | — | 16,968 | — | 114,054 | — | 11,216 | |||||||||||||||||||||||
| (42,346 | ) | (85,337 | ) | (19,083 | ) | (31,097 | ) | (183,781 | ) | (395,982 | ) | (21,675 | ) | (39,060 | ) | |||||||||||||||
|
|
78,262 |
|
136,405 | 11,962 | 24,792 | (103,987 | ) | (129,393 | ) | (4,772 | ) | 23,175 | ||||||||||||||||||
| 85,358 | 137,913 | 18,061 | 32,085 | 7,536 | 43,891 | 11,861 | 37,056 | |||||||||||||||||||||||
| 924,457 | 786,544 | 276,639 | 244,554 | 2,949,632 | 2,905,741 | 281,863 | 244,807 | |||||||||||||||||||||||
| $ | 1,009,815 | $ | 924,457 | $ | 294,700 | $ | 276,639 | $ | 2,957,168 | $ | 2,949,632 | $ | 293,724 | $ | 281,863 | |||||||||||||||
| $ | 65,497 | $ | 40,645 | $ | 28,297 | $ | 17,943 | $ | 136,705 | $ | 89,243 | $ | 10,481 | $ | 6,508 | |||||||||||||||
| 99,299 | 161,348 | 41,250 | 54,593 | 39,613 | 81,031 | 13,430 | 43,790 | |||||||||||||||||||||||
| — | 27,256 | — | 24,734 | — | 62,087 | — | 9,611 | |||||||||||||||||||||||
| (34,881 | ) | (72,260 | ) | (25,312 | ) | (43,676 | ) | (91,213 | ) | (210,799 | ) | (17,223 | ) | (33,518 | ) | |||||||||||||||
|
|
64,418 |
|
116,344 | 15,938 | 35,651 | (51,600 | ) | (67,681 | ) | (3,793 | ) | 19,883 | ||||||||||||||||||
The Accompanying Notes are an Integral Part of the Financial Statements.
Statements of Changes in Net Assets
105
Table of Contents
(For a share outstanding throughout the period)
| Net Asset Value, Beginning of Period |
Net Invest- ment Income (Loss) |
Net Realized and Unrealized Gain (Loss) on Investments |
Total from Investment Operations |
Distributions from Net Investment Income |
Distributions From Realized Gains on Investments |
Total Distribu- tions |
Net Asset Value, End of Period |
Total Return(d) |
Net Assets, End of Period (thousands) |
Ratio of Gross Expenses to Average Net Assets |
Ratio of Net Expenses to Average Net Assets |
Ratio of Net Investment Income (Loss) to Average Net Assets |
Portfolio Turnover Rate |
||||||||||||||||||||||||||||||||||
| Growth Stock Portfolio |
|
||||||||||||||||||||||||||||||||||||||||||||||
| (j)2007 |
$ | 2.30 | $ | 0.01 | $ | 0.14 | $ | 0.15 | $ | — | $ | — | $ | — | $ | 2.45 | 6.79 | % | $754,125 | — | 0.42 | %(c) | 1.00 | %(c) | 20.56 | % | |||||||||||||||||||||
| 2006 |
2.11 | 0.02 | 0.19 | 0.21 | (0.02 | ) | — | (0.02 | ) | 2.30 | 9.57 | 735,055 | — | 0.43 | 0.94 | 36.05 | |||||||||||||||||||||||||||||||
| 2005 |
1.98 | 0.02 | 0.13 | 0.15 | (0.02 | ) | — | (0.02 | ) | 2.11 | 7.71 | 702,526 | — | 0.43 | 0.78 | 31.74 | |||||||||||||||||||||||||||||||
| 2004 |
1.87 | 0.01 | 0.11 | 0.12 | (0.01 | ) | — | (0.01 | ) | 1.98 | 6.67 | 686,849 | — | 0.43 | 1.07 | 34.53 | |||||||||||||||||||||||||||||||
| 2003 |
1.59 | 0.01 | 0.28 | 0.29 | (0.01 | ) | — | (0.01 | ) | 1.87 | 18.94 | 665,871 | — | 0.43 | 0.77 | 40.89 | |||||||||||||||||||||||||||||||
| 2002 |
2.03 | 0.01 | (0.43 | ) | (0.42 | ) | (0.02 | ) | — | (0.02 | ) | 1.59 | (20.83 | ) | 551,421 | — | 0.43 | 0.76 | 28.06 | ||||||||||||||||||||||||||||
| Janus Capital Appreciation Portfolio |
|
||||||||||||||||||||||||||||||||||||||||||||||
| (j)2007 |
$ | 1.62 | $ | — | (e) | $ | 0.16 | $ | 0.16 | $ | — | $ | — | $ | — | $ | 1.78 | 9.77 | % | $172,842 | 0.80 | %(c) | 0.80 | %(c) | 0.47 | %(c) | 43.87 | % | |||||||||||||||||||
| 2006 |
1.63 | 0.01 | 0.07 | 0.08 | (0.01 | ) | (0.08 | ) | (0.09 | ) | 1.62 | 4.88 | 138,581 | 0.81 | 0.81 | 0.38 | 61.84 | ||||||||||||||||||||||||||||||
| 2005 |
1.43 | — | 0.25 | 0.25 | — | (0.05 | ) | (0.05 | ) | 1.63 | 17.00 | 132,679 | 0.82 | 0.82 | 0.18 | 45.20 | |||||||||||||||||||||||||||||||
| 2004 |
1.20 | 0.00 | (c) | 0.23 | 0.23 | — | — | — | 1.43 | 19.67 | 56,690 | 0.84 | 0.84 | (0.03 | ) | 25.42 | |||||||||||||||||||||||||||||||
| (b)2003 |
1.00 | — | 0.20 | 0.20 | 0.00 | (c) | 0.00 | (c) | 0.00 | (c) | 1.20 | 19.90 | 36,730 | 0.90 | (c) | 0.89 | (c) | 0.07 | (c) | 33.68 | |||||||||||||||||||||||||||
| Large Cap Core Stock Portfolio |
|
||||||||||||||||||||||||||||||||||||||||||||||
| (j)2007 |
$ | 1.35 | $ | 0.01 | $ | 0.08 | $ | 0.09 | $ | — | $ | — | $ | — | $ | 1.44 | 6.97 | % | $558,346 | — | 0.43 | %(c) | 1.52 | %(c) | 21.67 | % | |||||||||||||||||||||
| 2006 |
1.22 | 0.02 | 0.12 | 0.14 | (0.01 | ) | — | (0.01 | ) | 1.35 | 11.49 | 535,453 | — | 0.44 | 1.25 | 39.39 | |||||||||||||||||||||||||||||||
| 2005 |
1.14 | 0.01 | 0.09 | 0.10 | (0.02 | ) | — | (0.02 | ) | 1.22 | 8.46 | 494,020 | — | 0.44 | 1.15 | 32.23 | |||||||||||||||||||||||||||||||
| 2004 |
1.07 | 0.02 | 0.06 | 0.08 | (0.01 | ) | — | (0.01 | ) | 1.14 | 8.16 | 469,935 | — | 0.44 | 1.41 | 33.64 | |||||||||||||||||||||||||||||||
| 2003 |
0.87 | 0.01 | 0.20 | 0.21 | (0.01 | ) | — | (0.01 | ) | 1.07 | 24.05 | 447,554 | — | 0.46 | 1.07 | 58.90 | |||||||||||||||||||||||||||||||
| 2002 |
1.22 | 0.01 | (0.35 | ) | (0.34 | ) | (0.01 | ) | — | (0.01 | ) | 0.87 | (28.20 | ) | 365,944 | — | 0.58 | 0.85 | 29.20 | ||||||||||||||||||||||||||||
| Index 500 Stock Portfolio |
|
||||||||||||||||||||||||||||||||||||||||||||||
| 2007 |
$ | 3.26 | $ | 0.03 | $ | 0.20 | $ | 0.23 | $ | — | $ | — | $ | — | $ | 3.49 | 6.96 | % | $2,176,206 | — | 0.20 | %(c) | 1.81 | %(c) | 1.50 | % | |||||||||||||||||||||
| 2006 |
2.97 | 0.06 | 0.39 | 0.45 | (0.05 | ) | (0.11 | ) | (0.16 | ) | 3.26 | 15.62 | 2,081,399 | — | 0.20 | 1.78 | 4.47 | ||||||||||||||||||||||||||||||
| 2005 |
2.94 | 0.05 | 0.08 | 0.13 | (0.05 | ) | (0.05 | ) | (0.10 | ) | 2.97 | 4.72 | 1,903,641 | — | 0.20 | 1.68 | 5.36 | ||||||||||||||||||||||||||||||
| 2004 |
2.72 | 0.05 | 0.24 | 0.29 | (0.04 | ) | (0.03 | ) | (0.07 | ) | 2.94 | 10.70 | 1,904,122 | — | 0.20 | 1.83 | 3.45 | ||||||||||||||||||||||||||||||
| 2003 |
2.17 | 0.04 | 0.56 | 0.60 | (0.04 | ) | (0.01 | ) | (0.05 | ) | 2.72 | 28.43 | 1,756,120 | — | 0.20 | 1.59 | 2.44 | ||||||||||||||||||||||||||||||
| 2002 |
2.87 | 0.03 | (0.64 | ) | (0.61 | ) | (0.03 | ) | (0.06 | ) | (0.09 | ) | 2.17 | (22.07 | ) | 1,362,881 | — | 0.21 | 1.40 | 6.55 | |||||||||||||||||||||||||||
| Capital Guardian Domestic Equity Portfolio |
|
||||||||||||||||||||||||||||||||||||||||||||||
| (j)2007 |
$ | 1.31 | $ | 0.01 | $ | 0.08 | $ | 0.09 | $ | — | $ | — | $ | — | $ | 1.40 | 6.97 | % | $480,750 | — |
|
0.56 | %(c) | 2.10 | %(c) | 20.56 | % | ||||||||||||||||||||
| 2006 |
1.13 | 0.02 | 0.17 | 0.19 | — | (0.01 | ) | (0.01 | ) | 1.31 | 16.56 | 409,836 | — |
|
0.58 | 1.99 | 31.59 | ||||||||||||||||||||||||||||||
| 2005 |
1.14 | 0.02 | 0.07 | 0.09 | (0.02 | ) | (0.08 | ) | (0.10 | ) | 1.13 | 8.04 | 273,934 | — |
|
0.60 | 1.77 | 35.19 | |||||||||||||||||||||||||||||
| 2004 |
1.00 | 0.02 | 0.15 | 0.17 | (0.01 | ) | (0.02 | ) | (0.03 | ) | 1.14 | 16.85 | 211,977 | — |
|
0.62 | 1.63 | 32.97 | |||||||||||||||||||||||||||||
| 2003 |
0.76 | 0.01 | 0.24 | 0.25 | (0.01 | ) | — | (0.01 | ) | 1.00 | 34.41 | 136,099 | — |
|
0.67 | 1.84 | 29.20 | ||||||||||||||||||||||||||||||
| 2002 |
0.97 | 0.01 | (0.21 | ) | (0.20 | ) | (0.01 | ) | — | (0.01 | ) | 0.76 | (21.24 | ) | 74,274 | — |
|
0.70 | 1.54 | 22.42 | |||||||||||||||||||||||||||
| T. Rowe Price Equity Income Portfolio |
|
||||||||||||||||||||||||||||||||||||||||||||||
| (j)2007 |
$ | 1.53 | $ | 0.01 | $ | 0.11 | $ | 0.12 | $ | — | $ | — | $ | — | $ | 1.65 | 8.12 | % | $239,576 | 0.67 | %(c) | 0.67 | %(c) | 1.80 | %(c) | 14.59 | % | ||||||||||||||||||||
| 2006 |
1.33 | 0.02 | 0.24 | 0.26 | (0.02 | ) | (0.04 | ) | (0.06 | ) | 1.53 | 19.15 | 200,507 | 0.67 | 0.67 | 1.88 | 15.50 | ||||||||||||||||||||||||||||||
| 2005 |
1.35 | 0.02 | 0.04 | 0.06 | (0.02 | ) | (0.06 | ) | (0.08 | ) | 1.33 | 4.19 | 132,923 | 0.68 | 0.68 | 1.76 | 16.01 | ||||||||||||||||||||||||||||||
| 2004 |
1.22 | 0.02 | 0.17 | 0.19 | (0.02 | ) | (0.04 | ) | (0.06 | ) | 1.35 | 15.16 | 89,747 | 0.69 | 0.69 | 1.74 | 15.21 | ||||||||||||||||||||||||||||||
| (b)2003 |
1.00 | 0.01 | 0.23 | 0.24 | (0.01 | ) | (0.01 | ) | (0.02 | ) | 1.22 | 23.64 | 47,664 | 0.77 | 0.75 | 1.88 | 27.27 | ||||||||||||||||||||||||||||||
| Mid Cap Growth Stock Portfolio(i) |
|
||||||||||||||||||||||||||||||||||||||||||||||
| (j)2007 |
$ | 3.37 | $ | 0.01 | $ | 0.39 | $ | 0.40 | $ | — | $ | — | $ | — | $ | 3.77 | 12.06 | % | $1,241,810 | — | 0.52 | %(c) | 0.42 | %(c) | 48.31 | % | |||||||||||||||||||||
| 2006 |
3.30 | 0.03 | 0.12 | 0.15 | — | (0.08 | ) | (0.08 | ) | 3.37 | 4.40 | 1,183,484 | — | 0.52 | 0.77 | 72.15 | |||||||||||||||||||||||||||||||
| 2005 |
3.11 | — | 0.19 | 0.19 | — | — | — | 3.30 | 6.14 | 1,252,702 | — | 0.52 | 0.13 | 83.42 | |||||||||||||||||||||||||||||||||
| 2004 |
2.72 | 0.00 | (c) | 0.39 | 0.39 | — | — | — | 3.11 | 14.22 | 1,278,495 | — | 0.52 | 0.05 | 71.24 | ||||||||||||||||||||||||||||||||
| 2003 |
2.18 | — | 0.54 | 0.54 | — | — | — | 2.72 | 24.69 | 1,187,542 | — | 0.52 | (0.10 | ) | 63.21 | ||||||||||||||||||||||||||||||||
| 2002 |
2.82 | — | (0.59 | ) | (0.59 | ) | — | (0.05 | ) | (0.05 | ) | 2.18 | (21.15 | ) | 994,075 | — | 0.52 | (0.11 | ) | 43.37 | |||||||||||||||||||||||||||
| (b) |
For the period May 1, 2003 (commencement of operations) through December 31, 2003. |
| (c) |
Computed on an annualized basis. |
| (d) |
Total Return includes deductions for management and other fund expenses; excludes deductions for sales loads and account fees, not annualized for periods less than one year. |
| (e) |
Amount is less than $0.005. |
| (i) |
Formerly named Aggressive Growth Stock Portfolio. |
| (j) |
For the six months ended June 30, 2007. (Unaudited) |
The Accompanying Notes are an Integral Part of the Financial Statements.
106
Financial Highlights
Table of Contents
Financial Highlights, continued
(For a share outstanding throughout the period)
| Net Asset Value, Beginning of Period |
Net Invest- ment Income (Loss) |
Net Realized and Unrealized Gain (Loss) on Investments |
Total from Investment Operations |
Distributions from Net Investment Income |
Distributions From Realized Gains on Investments |
Total Distribu- tions |
Net Asset Value, End of Period |
Total Return(d) |
Net Assets, End of Period (thousands) |
Ratio of Gross Expenses to Average Net Assets |
Ratio of Net Expenses to Average Net Assets |
Ratio of Net Investment Income (Loss) to Average Net Assets |
Portfolio Turnover Rate |
||||||||||||||||||||||||||||||||||
| Index 400 Stock Portfolio |
|
||||||||||||||||||||||||||||||||||||||||||||||
| (j)2007 |
$ | 1.59 | $ | 0.01 | $ | 0.17 | $ | 0.18 | $ | — | $ | — | $ | — | $ | 1.77 | 11.85 | % | $589,415 | — | 0.26 | %(c) | 1.69 | %(c) | 9.01 | % | |||||||||||||||||||||
| 2006 |
1.55 | 0.02 | 0.14 | 0.16 | (0.02 | ) | (0.10 | ) | (0.12 | ) | 1.59 | 10.04 | 533,740 | — | 0.26 | 1.42 | 12.43 | ||||||||||||||||||||||||||||||
| 2005 |
1.46 | 0.02 | 0.15 | 0.17 | (0.01 | ) | (0.07 | ) | (0.08 | ) | 1.55 | 12.37 | 490,626 | — | 0.26 | 1.26 | 18.63 | ||||||||||||||||||||||||||||||
| 2004 |
1.28 | 0.01 | 0.19 | 0.20 | (0.01 | ) | (0.01 | ) | (0.02 | ) | 1.46 | 16.26 | 426,827 | — | 0.26 | 0.96 | 16.46 | ||||||||||||||||||||||||||||||
| 2003 |
0.95 | 0.01 | 0.33 | 0.34 | (0.01 | ) | — | (0.01 | ) | 1.28 | 35.01 | 342,500 | — | 0.27 | 0.92 | 9.74 | |||||||||||||||||||||||||||||||
| 2002 |
1.12 | 0.01 | (0.17 | ) | (0.16 | ) | (0.01 | ) | — | (0.01 | ) | 0.95 | (14.54 | ) | 225,410 | — | 0.28 | 0.86 | 15.60 | ||||||||||||||||||||||||||||
| AllianceBernstein Mid Cap Value Portfolio |
|
||||||||||||||||||||||||||||||||||||||||||||||
| (j)2007 |
$ | 1.53 | $ | 0.01 | $ | 0.19 | $ | 0.20 | $ | — | $ | — | $ | — | $ | 1.73 | 13.29 | % | $158,704 | 0.87 | %(c) | 0.87 | %(c) | 0.66 | %(c) | 17.57 | % | ||||||||||||||||||||
| 2006 |
1.45 | 0.02 | 0.20 | 0.22 | (0.02 | ) | (0.12 | ) | (0.14 | ) | 1.53 | 14.49 | 131,016 | 0.87 | 0.87 | 1.26 | 43.75 | ||||||||||||||||||||||||||||||
| 2005 |
1.45 | 0.01 | 0.08 | 0.09 | (0.01 | ) | (0.08 | ) | (0.09 | ) | 1.45 | 5.46 | 97,557 | 0.87 | 0.87 | 0.61 | 31.15 | ||||||||||||||||||||||||||||||
| 2004 |
1.32 | 0.01 | 0.22 | 0.23 | (0.01 | ) | (0.09 | ) | (0.10 | ) | 1.45 | 18.67 | 72,131 | 0.89 | 0.89 | 1.00 | 33.05 | ||||||||||||||||||||||||||||||
| (b)2003 |
1.00 | 0.01 | 0.32 | 0.33 | (0.00 | )(e) | (0.01 | ) | (0.01 | ) | 1.32 | 33.16 | 44,091 | 0.94 | (c) | 0.93 | (c) | 0.70 | (c) | 9.68 | |||||||||||||||||||||||||||
| Small Cap Growth Stock Portfolio |
|
||||||||||||||||||||||||||||||||||||||||||||||
| (j)2007 |
$ | 2.38 | $ | — | (e) | $ | 0.23 | $ | 0.23 | $ | — | $ | — | $ | — | $ | 2.61 | 9.69 | % | $554,764 | — | 0.55 | %(c) | 0.19 | %(c) | 69.10 | % | ||||||||||||||||||||
| 2006 |
2.53 | — | 0.18 | 0.18 | — | (0.33 | ) | (0.33 | ) | 2.38 | 6.68 | 528,612 | — | 0.55 | 0.08 | 82.48 | |||||||||||||||||||||||||||||||
| 2005 |
2.30 | — | 0.25 | 0.25 | — | (0.02 | ) | (0.02 | ) | 2.53 | 11.18 | 503,008 | — | 0.56 | (0.09 | ) | 69.50 | ||||||||||||||||||||||||||||||
| 2004 |
1.94 | (0.01 | ) | 0.37 | 0.36 | — | — | — | 2.30 | 18.80 | 442,420 | — | 0.57 | (0.30 | ) | 87.74 | |||||||||||||||||||||||||||||||
| 2003 |
1.46 | — | 0.48 | 0.48 | — | — | — | 1.94 | 33.06 | 366,612 | — | 0.59 | (0.35 | ) | 84.20 | ||||||||||||||||||||||||||||||||
| 2002 |
1.79 | — | (0.33 | ) | (0.33 | ) | — | — | — | 1.46 | (18.42 | ) | 254,880 | — | 0.60 | (0.26 | ) | 41.87 | |||||||||||||||||||||||||||||
| T. Rowe Price Small Cap Value Portfolio |
|
||||||||||||||||||||||||||||||||||||||||||||||
| (j)2007 |
$ | 1.84 | $ | 0.01 | $ | 0.13 | $ | 0.14 | $ | — | $ | — | $ | — | $ | 1.98 | 7.78 | % | $369,496 | 0.86 | %(c) | 0.86 | %(c) | 0.88 | %(c) | 11.11 | % | ||||||||||||||||||||
| 2006 |
1.64 | 0.01 | 0.26 | 0.27 | — | (0.07 | ) | (0.07 | ) | 1.84 | 16.55 | 324,973 | 0.86 | 0.86 | 0.66 | 21.70 | |||||||||||||||||||||||||||||||
| 2005 |
1.58 | 0.01 | 0.10 | 0.11 | (0.01 | ) | (0.04 | ) | (0.05 | ) | 1.64 | 7.21 | 245,041 | 0.87 | 0.87 | 0.63 | 17.74 | ||||||||||||||||||||||||||||||
| 2004 |
1.29 | 0.01 | 0.30 | 0.31 | — | (0.02 | ) | (0.02 | ) | 1.58 | 24.57 | 200,143 | 0.88 | 0.88 | 0.81 | 19.22 | |||||||||||||||||||||||||||||||
| 2003 |
0.95 | 0.01 | 0.33 | 0.34 | — | — | — | 1.29 | 35.15 | 121,944 | 0.90 | 0.90 | 0.65 | 33.78 | |||||||||||||||||||||||||||||||||
| 2002 |
1.02 | 0.01 | (0.07 | ) | (0.06 | ) | (0.01 | ) | — | (0.01 | ) | 0.95 | (5.58 | ) | 63,083 | 1.02 | 1.00 | 0.54 | 28.26 | ||||||||||||||||||||||||||||
| International Growth Portfolio |
|
||||||||||||||||||||||||||||||||||||||||||||||
| (j)2007 |
$ | 1.77 | $ | 0.02 | $ | 0.15 | $ | 0.17 | $ | — | $ | — | $ | — | $ | 1.94 | 9.97 | % | $324,196 | 0.80 | %(c) | 0.80 | %(c) | 1.84 | %(c) | 40.18 | % | ||||||||||||||||||||
| 2006 |
1.48 | 0.02 | 0.29 | 0.31 | — | (0.02 | ) | (0.02 | ) | 1.77 | 21.48 | 272,882 | 0.86 | 0.86 | 1.14 | 82.62 | |||||||||||||||||||||||||||||||
| 2005 |
1.32 | 0.01 | 0.23 | 0.24 | (0.01 | ) | (0.07 | ) | (0.08 | ) | 1.48 | 18.00 | 167,550 | 0.95 | 0.95 | 1.01 | 70.60 | ||||||||||||||||||||||||||||||
| 2004 |
1.09 | 0.01 | 0.23 | 0.24 | (0.01 | ) | — | (0.01 | ) | 1.32 | 21.59 | 110,498 | 0.98 | 0.98 | 0.81 | 70.84 | |||||||||||||||||||||||||||||||
| 2003 |
0.79 | 0.01 | 0.30 | 0.31 | (0.01 | ) | — | (0.01 | ) | 1.09 | 38.99 | 66,690 | 1.25 | 1.10 | 0.79 | 58.09 | |||||||||||||||||||||||||||||||
| 2002 |
0.91 | — | (0.12 | ) | (0.12 | ) | — | — | — | 0.79 | (12.34 | ) | 35,373 | 1.15 | 1.10 | 0.62 | 27.28 | ||||||||||||||||||||||||||||||
| Franklin Templeton International Equity Portfolio |
|
||||||||||||||||||||||||||||||||||||||||||||||
| (j)2007 |
$ | 2.33 | $ | 0.04 | $ | 0.30 | $ | 0.34 | $ | — | $ | — | $ | — | $ | 2.67 | 14.54 | % | $1,824,662 | 0.70 | %(c) | 0.63 | %(c) | 3.45 | %(c) | 5.28 | % | ||||||||||||||||||||
| 2006 |
1.81 | 0.05 | 0.51 | 0.56 | (0.04 | ) | — | (0.04 | ) | 2.33 | 30.90 | 1,556,230 | 0.71 | 0.70 | 2.53 | 12.15 | |||||||||||||||||||||||||||||||
| 2005 |
1.65 | 0.04 | 0.15 | 0.19 | (0.03 | ) | — | (0.03 | ) | 1.81 | 11.52 | 1,139,260 | 0.71 | 0.71 | 2.24 | 3.71 | |||||||||||||||||||||||||||||||
| 2004 |
1.41 | 0.03 | 0.24 | 0.27 | (0.03 | ) | — | (0.03 | ) | 1.65 | 19.33 | 980,977 | 0.72 | 0.72 | 2.23 | 18.65 | |||||||||||||||||||||||||||||||
| 2003 |
1.02 | 0.03 | 0.38 | 0.41 | (0.02 | ) | — | (0.02 | ) | 1.41 | 40.46 | 795,707 | 0.74 | 0.74 | 2.33 | 24.87 | |||||||||||||||||||||||||||||||
| 2002 |
1.26 | 0.02 | (0.24 | ) | (0.22 | ) | (0.02 | ) | — | (0.02 | ) | 1.02 | (17.40 | ) | 563,102 | 0.74 | 0.74 | 1.72 | 30.94 | ||||||||||||||||||||||||||||
| (b) |
For the period May 1, 2003 (commencement of operations) through December 31, 2003. |
| (c) |
Computed on an annualized basis. |
| (d) |
Total Return includes deductions for management and other fund expenses; excludes deductions for sales loads and account fees, not annualized for periods less than one year. |
| (e) |
Amount is less than $0.005. |
| (j) |
For the six months ended June 30, 2007. (Unaudited) |
The Accompanying Notes are an Integral Part of the Financial Statements.
Financial Highlights
107
Table of Contents
Financial Highlights, continued
(For a share outstanding throughout the period)
| Net Asset Value, Beginning of Period |
Net Invest- ment Income (Loss) |
Net Realized and Unrealized Gain (Loss) on Investments |
Total from Investment Operations |
Distributions from Net Investment Income |
Distributions From Realized Gains on Investments |
Total Distribu- tions |
Net Asset Value, End of Period |
Total Return(d) |
Net Assets, End of Period (thousands) |
Ratio of Gross Expenses to Average Net Assets |
Ratio of Net Expenses to Average Net Assets |
Ratio of Net Investment Income (Loss) to Average Net Assets |
Portfolio Turnover Rate |
|||||||||||||||||||||||||||||||||
| Money Market Portfolio |
|
|||||||||||||||||||||||||||||||||||||||||||||
| (j)2007 |
$ | 1.00 | $ | 0.02 | $ | — | $ | 0.02 | $ | (0.02 | ) | $ | — | $ | (0.02 | ) | $ | 1.00 | 2.52 | % | $419,545 | 0.30 | %(c) | 0.30 | %(c) | 5.04 | %(c) | — | % | |||||||||||||||||
| 2006 |
1.00 | 0.05 | — | 0.05 | (0.05 | ) | — | (0.05 | ) | 1.00 | 4.86 | 390,589 | 0.30 | 0.30 | 4.77 | — | ||||||||||||||||||||||||||||||
| 2005 |
1.00 | 0.03 | — | 0.03 | (0.03 | ) | — | (0.03 | ) | 1.00 | 2.98 | 339,858 | 0.30 | 0.30 | 2.94 | — | ||||||||||||||||||||||||||||||
| 2004 |
1.00 | 0.01 | — | 0.01 | (0.01 | ) | — | (0.01 | ) | 1.00 | 1.43 | 344,468 | 0.30 | 0.00 | 1.41 | — | ||||||||||||||||||||||||||||||
| 2003 |
1.00 | 0.01 | — | 0.01 | (0.01 | ) | — | (0.01 | ) | 1.00 | 1.23 | 399,873 | 0.30 | 0.00 | 1.23 | — | ||||||||||||||||||||||||||||||
| 2002 |
1.00 | 0.02 | — | 0.02 | (0.02 | ) | — | (0.02 | ) | 1.00 | 1.65 | 501,313 | 0.30 | 0.27 | 1.63 | — | ||||||||||||||||||||||||||||||
| Select Bond Portfolio |
|
|||||||||||||||||||||||||||||||||||||||||||||
| (j)2007 |
$ | 1.20 | $ | 0.03 | $ | (0.02 | ) | $ | 0.01 | $ | — | $ | — | $ | — | $ | 1.21 | 0.83 | % | $1,009,815 | — | 0.30 | %(c) | 5.18 | %(c) | 54.91 | %(g) | |||||||||||||||||||
| 2006 |
1.20 | 0.05 | — | 0.05 | (0.05 | ) | — | (0.05 | ) | 1.20 | 3.74 | 924,457 | — | 0.30 | 4.85 | 169.55 | (g) | |||||||||||||||||||||||||||||
| 2005 |
1.23 | 0.05 | (0.03 | ) | 0.02 | (0.04 | ) | (0.01 | ) | (0.05 | ) | 1.20 | 2.22 | 786,544 | — | 0.30 | 4.34 | 179.05 | (g) | |||||||||||||||||||||||||||
| 2004 |
1.26 | 0.05 | 0.01 | 0.06 | (0.05 | ) | (0.04 | ) | (0.09 | ) | 1.23 | 4.75 | 661,027 | — | 0.30 | 3.99 | 213.87 | |||||||||||||||||||||||||||||
| 2003 |
1.27 | 0.05 | 0.02 | 0.07 | (0.05 | ) | (0.03 | ) | (0.08 | ) | 1.26 | 5.49 | 621,325 | — | 0.30 | 4.03 | 137.05 | |||||||||||||||||||||||||||||
| 2002 |
1.20 | 0.05 | 0.09 | 0.14 | (0.06 | ) | (0.01 | ) | (0.07 | ) | 1.27 | 12.09 | 584,018 | — | 0.30 | 5.01 | 184.37 | |||||||||||||||||||||||||||||
| High Yield Bond Portfolio |
|
|||||||||||||||||||||||||||||||||||||||||||||
| (j)2007 |
$ | 0.73 | $ | 0.02 | $ | — | $ | 0.02 | $ | — | $ | — | $ | — | $ | 0.75 | 2.18 | % | $294,700 | — | 0.46 | %(c) | 7.19 | %(c) | 41.10 | % | ||||||||||||||||||||
| 2006 |
0.72 | 0.05 | 0.01 | 0.06 | (0.05 | ) | — | (0.05 | ) | 0.73 | 9.77 | 276,639 | — | 0.47 | 7.00 | 80.94 | ||||||||||||||||||||||||||||||
| 2005 |
0.76 | 0.05 | (0.04 | ) | 0.01 | (0.05 | ) | — | (0.05 | ) | 0.72 | 1.39 | 244,554 | — | 048 | 7.16 | 118.63 | |||||||||||||||||||||||||||||
| 2004 |
0.73 | 0.05 | 0.03 | 0.08 | (0.05 | ) | — | (0.05 | ) | 0.76 | 12.76 | 229,312 | — | 0.50 | 7.42 | 162.00 | ||||||||||||||||||||||||||||||
| 2003 |
0.56 | 0.05 | 0.12 | 0.17 | (0.00 | )(e) | — | (0.00 | )(e) | 0.73 | 29.06 | 199,371 | — | 0.52 | 8.66 | 182.10 | ||||||||||||||||||||||||||||||
| 2002 |
0.65 | 0.07 | (0.09 | ) | (0.02 | ) | (0.07 | ) | — | (0.07 | ) | 0.56 | (2.89 | ) | 137,553 | — | 0.54 | 10.37 | 89.20 | |||||||||||||||||||||||||||
| Balanced Portfolio |
|
|||||||||||||||||||||||||||||||||||||||||||||
| (j)2007 |
$ | 1.97 | $ | 0.04 | $ | 0.04 | $ | 0.08 | $ | — | $ | — | $ | — | $ | 2.05 | 3.85 | % | $2,957,168 | — | 0.30 | %(c) | 3.25 | %(c) | 68.06 | %(g) | ||||||||||||||||||||
| 2006 |
1.86 | 0.06 | 0.12 | 0.18 | (0.05 | ) | (0.02 | ) | (0.07 | ) | 1.97 | 10.42 | 2,949,632 | — | 0.30 | 3.11 | 70.12 | (g) | ||||||||||||||||||||||||||||
| 2005 |
1.87 | 0.05 | 0.02 | 0.07 | (0.05 | ) | (0.03 | ) | (0.08 | ) | 1.86 | 3.59 | 2,905,741 | — | 0.30 | 2.85 | 80.21 | (g) | ||||||||||||||||||||||||||||
| 2004 |
1.85 | 0.05 | 0.09 | 0.14 | (0.05 | ) | (0.07 | ) | (0.12 | ) | 1.87 | 7.89 | 2,983,179 | — | 0.30 | 2.71 | 100.02 | |||||||||||||||||||||||||||||
| 2003 |
1.62 | 0.05 | 0.24 | 0.29 | (0.06 | ) | — | (0.06 | ) | 1.85 | 17.99 | 2,891,488 | — | 0.30 | 2.74 | 69.56 | ||||||||||||||||||||||||||||||
| 2002 |
1.82 | 0.06 | (0.20 | ) | (0.14 | ) | (0.06 | ) | — | (0.06 | ) | 1.62 | (7.54 | ) | 2,561,529 | — | 0.30 | 3.08 | 53.12 | |||||||||||||||||||||||||||
| Asset Allocation Portfolio |
|
|||||||||||||||||||||||||||||||||||||||||||||
| (j)2007 |
$ | 1.22 | $ | 0.02 | $ | 0.05 | $ | 0.07 | $ | — | $ | — | $ | — | $ | 1.29 | 5.90 | % | $293,699 | 0.57 | %(c) | 0.55 | %(c) | 2.80 | %(c) | 42.81 | %(g) | |||||||||||||||||||
| 2006 |
1.16 | 0.03 | 0.08 | 0.11 | (0.02 | ) | (0.03 | ) | (0.05 | ) | 1.22 | 9.91 | 281,863 | 0.59 | 0.59 | 2.53 | 86.85 | (g) | ||||||||||||||||||||||||||||
| 2005 |
1.12 | 0.02 | 0.06 | 0.08 | (0.02 | ) | (0.02 | ) | (0.04 | ) | 1.16 | 6.99 | 244,807 | 0.61 | 0.61 | 2.18 | 90.04 | (g) | ||||||||||||||||||||||||||||
| 2004 |
1.02 | 0.02 | 0.08 | 0.10 | — | — | — | 1.12 | 10.02 | 196,568 | 0.64 | 0.64 | 1.90 | 116.65 | ||||||||||||||||||||||||||||||||
| 2003 |
0.86 | 0.02 | 0.16 | 0.18 | (0.02 | ) | — | (0.02 | ) | 1.02 | 20.63 | 130,478 | 0.73 | 0.73 | 1.83 | 103.77 | ||||||||||||||||||||||||||||||
| 2002 |
0.97 | 0.01 | (0.11 | ) | (0.10 | ) | (0.01 | ) | — | (0.01 | ) | 0.86 | (10.26 | ) | 87,260 | 0.87 | 0.75 | 2.18 | 112.73 | |||||||||||||||||||||||||||
| (c) |
Computed on an annualized basis. |
| (d) |
Total Return includes deductions for management and other fund expenses; excludes deductions for sales loads and account fees, not annualized for periods less than one year. |
| (e) |
Amount is less than $0.005. |
| (g) |
Portfolio Turnover rate excludes the impact of mortgage dollar roll transactions. |
| (j) |
For the six months ended June 30, 2007. (Unaudited) |
The Accompanying Notes are an Integral Part of the Financial Statements.
108
Financial Highlights
Table of Contents
Northwestern Mutual Series Fund, Inc.
June 30, 2007 (unaudited)
Note 1 — Northwestern Mutual Series Fund, Inc. (the “Series Fund”) is registered as a diversified open-end investment company under the Investment Company Act of 1940. The Series Fund consists of the Growth Stock Portfolio, Janus Capital Appreciation Portfolio, Large Cap Core Stock Portfolio, Index 500 Stock Portfolio, Capital Guardian Domestic Equity Portfolio, T. Rowe Price Equity Income Portfolio, Mid Cap Growth Stock Portfolio, Index 400 Stock Portfolio, AllianceBernstein Mid Cap Value Portfolio, Small Cap Growth Stock Portfolio, T. Rowe Price Small Cap Value Portfolio, International Growth Portfolio, Franklin Templeton International Equity Portfolio, Money Market Portfolio, Select Bond Portfolio, High Yield Bond Portfolio, Balanced Portfolio, and the Asset Allocation Portfolio (the “Portfolios”). Shares are presently offered only to The Northwestern Mutual Life Insurance Company (“Northwestern Mutual”) and its segregated asset accounts.
During the period ended June 30, 2007, Northwestern Mutual made redemptions totalling $24,000,000 from the AllianceBernstein Mid Cap Value Portfolio and $15,000,000 from the T. Rowe Price Equity Income Portfolio.
On April 30, 2007, the Aggressive Growth Stock Portfolio changed its name to the Mid Cap Growth Stock Portfolio.
Note 2 — The preparation of the financial statements in conformity with accounting principles generally accepted in the United States of America requires management to make estimates and assumptions that affect the reported amounts of assets and liabilities at the date of the financial statements and the reported amounts of revenues and expenses during the reporting period. Actual results could differ from those estimates.
On September 15, 2006, the Financial Accounting Standards Board issues Standard No. 157, “Fair Value Measurements” (“FAS 157”). FAS 157 addresses how companies should measure fair value when specified assets and liabilities are measured at fair value for either recognition or disclosure purposes under generally accepted accounting principles (GAAP). FAS 157 is intended to make the measurement of fair value more consistent and comparable and improve disclosures about those measures. FAS 157 is effective for financial statements issued for fiscal years beginning after November 15, 2007. At this time, management believes the adoption of FAS 157 will have no material impact on the financial statements of the Fund.
Principal accounting policies are summarized below.
Note 3 — Stocks listed on a national or foreign stock exchange are generally valued at the last sale price on theexchange on which the security is principally traded. Stocks listed on the NASDAQ Stock Market, Inc. (“NASDAQ”) for which a NASDAQ Official Closing Price (“NOCP”) is available are valued at the NOCP. If there has been no sale on such exchange or on NASDAQ, the security is valued at the final bid price. Stocks traded only in the over-the-counter market and not on a securities exchange or NASDAQ are valued at the last sale price or closing bid price if no sales have occurred. Bonds are valued on the basis of prices furnished by a service which determines prices for normal institutional-size trading units of bonds. Futures are valued at settlement prices. Non-exchange traded derivatives are normally valued on the basis of quotes obtained from brokers and dealers or pricing services. Securities for which current market quotations are not readily available are valued at fair value determined by procedures approved by the Board of Directors. The fair value procedures are used if a significant event that is likely to have affected the value of the securities takes place after the time of the most recent market quotations or the market quotations for other reasons do not reflect information material to the value of those securities. Generally, money market investments, other than in the Money Market Portfolio, with maturities exceeding sixty days are valued by marking to market on the basis of an average of the most recent bid prices or yields. Generally, money market investments with maturities of sixty days or less and all securities in the Money Market Portfolio are valued on an amortized cost basis or, if the current market value differs substantially from the amortized cost, by marking to market.
Note 4 — Certain of the Portfolios may have securities and other assets and liabilities denominated in foreign currencies which are translated into U.S. dollar amounts on the date of valuation. Purchases and sales of securities and income items denominated in foreign currencies are translated into U.S. dollar amounts on the respective dates of such transactions. When the Portfolios purchase or sell a foreign security they may enter into a foreign currency exchange contract to minimize market risk from the trade date to the settlement date of such transaction. Such foreign currency exchange contracts are marked to market daily.
The Portfolios may enter into forward foreign currency contracts to hedge against exchange rate risk arising from investments in securities denominated in foreign currencies or as part of an investment strategy. Contracts are valued at the contractual forward rate and are marked to market daily, with the change in market value recorded as an unrealized gain or loss. When the contracts are closed, a realized gain or loss is recorded. Risks may arise from changes in market value of the underlying instruments and from the possible inability of counterparties to meet the terms of their contracts.
Notes to Financial Statements
109
Table of Contents
Notes to Financial Statements
The Portfolios do not separately report the results of operations due to changes in foreign exchange rates on investments from the fluctuations arising from changes in market prices of securities held. Such fluctuations are included with the net realized or unrealized gain or loss from investments.
Net realized foreign exchange gains or losses arise from sales of foreign currencies, currency gains or losses realized between the trade date and the settlement date on security transactions, and the differences between the amounts of dividends and foreign withholding taxes recorded on the Portfolio's books and the U.S. dollar equivalent of the amounts actually received or paid.
Note 5 — Certain Portfolios invest in futures contracts as an alternative to investing in individual securities and could be exposed to market risk due to changes in the value of the underlying securities or due to an illiquid secondary market. Futures contracts are marked to market daily based upon quoted settlement prices. The Portfolios receive from or pay to brokers an amount of cash equal to the daily fluctuation in the value of the contracts. Such receipts or payments, known as the “variation margin”, are recorded by the Portfolios as unrealized gains or losses. When a contract is closed, the Portfolios record a realized gain or loss equal to the difference between the value of the contract at the time it was opened and the value at the time it was closed.
For federal income tax purposes, net unrealized appreciation (depreciation) on open futures contracts is generally required to be treated as realized gains (losses).
Note 6 — Certain Portfolios may invest in inflation-indexed bonds. Inflation-indexed bonds are fixed-income securities whose principal value is periodically adjusted to the rate of inflation. The interest rate on these bonds is generally fixed at issuance at a rate lower than typical bonds. Over the life of an inflation-indexed bond, however, interest will be paid based on a principal value, which is adjusted for inflation. Any increase in the principal amount of an inflation-indexed bond will be included as interest income in the Statements of Operations even though investors do not receive their principal until maturity.
Note 7 — The Select Bond and Balanced Portfolios have a securities lending program that enables each Portfolio to loan securities to approved broker-dealers. The Portfolio receives cash (U.S. currency), U.S. Government or U.S. Government agency obligations as collateral against the loaned securities. To the extent that a loan is collateralized by cash, such collateral shall be invested by the Portfolio to earn interest in accordance with the Portfolio’s investment policies. For the period ended June 30, 2007 the Select and Balanced Portfolios earned $182,758 and $180,227, respectively, in interest from securities lending activity. The collateral received under the securities lending program is recorded on the Portfolio’s statement of assets and liabilities along with the related obligation to return the collateral.
Income generated from the investment of cash collateral, less negotiated rebate fees paid to participating brokers and transaction costs, is recorded as income for the Portfolio. All collateral received will be in an amount at least equal to 102% (for loans of U.S. securities) or 105% (for non-U.S. securities) of the market value of the loaned securities at the inception of each loan. Thereafter, each loan must be continuously secured by collateral at least equal at all times to the value of the securities lent. In addition, the Portfolio is entitled to terminate a securities loan at any time. As of June 30, 2007, the value of outstanding securities on loan and the value of collateral amounted to the following:
| Portfolio |
Value of Securities on Loan |
Value of Collateral | ||||
| Select Bond |
$ | 48,340,750 | $ | 49,500,000 | ||
| Balanced |
$ | 51,828,770 | $ | 53,028,375 | ||
As of June 30, 2007, collateral received for securities on loan is invested in money market instruments and included in Investments on the Portfolio’s Statement of Assets and Liabilities.
Note 8 — Certain Portfolios may engage in swap transactions, including but not limited to, swap agreements on interest rate and total return to manage its exposure to interest rates and credit risk. In connection with these agreements, securities may be identified as collateral in accordance with the terms of the respective swap agreements.
Interest rate swap agreements involve the exchange by a Portfolio with another party of their respective commitments to pay or receive interest, e.g., an exchange of floating rate payments for fixed rate payments with respect to the notional amount of principal.
Total return swap agreements involve commitments to pay interest in exchange for a market-linked return, both based on notional amounts. To the extent the total return of the security or index underlying the transaction exceeds or falls short of the offsetting interest rate obligation, a Portfolio will receive a payment from or make a payment to the counterparty.
Swaps are marked to market daily based upon quotations from market makers and the change in value, if any, is recorded as unrealized gain or loss in the Statements of Operations. Payments received or made at the beginning of the measurement period are reflected as such on the Statements of Assets and Liabilities. These upfront payments are recorded as realized gain or loss in the Statements of Operations upon termination or maturity of the swap. A liquidation payment received or made at the termination of
110
Notes to Financial Statements
Table of Contents
Notes to Financial Statements
the swap is recorded as realized gain or loss in the Statements of Operations. Net periodic payments received by the Portfolios are included as part of realized gain (loss) on the Statements of Operations. Entering into these agreements involves, to varying degrees, elements of credit, market and documentation risk in excess of the amounts recognized on the Statements of Assets and Liabilities. Such risks involve the possibility that there will be no liquid market for these agreements, that the counterparty to the agreements may default on its obligation to perform or disagree as to the meaning of contractual terms in the agreements and that there may be unfavorable changes in interest rates.
Note 9 — Certain Portfolios may engage in securities transactions on a when-issued or delayed-delivery basis. In these transactions, the securities’ prices and yields are fixed on the date of the commitment, with payment and delivery scheduled for a future date. During this period, the securities are subject to market fluctuations. When delayed-delivery purchases are outstanding, a Portfolio will segregate liquid assets on their records in amounts sufficient to meet the purchase price. A Portfolio may dispose of or renegotiate a delayed delivery transaction, which may result in a capital gain or loss.
Note 10 — Interest income is recorded daily on the accrual basis and dividend income is recorded on the ex-dividend date or as soon as information from foreign issuers is available. Where applicable, dividends are recorded net of foreign dividend tax. Discounts and premiums on securities purchased are amortized over the life of the respective securities using the effective interest method. Securities transactions are accounted for on trade date. The basis for determining cost on sale of securities is identified cost. For the period ended June 30, 2007, transactions in securities other than money market investments were:
| Portfolio |
Total Security Purchases |
U.S. Govt. Security Purchases |
Total Security Sales/ Maturities |
U.S. Govt. Security Sales/ Maturities | ||||||||
| (Amounts in thousands) | ||||||||||||
| Growth Stock |
$ | 145,292 | $ | — | $ | 145,175 | $ | — | ||||
| Janus Capital Appreciation |
62,467 | — | 59,941 | — | ||||||||
| Large Cap Core Stock |
122,513 | — | 110,879 | — | ||||||||
| Index 500 Stock |
31,314 | — | 44,777 | — | ||||||||
| Capital Guardian Domestic Equity |
136,629 | — | 88,061 | — | ||||||||
| T. Rowe Price Equity Income |
55,515 | — | 31,179 | — | ||||||||
| Mid Cap Growth Stock |
549,047 | — | 576,266 | — | ||||||||
| Index 400 Stock (a) |
56,560 | — | 47,150 | — | ||||||||
| AllianceBernstein Mid Cap Value |
38,187 | — | 25,060 | — | ||||||||
| Small Cap Growth Stock |
344,714 | — | 340,877 | — | ||||||||
| T. Rowe Price Small Cap Value |
56,439 | — | 37,268 | — | ||||||||
| International Growth |
147,468 | — | 117,043 | — | ||||||||
| Franklin Templeton International |
127,972 | — | 83,995 | — | ||||||||
| Select Bond |
886,587 | 223,761 | 703,760 | 242,294 | ||||||||
| High Yield Bond |
129,470 | — | 113,047 | — | ||||||||
| Balanced (c) |
2,428,803 | 189,491 | 2,370,882 | 253,483 | ||||||||
| Asset Allocation |
140,373 | 21,574 | 117,046 | 26,887 | ||||||||
| (a) | Includes (in thousands) $165 of purchases and $16 of sales with affiliates |
| (c) | Includes (in thousands) $106,823 of purchases with affiliates |
Note 11 — The Series Fund and its Portfolios are parties to annually renewable contracts pursuant to which each Portfolio pays a charge for investment management and administrative services. Certain Portfolios, listed below, pay at a fixed annual rate based on the average daily net asset values of the Portfolio.
| Portfolio |
Fee | ||
| Index 500 Stock |
.20 | % | |
| Index 400 Stock |
.25 | % | |
| AllianceBernstein Mid Cap Value |
.85 | % | |
| T. Rowe Price Small Cap Value |
.85 | % | |
| Money Market |
.30 | % | |
| Select Bond |
.30 | % | |
| Balanced |
.30 | % |
For the other Portfolios the rate for the investment advisory fee is graded by the asset size of the Portfolio according to the following schedules:
| Portfolio |
First $50 Million |
Next $50 Million |
Excess | |||
| Growth Stock |
.60% | .50% | .40% | |||
| Large Cap Core Stock |
.60% | .50% | .40% | |||
| Mid Cap Growth Stock |
.80% | .65% | .50% | |||
| Small Cap Growth Stock |
.80% | .65% | .50% | |||
| Franklin Templeton International Equity |
.85% | .65% | .65% | |||
| High Yield Bond |
.60% | .50% | .40% | |||
| Portfolio |
First $100 Million |
Next $400 Million |
Excess | |||
| Janus Capital Appreciation |
.80% | .75% | .70% | |||
Notes to Financial Statements
111
Table of Contents
Notes to Financial Statements
| Portfolio |
First $100 Million |
Next $150 Million |
Excess | |||
| Capital Guardian Domestic Equity |
.65% | .55% | .50% | |||
| Portfolio |
First $500 Million |
Excess | ||||
| T. Rowe Price Equity Income |
.65% | .60% | ||||
Mason Street Advisors, LLC (“MSA”), a wholly owned subsidiary of Northwestern Mutual, which is the manager and investment adviser of the Series Fund, contractually agreed to waive the management fee and absorb certain other operating expenses to the extent necessary so that Total Operating Expenses will not exceed the following amounts:
| Portfolio |
Expiration | |||
| Janus Capital Appreciation |
0.90% | December 31, 2008 | ||
| Capital Guardian Domestic Equity |
0.75% | April 30, 2008 | ||
| T. Rowe Price Equity Income |
0.75% | December 31, 2008 | ||
| AllianceBernstein Mid Cap Value |
1.00% | December 31, 2008 | ||
| T. Rowe Price Small Cap Value |
1.00% | April 30, 2008 | ||
| International Growth |
1.10% | April 30, 2008 | ||
| Asset Allocation |
0.75% | April 30, 2008 |
With respect to the Franklin Templeton International Equity Portfolio, MSA has agreed to waive its management fee effective November 15, 2006, such that its management fee is 0.80% (80 basis points) on the Portfolio's first $50 million of assets, 0.60% (60 basis points) on Portfolio assets from $50 million to $1 billion, 0.58% (58 basis points) on assets from $1 billion to $1.5 billion, and 0.51% (51 basis points) on Portfolio assets in excess of $1.5 billion (the latter waiver was added effective December 12, 2006). MSA's fee waiver agreement extends at least until April 30, 2008.
With respect to the Asset Allocation Portfolio, MSA has agreed to waive its management fee such that its management fee is 0.55% on the Portfolio’s first $100 million of assets, 0.45% on the Portfolio’s assets from $100 million to $250 million, and 0.35% on assets in excess of $250 million. MSA’s fee waiver agreement extends at least until April 30, 2008. In addition, MSA has entered into a written expense limitation agreement under which it has agreed to limit the total expenses of the Portfolio (excluding interest, taxes, brokerage and extraordinary expenses) to an annual rate of 0.75% of the Portfolio’s average net assets until April 30, 2008. This fee waiver may be terminated at any time after April 30, 2008.
The investment advisory fee is paid to MSA. Other costs for each Portfolio are paid either by the Portfolios or MSA depending upon the applicable agreement in place.
All of the Portfolios, except for the Balanced, Select Bond and Money Market Portfolios, pay their own custodian fees. Certain Portfolios, listed below, pay a portion of their custodian fees indirectly through expense offset arrangements. Custodian fees are reduced for Portfolios that maintain compensating balances in non-interest bearing accounts. These Portfolios could have invested the assets used to pay for the custodian fees, had the assets not been used in the expense offset arrangements. For the period ended June 30, 2007, the amounts paid through expense offset arrangements were as follows:
| Portfolio |
Amount | ||
| Growth Stock |
$ | 1,328 | |
| Janus Capital Appreciation |
1,821 | ||
| Large Cap Core Stock |
1,293 | ||
| Index 500 Stock |
2,930 | ||
| Capital Guardian Domestic Equity |
4,023 | ||
| T. Rowe Price Equity Income |
1,202 | ||
| Mid Cap Growth Stock |
1,313 | ||
| Index 400 Stock |
3,612 | ||
| AllianceBernstein Mid Cap Value |
1,103 | ||
| Small Cap Growth Stock |
1,385 | ||
| T. Rowe Price Small Cap Value |
2,355 | ||
| High Yield Bond |
2,132 | ||
| Asset Allocation |
2,179 | ||
Janus Capital Management, LLC (“Janus Capital”), Capital Guardian Trust Company (“Capital Guardian”), American Century Investment Management, Inc. (“American Century”), T. Rowe Price Associates, Inc. (“T. Rowe Price”), Alliance Capital Management L.P., (“Alliance Capital Management”), Templeton Investment Counsel, LLC. (“Templeton Counsel”), have been retained under investment subadvisory agreements to provide investment advice and, in general, to conduct the management investment programs of the Janus Capital Appreciation Portfolio, Capital Guardian Domestic Equity Portfolio, T. Rowe Price Equity Income and T. Rowe Price Small Cap Value Portfolios, AllianceBernstein Mid Cap Value Portfolio, the Franklin Templeton International Equity Portfolio, respectively. MSA pays Janus Capital .55% on the first $100 million of the Portfolio’s assets, .50% on the next $400 million, and .45% on assets in excess of $500 million. For the Capital Guardian Domestic Equity Portfolio, MSA pays Capital Guardian a flat annual fee of $375,000 on the Portfolio’s assets of $100 million or less and .275% on net assets in excess of $100 million. For the T. Rowe Price Equity Income Portfolio, MSA pays T. Rowe Price .40% on the first $250 million of the Portfolio’s assets, .375% on the next $250 million, and .35% on assets in excess of $500 million. MSA pays T. Rowe Price an annual rate of .60% of the T. Rowe Price Small Cap Value Portfolio’s average daily net assets. MSA pays Alliance Capital Management .72% on the first $25 million of the Portfolio’s assets, .54% on the next $225 million, and .50% on assets in excess of $250 million, with a minimum amount of $16,000. Effective November 15, 2006, MSA pays Templeton Counsel .50% on the first $100 million of combined net assets for all funds managed for Northwestern Mutual by Templeton Counsel, .35% on the next $50 million, .30% on the next $350 million, .25% on the next $500, .20% on the next $500 million and .15% in excess of $1.5 billion.
112
Notes to Financial Statements
Table of Contents
Notes to Financial Statements
Note 12 — Each of the Portfolios of the Series Fund has elected to be taxed as a regulated investment company meeting certain requirements under the Internal Revenue Code. Since each expects to distribute all net investment income and net realized capital gains, the Portfolios anticipate incurring no federal income taxes.
Taxable distributions from net investment income and realized capital gains in the Portfolios may differ from book amounts earned during the period due to differences in the timing of capital gains recognition and due to the reclassification of certain gains or losses between capital and income. The differences between cost amounts for book purposes and tax purposes are primarily due to treatment of deferred losses.
It is the policy of the Portfolios to reclassify the net effect of permanent differences between book and taxable income to capital accounts on the Statements of Assets and Liabilities.
Certain losses incurred by the Portfolios after October 31st are deferred and deemed to have occurred in the next fiscal year for income tax purposes. Net realized capital losses for federal income tax purposes are carried forward to offset future net realized gains. A summary of the Portfolios’ post-October losses and capital loss carryovers as of December 31, 2006 is provided below:
| Post-October Losses |
||||||||||||||
| Capital Loss Carryovers | ||||||||||||||
| Portfolio |
Capital | Foreign Currency |
Amount | Expiration | Utilized in 2006 | |||||||||
| (Amounts in Thousands) | ||||||||||||||
| Growth Stock |
$ | — | $ | — | $ | 9,516 | 2010 | $ | 46,599 | |||||
| Janus Capital Appreciation |
— | — | — | — | — | |||||||||
| Large Cap Core Stock |
— | — | 127,109 | 2009-2012 | 34,806 | |||||||||
| Index 500 Stock |
— | — | — | — | — | |||||||||
| Capital Guardian Domestic Equity |
— | — | — | — | — | |||||||||
| T. Rowe Price Equity Income |
— | — | — | — | — | |||||||||
| Mid Cap Growth Stock |
— | — | — | — | — | |||||||||
| Index 400 Stock |
— | — | — | — | — | |||||||||
| AllianceBernstein Mid Cap Value |
— | — | — | — | — | |||||||||
| Small Cap Growth Stock |
— | — | — | — | — | |||||||||
| T. Rowe Price Small Cap Value |
— | — | — | — | — | |||||||||
| International Growth |
— | 3 | — | — | 597 | |||||||||
| Franklin Templeton International Equity |
— | — | — | — | 51,116 | |||||||||
| Money Market |
— | — | 13 | 2010 -2014 | — | |||||||||
| Select Bond |
273 | — | 19,819 | 2013 -2014 | — | |||||||||
| High Yield Bond |
43 | — | 66,473 | 2007 -2013 | — | |||||||||
| Balanced |
— | — | — | — | — | |||||||||
| Asset Allocation |
— | — | — | — | — | |||||||||
Note 13 — Dividends from net investment income and net realized capital gains are declared each business day for the Money Market Portfolio and at least annually for the remaining portfolios of the Series Fund when applicable.
Note 14 — Northwestern Mutual voluntarily reimburses foreign equity portfolios for the benefit Northwestern Mutual receives from foreign dividend taxes charged against the Portfolios. The amounts reimbursed represent approximately 65% of the foreign dividend taxes withheld from the Portfolios. Reimbursements are recorded when foreign dividend taxes are accrued. Voluntary reimbursements for the period ended June 30, 2007 and the year ended December 31, 2006 are summarized below:
| Portfolio |
2007 Reimbursements |
2006 Reimbursements | ||||
| International Growth |
$ | 289,556 | $ | 253,538 | ||
| Franklin Templeton International Equity |
2,511,810 | 2,840,171 | ||||
Notes to Financial Statements
113
Table of Contents
Notes to Financial Statements
Note 15 — Distributions to Shareholders
When applicable, each of the Portfolios made distributions during the year of ordinary income and long-term capital gains. Distributions for 2007 will be paid in August 2007. The tax character of distributions paid for the period ended December 31, 2006 is as follows:
| 2006 Distributions Paid From: | ||||||
| Portfolio |
Ordinary Income |
Long-term Capital Gain | ||||
| (Amounts in Thousands) | ||||||
| Growth Stock |
$ | 5.333 | $ | — | ||
| Janus Capital Appreciation |
514 | 6,622 | ||||
| Large Cap Core Stock |
5,437 | — | ||||
| Index 500 Stock |
31,371 | 69,507 | ||||
| Capital Guardian Domestic Equity |
1,088 | 2,506 | ||||
| T. Rowe Price Equity Income |
3,539 | 3,806 | ||||
| Mid Cap Growth Stock |
1,541 | 28,368 | ||||
| Index 400 Stock |
7,914 | 29,514 | ||||
| AllianceBernstein Mid Cap Value |
1.411 | 8,997 | ||||
| Small Cap Growth Stock |
2,905 | 64,047 | ||||
| T. Rowe Price Small Cap Value |
1,593 | 9,368 | ||||
| International Growth |
451 | 3,118 | ||||
| Franklin Templeton International Equity |
22,771 | — | ||||
| Money Market |
17,568 | — | ||||
| Select Bond |
31,072 | — | ||||
| High Yield Bond |
16,968 | — | ||||
| Balanced |
85,455 | 28,598 | ||||
| Asset Allocation |
4,818 | 6,398 | ||||
As of December 31 2006, the tax basis amounts were as follows:
| Portfolio |
Undistributed Ordinary Income |
Undistributed Long-term Gains |
Accumulated Losses |
Unrealized Appreciation (Depreciation) | |||||||||
| (Amounts in Thousands) | |||||||||||||
| Growth Stock |
$ | 6,654 | $ | — | $ | (9,516 | ) | $ | 133,419 | ||||
| Janus Capital Appreciation |
6 | 234 | — | 24,506 | |||||||||
| Large Cap Core Stock |
6.345 | — | (127,109 | ) | 111,431 | ||||||||
| Index 500 Stock |
37,782 | 76.78 | — | 644,597 | |||||||||
| Capital Guardian Domestic Equity |
10,842 | 15.394 | — | 58,086 | |||||||||
| T. Rowe Price Equity Income |
116 | 1.691 | — | 31,950 | |||||||||
| Mid Cap Growth Stock |
9.438 | 106,812 | — | 121,394 | |||||||||
| Index 400 Stock |
8.655 | 29,670 | — | 102,602 | |||||||||
| AllianceBernstein Mid Cap Value |
793 | 1,272 | — | 17,188 | |||||||||
| Small Cap Growth Stock |
3,407 | 45.726 | — | 58,653 | |||||||||
| T. Rowe Price Small Cap Value |
4,490 | 15.138 | — | 77,441 | |||||||||
| International Growth |
2.564 | 24,187 | 3 | 54,913 | |||||||||
| Franklin Templeton International Equity |
33,162 | 21.645 | — | 557,328 | |||||||||
| Money Market |
— | — | — | — | |||||||||
| Select Bond |
40,738 | — | (20,092 | ) | 6,214 | ||||||||
| High Yield Bond |
17,973 | — | (66,516 | ) | 4,910 | ||||||||
| Balanced |
89,339 | 52,593 | — | 798,844 | |||||||||
| Asset Allocation |
7,591 | 12.906 | — | 30,563 | |||||||||
Note 16 — Guarantees
In the normal course of business the Portfolios enter into contracts that contain a variety of representations which provide general indemnifications. The Portfolios’ maximum exposure under these arrangements is unknown as this would involve future claims that may be made against the Portfolios that have not yet occurred. However, the Portfolios expect the risk of loss to be remote.
114
Notes to Financial Statements
Table of Contents
Proxy Voting and Portfolio Holdings
Proxy Voting Guidelines
A description of the policies and procedures that the Fund uses to determine how to vote proxies relating to portfolio securities is available without charge, upon request, by calling toll free 1-888-455-2232. It is also available on the Securities and Exchange Commission’s website at http://www.sec.gov.
Information regarding how the fund voted proxies relating to portfolio securities during the most recent twelve-month period ended June 30 is available without charge, upon request, by calling toll free 1-888-455-2232. It is also available on the Securities and Exchange Commission’s website at http://www.sec.gov.
Quarterly Filing of Portfolio Holdings
The Fund files its complete schedule of portfolio holdings with the Commission for the first and third quarters of each fiscal year on Form N-Q. The Fund’s Form N-Q filings are available (i) on the Commission’s website at http://www.sec.gov and (ii) at the Commission’s Public Reference Room.
Proxy Voting and Portfolio Holdings
115
Table of Contents
Special Meeting of Shareholders (Unaudited)
A Special Meeting of Shareholders of Northwestern Mutual Series Fund, Inc. (“NMSF”) was held on February 20, 2007. All of the outstanding shares of NMSF are held by The Northwestern Mutual Life Insurance Company (“Northwestern Mutual”) and therefore, Northwestern Mutual is the only shareholder of NMSF. Northwestern Mutual holds these shares for its general account and for its separate investment accounts used for its variable annuity contracts and variable life policies. Northwestern Mutual voted the outstanding shares allocated to the variable accounts in accordance with the instructions received from variable annuity contract or variable life insurance policy. Shares of each Portfolio of NMSF as to which no timely instructions were received were voted by Northwestern Mutual in proportion to the instructions from those contract and policy owners and payees who furnished timely instructions with respect to shares of that Portfolio. Northwestern Mutual also voted the shares of each Portfolio held in its general account in the same proportion as it voted the rest of the shares. The results of the shareholders’ vote on the proposals are as follows:
Proposal 1 — To elect six Directors to Northwestern Mutual Series Fund’s Board of Directors.
(Under Maryland law, the nominees for director receiving the vote of a plurality of the outstanding voting shares of NMSF cast at a shareholders meeting will be elected.)
| Director Name | Votes For | Votes Withheld | Total Votes | |||
| Miriam M. Allison |
6,941,574,354.464 | 173,219,554.170 | 7,114,793,908.634 | |||
| William A. McIntosh |
6,936,844,394.274 | 177,949,514.360 | 7,114,793,908.634 | |||
| Michael G. Smith |
6,949,147,082.920 | 165,646,825.714 | 7,114,793,908.634 | |||
| Robert H. Huffmann III |
6,947,757,388.702 | 173,036,519.932 | 7,114,793,908.634 | |||
| Michael M. Knetter |
6,946,567,148.624 | 168,226,760.010 | 7,114,793,908.634 | |||
| Edward J. Zore |
6,943,272,826.802 | 171,521,081.832 | 7,114,793,908.634 |
Proposal 2 — Approval to enter into and materially amend agreements with investment sub-advisors on behalf of one or more of the portfolios without obtaining shareholder approval.
(Each Portfolio voted on this Proposal separately.)
| Portfolio Name | Votes For | Votes Against | Votes Abstained |
Total Votes | ||||
| Small Cap Growth Stock |
205,696,277.269 | 12,236,034.030 | 5,028,226.448 | 222,960,537.747 | ||||
| T. Rowe Price Small Cap Value |
160,179,370.847 | 10,755,868.468 | 3,702,513.550 | 174,637,752.865 | ||||
| Aggressive Growth Stock |
324,195,600.467 | 19,551,191.237 | 10,960,711.173 | 354,707,502.877 | ||||
| International Growth |
142,823,557.773 | 7,560,629.399 | 2,944,600.272 | 153,328,787.444 | ||||
| Franklin Templeton International Equity |
616,672,972.483 | 30,018,227.854 | 17,544,141.936 | 664,235,342.273 | ||||
| AllianceBernstein Mid Cap Value |
73,149,794.374 | 4,459,050.749 | 1,567,880.331 | 79,176,725.454 | ||||
| Index 400 Stock |
313,994,332.328 | 15,973,167.305 | 7,657,823.978 | 337,625,323.611 | ||||
| Janus Capital Appreciation |
74,803,595.077 | 4,466,598.601 | 1,368,053.555 | 80,638,247.233 | ||||
| Growth Stock |
290,359,202.921 | 20,703,314.394 | 10,176,643.955 | 321,239,161.270 | ||||
| Large Cap Core Stock |
365,138,542.695 | 17,545,911.849 | 15,460,625.303 | 398,145,079.847 | ||||
| Capital Guardian Domestic Equity |
285,770,445.295 | 17,221,622.154 | 4,970,374.099 | 307,962,441.548 | ||||
| T. Rowe Price Equity Income |
116,963,407.365 | 4,202,612.602 | 2,359,431.779 | 123,525,451.746 | ||||
| Index 500 Stock |
585,793,560.778 | 32,078,249.461 | 21,919,994.902 | 639,791,805.141 | ||||
| Asset Allocation |
219,038,236.144 | 7,541,873.108 | 4,675,335.791 | 231,255,445.043 | ||||
| Balanced |
1,384,950,479.290 | 67,965,630.254 | 51,051,296.210 | 1,503,967,405.754 | ||||
| High Yield Bond |
351,139,699.597 | 15,948,076.106 | 7,888,506.473 | 374,976,282.176 | ||||
| Select Bond |
715,455,599.700 | 31,131,980.741 | 13,800,108.944 | 760,387,689.385 | ||||
| Money Market |
356,171,943.481 | 22,925,585.963 | 7,135,397.776 | 386,232,927.220 |
116
Special Meeting of Shareholders
Table of Contents
Special Meeting of Shareholders
Proposal 3 — To approve an amendment to the Investment Advisory Agreement with Mason Street Advisors, LLC.
(Each Portfolio voted on this Proposal separately.)
| Portfolio Name | Votes For | Votes Against | Votes Abstained |
Total Votes | ||||
| Small Cap Growth Stock |
208,599,122.908 | 8,868,557.595 | 5,492,857.244 | 222,960,537.747 | ||||
| T. Rowe Small Cap Value |
161,254,955.879 | 9,218,526.093 | 4,164,270.893 | 174,637,752.865 | ||||
| Aggressive Growth Stock |
326,296,660.588 | 16,472,000.330 | 11,938,841.959 | 354,707,502.877 | ||||
| International Growth |
144,448,554.074 | 4,900,708.653 | 3,979,524.717 | 153,328,787.444 | ||||
| Franklin Templeton International Equity |
621,332,354.521 | 24,116,259.116 | 18,786,728.636 | 664,235,342.273 | ||||
| AllianceBernstein Mid cap Value |
73,584,505.617 | 3,995,910.893 | 1,596,308.944 | 79,176,725.454 | ||||
| Index 400 Stock |
315,952,390.685 | 13,424,090.023 | 8,248,842.903 | 337,625,323.611 | ||||
| Janus Capital Appreciation |
75,492,335.676 | 3,463,824.051 | 1,682,087.506 | 80,638,247.233 | ||||
| Growth Stock |
294,082,965.956 | 11,423,764.418 | 15,732,430.896 | 321,239,161.270 | ||||
| Large Cap Core Stock |
368,006,744.919 | 13,936,274.959 | 16,202,059.969 | 398,145,079.847 | ||||
| Capital Guardian Domestic Equity |
287,441,201.414 | 14,101,638.328 | 6,419,601.806 | 307,962,441.548w | ||||
| T. Rowe Price Equity Income |
118,081,905.366 | 2,777,761.152 | 2,665,785.228 | 123,525,451.746 | ||||
| Index 500 Stock |
591,934,502.233 | 25,557,802.693 | 22,299,500.215 | 639,791,805.141 | ||||
| Asset Allocation |
220,366,028.431 | 5,477,369.847 | 5,412,046.765 | 231,255,445.043 | ||||
| Balanced |
1,395,427,488.548 | 56,530,246.902 | 52,009,670.304 | 1,503,967,405.754 | ||||
| High Yield Bond |
352,642,144.705 | 13,463,913.296 | 8,870,224.175 | 374,976,282.176 | ||||
| Select Bond |
719,574,265.813 | 23,493,737.866 | 17,319,685.706 | 760,387,689.385 | ||||
| Money Market |
358,183,155.577 | 19,834,706.741 | 8,215,064.902 | 386,232,927.220 |
Proposal 4 — To approve an amendment to a component of the investment objective of the Balanced Portfolio.
(Only shareholders of the Balanced Portfolio voted on this Proposal.)
| Votes For | Votes Against | Votes Abstain | Total Votes | |||
| 1,393,090,531.408 |
58,981,971.032 | 51,894,903.314 | 1,503,967,405.754 |
Special Meeting of Shareholders
117
Table of Contents
Director and Officer Information (Unaudited)
Northwestern Mutual Series Fund, Inc.
The name, age and address of the directors, as well as their affiliations, positions held with the Fund, principal occupations during the past five years and the number of portfolios overseen in the Northwestern Mutual fund complex, are shown below as of June 30, 2007. Each director (whenever elected) shall hold office until the next annual meeting of shareholders and until his or her successor is elected and qualifies or until his or her earlier death, resignation or removal, provided no director shall serve a term or successive terms totaling more than twelve (12) years. The twelve-year service limitation commences for all directors on the later of May 1, 2003, or the date of his or her election or appointment to the Board. The statement of additional information contains additional information about Fund directors and is available without charge, upon request, by calling 1-888-627-6678.
| Independent Directors | ||||||||
| Name, Address, and Year of Birth |
Position | Length of Time Served | Number of Portfolios in Fund Complex Overseen by Director |
Other Directorships Held | ||||
| William A. McIntosh 720 East Wisconsin Avenue Milwaukee, WI 53202 1939 |
Director | Since 1997 | 27 | MGIC Investment Corporation | ||||
| Principal Occupation During Past 5 Years: Financial consulting. Adjunct Faculty Member, Howard University (1998-2004) | ||||||||
| Michael G. Smith 720 East Wisconsin Avenue Milwaukee, WI 53202 1944 |
Director | Since 2003 | 27 | Trustee of Ivy Fund (26 portfolios) | ||||
| Principal Occupation During Past 5 Years: Private investor; retired since 1999 | ||||||||
| Miriam M. Allison 720 East Wisconsin Avenue Milwaukee, WI 53202 1947 |
Director | Since 2006 | 27 | None | ||||
| Principal Occupation During Past 5 Years: Rancher since 2004. Real estate developer since 2002. From 2001 to 2005, Chairman of UMB Fund Services, Inc. (formerly Sunstone Financial Group, Inc.), a mutual fund service provider. | ||||||||
| Robert H. Huffman III 720 East Wisconsin Avenue Milwaukee, WI 53202 1959 |
Director | Since 2007 | 27 | None | ||||
| Principal Occupation During Past 5 Years: Co-Founder and Managing Partner of Relative Value Partners, LLC, a registered investment adviser; prior thereto, Head of Fixed Income Sales, Midwest Region, Citigroup, Inc. (formerly Salomon Brothers). | ||||||||
| Michael M. Knetter 720 East Wisconsin Avenue Milwaukee, WI 53202 1960 |
Director | Since 2007 | 27 | Wausau Paper Corp. and Great Wolf Resorts, Inc. | ||||
| Dean of University of Wisconsin-Madison School of Business since 2002. Prior thereto, Associate Dean of the MBA Program and Professor of International Economics for the Amos Tuck School of Business at Dartmouth College. | ||||||||
118
Director and Officer Information
Table of Contents
Director and Officer Information (Unaudited)
Northwestern Mutual Series Fund, Inc.
| Other Directors | ||||||||
| Name, Address, and Year of Birth |
Position | Length of Time Served | Number of Portfolios in Fund Complex Overseen by Director |
Other Directorships Held | ||||
| Edward J. Zore 720 East Wisconsin Avenue Milwaukee, WI 53202 1945 |
Chairman and Director | Since 2000 | 27 | Manpower, Inc.; Trustee of Northwestern Mutual | ||||
| Principal Occupation During Past 5 Years: President and Chief Executive Officer of Northwestern Mutual since 2001; President, 2000-2001 | ||||||||
Executive Officers
| Name, Address, and Year of Birth | Position | Length of Time Served | ||
| Mark G. Doll 720 East Wisconsin Avenue Milwaukee, WI 53202 1949 |
President | Since 2003 | ||
| Principal Occupation During Past 5 Years: Senior Vice President of Northwestern Mutual; President and Director of Mason Street Advisors, LLC since 2002; Vice President and Assistant Treasurer — Public Markets of Northwestern Investment Management Company, LLC from 1998 to 2001 | ||||
| Walter M. Givler 720 East Wisconsin Avenue Milwaukee, WI 53202 1957 |
Vice President; Chief Financial Officer & Treasurer |
Since 2003 | ||
| Principal Occupation During Past 5 Years: Vice President of Investment Accounting for Northwestern Mutual since 2002; Vice President and Associate Controller 2002; Associate Controller from 2001-2002; prior thereto, Director of New Business, Large Case Division | ||||
| Kate M. Fleming 720 East Wisconsin Avenue Milwaukee, WI 53202 1962 |
Vice President — Operations | Since 2004 | ||
| Principal Occupation During Past 5 Years: Vice President — Operations of Mason Street Advisors, LLC since 2004. Prior thereto, Assistant General Counsel of Northwestern Mutual | ||||
| Barbara E. Courtney 720 East Wisconsin Avenue Milwaukee, WI 53202 1957 |
Controller | Since 1996 | ||
| Principal Occupation During Past 5 Years: Director of Mutual Fund Accounting of Northwestern Mutual since 2002; prior thereto Associate Director | ||||
| Michael W. Zielinski 720 East Wisconsin Avenue Milwaukee, WI 53202 1974 |
Chief Compliance Officer | Since 2006 | ||
| Principal Occupation During Past 5 Years: Chief Compliance Officer of Mason Street Advisors, LLC since 2006; Counsel, Northwestern Mutual from 2004-2006; Associate Counsel, Quasar Distributors, LLC (broker-dealer) from 2003 to 2004; Legal Compliance Officer, US Bancorp Fund Services, LLC (mutual fund service provider) from 2001 to 2003 | ||||
| Randy M. Pavlick 720 East Wisconsin Avenue Milwaukee, WI 53202 1959 |
Secretary | Since 2006 | ||
| Principal Occupation During Past 5 Years: Assistant General Counsel of Northwestern Mutual and Assistant Secretary of Mason Street Advisors, LLC, each since 2004; prior thereto, Vice President and General Counsel of UMB Fund Services, Inc. (formerly Sunstone Financial Group, Inc.) (mutual fund service provider) from 1993 to 2004 | ||||
Director and Officer Information
119
Table of Contents
Approval and Continuance of Investment Advisory and Sub-Advisory Agreements
Northwestern Mutual Series Fund, Inc.
At its February 2007 meeting, the Board of Directors, including the Independent Directors, of the Northwestern Mutual Series Fund, Inc. (the “Series Fund”) unanimously approved the continuance of the Investment Advisory Agreement between the Series Fund and MSA relating to the Series Fund’s existing portfolios (the “Advisory Agreement”). At its May 2007 meeting, the Board of Directors, including the Independent Directors, of the Series Fund unanimously approved the continuance of the Investment Sub-Advisory Agreements between MSA and the sub-advisors of certain of the Series Fund’s existing portfolios (the “Sub-Advisory Agreements”). Each portfolio of the Series Fund is referred to as a “Portfolio” and collectively as the “Portfolios.”
In determining whether to approve the continuance of the Advisory Agreement and the Sub-Advisory Agreements on behalf of the Series Fund, the directors requested and received detailed information from MSA and the sub-advisors to assist them in their evaluation. While particular focus is given to an evaluation of the services, performance, fees, costs, and certain other relevant information under such Agreements at the meeting at which their continuation is formally considered, the evaluation process with respect to MSA and the sub-advisors and the nature, extent and quality of the services they provide the Portfolios, and the related performance, costs and expenses, is an ongoing one. As a result, the directors’ consideration of the nature, extent and quality of services, and the performance, costs and expenses, included deliberations at other meetings in addition to the annual renewal meeting.
The Independent Directors also received a memorandum from their counsel advising the directors of their responsibilities in connection with the renewal of the Advisory and Sub-Advisory Agreements, and summarizing the legal standards governing the review of these Agreements. In addition, during the course of their deliberations, the Independent Directors had the opportunity to meet privately without representatives of MSA and the sub-advisors present, and were represented throughout the process by legal counsel to the Independent Directors and the Series Fund.
At the February 2007 meeting with respect to the Advisory Agreement, and at the May 2007 meeting with respect to the Sub-Advisory Agreements, the directors, including all of the Independent Directors voting separately, determined that the terms of these Agreements were fair and reasonable, and approved them for one-year periods as being in the best interest of the respective Portfolios and their shareholders. The material factors and conclusions that formed the basis for these approvals include those discussed below.
Continuation of the Investment Advisory Agreement Between the Series Fund and MSA With Respect to the Portfolios
The material factors and conclusions that formed the basis for the Board’s determination at its February 2007 meeting to approve the continuance of the Advisory Agreement with respect to each the Portfolios include those discussed below. In addition to the information provided to them throughout the year, the directors considered their experience with and knowledge of the nature and quality of services provided by MSA to the Portfolios and their interactions with representatives of MSA and its affiliates. The directors evaluated the information they deemed relevant on a Portfolio by Portfolio basis. No one particular factor was identified as controlling, but rather it was a combination of all the factors and conclusions that formed the basis for the determinations made by the directors.
Nature, Extent and Quality of Services. In considering the nature, extent and quality of MSA’s services, factors considered by the directors included MSA’s investment personnel, the experience of the portfolio managers of the Portfolios, proposed changes in portfolio managers for certain of the Portfolios, and additions to the professional and compliance personnel overseeing the Portfolios. The directors also considered the scope of the services provided by MSA, MSA’s experience, and the performance of the Portfolios. The directors recognized that in addition to the investment advisory services provided by MSA, MSA and its affiliates provide certain other services necessary for the operation of the Portfolios and the servicing of the beneficial owners of shares of the Series Fund. Based on their review of these factors and their experience with MSA’s services for the Portfolios, the directors concluded that they were satisfied with the nature, extent and quality of services provided by MSA with respect to each Portfolio, and the resources committed by MSA in providing those services.
Investment Performance. The directors considered the investment performance of each of the Portfolios over a variety of periods. In addition to absolute performance for each Portfolio for both short and long-term periods, the directors considered (i) a comparison of each Portfolio’s one-, three- and five-year performance to the returns of appropriate peer groups created by an independent research firm, certain benchmarks and indices, and to the performance averages of each Portfolio’s respective Morningstar and Lipper categories for the same periods, (ii) the Morningstar overall star rating for each Portfolio, and (iii) the Morningstar and the Lipper rankings for the one-, three- and five-year periods. The directors evaluated each Portfolio’s
120
Approval and Continuance of Investment Advisory and Sub-Advisory Agreements
Table of Contents
Approval and Continuance of Investment Advisory and Sub-Advisory Agreements
Northwestern Mutual Series Fund, Inc.
performance against these peer groups and industry benchmarks and indices, and considered independent rankings and ratings, to provide an objective comparative benchmark against which they could assess the performance of the Portfolios. The directors were also presented with information from the portfolio managers regarding the relevant market and the factors resulting in the performance of each Portfolio. In addition to performance information presented at the meeting, the directors considered the detailed performance information, market commentary, portfolio analysis and portfolio manager presentations they received periodically throughout the year. Generally speaking, the directors provided greater weight to longer-term performance.
The directors noted that all of the Portfolios (other than four Portfolios) were in the top three quintiles of their respective performance universes (i.e. all funds underlying variable products with similar investment objectives and strategies regardless of amount of assets or distribution channels) for the five-year period ending December 31, 2006. Regarding these Portfolios, and based on its review of the various measures and periods of investment performance, and the explanations for and the factors resulting in the shorter-term performance of the Portfolios, the Board concluded that it was satisfied with the relative investment performance of these Portfolios over time. Regarding the relative performance of the other four Portfolios over various periods of time, the Board considered the explanations for the performance as well as recent performance improvements and the steps being taken to improve and monitor the performance, including the proposed restructuring of certain investment teams by MSA, and concluded that the performance of these Portfolios was being properly monitored.
Management Fees and Other Expenses. In evaluating the management fees paid by the Portfolios, the directors considered the actual and contractual fees paid by each Portfolio under the Advisory Agreement and the expense waiver agreements that were in place for certain of the Portfolios. The directors also considered a comparison of the actual and contractual management fees of the Portfolios and those of an independently selected peer group of mutual funds for each of the Portfolios. The directors also considered the total operating expenses of each of the Portfolios and a comparison of those expenses with each Portfolio’s respective peer group. The fact that under the Advisory Agreement MSA is responsible for many of the administrative and operational expenses, in addition to the investment management expenses, of the Portfolios was also considered. The directors did not consider the management fees charged to other MSA clients as relevant because substantially all of those accounts were managed for affiliates of MSA and, as such, they were priced based on different factors and considerations, and in some instances they had investment objectives and policies different than the Portfolios. The directors considered the comparative data as a guide to help assess the reasonableness of each Portfolio’s advisory fee, although they acknowledged that it was difficult to make precise comparisons with other funds since the exact nature of services provided by peers is often not apparent.
The directors noted that all of the Portfolios (other than three of the Portfolios for which a sub-advisor was retained, and the Asset Allocation Portfolio) were in the top quintile (meaning lowest expenses) of their respective peer groups with respect to actual and contractual management fees and total net operating expenses. For the four Portfolios not in the top quintile, three were in the second quintile for total expenses and one was in the third quintile. In considering the level of management fees, the directors also considered the structure and size of the Portfolios, the expenses assumed by MSA, and the existing expense cap arrangements agreed to by MSA for certain of the Portfolios. Based on their review of the management and other expenses, the comparative data, the performance of each Portfolio, and other factors deemed relevant by the directors, the directors concluded that the management fees and total operating expenses of each of the Portfolios were reasonable in relation to the nature, scope and quality of services provided and the performance of the Portfolios.
Costs and Profitability. The directors also considered MSA’s pricing methodology for its services as investment advisor and for the products of which the Portfolios are investment options. Also considered was the financial condition of MSA and information concerning MSA’s costs and profitability with respect to its relationship with each of the Portfolios. MSA provided a profitability analysis for each Portfolio which included the expense allocation methodology used, net income by Portfolio individually and the Portfolios in the aggregate, net income of MSA for all of its clients in the aggregate, and net profit margins for each Portfolio individually and in the aggregate. In connection with its review of the profitability of MSA’s services to the Portfolios, the directors also considered services provided by affiliates of MSA. The directors also received information on soft dollar arrangements.
The directors recognized that there are limitations inherent in allocating costs and calculating profitability for an
Approval and Continuance of Investment Advisory and Sub-Advisory Agreements
121
Table of Contents
Approval and Continuance of Investment Advisory and Sub-Advisory Agreements
Northwestern Mutual Series Fund, Inc.
organization such as MSA, and that it is difficult to make comparisons of profitability among investment advisors and clients because comparative information is not generally publicly available and, when available, its utility is subject to various assumptions and other factors. Based on their review of the profitability analysis for each Portfolio, the directors concluded that they were satisfied that MSA’s level of profitability from its relationship with each Portfolio was not excessive.
The directors were presented with other information including information regarding brokerage commissions, portfolio turnover, and compliance procedures, structure and history. Based on a consideration of all these factors in their totality, the Board, including the Independent Directors, approved the continuation of the Advisory Agreement with MSA.
Continuation of the Sub-Advisory Agreements Between MSA and Certain Sub-Advisors
At its May 2007 meeting, the Board, including the Independent Directors, unanimously approved the continuance of the Sub-Advisory Agreements between MSA and Templeton Investment Counsel, LLC (“Templeton”) relating to the Franklin Templeton International Equity Portfolio, and between MSA and Capital Guardian Trust Company (“CGTC”) relating to the Capital Guardian Domestic Equity Portfolio, with certain non-substantive amendments. (Templeton and CGTC are collectively referred to herein as the “Sub-Advisors” and their respective sub-advised Portfolios are collectively referred to herein as the “Sub-Advised Portfolios.”) In order to afford the Board the opportunity to focus on a smaller number of relationships at any one meeting, the Board considers the annual continuation of the sub-advisory agreements on a staggered basis.
The material factors and conclusions that formed the basis for the Board’s approval of the continuance of each of the Sub-Advisory Agreements with respect to each Sub-Advised Portfolio include those discussed below. In addition to the information provided to them at the meetings by MSA and the Sub-Advisors, the directors considered their experience with and knowledge of the nature and quality of the services provided by the Sub-Advisors and their interactions with representatives of MSA, its affiliates and the Sub-Advisors. The directors received a presentation by investment professionals of each Sub-Advisor who are involved in the management of the respective Sub-Advised Portfolio, as well as information from MSA regarding on-site due diligence visits which had been conducted with each Sub-Advisor. The directors evaluated the information they deemed relevant on a Portfolio by Portfolio basis. No one particular factor was identified as controlling, but rather it was a combination of all the factors and conclusions that formed the basis for the determinations made by the directors.
The directors considered the services provided by the Sub-Advisors and their experience in providing investment management services. Consideration was given to the Sub-Advisors’ reputations as leaders in providing investment management services. The directors noted that there were no significant changes in the services provided by the Sub-Advisors or the personnel providing those services. Based on their review and discussions, the directors concluded that they were satisfied with the nature, extent and quality of the services provided by the Sub-Advisors on behalf of the Sub-Advised Portfolios.
The directors also considered the performance of each of the Sub-Advisors over various time periods both on an absolute basis and compared to an independently compiled peer group of funds and appropriate market benchmarks and indices (as discussed above). The directors also considered the performance of accounts managed in a similar manner by certain of the Sub-Advisors. With respect to the relative performance of the Capital Guardian Domestic Equity Portfolio, the directors considered CGTC’s explanations for the underperformance and the steps being taken by CGTC to address these concerns. Based on CGTC’s explanation and the directors’ experience with and knowledge of the nature and quality of the services provided by CGTC, the directors concluded that the performance of the Domestic Equity Portfolio was being properly addressed and that they remained confident in the ability of CGTC to manage this Portfolio. For the reasons and based on the discussions summarized above, the directors concluded that they were satisfied with the relative investment performance of the Sub-Advised Portfolios.
The directors considered the total expenses of each Portfolio as discussed above. The directors also considered the sub-advisory fees, which fees are paid by MSA out of its management fee, including a comparison of those fees with fees charged for funds with the same classification/objective as compiled by Lipper. The directors considered that the fee schedule for each Sub-Advised Portfolio contained breakpoints. Based on its review, the directors concluded that the management fees and total expenses of each of the Sub-Advised Portfolios were reasonable in relation to the nature, scope and quality of services provided and the performance of the Sub-Advised Portfolios over time.
122
Approval and Continuance of Investment Advisory and Sub-Advisory Agreements
Table of Contents
Approval and Continuance of Investment Advisory and Sub-Advisory Agreements
Northwestern Mutual Series Fund, Inc.
The directors were previously presented with profitability information about MSA with respect to the Sub-Advised Portfolios. In connection with their review, the directors noted that the sub-advisory fees are paid out of MSA’s management fee and were the result of arm’s-length negotiations between MSA and the Sub-Advisers. The directors were presented with other information relating to the Sub-Advisors including regulatory and litigation matters, brokerage and compliance matters. Based on a consideration of all factors they deemed relevant in their totality, the Board, including the Independent Directors, approved the continuation of each of the Sub-Advisory Agreements between MSA and the Sub-Advisors.
Approval and Continuance of Investment Advisory and Sub-Advisory Agreements
123
Table of Contents

Table of Contents
| 3 | An example of shareholder expenses. | |||
| 4 | A summary of major shifts in the fund’s investments over the past six months. | |||
| 5 | A complete list of the fund’s investments with their market values. | |||
| 20 | Statements of assets and liabilities, operations, and changes in net assets, as well as financial highlights. | |||
| 24 | Notes to the financial statements. | |||
To view a fund’s proxy voting guidelines and proxy voting record for the 12-month period ended June 30, visit http://www.fidelity.com (search for “proxy voting guidelines”) or visit the Securities and Exchange Commission’s (SEC) web site at http://www.sec.gov. You may also call 1-877-208-0098 to request a free copy of the proxy voting guidelines.
Fidelity Variable Insurance Products are separate account options which are purchased through a variable insurance contract.
Standard & Poor’s, S&P and S&P 500 are registered service marks of The McGraw-Hill Companies, Inc. and have been licensed for use by Fidelity Distributors Corporation.
Other third party marks appearing herein are the property of their respective owners.
All other marks appearing herein are registered or unregistered trademarks or service marks of FMR Corp. or an affiliated company.
This report and the financial statements contained herein are submitted for the general information of the shareholders of the fund. This report is not authorized for distribution to prospective investors in the fund unless preceded or accompanied by an effective prospectus.
A fund files its complete schedule of portfolio holdings with the SEC for the first and third quarters of each fiscal year on Form N-Q. Forms N-Q are available on the SEC’s web site at http://www.sec.gov. A fund’s Forms N-Q may be reviewed and copied at the SEC’s Public Reference Room in Washington, DC. Information regarding the operation of the SEC’s Public Reference Room may be obtained by calling 1-800-SEC-0330. For a complete list of a fund’s portfolio holdings, view the most recent holdings report, semiannual report, or annual report on Fidelity’s web site at http://www.fidelity.com or http://www.advisor.fidelity.com, as applicable.
NOT FDIC INSURED • MAY LOSE VALUE • NO BANK GUARANTEE
Neither the fund nor Fidelity Distributors Corporation is a bank.
| VIP Mid Cap Portfolio | 2 |
Table of Contents
Shareholder Expense Example
As a shareholder of the Fund, you incur two types of costs: (1) transaction costs, and (2) ongoing costs, including management fees, distribution and/or service (12b-1) fees and other Fund expenses. This Example is intended to help you understand your ongoing costs (in dollars) of investing in the Fund and to compare these costs with the ongoing costs of investing in other mutual funds.
The Example is based on an investment of $1,000 invested at the beginning of the period and held for the entire period (January 1, 2007 to June 30, 2007).
Actual Expenses
The first line of the accompanying table for each class of the Fund provides information about actual account values and actual expenses. You may use the information in this line, together with the amount you invested, to estimate the expenses that you paid over the period. Simply divide your account value by $1,000.00 (for example, an $8,600 account value divided by $1,000.00 = 8.6), then multiply the result by the number in the first line for a class of the Fund under the heading entitled “Expenses Paid During Period” to estimate the expenses you paid on your account during this period. The estimate of expenses does not include any fees or other expenses of any variable annuity or variable life insurance product. If they were, the estimate of expenses you paid during the period would be higher, and your ending account value would be lower. In addition, the Fund, as a shareholder in the underlying Fidelity Central Funds, will indirectly bear its pro rata share of the fees and expenses incurred by the underlying Fidelity Central Funds. These fees and expenses are not included in the Fund’s annualized expense ratio used to calculate the expense estimate in the table below.
Hypothetical Example for Comparison Purposes
The second line of the accompanying table for each class of the Fund provides information about hypothetical account values and hypothetical expenses based on a Class’ actual expense ratio and an assumed rate of return of 5% per year before expenses, which is not the Class’ actual return. The hypothetical account values and expenses may not be used to estimate the actual ending account balance or expenses you paid for the period. You may use this information to compare the ongoing costs of investing in the Fund and other funds. To do so, compare this 5% hypothetical example with the 5% hypothetical examples that appear in the shareholder reports of the other funds. The estimate of expenses does not include any fees or other expenses of any variable annuity or variable life insurance product. If they were, the estimate of expenses you paid during the period would be higher, and your ending account value would be lower. In addition, the Fund, as a shareholder in the underlying Fidelity Central Funds, will indirectly bear its pro rata share of the fees and expenses incurred by the underlying Fidelity Central Funds. These fees and expenses are not included in the Fund’s annualized expense ratio used to calculate the expense estimate in the table below.
Please note that the expenses shown in the table are meant to highlight your ongoing costs only and do not reflect any transaction costs. Therefore, the second line of the table is useful in comparing ongoing costs only, and will not help you determine the relative total costs of owning different funds.
| Beginning Account Value January 1, 2007 |
Ending Account Value |
Expenses Paid During Period* January 1, 2007 to June 30, 2007 | |||||||
| Initial Class |
|||||||||
| Actual |
$ | 1,000.00 | $ | 1,123.90 | $ | 3.58 | |||
| HypotheticalA |
$ | 1,000.00 | $ | 1,021.42 | $ | 3.41 | |||
| Service Class |
|||||||||
| Actual |
$ | 1,000.00 | $ | 1,123.20 | $ | 4.11 | |||
| HypotheticalA |
$ | 1,000.00 | $ | 1,020.93 | $ | 3.91 | |||
| Service Class 2 |
|||||||||
| Actual |
$ | 1,000.00 | $ | 1,122.40 | $ | 4.84 | |||
| HypotheticalA |
$ | 1,000.00 | $ | 1,020.23 | $ | 4.61 | |||
| Investor Class |
|||||||||
| Actual |
$ | 1,000.00 | $ | 1,123.20 | $ | 4.16 | |||
| HypotheticalA |
$ | 1,000.00 | $ | 1,020.88 | $ | 3.96 | |||
| A |
5% return per year before expenses |
| * | Expenses are equal to each Class’ annualized expense ratio (shown in the table below); multiplied by the average account value over the period, multiplied by 181/365 (to reflect the one-half year period). |
| Annualized Expense Ratio |
|||
| Initial Class |
.68 | % | |
| Service Class |
.78 | % | |
| Service Class 2 |
.92 | % | |
| Investor Class |
.79 | % |
| 3 | Semiannual Report |
Table of Contents
Investment Changes
Top Ten Stocks as of June 30, 2007
| % of fund’s net assets |
% of fund’s net assets 6 months ago | |||
| Juniper Networks, Inc. |
2.6 | 2.3 | ||
| Altera Corp. |
2.4 | 0.3 | ||
| Thermo Fisher Scientific, Inc. |
2.3 | 2.3 | ||
| AGCO Corp. |
2.1 | 2.4 | ||
| Gentex Corp. |
1.7 | 0.5 | ||
| Ameriprise Financial, Inc. |
1.7 | 1.5 | ||
| AllianceBernstein Holding LP |
1.6 | 1.5 | ||
| Cisco Systems, Inc. |
1.5 | 1.1 | ||
| Apple, Inc. |
1.4 | 0.5 | ||
| Cooper Industries Ltd. Class A |
1.4 | 0.7 | ||
| 18.7 | ||||
Top Five Market Sectors as of June 30, 2007
| % of fund’s net assets |
% of fund’s net assets 6 months ago | |||
| Information Technology |
23.0 | 12.5 | ||
| Industrials |
13.1 | 14.3 | ||
| Energy |
12.9 | 14.6 | ||
| Consumer Discretionary |
12.6 | 11.1 | ||
| Health Care |
12.2 | 13.0 |
Asset Allocation (% of fund’s net assets)
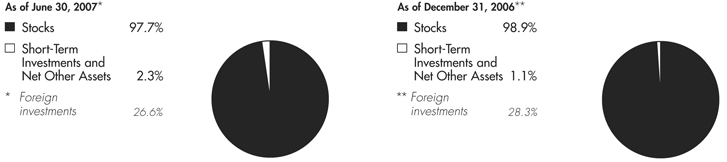
| VIP Mid Cap Portfolio | 4 |
Table of Contents
Investments June 30, 2007 (Unaudited)
Showing Percentage of Net Assets
| Common Stocks – 97.7% |
|||||
| Shares | Value | ||||
| CONSUMER DISCRETIONARY – 12.6% |
|||||
| Auto Components – 2.3% |
|||||
| Amerigon, Inc. (a) |
409,503 | $ | 7,366,959 | ||
| Automotive Axles Ltd. |
30,748 | 371,670 | |||
| Balkrishna Industries Ltd. |
33,225 | 499,953 | |||
| BorgWarner, Inc. |
100 | 8,604 | |||
| Fuel Systems Solutions, Inc. (a) |
440,619 | 7,305,463 | |||
| Gentex Corp. (d) |
7,069,086 | 139,190,303 | |||
| Hawk Corp. Class A (a) |
103,900 | 1,419,274 | |||
| Hota Industrial Manufacturing Co. Ltd. |
2,013,000 | 2,938,955 | |||
| Jinheng Automotive Safety Technology Holdings Ltd. |
2,000 | 409 | |||
| Minth Group Ltd. |
14,245,000 | 21,861,571 | |||
| New Focus Auto Tech Holdings Ltd. |
7,707,000 | 2,198,001 | |||
| Toyoda Gosei Co. Ltd. |
100 | 2,826 | |||
| Xinyi Glass Holdings Co. Ltd. |
7,724,000 | 6,895,017 | |||
| 190,059,005 | |||||
| Automobiles – 0.2% |
|||||
| Bajaj Auto Ltd. |
100 | 5,284 | |||
| Geely Automobile Holdings Ltd. |
94,780,200 | 14,788,194 | |||
| Great Wall Motor Co. Ltd. (H Shares) |
2,158,500 | 3,135,942 | |||
| Harley-Davidson, Inc. |
100 | 5,961 | |||
| Hyundai Motor Co. |
2,770 | 218,878 | |||
| Hyundai Motor Co. GDR (f) |
100 | 4,050 | |||
| Renault SA |
100 | 16,134 | |||
| Thor Industries, Inc. |
100 | 4,514 | |||
| 18,178,957 | |||||
| Distributors – 0.2% |
|||||
| ABC-Mart, Inc. |
824,500 | 18,878,612 | |||
| Li & Fung Ltd. |
2,200 | 7,920 | |||
| 18,886,532 | |||||
| Diversified Consumer Services – 0.0% |
|||||
| Benesse Corp. |
100 | 2,899 | |||
| Bright Horizons Family Solutions, Inc. (a) |
57 | 2,218 | |||
| Capella Education Co. |
19,900 | 915,997 | |||
| New Oriental Education & Technology Group, Inc. sponsored ADR |
100 | 5,372 | |||
| Princeton Review, Inc. (a) |
29 | 139 | |||
| Raffles Education Corp. Ltd. |
229,000 | 340,932 | |||
| Regis Corp. |
100 | 3,825 | |||
| Service Corp. International |
100 | 1,278 | |||
| Strayer Education, Inc. |
6,200 | 816,602 | |||
| Universal Technical Institute, Inc. (a) |
100 | 2,539 | |||
| Weight Watchers International, Inc. |
100 | 5,084 | |||
| 2,096,885 | |||||
| Hotels, Restaurants & Leisure – 1.8% |
|||||
| AmRest Holdings NV (a) |
100 | 5,195 | |||
| Applebee’s International, Inc. |
524,200 | 12,633,220 | |||
| Buffalo Wild Wings, Inc. (a)(d) |
134,162 | 5,579,798 | |||
| Chipotle Mexican Grill, Inc. Class A (a) |
100 | 8,528 | |||
| CKE Restaurants, Inc. |
471,575 | 9,464,510 | |||
| FU Jl Food & Catering Services Holdings Ltd. |
1,000 | 3,440 | |||
| Fun Technologies, Inc. (a) |
1,719,300 | 5,729,655 | |||
| Home Inns & Hotels Management, Inc. ADR |
27,300 | 879,333 | |||
| Indian Hotels Co. Ltd. |
100 | 372 | |||
| Jack in the Box, Inc. (a) |
100 | 7,094 | |||
| Jollibee Food Corp. |
2,105,100 | 2,391,124 | |||
| Krispy Kreme Doughnuts, Inc. (a) |
219,200 | 2,029,792 | |||
| Kyoritsu Maintenance Co. Ltd. |
120 | 2,426 | |||
| McCormick & Schmick’s Seafood Restaurants (a) |
900 | 23,346 | |||
| Minor International PCL (For. Reg.) |
10 | 4 | |||
| P.F. Chang’s China Bistro, Inc. (a) |
100 | 3,520 | |||
| Panera Bread Co. Class A (a) |
100 | 4,606 | |||
| Peet’s Coffee & Tea, Inc. (a) |
100 | 2,463 | |||
| Red Robin Gourmet Burgers, Inc. (a) |
719 | 29,026 | |||
| Ruby Tuesday, Inc. |
542,452 | 14,282,761 | |||
| Shanghai Jin Jiang International Hotels Group Co. Ltd. (H Shares) |
2,000 | 1,036 | |||
| Shangri-La Asia Ltd. |
100 | 242 | |||
| Sonic Corp. (a) |
1,676,574 | 37,085,806 | |||
| St. Marc Holdings Co. Ltd. (d) |
482,100 | 24,112,828 | |||
| Starwood Hotels & Resorts Worldwide, Inc. |
463,500 | 31,086,945 | |||
| TAJ GVK Hotels & Resorts Ltd. |
297,699 | 1,139,006 | |||
| The Cheesecake Factory, Inc. (a) |
100 | 2,452 | |||
| Yoshinoya D&C Co. Ltd. (d) |
1,994 | 3,723,774 | |||
| 150,232,302 | |||||
| Household Durables – 0.9% |
|||||
| Alba PLC |
26 | 76 | |||
| AV Jennings Homes Ltd. |
104 | 114 | |||
| Chitaly Holdings Ltd. |
528,000 | 103,315 | |||
| Corporacion Geo SA de CV Series B (a) |
100 | 548 | |||
| Cyrela Brazil Realty SA |
407,800 | 5,060,770 | |||
| Daito Trust Construction Co. |
583,100 | 27,791,465 | |||
| Fadesa Inmobiliaria SA |
100 | 3,562 | |||
| Gafisa SA ADR (a) |
26,000 | 811,200 | |||
| George Wimpey PLC |
100 | 1,010 | |||
| Henry Boot PLC |
347,370 | 1,785,737 | |||
| La-Z-Boy, Inc. |
100 | 1,146 | |||
| Makita Corp. sponsored ADR |
100 | 4,464 | |||
| Nihon Eslead Corp. |
262,700 | 4,905,895 | |||
| Rational AG |
100 | 19,604 | |||
| Samson Holding Ltd. |
100 | 52 | |||
| Sekisui House Ltd. |
618,000 | 8,254,384 | |||
| Skyworth Digital Holdings Ltd. |
2,052 | 323 | |||
| Snap-On, Inc. |
100 | 5,051 | |||
| Techtronic Industries Co. Ltd. |
500 | 668 | |||
| Tele Atlas NV (a) |
65,600 | 1,409,875 | |||
| The Stanley Works |
418,871 | 25,425,470 | |||
| Whirlpool Corp. |
100 | 11,120 | |||
| Woongjin Coway Co. Ltd. |
48,980 | 1,659,441 | |||
| 77,255,290 | |||||
See accompanying notes which are an integral part of the financial statements.
| 5 | Semiannual Report |
Table of Contents
VIP Mid Cap Portfolio
Investments (Unaudited) – continued
| Common Stocks – continued |
|||||
| Shares | Value | ||||
| CONSUMER DISCRETIONARY – continued |
|||||
| Internet & Catalog Retail – 1.2% |
|||||
| GSI Commerce, Inc. (a) |
100 | $ | 2,271 | ||
| N Brown Group PLC |
1,058,296 | 6,481,751 | |||
| Netflix, Inc. (a) |
100 | 1,939 | |||
| Priceline.com, Inc. (a)(d) |
1,422,900 | 97,810,146 | |||
| 104,296,107 | |||||
| Leisure Equipment & Products – 0.7% |
|||||
| Beneteau SA |
100 | 13,621 | |||
| Giant Manufacturing Co. Ltd. |
2,744,000 | 5,053,855 | |||
| Li Ning Co. Ltd. |
2,000 | 4,850 | |||
| Mega Brands, Inc. (a) |
100 | 1,954 | |||
| Mizuno Corp. (d) |
124,000 | 710,815 | |||
| Nidec Copal Corp. |
100 | 1,067 | |||
| Oakley, Inc. |
1,743,516 | 49,515,854 | |||
| SHIMANO, Inc. |
100 | 3,435 | |||
| 55,305,451 | |||||
| Media – 1.8% |
|||||
| Adlabs Films Ltd. |
293,487 | 4,079,850 | |||
| Austar United Communications Ltd. |
100 | 141 | |||
| Balaji Telefilms Ltd. |
100 | 552 | |||
| Cinemax India Ltd. |
235,034 | 919,837 | |||
| Clear Media Ltd. (a) |
243,000 | 264,157 | |||
| CTC Media, Inc. |
100 | 2,714 | |||
| cyber communications, Inc. (d) |
6,000 | 4,350,438 | |||
| CyberAgent, Inc. (d) |
3,500 | 2,284,833 | |||
| Dish TV India Ltd. (a) |
50 | 132 | |||
| E.W. Scripps Co. Class A |
102,700 | 4,692,363 | |||
| Eros International plc |
841,600 | 6,548,816 | |||
| Grupo Televisa SA de CV (CPO) sponsored ADR |
100 | 2,761 | |||
| Imagi International Holdings Ltd. (a) |
2,000 | 576 | |||
| Inox Leisure Ltd. |
140,631 | 465,531 | |||
| Lamar Advertising Co. Class A |
100 | 6,276 | |||
| Marvel Entertainment, Inc. (a)(d) |
566,800 | 14,442,064 | |||
| McGraw-Hill Companies, Inc. |
100 | 6,808 | |||
| News Corp. Class A |
204 | 4,327 | |||
| Omnicom Group, Inc. |
1,939,096 | 102,616,960 | |||
| ProQuest Co. (a) |
40,500 | 386,370 | |||
| PVR Ltd. (a) |
442,073 | 2,276,635 | |||
| RRSat Global Communications Network Ltd. |
195,200 | 3,898,144 | |||
| Shringar Cinemas Ltd. (a) |
580,000 | 824,380 | |||
| Trader Classified Media NV: |
|||||
| (A Shares) |
100 | 30 | |||
| Class A (NY Shares) |
76,800 | 22,867 | |||
| Usen Corp. |
100 | 771 | |||
| ValueCommerce Co. Ltd. (d) |
820 | 495,356 | |||
| Wire and Wireless India Ltd. (a) |
44 | 69 | |||
| Zee Entertainment Enterprises Ltd. |
88 | 646 | |||
| Zee News Ltd. (a) |
39 | 46 | |||
| 148,594,450 | |||||
| Multiline Retail – 0.2% |
|||||
| Don Quijote Co. Ltd. |
300 | 6,017 | |||
| Golden Eagle Retail Group Ltd. (H Shares) |
1,000 | 789 | |||
| JCPenney Co., Inc. |
100 | 7,238 | |||
| Lifestyle International Holdings Ltd. |
2,328,500 | 9,038,006 | |||
| Parkson Retail Group Ltd. |
500 | 3,204 | |||
| Ryohin Keikaku Co. Ltd. |
56,300 | 3,487,894 | |||
| Shopper’s Stop Ltd. |
100 | 1,442 | |||
| 12,544,590 | |||||
| Specialty Retail – 1.6% |
|||||
| Asahi Co. Ltd. |
200 | 2,923 | |||
| Blacks Leisure Group PLC |
100 | 627 | |||
| Build-A-Bear Workshop, Inc. (a) |
1,338 | 34,975 | |||
| Charming Shoppes, Inc. (a) |
100 | 1,083 | |||
| Chow Sang Sang Holdings International Ltd. |
2,000 | 1,816 | |||
| Cost Plus, Inc. (a) |
100 | 848 | |||
| DSG International PLC sponsored ADR |
100 | 950 | |||
| DSW, Inc. Class A (a)(d) |
396,100 | 13,792,202 | |||
| Esprit Holdings Ltd. |
500 | 6,343 | |||
| Fantastic Holdings Ltd. |
110 | 400 | |||
| Gamestop Corp. Class A (a) |
1,088,700 | 42,568,170 | |||
| Golfsmith International Holdings, Inc. |
250 | 1,728 | |||
| GOME Electrical Appliances Holdings Ltd. |
184,497 | 282,673 | |||
| Guess?, Inc. |
200 | 9,608 | |||
| Hennes & Mauritz AB (H&M) (B Shares) |
100 | 5,944 | |||
| Inditex SA |
367,200 | 21,752,310 | |||
| JB Hi-Fi Ltd. |
100 | 917 | |||
| KOMERI Co. Ltd. |
100 | 2,663 | |||
| Lewis Group Ltd. |
724,400 | 6,303,498 | |||
| Nafco Co. Ltd. |
1,300 | 37,683 | |||
| Nitori Co. Ltd. |
100 | 4,994 | |||
| Otsuka Kagu Ltd. |
27,600 | 712,634 | |||
| Pendragon PLC |
500 | 793 | |||
| RONA, Inc. (a) |
100 | 2,089 | |||
| Ross Stores, Inc. |
1,216,155 | 37,457,574 | |||
| Sharper Image Corp. (a) |
100 | 1,139 | |||
| Williams-Sonoma, Inc. |
100 | 3,158 | |||
| Xebio Co. Ltd. |
100 | 2,679 | |||
| Yamada Denki Co. Ltd. |
77,010 | 8,053,660 | |||
| 131,046,081 | |||||
| Textiles, Apparel & Luxury Goods – 1.7% |
|||||
| Asics Corp. |
5,718,700 | 70,717,601 | |||
| China Grand Forestry Resources Group Ltd. (a) |
9,012,000 | 1,740,347 | |||
| China Ting Group Holdings Ltd. |
7,656,000 | 2,643,646 | |||
| Columbia Sportswear Co. |
188,300 | 12,932,444 | |||
| Folli Follie SA |
80 | 3,248 | |||
| G-III Apparel Group Ltd. (a) |
100 | 1,579 | |||
| Liz Claiborne, Inc. |
167,200 | 6,236,560 | |||
| Luen Thai Holdings Ltd. |
1,000 | 148 | |||
See accompanying notes which are an integral part of the financial statements.
| VIP Mid Cap Portfolio | 6 |
Table of Contents
| Common Stocks – continued |
|||||
| Shares | Value | ||||
| CONSUMER DISCRETIONARY – continued |
|||||
| Textiles, Apparel & Luxury Goods – continued |
|||||
| Luxottica Group SpA sponsored ADR |
100 | $ | 3,864 | ||
| NIKE, Inc. Class B |
200 | 11,658 | |||
| Perry Ellis International, Inc. (a) |
158,500 | 5,098,945 | |||
| Phoenix Footwear Group, Inc. (a) |
2,100 | 6,930 | |||
| Polo Ralph Lauren Corp. Class A |
26,400 | 2,590,104 | |||
| Ports Design Ltd. |
2,687,500 | 7,561,515 | |||
| Quiksilver, Inc. (a) |
20,068 | 283,561 | |||
| The Swatch Group AG (Bearer) |
100 | 28,569 | |||
| Under Armour, Inc. Class A (sub. vtg.) (a) |
70 | 3,196 | |||
| VF Corp. |
204,000 | 18,682,320 | |||
| Volcom, Inc. (a) |
59,000 | 2,957,670 | |||
| Welspun India Ltd. (a) |
100 | 160 | |||
| Wolverine World Wide, Inc. |
100 | 2,771 | |||
| Yue Yuen Industrial Holdings Ltd. |
3,349,300 | 10,387,319 | |||
| 141,894,155 | |||||
| TOTAL CONSUMER DISCRETIONARY |
1,050,389,805 | ||||
| CONSUMER STAPLES – 5.4% |
|||||
| Beverages – 0.1% |
|||||
| Boston Beer Co., Inc. Class A (a) |
41,539 | 1,634,560 | |||
| Brick Brewing Co. Ltd. (a) |
100 | 202 | |||
| C&C Group PLC |
44,331 | 598,776 | |||
| Companhia de Bebidas das Americas (AmBev): |
|||||
| (PN) sponsored ADR |
100 | 7,000 | |||
| sponsored ADR |
20 | 1,404 | |||
| Dynasty Fine Wines Group Ltd. |
2,000 | 816 | |||
| Fomento Economico Mexicano SA de CV sponsored ADR |
74,700 | 2,937,204 | |||
| Grupo Modelo SA de CV Series C |
142,600 | 771,560 | |||
| Heineken Holding NV (A Shares) |
100 | 5,190 | |||
| Jones Soda Co. (a) |
45,559 | 638,737 | |||
| Remy Cointreau SA |
100 | 7,505 | |||
| Tsingtao Brewery Co. Ltd. (H Shares) |
3,000 | 7,290 | |||
| Yantai Changyu Pioneer Wine Co. (B Shares) |
130 | 648 | |||
| 6,610,892 | |||||
| Food & Staples Retailing – 1.4% |
|||||
| Alimentation Couche-Tard, Inc. Class B (sub. vtg.) |
100 | 2,062 | |||
| Breadtalk Group Ltd. |
1,000 | 320 | |||
| CVS Caremark Corp. |
1,044,400 | 38,068,380 | |||
| Daikokutenbussan Co. Ltd. |
79,000 | 807,575 | |||
| Heng Tai Consumables Group Ltd. (a) |
26,032,200 | 5,593,168 | |||
| Lianhua Supermarket Holdings Co. (H Shares) |
356,000 | 507,193 | |||
| Metro AG |
307,200 | 25,561,200 | |||
| Performance Food Group Co. (a) |
574,563 | 18,667,552 | |||
| Plant Co. Ltd. |
127,000 | 385,661 | |||
| Safeway, Inc. |
384,259 | 13,076,334 | |||
| Shinsegae Co. Ltd. |
100 | 65,162 | |||
| Shinsegae Food Co. Ltd. (a) |
100 | 9,742 | |||
| Valor Co. Ltd. |
651,000 | 7,426,559 | |||
| Wal-Mart de Mexico SA de CV sponsored ADR (V Shares) |
202 | 7,636 | |||
| Whole Foods Market, Inc. (d) |
236,525 | 9,058,908 | |||
| X5 Retail Group NV unit (a)(f) |
100 | 2,930 | |||
| 119,240,382 | |||||
| Food Products – 1.8% |
|||||
| Barry Callebaut AG |
85 | 64,432 | |||
| Britannia Industries Ltd. |
25,116 | 976,410 | |||
| Campbell Soup Co. |
100 | 3,881 | |||
| CCL Products (India) Ltd. |
103,953 | 735,046 | |||
| Cermaq ASA |
196,900 | 3,439,039 | |||
| Chaoda Modern Agriculture (Holdings) Ltd. |
1,000 | 772 | |||
| China Agri-Industries Holding Ltd. |
2,000 | 1,358 | |||
| China Foods Ltd. |
2,000 | 1,358 | |||
| China Huiyuan Juice Group Ltd. |
500 | 587 | |||
| China Mengniu Dairy Co. Ltd. |
100 | 345 | |||
| China Yurun Food Group Ltd. |
1,000 | 1,118 | |||
| Chiquita Brands International, Inc. |
598,600 | 11,349,456 | |||
| Corn Products International, Inc. |
1,625,904 | 73,897,337 | |||
| Green Mountain Coffee Roasters, Inc. (a) |
100 | 7,874 | |||
| Groupe Danone |
218,000 | 17,708,373 | |||
| Groupe Danone sponsored ADR |
163,400 | 2,656,884 | |||
| Hain Celestial Group, Inc. (a) |
100 | 2,714 | |||
| Heritage Foods (India) Ltd. |
100 | 661 | |||
| Hershey Co. |
100 | 5,062 | |||
| Hormel Foods Corp. |
732,500 | 27,358,875 | |||
| IAWS Group PLC (Ireland) |
25,450 | 533,882 | |||
| Nutreco Holding NV |
100 | 7,329 | |||
| REI Agro Ltd. (a) |
170,000 | 918,902 | |||
| Rocky Mountain Chocolate Factory, Inc. |
100 | 1,588 | |||
| Seaboard Corp. |
430 | 1,008,350 | |||
| Tingyi (Cayman Island) Holding Corp. |
2,000 | 2,325 | |||
| Uni-President Enterprises Corp. |
1,000 | 1,005 | |||
| Wimm-Bill-Dann Foods OJSC sponsored ADR |
94,000 | 9,776,940 | |||
| 150,461,903 | |||||
| Personal Products – 2.1% |
|||||
| Amorepacific Corp. |
62 | 49,125 | |||
| Avon Products, Inc. |
1,743,079 | 64,058,153 | |||
| Concern Kalina OJSC: |
|||||
| GDR (f) |
21,643 | 845,255 | |||
| sponsored ADR |
21,300 | 831,859 | |||
| Dabur India Ltd. |
100 | 254 | |||
| Estee Lauder Companies, Inc. Class A |
100 | 4,551 | |||
| Godrej Consumer Products Ltd. |
162,080 | 577,129 | |||
| Hengan International Group Co. Ltd. (d) |
27,672,200 | 98,384,382 | |||
| Kose Corp. |
110 | 3,117 | |||
See accompanying notes which are an integral part of the financial statements.
| 7 | Semiannual Report |
Table of Contents
VIP Mid Cap Portfolio
Investments (Unaudited) – continued
| Common Stocks – continued |
|||||
| Shares | Value | ||||
| CONSUMER STAPLES – continued |
|||||
| Personal Products – continued |
|||||
| Marico Ltd. |
100 | $ | 137 | ||
| Natura Cosmeticos SA |
168,300 | 2,429,711 | |||
| NBTY, Inc. (a) |
56,200 | 2,427,840 | |||
| Shiseido Co. Ltd. sponsored ADR |
207,200 | 4,361,560 | |||
| 173,973,073 | |||||
| TOTAL CONSUMER STAPLES |
450,286,250 | ||||
| ENERGY – 12.9% |
|||||
| Energy Equipment & Services – 9.2% |
|||||
| BJ Services Co. |
3,128,800 | 88,983,072 | |||
| Cameron International Corp. (a) |
360,900 | 25,793,523 | |||
| Dresser-Rand Group, Inc. (a) |
1,689,569 | 66,737,976 | |||
| Dril-Quip, Inc. (a) |
1,418,720 | 63,771,464 | |||
| ENSCO International, Inc. |
285,500 | 17,418,355 | |||
| Global Industries Ltd. (a) |
1,127,293 | 30,233,998 | |||
| Helmerich & Payne, Inc. |
4,400 | 155,848 | |||
| Input/Output, Inc. (a)(d) |
1,237,611 | 19,319,108 | |||
| Metretek Technologies, Inc. (a)(d)(e) |
1,140,099 | 17,603,129 | |||
| Nabors Industries Ltd. (a) |
1,353,100 | 45,166,478 | |||
| National Oilwell Varco, Inc. (a) |
326,700 | 34,055,208 | |||
| Newpark Resources, Inc. (a)(e) |
6,563,987 | 50,870,899 | |||
| Oil States International, Inc. (a) |
75,700 | 3,129,438 | |||
| Parker Drilling Co. (a)(e) |
8,056,444 | 84,914,920 | |||
| Patterson-UTI Energy, Inc. |
1,034,083 | 27,103,315 | |||
| RPC, Inc. |
2,157,718 | 36,767,515 | |||
| Saipem SpA |
99,700 | 3,420,576 | |||
| Tidewater, Inc. |
579,600 | 41,082,048 | |||
| TODCO (a) |
511,000 | 24,124,310 | |||
| Weatherford International Ltd. (a) |
1,518,400 | 83,876,416 | |||
| 764,527,596 | |||||
| Oil, Gas & Consumable Fuels – 3.7% |
|||||
| Canadian Natural Resources Ltd. |
132,500 | 8,803,896 | |||
| China Coal Energy Co. Ltd. (H Shares) |
1,000 | 1,499 | |||
| China Petroleum & Chemical Corp. sponsored ADR (H Shares) |
100 | 11,164 | |||
| China Shenhua Energy Co. Ltd. (H Shares) |
500 | 1,746 | |||
| Cosmo Oil Co. Ltd. |
1,596,000 | 8,811,952 | |||
| EOG Resources, Inc. |
100 | 7,306 | |||
| Evergreen Energy, Inc. (a)(d) |
1,533,433 | 9,246,601 | |||
| Helix Energy Solutions Group, Inc. (a) |
438,700 | 17,508,517 | |||
| Hess Corp. |
670,700 | 39,544,472 | |||
| Holly Corp. |
86,300 | 6,402,597 | |||
| International Coal Group, Inc. (a)(d) |
4,530,820 | 27,094,304 | |||
| JKX Oil & Gas |
91 | 616 | |||
| Newfield Exploration Co. (a) |
295,700 | 13,469,135 | |||
| Niko Resources Ltd. |
100 | 9,106 | |||
| Nippon Oil Corp. |
741,000 | 6,894,982 | |||
| Noble Energy, Inc. |
325,200 | 20,289,228 | |||
| OPTI Canada, Inc. (a) |
200 | 4,266 | |||
| Peabody Energy Corp. |
462 | 22,352 | |||
| Penn Virginia Resource Partners LP |
338,765 | 10,535,592 | |||
| Petrobras Energia Participaciones SA sponsored ADR (B Shares) (a) |
700 | 7,595 | |||
| Petrohawk Energy Corp. (a) |
1,466,200 | 23,253,932 | |||
| Petroleo Brasileiro SA Petrobras: |
|||||
| (PN) sponsored ADR (non-vtg.) |
100 | 10,668 | |||
| sponsored ADR |
100 | 12,127 | |||
| Plains Exploration & Production Co. (a) |
211,600 | 10,116,596 | |||
| Rentech, Inc. (a) |
100 | 259 | |||
| Sasol Ltd. sponsored ADR |
100 | 3,754 | |||
| Southwestern Energy Co. (a) |
54,200 | 2,411,900 | |||
| Sunoco, Inc. |
434,700 | 34,636,896 | |||
| Surgutneftegaz JSC sponsored ADR |
100 | 5,485 | |||
| Tesoro Corp. |
168,640 | 9,637,776 | |||
| Toreador Resources Corp. (a)(d) |
295,053 | 4,425,795 | |||
| UraMin, Inc. (a) |
100 | 787 | |||
| Valero Energy Corp. |
803,622 | 59,355,521 | |||
| XTO Energy, Inc. |
100 | 6,010 | |||
| 312,544,432 | |||||
| TOTAL ENERGY |
1,077,072,028 | ||||
| FINANCIALS – 9.8% |
|||||
| Capital Markets – 5.3% |
|||||
| Acta Holding ASA |
1,774,850 | 9,329,911 | |||
| AllianceBernstein Holding LP |
1,507,328 | 131,273,196 | |||
| Ameriprise Financial, Inc. |
2,179,922 | 138,577,642 | |||
| Charlemagne Capital Ltd. |
2,252,100 | 3,210,934 | |||
| Cohen & Steers, Inc. |
100 | 4,345 | |||
| Deutsche Bank AG (NY Shares) |
100 | 14,474 | |||
| EFG International |
183,908 | 8,490,841 | |||
| Espirito Santo Financial Group SA |
100 | 4,196 | |||
| Indiabulls Financial Services Ltd. |
100 | 1,457 | |||
| Investec PLC |
100 | 1,291 | |||
| JAFCO Co. Ltd. |
51,200 | 2,361,286 | |||
| Janus Capital Group, Inc. |
477,700 | 13,299,168 | |||
| Japan Asia Investment Co. Ltd. |
988,000 | 6,185,027 | |||
| Julius Baer Holding AG (Bearer) |
226,706 | 16,312,588 | |||
| Korea Investment Holdings Co. Ltd. |
430,110 | 29,423,561 | |||
| Legg Mason, Inc. |
100 | 9,838 | |||
| Man Group plc |
485,400 | 5,936,116 | |||
| Marusan Securities Co. Ltd. (d) |
1,539,700 | 17,314,748 | |||
| Mirae Asset Securities Co. Ltd. |
213,166 | 19,220,362 | |||
| MPC Muenchmeyer Petersen Capital AG |
67,000 | 6,877,911 | |||
| New Star Asset Management Group PLC |
71,780 | 651,519 | |||
| Nuveen Investments, Inc. Class A |
100 | 6,215 | |||
| Sparx Group Co. Ltd. (d) |
12,480 | 9,271,841 | |||
| T. Rowe Price Group, Inc. |
347,863 | 18,050,611 | |||
| TD Ameritrade Holding Corp. (a) |
100 | 2,000 | |||
| W.P. Carey & Co. LLC |
138,112 | 4,343,622 | |||
| 440,174,700 | |||||
See accompanying notes which are an integral part of the financial statements.
| VIP Mid Cap Portfolio | 8 |
Table of Contents
| Common Stocks – continued |
|||||
| Shares | Value | ||||
| FINANCIALS – continued |
|||||
| Commercial Banks – 0.7% |
|||||
| Allahabad Bank |
1,142,127 | $ | 2,328,361 | ||
| Asya Katilim Bankasi AS |
125,000 | 766,667 | |||
| Banco Itau Holding Financeira SA: |
|||||
| (PN) (non-vtg.) |
5,300 | 235,314 | |||
| sponsored ADR (non-vtg.) |
97,700 | 4,341,788 | |||
| Banco Pastor SA |
100 | 2,054 | |||
| Banif SGPS SA |
100 | 823 | |||
| Bank of Ayudhya PCL (For. Reg.) |
304,800 | 216,233 | |||
| Bank of Baroda |
1,157,580 | 9,263,497 | |||
| Bank of Georgia unit (a) |
100 | 4,300 | |||
| Bank of India |
100 | 572 | |||
| Boston Private Financial Holdings, Inc. |
195 | 5,240 | |||
| Capitalia SpA |
79 | 787 | |||
| Capitol Bancorp Ltd. |
399,373 | 10,914,864 | |||
| Cathay General Bancorp |
20 | 671 | |||
| China Merchants Bank Co. Ltd. (H Shares) |
1,000 | 3,044 | |||
| Corp. Bank Ltd. |
230,369 | 1,852,047 | |||
| DnB Nor ASA |
100 | 1,292 | |||
| East West Bancorp, Inc. |
100 | 3,888 | |||
| Erste Bank AG |
9,800 | 766,620 | |||
| Fukuoka Financial Group, Inc. (a) |
798,000 | 5,274,212 | |||
| Fulton Financial Corp. |
13 | 187 | |||
| HDFC Bank Ltd. sponsored ADR |
100 | 8,426 | |||
| Hokuhoku Financial Group, Inc. |
100 | 324 | |||
| ICICI Bank Ltd. sponsored ADR |
100 | 4,915 | |||
| Juroku Bank Ltd. (d) |
1,155,400 | 7,345,552 | |||
| Lakeland Financial Corp. |
200 | 4,254 | |||
| Marshall & llsley Corp. |
100 | 4,763 | |||
| Oriental Bank of Commerce |
182,856 | 1,040,415 | |||
| OTP Bank Ltd. |
100 | 5,808 | |||
| PT Bank Central Asia Tbk |
500 | 302 | |||
| Punjab National Bank |
100 | 1,614 | |||
| Sberbank (Savings Bank of the Russian Federation) GDR |
100 | 49,128 | |||
| Siam City Bank PCL (For. Reg.) |
236,300 | 130,004 | |||
| State Bank of India |
100 | 4,531 | |||
| Sumitomo Trust & Banking Co. Ltd. |
1,275,000 | 12,164,054 | |||
| The Jammu & Kashmir Bank Ltd. |
423 | 7,044 | |||
| The Mie Bank Ltd. |
1,000 | 5,034 | |||
| UCO Bank (a) |
1,431,669 | 839,041 | |||
| UMB Financial Corp. |
100 | 3,687 | |||
| Uniao de Bancos Brasileiros SA (Unibanco) GDR |
23,400 | 2,641,158 | |||
| Union Bank of India |
100 | 361 | |||
| UTI Bank Ltd. |
100 | 1,494 | |||
| Vijaya Bank Ltd. |
436,403 | 540,400 | |||
| Wintrust Financial Corp. |
100 | 4,385 | |||
| 60,789,155 | |||||
| Diversified Financial Services – 0.0% |
|||||
| African Bank Investments Ltd. |
100 | 423 | |||
| Hong Kong Exchanges & Clearing Ltd. |
100 | 1,413 | |||
| Infrastructure Development Finance Co. Ltd. |
100 | 325 | |||
| Kotak Mahindra Bank Ltd. |
100 | 1,661 | |||
| Moody’s Corp. |
53 | 3,297 | |||
| SREI Infrastructure Finance Ltd. |
100 | 221 | |||
| 7,340 | |||||
| Insurance – 0.6% |
|||||
| Admiral Group PLC |
1,356,400 | 24,214,465 | |||
| April Group |
100 | 5,285 | |||
| Baloise Holdings AG (Reg.) |
100 | 9,913 | |||
| Benfield Group PLC |
100 | 649 | |||
| Brown & Brown, Inc. |
100 | 2,514 | |||
| China Life Insurance Co. Ltd. ADR |
266 | 14,276 | |||
| eHealth, Inc. |
124,000 | 2,367,160 | |||
| Genworth Financial, Inc. Class A (non-vtg.) |
100 | 3,440 | |||
| KMG America Corp. (a) |
1,068,289 | 5,608,517 | |||
| Marsh & McLennan Companies, Inc. |
100 | 3,088 | |||
| Muenchener Rueckversicherungs-Gesellschaft AG (Reg.) |
100 | 18,432 | |||
| Penn Treaty American Corp. (a) |
178,755 | 1,022,479 | |||
| Ping An Insurance (Group) Co. of China, Ltd. (H Shares) |
331,500 | 2,342,359 | |||
| Power Financial Corp. |
100 | 3,797 | |||
| Principal Financial Group, Inc. |
100 | 5,829 | |||
| Reinsurance Group of America, Inc. |
194,389 | 11,709,993 | |||
| Samsung Fire & Marine Insurance Co. Ltd. |
100 | 19,267 | |||
| UNIPOL Assicurazioni SpA |
100 | 361 | |||
| Universal American Financial Corp. (a) |
34,900 | 742,672 | |||
| 48,094,496 | |||||
| Real Estate Investment Trusts – 1.0% |
|||||
| Alexandria Real Estate Equities, Inc. |
100 | 9,682 | |||
| American Financial Realty Trust (SBI) |
212,800 | 2,196,096 | |||
| BioMed Realty Trust, Inc. |
100 | 2,512 | |||
| British Land Co. PLC |
1,596 | 42,946 | |||
| CFS Retail Property Trust |
3,169,200 | 5,777,745 | |||
| DA Office Investment Corp. (d) |
100 | 657,681 | |||
| Digital Realty Trust, Inc. |
100 | 3,768 | |||
| General Growth Properties, Inc. |
154,600 | 8,186,070 | |||
| Hospitality Properties Trust (SBI) |
341,100 | 14,152,239 | |||
| K-REIT Asia |
738,020 | 1,378,261 | |||
| Land Securities Group PLC |
150,016 | 5,250,737 | |||
| Link (REIT) |
500 | 1,106 | |||
| Plum Creek Timber Co., Inc. |
100 | 4,166 | |||
| RAIT Financial Trust (SBI) |
200,600 | 5,219,612 | |||
| Senior Housing Properties Trust (SBI) |
2,109,110 | 42,920,389 | |||
| 85,803,010 | |||||
| Real Estate Management & Development – 1.9% |
|||||
| Ayala Land, Inc. |
14,622,600 | 5,536,467 | |||
| Babis Vovos International Technical SA |
12,465 | 403,196 | |||
| Capital & Regional PLC |
529,100 | 12,356,709 | |||
See accompanying notes which are an integral part of the financial statements.
| 9 | Semiannual Report |
Table of Contents
VIP Mid Cap Portfolio
Investments (Unaudited) – continued
| Common Stocks – continued |
|||||
| Shares | Value | ||||
| FINANCIALS – continued |
|||||
| Real Estate Management & Development – continued |
|||||
| CB Richard Ellis Group, Inc. Class A (a) |
153,300 | $ | 5,595,450 | ||
| China Seven Star Shopping Ltd. (a) |
10,000 | 1,266 | |||
| Derwent London PLC |
247,400 | 9,116,352 | |||
| Fabege AB |
685,400 | 7,566,117 | |||
| Hang Lung Properties Ltd. |
1,000 | 3,447 | |||
| Henderson Land Development Co. Ltd. |
1,000 | 6,810 | |||
| Hopson Development Holdings Ltd. |
8,390,000 | 23,552,345 | |||
| Indiabulls Real Estate Ltd. (a) |
300 | 3,097 | |||
| Joint Corp. |
20,600 | 647,304 | |||
| Kenedix, Inc. (d) |
6,992 | 13,057,486 | |||
| Keppel Land Ltd. |
1,200,100 | 6,856,819 | |||
| Kerry Properties Ltd. |
6,148,991 | 38,612,065 | |||
| Megaworld Corp. |
12,277,000 | 1,062,484 | |||
| Mirland Development Corp. PLC |
63,000 | 752,736 | |||
| New World China Land Ltd. |
12,373,200 | 10,523,043 | |||
| Patrizia Immobilien AG |
814,200 | 14,457,430 | |||
| PIK Group GDR (a) |
100 | 2,500 | |||
| Robinsons Land Corp. |
4,868,500 | 2,053,997 | |||
| Sankei Building Co. Ltd. (d) |
441,700 | 4,461,471 | |||
| Shun Tak Holdings Ltd. |
1,494,200 | 2,197,578 | |||
| Sistema-Hals JSC unit (a) |
100 | 1,200 | |||
| SM Prime Holdings, Inc. |
125 | 32 | |||
| Songbird Estates PLC Class B |
591,400 | 3,265,873 | |||
| 162,093,274 | |||||
| Thrifts & Mortgage Finance – 0.3% |
|||||
| BankUnited Financial Corp. Class A |
403,390 | 8,096,037 | |||
| Clayton Holdings, Inc. (a) |
800 | 9,112 | |||
| Housing Development Finance Corp. Ltd. |
84 | 4,215 | |||
| Hypo Real Estate Holding AG |
11,800 | 766,725 | |||
| Hypo Real Estate Holding AG ADR |
11,800 | 769,360 | |||
| IndyMac Bancorp, Inc. |
100 | 2,917 | |||
| Radian Group, Inc. |
233,477 | 12,607,758 | |||
| 22,256,124 | |||||
| TOTAL FINANCIALS |
819,218,099 | ||||
| HEALTH CARE – 12.2% |
|||||
| Biotechnology – 0.7% |
|||||
| 3SBio, Inc. ADR |
55,600 | 535,984 | |||
| Alnylam Pharmaceuticals, Inc. (a) |
79,700 | 1,210,643 | |||
| Basilea Pharmaceutica AG (a) |
29,070 | 6,436,997 | |||
| BioCryst Pharmaceuticals, Inc. (a)(d) |
590,769 | 4,566,644 | |||
| Celgene Corp. (a) |
100 | 5,733 | |||
| Cepheid, Inc. (a) |
66,600 | 972,360 | |||
| CSL Ltd. |
183 | 13,655 | |||
| Cubist Pharmaceuticals, Inc. (a) |
100 | 1,971 | |||
| CuraGen Corp. (a) |
294,635 | 580,431 | |||
| CytRx Corp. (a) |
186,785 | 582,769 | |||
| deCODE genetics, Inc. (a) |
327,482 | 1,223,145 | |||
| Digene Corp. (a) |
100 | 6,005 | |||
| Genentech, Inc. (a) |
100 | 7,566 | |||
| Genitope Corp. (a) |
100 | 386 | |||
| Genomic Health, Inc. (a) |
763 | 14,344 | |||
| Genta, Inc. (a) |
100 | 29 | |||
| Human Genome Sciences, Inc. (a)(d) |
1,338,082 | 11,935,691 | |||
| Infinity Pharmaceuticals, Inc. (a) |
100 | 1,088 | |||
| Insmed, Inc. (a) |
1,000,074 | 810,060 | |||
| lomai Corp. (a) |
100 | 182 | |||
| MannKind Corp. (a) |
40 | 493 | |||
| Medarex, Inc. (a) |
179,700 | 2,567,913 | |||
| Molecular Insight Pharmaceuticals, Inc. |
66,700 | 629,648 | |||
| Momenta Pharmaceuticals, Inc. (a)(d) |
69,800 | 703,584 | |||
| Myriad Genetics, Inc. (a) |
100 | 3,719 | |||
| Orchid Cellmark, Inc. (a) |
927,253 | 4,302,454 | |||
| Osiris Therapeutics, Inc. |
100 | 1,351 | |||
| Pro-Pharmaceuticals, Inc. (a) |
100 | 42 | |||
| Q-Med AB |
101,500 | 1,454,367 | |||
| Sangamo Biosciences, Inc. (a)(d)(e) |
2,268,749 | 18,422,242 | |||
| Seattle Genetics, Inc. (a) |
385,945 | 3,786,120 | |||
| Sino Biopharmaceutical Ltd. |
4,000 | 803 | |||
| Sonus Pharmaceuticals, Inc. (a) |
100 | 528 | |||
| Synta Pharmaceuticals Corp. |
100 | 830 | |||
| Telik, Inc. (a) |
100 | 338 | |||
| Theravance, Inc. (a) |
100 | 3,200 | |||
| TorreyPines Therapeutics, Inc. (a) |
100 | 695 | |||
| Trubion Pharmaceuticals, Inc. |
100 | 2,088 | |||
| VaxGen, Inc. (a) |
100 | 160 | |||
| Vion Pharmaceuticals, Inc. (a) |
100 | 108 | |||
| 60,786,366 | |||||
| Health Care Equipment & Supplies – 2.7% |
|||||
| Abiomed, Inc. (a) |
100 | 1,078 | |||
| Align Technology, Inc. (a) |
100 | 2,416 | |||
| American Medical Systems Holdings, Inc. (a) |
100 | 1,804 | |||
| Angiodynamics, Inc. (a) |
648 | 11,670 | |||
| Beckman Coulter, Inc. |
513,100 | 33,187,308 | |||
| Becton, Dickinson & Co. |
919,332 | 68,490,234 | |||
| bioMerieux SA |
100 | 8,608 | |||
| Biophan Technologies, Inc. (a) |
100 | 16 | |||
| Clinical Data, Inc. (a) |
100 | 2,116 | |||
| Cochlear Ltd. |
100 | 5,172 | |||
| DENTSPLY International, Inc. |
100 | 3,826 | |||
| Edwards Lifesciences Corp. (a) |
1,760,680 | 86,871,951 | |||
| Fresenius AG |
300 | 23,111 | |||
| Gen-Probe, Inc. (a) |
100 | 6,042 | |||
| Greatbatch, Inc. (a) |
100 | 3,240 | |||
| Gyrus Group PLC (a) |
85,500 | 810,818 | |||
| Hologic, Inc. (a) |
200 | 11,062 | |||
| I-Flow Corp. (a) |
200 | 3,348 | |||
| IDEXX Laboratories, Inc. (a) |
100 | 9,463 | |||
| Immucor, Inc. (a) |
100 | 2,797 | |||
| Inverness Medical Innovations, Inc. (a) |
21,100 | 1,076,522 | |||
| Kinetic Concepts, Inc. (a) |
100 | 5,197 | |||
| Kyphon, Inc. (a) |
100 | 4,815 | |||
See accompanying notes which are an integral part of the financial statements.
| VIP Mid Cap Portfolio | 10 |
Table of Contents
Common Stocks – continued
| Shares | Value | ||||
| HEALTH CARE – continued |
|||||
| Health Care Equipment & Supplies – continued |
|||||
| Meridian Bioscience, Inc. |
150 | $ | 3,249 | ||
| Mindray Medical International Ltd. sponsored ADR |
118,000 | 3,602,540 | |||
| Neogen Corp. (a) |
100 | 2,876 | |||
| NMT Medical, Inc. (a) |
100 | 1,188 | |||
| NuVasive, Inc. (a) |
100 | 2,701 | |||
| Optos PLC (a) |
100 | 508 | |||
| Palomar Medical Technologies, Inc. (a) |
206,899 | 7,181,464 | |||
| Quidel Corp. (a) |
1,190,525 | 20,905,619 | |||
| Somanetics Corp. (a) |
100 | 1,831 | |||
| St. Jude Medical, Inc. (a) |
100 | 4,149 | |||
| ThermoGenesis Corp. (a) |
1,168,959 | 3,226,327 | |||
| Varian Medical Systems, Inc. (a) |
100 | 4,251 | |||
| Zimmer Holdings, Inc. (a) |
100 | 8,489 | |||
| 225,487,806 | |||||
| Health Care Providers & Services – 1.3% |
|||||
| Acibadem Saglik Hizmetleri AS |
185 | 1,297 | |||
| Aetna, Inc. |
100 | 4,940 | |||
| Apollo Hospitals Enterprise Ltd. |
100 | 1,283 | |||
| Bangkok Dusit Medical Service PCL (For. Reg.) |
100 | 129 | |||
| Brookdale Senior Living, Inc. |
221,620 | 10,099,223 | |||
| Bumrungrad Hospital PCL (For. Reg.) |
100 | 138 | |||
| Chindex International, Inc. (a)(d)(e) |
429,400 | 9,511,210 | |||
| Diagnosticos da America SA |
1,000 | 22,135 | |||
| Health Grades, Inc. (a) |
335,121 | 2,181,638 | |||
| Health Management Associates, Inc. Class A |
100 | 1,136 | |||
| Health Net, Inc. (a) |
245,000 | 12,936,000 | |||
| Humana, Inc. (a) |
164,700 | 10,031,877 | |||
| Laboratory Corp. of America Holdings (a) |
383,800 | 30,036,188 | |||
| Lincare Holdings, Inc. (a) |
907,800 | 36,175,830 | |||
| Medial Saude SA |
180,000 | 2,939,194 | |||
| National Research Corp. |
100 | 2,517 | |||
| Network Healthcare Holdings Ltd. |
100 | 204 | |||
| Nighthawk Radiology Holdings, Inc. (a) |
500 | 9,025 | |||
| Ramsay Health Care Ltd. |
100 | 951 | |||
| Sonic Healthcare Ltd. |
100 | 1,277 | |||
| 113,956,192 | |||||
| Health Care Technology – 1.5% |
|||||
| Allscripts Healthcare Solutions, Inc. (a)(d) |
88,800 | 2,262,624 | |||
| Cerner Corp. (a) |
26,400 | 1,464,408 | |||
| Eclipsys Corp. (a) |
619,353 | 12,263,189 | |||
| Emageon, Inc. (a) |
100 | 902 | |||
| Health Corp. (a) |
1,907,419 | 26,722,940 | |||
| iCAD, Inc. (a) |
100 | 414 | |||
| IMS Health, Inc. |
1,842,900 | 59,212,377 | |||
| Merge Technologies, Inc. (a) |
200 | 1,306 | |||
| Phase Forward, Inc. (a) |
49,900 | 839,817 | |||
| ProxyMed, Inc. (a) |
100 | 229 | |||
| TriZetto Group, Inc. (a) |
1,053,136 | 20,388,713 | |||
| 123,156,919 | |||||
| Life Sciences Tools & Services – 4.8% |
|||||
| Applera Corp.: |
|||||
| – Applied Biosystems Group |
100 | 3,054 | |||
| – Celera Genomics Group (a) |
400 | 4,960 | |||
| Bachem Holding AG (B Shares) |
100 | 8,342 | |||
| Bio-Imaging Technologies, Inc. (a) |
100 | 683 | |||
| Bio-Rad Laboratories, Inc. Class A (a) |
327 | 24,711 | |||
| Cambrex Corp. |
100 | 1,327 | |||
| Charles River Laboratories International, Inc. (a) |
430,900 | 22,243,058 | |||
| Dionex Corp. (a) |
100 | 7,099 | |||
| Evotec OAI AG (a) |
100 | 436 | |||
| Exelixis, Inc. (a) |
74 | 895 | |||
| Harvard Bioscience, Inc. (a)(e) |
1,875,657 | 9,847,199 | |||
| ICON PLC sponsored ADR |
406,452 | 17,778,210 | |||
| Illumina, Inc. (a) |
100 | 4,059 | |||
| Invitrogen Corp. (a) |
87,800 | 6,475,250 | |||
| Luminex Corp. (a) |
100 | 1,231 | |||
| Millipore Corp. (a) |
561,750 | 42,181,808 | |||
| Nektar Therapeutics (a) |
100 | 949 | |||
| QIAGEN NV (a)(d) |
4,314,300 | 76,751,397 | |||
| Thermo Fisher Scientific, Inc. (a) |
3,736,100 | 193,231,092 | |||
| Third Wave Technologies, Inc. (a) |
470,674 | 2,753,443 | |||
| Varian, Inc. (a) |
105,600 | 5,790,048 | |||
| Ventana Medical Systems, Inc. (a) |
56,643 | 4,376,805 | |||
| Waters Corp. (a) |
307,920 | 18,278,131 | |||
| 399,764,187 | |||||
| Pharmaceuticals – 1.2% |
|||||
| Akorn, Inc. (a) |
815,100 | 5,697,549 | |||
| Allergan, Inc. |
120,216 | 6,929,250 | |||
| BioMimetic Therapeutics, Inc. |
40,300 | 629,889 | |||
| Boiron SA |
55 | 1,853 | |||
| Chugai Pharmaceutical Co. Ltd. |
100 | 1,798 | |||
| Daiichi Sankyo Co. Ltd |
100 | 2,655 | |||
| Discovery Laboratories, Inc. (a) |
1,989,217 | 5,629,484 | |||
| Endo Pharmaceuticals Holdings, Inc. (a) |
2,348,697 | 80,395,898 | |||
| Hi-Tech Pharmacal Co., Inc. (a) |
100 | 1,194 | |||
| MGI Pharma, Inc. (a) |
100 | 2,237 | |||
| Pfizer Ltd. |
100 | 1,986 | |||
| Ranbaxy Laboratories Ltd. sponsored GDR |
75 | 664 | |||
| Roche Holding AG (participation certificate) |
149 | 26,507 | |||
| SuperGen, Inc. (a) |
100 | 556 | |||
| Wockhardt Ltd. |
86,000 | 816,284 | |||
| 100,137,804 | |||||
| TOTAL HEALTH CARE |
1,023,289,274 | ||||
See accompanying notes which are an integral part of the financial statements.
| 11 | Semiannual Report |
Table of Contents
VIP Mid Cap Portfolio
Investments (Unaudited) – continued
Common Stocks – continued
| Shares | Value | ||||
| INDUSTRIALS – 13.1% |
|||||
| Aerospace & Defense – 0.3% |
|||||
| Ceradyne, Inc. (a) |
277,245 | $ | 20,505,040 | ||
| DHB Industries, Inc. (a) |
91,800 | 481,950 | |||
| DynCorp International, Inc. Class A |
129,900 | 2,856,501 | |||
| Embraer – Empresa Brasileira de Aeronautica SA sponsored ADR |
100 | 4,821 | |||
| General Dynamics Corp. |
200 | 15,644 | |||
| QinetiQ Group plc |
100 | 373 | |||
| 23,864,329 | |||||
| Air Freight & Logistics – 0.2% |
|||||
| Business Post Group PLC |
200 | 1,920 | |||
| C.H. Robinson Worldwide, Inc. |
400 | 21,008 | |||
| Expeditors International of Washington, Inc. |
200 | 8,260 | |||
| FedEx Corp. |
100 | 11,097 | |||
| Panalpina Welttransport Holding AG |
82,690 | 17,531,688 | |||
| 17,573,973 | |||||
| Airlines – 0.1% |
|||||
| Air China Ltd. (H Shares) |
2,000 | 1,527 | |||
| easyJet PLC (a) |
100 | 1,054 | |||
| TAM SA (PN) sponsored ADR (ltd. vtg.) |
240,400 | 7,957,240 | |||
| 7,959,821 | |||||
| Building Products – 0.0% |
|||||
| Ameron International Corp. |
159 | 14,340 | |||
| Duratex SA |
100 | 2,851 | |||
| PGT, Inc. |
100 | 1,093 | |||
| Trex Co., Inc. (a) |
100 | 1,963 | |||
| 20,247 | |||||
| Commercial Services & Supplies – 2.0% |
|||||
| Administaff, Inc. |
100 | 3,349 | |||
| Advisory Board Co. (a) |
100 | 5,556 | |||
| Allied Waste Industries, Inc. (a) |
4,467,000 | 60,125,820 | |||
| Bio-Treat Technology Ltd. |
961,416 | 549,309 | |||
| Equifax, Inc. |
1,421,803 | 63,156,489 | |||
| Experian Group Ltd. |
100 | 1,264 | |||
| Fuel Tech, Inc. (a) |
133,100 | 4,558,675 | |||
| GFK AG |
20 | 987 | |||
| Intertek Group PLC |
484 | 9,564 | |||
| Kenexa Corp. (a) |
614,092 | 23,157,409 | |||
| Korn/Ferry International (a) |
264,000 | 6,932,640 | |||
| Midas International Holdings Ltd. |
4,166,000 | 506,152 | |||
| Monster Worldwide, Inc. (a) |
100 | 4,110 | |||
| Pike Electric Corp. (a)(d) |
102,200 | 2,287,236 | |||
| Randstad Holdings NV |
62,140 | 4,949,301 | |||
| Ritchie Brothers Auctioneers, Inc. |
100 | 6,262 | |||
| Robert Half International, Inc. |
100 | 3,650 | |||
| Sinomem Technology Ltd. |
2,723,000 | 2,702,641 | |||
| Societe Generale de Surveillance Holding SA (SGS) (Reg.) |
100 | 118,861 | |||
| Steelcase, Inc. Class A |
100 | 1,850 | |||
| Stericycle, Inc. (a) |
200 | 8,892 | |||
| Taiwan Secom Co. |
155,000 | 265,119 | |||
| Tianjin Capital Environmental Protection Co. Ltd. (H Shares) |
1,386,000 | 1,059,991 | |||
| United Envirotech Ltd. |
1,000 | 202 | |||
| 170,415,329 | |||||
| Construction & Engineering – 0.6% |
|||||
| Fluor Corp. |
37,900 | 4,220,923 | |||
| Gammon India Ltd. |
100 | 1,015 | |||
| GS Engineering & Construction Corp. |
29,690 | 3,551,167 | |||
| Hindustan Construction Co. Ltd. |
100 | 304 | |||
| Insituform Technologies, Inc. Class A (a) |
300 | 6,543 | |||
| IVRCL Infrastructures & Projects Ltd. |
688,326 | 6,107,885 | |||
| Jacobs Engineering Group, Inc. (a) |
340,140 | 19,561,451 | |||
| Larsen & Toubro Ltd. |
100 | 5,424 | |||
| Nagarjuna Construction Co. Ltd. |
175,022 | 769,622 | |||
| Orascom Construction Industries SAE GDR |
100 | 13,250 | |||
| Prajay Engineers Syndicate Ltd. |
115,252 | 717,250 | |||
| Schmack Biogas AG (d) |
65,400 | 4,956,692 | |||
| Shaw Group, Inc. (a) |
130,000 | 6,017,700 | |||
| SNC-Lavalin Group, Inc. |
100 | 3,652 | |||
| Taihei Dengyo Kaisha Ltd. |
462,000 | 3,507,389 | |||
| Unitech Ltd. |
100 | 1,246 | |||
| 49,441,513 | |||||
| Electrical Equipment – 3.1% |
|||||
| Acuity Brands, Inc. (d) |
212,900 | 12,833,612 | |||
| AstroPower, Inc. (a) |
100 | 0 | |||
| Ceres Power Holdings PLC (a) |
20,100 | 117,052 | |||
| Conergy AG |
100 | 7,850 | |||
| Cooper Industries Ltd. Class A |
2,067,740 | 118,047,277 | |||
| Crompton Greaves Ltd. |
100 | 625 | |||
| Distributed Energy Systems Corp. (a) |
100 | 130 | |||
| Dongfang Electrical Machinery Co. Ltd. (H Shares) |
366,000 | 2,026,780 | |||
| First Solar, Inc. |
718 | 64,110 | |||
| Genlyte Group, Inc. (a) |
100 | 7,854 | |||
| Grupo Corporacion Tecnologica SA |
100 | 3,654 | |||
| Harbin Electric, Inc. (a) |
93,494 | 1,543,586 | |||
| Hitachi Cable Ltd. |
1,000 | 5,862 | |||
| Johnson Electric Holdings Ltd. sponsored ADR |
100 | 545 | |||
| Jyoti Structures Ltd. |
100 | 460 | |||
| Kalpataru Power Transmission Ltd. |
40,000 | 1,464,380 | |||
| KEC International Ltd. |
100 | 1,383 | |||
| Legrand SA |
100 | 3,623 | |||
| Neo-Neon Holdings Ltd. |
12,185,000 | 25,993,171 | |||
| Nexans SA |
17,400 | 2,915,386 | |||
| Prysmian SpA |
116,600 | 2,834,204 | |||
| Q-Cells AG |
200 | 17,375 | |||
| Renewable Energy Corp. AS |
284,000 | 11,076,443 | |||
| Rockwell Automation, Inc. (d) |
603,311 | 41,893,916 | |||
| Schneider Electric SA |
89,800 | 12,655,473 | |||
See accompanying notes which are an integral part of the financial statements.
| VIP Mid Cap Portfolio | 12 |
Table of Contents
Common Stocks – continued
| Shares | Value | ||||
| INDUSTRIALS – continued |
|||||
| Electrical Equipment – continued |
|||||
| Seoul Semiconductor Co. Ltd. |
191,880 | $ | 11,215,589 | ||
| Solar Integrated Technologies, Inc. (a) |
100 | 225 | |||
| SolarWorld AG (d) |
404,968 | 18,744,462 | |||
| Thomas & Betts Corp. (a) |
100 | 5,800 | |||
| Vestas Wind Systems AS (a) |
100 | 6,620 | |||
| 263,487,447 | |||||
| Industrial Conglomerates – 0.4% |
|||||
| 3M Co. |
100 | 8,679 | |||
| Adilya Birla Nuvo Ltd. |
100 | 3,307 | |||
| Hutchison Whampoa Ltd. ADR |
100 | 4,995 | |||
| McDermott International, Inc. (a) |
56,000 | 4,654,720 | |||
| NWS Holdings Ltd. |
2,190,535 | 5,462,890 | |||
| Sequa Corp. Class A (a) |
6,243 | 699,216 | |||
| Shanghai Industrial Holdings Ltd. (H Shares) |
929,000 | 3,564,303 | |||
| Siemens India Ltd. |
100 | 3,440 | |||
| Teleflex, Inc. |
201,900 | 16,511,382 | |||
| 30,912,932 | |||||
| Machinery – 5.9% |
|||||
| A.S.V., Inc. (a) |
100 | 1,728 | |||
| AGCO Corp. (a) |
4,005,723 | 173,888,435 | |||
| Albany International Corp. Class A |
100 | 4,044 | |||
| American Science & Engineering, Inc. (a) |
100 | 5,685 | |||
| Badger Meter, Inc. (d) |
660,463 | 18,664,684 | |||
| Bucher Industries AG |
500 | 80,345 | |||
| China Infrastructure Machinery Holdings Ltd. |
326,000 | 712,104 | |||
| China Metal International Holdings, Inc. |
2,000 | 721 | |||
| China Yuchai International Ltd. |
100 | 1,142 | |||
| Circor International, Inc. |
250,853 | 10,141,987 | |||
| Crane Co. |
704,484 | 32,018,798 | |||
| Cummins India Ltd. |
100 | 839 | |||
| Danaher Corp. |
100 | 7,550 | |||
| Deere & Co. |
821,100 | 99,139,614 | |||
| Delachaux SA |
49,989 | 4,808,925 | |||
| Doosan Infracore Co. Ltd. |
100 | 3,356 | |||
| Dover Corp. |
578,841 | 29,607,717 | |||
| Eicher Motors Ltd. |
100 | 870 | |||
| ESCO Technologies, Inc. (a) |
100 | 3,626 | |||
| Graco, Inc. |
100 | 4,028 | |||
| Haitian International Holdings Ltd. |
1,139,000 | 872,546 | |||
| Hamworthy PLC |
74,400 | 866,535 | |||
| Hexagon AB (B Shares) |
55,200 | 1,069,392 | |||
| Hyflux Ltd. |
100 | 191 | |||
| IDEX Corp. |
1,650 | 63,591 | |||
| Jain Irrigation Systems Ltd. |
100 | 1,186 | |||
| JTEKT Corp. |
1,000 | 18,107 | |||
| Kadant, Inc. (a) |
178,881 | 5,581,087 | |||
| KCI Konecranes Oyj |
100 | 4,210 | |||
| Komax Holding AG (Reg.) |
100 | 16,945 | |||
| Krones AG |
2,900 | 676,646 | |||
| MAN AG |
156,600 | 22,626,975 | |||
| Metso Corp. sponsored ADR |
100 | 5,894 | |||
| PACCAR, Inc. |
150 | 13,056 | |||
| Parker Hannifin Corp. |
183,900 | 18,005,649 | |||
| Railpower Technologies Corp. (a) |
100 | 40 | |||
| Shanthi Gears Ltd. |
130,010 | 227,297 | |||
| Shin Zu Shing Co. Ltd. |
1,050,000 | 8,081,857 | |||
| SPX Corp. |
468,580 | 41,146,010 | |||
| Tata Motors Ltd. |
100 | 1,654 | |||
| Tata Motors Ltd. sponsored ADR |
100 | 1,642 | |||
| Terex Corp. (a) |
308,286 | 25,063,652 | |||
| Thermax Ltd. |
100 | 1,240 | |||
| Uzel Makina Sanayi AS (a) |
415,173 | 733,868 | |||
| Valmont Industries, Inc. |
100 | 7,276 | |||
| Vossloh AG |
20,600 | 2,419,709 | |||
| Wabash National Corp |
100 | 1,463 | |||
| 496,603,916 | |||||
| Marine – 0.0% |
|||||
| Hanjin Shipping Co. Ltd. |
80 | 3,524 | |||
| Kuehne & Nagel International AG |
100 | 9,234 | |||
| 12,758 | |||||
| Road & Rail – 0.5% |
|||||
| Burlington Northern Santa Fe Corp. |
100 | 8,514 | |||
| Con-way, Inc. |
438,600 | 22,035,264 | |||
| CSX Corp. |
354,900 | 15,998,892 | |||
| Guangshen Railway Co. Ltd. sponsored ADR |
100 | 4,045 | |||
| Knight Transportation, Inc. |
225 | 4,361 | |||
| Landstar System, Inc. |
100 | 4,825 | |||
| Norfolk Southern Corp. |
100 | 5,257 | |||
| Old Dominion Freight Lines, Inc. (a) |
100 | 3,015 | |||
| 38,064,173 | |||||
| Trading Companies & Distributors – 0.0% |
|||||
| Aircastle Ltd. |
100 | 3,981 | |||
| GATX Corp. |
100 | 4,925 | |||
| MSC Industrial Direct Co., Inc. Class A |
77 | 4,235 | |||
| Richelieu Hardware Ltd. |
100 | 2,283 | |||
| 15,424 | |||||
| Transportation Infrastructure – 0.0% |
|||||
| Anhui Expressway Co. Ltd. (H Shares) |
2,000 | 1,686 | |||
| Macquarie Infrastructure Group unit |
102 | 311 | |||
| 1,997 | |||||
| TOTAL INDUSTRIALS |
1,098,373,859 | ||||
| INFORMATION TECHNOLOGY – 23.0% |
|||||
| Communications Equipment – 5.1% |
|||||
| ADC Telecommunications, Inc. (a) |
1,677,096 | 30,741,170 | |||
| Airspan Networks, Inc. (a) |
100 | 363 | |||
| Alvarion Ltd. (a) |
600 | 5,598 | |||
| Cisco Systems, Inc. (a) |
4,494,100 | 125,160,685 | |||
See accompanying notes which are an integral part of the financial statements.
| 13 | Semiannual Report |
Table of Contents
VIP Mid Cap Portfolio
Investments (Unaudited) – continued
| Common Stocks – continued |
|||||
| Shares | Value | ||||
| INFORMATION TECHNOLOGY – continued |
|||||
| Communications Equipment – continued |
|||||
| CommScope, Inc. (a) |
100 | $ | 5,835 | ||
| F5 Networks, Inc. (a) |
510,800 | 41,170,480 | |||
| Finisar Corp. (a) |
100 | 378 | |||
| Gemtek Technology Corp. |
151,000 | 389,722 | |||
| Harris Corp. |
100 | 5,455 | |||
| Infinera Corp. |
100 | 2,492 | |||
| Juniper Networks, Inc. (a) |
8,706,696 | 219,147,521 | |||
| Option NV (a) |
360 | 7,167 | |||
| Plantronics, Inc. |
7,900 | 207,138 | |||
| RADWARE Ltd. (a) |
324,500 | 4,721,475 | |||
| Vyyo, Inc. (a) |
100 | 664 | |||
| Zyxel Communications Corp. |
1,038,470 | 1,922,153 | |||
| 423,488,296 | |||||
| Computers & Peripherals – 2.7% |
|||||
| Acer, Inc. |
7,628,000 | 15,610,140 | |||
| Apple, Inc. (a) |
980,500 | 119,660,220 | |||
| ASUSTeK Computer, Inc. |
459,000 | 1,267,367 | |||
| Diebold, Inc. |
100 | 5,220 | |||
| Gemalto NV (a) |
16 | 372 | |||
| I-Chiun Precision Industries Co. Ltd. |
3,671,000 | 5,499,772 | |||
| Lenovo Group Ltd. |
5,280,000 | 3,112,953 | |||
| Lenovo Group Ltd. ADR |
100 | 1,165 | |||
| Lexmark International, Inc. Class A (a) |
623,600 | 30,749,716 | |||
| Logitech International SA (a) |
250,943 | 6,622,386 | |||
| Logitech International SA (Reg.) (a) |
200 | 5,278 | |||
| Moser-Baer India Ltd. |
100 | 1,154 | |||
| Psion PLC |
33 | 84 | |||
| SanDisk Corp. (a) |
20 | 979 | |||
| Sun Microsystems, Inc. (a) |
7,990,500 | 42,030,030 | |||
| Unisteel Technology Ltd. |
2,470,625 | 3,613,699 | |||
| 228,180,535 | |||||
| Electronic Equipment & Instruments – 2.3% |
|||||
| Acacia Research Corp. – Acacia Technologies (a) |
100 | 1,616 | |||
| Agilent Technologies, Inc. (a) |
1,094,059 | 42,055,628 | |||
| Amphenol Corp. Class A |
200 | 7,130 | |||
| China EnerSave Ltd. |
12,373,000 | 1,737,043 | |||
| CPI International, Inc. |
754,472 | 14,961,180 | |||
| Daktronics, Inc. |
200 | 4,296 | |||
| Digital China Holdings Ltd. (H Shares) |
19,601,000 | 8,548,114 | |||
| Echelon Corp. (a) |
4,525 | 70,726 | |||
| Everlight Electronics Co. Ltd. |
3,399,000 | 12,198,610 | |||
| Gold Circuit Electronics Ltd. |
4,532,000 | 3,529,811 | |||
| Hana Microelectronics PCL (For. Reg.) |
509,400 | 416,695 | |||
| Hon Hai Precision Industry Co. Ltd. (Foxconn) |
50,000 | 433,720 | |||
| Horiba Ltd. |
100 | 4,100 | |||
| Ingenico SA (d) |
364,130 | 10,792,617 | |||
| IPG Photonics Corp. |
52,543 | 1,048,233 | |||
| Itron, Inc. (a) |
109,136 | 8,506,060 | |||
| L-1 Identity Solutions, Inc. |
100 | 2,045 | |||
| Maxwell Technologies, Inc. (a)(d) |
315,586 | 4,487,633 | |||
| Measurement Specialties, Inc. (a) |
100 | 2,368 | |||
| Meiko Electronics Co. Ltd. |
100 | 3,719 | |||
| Mettler-Toledo International, Inc. (a) |
505,174 | 48,249,169 | |||
| Motech Industries, Inc. |
196,000 | 2,574,221 | |||
| Murata Manufacturing Co. Ltd. |
100 | 7,543 | |||
| Nichicon Corp. |
113,100 | 1,615,321 | |||
| Nihon Dempa Kogyo Co. Ltd. |
100 | 5,684 | |||
| Nippon Electric Glass Co. Ltd. |
594,000 | 10,490,013 | |||
| NovAtel, Inc. (a) |
100 | 3,630 | |||
| Oriental Investment Corp. Ltd. (a) |
20,000 | 2,097 | |||
| Prime View International Co. Ltd. (a) |
1,304,000 | 1,481,637 | |||
| Robotic Vision Systems, Inc. (a) |
100 | 1 | |||
| Rogers Corp. (a) |
100 | 3,700 | |||
| Sunpower Corp. Class A (a)(d) |
300,800 | 18,965,440 | |||
| Tektronix, Inc. |
100 | 3,374 | |||
| Unity Opto Technology Co. Ltd. |
1,000 | 1,289 | |||
| Universal Display Corp. (a) |
25,600 | 402,176 | |||
| Yageo Corp. sponsored GDR (a) |
100 | 235 | |||
| 192,616,874 | |||||
| Internet Software & Services – 1.8% |
|||||
| Answers Corp. (a) |
100 | 1,235 | |||
| aQuantive, Inc. (a) |
11 | 702 | |||
| Art Technology Group, Inc. (a) |
100 | 266 | |||
| Aun Consulting, Inc. (a) |
36 | 64,599 | |||
| Baidu.com, Inc. sponsored ADR (a) |
100 | 16,798 | |||
| Blinkx PLC |
3,876,776 | 3,386,455 | |||
| CNET Networks, Inc. (a) |
100 | 819 | |||
| DA Consortium, Inc. |
1,591 | 888,769 | |||
| DealerTrack Holdings, Inc. (a) |
992,361 | 36,558,579 | |||
| Digital River, Inc. (a) |
100 | 4,525 | |||
| eCollege.com (a) |
148,433 | 3,302,634 | |||
| F@N Communications, Inc. (d) |
325 | 538,324 | |||
| INFO Edge India Ltd. |
100 | 1,924 | |||
| Internap Network Services Corp. (a)(d) |
1,104,439 | 15,926,010 | |||
| LBI International AB (a) |
82,100 | 642,213 | |||
| LivePerson, Inc. (a) |
1,268,773 | 6,787,936 | |||
| LoopNet, Inc. |
390,991 | 9,121,820 | |||
| Omniture, Inc. |
196,105 | 4,494,727 | |||
| Online Resources Corp. (a) |
100 | 1,098 | |||
| Open Business Club AG |
44,990 | 2,786,911 | |||
| Open Text Corp. (a) |
36,700 | 804,110 | |||
| Openwave Systems, Inc. |
100 | 626 | |||
| Rediff.com India Ltd. sponsored ADR (a)(d) |
39,000 | 698,880 | |||
| Sify Ltd. sponsored ADR (a)(d) |
677,350 | 5,974,227 | |||
| Tencent Holdings Ltd. |
1,904,000 | 7,670,350 | |||
| TheStreet.com, Inc. |
100 | 1,088 | |||
| ValueClick, Inc. (a) |
766,361 | 22,576,995 | |||
| VistaPrint Ltd. (a) |
203,412 | 7,780,509 | |||
| Visual Sciences, Inc. (a) |
699,000 | 10,813,530 | |||
| Websense, Inc. (a) |
620,936 | 13,194,890 | |||
| 154,041,549 | |||||
See accompanying notes which are an integral part of the financial statements.
| VIP Mid Cap Portfolio | 14 |
Table of Contents
| Common Stocks – continued |
|||||
| Shares | Value | ||||
| INFORMATION TECHNOLOGY – continued |
|||||
| IT Services – 2.0% |
|||||
| Authorize. Net Holdings, Inc. (a) |
402,211 | $ | 7,195,555 | ||
| Cap Gemini SA |
36,800 | 2,707,904 | |||
| CheckFree Corp. (a) |
100 | 4,020 | |||
| Cognizant Technology Solutions Corp. Class A (a) |
138,600 | 10,407,474 | |||
| eLoyally Corp. |
100 | 2,225 | |||
| Mastercard, Inc. Class A (d) |
385,900 | 64,009,233 | |||
| Nomura Research Institute Ltd. |
2,787,400 | 82,155,421 | |||
| Patni Computer Systems Ltd. sponsored ADR |
39,500 | 995,795 | |||
| SAIC, Inc. |
24,700 | 446,329 | |||
| Syntel, Inc. |
100 | 3,039 | |||
| WNS Holdings Ltd. ADR |
100 | 2,846 | |||
| 167,929,841 | |||||
| Office Electronics – 0.0% |
|||||
| Zebra Technologies Corp. Class A (a) |
75 | 2,906 | |||
| Semiconductors & Semiconductor Equipment – 6.3% |
|||||
| Advanced Micro Devices, Inc. (a) |
100 | 1,430 | |||
| Advanced Semiconductor Manufacturing Corp. Ltd. (H Shares) |
2,000 | 200 | |||
| Advantest Corp. ADR |
100 | 4,374 | |||
| Aixtron AG (a) |
200 | 1,762 | |||
| Aixtron AG sponsored ADR (a) |
100 | 870 | |||
| Alliance Semiconductor Corp. |
100 | 500 | |||
| Altera Corp. |
8,884,324 | 196,610,090 | |||
| ANADIGICS, Inc. (a)(d) |
1,110,248 | 15,310,320 | |||
| Arima Optoelectronics Corp. |
1,743,000 | 2,387,708 | |||
| ARM Holdings PLC sponsored ADR |
100 | 875 | |||
| ASML Holding NV (a) |
120,600 | 3,310,470 | |||
| ASML Holding NV (NY Shares) (a) |
1,495,800 | 41,059,710 | |||
| ATMI, Inc. (a)(e) |
1,775,576 | 53,267,280 | |||
| Bright Led Electronics Corp. |
962,000 | 1,595,498 | |||
| Cambridge Display Technologies, Inc. (a) |
100 | 641 | |||
| Credence Systems Corp. (a) |
100 | 360 | |||
| Cree, Inc. (a)(d) |
863,216 | 22,314,134 | |||
| Elpida Memory, Inc. (a) |
100 | 4,409 | |||
| Epistar Corp. |
7,649,000 | 31,423,045 | |||
| Ersol Solar Energy AG (a) |
100 | 9,081 | |||
| Fairchild Semiconductor International, Inc. (a) |
100 | 1,932 | |||
| Formosa Epitaxy, Inc. (a) |
1,000 | 984 | |||
| Global Mixed-Mode Tech, Inc. |
82,000 | 1,041,906 | |||
| Harvatek Corp. |
1,000 | 1,411 | |||
| Hittite Microwave Corp. (a) |
100 | 4,273 | |||
| Holtek Semiconductor, Inc. |
1,385,000 | 2,813,149 | |||
| Infineon Technologies AG sponsored ADR (a) |
100 | 1,653 | |||
| Integrated Device Technology, Inc. (a) |
1,091,753 | 16,671,068 | |||
| International Rectifier Corp. (a) |
51,600 | 1,922,616 | |||
| Intersil Corp. Class A |
1,226,143 | 38,574,459 | |||
| KLA-Tencor Corp. |
100 | 5,495 | |||
| Lam Research Corp. (a) |
100 | 5,140 | |||
| LSI Corp. (a) |
1,747,021 | 13,120,128 | |||
| MediaTek, Inc. |
689,000 | 10,774,832 | |||
| Microchip Technology, Inc. |
100 | 3,704 | |||
| MIC Probe, Inc. |
1,000 | 4,215 | |||
| National Semiconductor Corp. |
100 | 2,827 | |||
| O2Micro International Ltd. sponsored ADR (a) |
202,400 | 2,241,580 | |||
| Opto Technology Corp. (a) |
8,347,000 | 7,113,051 | |||
| Powertech Technology, Inc. |
1,000,000 | 4,184,484 | |||
| Realtek Semiconductor Corp. |
154,000 | 766,707 | |||
| Richtek Technology Corp. |
1,595,000 | 25,332,926 | |||
| Saifun Semiconductors Ltd. (a) |
3,700 | 43,956 | |||
| Samco, Inc. |
100 | 1,161 | |||
| Semiconductor Manufacturing International Corp. sponsored ADR (a) |
100 | 689 | |||
| Silicon Laboratories, Inc. (a) |
100 | 3,461 | |||
| Siliconware Precision Industries Co. Ltd. sponsored ADR |
1,363,400 | 14,997,400 | |||
| SiRF Technology Holdings, Inc. (a) |
100 | 2,074 | |||
| Skyworks Solutions, Inc. (a) |
100 | 735 | |||
| Soitec SA (a) |
62,400 | 1,335,189 | |||
| Supertex, Inc. (a) |
100 | 3,134 | |||
| Teradyne, Inc. (a) |
729,000 | 12,815,820 | |||
| Tyntek Corp. |
1,000 | 1,093 | |||
| Ultratech, Inc. (a) |
100 | 1,333 | |||
| Varian Semiconductor Equipment Associates, Inc. (a) |
100 | 4,006 | |||
| Veeco Instruments, Inc. (a) |
100 | 2,074 | |||
| Zetex PLC |
876,700 | 1,566,846 | |||
| 522,670,268 | |||||
| Software – 2.8% |
|||||
| Activision, Inc. (a) |
1 | 19 | |||
| Adobe Systems, Inc. (a) |
652,500 | 26,197,875 | |||
| Amdocs Ltd. (a) |
383,000 | 15,251,060 | |||
| Autonomy Corp. PLC (a) |
3,876,776 | 56,051,668 | |||
| Business Objects SA sponsored ADR (a) |
517,900 | 20,115,236 | |||
| Cadence Design Systems, Inc. (a) |
997,331 | 21,901,389 | |||
| Cognos, Inc. (a) |
219,800 | 8,719,467 | |||
| Digimarc Corp. (a) |
100 | 981 | |||
| Electronic Arts, Inc. (a) |
197,741 | 9,357,104 | |||
| Financial Technology (India) Ltd. |
78 | 5,799 | |||
| Interactive Intelligence, Inc. (a) |
339,714 | 6,998,108 | |||
| Kingdee International Software Group Co. Ltd. |
2,552,000 | 2,310,743 | |||
| Lawson Software, Inc. (a) |
100 | 989 | |||
| Midway Games, Inc. (a) |
100 | 636 | |||
| Napster, Inc. (a) |
100 | 340 | |||
| Nintendo Co. Ltd. |
100 | 36,680 | |||
| Quality Systems, Inc. (d) |
309,043 | 11,734,363 | |||
| Salary.com, Inc. |
185,900 | 2,230,800 | |||
| Sandvine Corp. (a) |
1,910,200 | 10,579,845 | |||
| Scientific Learning Corp. (a) |
100 | 675 | |||
| Smith Micro Software, Inc. (a) |
100 | 1,506 | |||
See accompanying notes which are an integral part of the financial statements.
| 15 | Semiannual Report |
Table of Contents
VIP Mid Cap Portfolio
Investments (Unaudited) – continued
| Common Stocks – continued |
|||||
| Shares | Value | ||||
| INFORMATION TECHNOLOGY – continued |
|||||
| Software – continued |
|||||
| Subex Azure Ltd. |
89 | $ | 1,355 | ||
| Symantec Corp. (a) |
100 | 2,020 | |||
| Tata Elxsi Ltd. |
100 | 831 | |||
| Telelogic AB (a)(d) |
3,423,100 | 10,510,440 | |||
| The9 Ltd. sponsored ADR (a)(d) |
155,000 | 7,170,300 | |||
| THQ, Inc. (a) |
1,100 | 33,572 | |||
| Ubisoft Entertainment SA (a) |
384,500 | 20,372,967 | |||
| 229,586,768 | |||||
| TOTAL INFORMATION TECHNOLOGY |
1,918,517,037 | ||||
| MATERIALS – 6.0% |
|||||
| Chemicals – 1.9% |
|||||
| ADA-ES, Inc. (a) |
100 | 2,093 | |||
| Advansa Sasa Polyester Sanayi AS (a) |
1 | 1 | |||
| Air Products & Chemicals, Inc. |
100 | 8,037 | |||
| Asian Paints India Ltd. |
385,678 | 7,710,229 | |||
| Dyno Nobel Ltd. |
100 | 203 | |||
| Ecolab, Inc. |
1,580,000 | 67,466,000 | |||
| Filtrona PLC |
50 | 262 | |||
| JSR Corp. |
394,700 | 9,534,203 | |||
| Jubilant Organosys Ltd. |
100 | 760 | |||
| Kuraray Co. Ltd. |
125,000 | 1,466,588 | |||
| Lubrizol Corp. |
173,200 | 11,180,060 | |||
| Methanex Corp. |
103,700 | 2,573,882 | |||
| Monsanto Co. |
200 | 13,508 | |||
| Quaker Chemical Corp. |
100 | 2,360 | |||
| Recticel SA |
100 | 1,529 | |||
| RPM International, Inc. |
100 | 2,311 | |||
| Sensient Technologies Corp. |
732,890 | 18,608,077 | |||
| Sinopec Shanghai Petrochemical Co. Ltd. (H Shares) |
922,000 | 603,724 | |||
| Sodiff Advanced Materials Co. Ltd. |
100 | 4,817 | |||
| Syngenta AG sponsored ADR |
74,500 | 2,900,285 | |||
| Terra Nitrogen Co. LP |
103,700 | 13,177,159 | |||
| Tokuyama Corp. |
2,117,000 | 27,605,569 | |||
| United Phosphorous Ltd. |
100 | 768 | |||
| Zoltek Companies, Inc. (a) |
100 | 4,153 | |||
| 162,866,578 | |||||
| Construction Materials – 0.0% |
|||||
| Florida Rock Industries, Inc. |
100 | 6,750 | |||
| Headwaters, Inc. (a) |
100 | 1,727 | |||
| Shree Cement Ltd. |
100 | 3,157 | |||
| 11,634 | |||||
| Containers & Packaging – 0.0% |
|||||
| Essel Propack Ltd. (a) |
1,080,401 | 1,731,574 | |||
| Packaging Corp. of America |
100 | 2,531 | |||
| Sealed Air Corp. |
200 | 6,204 | |||
| Sonoco Products Co. |
100 | 4,281 | |||
| 1,744,590 | |||||
| Metals & Mining – 3.2% |
|||||
| Adilya Birla Minerals Ltd. |
394,800 | 950,749 | |||
| Agnico-Eagle Mines Ltd. (a) |
23,350 | 417,732 | |||
| Alamos Gold, Inc. (a) |
2,718,700 | 14,036,940 | |||
| Aquarius Platinum Ltd. (Australia) |
42,383 | 1,290,917 | |||
| Barrick Gold Corp. |
81,700 | 2,376,030 | |||
| BHP Billiton Ltd. sponsored ADR |
100 | 5,975 | |||
| BlueScope Steel Ltd. |
100 | 877 | |||
| Brush Engineered Materials, Inc. (a) |
100 | 4,199 | |||
| Eldorado Gold Corp. (a) |
8,085,900 | 47,365,422 | |||
| FNX Mining Co., Inc. (a) |
100 | 3,043 | |||
| Freeport-McMoRan Copper & Gold, Inc. Class B |
80,668 | 6,680,924 | |||
| Grupo Mexico SA de CV Series B |
100 | 611 | |||
| High River Gold Mines Ltd. (a) |
8,491,900 | 23,118,057 | |||
| IAMGOLD Corp. |
3,863,100 | 29,737,076 | |||
| Inmet Mining Corp. |
100 | 7,735 | |||
| Ivanhoe Mines Ltd. (a) |
100 | 1,418 | |||
| Kinross Gold Corp. (a) |
4,564,666 | 53,091,961 | |||
| Lihir Gold Ltd. (a) |
2,370,500 | 6,030,196 | |||
| Lihir Gold Ltd. sponsored ADR |
909,500 | 23,355,960 | |||
| Lundin Mining Corp. (a) |
970,821 | 11,720,026 | |||
| Maharashtra Seamless Ltd. |
70,000 | 1,145,392 | |||
| Mechel Steel Group OAO sponsored ADR |
100 | 3,653 | |||
| Meridian Gold, Inc. (a) |
100 | 2,758 | |||
| Miramar Mining Corp. (a) |
1,007,300 | 4,359,214 | |||
| Newcrest Mining Ltd. |
850,000 | 16,469,309 | |||
| Newmont Mining Corp. |
274,500 | 10,721,970 | |||
| Northern Orion Resources, Inc. (a) |
100 | 570 | |||
| POSCO sponsored ADR |
100 | 12,000 | |||
| Royal Gold, Inc. |
459,942 | 10,932,821 | |||
| Shore Gold, Inc. (a) |
805,600 | 3,705,647 | |||
| Sumitomo Metal Mining Co. Ltd. |
1,600 | 34,752 | |||
| Vedanta Resources PLC |
100 | 3,243 | |||
| Xstrata PLC |
100 | 5,998 | |||
| 267,593,175 | |||||
| Paper & Forest Products – 0.9% |
|||||
| Aracruz Celulose SA (PN-B) sponsored ADR (non-vtg.) |
100 | 6,624 | |||
| Ballarpur Industries Ltd. |
100 | 292 | |||
| Cathay Forest Products Corp. (a) |
40,100 | 50,066 | |||
| Glatfelter |
100 | 1,359 | |||
| Gunns Ltd. |
1,445,044 | 4,006,813 | |||
| International Forest Products Ltd. (Interfor) Class A (sub. vtg.) (a) |
9,100 | 76,969 | |||
| Lee & Man Paper Manufacturing Ltd. |
7,938,000 | 21,978,936 | |||
| Pope Resources, Inc. LP |
100 | 4,866 | |||
| Shandong Chenming Paper Holdings Ltd. (B Shares) |
100 | 87 | |||
See accompanying notes which are an integral part of the financial statements.
| VIP Mid Cap Portfolio | 16 |
Table of Contents
| Common Stocks – continued |
|||||
| Shares | Value | ||||
| MATERIALS – continued |
|||||
| Paper & Forest Products – continued |
|||||
| Sino-Forest Corp. (a) |
1,831,000 | $ | 26,298,334 | ||
| Votorantim Celulose e Papel SA sponsored ADR (non-vtg.) |
867,600 | 19,755,252 | |||
| 72,179,598 | |||||
| TOTAL MATERIALS |
504,395,575 | ||||
| TELECOMMUNICATION SERVICES – 0.0% |
|||||
| Diversified Telecommunication Services – 0.0% |
|||||
| Golden Telecom, Inc. |
100 | 5,501 | |||
| LG Dacom Corp. |
32,020 | 873,415 | |||
| Pipex Communications PLC (a) |
100 | 26 | |||
| PT Indosat Tbk sponsored ADR |
100 | 3,625 | |||
| PT Telkomunikasi Indonesia Tbk sponsored ADR |
100 | 4,310 | |||
| 886,877 | |||||
| Wireless Telecommunication Services – 0.0% |
|||||
| Clearwire Corp. |
100 | 2,443 | |||
| Nil Holdings, Inc. (a) |
36 | 2,907 | |||
| Philippine Long Distance Telephone Co. |
100 | 5,733 | |||
| Sprint Nextel Corp. |
36,700 | 760,057 | |||
| Telemig Celular Participacoes SA sponsored ADR |
100 | 5,034 | |||
| 776,174 | |||||
| TOTAL TELECOMMUNICATION SERVICES |
1,663,051 | ||||
| UTILITIES – 2.7% |
|||||
| Electric Utilities – 0.0% |
|||||
| Areva T&D India Ltd. |
100 | 3,747 | |||
| Entergy Corp. |
5,175 | 555,536 | |||
| Korea Electric Power Corp. sponsored ADR |
100 | 2,190 | |||
| 561,473 | |||||
| Gas Utilities – 0.7% |
|||||
| Aegis Logistics Ltd. |
120,637 | 400,982 | |||
| AGL Resources, Inc. |
1,421,200 | 57,530,176 | |||
| China Gas Holdings Ltd. |
2,000 | 857 | |||
| 57,932,015 | |||||
| Independent Power Producers & Energy Traders – 0.7% |
|||||
| AES Corp. (a) |
2,195,300 | 48,033,164 | |||
| Black Hills Corp. |
308,906 | 12,279,014 | |||
| International Power PLC sponsored ADR |
100 | 8,560 | |||
| NTPC Ltd. |
100 | 377 | |||
| Ormat Technologies, Inc. |
100 | 3,768 | |||
| PTC India Ltd. |
100 | 158 | |||
| 60,325,041 | |||||
| Multi-Utilities – 1.3% |
|||||
| CH Energy Group, Inc. |
34,633 | 1,557,446 | |||
| CMS Energy Corp. |
277,854 | 4,779,089 | |||
| Sempra Energy |
1,645,134 | 97,441,287 | |||
| Veolia Environment sponsored ADR |
100 | 7,841 | |||
| Wisconsin Energy Corp. |
100 | 4,423 | |||
| 103,790,086 | |||||
| Water Utilities – 0.0% |
|||||
| Eastern Water Resources Development & Management PCL (For.Reg.) |
100 | 15 | |||
| Guangdong Investment Ltd. |
2,000 | 1,166 | |||
| Puncak Niaga Holding BHD |
70 | 73 | |||
| Sino-Environment Technology Group Ltd. |
1,000 | 2,142 | |||
| 3,396 | |||||
| TOTAL UTILITIES |
222,612,011 | ||||
| TOTAL COMMON STOCKS |
8,165,816,989 | ||||
| Nonconvertible Preferred Stocks – 0.0% |
|||||
| CONSUMER DISCRETIONARY – 0.0% |
|||||
| Household Durables – 0.0% |
|||||
| Fedders Corp. Series A, 8.60% (a) |
5 | 10 | |||
| TOTAL NONCONVERTIBLE PREFERRED STOCKS |
10 | ||||
| Money Market Funds – 6.0% |
|||||
| Fidelity Cash Central Fund, 5.32% (b) |
216,952,226 | 216,952,226 | |||
| Fidelity Securities Lending Cash Central Fund, 5.4% (b)(c) |
285,343,850 | 285,343,850 | |||
| TOTAL MONEY MARKET FUNDS |
502,296,076 | ||||
See accompanying notes which are an integral part of the financial statements.
| 17 | Semiannual Report |
Table of Contents
VIP Mid Cap Portfolio
Investments (Unaudited) – continued
| Cash Equivalents – 0.0% |
|||||||
| Maturity Amount |
Value | ||||||
| Investments in repurchase agreements in a joint trading account at 4.32%, dated 6/29/07 due 7/2/07 (Collateralized by U.S. Treasury
Obligations) # |
$ | 4,786,722 | $ | 4,785,000 | |||
| TOTAL INVESTMENT PORTFOLIO – 103.7% |
8,672,898,075 | ||||||
| NET OTHER ASSETS – (3.7)% |
(312,072,427 | ) | |||||
| NET ASSETS – 100% |
$ | 8,360,825,648 | |||||
Legend
| (a) | Non-income producing |
| (b) | Affiliated fund that is available only to investment companies and other accounts managed by Fidelity Investments. The rate quoted is the annualized seven-day yield of the fund at period end. A complete unaudited listing of the fund’s holdings as of its most recent quarter end is available upon request. |
| (c) | Investment made with cash collateral received from securities on loan. |
| (d) | Security or a portion of the security is on loan at period end. |
| (e) | Affiliated company |
| (f) | Security exempt from registration under Rule 144A of the Securities Act of 1933. These securities may be resold in transactions exempt from registration, normally to qualified institutional buyers. At the end of the period, the value of these securities amounted to $852,235 or 0.0% of net assets. |
| # | Additional Information on each counterparty to the repurchase agreement is as follows: |
| Repurchase Agreement / Counterparty |
Value | ||
| $4,785,000 due 7/02/07 at 4.32% |
|||
| Banc of America Securities LLC |
$ | 901,750 | |
| Bear Stearns & Co., Inc. |
2,103,427 | ||
| Lehman Brothers, Inc. |
1,779,823 | ||
| $ | 4,785,000 | ||
Affiliated Central Funds
Information regarding fiscal year to date income earned by the Fund from investments in Fidelity Central Funds is as follows:
| Fund |
Income earned | ||
| Fidelity Cash Central Fund |
$ | 4,003,224 | |
| Fidelity Securities Lending Cash Central Fund |
1,865,333 | ||
| Total |
$ | 5,868,557 | |
See accompanying notes which are an integral part of the financial statements.
| VIP Mid Cap Portfolio | 18 |
Table of Contents
Other Affiliated Issuers
An affiliated company is a company in which the fund has ownership of at least 5% of the voting securities. Fiscal year to date transactions with companies which are or were affiliates are as follows:
| Affiliates |
Value, beginning of period |
Purchases | Sales Proceeds |
Dividend Income |
Value, end of period | ||||||||||
| AGCO Corp. |
$ | 178,583,287 | $ | 3,101,472 | $ | 64,701,925 | $ | — | $ | — | |||||
| ATMI, Inc. |
— | 68,242,479 | 9,497,387 | — | 53,267,280 | ||||||||||
| Chindex International, Inc. |
— | 8,626,972 | — | — | 9,511,210 | ||||||||||
| Core Laboratories NV |
102,829,500 | — | 102,159,975 | — | — | ||||||||||
| Harvard Bioscience, Inc. |
7,500,753 | 2,348,222 | — | — | 9,847,199 | ||||||||||
| Internap Network Services Corp. |
44,130,594 | 534,879 | 17,290,645 | — | — | ||||||||||
| Metretek Technologies, Inc. |
1,232 | 18,784,743 | 2,688,384 | — | 17,603,129 | ||||||||||
| Newpark Resources, Inc. |
20,776,617 | 35,422,207 | 6,817,345 | — | 50,870,899 | ||||||||||
| Parker Drilling Co. |
39,970,900 | 30,215,722 | — | — | 84,914,920 | ||||||||||
| Sangamo Biosciences, Inc. |
— | 20,077,817 | 2,257,494 | — | 18,422,242 | ||||||||||
| Techwell, Inc. |
— | 32,403,160 | 26,075,785 | — | — | ||||||||||
| Total |
$ | 393,792,883 | $ | 219,757,673 | $ | 231,488,940 | $ | — | $ | 244,436,879 | |||||
Other Information
Distribution of investments by country of issue, as a percentage of total net assets, is as follows:
| United States of America |
73.4 | % | |
| Japan |
5.1 | % | |
| Canada |
3.0 | % | |
| Cayman Islands |
2.4 | % | |
| Taiwan |
2.0 | % | |
| United Kingdom |
1.8 | % | |
| Bermuda |
1.7 | % | |
| Netherlands |
1.5 | % | |
| France |
1.3 | % | |
| Germany |
1.2 | % | |
| Hong Kong |
1.0 | % | |
| Others (individually less than 1%) |
5.6 | % | |
| 100.0 | % | ||
See accompanying notes which are an integral part of the financial statements.
| 19 | Semiannual Report |
Table of Contents
Financial Statements
Statement of Assets and Liabilities
| June 30, 2007 (Unaudited) | ||||||
| Assets |
||||||
| Investment in securities, at value (including securities loaned of $279,453,857 and repurchase agreements of $4,785,000) – See accompanying schedule: |
||||||
| Unaffiliated issuers (cost $6,500,589,350) |
$ | 7,926,165,120 | ||||
| Fidelity Central Funds (cost $502,296,076) |
502,296,076 | |||||
| Other affiliated issuers (cost $213,721,471) |
244,436,879 | |||||
| Total Investments (cost $7,216,606,897) |
$ | 8,672,898,075 | ||||
| Cash |
467 | |||||
| Foreign currency held at value (cost $307,416) |
307,885 | |||||
| Receivable for investments sold |
66,319,016 | |||||
| Receivable for fund shares sold |
5,380,698 | |||||
| Dividends receivable |
5,563,610 | |||||
| Distributions receivable from Fidelity Central Funds |
1,424,767 | |||||
| Prepaid expenses |
15,581 | |||||
| Other receivables |
162,881 | |||||
| Total assets |
8,752,072,980 | |||||
| Liabilities |
||||||
| Payable for investments purchased |
$ | 95,039,217 | ||||
| Payable for fund shares redeemed |
4,534,514 | |||||
| Accrued management fee |
3,882,133 | |||||
| Distribution fees payable |
1,230,768 | |||||
| Other affiliated payables |
580,716 | |||||
| Other payables and accrued expenses |
636,134 | |||||
| Collateral on securities loaned, at value |
285,343,850 | |||||
| Total liabilities |
391,247,332 | |||||
| Net Assets |
$ | 8,360,825,648 | ||||
| Net Assets consist of: |
||||||
| Paid in capital |
$ | 6,210,097,435 | ||||
| Undistributed net investment income |
20,255,478 | |||||
| Accumulated undistributed net realized gain (loss) on investments and foreign currency transactions |
674,545,558 | |||||
| Net unrealized appreciation (depreciation) on investments and assets and liabilities in foreign currencies |
1,455,927,177 | |||||
| Net Assets |
$ | 8,360,825,648 | ||||
| Initial Class: |
||||||
| Net Asset Value, offering price and redemption price per share ($1,499,601,339 ÷ 42,481,078 shares) |
$ | 35.30 | ||||
| Service Class: |
||||||
| Net Asset Value, offering price and redemption price per share ($1,170,817,468 ÷ 33,342,893 shares) |
$ | 35.11 | ||||
| Service Class 2: |
||||||
| Net Asset Value, offering price and redemption price per share ($5,466,269,691 ÷ 157,282,429 shares) |
$ | 34.75 | ||||
| Investor Class: |
||||||
| Net Asset Value, offering price and redemption price per share ($224,137,150 ÷ 6,366,279 shares) |
$ | 35.21 | ||||
See accompanying notes which are an integral part of the financial statements.
| VIP Mid Cap Portfolio | 20 |
Table of Contents
Statement of Operations
| Six months ended June 30, 2007 (Unaudited) | |||||||
| Investment Income |
|||||||
| Dividends |
$ | 44,544,535 | |||||
| Interest |
74,166 | ||||||
| Income from Fidelity Central Funds (including $1,865,333 from security lending) |
5,868,557 | ||||||
| Total income |
50,487,258 | ||||||
| Expenses |
|||||||
| Management fee |
$ | 21,737,796 | |||||
| Transfer agent fees |
2,680,325 | ||||||
| Distribution fees |
6,863,124 | ||||||
| Accounting and security lending fees |
616,821 | ||||||
| Custodian fees and expenses |
472,797 | ||||||
| Independent trustees’ compensation |
11,808 | ||||||
| Registration fees |
7,744 | ||||||
| Audit |
54,852 | ||||||
| Legal |
20,340 | ||||||
| Interest |
8,186 | ||||||
| Miscellaneous |
720,413 | ||||||
| Total expenses before reductions |
33,194,206 | ||||||
| Expense reductions |
(648,392 | ) | 32,545,814 | ||||
| Net investment income (loss) |
17,941,444 | ||||||
| Realized and Unrealized Gain (Loss) |
|||||||
| Net realized gain (loss) on: |
|||||||
| Investment securities: |
|||||||
| Unaffiliated issuers |
626,272,106 | ||||||
| Other affiliated issuers |
72,527,780 | ||||||
| Foreign currency transactions |
113,578 | ||||||
| Total net realized gain (loss) |
698,913,464 | ||||||
| Change in net unrealized appreciation (depreciation) on: |
|||||||
| Investment securities (net of decrease in deferred foreign taxes of $303,974) |
186,165,747 | ||||||
| Assets and liabilities in foreign currencies |
(50,874 | ) | |||||
| Total change in net unrealized appreciation (depreciation) |
186,114,873 | ||||||
| Net gain (loss) |
885,028,337 | ||||||
| Net increase (decrease) in net assets resulting from operations |
$ | 902,969,781 | |||||
Statement of Changes in Net Assets
| Six months ended June 30, 2007 (Unaudited) |
Year ended December 31, 2006 |
|||||||
| Increase (Decrease) in Net Assets |
||||||||
| Operations |
||||||||
| Net investment income (loss) |
$ | 17,941,444 | $ | 27,365,970 | ||||
| Net realized gain (loss) |
698,913,464 | 689,061,913 | ||||||
| Change in net unrealized appreciation (depreciation) |
186,114,873 | 41,085,813 | ||||||
| Net increase (decrease) in net assets resulting from operations |
902,969,781 | 757,513,696 | ||||||
| Distributions to shareholders from net investment income |
(25,044,378 | ) | (14,545,563 | ) | ||||
| Distributions to shareholders from net realized gain |
(699,942,265 | ) | (746,524,101 | ) | ||||
| Total distributions |
(724,986,643 | ) | (761,069,664 | ) | ||||
| Share transactions – net increase (decrease) |
873,831,592 | 1,451,992,833 | ||||||
| Total increase (decrease) in net assets |
1,051,814,730 | 1,448,436,865 | ||||||
| Net Assets |
||||||||
| Beginning of period |
7,309,010,918 | 5,860,574,053 | ||||||
| End of period (including undistributed net investment income of $20,255,478 and undistributed net investment income of $27,410,326, respectively) |
$ | 8 360 825 648 | $ | 7,309,010,918 | ||||
See accompanying notes which are an integral part of the financial statements.
| 21 | Semiannual Report |
Table of Contents
Financial Highlights – Initial Class
| Six months ended June 30, 2007 (Unaudited) |
Years ended December 31, | |||||||||||||||||||||||
| 2006 | 2005 | 2004 | 2003K | 2002 | ||||||||||||||||||||
| Selected Per-Share Data |
||||||||||||||||||||||||
| Net asset value, beginning of period |
$ | 34.77 | $ | 35.11 | $ | 30.18 | $ | 24.16 | $ | 17.51 | $ | 19.60 | ||||||||||||
| Income from Investment Operations |
||||||||||||||||||||||||
| Net investment income (loss) E |
.11 | .19 | .16 | H | .01 | — | J | .09 | ||||||||||||||||
| Net realized and unrealized gain (loss) |
3.88 | 3.93 | 5.28 | 6.01 | 6.73 | (2.00 | ) | |||||||||||||||||
| Total from investment operations |
3.99 | 4.12 | 5.44 | 6.02 | 6.73 | (1.91 | ) | |||||||||||||||||
| Distributions from net investment income |
(.17 | ) | (.13 | ) | — | — | (.08 | ) | (.18 | ) | ||||||||||||||
| Distributions from net realized gain |
(3.29 | ) | (4.33 | ) | (.51 | ) | — | |||||||||||||||||
| Total distributions |
(3.46 | ) | (4.46 | ) | (.51 | ) | — | (.08 | ) | (.18 | ) | |||||||||||||
| Net asset value, end of period |
$ | 35.30 | $ | 34.77 | $ | 35.11 | $ | 30.18 | $ | 24.16 | $ | 17.51 | ||||||||||||
| Total Return B,C,D |
12.39 | % | 12.70 | % | 18.30 | % | 24.92 | % | 38.64 | % | (9.82 | )% | ||||||||||||
| Ratios to Average Net Assets F,I |
||||||||||||||||||||||||
| Expenses before reductions |
.68 | %A | .68 | % | .69 | % | .71 | % | .70 | % | .70 | % | ||||||||||||
| Expenses net of fee waivers, if any |
.68 | %A | .68 | % | .69 | % | .71 | % | .70 | % | .70 | % | ||||||||||||
| Expenses net of all reductions |
.66 | %A | .66 | % | .64 | % | .68 | % | .68 | % | .63 | % | ||||||||||||
| Net investment income (loss) |
.64 | %A | .58 | % | .50 | %H | .03 | % | — | % | .51 | % | ||||||||||||
| Supplemental Data |
||||||||||||||||||||||||
| Net assets, end of period (000 omitted) |
$ | 1,499,601 | $ | 1,352,385 | $ | 1,276,302 | $ | 979,533 | $ | 678,480 | $ | 499,557 | ||||||||||||
| Portfolio turnover rate G |
153 | %A | 149 | % | 107 | % | 55 | % | 51 | % | 135 | % | ||||||||||||
| A |
Annualized |
| B |
Total returns for periods of less than one year ore not annualized. |
| C |
Total returns do not reflect charges attributable to your insurance company’s separate account. Inclusion of these charges would reduce the total returns shown. |
| D |
Total returns would have been lower had certain expenses not been reduced during the periods shown. |
| E |
Calculated based on average shares outstanding during the period. |
| F |
Fees and expenses of the underlying Fidelity Central Funds are not included in the Fund’s expense ratio. The Fund indirectly bears its proportionate share of the expenses of any underlying Fidelity Central Funds. |
| G |
Amount does not include the portfolio activity of any underlying Fidelity Central Funds. |
| H |
Investment income per share reflects a special dividend which amounted to $.04 per share. Excluding the special dividend, the ratio of net investment income (loss) to average net assets would have been .36%. |
| I |
Expense ratios reflect operating expenses of the class. Expenses before reductions do not reflect amounts reimbursed by the investment adviser or reductions from brokerage service arrangements or other expense offset arrangements and do not represent the amount paid by the class during periods when reimbursements or reductions occur. Expenses net of fee waivers reflect expenses after reimbursement by the investment adviser but prior to reductions from brokerage service arrangements or other expense offset arrangements. Expenses net of all reductions represent the net expenses paid by the class. |
| J |
Amount represents less than $.01 per share. |
| K |
As the result of a correction made in the classification of distributions received on securities representing realized gains for the year ended December 31, 2003, amounts previously reported have been reclassified. The impact of this correction was a decrease in net investment loss of $0.01 per share and a corresponding decrease in net realized and unrealized gain (loss). The ratio of net investment loss to average net assets decreased from (0.04)% to 0.00%. The classification had no impact on total net assets or total return of the class. |
Financial Highlights – Service Class
| Six months ended June 30, 2007 (Unaudited) |
Years ended December 31, | |||||||||||||||||||||||
| 2006 | 2005 | 2004 | 2003J | 2002 | ||||||||||||||||||||
| Selected Per-hare Data |
||||||||||||||||||||||||
| Net asset value, beginning of period |
$ | 34.59 | $ | 34.95 | $ | 30.07 | $ | 24.10 | $ | 17.46 | $ | 19.54 | ||||||||||||
| Income from Investment Operations |
||||||||||||||||||||||||
| Net investment income (loss) E |
.09 | .16 | .12 | H | (.02 | ) | (.02 | ) | .08 | |||||||||||||||
| Net realized and unrealized gain (loss) |
3.86 | 3.91 | 5.27 | 5.99 | 6.72 | (2.00 | ) | |||||||||||||||||
| Total from investment operations |
3.95 | 4.07 | 5.39 | 5.97 | 6.70 | (1.92 | ) | |||||||||||||||||
| Distributions from net investment income |
(.14 | ) | (.10 | ) | — | — | (.06 | ) | (.16 | ) | ||||||||||||||
| Distributions from net realized gain |
(3.29 | ) | (4.33 | ) | (.51 | ) | — | — | — | |||||||||||||||
| Total distributions |
(3.43 | ) | (4.43 | ) | (.51 | ) | — | (.06 | ) | (.16 | ) | |||||||||||||
| Net asset value, end of period |
$ | 35.11 | $ | 34.59 | $ | 34.95 | $ | 30.07 | $ | 24.10 | $ | 17.46 | ||||||||||||
| Total Return B,C,D |
12.32 | % | 12.59 | % | 18.20 | % | 24.77 | % | 38.52 | % | (9.90 | )% | ||||||||||||
| Ratios to Average Net Assets F,I |
||||||||||||||||||||||||
| Expenses before reductions |
.78 | %A | .78 | % | .79 | % | .81 | % | .80 | % | .80 | % | ||||||||||||
| Expenses net of fee waivers, if any |
.78 | %A | .78 | % | .79 | % | .81 | % | .80 | % | .80 | % | ||||||||||||
| Expenses net of all reductions |
.76 | %A | .76 | % | .74 | % | .78 | % | .78 | % | .73 | % | ||||||||||||
| Net investment income (loss) |
.54 | %A | .48 | % | .40 | %H | (.07 | )% | (.10 | )% | .41 | % | ||||||||||||
| Supplemental Data |
||||||||||||||||||||||||
| Net assets, end of period (000 omitted) |
$ | 1,170,817 | $ | 1,091,396 | $ | 990,561 | $ | 819,412 | $ | 580,179 | $ | 378,264 | ||||||||||||
| Portfolio turnover rate G |
153 | %A | 149 | % | 107 | % | 55 | % | 51 | % | 135 | % | ||||||||||||
| A |
Annualized |
| B |
Total returns for periods of less than one year are not annualized. |
| C |
Total returns do not reflect charges attributable to your insurance company’s separate account. Inclusion of these charges would reduce the total returns shown. |
| D |
Total returns would have been lower had certain expenses not been reduced during the periods shown. |
| E |
Calculated based on average shares outstanding during the period. |
| F |
Fees and expenses of the underlying Fidelity Central Funds are not included in the Fund’s expense ratio. The Fund indirectly bears its proportionate share of the expenses of any underlying Fidelity Central Funds. |
| G |
Amount does not include the portfolio activity of any underlying Fidelity Central Funds. |
| H |
Investment income per share reflects a special dividend which amounted to $.04 per share. Excluding the special dividend, the ratio of net investment income (loss) to average net assets would have been .26%. |
| I |
Expense ratios reflect operating expenses of the class. Expenses before reductions do not reflect amounts reimbursed by the investment adviser or reductions from brokerage service arrangements or other expense offset arrangements and do not represent the amount paid by the class during periods when reimbursements or reductions occur. Expenses net of fee waivers reflect expenses after reimbursement by the investment adviser but prior to reductions from brokerage service arrangements or other expense offset arrangements. Expenses net of all reductions represent the net expenses paid by the class. |
| J |
As the result of a correction made in the classification of distributions received on securities representing realized gains for the year ended December 31, 2003, amounts previously reported have been reclassified. The impact of this correction was a decrease in net investment loss of $0.01 per share and a corresponding decrease in net realized and unrealized gain (loss). The ratio of net investment loss to average net assets decreased from (0.14)% to (0.10)%. The reclassification had no impact on total net assets or total return of the class. |
See accompanying notes which are an integral part of the financial statements.
| VIP Mid Cap Portfolio | 22 |
Table of Contents
Financial Highlights – Service Class 2
| Six months ended June 30, 2007 (Unaudited) |
Years ended December 31, | |||||||||||||||||||||||
| 2006 | 2005 | 2004 | 2003J | 2002 | ||||||||||||||||||||
| Selected Per-Share Data |
||||||||||||||||||||||||
| Net asset value, beginning of period |
$ | 34.25 | $ | 34.67 | $ | 29.88 | $ | 23.98 | $ | 17.39 | $ | 19.49 | ||||||||||||
| Income from Investment Operations |
||||||||||||||||||||||||
| Net investment income (loss) E |
.07 | .11 | .08 | H | (.06 | ) | (.05 | ) | .05 | |||||||||||||||
| Net realized and unrealized gain (loss) |
3.82 | 3.87 | 5.22 | 5.96 | 6.69 | (1.99 | ) | |||||||||||||||||
| Total from investment operations |
3.89 | 3.98 | 5.30 | 5.90 | 6.64 | (1.94 | ) | |||||||||||||||||
| Distributions from net investment income |
(.10 | ) | (.07 | ) | — | — | (.05 | ) | (.16 | ) | ||||||||||||||
| Distributions from net realized gain |
(3.29 | ) | (4.33 | ) | (.51 | ) | — | — | — | |||||||||||||||
| Total distributions |
(3.39 | ) | (4.40 | ) | (.51 | ) | — | (.05 | ) | (.16 | ) | |||||||||||||
| Net asset value, end of period |
$ | 34.75 | $ | 34.25 | $ | 34.67 | $ | 29.88 | $ | 23.98 | $ | 17.39 | ||||||||||||
| Total Return B,C,D |
12.24 | % | 12.40 | % | 18.02 | % | 24.60 | % | 38.31 | % | (10.02 | )% | ||||||||||||
| Ratios to Average Net Assets F,I |
||||||||||||||||||||||||
| Expenses before reductions |
.92 | %A | .93 | % | .94 | % | .96 | % | .95 | % | .95 | % | ||||||||||||
| Expenses net of fee waivers, if any |
.92 | %A | .93 | % | .94 | % | .96 | % | .95 | % | .95 | % | ||||||||||||
| Expenses net of all reductions |
.91 | %A | .91 | % | .89 | % | .93 | % | .93 | % | .88 | % | ||||||||||||
| Net investment income (loss) |
.39 | %A | .33 | % | .26 | %H | (.22 | )% | (.25 | )% | .25 | % | ||||||||||||
| Supplemental Data |
||||||||||||||||||||||||
| Net assets, end of period (000 omitted) |
$ | 5,466,270 | $ | 4,701,583 | $ | 3,542,952 | $ | 2,201,298 | $ | 1,177,574 | $ | 520,933 | ||||||||||||
| Portfolio turnover rate G |
153 | %A | 149 | % | 107 | % | 55 | % | 51 | % | 135 | % | ||||||||||||
| A |
Annualized |
| B |
Total returns for periods of less than one year are not annualized. |
| C |
Total returns do not reflect charges attributable to your insurance company’s separate account. Inclusion of these charges would reduce the total returns shown. |
| D |
Total returns would have been lower had certain expenses not been reduced during the periods shown. |
| E |
Calculated based on average shares outstanding during the period. |
| F |
Fees and expenses of the underlying Fidelity Central Funds are not included in the Fund’s expense ratio. The Fund indirectly bears its proportionate share of the expenses of any underlying Fidelity Central Funds. |
| G |
Amount does not include the portfolio activity of any underlying Fidelity Central Funds. |
| H |
Investment income per share reflects a special dividend which amounted to $.05 per share. Excluding the special dividend, the ratio of net investment income (loss) to average net assets would have been .11%. |
| I |
Expense ratios reflect operating expenses of the class. Expenses before reductions do not reflect amounts reimbursed by the investment adviser or reductions from brokerage service arrangements or other expense offset arrangements and do not represent the amount paid by the class during periods when reimbursements or reductions occur. Expenses net of fee waivers reflect expenses after reimbursement by the investment adviser but prior to reductions from brokerage service arrangements or other expense offset arrangements. Expenses net of all reductions represent the net expenses paid by the class. |
| J |
As the result of a correction made in the classification of distributions received on securities representing realized gains for the year ended December 31, 2003, amounts previously reported have been reclassified. The impact of this correction was a decrease in net investment loss of $0.01 per share and a corresponding decrease in net realized and unrealized gain (loss). The ratio of net investment loss to average net assets decreased from (0.29)% to (0.25)%. The reclassification had no impact on total net assets or total return of the class. |
Financial Highlights – Investor Class
| Six months ended June 30, 2007 (Unaudited) |
Years ended December 31, | |||||||||||
| 2006 | 2005I | |||||||||||
| Selected Per-Share Data |
||||||||||||
| Net asset value, beginning of period |
$ | 34.69 | $ | 35.08 | $ | 31.81 | ||||||
| Income from Investment Operations |
||||||||||||
| Net investment income (loss) E |
.09 | .15 | .07 | H | ||||||||
| Net realized and unrealized gain (loss) |
3.87 | 3.93 | 3.20 | |||||||||
| Total from investment operations |
3.96 | 4.08 | 3.27 | |||||||||
| Distributions from net investment income |
(.15 | ) | (.14 | ) | — | |||||||
| Distributions from net realized gain |
(3.29 | ) | (4.33 | ) | — | |||||||
| Total distributions |
(3.44 | ) | (4.47 | ) | — | |||||||
| Net asset value, end of period |
$ | 35.21 | $ | 34.69 | $ | 35.08 | ||||||
| Total Return B,C,D |
12.32 | % | 12.59 | % | 10.28 | % | ||||||
| Ratios to Average Net Assets F,J |
||||||||||||
| Expenses before reductions |
.79 | %A | .80 | % | .86 | %A | ||||||
| Expenses net of fee waivers, if any |
.79 | %A | .86 | %A | ||||||||
| Expenses net of all reductions |
77 | %A | .78 | % | .80 | %A | ||||||
| Net investment income (loss) |
.53 | %A | .45 | % | .45 | %A,H | ||||||
| Supplemental Data |
||||||||||||
| Net assets, end of period (000 omitted) |
$ | 224,137 | $ | 163,646 | $ | 50,760 | ||||||
| Portfolio turnover rate G |
153 | %A | 149 | % | 107 | % | ||||||
| A |
Annualized |
| B |
Total returns for periods of less than one year are not annualized. |
| C |
Total returns do not reflect charges attributable to your insurance company’s separate account. Inclusion of these charges would reduce the total returns shown. |
| D |
Total returns would have been lower had certain expenses not been reduced during the periods shown. |
| E |
Calculated based on average shares outstanding during the period. |
| F |
Fees and expenses of the underlying Fidelity Central Funds are not included in the Fund’s expense ratio. The Fund indirectly bears its proportionate share of the expenses of any underlying Fidelity Central Funds. |
| G |
Amount does not include the portfolio activity of any underlying Fidelity Central Funds. |
| H |
Investment income per share reflects a special dividend which amounted to $.04 per share. Excluding the special dividend, the ratio of net investment income (loss) to average net assets would have been .17%. |
| I |
For the period July 21, 2005 (commencement of sale of shares) to December 31, 2005. |
| J |
Expense ratios reflect operating expenses of the class. Expenses before reductions do not reflect amounts reimbursed by the investment adviser or reductions from brokerage service arrangements or other expense offset arrangements and do not represent the amount paid by the class during periods when reimbursements or reductions occur. Expense ratios before reductions for start-up periods may not be representative of longer-term operating periods. Expenses net of fee waivers reflect expenses after reimbursement by the investment adviser but prior to reductions from brokerage service arrangements or other expense offset arrangements. Expenses net of all reductions represent the net expenses paid by the class. |
See accompanying notes which are an integral part of the financial statements.
| 23 | Semiannual Report |
Table of Contents
For the period ended June 30, 2007 (Unaudited)
1. Organization.
VIP Mid Cap Portfolio (the Fund) is a fund of Variable Insurance Products Fund III (the trust) and is authorized to issue an unlimited number of shares. The trust is registered under the Investment Company Act of 1940, as amended (the 1940 Act), as an open-end management investment company organized as a Massachusetts business trust. Shares of the Fund may only be purchased by insurance companies for the purpose of funding variable annuity or variable life insurance contracts. The Fund offers the following classes of shares: Initial Class shares, Service Class shares, Service Class 2 shares and Investor Class shares. All classes have equal rights and voting privileges, except for matters affecting a single class. Investment income, realized and unrealized capital gains and losses, the common expenses of the Fund, and certain fund-level expense reductions, if any, are allocated on a pro rata basis to each class based on the relative net assets of each class to the total net assets of the Fund. Each class differs with respect to transfer agent and distribution and service plan fees incurred. Certain expense reductions also differ by class. The Fund’s investments in emerging markets can be subject to social, economic, regulatory, and political uncertainties and can be extremely volatile.
2. Investments in Fidelity Central Funds.
The Fund may invest in Fidelity Central Funds which are open-end investment companies available only to other investment companies and accounts managed by Fidelity Management & Research Company (FMR) and its affiliates. The Fund’s Schedule of Investments lists each of the Fidelity Central Funds as an investment of the Fund, but does not include the underlying holdings of each Fidelity Central Fund. As an Investing Fund, the Fund indirectly bears its proportionate share of the expenses of the underlying Fidelity Central Funds. A complete unaudited list of holdings for each Fidelity Central Fund is available upon request. In addition, the financial statements of the Fidelity Central Funds are available on the EDGAR Database on the SEC’s web site, www.sec.gov, or upon request.
The Money Market Central Funds seek preservation of capital and current income and are managed by Fidelity Investments Money Management, Inc. (FIMM), an affiliate of FMR.
3. Significant Accounting Policies.
The financial statements have been prepared in conformity with accounting principles generally accepted in the United States of America, which require management to make certain estimates and assumptions at the date of the financial statements. The following summarizes the significant accounting policies of the Fund:
Security Valuation. Investments are valued and net asset value (NAV) per share is calculated (NAV calculation) as of the close of business of the New York Stock Exchange (NYSE), normally 4:00 p.m. Eastern time. Wherever possible, the Fund uses independent pricing services approved by the Board of Trustees to value its investments.
Equity securities, including restricted securities, for which market quotations are readily available, are valued at the last reported sale price or official closing price as reported by an independent pricing service on the primary market or exchange on which they are traded. In the event there were no sales during the day or closing prices are not available, securities are valued at the last quoted bid price. Investments in open-end mutual funds, including the Fidelity Central Funds, are valued at their closing net asset value each business day. Short-term securities with remaining maturities of sixty days or less for which quotations are not readily available are valued at amortized cost, which approximates value.
When current market prices or quotations are not readily available or do not accurately reflect fair value, valuations may be determined in accordance with procedures adopted by the Board of Trustees. For example, when developments occur between the close of a market and the close of the NYSE that may materially affect the value of some or all of the securities, or when trading in a security is halted, those securities may be fair valued. Factors used in the determination of fair value may include monitoring news to identify significant market or security specific events such as changes in the value of U.S. securities markets, reviewing developments in foreign markets and evaluating the performance of ADRs, futures contracts and exchange-traded funds. Because the Fund’s utilization of fair value pricing depends on market activity, the frequency with which fair value pricing is used cannot be predicted and may be utilized to a significant extent. The value of securities used for NAV calculation under fair value pricing may differ from published prices for the same securities.
Foreign Currency. The Fund uses foreign currency contracts to facilitate transactions in foreign-denominated securities. Losses from these transactions may arise from changes in the value of the foreign currency or if the counterparties do not perform under the contracts’ terms.
Foreign-denominated assets, including investment securities, and liabilities are translated into U.S. dollars at the exchange rate at period end. Purchases and sales of investment securities, income and dividends received and expenses denominated in foreign currencies are translated into U.S. dollars at the exchange rate in effect on the transaction date.
The effects of exchange rate fluctuations on investments are included with the net realized and unrealized gain (loss) on investment securities. Other foreign currency transactions resulting in realized and unrealized gain (loss) are disclosed separately.
| VIP Mid Cap Portfolio | 24 |
Table of Contents
3. Significant Accounting Policies – continued
Investment Transactions and Income. For financial reporting purposes, the Fund’s investment holdings and NAV include trades executed through the end of the last business day of the period. The NAV for processing shareholder transactions includes trades executed through the end of the prior business day. Gains and losses on securities sold are determined on the basis of identified cost and may include proceeds received from litigation. Dividend income is recorded on the ex-dividend date, except for certain dividends from foreign securities where the ex-dividend date may have passed, which are recorded as soon as the Fund is informed of the ex-dividend date. Non-cash dividends included in dividend income, if any, are recorded at the fair market value of the securities received. Distributions received on securities that represent a return of capital or capital gain are recorded as a reduction of cost of investments and/or as a realized gain. The Fund estimates the components of distributions received that may be considered return of capital distributions or capital gain distributions. Interest income and distributions from the Fidelity Central Funds are accrued as earned, with any distributions receivable as of period end included in Distributions receivable from Fidelity Central Funds on the Statement of Assets and Liabilities. Interest income includes coupon interest and amortization of premium and accretion of discount on debt securities. Investment income is recorded net of foreign taxes withheld where recovery of such taxes is uncertain.
Expenses. Most expenses of the trust can be directly attributed to a fund. Expenses which cannot be directly attributed are apportioned among each Fund in the trust. Expense estimates are accrued in the period to which they relate and adjustments are made when actual amounts are known.
Income Tax Information and Distributions to Shareholders. The Fund intends to qualify as a regulated investment company by distributing substantially all of its taxable income and realized gains under Subchapter M of the Internal Revenue Code and filing its U.S. federal tax return. As a result, no provision for income taxes is required. The Fund adopted the provisions of FASB Interpretation No. 48, Accounting for Uncertainties in Income Taxes, on June 29, 2007. FIN 48 sets forth a minimum threshold for financial statement recognition of the benefit of a tax position taken or expected to be taken in a tax return. The implementation of FIN 48 did not result in any unrecognized tax benefits in the accompanying financial statements. Each of the tax years in the three year period ended June 29, 2007, remains subject to examination by the Internal Revenue Service. Foreign taxes are provided for based on the Fund’s understanding of the tax rules and rates that exist in the foreign markets in which it invests.
Distributions are recorded on the ex-dividend date. Income dividends and capital gain distributions are declared separately for each class. Income and capital gain distributions are determined in accordance with income tax regulations, which may differ from generally accepted accounting principles.
Capital accounts within the financial statements are adjusted for permanent book-tax differences. These adjustments have no impact on net assets or the results of operations. Temporary book-tax differences will reverse in a subsequent period.
Book-tax differences are primarily due to foreign currency transactions, certain foreign taxes, passive foreign investment companies (PFIC), partnerships and losses deferred due to wash sales.
The federal tax cost of investments and unrealized appreciation (depreciation) as of period end were as follows:
| Unrealized appreciation |
$ | 1,603,844,029 | ||
| Unrealized depreciation |
(169,064,194 | ) | ||
| Net unrealized appreciation (depreciation) |
$ | 1,434,779,835 | ||
| Cost for federal income tax purposes |
$ | 7,238,118,240 |
New Accounting Pronouncement. In September 2006, Statement of Financial Accounting Standards No. 157, Fair Value Measurements (SFAS 157), was issued and is effective for fiscal years beginning after November 15, 2007. SFAS 157 defines fair value, establishes a framework for measuring fair value and expands disclosures about fair value measurements. Management is currently evaluating the impact the adoption of SFAS 157 will have on the Fund’s financial statement disclosures.
4. Operating Policies.
Repurchase Agreements. FMR has received an Exemptive Order from the Securities and Exchange Commission (the SEC) which permits the Fund and other affiliated entities of FMR to transfer uninvested cash balances into joint trading accounts which are then invested in repurchase agreements. The Fund may also invest directly with institutions in repurchase agreements. Repurchase agreements are collateralized by government or nongovernment securities. Upon settlement date, collateral is held in segregated accounts with custodian banks and may be obtained in the event of a default of the counterparty. The Fund monitors, on a daily basis, the value of the collateral to ensure it is at least equal to the principal amount of the repurchase agreement (including accrued interest). In the event of a default by the counterparty, realization of the collateral proceeds could be delayed, during which time the value of the collateral may decline.
| 25 | Semiannual Report |
Table of Contents
Notes to Financial Statements (Unaudited) – continued
4. Operating Policies – continued
Restricted Securities. The Fund may invest in securities that are subject to legal or contractual restrictions on resale. These securities generally may be resold in transactions exempt from registration or to the public if the securities are registered. Disposal of these securities may involve time-consuming negotiations and expense, and prompt sale at an acceptable price may be difficult. Information regarding restricted securities is included at the end of the Fund’s Schedule of Investments.
5. Purchases and Sales of Investments.
Purchases and sales of securities, other than short-term securities, aggregated $5,923,016,153 and $5,865,843,191, respectively.
6. Fees and Other Transactions with Affiliates.
Management Fee. FMR and its affiliates provide the Fund with investment management related services for which the Fund pays a monthly management fee. The management fee is the sum of an individual fund fee rate that is based on an annual rate of .30% of the Fund’s average net assets and a group fee rate that averaged .26% during the period. The group fee rate is based upon the average net assets of all the mutual funds advised by FMR. The group fee rate decreases as assets under management increase and increases as assets under management decrease. For the period, the total annualized management fee rate was .56% of the Fund’s average net assets.
Distribution and Service Plan. In accordance with Rule 12b-1 of the 1940 Act, the Fund has adopted separate 12b-1 Plans for each Service Class of shares. Each Service Class pays Fidelity Distributors Corporation (FDC), an affiliate of FMR, a service fee. For the period, the service fee is based on an annual rate of .10% of Service Class’ average net assets and .25% of Service Class 2’s average net assets.
For the period, each class paid FDC the following amounts, all of which were re-allowed to insurance companies for the distribution of shares and providing shareholder support services:
| Service Class |
$ | 566,247 | |
| Service Class 2 |
6,296,877 | ||
| $ | 6,863,124 | ||
Transfer Agent Fees. Fidelity Investments Institutional Operations Company, Inc. (FIIOC), an affiliate of FMR, is the fund’s transfer, dividend disbursing, and shareholder servicing agent. FIIOC receives an asset-based fee with respect to each class. Each class with the exception of Investor Class pays a transfer agent fee, excluding out of pocket expenses, equal to an annual rate of .07% of their month end net assets. Investor Class pays a monthly asset-based transfer agent fee of. 18% of its month end net assets. The total transfer agent fees paid by each class to FIIOC, including out of pocket expenses, were as follows:
| Initial Class |
$ | 466,893 | |
| Service Class |
374,878 | ||
| Service Class 2 |
1,665,536 | ||
| Investor Class |
173,018 | ||
| $ | 2,680,325 | ||
Accounting and Security Lending Fees. Fidelity Service Company, Inc. (FSC), an affiliate of FMR, maintains the Fund’s accounting records. The accounting fee is based on the level of average net assets for the month. Under a separate contract, FSC administers the security lending program. The security lending fee is based on the number and duration of lending transactions.
Brokerage Commissions. The Fund placed a portion of its portfolio transactions with brokerage firms which are affiliates of the investment adviser. The commissions paid to these affiliated firms were $69,896 for the period.
Interfund Lending Program. Pursuant to an Exemptive Order issued by the SEC, the Fund, along with other registered investment companies having management contracts with FMR, may participate in an interfund lending program. This program provides an alternative credit facility allowing the funds to borrow from, or lend money to, other participating affiliated funds. At period end, there were no interfund loans outstanding. The Fund’s activity in this program during the period for which loans were outstanding was as follows:
| Borrower or Lender |
Average Daily Loan Balance |
Weighted Average Interest Rate |
Interest Expense | ||||||
| Borrower |
$ | 10,912,600 | 5.40 | % | $ | 8,186 | |||
| VIP Mid Cap Portfolio | 26 |
Table of Contents
7. Committed Line of Credit.
The Fund participates with other funds managed by FMR in a $4.2 billion credit facility (the “line of credit”) to be utilized for temporary or emergency purposes to fund shareholder redemptions or for other short-term liquidity purposes. The Fund has agreed to pay commitment fees on its pro rata portion of the line of credit, which amounted to $8,962 and is reflected in Miscellaneous Expense on the Statement of Operations. During the period, there were no borrowings on this line of credit.
8. Security Lending.
The Fund lends portfolio securities from time to time in order to earn additional income. On the settlement date of the loan, the Fund receives collateral (in the form of U.S. Treasury obligations, letters of credit and/or cash) against the loaned securities and maintains collateral in an amount not less than 100% of the market value of the loaned securities during the period of the loan. The market value of the loaned securities is determined at the close of business of the Fund and any additional required collateral is delivered to the Fund on the next business day. If the borrower defaults on its obligation to return the securities loaned because of insolvency or other reasons, a fund could experience delays and costs in recovering the securities loaned or in gaining access to the collateral. Any cash collateral received is invested in the Fidelity Securities Lending Cash Central Fund. The value of loaned securities and cash collateral at period end are disclosed on the Fund’s Statement of Assets and Liabilities. Security lending income represents the income earned on investing cash collateral, less fees and expenses associated with the loan, plus any premium payments that may be received on the loan of certain types of securities. Security lending income is presented in the Statement of Operations as a component of income from Fidelity Central Funds.
9. Expense Reductions.
Many of the brokers with whom FMR places trades on behalf of the Fund provided services to the Fund in addition to trade execution. These services included payments of certain expenses on behalf of the Fund totaling $618,781 for the period. In addition, through arrangements with the fund’s custodian, credits realized as a result of uninvested cash balances were used to reduce the Fund’s expenses. During the period, these credits reduced the Fund’s custody expenses by $27,960.
10. Other.
The Fund’s organizational documents provide former and current trustees and officers with a limited indemnification against liabilities arising in connection with the performance of their duties to the Fund. In the normal course of business, the Fund may also enter into contracts that provide general indemnifications. The Fund’s maximum exposure under these arrangements is unknown as this would be dependent on future claims that may be made against the Fund. The risk of material loss from such claims is considered remote.
At the end of the period, FMR or its affiliates were the owners of record of 12% of the total outstanding shares of the Fund and one otherwise unaffiliated shareholder was the owner of record of 29% of the total outstanding shares of the Fund.
The United States Securities and Exchange Commission (“SEC”) is conducting an investigation of FMR (covering the years 2002 to 2004) arising from gifts, gratuities and business entertainment provided by certain brokers to certain individuals who were employed on FMR’s domestic equity trading desk during that period. FMR is in discussions with the SEC staff regarding the possible resolution of the matter, but as of period-end no final resolution has been reached.
In December 2006, the Independent Trustees completed their own investigation of the matter with the assistance of independent counsel. The Independent Trustees and FMR agree that, despite the absence of proof that the Fidelity mutual funds experienced diminished execution quality as a result of the improper receipt of gifts and business entertainment, the conduct at issue was serious and is worthy of redress. Accordingly, the Independent Trustees have requested and FMR has agreed to pay $42 million to Fidelity mutual funds, plus interest to be determined at the time that payment is made. A method of allocating this payment among the funds has not yet been determined. The total payment to the Fund is not anticipated to have a material impact on the Fund’s net assets. In addition, FMR reimbursed related legal expenses which are recorded in the accompanying Statement of Operations as an expense reduction.
11. Distributions to Shareholders.
Distributions to shareholders of each class were as follows:
| Six months ended 2007 |
Year ended December 31, 2006 | |||||
| From net investment income |
||||||
| Initial Class |
$ | 6,546,756 | $ | 4,750,962 | ||
| Service Class |
4,374,292 | 2,713,194 | ||||
| Service Class 2 |
13,389,673 | 6,828,025 | ||||
| Investor Class |
733,657 | 253,382 | ||||
| Total |
$ | 25,044,378 | $ | 14,545,563 | ||
| 27 | Semiannual Report |
Table of Contents
Notes to Financial Statements (Unaudited) – continued
11. Distributions to Shareholders – continued
Distributions to shareholders of each class were as follows: – continued
| Six months ended 2007 |
Year ended December 31, 2006 | |||||
| From net realized gain |
||||||
| Initial Class |
$ | 125,996,335 | $ | 160,864,588 | ||
| Service Class |
103,566,860 | 122,489,425 | ||||
| Service Class 2 |
454,282,632 | 455,271,711 | ||||
| Investor Class |
16,096,438 | 7,898,377 | ||||
| Total |
$ | 699,942,265 | $ | 746,524,101 | ||
12. Share Transactions.
Transactions for each class of shares were as follows:
| Shares | Dollars | |||||||||||||
| Six months ended 2007 |
Year ended December 31, 2006 |
Six months ended 2007 |
Year ended December 31, 2006 |
|||||||||||
| Initial Class |
||||||||||||||
| Shares sold |
4,666,865 | 7,331,123 | $ | 158,083,693 | $ | 248,761,453 | ||||||||
| Reinvestment of distributions |
4,095,893 | 5,122,659 | 132,543,091 | 165,615,550 | ||||||||||
| Shares redeemed |
(5,174,858 | ) | (9,913,376 | ) | (174,727,285 | ) | (328,496,358 | ) | ||||||
| Net increase (decrease) |
3,587,900 | 2,540,406 | $ | 115,899,499 | $ | 85,880,645 | ||||||||
| Service Class |
||||||||||||||
| Shares sold |
1,566,856 | 3,284,402 | $ | 52,549,341 | $ | 109,868,879 | ||||||||
| Reinvestment of distributions |
3,352,210 | 3,889,488 | 107,941,152 | 125,202,620 | ||||||||||
| Shares redeemed |
(3,127,396 | ) | (3,965,782 | ) | (105,285,944 | ) | (132,567,032 | ) | ||||||
| Net increase (decrease) |
1,791,670 | 3,208,108 | $ | 55,204,549 | $ | 102,504,467 | ||||||||
| Service Class 2 |
||||||||||||||
| Shares sold |
13,089,411 | 35,248,708 | $ | 436,645,572 | $ | 1,172,363,016 | ||||||||
| Reinvestment of distributions |
14,665,171 | 14,476,809 | 467,672,305 | 462,099,736 | ||||||||||
| Shares redeemed |
(7,729,725 | ) | (14,670,648 | ) | (256,423,526 | ) | (480,746,935 | ) | ||||||
| Net increase (decrease) |
20,024,857 | 35,054,869 | $ | 647,894,351 | $ | 1,153,715,817 | ||||||||
| Investor Class |
||||||||||||||
| Shares sold. |
1,430,422 | 3,254,309 | $ | 48,171,367 | $ | 109,672,374 | ||||||||
| Reinvestment of distributions |
521,217 | 252,531 | 16,830,095 | 8,151,693 | ||||||||||
| Shares redeemed |
(303,244 | ) | (235,856 | ) | (10,168,269 | ) | (7,932,163 | ) | ||||||
| Net increase (decrease) |
1,648,395 | 3,270,984 | $ | 54,833,193 | $ | 109,891,904 | ||||||||
| VIP Mid Cap Portfolio | 28 |
Table of Contents
Investment Adviser
Fidelity Management & Research Company
Boston, MA
Investment Sub-Advisers
FMR Co., Inc.
Fidelity Management & Research (U.K.) Inc.
Fidelity Research & Analysis Company
Fidelity Investments Japan Limited
Fidelity International Investment Advisors
Fidelity International Investment Advisors (U.K.) Limited
General Distributor
Fidelity Distributors Corporation
Boston, MA
Transfer and Service Agents
Fidelity Investments Institutional Operations Company, Inc.
Boston, MA
Fidelity Service Company, Inc.
Boston, MA
Custodian
Brown Brothers Harriman & Co.
Boston, MA
Table of Contents

MULTI-STYLE EQUITY FUND
AGGRESSIVE EQUITY FUND
NON-U.S. FUND
REAL ESTATE SECURITIES FUND
CORE BOND FUND
JUNE 30, 2007

Table of Contents
Russell Investment Funds
Russell Investment Funds is a series investment company with nine different investment portfolios referred to as Funds. These financial statements report on five of these Funds.
Russell Investment Management Company
Responsible for overall management and administration of the Funds.
Table of Contents
Russell Investment Funds
Semiannual Report
June 30, 2007 (Unaudited)
| Page | ||
| 5 | ||
| 12 | ||
| 23 | ||
| 37 | ||
| 42 | ||
| 69 | ||
| 70 | ||
| 74 | ||
| 76 | ||
| 78 | ||
| 80 | ||
| 81 | ||
| 93 | ||
| 96 | ||
| 97 | ||
| 101 |
Table of Contents
Russell Investment Funds
Copyright © Russell Investments 2007. All rights reserved.
Russell Investment Group is a Washington, USA corporation, which operates through subsidiaries worldwide and is a subsidiary of The Northwestern Mutual Life Insurance Company.
Fund objectives, risks, charges and expenses should be carefully considered before investing. A prospectus containing this and other important information must precede or accompany this material. Please read the prospectus carefully before investing.
Securities distributed through Russell Fund Distributors, Inc. member NASD, part of Russell Investment Group.
Russell Investment Group and Standard & Poor’s Corporation are the owners of the trademarks, service marks, and copyrights related to their respective indexes. Index performance is not indicative of the performance of any specific investment. Indexes are not managed and may not be invested in directly.
Performance quoted represents past performance and does not guarantee future results. The investment return and principal value of an investment will fluctuate so that shares, when redeemed, may be worth more or less than their original cost. Current performance may be lower or higher than the performance data quoted.
Table of Contents
Multi-Style Equity Fund
Shareholder Expense Example—June 30, 2007 (Unaudited)
Fund Expenses
The following disclosure provides important information regarding each Fund’s Expense Example, which appears on each Fund’s individual page in this Semiannual Report. Please refer to this information when reviewing the Expense Example for a Fund.
Example
As a shareholder of the Fund, you incur two types of costs: (1) transaction costs, and (2) ongoing costs, including management fees; and other Fund expenses. The Example is intended to help you understand your ongoing costs (in dollars) of investing in the Fund and to compare these costs with the ongoing costs of investing in other mutual funds. The Example is based on an investment of $1,000 invested at the beginning of the period and held for the entire period indicated, which for this Fund is from January 1, 2007 to June 30, 2007.
Actual Expenses
The information in the table under the heading “Actual Performance” provides information about actual account values and actual expenses. You may use the information in this column, together with the amount you invested, to estimate the expenses that you paid over the period. Simply divide your account value by $1,000 (for example, an $8,600 account value divided by $1,000 = 8.6), then multiply the result by the number in the first column in the row entitled “Expenses Paid During Period” to estimate the expenses you paid on your account during this period.
Hypothetical Example for Comparison Purposes
The information in the table under the heading “Hypothetical Performance (5% return before expenses)” provides information about hypothetical account values and hypothetical expenses based on the Fund’s actual expense ratio and an assumed rate of return of 5% per year before expenses, which is not the Fund’s actual return. The hypothetical account values and expenses may not be used to estimate the actual ending account balance or expenses you paid for the period. You may use this information to compare the ongoing costs of investing in the Fund and other funds. To do so, compare this 5% hypothetical example with the 5% hypothetical examples that appear in the shareholder reports of other funds.
Please note that the expenses shown in the table are meant to highlight your ongoing costs only and do not reflect any transactional costs. Therefore, the information under the heading “Hypothetical Performance (5% return before expenses)” is useful in comparing ongoing costs only, and will not help you determine the relative total costs of owning different funds. In addition, if these transactional costs were included, your costs would have been higher.
| Actual Performance |
Hypothetical Performance (5% return before expenses) | |||||
| Beginning Account Value January 1, 2007 |
$ | 1,000.00 | $ | 1,000.00 | ||
| Ending Account Value June 30, 2007 |
$ | 1,080.90 | $ | 1,020.53 | ||
| Expenses Paid During Period* |
$ | 4.44 | $ | 4.31 | ||
| * | Expenses are equal to the Fund’s annualized expense ratio of 0.86% (representing the one-half year period annualized), multiplied by the average account value over the period, multiplied by 181/365 (to reflect the one-half year period). |
Multi-Style Equity Fund 3
Table of Contents
Russell Investment Funds
Multi-Style Equity Fund
Schedule of Investments—June 30, 2007 (Unaudited)
Amounts in thousands (except share amounts)
| Principal Amount ($) or Shares |
Market Value $ | |||
| Common Stocks—95.5% |
||||
| Auto and Transportation—2.1% |
||||
| Autoliv, Inc. |
2,600 | 148 | ||
| CH Robinson Worldwide, Inc. (Ñ) |
22,530 | 1,183 | ||
| Con-way, Inc. |
4,300 | 216 | ||
| CSX Corp. |
9,608 | 433 | ||
| FedEx Corp. |
5,200 | 577 | ||
| Goodyear Tire & Rubber Co. (The) (Æ)(Ñ) |
22,800 | 793 | ||
| JB Hunt Transport Services, Inc. (Ñ) |
13,274 | 389 | ||
| Norfolk Southern Corp. |
40,200 | 2,113 | ||
| Oshkosh Truck Corp. |
9,402 | 592 | ||
| Polaris Industries, Inc. (Ñ) |
10,400 | 563 | ||
| TRW Automotive Holdings Corp. (Æ) |
6,400 | 236 | ||
| Union Pacific Corp. |
10,300 | 1,186 | ||
| United Parcel Service, Inc. Class B |
18,000 | 1,314 | ||
| US Airways Group, Inc. (Æ) |
4,000 | 121 | ||
| 9,864 | ||||
| Consumer Discretionary—13.7% |
||||
| Abercrombie & Fitch Co. Class A |
8,000 | 584 | ||
| ABM Industries, Inc. |
3,800 | 98 | ||
| Advance Auto Parts, Inc. |
9,600 | 389 | ||
| Alberto-Culver Co. Class B |
7,900 | 187 | ||
| AutoNation, Inc. (Æ)(Ñ) |
4,500 | 101 | ||
| Avon Products, Inc. |
26,220 | 964 | ||
| Bare Escentuals, Inc. (Æ) |
10,729 | 366 | ||
| Barnes & Noble, Inc. |
7,600 | 292 | ||
| BJ’s Wholesale Club, Inc. (Æ) |
4,300 | 155 | ||
| Black & Decker Corp. |
6,000 | 530 | ||
| CEC Entertainment, Inc. (Æ)(Ñ) |
1,900 | 67 | ||
| Chico’s FAS, Inc. (Æ)(Ñ) |
11,517 | 280 | ||
| Cinemark Holdings, Inc. (Æ)(Ñ) |
24,800 | 444 | ||
| Citadel Broadcasting Corp. |
8 | — | ||
| Coach, Inc. (Æ) |
21,690 | 1,028 | ||
| Convergys Corp. (Æ) |
9,200 | 223 | ||
| Corrections Corp. of America (Æ) |
6,600 | 417 | ||
| Costco Wholesale Corp. |
32,300 | 1,890 | ||
| CROCS, Inc. (Æ)(Ñ) |
12,928 | 556 | ||
| eBay, Inc. (Æ) |
67,290 | 2,165 | ||
| Electronic Arts, Inc. (Æ) |
61,375 | 2,904 | ||
| Expedia, Inc. (Æ) |
16,410 | 481 | ||
| Focus Media Holding, Ltd.—ADR (Æ)(Ñ) |
16,230 | 820 | ||
| Foot Locker, Inc. |
40,100 | 874 | ||
| GameStop Corp. Class A (Æ)(Ñ) |
11,700 | 458 | ||
| Gannett Co., Inc. |
8,500 | 467 | ||
| Gap, Inc. (The) |
68,800 | 1,314 | ||
| Google, Inc. Class A (Æ) |
17,559 | 9,190 | ||
| Guess?, Inc. (Ñ) |
13,110 | 630 | ||
| Hasbro, Inc. (Ñ) |
12,000 | 377 | ||
| Hewitt Associates, Inc. Class A (Æ)(Ñ) |
30,700 | 982 | ||
| Hilton Hotels Corp. |
13,000 | 435 | ||
| Home Depot, Inc. |
23,000 | 905 | ||
| Intercontinental Hotels Group PLC—ADR |
30,759 | 762 | ||
| International Game Technology |
19,100 | 758 | ||
| Jarden Corp. (Æ) |
2,900 | 125 | ||
| JC Penney Co., Inc. (Ñ) |
18,100 | 1,310 | ||
| Jones Apparel Group, Inc. |
29,300 | 828 | ||
| Kimberly-Clark Corp. |
15,800 | 1,057 | ||
| Las Vegas Sands Corp. (Æ)(Ñ) |
14,250 | 1,089 | ||
| Limited Brands, Inc. (Ñ) |
25,100 | 689 | ||
| Mattel, Inc. |
18,400 | 465 | ||
| McDonald’s Corp. |
46,398 | 2,355 | ||
| McGraw-Hill Cos., Inc. (The) |
22,700 | 1,546 | ||
| Monster Worldwide, Inc. (Æ) |
15,410 | 633 | ||
| Newell Rubbermaid, Inc. |
8,300 | 244 | ||
| News Corp. |
11,930 | 253 | ||
| Nike, Inc. Class B (Ñ) |
44,000 | 2,565 | ||
| Office Depot, Inc. (Æ) |
30,200 | 915 | ||
| OfficeMax, Inc. (Ñ) |
1,100 | 43 | ||
| Polo Ralph Lauren Corp. Class A (Ñ) |
8,300 | 814 | ||
| Royal Caribbean Cruises, Ltd. (Ñ) |
16,200 | 696 | ||
| RR Donnelley & Sons Co. (Ñ) |
23,300 | 1,014 | ||
| Sears Holdings Corp. (Æ) |
3,000 | 509 | ||
| Starwood Hotels & Resorts Worldwide, Inc. (ö) |
30,950 | 2,076 | ||
| Target Corp. |
38,149 | 2,426 | ||
| Time Warner, Inc. |
69,100 | 1,454 | ||
| Under Armour, Inc. Class A (Æ)(Ñ) |
10,010 | 457 | ||
| Urban Outfitters, Inc. (Æ)(Ñ) |
28,763 | 691 | ||
| VeriSign, Inc. (Æ) |
20,460 | 649 | ||
| Viacom, Inc. Class A (Æ) |
13,400 | 558 | ||
| Wal-Mart Stores, Inc. |
53,100 | 2,555 | ||
| Walt Disney Co. (The) |
37,100 | 1,267 | ||
| Waste Management, Inc. |
22,900 | 894 | ||
| Whirlpool Corp. (Ñ) |
2,500 | 278 | ||
| Yahoo!, Inc. (Æ) |
45,441 | 1,233 | ||
| 63,781 | ||||
| Consumer Staples—9.2% |
||||
| Altria Group, Inc. |
15,068 | 1,057 | ||
| Anheuser-Busch Cos., Inc. |
10,500 | 548 | ||
| Clorox Co. |
16,100 | 1,000 | ||
| Coca-Cola Co. (The) |
181,890 | 9,515 | ||
| Colgate-Palmolive Co. |
31,700 | 2,056 | ||
| ConAgra Foods, Inc. |
17,800 | 478 | ||
| Dean Foods Co. |
8,200 | 261 | ||
| Del Monte Foods Co. |
9,500 | 115 |
4 Multi-Style Equity Fund
Table of Contents
Russell Investment Funds
Multi-Style Equity Fund
Schedule of Investments, continued—June 30, 2007 (Unaudited)
Amounts in thousands (except share amounts)
| Principal Amount ($) or Shares |
Market Value $ | |||
| General Mills, Inc. |
25,700 | 1,501 | ||
| Hansen Natural Corp. (Æ)(Ñ) |
17,030 | 732 | ||
| Hershey Co. (The) |
19,300 | 977 | ||
| Hormel Foods Corp. |
2,500 | 93 | ||
| Kraft Foods, Inc. Class A |
77,791 | 2,742 | ||
| Kroger Co. (The) |
19,500 | 549 | ||
| Loews Corp.—Carolina Group |
6,400 | 494 | ||
| McCormick & Co., Inc. (Ñ) |
2,500 | 95 | ||
| Pepsi Bottling Group, Inc. |
3,800 | 128 | ||
| PepsiCo, Inc. |
122,235 | 7,927 | ||
| Procter & Gamble Co. |
154,500 | 9,454 | ||
| Rite Aid Corp. (Æ)(Ñ) |
42,802 | 273 | ||
| Safeway, Inc. |
15,800 | 538 | ||
| Unilever NV |
30,000 | 931 | ||
| Walgreen Co. |
25,300 | 1,102 | ||
| 42,566 | ||||
| Financial Services—16.5% |
||||
| Allstate Corp. (The) |
12,100 | 744 | ||
| AMB Property Corp. (ö) |
3,100 | 165 | ||
| American Express Co. |
67,000 | 4,099 | ||
| American International Group, Inc. |
88,829 | 6,221 | ||
| Ameriprise Financial, Inc. |
4,900 | 312 | ||
| Annaly Capital Management, Inc. (ö) |
34,100 | 492 | ||
| AON Corp. |
6,300 | 268 | ||
| Astoria Financial Corp. |
15,700 | 393 | ||
| Automatic Data Processing, Inc. |
16,900 | 819 | ||
| Axis Capital Holdings, Ltd. |
5,500 | 224 | ||
| Bank of America Corp. |
40,400 | 1,975 | ||
| Bank of York Co., Inc. (The) |
41,900 | 1,736 | ||
| BB&T Corp. |
14,700 | 598 | ||
| Camden Property Trust (ö)(Ñ) |
2,300 | 154 | ||
| Capital One Financial Corp. |
17,900 | 1,404 | ||
| Chicago Mercantile Exchange Holdings, Inc. Class A |
2,390 | 1,277 | ||
| Chubb Corp. |
24,900 | 1,348 | ||
| Citigroup, Inc. |
124,500 | 6,386 | ||
| CNA Financial Corp. (Ñ) |
2,500 | 119 | ||
| Colonial BancGroup, Inc. (The) |
24,100 | 602 | ||
| Cullen/Frost Bankers, Inc. |
8,300 | 444 | ||
| Federated Investors, Inc. Class B |
18,800 | 721 | ||
| First Horizon National Corp. (Ñ) |
11,300 | 441 | ||
| Franklin Resources, Inc. |
5,860 | 776 | ||
| General Growth Properties, Inc. (ö)(Ñ) |
5,400 | 286 | ||
| Goldman Sachs Group, Inc. (The) |
19,550 | 4,237 | ||
| H&R Block, Inc. |
21,200 | 495 | ||
| Hartford Financial Services Group, Inc. |
18,700 | 1,842 | ||
| Hospitality Properties Trust (ö)(Ñ) |
8,100 | 336 | ||
| HRPT Properties Trust (ö)(Ñ) |
12,400 | 129 | ||
| IntercontinentalExchange, Inc. (Æ)(Ñ) |
6,710 | 992 | ||
| JPMorgan Chase & Co. |
96,050 | 4,654 | ||
| Liberty Property Trust (ö)(Ñ) |
3,800 | 167 | ||
| MBIA, Inc. (Ñ) |
15,100 | 940 | ||
| Mercury General Corp. (Ñ) |
10,600 | 584 | ||
| Merrill Lynch & Co., Inc. |
37,846 | 3,163 | ||
| MetLife, Inc. |
3,400 | 219 | ||
| MGIC Investment Corp. (Ñ) |
12,800 | 728 | ||
| Morgan Stanley |
75,796 | 6,358 | ||
| National Retail Properties, Inc. (ö) |
700 | 15 | ||
| York Community Bancorp, Inc. (Ñ) |
45,900 | 781 | ||
| Northern Trust Corp. |
23,700 | 1,522 | ||
| Nymex Holdings, Inc. (Ñ) |
6,790 | 853 | ||
| Odyssey Re Holdings Corp. (Ñ) |
600 | 26 | ||
| Paychex, Inc. |
49,000 | 1,917 | ||
| PMI Group, Inc. (The) (Ñ) |
11,600 | 518 | ||
| PNC Financial Services Group, Inc. |
6,600 | 472 | ||
| Protective Life Corp. |
11,800 | 564 | ||
| Raymond James Financial, Inc. |
4,300 | 133 | ||
| Regions Financial Corp. (Ñ) |
7,500 | 248 | ||
| RenaissanceRe Holdings, Ltd. |
4,300 | 267 | ||
| Simon Property Group, Inc. (ö) |
4,700 | 437 | ||
| South Financial Group, Inc. (The) (Ñ) |
21,100 | 478 | ||
| SunTrust Banks, Inc. |
10,100 | 866 | ||
| TCF Financial Corp. (Ñ) |
16,200 | 450 | ||
| Transatlantic Holdings, Inc. (Ñ) |
500 | 36 | ||
| Travelers Cos., Inc. (The) |
13,400 | 717 | ||
| Wachovia Corp. (Ñ) |
71,700 | 3,675 | ||
| Washington Mutual, Inc. (Ñ) |
21,600 | 921 | ||
| Wells Fargo & Co. |
90,000 | 3,165 | ||
| Western Union Co. (The) |
22,000 | 458 | ||
| Wilmington Trust Corp. |
18,900 | 785 | ||
| WR Berkley Corp. |
11,000 | 358 | ||
| 76,510 | ||||
| Health Care—13.7% |
||||
| Abbott Laboratories |
105,225 | 5,635 | ||
| Aetna, Inc. |
8,300 | 410 | ||
| Allergan, Inc. |
47,340 | 2,729 | ||
| AMERIGROUP Corp. (Æ)(Ñ) |
2,100 | 50 | ||
| AmerisourceBergen Corp. Class A |
9,900 | 490 | ||
| Amgen, Inc. (Æ) |
2,721 | 150 | ||
| Baxter International, Inc. |
20,030 | 1,129 | ||
| Biogen Idec, Inc. (Æ) |
14,593 | 781 | ||
| BioMarin Pharmaceuticals, Inc. (Æ)(Ñ) |
59,200 | 1,062 | ||
| Bristol-Myers Squibb Co. |
117,311 | 3,702 | ||
| Celgene Corp. (Æ)(Ñ) |
28,765 | 1,649 | ||
| Cooper Cos., Inc. (The) (Ñ) |
22,700 | 1,210 | ||
| CVS Caremark Corp. |
92,740 | 3,380 | ||
| Eli Lilly & Co. |
18,100 | 1,011 | ||
| Express Scripts, Inc. Class A (Æ) |
12,290 | 615 | ||
| Gen-Probe, Inc. (Æ) |
7,100 | 429 |
Multi-Style Equity Fund 5
Table of Contents
Russell Investment Funds
Multi-Style Equity Fund
Schedule of Investments, continued—June 30, 2007 (Unaudited)
Amounts in thousands (except share amounts)
| Principal Amount ($) or Shares |
Market Value $ | |||
| Genentech, Inc. (Æ) |
22,287 | 1,686 | ||
| Gilead Sciences, Inc. (Æ) |
89,272 | 3,461 | ||
| Hospira, Inc. (Æ) |
29,050 | 1,134 | ||
| Human Genome Sciences, Inc. (Æ)(Ñ) |
83,400 | 744 | ||
| Intuitive Surgical, Inc. (Æ)(Ñ) |
4,250 | 590 | ||
| Johnson & Johnson |
53,327 | 3,286 | ||
| King Pharmaceuticals, Inc. (Æ)(Ñ) |
11,900 | 244 | ||
| McKesson Corp. |
7,800 | 465 | ||
| Medco Health Solutions, Inc. (Æ) |
9,359 | 730 | ||
| Medtronic, Inc. |
12,865 | 667 | ||
| Merck & Co., Inc. |
147,556 | 7,348 | ||
| Novartis AG—ADR |
45,600 | 2,557 | ||
| Pfizer, Inc. |
88,200 | 2,255 | ||
| Sanofi-Aventis—ADR |
14,200 | 572 | ||
| Schering-Plough Corp. |
31,800 | 968 | ||
| Shire Pharmaceuticals PLC—ADR (Ñ) |
11,180 | 829 | ||
| St. Jude Medical, Inc. (Æ) |
26,660 | 1,106 | ||
| Stryker Corp. |
30,100 | 1,899 | ||
| Thermo Fisher Scientific, Inc. (Æ) |
51,860 | 2,682 | ||
| Vertex Pharmaceuticals, Inc. (Æ)(Ñ) |
47,500 | 1,357 | ||
| WellPoint, Inc. (Æ) |
12,426 | 992 | ||
| Wyeth |
58,469 | 3,353 | ||
| 63,357 | ||||
| Integrated Oils—4.0% |
||||
| Chevron Corp. |
22,900 | 1,929 | ||
| ConocoPhillips |
6,700 | 526 | ||
| Exxon Mobil Corp. |
40,500 | 3,397 | ||
| Hess Corp. |
89,000 | 5,248 | ||
| Marathon Oil Corp. |
20,400 | 1,223 | ||
| Occidental Petroleum Corp. |
105,200 | 6,089 | ||
| 18,412 | ||||
| Materials and Processing—6.7% |
||||
| Agrium, Inc. |
21,300 | 932 | ||
| Alcoa, Inc. |
10,700 | 434 | ||
| Archer-Daniels-Midland Co. |
18,000 | 596 | ||
| Ashland, Inc. |
14,600 | 934 | ||
| Avery Dennison Corp. |
6,100 | 406 | ||
| Bemis Co., Inc. |
8,100 | 269 | ||
| Cabot Corp. |
1,900 | 91 | ||
| Cameco Corp. (Ñ) |
38,530 | 1,955 | ||
| Celanese Corp. Class A |
7,200 | 279 | ||
| Chemtura Corp. |
29,300 | 325 | ||
| Commercial Metals Co. |
7,100 | 240 | ||
| Corn Products International, Inc. |
6,197 | 282 | ||
| Cytec Industries, Inc. |
16,700 | 1,065 | ||
| Dow Chemical Co. (The) |
9,100 | 402 | ||
| Eastman Chemical Co. (Ñ) |
4,800 | 309 | ||
| EI Du Pont de Nemours & Co. (Ñ) |
87,471 | 4,447 | ||
| EMCOR Group, Inc. (Æ) |
2,100 | 153 | ||
| Energizer Holdings, Inc. (Æ) |
700 | 70 | ||
| Fluor Corp. (Ñ) |
10,734 | 1,195 | ||
| FMC Corp. |
1,800 | 161 | ||
| Huntsman Corp. |
5,200 | 126 | ||
| International Paper Co. |
35,600 | 1,390 | ||
| Lubrizol Corp. |
4,400 | 284 | ||
| Lyondell Chemical Co. (Ñ) |
9,600 | 356 | ||
| Masco Corp. (Ñ) |
71,450 | 2,034 | ||
| MeadWestvaco Corp. |
13,200 | 466 | ||
| Monsanto Co. |
21,330 | 1,441 | ||
| Packaging Corp. of America |
18,400 | 466 | ||
| Perini Corp. (Æ) |
1,200 | 74 | ||
| PPG Industries, Inc. |
13,000 | 989 | ||
| Rio Tinto PLC—ADR |
6,550 | 2,005 | ||
| Rock-Tenn Co. Class A (Ñ) |
1,300 | 41 | ||
| Rohm & Haas Co. |
48,500 | 2,652 | ||
| RPM International, Inc. (Ñ) |
23,400 | 541 | ||
| Sonoco Products Co. (Ñ) |
4,000 | 171 | ||
| Temple-Inland, Inc. |
32,800 | 2,018 | ||
| Timken Co. |
23,400 | 845 | ||
| URS Corp. (Æ) |
3,300 | 160 | ||
| Valspar Corp. |
17,800 | 506 | ||
| 31,110 | ||||
| Miscellaneous—4.0% |
||||
| 3M Co. |
6,200 | 538 | ||
| Brunswick Corp. (Ñ) |
24,100 | 786 | ||
| Foster Wheeler, Ltd. (Æ) |
5,412 | 579 | ||
| General Electric Co. |
310,345 | 11,880 | ||
| Johnson Controls, Inc. |
7,100 | 822 | ||
| Teleflex, Inc. |
500 | 41 | ||
| Textron, Inc. (Ñ) |
37,200 | 4,096 | ||
| 18,742 | ||||
| Other Energy—4.9% |
||||
| Apache Corp. |
11,100 | 906 | ||
| Baker Hughes, Inc. |
55,100 | 4,635 | ||
| Cameron International Corp. (Æ)(Ñ) |
6,939 | 496 | ||
| Consol Energy, Inc. (Ñ) |
17,160 | 791 | ||
| Devon Energy Corp. |
21,300 | 1,668 | ||
| Diamond Offshore Drilling, Inc. |
4,850 | 492 | ||
| Grant Prideco, Inc. (Æ) |
18,300 | 985 | ||
| Grey Wolf, Inc. (Æ) |
8,000 | 66 | ||
| Halliburton Co. |
57,800 | 1,994 | ||
| Noble Energy, Inc. |
7,000 | 437 | ||
| Range Resources Corp. (Ñ) |
16,812 | 629 | ||
| Schlumberger, Ltd. |
58,913 | 5,004 | ||
| Sunoco, Inc. |
6,300 | 502 |
6 Multi-Style Equity Fund
Table of Contents
Russell Investment Funds
Multi-Style Equity Fund
Schedule of Investments, continued—June 30, 2007 (Unaudited)
Amounts in thousands (except share amounts)
| Principal Amount ($) or Shares |
Market Value $ | |||
| Valero Energy Corp. |
8,500 | 628 | ||
| XTO Energy, Inc. |
55,130 | 3,313 | ||
| 22,546 | ||||
| Producer Durables—3.2% |
||||
| Applied Materials, Inc. |
70,200 | 1,395 | ||
| Boeing Co. |
6,500 | 625 | ||
| Caterpillar, Inc. |
22,306 | 1,747 | ||
| Crown Castle International Corp. (Æ)(Ñ) |
28,100 | 1,019 | ||
| Deere & Co. |
10,290 | 1,243 | ||
| Emerson Electric Co. |
35,700 | 1,671 | ||
| Goodrich Corp. |
18,700 | 1,114 | ||
| KB Home (Ñ) |
10,500 | 413 | ||
| Kla-Tencor Corp. |
22,130 | 1,216 | ||
| Lexmark International, Inc. Class A (Æ)(Ñ) |
1,200 | 59 | ||
| Nortel Networks Corp. (Æ) |
27,500 | 661 | ||
| Northrop Grumman Corp. |
8,200 | 639 | ||
| Pentair, Inc. (Ñ) |
21,100 | 814 | ||
| Raytheon Co. |
3,000 | 162 | ||
| Roper Industries, Inc. |
13,980 | 798 | ||
| Spirit Aerosystems Holdings, Inc. Class A (Æ) |
13,261 | 478 | ||
| Standard-Pacific Corp. (Ñ) |
1,900 | 33 | ||
| United Technologies Corp. |
11,636 | 825 | ||
| 14,912 | ||||
| Technology—13.9% |
||||
| Akamai Technologies, Inc. (Æ)(Ñ) |
18,900 | 919 | ||
| Analog Devices, Inc. |
12,400 | 467 | ||
| Apple, Inc. (Æ) |
49,970 | 6,098 | ||
| Applera Corp.—Applied Biosystems Group |
18,400 | 562 | ||
| Arrow Electronics, Inc. (Æ) |
4,700 | 181 | ||
| AU Optronics Corp.—ADR |
26,300 | 452 | ||
| Broadcom Corp. Class A (Æ) |
61,355 | 1,795 | ||
| Brocade Communications Systems, Inc. (Æ) |
53,279 | 417 | ||
| Cisco Systems, Inc. (Æ) |
322,852 | 8,991 | ||
| Computer Sciences Corp. (Æ) |
9,200 | 544 | ||
| Corning, Inc. (Æ) |
74,000 | 1,891 | ||
| Dell, Inc. (Æ) |
37,760 | 1,078 | ||
| Electronic Data Systems Corp. |
16,100 | 446 | ||
| F5 Networks, Inc. (Æ) |
7,550 | 609 | ||
| General Dynamics Corp. |
6,100 | 477 | ||
| Hewlett-Packard Co. |
160,249 | 7,150 | ||
| Ingram Micro, Inc. Class A (Æ) |
10,100 | 219 | ||
| Intel Corp. |
167,160 | 3,972 | ||
| International Business Machines Corp. (Ñ) |
18,200 | 1,916 | ||
| Maxim Integrated Products, Inc. |
36,600 | 1,223 | ||
| Microsoft Corp. |
92,561 | 2,728 | ||
| Motorola, Inc. |
90,850 | 1,608 | ||
| Qualcomm, Inc. |
161,360 | 7,001 | ||
| Research In Motion, Ltd. (Æ) |
10,900 | 2,180 | ||
| Salesforce.com, Inc. (Æ)(Ñ) |
18,720 | 802 | ||
| SanDisk Corp. (Æ)(Ñ) |
28,216 | 1,381 | ||
| Seagate Technology |
39,700 | 864 | ||
| Seagate Technology, Inc. (Æ) |
2,300 | — | ||
| Sun Microsystems, Inc. (Æ) |
108,500 | 571 | ||
| Sunpower Corp. Class A (Æ)(Ñ) |
11,260 | 710 | ||
| Taiwan Semiconductor Manufacturing Co., Ltd.—ADR |
87,535 | 974 | ||
| Texas Instruments, Inc. |
148,136 | 5,574 | ||
| Unisys Corp. (Æ) |
25,900 | 237 | ||
| Xilinx, Inc. (Ñ) |
25,165 | 674 | ||
| 64,711 | ||||
| Utilities—3.6% |
||||
| Aqua America, Inc. (Ñ) |
25,800 | 580 | ||
| AT&T, Inc. |
141,161 | 5,858 | ||
| Atmos Energy Corp. |
1,800 | 54 | ||
| Constellation Energy Group, Inc. |
6,800 | 593 | ||
| Dominion Resources, Inc. |
29,950 | 2,585 | ||
| Edison International |
8,900 | 500 | ||
| Embarq Corp. |
7,900 | 501 | ||
| FirstEnergy Corp. |
4,100 | 265 | ||
| Level 3 Communications, Inc. (Æ)(Ñ) |
54,600 | 319 | ||
| MetroPCS Communications, Inc. (Æ)(Ñ) |
11,840 | 391 | ||
| NII Holdings, Inc. (Æ)(Ñ) |
15,700 | 1,268 | ||
| NiSource, Inc. (Ñ) |
18,500 | 383 | ||
| Pepco Holdings, Inc. |
4,800 | 135 | ||
| Progress Energy, Inc.—CVO |
1,300 | 1 | ||
| SCANA Corp. (Ñ) |
5,100 | 195 | ||
| TECO Energy, Inc. |
16,800 | 289 | ||
| Time Warner Telecom, Inc. Class A (Æ)(Ñ) |
23,600 | 474 | ||
| Verizon Communications, Inc. |
57,500 | 2,367 | ||
| 16,758 | ||||
| Total Common Stocks | ||||
| (cost $388,161) |
443,269 | |||
Multi-Style Equity Fund 7
Table of Contents
Russell Investment Funds
Multi-Style Equity Fund
Schedule of Investments, continued—June 30, 2007 (Unaudited)
Amounts in thousands (except share amounts)
| Principal Amount ($) or Shares |
Market Value $ |
||||
| Short-Term Investments—4.5% |
|||||
| Russell Investment Company Money Market Fund |
19,870,000 | 19,870 | |||
| United States Treasury Bills (ž)(§) |
|||||
| 4.649% due 09/27/07 |
1,200 | 1,186 | |||
| Total Short-Term Investments |
|||||
| (cost $21,057) |
21,056 | ||||
| Other Securities—9.7% |
|||||
| State Street Securities Lending Quality Trust (×) |
44,936,626 | 44,937 | |||
| Total Other Securities |
|||||
| (cost $44,937) |
44,937 | ||||
| Total Investments—109.7% |
|||||
| (identified cost $454,155) |
509,262 | ||||
| Other Assets and Liabilities, Net—(9.7%) |
(44,991 | ) | |||
| Net Assets—100.0% |
464,271 | ||||
See accompanying notes which are an integral part of the financial statements.
8 Multi-Style Equity Fund
Table of Contents
Russell Investment Funds
Multi-Style Equity Fund
Schedule of Investments, continued—June 30, 2007 (Unaudited)
Amounts in thousands
| Futures Contracts (Number of Contracts) |
Notional Amount $ |
Unrealized Appreciation (Depreciation) |
|||
| Long Positions |
|||||
| Russell 1000 Index expiration date 09/07 (7) |
2,887 | (50 | ) | ||
| S&P 500 E-Mini Index (CME) expiration date 09/07 (39) |
2,955 | (64 | ) | ||
| S&P 500 Index (CME) expiration date 09/07 (10) |
3,789 | (61 | ) | ||
| S&P Midcap 400 E-Mini Index (CME) expiration date 09/07 (126) |
11,393 | (20 | ) | ||
| Total Unrealized Appreciation (Depreciation) on Open Futures Contracts |
(195 | ) | |||
Presentation of Portfolio Holdings—June 30, 2007 (Unaudited)
| Portfolio Summary |
% of Net Assets |
||
| Auto and Transportation |
2.1 | ||
| Consumer Discretionary |
13.7 | ||
| Consumer Staples |
9.2 | ||
| Financial Services |
16.5 | ||
| Health Care |
13.7 | ||
| Integrated Oils |
4.0 | ||
| Materials and Processing |
6.7 | ||
| Miscellaneous |
4.0 | ||
| Other Energy |
4.9 | ||
| Producer Durables |
3.2 | ||
| Technology |
13.9 | ||
| Utilities |
3.6 | ||
| Short-Term Investments |
4.5 | ||
| Other Securities |
9.7 | ||
| Total Investments |
109.7 | ||
| Other Assets and Liabilities, Net |
(9.7 | ) | |
| 100.0 | |||
| Futures Contracts |
(— | )* |
| * | Less than .05% of net assets |
See accompanying notes which are an integral part of the financial statements.
Multi-Style Equity Fund 9
Table of Contents
Aggressive Equity Fund
Shareholder Expense Example—June 30, 2007 (Unaudited)
Fund Expenses
The following disclosure provides important information regarding each Fund’s Expense Example, which appears on each Fund’s individual page in this Semiannual Report. Please refer to this information when reviewing the Expense Example for a Fund.
Example
As a shareholder of the Fund, you incur two types of costs: (1) transaction costs, and (2) ongoing costs, including management fees; and other Fund expenses. The Example is intended to help you understand your ongoing costs (in dollars) of investing in the Fund and to compare these costs with the ongoing costs of investing in other mutual funds. The Example is based on an investment of $1,000 invested at the beginning of the period and held for the entire period indicated, which for this Fund is from January 1, 2007 to June 30, 2007.
Actual Expenses
The information in the table under the heading “Actual Performance” provides information about actual account values and actual expenses. You may use the information in this column, together with the amount you invested, to estimate the expenses that you paid over the period. Simply divide your account value by $1,000 (for example, an $8,600 account value divided by $1,000 = 8.6), then multiply the result by the number in the first column in the row entitled “Expenses Paid During Period” to estimate the expenses you paid on your account during this period.
Hypothetical Example for Comparison Purposes
The information in the table under the heading “Hypothetical Performance (5% return before expenses)” provides information about hypothetical account values and hypothetical expenses based on the Fund’s actual expense ratio and an assumed rate of return of 5% per year before expenses, which is not the Fund’s actual return. The hypothetical account values and expenses may not be used to estimate the actual ending account balance or expenses you paid for the period. You may use this information to compare the ongoing costs of investing in the Fund and other funds. To do so, compare this 5% hypothetical example with the 5% hypothetical examples that appear in the shareholder reports of other funds.
Please note that the expenses shown in the table are meant to highlight your ongoing costs only and do not reflect any transactional costs. Therefore, the information under the heading “Hypothetical Performance (5% return before expenses)” is useful in comparing ongoing costs only, and will not help you determine the relative total costs of owning different funds. In addition, if these transactional costs were included, your costs would have been higher.
| Actual Performance |
Hypothetical Performance (5% return before expenses) | |||||
| Beginning Account Value January 1, 2007 |
$ | 1,000.00 | $ | 1,000.00 | ||
| Ending Account Value June 30, 2007 |
$ | 1,084.20 | $ | 1,019.59 | ||
| Expenses Paid During Period* |
$ | 5.43 | $ | 5.26 | ||
| * | Expenses are equal to the Fund’s annualized expense ratio of 1.05% (representing the one-half year period annualized), multiplied by the average account value over the period, multiplied by 181/365 (to reflect the one-half year period). Reflects amounts waived and/or reimbursed by the investment adviser. Without the waiver and/or reimbursement, expenses would have been higher. |
10 Aggressive Equity Fund
Table of Contents
Russell Investment Funds
Aggressive Equity Fund
Schedule of Investments—June 30, 2007 (Unaudited)
Amounts in thousands (except share amounts)
| Principal Amount ($) or Shares |
Market Value $ | |||
| Common Stocks—97.2% |
||||
| Auto and Transportation—3.3% |
||||
| AAR Corp. (Æ) |
7,000 | 231 | ||
| Aftermarket Technology Corp. (Æ) |
4,300 | 128 | ||
| Alaska Air Group, Inc. (Æ) |
5,200 | 145 | ||
| Arctic Cat, Inc. |
2,500 | 50 | ||
| Atlas Air Worldwide Holdings, Inc. (Æ) |
500 | 29 | ||
| Autoliv, Inc. |
7,100 | 404 | ||
| Con-way, Inc. |
6,000 | 301 | ||
| Continental Airlines, Inc. Class A (Æ) |
9,993 | 338 | ||
| Cooper Tire & Rubber Co. |
2,000 | 55 | ||
| Dana Corp. (Æ)(Ñ) |
47,300 | 96 | ||
| Danaos Corp. (Ñ) |
3,700 | 116 | ||
| Eagle Bulk Shipping, Inc. (Ñ) |
7,200 | 161 | ||
| ExpressJet Holdings, Inc. Class A (Æ) |
36,670 | 219 | ||
| Genco Shipping & Trading, Ltd. (Ñ) |
4,600 | 190 | ||
| General Motors Corp. |
20,481 | 774 | ||
| Greenbrier Cos., Inc. (Ñ) |
6,800 | 205 | ||
| Grupo Aeroportuario del Sureste SABde CV—ADR |
7,700 | 406 | ||
| Gulfmark Offshore, Inc. (Æ)(Ñ) |
4,000 | 205 | ||
| Horizon Lines, Inc. Class A |
14,359 | 470 | ||
| Kansas City Southern (Æ)(Ñ) |
5,700 | 214 | ||
| Kirby Corp. (Æ) |
10,467 | 402 | ||
| Modine Manufacturing Co. |
4,600 | 104 | ||
| Navios Maritime Holdings, Inc. |
53,600 | 647 | ||
| Navistar International Corp. (Æ) |
4,500 | 297 | ||
| Polaris Industries, Inc. |
4,093 | 222 | ||
| Saia, Inc. (Æ)(Ñ) |
2,500 | 68 | ||
| Skywest, Inc. |
7,958 | 190 | ||
| Standard Motor Products, Inc. |
9,203 | 138 | ||
| Tidewater, Inc. |
323 | 23 | ||
| TRW Automotive Holdings Corp. (Æ) |
11,200 | 413 | ||
| US Airways Group, Inc. (Æ) |
13,000 | 394 | ||
| UTI Worldwide, Inc. |
12,273 | 329 | ||
| 7,964 | ||||
| Consumer Discretionary—18.3% |
||||
| ABM Industries, Inc. |
8,329 | 215 | ||
| Activision, Inc. (Æ) |
52,704 | 984 | ||
| Advance Auto Parts, Inc. |
4,800 | 195 | ||
| Advisory Board Co. (The) (Æ) |
7,934 | 441 | ||
| Aeropostale, Inc. (Æ) |
4,600 | 192 | ||
| AFC Enterprises (Æ)(Ñ) |
5,000 | 86 | ||
| Alberto-Culver Co. Class B |
12,700 | 301 | ||
| American Eagle Outfitters, Inc. |
12,950 | 332 | ||
| American Woodmark Corp. |
6,145 | 213 | ||
| aQuantive, Inc. (Æ) |
3,492 | 223 | ||
| Asbury Automotive Group, Inc. |
7,827 | 195 | ||
| AutoNation, Inc. (Æ)(Ñ) |
19,000 | 426 | ||
| Baidu.com—ADR (Æ) |
1,400 | 235 | ||
| Bally Technologies, Inc. (Æ) |
4,991 | 132 | ||
| Bare Escentuals, Inc. (Æ) |
18,467 | 631 | ||
| Barnes & Noble, Inc. |
8,400 | 323 | ||
| Big 5 Sporting Goods Corp. (Ñ) |
400 | 10 | ||
| Big Lots, Inc. (Æ) |
27,719 | 815 | ||
| Black & Decker Corp. |
1,042 | 92 | ||
| Blockbuster, Inc. Class A (Æ) |
40,468 | 174 | ||
| Blyth, Inc. (Ñ) |
6,200 | 165 | ||
| Bob Evans Farms, Inc. |
2,025 | 75 | ||
| Books-A-Million, Inc. Class A |
1,107 | 19 | ||
| Bowne & Co., Inc. |
4,400 | 86 | ||
| Bright Horizons Family Solutions, Inc. (Æ)(Ñ) |
5,700 | 222 | ||
| Brown Shoe Co., Inc. |
9,407 | 229 | ||
| Buckle, Inc. (The) |
4,600 | 181 | ||
| Buffalo Wild Wings, Inc. (Æ)(Ñ) |
4,400 | 183 | ||
| CBRL Group, Inc. |
7,125 | 303 | ||
| CDI Corp. (Ñ) |
1,500 | 48 | ||
| CEC Entertainment, Inc. (Æ) |
8,100 | 285 | ||
| Cenveo, Inc. (Æ) |
3,800 | 88 | ||
| Charlotte Russe Holding, Inc. (Æ) |
5,789 | 156 | ||
| Chemed Corp. (Ñ) |
6,100 | 404 | ||
| Children’s Place Retail Stores, Inc. (The) (Æ) |
3,384 | 175 | ||
| Chipotle Mexican Grill, Inc. Class A (Æ)(Ñ) |
4,600 | 392 | ||
| Churchill Downs, Inc. (Ñ) |
4,700 | 246 | ||
| Cinemark Holdings, Inc. (Æ)(Ñ) |
9,000 | 161 | ||
| CMGI, Inc. (Æ)(Ñ) |
190,640 | 372 | ||
| Columbia Sportswear Co. (Ñ) |
1,100 | 76 | ||
| Convergys Corp. (Æ) |
58,072 | 1,408 | ||
| Core-Mark Holding Co., Inc. (Æ)(Ñ) |
800 | 29 | ||
| Corinthian Colleges, Inc. (Æ)(Ñ) |
15,100 | 246 | ||
| CROCS, Inc. (Æ)(Ñ) |
24,400 | 1,050 | ||
| CSS Industries, Inc. (Ñ) |
900 | 36 | ||
| Denny’s Corp. (Æ) |
19,802 | 88 | ||
| DeVry, Inc. (Ñ) |
14,000 | 476 | ||
| Dick’s Sporting Goods, Inc. (Æ)(Ñ) |
2,200 | 128 | ||
| Dillard’s, Inc. Class A |
5,400 | 194 | ||
| Dolby Laboratories, Inc. Class A (Æ) |
22,100 | 783 | ||
| Dollar Tree Stores, Inc. (Æ) |
19,459 | 847 | ||
| DreamWorks Animation SKG, Inc. Class A (Æ) |
8,700 | 251 | ||
| Earthlink, Inc. (Æ)(Ñ) |
18,700 | 140 | ||
| Elizabeth Arden, Inc. (Æ)(Ñ) |
5,900 | 143 | ||
| Family Dollar Stores, Inc. |
706 | 24 | ||
| Finish Line Class A (Ñ) |
6,200 | 56 | ||
| Focus Media Holding, Ltd.—ADR (Æ)(Ñ) |
7,000 | 353 | ||
| Foot Locker, Inc. |
15,300 | 334 | ||
| FTD Group, Inc. (Ñ) |
26,300 | 484 |
Aggressive Equity Fund 11
Table of Contents
Russell Investment Funds
Aggressive Equity Fund
Schedule of Investments, continued—June 30, 2007 (Unaudited)
Amounts in thousands (except share amounts)
| Principal Amount ($) or Shares |
Market Value $ | |||
| GameStop Corp. Class A (Æ) |
10,573 | 413 | ||
| GateHouse Media, Inc. (Ñ) |
15,000 | 278 | ||
| Gevity HR, Inc. (Ñ) |
7,600 | 147 | ||
| Greenfield Online, Inc. (Æ) |
7,636 | 121 | ||
| Group 1 Automotive, Inc. (Ñ) |
5,900 | 238 | ||
| Guess?, Inc. (Ñ) |
6,100 | 293 | ||
| Gymboree Corp. (Æ) |
1,984 | 78 | ||
| Harris Interactive, Inc. (Æ) |
5,774 | 31 | ||
| Hasbro, Inc. (Ñ) |
38,936 | 1,223 | ||
| Helen of Troy, Ltd. (Æ) |
7,200 | 194 | ||
| Home Inns & Hotels Management, Inc.—ADR (Æ)(Ñ) |
9,500 | 306 | ||
| ICF International, Inc. (Æ) |
7,300 | 147 | ||
| Iconix Brand Group, Inc. (Æ)(Ñ) |
36,170 | 804 | ||
| Idearc, Inc. (Ñ) |
5,100 | 180 | ||
| IKON Office Solutions, Inc. |
4,600 | 72 | ||
| infoUSA, Inc. (Ñ) |
15,171 | 155 | ||
| Inter Parfums, Inc. (Ñ) |
6,900 | 184 | ||
| International Speedway Corp. Class A (Ñ) |
1,900 | 100 | ||
| ITT Educational Services, Inc. (Æ) |
1,600 | 188 | ||
| J Crew Group, Inc. (Æ)(Ñ) |
13,700 | 741 | ||
| Jakks Pacific, Inc. (Æ) |
9,329 | 263 | ||
| Jamba, Inc. (Æ)(Ñ) |
18,700 | 171 | ||
| Jarden Corp. (Æ) |
11,800 | 507 | ||
| Jo-Ann Stores, Inc. (Æ) |
7,836 | 223 | ||
| Jones Apparel Group, Inc. |
12,900 | 364 | ||
| Journal Communications, Inc. Class A |
2,086 | 27 | ||
| Kelly Services, Inc. Class A (Ñ) |
3,400 | 93 | ||
| Kenexa Corp. (Æ)(Ñ) |
8,800 | 332 | ||
| Kenneth Cole Productions, Inc. Class A (Ñ) |
2,700 | 67 | ||
| Knology, Inc. (Æ) |
2,282 | 40 | ||
| Korn/Ferry International (Æ)(Ñ) |
10,700 | 281 | ||
| Leapfrog Enterprises, Inc. Class A (Æ)(Ñ) |
11,500 | 118 | ||
| Lee Enterprises, Inc. |
11,800 | 246 | ||
| Life Time Fitness, Inc. (Æ)(Ñ) |
10,900 | 580 | ||
| Lithia Motors, Inc. Class A (Ñ) |
3,100 | 79 | ||
| Liz Claiborne, Inc. (Ñ) |
8,000 | 298 | ||
| LKQ Corp. (Æ) |
16,576 | 409 | ||
| Lodgenet Entertainment Corp. (Æ) |
3,915 | 125 | ||
| LoopNet, Inc. (Æ)(Ñ) |
17,300 | 404 | ||
| Maidenform Brands, Inc. (Æ) |
2,500 | 50 | ||
| McCormick & Schmick’s Seafood Restaurants, Inc. (Æ)(Ñ) |
7,100 | 184 | ||
| Media General, Inc. Class A (Ñ) |
6,200 | 206 | ||
| Men’s Wearhouse, Inc. (The) |
2,700 | 138 | ||
| Meredith Corp. |
8,518 | 525 | ||
| Morton’s Restaurant Group, Inc. (Æ)(Ñ) |
2,000 | 36 | ||
| Mothers Work, Inc. (Æ) |
373 | 12 | ||
| Movado Group, Inc. |
2,300 | 78 | ||
| MPS Group, Inc. (Æ) |
8,283 | 111 | ||
| MSC Industrial Direct Co., Inc. Class A |
10,280 | 565 | ||
| New Oriental Education & Technology Group—ADR (Æ) |
2,300 | 124 | ||
| Nu Skin Enterprises, Inc. Class A |
4,600 | 76 | ||
| O’Charleys, Inc. (Ñ) |
18,948 | 382 | ||
| O’Reilly Automotive, Inc. (Æ) |
13,704 | 501 | ||
| OfficeMax, Inc. |
5,200 | 204 | ||
| On Assignment, Inc. (Æ)(Ñ) |
15,200 | 163 | ||
| Orient-Express Hotels, Ltd. Class A |
5,245 | 280 | ||
| Oxford Industries, Inc. (Ñ) |
2,500 | 111 | ||
| PC Connection, Inc. (Æ) |
1,877 | 25 | ||
| Perry Ellis International, Inc. (Æ) |
16,923 | 544 | ||
| Phillips-Van Heusen Corp. |
11,400 | 690 | ||
| Pier 1 Imports, Inc. (Æ)(Ñ) |
20,000 | 170 | ||
| Prestige Brands Holdings, Inc. (Æ) |
2,010 | 26 | ||
| Priceline.com, Inc. (Æ)(Ñ) |
11,000 | 756 | ||
| Quiksilver, Inc. (Æ)(Ñ) |
21,800 | 308 | ||
| RadioShack Corp. |
11,379 | 377 | ||
| Rent-A-Center, Inc. Class A (Æ)(Ñ) |
14,800 | 388 | ||
| Republic Services, Inc. Class A |
29,794 | 913 | ||
| Resources Connection, Inc. (Æ) |
12,110 | 402 | ||
| Robert Half International, Inc. |
9,860 | 360 | ||
| Rush Enterprises, Inc. Class A (Æ) |
2,300 | 50 | ||
| Scholastic Corp. (Æ)(Ñ) |
6,400 | 230 | ||
| Scientific Games Corp. (Æ)(Ñ) |
7,200 | 252 | ||
| Service Corp. International |
34,700 | 443 | ||
| Shanda Interactive Entertainment, Ltd.—ADR (Æ) |
16,700 | 518 | ||
| Sinclair Broadcast Group, Inc. Class A |
6,105 | 87 | ||
| Skechers USA, Inc. Class A (Æ) |
2,100 | 61 | ||
| Sonic Automotive, Inc. Class A (Ñ) |
5,800 | 168 | ||
| Sonic Corp. (Æ) |
9,483 | 210 | ||
| Speedway Motorsports, Inc. (Ñ) |
1,400 | 56 | ||
| Spherion Corp. (Æ) |
8,000 | 75 | ||
| Stein Mart, Inc. (Ñ) |
18,700 | 229 | ||
| Stewart Enterprises, Inc. Class A (Ñ) |
7,100 | 55 | ||
| Sturm Ruger & Co., Inc. (Æ) |
13,100 | 203 | ||
| Take-Two Interactive Software, Inc. (Æ)(Ñ) |
10,000 | 200 | ||
| Tech Data Corp. (Æ) |
1,400 | 54 | ||
| TeleTech Holdings, Inc. (Æ) |
8,600 | 279 | ||
| Timberland Co. Class A (Æ)(Ñ) |
5,000 | 126 | ||
| Tractor Supply Co. (Æ) |
5,666 | 295 | ||
| Tupperware Corp. |
18,016 | 518 | ||
| Under Armour, Inc. Class A (Æ) |
6,787 | 310 | ||
| Unifirst Corp. |
1,500 | 66 | ||
| United Online, Inc. (Ñ) |
26,500 | 437 | ||
| United Stationers, Inc. (Æ) |
3,400 | 227 |
12 Aggressive Equity Fund
Table of Contents
Russell Investment Funds
Aggressive Equity Fund
Schedule of Investments, continued—June 30, 2007 (Unaudited)
Amounts in thousands (except share amounts)
| Principal Amount ($) or Shares |
Market Value $ | |||
| Urban Outfitters, Inc. (Æ)(Ñ) |
17,400 | 418 | ||
| VeriSign, Inc. (Æ) |
13,830 | 439 | ||
| VistaPrint, Ltd. (Æ)(Ñ) |
6,300 | 241 | ||
| Volcom, Inc. (Æ)(Ñ) |
5,300 | 266 | ||
| Volt Information Sciences, Inc. (Æ) |
994 | 18 | ||
| Warnaco Group, Inc. (The) (Æ) |
8,300 | 327 | ||
| Warner Music Group Corp. (Ñ) |
20,200 | 292 | ||
| West Marine, Inc. (Æ) |
8,736 | 120 | ||
| WMS Industries, Inc. (Æ)(Ñ) |
9,750 | 281 | ||
| World Wrestling Entertainment, Inc. Class A (Ñ) |
19,000 | 304 | ||
| Zumiez, Inc. (Æ)(Ñ) |
7,600 | 287 | ||
| 44,518 | ||||
| Consumer Staples—2.7% |
||||
| Alliance One International, Inc. (Æ) |
103,635 | 1,041 | ||
| B&G Foods, Inc. Class A (Ñ) |
23,700 | 313 | ||
| Boston Beer Co., Inc. Class A (Æ)(Ñ) |
1,500 | 59 | ||
| Del Monte Foods Co. (Ñ) |
30,100 | 366 | ||
| Diamond Foods, Inc. (Ñ) |
1,400 | 25 | ||
| Flowers Foods, Inc. (Ñ) |
7,800 | 260 | ||
| Green Mountain Coffee Roasters, Inc. (Æ)(Ñ) |
3,100 | 244 | ||
| Hansen Natural Corp. (Æ) |
10,542 | 453 | ||
| Hormel Foods Corp. |
2,500 | 93 | ||
| Imperial Sugar Co. (Ñ) |
900 | 28 | ||
| JM Smucker Co. (The) |
6,545 | 417 | ||
| Loews Corp.—Carolina Group |
13,471 | 1,041 | ||
| McCormick & Co., Inc. |
4,000 | 153 | ||
| Molson Coors Brewing Co. Class B (Ñ) |
4,800 | 444 | ||
| Nash Finch Co. |
5,847 | 289 | ||
| NBTY, Inc. (Æ) |
7,338 | 317 | ||
| PepsiAmericas, Inc. (Ñ) |
5,100 | 125 | ||
| Reddy Ice Holdings, Inc. |
7,458 | 213 | ||
| Ruddick Corp. (Ñ) |
1,600 | 48 | ||
| Schweitzer-Mauduit International, Inc. |
4,429 | 137 | ||
| Tootsie Roll Industries, Inc. (Ñ) |
9,459 | 262 | ||
| Universal Corp. |
2,389 | 146 | ||
| 6,474 | ||||
| Financial Services—15.4% |
||||
| Advanta Corp. Class B |
1,239 | 39 | ||
| Advent Software, Inc. (Æ) |
19,600 | 638 | ||
| Affiliated Managers Group, Inc. (Æ) |
6,904 | 889 | ||
| Affirmative Insurance Holdings, Inc. |
1,500 | 23 | ||
| AG Edwards, Inc. |
6,056 | 512 | ||
| Alesco Financial, Inc. (ö) |
9,500 | 77 | ||
| AMB Property Corp. (ö) |
6,500 | 346 | ||
| American Financial Group, Inc. |
12,122 | 414 | ||
| American Financial Realty Trust (ö)(Ñ) |
21,000 | 217 | ||
| Amerisafe, Inc. (Æ) |
9,006 | 177 | ||
| Annaly Capital Management, Inc. (ö) |
49,500 | 714 | ||
| Anthracite Capital, Inc. (ö) |
5,601 | 66 | ||
| Anworth Mortgage Asset Corp. (ö) |
26,700 | 242 | ||
| Apartment Investment & Management Co. Class A (ö) |
8,500 | 429 | ||
| Apollo Investment Corp. |
22,800 | 491 | ||
| Arch Capital Group, Ltd. (Æ) |
3,900 | 283 | ||
| Ashford Hospitality Trust, Inc. (ö) |
32,400 | 381 | ||
| Assurant, Inc. |
9,411 | 554 | ||
| Astoria Financial Corp. |
4,300 | 108 | ||
| Axis Capital Holdings, Ltd. (Ñ) |
5,100 | 207 | ||
| Bancfirst Corp. |
1,000 | 43 | ||
| Bancorpsouth, Inc. |
2,400 | 59 | ||
| Bank of Hawaii Corp. |
3,300 | 170 | ||
| BankUnited Financial Corp. Class A |
15,494 | 311 | ||
| Banner Corp. |
1,000 | 34 | ||
| BioMed Realty Trust, Inc. (ö) |
9,000 | 226 | ||
| BOK Financial Corp. |
930 | 50 | ||
| Broadridge Financial Solutions, Inc. |
12,600 | 241 | ||
| Camden Property Trust (ö) |
5,200 | 348 | ||
| Capital Trust, Inc. Class A (ö)(Ñ) |
500 | 17 | ||
| Capstead Mortgage Corp. |
900 | 9 | ||
| Cash America International, Inc. |
7,814 | 310 | ||
| CB Richard Ellis Group, Inc. Class A (Æ) |
2,889 | 105 | ||
| CBL & Associates Properties, Inc. (ö)(Ñ) |
9,800 | 353 | ||
| CIT Group, Inc. |
4,800 | 263 | ||
| City Bank (Ñ) |
1,200 | 38 | ||
| Colonial BancGroup, Inc. (The) |
8,600 | 215 | ||
| Commerce Bancshares, Inc. (Ñ) |
2,310 | 105 | ||
| Community Bancorp (Æ) |
5,790 | 162 | ||
| Corus Bankshares, Inc. (Ñ) |
11,502 | 199 | ||
| Cowen Group, Inc. (Æ)(Ñ) |
2,000 | 36 | ||
| Crystal River Capital, Inc. (ö)(Ñ) |
19,900 | 483 | ||
| Deerfield Triarc Capital Corp. (ö) |
23,400 | 342 | ||
| Deluxe Corp. (Ñ) |
26,826 | 1,089 | ||
| Dime Community Bancshares (Ñ) |
12,700 | 168 | ||
| Downey Financial Corp. |
4,753 | 314 | ||
| East West Bancorp, Inc. (Ñ) |
7,700 | 299 | ||
| EastGroup Properties, Inc. (ö) |
700 | 31 | ||
| Eaton Vance Corp. |
6,669 | 295 | ||
| EMC Insurance Group, Inc. |
900 | 22 | ||
| Entertainment Properties Trust (ö) |
2,143 | 115 | ||
| Euronet Worldwide, Inc. (Æ) |
14,767 | 431 | ||
| Factset Research Systems, Inc. |
5,000 | 342 | ||
| FBL Financial Group, Inc. Class A |
900 | 35 | ||
| FCStone Group, Inc. (Æ)(Ñ) |
1,700 | 97 | ||
| Federated Investors, Inc. Class B |
6,730 | 258 | ||
| Feldman Mall Properties, Inc. (ö) |
14,900 | 170 |
Aggressive Equity Fund 13
Table of Contents
Russell Investment Funds
Aggressive Equity Fund
Schedule of Investments, continued—June 30, 2007 (Unaudited)
Amounts in thousands (except share amounts)
| Principal Amount ($) or Shares |
Market Value $ | |||
| Fidelity National Financial, Inc. Class A |
18,900 | 448 | ||
| First American Corp. (Ñ) |
17,000 | 841 | ||
| First Cash Financial Services, Inc. (Æ)(Ñ) |
14,400 | 338 | ||
| First Marblehead Corp. (The) |
1,222 | 47 | ||
| First Regional Bancorp (Æ) |
900 | 23 | ||
| FirstFed Financial Corp. (Æ)(Ñ) |
8,451 | 479 | ||
| Flushing Financial Corp. (Ñ) |
9,900 | 159 | ||
| Friedman Billings Ramsey Group, Inc. Class A (ö)(Ñ) |
79,500 | 434 | ||
| GFI Group, Inc. (Æ)(Ñ) |
11,300 | 819 | ||
| Global Payments, Inc. |
7,175 | 284 | ||
| Gramercy Capital Corp. (ö)(Ñ) |
1,000 | 28 | ||
| Greater Bay Bancorp (Ñ) |
4,500 | 125 | ||
| Harleysville Group, Inc. |
1,000 | 33 | ||
| HCC Insurance Holdings, Inc. |
10,250 | 342 | ||
| Health Care Property Investors, Inc. (ö) |
6,900 | 200 | ||
| Health Care REIT, Inc. (ö) |
1,700 | 69 | ||
| Heartland Payment Systems, Inc. |
2,949 | 86 | ||
| Hercules Technology Growth Capital, Inc. (Ñ) |
20,700 | 280 | ||
| Hersha Hospitality Trust (ö)(Ñ) |
3,400 | 40 | ||
| Hospitality Properties Trust (ö) |
10,100 | 419 | ||
| HRPT Properties Trust (ö)(Ñ) |
27,400 | 285 | ||
| Huron Consulting Group, Inc. (Æ)(Ñ) |
7,200 | 526 | ||
| IBERIABANK Corp. (Ñ) |
900 | 44 | ||
| Intersections, Inc. (Æ) |
172 | 2 | ||
| Intervest Bancshares Corp. Class A (Ñ) |
2,300 | 65 | ||
| Investors Bancorp, Inc. (Æ) |
17,700 | 238 | ||
| Investors Real Estate Trust (ö) |
2,600 | 27 | ||
| IPC Holdings, Ltd. |
11,700 | 378 | ||
| iStar Financial, Inc. (ö) |
14,956 | 663 | ||
| ITLA Capital Corp. (Ñ) |
1,526 | 80 | ||
| JER Investors Trust, Inc. (ö)(Ñ) |
30,700 | 460 | ||
| JER Investors Trust, Inc. (Æ)(Þ) |
9,200 | 138 | ||
| Jones Lang LaSalle, Inc. |
1,498 | 170 | ||
| KKR Financial Holdings LLC (ö) |
15,300 | 381 | ||
| LaSalle Hotel Properties (ö)(Ñ) |
5,000 | 217 | ||
| Liberty Property Trust (ö)(Ñ) |
10,000 | 439 | ||
| Luminent Mortgage Capital, Inc. (ö)(Ñ) |
32,900 | 332 | ||
| Macatawa Bank Corp. (Ñ) |
1,260 | 20 | ||
| MCG Capital Corp. |
14,600 | 234 | ||
| Mcgrath Rentcorp (Ñ) |
8,700 | 293 | ||
| Meadowbrook Insurance Group, Inc. (Æ) |
2,200 | 24 | ||
| Mercantile Bank Corp. (Ñ) |
735 | 20 | ||
| MFA Mortgage Investments, Inc. (ö) |
51,400 | 374 | ||
| National Retail Properties, Inc. (ö) |
20,122 | 440 | ||
| Nationwide Financial Services, Inc. (Ñ) |
5,900 | 373 | ||
| Navigators Group, Inc. (Æ) |
2,290 | 123 | ||
| Newcastle Investment Corp. (ö) |
15,815 | 396 | ||
| NorthStar Realty Finance Corp. (ö)(Ñ) |
26,000 | 325 | ||
| Nymex Holdings, Inc. |
3,253 | 409 | ||
| Ocwen Financial Corp. (Æ) |
13,788 | 184 | ||
| Odyssey Re Holdings Corp. (Ñ) |
5,100 | 219 | ||
| Oriental Financial Group (Ñ) |
8,563 | 93 | ||
| Pacific Capital Bancorp NA |
4,123 | 111 | ||
| Pennsylvania Real Estate Investment Trust (ö) |
5,100 | 226 | ||
| People’s United Financial, Inc. |
14,400 | 255 | ||
| Philadelphia Consolidated Holding Co. (Æ) |
5,108 | 214 | ||
| Pico Holdings, Inc. (Æ)(Ñ) |
1,800 | 78 | ||
| PMI Group, Inc. (The) |
8,043 | 359 | ||
| Potlatch Corp. (ö)(Ñ) |
6,888 | 297 | ||
| Preferred Bank (Ñ) |
3,550 | 142 | ||
| Protective Life Corp. |
7,600 | 363 | ||
| RAIT Financial Trust (ö)(Ñ) |
15,900 | 414 | ||
| Raymond James Financial, Inc. |
24,300 | 751 | ||
| Realty Income Corp. (ö) |
12,740 | 321 | ||
| Reinsurance Group of America, Inc. |
4,800 | 289 | ||
| Ryder System, Inc. (Ñ) |
11,300 | 608 | ||
| S1 Corp. (Æ) |
26,962 | 215 | ||
| Safety Insurance Group, Inc. |
6,111 | 253 | ||
| SeaBright Insurance Holdings, Inc. (Æ) |
2,900 | 51 | ||
| Security Bank Corp. (Ñ) |
1,500 | 30 | ||
| SEI Investments Co. |
14,800 | 430 | ||
| Southwest Bancorp, Inc. |
1,216 | 29 | ||
| Stancorp Financial Group, Inc. |
8,800 | 462 | ||
| Sterling Bancorp (Ñ) |
7,100 | 114 | ||
| Sterling Bancshares, Inc. (Ñ) |
18,500 | 209 | ||
| SWS Group, Inc. (Ñ) |
13,886 | 300 | ||
| Taylor Capital Group, Inc. |
3,469 | 95 | ||
| Technology Investment Capital Corp. (Ñ) |
3,400 | 54 | ||
| Thornburg Mortgage, Inc. (ö) |
4,600 | 120 | ||
| Total System Services, Inc. |
10,279 | 303 | ||
| Transatlantic Holdings, Inc. (Ñ) |
1,100 | 78 | ||
| Triad Guaranty, Inc. (Æ) |
5,118 | 204 | ||
| U-Store-It Trust (ö)(Ñ) |
12,800 | 210 | ||
| United America Indemnity, Ltd. Class A (Æ) |
2,900 | 72 | ||
| United Fire & Casualty Co. (Ñ) |
1,400 | 50 | ||
| Unitrin, Inc. |
2,700 | 133 | ||
| ViewPoint Financial Group |
12,800 | 220 | ||
| W Holding Co., Inc. (Ñ) |
11,500 | 30 | ||
| Webster Financial Corp. |
2,500 | 107 | ||
| West Coast Bancorp |
900 | 27 |
14 Aggressive Equity Fund
Table of Contents
Russell Investment Funds
Aggressive Equity Fund
Schedule of Investments, continued—June 30, 2007 (Unaudited)
Amounts in thousands (except share amounts)
| Principal Amount ($) or Shares |
Market Value $ | |||
| Whitney Holding Corp. (Ñ) |
3,700 | 111 | ||
| Wilmington Trust Corp. |
3,500 | 145 | ||
| Wilshire Bancorp, Inc. (Ñ) |
1,300 | 16 | ||
| WR Berkley Corp. |
10,100 | 329 | ||
| WSFS Financial Corp. |
300 | 20 | ||
| Zenith National Insurance Corp. |
8,953 | 422 | ||
| 37,325 | ||||
| Health Care—9.7% |
||||
| Accelrys, Inc. (Æ) |
24,600 | 155 | ||
| Adams Respiratory Therapeutics, Inc. (Æ) |
8,965 | 353 | ||
| Advanced Medical Optics, Inc. (Æ)(Ñ) |
2,700 | 94 | ||
| Albany Molecular Research, Inc. (Æ) |
1,846 | 27 | ||
| Allscripts Healthcare Solutions, Inc. (Æ) |
16,275 | 415 | ||
| American Dental Partners, Inc. (Æ) |
6,766 | 176 | ||
| American Medical Systems Holdings, Inc. (Æ) |
30,340 | 547 | ||
| American Oriental Bioengineering, Inc. (Æ) |
11,400 | 101 | ||
| AMERIGROUP Corp. (Æ) |
13,700 | 326 | ||
| Analogic Corp. |
1,600 | 118 | ||
| Applera Corp.—Celera Group (Æ) |
37,400 | 464 | ||
| Apria Healthcare Group, Inc. (Æ) |
12,052 | 347 | ||
| Arrow International, Inc. |
5,500 | 211 | ||
| Arthrocare Corp. (Æ) |
13,789 | 605 | ||
| Beckman Coulter, Inc. |
3,100 | 201 | ||
| Bio-Rad Laboratories, Inc. Class A (Æ) |
1,100 | 83 | ||
| Bradley Pharmaceuticals, Inc. (Æ) |
3,461 | 75 | ||
| Centene Corp. (Æ) |
9,900 | 212 | ||
| Cerner Corp. (Æ)(Ñ) |
13,500 | 749 | ||
| Charles River Laboratories International, Inc. (Æ)(Ñ) |
7,100 | 367 | ||
| Community Health Systems, Inc. (Æ)(Ñ) |
2,500 | 101 | ||
| Conmed Corp. (Æ) |
15,467 | 453 | ||
| Cooper Cos., Inc. (The) (Ñ) |
18,628 | 993 | ||
| Corvel Corp. (Æ) |
1,052 | 27 | ||
| Covance, Inc. (Æ) |
5,300 | 363 | ||
| DaVita, Inc. (Æ) |
7,200 | 388 | ||
| Discovery Laboratories, Inc. (Æ)(Ñ) |
14,200 | 40 | ||
| Emergency Medical Services Corp. Class A (Æ) |
11,322 | 443 | ||
| Greatbatch, Inc. (Æ) |
2,979 | 97 | ||
| Haemonetics Corp. (Æ) |
6,550 | 345 | ||
| Healthcare Services Group (Ñ) |
15,000 | 443 | ||
| HealthExtras, Inc. (Æ)(Ñ) |
27,600 | 816 | ||
| Healthspring, Inc. (Æ) |
25,606 | 488 | ||
| Healthways, Inc. (Æ)(Ñ) |
16,915 | 801 | ||
| Hologic, Inc. (Æ) |
13,318 | 737 | ||
| Illumina, Inc. (Æ) |
8,986 | 365 | ||
| Immucor, Inc. (Æ) |
2,800 | 78 | ||
| Immunomedics, Inc. (Æ) |
15,427 | 64 | ||
| IMS Health, Inc. |
12,707 | 408 | ||
| Intuitive Surgical, Inc. (Æ)(Ñ) |
800 | 111 | ||
| Invacare Corp. (Ñ) |
1,600 | 29 | ||
| Inverness Medical Innovations, Inc. (Æ)(Ñ) |
7,700 | 393 | ||
| Kindred Healthcare, Inc. (Æ)(Ñ) |
2,400 | 74 | ||
| King Pharmaceuticals, Inc. (Æ)(Ñ) |
21,234 | 434 | ||
| KV Pharmaceutical Co. (Æ) |
6,400 | 174 | ||
| Kyphon, Inc. (Æ) |
6,001 | 289 | ||
| LHC Group, Inc. (Æ) |
9,344 | 245 | ||
| LifePoint Hospitals, Inc. (Æ) |
700 | 27 | ||
| Lincare Holdings, Inc. (Æ) |
4,049 | 161 | ||
| Matria Healthcare, Inc. (Æ) |
1,245 | 38 | ||
| Medcath Corp. (Æ) |
10,394 | 331 | ||
| Medical Action Industries, Inc. (Æ) |
5,200 | 94 | ||
| Medicis Pharmaceutical Corp. Class A |
9,635 | 294 | ||
| Medtox Scientific, Inc. (Æ) |
2,208 | 65 | ||
| Mentor Corp. (Ñ) |
6,400 | 260 | ||
| Meridian Bioscience, Inc. (Ñ) |
10,400 | 225 | ||
| Molina Healthcare, Inc. (Æ)(Ñ) |
3,500 | 107 | ||
| Myriad Genetics, Inc. (Æ)(Ñ) |
8,800 | 327 | ||
| Nabi Biopharmaceuticals (Æ)(Ñ) |
1,500 | 7 | ||
| Neurocrine Biosciences, Inc. (Æ)(Ñ) |
7,300 | 82 | ||
| Noven Pharmaceuticals, Inc. (Æ) |
5,726 | 134 | ||
| NuVasive, Inc. (Æ)(Ñ) |
10,200 | 276 | ||
| Perrigo Co. (Ñ) |
11,200 | 219 | ||
| Pharmaceutical Product Development, Inc. |
7,189 | 275 | ||
| Pharmacopeia, Inc. (Æ)(Ñ) |
16,050 | 89 | ||
| PharmaNet Development Group, Inc. (Æ) |
5,251 | 167 | ||
| Phase Forward, Inc. (Æ)(Ñ) |
17,400 | 293 | ||
| PolyMedica Corp. (Ñ) |
9,100 | 372 | ||
| Psychiatric Solutions, Inc. (Æ) |
13,886 | 504 | ||
| Quality Systems, Inc. |
8,058 | 306 | ||
| ResMed, Inc. (Æ) |
9,081 | 375 | ||
| Sciele Pharma, Inc. (Æ) |
7,330 | 173 | ||
| Sierra Health Services, Inc. (Æ) |
11,974 | 498 | ||
| Sirona Dental Systems, Inc. (Æ) |
11,186 | 423 | ||
| Stericycle, Inc. (Æ)(Ñ) |
4,400 | 196 | ||
| STERIS Corp. |
8,300 | 254 | ||
| Techne Corp. (Æ) |
9,954 | 569 | ||
| TomoTherapy, Inc. (Æ)(Ñ) |
7,900 | 173 | ||
| Universal Health Services, Inc. Class B |
6,300 | 387 | ||
| Watson Pharmaceuticals, Inc. (Æ) |
12,971 | 422 | ||
| WellCare Health Plans, Inc. (Æ) |
3,927 | 355 |
Aggressive Equity Fund 15
Table of Contents
Russell Investment Funds
Aggressive Equity Fund
Schedule of Investments, continued—June 30, 2007 (Unaudited)
Amounts in thousands (except share amounts)
| Principal Amount ($) or Shares |
Market Value $ | |||
| West Pharmaceutical Services, Inc. |
5,419 | 256 | ||
| 23,559 | ||||
| Materials and Processing—12.8% |
||||
| Acuity Brands, Inc. |
2,401 | 145 | ||
| Airgas, Inc. |
13,465 | 645 | ||
| Albemarle Corp. |
19,802 | 763 | ||
| Aptargroup, Inc. |
2,600 | 92 | ||
| Ashland, Inc. |
3,400 | 217 | ||
| Bemis Co., Inc. |
4,200 | 139 | ||
| Bluegreen Corp. (Æ) |
2,300 | 27 | ||
| BlueLinx Holdings, Inc. (Ñ) |
1,700 | 18 | ||
| Buckeye Technologies, Inc. (Æ) |
47,491 | 735 | ||
| Cal Dive International, Inc. (Æ)(Ñ) |
11,100 | 185 | ||
| Cambrex Corp. |
13,600 | 180 | ||
| Carpenter Technology Corp. |
4,639 | 605 | ||
| Celanese Corp. Class A |
40,685 | 1,578 | ||
| Ceradyne, Inc. (Æ) |
3,600 | 266 | ||
| CF Industries Holdings, Inc. |
8,200 | 491 | ||
| Chemtura Corp. (Ñ) |
28,723 | 319 | ||
| Chesapeake Corp. (Ñ) |
3,100 | 39 | ||
| Chicago Bridge & Iron Co. NV |
13,145 | 496 | ||
| Comfort Systems USA, Inc. (Ñ) |
30,900 | 438 | ||
| Commercial Metals Co. |
24,700 | 834 | ||
| Constar International, Inc. (Æ)(Ñ) |
10,500 | 65 | ||
| Corn Products International, Inc. |
17,700 | 804 | ||
| Crown Holdings, Inc. (Æ)(Ñ) |
23,100 | 577 | ||
| Cytec Industries, Inc. (Ñ) |
9,200 | 587 | ||
| Eastman Chemical Co. (Ñ) |
8,700 | 560 | ||
| EMCOR Group, Inc. (Æ) |
15,454 | 1,127 | ||
| Energizer Holdings, Inc. (Æ) |
3,000 | 299 | ||
| Energy Conversion Devices, Inc. (Æ) |
7,966 | 246 | ||
| Ennis, Inc. |
5,900 | 139 | ||
| FMC Corp. |
4,100 | 367 | ||
| Glatfelter (Ñ) |
15,000 | 204 | ||
| GrafTech International, Ltd. (Æ) |
27,513 | 463 | ||
| Granite Construction, Inc. (Ñ) |
6,924 | 444 | ||
| Greif, Inc. Class A |
900 | 54 | ||
| Harsco Corp. |
8,400 | 437 | ||
| Haynes International, Inc. (Æ) |
2,200 | 186 | ||
| Hercules, Inc. (Æ) |
40,600 | 798 | ||
| Infrasource Services, Inc. (Æ) |
11,437 | 424 | ||
| Innospec, Inc. |
4,626 | 274 | ||
| Jacobs Engineering Group, Inc. (Æ)(Ñ) |
20,300 | 1,167 | ||
| KBR, Inc. (Æ)(Ñ) |
6,800 | 178 | ||
| Landec Corp. (Æ) |
10,912 | 146 | ||
| Layne Christensen Co. (Æ) |
6,300 | 258 | ||
| Lennox International, Inc. |
10,700 | 366 | ||
| Lubrizol Corp. |
9,500 | 613 | ||
| Lydall, Inc. (Æ) |
1,200 | 18 | ||
| McDermott International, Inc. (Æ) |
18,401 | 1,530 | ||
| Mercer International, Inc. (Æ) |
8,900 | 91 | ||
| Metal Management, Inc. |
2,900 | 128 | ||
| Northwest Pipe Co. (Æ)(Ñ) |
800 | 28 | ||
| Olin Corp. (Ñ) |
19,700 | 414 | ||
| OM Group, Inc. (Æ) |
6,679 | 353 | ||
| Perini Corp. (Æ) |
3,232 | 199 | ||
| Quanta Services, Inc. (Æ) |
17,904 | 549 | ||
| Resource Capital Corp. (ö)(Ñ) |
3,500 | 49 | ||
| Rock-Tenn Co. Class A |
31,426 | 997 | ||
| Royal Gold, Inc. (Ñ) |
6,200 | 147 | ||
| RPM International, Inc. (Ñ) |
24,204 | 559 | ||
| SAIC, Inc. (Æ)(Ñ) |
20,800 | 376 | ||
| Schnitzer Steel Industries, Inc. Class A |
5,300 | 254 | ||
| Senomyx, Inc. (Æ)(Ñ) |
9,400 | 127 | ||
| Sigma-Aldrich Corp. |
10,100 | 431 | ||
| Silgan Holdings, Inc. |
700 | 39 | ||
| Sonoco Products Co. |
27,744 | 1,188 | ||
| Spartech Corp. |
16,956 | 450 | ||
| Standard Register Co. (The) (Ñ) |
2,100 | 24 | ||
| Superior Essex, Inc. (Æ) |
4,700 | 176 | ||
| Symyx Technologies, Inc. (Æ)(Ñ) |
6,000 | 69 | ||
| Temple-Inland, Inc. |
2,900 | 178 | ||
| Timken Co. |
10,700 | 386 | ||
| Titanium Metals Corp. (Æ) |
7,441 | 237 | ||
| Tredegar Corp. |
11,777 | 251 | ||
| UAP Holding Corp. (Ñ) |
8,500 | 256 | ||
| URS Corp. (Æ) |
20,605 | 1,000 | ||
| USEC, Inc. (Æ) |
14,910 | 328 | ||
| Valspar Corp. |
5,600 | 159 | ||
| Washington Group International, Inc. (Æ) |
12,434 | 995 | ||
| Wausau Paper Corp. (Ñ) |
2,400 | 32 | ||
| Zoltek Cos., Inc. (Æ) |
2,900 | 120 | ||
| 31,133 | ||||
| Miscellaneous—1.3% |
||||
| Brunswick Corp. (Ñ) |
18,575 | 606 | ||
| Castlepoint Holdings, Ltd. (Þ) |
30,900 | 454 | ||
| Foster Wheeler, Ltd. (Æ) |
13,803 | 1,477 | ||
| Raven Industries, Inc. (Ñ) |
1,500 | 54 | ||
| Teleflex, Inc. |
7,648 | 625 | ||
| 3,216 | ||||
| Other Energy—4.9% |
||||
| Alon USA Energy, Inc. |
12,400 | 546 | ||
| Atwood Oceanics, Inc. (Æ) |
4,900 | 336 | ||
| Cameron International Corp. (Æ) |
6,183 | 442 | ||
| CARBO Ceramics, Inc. (Ñ) |
500 | 22 | ||
| Complete Production Services, Inc. (Æ) |
8,400 | 217 |
16 Aggressive Equity Fund
Table of Contents
Russell Investment Funds
Aggressive Equity Fund
Schedule of Investments, continued—June 30, 2007 (Unaudited)
Amounts in thousands (except share amounts)
| Principal Amount ($) or Shares |
Market Value $ | |||
| Core Laboratories NV (Æ)(Ñ) |
10,145 | 1,032 | ||
| Diamond Offshore Drilling, Inc. |
4,516 | 459 | ||
| Dresser-Rand Group, Inc. (Æ)(Ñ) |
7,000 | 276 | ||
| Dril-Quip, Inc. (Æ) |
5,479 | 246 | ||
| ENSCO International, Inc. (Ñ) |
6,100 | 372 | ||
| Foundation Coal Holdings, Inc. (Ñ) |
8,000 | 325 | ||
| Frontier Oil Corp. |
6,300 | 276 | ||
| Global Industries, Ltd. (Æ) |
23,056 | 618 | ||
| Goodrich Petroleum Corp. (Æ) |
8,516 | 295 | ||
| Grant Prideco, Inc. (Æ)(Ñ) |
11,508 | 619 | ||
| Grey Wolf, Inc. (Æ) |
41,900 | 345 | ||
| Gulf Island Fabrication, Inc. (Ñ) |
700 | 24 | ||
| Hercules Offshore, Inc. (Æ)(Ñ) |
13,000 | 421 | ||
| Holly Corp. (Ñ) |
7,200 | 534 | ||
| Hornbeck Offshore Services, Inc. (Æ)(Ñ) |
6,800 | 264 | ||
| Input/Output, Inc. (Æ)(Ñ) |
23,100 | 361 | ||
| JA Solar Holdings Co., Ltd.—ADR (Æ)(Ñ) |
4,300 | 145 | ||
| Meridian Resource Corp. (Æ) |
25,700 | 78 | ||
| National-Oilwell Varco, Inc. (Æ) |
3,579 | 373 | ||
| Oceaneering International, Inc. (Æ) |
10,400 | 547 | ||
| Ormat Technologies, Inc. (Ñ) |
7,500 | 283 | ||
| Range Resources Corp. (Ñ) |
7,400 | 277 | ||
| Rosetta Resources, Inc. (Æ) |
2,648 | 57 | ||
| SEACOR Holdings, Inc. (Æ) |
1,700 | 159 | ||
| Superior Energy Services, Inc. (Æ)(Ñ) |
5,500 | 219 | ||
| Superior Offshore International, Inc. (Æ) |
6,100 | 111 | ||
| Tesoro Corp. |
16,951 | 969 | ||
| Union Drilling, Inc. (Æ) |
2,900 | 48 | ||
| W-H Energy Services, Inc. (Æ) |
5,500 | 340 | ||
| Western Refining, Inc. (Ñ) |
3,700 | 214 | ||
| 11,850 | ||||
| Producer Durables—7.2% |
||||
| AGCO Corp. (Æ) |
8,765 | 381 | ||
| AO Smith Corp. (Ñ) |
600 | 24 | ||
| Applied Industrial Technologies, Inc. |
4,600 | 136 | ||
| Arris Group, Inc. (Æ)(Ñ) |
28,090 | 494 | ||
| Asyst Technologies, Inc. (Æ) |
1,800 | 13 | ||
| Baldor Electric Co. |
13,300 | 655 | ||
| BE Aerospace, Inc. (Æ) |
6,900 | 285 | ||
| Belden, Inc. |
6,083 | 337 | ||
| C-COR, Inc. (Æ) |
15,700 | 221 | ||
| Cognex Corp. (Ñ) |
18,100 | 407 | ||
| Cohu, Inc. (Ñ) |
15,300 | 340 | ||
| Crane Co. (Ñ) |
7,400 | 336 | ||
| Credence Systems Corp. (Æ)(Ñ) |
66,711 | 240 | ||
| Crown Castle International Corp. (Æ)(Ñ) |
6,100 | 221 | ||
| CTS Corp. (Ñ) |
5,013 | 64 | ||
| Cummins, Inc. |
4,377 | 443 | ||
| Diebold, Inc. |
2,800 | 146 | ||
| DR Horton, Inc. |
17,044 | 340 | ||
| EnPro Industries, Inc. (Æ) |
2,068 | 89 | ||
| Entegris, Inc. (Æ)(Ñ) |
39,431 | 468 | ||
| ESCO Technologies, Inc. (Æ)(Ñ) |
2,700 | 98 | ||
| FEI Co. (Æ)(Ñ) |
3,300 | 107 | ||
| Flowserve Corp. |
7,800 | 559 | ||
| Franklin Electric Co., Inc. (Ñ) |
3,600 | 170 | ||
| Gardner Denver, Inc. (Æ) |
17,400 | 740 | ||
| Goodrich Corp. |
6,898 | 411 | ||
| Hubbell, Inc. Class B (Ñ) |
7,400 | 401 | ||
| Intevac, Inc. (Æ) |
4,623 | 98 | ||
| Kennametal, Inc. |
5,271 | 432 | ||
| Kimball International, Inc. Class B |
2,000 | 28 | ||
| Knoll, Inc. |
4,382 | 98 | ||
| L-1 Identity Solutions, Inc. (Æ)(Ñ) |
43,500 | 890 | ||
| Lexmark International, Inc. Class A (Æ) |
5,049 | 249 | ||
| LTX Corp. (Æ) |
24,883 | 138 | ||
| MasTec, Inc. (Æ)(Ñ) |
3,200 | 51 | ||
| Mettler Toledo International, Inc. (Æ) |
4,174 | 399 | ||
| Milacron, Inc. (Æ)(Ñ) |
3,124 | 27 | ||
| Mine Safety Appliances Co. (Ñ) |
5,100 | 223 | ||
| Mueller Water Products, Inc. Class A |
12,121 | 182 | ||
| NACCO Industries, Inc. Class A |
226 | 35 | ||
| Novellus Systems, Inc. (Æ) |
1,482 | 42 | ||
| NVR, Inc. (Æ)(Ñ) |
1,016 | 691 | ||
| Pall Corp. |
13,300 | 612 | ||
| Photon Dynamics, Inc. (Æ) |
3,134 | 34 | ||
| Plantronics, Inc. (Ñ) |
7,100 | 186 | ||
| Polycom, Inc. (Æ)(Ñ) |
7,500 | 252 | ||
| Robbins & Myers, Inc. (Ñ) |
15,262 | 811 | ||
| SBA Communications Corp. Class A (Æ)(Ñ) |
18,200 | 611 | ||
| Steelcase, Inc. Class A (Ñ) |
26,746 | 495 | ||
| Tecumseh Products Co. Class A (Æ)(Ñ) |
15,100 | 237 | ||
| Teledyne Technologies, Inc. (Æ)(Ñ) |
6,800 | 312 | ||
| Tennant Co. |
2,600 | 95 | ||
| Teradyne, Inc. (Æ)(Ñ) |
41,949 | 738 | ||
| Terex Corp. (Æ) |
5,389 | 438 | ||
| Thomas & Betts Corp. (Æ) |
1,700 | 99 | ||
| Ultratech, Inc. (Æ)(Ñ) |
19,200 | 256 | ||
| Varian Semiconductor Equipment Associates, Inc. (Æ) |
5,450 | 218 | ||
| WW Grainger, Inc. |
3,700 | 344 | ||
| 17,447 | ||||
| Technology—16.3% |
||||
| 3Com Corp. (Æ) |
81,500 | 337 | ||
| ActivIdentity Corp. (Æ) |
500 | 2 |
Aggressive Equity Fund 17
Table of Contents
Russell Investment Funds
Aggressive Equity Fund
Schedule of Investments, continued—June 30, 2007 (Unaudited)
Amounts in thousands (except share amounts)
| Principal Amount ($) or Shares |
Market Value $ | |||
| Adaptec, Inc. (Æ)(Ñ) |
21,100 | 80 | ||
| Adtran, Inc. (Ñ) |
8,600 | 223 | ||
| Alliance Semiconductor Corp. (Æ) |
16,700 | 84 | ||
| Amdocs, Ltd. (Æ)(Ñ) |
9,900 | 394 | ||
| American Reprographics Co. (Æ) |
9,565 | 295 | ||
| Amkor Technology, Inc. (Æ) |
17,100 | 269 | ||
| Amphenol Corp. Class A |
28,168 | 1,004 | ||
| Anadigics, Inc. (Æ) |
8,900 | 123 | ||
| Anixter International, Inc. (Æ) |
6,400 | 481 | ||
| Ansys, Inc. (Æ) |
40,468 | 1,072 | ||
| Applied Micro Circuits Corp. (Æ) |
21,800 | 55 | ||
| ARM Holdings PLC—ADR |
35,200 | 308 | ||
| Arrow Electronics, Inc. (Æ) |
11,300 | 434 | ||
| AsiaInfo Holdings, Inc. (Æ) |
6,046 | 59 | ||
| Atheros Communications, Inc. (Æ)(Ñ) |
8,600 | 265 | ||
| Atmel Corp. (Æ) |
17,500 | 97 | ||
| Avanex Corp. (Æ)(Ñ) |
38,600 | 69 | ||
| Avnet, Inc. (Æ) |
7,679 | 304 | ||
| AVX Corp. |
11,950 | 200 | ||
| BearingPoint, Inc. (Æ) |
33,900 | 248 | ||
| Blackboard, Inc. (Æ) |
19,800 | 834 | ||
| Brocade Communications Systems, Inc. (Æ)(Ñ) |
126,700 | 991 | ||
| Captaris, Inc. (Æ) |
14,278 | 73 | ||
| Cavium Networks, Inc. (Æ)(Ñ) |
6,700 | 152 | ||
| Cbeyond, Inc. (Æ)(Ñ) |
8,500 | 327 | ||
| Ciena Corp. (Æ)(Ñ) |
12,760 | 461 | ||
| Citrix Systems, Inc. (Æ) |
8,100 | 273 | ||
| Cogent Communications Group, Inc. (Æ)(Ñ) |
8,900 | 266 | ||
| CommScope, Inc. (Æ) |
9,377 | 547 | ||
| COMSYS IT Partners, Inc. (Æ) |
3,992 | 91 | ||
| Comtech Telecommunications Corp. (Æ) |
6,839 | 317 | ||
| Comverse Technology, Inc. (Æ)(Ñ) |
20,700 | 432 | ||
| CSG Systems International, Inc. (Æ) |
16,116 | 427 | ||
| Cubic Corp. |
7,400 | 223 | ||
| Daktronics, Inc. (Ñ) |
9,900 | 213 | ||
| DealerTrack Holdings, Inc. (Æ)(Ñ) |
32,341 | 1,191 | ||
| Digital River, Inc. (Æ)(Ñ) |
5,500 | 249 | ||
| EMS Technologies, Inc. (Æ) |
1,500 | 33 | ||
| EPIQ Systems, Inc. (Æ) |
6,643 | 107 | ||
| Equinix, Inc. (Æ)(Ñ) |
16,513 | 1,510 | ||
| Excel Technology, Inc. (Æ) |
1,700 | 48 | ||
| F5 Networks, Inc. (Æ)(Ñ) |
4,400 | 355 | ||
| First Solar, Inc. (Æ)(Ñ) |
1,700 | 152 | ||
| Flir Systems, Inc. (Æ)(Ñ) |
15,600 | 722 | ||
| Foundry Networks, Inc. (Æ) |
38,048 | 634 | ||
| Garmin, Ltd. |
10,076 | 745 | ||
| Gartner, Inc. (Æ)(Ñ) |
47,500 | 1,168 | ||
| Gateway, Inc. (Æ)(Ñ) |
81,000 | 129 | ||
| Genesis Microchip, Inc. (Æ) |
2,745 | 26 | ||
| Gerber Scientific, Inc. (Æ) |
2,000 | 23 | ||
| Hittite Microwave Corp. (Æ) |
9,625 | 411 | ||
| Ikanos Communications, Inc. (Æ) |
16,600 | 126 | ||
| Imation Corp. (Ñ) |
9,100 | 335 | ||
| Ingram Micro, Inc. Class A (Æ) |
18,100 | 393 | ||
| Integrated Device Technology, Inc. (Æ) |
18,000 | 275 | ||
| Intermec, Inc. (Æ) |
15,176 | 384 | ||
| International Rectifier Corp. (Æ)(Ñ) |
6,000 | 224 | ||
| Interwoven, Inc. (Æ) |
50,586 | 710 | ||
| IXYS Corp. (Æ)(Ñ) |
1,600 | 13 | ||
| Keynote Systems, Inc. (Æ) |
14,700 | 241 | ||
| Leadis Technology, Inc. (Æ) |
1,000 | 4 | ||
| Magma Design Automation, Inc. (Æ) |
4,256 | 60 | ||
| Manhattan Associates, Inc. (Æ) |
11,799 | 329 | ||
| Mentor Graphics Corp. (Æ) |
1,559 | 21 | ||
| Mercury Computer Systems, Inc. (Æ)(Ñ) |
11,200 | 137 | ||
| Methode Electronics, Inc. |
4,437 | 69 | ||
| Microchip Technology, Inc. |
10,612 | 393 | ||
| Micros Systems, Inc. (Æ) |
9,917 | 539 | ||
| MicroStrategy, Inc. Class A (Æ) |
139 | 13 | ||
| NAM TAI Electronics, Inc. (Ñ) |
14,500 | 173 | ||
| National Instruments Corp. (Ñ) |
10,800 | 352 | ||
| Ness Technologies, Inc. (Æ) |
5,300 | 69 | ||
| Novatel Wireless, Inc. (Æ)(Ñ) |
8,300 | 216 | ||
| Novell, Inc. (Æ) |
34,400 | 268 | ||
| Nuance Communications, Inc. (Æ)(Ñ) |
22,500 | 376 | ||
| Oplink Communications, Inc. (Æ) |
3,400 | 51 | ||
| Orckit Communications, Ltd. (Æ) |
12,300 | 110 | ||
| PMC—Sierra, Inc. (Æ)(Ñ) |
50,000 | 387 | ||
| QLogic Corp. (Æ) |
16,100 | 268 | ||
| Quantum Corp. (Æ)(Ñ) |
23,800 | 75 | ||
| Rackable Systems, Inc. (Æ)(Ñ) |
9,900 | 122 | ||
| Radware, Ltd. (Æ)(Ñ) |
7,600 | 111 | ||
| RealNetworks, Inc. (Æ)(Ñ) |
35,000 | 286 | ||
| Riverbed Technology, Inc. (Æ) |
11,200 | 491 | ||
| SanDisk Corp. (Æ) |
9,110 | 446 | ||
| Seachange International, Inc. (Æ)(Ñ) |
25,000 | 194 | ||
| Seagate Technology (Ñ) |
9,197 | 200 | ||
| Sigma Designs, Inc. (Æ)(Ñ) |
19,100 | 498 | ||
| Sigmatel, Inc. (Æ) |
6,200 | 18 | ||
| Silicon Storage Technology, Inc. (Æ) |
84,798 | 316 | ||
| Skyworks Solutions, Inc. (Æ)(Ñ) |
66,400 | 488 | ||
| SonicWALL, Inc. (Æ) |
16,300 | 140 | ||
| Standard Microsystems Corp. (Æ)(Ñ) |
5,400 | 185 | ||
| Sunpower Corp. Class A (Æ)(Ñ) |
8,200 | 517 | ||
| Sybase, Inc. (Æ) |
13,558 | 324 | ||
| Sycamore Networks, Inc. (Æ)(Ñ) |
36,800 | 148 | ||
| Synchronoss Technologies, Inc. (Æ)(Ñ) |
5,000 | 147 | ||
| Syniverse Holdings, Inc. (Æ)(Ñ) |
2,700 | 35 | ||
| SYNNEX Corp. (Æ)(Ñ) |
5,600 | 115 |
18 Aggressive Equity Fund
Table of Contents
Russell Investment Funds
Aggressive Equity Fund
Schedule of Investments, continued—June 30, 2007 (Unaudited)
Amounts in thousands (except share amounts)
| Principal Amount ($) or Shares |
Market Value $ |
||||
| Synopsys, Inc. (Æ)(Ñ) |
6,800 | 180 | |||
| Tekelec (Æ)(Ñ) |
39,100 | 564 | |||
| Tessera Technologies, Inc. (Æ)(Ñ) |
27,098 | 1,099 | |||
| TIBCO Software, Inc. (Æ) |
60,600 | 548 | |||
| Transaction Systems Architects, Inc. (Æ)(Ñ) |
9,400 | 316 | |||
| Trident Microsystems, Inc. (Æ) |
7,300 | 134 | |||
| TriQuint Semiconductor, Inc. (Æ) |
44,700 | 226 | |||
| Trizetto Group, Inc. (The) (Æ)(Ñ) |
10,400 | 201 | |||
| Ultimate Software Group, Inc. (Æ)(Ñ) |
22,900 | 663 | |||
| Unisys Corp. (Æ) |
49,900 | 456 | |||
| Utstarcom, Inc. (Æ)(Ñ) |
32,400 | 182 | |||
| Varian, Inc. (Æ)(Ñ) |
4,000 | 219 | |||
| VeriFone Holdings, Inc. (Æ)(Ñ) |
23,200 | 818 | |||
| Verigy, Ltd. (Æ) |
30,504 | 873 | |||
| Verint Systems, Inc. (Æ)(Ñ) |
20,113 | 630 | |||
| Vignette Corp. (Æ) |
10,435 | 200 | |||
| Vocus, Inc. (Æ)(Ñ) |
18,300 | 460 | |||
| Wavecom SA—ADR (Æ)(Ñ) |
7,200 | 254 | |||
| Zebra Technologies Corp. Class A (Æ) |
9,542 | 370 | |||
| Zoran Corp. (Æ)(Ñ) |
18,400 | 369 | |||
| 39,687 | |||||
| Utilities—5.3% |
|||||
| AGL Resources, Inc. |
8,724 | 353 | |||
| Allete, Inc. |
3,100 | 146 | |||
| Alliant Energy Corp. |
19,851 | 771 | |||
| Atmos Energy Corp. |
29,487 | 886 | |||
| Black Hills Corp. |
8,664 | 344 | |||
| California Water Service Group (Ñ) |
7,500 | 281 | |||
| Centerpoint Energy, Inc. (Ñ) |
19,300 | 336 | |||
| CenturyTel, Inc. |
15,726 | 771 | |||
| Cincinnati Bell, Inc. (Æ) |
11,247 | 65 | |||
| Citizens Communications Co. |
8,082 | 123 | |||
| Clearwire Corp. Class A (Æ) |
4,900 | 120 | |||
| Cleco Corp. (Ñ) |
9,600 | 235 | |||
| CMS Energy Corp. (Ñ) |
18,000 | 310 | |||
| Energen Corp. |
6,859 | 377 | |||
| EnerNOC, Inc. (Æ) |
2,500 | 95 | |||
| Integrys Energy Group, Inc. (Ñ) |
2,900 | 147 | |||
| Leap Wireless International, Inc. (Æ) |
8,900 | 752 | |||
| MDU Resources Group, Inc. |
15,500 | 435 | |||
| New Jersey Resources Corp. (Ñ) |
2,200 | 112 | |||
| NII Holdings, Inc. (Æ) |
5,836 | 471 | |||
| Northeast Utilities |
25,200 | 715 | |||
| OGE Energy Corp. |
19,523 | 716 | |||
| Oneok, Inc. |
5,300 | 267 | |||
| PAETEC Corp. (Æ)(Ñ) |
22,500 | 254 | |||
| Pepco Holdings, Inc. |
24,100 | 680 | |||
| PNM Resources, Inc. |
7,100 | 197 | |||
| Portland General Electric Co. |
2,260 | 62 | |||
| Premiere Global Services, Inc. (Æ) |
11,100 | 145 | |||
| Puget Energy, Inc. |
9,929 | 240 | |||
| Sierra Pacific Resources (Æ) |
31,100 | 546 | |||
| Southern Union Co. |
11,600 | 378 | |||
| Southwest Gas Corp. |
5,074 | 172 | |||
| Suburban Propane Partners, LP |
3,100 | 148 | |||
| Telephone & Data Systems, Inc. |
400 | 25 | |||
| UGI Corp. |
30,900 | 843 | |||
| Westar Energy, Inc. |
13,284 | 323 | |||
| 12,841 | |||||
| Total Common Stocks |
|||||
| (cost $208,722) |
236,014 | ||||
| Warrants & Rights—0.0% |
|||||
| Financial Services—0.0% |
|||||
| Washington Mutual, Inc. 2050 Warrants (Æ) |
42,200 | 11 | |||
| Total Warrants & Rights |
|||||
| (cost $10) |
11 | ||||
| Short-Term Investments—2.8% |
|||||
| Russell Investment Company Money Market Fund |
5,709,000 | 5,709 | |||
| United States Treasury Bills (ž)(§) 4.649% due 09/27/07 |
1,000 | 989 | |||
| Total Short-Term Investments |
|||||
| (cost $6,698) |
6,698 | ||||
| Other Securities—28.9% |
|||||
| State Street Securities Lending Quality Trust (×) |
70,084,473 | 70,084 | |||
| Total Other Securities |
|||||
| (cost $70,084) |
70,084 | ||||
| Total Investments—128.9% |
|||||
| (identified cost $285,514) |
312,807 | ||||
| Other Assets and Liabilities, |
|||||
| Net—(28.9%) |
(70,121 | ) | |||
| Net Assets—100.0% |
242,686 | ||||
See accompanying notes which are an integral part of the financial statements.
Aggressive Equity Fund 19
Table of Contents
Russell Investment Funds
Aggressive Equity Fund
Schedule of Investments, continued—June 30, 2007 (Unaudited)
Amounts in thousands
| Futures Contracts (Number of Contracts) |
Notional Amount $ |
Unrealized Appreciation (Depreciation) $ |
|||
| Long Positions |
|||||
| Russell 2000 Mini Index (CME) expiration date 09/07 (82) |
6,905 | (55 | ) | ||
| Total Unrealized Appreciation (Depreciation) on Open Futures Contracts |
(55 | ) | |||
Presentation of Portfolio Holdings—June 30, 2007 (Unaudited)
| Portfolio Summary |
% of Net Assets |
||
| Auto and Transportation |
3.3 | ||
| Consumer Discretionary |
18.3 | ||
| Consumer Staples |
2.7 | ||
| Financial Services |
15.4 | ||
| Health Care |
9.7 | ||
| Materials and Processing |
12.8 | ||
| Miscellaneous |
1.3 | ||
| Other Energy |
4.9 | ||
| Producer Durables |
7.2 | ||
| Technology |
16.3 | ||
| Utilities |
5.3 | ||
| Warrants & Rights |
— | * | |
| Short-Term Investments |
2.8 | ||
| Other Securities |
28.9 | ||
| Total Investments |
128.9 | ||
| Other Assets and Liabilities, Net |
(28.9) | ||
| 100.0 | |||
| Futures Contracts |
(— ) | * |
| * | Less than .05% of net assets |
See accompanying notes which are an integral part of the financial statements.
20 Aggressive Equity Fund
Table of Contents
Non-U.S. Fund
Shareholder Expense Example—June 30, 2007 (Unaudited)
Fund Expenses
The following disclosure provides important information regarding each Fund’s Expense Example, which appears on each Fund’s individual page in this Semiannual Report. Please refer to this information when reviewing the Expense Example for a Fund.
Example
As a shareholder of the Fund, you incur two types of costs: (1) transaction costs, and (2) ongoing costs, including management fees; and other Fund expenses. The Example is intended to help you understand your ongoing costs (in dollars) of investing in the Fund and to compare these costs with the ongoing costs of investing in other mutual funds. The Example is based on an investment of $1,000 invested at the beginning of the period and held for the entire period indicated, which for this Fund is from January 1, 2007 to June 30, 2007.
Actual Expenses
The information in the table under the heading “Actual Performance” provides information about actual account values and actual expenses. You may use the information in this column, together with the amount you invested, to estimate the expenses that you paid over the period. Simply divide your account value by $1,000 (for example, an $8,600 account value divided by $1,000 = 8.6), then multiply the result by the number in the first column in the row entitled “Expenses Paid During Period” to estimate the expenses you paid on your account during this period.
Hypothetical Example for Comparison Purposes
The information in the table under the heading “Hypothetical Performance (5% return before expenses)” provides information about hypothetical account values and hypothetical expenses based on the Fund’s actual expense ratio and an assumed rate of return of 5% per year before expenses, which is not the Fund’s actual return. The hypothetical account values and expenses may not be used to estimate the actual ending account balance or expenses you paid for the period. You may use this information to compare the ongoing costs of investing in the Fund and other funds. To do so, compare this 5% hypothetical example with the 5% hypothetical examples that appear in the shareholder reports of other funds.
Please note that the expenses shown in the table are meant to highlight your ongoing costs only and do not reflect any transactional costs. Therefore, the information under the heading “Hypothetical Performance (5% return before expenses)” is useful in comparing ongoing costs only, and will not help you determine the relative total costs of owning different funds. In addition, if these transactional costs were included, your costs would have been higher.
| Actual Performance |
Hypothetical Performance (5% return before expenses) | |||||
| Beginning Account Value January 1, 2007 |
$ | 1,000.00 | $ | 1,000.00 | ||
| Ending Account Value June 30, 2007 |
$ | 1,098.40 | $ | 1,019.09 | ||
| Expenses Paid During Period* |
$ | 5.98 | $ | 5.76 | ||
| * | Expenses are equal to the Fund’s annualized expense ratio of 1.15% (representing the one-half year period annualized), multiplied by the average account value over the period, multiplied by 181/365 (to reflect the one-half year period). Reflects amounts waived and/or reimbursed by the investment adviser. Without the waiver and/or reimbursement, expenses would have been higher. |
Non-U.S. Fund 21
Table of Contents
Russell Investment Funds
Non-U.S. Fund
Schedule of Investments—June 30, 2007 (Unaudited)
Amounts in thousands (except share amounts)
| Principal Amount ($) or Shares |
Market Value $ | |||
| Common Stocks—90.3% |
||||
| Australia—2.2% |
||||
| AGL Energy, Ltd. |
2,861 | 37 | ||
| Alinta, Ltd. (Ñ) |
2,184 | 28 | ||
| Amcor, Ltd. |
20,090 | 127 | ||
| AMP, Ltd. |
30,919 | 265 | ||
| Ansell, Ltd. |
10,025 | 104 | ||
| Asciano Group (Æ) |
1,189 | 10 | ||
| Australia & New Zealand Banking Group, Ltd. |
16,945 | 417 | ||
| AXA Asia Pacific Holdings, Ltd. |
11,885 | 75 | ||
| BHP Billiton, Ltd. |
28,869 | 857 | ||
| Brambles, Ltd. (Æ) |
37,579 | 388 | ||
| Caltex Australia, Ltd. |
7,421 | 149 | ||
| Centro Properties Group |
7,961 | 57 | ||
| CFS Gandel Retail Trust |
2,597 | 5 | ||
| Coles Group, Ltd. |
20,478 | 280 | ||
| Commonwealth Bank of Australia |
9,434 | 442 | ||
| CSR, Ltd. (Ñ) |
24,355 | 72 | ||
| David Jones, Ltd. |
15,500 | 73 | ||
| DB RREEF Trust |
11,747 | 20 | ||
| GPT Group |
13,500 | 53 | ||
| Harvey Norman Holdings, Ltd. |
2,911 | 13 | ||
| Incitec Pivot, Ltd. |
1,229 | 83 | ||
| Insurance Australia Group, Ltd. |
16,784 | 81 | ||
| Investa Property Group (Ñ) |
6,524 | 16 | ||
| Leighton Holdings, Ltd. (Ñ) |
5,722 | 200 | ||
| Macquarie Airports |
1,615 | 6 | ||
| Macquarie Bank, Ltd. |
266 | 19 | ||
| Macquarie Communications Infrastructure Group |
546 | 3 | ||
| Macquarie Goodman Group |
11,663 | 66 | ||
| Macquarie Infrastructure Group |
21,026 | 64 | ||
| Macquarie Office Trust |
3,445 | 5 | ||
| Minara Resources, Ltd. |
14,323 | 88 | ||
| Mirvac Group |
6,629 | 32 | ||
| Multiplex Group |
735 | 3 | ||
| National Australia Bank, Ltd. |
35,669 | 1,241 | ||
| OneSteel, Ltd. |
1,126 | 6 | ||
| Orica, Ltd. |
2,083 | 53 | ||
| Pacific Brands, Ltd. |
60,888 | 178 | ||
| Paladin Resources, Ltd. (Æ) |
3,532 | 25 | ||
| Qantas Airways, Ltd. |
35,169 | 167 | ||
| QBE Insurance Group, Ltd. |
51,187 | 1,354 | ||
| Rinker Group, Ltd. |
6,340 | 101 | ||
| Rio Tinto, Ltd. (Ñ) |
7,649 | 641 | ||
| Santos, Ltd. |
2,041 | 24 | ||
| Sons of Gwalia, Ltd. (Æ)(Ñ)(ß) |
8,400 | — | ||
| Stockland (Ñ) |
8,624 | 60 | ||
| Symbion Health, Ltd. |
3,211 | 11 | ||
| Tattersall’s, Ltd. |
22,123 | 88 | ||
| Telstra Corp., Ltd. |
28,239 | 101 | ||
| Toll Holdings, Ltd. |
1,189 | 15 | ||
| Transurban Group (Æ) |
42,111 | 286 | ||
| Westfield Group |
11,095 | 188 | ||
| Westpac Banking Corp. |
11,549 | 251 | ||
| Woolworths, Ltd. |
5,942 | 136 | ||
| Zinifex, Ltd. |
10,990 | 175 | ||
| 9,239 | ||||
| Austria—0.3% |
||||
| Erste Bank der Oesterreichischen Sparkassen AG |
15,553 | 1,217 | ||
| Belgium—0.2% |
||||
| Fortis |
17,403 | 742 | ||
| Solvay SA |
1,293 | 205 | ||
| 947 | ||||
| Bermuda—0.5% |
||||
| Benfield Group, Ltd. |
71,161 | 462 | ||
| Esprit Holdings, Ltd. |
8,600 | 109 | ||
| Guoco Group, Ltd. |
2,000 | 28 | ||
| Hongkong Land Holdings, Ltd. |
5,000 | 23 | ||
| Jardine Matheson Holdings, Ltd. |
3,200 | 76 | ||
| Jardine Strategic Holdings, Ltd. |
3,000 | 40 | ||
| Li & Fung, Ltd. |
334,000 | 1,202 | ||
| Orient Overseas International, Ltd. |
6,800 | 66 | ||
| People’s Food Holdings, Ltd. |
18,000 | 22 | ||
| Vostok Gas, Ltd. (Æ) |
2,925 | 163 | ||
| Yue Yuen Industrial Holdings, Ltd. |
8,000 | 25 | ||
| 2,216 | ||||
| Brazil—0.3% |
||||
| Cia Vale do Rio Doce—ADR |
25,900 | 1,154 | ||
| Canada—1.4% |
||||
| Cameco Corp. (Ñ) |
10,200 | 518 | ||
| Canadian National Railway Co. |
21,840 | 1,112 | ||
| Potash Corp. of Saskatchewan |
7,700 | 601 | ||
| Research In Motion, Ltd. (Æ)(Ñ) |
8,100 | 1,620 | ||
| Rogers Communications, Inc. Class B |
23,200 | 989 | ||
| Suncor Energy, Inc. |
13,600 | 1,225 | ||
| 6,065 | ||||
22 Non-U.S. Fund
Table of Contents
Russell Investment Funds
Non-U.S. Fund
Schedule of Investments, continued—June 30, 2007 (Unaudited)
Amounts in thousands (except share amounts)
| Principal Amount ($) or Shares |
Market Value $ | |||
| Cayman Islands—0.3% |
||||
| Ctrip.com International, Ltd.—ADR (Ñ) |
9,100 | 716 | ||
| Focus Media Holding, Ltd.—ADR (Æ)(Ñ) |
14,400 | 727 | ||
| Kingboard Chemical Holdings, Ltd. |
7,500 | 34 | ||
| 1,477 | ||||
| China—0.3% |
||||
| China Communications Construction Co., Ltd. Class H (Æ) |
297,000 | 532 | ||
| China Merchants Bank Co., Ltd. |
294,000 | 895 | ||
| 1,427 | ||||
| Czech Republic—0.2% |
||||
| Komercni Banka AS |
3,707 | 690 | ||
| Denmark—0.6% |
||||
| Carlsberg A/S Class B |
3,700 | 449 | ||
| FLSmidth & Co. A/S |
2,750 | 217 | ||
| Novo Nordisk A/S Series B |
3,450 | 377 | ||
| Sydbank A/S |
1,800 | 86 | ||
| Vestas Wind Systems A/S (Æ) |
24,100 | 1,595 | ||
| 2,724 | ||||
| Finland—1.6% |
||||
| Cargotec Corp. Class B (Ñ) |
1,660 | 102 | ||
| Kesko OYJ Class B |
4,308 | 288 | ||
| Nokia OYJ |
160,410 | 4,518 | ||
| Oriola-KD OYJ |
3,400 | 16 | ||
| Orion OYJ Class B |
10,261 | 257 | ||
| Outokumpu OYJ |
5,225 | 177 | ||
| Outotec OYJ |
1,784 | 99 | ||
| Rautaruukki OYJ |
8,096 | 521 | ||
| Stora Enso OYJ Class R |
48,820 | 908 | ||
| Uponor OYJ |
1,734 | 68 | ||
| 6,954 | ||||
| France—12.3% |
||||
| Air France-KLM (Ñ) |
10,918 | 511 | ||
| Air Liquide |
15,562 | 2,052 | ||
| Alcatel-Lucent—ADR |
53,450 | 748 | ||
| Alstom RGPT (Æ)(Ñ) |
11,293 | 1,899 | ||
| AXA SA (Ñ) |
64,942 | 2,814 | ||
| BNP Paribas (Ñ) |
18,869 | 2,257 | ||
| Bouygues SA |
274 | 23 | ||
| Carrefour SA |
7,333 | 517 | ||
| Casino Guichard Perrachon SA |
2,400 | 244 | ||
| Christian Dior SA |
2,214 | 288 | ||
| Cie Generale d’Optique Essilor International SA (Ñ) |
5,130 | 614 | ||
| CNP Assurances |
1,367 | 176 | ||
| Credit Agricole SA |
79,183 | 3,235 | ||
| Gaz de France SA (Ñ) |
23,429 | 1,189 | ||
| Klepierre |
594 | 101 | ||
| L’Oreal SA |
17,568 | 2,088 | ||
| Lafarge SA (Ñ) |
452 | 83 | ||
| Legrand SA |
38,859 | 1,408 | ||
| LVMH Moet Hennessy Louis Vuitton SA |
30,122 | 3,487 | ||
| Nexans SA |
1,598 | 268 | ||
| NicOx SA (Æ) |
7,623 | 187 | ||
| Pernod-Ricard SA (Ñ) |
11,012 | 2,443 | ||
| PPR SA |
3,523 | 618 | ||
| Rhodia SA (Æ) |
8,810 | 401 | ||
| Sanofi-Aventis |
18,670 | 1,519 | ||
| Schneider Electric SA (Ñ) |
25,160 | 3,546 | ||
| Societe BIC SA |
1,096 | 81 | ||
| Societe Generale (Ñ) |
5,843 | 1,088 | ||
| Societe Television Francaise 1 |
21,814 | 758 | ||
| Sodexho Alliance SA (Ñ) |
4,748 | 342 | ||
| Suez SA (Ñ) |
7,547 | 434 | ||
| Suez SA (Æ) |
1,228 | — | ||
| Thales SA |
18,781 | 1,152 | ||
| Total SA |
90,500 | 7,381 | ||
| Unibail-Rodamco (Ñ) |
715 | 184 | ||
| Valeo SA |
8,355 | 450 | ||
| Vallourec SA (Ñ) |
3,643 | 1,174 | ||
| Veolia Environnement (Ñ) |
37,758 | 2,965 | ||
| Vivendi Universal SA (Ñ) |
79,777 | 3,445 | ||
| 52,170 | ||||
| Germany—9.4% |
||||
| Allianz SE (Ñ) |
10,097 | 2,372 | ||
| BASF AG |
6,388 | 841 | ||
| Bayer AG (Ñ) |
64,750 | 4,916 | ||
| Bayerische Motoren Werke AG (Ñ) |
20,900 | 1,358 | ||
| Continental AG (Ñ) |
20,378 | 2,881 | ||
| DaimlerChrysler AG |
15,252 | 1,416 | ||
| Deutsche Bank AG |
4,354 | 635 | ||
| Deutsche Boerse AG (Ñ) |
14,190 | 1,608 | ||
| Deutsche Telekom AG |
45,665 | 846 | ||
| E.ON AG (Ñ) |
26,765 | 4,502 | ||
| Epcos AG |
9,146 | 180 | ||
| Fresenius Medical Care AG & Co. KGaA (Ñ) |
19,186 | 886 | ||
| Hochtief AG |
4,299 | 470 | ||
| Infineon Technologies AG (Æ)(Ñ) |
97,780 | 1,629 | ||
| KarstadtQuelle AG (Æ)(Ñ) |
56,292 | 1,906 | ||
| Lanxess AG |
7,955 | 446 |
Non-U.S. Fund 23
Table of Contents
Russell Investment Funds
Non-U.S. Fund
Schedule of Investments, continued—June 30, 2007 (Unaudited)
Amounts in thousands (except share amounts)
| Principal Amount ($) or Shares |
Market Value $ | |||
| Linde AG (Ñ) |
18,880 | 2,281 | ||
| Metro AG (Ñ) |
28,157 | 2,343 | ||
| MTU Aero Engines Holding AG |
6,398 | 418 | ||
| RWE AG (Ñ) |
5,592 | 598 | ||
| Salzgitter AG |
9,490 | 1,843 | ||
| Siemens AG |
22,545 | 3,252 | ||
| ThyssenKrupp AG |
897 | 54 | ||
| Volkswagen AG (Ñ) |
4,505 | 720 | ||
| Wacker Chemie AG (Ñ) |
5,358 | 1,269 | ||
| Wincor Nixdorf AG |
2,238 | 208 | ||
| 39,878 | ||||
| Greece—0.1% |
||||
| National Bank of Greece SA |
10,244 | 588 | ||
| Guernsey—0.2% |
||||
| Eurocastle Investment, Ltd. |
14,286 | 662 | ||
| Hong Kong—0.6% |
||||
| Bank of East Asia, Ltd. |
10,400 | 58 | ||
| BOC Hong Kong Holdings, Ltd. |
23,000 | 55 | ||
| Cathay Pacific Airways, Ltd. |
18,000 | 45 | ||
| Cheung Kong Holdings, Ltd. |
64,910 | 850 | ||
| China Insurance International Holdings Co., Ltd. (Æ) |
567 | 1 | ||
| China Resources Enterprise |
142,000 | 534 | ||
| China Unicom, Ltd. |
18,000 | 31 | ||
| CLP Holdings, Ltd. |
12,000 | 80 | ||
| Hang Lung Group, Ltd. |
14,000 | 63 | ||
| Henderson Land Development Co., Ltd. |
12,000 | 82 | ||
| Hong Kong Exchanges and Clearing, Ltd. |
6,500 | 92 | ||
| HongKong Electric Holdings |
23,500 | 119 | ||
| Hopewell Holdings |
12,000 | 49 | ||
| Hutchison Whampoa, Ltd. |
14,000 | 139 | ||
| Link REIT (The) (ö) |
13,000 | 29 | ||
| New World Development, Ltd. |
17,000 | 43 | ||
| Sino Land Co. |
14,000 | 29 | ||
| Sun Hung Kai Properties, Ltd. |
6,000 | 72 | ||
| Swire Pacific, Ltd. |
10,500 | 117 | ||
| Television Broadcasts, Ltd. |
7,000 | 49 | ||
| Wharf Holdings, Ltd. |
20,000 | 80 | ||
| Wheelock & Co., Ltd. |
16,000 | 41 | ||
| 2,658 | ||||
| Indonesia—0.2% |
||||
| Bank Central Asia Tbk PT |
1,081,000 | 652 | ||
| Telekomunikasi Indonesia Tbk PT—ADR |
1,750 | 76 | ||
| 728 | ||||
| Ireland—0.6% |
||||
| Elan Corp. PLC—ADR (Æ)(Ñ) |
87,600 | 1,921 | ||
| Ryanair Holdings PLC—ADR (Æ)(Ñ) |
11,710 | 442 | ||
| 2,363 | ||||
| Italy—3.9% |
||||
| Alleanza Assicurazioni SpA |
86,588 | 1,134 | ||
| Ansaldo STS SpA (Æ) |
82,838 | 1,101 | ||
| Arnoldo Mondadori Editore SpA |
97,774 | 959 | ||
| Assicurazioni Generali SpA |
14,823 | 597 | ||
| Banco Popolare di Verona e Novara SCRL (Ñ) |
20,962 | 605 | ||
| Benetton Group SpA |
6,473 | 113 | ||
| Bulgari SpA |
35,643 | 575 | ||
| Buzzi Unicem SpA |
4,442 | 153 | ||
| Enel SpA |
45,943 | 496 | ||
| ENI SpA |
75,965 | 2,766 | ||
| Esprinet SpA (Ñ) |
5,834 | 118 | ||
| Fiat SpA |
1,566 | 47 | ||
| Fondiaria-Sai SpA |
9,454 | 459 | ||
| Intesa Sanpaolo SpA |
196,259 | 1,469 | ||
| Italcementi SpA (Ñ) |
15,628 | 485 | ||
| Luxottica Group SpA (Ñ) |
17,304 | 674 | ||
| Mediaset SpA |
151,206 | 1,566 | ||
| Milano Assicurazioni SpA (Ñ) |
51,100 | 427 | ||
| Parmalat Finanziaria SpA (Æ)(Ñ)(ß) |
12,500 | — | ||
| Snam Rete Gas SpA |
27,825 | 165 | ||
| Telecom Italia SpA |
847,028 | 1,884 | ||
| UniCredito Italiano SpA |
71,208 | 639 | ||
| Unione di Banche Italiane Scpa |
1,315 | 34 | ||
| 16,466 | ||||
| Japan—16.2% |
||||
| Aderans Co., Ltd. |
100 | 2 | ||
| Advantest Corp. |
9,100 | 397 | ||
| Aeon Credit Service Co., Ltd. |
43,100 | 684 | ||
| Aioi Insurance Co., Ltd. |
6,000 | 39 | ||
| Alfresa Holdings Corp. |
300 | 21 | ||
| Amada Co., Ltd. |
10,000 | 125 | ||
| Asahi Breweries, Ltd. |
11,400 | 177 | ||
| Asahi Glass Co., Ltd. |
105,000 | 1,419 | ||
| Asahi Kasei Corp. |
26,000 | 171 | ||
| Astellas Pharma, Inc. |
2,200 | 96 | ||
| Bank of Nagoya, Ltd. (The) |
7,000 | 46 |
24 Non-U.S. Fund
Table of Contents
Russell Investment Funds
Non-U.S. Fund
Schedule of Investments, continued—June 30, 2007 (Unaudited)
Amounts in thousands (except share amounts)
| Principal Amount ($) or Shares |
Market Value $ | |||
| Bank of Yokohama, Ltd. (The) |
5,000 | 35 | ||
| Bosch Corp. (Ñ) |
21,000 | 104 | ||
| Bridgestone Corp. |
47,000 | 1,008 | ||
| Brother Industries, Ltd. |
12,000 | 176 | ||
| Calsonic Kansei Corp. |
2,000 | 8 | ||
| Canon Marketing Japan, Inc. (Ñ) |
2,800 | 57 | ||
| Canon, Inc. (Ñ) |
71,600 | 4,204 | ||
| Chiba Bank, Ltd. (The) |
8,000 | 71 | ||
| Dai Nippon Printing Co., Ltd. |
8,000 | 119 | ||
| Daihatsu Motor Co., Ltd. |
6,000 | 55 | ||
| Daiichi Sankyo Co., Ltd. |
5,300 | 141 | ||
| Daiwa House Industry Co., Ltd. |
31,170 | 446 | ||
| Daiwa Securities Group, Inc. |
64,740 | 690 | ||
| Denki Kagaku Kogyo Kabushiki Kaisha |
18,000 | 81 | ||
| Denso Corp. |
3,800 | 149 | ||
| Dentsu, Inc. (Ñ) |
9 | 26 | ||
| East Japan Railway Co. |
14 | 108 | ||
| Eisai Co., Ltd. |
1,200 | 52 | ||
| Elpida Memory, Inc. (Æ)(Ñ) |
14,000 | 617 | ||
| Fanuc, Ltd. |
17,300 | 1,787 | ||
| Fuji Electric Holdings Co., Ltd. |
8,000 | 41 | ||
| Fuji Fire & Marine Insurance Co., Ltd. (The) |
21,000 | 84 | ||
| Fuji Heavy Industries, Ltd. (Ñ) |
40,000 | 192 | ||
| Fuji Television Network, Inc. |
514 | 1,035 | ||
| FUJIFILM Holdings Corp. |
4,800 | 215 | ||
| Fujitsu, Ltd. |
33,000 | 243 | ||
| Hakuhodo DY Holdings, Inc. |
550 | 36 | ||
| Hirose Electric Co., Ltd. (Ñ) |
4,900 | 645 | ||
| Hitachi, Ltd. |
10,000 | 71 | ||
| Honda Motor Co., Ltd. |
11,700 | 428 | ||
| Hyakugo Bank, Ltd. (The) |
2,000 | 14 | ||
| Hyakujushi Bank, Ltd. (The) |
3,000 | 17 | ||
| Inpex Holdings, Inc. |
2 | 19 | ||
| Itochu Corp. |
34,000 | 394 | ||
| Izumi Co., Ltd. (Ñ) |
4,400 | 72 | ||
| Japan Tobacco, Inc. |
338 | 1,669 | ||
| JFE Holdings, Inc. |
7,900 | 492 | ||
| JGC Corp. |
7,000 | 131 | ||
| Joyo Bank, Ltd. (The) |
235,190 | 1,463 | ||
| Kagoshima Bank, Ltd. (The) |
5,000 | 38 | ||
| Kandenko Co., Ltd. (Ñ) |
17,000 | 96 | ||
| Kansai Electric Power Co., Inc. (The) |
11,800 | 279 | ||
| Kao Corp. |
127,000 | 3,290 | ||
| Kawasaki Kisen Kaisha, Ltd. |
19,000 | 233 | ||
| KDDI Corp. |
16 | 119 | ||
| Keiyo Bank, Ltd. (The) |
7,000 | 41 | ||
| Kobe Steel, Ltd. |
41,000 | 156 | ||
| Komatsu, Ltd. |
37,700 | 1,096 | ||
| Komori Corp. |
3,000 | 70 | ||
| Kose Corp. |
54,040 | 1,532 | ||
| Kubota Corp. |
19,000 | 154 | ||
| Kyocera Corp. |
900 | 96 | ||
| Leopalace21 Corp. (Ñ) |
700 | 24 | ||
| Makita Corp. |
3,500 | 156 | ||
| Matsushita Electric Industrial Co., Ltd. |
22,000 | 437 | ||
| Matsushita Electric Works, Ltd. |
20,000 | 256 | ||
| Mazda Motor Corp. |
34,000 | 194 | ||
| Meiji Dairies Corp. |
13,000 | 83 | ||
| MID Reit, Inc. (ö) |
95 | 481 | ||
| Millea Holdings, Inc. |
6,100 | 251 | ||
| Mitsubishi Chemical Holdings Corp. |
27,500 | 253 | ||
| Mitsubishi Corp. |
31,600 | 829 | ||
| Mitsubishi Electric Corp. |
28,000 | 260 | ||
| Mitsubishi Estate Co., Ltd. |
10,000 | 272 | ||
| Mitsubishi Heavy Industries, Ltd. |
14,000 | 90 | ||
| Mitsubishi UFJ Financial Group, Inc. |
56 | 619 | ||
| Mitsui & Co., Ltd. |
13,000 | 259 | ||
| Mitsui Fudosan Co., Ltd. |
8,000 | 225 | ||
| Mitsui OSK Lines, Ltd. |
84,000 | 1,142 | ||
| Mitsui Sumitomo Insurance Co., Ltd. |
3,000 | 39 | ||
| Mitsui-Soko Co., Ltd. (Ñ) |
106,560 | 636 | ||
| Mizuho Financial Group, Inc. |
62 | 430 | ||
| Mochida Pharmaceutical Co., Ltd. |
2,000 | 19 | ||
| Mori Seiki Co., Ltd. |
800 | 25 | ||
| Nabtesco Corp. |
2,000 | 29 | ||
| New City Residence Investment Corp. Class A (ö) |
84 | 467 | ||
| Nichirei Corp. |
35,000 | 181 | ||
| Nintendo Co., Ltd. (Ñ) |
4,800 | 1,758 | ||
| Nippon Building Fund, Inc. Class A (ö) |
1 | 14 | ||
| Nippon Commercial Investment Corp. (ö) |
169 | 736 | ||
| Nippon Express Co., Ltd. |
17,000 | 97 | ||
| Nippon Oil Corp. |
20,000 | 186 | ||
| Nippon Paint Co., Ltd. (Ñ) |
2,000 | 10 | ||
| Nippon Residential Investment Corp. Class A (ö) |
107 | 621 | ||
| Nippon Steel Corp. |
52,000 | 367 | ||
| Nippon Telegraph & Telephone Corp. |
90 | 400 | ||
| Nippon Yusen KK (Ñ) |
36,000 | 331 | ||
| Nipponkoa Insurance Co., Ltd. |
222,490 | 2,006 | ||
| Nissan Motor Co., Ltd. (Ñ) |
17,000 | 182 | ||
| Nisshin Seifun Group, Inc. |
6,500 | 64 | ||
| Nomura Holdings, Inc. |
139,360 | 2,716 | ||
| Nomura Research Institute, Ltd. |
2,000 | 59 | ||
| NTN Corp. |
7,000 | 60 | ||
| NTT Data Corp. |
10 | 48 | ||
| NTT DoCoMo, Inc. |
284 | 450 |
Non-U.S. Fund 25
Table of Contents
Russell Investment Funds
Non-U.S. Fund
Schedule of Investments, continued—June 30, 2007 (Unaudited)
Amounts in thousands (except share amounts)
| Principal Amount ($) or Shares |
Market Value $ | |||
| Omron Corp. |
36,300 | 955 | ||
| ORIX Corp. |
640 | 169 | ||
| Pacific Metals Co., Ltd. |
5,000 | 84 | ||
| Resona Holdings, Inc. (Ñ) |
68 | 163 | ||
| Ricoh Co., Ltd. |
98,000 | 2,268 | ||
| Santen Pharmaceutical Co., Ltd. |
2,100 | 51 | ||
| Sapporo Hokuyo Holdings, Inc. |
13 | 144 | ||
| Secom Co., Ltd. |
1,000 | 47 | ||
| Seino Holdings Corp. |
5,000 | 47 | ||
| Sekisui House, Ltd. |
6,000 | 80 | ||
| Seven & I Holdings Co., Ltd. |
58,080 | 1,660 | ||
| Sharp Corp. |
6,000 | 114 | ||
| Shiga Bank, Ltd. (The) |
3,000 | 21 | ||
| Shin-Etsu Chemical Co., Ltd. |
300 | 21 | ||
| Shinsei Bank, Ltd. |
17,000 | 69 | ||
| Shizuoka Bank, Ltd. (The) |
69,000 | 700 | ||
| Showa Shell Sekiyu KK |
16,405 | 204 | ||
| Sohgo Security Services Co., Ltd. |
5,000 | 88 | ||
| Sompo Japan Insurance, Inc. |
14,000 | 172 | ||
| Sony Corp. (Ñ) |
20,800 | 1,069 | ||
| Sugi Pharmacy Co., Ltd. |
19,900 | 455 | ||
| Sumitomo Bakelite Co., Ltd. |
148,600 | 1,042 | ||
| Sumitomo Corp. |
3,500 | 64 | ||
| Sumitomo Forestry Co., Ltd. |
57,000 | 552 | ||
| Sumitomo Heavy Industries, Ltd. |
6,000 | 68 | ||
| Sumitomo Metal Industries, Ltd. |
32,000 | 189 | ||
| Sumitomo Mitsui Financial Group, Inc. ( Ñ) |
39 | 364 | ||
| Sumitomo Realty & Development Co., Ltd. |
3,000 | 98 | ||
| Sumitomo Trust & Banking Co., Ltd. (The) |
183,000 | 1,746 | ||
| Suzuken Co., Ltd. |
1,800 | 56 | ||
| Suzuki Motor Corp. |
38,160 | 1,085 | ||
| Taiyo Nippon Sanso Corp. |
4,000 | 31 | ||
| Takeda Pharmaceutical Co., Ltd. |
26,660 | 1,724 | ||
| Tobu Railway Co., Ltd. |
9,000 | 41 | ||
| Toho Co., Ltd./Tokyo |
3,600 | 65 | ||
| Tokai Rubber Industries, Inc. |
6,300 | 105 | ||
| Tokyo Electric Power Co., Inc. (The) |
14,400 | 463 | ||
| Tokyo Electron, Ltd. |
700 | 52 | ||
| Tokyo Gas Co., Ltd. |
157,000 | 745 | ||
| Tokyu Corp. |
10,000 | 67 | ||
| Tokyu Land Corp. |
2,000 | 21 | ||
| Toppan Forms Co., Ltd. |
87 | 1 | ||
| Toshiba Corp. |
23,000 | 201 | ||
| Toyo Seikan Kaisha, Ltd. |
1,500 | 29 | ||
| Toyo Suisan Kaisha, Ltd. |
1,000 | 18 | ||
| Toyobo Co., Ltd. |
25,000 | 72 | ||
| Toyota Auto Body Co., Ltd. |
1,600 | 27 | ||
| Toyota Motor Corp. |
65,300 | 4,137 | ||
| West Japan Railway Co. |
199 | 928 | ||
| Yamada Denki Co., Ltd. |
5,250 | 549 | ||
| Yamaha Corp. |
1,800 | 37 | ||
| Yamato Kogyo Co., Ltd. |
1,700 | 68 | ||
| 68,560 | ||||
| Luxembourg—0.2% |
||||
| Millicom International Cellular SA (Æ)(Ñ) |
9,000 | 825 | ||
| Mexico—0.2% |
||||
| America Movil SAB de CV Series L |
12,800 | 793 | ||
| Netherlands—3.7% |
||||
| ABN AMRO Holding NV |
12,895 | 594 | ||
| Akzo Nobel NV |
4,056 | 351 | ||
| Arcelor Mittal |
5,217 | 329 | ||
| ASML Holding NV (Æ) |
56,172 | 1,559 | ||
| Corporate Express |
78,605 | 1,211 | ||
| CSM |
3,980 | 141 | ||
| Heineken Holding NV |
983 | 51 | ||
| Heineken NV |
43,542 | 2,563 | ||
| Hunter Douglas NV |
1,774 | 168 | ||
| ING Groep NV |
54,891 | 2,436 | ||
| Koninklijke Ahold NV (Æ) |
26,305 | 332 | ||
| Koninklijke Philips Electronics NV |
17,683 | 755 | ||
| OCE NV |
5,472 | 107 | ||
| Rodamco Europe NV |
989 | 133 | ||
| Royal KPN NV |
17,750 | 296 | ||
| TNT NV |
42,020 | 1,901 | ||
| Unilever NV |
80,274 | 2,505 | ||
| Univar NV |
1,082 | 58 | ||
| 15,490 | ||||
| Norway—0.5% |
||||
| Renewable Energy Corp. AS (Æ) |
28,350 | 1,106 | ||
| Statoil ASA |
32,312 | 1,005 | ||
| 2,111 | ||||
| Portugal—0.2% |
||||
| Energias de Portugal SA |
137,732 | 762 | ||
| Singapore—0.7% |
||||
| Ascendas Real Estate Investment Trust (Æ)(ö) |
3,000 | 6 | ||
| CapitaCommercial Trust (Æ)(ö) |
4,000 | 8 | ||
| CapitaLand, Ltd. (Ñ) |
12,000 | 63 | ||
| CapitaMall Trust (Æ)(ö) |
4,000 | 11 | ||
| Creative Technology, Ltd. |
3,600 | 18 |
26 Non-U.S. Fund
Table of Contents
Russell Investment Funds
Non-U.S. Fund
Schedule of Investments, continued—June 30, 2007 (Unaudited)
Amounts in thousands (except share amounts)
| Principal Amount ($) or Shares |
Market Value $ | |||
| DBS Group Holdings, Ltd. |
41,000 | 611 | ||
| Fraser and Neave, Ltd. |
17,000 | 61 | ||
| Jardine Cycle & Carriage, Ltd. |
4,000 | 41 | ||
| Keppel Corp., Ltd. |
12,000 | 98 | ||
| NatSteel, Ltd. |
10,000 | 12 | ||
| Neptune Orient Lines, Ltd. |
17,000 | 59 | ||
| Olam International, Ltd. |
10,000 | 20 | ||
| Oversea-Chinese Banking Corp. |
7,000 | 42 | ||
| Pacific Century Regional Developments, Ltd. (Æ) |
76,000 | 20 | ||
| SembCorp Industries, Ltd. |
14,880 | 55 | ||
| Singapore Airlines, Ltd. |
8,000 | 98 | ||
| Singapore Telecommunications, Ltd. |
599,000 | 1,330 | ||
| STATS ChipPAC, Ltd. (Æ) |
15,000 | 17 | ||
| Suntec Real Estate Investment Trust (Æ)(ö) |
3,000 | 4 | ||
| United Overseas Bank, Ltd. |
12,000 | 172 | ||
| Wing Tai Holdings, Ltd. |
16,000 | 42 | ||
| 2,788 | ||||
| South Korea—1.7% |
||||
| Hyundai Motor Co. |
9,900 | 782 | ||
| Kookmin Bank—ADR |
13,070 | 1,146 | ||
| Kookmin Bank |
8,619 | 757 | ||
| LG Electronics, Inc. |
18,789 | 1,554 | ||
| Samsung Electronics Co., Ltd. |
4,622 | 2,832 | ||
| 7,071 | ||||
| Spain—1.7% |
||||
| Abengoa SA |
3,742 | 154 | ||
| Avanzit SA (Æ) |
27,604 | 200 | ||
| Banco Bilbao Vizcaya Argentaria SA |
55,235 | 1,361 | ||
| Banco Santander Central Hispano SA |
47,400 | 878 | ||
| Endesa SA |
5,185 | 282 | ||
| Gamesa Corp. Tecnologica SA |
25,266 | 923 | ||
| Gestevision Telecinco SA |
6,557 | 187 | ||
| Grifols SA (Æ) |
7,419 | 162 | ||
| Iberdrola SA |
15,427 | 866 | ||
| Iberia Lineas Aereas de Espana |
61,406 | 308 | ||
| Mapfre SA |
94,020 | 468 | ||
| Repsol YPF SA (Ñ) |
11,322 | 448 | ||
| Telefonica SA |
33,652 | 753 | ||
| Union Fenosa SA |
3,837 | 206 | ||
| 7,196 | ||||
| Sweden—2.0% |
||||
| Alfa Laval AB |
7,700 | 467 | ||
| Electrolux AB |
19,000 | 453 | ||
| JM AB |
10,400 | 318 | ||
| Lindex AB |
3,000 | 40 | ||
| Nordea Bank AB |
68,180 | 1,072 | ||
| Scania AB Class B (Æ) |
26,400 | 648 | ||
| Skandinaviska Enskilda Banken AB Class A |
7,000 | 227 | ||
| SKF AB Class B |
18,400 | 389 | ||
| Ssab Svenskt Stal AB Series A |
12,700 | 525 | ||
| Svenska Cellulosa AB Class B |
6,000 | 101 | ||
| Svenska Handelsbanken AB Series A |
6,700 | 188 | ||
| Telefonaktiebolaget LM Ericsson Series B |
931,670 | 3,741 | ||
| TeliaSonera AB |
29,500 | 218 | ||
| 8,387 | ||||
| Switzerland—7.8% |
||||
| ABB, Ltd. |
52,225 | 1,189 | ||
| Actelion, Ltd. (Æ) |
18,360 | 821 | ||
| Clariant AG (Æ) |
52,333 | 853 | ||
| Credit Suisse Group |
13,998 | 1,001 | ||
| Geberit AG |
1,730 | 296 | ||
| Georg Fischer AG |
202 | 153 | ||
| Givaudan SA (Ñ) |
1,980 | 1,961 | ||
| Helvetia Holding AG |
242 | 93 | ||
| Julius Baer Holding AG |
43,930 | 3,161 | ||
| Kudelski SA (Ñ) |
3,753 | 132 | ||
| Nestle SA |
21,489 | 8,198 | ||
| Novartis AG |
12,998 | 734 | ||
| Phonak Holding AG |
4,282 | 386 | ||
| Roche Holding AG |
30,449 | 5,419 | ||
| Sulzer AG |
204 | 265 | ||
| Swatch Group AG |
15,555 | 885 | ||
| Swiss Reinsurance |
27,259 | 2,497 | ||
| Swisscom AG |
1,175 | 403 | ||
| UBS AG |
70,146 | 4,227 | ||
| Zurich Financial Services AG |
678 | 210 | ||
| 32,884 | ||||
| Taiwan—0.7% |
||||
| HON HAI Precision Industry Co., Ltd. |
139,400 | 1,205 | ||
| Taiwan Semiconductor Manufacturing Co., Ltd.—ADR |
86,020 | 957 | ||
| United Microelectronics Corp.—ADR (Ñ) |
245,250 | 839 | ||
| 3,001 | ||||
| Thailand—0.2% |
||||
| Bangkok Bank PCL |
230,100 | 813 | ||
Non-U.S. Fund 27
Table of Contents
Russell Investment Funds
Non-U.S. Fund
Schedule of Investments, continued—June 30, 2007 (Unaudited)
Amounts in thousands (except share amounts)
| Principal Amount ($) or Shares |
Market Value $ | |||
| United Kingdom—19.1% |
||||
| 3i Group PLC |
969 | 23 | ||
| Anglo American PLC |
9,340 | 552 | ||
| ARM Holdings PLC |
312,110 | 918 | ||
| AstraZeneca PLC |
17,806 | 959 | ||
| Aviva PLC |
42,758 | 638 | ||
| BAE Systems PLC |
85,279 | 694 | ||
| Balfour Beatty PLC |
12,103 | 108 | ||
| Barclays PLC |
23,985 | 335 | ||
| Berkeley Group Holdings PLC (Æ) |
7,976 | 285 | ||
| BG Group PLC |
75,054 | 1,238 | ||
| BHP Billiton PLC |
65,733 | 1,835 | ||
| Bovis Homes Group PLC |
509 | 9 | ||
| BP PLC |
130,339 | 1,578 | ||
| BP PLC—ADR |
19,700 | 1,421 | ||
| British Airways PLC (Æ) |
35,244 | 296 | ||
| British American Tobacco PLC |
9,492 | 324 | ||
| British Energy Group PLC |
49,733 | 540 | ||
| British Land Co. PLC (ö) |
4,514 | 122 | ||
| BT Group PLC |
230,287 | 1,538 | ||
| Burberry Group PLC |
59,419 | 820 | ||
| Cable & Wireless PLC |
271,399 | 1,060 | ||
| Cadbury Schweppes PLC |
180,758 | 2,468 | ||
| Carnival PLC |
1,486 | 71 | ||
| Carphone Warehouse Group PLC |
92,521 | 614 | ||
| Centrica PLC |
298 | 2 | ||
| Charter PLC (Æ) |
53 | 1 | ||
| Compass Group PLC |
7,613 | 53 | ||
| Daily Mail & General Trust Class A |
21,791 | 335 | ||
| Davis Service Group PLC |
9,300 | 116 | ||
| De La Rue PLC |
5,646 | 88 | ||
| Diageo PLC |
232,763 | 4,847 | ||
| EMI Group PLC |
2,867 | 15 | ||
| Enterprise Inns PLC |
1,722 | 24 | ||
| Experian Group, Ltd. |
60,067 | 759 | ||
| Fiberweb PLC |
719 | 2 | ||
| Firstgroup PLC |
5,688 | 76 | ||
| Friends Provident PLC |
4,064 | 15 | ||
| Galiform PLC (Æ) |
698 | 2 | ||
| GlaxoSmithKline PLC |
236,759 | 6,205 | ||
| Great Portland Estates PLC (ö) |
139 | 2 | ||
| Hammerson PLC (ö) |
342 | 10 | ||
| HBOS PLC |
45,036 | 891 | ||
| HSBC Holdings PLC |
140,769 | 2,587 | ||
| Inchcape PLC |
9,115 | 92 | ||
| Invensys PLC (Æ) |
348 | 3 | ||
| Invesco PLC |
150,050 | 1,948 | ||
| Investec PLC |
161 | 2 | ||
| ITV PLC |
8,142 | 19 | ||
| J Sainsbury PLC |
51,870 | 609 | ||
| Kazakhmys PLC |
460 | 12 | ||
| Kesa Electricals PLC |
57,426 | 363 | ||
| Kingfisher PLC |
359,143 | 1,634 | ||
| Ladbrokes PLC |
149,504 | 1,300 | ||
| Land Securities Group PLC (ö) |
4,913 | 172 | ||
| Legal & General Group PLC |
309,419 | 933 | ||
| Liberty International PLC (ö) |
471 | 11 | ||
| Lloyds TSB Group PLC |
72,848 | 813 | ||
| Man Group PLC |
158,422 | 1,937 | ||
| National Express Group PLC |
7,427 | 160 | ||
| Next PLC |
19,592 | 790 | ||
| Pearson PLC |
31,491 | 533 | ||
| Premier Farnell PLC |
3,208 | 13 | ||
| Reckitt Benckiser PLC |
99,977 | 5,491 | ||
| Reed Elsevier PLC |
5,030 | 65 | ||
| Resolution PLC |
815 | 10 | ||
| Rexam PLC |
832 | 8 | ||
| Rio Tinto PLC |
971 | 75 | ||
| Royal & Sun Alliance Insurance Group PLC |
702 | 2 | ||
| Royal Bank of Scotland Group PLC |
211,474 | 2,688 | ||
| Royal Dutch Shell PLC Class A |
81 | 3,327 | ||
| Royal Dutch Shell PLC Class B |
18,848 | 788 | ||
| SABMiller PLC |
4,444 | 113 | ||
| Scottish & Southern Energy PLC |
29,258 | 851 | ||
| Smith & Nephew PLC |
105,797 | 1,315 | ||
| Smiths Group PLC (Æ) |
76,228 | 1,814 | ||
| Stagecoach Group PLC |
52,331 | 192 | ||
| Standard Chartered PLC |
29,796 | 975 | ||
| Standard Life PLC |
8,087 | 54 | ||
| Tesco PLC |
337,312 | 2,835 | ||
| Trinity Mirror PLC |
13,551 | 144 | ||
| Tullett Prebon PLC |
1,143 | 10 | ||
| Unilever PLC |
36,439 | 1,182 | ||
| Vodafone Group PLC |
417,137 | 1,406 | ||
| Vodafone Group PLC—ADR (Ñ) |
83,850 | 2,820 | ||
| William Hill PLC |
193,817 | 2,394 | ||
| WPP Group PLC |
325,959 | 4,899 | ||
| Xstrata PLC |
24,910 | 1,494 | ||
| 80,772 | ||||
| United States—0.2% |
||||
| NYSE Euronext |
1,415 | 105 | ||
| Synthes, Inc. |
5,536 | 666 | ||
| 771 | ||||
| Total Common Stocks |
||||
| (cost $321,434) |
381,847 | |||
28 Non-U.S. Fund
Table of Contents
Russell Investment Funds
Non-U.S. Fund
Schedule of Investments, continued—June 30, 2007 (Unaudited)
Amounts in thousands (except share amounts)
| Principal Amount ($) or Shares |
Market Value $ | |||
| Preferred Stocks—0.6% |
||||
| Germany—0.5% |
||||
| Henkel KGaA (Ñ) |
38,086 | 2,015 | ||
| Volkswagen AG (Ñ) |
1,676 | 175 | ||
| 2,190 | ||||
| Italy—0.1% |
||||
| Unipol SpA |
77,511 | 267 | ||
| Total Preferred Stocks |
||||
| (cost $2,313) |
2,457 | |||
| Warrants & Rights—0.0% |
||||
| Australia—0.0% |
||||
| Westfield Group (Æ) |
964 | — | ||
| Italy—0.0% |
||||
| Unipol SpA (Æ) |
101,002 | 27 | ||
| Total Warrants & Rights |
||||
| (cost $—) |
27 | |||
| Notional Amount $ |
||||
| Options Purchased—0.1% |
||||
| Switzerland—0.1% |
||||
| Swiss Market Index Futures |
||||
| Sep 2007 9,255.51 (CHF) Call (45) |
3,410 | 187 | ||
| Sep 2007 9,258.32 (CHF) Call (29) |
2,198 | 119 | ||
| Total Options Purchased |
||||
| (cost $298) |
306 | |||
A portion of the portfolio has been fair valued as of period end.
| Principal Amount ($) or Shares |
Market Value $ |
||||
| Short-Term Investments—8.4% |
|||||
| United States—8.4% |
|||||
| Russell Investment Company Money Market Fund |
33,478,000 | 33,478 | |||
| United States Treasury Bills (ž)(§) 4.644% due 09/27/07 |
2,200 | 2,175 | |||
| Total Short-Term Investments |
|||||
| (cost $35,654) |
35,653 | ||||
| Other Securities—13.1% |
|||||
| State Street Securities Lending Quality Trust (×) |
55,265,823 | 55,266 | |||
| Total Other Securities |
|||||
| (cost $55,266) |
55,266 | ||||
| Total Investments—112.5% |
|||||
| (identified cost $414,965) |
475,556 | ||||
| Other Assets and Liabilities, |
|||||
| Net—(12.5%) |
(52,886 | ) | |||
| Net Assets—100.0% |
422,670 | ||||
See accompanying notes which are an integral part of the financial statements.
Non-U.S. Fund 29
Table of Contents
Russell Investment Funds
Non-U.S. Fund
Schedule of Investments, continued—June 30, 2007 (Unaudited)
Amounts in thousands
| Futures Contracts (Number of Contracts) |
Notional $ |
Unrealized Appreciation $ |
|||
| Long Positions |
|||||
| AEX Index (Netherlands) expiration date 07/07 (40) |
5,935 | 115 | |||
| CAC-40 Index (France) expiration date 07/07 (43) |
3,526 | 64 | |||
| DAX Index (Germany) expiration date 09/07 (44) |
12,001 | 476 | |||
| EUR STOXX 50 Index (EMU) expiration date 09/07 (107) |
6,525 | 111 | |||
| FTSE-100 Index (UK) expiration date 09/07 (48) |
6,393 | 21 | |||
| MSCI Singapore Index expiration date 07/07 (1) |
57 | (1 | ) | ||
| OMX S30 Index (Sweden) expiration date 07/07 (227) |
4,155 | (112 | ) | ||
| TOPIX Index (Japan) expiration date 09/07 (87) |
21,560 | 5 | |||
| Short Positions |
|||||
| CAC-40 Index (France) expiration date 07/07 (2) |
164 | (5 | ) | ||
| FTSE-100 Index (UK) expiration date 09/07 (51) |
6,792 | (45 | ) | ||
| Hang Seng Index (Hong Kong) expiration date 07/07 (7) |
979 | (1 | ) | ||
| IBEX Plus Index (Spain) expiration date 07/07 (20) |
4,004 | (6 | ) | ||
| MIB-30 (Italy) expiration date 09/07 (14) |
4,005 | (38 | ) | ||
| SPI 200 Index (Australia) expiration date 09/07 (45) |
5,991 | 83 | |||
| Total Unrealized Appreciation (Depreciation) on Open Futures Contracts |
667 | ||||
| Options Written (Number of Contracts) |
Notional Amount $ |
Market Value $ |
|||
| Switzerland |
|||||
| Swiss Market Index Futures |
|||||
| Sep 2007 9,255.51 (CHF) Put (45) |
3,410 | (184 | ) | ||
| Sep 2007 9,258.32 (CHF) Put (29) |
2,198 | (120 | ) | ||
| Total Liability for Options Written (premiums received $298) |
(304 | ) | |||
See accompanying notes which are an integral part of the financial statements.
30 Non-U.S. Fund
Table of Contents
Russell Investment Funds
Non-U.S. Fund
Schedule of Investments, continued—June 30, 2007 (Unaudited)
Amounts in thousands
Foreign Currency Exchange Contracts
| Amount Sold |
Amount Bought |
Settlement Date |
Unrealized Appreciation (Depreciation) $ |
||||||||
| USD |
22 | AUD | 26 | 07/03/07 | — | ||||||
| USD |
40 | AUD | 48 | 09/19/07 | 1 | ||||||
| USD |
314 | AUD | 374 | 09/19/07 | 2 | ||||||
| USD |
343 | AUD | 408 | 09/19/07 | 2 | ||||||
| USD |
431 | CHF | 528 | 07/03/07 | 1 | ||||||
| USD |
147 | CHF | 179 | 07/05/07 | — | ||||||
| USD |
243 | CHF | 299 | 09/19/07 | 3 | ||||||
| USD |
805 | CHF | 991 | 09/19/07 | 11 | ||||||
| USD |
968 | CHF | 1,193 | 09/19/07 | 14 | ||||||
| USD |
3,345 | CHF | 4,118 | 09/19/07 | 47 | ||||||
| USD |
6,022 | CHF | 7,416 | 09/19/07 | 86 | ||||||
| USD |
22,734 | CHF | 28,010 | 09/19/07 | 337 | ||||||
| USD |
15 | CZK | 329 | 07/03/07 | — | ||||||
| USD |
29 | DKK | 160 | 09/19/07 | — | ||||||
| USD |
33 | DKK | 181 | 09/19/07 | — | ||||||
| USD |
10 | EUR | 8 | 07/02/07 | — | ||||||
| USD |
38 | EUR | 28 | 07/02/07 | — | ||||||
| USD |
246 | EUR | 182 | 07/02/07 | 1 | ||||||
| USD |
26 | EUR | 19 | 07/03/07 | — | ||||||
| USD |
727 | EUR | 538 | 07/03/07 | 1 | ||||||
| USD |
280 | EUR | 208 | 07/10/07 | 3 | ||||||
| USD |
674 | EUR | 500 | 09/19/07 | 4 | ||||||
| USD |
1,094 | EUR | 814 | 09/19/07 | 11 | ||||||
| USD |
1,343 | EUR | 1,000 | 09/19/07 | 14 | ||||||
| USD |
1,347 | EUR | 1,000 | 09/19/07 | 11 | ||||||
| USD |
1,350 | EUR | 1,000 | 09/19/07 | 3 | ||||||
| USD |
1,518 | EUR | 1,130 | 09/19/07 | 15 | ||||||
| USD |
2,166 | EUR | 1,600 | 09/19/07 | 5 | ||||||
| USD |
2,842 | EUR | 2,100 | 09/19/07 | 8 | ||||||
| USD |
3,352 | EUR | 2,495 | 09/19/07 | 34 | ||||||
| USD |
11,501 | EUR | 8,500 | 09/19/07 | 35 | ||||||
| USD |
11,908 | EUR | 8,800 | 09/19/07 | 34 | ||||||
| USD |
11,967 | EUR | 8,905 | 09/19/07 | 119 | ||||||
| USD |
18 | GBP | 9 | 07/02/07 | — | ||||||
| USD |
114 | GBP | 57 | 07/02/07 | 1 | ||||||
| USD |
126 | GBP | 63 | 07/02/07 | — | ||||||
| USD |
324 | GBP | 162 | 07/02/07 | 2 | ||||||
| USD |
30 | GBP | 15 | 07/03/07 | — | ||||||
| USD |
32 | GBP | 16 | 07/03/07 | — | ||||||
| USD |
512 | GBP | 255 | 07/03/07 | 1 | ||||||
| USD |
498 | GBP | 250 | 09/19/07 | 4 | ||||||
| USD |
590 | GBP | 300 | 09/19/07 | 12 | ||||||
| USD |
728 | GBP | 365 | 09/19/07 | 4 | ||||||
| USD |
796 | GBP | 400 | 09/19/07 | 6 | ||||||
| USD |
796 | GBP | 400 | 09/19/07 | 6 | ||||||
| USD |
2,874 | GBP | 1,452 | 09/19/07 | 39 | ||||||
| USD |
3,137 | GBP | 1,594 | 09/19/07 | 60 | ||||||
| USD |
3,329 | GBP | 1,682 | 09/19/07 | 45 | ||||||
| USD |
5,981 | GBP | 3,023 | 09/19/07 | 83 | ||||||
| USD |
8,162 | GBP | 4,100 | 09/19/07 | 62 | ||||||
| USD |
9,340 | GBP | 4,720 | 09/19/07 | 127 | ||||||
| USD |
9,756 | GBP | 4,900 | 09/19/07 | 72 | ||||||
| USD |
29 | HKD | 224 | 07/03/07 | — | ||||||
| USD |
3 | HKD | 22 | 09/19/07 | — | ||||||
| USD |
13 | HKD | 99 | 09/19/07 | — | ||||||
| USD |
119 | HKD | 925 | 09/19/07 | — | ||||||
| USD |
155 | HKD | 1,210 | 09/19/07 | — | ||||||
| USD |
335 | JPY | 41,359 | 07/03/07 | 1 | ||||||
| USD |
67 | JPY | 8,171 | 09/19/07 | — | ||||||
| USD |
106 | JPY | 12,896 | 09/19/07 | — | ||||||
| USD |
216 | JPY | 26,328 | 09/19/07 | 1 | ||||||
| USD |
410 | JPY | 50,000 | 09/19/07 | 1 | ||||||
| USD |
824 | JPY | 100,000 | 09/19/07 | (3 | ) | |||||
| USD |
833 | JPY | 100,000 | 09/19/07 | (12 | ) | |||||
| USD |
836 | JPY | 100,000 | 09/19/07 | (15 | ) | |||||
| USD |
1,045 | JPY | 125,000 | 09/19/07 | (19 | ) | |||||
| USD |
1,063 | JPY | 130,000 | 09/19/07 | (7 | ) | |||||
| USD |
1,087 | JPY | 130,000 | 09/19/07 | (20 | ) | |||||
| USD |
1,675 | JPY | 200,000 | 09/19/07 | (33 | ) | |||||
| USD |
2,662 | JPY | 325,090 | 09/19/07 | 6 | ||||||
| USD |
3,349 | JPY | 409,062 | 09/19/07 | 9 | ||||||
| USD |
3,846 | JPY | 460,000 | 09/19/07 | (70 | ) | |||||
| USD |
6,315 | JPY | 755,000 | 09/19/07 | (118 | ) | |||||
| USD |
10,305 | JPY | 1,259,530 | 09/19/07 | 33 | ||||||
| USD |
47 | NOK | 285 | 09/19/07 | 1 | ||||||
| USD |
278 | NZD | 372 | 09/19/07 | 7 | ||||||
| USD |
462 | NZD | 620 | 09/19/07 | 12 | ||||||
| USD |
495 | NZD | 662 | 09/19/07 | 13 | ||||||
| USD |
509 | NZD | 682 | 09/19/07 | 13 | ||||||
| USD |
693 | NZD | 930 | 09/19/07 | 19 | ||||||
| USD |
1,388 | NZD | 1,860 | 09/19/07 | 37 | ||||||
| USD |
1,665 | NZD | 2,232 | 09/19/07 | 45 | ||||||
| USD |
2,404 | NZD | 3,225 | 09/19/07 | 65 | ||||||
| USD |
19 | SEK | 130 | 07/03/07 | — | ||||||
| USD |
220 | SEK | 1,513 | 07/03/07 | 1 | ||||||
| USD |
139 | SEK | 978 | 09/19/07 | 4 | ||||||
| USD |
2,200 | SEK | 15,440 | 09/19/07 | 67 | ||||||
| USD |
4,170 | SEK | 29,256 | 09/19/07 | 125 | ||||||
| USD |
29 | SGD | 45 | 07/03/07 | — | ||||||
| USD |
35 | SGD | 54 | 09/19/07 | — | ||||||
See accompanying notes which are an integral part of the financial statements.
Non-U.S. Fund 31
Table of Contents
Russell Investment Funds
Non-U.S. Fund
Schedule of Investments, continued—June 30, 2007 (Unaudited)
Amounts in thousands
Foreign Currency Exchange Contracts
| Amount Sold |
Amount Bought |
Settlement Date |
Unrealized Appreciation (Depreciation) $ |
||||||||
| USD |
348 | SGD | 532 | 09/19/07 | 2 | ||||||
| USD |
558 | SGD | 854 | 09/19/07 | 3 | ||||||
| USD |
807 | SGD | 1,231 | 09/19/07 | 3 | ||||||
| USD |
1,041 | SGD | 1,588 | 09/19/07 | 4 | ||||||
| USD |
1,299 | SGD | 1,983 | 09/19/07 | 4 | ||||||
| USD |
2,628 | SGD | 4,012 | 09/19/07 | 10 | ||||||
| USD |
4,149 | SGD | 6,336 | 09/19/07 | 17 | ||||||
| AUD |
437 | USD | 367 | 09/19/07 | (3 | ) | |||||
| AUD |
547 | USD | 459 | 09/19/07 | (3 | ) | |||||
| AUD |
627 | USD | 527 | 09/19/07 | (3 | ) | |||||
| AUD |
758 | USD | 637 | 09/19/07 | (4 | ) | |||||
| AUD |
2,423 | USD | 2,036 | 09/19/07 | (13 | ) | |||||
| AUD |
3,038 | USD | 2,552 | 09/19/07 | (18 | ) | |||||
| CAD |
267 | USD | 251 | 07/05/07 | 1 | ||||||
| CHF |
2,386 | USD | 1,938 | 09/19/07 | (27 | ) | |||||
| CHF |
3,127 | USD | 2,529 | 09/19/07 | (46 | ) | |||||
| CHF |
3,306 | USD | 2,674 | 09/19/07 | (49 | ) | |||||
| CHF |
3,752 | USD | 3,035 | 09/19/07 | (55 | ) | |||||
| CHF |
6,558 | USD | 5,325 | 09/19/07 | (77 | ) | |||||
| CHF |
11,239 | USD | 9,128 | 09/19/07 | (130 | ) | |||||
| DKK |
12 | USD | 2 | 09/19/07 | — | ||||||
| DKK |
258 | USD | 47 | 09/19/07 | — | ||||||
| DKK |
475 | USD | 86 | 09/19/07 | (1 | ) | |||||
| DKK |
705 | USD | 127 | 09/19/07 | (1 | ) | |||||
| EUR |
83 | USD | 112 | 07/03/07 | — | ||||||
| EUR |
134 | USD | 180 | 07/03/07 | (1 | ) | |||||
| EUR |
97 | USD | 131 | 07/05/07 | — | ||||||
| EUR |
200 | USD | 271 | 09/19/07 | (1 | ) | |||||
| EUR |
239 | USD | 321 | 09/19/07 | (3 | ) | |||||
| EUR |
275 | USD | 369 | 09/19/07 | (4 | ) | |||||
| EUR |
300 | USD | 404 | 09/19/07 | (3 | ) | |||||
| EUR |
400 | USD | 536 | 09/19/07 | (7 | ) | |||||
| EUR |
400 | USD | 541 | 09/19/07 | (2 | ) | |||||
| EUR |
400 | USD | 543 | 09/19/07 | — | ||||||
| EUR |
500 | USD | 676 | 09/19/07 | (2 | ) | |||||
| EUR |
500 | USD | 678 | 09/19/07 | — | ||||||
| EUR |
900 | USD | 1,218 | 09/19/07 | (4 | ) | |||||
| EUR |
2,750 | USD | 3,719 | 09/19/07 | (13 | ) | |||||
| EUR |
3,003 | USD | 4,036 | 09/19/07 | (39 | ) | |||||
| EUR |
3,452 | USD | 4,609 | 09/19/07 | (76 | ) | |||||
| EUR |
3,540 | USD | 4,759 | 09/19/07 | (45 | ) | |||||
| EUR |
7,183 | USD | 9,655 | 09/19/07 | (94 | ) | |||||
| EUR |
8,500 | USD | 11,507 | 09/19/07 | (28 | ) | |||||
| GBP |
40 | USD | 80 | 07/03/07 | — | ||||||
| GBP |
107 | USD | 215 | 07/03/07 | (1 | ) | |||||
| GBP |
143 | USD | 287 | 07/05/07 | — | ||||||
| GBP |
100 | USD | 200 | 09/19/07 | (1 | ) | |||||
| GBP |
100 | USD | 201 | 09/19/07 | — | ||||||
| GBP |
300 | USD | 597 | 09/19/07 | (5 | ) | |||||
| GBP |
600 | USD | 1,194 | 09/19/07 | (9 | ) | |||||
| GBP |
1,173 | USD | 2,322 | 09/19/07 | (31 | ) | |||||
| GBP |
1,217 | USD | 2,408 | 09/19/07 | (32 | ) | |||||
| GBP |
1,960 | USD | 3,880 | 09/19/07 | (52 | ) | |||||
| GBP |
2,220 | USD | 4,420 | 09/19/07 | (33 | ) | |||||
| GBP |
4,100 | USD | 8,162 | 09/19/07 | (61 | ) | |||||
| GBP |
4,147 | USD | 8,209 | 09/19/07 | (109 | ) | |||||
| GBP |
5,866 | USD | 11,609 | 09/19/07 | (157 | ) | |||||
| HKD |
698 | USD | 90 | 09/19/07 | — | ||||||
| HKD |
714 | USD | 92 | 09/19/07 | — | ||||||
| JPY |
39,581 | USD | 323 | 07/02/07 | 2 | ||||||
| JPY |
6,667 | USD | 54 | 07/03/07 | — | ||||||
| JPY |
5,000 | USD | 42 | 09/19/07 | 1 | ||||||
| JPY |
50,000 | USD | 411 | 09/19/07 | 1 | ||||||
| JPY |
56,985 | USD | 466 | 09/19/07 | (1 | ) | |||||
| JPY |
100,000 | USD | 820 | 09/19/07 | (1 | ) | |||||
| JPY |
100,000 | USD | 835 | 09/19/07 | 14 | ||||||
| JPY |
150,000 | USD | 1,253 | 09/19/07 | 22 | ||||||
| JPY |
156,176 | USD | 1,279 | 09/19/07 | (3 | ) | |||||
| JPY |
268,481 | USD | 2,197 | 09/19/07 | (6 | ) | |||||
| JPY |
655,000 | USD | 5,478 | 09/19/07 | 102 | ||||||
| JPY |
670,159 | USD | 5,483 | 09/19/07 | (18 | ) | |||||
| JPY |
802,939 | USD | 6,567 | 09/19/07 | (24 | ) | |||||
| JPY |
2,221,544 | USD | 18,189 | 09/19/07 | (45 | ) | |||||
| NOK |
285 | USD | 47 | 09/19/07 | (1 | ) | |||||
| SEK |
581 | USD | 85 | 07/03/07 | — | ||||||
| SEK |
3,266 | USD | 465 | 09/19/07 | (14 | ) | |||||
| SEK |
3,640 | USD | 519 | 09/19/07 | (16 | ) | |||||
| SEK |
38,768 | USD | 5,525 | 09/19/07 | (166 | ) | |||||
| SGD |
3 | USD | 2 | 09/19/07 | — | ||||||
| SGD |
302 | USD | 199 | 09/19/07 | — | ||||||
| SGD |
975 | USD | 642 | 09/19/07 | 1 | ||||||
| SGD |
1,594 | USD | 1,044 | 09/19/07 | (4 | ) | |||||
| SGD |
1,887 | USD | 1,235 | 09/19/07 | (5 | ) | |||||
| SGD |
2,757 | USD | 1,806 | 09/19/07 | (7 | ) | |||||
| SGD |
4,395 | USD | 2,879 | 09/19/07 | (11 | ) | |||||
| SGD |
4,678 | USD | 3,063 | 09/19/07 | (13 | ) | |||||
| Total Unrealized Appreciation (Depreciation) on Open Foreign Currency Exchange Contracts |
98 | ||||||||||
See accompanying notes which are an integral part of the financial statements.
32 Non-U.S. Fund
Table of Contents
Russell Investment Funds
Non-U.S. Fund
Schedule of Investments, continued—June 30, 2007 (Unaudited)
Amounts in thousands
Index Swap Contracts
| Fund Receives Underlying Security |
Counter Party |
Notional Amount |
Fund Pays Floating Rate |
Termination Date |
Unrealized Appreciation (Depreciation) |
||||||
| MSCI Belgium Local Net Total Return Index |
Merrill Lynch | EUR 1,010 | 1 Month EUR LIBOR plus 0.15% |
06/30/07 | (2 | ) | |||||
| MSCI Belgium Local Net Total Return Index |
Merrill Lynch | EUR 308 | 1 Month EUR LIBOR plus 0.15% |
09/19/07 | (4 | ) | |||||
| MSCI Belgium Local Net Total Return Index |
Merrill Lynch | EUR 1,016 | 1 Month EUR LIBOR minus 0.45% |
09/24/07 | (12 | ) | |||||
| Total Unrealized Appreciation (Depreciation) on Open Index Swap Contracts |
(18 | ) | |||||||||
| Industry Diversification |
% of Net Assets |
Market Value $ |
||||
| Auto and Transportation |
6.1 | 25,854 | ||||
| Consumer Discretionary |
11.2 | 47,377 | ||||
| Consumer Staples |
10.2 | 43,175 | ||||
| Financial Services |
19.8 | 83,784 | ||||
| Health Care |
6.0 | 25,102 | ||||
| Integrated Oils |
5.0 | 21,177 | ||||
| Materials and Processing |
10.2 | 43,226 | ||||
| Miscellaneous |
1.1 | 4,571 | ||||
| Other Energy |
0.2 | 582 | ||||
| Producer Durables |
9.5 | 40,280 | ||||
| Technology |
3.8 | 16,103 | ||||
| Utilities |
7.8 | 33,073 | ||||
| Warrants & Rights |
— | 27 | ||||
| Options Purchased |
0.1 | 306 | ||||
| Short-Term Investments |
8.4 | 35,653 | ||||
| Other Securities |
13.1 | 55,266 | ||||
| Total Investments |
112.5 | 475,556 | ||||
| Other Assets and Liabilities, Net |
(12.5 | ) | (52,886 | ) | ||
| Net Assets |
100.0 | 422,670 | ||||
| Geographic Diversification |
% of Net Assets |
Market Value $ |
||||
| Asia |
6.6 | 27,725 | ||||
| Europe |
46.0 | 194,442 | ||||
| Guernsey |
0.2 | 662 | ||||
| Japan |
16.2 | 68,560 | ||||
| Latin America |
1.3 | 5,640 | ||||
| Other Regions |
10.0 | 42,489 | ||||
| United Kingdom |
19.1 | 80,772 | ||||
| Other Securities |
13.1 | 55,266 | ||||
| Total Investments |
112.5 | 475,556 | ||||
| Other Assets and Liabilities, Net |
(12.5 | ) | (52,886 | ) | ||
| Net Assets |
100.0 | 422,670 | ||||
See accompanying notes which are an integral part of the financial statements.
Non-U.S. Fund 33
Table of Contents
Russell Investment Funds
Non-U.S. Fund
Presentation of Portfolio Holdings—June 30, 2007 (Unaudited)
| Portfolio Summary |
% of Net Assets |
||
| Australia |
2.2 | ||
| Austria |
0.3 | ||
| Belgium |
0.2 | ||
| Bermuda |
0.5 | ||
| Brazil |
0.3 | ||
| Canada |
1.4 | ||
| Cayman Islands |
0.3 | ||
| China |
0.3 | ||
| Czech Republic |
0.2 | ||
| Denmark |
0.6 | ||
| Finland |
1.6 | ||
| France |
12.3 | ||
| Germany |
9.4 | ||
| Greece |
0.1 | ||
| Guernsey |
0.2 | ||
| Hong Kong |
0.6 | ||
| Indonesia |
0.2 | ||
| Ireland |
0.6 | ||
| Italy |
3.9 | ||
| Japan |
16.2 | ||
| Luxembourg |
0.2 | ||
| Mexico |
0.2 | ||
| Netherlands |
3.7 | ||
| Norway |
0.5 | ||
| Portugal |
0.2 | ||
| Singapore |
0.7 | ||
| South Korea |
1.7 | ||
| Spain |
1.7 | ||
| Sweden |
2.0 | ||
| Switzerland |
7.8 | ||
| Taiwan |
0.7 | ||
| Thailand |
0.2 | ||
| United Kingdom |
19.1 | ||
| United States |
0.2 | ||
| Preferred Stocks |
0.6 | ||
| Warrants & Rights |
— | * | |
| Options Purchased |
0.1 | ||
| Short-Term Investments |
8.4 | ||
| Other Securities |
13.1 | ||
| Total Investments |
112.5 | ||
| Other Assets and Liabilities Net |
(12.5 | ) | |
| 100.0 | |||
| Futures Contracts |
0.2 | ||
| Options Written |
(0.1 | ) | |
| Foreign Currency Exchange Contracts |
— | * | |
| Index Swap Contracts |
(— | )* |
| * | Less than .05% of net assets |
See accompanying notes which are an integral part of the financial statements.
34 Non-U.S. Fund
Table of Contents
Real Estate Securities Fund
Shareholder Expense Example—June 30, 2007 (Unaudited)
Fund Expenses
The following disclosure provides important information regarding each Fund’s Expense Example, which appears on each Fund’s individual page in this Semiannual Report. Please refer to this information when reviewing the Expense Example for a Fund.
Example
As a shareholder of the Fund, you incur two types of costs: (1) transaction costs, and (2) ongoing costs, including management fees; and other Fund expenses. The Example is intended to help you understand your ongoing costs (in dollars) of investing in the Fund and to compare these costs with the ongoing costs of investing in other mutual funds. The Example is based on an investment of $1,000 invested at the beginning of the period and held for the entire period indicated, which for this Fund is from January 1, 2007 to June 30, 2007.
Actual Expenses
The information in the table under the heading “Actual Performance” provides information about actual account values and actual expenses. You may use the information in this column, together with the amount you invested, to estimate the expenses that you paid over the period. Simply divide your account value by $1,000 (for example, an $8,600 account value divided by $1,000 = 8.6), then multiply the result by the number in the first column in the row entitled “Expenses Paid During Period” to estimate the expenses you paid on your account during this period.
Hypothetical Example for Comparison Purposes
The information in the table under the heading “Hypothetical Performance (5% return before expenses)” provides information about hypothetical account values and hypothetical expenses based on the Fund’s actual expense ratio and an assumed rate of return of 5% per year before expenses, which is not the Fund’s actual return. The hypothetical account values and expenses may not be used to estimate the actual ending account balance or expenses you paid for the period. You may use this information to compare the ongoing costs of investing in the Fund and other funds. To do so, compare this 5% hypothetical example with the 5% hypothetical examples that appear in the shareholder reports of other funds.
Please note that the expenses shown in the table are meant to highlight your ongoing costs only and do not reflect any transactional costs. Therefore, the information under the heading “Hypothetical Performance (5% return before expenses)” is useful in comparing ongoing costs only, and will not help you determine the relative total costs of owning different funds. In addition, if these transactional costs were included, your costs would have been higher.
| Actual Performance |
Hypothetical Performance (5% return before expenses) | |||||
| Beginning Account Value January 1, 2007 |
$ | 1,000.00 | $ | 1,000.00 | ||
| Ending Account Value June 30, 2007 |
$ | 934.80 | $ | 1,020.33 | ||
| Expenses Paid During Period* |
$ | 4.32 | $ | 4.51 | ||
| * | Expenses are equal to the Fund’s annualized expense ratio of 0.90% (representing the one-half year period annualized), multiplied by the average account value over the period, multiplied by 181/365 (to reflect the one-half year period). |
Real Estate Securities Fund 35
Table of Contents
Russell Investment Funds
Real Estate Securities Fund
Schedule of Investments—June 30, 2007 (Unaudited)
Amounts in thousands (except share amounts)
| Principal Amount ($) or Shares |
Market Value $ | |||
| Common Stocks—97.6% |
||||
| Apartments—16.1% |
||||
| American Campus Communities, Inc. (ö) |
14,300 | 404 | ||
| Apartment Investment & Management Co. Class A (ö) |
124,825 | 6,294 | ||
| Archstone-Smith Trust (ö) |
342,376 | 20,238 | ||
| AvalonBay Communities, Inc. (ö) |
181,350 | 21,559 | ||
| Boardwalk Real Estate Investment Trust (ö) |
7,300 | 333 | ||
| BRE Properties, Inc. Class A (ö) |
30,000 | 1,779 | ||
| Camden Property Trust (ö) |
149,200 | 9,992 | ||
| Equity Residential (ö) |
328,658 | 14,997 | ||
| Essex Property Trust, Inc. (ö) |
86,900 | 10,106 | ||
| GAGFAH SA |
11,800 | 258 | ||
| Home Properties, Inc. (ö) |
13,400 | 696 | ||
| Mid-America Apartment Communities, Inc. (ö) |
25,100 | 1,317 | ||
| New City Residence Investment Corp. Class A (ö) |
50 | 278 | ||
| Post Properties, Inc. (ö) |
38,250 | 1,994 | ||
| United Dominion Realty Trust, Inc. (ö) |
141,029 | 3,709 | ||
| 93,954 | ||||
| Diversified—9.9% |
||||
| British Land Co. PLC (ö) |
80,000 | 2,153 | ||
| CA Immobilien Anlagen AG (Æ) |
9,400 | 278 | ||
| Castellum AB |
42,000 | 508 | ||
| Cheung Kong Holdings, Ltd. |
21,000 | 275 | ||
| Colonial Properties Trust (ö) |
63,100 | 2,300 | ||
| Fonciere Des Regions |
3,500 | 514 | ||
| Forest City Enterprises, Inc. Class A |
8,400 | 516 | ||
| GPT Group |
143,283 | 566 | ||
| Great Eagle Holdings, Ltd. |
202,000 | 708 | ||
| Hang Lung Properties, Ltd. |
97,000 | 334 | ||
| Heiwa Real Estate Co., Ltd. |
43,000 | 315 | ||
| Helical Bar PLC |
34,700 | 323 | ||
| Henderson Land Development Co., Ltd. |
99,000 | 674 | ||
| Hysan Development Co., Ltd. |
334,000 | 889 | ||
| iStar Financial, Inc. (ö) |
34,200 | 1,516 | ||
| IVG Immobilien AG |
14,200 | 556 | ||
| Kenedix Realty Investment Corp. Class A (ö) |
89 | 667 | ||
| Kerry Properties, Ltd. |
76,000 | 479 | ||
| Land Securities Group PLC (ö) |
80,912 | 2,832 | ||
| Mirvac Group |
60,581 | 293 | ||
| Mitsubishi Estate Co., Ltd. |
103,000 | 2,802 | ||
| Mitsui Fudosan Co., Ltd. |
101,000 | 2,838 | ||
| Quintain Estates & Development PLC |
18,500 | 301 | ||
| Spirit Finance Corp. (ö) |
71,400 | 1,040 | ||
| Sponda OYJ |
27,900 | 407 | ||
| Stockland |
64,300 | 444 | ||
| Sun Hung Kai Properties, Ltd. |
63,000 | 759 | ||
| Unibail-Rodamco |
9,368 | 2,411 | ||
| Vornado Realty Trust (ö) |
266,134 | 29,232 | ||
| Washington Real Estate Investment Trust (ö) |
12,200 | 415 | ||
| Wharf Holdings, Ltd. |
158,000 | 631 | ||
| 57,976 | ||||
| Free Standing Retail—0.2% |
||||
| Realty Income Corp. (ö) |
39,000 | 982 | ||
| Health Care—5.7% |
||||
| Cogdell Spencer, Inc. (ö) |
21,650 | 446 | ||
| Health Care Property Investors, Inc. (ö) |
179,500 | 5,193 | ||
| Health Care REIT, Inc. (ö) |
120,300 | 4,855 | ||
| Healthcare Realty Trust, Inc. (ö) |
60,650 | 1,685 | ||
| LTC Properties, Inc. (ö) |
76,400 | 1,738 | ||
| Nationwide Health Properties, Inc. (ö) |
266,550 | 7,250 | ||
| Omega Healthcare Investors, Inc. (ö) |
89,200 | 1,412 | ||
| Senior Housing Properties Trust (ö) |
75,700 | 1,540 | ||
| Ventas, Inc. (ö) |
255,000 | 9,244 | ||
| 33,363 | ||||
| Industrial—7.4% |
||||
| AMB Property Corp. (ö) |
243,250 | 12,946 | ||
| DCT Industrial Trust, Inc. (ö) |
208,300 | 2,241 | ||
| First Potomac Realty Trust (ö) |
44,300 | 1,032 | ||
| Macquarie Goodman Group |
103,100 | 587 | ||
| ProLogis (ö) |
444,904 | 25,315 | ||
| ProLogis European Properties |
15,100 | 265 | ||
| Segro PLC (ö) |
52,600 | 660 | ||
| 43,046 | ||||
| Lodging/Resorts—9.4% |
||||
| Ashford Hospitality Trust, Inc. (ö) |
93,000 | 1,094 | ||
| DiamondRock Hospitality Co. (ö) |
210,950 | 4,025 | ||
| FelCor Lodging Trust, Inc. (ö) |
108,900 | 2,835 | ||
| Hilton Hotels Corp. |
232,100 | 7,768 | ||
| Hospitality Properties Trust (ö) |
16,600 | 689 | ||
| Host Hotels & Resorts, Inc. (ö) |
993,013 | 22,958 | ||
| LaSalle Hotel Properties (ö) |
124,450 | 5,404 | ||
| Shangri-La Asia, Ltd. |
178,000 | 430 | ||
| Starwood Hotels & Resorts Worldwide, Inc. (ö) |
136,580 | 9,160 | ||
| Strategic Hotels & Resorts, Inc. (ö) |
29,800 | 670 | ||
| 55,033 | ||||
36 Real Estate Securities Fund
Table of Contents
Russell Investment Funds
Real Estate Securities Fund
Schedule of Investments, continued—June 30, 2007 (Unaudited)
Amounts in thousands (except share amounts)
| Principal Amount ($) or Shares |
Market Value $ | |||
| Manufactured Homes—0.5% |
||||
| Equity Lifestyle Properties, Inc. (ö) |
55,100 | 2,876 | ||
| Mixed Industrial/Office—1.4% |
||||
| Liberty Property Trust (ö) |
118,600 | 5,210 | ||
| PS Business Parks, Inc. (ö) |
43,800 | 2,776 | ||
| 7,986 | ||||
| Office—15.6% |
||||
| Alexandria Real Estate Equities, Inc. (ö) |
59,500 | 5,761 | ||
| Alstria Office AG (Æ) |
19,600 | 397 | ||
| Beni Stabili SpA |
355,500 | 520 | ||
| BioMed Realty Trust, Inc. (ö) |
188,950 | 4,746 | ||
| Boston Properties, Inc. (ö) |
190,159 | 19,421 | ||
| Brandywine Realty Trust (ö) |
196,786 | 5,624 | ||
| Brookfield Properties Corp. |
387,025 | 9,409 | ||
| CapitaCommercial Trust (Æ)(ö) |
200,000 | 383 | ||
| Corporate Office Properties Trust (ö) |
38,600 | 1,583 | ||
| Daibiru Corp. |
20,200 | 281 | ||
| Derwent London PLC (ö) |
30,200 | 1,113 | ||
| Douglas Emmett, Inc. (ö) |
157,328 | 3,892 | ||
| Fabege AB |
24,200 | 267 | ||
| Great Portland Estates PLC (ö) |
21,453 | 285 | ||
| Highwoods Properties, Inc. (ö) |
66,700 | 2,501 | ||
| Hongkong Land Holdings, Ltd. |
321,000 | 1,444 | ||
| HRPT Properties Trust (ö) |
167,100 | 1,738 | ||
| ING Office Fund |
191,839 | 285 | ||
| Kilroy Realty Corp. (ö) |
56,600 | 4,010 | ||
| Mack-Cali Realty Corp. (ö) |
107,250 | 4,664 | ||
| Maguire Properties, Inc. (ö) |
8,300 | 285 | ||
| Nomura Real Estate Office Fund, Inc. Class A (ö) |
24 | 259 | ||
| Norwegian Property ASA |
26,200 | 328 | ||
| Parkway Properties, Inc. (ö) |
25,600 | 1,230 | ||
| SL Green Realty Corp. (ö) |
164,150 | 20,336 | ||
| Societe Immobiliere de Location pour l’Industrie et le Commerce |
1,741 | 282 | ||
| Tishman Speyer Office Fund |
137,300 | 276 | ||
| Vastned Offices/Industrial |
5,800 | 215 | ||
| 91,535 | ||||
| Regional Malls—15.7% |
||||
| Aeon Mall Co., Ltd. |
7,900 | 243 | ||
| CBL & Associates Properties, Inc. (ö) |
31,200 | 1,125 | ||
| CFS Gandel Retail Trust |
134,341 | 208 | ||
| General Growth Properties, Inc. (ö) |
383,100 | 20,285 | ||
| Liberty International PLC (ö) |
6,366 | 146 | ||
| Macerich Co. (The) (ö) |
203,072 | 16,737 | ||
| Simon Property Group, Inc. (ö) |
479,900 | 44,650 | ||
| Taubman Centers, Inc. (ö) |
136,300 | 6,762 | ||
| Westfield Group |
84,968 | 1,438 | ||
| 91,594 | ||||
| Self Storage—4.0% |
||||
| Extra Space Storage, Inc. (ö) |
173,300 | 2,859 | ||
| Public Storage, Inc. (ö) |
271,710 | 20,873 | ||
| 23,732 | ||||
| Shopping Centers—10.3% |
||||
| Cedar Shopping Centers, Inc. (ö) |
62,000 | 890 | ||
| Corio NV |
4,100 | 323 | ||
| Developers Diversified Realty Corp. (ö) |
230,200 | 12,134 | ||
| Federal Realty Investors Trust (ö) |
189,740 | 14,659 | ||
| Hammerson PLC (ö) |
14,938 | 430 | ||
| Kimco Realty Corp. (ö) |
180,500 | 6,872 | ||
| Kite Realty Group Trust (ö) |
99,300 | 1,889 | ||
| Macquarie CountryWide Trust |
164,100 | 281 | ||
| Regency Centers Corp. (ö) |
261,000 | 18,400 | ||
| Tanger Factory Outlet Centers (ö) |
77,550 | 2,904 | ||
| Weingarten Realty Investors (ö) |
38,000 | 1,562 | ||
| 60,344 | ||||
| Specialty—1.4% |
||||
| Digital Realty Trust, Inc. (ö) |
161,350 | 6,080 | ||
| Plum Creek Timber Co., Inc. (ö) |
52,100 | 2,170 | ||
| 8,250 | ||||
| Total Common Stocks |
||||
| (cost $423,502) |
570,671 | |||
| Warrants & Rights—0.0% |
||||
| Westfield Group 2007 Rights (Æ) |
6,782 | 3 | ||
| Total Warrants & Rights |
||||
| (cost $—) |
3 | |||
Real Estate Securities Fund 37
Table of Contents
Russell Investment Funds
Real Estate Securities Fund
Schedule of Investments, continued—June 30, 2007 (Unaudited)
Amounts in thousands (except share amounts)
| Principal Amount ($) or Shares |
Market Value $ | |||
| Short-Term Investments—2.3% |
||||
| Russell Investment Company Money Market Fund |
13,668,000 | 13,668 | ||
| Total Short-Term Investments |
||||
| (cost $13,668) |
13,668 | |||
| Total Investments—99.9% |
||||
| (identified cost $ 437,170) |
584,342 | |||
| Other Assets and Liabilities, |
||||
| Net—0.1% |
309 | |||
| Net Assets—100.0% |
584,651 | |||
Foreign Currency Exchange Contracts
| Amount Sold |
Amount Bought |
Settlement Date |
Unrealized Appreciation (Depreciation) $ |
||||||||
| USD |
2 | AUD | 3 | 07/02/07 | — | ||||||
| USD |
7 | AUD | 8 | 07/03/07 | — | ||||||
| USD |
4 | JPY | 520 | 07/02/07 | — | ||||||
| USD |
14 | JPY | 1,714 | 07/03/07 | — | ||||||
| GBP |
73 | USD | 146 | 07/02/07 | (1 | ) | |||||
| GBP |
74 | USD | 149 | 07/03/07 | — | ||||||
| HKD |
565 | USD | 72 | 07/03/07 | — | ||||||
| JPY |
3,643 | USD | 30 | 07/03/07 | — | ||||||
| SGD |
23 | USD | 15 | 07/02/07 | — | ||||||
| Total Unrealized Appreciation (Depreciation) on Open Foreign Currency Exchange Contracts |
(1 | ) | |||||||||
See accompanying notes which are an integral part of the financial statements.
38 Real Estate Securities Fund
Table of Contents
Russell Investment Funds
Real Estate Securities Fund
Presentation of Portfolio Holdings—June 30, 2007 (Unaudited)
| Categories |
% of Net Assets |
||
| Apartments |
16.1 | ||
| Diversified |
9.9 | ||
| Free Standing Retail |
0.2 | ||
| Health Care |
5.7 | ||
| Industrial |
7.4 | ||
| Lodging/Resorts |
9.4 | ||
| Manufactured Homes |
0.5 | ||
| Mixed Industrial/Office |
1.4 | ||
| Office |
15.6 | ||
| Regional Malls |
15.7 | ||
| Self Storage |
4.0 | ||
| Shopping Centers |
10.3 | ||
| Specialty |
1.4 | ||
| Warrants & Rights |
— | * | |
| Short-Term Investments |
2.3 | ||
| Total Investments |
99.9 | ||
| Other Assets and Liabilities, Net |
0.1 | ||
| 100.0 | |||
| Foreign Currency Exchange Contracts |
(— | )* |
| * | Less than .05% of net assets |
See accompanying notes which are an integral part of the financial statements.
Real Estate Securities Fund 39
Table of Contents
Core Bond Fund
Shareholder Expense Example—June 30, 2007 (Unaudited)
Fund Expenses
The following disclosure provides important information regarding each Fund’s Expense Example, which appears on each Fund’s individual page in this Semiannual Report. Please refer to this information when reviewing the Expense Example for a Fund.
Example
As a shareholder of the Fund, you incur two types of costs: (1) transaction costs, and (2) ongoing costs, including management fees; and other Fund expenses. The Example is intended to help you understand your ongoing costs (in dollars) of investing in the Fund and to compare these costs with the ongoing costs of investing in other mutual funds. The Example is based on an investment of $1,000 invested at the beginning of the period and held for the entire period indicated, which for this Fund is from January 1, 2007 to June 30, 2007.
Actual Expenses
The information in the table under the heading “Actual Performance” provides information about actual account values and actual expenses. You may use the information in this column, together with the amount you invested, to estimate the expenses that you paid over the period. Simply divide your account value by $1,000 (for example, an $8,600 account value divided by $1,000 = 8.6), then multiply the result by the number in the first column in the row entitled “Expenses Paid During Period” to estimate the expenses you paid on your account during this period.
Hypothetical Example for Comparison Purposes
The information in the table under the heading “Hypothetical Performance (5% return before expenses)” provides information about hypothetical account values and hypothetical expenses based on the Fund’s actual expense ratio and an assumed rate of return of 5% per year before expenses, which is not the Fund’s actual return. The hypothetical account values and expenses may not be used to estimate the actual ending account balance or expenses you paid for the period. You may use this information to compare the ongoing costs of investing in the Fund and other funds. To do so, compare this 5% hypothetical example with the 5% hypothetical examples that appear in the shareholder reports of other funds.
Please note that the expenses shown in the table are meant to highlight your ongoing costs only and do not reflect any transactional costs. Therefore, the information under the heading “Hypothetical Performance (5% return before expenses)” is useful in comparing ongoing costs only, and will not help you determine the relative total costs of owning different funds. In addition, if these transactional costs were included, your costs would have been higher.
| Actual Performance |
Hypothetical Performance (5% return before expenses) | |||||
| Beginning Account Value January 1, 2007 |
$ | 1,000.00 | $ | 1,000.00 | ||
| Ending Account Value June 30, 2007 |
$ | 1,011.10 | $ | 1,021.32 | ||
| Expenses Paid During Period* |
$ | 3.49 | $ | 3.51 | ||
| * | Expenses are equal to the Fund’s annualized expense ratio of 0.70% (representing the one-half year period annualized), multiplied by the average account value over the period, multiplied by 181/365 (to reflect the one-half year period). Reflects amounts waived and/or reimbursed by the investment adviser. Without the waiver and/or reimbursement, expenses would have been higher. |
40 Core Bond Fund
Table of Contents
Russell Investment Funds
Core Bond Fund
Schedule of Investments—June 30, 2007 (Unaudited)
Amounts in thousands (except share amounts)
| Principal Amount ($) or Shares |
Market Value $ | |||
| Long-Term Investments—90.3% |
||||
| Asset-Backed Securities—4.7% |
||||
| Accredited Mortgage Loan Trust (Ê) |
||||
| Series 2004-2 Class A2 |
||||
| 5.620% due 07/25/34 |
45 | 45 | ||
| ACE Securities Corp. (Ê) |
||||
| Series 2003-OP1 Class M2 |
||||
| 6.820% due 12/25/33 |
55 | 55 | ||
| Series 2005-SD3 Class A |
||||
| 5.720% due 08/25/45 |
296 | 296 | ||
| Aegis Asset Backed Securities Trust (Ê) |
||||
| Series 2003-3 Class M2 |
||||
| 6.970% due 01/25/34 |
110 | 111 | ||
| American Express Credit Account Master Trust (Ê) |
||||
| Series 2004-C Class C (þ) |
||||
| 5.820% due 02/15/12 |
246 | 246 | ||
| Series 2005-3 Class A |
||||
| 5.320% due 01/18/11 |
700 | 699 | ||
| Ameriquest Mortgage Securities, Inc. (Ê) |
||||
| Series 2002-D Class M1 |
||||
| 7.483% due 02/25/33 |
90 | 90 | ||
| Series 2004-R8 Class A5 |
||||
| 5.690% due 09/25/34 |
50 | 50 | ||
| Series 2004-R10 Class A5 |
||||
| 5.710% due 11/25/34 |
15 | 15 | ||
| Bayview Financial Acquisition Trust |
||||
| Series 2006-A Class 1A3 |
||||
| 5.865% due 02/28/41 |
190 | 189 | ||
| Citifinancial Mortgage Securities, Inc. |
||||
| Series 2003-4 Class AF3 |
||||
| 3.221% due 10/25/33 |
3 | 3 | ||
| Countrywide Asset-Backed Certificates |
||||
| Series 2004-13 Class AF3 |
||||
| 3.989% due 02/25/31 |
25 | 25 | ||
| Series 2004-AB2 Class M3 (Ê) |
||||
| 5.920% due 05/25/36 |
91 | 91 | ||
| Series 2004-BC1 Class M1 (Ê) |
||||
| 5.820% due 02/25/34 |
95 | 95 | ||
| Series 2006-11 Class 1AF4 |
||||
| 6.300% due 09/25/46 |
170 | 170 | ||
| Countrywide Home Equity Loan Trust (Ê) |
||||
| Series 2006-H Class 2A1B |
||||
| 5.470% due 11/15/36 |
794 | 793 | ||
| First Franklin Mortgage Loan Asset Backed Certificates (Ê) |
||||
| Series 2006-FF1 Class A3 |
||||
| 5.370% due 11/25/36 |
246 | 246 | ||
| Fremont Home Loan Trust (Ê) |
||||
| Series 2006-A Class 2A1 |
||||
| 5.370% due 05/25/36 |
29 | 29 | ||
| GSAA Home Equity Trust |
||||
| Series 2006-4 Class 1A2 |
||||
| 5.953% due 03/25/36 |
245 | 244 | ||
| GSAA Trust (Ê) |
||||
| Series 2006-2 Class 2A3 |
||||
| 5.590% due 12/25/35 |
320 | 320 | ||
| GSAMP Trust (Ê) |
||||
| Series 2003-HE2 Class M1 |
||||
| 5.970% due 08/25/33 |
175 | 175 | ||
| Series 2004-SEA Class A2A |
||||
| 5.610% due 03/25/34 |
83 | 83 | ||
| Home Equity Asset Trust (Ê) |
||||
| Series 2005-2 Class 2A2 |
||||
| 5.520% due 07/25/35 |
41 | 41 | ||
| HSI Asset Securitization Corp. Trust (Ê) |
||||
| Series 2006-HE2 Class 2A1 |
||||
| 5.370% due 12/25/36 |
84 | 84 | ||
| Indymac Residential Asset Backed Trust (Ê) |
||||
| Series 2006-H2 Class A |
||||
| 5.470% due 06/28/36 |
476 | 476 | ||
| Lehman XS Trust (Ê) |
||||
| Series 2005-1 Class 2A2 |
||||
| 4.660% due 07/25/35 |
134 | 136 | ||
| Series 2006-16N Class A1A |
||||
| 5.400% due 11/25/46 |
232 | 232 | ||
| Series 2007-4N Class 3A2A |
||||
| 5.777% due 04/25/37 |
959 | 959 | ||
| Long Beach Mortgage Loan Trust (Ê) |
||||
| Series 2004-4 Class 1A1 |
||||
| 5.600% due 10/25/34 |
18 | 18 | ||
| Series 2006-9 Class 2A1 |
||||
| 5.380% due 10/25/36 |
738 | 738 | ||
| Mastr Asset Backed Securities Trust (Ê) |
||||
| Series 2003-WMC Class M2 |
||||
| 7.795% due 08/25/33 |
57 | 57 | ||
| Morgan Stanley ABS Capital I (Ê) |
||||
| Series 2003-NC8 Class M3 |
||||
| 7.420% due 09/25/33 |
42 | 42 | ||
| Series 2006-HE7 Class A2A |
||||
| 5.370% due 09/25/36 |
704 | 704 | ||
| Morgan Stanley Mortgage Loan Trust |
||||
| Series 2006-12X Class A6A |
||||
| 5.726% due 10/25/36 |
145 | 142 |
Core Bond Fund 41
Table of Contents
Russell Investment Funds
Core Bond Fund
Schedule of Investments, continued—June 30, 2007 (Unaudited)
Amounts in thousands (except share amounts)
| Principal Amount ($) or Shares |
Market Value $ | |||
| New Century Home Equity Loan Trust (Ê) |
||||
| Series 2004-4 Class M2 |
||||
| 5.850% due 02/25/35 |
215 | 216 | ||
| NWA Trust |
||||
| Series 1995-2 Class A |
||||
| 9.250% due 06/21/14 |
185 | 190 | ||
| Option One Mortgage Loan Trust (Ê) |
||||
| Series 2003-2 Class M2 |
||||
| 7.020% due 04/25/33 |
54 | 55 | ||
| Series 2003-3 Class M3 |
||||
| 7.320% due 06/25/33 |
39 | 39 | ||
| Series 2003-4 Class M2 |
||||
| 6.970% due 07/25/33 |
36 | 36 | ||
| Park Place Securities, Inc. (Ê) |
||||
| Series 2005-WCW Class M1 |
||||
| 5.770% due 09/25/35 |
210 | 210 | ||
| Parker Hannifin Employee Stock Ownership Trust (Â) |
||||
| 6.340% due 07/15/08 |
84 | 84 | ||
| Popular ABS Mortgage Pass-Through Trust |
||||
| Series 2005-6 Class A3 |
||||
| 5.680% due 01/25/36 |
230 | 229 | ||
| Renaissance Home Equity Loan Trust |
||||
| Series 2005-1 Class M1 |
||||
| 5.357% due 05/25/35 |
80 | 78 | ||
| Series 2005-2 Class AF4 |
||||
| 4.934% due 08/25/35 |
85 | 83 | ||
| Series 2006-1 Class AF6 |
||||
| 5.746% due 05/25/36 |
175 | 171 | ||
| Residential Asset Mortgage Products, Inc. |
||||
| Series 2003-RS1 Class AI6A |
||||
| 5.980% due 12/25/33 |
205 | 203 | ||
| Series 2006-RZ4 Class A1A (Ê) |
||||
| 5.400% due 10/25/36 |
915 | 915 | ||
| Residential Asset Securities Corp. |
||||
| Series 2003-KS1 Class M2 (Ê) |
||||
| 7.945% due 01/25/33 |
22 | 21 | ||
| Series 2003-KS2 Class MI1 |
||||
| 4.800% due 04/25/33 |
450 | 438 | ||
| Series 2003-KS2 Class MI3 |
||||
| 6.100% due 04/25/33 |
131 | 124 | ||
| Series 2006-KS9 Class AI1 (Ê) |
||||
| 5.390% due 11/25/36 |
230 | 230 | ||
| Series 2007-KS2 Class AI1 (Ê) |
||||
| 5.390% due 02/25/37 |
459 | 459 | ||
| SBI Heloc Trust (Ê)(þ) |
||||
| Series 2006-1A Class 1A2A |
||||
| 5.490% due 08/25/36 |
146 | 146 | ||
| SLM Student Loan Trust (Ê) |
||||
| Series 2006-9 Class A1 |
||||
| 5.325% due 10/25/12 |
311 | 311 | ||
| Series 2007-3 Class A1 |
||||
| 5.345% due 10/27/14 |
1,066 | 1,067 | ||
| Small Business Administration |
||||
| Series 2000-P10 Class 1 |
||||
| 7.449% due 08/01/10 |
8 | 8 | ||
| Soundview Home Equity Loan Trust |
||||
| Series 2006-WF1 Class A2 |
||||
| 5.645% due 10/25/36 |
290 | 289 | ||
| Structured Asset Investment Loan Trust (Ê) |
||||
| Series 2005-3 Class M2 |
||||
| 5.760% due 04/25/35 |
120 | 120 | ||
| Structured Asset Securities Corp. |
||||
| Series 2004-19X Class A2 |
||||
| 4.370% due 10/25/34 |
191 | 189 | ||
| Series 2006-BC3 Class A2 (Ê) |
||||
| 5.370% due 10/25/36 |
222 | 222 | ||
| VTB 24 Capital PLC (Ê) |
||||
| 6.180% due 12/07/09 |
100 | 101 | ||
| Wells Fargo Home Equity Trust (Ê)(þ) |
||||
| Series 2005-4 Class AI1 |
||||
| 5.440% due 12/25/35 |
161 | 161 | ||
| 14,094 | ||||
| Certificates of Deposit—1.0% |
||||
| BNP Paribas |
||||
| 5.270% due 09/23/08 |
600 | 599 | ||
| Calyon NY |
||||
| 5.330% due 01/16/09 |
300 | 300 | ||
| Dexia Credit SA |
||||
| 5.270% due 09/29/08 |
1,100 | 1,099 | ||
| Fortis Bank |
||||
| 5.300% due 09/30/08 |
300 | 300 | ||
| Nordea Bank Finland PLC |
||||
| 5.298% due 04/09/09 |
400 | 400 | ||
| Skandinaviska Enskilda Banken |
||||
| 5.340% due 08/21/08 |
400 | 400 | ||
| 3,098 | ||||
| Corporate Bonds and Notes—16.4% |
||||
| Abbey National Treasury Services |
||||
| PLC (Ê) |
||||
| Series YCD |
||||
| 5.270% due 07/02/08 |
500 | 500 | ||
| Abbott Laboratories |
||||
| 5.600% due 05/15/11 |
215 | 216 | ||
| 5.875% due 05/15/16 |
80 | 80 |
42 Core Bond Fund
Table of Contents
Russell Investment Funds
Core Bond Fund
Schedule of Investments, continued—June 30, 2007 (Unaudited)
Amounts in thousands (except share amounts)
| Principal Amount ($) or Shares |
Market Value $ | |||
| Ace Capital Trust II (Ñ) |
||||
| 9.700% due 04/01/30 |
175 | 226 | ||
| Alamosa Delaware, Inc. |
||||
| 8.500% due 01/31/12 |
100 | 105 | ||
| Alion Science and Technology Corp. |
||||
| 10.250% due 02/01/15 |
125 | 129 | ||
| Allied Waste North America, Inc. |
||||
| Series B |
||||
| 7.125% due 05/15/16 |
90 | 88 | ||
| Altria Group, Inc. |
||||
| 7.750% due 01/15/27 |
25 | 29 | ||
| AmerenUE |
||||
| 6.400% due 06/15/17 |
190 | 194 | ||
| American Casino & Entertainment Properties LLC |
||||
| 7.850% due 02/01/12 |
115 | 118 | ||
| American Electric Power Co., Inc. |
||||
| Series C |
||||
| 5.375% due 03/15/10 |
35 | 35 | ||
| American Express Bank (Ê) |
||||
| Series BKNT |
||||
| 5.330% due 10/16/08 |
300 | 300 | ||
| American General Finance Corp. |
||||
| 4.875% due 05/15/10 |
225 | 221 | ||
| American International Group, Inc. |
||||
| 4.700% due 10/01/10 |
130 | 127 | ||
| 5.375% due 10/18/11 (Ñ) |
170 | 169 | ||
| 5.050% due 10/01/15 |
210 | 200 | ||
| 6.250% due 03/15/37 |
150 | 142 | ||
| Americo Life, Inc. (þ) |
||||
| 7.875% due 05/01/13 |
75 | 76 | ||
| AMFM, Inc. |
||||
| 8.000% due 11/01/08 |
50 | 51 | ||
| Amkor Technology, Inc. |
||||
| 7.750% due 05/15/13 |
175 | 168 | ||
| Anadarko Petroleum Corp. |
||||
| 5.950% due 09/15/16 |
305 | 298 | ||
| ANZ Capital Trust (ƒ)(þ) |
||||
| 4.484% due 12/31/49 |
225 | 218 | ||
| Arizona Public Service Co. |
||||
| 5.800% due 06/30/14 |
100 | 99 | ||
| 6.250% due 08/01/16 |
150 | 151 | ||
| AT&T Mobility LLC |
||||
| 6.500% due 12/15/11 |
170 | 176 | ||
| AT&T, Inc. |
||||
| 5.100% due 09/15/14 |
45 | 43 | ||
| Atmos Energy Corp. |
||||
| 6.350% due 06/15/17 |
65 | 66 | ||
| BAE Systems Holdings, Inc. (þ) |
||||
| 6.400% due 12/15/11 |
395 | 406 | ||
| Bank of America Corp. |
||||
| 5.875% due 02/15/09 (Ñ) |
80 | 81 | ||
| 5.360% due 06/19/09 (Ê) |
900 | 901 | ||
| 5.366% due 11/06/09 (Ê) |
100 | 100 | ||
| 5.625% due 10/14/16 |
40 | 39 | ||
| Bank of America NA (Ê) |
||||
| Series BKNT |
||||
| 5.360% due 06/12/09 |
700 | 700 | ||
| Bank of New York Co., Inc. (The) |
||||
| 5.125% due 11/01/11 |
190 | 187 | ||
| BellSouth Corp. |
||||
| 6.550% due 06/15/34 |
35 | 35 | ||
| Bellsouth Telecommunications, Inc. (Ñ) |
||||
| 7.000% due 12/01/95 |
210 | 208 | ||
| BNP Paribas Capital Trust (ƒ)(Å) |
||||
| 9.003% due 12/29/49 |
450 | 493 | ||
| Boardwalk Pipelines, LP |
||||
| 5.875% due 11/15/16 |
225 | 219 | ||
| Boeing Capital Corp., Ltd. (Ñ) |
||||
| 6.100% due 03/01/11 |
50 | 51 | ||
| Boston Scientific Corp. |
||||
| 6.400% due 06/15/16 |
255 | 248 | ||
| Burlington Northern Santa Fe Corp. |
||||
| 5.650% due 05/01/17 |
75 | 73 | ||
| 6.875% due 12/01/27 (Ñ) |
25 | 26 | ||
| 6.750% due 03/15/29 |
10 | 10 | ||
| California Steel Industries, Inc. |
||||
| 6.125% due 03/15/14 |
275 | 256 | ||
| Caterpillar Financial Services Corp. (Ê) |
||||
| 5.420% due 05/18/09 |
1,100 | 1,101 | ||
| Catlin Insurance Co., Ltd. (ƒ)(Å) |
||||
| 7.249% due 12/31/49 |
100 | 95 | ||
| CCH I Holdings LLC/CCH I Holdings Capital Corp. |
||||
| 11.000% due 10/01/15 |
85 | 89 | ||
| CDRV Investors, Inc. |
||||
| (Step Up, 9.625% 01/01/10) |
||||
| Zero Coupon due 01/01/15 |
155 | 141 | ||
| CenterPoint Energy Houston Electric LLC |
||||
| Series J2 |
||||
| 5.700% due 03/15/13 |
110 | 109 | ||
| CenterPoint Energy Resources Corp. |
||||
| Series B |
||||
| 7.875% due 04/01/13 |
165 | 180 | ||
| Chubb Corp. |
||||
| 6.000% due 05/11/37 |
75 | 71 | ||
| 6.375% due 03/29/67 (Ñ) |
175 | 171 |
Core Bond Fund 43
Table of Contents
Russell Investment Funds
Core Bond Fund
Schedule of Investments, continued—June 30, 2007 (Unaudited)
Amounts in thousands (except share amounts)
| Principal Amount ($) or Shares |
Market Value $ | |||
| Cingular Wireless Services, Inc. |
||||
| 7.875% due 03/01/11 (Ñ) |
150 | 161 | ||
| 8.750% due 03/01/31 |
85 | 106 | ||
| CIT Group, Inc. |
||||
| 6.875% due 11/01/09 |
45 | 46 | ||
| Citigroup Funding, Inc. (Ê) |
||||
| 5.330% due 12/08/08 |
100 | 100 | ||
| 5.320% due 04/23/09 |
100 | 100 | ||
| 5.360% due 06/26/09 |
200 | 200 | ||
| Citigroup Global Markets Holdings, Inc. (Ê) |
||||
| Series MTNA |
||||
| 5.460% due 03/17/09 |
200 | 200 | ||
| Citigroup, Inc. |
||||
| 5.395% due 01/30/09 (Ê) |
200 | 200 | ||
| 5.380% due 12/28/09 (Ê) |
400 | 400 | ||
| 6.500% due 01/18/11 (Ñ) |
205 | 211 | ||
| 4.700% due 05/29/15 |
50 | 47 | ||
| 5.850% due 08/02/16 |
55 | 55 | ||
| 6.125% due 08/25/36 |
300 | 295 | ||
| Clorox Co. (Ñ) |
||||
| 4.200% due 01/15/10 |
100 | 97 | ||
| CNA Financial Corp. |
||||
| 6.500% due 08/15/16 |
125 | 126 | ||
| Columbus Southern Power Co. Series C |
||||
| 5.500% due 03/01/13 |
10 | 10 | ||
| Comcast Cable Communications Holdings, Inc. |
||||
| 9.455% due 11/15/22 |
125 | 159 | ||
| Comcast Cable Holdings LLC |
||||
| 9.800% due 02/01/12 (Ñ) |
180 | 208 | ||
| 7.875% due 08/01/13 |
305 | 334 | ||
| Comcast Corp. |
||||
| 5.900% due 03/15/16 |
45 | 44 | ||
| Commonwealth Edison Co. |
||||
| 6.950% due 07/15/18 |
50 | 50 | ||
| Series 105 |
||||
| 5.400% due 12/15/11 |
125 | 122 | ||
| Community Health Systems, Inc. (þ) |
||||
| 8.875% due 07/15/15 |
105 | 106 | ||
| Consolidated Natural Gas Co. |
||||
| 6.850% due 04/15/11 |
150 | 158 | ||
| COX Communications, Inc. |
||||
| 4.625% due 01/15/10 (Ñ) |
350 | 342 | ||
| 5.875% due 12/01/16 (þ) |
75 | 73 | ||
| Credit Suisse First Boston USA, Inc. |
||||
| 4.875% due 08/15/10 (Ñ) |
65 | 64 | ||
| 6.500% due 01/15/12 |
25 | 26 | ||
| 5.500% due 08/15/13 (Ñ) |
45 | 45 | ||
| 4.875% due 01/15/15 |
55 | 52 | ||
| Credit Suisse USA, Inc. (Ñ) |
||||
| 5.250% due 03/02/11 |
55 | 55 | ||
| Crescent Real Estate Equities, LP |
||||
| 9.250% due 04/15/09 |
40 | 41 | ||
| CSC Holdings, Inc. |
||||
| 6.750% due 04/15/12 |
90 | 86 | ||
| CVS Caremark Corp. |
||||
| 5.750% due 08/15/11 |
125 | 125 | ||
| 5.750% due 06/01/17 |
180 | 174 | ||
| DaimlerChrysler NA Holding Corp. (Ê) |
||||
| 5.690% due 03/13/09 |
400 | 400 | ||
| 5.770% due 03/13/09 |
300 | 301 | ||
| 6.500% due 11/15/13 |
145 | 150 | ||
| DCP Midstream, LP (Ñ) |
||||
| 6.875% due 02/01/11 |
20 | 21 | ||
| Detroit Edison Co. (The) |
||||
| 6.350% due 10/15/32 |
50 | 50 | ||
| Devon Financing Corp. ULC |
||||
| 7.875% due 09/30/31 |
45 | 52 | ||
| Dex Media East Finance Co. (Ñ) |
||||
| 12.125% due 11/15/12 |
50 | 54 | ||
| Dominion Resources, Inc. |
||||
| Series A |
||||
| 5.200% due 01/15/16 |
195 | 185 | ||
| Series B |
||||
| 6.250% due 06/30/12 |
110 | 114 | ||
| Dow Chemical Co. (The) |
||||
| 6.000% due 10/01/12 |
60 | 61 | ||
| DPL, Inc. |
||||
| 6.875% due 09/01/11 |
148 | 154 | ||
| El Paso Corp. |
||||
| 8.050% due 10/15/30 |
200 | 210 | ||
| Eli Lilly & Co. |
||||
| 5.200% due 03/15/17 |
235 | 225 | ||
| Energy Transfer Partners, LP |
||||
| 5.950% due 02/01/15 |
200 | 197 | ||
| Enterprise Products Operating, LP |
||||
| 4.950% due 06/01/10 |
125 | 123 | ||
| 8.375% due 08/01/66 |
100 | 107 | ||
| FedEx Corp. (Ñ) |
||||
| 7.600% due 07/01/97 |
75 | 84 | ||
| Financing Corp. |
||||
| Principal Only STRIP |
||||
| Series 2P |
||||
| Zero coupon due 11/30/17 |
60 | 34 | ||
| Series 6P |
||||
| Zero coupon due 08/03/18 |
300 | 165 | ||
| Series 10P |
||||
| Zero coupon due 11/30/17 |
510 | 292 |
44 Core Bond Fund
Table of Contents
Russell Investment Funds
Core Bond Fund
Schedule of Investments, continued—June 30, 2007 (Unaudited)
Amounts in thousands (except share amounts)
| Principal Amount ($) or Shares |
Market Value $ | |||
| Series 15P |
||||
| Zero coupon due 03/07/19 |
70 | 37 | ||
| FirstEnergy Corp. |
||||
| Series B |
||||
| 6.450% due 11/15/11 |
280 | 287 | ||
| Series C |
||||
| 7.375% due 11/15/31 |
125 | 135 | ||
| Ford Motor Credit Co. LLC |
||||
| 7.875% due 06/15/10 |
200 | 200 | ||
| Freeport-McMoRan Copper & Gold, Inc. |
||||
| 8.375% due 04/01/17 |
305 | 326 | ||
| General Electric Capital Corp. |
||||
| 5.428% due 01/20/10 (Ê) |
200 | 200 | ||
| 5.500% due 04/28/11 (Ñ) |
220 | 220 | ||
| Series MTN (Ê) |
||||
| 5.385% due 10/26/09 |
500 | 500 | ||
| Series MTNA |
||||
| 5.455% due 07/28/08 (Ê)(Ñ) |
700 | 701 | ||
| 5.450% due 01/15/13 |
260 | 257 | ||
| General Electric Co. (Ê) |
||||
| 5.400% due 12/09/08 |
200 | 200 | ||
| Goldman Sachs Group, Inc. (The) |
||||
| 5.400% due 12/23/08 (Ê) |
600 | 600 | ||
| 5.400% due 03/30/09 (Ê) |
400 | 400 | ||
| 6.875% due 01/15/11 |
505 | 525 | ||
| 5.350% due 01/15/16 (Ñ) |
355 | 339 | ||
| 5.625% due 01/15/17 |
125 | 120 | ||
| Series MTNB (Ê) |
||||
| 5.450% due 12/22/08 |
300 | 300 | ||
| Harrah’s Operating Co., Inc. |
||||
| 5.500% due 07/01/10 |
125 | 121 | ||
| Hawaiian Telcom Communications, Inc. (Ê)(Ñ) |
||||
| Series B |
||||
| 10.860% due 05/01/13 |
175 | 179 | ||
| HCA, Inc. (þ) |
||||
| 9.125% due 11/15/14 |
125 | 131 | ||
| Health Care Property Investors, Inc. (Ñ) |
||||
| 5.950% due 09/15/11 |
300 | 300 | ||
| Historic TW, Inc. |
||||
| 8.050% due 01/15/16 |
195 | 216 | ||
| Home Depot, Inc. |
||||
| 5.400% due 03/01/16 |
35 | 33 | ||
| HSBC Finance Corp. |
||||
| 5.415% due 10/21/09 (Ê) |
100 | 100 | ||
| 5.435% due 03/12/10 (Ê) |
300 | 300 | ||
| 5.607% due 05/10/10 (Ê) |
100 | 100 | ||
| 6.375% due 11/27/12 (Ñ) |
185 | 190 | ||
| 5.000% due 06/30/15 |
110 | 103 | ||
| Idearc, Inc. |
||||
| 8.000% due 11/15/16 |
125 | 126 | ||
| International Business Machines Corp. |
||||
| 7.125% due 12/01/96 |
180 | 199 | ||
| International Lease Finance Corp. |
||||
| 5.750% due 06/15/11 |
80 | 80 | ||
| 5.625% due 09/20/13 |
80 | 80 | ||
| International Paper Co. |
||||
| 5.850% due 10/30/12 |
510 | 509 | ||
| International Steel Group, Inc. (Ñ) |
||||
| 6.500% due 04/15/14 |
180 | 184 | ||
| iPCS, Inc. (Ê)(þ) |
||||
| 7.480% due 05/01/13 |
35 | 35 | ||
| iStar Financial, Inc. |
||||
| Series B |
||||
| 5.125% due 04/01/11 |
200 | 196 | ||
| Jersey Central Power & Light Co. |
||||
| 5.625% due 05/01/16 |
90 | 88 | ||
| JP Morgan Chase Bank |
||||
| Series EMTN |
||||
| 6.000% due 05/22/45 |
1,819 | 1,583 | ||
| JPMorgan Chase & Co. |
||||
| 5.600% due 06/01/11 |
65 | 65 | ||
| JPMorgan Chase Bank NA |
||||
| Series BKNT |
||||
| 5.875% due 06/13/16 |
200 | 200 | ||
| Kellogg Co. |
||||
| Series B |
||||
| 6.600% due 04/01/11 |
395 | 408 | ||
| Kerr-McGee Corp. |
||||
| 6.950% due 07/01/24 |
125 | 130 | ||
| KeySpan Corp. |
||||
| 7.625% due 11/15/10 |
150 | 159 | ||
| Kraft Foods, Inc. |
||||
| 5.625% due 11/01/11 |
495 | 491 | ||
| Kroger Co. (The) (Ñ) |
||||
| 8.000% due 09/15/29 |
15 | 16 | ||
| 7.500% due 04/01/31 |
25 | 26 | ||
| Lehman Brothers Holdings, Inc. |
||||
| 5.445% due 01/23/09 (Ê) |
600 | 600 | ||
| 5.440% due 04/03/09 (Ê) |
400 | 400 | ||
| 5.500% due 05/25/10 (Ê) |
200 | 200 | ||
| 5.250% due 02/06/12 |
85 | 84 | ||
| 5.500% due 04/04/16 (Ñ) |
85 | 83 | ||
| Level 3 Communications, Inc. |
||||
| 6.000% due 09/15/09 |
60 | 58 | ||
| Level 3 Financing, Inc. |
||||
| 12.250% due 03/15/13 |
85 | 98 | ||
| M&T Bank Corp. |
||||
| 5.375% due 05/24/12 |
215 | 213 |
Core Bond Fund 45
Table of Contents
Russell Investment Funds
Core Bond Fund
Schedule of Investments, continued—June 30, 2007 (Unaudited)
Amounts in thousands (except share amounts)
| Principal Amount ($) or Shares |
Market Value $ | |||
| Mandalay Resort Group |
||||
| 6.500% due 07/31/09 |
90 | 90 | ||
| Manufacturers & Traders Trust Co. |
||||
| 5.585% due 12/28/20 |
84 | 81 | ||
| Merrill Lynch & Co., Inc. |
||||
| 5.440% due 12/04/09 (Ê)(Ñ) |
200 | 200 | ||
| 6.050% due 05/16/16 |
130 | 129 | ||
| Series MTN (Ê) |
||||
| 5.406% due 05/08/09 |
900 | 900 | ||
| Series MTNC |
||||
| 4.250% due 02/08/10 |
185 | 180 | ||
| MetLife, Inc. |
||||
| 6.400% due 12/15/36 |
100 | 93 | ||
| Metropolitan Life Global Funding I (Ê)(þ) |
||||
| 5.400% due 05/17/10 |
400 | 400 | ||
| MGM Mirage |
||||
| 6.750% due 09/01/12 |
215 | 205 | ||
| Midamerican Energy Holdings Co. (Ñ) |
||||
| 6.125% due 04/01/36 |
325 | 314 | ||
| Miller Brewing Co. (þ) |
||||
| 5.500% due 08/15/13 |
110 | 108 | ||
| Monumental Global Funding II (þ) |
||||
| 4.625% due 03/15/10 |
95 | 93 | ||
| Morgan Stanley |
||||
| 5.406% due 05/07/09 (Ê) |
300 | 300 | ||
| 5.375% due 10/15/15 |
125 | 120 | ||
| Series GMTN (Ê) |
||||
| 5.467% due 02/09/09 |
500 | 501 | ||
| Series MTN (Ê) |
||||
| 5.446% due 01/15/10 |
300 | 300 | ||
| Natexis Ambs Co. LLC (ƒ)(þ) |
||||
| 8.440% due 12/29/49 |
120 | 123 | ||
| National Rural Utilities Cooperative Finance Corp. |
||||
| 5.750% due 08/28/09 |
45 | 45 | ||
| NCO Group, Inc. (Ê)(þ) |
||||
| 10.230% due 11/15/13 |
120 | 120 | ||
| Neff Corp. (þ) |
||||
| 10.000% due 06/01/15 |
205 | 204 | ||
| Nelnet, Inc. |
||||
| 7.400% due 09/29/36 |
125 | 125 | ||
| Nevada Power Co. Series L |
||||
| 5.875% due 01/15/15 |
100 | 98 | ||
| News America Holdings, Inc. |
||||
| 7.750% due 12/01/45 |
75 | 82 | ||
| 7.900% due 12/01/95 |
90 | 98 | ||
| 8.250% due 10/17/96 |
20 | 23 | ||
| Nisource Finance Corp. |
||||
| 7.875% due 11/15/10 |
125 | 133 | ||
| Norfolk Southern Corp. |
||||
| 7.700% due 05/15/17 |
20 | 22 | ||
| 7.050% due 05/01/37 |
40 | 42 | ||
| 7.900% due 05/15/97 |
370 | 417 | ||
| 6.000% due 03/15/05 |
125 | 106 | ||
| NRG Energy, Inc. |
||||
| 7.375% due 01/15/17 |
125 | 125 | ||
| Ohio Power Co. Series F |
||||
| 5.500% due 02/15/13 |
20 | 20 | ||
| ONEOK Partners, LP |
||||
| 6.650% due 10/01/36 |
100 | 99 | ||
| Pacific Gas & Electric Co. |
||||
| 4.200% due 03/01/11 |
60 | 57 | ||
| 6.050% due 03/01/34 (Ñ) |
95 | 92 | ||
| PAETEC Holding Corp. (þ) |
||||
| 9.500% due 07/15/15 |
150 | 152 | ||
| PartnerRe Finance II |
||||
| 6.440% due 12/01/66 |
50 | 47 | ||
| Peabody Energy Corp. (Ñ) |
||||
| 7.875% due 11/01/26 |
100 | 104 | ||
| Pemex Project Funding Master Trust |
||||
| 5.750% due 12/15/15 |
100 | 98 | ||
| Phoenix Life Insurance Co. (þ) |
||||
| 7.150% due 12/15/34 |
150 | 154 | ||
| Popular North America, Inc. Series MTNE |
||||
| 3.875% due 10/01/08 |
275 | 270 | ||
| Progress Energy, Inc. |
||||
| 7.100% due 03/01/11 |
47 | 49 | ||
| 5.625% due 01/15/16 |
40 | 39 | ||
| 7.000% due 10/30/31 |
90 | 96 | ||
| Qwest Corp. |
||||
| 7.625% due 06/15/15 |
200 | 207 | ||
| Raytheon Co. |
||||
| 6.750% due 03/15/18 |
75 | 80 | ||
| RBS Capital Trust III (ƒ) |
||||
| 5.512% due 09/29/49 |
200 | 192 | ||
| Realogy Corp. (Ñ)(þ) |
||||
| 12.375% due 04/15/15 |
230 | 210 | ||
| Reckson Operating Partnership, LP |
||||
| 7.750% due 03/15/09 |
25 | 26 | ||
| 5.150% due 01/15/11 |
92 | 90 | ||
| Reinsurance Group of America, Inc. |
||||
| 6.750% due 12/15/65 |
75 | 73 | ||
| Reliant Energy, Inc. |
||||
| 6.750% due 12/15/14 |
350 | 357 | ||
| Residential Capital LLC |
||||
| 6.375% due 06/30/10 |
225 | 222 | ||
| 6.000% due 02/22/11 |
190 | 184 |
46 Core Bond Fund
Table of Contents
Russell Investment Funds
Core Bond Fund
Schedule of Investments, continued—June 30, 2007 (Unaudited)
Amounts in thousands (except share amounts)
| Principal Amount ($) or Shares |
Market Value $ | |||
| RH Donnelley, Inc. |
||||
| 10.875% due 12/15/12 |
205 | 219 | ||
| Rural Cellular Corp. |
||||
| 8.250% due 03/15/12 |
235 | 240 | ||
| Safeway, Inc. (Ñ) |
||||
| 7.250% due 02/01/31 |
20 | 21 | ||
| SB Treasury Co. LLC (ƒ)(Å) |
||||
| (Step Up, 10.295%, 06/30/08) |
||||
| 9.400% due 12/29/49 |
350 | 362 | ||
| SBC Communications, Inc. (Ñ) |
||||
| 6.150% due 09/15/34 |
75 | 72 | ||
| Schering-Plough Corp. |
||||
| 5.300% due 12/01/13 |
110 | 110 | ||
| Simon Property Group, LP |
||||
| 5.600% due 09/01/11 |
200 | 200 | ||
| Spansion, Inc. (Ñ)(þ) |
||||
| 11.250% due 01/15/16 |
175 | 180 | ||
| Sprint Capital Corp. |
||||
| 7.625% due 01/30/11 |
350 | 368 | ||
| 8.750% due 03/15/32 |
70 | 79 | ||
| Sprint Nextel Corp. |
||||
| 6.000% due 12/01/16 |
170 | 161 | ||
| State Street Bank & Trust Co. |
||||
| Series BKNT |
||||
| 5.300% due 01/15/16 |
80 | 78 | ||
| Swiss Re Capital I, LP (ƒ)(Ñ)(þ) |
||||
| 6.854% due 05/29/49 |
225 | 226 | ||
| Symetra Financial Corp. (þ) |
||||
| 6.125% due 04/01/16 |
150 | 148 | ||
| Time Warner Cable, Inc. (þ) |
||||
| 5.400% due 07/02/12 |
330 | 324 | ||
| 6.550% due 05/01/37 |
100 | 97 | ||
| Time Warner, Inc. |
||||
| 5.875% due 11/15/16 |
400 | 389 | ||
| Travelers Cos., Inc. (The) |
||||
| 6.250% due 06/15/37 |
85 | 82 | ||
| Triad Hospitals, Inc. |
||||
| 7.000% due 05/15/12 |
60 | 63 | ||
| 7.000% due 11/15/13 |
130 | 137 | ||
| Trump Entertainment Resorts, Inc. |
||||
| 8.500% due 06/01/15 |
295 | 293 | ||
| TXU Electric Delivery Co. (Ê)(þ) |
||||
| 5.735% due 09/16/08 |
400 | 406 | ||
| Union Pacific Corp. |
||||
| 6.125% due 01/15/12 |
120 | 122 | ||
| Union Planters Corp. |
||||
| 7.750% due 03/01/11 |
50 | 54 | ||
| United States Steel Corp. |
||||
| 5.650% due 06/01/13 |
90 | 89 | ||
| 6.050% due 06/01/17 |
95 | 93 | ||
| 6.650% due 06/01/37 |
40 | 39 | ||
| UnitedHealth Group, Inc. |
||||
| 5.250% due 03/15/11 |
75 | 74 | ||
| 6.000% due 06/15/17 (þ) |
35 | 35 | ||
| 6.500% due 06/15/37 (þ) |
45 | 45 | ||
| Valero Energy Corp. |
||||
| 6.125% due 06/15/17 |
85 | 85 | ||
| Verizon Communications, Inc. |
||||
| 5.399% due 04/03/09 (Ê) |
500 | 500 | ||
| 5.850% due 09/15/35 |
180 | 165 | ||
| Verizon Global Funding Corp. |
||||
| 7.250% due 12/01/10 |
150 | 158 | ||
| 6.875% due 06/15/12 |
805 | 848 | ||
| Wachovia Capital Trust III (ƒ) |
||||
| 5.800% due 03/15/42 |
125 | 124 | ||
| Wachovia Corp. (Ñ) |
||||
| 5.625% due 10/15/16 |
100 | 97 | ||
| 5.750% due 06/15/17 |
155 | 153 | ||
| Wells Fargo & Co. |
||||
| 4.950% due 10/16/13 |
65 | 63 | ||
| Wells Fargo Bank NA (Ñ) |
||||
| 5.750% due 05/16/16 |
80 | 80 | ||
| Windstream Corp. |
||||
| 8.625% due 08/01/16 |
125 | 132 | ||
| World Savings Bank FSB (Ê) |
||||
| Series BKNT |
||||
| 5.396% due 05/08/09 |
1,000 | 1,000 | ||
| Wyeth |
||||
| 6.950% due 03/15/11 |
360 | 377 | ||
| 5.500% due 03/15/13 |
60 | 59 | ||
| 5.950% due 04/01/37 |
130 | 124 | ||
| Xerox Corp. |
||||
| 5.500% due 05/15/12 |
185 | 181 | ||
| 48,890 | ||||
| International Debt—5.8% |
||||
| Abbey National PLC (ƒ) |
||||
| (Step Up, 7.570%, 06/15/08) |
||||
| 6.700% due 06/29/49 |
150 | 151 | ||
| Altos Hornos de Mexico SA de CV (Ø) |
||||
| Series A |
||||
| 11.375% due 04/30/49 |
255 | 193 | ||
| America Movil SAB de CV (Ñ) |
||||
| 5.500% due 03/01/14 |
100 | 98 | ||
| Aspen Insurance Holdings, Ltd. |
||||
| 6.000% due 08/15/14 |
50 | 48 | ||
| AXA SA |
||||
| 8.600% due 12/15/30 |
35 | 43 | ||
| 6.379% due 12/14/49 (ƒ)(þ) |
100 | 91 | ||
| 6.463% due 12/31/49 (ƒ)(þ) |
100 | 94 |
Core Bond Fund 47
Table of Contents
Russell Investment Funds
Core Bond Fund
Schedule of Investments, continued—June 30, 2007 (Unaudited)
Amounts in thousands (except share amounts)
| Principal Amount ($) or Shares |
Market Value $ | |||
| BNP Paribas (ƒ)(þ) |
||||
| 5.186% due 06/29/49 |
300 | 280 | ||
| British Telecommunications PLC |
||||
| 8.625% due 12/15/30 |
150 | 196 | ||
| Canadian Natural Resources, Ltd. |
||||
| 6.000% due 08/15/16 |
10 | 10 | ||
| 5.700% due 05/15/17 |
75 | 73 | ||
| 5.850% due 02/01/35 (Ñ) |
25 | 23 | ||
| 6.500% due 02/15/37 (Ñ) |
200 | 196 | ||
| 6.250% due 03/15/38 |
50 | 47 | ||
| Canadian Pacific Railway Co. (Ñ) |
||||
| 5.950% due 05/15/37 |
65 | 61 | ||
| CIT Group Funding Co. of Canada (Ñ) |
||||
| 5.600% due 11/02/11 |
80 | 79 | ||
| Citigroup Global Markets Deutschland |
||||
| AG for OAO Gazprom |
||||
| 10.500% due 10/21/09 |
200 | 220 | ||
| Conoco Funding Co. |
||||
| 6.350% due 10/15/11 |
415 | 428 | ||
| Cosan Finance, Ltd. (þ) |
||||
| 7.000% due 02/01/17 |
160 | 155 | ||
| Deutsche Telekom International Finance BV |
||||
| 5.540% due 03/23/09 (Ê) |
300 | 301 | ||
| 8.000% due 06/15/10 |
60 | 64 | ||
| 5.375% due 03/23/11 |
75 | 74 | ||
| 8.250% due 06/15/30 (Ñ) |
155 | 186 | ||
| DNB Nor Bank ASA (Ê)(þ) |
||||
| 5.425% due 10/13/09 |
1,000 | 1,000 | ||
| Egypt Government AID Bonds |
||||
| 4.450% due 09/15/15 |
295 | 277 | ||
| Endurance Specialty Holdings, Ltd. (Ñ) |
||||
| 6.150% due 10/15/15 |
100 | 97 | ||
| Export-Import Bank of China (þ) |
||||
| 4.875% due 07/21/15 |
110 | 104 | ||
| Export-Import Bank of Korea |
||||
| 4.125% due 02/10/09 (þ) |
120 | 117 | ||
| 5.125% due 02/14/11 |
100 | 98 | ||
| Falconbridge, Ltd. |
||||
| 7.250% due 07/15/12 |
50 | 53 | ||
| 6.000% due 10/15/15 |
225 | 225 | ||
| Federative Republic of Brazil |
||||
| 6.000% due 01/17/17 (Ñ) |
160 | 157 | ||
| 10.250% due 01/10/28 |
875 | 506 | ||
| FMG Finance Pty, Ltd. (þ) |
||||
| 10.625% due 09/01/16 |
450 | 536 | ||
| Gaz Capital for Gazprom (þ) |
||||
| 6.212% due 11/22/16 |
115 | 112 | ||
| Gazinvest Luxembourg SA for Gazprombank |
||||
| 7.250% due 10/30/08 |
160 | 163 | ||
| HBOS Treasury Services PLC (Ê)( Ñ)(þ) |
||||
| Series MTN |
||||
| 5.397% due 07/17/09 |
300 | 300 | ||
| HSBC Holdings PLC |
||||
| 6.500% due 05/02/36 |
145 | 149 | ||
| Inco, Ltd. |
||||
| 5.700% due 10/15/15 |
175 | 170 | ||
| Intelsat Bermuda, Ltd. |
||||
| 8.872% due 01/15/15 (Ê) |
195 | 199 | ||
| 11.250% due 06/15/16 |
170 | 190 | ||
| Ispat Inland ULC |
||||
| 9.750% due 04/01/14 |
399 | 442 | ||
| Korea Development Bank (Ê) |
||||
| 5.489% due 04/03/10 |
900 | 900 | ||
| Korea Electric Power Corp. (þ) |
||||
| 5.125% due 04/23/34 |
60 | 58 | ||
| Lukoil International Finance BV (þ) |
||||
| 6.356% due 06/07/17 |
100 | 97 | ||
| 6.656% due 06/07/22 |
100 | 97 | ||
| Majapahit Holding BV (Ñ)(þ) |
||||
| 7.875% due 06/29/37 |
100 | 100 | ||
| Mexico Government International Bond (Ñ) |
||||
| Series MTNA |
||||
| 6.750% due 09/27/34 |
65 | 69 | ||
| Mizuho Financial Group Cayman, Ltd. (þ) |
||||
| 5.790% due 04/15/14 |
100 | 100 | ||
| MUFG Capital Finance 1, Ltd. (ƒ) |
||||
| 6.346% due 07/29/49 |
200 | 197 | ||
| Province of Quebec Canada Series PJ |
||||
| 6.125% due 01/22/11 |
390 | 400 | ||
| Ras Laffan Liquefied Natural Gas Co., Ltd. II (þ) |
||||
| 5.298% due 09/30/20 |
75 | 70 | ||
| Ras Laffan Liquefied Natural Gas Co., Ltd. III (þ) |
||||
| 5.838% due 09/30/27 |
250 | 232 | ||
| Resona Bank, Ltd. (ƒ)(þ) |
||||
| 5.850% due 09/29/49 |
255 | 244 | ||
| Resona Preferred Global Securities Cayman, Ltd. (ƒ)(þ) |
||||
| 7.191% due 12/29/49 |
225 | 230 | ||
| Rogers Wireless, Inc. |
||||
| 6.375% due 03/01/14 |
65 | 66 |
48 Core Bond Fund
Table of Contents
Russell Investment Funds
Core Bond Fund
Schedule of Investments, continued—June 30, 2007 (Unaudited)
Amounts in thousands (except share amounts)
| Principal Amount ($) or Shares |
Market Value $ | |||
| Royal Bank of Scotland Group PLC (ƒ) |
||||
| Series 1 |
||||
| 9.118% due 03/31/49 |
700 | 761 | ||
| Royal Bank of Scotland PLC (Ê) |
||||
| 5.750% due 07/06/12 |
600 | 600 | ||
| Russia Government International Bond (þ) |
||||
| 7.500% due 03/31/30 |
313 | 344 | ||
| Santander Financial Issuances |
||||
| 6.375% due 02/15/11 |
110 | 113 | ||
| Santander US Debt SA |
||||
| Unipersonal (Ê)(þ) |
||||
| 5.358% due 11/20/08 |
500 | 500 | ||
| Sanwa Finance Aruba AEC |
||||
| 8.350% due 07/15/09 |
135 | 142 | ||
| Shimao Property Holdings, Ltd. (þ) |
||||
| 8.000% due 12/01/16 |
100 | 102 | ||
| SMFG Preferred Capital USD 1, Ltd. (ƒ)(þ) |
||||
| 6.078% due 01/29/49 |
100 | 96 | ||
| Sumitomo Mitsui Banking Corp. (ƒ)(þ) |
||||
| 5.625% due 07/29/49 |
400 | 381 | ||
| Systems 2001 AT LLC (þ) |
||||
| 7.156% due 12/15/11 |
99 | 102 | ||
| Telecom Italia Capital SA |
||||
| 4.875% due 10/01/10 |
150 | 146 | ||
| 5.250% due 10/01/15 |
105 | 98 | ||
| Telefonica Emisiones SAU |
||||
| 5.650% due 06/19/09 (Ê) |
300 | 301 | ||
| 7.045% due 06/20/36 |
65 | 67 | ||
| TELUS Corp. |
||||
| 8.000% due 06/01/11 |
250 | 267 | ||
| Transocean, Inc. (Ê) |
||||
| 5.548% due 09/05/08 |
200 | 200 | ||
| Tyco International Group SA (Ñ) |
||||
| 6.750% due 02/15/11 |
210 | 220 | ||
| UFJ Finance Aruba AEC |
||||
| 6.750% due 07/15/13 |
35 | 37 | ||
| Unicredit Luxembourg Finance SA (Ê)(þ) |
||||
| 5.405% due 10/24/08 |
1,000 | 1,000 | ||
| Vale Overseas, Ltd. |
||||
| 6.250% due 01/11/16 |
35 | 35 | ||
| 6.250% due 01/23/17 |
140 | 139 | ||
| Vedanta Resources PLC (þ) |
||||
| 6.625% due 02/22/10 |
160 | 160 | ||
| Vodafone Group PLC (Ñ) |
||||
| 5.750% due 03/15/16 |
105 | 102 | ||
| VTB Capital SA (Ê)(þ) |
||||
| 5.955% due 08/01/08 |
230 | 230 | ||
| Westfield Capital Corp., Ltd. (þ) |
||||
| 5.125% due 11/15/14 |
125 | 120 | ||
| Westfield Group (þ) |
||||
| 5.400% due 10/01/12 |
125 | 123 | ||
| Xstrata Finance Canada, Ltd. (þ) |
||||
| 5.500% due 11/16/11 |
45 | 45 | ||
| 5.800% due 11/15/16 |
45 | 44 | ||
| 17,341 | ||||
| Loan Agreements—0.8% |
||||
| Adam Aircraft |
||||
| 12.380% due 05/01/12 |
85 | 85 | ||
| Starbound Reinsurance, Ltd. Term Loan B |
||||
| 7.360% due 03/31/08 |
1,500 | 1,500 | ||
| 8.360% due 08/20/09 |
420 | 420 | ||
| Travelport Holdings, Ltd. |
||||
| 12.350% due 03/01/13 |
255 | 255 | ||
| 2,260 | ||||
| Mortgage-Backed Securities—52.4% |
||||
| ABN Amro Mortgage Corp. |
||||
| Series 2003-13 Class A3 |
||||
| 5.500% due 01/25/34 |
1,568 | 1,489 | ||
| Adjustable Rate Mortgage Trust (Ê) |
||||
| Series 2005-3 Class 8A2 |
||||
| 5.560% due 07/25/35 |
214 | 214 | ||
| American Home Mortgage Assets (Ê) |
||||
| Series 2007-1 Class A1 |
||||
| 5.729% due 02/25/47 |
939 | 939 | ||
| American Home Mortgage Investment Trust (Ê) |
||||
| Series 2004-4 Class 4A |
||||
| 4.390% due 02/25/45 |
141 | 138 | ||
| Series 2005-2 Class 5A2 |
||||
| 5.470% due 09/25/35 |
44 | 44 | ||
| Banc of America Commercial Mortgage, Inc. |
||||
| Series 2004-3 Class A3 |
||||
| 4.875% due 06/10/39 |
465 | 458 | ||
| Series 2004-4 Class A3 |
||||
| 4.128% due 07/10/42 |
300 | 292 | ||
| Series 2005-2 Class A4 |
||||
| 4.783% due 07/10/43 |
333 | 321 | ||
| Series 2005-3 Class A2 |
||||
| 4.501% due 07/10/43 |
150 | 146 | ||
| Series 2005-5 Class A4 |
||||
| 5.115% due 10/10/45 |
500 | 477 | ||
| Series 2006-1 Class A4 |
||||
| 5.372% due 09/10/45 |
200 | 194 |
Core Bond Fund 49
Table of Contents
Russell Investment Funds
Core Bond Fund
Schedule of Investments, continued—June 30, 2007 (Unaudited)
Amounts in thousands (except share amounts)
| Principal Amount ($) or Shares |
Market Value $ | |||
| Banc of America Funding Corp. |
||||
| Series 2005-D Class A1 (Ê) |
||||
| 4.113% due 05/25/35 |
149 | 146 | ||
| Series 2006-3 Class 5A8 |
||||
| 5.500% due 03/25/36 |
475 | 465 | ||
| Series 2006-A Class 3A2 |
||||
| 5.898% due 02/20/36 |
197 | 197 | ||
| Series 2006-A Class 4A1 (Ê) |
||||
| 5.577% due 02/20/36 |
487 | 484 | ||
| Banc of America Mortgage Securities, Inc. |
||||
| Series 2003-9 Class 1A12 (Ê) |
||||
| 5.770% due 12/25/33 |
442 | 443 | ||
| Series 2004-1 Class 5A1 |
||||
| 6.500% due 09/25/33 |
17 | 17 | ||
| Series 2004-11 Class 2A1 |
||||
| 5.750% due 01/25/35 |
415 | 403 | ||
| Series 2005-L Class 3A1 (Ê) |
||||
| 5.459% due 01/25/36 |
245 | 243 | ||
| Series 2006-2 Class A15 |
||||
| 6.000% due 07/25/36 |
295 | 296 | ||
| Bank of America Alternative Loan Trust |
||||
| Series 2003-2 Class CB2 (Ê) |
||||
| 5.820% due 04/25/33 |
96 | 97 | ||
| Series 2003-10 Class 2A2 (Ê) |
||||
| 5.770% due 12/25/33 |
231 | 232 | ||
| Series 2006-5 Class CB17 |
||||
| 6.000% due 06/25/36 |
231 | 230 | ||
| Bear Stearns Adjustable Rate Mortgage Trust |
||||
| Series 2003-1 Class 6A1 |
||||
| 5.044% due 04/25/33 |
72 | 72 | ||
| Series 2003-8 Class 4A1 |
||||
| 4.622% due 01/25/34 |
143 | 143 | ||
| Bear Stearns Alt-A Trust |
||||
| Series 2005-4 Class 23A1 |
||||
| 5.377% due 05/25/35 |
269 | 267 | ||
| Bear Stearns Mortgage Funding Trust (Ê) |
||||
| Series 2006-AR2 Class 1A1 |
||||
| 5.520% due 09/25/36 |
960 | 959 | ||
| Series 2006-AR2 Class 2A1 |
||||
| 5.550% due 10/25/36 |
939 | 938 | ||
| Chase Mortgage Finance Corp. |
||||
| Series 2003-S8 Class A1 |
||||
| 4.500% due 09/25/18 |
167 | 158 | ||
| Series 2006-S4 Class A3 |
||||
| 6.000% due 12/25/36 |
270 | 271 | ||
| Series 2006-S4 Class A4 |
||||
| 6.000% due 12/25/36 |
145 | 145 | ||
| Series 2007-A1 Class 1A3 |
||||
| 4.359% due 02/25/37 |
931 | 916 | ||
| Citigroup Mortgage Loan Trust, Inc. |
||||
| Series 2005-11 Class A2A (Ê) |
||||
| 4.700% due 12/25/35 |
85 | 83 | ||
| Series 2006-WF1 Class A2F |
||||
| 5.657% due 03/01/36 |
325 | 318 | ||
| Series 2006-WFH Class A2 (Ê) |
||||
| 5.420% due 11/25/36 |
1,000 | 999 | ||
| Citigroup/Deutsche Bank Commercial Mortgage Trust |
||||
| Series 2005-CD1 Class A4 |
||||
| 5.400% due 07/15/44 |
1,000 | 968 | ||
| Series 2006-CD3 Class A5 |
||||
| 5.617% due 10/15/48 |
190 | 187 | ||
| Citimortgage Alternative Loan Trust |
||||
| Series 2006-A3 Class 1A5 |
||||
| 6.000% due 07/25/36 |
168 | 168 | ||
| Countrywide Alternative Loan Trust |
||||
| Series 2005-32T Class A7 (Ê) |
||||
| 5.570% due 08/25/35 |
185 | 185 | ||
| Series 2005-J8 Class 1A3 |
||||
| 5.500% due 07/25/35 |
217 | 215 | ||
| Series 2005-J13 Class 2A3 |
||||
| 5.500% due 11/25/35 |
145 | 144 | ||
| Series 2006-9T1 Class A7 |
||||
| 6.000% due 05/25/36 |
123 | 123 | ||
| Series 2006-43C Class 1A7 |
||||
| 6.000% due 02/25/37 |
362 | 362 | ||
| Series 2006-J2 Class A3 |
||||
| 6.000% due 04/25/36 |
181 | 181 | ||
| Series 2006-OA1 Class 4A1 (Ê) |
||||
| 5.510% due 08/25/46 |
855 | 855 | ||
| Series 2006-OA1 Class A1 (Ê) |
||||
| 5.500% due 02/20/47 |
899 | 898 | ||
| Countrywide Home Loan Mortgage Pass Through Trust |
||||
| Series 2004-16 Class 1A1 (Ê) |
||||
| 5.720% due 09/25/34 |
258 | 259 | ||
| Series 2005-3 Class 1A2 (Ê) |
||||
| 5.610% due 04/25/35 |
38 | 38 | ||
| Series 2005-HYB Class 3A2A (Ê) |
||||
| 5.250% due 02/20/36 |
79 | 78 | ||
| Series 2006-OA5 Class 2A1 (Ê) |
||||
| 5.520% due 04/25/46 |
796 | 795 | ||
| Series 2007-HY1 Class 1A2 |
||||
| 5.718% due 04/25/37 |
105 | 104 | ||
| Credit Suisse First Boston Mortgage Securities Corp. |
||||
| Series 1998-C1 Class A1B |
||||
| 6.480% due 05/17/40 |
52 | 53 |
50 Core Bond Fund
Table of Contents
Russell Investment Funds
Core Bond Fund
Schedule of Investments, continued—June 30, 2007 (Unaudited)
Amounts in thousands (except share amounts)
| Principal Amount ($) or Shares |
Market Value $ | |||
| Series 1998-C2 Class A2 |
||||
| 6.300% due 11/15/30 |
94 | 94 | ||
| Deutsche ALT-A Securities, Inc. Alternate Loan Trust |
||||
| Series 2005-AR1 Class 2A3 |
||||
| 5.010% due 08/25/35 |
465 | 462 | ||
| DLJ Commercial Mortgage Corp. |
||||
| Series 1998-CF1 Class A1B |
||||
| 6.410% due 02/18/31 |
171 | 172 | ||
| Series 1999-CG1 Class S |
||||
| Interest Only STRIP |
||||
| 1.040% due 03/10/32 |
3,347 | 51 | ||
| Fannie Mae |
||||
| 5.190% due 2012 |
211 | 209 | ||
| 6.000% due 2016 |
17 | 17 | ||
| 5.000% due 2017 |
575 | 558 | ||
| 5.532% due 2017 (Ê) |
57 | 57 | ||
| 6.000% due 2017 |
94 | 95 | ||
| 4.000% due 2018 |
878 | 817 | ||
| 4.500% due 2018 |
4,321 | 4,117 | ||
| 5.000% due 2018 |
252 | 244 | ||
| 4.500% due 2019 |
486 | 462 | ||
| 5.000% due 2019 |
1,282 | 1,242 | ||
| 4.500% due 2020 |
524 | 499 | ||
| 5.000% due 2020 |
1,697 | 1,642 | ||
| 5.000% due 2021 |
1,523 | 1,472 | ||
| 6.500% due 2024 |
521 | 528 | ||
| 6.000% due 2028 |
37 | 36 | ||
| 5.500% due 2029 |
96 | 93 | ||
| 6.000% due 2032 |
584 | 581 | ||
| 7.000% due 2032 |
226 | 233 | ||
| 3.907% due 2033 (Ê) |
307 | 306 | ||
| 4.794% due 2033 (Ê) |
172 | 174 | ||
| 5.000% due 2033 |
608 | 573 | ||
| 5.500% due 2033 |
2,850 | 2,758 | ||
| 6.000% due 2033 |
217 | 216 | ||
| 5.000% due 2034 |
708 | 668 | ||
| 5.500% due 2034 |
4,429 | 4,288 | ||
| 5.000% due 2035 |
637 | 599 | ||
| 5.500% due 2035 |
21,113 | 20,426 | ||
| 6.000% due 2035 |
181 | 180 | ||
| 5.000% due 2036 |
47 | 44 | ||
| 5.500% due 2036 |
931 | 898 | ||
| 5.659% due 2036 (Ê) |
488 | 492 | ||
| 6.000% due 2036 |
7,919 | 7,836 | ||
| 6.500% due 2036 |
117 | 118 | ||
| 7.000% due 2036 |
28 | 29 | ||
| 7.500% due 2036 |
1,208 | 1,255 | ||
| 5.000% due 2037 |
6,986 | 6,548 | ||
| 6.000% due 2037 |
1,142 | 1,130 | ||
| Series 1992-10 Class ZD |
||||
| 8.000% due 11/25/21 |
132 | 133 | ||
| Series 1999-56 Class Z |
||||
| 7.000% due 12/18/29 |
114 | 117 | ||
| Series 2003-32 Class FH (Ê) |
||||
| 5.720% due 11/25/22 |
350 | 349 | ||
| Series 2003-78 Class FI (Ê) |
||||
| 5.720% due 01/25/33 |
340 | 341 | ||
| Series 2003-337 Class 1 |
||||
| Principal Only STRIP |
||||
| Zero coupon due 07/01/33 |
290 | 199 | ||
| Series 2003-343 Class 6 |
||||
| Interest Only STRIP |
||||
| 5.000% due 10/01/33 |
282 | 75 | ||
| Series 2003-345 Class 18 |
||||
| Interest Only STRIP |
||||
| 4.500% due 12/01/18 |
774 | 118 | ||
| Series 2003-345 Class 19 |
||||
| Interest Only STRIP |
||||
| 4.500% due 01/01/19 |
866 | 132 | ||
| Series 2004-21 Class FL (Ê) |
||||
| 5.670% due 11/25/32 |
173 | 173 | ||
| Series 2004-356 Class 35 |
||||
| Interest Only STRIP |
||||
| 4.500% due 03/01/20 |
153 | 26 | ||
| Series 2004-356 Class 36 |
||||
| Interest Only STRIP |
||||
| 4.500% due 03/01/20 |
260 | 44 | ||
| Series 2006-369 Class 8 |
||||
| Interest Only STRIP |
||||
| 5.500% due 04/01/36 |
224 | 59 | ||
| Series 2006-373 Class 1 |
||||
| Principal Only STRIP |
||||
| Zero coupon due 07/01/36 |
249 | 175 | ||
| 15 Year TBA (Ï) |
||||
| 4.500% |
340 | 323 | ||
| 5.000% |
1,575 | 1,522 | ||
| 30 Year TBA (Ï) |
||||
| 4.500% |
530 | 482 | ||
| 5.000% |
2,330 | 2,183 | ||
| 5.500% |
6,280 | 6,055 | ||
| 6.000% |
6,550 | 6,478 | ||
| 6.500% |
1,365 | 1,378 | ||
| Fannie Mae REMICS |
||||
| Series 1993-41 Class ZQ |
||||
| 7.000% due 12/25/23 |
9 | 9 | ||
| Series 1993-42 Class ZQ |
||||
| 6.750% due 04/25/23 |
9 | 9 | ||
| Series 2003-35 Class FY (Ê) |
||||
| 5.720% due 05/25/18 |
456 | 458 |
Core Bond Fund 51
Table of Contents
Russell Investment Funds
Core Bond Fund
Schedule of Investments, continued—June 30, 2007 (Unaudited)
Amounts in thousands (except share amounts)
| Principal Amount ($) or Shares |
Market Value $ | |||
| Series 2005-36 Class AI |
||||
| Interest Only STRIP |
||||
| 5.500% due 10/25/26 |
313 | 23 | ||
| Series 2005-79 Class FC (Ê) |
||||
| 5.620% due 02/25/22 |
164 | 164 | ||
| Series 2006-48 Class LG |
||||
| Principal Only STRIP |
||||
| Zero coupon due 06/25/36 |
77 | 47 | ||
| Fannie Mae Whole Loan |
||||
| Series 2003-W1 Class 1A1 |
||||
| 6.500% due 12/25/42 |
44 | 45 | ||
| Federal Home Loan Mortgage Corp. |
||||
| 5.000% due 03/15/32 |
1,500 | 1,500 | ||
| 5.470% due 12/31/49 |
2,200 | 2,198 | ||
| Federal Home Loan Mortgage Corp. Structured Pass Through Securities (Ê) |
||||
| Series 2005-63 Class 1A1 |
||||
| 6.227% due 02/25/45 |
43 | 43 | ||
| First Horizon Alternative Mortgage Securities |
||||
| Series 2004-AA3 Class A1 (Ê) |
||||
| 5.303% due 09/25/34 |
58 | 58 | ||
| Series 2006-AA5 Class A2 (Ê) |
||||
| 6.530% due 09/25/36 |
164 | 167 | ||
| Series 2006-FA3 Class A6 |
||||
| 6.000% due 07/25/36 |
261 | 262 | ||
| First Horizon Asset Securities, Inc. (Ê) |
||||
| Series 2005-AR5 Class 3A1 |
||||
| 5.535% due 10/25/35 |
115 | 114 | ||
| Freddie Mac |
||||
| 5.000% due 2018 |
419 | 407 | ||
| 4.000% due 2019 |
1,759 | 1,635 | ||
| 5.000% due 2019 |
799 | 775 | ||
| 5.000% due 2020 |
1,463 | 1,416 | ||
| 4.614% due 2034 (Ê) |
170 | 171 | ||
| 6.000% due 2035 |
153 | 151 | ||
| 5.888% due 2036 (Ê) |
124 | 124 | ||
| 5.940% due 2036 (Ê) |
261 | 261 | ||
| 5.969% due 2036 (Ê) |
139 | 139 | ||
| Series 2000-226 Class F (Ê) |
||||
| 5.770% due 11/15/30 |
17 | 17 | ||
| Series 2003-262 Class AB |
||||
| 2.900% due 11/15/14 |
300 | 291 | ||
| Series 2004-276 Class IP |
||||
| Interest Only STRIP |
||||
| 5.500% due 07/15/23 |
229 | 9 | ||
| Series 2004-281 Class DF (Ê) |
||||
| 5.770% due 06/15/23 |
131 | 132 | ||
| Series 2005-292 Class IG |
||||
| Interest Only STRIP |
||||
| 5.000% due 04/15/23 |
182 | 30 | ||
| Series 2005-294 Class FA (Ê) |
||||
| 5.490% due 03/15/20 |
256 | 256 | ||
| Series 2006-313 Class FP (Ê)(Å) |
||||
| Zero coupon due 04/15/36 |
185 | 207 | ||
| 30 Year TBA (Ï) |
||||
| 5.000% |
1,040 | 975 | ||
| 5.500% |
1,520 | 1,466 | ||
| 6.000% |
2,125 | 2,105 | ||
| Freddie Mac Gold |
||||
| 6.000% due 2016 |
29 | 29 | ||
| 5.000% due 2018 |
283 | 275 | ||
| 5.500% due 2020 |
868 | 856 | ||
| 7.243% due 2030 (Ê) |
2 | 2 | ||
| 5.000% due 2033 |
218 | 206 | ||
| Freddie Mac Reference REMICS (Ê) |
||||
| Series 2006-R00 Class FK |
||||
| 5.720% due 07/15/23 |
346 | 347 | ||
| Freddie Mac REMICS |
||||
| Series 2003-256 Class FJ (Ê) |
||||
| 5.720% due 02/15/33 |
157 | 158 | ||
| Series 2003-258 Class IG |
||||
| Interest Only STRIP |
||||
| 4.500% due 10/15/16 |
124 | 13 | ||
| Series 2004-277 Class KE |
||||
| 3.500% due 12/15/17 |
12 | 12 | ||
| Series 2005-299 Class KF (Ê) |
||||
| 5.720% due 06/15/35 |
88 | 88 | ||
| Series 2005-301 Class IM |
||||
| Interest Only STRIP |
||||
| 5.500% due 01/15/31 |
187 | 23 | ||
| Series 2006-317 Class XI (Ê)(Å) |
||||
| Principal Only STRIP |
||||
| Zero coupon due 10/15/35 |
260 | 3 | ||
| Series 2006-323 Class PA |
||||
| 6.000% due 03/15/26 |
290 | 292 | ||
| Series 2007-333 Class AF (Ê) |
||||
| 5.470% due 10/15/20 |
2,200 | 2,198 | ||
| Series 2007-333 Class BF (Ê) |
||||
| 5.470% due 07/15/19 |
400 | 400 | ||
| Series 2007-333 Class FT (Ê) |
||||
| 5.470% due 08/15/19 |
1,600 | 1,599 | ||
| Freddie Mac Strips |
||||
| Series 2007-245 Class IO |
||||
| Interest Only STRIP |
||||
| 5.000% due 05/15/37 |
415 | 118 | ||
| Series 2007-245 Class PO |
||||
| Interest Only STRIP |
||||
| 5.000% 11/15/36 |
412 | 269 |
52 Core Bond Fund
Table of Contents
Russell Investment Funds
Core Bond Fund
Schedule of Investments, continued—June 30, 2007 (Unaudited)
Amounts in thousands (except share amounts)
| Principal Amount ($) or Shares |
Market Value $ | |||
| Ginnie Mae I |
||||
| 6.000% due 2029 |
14 | 14 | ||
| 30 Year TBA (Ï) |
||||
| 5.500% |
1,650 | 1,601 | ||
| 6.000% |
1,000 | 995 | ||
| Ginnie Mae II (Ê) |
||||
| 5.375% due 2026 |
227 | 230 | ||
| 5.750% due 2027 |
14 | 15 | ||
| 5.750% due 2032 |
111 | 112 | ||
| GMAC Commercial Mortgage Securities, Inc. |
||||
| Series 1999-C2 Class A2 |
||||
| 6.945% due 09/15/33 |
194 | 198 | ||
| Government National Mortgage Association (Ê) |
||||
| Series 1999-40 Class FE |
||||
| 5.870% due 11/16/29 |
131 | 132 | ||
| Series 2000-29 Class F |
||||
| 5.820% due 09/20/30 |
25 | 25 | ||
| Greenwich Capital Commercial Funding Corp. |
||||
| Series 2003-C2 Class A2 |
||||
| 4.022% due 01/05/36 |
200 | 195 | ||
| Series 2004-GG1 Class A7 |
||||
| 5.317% due 06/10/36 |
465 | 454 | ||
| Series 2006-RR1 Class A1 (þ) |
||||
| 5.964% due 03/18/49 |
205 | 195 | ||
| Series 2007-GG9 Class A4 |
||||
| 5.444% due 03/10/39 |
185 | 179 | ||
| GS Mortgage Securities Corp. II |
||||
| Series 2006-FL8 Class A1 (Ê)(þ) |
||||
| 5.420% due 06/06/20 |
30 | 30 | ||
| Series 2006-GG6 Class A4 |
||||
| 5.553% due 04/10/38 |
115 | 113 | ||
| Series 2006-GG8 Class AAB |
||||
| 5.535% due 11/10/39 |
200 | 197 | ||
| Harborview Mortgage Loan Trust |
||||
| Series 2005-14 Class 3A1A |
||||
| 5.313% due 12/19/35 |
116 | 116 | ||
| Series 2005-16 Class 3A1A (Ê) |
||||
| 5.570% due 01/19/36 |
531 | 532 | ||
| Indymac Index Mortgage Loan Trust (Ê) |
||||
| Series 2006-AR2 Class A2 |
||||
| 5.400% due 11/25/36 |
134 | 134 | ||
| JP Morgan Chase Commercial Mortgage Securities Corp. |
||||
| Series 2001-CIB Class A2 |
||||
| 6.244% due 04/15/35 |
168 | 169 | ||
| Series 2004-LN2 Class A1 |
||||
| 4.475% due 07/15/41 |
352 | 340 | ||
| Series 2005-LDP Class A3A1 |
||||
| 4.871% due 10/15/42 |
210 | 204 | ||
| Series 2005-LDP Class A4 |
||||
| 4.918% due 10/15/42 |
325 | 306 | ||
| 5.345% due 12/15/44 |
300 | 290 | ||
| Series 2006-CB1 Class A4 |
||||
| 5.552% due 05/12/45 |
220 | 215 | ||
| Series 2006-LDP Class A3 |
||||
| 5.336% due 05/15/47 |
150 | 144 | ||
| Series 2006-LDP Class A3B |
||||
| 5.447% due 05/15/45 |
250 | 246 | ||
| Series 2006-LDP Class A4 |
||||
| 6.066% due 04/15/45 |
270 | 272 | ||
| 5.399% due 05/15/45 |
290 | 280 | ||
| Series 2007-LDP Class A3 |
||||
| 5.420% due 01/15/49 |
275 | 265 | ||
| JP Morgan Mortgage Trust (Ê) |
||||
| Series 2007-A1 Class 2A2 |
||||
| 4.763% due 07/25/35 |
957 | 941 | ||
| LB-UBS Commercial Mortgage Trust |
||||
| Series 2006-C1 Class A4 |
||||
| 5.156% due 02/15/31 |
1,000 | 955 | ||
| Series 2006-C4 Class A4 |
||||
| 6.100% due 06/15/38 |
105 | 106 | ||
| Lehman Mortgage Trust |
||||
| Series 2005-3 Class 1A3 |
||||
| 5.500% due 01/25/36 |
657 | 655 | ||
| Lehman XS Trust (Ê) |
||||
| Series 2005-5N Class 3A1A |
||||
| 5.620% due 11/25/35 |
574 | 575 | ||
| Series 2006-16N Class A4A |
||||
| 5.510% due 11/25/46 |
908 | 906 | ||
| Mastr Adjustable Rate Mortgages Trust (Ê) |
||||
| Series 2006-OA2 Class 4A1A |
||||
| 5.833% due 12/25/46 |
925 | 925 | ||
| Mastr Alternative Loans Trust |
||||
| Series 2003-4 Class B1 |
||||
| 5.670% due 06/25/33 |
199 | 198 | ||
| Series 2004-10 Class 5A6 |
||||
| 5.750% due 09/25/34 |
170 | 167 | ||
| Mastr Asset Securitization Trust (Ê) |
||||
| Series 2003-7 Class 4A35 |
||||
| 5.720% due 09/25/33 |
255 | 255 | ||
| Series 2004-4 Class 2A2 |
||||
| 5.770% due 04/25/34 |
97 | 98 | ||
| Mellon Residential Funding Corp. (Ê) |
||||
| Series 2000-TBC Class A1 |
||||
| 5.800% due 06/15/30 |
213 | 213 |
Core Bond Fund 53
Table of Contents
Russell Investment Funds
Core Bond Fund
Schedule of Investments, continued—June 30, 2007 (Unaudited)
Amounts in thousands (except share amounts)
| Principal Amount ($) or Shares |
Market Value $ | |||
| Merrill Lynch Floating Trust (Ê)(þ) |
||||
| Series 2006-1 Class A1 |
||||
| 5.390% due 06/15/22 |
889 | 889 | ||
| MLCC Mortgage Investors, Inc. (Ê) |
||||
| Series 2004-HB1 Class A2 |
||||
| 5.771% due 04/25/29 |
49 | 49 | ||
| Morgan Stanley Capital I |
||||
| Series 2005-IQ1 Class AAB |
||||
| 5.178% due 09/15/42 |
415 | 405 | ||
| Series 2006-HQ8 Class A4 |
||||
| 5.561% due 03/12/44 |
160 | 156 | ||
| Series 2006-HQ9 Class A4 |
||||
| 5.731% due 07/20/44 |
200 | 198 | ||
| Morgan Stanley Mortgage Loan Trust |
||||
| Series 2006-11 Class 1A6 |
||||
| 6.231% due 08/25/36 |
220 | 221 | ||
| MortgageIT Trust (Ê) |
||||
| Series 2005-AR1 Class 1A1 |
||||
| 5.570% due 11/25/35 |
526 | 527 | ||
| Prime Mortgage Trust (Ê) |
||||
| Series 2004-CL1 Class 1A2 |
||||
| 5.720% due 02/25/34 |
45 | 45 | ||
| Residential Accredit Loans, Inc. |
||||
| Series 2004-QS5 Class A6 (Ê) |
||||
| 5.920% due 04/25/34 |
65 | 65 | ||
| Series 2004-QS8 Class A4 (Ê) |
||||
| 5.720% due 06/25/34 |
331 | 333 | ||
| Series 2005-QA8 Class NB3 |
||||
| 5.492% due 07/25/35 |
262 | 259 | ||
| Series 2006-QS6 Class 1A13 |
||||
| 6.000% due 06/25/36 |
445 | 446 | ||
| Residential Asset Securities Corp. (Ê) |
||||
| Series 2003-KS4 Class AIIB |
||||
| 5.900% due 06/25/33 |
66 | 66 | ||
| Residential Asset Securitization Trust |
||||
| Series 2003-A15 Class 1A2 (Ê) |
||||
| 5.770% due 02/25/34 |
370 | 372 | ||
| Series 2007-A5 Class 2A3 |
||||
| 6.000% due 05/25/37 |
145 | 145 | ||
| Residential Funding Mortgage Securities I |
||||
| Series 2003-S5 Class 1A2 (Ê) |
||||
| 5.770% due 11/25/18 |
200 | 201 | ||
| Series 2003-S14 Class A5 (Ê) |
||||
| 5.720% due 07/25/18 |
210 | 211 | ||
| Series 2003-S20 Class 1A7 (Ê) |
||||
| 5.820% due 12/25/33 |
81 | 81 | ||
| Series 2006-SA4 Class 2A1 |
||||
| 6.131% due 11/25/36 |
514 | 518 | ||
| Sequoia Mortgage Trust (Ê) |
||||
| Series 2001-5 Class A |
||||
| 5.670% due 10/19/26 |
83 | 83 | ||
| Small Business Administration Participation Certificates |
||||
| Series 2005-20G Class 1 |
||||
| 4.750% due 07/01/25 |
921 | 874 | ||
| Structured Asset Mortgage Investments, Inc. (Ê) |
||||
| Series 2006-AR2 Class A1 |
||||
| 5.550% due 02/25/36 |
675 | 677 | ||
| Series 2006-AR8 Class A1A |
||||
| 5.520% due 10/25/36 |
915 | 914 | ||
| Structured Asset Securities Corp. |
||||
| Series 2004-21X Class 1A3 |
||||
| 4.440% due 12/25/34 |
620 | 613 | ||
| Thornburg Mortgage Securities Trust (Ê) |
||||
| Series 2003-2 Class A1 |
||||
| 5.660% due 04/25/43 |
144 | 144 | ||
| Series 2006-5 Class A1 |
||||
| 5.440% due 08/25/36 |
824 | 823 | ||
| Series 2006-6 Class A1 |
||||
| 5.430% due 12/25/36 |
170 | 170 | ||
| Wachovia Bank Commercial Mortgage Trust |
||||
| Series 2005-C21 Class A4 |
||||
| 5.368% due 10/15/44 |
1,000 | 969 | ||
| Washington Mutual Alternative Mortgage Pass-Through Certificates |
||||
| Series 2005-4 Class CB11 |
||||
| 5.500% due 06/25/35 |
90 | 87 | ||
| Series 2006-AR7 Class A1A (Ê) |
||||
| 5.947% due 09/25/46 |
15 | 15 | ||
| Series 2006-AR8 Class 2A (Ê) |
||||
| 5.879% due 10/25/46 |
867 | 872 | ||
| Series 2006-AR9 Class 2A (Ê) |
||||
| 5.867% due 11/25/46 |
940 | 940 | ||
| Washington Mutual Mortgage Pass-Through Certificates |
||||
| Series 2003-S9 Class A2 (Ê) |
||||
| 5.870% due 10/25/33 |
360 | 362 | ||
| Series 2005-AR1 Class 1A1 |
||||
| 4.836% due 10/25/35 |
313 | 309 | ||
| Series 2005-AR1 Class A1A1 (Ê) |
||||
| 5.610% due 10/25/45 |
47 | 47 | ||
| 5.590% due 12/25/45 |
546 | 547 | ||
| Series 2005-AR6 Class B3 (Ê) |
||||
| 5.980% due 04/25/45 |
230 | 229 |
54 Core Bond Fund
Table of Contents
Russell Investment Funds
Core Bond Fund
Schedule of Investments, continued—June 30, 2007 (Unaudited)
Amounts in thousands (except share amounts)
| Principal Amount ($) or Shares |
Market Value $ | |||
| Series 2006-AR1 Class 3A1A (Ê) |
||||
| 5.947% due 09/25/46 |
922 | 927 | ||
| Series 2006-AR2 Class 1A1 |
||||
| 5.319% due 03/25/37 |
857 | 847 | ||
| Series 2007-HY3 Class 4A1 |
||||
| 5.354% due 03/25/37 |
957 | 948 | ||
| Series 2007-HY3 Class 4B1 |
||||
| 5.356% due 03/25/37 |
125 | 122 | ||
| Series 2007-HY4 Class 1A1 |
||||
| 5.569% due 04/25/37 |
174 | 173 | ||
| Wells Fargo Mortgage Backed Securities Trust |
||||
| Series 2006-2 Class 2A3 |
||||
| 5.500% due 03/25/36 |
469 | 464 | ||
| Series 2006-AR2 Class 2A1 |
||||
| 4.950% due 03/25/36 |
340 | 335 | ||
| Series 2007-10 Class 2A5 |
||||
| 6.250% due 07/25/37 |
195 | 196 | ||
| 156,045 | ||||
| Non-US Bonds—0.2% |
||||
| Argentina Government International Bond |
||||
| Series dis |
||||
| 5.830% due 12/31/33 |
ARS 580 | 258 | ||
| Bombardier, Inc. (Å) |
||||
| 7.250% due 11/15/16 |
EUR 125 | 177 | ||
| Quebec Residual |
||||
| Zero coupon due 12/01/36 |
CAD 370 | 80 | ||
| 515 | ||||
| United States Government Agencies—3.6% |
||||
| Fannie Mae |
||||
| 4.150% due 09/10/09 |
2,200 | 2,153 | ||
| 3.875% due 02/15/10 (Ñ) |
710 | 688 | ||
| 4.750% due 04/20/10 |
1,400 | 1,384 | ||
| 4.125% due 05/12/10 |
1,500 | 1,458 | ||
| 5.050% due 02/07/11 (Ñ) |
1,200 | 1,194 | ||
| Federal Home Loan Bank (Ñ) |
||||
| Series 577 |
||||
| 4.500% due 09/26/08 |
900 | 892 | ||
| Federal Home Loan Bank System |
||||
| 5.375% due 08/19/11 (Ñ) |
295 | 296 | ||
| 5.310% due 12/28/12 |
1,000 | 1,000 | ||
| Financing Corp. Principal Only STRIP |
||||
| Series 1 |
||||
| Zero coupon due 05/11/16 |
80 | 50 | ||
| Series 1P |
||||
| Zero coupon due 05/11/18 |
95 | 53 | ||
| Series 3P |
||||
| Zero coupon due 11/30/17 |
170 | 97 | ||
| Series 5P |
||||
| Zero coupon due 02/08/18 |
65 | 37 | ||
| Series 8P |
||||
| Zero coupon due 08/03/18 |
605 | 333 | ||
| Series 9P |
||||
| Zero coupon due 10/06/17 |
310 | 179 | ||
| Series 12P |
||||
| Zero coupon due 12/06/18 |
245 | 132 | ||
| Series 13 |
||||
| Zero coupon due 12/27/16 |
275 | 165 | ||
| Series 13P |
||||
| Zero coupon due 12/27/18 |
670 | 360 | ||
| Series 16P |
||||
| Zero coupon due 04/05/19 |
380 | 201 | ||
| Series 19 |
||||
| Zero coupon due 06/06/16 |
230 | 143 | ||
| 10,815 | ||||
| United States Government Treasuries—5.4% |
||||
| United States Treasury Principal (Ñ) |
||||
| Principal Only STRIP |
||||
| Zero coupon due 08/15/25 |
300 | 116 | ||
| Zero coupon due 08/15/26 |
900 | 333 | ||
| Zero coupon due 11/15/26 |
500 | 183 | ||
| Zero coupon due 05/15/30 |
1,000 | 310 | ||
| United States Treasury Inflation Indexed Bonds (Ñ) |
||||
| 3.375% due 01/15/12 |
972 | 1,003 | ||
| 2.000% due 07/15/14 |
307 | 295 | ||
| 2.375% due 01/15/25 |
548 | 527 | ||
| 2.000% due 01/15/26 |
312 | 283 | ||
| 2.375% due 01/15/27 |
205 | 197 | ||
| United States Treasury Notes (Ñ) |
||||
| 4.750% due 12/31/08 |
1,255 | 1,251 | ||
| 4.375% due 12/15/10 |
3,710 | 3,649 | ||
| 4.750% due 05/31/12 |
600 | 595 | ||
| 4.250% due 08/15/15 |
555 | 527 | ||
| 4.875% due 08/15/16 |
1,000 | 988 | ||
| 4.625% due 02/15/17 |
1,400 | 1,356 | ||
| 4.500% due 05/15/17 |
300 | 288 | ||
| Zero coupon due 11/15/21 |
2,345 | 1,104 | ||
| 6.000% due 02/15/26 |
1,645 | 1,796 | ||
| 4.750% due 02/15/37 |
1,300 | 1,226 | ||
| 16,027 | ||||
| Total Long-Term Investments |
||||
| (cost $271,123) |
269,085 | |||
Core Bond Fund 55
Table of Contents
Russell Investment Funds
Core Bond Fund
Schedule of Investments, continued—June 30, 2007 (Unaudited)
Amounts in thousands (except share amounts)
| Principal Amount ($) or Shares |
Market Value $ | |||
| Preferred Stocks—0.3% |
||||
| Financial Services—0.3% |
||||
| DG Funding Trust (Å) |
49 | 509 | ||
| Mills Corp. (The) (Æ)(Ñ) |
12,775 | 333 | ||
| Total Preferred Stocks |
||||
| (cost $854) |
842 | |||
| Warrants & Rights—0.0% |
||||
| Miscellaneous—0.0% |
||||
| Mexico Government International Bond Value Recovery Rights (Æ) |
1,900,000 | 14 | ||
| Total Warrants & Rights |
||||
| (cost $1) |
14 | |||
| Notional Amount $ |
||||
| Options Purchased—0.2% |
||||
| (Number of Contracts) |
||||
| Eurodollar Futures |
||||
| Sep 2007 90.75 Put (37) |
8,394 | — | ||
| Sep 2007 91.25 Put (46) |
10,494 | — | ||
| Dec 2007 91.25 Put (38) |
8,669 | — | ||
| Mar 2008 91.75 Put (241) |
55,279 | 2 | ||
| Mar 2008 92.00 Put (43) |
9,890 | — | ||
| Mar 2008 92.50 Put (58) |
13,413 | — | ||
| Mar 2008 92.75 Put (53) |
12,289 | — | ||
| Mar 2008 93.00 Put (68) |
15,810 | — | ||
| Jun 2008 92.75 Put (40) |
9,275 | — | ||
| Swaptions |
||||
| (Fund Pays/Fund Receives) |
||||
| EUR Six Month LIBOR/EUR 3.960% |
||||
| Jul 2007 0.00 Call (2) |
5,414 | — | ||
| EUR Six Month LIBOR/EUR 4.100% |
||||
| Jul 2007 0.00 Call (1) |
2,707 | — | ||
| USD Three Month LIBOR/USD 4.800% |
||||
| Aug 2007 0.00 Call (1) |
2,000 | 21 | ||
| USD Three Month LIBOR/USD 4.900% |
||||
| Aug 2007 0.00 Call (1) |
6,000 | 31 | ||
| USD Three Month LIBOR/USD 5.000% |
||||
| Aug 2007 0.00 Call (1) |
5,000 | 21 | ||
| USD Three Month LIBOR/USD 5.250% |
||||
| Aug 2007 0.00 Call (1) |
4,000 | 4 | ||
| USD Three Month LIBOR/USD 4.900% |
||||
| Oct 2007 0.00 Call (1) |
3,000 | 27 | ||
| USD Three Month LIBOR/USD 4.750% |
||||
| Feb 2008 0.00 Call (1) |
5,000 | 2 | ||
| USD Three Month LIBOR/USD 5.000% |
||||
| Feb 2008 0.00 Call (2) |
6,000 | 46 | ||
| USD Three Month LIBOR/USD 4.750% |
||||
| Mar 2008 0.00 Call (2) |
19,600 | 103 | ||
| USD Three Month LIBOR/USD 4.750% |
||||
| Sep 2008 0.00 Call (3) |
13,900 | 187 | ||
| USD Three Month LIBOR/USD 4.750% |
||||
| Dec 2008 0.00 Call (1) |
6,200 | 14 | ||
| USD Three Month LIBOR/USD 5.000% |
||||
| Dec 2008 0.00 Call (1) |
15,100 | 52 | ||
| Total Options Purchased |
||||
| (cost $373) |
510 | |||
| Principal Amount $ or Shares |
||||
| Short-Term Investments—16.8% |
||||
| Barclays Bank PLC (ž) |
||||
| 5.281% due 03/17/08 |
900 | 900 | ||
| BellSouth Corp. (þ) |
||||
| 4.240% due 04/26/08 |
300 | 297 | ||
| BNP Paribas (ž) |
||||
| 5.262% due 05/28/08 |
200 | 200 | ||
| Citigroup Funding, Inc. |
||||
| Zero coupon due 11/15/07 |
520 | 553 | ||
| Citigroup Global Markets Holdings, Inc. (Ê) |
||||
| Series MTNM |
||||
| 5.370% due 03/07/08 |
400 | 400 | ||
| Citigroup, Inc. |
||||
| 3.500% due 02/01/08 |
560 | 554 | ||
56 Core Bond Fund
Table of Contents
Russell Investment Funds
Core Bond Fund
Schedule of Investments, continued—June 30, 2007 (Unaudited)
Amounts in thousands (except share amounts)
| Principal Amount ($) or Shares |
Market $ |
||||
| DaimlerChrysler NA Holding Corp. (Ê) |
|||||
| Series MTND |
|||||
| 5.840% due 09/10/07 |
400 | 400 | |||
| Fannie Mae |
|||||
| 4.200% due 03/24/08 |
2,000 | 1,982 | |||
| Federal Home Loan Bank (Ñ) |
|||||
| 4.800% due 05/02/08 |
3,100 | 3,087 | |||
| Federal Home Loan Bank System |
|||||
| Series IY08 |
|||||
| 3.400% due 03/18/08 |
1,000 | 986 | |||
| Fortis Bank (ž) |
|||||
| 5.270% due 04/28/08 |
400 | 400 | |||
| France Treasury Bills BTF |
|||||
| Zero coupon due 07/05/07 |
EUR 1,000 | 1,353 | |||
| Freddie Mac (Ñ) |
|||||
| Series * |
|||||
| 2.750% due 03/15/08 |
210 | 206 | |||
| 3.450% due 03/12/08 |
1,000 | 987 | |||
| Greater Bay Bancorp |
|||||
| Series B |
|||||
| 5.250% due 03/31/08 |
150 | 150 | |||
| Honda Auto Receivables Owner Trust |
|||||
| Series 2007-1 Class A1 |
|||||
| 5.322% due 03/18/08 |
261 | 261 | |||
| HSBC Bank USA NA (Ê) |
|||||
| Series BKNT |
|||||
| 5.430% due 09/21/07 |
500 | 500 | |||
| JPMorgan Chase Bank/London |
|||||
| Series EMTN (Å) |
|||||
| Zero coupon due 04/24/08 |
EGP 620 | 103 | |||
| Mandalay Resort Group |
|||||
| Series B |
|||||
| 10.250% due 08/01/07 |
410 | 412 | |||
| Mirage Resorts, Inc. |
|||||
| 6.750% due 08/01/07 |
85 | 85 | |||
| Norden Bank Finland PLC (ž) |
|||||
| 5.307% due 05/28/08 |
200 | 200 | |||
| Royal Bank of Canada (ž) |
|||||
| 5.420% due 06/30/08 |
400 | 400 | |||
| Royal Bank of Scotland (ž) |
|||||
| 5.265% due 03/26/08 |
200 | 200 | |||
| Russell Investment Company |
|||||
| Money Market Fund |
22,050,000 | 22,050 | |||
| Skandinaviska Enskilda Banken (ç)(ž) |
|||||
| 5.203% due 08/21/07 |
2,900 | 2,879 | |||
| Societe Generale (Ê) |
|||||
| Series YCD |
|||||
| 5.270% due 03/26/08 |
200 | 200 | |||
| Series CD |
|||||
| 5.269% due 06/30/08 |
1,100 | 1,100 | |||
| Societe Generale NA (ž) |
|||||
| 5.245% due 09/27/07 |
2,200 | 2,172 | |||
| UBS Financial Del LLC (ž) |
|||||
| 5.240% due 10/02/07 |
5,500 | 5,423 | |||
| Unicredito Italiano NY (Ê) |
|||||
| Series YCD |
|||||
| 5.370% due 05/29/08 |
200 | 200 | |||
| United States Treasury Bills (§)(ž) |
|||||
| 4.692% due 08/16/07 (ç) |
80 | 80 | |||
| 4.715% due 08/16/07 (ç) |
15 | 15 | |||
| 4.724% due 08/16/07 (ç) |
30 | 30 | |||
| 4.729% due 08/16/07 (ç) |
195 | 194 | |||
| 4.742% due 08/16/07 (ç) |
155 | 154 | |||
| 4.766% due 08/16/07 (ç) |
60 | 60 | |||
| 4.812% due 08/16/07 (ç) |
25 | 25 | |||
| 4.875% due 08/30/07 |
185 | 184 | |||
| 4.500% due 09/13/07 |
10 | 10 | |||
| 4.652% due 09/13/07 |
20 | 20 | |||
| 4.770% due 09/13/07 |
225 | 223 | |||
| 4.772% due 09/13/07 |
25 | 25 | |||
| 4.774% due 09/13/07 |
200 | 198 | |||
| Wisconsin Central Transport |
|||||
| 6.625% due 04/15/08 |
325 | 327 | |||
| Total Short-Term Investments |
|||||
| (cost $50,138) |
50,185 | ||||
| Other Securities—10.7% |
|||||
| State Street Securities |
|||||
| Lending Quality Trust (×) |
31,779,066 | 31,779 | |||
| Total Other Securities |
|||||
| (cost $31,779) |
31,779 | ||||
| Total Investments—118.3% |
|||||
| (identified cost $354,268) |
352,415 | ||||
| Other Assets and Liabilities, |
|||||
| Net—(18.3%) |
(54,522 | ) | |||
| Net Assets—100.0% |
297,893 | ||||
See accompanying notes which are an integral part of the financial statements.
Core Bond Fund 57
Table of Contents
Russell Investment Funds
Core Bond Fund
Schedule of Investments, continued—June 30, 2007 (Unaudited)
Amounts in thousands
| Futures Contracts (Number of Contracts) |
Notional Amount |
Unrealized Appreciation (Depreciation) $ |
|||
| Long Positions |
|||||
| Euribor Futures |
|||||
| expiration date 12/07 (6) |
1,938 | (9 | ) | ||
| expiration date 03/08 (12) |
645 | (4 | ) | ||
| expiration date 06/08 (5) |
1,612 | (11 | ) | ||
| expiration date 09/08 (4) |
1,290 | (7 | ) | ||
| expiration date 12/08 (3) |
967 | (7 | ) | ||
| Euro-Bund Futures (Germany) |
|||||
| expiration date 09/07 (17) |
2,543 | (38 | ) | ||
| Eurodollar Futures (CME) |
|||||
| expiration date 09/07 (31) |
7,337 | 3 | |||
| expiration date 12/07 (79) |
18,706 | (91 | ) | ||
| expiration date 03/08 (347) |
82,230 | (378 | ) | ||
| expiration date 06/08 (287) |
68,037 | (310 | ) | ||
| expiration date 09/08 (41) |
9,719 | (19 | ) | ||
| expiration date 12/08 (59) |
13,980 | (33 | ) | ||
| expiration date 03/09 (4) |
947 | (6 | ) | ||
| Euroyen Futures |
|||||
| expiration date 12/07 (1) |
201 | — | |||
| Japanese 10 Year Bond (Japan) |
|||||
| expiration date 09/07 (7) |
7,483 | (14 | ) | ||
| LIBOR Futures |
|||||
| expiration date 09/07 (6) |
1,413 | (14 | ) | ||
| expiration date 12/07 (2) |
471 | (5 | ) | ||
| expiration date 03/08 (8) |
1,881 | (17 | ) | ||
| expiration date 06/08 (6) |
1,411 | (11 | ) | ||
| expiration date 09/08 (2) |
470 | (6 | ) | ||
| Long Gilt Futures (UK) |
|||||
| expiration date 09/07 (2) |
416 | — | |||
| S&P 500 E-Mini Index (CME) |
|||||
| expiration date 09/07 (9) |
682 | (7 | ) | ||
| United States Treasury 2 Year Notes |
|||||
| expiration date 09/07 (13) |
2,649 | (1 | ) | ||
| United States Treasury 5 Year Notes |
|||||
| expiration date 09/07 (137) |
14,259 | (72 | ) | ||
| United States Treasury Bonds |
|||||
| expiration date 09/07 (56) |
6,034 | (56 | ) | ||
| Short Positions |
|||||
| Euro-Bobl Futures (Germany) |
|||||
| expiration date 09/07 (8) |
1,146 | — | |||
| Eurodollar Futures (CME) |
|||||
| expiration date 12/07 (10) |
2,368 | 11 | |||
| United States Treasury 5 Year Notes |
|||||
| expiration date 09/07 (7) |
729 | — | |||
| United States Treasury 10 Year Notes |
|||||
| expiration date 09/07 (118) |
12,473 | 91 | |||
| United States Treasury Bonds |
|||||
| expiration date 09/07 (18) |
1,940 | 6 | |||
| Total Unrealized Appreciation (Depreciation) on Open Futures Contracts |
(1,005 | ) | |||
See accompanying notes which are an integral part of the financial statements.
58 Core Bond Fund
Table of Contents
Russell Investment Funds
Core Bond Fund
Schedule of Investments, continued—June 30, 2007 (Unaudited)
Amounts in thousands
| Options Written (Number of Contracts) |
Notional Amount $ |
Market Value $ |
|||
| Swaptions |
|||||
| (Fund Receives/Fund Pays) |
|||||
| EUR Six Month LIBOR/EUR 4.100% |
|||||
| July 2007 0.00 Call (2) |
2,707 | (40 | ) | ||
| EUR Six Month LIBOR/EUR 4.230% |
|||||
| July 2007 0.00 Call (1) |
1,353 | — | |||
| USD Three Month LIBOR/USD 4.900% |
|||||
| Aug 2007 0.00 Call (3) |
3,000 | — | |||
| USD Three Month LIBOR/USD 5.570% |
|||||
| Aug 2007 0.00 Call (1) |
1,000 | (4 | ) | ||
| USD Three Month LIBOR/USD 5.010% |
|||||
| Oct 2007 0.00 Call (1) |
1,000 | (1 | ) | ||
| USD Three Month LIBOR/USD 4.900% |
|||||
| Feb 2008 0.00 Call (1) |
1,000 | (2 | ) | ||
| USD Three Month LIBOR/USD 5.100% |
|||||
| Feb 2008 0.00 Call (1) |
3,000 | (10 | ) | ||
| USD Three Month LIBOR/USD 4.900% |
|||||
| Mar 2008 0.00 Call (2) |
6,200 | (17 | ) | ||
| USD Three Month LIBOR/USD 4.950% |
|||||
| Mar 2008 0.00 Call (1) |
2,000 | (6 | ) | ||
| USD Three Month LIBOR/USD 4.950% |
|||||
| Sept 2008 0.00 Call (3) |
6,800 | (34 | ) | ||
| USD Three Month LIBOR/USD 5.000% |
|||||
| Dec 2008 0.00 Call (1) |
2,100 | (14 | ) | ||
| USD Three Month LIBOR/USD 5.200% |
|||||
| Dec 2008 0.00 Call (1) |
5,000 | (47 | ) | ||
| United States Treasury Bonds |
|||||
| Aug 2007 111.00 Call (45) |
4,995 | (10 | ) | ||
| Aug 2007 103.00 Put (25) |
2,575 | (4 | ) | ||
| Aug 2007 107.00 Put (30) |
3,210 | (26 | ) | ||
| Aug 2007 109.00 Put (59) |
6,431 | (114 | ) | ||
| United States Treasury Notes |
|||||
| 2 Year Futures |
|||||
| Jul 2007 101.75 Call (31) |
3,154 | (15 | ) | ||
| Aug 2007 101.50 Put (15) |
1,523 | (3 | ) | ||
| 10 Year Futures |
|||||
| Aug 2007 104.00 Call (16) |
1,664 | (31 | ) | ||
| Aug 2007 105.00 Call (31) |
3,255 | (33 | ) | ||
| Aug 2007 103.00 Put (8) |
824 | (1 | ) | ||
| Aug 2007 104.00 Put (16) |
1,664 | (4 | ) | ||
| Total Liability for Options Written |
|||||
| (premiums received $523) |
(416 | ) | |||
See accompanying notes which are an integral part of the financial statements.
Core Bond Fund 59
Table of Contents
Russell Investment Funds
Core Bond Fund
Schedule of Investments, continued—June 30, 2007 (Unaudited)
Amounts in thousands
Foreign Currency Exchange Contracts
| Amount Sold |
Amount Bought |
Settlement Date |
Unrealized Appreciation (Depreciation) $ | |||||||
| USD |
153 | AUD | 182 | 07/12/07 | 1 | |||||
| USD |
155 | AUD | 185 | 07/12/07 | 2 | |||||
| USD |
548 | AUD | 649 | 09/19/07 | 1 | |||||
| USD |
1,006 | AUD | 1,191 | 09/19/07 | 2 | |||||
| USD |
1,453 | AUD | 1,727 | 09/19/07 | 8 | |||||
| USD |
154 | BRL | 318 | 08/02/07 | 10 | |||||
| USD |
155 | BRL | 305 | 09/05/07 | 2 | |||||
| USD |
175 | BRL | 344 | 10/02/07 | 1 | |||||
| USD |
335 | BRL | 660 | 10/02/07 | 3 | |||||
| USD |
230 | CAD | 260 | 07/12/07 | 14 | |||||
| USD |
463 | CAD | 495 | 08/09/07 | 2 | |||||
| USD |
443 | CAD | 469 | 09/19/07 | (1) | |||||
| USD |
1,000 | CAD | 1,056 | 09/19/07 | (7) | |||||
| USD |
1,001 | CAD | 1,056 | 09/19/07 | (8) | |||||
| USD |
548 | CHF | 670 | 09/19/07 | 3 | |||||
| USD |
8 | EUR | 6 | 07/02/07 | — | |||||
| USD |
197 | EUR | 146 | 07/26/07 | 1 | |||||
| USD |
548 | EUR | 407 | 09/19/07 | 4 | |||||
| USD |
1,096 | EUR | 816 | 09/19/07 | 12 | |||||
| USD |
149 | GBP | 75 | 08/14/07 | 2 | |||||
| USD |
670 | GBP | 337 | 09/19/07 | 7 | |||||
| USD |
46 | INR | 1,883 | 10/03/07 | — | |||||
| USD |
74 | INR | 3,065 | 10/03/07 | 1 | |||||
| USD |
548 | JPY | 66,830 | 09/19/07 | 1 | |||||
| USD |
1,088 | JPY | 130,850 | 09/19/07 | (14) | |||||
| USD |
1,096 | JPY | 132,910 | 09/19/07 | (5) | |||||
| USD |
306 | KRW | 284,611 | 07/30/07 | 2 | |||||
| USD |
840 | KRW | 779,730 | 07/30/07 | 5 | |||||
| USD |
155 | KRW | 143,360 | 09/21/07 | 1 | |||||
| USD |
308 | MXN | 3,393 | 09/28/07 | 4 | |||||
| USD |
592 | NZD | 789 | 09/19/07 | 13 | |||||
| USD |
324 | PLN | 929 | 09/28/07 | 10 | |||||
| USD |
720 | PLN | 2,035 | 09/28/07 | 11 | |||||
| USD |
150 | RUB | 3,895 | 09/19/07 | 2 | |||||
| USD |
150 | RUB | 3,896 | 09/19/07 | 2 | |||||
| USD |
720 | RUB | 18,571 | 09/19/07 | 4 | |||||
| USD |
840 | SGD | 1,282 | 07/03/07 | (2) | |||||
| USD |
9 | SGD | 13 | 08/07/07 | — | |||||
| USD |
306 | SGD | 470 | 08/07/07 | 2 | |||||
| USD |
155 | SGD | 235 | 10/03/07 | — | |||||
| USD |
333 | SGD | 507 | 10/03/07 | 1 | |||||
| USD |
503 | SGD | 769 | 10/03/07 | 3 | |||||
| AUD |
648 | USD | 548 | 09/19/07 | — | |||||
| BRL |
699 | USD | 356 | 08/02/07 | (5) | |||||
| BRL |
2,105 | USD | 1,026 | 08/02/07 | (60) | |||||
| CAD |
260 | USD | 229 | 07/12/07 | (16) | |||||
| CHF |
1,587 | EUR | 969 | 09/19/07 | 1 | |||||
| CHF |
1,587 | EUR | 969 | 09/19/07 | 6 | |||||
| CHF |
911 | USD | 742 | 09/19/07 | (9) | |||||
| EUR |
835 | NOK | 6,760 | 09/19/07 | (2) | |||||
| EUR |
835 | NOK | 6,760 | 09/19/07 | 16 | |||||
| EUR |
836 | NOK | 6,760 | 09/19/07 | (5) | |||||
| EUR |
836 | NOK | 6,760 | 09/19/07 | 19 | |||||
| EUR |
121 | USD | 162 | 07/26/07 | (1) | |||||
| EUR |
242 | USD | 325 | 07/26/07 | (3) | |||||
| EUR |
406 | USD | 548 | 09/19/07 | (4) | |||||
| EUR |
441 | USD | 590 | 09/19/07 | (8) | |||||
| GBP |
40 | USD | 80 | 08/09/07 | — | |||||
| GBP |
280 | USD | 551 | 09/19/07 | (11) | |||||
| JPY |
19,177 | USD | 157 | 07/30/07 | 1 | |||||
| JPY |
105,521 | USD | 877 | 09/19/07 | 11 | |||||
| JPY |
172,037 | USD | 1,436 | 09/19/07 | 24 | |||||
| NOK |
3,322 | EUR | 410 | 09/19/07 | (14) | |||||
| NOK |
3,322 | EUR | 410 | 09/19/07 | 6 | |||||
| NZD |
724 | USD | 548 | 09/19/07 | (7) | |||||
| SEK |
679 | USD | 97 | 09/11/07 | (3) | |||||
| SGD |
507 | USD | 330 | 07/03/07 | (1) | |||||
| SGD |
774 | USD | 503 | 07/03/07 | (3) | |||||
| Total Unrealized Appreciation (Depreciation) on Open Foreign Currency Exchange Contracts |
32 | |||||||||
See accompanying notes which are an integral part of the financial statements.
60 Core Bond Fund
Table of Contents
Russell Investment Funds
Core Bond Fund
Schedule of Investments, continued—June 30, 2007 (Unaudited)
Amounts in thousands
Index Swap Contract
| Fund Receives Underlying Security |
Counter Party |
Notional Amount $ |
Fund Pays Floating Rate |
Termination Date |
Unrealized Appreciation (Depreciation) $ |
||||||
| CMBS AAA 10 Yr. Index |
Bank of America | 1,250 | CMBS AAA 10 Yr. |
09/28/07 | (1 | ) | |||||
| CMBS AAA 10 Yr. Index |
Bank of America | 1,000 | CMBS AAA 10 Yr. |
07/16/07 | (1 | ) | |||||
| CMBS AAA 10 Yr. Index |
Bank of America | 700 | CMBS AAA 10 Yr. I |
06/30/07 | (1 | ) | |||||
| CMBS AAA 10 Yr. Index |
Bank of America | 1,000 | CMBS AAA 10 Yr. I |
07/31/07 | (1 | ) | |||||
| CMBS AAA 10 Yr. Index |
Bank of America | 1,000 | CMBS AAA 10 Yr. |
01/31/08 | — | ||||||
| CMBS AAA 10 Yr. Index |
Bank of America | 250 | CMBS AAA 10 Yr. |
08/31/07 | — | ||||||
| CMBS AAA 10 Yr. Index |
Deutsche Bank | 250 | CMBS AAA 10 Yr. |
08/31/07 | — | ||||||
| CMBS AAA 10 Yr. Index |
Deutsche Bank | 1,000 | CMBS AAA 10 Yr. |
11/30/07 | — | ||||||
| CMBS AAA 10 Yr. Index |
JP Morgan | 250 | CMBS AAA 10 Yr. |
08/31/07 | — | ||||||
| Goldman Sachs Total Return |
Citibank | 2,768 | Turkish Overnight Index |
01/20/11 | 8 | ||||||
| Goldman Sachs Total Return |
Citibank | 790 | Turkish Overnight Index |
03/07/12 | 10 | ||||||
| Goldman Sachs Total Return |
Citibank | 84 | Turkish Overnight Index |
07/17/08 | (57 | ) | |||||
| Goldman Sachs Total Return |
Deutsche Bank | 12,120 | Turkish Overnight Index |
03/07/12 | 11 | ||||||
| Total Unrealized Appreciation (Depreciation) on Open Index Swap Contracts |
(32 | ) | |||||||||
See accompanying notes which are an integral part of the financial statements.
Core Bond Fund 61
Table of Contents
Russell Investment Funds
Core Bond Fund
Schedule of Investments, continued—June 30, 2007 (Unaudited)
Amounts in thousands
Interest Rate Swaps Contracts
| Counter Party |
Notional Amount |
Fund Receives |
Fund Pays |
Termination Date |
Market $ |
||||||||
| Bank of America |
USD | 4,600 | 5.000% | Three Month LIBOR | 12/19/09 | (30 | ) | ||||||
| Bank of America |
CAD | 1,240 | Three Month LIBOR | 4.967% | 05/31/10 | 1 | |||||||
| Bank of America |
USD | 6,500 | 5.470% | Three Month LIBOR | 06/14/11 | 7 | |||||||
| Bank of America |
USD | 1,800 | 5.550% | Three Month LIBOR | 06/14/11 | (10 | ) | ||||||
| Bank of America |
AUD | 3,470 | Six Month LIBOR | 6.500% | 12/19/12 | 56 | |||||||
| Bank of America |
USD | 7,900 | 5.000% | Three Month LIBOR | 12/19/12 | (172 | ) | ||||||
| Bank of America |
USD | 6,000 | Three Month LIBOR | 5.000% | 12/19/12 | 131 | |||||||
| Bank of America |
CAD | 780 | 4.955% | Three Month LIBOR | 05/30/13 | (3 | ) | ||||||
| Bank of America |
USD | 500 | Three Month LIBOR | 5.000% | 12/19/17 | 26 | |||||||
| Bank of America |
USD | 2,800 | 5.250% | Three Month LIBOR | 12/19/22 | (149 | ) | ||||||
| Bank of America |
USD | 1,500 | 5.630% | Three Month LIBOR | 06/16/36 | (39 | ) | ||||||
| Bank of America |
USD | 1,000 | 5.250% | Three Month LIBOR | 12/19/37 | (79 | ) | ||||||
| Bank of America |
CAD | 110 | Three Month LIBOR | 4.990% | 05/31/38 | 3 | |||||||
| Barclays Bank PLC |
GBP | 100 | 6.000% | Six Month LIBOR | 12/20/08 | (1 | ) | ||||||
| Barclays Bank PLC |
BRL | 100 | 11.360% | Brazil Interbank Deposit Rate | 01/04/10 | 1 | |||||||
| Barclays Bank PLC |
GBP | 790 | Six Month LIBOR | 5.750% | 12/19/12 | 29 | |||||||
| Barclays Bank PLC |
EUR | 3,800 | 4.250% | Six Month LIBOR | 07/20/16 | (137 | ) | ||||||
| Barclays Bank PLC |
EUR | 750 | 4.500% | Six Month LIBOR | 12/19/17 | (31 | ) | ||||||
| Barclays Bank PLC |
EUR | 450 | Six Month LIBOR | 4.500% | 12/19/17 | 18 | |||||||
| Barclays Bank PLC |
EUR | 210 | Six Month LIBOR | 4.500% | 12/19/17 | 6 | |||||||
| Barclays Bank PLC |
EUR | 90 | Six Month LIBOR | 4.500% | 12/19/17 | 4 | |||||||
| Barclays Bank PLC |
SEK | 4,000 | 4.500% | Three Month LIBOR | 12/19/17 | (24 | ) | ||||||
| Barclays Bank PLC |
SEK | 1,000 | 4.500% | Three Month LIBOR | 12/19/17 | (6 | ) | ||||||
| Barclays Bank PLC |
SEK | 2,000 | 4.500% | Three Month LIBOR | 12/19/17 | (12 | ) | ||||||
| Barclays Bank PLC |
SEK | 37,000 | Three Month LIBOR | 4.500% | 12/19/17 | 231 | |||||||
| Barclays Bank PLC |
SEK | 4,000 | Three Month LIBOR | 4.500% | 12/19/17 | 25 | |||||||
| Barclays Bank PLC |
USD | 1,500 | 5.000% | Three Month LIBOR | 12/19/17 | (10 | ) | ||||||
| Barclays Bank PLC |
GBP | 470 | Six Month LIBOR | 4.750% | 12/19/37 | 55 | |||||||
| BNP Paribas |
EUR | 500 | 2.090% | Consumer Price Index (France) | 12/15/10 | 6 | |||||||
| BNP Paribas |
EUR | 450 | 4.500% | Six Month LIBOR | 12/19/37 | (43 | ) | ||||||
| Citibank |
PLN | 5,000 | 4.670% | Six Month LIBOR | 01/16/09 | (24 | ) | ||||||
| Citibank |
GBP | 790 | 5.750% | Six Month LIBOR | 12/19/12 | (29 | ) | ||||||
| Citibank |
JPY | 30,000 | Six Month LIBOR | 1.500% | 12/19/12 | 3 | |||||||
| Citibank |
JPY | 935,000 | Six Month LIBOR | 1.800% | 09/20/14 | 51 | |||||||
| Citibank |
JPY | 800,000 | Six Month LIBOR | 1.750% | 12/19/14 | 90 | |||||||
| Citibank |
JPY | 441,000 | 2.000% | Six Month LIBOR | 12/19/17 | (53 | ) | ||||||
| Credit Suisse First Boston |
GBP | 100 | 5.000% | Six Month LIBOR | 06/15/09 | (5 | ) | ||||||
| Credit Suisse First Boston |
EUR | 10,090 | 4.500% | Six Month LIBOR | 12/19/09 | (75 | ) | ||||||
| Credit Suisse First Boston |
EUR | 4,520 | Six Month LIBOR | 4.500% | 12/19/12 | 84 | |||||||
| Credit Suisse First Boston |
USD | 2,070 | Three Month LIBOR | 5.000% | 12/19/12 | 45 | |||||||
| Credit Suisse First Boston |
EUR | 2,650 | 4.500% | Six Month LIBOR | 12/19/17 | (108 | ) | ||||||
See accompanying notes which are an integral part of the financial statements.
62 Core Bond Fund
Table of Contents
Russell Investment Funds
Core Bond Fund
Schedule of Investments, continued—June 30, 2007 (Unaudited)
Amounts in thousands
Interest Rate Swaps Contracts
| Counter Party |
Notional Amount |
Fund Receives |
Fund Pays |
Termination Date |
Market Value $ |
||||||||
| Credit Suisse First Boston |
EUR | 160 | Six Month LIBOR | 4.500% | 12/19/17 | 7 | |||||||
| Credit Suisse First Boston |
EUR | 350 | Six Month LIBOR | 4.500% | 12/19/17 | 14 | |||||||
| Credit Suisse First Boston |
EUR | 90 | Six Month LIBOR | 4.500% | 12/19/17 | 4 | |||||||
| Credit Suisse First Boston |
GBP | 510 | Six Month LIBOR | 5.500% | 12/19/17 | 28 | |||||||
| Credit Suisse First Boston |
SEK | 2,000 | 4.500% | Three Month LIBOR | 12/19/17 | (12 | ) | ||||||
| Credit Suisse First Boston |
SEK | 3,000 | 4.500% | Three Month LIBOR | 12/19/17 | (18 | ) | ||||||
| Credit Suisse First Boston |
SEK | 1,000 | 4.500% | Three Month LIBOR | 12/19/17 | (6 | ) | ||||||
| Credit Suisse First Boston |
SEK | 15,000 | Three Month LIBOR | 4.500% | 12/19/17 | 94 | |||||||
| Credit Suisse First Boston |
EUR | 840 | 4.500% | Six Month LIBOR | 12/19/37 | (81 | ) | ||||||
| Credit Suisse First Boston |
EUR | 1,390 | Six Month LIBOR | 4.500% | 12/19/37 | 133 | |||||||
| Credit Suisse First Boston |
GBP | 500 | Six Month LIBOR | 4.750% | 12/19/37 | 60 | |||||||
| Deutsche Bank AG |
USD | 7,200 | 5.000% | Three Month LIBOR | 12/19/08 | (22 | ) | ||||||
| Deutsche Bank AG |
JPY | 70,000 | 1.000% | Six Month LIBOR | 03/18/09 | (2 | ) | ||||||
| Deutsche Bank AG |
EUR | 2,850 | 4.545% | Six Month LIBOR | 10/16/09 | (16 | ) | ||||||
| Deutsche Bank AG |
EUR | 10,010 | 4.360% | Six Month LIBOR | 10/16/09 | (103 | ) | ||||||
| Deutsche Bank AG |
EUR | 4,010 | 4.395% | Six Month LIBOR | 10/16/09 | (38 | ) | ||||||
| Deutsche Bank AG |
EUR | 4,020 | 4.401% | Six Month LIBOR | 10/16/09 | (37 | ) | ||||||
| Deutsche Bank AG |
EUR | 2,010 | 4.363% | Six Month LIBOR | 10/16/09 | (20 | ) | ||||||
| Deutsche Bank AG |
EUR | 4,030 | 4.845% | Six Month LIBOR | 12/19/09 | 5 | |||||||
| Deutsche Bank AG |
USD | 31,300 | 5.000% | Three Month LIBOR | 12/19/09 | (206 | ) | ||||||
| Deutsche Bank AG |
EUR | 6,050 | 4.872% | Six Month LIBOR | 12/19/09 | 11 | |||||||
| Deutsche Bank AG |
CAD | 260 | 4.318% | Three Month LIBOR | 04/04/12 | (7 | ) | ||||||
| Deutsche Bank AG |
CAD | 260 | 4.328% | Three Month LIBOR | 04/05/12 | (7 | ) | ||||||
| Deutsche Bank AG |
NZD | 410 | 7.598% | Three Month LIBOR | 04/10/12 | 6 | |||||||
| Deutsche Bank AG |
CAD | 230 | 4.483% | Three Month LIBOR | 05/09/12 | (5 | ) | ||||||
| Deutsche Bank AG |
CAD | 200 | 4.484% | Three Month LIBOR | 05/09/12 | (4 | ) | ||||||
| Deutsche Bank AG |
CAD | 190 | 4.492% | Three Month LIBOR | 05/11/12 | (4 | ) | ||||||
| Deutsche Bank AG |
NZD | 300 | Three Month LIBOR | 7.660% | 05/11/12 | 3 | |||||||
| Deutsche Bank AG |
NZD | 340 | Three Month LIBOR | 7.660% | 05/11/12 | 4 | |||||||
| Deutsche Bank AG |
NZD | 340 | Three Month LIBOR | 7.660% | 05/15/12 | 4 | |||||||
| Deutsche Bank AG |
AUD | 3,750 | 6.500% | Six Month LIBOR | 12/19/12 | (56 | ) | ||||||
| Deutsche Bank AG |
EUR | 2,700 | Six Month LIBOR | 4.440% | 10/16/14 | 83 | |||||||
| Deutsche Bank AG |
EUR | 2,700 | Six Month LIBOR | 4.435% | 10/16/14 | 85 | |||||||
| Deutsche Bank AG |
EUR | 6,750 | Six Month LIBOR | 4.380% | 10/16/14 | 240 | |||||||
| Deutsche Bank AG |
EUR | 1,350 | Six Month LIBOR | 4.380% | 10/16/14 | 48 | |||||||
See accompanying notes which are an integral part of the financial statements.
Core Bond Fund 63
Table of Contents
Russell Investment Funds
Core Bond Fund
Schedule of Investments, continued—June 30, 2007 (Unaudited)
Amounts in thousands
Interest Rate Swaps Contracts
| Counter Party |
Notional Amount |
Fund Receives |
Fund Pays |
Termination Date |
Market Value $ |
||||||||
| Deutsche Bank AG |
EUR | 1,930 | Six Month LIBOR | 4.530% | 10/19/14 | 45 | |||||||
| Deutsche Bank AG |
EUR | 2,760 | 4.648% | Six Month LIBOR | 12/19/14 | (14 | ) | ||||||
| Deutsche Bank AG |
EUR | 4,140 | Six Month LIBOR | 4.936% | 12/19/14 | 28 | |||||||
| Deutsche Bank AG |
JPY | 265,000 | 1.750% | Six Month LIBOR | 12/19/14 | (42 | ) | ||||||
| Deutsche Bank AG |
EUR | 1,490 | 4.500% | Six Month LIBOR | 12/19/17 | (61 | ) | ||||||
| Deutsche Bank AG |
EUR | 900 | Six Month LIBOR | 4.500% | 12/19/17 | 36 | |||||||
| Deutsche Bank AG |
JPY | 266,000 | Six Month LIBOR | 2.000% | 12/19/17 | 32 | |||||||
| Deutsche Bank AG |
SEK | 3,000 | Three Month LIBOR | 4.500% | 12/19/17 | 19 | |||||||
| Deutsche Bank AG |
USD | 1,700 | Three Month LIBOR | 5.000% | 12/19/17 | 87 | |||||||
| Deutsche Bank AG |
EUR | 1,500 | 4.568% | Six Month LIBOR | 10/16/37 | (123 | ) | ||||||
| Deutsche Bank AG |
EUR | 600 | 4.631% | Six Month LIBOR | 10/16/37 | (41 | ) | ||||||
| Deutsche Bank AG |
EUR | 600 | 4.641% | Six Month LIBOR | 10/16/37 | (40 | ) | ||||||
| Deutsche Bank AG |
EUR | 300 | 4.573% | Six Month LIBOR | 10/16/37 | (24 | ) | ||||||
| Deutsche Bank AG |
EUR | 430 | 4.534% | Six Month LIBOR | 10/16/37 | (25 | ) | ||||||
| Deutsche Bank AG |
EUR | 960 | 5.084% | Six Month LIBOR | 12/19/37 | 23 | |||||||
| Deutsche Bank AG |
EUR | 640 | 5.070% | Six Month LIBOR | 12/21/37 | 13 | |||||||
| Goldman Sachs |
GBP | 900 | 5.000% | Six Month LIBOR | 06/15/09 | (42 | ) | ||||||
| Goldman Sachs |
GBP | 500 | 6.000% | Six Month LIBOR | 06/19/09 | (3 | ) | ||||||
| Mexico Interbank 28 Day | |||||||||||||
| Goldman Sachs |
MXN | 1,500 | 7.780% | Deposit Rate | 04/03/12 | (1 | ) | ||||||
| HSBC |
GBP | 1,700 | 4.500% | Six Month LIBOR | 12/20/07 | (26 | ) | ||||||
| JP Morgan |
BRL | 4,700 | 10.750% | Three Month LIBOR | 01/04/10 | 2 | |||||||
| JP Morgan |
USD | 6,100 | 5.000% | Three Month LIBOR | 12/19/10 | (67 | ) | ||||||
| JP Morgan |
EUR | 500 | 1.958% | Consumer Price Index (France) | 04/10/12 | (5 | ) | ||||||
| JP Morgan |
USD | 9,200 | 5.000% | Three Month LIBOR | 06/20/12 | (196 | ) | ||||||
| JP Morgan |
USD | 17,000 | 5.000% | Three Month LIBOR | 12/19/14 | (572 | ) | ||||||
| JP Morgan |
USD | 8,500 | Three Month LIBOR | 5.000% | 12/19/12 | 186 | |||||||
| JP Morgan |
USD | 500 | 5.000% | Three Month LIBOR | 12/19/37 | (57 | ) | ||||||
| Merrill Lynch |
BRL | 200 | 12.948% | Brazil Interbank Deposit Rate | 01/04/10 | 3 | |||||||
| Merrill Lynch |
GBP | 100 | 4.000% | Six Month LIBOR | 12/15/35 | 9 | |||||||
| Merrill Lynch |
GBP | 500 | Six Month LIBOR | 4.750% | 12/19/37 | 60 | |||||||
| Morgan Stanley |
USD | 2,600 | 5.000% | Three Month LIBOR | 06/20/09 | (18 | ) | ||||||
| Morgan Stanley |
USD | 500 | Three Month LIBOR | 5.000% | 12/19/17 | 26 | |||||||
| Morgan Stanley |
USD | 300 | 5.000% | Three Month LIBOR | 12/19/37 | (34 | ) | ||||||
| Royal Bank of Scotland |
USD | 7,200 | 5.000% | Three Month LIBOR | 12/19/08 | (22 | ) | ||||||
| Royal Bank of Scotland |
USD | 4,900 | 5.000% | Three Month LIBOR | 06/20/09 | (34 | ) | ||||||
| Royal Bank of Scotland |
EUR | 100 | 1.960% | Consumer Price Index (France) | 03/28/12 | (1 | ) | ||||||
| Royal Bank of Scotland |
GBP | 100 | Six Month LIBOR | 4.000% | 12/15/36 | 36 | |||||||
| UBS Securities |
JPY | 480,000 | 1.000% | Six Month LIBOR | 03/18/09 | (13 | ) | ||||||
| Total Market Value of Open Interest Rate Swap Contracts Premiums Paid (Received)—$(947) |
(839 | ) | |||||||||||
See accompanying notes which are an integral part of the financial statements.
64 Core Bond Fund
Table of Contents
Russell Investment Funds
Core Bond Fund
Schedule of Investments, continued—June 30, 2007 (Unaudited)
Amounts in thousands
Credit Default Swap Contracts
| Reference Entity |
Counter Party |
Notional Amount $ |
Fund (Pays)/ Receives |
Termination Date |
Market Value $ |
|||||||||
| Amkor Technology, Inc. |
Lehman Brothers | USD | 135 | 3.950 | % | 09/20/12 | (2 | ) | ||||||
| Anadarko Petroleum Corp. |
Goldman Sachs | USD | 100 | 0.150 | % | 03/20/08 | — | |||||||
| Brazil Government International Bond |
Citibank | USD | 800 | (1.500 | %) | 08/20/11 | 21 | |||||||
| Core Investment Grade Bond |
Bank of America | USD | 6,300 | (0.350 | %) | 06/20/16 | (19 | ) | ||||||
| Core Investment Grade Bond |
Bank of America | USD | 1,000 | (0.650 | %) | 12/20/16 | (3 | ) | ||||||
| Core Investment Grade Bond |
Bank of America | USD | 3,000 | (0.650 | %) | 12/20/16 | (20 | ) | ||||||
| Core Investment Grade Bond |
JP Morgan | USD | 10,000 | (0.400 | %) | 12/20/11 | 2 | |||||||
| Core Investment Grade Bond |
JP Morgan | USD | 1,000 | (0.650 | %) | 12/20/16 | (3 | ) | ||||||
| Core Investment Grade Bond |
JP Morgan | USD | 4,000 | (0.650 | %) | 12/20/16 | (13 | ) | ||||||
| Countrywide Home Loan |
Lehman Brothers | USD | 960 | 0.480 | % | 06/20/12 | (7 | ) | ||||||
| Countrywide Home Loan |
Lehman Brothers | USD | 565 | (0.710 | %) | 06/20/12 | — | |||||||
| Dow Jones CDX High Volatility Index |
Deutsche Bank AG | USD | 200 | (0.600 | %) | 06/20/17 | (2 | ) | ||||||
| Dow Jones CDX High Volatility Index |
Goldman Sachs | USD | 2,000 | (0.650 | %) | 12/20/16 | (7 | ) | ||||||
| Dow Jones CDX High Volatility Index |
Goldman Sachs | USD | 800 | (0.600 | %) | 06/20/17 | (7 | ) | ||||||
| Dow Jones CDX High Volatility Index |
Lehman Brothers | USD | 250 | (2.750 | %) | 06/20/12 | (6 | ) | ||||||
| Dow Jones CDX High Volatility Index |
Lehman Brothers | USD | 445 | (2.750 | %) | 06/20/12 | (15 | ) | ||||||
| Ford Motor Credit Co. |
Lehman Brothers | USD | 200 | 1.200 | % | 03/20/08 | — | |||||||
| Ford Motor Credit Co. |
Lehman Brothers | USD | 210 | 1.100 | % | 03/20/08 | — | |||||||
| Ford Motor Credit Co. |
Lehman Brothers | USD | 100 | 2.200 | % | 03/20/08 | 1 | |||||||
| Gaz Capital for Gazprom |
Morgan Stanley | USD | 200 | 0.570 | % | 07/20/07 | 1 | |||||||
| GMAC |
Morgan Stanley | USD | 1,000 | 0.970 | % | 09/20/08 | (3 | ) | ||||||
| Indonesia Government International Bond |
Lehman Brothers | USD | 100 | 0.400 | % | 12/20/08 | — | |||||||
| International Paper |
Lehman Brothers | USD | 510 | (0.340 | %) | 06/20/12 | — | |||||||
| Panama Government International Bond |
Morgan Stanley | USD | 100 | 0.750 | % | 01/20/12 | 1 | |||||||
| Russia Government International Bond |
Deutsche Bank AG | USD | 1,000 | 0.260 | % | 12/20/07 | — | |||||||
| Russia Government International Bond |
Morgan Stanley | USD | 100 | 0.245 | % | 06/20/08 | — | |||||||
| Softbank Corp. |
Deutsche Bank AG | JPY | 7,000 | 2.300 | % | 09/20/07 | — | |||||||
| Temple-Inland Inc. |
Lehman Brothers | USD | 200 | (0.740 | %) | 03/20/12 | (1 | ) | ||||||
| Verizon Communications |
Lehman Brothers | USD | 850 | (0.180 | %) | 06/20/12 | (1 | ) | ||||||
| Total Market Value of Open Credit Default Swap Contracts Premiums Paid (Received)—($93) |
(83 | ) | ||||||||||||
See accompanying notes which are an integral part of the financial statements.
Core Bond Fund 65
Table of Contents
Russell Investment Funds
Core Bond Fund
Presentation of Portfolio Holdings—June 30, 2007 (Unaudited)
| Categories |
% of Net Assets |
||
| Asset-Backed Securities |
4.7 | ||
| Certificates of Deposit |
1.0 | ||
| Corporate Bonds and Notes |
16.4 | ||
| International Debt |
5.8 | ||
| Loan Agreements |
0.8 | ||
| Mortgage-Backed Securities |
52.4 | ||
| Non-US Bonds |
0.2 | ||
| United States Government Agencies |
3.6 | ||
| United States Government Treasuries |
5.4 | ||
| Preferred Stocks |
0.3 | ||
| Warrants & Rights |
— | * | |
| Options Purchased |
0.2 | * | |
| Short-Term Investments |
16.8 | ||
| Other Securities |
10.7 | ||
| Total Investments |
118.3 | ||
| Other Assets and Liabilities, Net |
(18.3 | ) | |
| 100.0 | |||
| Futures Contracts |
(0.3 | ) | |
| Options Written |
(0.1 | ) | |
| Foreign Currency Exchange Contracts |
— | * | |
| Index Swap Contracts |
(— | )* | |
| Interest Rate Swap Contracts |
(0.3 | ) | |
| Credit Default Swap Contracts |
(— | )* |
| * | Less than .05% of net assets |
See accompanying notes which are an integral part of the financial statements.
66 Core Bond Fund
Table of Contents
Notes to Schedules of Investments—June 30, 2007 (Unaudited)
Footnotes:
| (Æ) | Nonincome-producing security. |
| (Ï) | Forward commitment. |
| (Ê) | Adjustable or floating rate security. Rate shown reflects rate in effect at period end. |
| (f) | Perpetual floating rate security. Rate shown reflects rate in effect at period end. |
| (ö) | Real Estate Investment Trust (REIT). |
| (µ) | Bond is insured by a guarantor. |
| (ß) | Illiquid security. |
| (Ø) | In default. |
| (ç) | At amortized cost, which approximates market. |
| (ž) | Rate noted is yield-to-maturity from date of acquisition. |
| (æ) | Pre-refunded: These bonds are collateralized by US Treasury securities, which are held in escrow by a trustee and used to pay principal and interest in the tax-exempt issue and to retire the bonds in full at the earliest refunding date. |
| (§) | All or a portion of the shares of this security are held as collateral in connection with futures contracts purchased (sold), options written, or swaps entered into by the Fund. |
| (×) | The security is purchased with the cash collateral from the securities loaned. |
| (Ñ) | All or a portion of the shares of this security are on loan. |
| (Þ) | Restricted security. Security may have contractual restrictions on resale, may have been offered in a private placement transaction, and may not be registered under the Securities Act of 1933. |
| (Å) | Illiquid and restricted security. |
| Abbreviations: |
| ADR - American Depositary Receipt |
| ADS - American Depositary Share |
| CIBOR -Copenhagen Interbank Offered Rate |
| CME - Chicago Mercantile Exchange |
| CMO - Collateralized Mortgage Obligation |
| CVO - Contingent Value Obligation |
| FDIC - Federal Deposit Insurance Company |
| GDR - Global Depositary Receipt |
| GDS - Global Depositary Share |
| LIBOR - London Interbank Offered Rate |
| NIBOR - Norwegian Interbank Offered Rate |
| PIK - Payment in Kind |
| REMIC - Real Estate Mortgage Investment Conduit |
| STRIP - Separate Trading of Registered Interest and Principal of Securities |
| TBA - To Be Announced Security |
| Foreign Currency Abbreviations: | ||||
| ARS - Argentine peso |
HKD - Hong Kong dollar | PHP - Philippine peso | ||
| AUD - Australian dollar |
HUF - Hungarian forint | PKR - Pakistani rupee | ||
| BRL - Brazilian real |
IDR - Indonesian rupiah | PLN - Polish zloty | ||
| CAD - Canadian dollar |
ILS - Israeli shekel | RUB - Russian ruble | ||
| CHF - Swiss franc |
INR - Indian rupee | SEK - Swedish krona | ||
| CLP - Chilean peso |
ISK - Iceland krona | SGD - Singapore dollar | ||
| CNY - Chinese renminbi yuan |
JPY - Japanese yen | SKK - Slovakian koruna | ||
| COP - Colombian peso |
KES - Kenyan schilling | THB - Thai baht | ||
| CRC - Costa Rica colon |
KRW - South Korean won | TRY - Turkish lira | ||
| CZK - Czech koruna |
MXN - Mexican peso | TWD - Taiwanese dollar | ||
| DKK - Danish krone |
MYR - Malaysian ringgit | USD - United States dollar | ||
| EGP - Egyptian pound |
NOK - Norwegian krone | VEB - Venezuelan bolivar | ||
| EUR - Euro |
NZD - New Zealand dollar | VND - Vietnamese dong | ||
| GBP - British pound sterling |
PEN - Peruvian nouveau sol | ZAR - South African rand | ||
Notes to Schedules of Investments 67
Table of Contents
Statement of Assets and Liabilities—June 30, 2007 (Unaudited)
| Amounts in thousands |
Multi-Style Equity Fund |
|||
| Assets |
||||
| Investments, at identified cost |
$ | 454,155 | ||
| Investments, at market*** |
509,262 | |||
| Cash |
— | |||
| Cash (restricted) |
— | |||
| Foreign currency holdings* |
— | |||
| Unrealized appreciation on foreign currency exchange contracts |
— | |||
| Receivables: |
||||
| Dividends and interest |
487 | |||
| Dividends from affiliated money market funds |
88 | |||
| Investments sold |
6,808 | |||
| Fund shares sold |
332 | |||
| Foreign taxes recoverable |
— | |||
| From Manager |
— | |||
| Daily variation margin on futures contracts |
— | |||
| Prepaid expenses |
6 | |||
| Unrealized appreciation on index swap contracts |
— | |||
| Interest rate swap contracts, at market value**** |
— | |||
| Credit default swap contracts, at market value***** |
— | |||
| Total assets |
516,983 | |||
| Liabilities |
||||
| Payables: |
||||
| Due to custodian |
— | |||
| Investments purchased |
7,073 | |||
| Fund shares redeemed |
292 | |||
| Accrued fees to affiliates |
321 | |||
| Other accrued expenses |
56 | |||
| Daily variation margin on futures contracts |
33 | |||
| Unrealized depreciation on foreign currency exchange contracts |
— | |||
| Options written, at market value** |
— | |||
| Payable upon return of securities loaned |
44,937 | |||
| Unrealized depreciation on index swap contracts |
— | |||
| Interest rate swap contracts, at market value**** |
— | |||
| Credit default swap contracts, at market value***** |
— | |||
| Total liabilities |
52,712 | |||
| Net Assets |
$ | 464,271 | ||
| Net Assets Consist of: |
||||
| Undistributed (overdistributed) net investment income |
$ | 1,069 | ||
| Accumulated net realized gain (loss) |
3,681 | |||
| Unrealized appreciation (depreciation) on: |
||||
| Investments |
55,107 | |||
| Futures contracts |
(195 | ) | ||
| Options written |
— | |||
| Credit default swap contracts |
— | |||
| Index swap contracts |
— | |||
| Interest rate swap contracts |
— | |||
| Foreign currency-related transactions |
— | |||
| Shares of beneficial interest |
289 | |||
| Additional paid-in capital |
404,320 | |||
| Net Assets |
$ | 464,271 | ||
See accompanying notes which are an integral part of the financial statements.
68 Statement of Assets and Liabilities
Table of Contents
| Aggressive Equity Fund |
Non-U.S. Fund |
Real Estate Securities Fund |
Core Bond Fund |
|||||||||
| $ | 285,514 | $ | 414,965 | $ | 437,170 | $ | 354,268 | |||||
| 312,807 | 475,556 | 584,342 | 352,415 | |||||||||
| — | 96 | — | 733 | |||||||||
| — | 2,344 | — | — | |||||||||
| — | 1,668 | — | 428 | |||||||||
| — | 1,973 | — | 221 | |||||||||
| 236 | 638 | 1,723 | 1,989 | |||||||||
| 28 | 138 | 64 | 121 | |||||||||
| 2,367 | 2,574 | 6,572 | 22,750 | |||||||||
| 70 | 150 | 350 | 558 | |||||||||
| — | 63 | — | — | |||||||||
| 23 | 11 | — | 26 | |||||||||
| — | 303 | — | 235 | |||||||||
| 3 | 8 | 11 | 4 | |||||||||
| — | — | — | 29 | |||||||||
| — | — | — | 2,309 | |||||||||
| — | — | — | 27 | |||||||||
| 315,534 | 485,522 | 593,062 | 381,845 | |||||||||
| 7 | — | 81 | — | |||||||||
| 2,388 | 4,651 | 7,004 | 47,998 | |||||||||
| 101 | 298 | 850 | 1 | |||||||||
| 192 | 328 | 435 | 147 | |||||||||
| 50 | 112 | 40 | 32 | |||||||||
| 26 | — | — | 71 | |||||||||
| — | 1,875 | 1 | 189 | |||||||||
| — | 304 | — | 416 | |||||||||
| 70,084 | 55,266 | — | 31,779 | |||||||||
| — | — | — | 61 | |||||||||
| — | 18 | — | 3,148 | |||||||||
| — | — | — | 110 | |||||||||
| 72,848 | 62,852 | 8,411 | 83,952 | |||||||||
| $ | 242,686 | $ | 422,670 | $ | 584,651 | $ | 297,893 | |||||
| $ | 339 | $ | 3,325 | $ | 2,288 | $ | 4,824 | |||||
| 12,015 | 32,424 | 32,772 | (4,325 | ) | ||||||||
| 27,293 | 60,591 | 147,172 | (1,853 | ) | ||||||||
| (55) | 667 | — | (1,005 | ) | ||||||||
| — | (6 | ) | — | 107 | ||||||||
| — | — | — | 10 | |||||||||
| — | (18 | ) | — | (32 | ) | |||||||
| — | — | — | 108 | |||||||||
| — | 91 | — | 42 | |||||||||
| 162 | 282 | 298 | 294 | |||||||||
| 202,932 | 325,314 | 402,121 | 299,723 | |||||||||
| $ | 242,686 | $ | 422,670 | $ | 584,651 | $ | 297,893 | |||||
See accompanying notes which are an integral part of the financial statements.
Statement of Assets and Liabilities 69
Table of Contents
Russell Investment Funds
Statement of Assets and Liabilities, continued—June 30, 2007 (Unaudited)
| Multi-Style Equity Fund | |||||
| Net Asset Value, offering and redemption price per share: |
|||||
| Net asset value per share****** |
$ | 16.05 | |||
| Net assets |
$ | 464,270,676 | |||
| Shares outstanding ($.01 par value) |
28,933,656 | ||||
| Amounts in thousands |
|||||
| * Foreign currency holdings - cost |
$ | — | |||
| ** Premiums received on options written |
$ | — | |||
| *** Securities on loan included in investments |
$ | 47,303 | |||
| **** Interest rate swap contracts - premiums paid (received) |
$ | — | |||
| ***** Credit default swap contracts - premiums paid (received) |
$ | — | |||
| ****** Net asset value per share equals net assets divided by shares of outstanding. |
|||||
See accompanying notes which are an integral part of the financial statements.
70 Statement of Assets and Liabilities
Table of Contents
| Aggressive Equity Fund |
Non-U.S. Fund |
Real Estate Securities Fund |
Core Bond Fund |
||||||||
| $ | 14.99 | $ | 14.97 | $ | 19.63 | $ | 10.15 | ||||
| $ | 242,686,440 | $ | 422,670,128 | $ | 584,651,253 | $ | 297,892,894 | ||||
| 16,192,627 | 28,233,280 | 29,781,025 | 29,360,023 | ||||||||
| $ | — | $ | 1,659 | $ | — | $ | 424 | ||||
| $ | — | $ | 298 | $ | — | $ | 523 | ||||
| $ | 69,023 | $ | 53,592 | $ | — | $ | 31,259 | ||||
| $ | — | $ | — | $ | — | $ | (947 | ) | |||
| $ | — | $ | — | $ | — | $ | (93 | ) | |||
See accompanying notes which are an integral part of the financial statements.
Statement of Assets and Liabilities 71
Table of Contents
Statement of Operations—For the Period Ended June 30, 2007 (Unaudited)
| Amounts in thousands |
Multi-Style Equity Fund |
|||
| Investment Income |
||||
| Dividends |
$ | 3,493 | ||
| Dividends from affiliated money market funds |
584 | |||
| Interest |
29 | |||
| Securities lending income |
61 | |||
| Less foreign taxes withheld |
— | |||
| Total investment income |
4,167 | |||
| Expenses |
||||
| Management fees |
1,706 | |||
| Custodian fees |
122 | |||
| Transfer agent fees |
10 | |||
| Professional fees |
21 | |||
| Trustees’ fees |
4 | |||
| Printing fees |
3 | |||
| Miscellaneous |
7 | |||
| Expenses before reductions |
1,873 | |||
| Expense reductions |
(1 | ) | ||
| Net expenses |
1,872 | |||
| Net investment income (loss) |
2,295 | |||
| Net Realized and Unrealized Gain (Loss) |
||||
| Net realized gain (loss) on: |
||||
| Investments |
25,457 | |||
| Futures contracts |
1,521 | |||
| Options written |
— | |||
| Credit default swap contracts |
— | |||
| Index swap contracts |
— | |||
| Interest rate swap contracts |
— | |||
| Foreign currency-related transactions |
— | |||
| Net realized gain (loss) |
26,978 | |||
| Net change in unrealized appreciation (depreciation) on: |
||||
| Investments |
5,020 | |||
| Futures contracts |
(42 | ) | ||
| Options written |
— | |||
| Credit default swap contracts |
— | |||
| Index swap contracts |
— | |||
| Interest rate swap contracts |
— | |||
| Foreign currency-related transactions |
— | |||
| Net change in unrealized appreciation (depreciation) |
4,978 | |||
| Net realized and unrealized gain (loss) |
31,956 | |||
| Net Increase (Decrease) in Net Assets from Operations |
$ | 34,251 | ||
See accompanying notes which are an integral part of the financial statements.
72 Statement of Operations
Table of Contents
| Aggressive Equity Fund |
Non-U.S. Fund |
Real Estate Securities Fund |
Core Bond Fund |
||||||||||
| $ | 1,365 | $ | 7,024 | $ | 6,815 | $ | 48 | ||||||
| 234 | 812 | 507 | 657 | ||||||||||
| 99 | 45 | — | 7,848 | ||||||||||
| 16 | 161 | 50 | 25 | ||||||||||
| — | (642 | ) | — | — | |||||||||
| 1,714 | 7,400 | 7,372 | 8,578 | ||||||||||
| 1,106 | 1,860 | 2,752 | 837 | ||||||||||
| 172 | 418 | 94 | 169 | ||||||||||
| 5 | 9 | 14 | 6 | ||||||||||
| 21 | 30 | 21 | 18 | ||||||||||
| 2 | 4 | 6 | 3 | ||||||||||
| 2 | 2 | 4 | 2 | ||||||||||
| 4 | 14 | 10 | 3 | ||||||||||
| 1,312 | 2,337 | 2,901 | 1,038 | ||||||||||
| (89) | (86 | ) | (2 | ) | (62 | ) | |||||||
| 1,223 | 2,251 | 2,899 | 976 | ||||||||||
| 491 | 5,149 | 4,473 | 7,602 | ||||||||||
| 13,224 | 31,386 | 33,500 | 712 | ||||||||||
| 418 | 3,029 | — | (739 | ) | |||||||||
| — | (566 | ) | — | (32 | ) | ||||||||
| — | — | — | (85 | ) | |||||||||
| — | 88 | — | 234 | ||||||||||
| — | — | — | (972 | ) | |||||||||
| — | 237 | 49 | (205 | ) | |||||||||
| 13,642 | 34,174 | 33,549 | (1,087 | ) | |||||||||
| 4,879 | (2,425 | ) | (80,573 | ) | (3,325 | ) | |||||||
| 12 | 216 | — | (665 | ) | |||||||||
| — | 5 | — | 216 | ||||||||||
| — | — | — | (80 | ) | |||||||||
| — | (18 | ) | — | (52 | ) | ||||||||
| — | — | — | 416 | ||||||||||
| — | 198 | — | (61 | ) | |||||||||
| 4,891 | (2,024 | ) | (80,573 | ) | (3,551 | ) | |||||||
| 18,533 | 32,150 | (47,024 | ) | (4,638 | ) | ||||||||
| $ | 19,024 | $ | 37,299 | $ | (42,551 | ) | $ | 2,964 | |||||
See accompanying notes which are an integral part of the financial statements.
75 Statement of Operations
Table of Contents
Statement of Changes in Net Assets
| Multi-Style Equity Fund |
||||||||
| Amounts in thousands |
Period Ended June 30, 2007 (Unaudited) |
Year Ended |
||||||
| Increase (Decrease) in Net Assets |
||||||||
| Operations |
||||||||
| Net investment income (loss) |
$ | 2,295 | $ | 3,896 | ||||
| Net realized gain (loss) |
26,978 | 28,237 | ||||||
| Net change in unrealized appreciation (depreciation) |
4,978 | 13,801 | ||||||
| Net increase (decrease) in net assets from operations |
34,251 | 45,934 | ||||||
| Distributions |
||||||||
| From net investment income |
(2,368 | ) | (3,606 | ) | ||||
| From net realized gain |
— | — | ||||||
| Net decrease in net assets from distributions |
(2,368 | ) | (3,606 | ) | ||||
| Share Transactions |
||||||||
| Net increase (decrease) in net assets from share transactions |
14,881 | 25,520 | ||||||
| Total Net Increase (Decrease) in Net Assets |
46,764 | 67,848 | ||||||
| Net Assets |
||||||||
| Beginning of period |
417,507 | 349,659 | ||||||
| End of period |
$ | 464,271 | $ | 417,507 | ||||
| Undistributed (overdistributed) net investment income included in net assets |
$ | 1,069 | $ | 1,142 | ||||
See accompanying notes which are an integral part of the financial statements.
74 Statement of Changes in Net Assets
Table of Contents
| Aggressive Equity Fund |
Non-U.S. Fund |
Real Estate Securities Fund |
Core Bond Fund |
|||||||||||||||||||||||||||
| Period Ended June 30, 2007 (Unaudited) |
Year Ended December 31, 2006 |
Period Ended June 30, 2007 (Unaudited) |
Year Ended December 31, 2006 |
Period Ended June 30, 2007 (Unaudited) |
Year Ended December 31, 2006 |
Period Ended June 30, 2007 (Unaudited) |
Year Ended December 31, 2006 |
|||||||||||||||||||||||
| $ | 491 | $ | 352 | $ | 5,149 | $ | 5,611 | $ | 4,473 | $ | 9,841 | $ | 7,602 | $ | 10,499 | |||||||||||||||
| 13,642 | 36,184 | 34,174 | 65,969 | 33,549 | 48,221 | (1,087 | ) | (2,016 | ) | |||||||||||||||||||||
| 4,891 | (6,802 | ) | (2,024 | ) | (523 | ) | (80,573 | ) | 101,743 | (3,551 | ) | 439 | ||||||||||||||||||
| 19,024 | 29,734 | 37,299 | 71,057 | (42,551 | ) | 159,805 | 2,964 | 8,922 | ||||||||||||||||||||||
| (152 | ) | (423 | ) | (1,137 | ) | (8,763 | ) | (2,185 | ) | (10,448 | ) | (2,832 | ) | (10,963 | ) | |||||||||||||||
| (9,998 | ) | (30,314 | ) | (34,813 | ) | (7,690 | ) | (9,102 | ) | (44,446 | ) | — | — | |||||||||||||||||
| (10,150 | ) | (30,737 | ) | (35,950 | ) | (16,453 | ) | (11,287 | ) | (54,894 | ) | (2,832 | ) | (10,963 | ) | |||||||||||||||
| 10,166 | 20,357 | 51,437 | 13,019 | 13,012 | 77,474 | 31,978 | 51,050 | |||||||||||||||||||||||
| 19,040 | 19,354 | 52,786 | 67,623 | (40,826 | ) | 182,385 | 32,110 | 49,009 | ||||||||||||||||||||||
| 223,646 | 204,292 | 369,884 | 302,261 | 625,477 | 443,092 | 265,783 | 216,774 | |||||||||||||||||||||||
| $ | 242,686 | $ | 223,646 | $ | 422,670 | $ | 369,884 | $ | 584,651 | $ | 625,477 | $ | 297,893 | $ | 265,783 | |||||||||||||||
| $ | 339 | $ | — | $ | 3,325 | $ | (687 | ) | $ | 2,288 | $ | — | $ | 4,824 | $ | 54 | ||||||||||||||
See accompanying notes which are an integral part of the financial statements.
Statement of Changes in Net Assets 75
Table of Contents
Financial Highlights—For the Periods Ended
For a Share Outstanding Throughout Each Period.
| $ Net Asset Value, Beginning of Period |
$ Net Investment |
$ Net Realized |
$ Total Income |
$ Distributions from Net |
$ Distributions from Net Realized Gain |
$ Return of Capital |
||||||||||||||
| Multi-Style Equity Fund |
||||||||||||||||||||
| June 30, 2007* |
14.93 | .08 | 1.12 | 1.20 | (.08 | ) | — | — | ||||||||||||
| December 31, 2006 |
13.37 | .14 | 1.55 | 1.69 | (.13 | ) | — | — | ||||||||||||
| December 31, 2005 |
12.60 | .12 | .79 | .91 | (.14 | ) | — | — | ||||||||||||
| December 31, 2004 |
11.56 | .11 | 1.02 | 1.13 | (.09 | ) | — | — | ||||||||||||
| December 31, 2003 |
9.04 | .08 | 2.51 | 2.59 | (.07 | ) | — | — | ||||||||||||
| December 31, 2002 |
11.84 | .06 | (2.80 | ) | (2.74 | ) | (.06 | ) | — | — | ||||||||||
| Aggressive Equity Fund |
||||||||||||||||||||
| June 30, 2007* |
14.45 | .03 | 1.16 | 1.19 | (.01 | ) | (.64 | ) | — | |||||||||||
| December 31, 2006 |
14.40 | .03 | 2.10 | 2.13 | (.03 | ) | (2.05 | ) | — | |||||||||||
| December 31, 2005 |
14.90 | .03 | .90 | .93 | (.03 | ) | (1.40 | ) | — | |||||||||||
| December 31, 2004 |
13.47 | .02 | 1.95 | 1.97 | (.02 | ) | (.52 | ) | — | |||||||||||
| December 31, 2003 |
9.26 | .01 | 4.21 | 4.22 | (.01 | ) | — | — | ||||||||||||
| December 31, 2002 |
11.44 | (.02 | ) | (2.16 | ) | (2.18 | ) | — | — | — | ||||||||||
| Non-U.S. Fund |
||||||||||||||||||||
| June 30, 2007* |
15.01 | .19 | 1.21 | 1.40 | (.05 | ) | (1.39 | ) | — | |||||||||||
| December 31, 2006 |
12.68 | .23 | 2.75 | 2.98 | (.35 | ) | (.30 | ) | — | |||||||||||
| December 31, 2005 |
11.33 | .16 | 1.38 | 1.54 | (.19 | ) | — | — | ||||||||||||
| December 31, 2004 |
9.76 | .11 | 1.66 | 1.77 | (.20 | ) | — | — | ||||||||||||
| December 31, 2003 |
7.20 | .09 | 2.69 | 2.78 | (.22 | ) | — | — | ||||||||||||
| December 31, 2002 |
8.64 | .06 | (1.37 | ) | (1.31 | ) | (.13 | ) | — | — | ||||||||||
| Real Estate Securities Fund |
||||||||||||||||||||
| June 30, 2007* |
21.34 | .15 | (1.48 | ) | (1.33 | ) | (.07 | ) | (.31 | ) | — | |||||||||
| December 31, 2006 |
17.28 | .37 | 5.72 | 6.09 | (.39 | ) | (1.64 | ) | — | |||||||||||
| December 31, 2005 |
17.09 | .32 | 1.82 | 2.14 | (.37 | ) | (1.58 | ) | — | |||||||||||
| December 31, 2004 |
13.71 | .36 | 4.33 | 4.69 | (.36 | ) | (.95 | ) | — | |||||||||||
| December 31, 2003 |
10.51 | .55 | 3.28 | 3.83 | (.61 | ) | — | (.02 | ) | |||||||||||
| December 31, 2002 |
10.75 | .54 | (.13 | ) | .41 | (.57 | ) | (.08 | ) | — | ||||||||||
| Core Bond Fund |
||||||||||||||||||||
| June 30, 2007* |
10.14 | .28 | (.17 | ) | .11 | (.10 | ) | — | — | |||||||||||
| December 31, 2006 |
10.23 | .45 | (.08 | ) | .37 | (.46 | ) | — | — | |||||||||||
| December 31, 2005 |
10.50 | .38 | (.17 | ) | .21 | (.37 | ) | (.11 | ) | — | ||||||||||
| December 31, 2004 |
10.47 | .24 | .24 | .48 | (.26 | ) | (.19 | ) | — | |||||||||||
| December 31, 2003 |
10.43 | .31 | .31 | .62 | (.38 | ) | (.20 | ) | — | |||||||||||
| December 31, 2002 |
10.13 | .36 | .52 | .88 | (.30 | ) | (.28 | ) | — | |||||||||||
See accompanying notes which are an integral part of the financial statements.
76 Financial Highlights
Table of Contents
| $ Total Distributions |
$ Net Asset Value, |
% Total |
$ Net Assets, |
% Ratio of Expenses Net
Assets, |
% Ratio of Expenses Net
Assets, |
% Ratio of Net Net Assets(c)(d) |
% Portfolio | ||||||||||
| (.08 | ) | 16.05 | 8.09 | 464,271 | .86 | .86 | 1.05 | 63.85 | |||||||||
| (.13 | ) | 14.93 | 12.75 | 417,507 | .87 | .87 | 1.03 | 128.33 | |||||||||
| (.14 | ) | 13.37 | 7.27 | 349,659 | .83 | .87 | .94 | 130.00 | |||||||||
| (.09 | ) | 12.60 | 9.81 | 332,759 | .87 | .88 | .96 | 123.29 | |||||||||
| (.07 | ) | 11.56 | 28.86 | 296,767 | .87 | .95 | .82 | 107.67 | |||||||||
| (.06 | ) | 9.04 | (23.19 | ) | 206,794 | .92 | .99 | .61 | 145.90 | ||||||||
| (.65 | ) | 14.99 | 8.42 | 242,686 | 1.05 | 1.13 | .42 | 98.23 | |||||||||
| (2.08 | ) | 14.45 | 14.79 | 223,646 | 1.05 | 1.12 | .16 | 183.55 | |||||||||
| (1.43 | ) | 14.40 | 6.36 | 204,292 | .99 | 1.13 | .21 | 130.09 | |||||||||
| (.54 | ) | 14.90 | 14.73 | 195,583 | 1.05 | 1.17 | .17 | 150.26 | |||||||||
| (.01 | ) | 13.47 | 45.60 | 166,385 | 1.06 | 1.26 | .10 | 138.95 | |||||||||
| — | 9.26 | (19.06 | ) | 97,794 | 1.25 | 1.36 | (.17 | ) | 139.24 | ||||||||
| (1.44 | ) | 14.97 | 9.84 | 422,670 | 1.15 | 1.19 | 2.63 | 65.19 | |||||||||
| (.65 | ) | 15.01 | 23.64 | 369,884 | 1.15 | 1.21 | 1.64 | 110.77 | |||||||||
| (.19 | ) | 12.68 | 13.69 | 302,261 | 1.12 | 1.26 | 1.41 | 87.98 | |||||||||
| (.20 | ) | 11.33 | 18.30 | 258,766 | 1.15 | 1.28 | 1.11 | 73.45 | |||||||||
| (.22 | ) | 9.76 | 38.78 | 206,619 | 1.16 | 1.41 | 1.14 | 50.29 | |||||||||
| (.13 | ) | 7.20 | (15.15 | ) | 137,840 | 1.30 | 1.48 | .77 | 60.98 | ||||||||
| (.38 | ) | 19.63 | (6.52 | ) | 584,651 | .90 | .90 | 1.38 | 42.34 | ||||||||
| (2.03 | ) | 21.34 | 35.84 | 625,477 | .90 | .91 | 1.86 | 52.63 | |||||||||
| (1.95 | ) | 17.28 | 12.96 | 443,092 | .91 | .91 | 1.86 | 64.24 | |||||||||
| (1.31 | ) | 17.09 | 34.88 | 379,733 | .92 | .92 | 2.43 | 47.21 | |||||||||
| (.63 | ) | 13.71 | 37.21 | 254,691 | .95 | .95 | 4.66 | 38.84 | |||||||||
| (.65 | ) | 10.51 | 3.80 | 160,176 | .99 | .99 | 5.01 | 55.43 | |||||||||
| (.10 | ) | 10.15 | 1.11 | 297,893 | .70 | .74 | 5.45 | 581.90 | |||||||||
| (.46 | ) | 10.14 | 3.72 | 265,783 | .70 | .73 | 4.40 | 452.50 | |||||||||
| (.48 | ) | 10.23 | 2.01 | 216,774 | .70 | .72 | 3.70 | 192.66 | |||||||||
| (.45 | ) | 10.50 | 4.66 | 175,851 | .70 | .73 | 2.41 | 216.23 | |||||||||
| (.58 | ) | 10.47 | 6.15 | 147,202 | .71 | .78 | 2.86 | 232.64 | |||||||||
| (.58 | ) | 10.43 | 8.84 | 140,280 | .80 | .80 | 3.52 | 207.60 | |||||||||
See accompanying notes which are an integral part of the financial statements.
Financial Highlights 77
Table of Contents
Notes To Financial Highlights—June 30, 2007 (Unaudited)
| * | For the six months ended June 30, 2007 (Unaudited). |
| (a) | Average month-end shares outstanding were used for this calculation. |
| (b) | Periods less than one year are not annualized. |
| (c) | The ratios for periods less than one year are annualized. |
| (d) | May reflect amounts waived and/or reimbursed by RIMCO. |
See accompanying notes which are an integral part of the financial statements.
78 Notes to Financial Highlights
Table of Contents
Notes to Financial Statements—June 30, 2007 (Unaudited)
| 1. | Organization |
Russell Investment Funds (the “Investment Company” or “RIF”) is a series investment company with nine different investment portfolios referred to as Funds. These financial statements report on five of these Funds (“the Funds”). The Investment Company provides the investment base for one or more variable insurance products issued by one or more insurance companies. These Funds are offered at net asset value to qualified insurance company separate accounts offering variable insurance products. The Investment Company is registered under the Investment Company Act of 1940, as amended, as an open-end management investment company. It is organized and operates as a Massachusetts business trust under a master trust agreement dated July 11, 1996, as amended. The Investment Company’s master trust agreement permits the Board of Trustees (the “Board”) to issue an unlimited number of shares of beneficial interest at a $.01 par value per share.
| 2. | Significant Accounting Policies |
The Funds’ financial statements are prepared in accordance with accounting principles generally accepted in the United States of America (“GAAP”) which require the use of management estimates and assumptions at the date of the financial statements. Actual results could differ from those estimates. The following is a summary of the significant accounting policies consistently followed by each Fund in the preparation of its financial statements.
Security Valuation
The Funds value portfolio securities according to Board-approved Securities Valuation Procedures, including Market Value Procedures, Fair Value Procedures and Pricing Services. Debt obligation securities maturing within 60 days of the time of purchase are priced using the amortized cost method of valuation, unless the Board determines that amortized cost does not represent market value of short-term debt obligations. The Board has delegated the responsibility for administration of the Securities Valuation Procedures to Russell Investment Management Company (“RIMCo” or “Manager”). On July 1, 2006, Frank Russell Investment Management Company changed its name to RIMCo.
Ordinarily, the Funds value each portfolio security based on market quotations provided by Pricing Services or alternative pricing services or dealers (when permitted by the Market Value Procedures). Generally, Fund securities are valued at the close of the market on which they are traded as follows:
| • | US listed equities; equity and fixed income options: Last sale price; last bid price if no last sale price; |
| • | US over-the-counter equities: Official closing price; last bid price if no closing price; |
| • | Listed ADRs/GDRs: Last sale price; last bid price if no sales; |
| • | Municipal bonds, US bonds, Eurobonds/foreign bonds: Evaluated bid price; broker quote if no evaluated bid price; |
| • | Futures: Settlement price. |
| • | Investments in other mutual funds are valued at their net asset value per share, calculated at 4 p.m. Eastern time or as of the close of the New York Stock Exchange, whichever is earlier. |
| • | The value of swap agreements are equal to the Funds’ obligation (or rights) under swap contracts which will generally be equal to the net amounts to be paid or received under the contracts based upon the relative values of the positions held by each party to the contracts. |
| • | Equity securities traded on a national securities foreign exchange or an over-the-counter market are valued on the basis of the official closing price, or lacking the official closing price, at the last sale price of the primary exchange on which the security is traded. |
If market quotations are not readily available for a security or if subsequent events suggest that a market quotation is not reliable, the Funds will use the security’s fair value, as determined in accordance with the Fair Value Procedures. This generally means that equity securities and fixed income securities listed and traded principally on any national securities exchange are valued on the basis of the last sale price or, lacking any sales, at the closing bid price, on the primary exchange on which the security is traded. The Fair Value Procedures may involve subjective judgments as to the fair value of securities. The effect of fair value pricing is that securities may not be priced on the basis of quotations from the primary market in which they are traded, but rather may be priced by another method that the Funds’ Board of Trustees believes reflects fair value. The use of fair value pricing by a Fund may cause the net asset value of its shares to differ significantly from the net asset value that would be calculated using normal pricing methods. Fair value pricing could also cause discrepancies between the daily movement of the value of Fund shares and the daily movement of the benchmark index if the index is valued using another pricing method.
Notes to Financial Statements 79
Table of Contents
Russell Investment Funds
Notes to Financial Statements, continued—June 30, 2007 (Unaudited)
This policy is intended to assure that the Funds’ net asset values fairly reflect security values as of the time of pricing. Events or circumstances affecting the values of Fund securities that occur between the closing of the principal markets on which they trade and the time the net asset value of Fund shares is determined may be reflected in the calculation of net asset values for each applicable Fund when the Funds deem that the particular event or circumstance would materially affect such Fund’s net asset value. Funds that invest primarily in frequently traded exchange listed securities will use fair value pricing in limited circumstances since reliable market quotations will often be readily available. Funds that invest in foreign securities are likely to use fair value pricing more often since significant events may occur between the close of foreign markets and the time of pricing which would trigger fair value pricing of the foreign securities. Funds that invest in low rated debt securities are also likely to use fair value pricing more often since the markets in which such securities are traded are generally thinner, more limited and less active than those for higher rated securities. Examples of events that could trigger fair value pricing of one or more securities are: a material market movement of the US securities market (defined in the Fair Value Procedures as the movement by any two of four major US Indexes greater than a certain percentage) or other significant event; foreign market holidays if on a daily basis, Fund exposure exceeds 20% in aggregate (all closed markets combined); a company development; a natural disaster; or an armed conflict.
Because foreign securities can trade on non-business days, the net asset value of a Fund’s portfolio that includes foreign securities may change on days when shareholders will not be able to purchase or redeem fund shares.
In September 2006, Statement of Financial Accounting Standards No. 157, Fair Value Measurements (SFAS 157), was issued and is effective for fiscal years beginning after November 15, 2007. SFAS 157 defines fair value, establishes a framework for measuring fair value and expands disclosures about fair value measurements. Management is currently evaluating the impact the adoption of SFAS 157 will have on the Funds’ financial statement disclosure.
Investment Transactions
Securities transactions are recorded on a trade date basis. Realized gains and losses from securities transactions, if any, are recorded on the basis of specific identified cost incurred by each money manager within a particular Fund.
Investment Income
Dividend income is recorded net of applicable withholding taxes on the ex-dividend date, except that certain dividends from foreign securities are recorded as soon thereafter as the Funds are informed of the ex-dividend date. Interest income is recorded daily on the accrual basis. The Core Bond Fund classifies gains and losses realized on prepayments received on mortgage-backed securities as part of interest income. All premiums and discounts, including original issue discounts, are amortized/accreted using the interest method.
Federal Income Taxes
Since the Investment Company is a Massachusetts business trust, each Fund is a separate corporate taxpayer and determines its net investment income and capital gains (or losses) and the amounts to be distributed to each Fund’s shareholders without regard to the income and capital gains (or losses) of the other Funds.
It is each Fund’s intention to qualify as a regulated investment company and distribute all of its taxable income and capital gains. Therefore, no federal income tax provision was required for the Funds.
In July 2006, Financial Accounting Standards Board Interpretation No. 48, Accounting for Uncertainty in Income Taxes—an interpretation of FASB Statement 109 (FIN 48) was issued and is effective for fiscal years beginning after December 15, 2006. FIN 48 sets forth a threshold for financial statement recognition, measurement and disclosure of a tax position taken or expected to be taken on a tax return. For the period ended June 30, 2007, there was no impact from the adoption of FIN 48 on the Funds’ net assets and results of operations.
Dividends and Distributions to Shareholders
For all Funds, income and capital gain distributions, if any, are recorded on the ex-dividend date. Income distributions are generally declared and paid quarterly, except for the Non-U.S. Fund, which generally declares and pays income distributions annually. Capital gain distributions are generally declared and paid annually. An additional distribution may be paid by the Funds to avoid imposition of federal income and excise tax on any remaining undistributed capital gains and net investment income.
80 Notes to Financial Statements
Table of Contents
Russell Investment Funds
Notes to Financial Statements, continued—June 30, 2007 (Unaudited)
The timing and characterization of certain income and capital gain distributions are determined in accordance with federal tax regulations which may differ from GAAP. As a result, net investment income and net realized gain (or loss) on investment and foreign currency-related transactions for a reporting period may differ significantly from distributions during such period. The differences between tax regulations and GAAP primarily relate to investments in options, futures, forward contracts, swap contracts, passive foreign investment companies, foreign-denominated investments, mortgage-backed securities, certain securities sold at a loss and capital loss carryforwards.
Expenses
The Funds will pay their own expenses other than those expressly assumed by RIMCo. Most expenses can be directly attributed to the individual Funds. Expenses which cannot be directly attributed to a specific Fund are allocated among all Funds principally based on their relative net assets.
Foreign Currency Translations
The books and records of the Funds are maintained in US dollars. Foreign currency amounts and transactions of the Funds are translated into US dollars on the following basis:
| (a) | Market value of investment securities, other assets and liabilities at the closing rate of exchange on the valuation date. |
| (b) | Purchases and sales of investment securities and income at the closing rate of exchange prevailing on the respective trade dates of such transactions. |
Reported net realized gains or losses from foreign currency-related transactions arise from: sales and maturities of short-term securities; sales of foreign currencies; currency gains or losses realized between the trade and settlement dates on securities transactions; the difference between the amounts of dividends, interest, and foreign withholding taxes recorded on the Non-U.S. Fund’s books and the US dollar equivalent of the amounts actually received or paid. Net unrealized gains or losses from foreign currency-related transactions arise from changes in the value of assets and liabilities, other than investments in securities, at year-end, as a result of changes in the exchange rates.
The Funds do not isolate that portion of the results of operations of the Funds that arises as a result of changes in exchange rates from that portion that arises from changes in market prices of investments during the year. Such fluctuations are included with the net realized and unrealized gain or loss from investments. However, for federal income tax purposes the Funds do isolate the effects of changes in foreign exchange rates from the fluctuations arising from changes in market prices for realized gain (or loss) on debt obligations.
Capital Gains Taxes
The Non-U.S. and Real Estate Securities Funds may be subject to capital gains taxes and repatriation taxes imposed by certain countries in which it invests. The Non-U.S. and Real Estate Securities Funds may record a deferred tax liability in respect of unrealized appreciation on foreign securities for potential capital gains and repatriation taxes at June 30, 2007. The accrual for capital gains and repatriation taxes is included in net unrealized appreciation (depreciation) on investments in the Statement of Assets and Liabilities for both Funds, if applicable. The amounts related to capital gains taxes are included in net realized gain (loss) on investments in the Statement of Operations for both Funds. The Non-U.S. and Real Estate Securities Funds had no deferred tax liability or capital gains taxes for the period ended June 30, 2007.
Derivatives
To the extent permitted by the investment objectives, restrictions and policies set forth in the Funds’ Prospectus and Statement of Additional Information, the Funds may participate in various derivative-based transactions. Derivative securities are instruments or agreements whose value is derived from an underlying security or index. They include options, futures, swaps, swaptions, forwards, structured notes and stripped securities. These instruments offer unique characteristics and risks that assist the Funds in meeting their investment strategies.
The Funds typically use derivatives in three ways: exposing cash reserves to markets, hedging and return enhancement. The Funds may pursue their strategy to be fully invested by exposing cash reserves in a Fund to the performance of appropriate markets by purchasing securities and/or derivatives. This is intended to cause the Funds to perform as though their cash
Notes to Financial Statements 81
Table of Contents
Russell Investment Funds
Notes to Financial Statements, continued—June 30, 2007 (Unaudited)
reserves were actually invested in those markets. Hedging is also used by some Funds to limit or control risks, such as adverse movements in exchange rates and interest rates. Return enhancement can be accomplished through the use of derivatives in a Fund. By purchasing certain instruments, Funds may more effectively achieve the desired portfolio characteristics that assist them in meeting their investment objectives. Depending on how the derivatives are structured and utilized, the risks associated with them may vary widely. These risks are generally categorized as market risk, liquidity risk and counterparty or credit risk.
Foreign Currency Exchange Contracts
In connection with investment transactions consistent with the Fund’s investment objective and strategies, certain Funds may enter into foreign currency exchange spot contracts and forward foreign currency exchange contracts (“contracts”). The Funds may enter into foreign currency forward overlays on liquidity reserve balances. Additionally, from time to time the Funds may enter into contracts to hedge certain foreign currency-denominated assets. Contracts are recorded at market value. Certain risks may arise upon entering into these contracts from the potential inability of counterparties to meet the terms of their contracts and are generally limited to the amount of unrealized gain on the contracts, if any, that are recognized in the Statement of Assets and Liabilities. Realized gains or losses arising from such transactions are included in net realized gain (or loss) from foreign currency-related transactions. Open contracts at June 30, 2007 are presented on the Schedule of Investments.
Forward Commitments
Certain Funds may contract to purchase securities for a fixed price at a future date beyond customary settlement time consistent with a Fund’s ability to manage its investment portfolio and meet redemption requests. The price of the underlying securities and the date when the securities will be delivered and paid for are fixed at the time the transaction is negotiated. The Funds may dispose of a forward commitment transaction prior to settlement if it is appropriate to do so and realize short-term gains (or losses) upon such sale. When effecting such transactions, cash or liquid high-grade debt obligations of the Fund in a dollar amount sufficient to make payment for the portfolio securities to be purchased will be segregated on the Fund’s records at the trade date and maintained until the transaction is settled. A forward commitment transaction involves a risk of loss if the value of the security to be purchased declines prior to the settlement date or the other party to the transaction fails to complete the transaction.
Loan Agreements
The Core Bond Fund may invest in direct debt instruments which are interests in amounts owed by corporate, governmental, or other borrowers to lenders or lending syndicates. A Fund’s investments in loans may be in the form of participations in loans or assignments of all or a portion of loans from third parties. A loan is often administered by a bank or other financial institution (the “lender”) that acts as agent for all holders. The agent administers the terms of the loan, as specified in the loan agreement. When investing in a loan participation, a Fund has the right to receive payments of principal, interest and any fees to which it is entitled only from the lender selling the loan agreement and only upon receipt by the lender of payments from the borrower. A Fund generally has no right to enforce compliance with the terms of the loan agreement with the borrower. As a result, a Fund may be subject to the credit risk of both the borrower and the lender that is selling the loan agreement. When a Fund purchases assignments from lenders it acquires direct rights against the borrower on the loan. For the period ended June 30, 2007, there were no unfunded loan commitments in the Core Bond Fund.
Options
The Funds may purchase and sell (write) call and put options on securities and securities indices, provided such options are traded on a national securities exchange or in an over-the-counter market. The Funds may also purchase and sell call and put options on foreign currencies. The domestic equity Funds may utilize options to equitize liquidity reserve balances.
When a Fund writes a covered call or a put option, an amount equal to the premium received by the Fund is included in the Fund’s Statement of Assets and Liabilities as an asset and as an equivalent liability. The amount of the liability is subsequently marked-to-market to reflect the current market value of the option written. The Fund receives a premium on the sale of a call option but gives up the opportunity to profit from any increase in stock value above the exercise price of the option, and when the Fund writes a put option it is exposed to a decline in the price of the underlying security.
Whether an option which the Fund has written either expires on its stipulated expiration date or the Fund enters into a closing purchase transaction, the Fund realizes a gain (or loss, if the cost of a closing purchase transaction exceeds the premium received when the option was sold) without regard to any unrealized gain or loss on the underlying security, and the liability related to such option is extinguished. If a call option which the Fund has written is exercised, the Fund realizes a capital gain or loss from the sale of the underlying security, and the proceeds from such sale are increased by the premium originally
82 Notes to Financial Statements
Table of Contents
Russell Investment Funds
Notes to Financial Statements, continued—June 30, 2007 (Unaudited)
received. When a put option which a Fund has written is exercised, the amount of the premium originally received will reduce the cost of the security which a Fund purchases upon exercise of the option. Realized gains (losses) on purchased options are included in net realized gain (loss) from investments.
The Funds’ use of written options involves, to varying degrees, elements of market risk in excess of the amount recognized in the Statement of Assets and Liabilities. The face or contract amounts of these instruments reflect the extent of the Funds’ exposure to market risk. The risks may be caused by an imperfect correlation between movements in the price of the instrument and the price of the underlying securities and interest rates.
Futures Contracts
The Funds may invest in futures contracts (i.e., interest rate, foreign currency and index futures contracts) to a limited extent. The face or contract amounts of these instruments reflect the extent of the Funds’ exposure to off balance sheet risk. The primary risks associated with the use of futures contracts are an imperfect correlation between the change in market value of the securities held by the Fund and the prices of futures contracts and the possibility of an illiquid market. Upon entering into a futures contract, the Funds are required to deposit with a broker an amount, termed the initial margin, which typically represents 5% of the purchase price indicated in the futures contract. Payments to and from the broker, known as variation margin, are made as the price of the futures contract fluctuates. Changes in initial settlement value are accounted for as unrealized appreciation (depreciation) until the contracts are terminated, at which time realized gains and losses are recognized. As of June 30, 2007, included in the Statement of Assets and Liabilities, the Non-U.S. Fund had cash collateral balances of $2,343,868 in connection with futures contracts purchased (sold).
Swap Agreements
The Funds may enter into several different types of agreements including interest rate, index, credit default and currency swaps.
The Funds may enter into index swap agreements as an additional hedging strategy for cash reserves held by those Funds or to effect investment transactions consistent with these Funds’ investment objectives and strategies. Swap agreements are two party contracts entered into primarily by institutional investors for periods ranging from a few weeks to more than one year. In a standard swap transaction, the two parties agree to exchange the returns (or differentials in rates of return) earned or realized on particular investments or instruments. The returns to be exchanged between the parties are calculated with respect to a “notional amount” (i.e. a specified dollar amount that is hypothetically invested in a “basket” of securities representing a particular index).
Amounts paid to and received from the swap counterparties representing capital appreciation and depreciation on the underlying securities and accrued interest expense and interest income are recorded as net realized gain (loss). The Funds are exposed to credit risk in the event of non-performance by the swap counterparties; however, the Funds do not anticipate non-performance by the counterparties.
The Funds may enter into swap agreements, on either an asset-based or liability-based basis, depending on whether they are hedging their assets or liabilities, and will usually enter into swaps on a net basis, i.e., the two payment streams are netted out, with the Funds receiving or paying, as the case may be, only the net amount of the two payments. When the Funds engage in a swap, they exchange their obligations to pay or rights to receive payments for the obligations or rights to receive payments of another party (i.e., an exchange of floating rate payments for fixed rate payments).
Interest rate swaps are a counterparty agreement and can be customized to meet each party’s needs and involves the exchange of a fixed payment per period for a payment that is not fixed. Currency swaps are an agreement where two parties exchange specified amounts of different currencies which are followed by a series of interest payments that are exchanged based on the principal cash flow. At maturity the principal amounts are exchanged back. Credit default swaps are a counterparty agreement which allows the transfer of third party credit risk (the possibility that an issuer will default on their obligation by failing to pay principal or interest in a timely manner) from one party to another. The lender faces the credit risk from a third party and the counterparty in the swap agrees to insure this risk in exchange for regular periodic payments.
The Funds expect to enter into these transactions primarily to preserve a return or spread on a particular investment or portion of its portfolio or to protect against any increase in the price of securities they anticipate purchasing at a later date. The net amount of the excess, if any, of the Funds’ obligations over its entitlements with respect to each swap will be accrued on a daily basis and an amount of cash or liquid high-grade debt securities having an aggregate net asset value at least equal to the accrued excess will be maintained in a segregated account by the Funds’ custodian. To the extent that the Funds enter into swaps on other than a net basis, the amount maintained in a segregated account will be the full amount of the Funds’
Notes to Financial Statements 83
Table of Contents
Russell Investment Funds
Notes to Financial Statements, continued—June 30, 2007 (Unaudited)
obligations, if any, with respect to such interest rate swaps, accrued on a daily basis. If there is a default by the other party to such a transaction, the Funds will have contractual remedies pursuant to the agreement related to the transaction. The swap market has grown substantially in recent years with a large number of banks and investment banking firms acting both as principals and as agents utilizing standardized swap documentation. As a result, the swap market has become relatively liquid.
Investments in Emerging Markets
Investing in emerging markets may involve special risks and considerations not typically associated with investing in the United States markets. These risks include revaluation of currencies, high rates of inflation, repatriation, restrictions on income and capital, and future adverse political and economic developments. Moreover, securities issued in these markets may be less liquid, subject to government ownership controls, delayed settlements, and their prices may be more volatile than those of comparable securities in the United States.
Mortgage-Related and Other Asset-Backed Securities
The Core Bond Fund may invest in mortgage or other asset-backed securities. These securities include mortgage pass-through securities, collateralized mortgage obligations (“CMOs”), commercial mortgage-backed securities, mortgage dollar rolls, CMO residuals, stripped mortgage backed securities (“SMBSs”) and other securities that directly or indirectly represent a participation in, or are secured by a payable from, mortgage loans on real property. The value of some mortgage or asset-backed securities may be particularly sensitive to changes in prevailing interest rates. Early repayment of principal on some mortgage-related securities may expose the Fund to a lower rate of return upon reinvestment of principal. The value of these securities may fluctuate in response to the market’s perception of the creditworthiness of the issuers. Additionally, although mortgages and mortgage related securities are generally supported by some form of government or private guarantee and/or insurance, there is no assurance that private guarantors or insurers will meet their obligations.
One type of SMBS has one class receiving all of the interest from the mortgage assets (the interest-only, or “IO” class), while the other class will receive all of the principal (the principal-only, or “PO” class). Payments received for the IOs are included in interest income on the Statement of Operations. Because principal will not be received at the maturity of an IO, adjustments are made to the book value of the security on a daily basis until maturity. These adjustments are included in interest income on the Statement of Operations. Payments received for POs are treated as reductions to the cost and par value of the securities.
Inflation-Indexed Bonds
The Core Bond Fund may invest in inflation-indexed bonds. Inflation-indexed bonds are fixed-income securities whose principal value is periodically adjusted to the rate of inflation. The interest rate on these bonds is generally fixed at issuance at a rate lower than typical bonds. Over the life of an inflation-indexed bond, however, interest will be paid based on a principal value, which is adjusted for inflation. Any increase in the principal amount of an inflation-indexed bond will be included as interest income in the Statement of Operations, even though investors do not receive their principal until maturity.
Guarantees
In the normal course of business the Funds enter into contracts that contain a variety of representations which provide general indemnifications. The Funds’ maximum exposure under these arrangements is unknown as this would involve future claims that may be made against the Funds that have not yet occurred. However, the Funds expect the risk of loss to be remote.
| 3. | Investment Transactions |
Securities
During the period ended June 30, 2007, purchases and sales of investment securities (excluding US Government and Agency obligations, short-term investments, options, futures and repurchase agreements) were as follows:
| Funds |
Purchases | Sales | Funds | Purchases | Sales | |||||||||
| Multi-Style Equity |
$ | 282,855,212 | $ | 266,766,825 | Real Estate Securities | $ | 284,981,464 | $ | 266,073,653 | |||||
| Aggressive Equity |
196,344,314 | 193,570,311 | Core Bond | 1,475,997,697 | 1,457,272,077 | |||||||||
| Non-U.S. |
250,211,495 | 233,823,238 | ||||||||||||
84 Notes to Financial Statements
Table of Contents
Russell Investment Funds
Notes to Financial Statements, continued—June 30, 2007 (Unaudited)
Purchases and sales of US Government and Agency obligations (excluding short-term investments, options, futures and repurchase agreements) were as follows:
| Fund |
Purchases | Sales | ||||
| Core Bond |
$ | 106,653,653 | $ | 98,814,834 | ||
Written Options Contracts
Transactions in written options contracts for the period ended June 30, 2007 were as follows:
| Non-U.S. Fund | Core Bond Fund | |||||||||||||
| Number of Contracts |
Premiums Received |
Number of Contracts |
Premiums Received |
|||||||||||
| Outstanding December 31, 2006 |
60 | $ | 306,054 | 253 | $ | 329,796 | ||||||||
| Opened |
351 | 1,497,498 | 972 | 630,911 | ||||||||||
| Closed |
(337 | ) | (1,505,765 | ) | (865 | ) | (415,036 | ) | ||||||
| Expired |
— | — | (66 | ) | (23,095 | ) | ||||||||
| Outstanding June 30, 2007 |
74 | $ | 297,787 | 294 | $ | 522,576 | ||||||||
Securities Lending
The Investment Company has a securities lending program whereby each Fund can loan securities with a value up to 33 1/3% of its total assets. The Fund receives cash (US currency), US Government or US Government agency obligations as collateral against the loaned securities. To the extent that a loan is collateralized by cash, such collateral is invested by the securities lending agent, State Street Corporation (“State Street”) in short-term instruments, money market mutual funds and other short-term investments that meet certain quality and diversification requirements. Cash collateral invested in money market funds is included in the Schedule of Investments. The collateral received is recorded on a lending Fund’s statement of assets and liabilities along with the related obligation to return the collateral.
Income generated from the investment of cash collateral, less negotiated rebate fees paid to participating brokers and transaction costs, is divided between the Fund and State Street and is recorded as income for the Fund. To the extent that a loan is secured by non-cash collateral, brokers pay the Fund negotiated lenders’ fees, which are divided between the Fund and State Street and are recorded as securities lending income for the Fund. All collateral received will be in an amount at least equal to 102% (for loans of US securities) or 105% (for Non-U.S. securities) of the market value of the loaned securities at the inception of each loan. The market value of the loaned securities is determined at the close of business of the Funds and any additional required collateral is delivered to the Fund the next day. Should the borrower of the securities fail financially, there is a risk of delay in recovery of the securities or loss of rights in the collateral. Consequently, loans are made only to borrowers which are deemed to be of good financial standing.
As of June 30, 2007, the non-cash collateral received for the securities on loan in the Multi-Style Equity Fund and Aggressive Equity Fund were $3,583,762 and $788,368 respectively. The non-cash collateral consists of a pool of US Government securities.
Custodian
The Funds have entered into a custody agreement with their Custodian whereby custody credits realized as a result of uninvested cash balances were used to reduce a portion of the Funds’ expenses. For the period ended June 30, 2007, the Funds’ custodian fees were reduced by the following amounts under these arrangements:
| Funds |
Custody Credit Amount | ||
| Multi-Style Equity |
$ | 951 | |
| Aggressive Equity |
1,743 | ||
| Non-U.S. |
2,467 | ||
| Real Estate Securities |
2,454 | ||
| Core Bond |
19,294 | ||
Notes to Financial Statements 85
Table of Contents
Russell Investment Funds
Notes to Financial Statements, continued—June 30, 2007 (Unaudited)
Brokerage Commissions
The Funds effect certain transactions though Lynch, Jones & Ryan, Inc. (“LJR”) and its global network of correspondent brokers. LJR is a registered broker and is not an affiliate of the Funds or RIMCo. Trades placed through LJR and its correspondents are used (i) to obtain research services for RIMCo to assist it in its capacity as a manager of managers and (ii) to generate commission rebates to the Funds on whose behalf the trades were made. For purposes of trading to obtain research services for RIMCo or to generate commission rebates to the Funds, the Funds’ money managers are requested to and RIMCo may, with respect to transactions it places, effect transactions with or through LJR and its correspondents or other brokers only to the extent that the Funds will receive competitive execution, price and commissions. In addition, RIMCo recommends targets for the amount of trading that money managers allocate through LJR based upon asset class, investment style and other factors. Research services provided to RIMCo by LJR or other brokers include performance measurement statistics, fund analytics systems and market monitoring systems. Research services will generally be obtained from unaffiliated third parties at market rates. Research provided to RIMCo may benefit the particular Funds generating the trading activity and may also benefit other Funds within the Investment Company and other funds and clients managed or advised by RIMCo or its affiliates. Similarly, the Funds may benefit from research provided with respect to trading by those other funds and clients.
LJR also may rebate to the Funds a portion of commissions earned on certain trading by the Funds through LJR and their correspondents in the form of commission recapture. Commission recapture is paid solely to those Funds generating the applicable trades. Commission recapture is generated on the instructions of the Soft Dollar Committee once RIMCo’s research budget has been met, as determined annually in the Soft Dollar Committee budgeting process.
| 4. | Related Party Transactions, Fees and Expenses |
Manager
RIMCo manages all of the Funds which comprise the Investment Company. RIMCo is a wholly-owned subsidiary of Frank Russell Company (a subsidiary of The Northwestern Mutual Life Insurance Company). Frank Russell Company provides money manager research services to RIMCo.
The Funds are permitted to invest their cash reserves (i.e., cash awaiting investment or cash held to meet redemption requests or to pay expenses), and also may invest a portion of the collateral received from the Investment Company’s securities lending program in the Russell Investment Company (“RIC”) Money Market Fund. RIC is a registered investment company that employs the same investment adviser as the Investment Company. As of June 30, 2007, $94,775,000 of the RIC Money Market Fund’s net assets represents investments by the Funds.
The management fees are based upon the average daily net assets of each Fund at the rates specified in the table below, are payable monthly and total $8,260,994 for the period ended June 30, 2007.
| Funds |
Annual Rate | ||
| Multi-Style Equity |
0.78 | % | |
| Aggressive Equity |
0.95 | ||
| Non-U.S. |
0.95 | ||
| Real Estate Securities |
0.85 | ||
| Core Bond |
0.60 |
RIMCo has agreed to certain waivers of its management fees as follows:
Multi-Style Equity Fund—RIMCo has contractually agreed to waive, at least until April 30, 2008, a portion of its 0.78% management fee, up to the full amount of that fee, equal to the amount by which the Fund’s total direct Fund-level operating expenses exceed 0.87% of the Fund’s average daily net assets on an annual basis and then to reimburse the Fund for all remaining expenses, after fee waivers, that exceed 0.87% of the average daily net assets on an annual basis. Direct Fund-level expenses do not include expenses of other investment companies in which the Fund invests which are borne indirectly by the Fund. There was no waiver for the period ended June 30, 2007. There were no reimbursements during the period.
Aggressive Equity Fund—RIMCo has contractually agreed to waive, at least until April 30, 2008, a portion of its 0.95% management fee, up to the full amount of that fee, equal to the amount by which the Fund’s total direct Fund-level operating expenses exceed 1.05% of the Fund’s average daily net assets on an annual basis and to then reimburse the Fund for all remaining expenses, after fee waivers, that exceed 1.05% of the average daily net assets on an annual basis. Direct Fund-level expenses do not include expenses of other investment companies in which the Fund invests which are borne indirectly by the Fund. The total amount of the waiver for the period ended June 30, 2007 was $87,371. There were no reimbursements during the period.
86 Notes to Financial Statements
Table of Contents
Russell Investment Funds
Notes to Financial Statements, continued—June 30, 2007 (Unaudited)
Non-U.S. Fund—RIMCo has contractually agreed to waive, at least until April 30, 2008, a portion of its 0.95% management fee, up to the full amount of that fee, equal to amount by which the Fund’s total direct Fund-level operating expenses exceed 1.15% of the Fund’s average daily net assets on an annual basis and to then reimburse the Fund for all remaining expenses, after fee waivers, that exceed 1.15% of the average daily net assets on an annual basis. Direct Fund-level expenses do not include expenses of other investment companies in which the Fund invests which are borne indirectly by the Fund. The total amount of the waiver for the period ended June 30, 2007 was $83,361. There were no reimbursements during the period.
Core Bond Fund—RIMCo has contractually agreed to waive, at least until April 30, 2008, a portion of its 0.60% management fee, up to the full amount of that fee, equal to the amount by which the Fund’s total direct Fund-level operating expenses exceed 0.70% of the Fund’s average daily net assets on an annual basis and to then reimburse the Fund for all remaining expenses, after fee waivers, that exceed 0.70% of the average daily net assets on an annual basis. Direct Fund-level expenses do not include expenses of other investment companies in which the Fund invests which are borne indirectly by the Fund. The total amount of the waiver for the period ended June 30, 2007 was $43,154. There were no reimbursements during the period.
RIMCo does not have the ability to recover amounts waived or reimbursed from previous periods.
Transfer Agent
RIMCo serves as Transfer and Dividend Disbursing Agent for the Investment Company. For this service, RIMCo is paid a fee for transfer agency and dividend disbursing services provided to the Funds. RIMCo retains a portion of this fee for its services provided to the Funds and pays the balance to unaffiliated agents who assist in providing these services. Total fees for the Funds for the period ended June 30, 2007 were $43,744.
Accrued fees payable to affiliates as of June 30, 2007 were as follows:
| Multi-Style Equity Fund |
Aggressive Equity Fund |
Non-U.S. Fund | Real Estate Securities Fund |
Core Bond Fund | |||||||||||
| Management fees |
$ | 318,070 | $ | 190,348 | $ | 325,542 | $ | 430,814 | $ | 144,866 | |||||
| Transfer agent fees |
1,659 | 867 | 1,467 | 2,163 | 1,030 | ||||||||||
| Trustees’ fees |
1,547 | 1,048 | 1,350 | 1,897 | 939 | ||||||||||
| $ | 321,276 | $ | 192,263 | $ | 328,359 | $ | 434,874 | $ | 146,835 | ||||||
Distributor
Russell Fund Distributors, Inc. (the “Distributor”), a wholly-owned subsidiary of RIMCo, is the principal underwriter for Investment Company shares. The Distributor receives no compensation from the Investment Company for its services.
Affiliated Brokerage Commissions
The Funds will effect certain transactions through Russell Implementation Services Inc. (“RIS”) and its global network of unaffiliated correspondent brokers. RIS is a registered broker and investment adviser and an affiliate of RIMCo. Trades placed through RIS and its correspondents are made (i) to manage trading associated with changes in managers, rebalancing across existing managers, cash flows and other portfolio transitions and (ii) to execute portfolio securities transactions for each Fund’s assets that RIMCo determines not to allocate to money managers, including assets allocated to the “select holdings” strategy, and for each Fund’s cash reserves.
Board of Trustees
The Russell Fund Complex consists of RIC, which has 35 Funds, and RIF, which has nine Funds. Each of the Trustees is a Trustee of both RIC and RIF. During the period, the Russell Fund Complex paid each of its independent Trustees a retainer of $52,000 per year, $6,500 for each regular quarterly meeting attended in person, $2,000 for each special meeting attended in person, and $2,000 for each Audit Committee meeting, Nominating and Governance Committee meeting, Investment Committee meeting or any other committee meeting established and approved by the Board that is attended in person. Each Trustee receives a $500 fee for attending the meetings (quarterly, special, committee) by phone instead of receiving the full fee had the member attended in person. Trustees’ out of pocket expenses are also paid by the Russell Fund Complex. The Audit Committee Chair and Investment Committee Chair are each paid a fee of $12,000 per year and the Nominating and Governance Committee Chair are each paid a fee of $6,000 per year. The chair person of the Board receives additional annual compensation of $52,000.
Notes to Financial Statements 87
Table of Contents
Russell Investment Funds
Notes to Financial Statements, continued—June 30, 2007 (Unaudited)
| 5. | Federal Income Taxes |
At June 30, 2007, the following Funds had net tax basis capital loss carryforwards which may be applied against any net realized taxable gains in each succeeding year or until their respective expiration dates, whichever occurs first. Available capital loss carryforwards and expiration dates are as follows:
| Funds |
12/31/10 | 12/31/11 | 12/31/12 | 12/31/13 | 12/31/14 | Totals | ||||||||||||
| Multi-Style Equity |
$ | 17,458,223 | $ | 3,302,725 | $ | — | $ | — | $ | — | $ | 20,760,948 | ||||||
| Core Bond |
— | — | — | 305,131 | 3,005,117 | 3,310,248 | ||||||||||||
At June 30, 2007, the cost of investments and net unrealized appreciation (depreciation) for income tax purposes were as follows:
| Multi-Style Equity |
Aggressive Equity |
Non-U.S. | Real Estate Securities |
Core Bond | ||||||||||||||||
| Cost of Investments |
$ | 455,920,696 | $ | 286,752,432 | $ | 417,851,379 | $ | 439,614,101 | $ | 354,401,933 | ||||||||||
| Unrealized Appreciation |
$ | 58,694,636 | $ | 31,976,276 | $ | 61,481,478 | $ | 158,812,820 | $ | 6,200,698 | ||||||||||
| Unrealized Depreciation |
(5,353,768 | ) | (5,921,902 | ) | (3,776,921 | ) | (14,084,644 | ) | (8,187,178 | ) | ||||||||||
| Net Unrealized Appreciation (Depreciation) |
$ | 53,340,868 | $ | 26,054,374 | $ | 57,704,557 | $ | 144,728,176 | $ | (1,986,480 | ) | |||||||||
As permitted by tax regulations, the Core Bond Fund intends to defer a net realized capital loss of $191,798 incurred from November 1, 2006 to December 31, 2006.
88 Notes to Financial Statements
Table of Contents
Russell Investment Funds
Notes to Financial Statements, continued—June 30, 2007 (Unaudited)
| 6. | Fund Share Transactions (amounts in thousands) |
Share transactions for the periods ended June 30, 2007 and December 31, 2006 were as follows:
| Shares | Dollars | |||||||||||||
| 2007 | 2006 | 2007 | 2006 | |||||||||||
| Multi-Style Equity Fund |
||||||||||||||
| Proceeds from shares sold |
1,705 | 3,072 | $ | 26,379 | $ | 43,060 | ||||||||
| Proceeds from reinvestment of distributions |
155 | 259 | 2,369 | 3,605 | ||||||||||
| Payments for shares redeemed |
(894 | ) | (1,514 | ) | (13,867 | ) | (21,145 | ) | ||||||
| Total net increase (decrease) |
966 | 1,817 | $ | 14,881 | $ | 25,520 | ||||||||
| Aggressive Equity Fund |
||||||||||||||
| Proceeds from shares sold |
649 | 2,111 | $ | 9,426 | $ | 32,794 | ||||||||
| Proceeds from reinvestment of distributions |
703 | 2,097 | 10,149 | 30,737 | ||||||||||
| Payments for shares redeemed |
(642 | ) | (2,910 | ) | (9,409 | ) | (43,174 | ) | ||||||
| Total net increase (decrease) |
710 | 1,298 | $ | 10,166 | $ | 20,357 | ||||||||
| Non-U.S. Fund |
||||||||||||||
| Proceeds from shares sold |
1,814 | 4,156 | $ | 26,489 | $ | 58,314 | ||||||||
| Proceeds from reinvestment of distributions |
2,537 | 1,115 | 35,950 | 16,452 | ||||||||||
| Payments for shares redeemed |
(757 | ) | (4,464 | ) | (11,002 | ) | (61,747 | ) | ||||||
| Total net increase (decrease) |
3,594 | 807 | $ | 51,437 | $ | 13,019 | ||||||||
| Real Estate Securities Fund |
||||||||||||||
| Proceeds from shares sold |
1,941 | 3,955 | $ | 43,396 | $ | 78,527 | ||||||||
| Proceeds from reinvestment of distributions |
488 | 2,646 | 11,287 | 54,893 | ||||||||||
| Payments for shares redeemed |
(1,956 | ) | (2,929 | ) | (41,671 | ) | (55,946 | ) | ||||||
| Total net increase (decrease) |
473 | 3,672 | $ | 13,012 | $ | 77,474 | ||||||||
| Core Bond Fund |
||||||||||||||
| Proceeds from shares sold |
3,313 | 5,342 | $ | 33,783 | $ | 54,242 | ||||||||
| Proceeds from reinvestment of distributions |
278 | 1,088 | 2,831 | 10,962 | ||||||||||
| Payments for shares redeemed |
(455 | ) | (1,397 | ) | (4,636 | ) | (14,154 | ) | ||||||
| Total net increase (decrease) |
3,136 | 5,033 | $ | 31,978 | $ | 51,050 | ||||||||
| 7. | Interfund Lending Program |
The Investment Company has been granted permission from the Securities and Exchange Commission to participate in a joint lending and borrowing facility (the “Credit Facility”). Funds of the Investment Company may borrow money from the RIC Money Market Fund for temporary purposes. All such borrowing and lending will be subject to a participating Fund’s fundamental investment limitations. The RIC Money Market Fund will lend through the program only when the returns are higher than those available from an investment in repurchase agreements or short-term reserves. The Funds will borrow through the program only when the costs are equal to or lower than the cost of bank loans. Interfund loans and borrowings normally extend overnight, but can have a maximum duration of seven days. Loans may be called on one business day’s notice. A participating Fund may have to borrow from a bank at a higher interest rate if an interfund loan is called or not renewed. Any delay in repayment to the RIC Money Market Fund could result in a lost investment opportunity or additional borrowing costs.
For the period ended June 30, 2007, the Funds did not participate in the interfund lending program.
Notes to Financial Statements 89
Table of Contents
Russell Investment Funds
Notes to Financial Statements, continued—June 30, 2007 (Unaudited)
| 8. | Record Ownership |
As of June 30, 2007, the following table includes shareholders of record with greater than 10% of the total outstanding shares of each respective Fund. The Northwestern Mutual Life Insurance Company separate accounts were the largest shareholder in each Fund.
| Funds |
# of Shareholders |
% | ||
| Multi-Style Equity |
2 | 88.1 | ||
| Aggressive Equity |
2 | 85.6 | ||
| Non-U.S. |
2 | 92.8 | ||
| Real Estate Securities |
2 | 87.2 | ||
| Core Bond |
2 | 89.7 |
| 9. | Restricted Securities |
Restricted securities are subject to contractual limitations on resale, are often issued in private placement transactions, and are not registered under the Securities Act of 1933 (the “Act”). The most common types of restricted securities are those sold under Rule 144A of the Act and commercial paper sold under Section 4(2) of the Act.
A Fund may invest a portion of its net assets not to exceed 15% in securities that are illiquid. Illiquid securities are securities that may not be readily marketable, and that cannot be sold within seven days in the ordinary course of business at the approximate amount at which the Fund has valued the securities. Restricted securities are generally considered to be illiquid.
The following table lists restricted securities held by a Fund that are illiquid. The following table does not include (1) securities deemed liquid by RIMCo or a money manager pursuant to Board approved policies and procedures or (2) illiquid securities that are not restricted securities as designated on the Fund’s Schedule of Investments.
| Fund - % of Net Assets Securities |
Acquisition Date |
Principal Amount ($) or Shares |
Cost per Unit $ |
Cost (000) $ |
Market Value (000) $ | |||||
| Core Bond Fund—0.7% |
||||||||||
| BNP Paribas Capital Trust |
06/11/06 | 450,000 | 112.20 | 505 | 493 | |||||
| Bombardier, Inc. |
11/10/06 | 125,000 | 128.47 | 161 | 177 | |||||
| Catlin Insurance Co., Ltd. |
01/11/07 | 100,000 | 100.00 | 100 | 95 | |||||
| DG Funding Trust |
11/04/03 | 49 | 10,537.12 | 516 | 509 | |||||
| Freddie Mac |
07/07/06 | 185,123 | 102.05 | 189 | 207 | |||||
| Freddie Mac REMICS |
06/28/07 | 259,787 | 3.28 | 9 | 3 | |||||
| JP Morgan Chase Bank/London |
04/19/07 | 620,000 | 16.30 | 101 | 103 | |||||
| Parker Hannifin Employee Stock Ownership Trust |
03/09/99 | 83,592 | 100.00 | 84 | 84 | |||||
| SB Treasury Co. LLC |
06/01/06 | 350,000 | 106.81 | 374 | 362 | |||||
| 2,033 | ||||||||||
Illiquid securities and restricted securities may be priced by the Funds using fair value procedures approved by the Board of Trustees.
90 Notes to Financial Statements
Table of Contents
Basis for Approval of Investment Advisory Contracts (Unaudited)
Approval of Investment Advisory Agreement
The Board of Trustees, including all of the Independent Trustees, last considered and approved the continuation of the management agreement with RIMCo (the “RIMCo Agreement”) and the portfolio management contract with each Money Manager of the Funds (collectively, the “portfolio management contracts”) at a meeting held on April 24, 2007. During the course of a year, the Trustees receive a wide variety of materials regarding the investment performance of the Funds, sales and redemptions of the Funds’ shares, and the management of the Funds by RIMCo. In preparation for the annual review, the Independent Trustees, with the advice and assistance of their independent counsel, also requested and the Board considered (1) information and reports prepared by RIMCo relating to the services provided by RIMCo (and its affiliates) to the Funds; (2) information (the “Third-Party Information”) received from an independent, nationally recognized provider of investment company information comparing the performance of each of the Funds and their respective operating expenses over various periods of time with other peer funds (“Comparable Funds”) not managed by RIMCo believed by the provider to be generally comparable in investment objectives and size to the Funds; and (3) RIMCo’s response to questions from the Board concerning the Third-Party Information addressing, among other things, performance and expense differentials between certain Funds and their respective Comparable Funds. The foregoing information requested by the Trustees or provided by RIMCo is collectively called the “Agreement Renewal Information.” The Independent Trustees also received a memorandum from their independent counsel discussing the legal standards for their consideration of the proposed continuances.
On April 23, 2007, the Independent Trustees met to review the Agreement Renewal Information in a private session with their independent counsel at which no representatives of RIMCo or management were present. At the April 24 meeting of the Board of Trustees, the Board, including the Independent Trustees, reviewed the proposed continuance of the RIMCo Agreement and the portfolio management contracts with management and independent counsel to the Independent Trustees. Presentations made by RIMCo to the Board as part of this review encompassed the Funds and all other RIMCo-managed funds for which the Board has supervisory responsibility. Following this review, but prior to voting, the Independent Trustees again met in a private session with their independent counsel to evaluate additional information and analyses received from RIMCo and management at the Board meeting. The discussion below reflects all of these reviews.
In evaluating the portfolio management contracts, the Board considered that the Funds, in employing a manager-of-managers method of investment, operate in a manner that is distinctly different from most other investment companies. In the case of most other investment companies, an advisory fee is paid by the investment company to its adviser which in turn employs and compensates individual portfolio managers to make specific securities selections consistent with the adviser’s style and investment philosophy. RIMCo has engaged multiple Money Managers for all Funds.
The Board considered that RIMCo (rather than any Money Manager) is responsible under the RIMCo Agreement for determining, implementing and maintaining the investment program for each Fund. Assets of each Fund generally have been allocated among the multiple Money Managers selected by RIMCo, subject to Board approval, for that Fund. RIMCo manages directly a portion of certain Funds’ assets employing a “select holdings strategy,” as described below, and directly manages the investment of each Fund’s cash reserves. RIMCo also may manage directly any portion of each Fund’s assets that RIMCo determines not to allocate to the Money Managers and portions of a Fund during transitions between Money Managers. In all cases, assets are managed directly by RIMCo in accordance with the RIMCo Agreement.
RIMCo is responsible for selecting, subject to Board approval, Money Managers for each Fund and for actively managing allocations and reallocations of assets among the Money Managers. RIMCo’s goal is to construct and manage diversified portfolios in a risk aware manner. Each Money Manager for a Fund in effect performs the function of an individual portfolio manager who is responsible for selecting portfolio securities for the portion of the Fund assigned to it by RIMCo (each, a “segment”) in accordance with the Fund’s applicable investment objective, policies and restrictions, any constraints placed by RIMCo upon their selection of portfolio securities and the Money Manager’s specified role in a Fund. RIMCo is responsible for communicating performance expectations to each Money Manager; supervising compliance by each Money Manager with each Fund’s investment objective and policies; authorizing Money Managers to engage in certain investment strategies for a Fund; and recommending annually to the Board whether portfolio management contracts should be renewed, modified or terminated. In addition to its annual recommendation as to the renewal, modification or termination of portfolio management contracts, RIMCo is responsible for recommending to the Board the restructuring of Fund segments and additions of new Money Managers or replacements of existing Money Managers at any time when, based on RIMCo’s research and ongoing review and analysis, such actions are appropriate. RIMCo may assign specific investment constraints from time to time for each Money Manager intended to capitalize on the strengths of that Money Manager or to coordinate the investment activities of Money Managers for the Fund in a complementary manner. Therefore, RIMCo’s selection of Money Managers is made not only on the basis of performance considerations but anticipated compatibility with other Money Manager in the same Fund. In light of the foregoing, the overall performance of each
Basis for Approval of Investment Advisory Contracts 91
Table of Contents
Russell Investment Funds
Basis for Approval of Investment Advisory Contracts, continued (Unaudited)
Fund over appropriate periods reflects, in great part, the performance of RIMCo in designing the Fund’s investment program, structuring the Fund, selecting an effective Money Manager with a particular investment style or sub-style for a segment that is complementary to the styles of the Money Managers of other Fund segments, and allocating assets among the Money Managers in a manner designed to achieve the objectives of the Fund.
The Board considered that the prospectuses for the Funds and other public disclosures emphasize to investors RIMCo’s role as the principal investment manager for each Fund, rather than the investment selection role of the Funds’ Money Managers, and describe the manner in which the Funds operate so that investors may take that information into account when deciding to purchase shares of any such Fund.
The Board also considered the special expertise of RIMCo with respect to the manager-of-managers structure of the Funds and the likelihood that, at the current expense ratio of each such Fund, there would be no acceptable alternative investment managers to replace RIMCo on comparable terms given the need to continue the manager-of-managers strategy of each such Fund selected by shareholders in purchasing their shares.
In addition to these general factors relating to the manager-of-managers structure of the Funds, the Trustees considered, with respect to each Fund, various specific factors in evaluating renewal of the RIMCo Agreement, including the following:
| 1. | The nature, scope and quality of the services provided to the Fund by RIMCo; |
| 2. | The management fee paid by the Fund to RIMCo and the fact that it encompasses all investment advisory fees paid by the Fund, including the fees for any Money Managers of such Fund; |
| 3. | Information provided by RIMCo as to other fees and benefits received by RIMCo or its affiliates from the Fund, including any administrative, transfer agent, cash management and securities lending fees, soft dollar arrangements and commissions in connection with portfolio securities transactions; |
| 4. | Information provided by RIMCo as to expenses incurred by the Fund; and |
| 5. | Information provided by RIMCo as to the profits that RIMCo derives from its mutual fund operations generally and from the Fund. |
As noted above, RIMCo pursuant to the terms of the RIMCo Agreement directly manages a portion—up to 10%—of the assets of the Multi-Style Equity Fund (the “Participating Fund”) utilizing a select holdings strategy, the actual allocation being determined by the Participating Fund’s RIMCo portfolio manager. The select holdings strategy utilized by RIMCo in managing such assets for the Participating Fund is designed to increase the Participating Fund’s exposure to stocks that are viewed as attractive by multiple Money Managers of the Participating Fund. The Board reviewed the results of the select holdings strategy in respect of the Participating Fund since implementation taking into account that the strategy has been utilized for a limited period of time. The Trustees considered that RIMCo would not be required to pay investment advisory fees to a Money Manager with respect to assets for which the select holdings strategy is utilized and that the profits derived by RIMCo generally and from the Participating Fund consequently may increase incrementally. The Board, however, also considered RIMCo’s advice that it will pay certain Money Managers additional fees for providing information and other services in connection with the select holdings strategy and expects to incur additional costs in carrying out the select holdings strategy; the limited amount of assets that are managed directly by RIMCo pursuant to the select holdings strategy; and the fact that the aggregate investment advisory fees paid by the Participating Fund are not increased as a result of the select holdings strategy.
At the April 24 Board meeting, RIMCo and management discussed the reasonableness of the Funds’ investment advisory fees. In discussing whether the Funds’ performance supported these fees, RIMCo noted differences between the investment strategies of certain Funds and their respective Comparable Funds in pursuing their investment objectives, including Fund strategies which seek to achieve a lower tracking error (i.e., the difference, whether positive or negative, between the return of a fund and its benchmark) and resulting lower return volatility than Comparable Funds. According to RIMCo, these strategies may be expected to result, and for certain Funds during the periods covered by the Third-Party Information did result, in lower performance than that of some of their respective Comparable Funds. RIMCo stated that the strategies pursued by the Funds are intended to result in less volatile, more moderate returns relative to each Fund’s performance benchmark rather than more volatile, more extreme returns that its Comparable Funds may experience over time.
On the basis of the Agreement Renewal Information, and other information previously received by the Board from RIMCo during the course of the year or presented at the April 24 Board meeting by RIMCo, the Board, in respect of each Fund, found, after giving effect to any applicable waivers and/or reimbursements (1) the management fee charged by RIMCo to be reasonable in light of the nature, scope and quality of the services provided to the Funds; (2) the relative expense ratio of the Fund was comparable to those
92 Basis for Approval of Investment Advisory Contracts
Table of Contents
Russell Investment Funds
Basis for Approval of Investment Advisory Contracts, continued (Unaudited)
of its Comparable Funds; (3) RIMCo’s methodology of allocating expenses of operating funds in the complex was reasonable; and (4) RIMCo’s profitability with respect to the Fund was not excessive in light of the nature, scope and quality of the services provided by RIMCo. The Board also concluded that the performance of each of the Funds supported continuation of the RIMCo Agreement. In evaluating performance, the Board considered each Fund’s absolute performance and its performance relative to appropriate benchmarks and indices and its Comparable Funds. The Board also considered RIMCo’s investment strategy of managing the Funds in a risk aware manner.
At the April 24 Board meeting, the Board considered for each Fund whether economies of scale have been realized and whether the fees for such Fund appropriately reflect or should be revised to reflect any such economies. The Board determined that the management fees for each Fund appropriately reflect any economies of scale realized by that Fund, based upon such factors as the variability of Money Manager investment advisory fees and other factors associated with the manager-of-managers structure employed by the Funds. The Trustees considered that fees payable to RIMCo by institutional clients with investment objectives similar to those of the Funds and other funds under the Board’s supervision are lower, and may, in some cases, be substantially lower, than the rates paid by the Funds. The Trustees reviewed with RIMCo the differences in the scope of services it provides to institutional clients and the Funds. In response to the Trustees’ inquiries, RIMCo noted, among other things, that institutional clients have fewer administrative needs than the Funds. It was further noted by RIMCo that since the Funds must constantly issue and redeem their shares, they are more difficult to manage than institutional accounts, where assets are relatively stable. Accordingly, the Trustees did not regard these fee differences as relevant to their deliberations.
After considering the foregoing and other relevant factors, the Board concluded that continuation of the RIMCo Agreement on its current terms and conditions would be in the best interests of the Funds and their respective shareholders and voted to approve the continuation of the agreement.
At the April 24 Board meeting, with respect to the evaluation of the terms of portfolio management contracts with Money Managers, the Board received and considered information from RIMCo reporting for each Money Manager, among other things, the Money Manager’s performance over various periods; RIMCo’s assessment of the performance of each Money Manager; any significant business relationships between the Money Manager and RIMCo or Russell Fund Distributors, Inc., the Funds’ underwriter; and RIMCo’s recommendation to retain the Money Manager at the current fee rate, to retain the Money Manager at a reduced fee rate or to terminate the Money Manager. RIMCo recommended that each Money Manager be retained at its current fee rate. RIMCo has advised the Board that it does not regard Money Manager profitability as relevant to its evaluation of the portfolio management contracts with Money Managers because the willingness of Money Managers to serve in such capacity depends upon arm’s-length negotiations with RIMCo; RIMCo is aware of the fees charged by Money Managers to other clients; and RIMCo believes that the fees agreed upon with Money Managers are reasonable in light of the anticipated quality of investment advisory services to be rendered. The Board accepted RIMCo’s explanation in light of the Board’s findings as to the reasonableness of the aggregate investment advisory fees paid by each Fund and the fact that each Money Manager’s fee is paid by RIMCo.
Based substantially upon RIMCo’s recommendations together with the information received from RIMCo in support of its recommendations at the April 24 meeting, the Board concluded that the fees paid to the Money Managers of each Fund are reasonable in light of the quality of the investment advisory services provided and that continuation of the portfolio management agreement with each Money Manager of each Fund would be in the best interests of the Fund and its shareholders.
In their deliberations, the Trustees did not identify any particular information as to the RIMCo Agreement or, other than RIMCo’s recommendation, the portfolio management agreement with any Money Manager that was all-important or controlling and each Trustee attributed different weights to the various factors considered. The Trustees evaluated all information available to them on a Fund-by-Fund basis and their determinations were made in respect of each Fund.
At a meeting held on May 22, the Board of Trustees received a proposal from RIMCo to hire an additional money manager for the Real Estate Securities Fund. The Trustees approved the terms of the portfolio management contract with the new Money Manager based substantially upon RIMCo’s recommendation to hire the Money Manager at the proposed fee rate; any significant business relationships between the Money Manager and RIMCo or Russell Fund Distributors, Inc., the Fund’s underwriter; RIMCo’s explanation as to the lack of relevance of profitability to the evaluation of portfolio management contracts with Money Managers because the willingness of Money Managers to serve in such capacity depends upon arm’s-length negotiations with RIMCo; RIMCo’s awareness of the fees charged by the Money Manager to other clients; and RIMCo’s belief that the proposed investment advisory fees would be reasonable in light of the anticipated quality of investment advisory services to be rendered. The Trustees also considered their findings at their April 24 meeting as to the reasonableness of the aggregate investment advisory fees paid by the Fund, and the fact that the aggregate investment advisory fees paid by the Fund would not increase as a result of the proposed Money Manager change because the Money Managers’ investment advisory fee is paid by RIMCo.
Basis for Approval of Investment Advisory Contracts 93
Table of Contents
Shareholder Requests for Additional Information—June 30, 2007 (Unaudited)
A complete unaudited schedule of investments is made available generally no later than 60 days after the end of the first and third quarters of each year. These reports are available (i) free of charge, upon request, by calling the Fund at (800) 787-7354, (ii) on the Securities and Exchange Commission’s website at www.sec.gov, and (iii) at the Securities and Exchange Commission’s public reference room.
The Board has delegated to RIMCo, as RIF’s investment manager, the primary responsibility for monitoring, evaluating and voting proxies solicited by or with respect to issuers of securities in which assets of the Funds may be invested. RIMCo has established a proxy voting committee (“Committee”) and has adopted written proxy voting policies and procedures (“P&P”) and proxy voting guidelines (“Guidelines”). The Funds maintain a Portfolio Holdings Disclosure Policy that governs the timing and circumstances of disclosure to shareholders and third parties of information regarding the portfolio investments held by a Fund. A description of the P&P, Guidelines, Portfolio Holdings Disclosure Policy and additional information about Fund Directors are contained in the Funds’ Statement of Additional Information (“SAI”). The SAI is available (i) free of charge, upon request, by calling the Fund at (800) 787-7354, and (ii) on the Securities and Exchange Commission’s website at www.sec.gov.
If possible, depending on contract owner registration and address information, and unless you have otherwise opted out, only one copy of the RIF prospectus and each annual and semi-annual report will be sent to contract owners at the same address. If you would like to receive a separate copy of these documents, please contact your Insurance Company. If you currently receive multiple copies of the prospectus, annual report and semi-annual report and would like to request to receive a single copy of these documents in the future, please call your Insurance Company. Some Insurance Companies may offer electronic delivery of the Fund’s prospectus and annual and semiannual reports. Please contact your Insurance Company for further details.
94 Shareholder Requests for Additional Information
Table of Contents
Disclosure of Information about Fund Directors—June 30, 2007 (Unaudited)
The following tables provide information for each officer and trustee of the Russell Fund Complex. The Russell Fund Complex consists of Russell Investment Company (“RIC”), which has 35 funds, and Russell Investment Funds (“RIF”), which has nine funds. Each of the trustees is a trustee of both RIC and RIF. The first table provides information for the independent trustees. The second table provides information for the trustees emeritus. The third table provides information for the officers.
| Name, Age, Address |
Position(s) Held with Fund and Time Served |
Term of Office* |
Principal Occupation(s) Past 5 Years |
No. of |
Other Directorships Held by Trustee | |||||
| INDEPENDENT TRUSTEES | ||||||||||
| Thaddas L. Alston Born April 7, 1945
909 A Street Tacoma, Washington 98402-1616 |
Trustee since 2006 | Appointed until successor is duly elected and qualified | • Senior Vice President, Larco Investments, Ltd. (real estate firm) |
44 | None | |||||
| Kristianne Blake, Born January 22, 1954
909 A Street Tacoma, Washington 98402-1616 |
Trustee since 2000
Chairperson since 2005 |
Appointed until successor is duly elected and qualified
Annual |
• Director and Chairman of the Audit Committee, Avista Corp. • Trustee, Principal Investors Fund and Principal Variable Contracts Fund • Regent, University of Washington • President, Kristianne Gates Blake, P.S. (accounting services) • February 2002 to June 2005, Chairman of the Audit Committee, RIC and RIF • Trustee and Chairman of the Operations and Distribution Committee, WM Group of Funds, 1999-2006 |
44 | • Director, Avista Corp (electric utilities) • Trustee, Principal Investors Fund (investment company) • Trustee, Principal Variable Contracts Fund (investment company) | |||||
| Daniel P. Connealy, Born June 6, 1946
909 A Street Tacoma, Washington 98402-1616 |
Trustee since 2003
Chairman of the Audit Committee since 2005 |
Appointed until successor is duly elected and qualified
Appointed until successor is duly elected and qualified |
• June 2004 to present, Senior Vice President and Chief Financial Officer, Waddell & Reed Financial, Inc. • 2003, Retired • 2001-2003, Vice President and Chief Financial Officer, Janus Capital Group Inc. • 1979-2001, Audit and Accounting Partner, PricewaterhouseCoopers LLP |
44 | None | |||||
| Jonathan Fine, Born July 8, 1954
909 A Street Tacoma, Washington 98402-1616 |
Trustee since 2004 | Appointed until successor is duly elected and qualified | • President and Chief Executive Officer, United Way of King County, WA |
44 | None |
| * | Each Trustee is subject to mandatory retirement at age 72. |
Disclosure of Information about Fund Directors 95
Table of Contents
Russell Investment Funds
Disclosure of Information about Fund Directors, continued—June 30, 2007 (Unaudited)
| Name, Age, Address |
Position(s) Held with Fund and Time Served |
Term of Office* |
Principal Occupation(s) Past 5 Years |
No. of |
Other Directorships Held by Trustee | |||||
| INDEPENDENT TRUSTEES (continued) | ||||||||||
| Raymond P. Tennison, Jr., Born December 21, 1955
909 A Street Tacoma, Washington 98402-1616 |
Trustee since 2000
Chairman of the Nominating and Governance Committee since 2007 |
Appointed until successor is duly elected and qualified
Appointed until successor is duly elected and qualified |
• President, Simpson Investment Company and several additional subsidiary companies, including Simpson Timber Company, Simpson Paper Company and Simpson Tacoma Kraft Company |
44 | None | |||||
| Jack R. Thompson, Born March 21, 1949
909 A Street Tacoma Washington 98402-1616 |
Trustee since 2005 | Appointed until successor is duly elected and qualified | • September 2003 to present, Independent Board Chair and Chairman of the Audit Committee, Sparx Japan Fund • May 1999 to May 2003, President, Chief Executive Officer and Director, Berger Financial Group, LLC • May 1999 to May 2003, President and Trustee, Berger Funds |
44 | • Director, Sparx Japan Fund (investment company) | |||||
| Julie W. Weston, Born October 2, 1943
909 A Street Tacoma, Washington 98402-1616 |
Trustee since 2002
Chairperson of the Investment Committee since 2006 |
Appointed until successor is duly elected and qualified
Appointed until successor is duly elected and qualified |
• Retired since 2000 • 1987 to 2002, Director, Smith Barney Fundamental Value Fund |
44 | None | |||||
| * | Each Trustee is subject to mandatory retirement at age 72. |
96 Disclosure of Information about Fund Directors
Table of Contents
Russell Investment Funds
Disclosure of Information about Fund Directors, continued—June 30, 2007 (Unaudited)
| Name, Age, Address |
Position(s) Held with Fund and Time Served |
Term of Office |
Principal Occupation(s) Past 5 Years |
No. of |
Other Directorships Held by Trustee | |||||
| TRUSTEES EMERITUS | ||||||||||
| * George F. Russell, Jr., Born July 3, 1932
909 A Street Tacoma, Washington 98402-1616 |
Trustee Emeritus and Chairman Emeritus since 1999 | Until resignation or removal | • Director Emeritus, Frank Russell Company (investment consultant to institutional investors (“FRC”)); and RIMCo • Chairman Emeritus, RIC and RIF; Russell Implementation Services, Inc. (broker-dealer and investment adviser (“RIS”)); Russell 20-20 Association (non-profit corporation); and Russell Trust Company (non- depository trust company (“RTC”)) • Chairman, Sunshine Management Services, LLC (investment adviser) |
44 | None | |||||
| Paul E. Anderson, Born October 15, 1931
909 A Street Tacoma, Washington 98402-1616 |
Trustee Emeritus since 2007 | Five year term | • President, Anderson Management Group LLC (private investments consulting) • February 2002 to June 2005, Lead Trustee RIC and RIF • Trustee of RIC and RIF until 2006 • Chairman of the Nominating and Governance Committee, 2006 |
44 | None | |||||
| Paul Anton, Ph.D., Born December 1, 1919
909 A Street Tacoma, Washington 98402-1616 |
Trustee Emeritus since 2003 | Five year term | • Retired since 1997 • Trustee of RIC and RIF Until 2002 |
44 | None | |||||
| William E. Baxter, Born June 8, 1925
909 A Street Tacoma, Washington 98402-1616 |
Trustee Emeritus since 2004 | Five year term | • Retired since 1986 • Trustee of RIC and RIF Until 2004 |
44 | None | |||||
| Lee C. Gingrich, Born October 6, 1930
909 A Street Tacoma, Washington 98402-1616 |
Trustee Emeritus since 2006 | Five year term | • Retired since 1995 • Trustee of RIC and RIF Until 2005 • Chairman of the Nominating and Governance Committee 2001-2005 |
44 | None | |||||
| Eleanor W. Palmer, Born May 5, 1926
909 A Street Tacoma, Washington 98402-1616 |
Trustee Emeritus since 2004 | Five year term | • Retired since 1981 • Trustee of RIC and RIF Until 2004 |
44 | None | |||||
| * | Mr. Russell is also a director emeritus of one or more affiliates of RIC and RIF. |
Disclosure of Information about Fund Directors 97
Table of Contents
Russell Investment Funds
Disclosure of Information about Fund Directors, continued—June 30, 2007 (Unaudited)
| Name, Age, Address |
Position(s) Held with Fund and Time Served |
Term of Office |
Principal Occupation(s) During the Past 5 Years | |||||||
| OFFICERS | ||||||||||
| Cheryl Wichers, Born December 16, 1966
909 A Street Tacoma, Washington 98402-1616 |
Chief Compliance Officer since 2005 | Until removed by Independent Trustees | • Chief Compliance Officer, RIC • Chief Compliance Officer, RIF • Chief Compliance Officer, RIMCo • April 2002-May 2005, Manager, Global Regulatory Policy • 1998-2002, Compliance Supervisor, Russell Investment Group | |||||||
| Greg J. Stark, Born May 3, 1968
909 A Street Tacoma, Washington 98402-1616 |
President and Chief Executive Officer since 2004 | Until successor is chosen and qualified by Trustees | • President and CEO, RIC and RIF • Chairman of the Board, President and CEO, RIMCo • Chairman of the Board, President and CEO, RFD • Chairman of the Board and President Russell Insurance Agency, Inc. (insurance agency (“RIA”)) • Until 2004, Managing Director of Individual Investor Services, FRC • 2000 to 2004, Managing Director, Sales and Client Service, RIMCo | |||||||
| Mark E. Swanson, Born November 26, 1963
909 A Street Tacoma, Washington 98402-1616 |
Treasurer and Chief Accounting Officer since 1998 | Until successor is chosen and qualified by Trustees | • Treasurer, Chief Accounting Officer and CFO, RIC and RIF • Director, Funds Administration, RIMCo, RTC and RFD • Treasurer and Principal Accounting Officer, SSgA Funds | |||||||
| Thomas F. Hanly, Born November 17, 1964
909 A Street Tacoma, Washington 98402-1616 |
Chief Investment Officer since 2004 | Until removed by Trustees | • Chief Investment Officer, RIC, RIF, FRC, RTC • Director and Chief Investment Officer, RIMCo and RFD • 1999 to 2003, Chief Financial Officer, FRC, RIC and RIF | |||||||
| Gregory J. Lyons, Born August 24, 1960
909 A Street Tacoma, Washington 98402-1616 |
Secretary since 2007 | Until successor is chosen and qualified by Trustees | • Associate General Counsel and Assistant Secretary, FRC and RIA • Director and Secretary, RIMCo and RFD • Secretary and Chief Legal Counsel, RIC and RIF | |||||||
98 Disclosure of Information about Fund Directors
Table of Contents
909 A Street, Tacoma, Washington 98402
(800) 787-7354
| Trustees Thaddas L. Alston Kristianne Blake Daniel P. Connealy Jonathan Fine Raymond P. Tennison, Jr. Jack R. Thompson Julie W. Weston
Trustees Emeritus George F. Russell, Jr. Paul E. Anderson Paul Anton, Ph.D. William E. Baxter Lee C. Gingrich Eleanor W. Palmer
Officers Greg J. Stark, President and Chief Executive Officer Cheryl Wichers, Chief Compliance Officer Thomas F. Hanly, Chief Investment Officer Mark E. Swanson, Treasurer and Chief Accounting Officer Gregory J. Lyons, Secretary
Manager and Transfer and Dividend Disbursing Agent Russell Investment Management Company 909 A Street Tacoma, WA 98402
Custodian State Street Bank and Trust Company Josiah Quincy Building 200 Newport Avenue North Quincy, MA 02171
Office of Shareholder Inquiries 909 A Street Tacoma, WA 98402 (800) 787-7354
Legal Counsel Dechert LLP 200 Clarendon Street, 27th Floor Boston, MA 02116-5021
Distributor Russell Fund Distributors, Inc. 909 A Street Tacoma, WA 98402 |
Money Managers as of June 30, 2007 Multi-Style Equity Fund Ark Asset Management Co., Inc., New York, NY DePrince, Race & Zollo, Inc., Winter Park, FL Institutional Capital LLC, Chicago, IL Jacobs Levy Equity Management, Inc., Florham Park, NJ Montag & Caldwell, Inc., Atlanta, GA Suffolk Capital Management, LLC, New York, NY Turner Investment Partners, Inc., Berwyn, PA
Aggressive Equity Fund Berkeley Capital Management LLC, San Francisco, CA ClariVest Asset Management, LLC, San Diego, CA David J. Greene and Company, LLC, New York, NY DePrince, Race & Zollo, Inc., Winter Park, FL Gould Investment Partners, LLC, Berwyn, PA Jacobs Levy Equity Management, Inc., Florham Park, NJ PanAgora Asset Management, Inc., Boston, MA Tygh Capital Management, Inc., Portland, OR
Non-U.S. Fund Altrinsic Global Advisors, LLC, Stamford, CT AQR Capital Management, LLC, Greenwich, CT MFS Institutional Advisors, Inc., Boston, MA Wellington Management Company, LLP, Boston, MA
Real Estate Securities Fund AEW Management and Advisors, L.P., Boston, MA Cohen & Steers Capital Management, Inc., New York, NY Heitman Real Estate Securities LLC, Chicago, IL INVESCO Institutional (N.A.), Inc. which acts as a money manager to the Fund through its INVESCO Real Estate division, Dallas, TX RREEF America L.L.C., Chicago, IL
Core Bond Fund Bear Stearns Asset Management Inc., New York, NY Goldman Sachs Asset Management, L.P., New York, NY Pacific Investment Management Company LLC, Newport Beach, CA | |
This report is prepared from the books and records of the Funds and is submitted for the general information of shareholders and is not authorized for distribution to prospective investors unless accompanied or preceded by an effective Prospectus. Nothing herein contained is to be considered an offer of sale or a solicitation of an offer to buy shares of Russell Investment Funds. Such offering is made only by Prospectus, which includes details as to offering price and other material information.
Manager, Money Managers and Service Providers 99
Table of Contents
(This page intentionally left blank)
Table of Contents
(This page intentionally left blank)
Table of Contents
(This page intentionally left blank)
Table of Contents
| Russell Investment Funds | ||
| 909 A Street | ||
| Tacoma, Washington 98402 | ||
| 800-787-7354 | ||
| Fax: 253-591-3495 | 36-08-072 (06/07) |
Table of Contents
Prospectus Supplements
Table of Contents
Russell Investment Funds Prospectus
Russell Investment Funds, Variable Target Portfolio Series Prospectus
RUSSELL INVESTMENT FUNDS
Supplement dated June 29, 2007 to
PROSPECTUSES DATED APRIL 30, 2007
| I. | Real Estate Securities Fund: The following information relates to a proposed change in status of the Real Estate Securities Fund from a “diversified company” to a “non-diversified company” and supplements the Prospectuses listed above: |
In connection with the proposed change in classification of the Real Estate Securities Fund, Russell Investment Funds will file a proxy statement with the Securities and Exchange Commission (“SEC”). All shareholders are advised to read the proxy statement in its entirety when it becomes available because it will contain important information regarding the proposal, the persons soliciting proxies in connection with the proposal and the interests of these persons in the proposal and related matters. The proxy statement will be mailed to record date shareholders after it has been filed with the SEC. Shareholders may obtain a free copy of the proxy statement, when available, and other documents filed with the SEC at the SEC’s website at WWW.SEC.GOV. Copies of such documents will also be available, once they are filed with the SEC, at no charge by contacting Russell Investment Funds at 909 A Street, Tacoma, WA 98402, or by calling 1-800-787-7354.
The Real Estate Securities Fund is currently classified as a “diversified company” under the Investment Company Act. This means that as to 75% of its assets, no individual security can represent more than 5% of the Fund’s total assets, and the Fund cannot own more than 10% of any one issuer’s outstanding voting securities. The Fund’s diversification policy is a fundamental policy that can be changed only by a shareholder vote.
At a meeting held on May 22, 2007, the Board of Trustees of Russell Investment Funds, upon the recommendation of RIMCo, has approved, subject to shareholder approval, the change in status of the Real Estate Securities Fund from a “diversified company” to a “non-diversified company.” The proposed change from diversified to non-diversified status is intended to provide the Fund with more investment flexibility to respond to consolidation in the Real Estate Investment Trust (“REIT”) industry and to take larger positions in one or more issuers in the REIT industry. As a non-diversified fund, the Fund will be subject to additional risk. To the extent the Fund invests a relatively high percentage of its assets in the securities of a single issuer or group of issuers, the Fund’s performance will be more vulnerable to changes in the market value of the single issuer or group of issuers, and more susceptible to risks associated with a single economic, political or regulatory occurrence, than it would be had the Fund continued to operate as a diversified fund.
The change in status can only happen if, among other things, it is approved by the Shareholders of the Real Estate Securities Fund. A Special Meeting (the “Meeting”) of the shareholders of the Funds is expected to be held on or about October 25, 2007 and shareholders will be given the opportunity to vote on the change in status.
It is currently anticipated that on or about August 24, 2007, proxy materials regarding the change in status will be distributed to shareholders of record as of July 31, 2007.
Table of Contents
| II. | Real Estate Securities Fund: The following Principal Investment Strategy and Principal Risk are added to the section entitled “Risk/Return Summary” in the Prospectuses listed above: |
Principal Investment Strategy
The Fund also invests in non-U.S. companies.
Principal Risk
Since the Fund invests in international securities, its return and net asset value may be significantly affected by political or economic conditions and regulatory requirements in a particular country; also, the value of the Fund’s foreign assets may be affected by changes in exchange rates of foreign currencies.
The following Investment Strategies are added to the section entitled “Investment Objective and Investment Strategies” in the Prospectuses listed above:
Principal Investment Strategy:
The Fund also invests in non-U.S. companies.
Non-Principal Investment Strategy:
The Fund may also invest in non-U.S. issuers by purchasing American Depositary Receipts (“ADRs”), Global Depositary Receipts (“GDRs”) and European Depositary Receipts (“EDRs”). The Fund may purchase depositary receipts where an ADR, GDR or EDR provides better access to markets and higher liquidity. An ADR is a stock that trades in the U.S. but represents shares in a non-U.S. company. A GDR is a stock that trades in one or more global markets but represents shares of a company domiciled in a different country. An EDR is issued in Europe typically by foreign banks and trust companies and evidence ownership of either foreign or domestic securities. The Fund will invest primarily in sponsored ADRs, GDRs and EDRs but may also invest in unsponsored ADRs, GDRs and EDRs.
The following Risks are added to the Real Estate Securities Fund in the section entitled “Risks” in the Prospectuses listed above:
Principal Risks:
International Securities
| i. | Non-U.S. Equity Securities |
| ii. | Currency Risk |
Non-Principal Risks:
Depositary Receipts
Please see the Prospectuses for a more detailed explanation of these risks.
| III. | Core Bond Fund: The following Non-Principal Risk is added to the Core Bond Fund in the section entitled “Risks” of the Prospectuses listed above: |
Illiquid Securities
Please see the Prospectuses for a more detailed explanation of this risk.
Table of Contents
| IV. | The following replaces the information in the section entitled “Money Manager Information” for the Non-U.S. Fund, Real Estate Securities Fund and Emerging Markets Fund in each of the Prospectuses listed above, as applicable: |
Non-U.S. Fund
Altrinsic Global Advisors, LLC, 100 First Stamford Place, 6th Floor East, Stamford, CT 06902.
AQR Capital Management, LLC, Two Greenwich Plaza, 3rd Floor, Greenwich, CT 06830.
MFS Institutional Advisors, Inc. 500 Boylston Street, 21st Floor, Boston, MA 02116-3741.
Wellington Management Company, LLP, 75 State Street, Boston, MA 02109.
Real Estate Securities Fund
AEW Management and Advisors, L.P., World Trade Center East, Two Seaport Lane, 16th Floor, Boston, MA 02210-2021.
Cohen & Steers Capital Management, Inc., 280 Park Avenue, 10th Floor, New York, NY 10017-1216.
Heitman Real Estate Securities LLC, 191 North Wacker Drive, Suite 2500, Chicago, IL 60606.
INVESCO Institutional (N.A.), Inc. which acts as a money manager to the Fund through its INVESCO Real Estate division, Three Galleria Tower, Suite 500, 13155 Noel Road, Dallas, TX 75240.
RREEF America L.L.C., The Hancock Building, 875 North Michigan Avenue, 41st Floor, Chicago IL 60611-1901.
Emerging Markets Fund
AllianceBernstein L.P., 1345 Avenue of the Americas, 35th Floor, New York, NY 10105.
Arrowstreet Capital, Limited Partnership, 44 Brattle Street, 5th Floor, Cambridge MA 02138.
Genesis Asset Managers, LLP, P.O. Box 466 Barclays Court, Les Echelons, St. Peter Port, Guernsey, GY1 6AW Channel Islands.
Harding Loevner Management, L.P., 50 Division Street, Suite 401, Somerville, NJ 08876.
Nicholas-Applegate Capital Management LLC, 600 West Broadway, Suite 2900, San Diego, CA 92101.
T. Rowe Price International, Inc., 100 East Pratt Street, Baltimore, MD 21202-1009.
Table of Contents
36-08-156 (1 06/07)
Table of Contents
Northwestern Mutual Series Fund, Inc.
Supplement Dated July 20, 2007 to the
Prospectus Dated April 30, 2007
This Supplement revises certain information contained in the Prospectus for the Northwestern Mutual Series Fund, Inc. dated April 30, 2007 (the “Prospectus”), a copy of which you have already received. You should read this Supplement together with the Prospectus. Please retain this Supplement for future reference.
Fund Manager Changes:
Effective July 20, 2007, Mary R. Linehan will assume primary responsibility for the day-to-day management of the Large Cap Core Stock Portfolio. In addition, Curtis J. Ludwick will replace William R. Walker as the co-portfolio manager of Mid Cap Growth Stock Portfolio. As noted in the Prospectus, Ms. Linehan and Mr. Ludwick were previously co-portfolio managers of the Large Cap Core Stock Portfolio.
Table of Contents
Russell Investment Funds Prospectus
Russell Investment Funds, Variable Target Portfolio Series Prospectus
RUSSELL INVESTMENT FUNDS
Supplement dated July 25, 2007 to
PROSPECTUSES DATED APRIL 30, 2007
| I. | Real Estate Securities Fund: The following information relates to a proposed change in status of the Real Estate Securities Fund from a “diversified company” to a “non-diversified company” and supplements the Prospectuses listed above: |
In connection with the proposed change in classification of the Real Estate Securities Fund, Russell Investment Funds has filed a proxy statement with the Securities and Exchange Commission (“SEC”). All shareholders are advised to read the proxy statement in its entirety because it contains important information regarding the proposal, the persons soliciting proxies in connection with the proposal and the interests of these persons in the proposal and related matters. The proxy statement will be mailed to record date shareholders. Shareholders may obtain a free copy of the proxy statement and other documents filed with the SEC at the SEC’s website at WWW.SEC.GOV. Copies of such documents are also available at no charge by contacting Russell Investment Funds at 909 A Street, Tacoma, WA 98402, or by calling 1-800-787-7354.
The Real Estate Securities Fund is currently classified as a “diversified company” under the Investment Company Act. This means that as to 75% of its assets, no individual security can represent more than 5% of the Fund’s total assets, and the Fund cannot own more than 10% of any one issuer’s outstanding voting securities. The Fund’s diversification policy is a fundamental policy that can be changed only by a shareholder vote.
At a meeting held on May 22, 2007, the Board of Trustees of Russell Investment Funds, upon the recommendation of RIMCo, has approved, subject to shareholder approval, the change in status of the Real Estate Securities Fund from a “diversified company” to a “non-diversified company.” The proposed change from diversified to non-diversified status is intended to provide the Fund with more investment flexibility to respond to consolidation in the Real Estate Investment Trust (“REIT”) industry and to take larger positions in one or more issuers in the REIT industry. As a non-diversified fund, the Fund will be subject to additional risk. To the extent the Fund invests a relatively high percentage of its assets in the securities of a single issuer or group of issuers, the Fund’s performance will be more vulnerable to changes in the market value of the single issuer or group of issuers, and more susceptible to risks associated with a single economic, political or regulatory occurrence, than it would be had the Fund continued to operate as a diversified fund.
The change in status can only happen if, among other things, it is approved by the Shareholders of the Real Estate Securities Fund. A Special Meeting (the “Meeting”) of the shareholders of the Funds is expected to be held on or about October 25, 2007 and shareholders will be given the opportunity to vote on the change in status.
It is currently anticipated that on or about August 24, 2007, proxy materials regarding the change in status will be distributed to shareholders of record as of July 31, 2007.
Table of Contents
| II. | Real Estate Securities Fund: The following Principal Investment Strategy and Principal Risk are added to the section entitled “Risk/Return Summary” in the Prospectuses listed above: |
Principal Investment Strategy
The Fund also invests in non-U.S. companies.
Principal Risk
Since the Fund invests in international securities, its return and net asset value may be significantly affected by political or economic conditions and regulatory requirements in a particular country; also, the value of the Fund’s foreign assets may be affected by changes in exchange rates of foreign currencies.
The following Investment Strategies are added to the section entitled “Investment Objective and Investment Strategies” in the Prospectuses listed above:
Principal Investment Strategy:
The Fund also invests in non-U.S. companies.
Non-Principal Investment Strategy:
The Fund may also invest in non-U.S. issuers by purchasing American Depositary Receipts (“ADRs”), Global Depositary Receipts (“GDRs”) and European Depositary Receipts (“EDRs”). The Fund may purchase depositary receipts where an ADR, GDR or EDR provides better access to markets and higher liquidity. An ADR is a stock that trades in the U.S. but represents shares in a non-U.S. company. A GDR is a stock that trades in one or more global markets but represents shares of a company domiciled in a different country. An EDR is issued in Europe typically by foreign banks and trust companies and evidence ownership of either foreign or domestic securities. The Fund will invest primarily in sponsored ADRs, GDRs and EDRs but may also invest in unsponsored ADRs, GDRs and EDRs.
The following Risks are added to the Real Estate Securities Fund in the section entitled “Risks” in the Prospectuses listed above:
Principal Risks:
International Securities
i. Non-U.S. Equity Securities
ii. Currency Risk
Non-Principal Risks:
Depositary Receipts
Please see the Prospectuses for a more detailed explanation of these risks.
Table of Contents
| III. | Core Bond Fund: The following Non-Principal Risk is added to the Core Bond Fund in the section entitled “Risks” of the Prospectuses listed above: |
Illiquid Securities
Please see the Prospectuses for a more detailed explanation of this risk.
| IV. | The following replaces the information in the section entitled “Money Manager Information” for the Multi-Style Equity Fund, Non-U.S. Fund, Real Estate Securities Fund and Emerging Markets Fund in each of the Prospectuses listed above, as applicable: |
Multi-Style Equity Fund
Columbus Circle Investors, One Station Place, Metro Center – 8th Floor, Stamford, CT 06902.
DePrince, Race & Zollo, Inc., 250 Park Avenue South, Suite 250, Winter Park, FL 32789.
Institutional Capital LLC, 225 West Wacker Drive, Suite 2400, Chicago, IL 60606.
Jacobs Levy Equity Management, Inc., 100 Campus Drive, P.O. Box 650, Florham Park, NJ 07932-0650.
Montag & Caldwell, Inc., 3455 Peachtree Road N.E., Suite 1200, Atlanta, GA 30326-3248.
Suffolk Capital Management, LLC, 1633 Broadway, 40th Floor, New York, NY 10019.
Turner Investment Partners, Inc., 1205 Westlakes Drive, Suite 100, Berwyn, PA 19312-2414.
Non-U.S. Fund
Altrinsic Global Advisors, LLC, 100 First Stamford Place, 6th Floor East, Stamford, CT 06902.
AQR Capital Management, LLC, Two Greenwich Plaza, 3rd Floor, Greenwich, CT 06830.
MFS Institutional Advisors, Inc. 500 Boylston Street, 21st Floor, Boston, MA 02116-3741.
Wellington Management Company, LLP, 75 State Street, Boston, MA 02109.
Real Estate Securities Fund
AEW Management and Advisors, L.P., World Trade Center East, Two Seaport Lane, 16th Floor, Boston, MA 02210-2021.
Cohen & Steers Capital Management, Inc., 280 Park Avenue, 10th Floor, New York, NY 10017-1216.
Heitman Real Estate Securities LLC, 191 North Wacker Drive, Suite 2500, Chicago, IL 60606.
INVESCO Institutional (N.A.), Inc. which acts as a money manager to the Fund through its INVESCO Real Estate division, Three Galleria Tower, Suite 500, 13155 Noel Road, Dallas, TX 75240.
RREEF America L.L.C., The Hancock Building, 875 North Michigan Avenue, 41st Floor, Chicago IL 60611-1901.
Table of Contents
Emerging Markets Fund
AllianceBernstein L.P., 1345 Avenue of the Americas, 35th Floor, New York, NY 10105.
Arrowstreet Capital, Limited Partnership, 44 Brattle Street, 5th Floor, Cambridge MA 02138.
Genesis Asset Managers, LLP, P.O. Box 466 Barclays Court, Les Echelons, St. Peter Port, Guernsey, GY1 6AW Channel Islands.
Harding Loevner Management, L.P., 50 Division Street, Suite 401, Somerville, NJ 08876.
T. Rowe Price International, Inc., 100 East Pratt Street, Baltimore, MD 21202-1009.
UBS Global Asset Management (Americas) Inc., One North Wacker Drive, Chicago, IL 60606.
36-08-156 (1 07/07)
Table of Contents
This booklet contains information about the Northwestern Mutual variable insurance product and the mutual funds identified on the front cover. The mutual funds correspond with the investment divisions available under the variable insurance product (“Product”). The information is prepared for Product owners and does not represent an offer of the Product, nor should it be used in connection with any offer, except when accompanied or preceded by the current Product prospectus and the mutual fund prospectuses, which contain detailed information about mutual fund investment objectives and operations, and applicable fees, expenses and sales charges. Prospectuses may be obtained by calling the telephone number or visiting the website address listed below. You should read and carefully consider this information before you invest or send money. The mutual fund reports are prepared from the books and records of the funds. Discussions of investment performance in the reports represent the views of the funds’ portfolio managers as of the dates of the reports. They are not guarantees of investment results, nor should they be relied upon as investment advice or indications of current or future trading strategies of the portfolio managers. Portfolio manager views and security holdings are subject to change at any time.
The Northwestern Mutual Life Insurance Company (Northwestern Mutual), 1-866-424-2609, www.northwesternmutual.com
Product Distributor: Northwestern Mutual Investment Services, LLC (NMIS), Suite 300, 611 East Wisconsin Avenue, Milwaukee, WI 53202-4797, 1-866-664-7737, member NASD and SIPC
The Northwestern Mutual
Life Insurance Company • Milwaukee,WI www.northwesternmutual.com
90-1899 (0786) (REV 0707)
Northwestern Mutual®
P.O. Box 3095
Milwaukee, WI 53201-3095