UNITED STATES SECURITIES AND EXCHANGE COMMISSION
Washington, D.C. 20549
Proxy Statement Pursuant to Section 14(a) of the Securities
Exchange Act of 1934 (Amendment No. )
☑ Filed by the Registrant | ☐ Filed by a Party other than the Registrant | |
Check the appropriate box: | ||
⬜ | Preliminary Proxy Statement | |
⬜ | CONFIDENTIAL, FOR USE OF THE COMMISSION ONLY (AS PERMITTED BY RULE 14a-6(e)(2)) | |
☑ | Definitive Proxy Statement | |
⬜ | Definitive Additional Materials | |
⬜ | Soliciting Material Pursuant to §240.14a-12 | |
(Name of Registrant as Specified In Its Charter)
(Name of Person(s) Filing Proxy Statement, if other than the Registrant)
Payment of Filing Fee (Check all boxes that apply): | ||
☑ | No fee required. | |
⬜ | Fee paid previously with preliminary materials. | |
⬜ | Fee computed on table in exhibit required by Item 25(b) per Exchange Act Rules 14a-6(i)(1) and 0-11. | |
UDR At A Glance | ||||
UDR is a full-cycle investment | 51+ Years | |||
that consistently generates | ||||
strong total shareholder return | History | |||
(“TSR”) through innovation, | ||||
best-in-class operations, and | S&P 500 | |||
disciplined capital allocation. | ||||
 | Multifamily REIT | |||
~$20 Billion | ||||
Enterprise Value (1) | ||||
~60,000 | ||||
Apartment Homes (2) | ||||
21 | ||||
Markets | ||||
4.4% | ||||
Dividend Yield (1) | ||||
(1) Enterprise Value and Dividend Yield as of December 31, | ||||
2023 | ||||
(2) As of December 31, 2023; includes homes held by | ||||
unconsolidated joint ventures | ||||
Properties on the Cover | ||||
Outside Front Cover: Columbus Square, New York City (Top-Left), | ||||
The Whitmore, Arlington, VA (Top-Center), Waterside Towers, Washington, DC (Top-Right), Signal Hill, Woodbridge, VA (Middle), Andover House, Washington, DC (Bottom) | ||||
Inside Front Cover: Waterside Towers, Washington, DC | ||||
Outside Back Cover: The Courts at Huntington Station, | ||||
Alexandria, VA | ||||
UDR Values UDR has a strong, inclusive culture that promotes innovation, engagement, and good corporate responsibility. We expect our associates will continue to cultivate this culture in alignment with our values for many years to come. |
| Respect |
|
| Integrity |
|
| Teamwork |
We will treat each other with courtesy and fairness. We will learn from a diversity of perspectives and accept that doing so is the way to a greater balance in our lives. | We will be honest and sincere in both words and our actions, striving to do the right thing, the right way, every time. | As we work together, we share ideas to find better ways to develop effective solutions, challenge our thinking, and overcome obstacles. | |||||
|
| Ownership |
|
| Growth |
Our Company's success will be the result of holding ourselves accountable to meet our goals and proudly share in our victories. | We will "be our best" when we increase our skills, gain more knowledge, try new things, learn from our mistakes, and focus on the positive as we shape our future. | ||||
Highlights, Culture, and Values
Our approach to social responsibility ensures we have a strategy and initiatives in place that address aspects across the employee lifecycle, including attracting, recruiting, developing, engaging and retaining talent. Our ultimate goal is to build a better Company by maintaining a diverse, engaged workforce to grow and retain talent, as there is a positive correlation between culture and values with engagement, productivity, and the bottom line. In furtherance of this goal, in 2023 we hired a Vice President - Organizational Development to concentrate on our succession and talent development efforts. Our commitment to social responsibility also prioritizes resident engagement and their experience with UDR. In 2023 we published our fifth ESG report, and we have received a 5 star designation from GRESB.
What Is New in this Proxy Statement? ● Expanded human capital disclosure including new benefit programs and associate communication methods ● Expanded disclosure regarding our efforts with respect to cybersecurity ● Added Independence Realty Trust (“IRT”) to our apartment peer group for 2024 ● Expanded disclosure regarding our board overboarding policy ● Added disclosure regarding actual compensation ● Additional disclosure regarding shareholder engagement ● Expanded disclosure regarding our sustainability efforts | ||||
x
| I welcome you to join me and the entire Board of Directors at our 2024 Annual Meeting of Shareholders, which will be held at 10:00am local time in Denver, CO, May 23, 2024, at the Four Seasons Hotel. Thomas W. Toomey Chairman and Chief Executive Officer | |||||
|
|
|
| |||
To My Fellow Shareholders:
Over the course of my 23 years at UDR, Inc. (“UDR” or the “Company”) and more than 30 years in the multifamily industry, I have seen firsthand the evolution of our business and how we communicate with stakeholders. Given the hundreds of investor interactions we conduct and the multitude of documents we publish annually which inform UDR’s stakeholders on our strategy and results in detail, this letter, which was once a primary communication vehicle, now seems more akin to a reflective piece. As such, I am using this platform to comment on the year that was, reflect on the progress we have made on our fourth strategic plan which we launched five years ago, and opine on where we see our business heading.
To that end, 2023 was a strong year for UDR. Among our many accomplishments, the Company:
| ● | Generated Funds From Operations as Adjusted (“FFOA”) per share growth of 6%. |
| ● | Produced same-store NOI growth of 6.8%, the second highest among our apartment peer group1 and the fourth highest annual growth rate over my 23 years at UDR. I would like to thank Mike Lacy, Matt Cozad, Kristin Nicholson, Cesar Armendariz, and our approximately 1,400 associates across the country for your continued passion to deliver success. |
| ● | Increased our dividend by a robust 10.5%, a near-record high for the Company, enhancing our already strong total return profile. |
| ● | Advanced our innovation efforts to deliver greater resident satisfaction, reduce resident turnover, and enhance associate resources, thereby positioning the Company well for years to come. I thank Scott Wesson, Josh Gampp, Chris Johnson, and our Innovation Team for continually finding creative solutions to advance the way we conduct business. |
| ● | Adhered to capital market signals and maintained disciplined capital allocation. We opportunistically executed approximately $1 billion of accretive deals through joint venture and Operating Partnership Unit transactions in 2023. I thank Harry Alcock, Andrew Cantor, Dan Campbell, and their teams for their tireless efforts to uncover attractive investment opportunities. |
| ● | Maintained a solid BBB+/Baa1 investment grade rating. I am grateful for Joe Fisher, Abe Claude, and their teams for positioning our balance sheet with minimal debt maturities through 2026 while enhancing liquidity to approximately $1 billion. |
| ● | Expanded our commitment to environmental, social, and governance (“ESG”) goals, as evidenced by a Sector Leader designation by GRESB2 and again being named to Newsweek’s list of America’s Most Responsible Companies. Chris Van Ens, Stephanie Marlin, Justin Rychlick, and our Sustainability team rightfully deserve credit for advancing our long-term environmental strategy. |
| ● | Received accolades from Institutional Investor3, who recognized UDR’s Board, Chairman and CEO, President and CFO, and Investor Relations team as being top-3 in their respective categories among more than 150 companies in the U.S. REITs industry. |
1 Apartment peer group includes AIRC, AVB, CPT, EQR, ESS, and MAA.
2 GRESB is a leading global ESG benchmark for real assets including real estate.
3 Institutional Investor offers annual rankings on corporates, buy-side and sell-side research, hedge funds, fixed income and asset management. These rankings have become known as the benchmark for excellence and a published position is confirmation directly from investors and/or sell-side analysts of the quality and reliability of a company’s efforts.
Specific to the Company’s fourth strategic plan that we prepared in conjunction with our Board and launched in 2018, we have achieved various accomplishments in transforming our business to a self-service model with a focus on an improved customer experience and higher associate engagement. Over the last five years, we have:
| ● | Grown the Enterprise Value of our Company by nearly 6%, the second highest rate among our peer group. This is a reflection of both our ability to source and deploy capital accretively and expand the operating margin on acquired communities through our industry-leading operating platform. |
| ● | Generated cumulative same-store NOI and FFOA per share growth of nearly 20%, each the third highest among our apartment peer group, trailing only our Sunbelt-oriented peers who disproportionately benefitted from increased demand due to effects of the COVID pandemic. |
| ● | Enhanced our controllable operating margin to a peer-leading 84%, helping drive higher cash flow growth. |
| ● | Delivered Total Shareholder Return of 15%, a testament to our ability to navigate through a wide range of challenges including the COVID pandemic, a capital markets recession, and interest rate volatility, among others. |
| ● | Increased the frequency, depth, and breadth of associate engagement. Similar to establishing a culture, improving engagement takes time and requires attentively listening and responding to our associates. We have made concerted efforts to enhance dialogue through frequent discussions, surveys, and townhall-style forums. Nearly 90% of our associates participate in these engagements, and approximately 80% of UDR associates express satisfaction in their job; both results are well above their respective benchmarks for high-performing companies. While there remains room for improvement, I am encouraged by our industry-leading response rate and feedback that shows an overwhelming majority of our associates enjoy working for, and believe they can succeed at, UDR. This is best evidenced by achieving an all-time Company low associate turnover rate of 22% in 2023, which is nearly half of the industry average of 40%. |
While the team and I are proud of our accomplishments, we continue to build the Company for the future and are excited for what lies ahead. Namely, our primary goals remain to innovate and drive durable competitive advantages across our diversified portfolio. Over time, these should generate attractive risk-adjusted returns for our stakeholders irrespective of the economic cycle. To accomplish this, we remain laser focused on executing in areas that we can control. These include continuous innovation, the quality of our customer service, growing the skill set of our associates, solidifying our balance sheet and improving liquidity, and actively engaging investors.
We start 2024 with fewer “knowns” than in 2023 due to ongoing interest rate volatility, economic uncertainty, geopolitical risks, and historically high levels of new multifamily supply, all of which could impact customer behavior. While the macro backdrop remains fluid, we remain confident in our abilities to navigate through a wide range of outcomes. Our success over time can be directly linked to four core attributes:
| 1. | Always listening to associates, customers, and other stakeholders to guide long-term strategy and short-term tactics. |
| 2. | Continually evolving how we conduct our business through ongoing innovation. |
| 3. | Fostering an inclusive culture that empowers teams and associates to innovate while simultaneously affording opportunities for career growth and work-life balance. |
| 4. | Focusing on what we can control and creating strategies that mitigate risk from drivers of our business that are out of our control. |
Looking to 2024, we have strategically positioned ourselves with high occupancy of over 97% to begin the year, with the intent of pushing rent growth as the peak leasing season unfolds. Also in our favor are several underlying fundamental factors including:
| 1. | Our consumer remains resilient, with rent-to-income ratios approximating the long-term average. |
| 2. | Relative affordability versus alternative housing options remains decidedly in our favor at roughly 60% less expensive to rent than own, a 25% improvement from pre-COVID, and supportive of a stable to declining homeownership rate. |
| 3. | The largest U.S. age cohorts remain in their prime renter years, according to the latest U.S. Census data, providing continued support for long-term rental demand. |
| 4. | Multifamily development starts activity has retreated by 70% from recent highs and is now well below historical norms, which should benefit future rent growth. |
What is missed in the numbers we report and the macro outlook that drives our business is how we are structurally enhancing UDR to better capitalize on what should be improved operating conditions post 2024. These enhancements include our Customer Experience Project, which helps to improve our residents’ UDR experience, reduce resident turnover over time, and better capture the lifetime value of a UDR resident. This initiative will continue to be rolled out in the coming years, but the upside potential is vast. For every 1% decrease in resident turnover our NOI increases by approximately $3 million. Since implementing our Customer Experience Project in mid-2023, initial results have been positive with annualized resident turnover approximately 3.5% to 4% lower versus the prior year. To facilitate the implementation of the Customer Experience
2024 Proxy Statement |
| 3 |
Project and other future innovations, we have reorganized the reporting structure of some of our business lines. Specifically, we combined our Operations and Technology Systems teams to streamline the process of advancing ideas into actions and outcomes. I am excited about what this collaboration will yield.
Management Team Update
On a bittersweet note, UDR’s Chief Investment Officer Harry Alcock announced his retirement effective July 31, 2024. Harry, who has been with UDR for 13 years and with whom I have had the pleasure of working for approximately 30 years during our careers, has been a long-time trusted partner. His contributions to the Company have helped UDR thoughtfully and accretively grow from an $8 billion enterprise in 2010 to a $20 billion enterprise today. I am thankful that UDR and its investors have benefitted from Harry’s expertise, and wish him well in his retirement.
With change comes opportunity. Our broader investment teams are in good hands under the guidance of Andrew Cantor, Bob McCullough, Doug Fee, and Andrew Lavaux. All have proven their value to the Company time and again, and I look forward to working with them more closely moving forward.
Reflection
When considering our long-term growth trajectory, we will continue to focus on our customers, associates, and stakeholders.
| 1. | Customers. Our residents have healthy rent-to-income ratios and relative affordability continues to favor apartments over other forms of housing. So, we view the near-term effect of elevated multifamily supply as transitory and expect that the demand versus supply dynamic will eventually revert to our favor. |
| 2. | Associates. Through frequent discussions, surveys, and townhall meetings, we have created a strong and engaging culture that empowers our associates to constantly innovate and help grow the Company. |
| 3. | Stakeholders. We are highly engaged and understand what stakeholders believe we are doing well and where we can and will improve. |
From these interactions, we have created a company that we believe is a full cycle investment and maximizes value creation for our stakeholders regardless of the economic environment. In 2024 and beyond, we plan to lean into what we can control and execute on. This means continuing to leverage our operating platform and innovation, nimbly adjusting our tactics to combat the ever-changing economic landscape, taking a capital light approach to maintain liquidity and balance sheet flexibility, and continuing to invest in our associates and culture. Taken together, I believe these tactics will continue UDR’s long tenure of success.
Finally, my and Senior Management’s thanks go out to our associates, the Company’s trusted partners, and our Board. These groups are a big reason why UDR continues to succeed, and I look forward to seeing how our innovation will propel UDR forward in the years to come.
Best,

Thomas W. Toomey
Chairman and Chief Executive Officer
2024 Proxy Statement |
| 4 |
Voting Items
01 | Election of 10 Directors |
Date and Time
Location
Who Can Vote Important Notice: Availability of Proxy Materials for UDR, Inc.’s Annual Meeting of Shareholders to be held on May 23, 2024. This Notice of Annual Meeting and Proxy Statement and UDR, Inc.’s Annual Report/Form 10-K for the year ended December 31, 2023 are available on the Internet at the following website: www.proxyvote.com. | ||||
| The Board recommends a vote “FOR” each director nominee | Page 24 |
| |||
02 | Advisory Vote on Executive Compensation | |||||
| The Board recommends a vote “FOR” | Page 61 |
| |||
03 | Ratification of Ernst & Young LLP as Independent Registered Public Accounting Firm | |||||
| The Board recommends a vote “FOR” | Page 104 |
| |||
Shareholders will also transact such other business as may properly come before the Meeting or any adjournment(s) thereof. How to Vote in Advance Your vote is important. Whether or not you plan to attend the meeting, we urge you to vote your shares electronically through the following: | ||||||
|
|
| ||||
By Telephone 1-800-690-6903 | By Internet www.proxyvote.com | By Mail Mark, sign and date your proxy card and return it in the postage-paid envelope we have provided | ||||
2024 Proxy Statement |
| 5 |
On or about April 4, 2024, we intend to mail to our shareholders of record a notice containing instructions on how to access our 2024 proxy statement (“Proxy Statement”) and our Annual Report on Form 10-K for the year ended December 31, 2023 (“Annual Report”), and how to vote online. The notice also provides instructions on how you can request a paper copy of these documents if you desire, and how you can enroll in e-delivery. If you received your annual meeting materials via email, the email contains voting instructions and links to our Annual Report and Proxy Statement on the Internet. If you would like to reduce the costs incurred by UDR in mailing proxy materials, you can consent to receiving all future proxy statements, proxy cards and annual reports electronically via e-mail or the Internet. To sign up for electronic delivery, please follow the instructions on the Proxy Card to vote using the Internet and, when prompted, indicate that you agree to receive or access shareholder communications electronically in future years. We want to thank you for helping make UDR an environmentally friendly company and for your continued support of UDR.
We intend to hold our annual meeting in person; however, in the event it is not possible or advisable to hold our annual meeting in person, we will announce alternative arrangements for the meeting as promptly as practicable, which may include holding the meeting by means of remote communication. Please monitor our annual meeting website at https://www.udr.com/2024annualmeeting for updated information. If you are planning to attend our meeting, please check the website one week prior to the meeting date.
Whether or not you expect to be at the meeting, please vote as soon as possible to ensure that your shares are represented.
By Order of the Board of Directors

Warren L. Troupe
Corporate secretary
April 4, 2024
2024 Proxy Statement |
| 6 |
This summary highlights selected information about UDR and the items to be voted on at the annual meeting. This summary does not contain all of the information that you should consider in deciding how to vote. You should read the entire proxy statement carefully before voting.
Company Overview
About UDR, Inc.
UDR is a $20 billion enterprise value multifamily REIT that owns, operates, develops and redevelops a diversified portfolio of apartment homes across top-tier U.S. markets. Founded in 1972, UDR is an S&P 500 company that consistently generates strong total shareholder return through innovation, best-in-class operations and disciplined capital allocation across a wide range of opportunities. UDR’s strategy is founded on diversification across markets, price points, and product types which coupled with our best-in-class operations delivers a full-cycle investment that generates both growth and stability. As of December 31, 2023, we owned 188 communities including 60,336 homes and had 1,397 full-time and 13 part-time associates who worked to generate in excess of $1.6 billion of revenue in 2023.
2024 Proxy Statement |
| 7 |
Proxy Overview
UDR’s Business Strategy
Why UDR?
Strategy
Our primary goal is to consistently generate above-peer (our apartment peers include AIRC, AVB, CPT, EQR, ESS, and MAA) average total shareholder return (“TSR”) while considering our stakeholders and the environments in which we operate. The following attributes aid us in executing this goal through growth in Funds from Operations as Adjusted (“FFOA”), Net Asset Value (“NAV”), and the Dividend per share combined with being a strong Corporate Citizen.
► Operating Excellence | ► Culture and ESG | |
● Generate above-peer median same-store growth. ● Enhance controllable operating margin via innovative technological solutions. ● Increase resident satisfaction through self-service enablement. | ● Promote an innovative, inclusive culture where associate engagement is high, sustainability is more than a catch phrase, and top-notch customer service is a central focus. ● Reduce our environmental footprint through accretive capital investments in energy, water, and waste initiatives. | |
► Portfolio Diversification | ► Accretive Capital Allocation | |
● Reduce metropolitan statistical area concentration risk and same-store growth volatility and appeal to a wide renter/investor audience. ● Implement our best-in-class operating and capital allocation platforms. | ● Invest in and pivot to the best risk-adjusted return opportunities. ● Apply predictive analytics that influence investments and capital deployment. | |
► Balance Sheet Strength | ||
● Maintain a safe, liquid and flexible balance sheet that can fully fund our needs throughout real estate cycles. ● Sustain a diverse, efficient set of capital sources. | ||
These efforts contribute to creating above-peer average TSR:

2024 Proxy Statement |
| 8 |
Proxy Overview
2023 Performance Highlights
In 2023, UDR achieved a variety of successes, which include:
► Earnings and Growth Highlights | ||
● Generating above-peer-average earnings growth of 6%, marking the seventh time in the last ten years UDR has outperformed the peer group. ● Accretively growing the Company through $402 million of wholly owned acquisitions. ● Formed the LaSalle joint venture, contributed $507 million of properties and acquired one property for $114 million. ● Our dividend paid in January 2024 (for the fourth quarter of 2023) was our 206th consecutive dividend paid and our annualized dividend for 2024 increased by 1.2% over 2023, while our 2023 annualized dividend increased by 10.5% over the annualized dividend for 2022. | ||
► Operational Highlights | ||
● Implementing the Company’s Next Generation Operating Platform to improve the customer experience and our operating efficiency through a self-service model. Since 2018, UDR has reduced onsite staffing by approximately 40% mostly through natural attrition, resulting in UDR having the best controllable operating margin in the multifamily peer group at approximately 300 basis points above what would be expected for a company with UDR’s average rent. We are continuing our innovation efforts and have identified future projects which we estimate will increase net operating income by as much as $40 million while at the same time enhancing our residents’ experience. ● Second highest same-store net operating income growth among our apartment peers for 2023. | ||
► ESG Highlights | ||
● Enhanced our ESG related disclosure resulting in receiving a GRESB Sector Leader designation, being named one of America’s Most Responsible Companies by Newsweek for the third consecutive year, and we have committed to invest $30 million (including $10 million in early 2024) in strategic ESG and climate focused venture capital funds. ● We were an inaugural donor to the NAREIT Foundation’s Dividends through Diversity, Equity and Inclusion campaign. ● Achieved 80% participation by our associates in our quarterly Associate Engagement Pulse Survey. ● Introduced quarterly pulse surveys to promptly examine and consider the needs and perceptions of our associates. ● Associate turnover of 22% in 2023 outperforming the industry average of 40%. ● Updated our Scope 1, 2, and 3 emissions intensity goals to align with science-based targets. | ||
► Investment/Balance Sheet | ||
● Invested in ~$1 billion of joint venture and operating partnership unit transactions. ● Maintained our investment-grade balance sheet and have the lowest cost of debt in our sector and the best liquidity profile – only 12% of debt (apartment peer group average is 25%) maturing through 2026. | ||
2024 Proxy Statement |
| 9 |
Proxy Overview
Innovation Accomplishments
UDR’s history of innovation has delivered better SS NOI growth and controllable operating margin versus peers.
Long-Term Same-Store UDR vs. Peer Median(1) SS NOI Growth (2013-2023) | Controllable Operating Margin (“COM”) COM vs. Avg. Monthly Rent(2) (TTM THROUGH 4Q 2023) |
|
|
| (1) | Peer group includes AIRC (AIV prior to 2021), AVB, CPT, EQR, ESS, and MAA; 2Q 2020 through 4Q 2023 UDR same-store NOI results have been adjusted where appropriate to reflect concessions on a straight-line basis for peer comparability. |
| (2) | Based on disclosures across the peer group, Average Monthly Rent is defined as average monthly rental rates for EQR, ESS, and MAA and is defined as average monthly revenue per occupied home for AIRC, AVB, CPT, and UDR. |
Source: Company and peer documents.
~300 bps controllable operating margin advantage vs. peer average |
| Same-Store EBITDA margin (including G&A and property management) is ~100 bps higher than the peer average |
| Higher Same-Store EBITDA margin in 9 of 14 primary UDR markets in which we compete with our apartment peers |
2024 Proxy Statement |
| 10 |
Proxy Overview
Human Capital Management
Our associates are critical to our success and, in recognition of that fact, below we describe some of the tools and initiatives we utilize to attract, develop, and retain our associates as well as to measure the results of our efforts. Our goal is to build a culture that results in high associate satisfaction and retention, which in turn should help us to achieve results for our other stakeholders, including our shareholders. Our efforts in 2023 resulted in a turnover rate of 22%, a 4% decrease from 2022, as compared to an industry average turnover rate of 40%.
Board Oversight
The board believes that it is critical to our success that we continue to attract, develop and retain high quality associates in all areas of our business. Through its oversight function, the board sets the “tone at the top,” and holds senior management accountable for creating a culture that embodies our values and that allows us to attract and retain the high-quality associates that we need. Each year in its annual report to the board, the human resources team furnishes a thorough overview of our human capital initiatives, encompassing the evaluation process and results, workforce analysis, and strategic planning components.
In 2018, in connection with our belief as to the importance of our associates to our success, a “Health of the Workforce” performance metric was added to our short-term incentive compensation program for our named executive officers and certain other senior officers, which has been retained for subsequent years. In 2023, we continued to track the Rooney Rule metric as part of the “Health of the Workforce” scorecard, which ties compensation to performance with respect to an initiative to consider all candidates for all open positions across the entire company. A new ESG metric was added to our 2021 short term incentive compensation program and retained for 2022 and 2023, although for 2023 such metric was revised to be determined based on the percentile of our overall GRESB score as opposed to an absolute score. In addition, for 2022 and 2023 we expanded our Health of the Workforce and ESG metrics so that they impact associate compensation for many associates beginning at the vice president level and in 2024 we expanded this concept to many associates at the director and senior director level.
Helping Our Associates Thrive
At UDR, our culture is defined by choice, transparency, and trust. We seek to empower our associates to make decisions that align with their individual interests and benefit the company as a whole. Our approach to human capital has resulted in high levels of associate engagement as shown by our associate surveys, leading to increased associate retention (turnover in 2023 of 22% outperforming the industry average of 40%) and better performance outcomes. To continue this success, our human resources team continues to evaluate and adjust our strategies to create alignment between the needs and expectations of our business and our associates.
To further enhance our commitment to human capital development, in 2023, we hired a Vice President of Organizational Development, a new position that will focus on career development and succession for associates throughout the organization. These efforts will play a pivotal role in ensuring that UDR cultivates and retains the right talent in the right positions.
In 2022, as part of our ongoing commitment to optimizing our human resources strategy, our human resources team spearheaded an HR Priority Ranking Assessment involving approximately 50 UDR leaders, including Senior Vice Presidents and Vice Presidents. The objective was to synchronize our strategic direction with the specific needs of our business, allowing the creation of tailored and impactful solutions. Based on the insights gleaned from this assessment, five key HR Goals for 2023 were identified and subsequently approved by the senior executive team. In addition, drawing upon feedback garnered from quarterly pulse surveys begun in 2023, our objectives were adjusted for 2024. For 2024, our five core objectives are as follows: (1) enhance the associate experience to drive engagement and elevate customer satisfaction; (2) strengthen our approach to learning, development, and succession planning; (3) pursue excellence in associate health, wellness, and compensation to maintain competitive standing in the market; (4) optimize our talent acquisition function to attract and retain top talent effectively, and (5) advance our DEI programs and expand opportunities for community engagement among associates.
Following up on the comprehensive benefits survey of our associates conducted in 2022, and the changes we made to our benefits program in 2022 based on the results of the survey, we dedicated our third quarter 2023 associate engagement pulse survey to benefits. That survey revealed that 88% of associates have a clear understanding of their benefits, with a strong favorability rating of 77% across our UDR benefit offerings. Drawing from the survey and additional feedback from associates we further enhanced our benefit package for 2024 by reducing the benefit waiting period from 60 to 30 days, instituting a 401(k) auto-enrollment for new hires at 3% of salary, introducing Teen Support to our Associate Resource Program, and launching a new Annual Virtual Health & Wellness Fair.
For a number of years, we have worked in our recruitment endeavors to attract qualified candidates including candidates from underrepresented groups. In connection with that effort, we have implemented various strategies such as integrating our Human Resources Information System with job board platforms, including those most used by potential candidates from underrepresented groups, collaborating with organizations such as the National Diversity Council, actively participating in military job fairs, and making other concerted efforts to recruit from diverse candidate pools. These efforts have been successful, in 2023, 61% of our newly hired associates were from ethnic groups other than white, and 42% were female. In addition to recruiting efforts, we continue to furnish resources on DEI-related topics, offering a range of avenues, including webinars, training, workshops, and other tools. These efforts are complemented by our ongoing initiatives to promote community engagement, exemplified through activities such as food drives and volunteer opportunities. We measure our efforts in this area through our quarterly pulse surveys with a survey in 2023 showing that 80% of associates believe that everyone can succeed at UDR irrespective of age, cultural background, gender, or race.
2024 Proxy Statement |
| 11 |
Proxy Overview
Compensation programs are also important to recruiting, attracting and retaining talent and along with our surveys we use tools to measure our compensation across a variety of metric including a compensation market data tool we began using in 2022, that provides near real-time market data, which we use to measure and update our salary ranges.
Set forth below are graphs that show the average salary by gender and ethnicity versus the average salary company wide, in each case by job title:
by gender: | |||||||
Salaries | Workforce | Management | Management Promotions | ||||
100% | 100% | 40% | 60% | 43% | 57% | 48% | 52% |
Female | Male | Female | Male | Female | Male | Female | Male |
by ethnicity: | |||||||
SALARIES BY ETHNIC GROUP | Workforce | Management | Management Promotions | ||||
Asian | 106% | Asian | 2% | Non-white | 39% | Asian | 5% |
Black | 101% | Black | 13% | White | 61% | Black | 18% |
White | 100% | White | 53% | White | 52% | ||
Hispanic/ | 99% | Hispanic/ | 26% | Hispanic/ | 21% | ||
Other | 102% | Other | 6% | Other | 4% | ||
* | Data as of or for the period ending December 31, 2023. |
** | Management is defined as Resident Services Manager and more senior job classifications. |
Other includes: American Indian, Alaska Native, Native Hawaiian, Pacific Islander, Not Specified or two or more races.
2024 Proxy Statement |
| 12 |
Proxy Overview
While we believe the metrics with respect to our workplace and workforce set forth above are more useful to us in managing our business, the data from our EEO-1 report for 2022, filed in May 2023 (the most recent report available), is below.
Job | Hispanic | Non-Hispanic or Latino | Overall Total | ||||||||||||
Male | Female | ||||||||||||||
Male | Female | White | Black or African | Native Hawaiian or | Asian | American Indian | Two or More Races | White | Black or African | Native Hawaiian or | Asian | American Indian | Two or More Races | ||
Exec/Sr. | 3 | 0 | 35 | 0 | 0 | 0 | 0 | 0 | 13 | 0 | 0 | 0 | 0 | 0 | 51 |
First/Mid | 39 | 11 | 84 | 9 | 0 | 4 | 1 | 4 | 113 | 12 | 0 | 8 | 0 | 4 | 289 |
Professionals | 15 | 25 | 91 | 11 | 1 | 3 | 0 | 5 | 77 | 17 | 2 | 7 | 2 | 7 | 263 |
Technicians | 0 | 0 | 0 | 0 | 0 | 0 | 0 | 0 | 0 | 0 | 0 | 0 | 0 | 0 | 0 |
Sales Workers | 2 | 6 | 6 | 2 | 0 | 0 | 0 | 1 | 21 | 4 | 0 | 0 | 0 | 2 | 44 |
Administrative Support | 13 | 40 | 41 | 15 | 1 | 6 | 0 | 3 | 85 | 29 | 1 | 4 | 0 | 14 | 252 |
Craft Workers | 156 | 1 | 92 | 42 | 1 | 1 | 1 | 3 | 0 | 0 | 0 | 0 | 0 | 0 | 297 |
Operatives | 0 | 0 | 0 | 0 | 0 | 0 | 0 | 0 | 0 | 0 | 0 | 0 | 0 | 0 | 0 |
Laborers & Helpers | 14 | 0 | 23 | 4 | 0 | 0 | 0 | 1 | 0 | 0 | 0 | 0 | 0 | 0 | 42 |
Service Workers | 15 | 6 | 28 | 10 | 1 | 0 | 0 | 3 | 8 | 3 | 0 | 1 | 0 | 1 | 76 |
Total | 257 | 89 | 400 | 93 | 4 | 14 | 2 | 20 | 317 | 65 | 3 | 20 | 2 | 28 | 1314 |
Previous | 245 | 78 | 376 | 79 | 4 | 12 | 3 | 15 | 312 | 50 | 2 | 20 | 0 | 31 | 1227 |
We believe that a critical component of human capital is training, which is a cornerstone for enhancing associate job satisfaction, effectiveness, career progression, and retention. We have a comprehensive two-day onboarding process for new associates during which we prioritize instilling our culture, values, mission, and administrative procedures, providing our associates with the groundwork for success. In addition, we have mandatory annual regulatory training covering areas such as harassment, cybersecurity, and fair housing for all associates. Further, associates can participate in management development programs such as ULEAD and Level Up! Career Mobility Programs. Through these programs we intend to equip associates with the essential skills required for career advancement. Our extensive training catalog boasts over 6,000 courses encompassing leasing skills, property maintenance, customer service, project management, and system applications. In 2023, our associates collectively dedicated 13,924 hours to training, averaging 10 hours per full-time associate. In addition, with respect to required training, we implemented enhanced controls to ensure timely completion of courses, resulting in a 95% completion rate by year end 2023.
Certifications are widely recognized as key elements in career progression within the apartment industry. To support our associates' professional growth, we actively encourage them to pursue certifications aligned with their interests, offering partial tuition reimbursement. Additionally, we require annual performance reviews, providing valuable feedback on career development and engagement levels, thereby integrating robust human capital management strategies into our practices.
We also believe in actively engaging with our communities and facilitating our associates' involvement in meaningful community initiatives. To this end, each associate receives 8 hours of paid volunteer time per year. In 2023, UDR associates collectively contributed 1,041 hours of paid time off for volunteer work, collaborating with over 20 local organizations. Additionally, we organized various drives and initiatives, including food, clothing, and blood drives, to support non-profit organizations and causes, fostering a culture of giving back.
Throughout 2023, in addition to our quarterly pulse survey program we also implemented various measures focused on improving communication in order to foster data-driven decisions and promote collaboration between operations and corporate teams. These initiatives included: centralizing information, creating an HR Monthly Newsletter, and establishing internal publications and recognition programs.
2024 Proxy Statement |
| 13 |
Proxy Overview
Sustainability
HIGHLIGHTS OF OUR SUSTAINABILITY EFFORTS OVER RECENT YEARS INCLUDE:

1M kWh | SCOPE 1, 2, AND 3 EMISSIONS INTENSITY REDUCTION GOALS | ESG and Climate Tech Funds | ||||||||
Over 300 Sustainability Projects | United Nations Sustainable Development Goals | 32,071,000 kWh in RECs | ||||||||
More than 420 Electric Vehicle Charging Ports | Paperless | 11,000 kW | ||||||||
Physical Climate Change Risk | 15,978,000 Gallons Reclaimed | Carbon Footprint and Climate Related Risk | ||||||||
41,700 Metric Tons CO2e Avoided | Resident Communication | |||||||||
Sustainable Building Certification | Compensation Tied to ESG | |||||||||
2024 Proxy Statement |
| 14 |
Proxy Overview
Commitment to Corporate Responsibility Reporting
In 2023, we published our fifth ESG Report covering calendar year 2022, which is available on the investor relations page of our website under the heading ESGà2023 ESG Report. Our Report aligns with SASB and TCFD standards and we updated our GRI disclosures to reflect the GRI Universal Standards (2021). Highlights of our report include:
| ● | Our updated long-term Sustainability Strategy which positions UDR well to navigate the still-evolving sustainability environment, including the adoption of science-based Scope 1, 2, and 3 GHG emissions intensity reduction targets and revised sub-goals related to reduced energy, water, and waste usage as well as greater renewable energy procurement. |
| ● | The expansion of our Environmental Metrics table to include Scope 3 emissions as we work towards our Scope 3 emissions intensity reduction goal. |
| ● | The introduction of our top five people goals, intended to help shape the direction of our future people initiatives, which are: |
| o | Monitor and enhance the associate experience; |
| o | Enhance our approach to learning, development, and succession planning; |
| o | Improve associate health and wellness; |
| o | Strengthen our talent acquisition function; and |
| o | Advance Diversity, Equity, and Inclusion (“DEI”) and community engagement programs. |
| ● | Additional disclosures related to associate engagement, including quarterly pulse survey results and the addition of “Associate Compensation and Benefits” to our ESG Report Materiality Assessment, which prioritizes ESG topics to include in our disclosures based on rankings periodically performed by senior leadership through a survey to reflect current ESG initiatives and relevant ESG engagement across our stakeholder groups. |
We will continue to evaluate our ESG strategy through consistent reviews of our ESG processes and initiatives to ensure that they (1) remain aligned with and enhance our strategic and sustainability goals, (2) address the evolving needs and expectations of our stakeholders, and (3) continue to provide useful and actionable ESG data metrics. Continued ESG improvement is critical to our long-term success, the results and the TSR we generate over time, enhancing our culture, and improving our residents’ experience.
Awards and Leadership
UDR’s ongoing commitment to enhancing its comprehensive ESG program resulted in the Company earning a variety of honors from widely recognized institutions as a leader in ESG and sustainability in 2023.
|
| GRESB Score of 87 Sustainalytics Climate Tech Funds | SDG Alignment Responsibility Green Bonds | Sustainable Building Certifications DEI Commitment | |||||
|
| ||||||||
|
|
| 2020 |
| 2021 |
| 2022 |
| 2023 | |
GRESB |
| 83 |
| 86 |
| 87 |
| 87 |
Sustainalytics |
| 13 |
| 13 |
| 12 |
| 14 |
MSCI |
| A |
| BB |
| BB |
| BB |
2024 Proxy Statement |
| 15 |
Proxy Overview
Protecting the Environment and Our Stakeholders
We understand the impact our business can have on the environment and our stakeholders. When appropriate, we undertake initiatives designed to improve our operational quality, improve quality of life for and retention of our associates and residents, and reduce our environmental footprint. Examples of efforts completed over the past couple of years include having third parties assess climate-change risks for each of our assets (the results of which are reported to the board and are used to inform future decision making), conducting environmental assessments of each UDR asset that we acquire, investing in ESG and Climate Technology Funds that are on the cutting edge of sustainability technology, including “green lease” addendums in all our leases to better educate our residents on their environmental impact, improving our employee benefits packages based on extensive internal feedback, and enhancing our resident experience through self-service and leading technologies. Over the past nine years we have completed 240 energy conservation projects which have resulted in estimated avoided emissions of more than 41,700 metric tons of carbon dioxide equivalent (CO2e) since 2015 and have also provided a strong financial return. In 2023, we updated our Sustainability Strategy to (1) reinforce our long-standing commitment to being a sustainability leader in the REIT space, and (2) better address the evolution that the sustainability space has undergone over the past 5+ years by layering on more programmatic sustainability actions and capital investment to our already best-in-class compliance and reporting framework. This updated strategy is governed by our Environmental Policy, which states that UDR is committed to incorporating efforts towards the protection of the environment within the Company’s environmental governance, risk management, and business strategy in order to operate more sustainably and create long-term value for our stakeholders.
2024 Proxy Statement |
| 16 |
Proxy Overview
proposal 1 highlights
01 | Election of 10 Directors |
| The Board recommends a vote “FOR” each director nominee |
● Diverse slate of directors (40% of our directors are diverse) with broad leadership experience. ● All candidates are highly successful executives with relevant skills and expertise. ● Average director tenure of 13.7 years with 9 of 10 directors to be voted upon independent of management. ● Board ranked number 3 in the 2023 Institutional Investor All-America Executive Team Rankings out of approximately 150 companies. | |
Our Existing Board
|
|
| |||||
Katherine A. Cattanach Former General Partner of INVESCO Private Capital, Inc. | Jon A. Grove Former Chairman, President and Chief Executive Officer of ASR Investments Corporation | Mary Ann King Co-Head of Berkadia Institutional Solutions | |||||
Independent Tenure: 18 years Other Current Public Company Boards: 0 Committee(s): AC, GC (Chair), NC | Independent Tenure: 26 years Other Current Public Company Boards: 0 Committee(s): CC | Independent Tenure: 9 years Other Current Public Company Boards: 0 Committee(s): CC, GC | |||||
|
|
| |||||
James D. Klingbeil Chairman and CEO of Klingbeil Capital Management and The Klingbeil Company | Clint D. McDonnough Managing Partner of McDonnough Consulting LLC; Former Office Managing Partner for Ernst & Young LLP’s Dallas office | Robert A. McNamara Former Group Chief Risk Officer of Lend Lease Corporation | |||||
Lead Independent Director Tenure: 26 years Other Current Public Company Boards: 0 Committee(s): NC (Chair), EC (Chair) | Independent Tenure: 8 years Other Current Public Company Boards: 0 Committee(s): AC, EC | Independent Tenure: 10 years Other Current Public Company Boards: 1 Committee(s): CC (Chair), GC, NC | |||||
|
|
| |||||
Diane M. Morefield Former Executive Vice President, Chief Financial Officer of CyrusOne | Kevin C. Nickelberry Managing Director and | Mark R. Patterson President of MRP Holdings LLC | |||||
Independent Tenure: 4 years Other Current Public Company Boards: 1 Committee(s): AC (Chair), GC, NC | Independent Tenure: 3 years Other Current Public Company Boards: 0 Committee(s): AC, GC | Independent Tenure: 10 years Other Current Public Company Boards: 3 Committee(s): CC | |||||
AC = Audit and Risk Management Committee CC = Compensation and Management Development Committee GC = Governance Committee NC = Nominating Committee EC = Executive Committee |
| |||||
Thomas W. Toomey Chairman and CEO of UDR, Inc. | ||||||
Tenure: 23 years Other Current Public Company Boards: 0 Committee(s): EC | ||||||
2024 Proxy Statement |
| 17 |
Proxy Overview
Board Snapshot

Skills and Attributes
|
|
|
|
|
|
|
Accounting/Financial | C-Level Management | Capital Market | Corporate | |||
10/10 | 8/10 | 9/10 | 10/10 |
|
|
|
|
|
|
|
Multifamily | Non-UDR Board | Property Mangement | Public Company CEO | |||
4/10 | 6/10 | 5/10 | 2/10 |
|
|
|
|
| ||||
Real Estate | Sales and | Stakeholder | Strategic | Technology, | ||||
9/10 | 8/10 | 10/10 | 10/10 | 6/10 |
2024 Proxy Statement |
| 18 |
Proxy Overview
Shareholder Engagement
85.0% | In 2023 and early 2024, we had 708 interactions with our investors through meetings and property tours, representing ownership of approximately 85.0% of our outstanding common stock. |
| 43.1% | In addition, we proactively contacted the governance or stewardship departments of 119 of our investors and received responses from and had engagement meetings with representatives of 17 of such departments, representing ownership of approximately 43.1% of our outstanding common stock. |
Governance Highlights
UDR has a history of strong corporate governance guided by three primary principles – dialogue, transparency and responsiveness. The board has adjusted our governance approach over time to align with evolving best practices, drive sustained shareholder value, and serve the interests of shareholders.
► Good Governance | |
● Extensive board and committee dialogue with formal processes for shareholder engagement ● Annual board and committee self-evaluations ● Annual individual director evaluation process ● Periodic continuing education for directors ● All directors attended at least 75% of meetings held ● Policies, incorporated in our Statement on Corporate Governance and Nominating Committee Charter, requiring the initial pools of candidates for the board and external searches for a Chief Executive Officer to include diverse candidates. This concept has been expanded to cover associates at all levels ● Annual advisory approval of named executive officer compensation ● Robust Code of Business Conduct and Ethics, and Code of Ethics for Senior Financial Officers ● Stock ownership guidelines for executive officers and directors ● Board Overboarding Policy | ● Prohibition on hedging transactions ● Pledging transactions prohibited without prior approval ● Recoupment Policy (updated in 2023) ● Charitable Donations and Political Contributions Policy ● Annual ESG reporting ● Double-trigger acceleration of vesting in the event of a change in control ● Twelve-month minimum vesting on equity awards generally ● Board and committee oversight of material short-term and long-term risks (including climate change and cybersecurity risk), ESG and human capital management |
► Shareholder Rights | |
● Annual election of all directors ● Majority voting in uncontested director elections ● Proxy access for eligible director candidates nominated by eligible shareholders ● No shareholder rights plan (poison pill) ● Confidential voting | ● No material restrictions on shareholders’ right to call a special meeting ● Active shareholder engagement ● Ability for shareholders to propose binding bylaw amendments ● No issued and outstanding shares of capital stock that have no voting rights and no treasury stock |
► Independent Oversight | |
● Strong Lead Independent Director role with clearly articulated responsibilities ● Audit, Compensation, Governance and Nominating Committees consist entirely of Independent Directors | ● All directors are independent, except the Chairman and Chief Executive Officer ● Independent directors and committees meet regularly in executive session |
2024 Proxy Statement |
| 19 |
Proxy Overview
Proposal 2 highlights
02 | Say-on-Pay: Advisory Vote on the Compensation of the Named Executive Officers |
| The Board recommends a vote “FOR” this proposal |
● Independent oversight by our Compensation and Management Development Committee, with the assistance of an independent compensation consultant. ● Executive compensation that is competitive with our peers and that is structured to be aligned with our strategy and is measured against both absolute and relative to our peers total return to shareholders. ● Executive compensation comprised of a mix of base salary, short-term incentive compensation and long-term incentive compensation, and is determined based on the consideration of a number of factors described in more detail in “Executive Compensation — Compensation Discussion and Analysis.” ● Our TSR over time compares favorably to the peer group. | |
Components of 2023 Compensation
| component |
| Fixed/ |
| objective | performance metrics | |
| Base Salary |
| Fixed |
| Designed to reward individual effort associated with job-related duties and to attract and retain talented executive officers for our Company. | ||
| Short-Term Incentive Compensation (STI) |
| Variable |
| Designed to encourage outstanding individual and Company performance by motivating the named executive officers to achieve short-term Company and individual goals by rewarding performance measured against key annual strategic objectives and, for the CEO, using the independent directors’ evaluation of the CEO’s performance towards achieving short-term goals. | ● FFO as Adjusted per share ● Transactions Index ● Operations Index ● GRESB Percentile ● Associate Engagement & DEI ● Individual and Department Goals | |
| Long-Term Incentive Compensation (LTI) |
| Variable |
| Our LTI compensation is designed to closely align the interests of our management with the creation of shareholder value, to motivate our management to achieve long-term growth and success of our Company and to foster significant ownership of our common stock by our management. LTI compensation is the most significant component of the named executive officers’ compensation. | ● 3-Year Relative TSR vs. Apartment Peers ● 3-Year Relative TSR vs. NAREIT Equity REITs Total Return Index ● 3-Year Relative FFO as Adjusted Growth Rate vs. Apartment Peers ● Annual FFO as Adjusted per share |
Say-on-Pay/Shareholder Engagement
While we have consistently had strong shareholder support for our executive compensation program, we continue to engage in dialogue with shareholders on executive compensation issues. We will consider the outcome of future advisory votes and the input we receive from shareholder engagement when establishing the Company’s compensation programs and policies and making compensation decisions regarding our named executive officers.
Our shareholders have consistently supported our executive compensation program and over the last five years, shareholder support for our advisory vote on executive compensation has averaged 85.86%.
2024 Proxy Statement |
| 20 |
Proxy Overview
Compensation Earned
Total compensation, as reported in the Summary Compensation Table and calculated as required by applicable rules and regulations, includes items driven by accounting rules and assumptions with respect to incentive compensation that has not yet been earned and may in the future not be earned. Therefore, it is not reflective of the compensation our named executive officers actually earned in a given year. Accordingly, to supplement the disclosure contained in the Summary Compensation Table and the narrative disclosure accompanying the table starting on page 89, we are providing the table below to compare the compensation earned by our named executive officers in 2023, 2022, and 2021 to the total compensation shown by the Summary Compensation Table.
The amounts set forth below for “Earned Compensation” differ materially from the amounts reported as total compensation in the Summary Compensation Table and are not a substitute for those amounts.
|
|
| ||||
Total | Earned | |||||
(from Summary | Compensation | |||||
Name and | Compensation Table) | Total | ||||
Principal Position | Year | ($) | ($) | |||
Thomas W. |
| 2023 | 11,755,015 | 6,727,096 | ||
Toomey |
| 2022 | 8,149,435 | 9,852,300 | ||
Chief Executive Officer |
| 2021 | 14,228,383 | 11,040,952 | ||
Joseph D. Fisher |
| 2023 | 4,855,745 | 3,701,277 | ||
President - Chief |
| 2022 | 8,191,454 | 4,288,540 | ||
Financial Officer |
| 2021 | 3,068,246 | 4,668,698 | ||
Harry G. Alcock |
| 2023 | 3,601,319 | 2,916,140 | ||
Senior Vice |
| 2022 | 3,236,130 | 4,332,375 | ||
President - Chief Investment Officer | 2021 | 2,963,709 | 5,004,658 | |||
Michael D. Lacy | 2023 | 2,765,854 | 2,478,862 | |||
Senior Vice |
| 2022 | 1,815,398 | 2,395,045 | ||
President - Property Operations |
| 2021 | 1,711,463 | 1,857,987 |
Earned Compensation for 2023 includes 2023 salary, any bonus earned in 2023, short-term incentive compensation earned for 2023, the portion of the long-term incentive programs with respect to which the performance period ended on December 31, 2023 and the “All Other Compensation” from the Summary Compensation Table for 2023.
Earned Compensation for 2022 includes 2022 salary, any bonus earned in 2022, short-term incentive compensation earned for 2022, the portion of the long-term incentive programs with respect to which the performance period ended on December 31, 2022 and the “All Other Compensation” from the Summary Compensation Table for 2022.
Earned Compensation for 2021 includes 2021 salary, any bonus earned in 2021, short-term incentive compensation earned for 2021, the portion of the long-term incentive programs with respect to which the performance period ended on December 31, 2021, and the “All Other Compensation” from the Summary Compensation Table for 2021.
2024 Proxy Statement |
| 21 |
Proxy Overview
Our Compensation Best Practices
Our compensation policies and programs are built upon a strong foundation of corporate governance and compensation best practices, including:
| WHAT WE DO |
|
| WHAT WE DON’T DO |
● Provide a significant portion of our named executive officers’ total compensation in the form of awards tied to executing our long-term strategy, performance relative to key business and individual objectives, and performance versus our peers as measured by a diverse set of metrics. ● Require compliance with our Executive Stock Ownership Guidelines, which require that our executive officers own a specified number of shares of the Company’s common stock or equivalent (110,000 shares for the Chairman and Chief Executive Officer and President, 50,000 shares for any Executive Vice President, and 20,000 for any Senior Vice President). ● Have a Recoupment Policy that applies to certain of our executive officers, including all our named executive officers, and their performance-based incentive compensation. This policy was updated in 2023 to satisfy rules adopted by the SEC and the NYSE in 2023. ● Have a Compensation Committee comprised entirely of independent directors. The Compensation Committee has retained its own independent compensation advisor. ● Have a Compensation Committee that reviews external market considerations, internal considerations, and the long-term interests of our shareholders, when making compensation decisions. ● Have the ongoing consideration and oversight by the Compensation Committee with respect to any potential risks associated with our incentive compensation programs. ● Have a “double trigger” change of control provision and no awards outstanding that are subject to the legacy “single trigger” provision. | ● Permit any Company personnel, which includes directors, officers and all other employees of the Company, to engage in any short-term, speculative securities transactions, engage in short sales, buying or selling put or call options, trading in options (other than those granted by the Company) or engaging in hedging transactions, in each case with respect to our securities. ● Permit purchasing securities on margin or pledging our securities as collateral without prior approval. ● Provide tax gross-ups for our named executive officers. ● Grant only time-vested restricted stock units, LTIP Units (including Performance LTIP Units), options, or other equity awards to our named executive officers as part of our long-term incentive compensation program other than in limited circumstances such as the appointment of a new executive officer or to recognize extraordinary achievements. ● Time the grants of restricted stock, restricted stock units, LTIP Units, options or other equity awards to coordinate with the release of material non-public information, or time the release of material non-public information for the purpose of affecting the value of any named executive officer compensation. ● Make one-time or special awards to our named executive officers other than in connection with the appointment of a new named executive officer or other special circumstance. | |||
Compensation Changes Made in Response to Stakeholder Feedback
Minimum Vesting Period Beginning with grants made in 2021 and thereafter, all equity grants will have a minimum vesting period of 12 months subject to certain limited exclusions. | Double Trigger Provision All grants made in 2021 and thereafter are subject to a double-trigger change in control provision. | |||||||
Specific ESG and DEI Metrics We have added both ESG and DEI specific metrics to our short-term incentive compensation program for both our named executive officers and, when appropriate, for other officers | “Rooney Rule” Metrics We modified the associate engagement metric for 2022 and subsequent years that is part of our short-term incentive compensation program, and is applicable to all our named executive officers, to incorporate in our compensation programs performance with respect to our “Rooney Rule” initiative. This expands the Rooney Rule concept to all job openings across the Company regardless of the position we are seeking to fill. | |||||||
2024 Proxy Statement |
| 22 |
Proxy Overview
Proposal 3 highlights
03 | Independent Registered Public Accounting Firm |
| The Board recommends a vote “FOR” ratification of Ernst & Young LLP for 2024. |
● Independent firm with few ancillary services and reasonable fees. ● Significant industry and financial reporting expertise. | |
Ernst & Young LLP, an independent registered public accounting firm, served as our auditors for fiscal 2023. Our Audit Committee again selected Ernst & Young LLP to audit our financial statements for fiscal 2024. Although it is not required to do so, the board is submitting the Audit Committee’s selection of our independent registered public accounting firm for ratification by the shareholders at the annual meeting in order to ascertain the view of our shareholders regarding such selection. Below is summary information about Ernst & Young’s fees for services during fiscal years 2023 and 2022:
Description of Services |
| 2023 |
| 2022 | ||
Audit Fees | $ | 1,341,609 | $ | 1,476,705 | ||
Audit-Related Fees |
| — |
| — | ||
Tax Fees | $ | 68,170 | $ | 209,896 | ||
All Other Fees |
| — |
| — | ||
TOTAL | $ | 1,409,779 | $ | 1,686,601 | ||
2024 Proxy Statement |
| 23 |
The ten individuals listed below, each of whom is currently a member of the board, have been nominated for election to the board at the 2024 annual meeting of shareholders.
| KATHERINE A. |
| JON A. |
| MARY ANN | ||
| JAMES D. |
| CLINT D. |
| ROBERT A. | ||
| DIANE M. |
| KEVIN C. |
| MARK R. | ||
| THOMAS W. Chairman and CEO of UDR, Inc. |
If any of the nominees is unable or declines to serve as a director at the time of the meeting, the proxies will be voted for any nominee who is designated by the present board to fill the vacancy. It is not expected that any nominee will be unable or will decline to serve as a director. The directors elected will hold their respective offices until the next annual meeting of shareholders or until their successors are elected and qualified.
Each nominee brings a strong and unique background and set of skills to our board, giving the board as a whole competence and experience in a wide variety of areas of value to the Company, including corporate governance and board service, executive management, corporate finance and financial markets, real estate investment and the real estate industry and civic leadership. For each of our director nominees, set forth below are the specific experience, qualifications, attributes or skills that led the board to conclude that the person should serve as a director for the Company. There is no family relationship between any of our directors or executive officers.
| Our board recommends that the shareholders vote “FOR” the director nominees listed above. |
VOTE REQUIRED AND BOARD OF DIRECTORS’ RECOMMENDATION
The affirmative vote of a majority of the votes cast is required for the election of a director in an uncontested election. A majority of the votes cast means that the number of shares voted “for” a director’s election exceeds fifty percent of the total number of votes cast with respect to that director’s election. If an incumbent director does not receive a majority of the votes cast for his or her election, the director is required to tender his or her resignation for the consideration of the board. See “Corporate Governance Matters – Majority Voting Standard for Uncontested Director Elections.”
Proposal 1 Election of Directors
Director Skills and Experience
Board Skills Matrix
Skill/Attribute | Cattanach | Grove | King | Klingbeil | McDonnough | McNamara | Morefield | Nickelberry | Patterson | Toomey | |
| Accounting/Financial Literacy | ● | ● | ● | ● | ● | ● | ● | ● | ● | ● |
| C-Level Management Experience | ● | ● | ● | ● | ● | ● | ● | ● | ||
| Public Company CEO Experience | ● | ● | ||||||||
| Corporate Governance | ● | ● | ● | ● | ● | ● | ● | ● | ● | ● |
| Stakeholder Advocacy | ● | ● | ● | ● | ● | ● | ● | ● | ● | ● |
| Real Estate Industry Experience | ● | ● | ● | ● | ● | ● | ● | ● | ● | |
| Multifamily Experience | ● | ● | ● | ● | ||||||
| Capital Market Experience | ● | ● | ● | ● | ● | ● | ● | ● | ● | |
| Sales and Marketing Experience | ● | ● | ● | ● | ● | ● | ● | ● | ||
| Non-UDR Public Board Experience | ● | ● | ● | ● | ● | ● | ||||
| Property Management and Operations | ● | ● | ● | ● | ● | |||||
| Technology, Cybersecurity, and Innovation | ● | ● | ● | ● | ● | ● | ||||
| Strategic Oversight | ● | ● | ● | ● | ● | ● | ● | ● | ● | ● |
| Diversity | ● | ● | ● | ● | ||||||
Proposal 1 Election of Directors
Diversity Matrix
Cattanach | Grove | King | Klingbeil | McDonnough | McNamara | Morefield | Nickelberry | Patterson | Toomey | |
Board Tenure | ||||||||||
Completed Years | 18 | 26 | 9 | 26 | 8 | 10 | 4 | 3 | 10 | 23 |
Gender | ||||||||||
Male | ● | ● | ● | ● | ● | ● | ● | |||
Female | ● | ● | ● | |||||||
Race/Ethnicity | ||||||||||
African American/Black | ● | |||||||||
White/Caucasian | ● | ● | ● | ● | ● | ● | ● | ● | ● |
Selection of Directors
At UDR, we believe that diversity of background and perspective is an important attribute of a well-functioning board. Collectively, the members of our board standing for election embody a range of viewpoints, backgrounds and expertise. Currently, 30% of the members of our board are women and 40% of the members of our board are diverse. All recent board searches have included ethnically diverse candidates (utilizing search firms with specific expertise with underrepresented groups) and, consistent with our other company initiatives, we adopted a “Rooney Rule” for all board searches. The diversity of our board will continue to be a point of focus in connection with board refreshment efforts.
2024 Proxy Statement |
| 26 |
Proposal 1 Election of Directors
Director Biographies
INDEPENDENT Age: Director Since: Committee Membership: | Katherine A. Cattanach, Ph.D. PROFESSIONAL EXPERIENCE ● Former General Partner of INVESCO Private Capital, Inc. (formerly Sovereign Financial Services, Inc., of which Dr. Cattanach was CEO), a company specializing in private equity investments, from 1987 to 2005. ● Former Secretary and a member of the Board of Trustees of Great Outdoors Colorado. She is active in, and serves as a member of, numerous charitable organizations. ● Member of the Board of Directors and chair of the audit committee of Empower Trust Company. ● Extensive civic leadership, including the Colorado Commission on Higher Education, the Governing Board for the Colorado State University System, the Foundation for Metropolitan State College, the Board of Trustees for the Colorado Chapter of the Nature Conservancy and the Board of Trustees for the Yellowstone Association. ● From 2005 to March 2006, she served as a director of Collect America, Ltd. ● Has served as a member of several corporate boards and board committees and on several partnership advisory boards. ● Ph.D. in Finance and has served on the faculty of the College of Business at the University of Denver and as an Associate Professor of Finance at the University of Denver’s Graduate School of Business. | |
SKILLS AND QUALIFICATIONS Dr. Cattanach brings to the board (1) corporate governance experience, (2) C-Suite level management experience, (3) civic leadership from her numerous philanthropic activities, and (4) capital markets, risk assessment and financial literacy. ● Current or Former CEO ● Current or Former Public Company Officer ● Strategic Oversight ● Stockholder Advocacy ● Corporate Governance ● Real Estate Experience ● Financial Expertise ● Risk Assessment and Management | ||
2024 Proxy Statement |
| 27 |
Proposal 1 Election of Directors
INDEPENDENT Age: Director Since: Committee Membership: | Jon A. Grove PROFESSIONAL EXPERIENCE ● Former Chairman, President and Chief Executive Officer of ASR Investments Corporation from its organization in 1987 until our acquisition of ASR in 1998. ● Former Chairman and director of American Southwest Holdings, LLC and SecurNet Mortgage Securities LLC. ● Longtime executive of multifamily companies and investor in multifamily REITs. | |
SKILLS AND QUALIFICATIONS Mr. Grove brings to the board (1) C-Suite level management experience, (2) property management and operations expertise that helps to drive value creation through our expanding array of operating platform initiatives, (3) strategic oversight, (4) stakeholder advocacy, and (5) capital markets and financial literacy. ● Current or Former CEO ● Strategic Oversight ● Stockholder Advocacy ● Corporate Governance ● Real Estate Experience ● Financial Expertise ● Risk Assessment and Management | ||
2024 Proxy Statement |
| 28 |
Proposal 1 Election of Directors
INDEPENDENT Age: Director Since: Committee Membership: | Mary Ann King PROFESSIONAL EXPERIENCE ● Co-Head of Berkadia Institutional Solutions for Berkadia, a privately held commercial real estate firm that provides clients with a suite of services that includes investment sales and mortgage banking. ● Former Co-Chairman of Moran & Company, a real estate brokerage firm focusing exclusively on multifamily assets and mixed-use assets with significant multifamily components, whose investment sales operations were purchased by Berkadia in January of 2021. ● Over the Rainbow Association – Member of the Board of Directors, Member of the Executive Committee and Development Committee and Member and Chairman of the Association’s LIFE Fund. ● Member of the Advisory Board of Sack Properties. ● Full Member of ULI and Member of MFC-Blue Product Council; former Trustee from 2012-2015 and former Product Council Counselor for all four Multifamily Product Councils. ● Member of the Executive Committee of the National Multi Housing, Chairperson from 2006 to 2008, and served on the leadership team from 2000 to 2008. | |
SKILLS AND QUALIFICATIONS Ms. King brings to the board (1) extensive real estate experience across a variety of property sectors, in particular multifamily, (2) C-Suite level management experience, (3) corporate governance experience, (4) technology, cybersecurity, and innovation, and (5) financial literacy. ● Construction and Development Expertise ● Strategic Oversight ● Stockholder Advocacy ● Corporate Governance ● Real Estate Experience ● Financial Expertise ● Risk Assessment and Management | ||
2024 Proxy Statement |
| 29 |
Proposal 1 Election of Directors
LEAD INDEPENDENT DIRECTOR Age: Director Since: Committee Membership: | James D. Klingbeil PROFESSIONAL EXPERIENCE ● Lead Independent Director since January 2018. ● Chairman of the Board of Directors from March 2010 to December 2017 and Vice Chairman of the Board from October 2000 until March 2010. ● Chairman of Klingbeil Capital Management and The Klingbeil Company, both of which acquire, develop and operate multifamily assets. ● Chairman and Chief Executive Officer of American Apartment Communities II from 1995 until its merger with the Company in December of 1998. ● Currently serves as a director of numerous private companies and on the Board of Trustees of The Ohio State University. He is also the past Chairman and a lifetime member of the Board of Trustees of the Urban Land Institute and a member of the ULI Foundation Board. | |
SKILLS AND QUALIFICATIONS Mr. Klingbeil brings to the board (1) over 60 years of experience in building, acquiring, managing, and selling multifamily communities, which help drive value across UDR’s development, investment, and operating activities, (2) corporate governance experience, (3) capital markets expertise, and (4) accounting and financial literacy. ● Current or Former CEO ● Construction and Development Expertise ● Strategic Oversight ● Stockholder Advocacy ● Corporate Governance ● Real Estate Experience ● Financial Expertise ● Risk Assessment and Management | ||
2024 Proxy Statement |
| 30 |
Proposal 1 Election of Directors
INDEPENDENT Age: Director Since: Committee Membership: | Clint D. McDonnough PROFESSIONAL EXPERIENCE ● Managing Partner of McDonnough Consulting LLC, a consulting firm, since May 2016. ● Served 38 years for Ernst & Young LLP before retiring in June, 2015. ● Former Office Managing Partner for the Dallas, Texas, office of Ernst & Young LLP, responsible for day-to-day practice operations. ● Prior to serving as the Office Managing Partner, Mr. McDonnough was the firm’s Managing Partner of Assurance & Advisory Business Services for the Southwest Area practice. He also served as Ernst & Young’s National Director of Real Estate Advisory Services. ● Mr. McDonnough previously served on the Board of Directors of Forterra (Nasdaq), a manufacturer of water and drainage pipe and products, and previously served on the Board of Directors of Orix USA, a diversified financial services company. ● Currently a board member of the Dallas City Council. ● Active in, and previously served on the boards of, several charitable, civic and educational organizations. | |
SKILLS AND QUALIFICATIONS Mr. McDonnough brings to the board (1) extensive accounting expertise and experience as well as financial literacy, (2) real estate industry experience, (3) technology, cybersecurity, and innovation experience and (4) corporate governance expertise. ● Strategic Oversight ● Stockholder Advocacy ● Corporate Governance ● Real Estate Experience ● Financial Expertise ● Risk Assessment and Management | ||
2024 Proxy Statement |
| 31 |
Proposal 1 Election of Directors
INDEPENDENT Age: Director Since: Committee Membership: | Robert A. McNamara PROFESSIONAL EXPERIENCE ● Former Group Chief Risk Officer of Lend Lease Corporation (ASX), an international property and infrastructure firm from 2014 to 2017. ● Former Chief Executive Officer Americas of Lend Lease Corporation (ASX) from 2010 to 2014. ● Former Chairman and Chief Executive Officer of Penhall/LVI International, an environmental remediation, concrete services and infrastructure repair firm, from 2006 to 2010. ● Mr. McNamara held various positions at Fluor Corporation, a global engineering and construction company, from 1996 to 2006, including Senior Executive and Group President. ● Mr. McNamara began his career at Marshall Contractors, Inc., a general contractor, where he held various positions from 1978 to 1996, including President and Chief Operating Officer. ● Member of the Board of Directors of Jacobs Solutions Inc. (f/k/a Jacobs Engineering Group, Inc.) (NYSE), a provider of technical, professional and construction services, and serves on the Audit Committee and as chair of the ESG and Risk Committee for Jacobs. ● Former board member of several privately-held firms. ● Mr. McNamara has also served on the board of the US China Business Council and as Chairman for the Construction Industry Institute’s Technology Implementation Task Force. | |
SKILLS AND QUALIFICATIONS Mr. McNamara brings to the board (1) corporate governance experience, (2) development and construction experience, (3) ESG knowledge and oversight, (4) C-Suite level management experience, (5) capital markets, accounting and financial literacy, and (6) expertise in new technologies, cybersecurity, and innovation. ● Current or Former CEO ● Current or Former Public Company Officer ● Construction and Development Expertise ● Strategic Oversight ● Stockholder Advocacy ● Corporate Governance ● Real Estate Experience ● Financial Expertise ● Risk Assessment and Management | ||
2024 Proxy Statement |
| 32 |
Proposal 1 Election of Directors
INDEPENDENT Age: Director Since: Committee Membership: | Diane M. Morefield PROFESSIONAL EXPERIENCE ● Former Executive Vice President and Chief Financial Officer of CyrusOne, a publicly traded global datacenter REIT, from 2016 through 2020. ● Responsible for CyrusOne’s accounting, finance, capital markets, tax, procurement and investor relations. ● Served on the executive leadership team that set strategy and oversaw the global expansion. ● Former Executive Vice President and Chief Financial Officer of Strategic Hotels & Resorts, a publicly traded hotel REIT, from 2010 to 2015. ● Served as Senior Vice President Operations of Equity Office and Chief Financial Officer of Equity International for 12 years. ● Currently serves on the Board of Directors and audit committee of Copart Inc. (NASDAQ) and the Board of Directors and audit committee of Link Logistics Real Estate. ● Served on the Board of Directors and audit committee of Spirit Realty Capital, Inc. (NYSE) and on several other advisory and non-public boards. ● Earned her BS in Accountancy from the University of Illinois and is a CPA. ● Earned her MBA from the University of Chicago Booth School of Business. | |
SKILLS AND QUALIFICATIONS Ms. Morefield brings to the board (1) extensive real estate and capital market experience, (2) corporate governance experience, (3) C-Suite level management, and (4) accounting and financial literacy. ● Current or Former Public Company Officer ● Professional Certification ● Strategic Oversight ● Stockholder Advocacy ● Corporate Governance ● Real Estate Experience ● Financial Expertise ● Risk Assessment and Management | ||
2024 Proxy Statement |
| 33 |
Proposal 1 Election of Directors
INDEPENDENT Age: Director Since: Committee Membership: | Kevin C. Nickelberry PROFESSIONAL EXPERIENCE ● Currently Managing Director and Co-Head of the Elevate Strategy at GCM Grosvenor, a global investment and advisory firm. ● Former Managing Director and Co-Head of Private Equity Co-Investments at GCM Grosvenor. ● Former Managing Director in the private equity group and a member of the Investment Committee at Investcorp International from 2003 to 2020. ● From 1998 to 2003 executed growth equity and leverage buyout investments at J.P. Morgan Partners. ● Began his career in the investment banking division at Goldman Sachs & Co from 1993 to 1996. ● Previously a board member at a number of private companies. ● Current member of the Board of Directors of the Northside Center for Child Development in New York City. ● Earned his Master’s in Business Administration from Harvard University’s Graduate School of Business Administration. ● Earned his Bachelor of Arts in Business Administration from Morehouse College. | |
SKILLS AND QUALIFICATIONS Mr. Nickelberry brings to the board (1) corporate governance expertise, (2) strategic oversight, having assisted multiple management teams in the formulation and execution of strategic plans as an investor and director, (3) capital market expertise, (4) accounting and financial literacy, and (5) technology, cybersecurity, and innovation expertise. ● Professional Experience ● Private equity origination, execution and post-acquisition experience ● Strategic Oversight ● Stockholder Advocacy ● Corporate Governance ● Financial Expertise ● Risk Assessment and Management | ||
2024 Proxy Statement |
| 34 |
Proposal 1 Election of Directors
INDEPENDENT Age: Director Since: Committee Membership: | Mark R. Patterson PROFESSIONAL EXPERIENCE ● Currently a real estate consultant and financial advisor and is a director and President of MRP Holdings LLC. ● Former Chairman and Chief Executive Officer of Boomerang Systems, Inc., a manufacturer of fully automated, robotic parking systems. In August 2015, Boomerang Systems, Inc. filed for bankruptcy under Chapter 11 of the US Bankruptcy Code. ● Former Managing Director and the Head of Real Estate Global Principal Investments at Merrill Lynch. ● Spent 16 years at Citigroup, where he was the Global Head of Real Estate Investment Banking since 1996. ● Serves as Chair of the Board of Directors, and a member of the governance, compensation and investment committees of Americold Realty Trust, a cold storage REIT, member of the governance committee of Paramount Group, Inc., an office REIT, and a member of the Board of Directors and a member of the compensation and nominating and governance committees of Digital Realty Trust, a data center REIT. ● Served on the Board of Directors of General Growth Properties between 2011 and 2017. ● Serves as a Senior Advisor to Rockefeller Capital Management, as an Advisory Director for Investcorp International, Inc. and as an Advisory Director to Energy Impact Partners. | |
SKILLS AND QUALIFICATIONS Mr. Patterson brings to the board (1) extensive corporate governance experience, (2) a strong background in capital markets and real estate finance, (3) human capital management experience, (4) expertise in new technologies and innovation, and (5) C-Suite level management experience. ● Current or Former CEO ● Current or Former Public Company Officer ● Strategic Oversight ● Stockholder Advocacy ● Corporate Governance ● Real Estate Experience ● Financial Expertise ● Risk Assessment and Management | ||
2024 Proxy Statement |
| 35 |
Proposal 1 Election of Directors
CHAIRMAN OF THE BOARD Age: Director Since: Committee Membership: | Thomas W. Toomey PROFESSIONAL EXPERIENCE ● Chairman and Chief Executive Officer of UDR, Inc., a $20 billion (as of December 31, 2023), S&P 500 company, having served as Chief Executive Officer and a member of the board since joining the Company in 2001. Mr. Toomey also served as President of the Company from 2001 to 2019. ● Over his tenure, Mr. Toomey has been instrumental in repositioning UDR’s portfolio including the acquisition and disposition of approximately $22 billion in multifamily communities and development of over $5 billion in multifamily communities leading to an above average return of 11% for UDR’s shareholders. As of December 2023, UDR owned or had an ownership interest in 60,336 apartment homes in select markets across the U.S. ● As a leader in the real estate industry, Mr. Toomey is a Trustee and a past Global Chair of the Urban Land Institute (ULI), a Board member of the ULI Foundation, a past member of the Board of Governors of the National Association of Real Estate Investment Trusts (NAREIT), on the Executive Committee of the National Multi Housing Council (NMHC), a member of The Real Estate Roundtable and is past Chair and a former Trustee of the Oregon State University Foundation. ● Mr. Toomey served on the board of directors of The Ryland Group, Inc. (NYSE), a home builder, from December 2013 until its merger with Standard Pacific in October 2015. ● Prior to heading UDR, Mr. Toomey held various senior positions, including Chief Operating Officer and Chief Financial Officer, with AIMCO (NYSE), a multifamily REIT peer, which in 2020 underwent a separation and became two public companies, Apartment Income REIT Corp. and AIMCO. At AIMCO, Mr. Toomey was instrumental in transforming the company into the largest apartment owner in the U.S., growing its portfolio ten-fold over his tenure. ● Prior to AIMCO, Mr. Toomey served as a Senior Vice President with Lincoln Property Company, a multifaceted, national real estate firm, for five years. | |
SKILLS AND QUALIFICATIONS Mr. Toomey brings to the board (1) extensive C-Suite level management experience within the multifamily industry, (2) capital markets experience, (3) development experience, (4) stakeholder advocacy, (5) accounting and financial literacy, and (6) technology, cybersecurity, and innovation. ● Current or Former CEO ● Current or Former Public Company Officer ● Construction and Development Expertise ● Strategic Oversight ● Stockholder Advocacy ● Corporate Governance ● Real Estate Experience ● Financial Expertise ● Risk Assessment and Management | ||
2024 Proxy Statement |
| 36 |
Proposal 1 Election of Directors
Board Refreshment and Succession Planning
Board Diversity Policy
The board believes its effectiveness is enhanced by being comprised of individuals with diverse backgrounds, skills and experience that are relevant to the role of the board and the needs of our business as well as diversity with respect to gender and ethnicity. In our Code of Business Conduct and Ethics, we describe diversity as embracing the following characteristics with respect to the Company as a whole, including our board: age, race, gender, nationality, physical ability, culture, religion, marital status, sexual orientation, experience and perspective. In 2020, consistent with its overall views with respect to diversity and in order to formalize our practice, the board enhanced our Statement on Corporate Governance and the Charter of our Nominating Committee by amending such documents to adopt a “Rooney Rule” specifically requiring that diverse candidates, based on gender and ethnicity, be included in the initial pool for any external search for director candidates or for any external search for a Chief Executive Officer. In addition, any search firm used for conducting searches is required to include such candidates in its initial pool of candidates. Since 2019, we have hired search firms with specific experience in identifying candidates from underrepresented groups in connection with searches for board candidates. All recent searches for potential board members have included, and future searches will include, diverse candidates as the diversity of our board will remain a focus in connection with board refreshment efforts. The board, through the Nominating Committee and in consultation with our CEO, will regularly review the changing needs of the business and the skills and experience of its board members with the intention that the board will be periodically “renewed” as certain directors rotate off and new directors are recruited. The board’s commitment to diversity and renewal will be tempered by the need to balance change with continuity and experience. The board believes that its commitment in this regard has been effective in establishing a board that consists of members with diverse backgrounds, skills and experience that are relevant to the role of the board and the needs of the business. The board will continue to monitor the effectiveness of these efforts as part of its periodic self-assessment process.

Succession, Identification and Selection of Nominees for Directors
Part of our approach to board refreshment is to have a mix of experience on the board tied to our strategic plans. We try to have roughly one-third of our board members consist of directors that have served through a number of our strategic plans, roughly one-third that has only been involved in zero to two strategic plans, and roughly one-third in the middle. The intent of this approach is to be able to get the benefit of experience with our company and our strategic planning as well as the benefit of new ideas and perspectives.
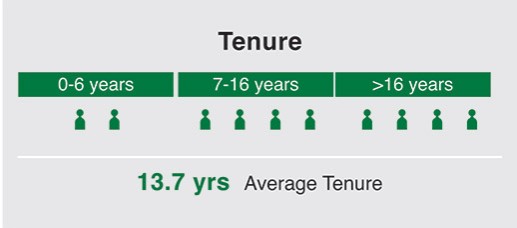
2024 Proxy Statement |
| 37 |
Proposal 1 Election of Directors
Our Nominating Committee works closely with our Chairman and CEO and Lead Independent Director (who currently serves as Chairman of the Nominating Committee) in recommending to the board criteria for open board positions, taking into account such factors as the Nominating Committee deems important, including, among others, the current composition of the board (including tenure on the board), the range of talents, experiences, expertise and skills that would complement those already represented on the board and those that would help achieve the Company’s current and future goals as set forth in our strategic plan and our Overboarding Policy. The recommendations are then discussed by the board. In evaluating a nominee, the board, acting through our Nominating Committee, will consider, among other things, whether a potential director nominee has the time available, in light of other business and personal commitments, to perform the responsibilities required for effective service on the board. The Nominating Committee considers candidates that are suggested by members of the board, as well as management, our shareholders, and any director search firm retained by the board or the Nominating Committee using the same criteria to evaluate all candidates.
Once a potential director nominee has been identified, the Nominating Committee, in consultation with the Chairman and CEO and Lead Independent Director, will evaluate the prospective nominee against the specific criteria that has been established, as well as the standards and qualifications contained in our Statement on Corporate Governance. If it is determined based upon a preliminary review that a candidate warrants further consideration, members of the board, as appropriate, will interview the prospective nominee. After completing this evaluation and interview process, the board makes the final determination as to whether to nominate or appoint the new director.
NOMINATION PROCESS FOR BOARD ELECTION
The graphic below describes the ongoing Nominating Committee process to identify highly qualified candidates for board service.
01 | Consider current board skill sets and needs to establish that the board is strong in core competencies of strategic oversight, shareholder advocacy, corporate governance and real estate and has diversity of expertise and perspective to meet existing and future business needs. | ||||||||||
05 | Board dialogue and decision adds highly qualified directors chosen to meet current, specific needs. |
| 02 | Check conflicts of interest, references and independence through screening candidates for conflicts of interest, and verifying that all directors are independent, except the Chairman and CEO. | |||||||
04 | Nominating Committee dialogue to consider shortlisted candidates and after deliberations, recommend candidates for election to the board. | 03 | Meet with qualified candidates to establish appropriate personal qualities, such as independence of mind, collegiality, and skill set to meet existing or future business needs. | ||||||||
In addition to any other applicable requirements, Section 2.11 of the bylaws sets forth the procedures and requirements relating to nominations of directors by shareholders. Any shareholder who wishes to recommend a prospective nominee for consideration at our 2025 annual meeting of shareholders must submit specified information, no sooner than November 5, 2024, and no later than December 5, 2024.
Each proposed candidate also must submit a written questionnaire, representation and agreement specifically addressing agreements, arrangements or understandings that the candidate has with certain other persons, including with respect to voting commitments and compensation, as well as a representation and agreement to comply with our applicable policies, codes and guidelines. Such information should be sent to the attention of our Corporate Secretary at 1745 Shea Center Drive, Suite 200, Highlands Ranch, Colorado 80129-1540.
Proxy Access
The Company’s bylaws include a proxy access provision which permits a shareholder, or a group of up to 20 shareholders, owning 3% or more of the Company’s outstanding common stock continuously for at least three years, to nominate and include in the Company’s proxy materials director candidates constituting up to 20% of the board, provided that the shareholder(s) and the nominee(s) satisfy the requirements specified in the bylaws.
Director Rotation and Retirement
Directors are elected annually to serve for a term until the next annual meeting of shareholders or until their successors are elected and qualified. The board does not impose arbitrary limits on the number of terms a director may serve. However, the Nominating Committee will
2024 Proxy Statement |
| 38 |
Proposal 1 Election of Directors
consider various criteria, including a director’s contribution to the board, in determining whether or not to recommend a director for re-election. Employee directors are required to resign as a director after ceasing to be an employee, unless the board asks them to continue to serve. The Chairman will refer the resignation to the Governance Committee for review.
The board will decide, in light of the circumstances and the recommendation of the Governance Committee, the date at which the resignation will become effective. A vacancy created by a director’s retirement may be filled by a majority of the remaining directors in accordance with our bylaws. A director so appointed to fill the vacancy will stand for re-election at the first annual meeting of shareholders following that director’s appointment to the board if recommended for re-election by the Nominating Committee. In addition, the Company requires that directors tender their resignation when they change employment or other significant organizational affiliations. The board then decides, in light of the circumstances and the recommendation of the Governance Committee, whether to accept such resignation.
MAJORITY VOTING STANDARD FOR UNCONTESTED DIRECTOR ELECTIONS
The Company’s bylaws specify a majority voting standard in uncontested director elections, which incorporates a director resignation policy for any director who does not receive the requisite vote. Under this majority voting standard, the affirmative vote of a majority of the votes cast is required for the election of a director in an uncontested election. A majority of the votes cast means that the number of shares voted “for” a director’s election exceeds fifty percent of the total number of votes cast with respect to that director’s election. If an incumbent director does not receive a majority of the votes cast for his or her election, the director is required to tender his or her resignation to the board. The board would then decide within 90 days following certification of the shareholder vote, through a process managed by the Governance Committee and excluding the nominee in question, whether to accept or reject the tendered resignation, or whether other action is recommended.
Board Tenure
The board seeks to create and maintain a board that, collectively, has the mix of skills, experiences and other attributes needed to provide oversight of our strategic and operational risks and the ability to deliver the high standard of governance expected. The board believes that ongoing board refreshment is important to deepen the board and provide fresh perspectives, but also believes in leveraging the knowledge, including institutional knowledge regarding the Company, and historical perspective of the board’s longer tenured members and seeks a balance with respect to board tenure. Our longer tenured directors bring a deep understanding of our business and strategy and provide historical context to board deliberations and in addition enhance the dynamics of the board and its relationship with management.
Board Refreshment
The following directors have joined the board over the past eight years adding to the diversity of the board across many variables including past background and experience, knowledge base and expertise, and gender and underrepresented group diversity.
2015 | 2016 | |||||||
| MARY ANN KING Co-Head of Berkadia Institutional Solutions |
| CLINT D. MCDONNOUGH Former Office Managing Partner for Ernst & Young LLP’s Dallas office | |||||
2021 | 2020 | |||||||
| KEVIN C. NICKELBERRY Managing Director and Co-Head of Private Equity Co-Investments of GCM Grosvenor |
| DIANE M. MOREFIELD Former Executive Vice President, Chief Financial Officer of CyrusOne |
2024 Proxy Statement |
| 39 |
Corporate Governance Principles
We believe that effective and transparent corporate governance is critical to our long-term success and our ability to create value for our shareholders. We frequently review our corporate governance policies, monitor emerging developments in corporate governance, and enhance our policies and procedures when our board determines that it would benefit our Company and our shareholders to do so.
We believe in and follow certain principles with respect to governance as follows:
PRINCIPLE 1: | PRINCIPLE 2: | PRINCIPLE 3: |
Boards are accountable to shareholders. | Shareholders should be entitled to voting rights in proportion to their economic interest. | Boards should be responsive to shareholders and be proactive to understand their perspectives. |
● All directors stand for election annually ● Proxy access for eligible director candidates nominated by eligible shareholders ● Shareholder ability to propose binding bylaw amendments | ● Each shareholder gets one vote per share and we have no non-voting or outstanding shares issued and have no treasury stock ● Majority voting in uncontested director elections, and directors not receiving majority support must tender their resignation for consideration by the board | ● Management and in some cases an independent director held 708 interactions with investors owning approximately 85.0% of shares outstanding in 2023 and early 2024, the results of which are reported to the board ● Board engagement topics during 2023 included, among others, corporate strategy, sustainability and social strategy, enterprise risk management, cybersecurity, climate risk, board composition, leadership and refreshment, succession planning, ESG, culture, diversity, equity and inclusion, and our executive compensation program |
PRINCIPLE 4: | PRINCIPLE 5: | PRINCIPLE 6: |
Boards should have a strong, independent leadership structure. | Boards should adopt structures and practices that enhance their effectiveness. | Boards should develop management incentive structures that are aligned with the long-term strategy of the Company. |
● Lead Independent Director with clearly defined duties that are disclosed to shareholders ● Board considers appropriateness of its leadership structure at least annually ● Independent Committee Chairs ● Proxy Statement discloses why board believes current leadership structure is appropriate | ● As of March 25, 2024, 90% of board members are independent ● Annual board and committee evaluations ● Active board refreshment plan | ● Our vote on our executive compensation program has received shareholder support averaging 85.86% over the last five years ● The Compensation Committee, in conjunction with an independent third-party consultant, annually reviews and approves our incentive program design, goals and objectives for alignment between compensation and our business strategies including compensation metrics focused on ESG issues ● Annual and long-term incentive programs for named executive officers and other associates are designed to reward financial and operational performance that furthers short-and long-term strategic objectives and include metrics assessing our absolute performance and our performance relative to that of our peers |
Corporate Governance
We also monitor our corporate governance policies and practices to maintain compliance with the provisions of the Sarbanes-Oxley Act of 2002 (the “Sarbanes-Oxley Act”), the Dodd-Frank Wall Street Reform and Consumer Protection Act of 2010 (the “Dodd-Frank Act”), the rules of the SEC and the corporate governance rules of the NYSE. Our policies and practices meet, and in many cases exceed, the listing requirements of the NYSE, applicable SEC rules and the corporate governance requirements of the Sarbanes-Oxley Act and the Dodd-Frank Act, including:
| ● | The board has adopted clear corporate governance policies; |
| ● | Nine of our ten current board members (and nine of the ten to be voted on at the 2024 annual meeting) are independent directors as defined by the NYSE; |
| ● | The independent directors meet as a board and at the committee level without the presence of management at each regularly scheduled meeting; |
| ● | All members of the Audit Committee, Compensation Committee, Governance Committee, and Nominating Committee are independent directors; |
| ● | While the Chairman and Chief Executive Officer role is combined, the board has appointed a Lead Independent Director with specific duties in accordance with our Statement on Corporate Governance; |
| ● | The charters of the board committees clearly establish their respective roles and responsibilities, including their responsibilities for oversight of risks, and are reviewed annually; |
| ● | The entire board oversees and receives reports (including from outside experts) at regularly scheduled meetings with respect to our ESG, culture and DEI efforts, and with respect to enterprise risk and cybersecurity risk; |
| ● | The board has adopted a Code of Business Conduct and Ethics that applies to all of our directors, officers, and employees and that is required to be provided to agents and consultants that, among other things, prohibits bribery and other forms of corruption; |
| ● | We have a Code of Ethics for Senior Financial Officers that applies to our senior financial officers; |
| ● | We have a hotline with a 1-800 number and a third-party anonymous reporting system at http://udr.ethicspoint.com available to all employees. The Audit Committee has procedures in place for the anonymous submission of any employee complaint, including those relating to accounting, internal controls or auditing matters. Instructions for making a report are published in the Corporate Governance subsection of the Investor Relations page of the Company’s website at ir.udr.com; and |
| ● | Our board has adopted a political contributions and charitable donations policy. |
Board Structure
Board Leadership Structure
The board periodically evaluates our board leadership structure. As stated in our Statement on Corporate Governance, the board will exercise its discretion in combining or separating the offices of Chairman of the Board and Chief Executive Officer. The determination is based on the board’s judgment of the best interests of the Company and its shareholders from time to time.
We currently combine the roles of the Chairman of the Board and Chief Executive Officer. Effective January 1, 2018, the board appointed Mr. Toomey Chairman of the Board, in addition to his roles at that time of Chief Executive Officer and President. The appointment of Mr. Toomey to the role of Chairman of the Board, Chief Executive Officer and President in 2018 reflected his strong knowledge and leadership of the multifamily real estate industry and the complex operations of UDR. Effective January 1, 2019, Mr. Toomey resigned as President and Jerry Davis was appointed President – Chief Operating Officer (Mr. Davis resigned as Chief Operating Officer effective December 31, 2020, and as President effective December 31, 2021). Effective May 19, 2022, Mr. Fisher was appointed President, in addition to his duties as Chief Financial Officer. The board believes that while serving as Chairman and Chief Executive Officer, Mr. Toomey is best equipped to lead the board in the discussion of key business and strategic matters, and to focus the board on the most critical issues facing UDR. The board further believes that, in serving as the Chairman and Chief Executive Officer, Mr. Toomey offers the Company-specific expertise and extensive industry knowledge that is necessary as we pursue our five strategic objectives, operating excellence, balance sheet strength, portfolio diversification, capital allocation and creating an empowering culture and a great place to work and live, while at the same time leading the board’s efforts in oversight of the Company and its management.
Our Statement on Corporate Governance provides that if the offices of Chairman of the Board and Chief Executive Officer are combined, or if the Chairman does not qualify as an independent director, the board will designate a Lead Independent Director, who will chair the executive sessions of the board, and have the duties and responsibilities set forth in our Statement of Corporate Governance as well as other duties not enumerated in the Statement of Corporate Governance as the board deems appropriate. Effective January 1, 2018, the board appointed Mr. Klingbeil as Lead Independent Director. Mr. Klingbeil has extensive experience leasing the board, having served as Chairman of the Board from 2010 to 2017, and having served as Vice Chairman of the Board from 2000 to 2010. Mr. Klingbeil has served on the board since 1998. Mr. Klingbeil’s long-term service to the Company and his deep experience in the apartment industry allow him to effectively work with our Chairman and CEO and the other members of the board to ensure the board fulfills its responsibilities, including its oversight responsibilities with respect to risk management.
2024 Proxy Statement |
| 41 |
Corporate Governance
Balanced Leadership Structure | |
● Supporting governance practices ensure a strong and independent board ● Effective leadership protects long-term interests of stakeholders and strengthens management accountability | |
Thomas W. Toomey |
James D. Klingbeil |
● Extensive industry knowledge and leadership necessary to pursue five strategic objectives described on page 8 and critical issues facing UDR ● Lead board discussions on key business and strategic matters to aid in oversight of Company and its management | ● Statement on Corporate Governance requires Lead Independent Director to ensure independent oversight ● Extensive experience leading board; serves as informal advisor to the Chairman on matters pertaining to board practices Primary Responsibilities of Lead Independent Director: ● Serves as liaison between the Chairman and the independent directors ● Calls and chairs meetings of the independent directors ● Approves agendas for the meetings of the board and assures sufficient time for discussion of all agenda items ● Develops and manages (with oversight from the Governance Committee) the annual evaluation of the effectiveness of directors and the board ● Serves as an informal advisor to the Chairman |
Director Independence
The board’s policy is that a significant majority of its members should be independent directors (see our Statement on Corporate Governance, which is available on our website at ir.udr.com). Each year, the board affirmatively determines whether each director has any material relationship with the Company (directly, or as a partner, shareholder or officer of an organization that has such a relationship with the Company), as defined under the NYSE listing standards and the Company’s director independence standards. The board has determined that all directors who served in 2023, and all of the directors who are standing for election at the annual meeting, are independent under both sets of standards except Mr. Toomey, who is not independent because, in addition to serving as Chairman, he is the Company’s CEO. Additional information about each of the directors standing for election is set forth under Proposal No. 1 in this proxy statement. In making these independence determinations, the board considered information submitted by the directors in response to directors’ questionnaires and information obtained from the Company’s internal records.
Executive Sessions of Independent Directors
Our independent directors hold regularly scheduled executive sessions at which our independent directors meet without the presence of management. These executive sessions generally occur around regularly scheduled meetings of the board. The Lead Independent Director presides as chairman of these executive sessions.
2024 Proxy Statement |
| 42 |
Corporate Governance
Standing Committees of the Board
The board has standing Audit, Compensation, Governance, Nominating and Executive Committees to assist it in discharging its duties. Information regarding each committee is set forth below.
| Audit Committee MEMBERS: Diane M. Morefield, Chair Katherine A. Cattanach Clint D. McDonnough Kevin C. Nickelberry | number of meetings in 2023: 8 |
Key Functions: ● Assists the board in its general oversight of our accounting financial reporting process, audits of our financial statements, internal controls and internal audit functions ● Appointment, compensation and oversight of our independent auditor ● Represents and assists the board in its oversight of: o the quality or integrity of our financial statements; o our compliance with legal and regulatory requirements; and o the performance of our internal audit department and independent auditors ● Discusses the adequacy and effectiveness of our internal controls over financial reporting ● Oversees our compliance with procedures and processes pertaining to corporate ethics and standards of business conduct ● Establishes procedures for the receipt, retention and treatment of complaints received concerning accounting, auditing, internal controls and financial reporting matters ● Oversees risk management policies and risk assessment ● Pre-approves all non-audit services to be provided to the Company by the independent auditors ● Oversees political contributions or charitable donations including annual review of our applicable policies ● Quarterly review of our enterprise risk management matrix (which includes short- and long-term risks) and cybersecurity Audit Committee Financial Expert: Each member of the Audit Committee is financially literate, and the board has determined that each member of the Audit Committee is an “audit committee financial expert” within the meaning of the SEC’s regulations. | ||
| Compensation Committee MEMBERS: Robert A. McNamara, Chair Jon A. Grove Mary Ann King Mark R. Patterson | number of meetings in 2023: 5 |
Key Functions: ● Administers and approves general compensation policies applicable to our key executive officers ● Reviews and approves compensation for the board and its committees ● Reviews and ensures the appropriate administration of our compensation and benefit plans, programs and policies ● Determines and approves the compensation of our CEO ● Sets annual objectives for, and evaluates the performance of, our CEO, with input from the board ● Reviews and recommends to the board short-and long-term compensation for the principal officers of the Company who report directly to our CEO ● Approves all employment and severance agreements for senior vice presidents and above ● Reviews and approves the contributions and awards, if any, under the management incentive programs and other management compensation, if any, including the long-term incentive plan ● Appoints and provides oversight of independent compensation consultants ● Oversees our efforts with respect to our culture, DEI and our workforce | ||
2024 Proxy Statement |
| 43 |
Corporate Governance
| Governance Committee MEMBERS: Katherine A. Cattanach, Chair Mary Ann King Robert A. McNamara Diane M. Morefield Kevin C. Nickelberry | Number of Meetings in 2023: 4 |
Key Functions: ● Exercises general oversight of board governance matters ● Reviews the size, role, composition and structure of our board and its committees ● Reviews and evaluates the board and its members ● Reviews and updates our Corporate Governance Policies ● Considers, develops and makes recommendations to the board regarding matters related to corporate governance ● Ensures that each committee conducts an annual assessment ● Oversees disclosure of environmental, social and governance matters ● Reviews, and if applicable preapproves, and oversees related party transactions | ||
| Nominating Committee MEMBERS: James D. Klingbeil, Chair Katherine A. Cattanach Robert A. McNamara Diane M. Morefield | Number of Meetings in 2023: 0 |
Key Functions: ● Identifies, evaluates and recommends to the board individuals qualified to serve as directors of the Company ● Establishes criteria for the selection of new directors ● Reviews the suitability for continued service as a director of board members ● Establishes procedures for the submission or recommendations by shareholders ● Meets only when there is a specific candidate for consideration although the entire board discusses board refreshment regularly | ||
| Executive Committee MEMBERS: James D. Klingbeil, Chair Clint D. McDonnough Thomas W. Toomey | Number of Meetings in 2023: 0 |
Key Functions: ● Performs the duties and exercises the powers delegated to it by the board ● Meets only when board action on a significant matter is required and it is impractical or not feasible to convene a full meeting of the board | ||
Independence of the Audit, Compensation, Governance and Nominating Committees
The Audit, Compensation, Governance and Nominating Committees consist entirely of independent directors, as defined in the NYSE listing standards and the Company’s director independence standards. Each member of the Audit Committee and the Compensation Committee also satisfies the additional independence requirements set forth in rules under the Exchange Act and the NYSE listing standards.
2024 Proxy Statement |
| 44 |
Corporate Governance
The Board’s Role and Responsibilities
Overview
Our directors have specific responsibilities and obligations arising from their service on the board and the committees of the board, as described in the table below.
► Responsibilities of the Board of Directors |
In addition to each director’s basic duties of care and loyalty, the board has separate and specific obligations under our Statement on Corporate Governance. Among other things, these obligations require directors to effectively monitor management’s capabilities, compensation, risk oversight (including, among other areas, cybersecurity, societal and environmental risks), leadership, and performance without undermining management’s ability to successfully operate the business. In addition, the board and the board’s committees have the authority to retain outside legal, accounting, or other advisors, as necessary, to carry out their responsibilities. |
► Director Education |
All directors are expected to be knowledgeable about the Company and its industry and to understand their duties and responsibilities as directors. The Company recognizes the importance of continuing education for directors and is committed to supporting continuing director education in order to enhance board and committee performance. We conduct periodic continuing education for directors and, at a director’s request, we will arrange for the director’s participation in continuing education programs offered by third parties that are relevant to the director’s role as a board and committee member. All of our independent directors are expected to participate in orientation programs. In addition, orientation sessions are conducted by senior management to familiarize directors with the Company’s strategic plans, significant financial, accounting and risk management issues, our compliance programs, our Code of Business Conduct and Ethics, and our principal officers, as well as our internal and external auditors. Finally, board meetings are often held in locations where we own properties so that directors can observe our properties and operations. |
► Director Evaluations |
The board, acting through the Governance Committee, annually evaluates the effectiveness of the board collectively and of board members individually, and the performance of each standing board committee. The Governance Committee determines the appropriate means for this evaluation. |
► Committee Evaluations |
Each committee of the board annually evaluates the effectiveness and performance of each respective committee collectively and of the members of each respective committee individually. |
► Directors’ Share Ownership Guidelines |
Our Statement on Corporate Governance provides that each director is expected to develop a meaningful equity stake in our Company over time and that after the fifth anniversary of election to the board, each director is required to own shares of the Company’s common stock and/or LTIP Units (as described below) equivalent to not less than 5 times their annual cash retainer. Each of our directors is in compliance with our share ownership guidelines. |
► Board Attendance at Annual Meeting |
The board has adopted the following policy on director attendance at meetings: Absent extenuating circumstances, directors are expected to attend in person our annual meeting of shareholders, all regularly scheduled board and committee meetings and to participate telephonically or via web-based application in regularly scheduled board and committee meetings when they are unable to attend in person. Nine of our ten serving directors attended our 2023 annual meeting of shareholders in person and the remaining serving director attended via web-based application. |
2024 Proxy Statement |
| 45 |
Corporate Governance
The Role of the Board in Oversight of Strategy

The Role of the Board in Risk Oversight
The board has oversight responsibility with respect to risk management and is not responsible for day-to-day management of risk, which is the responsibility of senior management. The board’s role in the Company’s risk oversight process includes receiving regular reports from members of senior management and other Company associates on areas of material risk to the Company, including operational, financial, legal, strategic, cybersecurity and reputational risks, and other risks such as risks related to climate change (including physical and transitional risks) and human capital. The reports and the discussions by the applicable committee and our board involve risks over short- and long-term periods. In addition, outside experts present to the board with respect to various risks and management consults with experts as appropriate. The Audit Committee and other board committees assist the board in fulfilling its oversight responsibility.
Board of Directors The board has allocated and delegated certain risk oversight responsibilities to various committees of the board in accordance with the following principles. | ||
AUDIT COMMITTEE | COMPENSATION COMMITTEE | GOVERNANCE COMMITTEE |
● Oversight of risks related to integrity of financial statements, including oversight of financial reporting principles and policies and internal controls. ● Oversight of risks related to regulatory and compliance matters not delegated to other committees. ● Oversight responsibility of the Company’s efforts with respect to cybersecurity risks. ● Oversight responsibility generally for our Enterprise Risk Management activities including cybersecurity. ● Oversight responsibility for our Charitable Donations and Political Contributions Policy. | ● Oversight of risks related to compensation programs, including formulation, administration and regulatory compliance with respect to compensation matters. ● Oversight of the Company’s workforce and human capital activities including diversity, equity and inclusion efforts and our related public disclosure. | ● Oversight of risks related to corporate governance matters, including succession planning, director independence and related person transactions. ● Oversight of the Company’s disclosure regarding environmental, social and governance matters. |
Each committee is also responsible for monitoring reputational risk to the extent arising out of its areas of responsibility. | ||
2024 Proxy Statement |
| 46 |
Corporate Governance
Board of Directors | In 2021, our Governance Committee Charter was amended to assign the Governance Committee oversight of the Company’s ESG disclosures, including any ESG report that is published. Sustainability is incorporated into UDR’s overall risk assessments, and the Board provides risk oversight. Recent ESG discussions during Board meetings focused on further integration of human capital into our overall business and our evolving ESG and people strategies as well as increased analysis of climate risks and opportunities. These discussions will continue to evolve as we seek to expand our commitment to ESG enhancement and further align the Company’s sustainability objectives with those of our stakeholders. UDR’s ESG Committee, made up of senior officers at the Company, sets Company-wide ESG targets, goals, and strategy. Chairman and CEO, Mr. Toomey, steers the Committee which approves the ESG strategy, while other members are responsible for implementing, and monitoring progress towards meeting ESG targets and goals, evaluating the integrity of the Company’s overall ESG reporting processes, and assessing the vision of our sustainability objectives. As part of our environmental management system (“EMS”) process and our ongoing commitment to stakeholders, we conduct third-party and internal assurance testing of the accuracy and completeness of significant ESG metrics. These include GHG emissions, energy usage, water usage, waste diversion, associate compensation, diversity, training, and gender metrics included in this proxy statement and the 2023 GRESB survey. As the ESG reporting landscape changes with influences from regulatory requirements and stakeholder interests, we will continue to evolve our ESG control environment. | |||
▼▲ | ||||
ESG Committee (CEO steers) | ||||
► Risk Management and Sustainability | ||
highlights ● The assessment of climate-related risks and opportunities are integrated in the Company’s Environmental Management System (“EMS”), environmental governance, risk management, and business strategy. ● UDR utilizes an annual asset-level ranking based on climate-related risks and opportunities to target sustainability upside and resilience. ● Results of climate-related rankings and assessments are shared with our ESG Committee in detail and with our Board at least annually, as these risks are considered by our Board as part of their oversight of enterprise risk management. | ||
In addition to the adoption of science-based Scope 1, 2, and 3 GHG emissions intensity targets, our updated Sustainability Strategy proactively addresses climate-related risk and opportunities associated with regulatory risk (such as Building Energy/Emissions Performance Standards and regulations), transitional risk (such as potential utility cost increases as “green” infrastructure advances), and physical climate change. The assessment of these risks and opportunities are integrated into the Company’s EMS, environmental governance, risk management, and business strategy. UDR’s EMS, which utilizes the Plan – Do – Check – Act model, first achieved third-party certification to the ISO 14001 Standard in the spring of 2022. We have created a comprehensive framework to annually rank our communities across a variety of environmental metrics to determine near- versus longer-term climate-related risk to the Company as well as properties that have the most inherent sustainability upside. The resulting assessments and rankings are shared with our ESG Committee in detail and with our Board in summary form, as these risks are considered by our Board as part of their oversight of enterprise risk management. The assessment results are also considered as we make decisions with respect to capital investments in our owned assets (for example, whether to “harden” an asset against sea level rise or xeriscape a property to conserve water) as well as market-level investment and divestment decisions (for example, markets or sub-markets in which to invest in or divest from) within our market selection process. Marrying sustainability benefits with relatively high-return-on-capital investments remains central to our Sustainability Strategy and we have developed, or are developing, tools to aid us in our future execution. These include collaboration with UDR’s Capital Expenditure Committee to better coordinate the identification of and execution of high-return on investment sustainability capital projects (i.e., implement programmatic annual capital spending plans) and continuing to research existing and new sustainability technologies identified through our $20 million, plus an additional $10 million committed in early 2024, of investments in climate technology funds that should identify and advance companies and technologies that help us achieve our long-term goals. The Company’s EMS and Environmental Policy provide a systematic governance approach to identifying climate-related risks and opportunities, evaluating the economic and environmental effects of mitigating these risks by investing in new technologies and other sustainability related opportunities, and assessing the results achieved through our EMS processes against our environmental goals. Given our past sustainability successes, we have high confidence in our ability to successfully execute our Strategy through 2035 and satisfy additional E-related reporting/compliance requirements if, and when, they materialize. The sustainability landscape will undoubtedly continue to evolve, but we believe we have the right strategy, team, and vision in place to quickly adapt as we move forward on our sustainability journey. | ||
2024 Proxy Statement |
| 47 |
Corporate Governance
► Risk Management and Cybersecurity | ||
Cybersecurity governance highlights ● Quarterly Review by Audit Committee and annual review by board ● Dedicated internal cybersecurity team and use of third party experts ● Regular security testing by external experts ● Training for all associates annually and phishing tests at least monthly | ||
Given the prevalence of cybersecurity threats, cybersecurity represents a critical component of the Company’s overall approach to risk management. The Company’s cybersecurity policies, standards and practices are integrated into the Company’s enterprise risk management (“ERM”) approach, and cybersecurity risks are among the core enterprise risks that are subject to oversight by the board. The Company’s cybersecurity policies, standards and practices are derived from recognized frameworks established by the National Institute of Standards and Technology (“NIST”) and other applicable industry standards, and the Company is working to obtain NIST certification. Many members of the Company’s cybersecurity team are certified by and have received training from the International Information Security Consortium (“IISC”). The Company generally approaches cybersecurity threats through a cross-functional, multilayered approach, with specific the goals of: (i) identifying, attempting to prevent and mitigating cybersecurity threats to the Company; (ii) preserving the confidentiality, security and availability of the information that we collect and store to use in our business; (iii) protecting the Company’s intellectual property; (iv) protecting personally identifiable data and maintaining the confidence of our customers, clients and business partners; and (v) providing appropriate public disclosure of cybersecurity risks and incidents when required. Risk Management and Strategy Consistent with overall ERM policies and practices, the Company’s cybersecurity program focuses on the following areas: • Vigilance: The Company operates cybersecurity threat functions 24/7 with the specific goals of identifying, attempting to prevent, and mitigating cybersecurity threats and responding to cybersecurity incidents in accordance with our established incident response and recovery plans. • Systems Safeguards: The Company deploys systems safeguards that are designed to protect the Company’s information systems from cybersecurity threats, including firewalls, intrusion prevention and detection systems, anti-malware functionality, and access controls that are evaluated and improved through ongoing vulnerability assessments and cybersecurity threat intelligence. • Collaboration: The Company utilizes collaboration mechanisms established with public and private entities, including intelligence and enforcement agencies, industry groups and third-party service providers, to identify, assess and respond to cybersecurity risks. • Third-Party Risk Management: The Company maintains a risk-based approach to identifying and overseeing cybersecurity risks presented by third-parties, including vendors, service providers and other external users of the Company’s systems, as well as the systems of third-parties that could adversely impact our business in the event of a cybersecurity incident affecting those third-party systems. Third-party vendors are assessed against a standardized vendor risk assessment process before being engaged and the Company requests vendors to annually recertify that their security controls comply with established industry standards and applicable legal requirements. • Insider Threat Management: In order to try to mitigate cybersecurity threats to our systems, the Company attempts to provide associates with the minimum access to our systems required in order for a given associate to perform his or her assigned duties. We also perform reviews of access to both our administrative and financial systems as part of our annual compliance procedures, and, when duties and resources allow, rotate job responsibilities. • Training: Upon employment and at least annually thereafter the Company provides mandatory training for our associates regarding cybersecurity threats, which reinforces the Company’s information security policies, standards and practices, and such training is scaled to reflect the roles, responsibilities, and information systems access of such personnel. The Company’s cybersecurity team performs regular phishing tests for associates and provides remedial training for associates who fail such tests. In addition, members of our cybersecurity team received specialized cybersecurity training. • Incident Response and Recovery Planning: The Company has established and maintains incident response and recovery plans that address the Company’s response to a cybersecurity incident and the recovery from a cybersecurity incident, and such plans are assessed and evaluated on a regular basis. All meaningful cybersecurity incidents are reported to the Company’s legal department by our cybersecurity team. • Governance, Communication, Coordination and Disclosure: The Company utilizes a cross-functional approach to address the risk from cybersecurity threats, involving management personnel from the Company’s technology, operations, legal, risk management, internal audit and other key business functions, third-party vendors and consultants, as well as the members of the Board and the Audit Committee in an ongoing dialogue regarding cybersecurity threats and incidents, while also implementing controls and procedures for the escalation of cybersecurity incidents when appropriate so that decisions regarding the disclosure | ||
2024 Proxy Statement |
| 48 |
Corporate Governance
and reporting of such incidents can be made by management in a timely manner. Our Senior Vice President – Chief Technology Officer reports on our cybersecurity posture to the Audit Committee quarterly and the Board is updated at least annually. A key part of the Company’s strategy for managing risks from cybersecurity threats is the ongoing assessment and testing of the Company’s processes and practices through auditing, assessments, tabletop exercises, vulnerability testing and other exercises focused on evaluating the effectiveness of our cybersecurity measures. The Company engages third-parties, including legal counsel, to perform assessments on our cybersecurity measures, including information security maturity assessments, penetration testing inclusive of our resident facing apps and devices, audits and independent reviews of our information security control environment and operating effectiveness. The material results of such assessments, audits and reviews are reported to the Audit Committee and the Board, and the Company adapts its cybersecurity policies, standards, processes, and practices as necessary based on the information provided by the assessments, audits, and reviews. In addition, in 2023 outside legal counsel conducted an exercise regarding preparation for cyber events attended by our Chairman and Chief Executive Officer, President and Chief Financial Officer and other members of senior management. Governance The board, in coordination with the Audit Committee, oversees the management of risks from cybersecurity threats, including the policies, standards, processes and practices that the Company’s management implements to address risks from cybersecurity threats. The Board and the Audit Committee each receive presentations and reports on cybersecurity risks, which address a wide range of topics including, for example, recent developments, evolving standards, vulnerability assessments, third-party and independent reviews, the threat environment, new tools and vendors being used by the Company related to cybersecurity, technological trends and information security considerations arising with respect to the Company’s peers and third parties. The board and the Audit Committee also receive information regarding any cybersecurity incident when appropriate, as well as ongoing updates regarding such incident until it has been addressed. The Company’s Chief Technology Officer is the member of the Company’s management that is principally responsible for overseeing the Company’s cybersecurity risk management program, in partnership with other business leaders across the Company. The Chief Technology Officer and our Vice President, Information Security work in coordination with the other members of the Information Security Management System Committee (“ISMS”), which includes department heads and IT personnel. The Chief Technology Officer also provides monthly reports regarding information technology including cybersecurity to our senior management including our Chairman and Chief Executive Officer, President and Chief Financial Officer, Senior Vice President – Chief Investment Officer, Senior Vice President – Operations, Senior Vice President – Chief Accounting Officer, Senior Vice President – Acquisitions and Dispositions, and Senior Vice President – General Counsel. The Company’s Chief Technology Officer has served in various roles in information technology and information security for over 23 years. The Chief Technology Officer holds an undergraduate degree in computer science and a master’s degree in business administration. The Company’s Vice President, Information Security holds an undergraduate degree in computer science and management science, has attained a professional certification of Certified Information Systems Security Professional (CISSP) from the IISC and has served in various roles in information technology and information security for over 15 years. In addition, our Vice President, Information Security is a member of InfraGard. The Company’s Chief Technology Officer and Vice President, Information Security, in coordination with the ISMS, work collaboratively across the Company to implement a program designed to protect the Company’s information systems from cybersecurity threats and to promptly respond to any cybersecurity incidents. To facilitate the success of this program, our IT security team and, when necessary, multidisciplinary teams throughout the Company are deployed to address cybersecurity threats and to respond to cybersecurity incidents in accordance with the Company’s incident response and recovery plans. Through the ongoing communications from these teams, the Chief Technology Officer and the Vice President, Information Security monitor the prevention, detection, mitigation, and remediation of cybersecurity incidents, and report such incidents to the ISMS and other members of management and the Audit Committee or the board when appropriate. |
► Risk Management and Political Contributions and Charitable Donations | ||
Although political contributions and charitable donations have historically not been made by the Company in material amounts, in early 2022 the board adopted a charitable donations and political contributions policy that provides that all such donations or contributions will be required to be approved in advance by the Company’s compliance officer, currently our Senior Vice President – General Counsel, and will only be approved based upon the Company’s business and interests and not those of the Company’s directors or officers. The policy further requires that such donations or contributions will be made only in compliance with applicable laws and regulations. The policy is reviewed annually by the Audit Committee and was reviewed by our Audit Committee in early 2024. | ||
2024 Proxy Statement |
| 49 |
Corporate Governance
Management Succession Planning
One of the primary responsibilities of the board is to ensure that the Company has the necessary senior management talent to pursue our strategies and to be successful. The Company’s Statement on Corporate Governance states that the board is responsible for appointing the CEO, and planning for his succession, as well as the succession for other executive officers of the Company. The Compensation Committee is responsible for annually reviewing the development and retention plans for the Company’s key executive officers, including the CEO, reviewing and approving a succession plan for the CEO, and ensuring development and succession plans are in place for the Company’s key executive officers reporting to the CEO. Consistent with its responsibilities, the Compensation Committee regularly reviews succession plans for the CEO and the key executive officers, and reports to the board regarding those plans. In addition, we have a plan in place in the event of a sudden vacancy in the CEO position, which is also reviewed by the Compensation Committee. Under the direction of the Compensation Committee, the CEO and other members of senior management have undertaken and continue to undertake a concerted effort to develop and implement a strategy to identify, assess and develop successors for the key executive officers. This effort involves potential candidates working with third party consultants and completing a series of leadership assessment programs with the goal of determining skill sets and executive potential as potential successors for key executive officers. In addition in 2023, we hired a Vice President of Organizational Development who has a specific focus on succession planning including for the CEO’s direct reports and all officers of the Company including Senior Directors, Vice Presidents and Senior Vice Presidents along with selected Directors.
The Company has a proven track record on management, talent development, and succession.
2019 | |||
● Five Vice Presidents were promoted to Senior Vice Presidents in 2019. | |||
2021 | |||
● Two Vice Presidents were promoted to Senior Vice President in 2021. ● Mr. Lacy, our Senior Vice President – Property Operations, and other members of management took on enhanced duties with respect to our operations in connection with the resignation of Mr. Davis as Chief Operating Officer at the beginning of 2021 and as President at the end of 2021. | |||
2022 | |||
● In May of 2022, Mr. Fisher was appointed President in addition to his role as our Chief Financial Officer. In connection with the promotion Mr. Fisher took on additional duties in the areas of innovation, ESG oversight, and human capital. | |||
2023 | |||
● Appointed Vice President of Organizational Development. | |||
2024 | |||
● Promoted one Vice President to Senior Vice President. | |||
2024 Proxy Statement |
| 50 |
Corporate Governance
The following outlines certain highlights of our succession planning:
► Management Succession | |
● The Company maintains an executive talent pipeline for every executive officer position, including the CEO position. ● We have a formal plan in place addressing an emergency vacancy in the CEO position. ● The executive talent pipeline includes “interim,” “ready now,” and “under development” candidates for each position. The Company has an intentional focus on those formally under development for executive roles. Management is also focused on attracting, developing, and retaining strong talent across the organization. ● The executive talent pipeline is formally updated annually and is the main topic of at least two of the Compensation Committee’s meetings each year. The Compensation Committee also reviews the pipeline in connection with year-end performance and compensation reviews for every executive officer position. The pipeline is discussed regularly at the executive management level as well. | ● Talent development and succession planning is a coordinated effort among the CEO, the board, the Compensation Committee, other members of senior management, our Vice President of Organizational Development, and the Company’s Human Resources team, as well as each succession candidate. ● The board is provided exposure to succession candidates for executive officer positions, including by attendance of potential candidates at board meetings from time-to-time. ● All executive succession candidates have development plans, which include the use of outside consultants for assessment and coaching. ● All CEO succession candidates receive one-on-one development from a professional executive coach. ● The CEO provides formal updates to the Compensation Committee and the board annually on CEO succession candidates’ development plan progress. ● The Company maintains a forward-looking approach to succession. Positions are filled considering the business strategy and needs at the time of a vacancy and the candidate’s skills, experience, expertise, leadership, and fit. |
520 | 59% | 48% | 13,924 |
Over the three-year period ending on December 31, 2023, 520 promotions occurred | 59% of associates who were promoted to the positions of resident services manager and more senior job classifications were female | 48% of associates who were promoted to the positions of community director or director or higher job classifications were of ethnic backgrounds other than white | In 2023, our associates completed 13,924 hours of training including training designed to help them increase their skills to allow career advancement |
DIVERSE WORKFORCE | TURNOVER RATE ▼ |
Our workforce is diverse: 60% male, 40% female 53% white, 47% other ethnicity | Our associate turnover of 22% for 2023 was substantially below the industry average of 40% |
2024 Proxy Statement |
| 51 |
Corporate Governance
Our Commitment to Shareholder Engagement
The Company has an ongoing proactive practice of meeting with and discussing corporate governance issues with shareholders throughout the year. We value the insights of and feedback from our shareholders and remain committed to ongoing engagement with investors. To this end, we engage in regular outreach to enable meaningful discussion and deliver feedback to our board to help drive strategic results.
Purposeful Engagement
We seek transparent and collaborative discussions with shareholders, and our engagement with investors includes the appropriate level of senior management for the topics being discussed to ensure actionable outcomes, where appropriate.
01 Review | ► | 02 plan | ||||||||
Regular Board Meetings: Review reports regarding shareholder engagement several times each year. Contents considered when reviewing the reports: ● Feedback ● Insights | Who We Engage: ● Our shareholders ● Our investment community ● Our investors’ key governance & stewardship contacts | Who Participates: ● Our Chairman and Chief Executive Officer ● Members of the Board (when appropriate) ● Our President and Chief Financial Officer ● Our Senior Vice President Property Operations ● Our Senior Vice President - General Counsel ● Our Investor Relations team ● Other members of our management team | ||||||||
▲ | ▼ | |||||||||
04 analyze and respond | ◄ | 03 engage | ||||||||
Key Topics of Engagement ● Sustainability matters ● Overall business strategy ● Current business and economic conditions ● Financial updates ● Corporate governance practices ● Executive compensation ● Human capital matters | How We Engage: ● Shareholder outreach program ● Quarterly earnings calls ● Annual Shareholder meeting ● Investor conferences ● Written and electronic communications ● Telephonic or web-based conferences with investors including their governance/stewardship teams which may include participation by our Lead Independent Director, committee chairs and other board members as appropriate ● Our Investor Relations team was ranked number 3 and our Vice President, Investor Relations Trent Trujillo ranked number 2 in the Institutional Investor All-America Executive Team Rankings for 2023 | |||||||||
2024 Proxy Statement |
| 52 |
Corporate Governance
Engagement
In 2023 and early 2024, we had 708 interactions with shareholders representing 85.0% of our outstanding shares.
As a result of our efforts, we were able to meet and interact with key governance or stewardship contacts at a number of our shareholders representing 43.1% of our outstanding shares and have in-depth discussions regarding a variety of ESG matters.
We also attend a variety of investor conferences and organize investor engagement events at which we interact with shareholders throughout the year. While the schedule may vary year-to-year, the conferences and events we attended in 2023 are as follows:
● UDR Platform and Innovation Roadshow hosted by Evercore ISI (Denver) ● Investor Roadshow hosted by KeyBanc (Boston and New York) ● ESG and Corporate Governance Investor Meetings (Virtual) ● Citi Global Property CEO Conference (Florida) ● Investor Property Tour hosted by Bank of America (San Francisco) ● Investor Property Tour hosted by Bank of America (Seattle) ● Investor Roadshow hosted by J.P. Morgan (Chicago) ● Investor Property Tours (Dallas) ● Investor Roadshow hosted by Morgan Stanley (Virtual) ● Investor Property Tour hosted by Evercore ISI (Los Angeles) ● NAREIT REITWeek 2023 Investor Conference (New York) ● Investor Property Tours (Washington, D.C.) ● Investor Property Tours (Denver) ● Investor Property Tour (Austin) ● Investor Property Tours (Nashville) ● Bank of America Global Real Estate Conference (New York) ● Investor Property Tour hosted by Wolfe Research (Seattle) ● Investor Property Tour hosted by U.S. Bank (Austin) ● Investor Property Tours (New York) ● Investor Dinner (Denver) ● Investor Property Tour hosted by Evercore ISI (San Francisco) ● NAREIT REITWorld 2023 Investor Conference (Los Angeles) | Property Tours
|
Recognition
Our board was ranked number 3, our Chairman and Chief Executive Officer was ranked number 3, our President and Chief Financial Officer was ranked number 3, and our investor relations team was ranked number 2 out of, in each case, approximately 150 companies in the 2023 Institutional Investor All-American Executive Team Rankings.
2024 Proxy Statement |
| 53 |
Corporate Governance
Communicating with the Board
Our board provides a process for shareholders and all other interested parties to send communications to the board. Any shareholder and all other interested parties who wish to communicate with the board or any specific director, including the Chairman or the Lead Independent Director, may write to:
UDR, Inc.
Attn: Board of Directors
1745 Shea Center Drive,
Suite 200
Highlands Ranch, Colorado 80129-1540
Depending on the subject matter of the communication, management will:
| ● | forward the communication to the director or directors to whom it is addressed; |
| ● | attempt to handle the inquiry directly where the communication does not appear to require direct attention by the board, or an individual member of the board, e.g., the communication is a request for information about the Company or is a stock-related matter; or |
| ● | not forward the communication if it is primarily commercial in nature or if it relates to an improper or irrelevant topic. |
Shareholders and all other interested parties may submit concerns regarding accounting matters via the Company’s third-party anonymous reporting system at http://udr.ethicspoint.com or by calling 1-844-989-2850. Instructions for making a report are published in the Corporate Governance section of the Investor Relations page of the Company’s website at ir.udr.com.
2024 Proxy Statement |
| 54 |
Corporate Governance
Board Practices, Policies and Processes
History of Commitment to Good Governance Practices
Our board is committed to operating with transparency. The following summary lists select strategic and governance developments overseen by the board during the last five years.
Governance 2023 ● Adopted revised Recoupment Policy complying with new SEC and NYSE requirements ● Published our fifth ESG Report 2022 ● Adopted Charitable Donations and Political Contributions Policy ● Published our fourth ESG Report (formerly known as Corporate Responsibility Report) 2021 ● Appointed one new director as part of our board refreshment efforts and appointed a new Audit Committee and Governance Committee member ● Revised the charter of the Governance Committee to provide the Governance Committee a specific duty to assess our disclosure of environmental, social and governance matters, including reviewing any ESG report we publish ● Revised our Amended and Restated Policy and Procedures with Respect to Related Person Transactions to comply with revised NYSE Regulations ● Revised our Governance Committee Charter to add review of related person transactions as a specific duty of the committee | 2020 ● Appointed one new director as part of our board refreshment efforts and appointed a new Audit Committee and Governance Committee member ● Enhanced our Statement on Corporate Governance and Nominating Committee Charter by amending such documents to adopt a “Rooney Rule” specifically requiring inclusion of diverse candidates in the initial pool for external director candidate and external CEO searches, and to require any retained search firms to do the same 2018 ● Following a vote of the shareholders at our 2018 Annual Meeting, amended our Charter and our bylaws to allow shareholders to amend bylaws under certain circumstances | |||||||
Enterprise Risk Management every year ● Board review of enterprise risk management, including cybersecurity related risks, reports provided to the board for each regularly scheduled meeting ● Board review of climate change related risks for all assets (began in 2018 now conducted annually) ● Review of our cybersecurity risk matrix and enterprise risk matrix at each meeting of the Audit Committee. Reports are provided to the board quarterly and cybersecurity is formally reviewed annually by the entire board. | ESG every year ● Board reviews human capital management, including culture ● ESG discussions by the board 2021 ● Review of ESG disclosure was added to the Governance Committee charter as a specific duty of the committee 2019 ● Made ESG discussion a regular agenda item for meetings of the board, and the board oversaw management’s publication of our first Corporate Responsibility Report | |||||||
Strategy Every Year ● Reviews Business Plan and Strategic Plan | ||||||||
2024 Proxy Statement |
| 55 |
Corporate Governance
Board Meetings and Attendance
The board held seven meetings during fiscal 2023, including meetings that were held by teleconference or by web-based application and acted by unanimous written consent on two occasions. No director attended fewer than 75% of the aggregate of (1) the total number of meetings of the board, and (2) the total number of meetings held by all committees of the board on which he or she served during fiscal 2023, held during the time such director was a member of the board or the applicable committee.
ENGAGED AND ACTIVE BOARD OF DIRECTORS |
| GOAL |
7 Board of Director meetings in 2023 | 2023 Board meetings included a multi-day meeting during which the board reviewed our 2024 business and strategy plan, including the operating plans of each of our business segments and a multi-day meeting during which the board reviewed human capital related matters. | |
100% Director attendance at 2023 Board and committee meetings | Strong director participation, with all Board members attending 100% of their Board meetings. | |
100% Director attendance at the 2023 Annual Meeting | We encourage directors to attend each Annual Meeting of Shareholders. | |
100% Each 2023 Board meeting included a non-management director executive session | Executive sessions of the non-management directors are held in connection with all regularly scheduled Board meetings. The non-management directors may also meet without management present at other times as requested by any non-management director. The Independent Lead Director chairs the executive sessions. |
Board Evaluation
The board, through the Governance Committee, annually evaluates the board and its members as follows.
How We Evaluate the Board’s Effectiveness
01 annual evaluation process | ► | 02 Evaluation Questionnaires | |||||
The Governance Committee oversees and approves the annual formal board evaluation process and determines whether it is appropriate for the evaluations to be conducted by the lead independent director. | Directors complete written questionnaires focusing on the performance of the board, each member of the board and each of its committees. | ||||||
▼ | |||||||
04 Use of Feedback | ◄ | 03 Discussion of Results | |||||
The board and each of its committees develops plans to take actions based on the results, as appropriate. | Based upon the written questionnaires, the lead independent director may conduct one-on-one interviews with members of the board. The lead independent director reviews the questionnaire and interview responses, as applicable, with the full board. | ||||||
Director Orientation/Education
In order to increase each director’s engagement with and understanding of our business and strategy, each director participates in an extensive orientation program upon joining the board. This includes meeting with members of our executive leadership team and other key leaders of the Company to gain a deeper understanding of our strategic priorities, key business areas, and areas of opportunity and risk. This process provides a deeper understanding of the business and accelerates the learning process and contribution of each director. In addition, presentations by outside experts on various topics are provided at board meetings to enhance director education in areas such as cybersecurity, ESG, AI, climate change, diversity, equity and inclusion, regulatory, and others. Our directors also have the opportunity to understand and assess how we are communicating our strategy to our investors and other important stakeholders. In addition, our board regularly receives updates on ethics, compliance, and governance. Last, certain board meetings are held in locations where we own properties, providing directors the opportunity to observe in person our properties and operations.
2024 Proxy Statement |
| 56 |
Corporate Governance
Guidelines on Corporate Governance
We maintain a corporate governance page on our website that includes key information about UDR’s corporate governance, including our:
● Statement on Corporate Governance; ● Code of Business Conduct and Ethics; ● Code of Ethics for Senior Financial Officers; ● Related Person Transactions Policy; ● Amended and Restated Insider Trading Policy; ● Recoupment Policy; | ● Executive Stock Ownership Guidelines; ● Charitable Donations and Political Contribution Policy; ● Charter of the Audit Committee; ● Charter of the Compensation Committee; ● Charter of the Governance Committee; and ● Charter of the Nominating Committee. |
All of these documents can be found by accessing the “Investor Relations” page at ir.udr.com and then clicking on “Corporate Governance” and “Governance Documents.” The documents noted above will also be provided without charge to any shareholder who requests them. Any changes to these documents, and any waivers granted by us with respect to our Code of Business Conduct and Ethics and our Code of Ethics for Senior Financial Officers, will be posted on our website. Each of these documents is reviewed annually by management and outside counsel and any changes are recommended to the board or the appropriate committees for approval.
Code of Business Conduct and Ethics
We maintain and require all UDR associates to follow a Code of Business Conduct and Ethics (available on our website at ir.udr.com, click “Governance Documents” and then “Code of Business Conduct and Ethics”). The code is also provided to and followed by our consultants. The code covers a variety of areas that we consider important to being a good corporate citizen including compliance with law, conflicts of interest, insider trading, corporate opportunities, competition and fair dealing, appropriate gifts, prohibition of discrimination or harassment, confidentiality, protection of company assets, and prohibitions of payments to government personnel.
Transactions with Related Persons
Our board has adopted a policy, which was revised in 2021, relating to the review, approval and ratification of transactions with related persons. The Company recognizes that there are situations where related person transactions may be in, or not inconsistent with, the best interest of the Company and therefore the board adopted a written policy to provide a procedure for the review and pre-approval by our Governance Committee, of related person transactions. The policy applies to any transaction, the amount of which exceeds $120,000, between the Company and any person who is a director, executive officer or the beneficial owner of more than 5% of any class of the Company’s voting securities, and in which such related person had, has or will have a direct or indirect material interest. Any related person transaction is subject to pre-approval by the governance committee of the board. To access the guidelines on our website, click on “Investor Relations” and then click on “Corporate Governance.”
From time to time, the Company makes loans to United Dominion Realty, L.P., a Delaware limited partnership, of which the Company is the parent company and the sole general partner (the “Operating Partnership”), and certain of the Company’s directors (or entities that they control) in connection with partnership interests held by them in the Operating Partnership, have entered into agreements to reimburse the Company for all or a portion of the Operating Partnership’s obligations under such loans in the event that the Operating Partnership is unable to repay the amounts owed to the Company. As of December 31, 2023, entities that Mr. Klingbeil controls have agreed to reimburse the Company up to $70,150,000, in the event that the Operating Partnership is unable to repay such amounts under the terms of certain outstanding loans made by the Company to the Operating Partnership.
Shareholder Bylaws Amendments
In 2018, following the approval by our shareholders of a charter amendment, the board amended our bylaws to provide that a shareholder, or a group of up to 20 shareholders, owning 3% or more of the Company’s outstanding common stock continuously for at least three years could propose a binding amendment to our bylaws. A shareholder proposal submitted under our amended bylaws may not alter, modify or repeal Article VII of the bylaws (which addresses indemnification) or Section 8.5 (which addresses procedures for amending the bylaws) without the approval of any indemnitees adversely affected or our board, respectively.
2024 Proxy Statement |
| 57 |
Corporate Governance
Compensation of Directors
2023 Director Compensation Program
For 2023 there were no changes from 2022 to the independent director compensation program.
Retainer Each independent director receives an annual retainer fee of $80,000 ($120,000 for the Lead Independent Director). The chairpersons of each of the Audit, Compensation, and Governance Committees also receive an annual retainer fee of $15,000. These fees were paid in January 2023. The independent directors can elect to receive their 2023 annual retainer in cash, stock, stock options, Class 1 LTIP Units, Class 1 Performance LTIP Units, or a combination of cash, stock, stock options, Class 1 LTIP Units or Class 1 Performance LTIP Units. | Equity Grant Each independent director also receives a grant of $200,000 ($230,000 for the Lead Independent Director) in value in the form of shares of restricted stock, stock options, Class 1 LTIP Units, and/or Class 1 Performance LTIP Units. | |||||||
For those independent directors who elected to receive restricted stock, the restricted stock was priced at $38.59 per share, which was the closing sales price of our common stock on January 3, 2023, the date of grant. The shares of restricted stock vested on January 3, 2024. The independent directors receiving restricted stock are entitled to receive dividends during the vesting period; however, any unvested shares at the end of the one-year vesting period will be returned to us and cancelled.
No independent directors elected to receive stock options.
For those independent directors who elected to receive Class 1 LTIP Units, the Class 1 LTIP Units were priced at $38.59 per unit, which was the closing sales price of our common stock on January 3, 2023, the date of grant. The Class 1 LTIP Units vested on January 3, 2024. The independent directors receiving Class 1 LTIP Units are entitled to receive distributions during the vesting period; however, any unvested Class 1 LTIP Units at the end of the one-year vesting period will be returned to us and cancelled.
For those independent directors who elected to receive Class 1 Performance LTIP Units, the Class 1 Performance LTIP Units were priced at $8.21 per unit, which was the fair value of a Class 1 Performance LTIP Unit on January 3, 2023, the date of grant. The Class 1 Performance LTIP Units have a strike price of $38.59 per unit, the closing sales price of our common stock on January 3, 2023, the date of grant. The Class 1 Performance LTIP Units vested on January 3, 2024. The independent directors receiving Class 1 Performance LTIP Units are entitled to receive distributions during the vesting period; however, any unvested Class 1 Performance LTIP Units at the end of the one-year vesting period will be returned to us and cancelled.
Directors who are also employees of the Company receive no additional compensation for service as a director. All independent directors are reimbursed for expenses incurred in connection with attending a board meeting or committee meeting in accordance with our Director Expense Reimbursement Policy.
2024 Director Compensation Program
There were no changes to the independent director compensation program from 2023.
2024 Proxy Statement |
| 58 |
Corporate Governance
Director Compensation Table
The following table provides information concerning the compensation of our directors for fiscal 2023.
| Fees |
|
|
|
|
|
| |||||||
Earned | Non-Equity | Nonqualified | ||||||||||||
or Paid in | Stock | Option | Incentive Plan | Deferred | All Other | |||||||||
Cash | Awards | Awards | Compensation | Compensation | Compensation | Total | ||||||||
Name | ($) | ($) | ($) | ($) | Earnings | ($) | ($) | |||||||
(a) | (b) | (c)(1)(2)(5) | (d)(1)(2)(5) | (e) | (f) | (g)(3) | (h) | |||||||
Katherine A. Cattanach(4) |
| 95,000 |
| 172,910 |
| -0- |
| -0- |
| -0- |
| 9,136 |
| 277,046 |
Jon A. Grove(4) |
| 80,000 |
| 187,383 |
| -0- |
| -0- |
| -0- |
| 1,119 |
| 268,502 |
Mary Ann King(4) |
| 80,000 |
| 187,383 |
| -0- |
| -0- |
| -0- |
| 1,119 |
| 268,502 |
James D. Klingbeil(4) |
| 120,000 |
| 214,227 |
| -0- |
| -0- |
| -0- |
| 1,398 |
| 335,625 |
Clint D. McDonnough(4) |
| 80,000 |
| 187,383 |
| -0- |
| -0- |
| -0- |
| 1,119 |
| 268,502 |
Robert A. McNamara |
| 95,000 |
| 195,478 |
| -0- |
| -0- |
| -0- |
| 4,649 |
| 295,127 |
Diane M. Morefield |
| 95,000 |
| 174,823 |
| -0- |
| -0- |
| -0- |
| 8,500 |
| 278,323 |
Kevin C. Nickelberry(4) |
| 80,000 |
| 164,745 |
| -0- |
| -0- |
| -0- |
| 11,900 |
| 256,645 |
Mark R. Patterson |
| 80,000 |
| 190,990 |
| -0- |
| -0- |
| -0- |
| 799 |
| 271,789 |
Thomas W. Toomey(5) |
| -0- |
| -0- |
| -0- |
| -0- |
| -0- |
| -0- |
| -0- |
| (1) | The dollar amount reflected in the “Stock Awards” and “Option Awards” columns reflect the aggregate grant date fair value, computed in accordance with FASB ASC Topic 718, of a grant of shares of restricted stock, stock options, Class 1 LTIP Units or Class 1 Performance LTIP Units, which vested on the first anniversary date of the grant, as discussed below under “Director Compensation Table Discussion.” For those independent directors who elected to receive restricted stock, the amount of restricted stock was 5,183 shares (5,960 shares for an independent Chairman of the Board), which was priced at $38.59 per share, which was the closing sales price of our common stock on January 3, 2023, the date of grant. For those independent directors who elected to receive stock options, the number of shares to which such options related was 22,701 (26,107 for an independent Chairman of the Board), which was priced at $8.81 per option, which was the fair value on January 3, 2023, the date of grant, with an exercise price of $38.59 per share. For those independent directors who elected to receive Class 1 LTIP Units, the amount was 5,183 units (5,960 units for an independent Chairman of the Board), which was priced at $38.59 per unit, which was the closing sales price of our common stock on January 3, 2023, the date of grant. For those independent directors who elected to receive Class 1 Performance LTIP Units, the amount was 24,361 units (28,015 units for an independent Chairman of the Board), which was priced at $8.21 per unit, which was the fair value on January 3, 2023, the date of grant, with a strike price of $38.59 per unit upon exercise. |
| (2) | The following table sets forth the unvested restricted stock awards, option awards, Class 1 LTIP Unit awards, and Class 1 Performance LTIP Unit awards outstanding as of December 31, 2023, for each of our independent directors. Mr. Toomey’s holdings are set forth under the heading “Executive Compensation” in this proxy statement. The restrictions relating to these awards are described in more detail below under the heading “Director Compensation Table Discussion — 2023 Director Compensation Program.” |
| Restricted Stock |
| LTIP Unit or Performance |
| Option Awards | |
Director | Awards Outstanding* | Unit Awards Outstanding* | Outstanding* | |||
Katherine A. Cattanach |
| -0- |
| 5,571 |
| -0- |
Jon A. Grove |
| -0- |
| 34,105 |
| -0- |
Mary Ann King |
| -0- |
| 34,105 |
| -0- |
James D. Klingbeil |
| -0- |
| 42,631 |
| -0- |
Clint D. McDonnough |
| -0- |
| 34,105 |
| -0- |
Robert A. McNamara |
| 2,591 |
| 12,180 |
| -0- |
Diane M. Morefield |
| -0- |
| 5,183 |
| -0- |
Kevin C. Nickelberry |
| -0- |
| 7,256 |
| -0- |
Mark R. Patterson |
| -0- |
| 24,361 |
| -0- |
* Restricted Stock, LTIP Unit, Performance Unit, or Option awards that were granted on January 2, 2024, pursuant to our 2024 independent director compensation program are not included in this table.
| (3) | The dollar amount in this column includes dividends on all outstanding stock awards. |
2024 Proxy Statement |
| 59 |
Corporate Governance
| (4) | These directors elected to receive all or some of their cash portion of the fees in Class 1 LTIP Units and/or Class 1 Performance LTIP Units, as follows: Ms. Cattanach received 389 Class 1 LTIP Units, Mr. Grove received 9,744 Class 1 Performance LTIP Units, Ms. King received 9,744 Class 1 Performance LTIP Units, Mr. Klingbeil received 14,616 Class 1 Performance LTIP Units, Mr. McDonnough received 9,744 Class 1 Performance LTIP Units, and Mr. Nickelberry received 2,073 Class 1 LTIP Units. |
| (5) | Mr. Toomey is our Chairman and Chief Executive Officer. Because he is an employee of the Company, he receives no additional compensation for service as a director of the Company. His total compensation for 2023 is set forth below under the heading “Executive Compensation.” |
Director Compensation Table Discussion
Our compensation program for independent directors is designed to attract and retain highly qualified board members who can work with senior management to establish key strategic goals in support of long-term shareholder value creation. The program consists of a combination of a cash retainer fee and a grant of equity awards. Total compensation was targeted to be competitive with the median level of a diversified group of public REITs. The compensation program was set at competitive levels in recognition of the time commitments and responsibility levels associated with serving on public company boards within the current environment.
The Compensation Committee reviews our independent director compensation annually to ensure that we are competitive and to allow us to recruit and retain qualified candidates to serve as directors of the Company. The Compensation Committee utilizes FPL to assist the Compensation Committee in reviewing and assessing our independent director compensation program and both a benchmarking study prepared by FPL and other industry data in determining director compensation.
Director Share Ownership Guidelines
Pursuant to our Amended and Restated Statement of Corporate Governance, each of our directors is required to own, at a minimum, shares of our common stock or LTIP Units equivalent to five times their annual cash retainer within five years after election to the board. As of March 25, 2024, all of our directors are in compliance with this policy.
Our director share ownership guidelines may be found on our corporate governance page on our website at ir.udr.com. To access the guidelines on our website at ir.udr.com, click on “Corporate Governance” and then click on “Governance Documents” and “Amended and Restated Statement of Corporate Governance.”
OVERBOARDING POLICY
Pursuant to our Statement on Corporate Governance, a director may not simultaneously serve on more than four (4) (including the Company’s) public company boards of directors. Further, a director may not serve on the audit committees of more than three (3) (including the Company’s) public companies.
2024 Proxy Statement |
| 60 |
Section 14A of the Exchange Act enables our shareholders to vote to approve, on an advisory basis, the compensation of our named executive officers as disclosed in this proxy statement in accordance with the SEC’s rules.
As described in detail under the heading “Executive Compensation — Compensation Discussion and Analysis,” our executive compensation programs are designed to attract and retain executive talent and to align the interests of our named executive officers with the interests of the Company and our shareholders by providing market competitive compensation that is closely tied to short-term and long-term performance goals set by our Compensation Committee. The compensation of our named executive officers is comprised of a mix of base salary, short-term incentive compensation and long-term incentive compensation. Please read the “Executive Compensation” section beginning on page 63, which includes the Compensation Discussion and Analysis, the tabular disclosure regarding the compensation of our named executive officers and the accompanying narrative disclosure set forth in this proxy statement for additional details about our executive compensation programs, including information about the fiscal year 2023 compensation of our named executive officers.
We are asking our shareholders to indicate their support for our named executive officer compensation as described in this proxy statement. Accordingly, our board is asking our shareholders to cast a non-binding advisory vote “FOR” the following resolution at the annual meeting:
“RESOLVED, that the Company’s shareholders approve, on an advisory basis, the compensation of the named executive officers, as disclosed in the Company’s Proxy Statement for the 2024 Annual Meeting of Shareholders pursuant to the compensation disclosure rules of the Securities and Exchange Commission, including the Compensation Discussion and Analysis, the Summary Compensation Table and the other related tables and disclosure.”
| Our board recommends that the shareholders vote “FOR” the approval of the compensation of our named executive officers, as disclosed in this proxy statement pursuant to the compensation disclosure rules of the Securities and Exchange Commission. |
Vote Required and Board of Directors’ Recommendation
The vote on the compensation of our named executive officers as disclosed in this proxy statement is advisory, and therefore not binding on the Company, the Compensation Committee or our board. Our board and our Compensation Committee value the opinions of our shareholders and to the extent there is any significant vote against the named executive officer compensation as disclosed in this proxy statement, we will consider our shareholders’ concerns and the Compensation Committee will evaluate whether any actions are necessary to address those concerns. We have determined that our shareholders should cast an advisory vote on the compensation of our named executive officers on an annual basis. Unless this policy changes, the next advisory vote on the compensation of our named executive officers will be at the 2025 annual meeting of shareholders. The affirmative vote of a majority of votes cast is required to approve, on an advisory basis, the compensation of the named executive officers, as disclosed in the Company’s proxy statement pursuant to the compensation disclosure rules of the Securities and Exchange Commission, including the Compensation Discussion and Analysis, the Summary Compensation Table and the other related tables and disclosure.
2024 Proxy Statement |
| 61 |
Proposal 2 Advisory Vote on Executive Compensation
Compensation Committee Report Notwithstanding anything to the contrary set forth in any of our previous or future filings under the Securities Act of 1933 or the Exchange Act that might incorporate this proxy statement or future filings with the Securities and Exchange Commission, in whole or part, the following report shall not be deemed to be incorporated by reference into any such filing. The Compensation Committee has reviewed and discussed with our management the Compensation Discussion and Analysis beginning on page 64 of this proxy statement. Based on such review and discussions, the Compensation Committee recommended to the board that the Compensation Discussion and Analysis be included in this proxy statement. COMPENSATION AND MANAGEMENT DEVELOPMENT COMMITTEE Compensation Committee Interlocks and Insider Participation The members of the Compensation Committee in fiscal 2023 included Robert A. McNamara (Chairman), Jon A. Grove, Mary Ann King, and Mark A. Patterson. None of the members of the Compensation Committee during fiscal 2023, or as of the date of this proxy statement, is a former or current officer or employee of the Company or has any interlocking relationships as set forth in applicable SEC rules. In addition, during 2023 and through the date of this proxy statement, none of our executive officers has served as a member of the board or compensation committee of any other entity that has one or more executive officers serving as a member of our board or Compensation Committee. |
2024 Proxy Statement |
| 62 |
Biographical Information of Our Executive Officers
The following table sets forth information about our executive officers. The executive officers listed below serve in their respective capacities at the discretion of our board.
Name |
| Age |
| Office |
| With the |
Thomas W. Toomey | 63 | Chairman and Chief Executive Officer | 2001 | |||
Joseph D. Fisher | 44 | President and Chief Financial Officer | 2017 | |||
Harry G. Alcock | 61 | Senior Vice President — Chief Investment Officer | 2010 | |||
Michael D. Lacy | 43 | Senior Vice President — Property Operations | 2006 |
Mr. Toomey’s biographical information is provided under the heading “Directors.”
Mr. Fisher oversees the areas of accounting, tax, financial planning and analysis, investor relations, SEC reporting, regulatory, innovation, environmental, social and governance oversight, and human capital. He joined us in January 2017 as Senior Vice President — Chief Financial Officer and was promoted to President – Chief Financial Officer in May 2022 at which time he took on additional responsibilities in the areas of innovation, information technology, environmental, social and governance oversight, human capital, and talent development. Mr. Fisher previously served as Co-Head of the Americas and Co-Lead Portfolio Manager at Deutsche Asset and Wealth Management since 2007. Prior to serving in those positions, he was Associate, Structured Debt Investments from April 2005 to June 2007, and Portfolio Analyst, Portfolio Management Group from May 2004 to June 2006. From June 2003 to May 2004, Mr. Fisher was an Asset Management Analyst at Principal Real Estate Investors.
Mr. Alcock oversees the Company’s acquisitions, dispositions, development, redevelopment and asset management. He joined us in December 2010 as Senior Vice President — Asset Management and in February 2017 was promoted to Senior Vice President – Chief Investment Officer. Prior to joining the Company, Mr. Alcock was with AIMCO for over 16 years, serving most recently as Executive Vice President, Co-Head of Transactions and Asset Management. He was appointed Executive Vice President and Chief Investment Officer in 1999, a position he held through 2007. Mr. Alcock established and chaired AIMCO’s Investment Committee, established the portfolio management function and at various times led the property debt and redevelopment departments. He currently serves as a member of the Executive Committee of the NMHC, and is a member of the Multifamily Gold Council for Urban Land Institute. As previously announced, Mr. Alcock will retire as Senior Vice President – Chief Investment Officer effective July 31, 2024, following which he is expected to serve in a consulting role until December 31, 2025.
Mr. Lacy oversees the Company’s property operations and information technology. Mr. Lacy joined us in November 2006 and worked in an operational strategist role and as a Senior Acquisitions Analyst. In November 2010, Mr. Lacy was promoted to Director of Pricing and Revenue Management, and from 2014-2016 he managed a portfolio in Southern California in the position of Vice President — Southern California Regional Manager. In January 2016 Mr. Lacy was promoted to Vice President — Property Operations, and in January 2019 he was promoted to Senior Vice President — Property Operations. Mr. Lacy began his career as an accountant at RedPeak Properties.
2024 Proxy Statement |
| 63 |
Executive Compensation
Compensation Discussion and Analysis
In this section, we describe the material components of our executive compensation program for our named executive officers (“NEOs”), whose compensation is set forth in the 2023 Summary Compensation Table and other compensation tables contained in this Proxy Statement.
We also provide an overview of our executive compensation philosophy and our executive compensation program. In addition, we explain how and why our Compensation Committee arrived at the specific compensation decisions involving the NEOs for fiscal year 2023.
Executive Overview
Named Executive Officers
|
|
|
| |||
Thomas W. Toomey | Joseph D. Fisher | Harry G. Alcock | Michael D. Lacy |
Highlights of 2023 Performance and Impact on Executive Compensation
Our Variable Compensation Performance Metrics Are Tied to Our Strategy and Our Annual Business Plan
The metrics we use for both our Long-Term Incentive Program (“LTI”) and our Short-Term Incentive Program (“STI”) are selected in light of areas that we believe will result in increasing value for our shareholders and, accordingly, are as described below tied to our strategic objectives of operating excellence, portfolio diversification, culture and ESG, accretive capital allocation and balance sheet strength.
2023 Highlights
Earnings and Dividend ● 6% FFOA growth year-over-year ● Increased our 2023 dividend by 10.5% over our 2022 dividend ● Outperformed our apartment peers with respect to FFOA growth in seven of the last ten years | Operations ● 3rd highest same-store revenue growth among the apartment peers at 6.2% ● 2nd highest same-store NOI growth among the apartment peers at 6.8% ● Industry leading controllable operating margin spread to apartment peers of approximately 300 basis points | |||
Capital ● Investment-grade rated balance sheet with the lowest cost of debt in the sector and best liquidity profile with 12% of debt (versus 25% apartment peer group average) maturing through 2026(1) ● Grew the Company through ~$1 billion of joint venture and operating partnership unit transactions in 2023 | GRESB ● Earned a GRESB Sector Leader designation, the highest rating possible ● Highest ESG ranking among all listed residential companies in the Americas | |||
| (1) | Data as of December 31, 2023. Amount for UDR excludes commercial paper balance, working capital facility balance, and principal amortization. |
2024 Proxy Statement |
| 64 |
Executive Compensation
Our Approach to Compensation
Our executive compensation program has four principal goals:
|
|
|
|
Components of 2023 Compensation
The mix, level, weighting of various metrics and structure of the components of our named executive officers’ compensation generally reflect real estate industry practices, as well as the executive’s role and relative impact on business results consistent with our variable pay-for-performance philosophy. The mix of compensation elements for our named executive officers places relatively greater emphasis on at-risk, variable performance-based incentive compensation, as compared with the median mix of compensation elements for the companies in our peer group. As an executive officer’s level of responsibility increases consistent with his or her relative ability to impact the long-term performance of the Company as a whole, a greater portion of the named executive officer’s compensation is based on performance-based incentive compensation and less on base salary, thereby creating the potential for greater variability in the individual’s compensation level from year to year.
The key components of our named executive officers’ compensation, base salary, short-term incentive compensation, and long-term incentive compensation, are described in more detail in the following table.
Fixed | Variable | ||||
Base Salary | + | Short-Term Incentive (STI) | + | Long-Term Incentive (LTI) | |
what | Cash | Cash or Equity (decision made by executive in prior year) | Equity | ||
when | Annually | Granted annually, generally determined in February of the year following the end of the performance period | Granted annually, generally determined in February of the year following the end of the applicable performance period | ||
how | ● The Compensation Committee annually reviews and determines the base salary of our named executive officers in consultation with our CEO. ● The considerations in setting base salary include: qualifications, experience level, competitive market for qualified executives and tenure. ● Performance Period: Continuous. | ● The metrics and the threshold, target and maximum dollar amounts for short-term incentive compensation are established prior to the beginning of each year and are intended to drive performance in areas that further our strategic objectives. The value of the award is paid in February of the following year based upon an evaluation of achievement of goals established at the time the targets are set. ● Short-term incentive compensation is based on pre-determined weighting between Company performance (70%) and individual performance (30%). The relative metrics and weightings are determined based on the extent to which a particular executive officer has responsibility for and influence over overall Company performance. ● Performance Period: 1 year. | ● The metrics used are selected to encourage our named executive officers to act in furtherance of our strategic objectives. ● Equity awards may consist of one or a combination of any of the following: restricted stock units; LTIP Units (including Performance LTIP Units); and stock options. ● 100% Company performance metrics. ● Performance Period: 3 years for 70% of Award; 1 year for 30% of Award (with a 2 year vesting period). | ||
why | Designed to reward individual effort associated with job-related duties and to attract and retain talented executive officers for our Company. | Designed to encourage outstanding individual and Company performance by motivating the named executive officers to achieve Company and individual goals that support long-term value creation by rewarding performance measured against key annual strategic objectives and, for the CEO, using the independent directors’ evaluation of the CEO’s performance towards achieving Company goals that support long-term value creation. | Our LTI compensation is designed to closely align the interests of our management with the creation of shareholder value, to motivate our management to achieve long-term growth and success of our Company and to foster significant ownership of our common stock. LTI compensation is the most significant component of the named executive officer’s compensation. | ||
2024 Proxy Statement |
| 65 |
Executive Compensation
Overview of 2023 Compensation Decisions/Changes to Compensation Program
In 2023, we modified our short-term incentive program to simplify the program and to add more rigor to the operations index metric by including sub-metrics for our growth rates versus our apartment peers for both same-store revenue growth and same-store expense growth. Further, the transaction index metric NOI component was modified to include development in addition to acquisitions in order to measure development efforts intended to be accretive to FFOA and thus our shareholders. In addition, the ESG Index was simplified by replacing it with a GRESB percentile metric that measures our GRESB score relative to the GRESB score of the Residential/Listed Company GRESB population. These changes help maintain the ability to measure and reward efforts that drive our strategic objectives and in turn drive above average TSR over time. The metrics used for the 2023 STI and their relationship to the creation of value are as follows:
FFO as Adjusted per Share Proven correlation with long-term value creation and relative TSR and growing FFO as Adjusted per Share promotes dividend growth. | Transactions Index Consists of transaction volume (60%) and acquisition and development performance (measured by NOI versus our acquisition budget) (40%) – rewards completion of transactions and efforts to increase NOI that are accretive to FFOA and thus the Company and our shareholders. | |||
Operations Index Consists of same-store market wins (revenue at or above apartment peer median) (25%), same-store revenue growth rank versus apartment peers (50%) and same-store expense growth rank versus peers (25%) – executing our operating plan should lead to long-term outperformance. | GRESB Percentile Measures our relative performance versus the Residential/Listed Company GRESB population – measures our performance on a relative basis and recognizes the importance of ESG to our stakeholders and therefore the Company. | |||
Associate Engagement & DEI Measures the engagement, quality and diversity of our workforce, which is important to help meet the needs of our residents and drive our innovative culture, and results, using a multifactor matrix that includes, among other factors, associate interview results, “Rooney Rule” compliance, retention metrics, and engagement and customer loyalty results. | ||||
2024 Proxy Statement |
| 66 |
Executive Compensation
Our Compensation Best Practices
Our compensation policies and programs are built upon a strong foundation of corporate governance and compensation best practices, including:
What We Do ● Provide a significant portion of our named executive officers’ total compensation in the form of awards tied to our long-term strategy and our performance relative to key business and personal objectives and performance versus our peers as measured by a diverse set of metrics. ● Require compliance with our Executive Stock Ownership Guidelines, which require that our executive officers own a specified number of shares of the Company’s common stock (110,000 shares for the Chairman and Chief Executive Officer and President, 50,000 for any Executive Vice President and 20,000 for any Senior Vice President). ● Have a Policy on Recoupment of Performance-Based Incentives, which complies with the requirements of the New York Stock Exchange and the U.S. Securities and Exchange Commission and applies to all our named executive officers. ● Have a Compensation Committee comprised entirely of independent directors that has retained its own independent compensation advisor. ● Have a Compensation Committee that reviews external market considerations, as well as internal considerations and the long-term interests of our shareholders, when making compensation decisions. ● Have the ongoing consideration and oversight by the Compensation Committee with respect to any potential risks associated with our incentive compensation programs. ● Have a “double trigger” change of control provision and no awards are outstanding to which the legacy “single trigger” provision applies. | What We Don’t Do ● Permit any Company personnel, which includes directors, officers and all other employees of the Company, to engage in any short-term, speculative securities transactions, engage in short sales, buying or selling put or call options, trading in options (other than those granted by the Company) or engaging in hedging transactions. ● Permit purchasing securities on margin or pledging securities as collateral without prior approval. ● Provide tax gross-ups for our named executive officers. ● Grant only time-vested restricted stock, restricted stock units, LTIP Units (including Performance LTIP Units), options or other equity awards to our named executive officers as part of our long-term incentive compensation program, other than in limited circumstances such as the appointment of a new executive officer or to recognize extraordinary achievements. ● Time the grants of restricted stock, restricted stock units, LTIP Units, options or other equity awards to coordinate with the release of material non-public information, or time the release of material non-public information for the purpose of affecting the value of any named executive officer compensation. ● Make one-time or special awards to our named executive officers other than in connection with the appointment of a new named executive officer or other special circumstances. | |||||
2024 Proxy Statement |
| 67 |
Executive Compensation
Procedures for Determining Compensation
Our Business and Our Compensation Philosophy
Our executive compensation program has four principal goals:
|
|
|
|
Our Compensation Committee determines the form and amount of compensation, as well as the overall structure of our executive compensation program. The compensation of our “named executive officers,” who are identified above, is comprised of a mix of base salary, short-term incentive compensation and long-term incentive compensation and is influenced by both the named executive officer’s individual performance and the Company’s overall performance. The composition of our named executive officers’ compensation is determined based on the consideration of a number of factors described in more detail below, including a periodic review of relevant comparative market information and alignment of strategic and tactical objectives agreed upon by the board.
The Compensation Committee believes that the application of its collective experiences and judgment is as important to excellence in compensation as the use of data and formulae, and the Company’s compensation policies and practices as described herein reflect this belief. Market data provides an important tool for analysis and decision-making; however, the Compensation Committee also gives consideration and emphasis to an individual’s personal contributions to the organization, as well as his or her skill sets, qualifications and experience. We also value and seek to reward performance that develops talent within the Company, embraces the sense of innovation that distinguishes the Company and demonstrates the qualities of imagination and drive that enables a Company executive to resolve longer-term challenges, or important new issues. These and similar qualities and attributes are not easily correlated to typical compensation data, but also deserve and are given consideration and weight in reaching compensation decisions.
Under our executive compensation program, as an executive officer’s level of responsibility increases with his or her relative ability to impact the long-term performance of the Company as a whole, a greater portion of that executive officer’s compensation is based on performance-based incentive compensation, a greater portion is based on long-term incentive compensation, and a lesser portion is based on base salary, thereby creating the potential for greater variability in the executive officer’s compensation level from year to year and a strong alignment with stakeholder interests. The mix, level, and weighting of various metrics and structure of the components of compensation generally reflect the executive officer’s role and relative impact on business results as well as competitive market practices.
Our 2023 performance, including our 2023 performance relative to our peers, along with the individual performance of our named executive officers, including their contributions toward the achievements outlined below, served as key factors in determining compensation for 2023.
2024 Proxy Statement |
| 68 |
Executive Compensation
Executive Compensation Decision-Making Process
Roles and Responsibilities
Compensation Committee | Compensation Consultants | Management |
Our Compensation Committee is composed entirely of independent directors and is responsible for developing and administering compensation programs for: (1) our directors, (2) executive officers, including base salaries and short-term and long-term incentive compensation plans, and (3) all long-term incentive compensation plans for our associates. The board meets each year in executive session to discuss the individual director’s evaluation of the CEO. After the board meets, the members of the Compensation Committee meet each year in executive session, without the CEO present, to evaluate the performance of our CEO. When evaluating the performance of our CEO, the Compensation Committee considers, among other materials, evaluations of our CEO that are provided by the members of the board. Our CEO makes recommendations to, and consults with, the Compensation Committee with respect to the compensation for the executive officers who report directly to our CEO. The Compensation Committee, in consultation with our CEO, each year sets the compensation for these executive officers and approves salary ranges for other executive officers. | The Compensation Committee has the sole authority to retain and terminate any compensation consultants to be used to assist in establishing compensation for our executive officers and to approve such consultants’ fees and other retention terms. The Compensation Committee selected FPL to serve as the Compensation Committee’s independent compensation consultant for 2023. FPL reports directly to the Compensation Committee and the Compensation Committee is free to replace FPL or to hire additional consultants from time to time. FPL does not have any conflict of interest with the Company, the members of the Compensation Committee or our executive officers. As part of its engagement, FPL provided the Compensation Committee and our CEO with, among other things, analyses regarding market pay and composition of pay, which the Compensation Committee considered as part of its analysis of the compensation of our named executive officers. In addition, FPL reviewed the competitiveness of the pay levels of our named executive officers against pay levels for the diversified public REIT peer group. FPL also assists the Compensation Committee with respect to director compensation. | Members of executive management make suggestions to our Compensation Committee regarding performance of associates below the named executive officer level as well as suggestions regarding compensation (including benefits) that may appeal to our associates to assist the Compensation Committee. |
Consideration of Market Data
Consistent with the Company’s goal to provide compensation that remains competitive, the Compensation Committee considers the executive compensation practices of companies in a peer group selected in consultation with FPL as one of several factors used in setting compensation. The Compensation Committee does not target a specific percentile range within the peer group when determining a named executive officer’s compensation. Instead, the Compensation Committee uses the market data provided by the peer group as one of several reference points useful for determining the form and amount of compensation.
The Compensation Committee reviews the peer group annually. The companies comprising the peer group must be publicly traded REITs based in the United States and of a size and equity market capitalization that are comparable to UDR.
2024 Proxy Statement |
| 69 |
Executive Compensation
For 2023, the peer group, which we refer to herein as either the “diversified public REIT peer group” or the “peer group,” included the companies listed in the table below. The companies listed below consist of six apartment REITs and nine comparably-sized REITs in other property sectors, recognizing that UDR competes with all REITs for executive talent and capital. For 2023, American Campus Communities, Realty Income and SL Green were removed from the peer group and American Homes 4 Rent and Boston Properties were added because of market capitalization changes, privatization, and sector alignment.
|
| Equity Market |
|
|
| ||||||||
Capitalization | Enterprise Value | 2023 Fiscal | |||||||||||
December 31, | December 31, | Year End | NAREIT | ||||||||||
NYSE | 2023(1) | 2023(1) | Total Assets | Property | |||||||||
Peer Group Company | Symbol | (In millions) | (In millions) | (In millions) | Sector | ||||||||
American Homes 4 Rent |
| AMH | $ | 13,737 | $ | 17,888 | $ | 12,688 |
| Residential | |||
Apartment Income REIT Inc. |
| AIRC | $ | 5,491 | $ | 8,488 | $ | 6,135 |
| Apartments | |||
AvalonBay Communities Inc. |
| AVB | $ | 26,624 | $ | 34,080 | $ | 20,678 |
| Apartments | |||
Boston Properties | BXP | $ | 13,254 | $ | 27,880 | $ | 26,026 | Office | |||||
Camden Property Trust |
| CPT | $ | 10,864 | $ | 14,501 | $ | 9,384 |
| Apartments | |||
Equity Residential |
| EQR | $ | 23,652 | $ | 31,443 | $ | 20,035 |
| Apartments | |||
Essex Property Trust, Inc. |
| ESS | $ | 16,119 | $ | 21,989 | $ | 12,361 |
| Apartments | |||
Extra Space Storage |
| EXR | $ | 32,347 | $ | 43,325 | $ | 27,456 |
| Storage | |||
Healthpeak Properties, Inc. |
| PEAK | $ | 11,413 | $ | 18,302 | $ | 15,699 |
| Healthcare | |||
Invitation Homes Inc. |
| INVH | $ | 20,963 | $ | 28,546 | $ | 19,221 |
| Residential | |||
Medical Properties Trust |
| MPW | $ | 2,940 | $ | 12,757 | $ | 18,305 |
| Healthcare | |||
Mid-America Apartment Communities, Inc. |
| MAA | $ | 15,880 | $ | 20,126 | $ | 11,485 |
| Apartments | |||
Sun Communities, Inc. |
| SUI | $ | 16,906 | $ | 24,685 | $ | 16,941 |
| Residential | |||
Vornado Realty Trust |
| VNO | $ | 6,182 | $ | 15,138 | $ | 16,188 |
| Office | |||
Peer Average | $ | 15,455 | $ | 22,796 | $ | 16,614 |
|
| |||||
Peer Median | $ | 14,808 | $ | 21,058 | $ | 16,564 |
|
| |||||
UDR | $ | 13,648 | $ | 19,899 | $ | 11,373 |
|
| |||||
UDR Rank (out of 15) |
| 9 |
| 9 |
| 13 |
|
| |||||
| (1) | Equity Market Capitalization and Enterprise Value based upon data from BMO Capital Markets as of December 31, 2023, except for UDR which is calculated internally. |
Advisory Vote on Executive Compensation
At the 2023 annual meeting of shareholders, the shareholders approved, on an advisory basis, the compensation of our named executive officers, as disclosed pursuant to the compensation disclosure rules of the SEC, with 85.89% of votes cast voted in favor of the resolution. The Compensation Committee reviewed the final vote results for that resolution and the input we received from shareholder engagement, and as described above we have made changes to our executive compensation policies. While the vote on the compensation of our named executive officers is advisory, and therefore not binding on the Company, our board and our Compensation Committee value the opinions of our shareholders and, to the extent there is any significant vote against the named executive officer compensation, we will consider our shareholders’ concerns and the Compensation Committee will evaluate whether any actions are necessary to address those concerns. As described above, we also make changes to our compensation programs based on stakeholder feedback received other than through the vote on compensation. At our 2023 annual meeting, we conducted an advisory vote on the frequency of our advisory votes on executive compensation. Through that vote, our shareholders expressed a preference for an annual advisory vote on executive compensation, with 98.3% of votes cast in favor of an annual advisory vote on executive compensation. We have determined that our shareholders should cast an advisory vote on the compensation of our named executive officers on an annual basis. Accordingly, our board recommends that you vote “FOR” Proposal No. 2 at the annual meeting. For more information, see “Proposal No. 2 Advisory Vote on Executive Compensation”.
2024 Proxy Statement |
| 70 |
Executive Compensation
Consideration of Risk
The Compensation Committee is aware of the consequences to companies that have not appropriately balanced risk and reward in executive compensation. The Compensation Committee believes that the emphasis on long-term performance in the Amended and Restated 1999 Long Term Incentive Plan, as amended and restated February 19, 2024 (the “1999 Plan”) results in an overall compensation program that does not reward excessive risk-taking for the Company. The Company’s compensation strategy is intended to mitigate risk by emphasizing long-term compensation and financial performance measures correlated with growing shareholder value rather than rewarding shorter performance and payout periods.
Our Compensation Committee believes that our executive incentive compensation arrangements do not encourage our executives to take unnecessary or excessive risks that could threaten the value of our Company. While performance-based compensation constitutes a significant percentage of our executives’ overall total compensation and thereby the Compensation Committee believes motivates our executives to help fulfill our corporate mission and vision, including specific and focused Company performance objectives, the non-performance based compensation, for most executives for most years, is also a sufficiently high percentage of overall total compensation that the Compensation Committee does not believe that unnecessary or excessive risk taking is encouraged by the performance-based compensation. In addition, a significant portion of executive’s performance-based compensation is in the form of long-term equity incentives, which do not encourage unnecessary or excessive risk because they generally are performance-based and are earned over a multiple-year period of time, thereby focusing the executives on our Company’s long-term interests. In order to align the interests of our executive officers with the interests of our shareholders, each of our executive officers is required to comply with our Executive Stock Ownership Guidelines. Further, the Compensation Committee has adopted the Recoupment Policy as a means of discouraging unnecessary or excessive risk taking.
Design and Structure of 2023 Executive Compensation
CEO and Other NEO Compensation Mix
Consistent with our variable pay-for-performance philosophy, the compensation mix for our CEO and the other named executive officers in 2023 placed a high emphasis on performance-based incentive compensation as demonstrated in the graphics below showing the breakdown of our CEO’s compensation and that of our named executive officers, excluding the CEO, across base salary, short-term incentive compensation and long-term incentive compensation and amounts paid or payable in cash or in equity.
Composition of Compensation


2024 Proxy Statement |
| 71 |
Executive Compensation
Base Salaries
The base salaries for 2023 for Messrs. Toomey and Alcock were not changed from 2022, the base salary for Mr. Fisher was increased by 9% and the base salary for Mr. Lacy was increased by 22%. These increases reflect the growth in each individual’s influence, responsibilities, and contributions to our business.
| 2022 |
| 2023 |
| % change | ||||
Thomas W. Toomey | $ | 900,000 | $ | 900,000 | — | % | |||
Joseph D. Fisher | $ | 550,000 | $ | 600,000 | 9 | % | |||
Harry G. Alcock | $ | 550,000 | $ | 550,000 | — | % | |||
Michael D. Lacy | $ | 450,000 | $ | 550,000 | 22 | % | |||
Short-Term Incentive Compensation
2023 Short-Term Incentive Compensation
Performance Metrics | Definition | How Our Performance Metrics | ||
FFO as Adjusted | An absolute measure of our FFOA per share for the performance period measured against a pre-determined range | Increasing FFOA per share should drive increases in our dividend and TSR and thus provide value to our shareholders. Success in execution of each of our strategic objectives will drive increases in FFOA per share | ||
Transactions Index | An index consisting of two metrics; transaction volume measured as the sum of total acquisitions of operating assets and development land, development and redevelopment spend, new developer capital program commitments, dispositions and equity issuances and stock buy-backs versus the total transactions budget for the year weighted at 60% and net operating income during the year from non-mature assets acquired in 2022 and developments delivered in 2022 versus budget weighted at 40% | Each transaction we enter into is designed to drive FFOA per share accretion as well as expand, improve and diversify our portfolio - increasing our portfolio diversification and expand our cash flow | ||
Operations Index | An index consisting of weighted metrics – same store wins (the percentage of markets in which our revenue is at or above the median of our apartment peers who are in the market), 25%, same-store revenue growth versus our apartment peers, 50%, and same-store expense growth rank versus our apartment peers, 25%. | Drives our strategic objective of operational excellence as well as financial results | ||
GRESB Percentile | Our GRESB score relative to the GRESB scores of the entities within the GRESB Residential/Listed Company population. | Drives performance with respect to our culture and our ESG strategic objectives and benefits all stakeholders | ||
Associate Engagement & DEI | Calculated by the “Overall Health of the Workforce” score made up of ten components including exit and stay interview results, customer loyalty and satisfaction test, associate turnover and retention, “Rooney Rule” compliance throughout the company, results of associate engagement surveys and associate performance evaluation results | Drives performance with respect to our culture while creating a feedback loop that supports positive outcomes for our residents and associates | ||
Subjective Determination | Determined by the Compensation Committee based on achievement of performance goals for each executive set before the beginning of the year and the performance of the specific executive. | Drives performance with respect to individualized goals for each executive chosen to support specific outcomes designed to benefit our business and, thus, our stakeholders. |
2024 Proxy Statement |
| 72 |
Executive Compensation
Our short-term incentive compensation awards for 2023 were based on pre-determined weightings between Company performance and individual performance. Company performance (as measured by the applicable metrics) was weighted more heavily (70%) than individual performance (30%) and the metrics applied to each named executive were based on the extent to which a particular named executive officer has responsibility for, and influence over, the overall performance of the Company. As discussed above, each of the metrics in our short-term incentive program is intended to incentivize performance that drives one or more of our core strategic objectives and, in turn, create long term value while at the same time simplifying the program. With respect to the 30% of the short-term compensation awards based on individual performance, such awards, while subject to the discretion of the Compensation Committee, are based on the achievement of performance goals set for each named executive prior to the beginning of the year based on individual roles.
2023 Results
The Company’s 2023 performance, as measured by the performance metrics utilized for determining short-term incentive compensation for the named executive officers, was as follows:
Performance | Threshold | Target | Maximum | Performance | Performance | ||||||||||
FFO as Adjusted | Actual: $2.47 | â | 70% | ||||||||||||
$2.45 | $2.50 | $2.55 | |||||||||||||
Transactions | Actual: 120% | á | 120% | ||||||||||||
50% | 100% | 200% | |||||||||||||
Operations | |||||||||||||||
Actual: 133% | á | 133% | |||||||||||||
50% | 100% | 200% | |||||||||||||
GRESB Percentile | |||||||||||||||
Actual: 20% | á | 200% | |||||||||||||
50% | 33% | 20% | |||||||||||||
Associate | Actual: 4.28 | á | 200% | ||||||||||||
3.5 50% | 3.8 100% | 4.1 200% | |||||||||||||
The table below sets forth the percentage each of the STI metrics is weighted when determining the portion of short-term incentive compensation for each of our named executive officers, determined by reference to the objective Company metrics. Each percentage is determined by the Compensation Committee prior to the beginning of the performance period taking into account the influence each executive has with respect to performance of each metric.
| Mr. Toomey |
| Mr. Fisher |
| Mr. Alcock |
| Mr. Lacy |
| |
FFOA as Adjusted per share |
| 30 | % | 30 | % | 30 | % | 30 | % |
Transactions Index |
| 15 | % | 15 | % | 40 | % | 10 | % |
Operations Index |
| 35 | % | 35 | % | 10 | % | 40 | % |
GRESB Percentile |
| 10 | % | 10 | % | 10 | % | 10 | % |
Associate Engagement & DEI |
| 10 | % | 10 | % | 10 | % | 10 | % |
2024 Proxy Statement |
| 73 |
Executive Compensation
NEO Short-Term Incentive Compensation Decisions
Thomas W. Toomey | |||||
| In evaluating Mr. Toomey’s 2023 compensation, the Compensation Committee considered Mr. Toomey’s accomplishment of these goals. | ||||
Company | + | Individual | = | Pay | |
In February 2024, the Compensation Committee awarded Mr. Toomey short-term incentive compensation in the amount of $2,897,375 for fiscal 2023, based on the Company’s performance against the annual performance metrics and his individual performance. Of the total amount, $1,847,375 was attributable to the Company’s performance against the annual performance metrics and the remainder was attributable to Mr. Toomey’s individual performance. In October 2022, Mr. Toomey elected to receive 100% of his short-term incentive compensation for 2023 in Class 2 Performance LTIP Units. | |||||
The Compensation Committee established the following range for Mr. Toomey’s 2023 short-term incentive compensation:
| Threshold |
| Target |
| Maximum | ||||
Components |
|
|
|
|
|
| |||
Company (70%) | $ | 735,000 | $ | 1,470,000 | $ | 2,940,000 | |||
Individual (30%) | $ | 315,000 | $ | 630,000 | $ | 1,260,000 | |||
Total | $ | 1,050,000 | $ | 2,100,000 | $ | 4,200,000 | |||
| ● | with 70% based on the Company’s performance as measured by all of the annual performance metrics that were weighted as described above, and |
| ● | the remaining 30% based on his individual performance against the board-approved leadership competencies and key performance objectives. |
The Compensation Committee determined that the above-referenced amounts were consistent with the target short-term incentive compensation as a percentage of overall compensation for the CEO position, and these amounts provide a market competitive level of compensation for the CEO. The Compensation Committee also made a subjective determination that these amounts were appropriate to motivate Mr. Toomey to achieve short-term Company and individual goals and to help ensure Mr. Toomey’s continued service with the Company.
Mr. Toomey’s individual goals for 2023, which were factored into the 30% of the award based on individual performance, were as follows:
| ● | set the vision for the Company, |
| ● | strategic planning, |
| ● | leadership of the Company, |
| ● | board relations, |
| ● | refine, enhance and execute on the Business Plan and strategic vision, |
| ● | responding to a changing market, |
| ● | communication, |
| ● | resolving areas for which the board requests further discussion and analysis, and |
| ● | management team development and succession. |
Results
Components |
| ||
Company (70%) | $ | 1,847,375 | |
Individual (30%) | $ | 1,050,000 | |
Total | $ | 2,897,375 |
2024 Proxy Statement |
| 74 |
Executive Compensation
Joseph D. Fisher | |||||
| In evaluating Mr. Fisher’s 2023 compensation, the Compensation Committee considered Mr. Fisher’s accomplishment of these goals. | ||||
Company | + | Individual | = | Pay | |
In February 2024, the Compensation Committee awarded Mr. Fisher short-term incentive compensation in the total amount of $2,207,513 for fiscal 2023, based on the Company’s performance against the annual performance metrics, and his individual performance. Of the total amount, $1,407,513 was attributable to the Company’s performance against the annual performance metrics and the remainder was attributable to Mr. Fisher’s individual performance. In October 2022, Mr. Fisher elected to receive 100% of his short-term incentive compensation for 2023 in Class 2 Performance LTIP Units. | |||||
The Compensation Committee established a range for Mr. Fisher’s 2023 short-term incentive compensation as follows:
| Threshold |
| Target |
| Maximum | ||||
Components |
|
|
|
|
|
| |||
Company (70%) | $ | 560,000 | $ | 1,120,000 | $ | 2,240,000 | |||
Individual (30%) | $ | 240,000 | $ | 480,000 | $ | 960,000 | |||
Total | $ | 800,000 | $ | 1,600,000 | $ | 3,200,000 | |||
| ● | with 70% based on the Company’s performance as measured by the all of the annual performance metrics that were weighted as described above, and |
| ● | 30% based on his individual performance. |
The Compensation Committee, in consultation with our CEO, determined that these amounts were consistent with the target short-term incentive compensation as a percentage of overall compensation for the President – Chief Financial Officer position, and these amounts provide a market competitive level of compensation for the President – Chief Financial Officer. The Compensation Committee, in consultation with our CEO, also made a subjective determination that these amounts were appropriate to motivate Mr. Fisher to achieve short-term Company and individual goals and to help ensure Mr. Fisher’s continued service with the Company.
The Compensation Committee, in consultation with our CEO, considered Mr. Fisher’s individual performance in 2023 in part based on the accomplishment of his specific goals that included:
| ● | management of accounting and tax functions, |
| ● | management of investor relations function, |
| ● | financial planning and analysis, |
| ● | assist in debt and treasury initiatives, |
| ● | oversight of human capital and our ESG efforts |
| ● | provide assistance to support functional execution of the Business Plan, |
| ● | examine and present options for the Company with respect to portfolio strategy and treasury initiatives, |
| ● | assist with board materials, and |
| ● | review and monitor technology investments. |
Results
Components |
|
| |
Company (70%) | $ | 1,407,513 | |
Individual (30%) | $ | 800,000 | |
Total | $ | 2,207,513 |
2024 Proxy Statement |
| 75 |
Executive Compensation
Harry G. Alcock | |||||
| In evaluating Mr. Alcock’s 2023 compensation, the Compensation Committee considered Mr. Alcock’s accomplishment of these goals. | ||||
Company | + | Individual | = | Pay | |
In February 2024, the Compensation Committee awarded Mr. Alcock short-term incentive compensation in the total amount of $1,609,285 for fiscal 2023, based on the Company’s performance against the annual performance metrics, and his individual performance. Of the total amount, $1,113,285 was attributable to the Company’s performance against the annual performance metrics and the remainder was attributable to Mr. Alcock’s individual performance. In October 2022, Mr. Alcock elected to receive 50% of his short-term incentive compensation for 2023 in Class 2 Performance LTIP Units, 25% in Class 2 LTIP Units and 25% in cash. | |||||
The Compensation Committee established a range for Mr. Alcock’s 2023 short-term incentive compensation, as follows:
| Threshold |
| Target |
| Maximum | ||||
Components |
|
|
|
|
|
| |||
Company (70%) | $ | 455,000 | $ | 910,000 | $ | 1,820,000 | |||
Individual (30%) | $ | 195,000 | $ | 390,000 | $ | 780,000 | |||
Total | $ | 650,000 | $ | 1,300,000 | $ | 2,600,000 | |||
| ● | with 70% based on the Company’s performance as measured by all of the annual performance metrics that were weighted as described above, and |
| ● | 30% based on his individual performance. |
The Compensation Committee, in consultation with our CEO, determined that these amounts were consistent with the target short-term incentive compensation as a percentage of overall compensation for the Senior Vice President – Chief Investment Officer position, and these amounts provide a market competitive level of compensation for the Senior Vice President – Chief Investment Officer. The Compensation Committee, in consultation with our CEO, also made a subjective determination that these amounts were appropriate to motivate Mr. Alcock to achieve short-term Company and individual goals and to help ensure Mr. Alcock’s continued service with the Company.
The Compensation Committee, in consultation with our CEO, considered Mr. Alcock’s individual performance in 2023 in part based on the accomplishment of his specific goals that included:
| ● | enhancing the portfolio through sales and acquisitions, |
| ● | addressing asset quality through redevelopment and asset quality initiatives, and |
| ● | strengthening the Company’s portfolio through development. |
Results
Components |
|
| |
Company (70%) | $ | 1,113,285 | |
Individual (30%) | $ | 496,000 | |
Total | $ | 1,609,285 |
2024 Proxy Statement |
| 76 |
Executive Compensation
Michael D. Lacy | |||||
| In evaluating Mr. Lacy’s 2023 compensation, the Compensation Committee considered Mr. Lacy’s accomplishment of these goals. | ||||
Company | + | Individual | = | Pay | |
In February 2024, the Compensation Committee awarded Mr. Lacy short-term incentive compensation in the total amount of $1,484,297 for fiscal 2023, based on the Company’s performance against the annual performance metrics, and his individual performance. Of the total amount, $884,297 was attributable to the Company’s performance against the annual performance metrics and the remainder was attributable to Mr. Lacy’s individual performance. In October 2022, Mr. Lacy elected to receive 30% of his short-term incentive compensation for 2023 in cash and 70% in Class 2 LTIP Units. | |||||
The Compensation Committee established a range for Mr. Lacy’s 2023 short-term incentive compensation as follows:
| Threshold |
| Target |
| Maximum | ||||
Components |
|
|
|
|
|
| |||
Company (70%) | $ | 350,000 | $ | 700,000 | $ | 1,400,000 | |||
Individual (30%) | $ | 150,000 | $ | 300,000 | $ | 600,000 | |||
Total | $ | 500,000 | $ | 1,000,000 | $ | 2,000,000 | |||
| ● | with 70% based on the Company’s performance as measured by all of the annual performance metrics that were weighted as described above, and |
| ● | 30% based on his individual performance. |
The Compensation Committee, in consultation with our CEO, determined that these amounts were consistent with the target short-term incentive compensation as a percentage of overall compensation for the Senior Vice President – Property Operations position, and these amounts provide a market competitive level of compensation for the Senior Vice President – Property Operations. The Compensation Committee, in consultation with our CEO, also made a subjective determination that these amounts were appropriate to motivate Mr. Lacy to achieve short-term Company and individual goals and to help ensure Mr. Lacy’s continued service with the Company.
The Compensation Committee, in consultation with our CEO, considered Mr. Lacy’s individual performance in 2023 in part based on the accomplishment of his specific goals that included:
| ● | manage operations to budget, |
| ● | participate in innovation efforts, and |
| ● | participate in investor relations efforts. |
Results
Components |
|
| |
Company (70%) | $ | 884,297 | |
Individual (30%) | $ | 600,000 | |
Total | $ | 1,484,297 |
2024 Proxy Statement |
| 77 |
Executive Compensation
2024 Short-Term Incentive Compensation
In December 2023, the Compensation Committee also approved a new short-term incentive program for 2024 and in October 2023, Messrs. Toomey and Fisher elected to receive 100% of their short-term incentive compensation, to the extent earned, in Class 2 LTIP Units, Mr. Alcock elected to receive 75% in Class 2 LTIP Units and 25% in cash, and Mr. Lacy elected to receive 70% in Class 2 LTIP Units and 30% in cash.
For each named executive officer, 70% will be based on company performance measured by the metrics and with the weightings set forth below and 30% of the STI award will be based on the Compensation Committee’s determination of such executive’s performance. The weightings for each executive officer for each metric differ based on the role of the executive officer and are set by the Compensation Committee.
The metrics and weightings used for the 2024 STI Program will be as follows:
Metric | Weightings | |||
Mr. Toomey | Mr. Fisher | Mr. Alcock | Mr. Lacy | |
FFO as Adjusted per share | 30% | 30% | 30% | 30% |
Transactions Index | 15% | 15% | 40% | 10% |
Operations Index | 35% | 35% | 10% | 40% |
GRESB Percentile | 10% | 10% | 10% | 10% |
Associate Engagement & DEI | 10% | 10% | 10% | 10% |
Long-Term Incentive Compensation
Long-term incentive compensation, 100% consisting of equity awards including restricted stock units, stock options and/or Class 2 LTIP Units (including Class 2 Performance LTIP Units), constitute the most significant component of our executive officers’ compensation, which closely aligns their long-term interests with the long-term interests of our shareholders, while mitigating potential risks related to our compensation programs. Both LTIP Units and Performance LTIP Units structurally encourage long-term holding by the participant, further aligning the interests of management with the creation of shareholder value over time. The following table shows characteristics of LTIP Units and Performance LTIP Units.
LTIP Unit | Performance LTIP Unit |
Class of partnership interest in our Operating Partnership called “LTIP Units” | Class of partnership interest in our Operating Partnership called “Performance LTIP Units” |
Qualify as “profit interest” for federal tax purposes. | Qualify as “profit interest” for federal tax purposes. |
Not economically equivalent to a share of our common stock at grant. | Not economically equivalent to a share of our common stock at grant. |
Over time can increase in value to equal the value of common stock based on satisfaction of provisions of partnership tax rules. | In order for Performance LTIP Units to have value to the holder, the price of our common stock on the date of conversion of the Performance LTIP Unit has to exceed the price of our common stock as of the date of grant. |
Once vested, convertible to OP Units provided LTIP Unit has been outstanding for 2 years from grant. OP Units are, subject to the terms of the partnership agreement for the Operating Partnership, redeemable for common stock. | Once vested, convertible to LTIP Units. |
During performance period, distributions equal to 10% of regular distributions paid on OP Units. | During performance period, distributions equal to 2% of regular distributions paid on OP Units. |
After LTIP Units vest, they are entitled to distributions, regular and special, equal to distributions paid on OP Units. | No change in distributions until converted to LTIP Units. |
2024 Proxy Statement |
| 78 |
Executive Compensation
The Class 2 LTIP Units and Class 2 Performance LTIP Units are granted at maximum, and will vest only to the extent that pre-established performance metrics are met for the applicable performance period, subject to continuing employment. Consistent with the treatment of other equity awards under the 1999 Plan, upon a Class 2 LTIP Unit or Class 2 Performance LTIP Unit holder’s death or disability during his or her employment, or in the event of a change of control, if accompanied by a loss of employment without cause or for good reason, all restrictions on outstanding awards shall lapse; otherwise, vesting shall cease upon the date that employment is terminated. Holders of Class 2 LTIP Units and Class 2 Performance LTIP Units have the same voting rights as limited partners holding OP Units in the Operating Partnership, with such units voting together as a single class with the holders of OP Units and having one vote per unit.
2023 Long-Term Incentive Compensation
The 2023 LTI program award opportunity for the 3-year performance period, which commenced in 2023, includes four performance metrics, as follows: (i) 35% of the award opportunity has a metric measured by the Company’s 3-year relative cumulative TSR performance versus the Apartment Peers and will vest on the date the Compensation Committee determines performance in February of 2026; (ii) 20% of the award opportunity has a metric measured by the Company’s 3-Year relative cumulative TSR performance versus the NAREIT Equity REITs Total Return Index and will vest on the date the Compensation Committee determines performance in February of 2026; (iii) 15% of the award opportunity has a metric measured by the Company’s 3-year relative cumulative FFO as Adjusted growth rate versus the Apartment Peers and will vest on the date the Compensation Committee determines performance in February of 2026; and (iv) 30% of the award opportunity has an FFO as Adjusted performance period of 1-year with one-half vested in February 2024 and one-half vesting in February 2025.
Performance Metrics |
| Definition |
| How Our Performance Metrics Are Tied to |
3-Year Relative Cumulative TSR vs. Apartment Peers | The relative spread of our TSR against the weighted average of the TSRs of our apartment peers | Each of these metrics: ● measures our financial performance on either an absolute basis or relative to our peers; ● is driven by achievement in all five of our strategic objectives; and ● supports long-term value creation and TSR for our shareholders. | ||
3-Year Relative Cumulative TSR vs. NAREIT Equity REITs Total | The relative spread of our TSR against the TSR for the NAREIT Equity REIT Total Return Index | |||
3-Year Relative Cumulative FFO | The relative spread of our cumulative three-year FFOA growth rate against the weighted average FFOA growth rate for our apartment peers | |||
1-Year FFO as | An absolute measure of our FFOA measured against a pre-determined range |
2024 Proxy Statement |
| 79 |
Executive Compensation
In December 2022, the Compensation Committee approved a new long-term incentive program for 2023.
The metrics used for the 2023 LTI Program were as follows:
Performance | Weighting | Threshold | Maximum | Maximum | Payout % | |||||||||
Actual: TBD | ||||||||||||||
3-Year Relative Cumulative | ||||||||||||||
35% | TBD | |||||||||||||
-900 bps to | Wavg TSR | +900 bps to | ||||||||||||
Actual: TBD | ||||||||||||||
3-Year Relative Cumulative | ||||||||||||||
20% | TBD | |||||||||||||
-900 bps to | Index Return | +900 bps to | ||||||||||||
Actual: TBD | ||||||||||||||
3-Year Relative Cumulative | ||||||||||||||
15% | TBD | |||||||||||||
-900 bps to | Wavg | +900 bps to | ||||||||||||
Actual: $2.47 | ||||||||||||||
1-Year FFO as Adjusted | ||||||||||||||
30% | 70% | |||||||||||||
$2.45 | $2.50 | $2.55 | ||||||||||||
Each of Messrs. Toomey and Fisher elected to receive their awards for the 2023 LTI Program in the form of Class 2 Performance LTIP Units, Mr. Alcock elected to receive his award for the 2023 LTI Program in the form of Class 2 LTIP Units for 25% of the award and Class 2 Performance LTIP Units for 75% of the award, and Mr. Lacy elected to receive his award for the 2023 LTI Program in the form of Class 2 LTIP Units.
The 2023 LTI Program awards were granted to Messrs. Toomey, Alcock, Fisher and Lacy, in the following amounts (the actual results with respect to the 3-Year metrics will be determined in February of 2026):
Total 2023 Long-Term Incentive Program Awards | ||||||||||||
| Threshold |
| Target |
| Maximum |
| Actual Amount | |||||
Mr. Toomey |
| $ | 3,500,000 | $ | 7,000,000 | $ | 14,000,000 | TBD | ||||
Mr. Fisher | $ | 1,075,000 | $ | 2,150,000 | $ | 4,300,000 | TBD | |||||
Mr. Alcock | $ | 750,000 | $ | 1,500,000 | $ | 3,000,000 | TBD | |||||
Mr. Lacy | $ | 625,000 | $ | 1,250,000 | $ | 2,500,000 | TBD | |||||
3-Year Relative Cumulative TSR vs. Apartment Peers (35% of 2023 LTI Program Award) | ||||||||||||
| Threshold |
| Target |
| Maximum |
| Actual Amount | |||||
Mr. Toomey |
| $ | 1,225,000 | $ | 2,450,000 | $ | 4,900,000 | TBD | ||||
Mr. Fisher | $ | 376,250 | $ | 752,500 | $ | 1,505,000 | TBD | |||||
Mr. Alcock | $ | 262,500 | $ | 525,000 | $ | 1,050,000 | TBD | |||||
Mr. Lacy | $ | 218,750 | $ | 437,500 | $ | 875,000 | TBD | |||||
3-Year Relative Cumulative TSR Rank vs. NAREIT Equity REITs (20% of 2023 LTI Program Award) | ||||||||||||
| Threshold |
| Target |
| Maximum |
| Actual Amount | |||||
Mr. Toomey |
| $ | 700,000 | $ | 1,400,000 | $ | 2,800,000 | TBD | ||||
Mr. Fisher | $ | 215,000 | $ | 430,000 | $ | 860,000 | TBD | |||||
Mr. Alcock | $ | 150,000 | $ | 300,000 | $ | 600,000 | TBD | |||||
Mr. Lacy | $ | 125,000 | $ | 250,000 | $ | 500,000 | TBD | |||||
2024 Proxy Statement |
| 80 |
Executive Compensation
3-Year Relative Cumulative FFO as Adjusted Growth Rate vs. Apartment Peers (15% of 2023 LTI Program Award) | ||||||||||||
| Threshold |
| Target |
| Maximum |
| Actual Amount | |||||
Mr. Toomey |
| $ | 525,000 | $ | 1,050,000 | $ | 2,100,000 | TBD | ||||
Mr. Fisher | $ | 161,250 | $ | 322,500 | $ | 645,000 | TBD | |||||
Mr. Alcock | $ | 112,500 | $ | 225,000 | $ | 450,000 | TBD | |||||
Mr. Lacy | $ | 93,750 | $ | 187,500 | $ | 375,000 | TBD | |||||
1-Year FFO as Adjusted (30% of 2023 LTI Program Award) | ||||||||||||
| Threshold |
| Target |
| Maximum |
| Actual Amount | |||||
Mr. Toomey |
| $ | 1,050,000 | $ | 2,100,000 | $ | 4,200,000 | $ | 1,470,000 | |||
Mr. Fisher | $ | 322,500 | $ | 645,000 | $ | 1,290,000 | $ | 452,000 | ||||
Mr. Alcock | $ | 225,000 | $ | 450,000 | $ | 900,000 | $ | 315,000 | ||||
Mr. Lacy | $ | 187,500 | $ | 375,000 | $ | 750,000 | $ | 263,000 | ||||
2024 Proxy Statement |
| 81 |
Executive Compensation
Timeline of the LTIP
Following is a timeline showing the timing of various events with respect to the 2021, 2022 and 2023 LTI Programs.
2021 | 2022 | 2023 | 2024 | 2025 | 2026 | |||||||
2021 LTIP Performance Period (2021-2023) | ||||||||||||
3-Year Relative Cumulative TSR vs. Apartment Peers (35%) | Vested: | |||||||||||
3-Year Relative Cumulative TSR vs. NAREIT Equity REITs Total Return Index (20%) | Vested: | |||||||||||
3-Year Relative Cumulative FFO as Adjusted Growth Rate vs. Apartment Peers(15%) | Vested: | |||||||||||
1/2 vested | 1/2 vested: | |||||||||||
1-Year FFO as Adjusted (30%) | ||||||||||||
2022 LTIP Performance Period (2022-2024) | ||||||||||||
3-Year Relative Cumulative TSR vs. Apartment Peers (35%) | Vests: | |||||||||||
3-Year Relative Cumulative TSR vs. NAREIT Equity REITs Total Return Index (20%) | Vests: | |||||||||||
3-Year Relative Cumulative FFO as Adjusted Growth Rate vs. Apartment Peers(15%) | Vests: | |||||||||||
1/2 vested: | 1/2 vested: | |||||||||||
1-Year FFO as Adjusted (30%) | ||||||||||||
2023 LTIP Performance Period (2023-2025) | ||||||||||||
3-Year Relative Cumulative TSR vs. Apartment Peers (35%) | Vests: | |||||||||||
3-Year Relative Cumulative TSR vs. NAREIT Equity REITs Total Return Index (20%) | Vests: | |||||||||||
3-Year Relative Cumulative FFO as Adjusted Growth Rate vs. Apartment Peers(15%) | Vests: | |||||||||||
1/2 vests: | 1/2 vests: | |||||||||||
1-Year FFO as Adjusted (30%) | ||||||||||||
2024 Proxy Statement |
| 82 |
Executive Compensation
2021 LTI Compensation
In December 2020, the Compensation Committee in consultation with a compensation consultant approved a new long-term incentive program for 2021. Under the terms of the 2021 LTI Program, our named executive officers were awarded restricted stock units, Class 2 Performance LTIP Units, or Class 2 LTIP Units with dividend equivalent rights with the number of units awarded based upon the achievement of specific performance objectives over the relevant performance period, and each of the awards were subject to specific vesting provisions that were based on the achievement of the applicable performance criteria. The 2021 LTI Program included a three-year relative TSR performance metric that was based on the Company’s TSR performance against that of our apartment peers, a three-year relative TSR performance metric that was based on the Company’s TSR performance against the NAREIT Equity REITs Total Return Index and a three-year relative FFO as Adjusted growth rate versus our apartment peers. The portion of the award that is earned contingent on the achievement of the three-year metrics cliff vested when measured and approved by the Compensation Committee following the conclusion of the performance period. In February 2024, the three-year metrics were measured and approved by the Compensation Committee.
The following table reflects the Company’s performance and the vested payout for the three-year metrics of the 2021 LTI Program grants:
Performance | Weighting | Threshold | Target | Maximum | Payout% | |||||
3-Year Relative Cumulative | 35% | Actual: -710 bps I | 61% | |||||||
-900 bps to | Wavg TSR | +600 bps to | ||||||||
3-Year Relative Cumulative | Actual: -1,560 bps | 0% | ||||||||
I | ||||||||||
20% | ||||||||||
-900 bps | Index Return | +900 bps | ||||||||
3-Year Relative Cumulative | 15% | Actual: -310 bps I | 83% | |||||||
-900 bps to | Wavg | +900 bps to | ||||||||
2021-2023 3-Year TSR vs. Apartment Peers (35% of 2021 LTI Program Award) | ||||||||||||
| Threshold |
| Target |
| Maximum |
| Actual Amount | |||||
Mr. Toomey |
| $ | 735,000 | $ | 1,470,000 | $ | 2,940,000 | $ | 890,000 | |||
Mr. Fisher | $ | 218,750 | $ | 437,500 | $ | 875,000 | $ | 265,000 | ||||
Mr. Alcock | $ | 218,750 | $ | 437,500 | $ | 875,000 | $ | 265,000 | ||||
Mr. Lacy | $ | 83,125 | $ | 166,250 | $ | 332,500 | $ | 101,000 | ||||
2021-2023 3-Year TSR vs. NAREIT (20% of 2021 LTI Program Award) | ||||||||||||
| Threshold |
| Target |
| Maximum |
| Actual Amount | |||||
Mr. Toomey |
| $ | 420,000 | $ | 840,000 | $ | 1,680,000 | $ | — | |||
Mr. Fisher | $ | 125,000 | $ | 250,000 | $ | 500,000 | $ | — | ||||
Mr. Alcock | $ | 125,000 | $ | 250,000 | $ | 500,000 | $ | — | ||||
Mr. Lacy | $ | 47,500 | $ | 95,000 | $ | 190,000 | $ | — | ||||
2024 Proxy Statement |
| 83 |
Executive Compensation
2021-2023 3-Year Relative Cumulative FFO as Adjusted Growth (15% of 2021 LTI Program Award) | ||||||||||||
| Threshold |
| Target |
| Maximum |
| Actual Amount | |||||
Mr. Toomey |
| $ | 315,000 | $ | 630,000 | $ | 1,260,000 | $ | 522,000 | |||
Mr. Fisher | $ | 93,750 | $ | 187,500 | $ | 375,000 | $ | 155,000 | ||||
Mr. Alcock | $ | 93,750 | $ | 187,500 | $ | 375,000 | $ | 155,000 | ||||
Mr. Lacy | $ | 35,625 | $ | 71,250 | $ | 142,500 | $ | 59,000 | ||||
2024 LTI Compensation
In December 2023, the Compensation Committee approved a new long-term incentive program for 2024.
The metrics used for the 2024 LTI Program are as follows with each metric having a payout percentage for 0%, if the threshold is not met, to 200%:
Performance Metrics |
| Weighting | |
3-Year Relative Cumulative TSR vs. NAREIT Equity REITs Total Return Index |
| 20 | % |
3-Year Relative Cumulative TSR vs. Apartment Peers | 35 | % | |
3-Year Relative Cumulative FFO as Adjusted Growth Rate vs. Apartment Peers | 15 | % | |
1-Year FFO as Adjusted per share | 30 | % |
The portions of the 2024 LTI awards based upon the 3-year relative apartment peer TSR metric, the 3-year relative NAREIT Equity Index TSR metric, and the 3-year relative cumulative FFO as Adjusted metric will vest on the date the Compensation Committee determines performance in February 2027. The portion of the 2024 LTI awards based upon the 1-year FFO as Adjusted metric will be measured in February 2025 and will vest 50% at such time and 50% on the one-year anniversary thereof.
2024 Proxy Statement |
| 84 |
Executive Compensation
Other Compensation
Retirement Plans
We have a retirement plan (the “401(k) Plan”), which is a defined contribution plan covering all eligible full-time employees. Under the 401(k) Plan, the Company makes discretionary profit sharing and matching contributions to the plan as approved by the Compensation Committee. Details regarding matching contributions for our named executive officers are set forth below under the Summary Compensation Table. UDR does not have a pension plan, a SERP, or any similar arrangements.
Perquisites and Other Benefits
The primary perquisites that we offer to our named executive officers are Company-paid health insurance (including dental) consistent with other associates, life insurance, long-term disability insurance, and accidental death and disability insurance. Our named executive officers participate in these benefit plans on the same terms as other employees. In addition to the group medical plans that we provide, we reimburse actual expenses for annual physical exams for our named executive officers. To help us attract and retain qualified personnel, we also offer relocation benefits, but these benefits are individually negotiated when they occur.
We review our policies with respect to perquisites on a regular basis to consider whether the perquisites should be maintained and whether, or to what extent, it may be appropriate for us to discontinue particular perquisites or to require repayment of the cost of perquisites. During 2023, we did not change our policies with respect to perquisites that we offer to our CEO and other named executive officers.
2023 AND 2024 Other Events
In November 2023, the Board accepted the forfeiture, for no consideration, of a performance-based supplemental equity award (the “Award”) for Mr. Toomey that was originally granted to Mr. Toomey in December of 2021. Also in November 2023, Mr. Toomey voluntarily forfeited such award.
The Compensation Committee and the Board approved the Award in December 2021, which would be earned only upon the achievement of absolute common stock price hurdles over a four-year measurement period commencing on December 5, 2022.
The Award consisted of Class 2 Performance LTIP Units with a value of $7,000,000 based on the closing price on December 6, 2021. The Class 2 Performance LTIP Units were granted at maximum and would be earned only to the extent that the pre-established common stock price hurdles were achieved during the performance period. The Class 2 Performance LTIP Units would, to the extent earned, vest subject to Mr. Toomey’s continuing employment, on the fifth anniversary of the date of grant.
Prior to the forfeiture, the pre-established common stock price hurdles specified in the Award had not been achieved, and the Board determined that the Award no longer served its principal objective of linking Mr. Toomey’s long-term compensation opportunity with significant long-term stockholder value creation thus incenting Mr. Toomey to continue to provide his services to the Company.
Although the supplemental award granted in 2021 no longer served its purpose as described above, the Board and the Compensation Committee continued to believe it is in the best interests of the Company to retain the services of Mr. Toomey. Accordingly, the Compensation Committee after consulting with third party advisors, negotiated an Executive Agreement that included market based compensation terms and severance entitlements, which prior to entering into the Executive Agreement Mr. Toomey was not entitled to, in order to help retain Mr. Toomey’s services.
In February 2024, the Company entered into the Executive Agreement with Mr. Toomey. The Executive Agreement provides certain compensation and employment protections to Mr. Toomey in recognition of Mr. Toomey’s significant continuing contributions to the Company and the desire to retain Mr. Toomey’s services. The Compensation Committee determined that it is in the best interests of the Company and its shareholders for Mr. Toomey’s compensation and benefits in several circumstances to be specified in the Executive Agreement.
The Executive Agreement specifies that Mr. Toomey will be paid an annual base salary of $900,000, which shall be reviewed annually by the Compensation Committee and may be increased at any time for any reason. Mr. Toomey is also eligible to earn an annual bonus with a target opportunity of $2,100,000, with the amount to be earned determined based on the achievement of personal and Company performance goals established by the Compensation Committee. The target annual bonus opportunity shall be reviewed by the Compensation Committee annually and may be increased at any time for any reason. The Executive Agreement specifies that Mr. Toomey will be eligible to receive future long-term incentive awards as part of the Company’s annual grant process, subject to Compensation Committee and/or Board approval. The target opportunity for Mr. Toomey’s long-term incentive award is $7,000,000, with the amount to be earned based on achievement of personal or Company performance goals established by the Compensation Committee. The Compensation Committee may increase the target opportunity for Mr. Toomey’s long-term incentive award target opportunity at any time for any reason. Mr. Toomey is also eligible to participate in employee benefit plans and programs in which similarly situated Company employees are eligible to participate. The award levels set forth above are the levels set by the Compensation Committee with respect to the grants made to Mr. Toomey in January 2024 and Mr. Toomey’s equity compensation remains subject to the terms of our long-term and short-term compensation programs, as applicable, and the 1999 Plan.
Under the Executive Agreement, either the Company or Mr. Toomey may terminate his employment with the Company at any time, with or without “Cause.” If Mr. Toomey’s employment with the Company is terminated by the Company for Cause, Mr. Toomey shall be:
| ● | paid any previously earned but unpaid base salary through the date of termination; |
| ● | reimbursed for any business expenses incurred by, but not yet paid to, Mr. Toomey; |
| ● | entitled to any vested benefits under certain benefit plans and programs (except for equity); and |
2024 Proxy Statement |
| 85 |
Executive Compensation
| ● | paid or provided with any other amounts or benefits that are required to be paid or provided by applicable law, with all of these payments and benefits collectively referred to in the Executive Agreement as the “Accrued Obligations.” |
If Mr. Toomey’s employment with the Company is terminated by the Company for Cause, all of his unvested equity awards shall be immediately forfeited and canceled and Mr. Toomey shall not receive any of the severance benefits contemplated by the Executive Agreement or any other severance compensation or benefit.
For the purposes of the Executive Agreement, the term “Cause” means the occurrence of one of the following on the part of Mr. Toomey:
| ● | an act of fraud, embezzlement, theft, breach of fiduciary duty, dishonesty, or any other misconduct that materially interferes with or materially prejudices the proper conduct of the business of the Company; |
| ● | conviction of, or a plea of nolo contendere to, a misdemeanor involving an act of moral turpitude or a felony, provided that the Board retains the right to place Mr. Toomey on a paid leave of absence during the pendency of any related proceeding; |
| ● | Mr. Toomey’s breach of any non-competition, non-solicitation, non-disparagement or other restrictive covenants to which he is subject relating to the Company and its subsidiaries (or a successor) which materially interferes with or materially prejudices the proper conduct of the business of the Company; or |
| ● | Mr. Toomey’s material breach of any written or published employment policy of the Company and its subsidiaries (or a successor) which materially interferes with or materially prejudices the proper conduct of the business of the Company. |
The Executive Agreement provides that if Mr. Toomey’s employment with the Company is terminated by the Company without Cause or by Mr. Toomey for Good Reason, Mr. Toomey shall be paid the Accrued Obligations, and, subject to execution of a release of claims in favor of the Company, resignation of any other position with the Company (including as a member of the Company’s Board of Directors), the return of Company property and compliance with the Executive Agreement and the release agreement, Mr. Toomey shall receive certain severance benefits that include:
| ● | an amount equal to three times the sum of Mr. Toomey’s then-current base salary and target annual bonus; |
| ● | the amount of Mr. Toomey’s prior calendar year’s annual bonus if his termination occurs after such calendar year but prior to payment of the annual bonus for that calendar year; |
| ● | the pro-rata amount of Mr. Toomey’s annual bonus relating the year of termination that Mr. Toomey would have received if he had remained employed by the Company through the date the annual bonus is paid; |
| ● | continued participation by Mr. Toomey and his eligible dependents in health, dental and vision benefit plans until Mr. Toomey reaches the age of 75, subject to certain limitations; and |
| ● | the vesting of Mr. Toomey’s unvested timed-based LTIP and other equity-based awards, as well as the vesting of all unvested performance-based LTIP and other equity-based awards at the greater of the target award or actual performance, if measurable, through the date of termination. |
For purposes of the Executive Agreement, “Good Reason” means a termination of employment by Mr. Toomey within sixty days following the occurrence of any of the following:
| ● | a material diminution in, or material adverse alteration to, Mr. Toomey’s title, base salary or other compensation, position, or duties and responsibilities, subject to certain conditions; |
| ● | the relocation of Mr. Toomey’s principal office outside of the area within a thirty mile radius from Mr. Toomey’s principal place of business or from such other location as may be mutually agreed by Mr. Toomey and the Company (excluding such relocation relating to a work-from-home or similar mandate), subject to certain conditions; or |
| ● | any other action or inaction that constitutes a material breach by the Company of the Executive Agreement. |
The Executive Agreement provides that, in the event of Mr. Toomey’s death during the term of the Executive Agreement, Mr. Toomey or his legal representatives are entitled to a pro rata bonus for the year of termination based on his then-current target annual bonus, and his unvested performance-based LTIP and other equity-based awards will vest at the greater of the target award or actual performance, if measurable, through the date of termination. Mr. Toomey’s legal representatives shall also receive any Accrued Obligations. Further, if Mr. Toomey’s employment is terminated due to his Disability, Mr. Toomey shall receive a pro rata bonus for the year of termination based on his then-current target annual bonus, and his unvested performance-based LTIP and other equity-based awards will vest at the greater of the target award or actual performance, if measurable, through the date of termination. In addition, Mr. Toomey shall receive any Accrued Obligations if his employment is terminated due to his Disability.
For purposes of the Executive Agreement, “Disability” means illness or other physical or mental condition of Mr. Toomey that renders him incapable of performing his customary and usual duties for the Company and its subsidiaries, or any medically determinable illness or other physical or mental condition resulting from bodily injury, disease or mental disorder which, in the judgment of the Board, is permanent and continuous in nature.
Under the Executive Agreement, Mr. Toomey is subject to customary non-solicitation and non-competition covenants, and is also bound by customary non-disparagement and confidentiality restrictions. The Executive Agreement provides that any amounts paid or payable pursuant to the Executive Agreement shall be subject to any applicable clawback policies or procedures adopted by the Company. The Executive Agreement shall continue until the fifth anniversary of the date on which Mr. Toomey entered into the Executive Agreement.
2024 Proxy Statement |
| 86 |
Executive Compensation
Other Items
Severance, Change of Control and Other Arrangements
We provide a description of the change of control provisions and the death, disability and retirement provisions in the 1999 Plan and our policy with respect to severance benefits, below under “Post-Employment Compensation – Severance, Change of Control and Other Arrangements.”
Accounting and Tax Effects
Among many factors, the impact of accounting treatment is considered in developing and implementing our compensation programs generally, including the accounting treatment as it applies to amounts awarded or paid to our executives. The impact of federal tax laws on our compensation programs is also considered.
The Compensation Committee has sought to maintain flexibility in compensating executive officers in a manner designed to promote varying corporate goals, and therefore the Compensation Committee has not adopted a policy that all compensation must be deductible on our federal income tax returns, and has reserved the right to adopt a policy, or may change any policy it does adopt, as it deems necessary. The Compensation Committee will continue to consider the tax deductibility of compensation as just one of many factors in determining the appropriate amount and form of compensation for our named executive officers.
The impact of Section 409A of the Internal Revenue Code of 1986, as amended (the “Code”) is also taken into account. The 1999 Plan has been designed to comply with the requirements of Section 409A of the Code so as to avoid possible adverse tax consequences that may result from noncompliance.
Equity Granting Process
Grants of stock options, restricted stock, restricted stock units, LTIP Units, Performance LTIP Units, and other equity awards to our executive officers and other employees are approved by the Compensation Committee at regularly scheduled meetings, or occasionally by unanimous written consent. If approval is made at a meeting, the grant date of the award is the date of the meeting or a future date; if approval is by unanimous written consent, the grant date of the award is the day the last Compensation Committee member signs the written consent or a future date.
We have no practice of timing grants of stock options, restricted stock, restricted stock units, LTIP Units, Performance LTIP Units, or other equity awards to coordinate with the release of material non-public information, nor have we timed the release of material non-public information for the purpose of affecting the value of any named executive officer compensation.
Stock Ownership Guidelines
To align the interests of our executive officers with the interests of our shareholders, each of our executive officers is required to comply with our Executive Stock Ownership Guidelines. These guidelines require our executive officers to own a specified number of shares of the Company’s common stock as determined by the executive officer’s position within four years of the date of the executive officer’s appointment. The individual guidelines are as follows:
| ● | 110,000 shares for the Chairman and CEO and the President, |
| ● | 50,000 shares for any Executive Vice President (or equivalent), and |
| ● | 20,000 shares for any Senior Vice President (or equivalent). |
All of our named executive officers serving as of the end of 2023 are in compliance with the Executive Stock Ownership Guideline applicable to their position. The Governance Committee may, from time to time, re-evaluate and revise these guidelines to give effect to changes in the price of our common stock or our capitalization.
Stock that counts towards satisfaction of the ownership guidelines include:
| ● | shares owned outright by the participant or his or her immediate family members residing in the same household, |
| ● | vested restricted stock, |
| ● | vested LTIP Units, and |
| ● | shares into which OP Units in the Operating Partnership or Performance OP Units in the Operating Partnership may be redeemed for shares of common stock. |
A copy of our Executive Stock Ownership Guidelines may be found on our corporate governance page on our website at ir.udr.com. To access the guidelines on our website at ir.udr.com, click on “Corporate Governance” and then click on “Governance Documents.”
2024 Proxy Statement |
| 87 |
Executive Compensation
Hedging, Pledging and Short-Term Speculative Transactions
We prohibit any Company personnel, which includes directors, officers and all other employees of the Company, from engaging in any short-term, speculative securities transactions, engaging in short sales, buying or selling put or call options, trading in options (other than those granted by the Company) and engaging in hedging transactions. We also prohibit purchasing securities on margin or pledging securities as collateral without the prior approval of our Corporate Compliance Officer or Chief Executive Officer.
Policy on Recoupment of Performance-Based Incentives
In response to the SEC’s adoption of Rule 10D-1 under the Exchange Act and the New York Stock Exchange’s adoption of Section 303A.14 of the Listed Company Manual, our Board approved a Recoupment Policy that complies with such rules, which applies to certain of our executive officers, including all of our named executive officers, and their performance-based incentive compensation.
2024 Proxy Statement |
| 88 |
Executive Compensation
Executive Compensation Tables
Summary Compensation Table
The executive officers named in the table below are referred to in this proxy statement as the “named executive officers.” The table below summarizes for each of the named executive officers the compensation amounts paid or earned for the fiscal years ended December 31, 2021, December 31, 2022 and December 31, 2023.
|
|
|
|
|
|
| Change In |
|
| |||||||||
Pension | ||||||||||||||||||
Value and | ||||||||||||||||||
Nonqualified | ||||||||||||||||||
Non-Equity | Deferred | |||||||||||||||||
Stock | Option | Incentive Plan | Compensation | All Other | ||||||||||||||
Name and | Salary | Bonus | Awards(1) | Awards | Compensation | Earnings | Compensation | Total | ||||||||||
Principal Position | Year | ($) | ($) | ($) | ($) | ($) | ($) | ($) | ($) | |||||||||
(a) | (b) | (c) | (d) | (e) | (f) | (g) | (h) | (i) | (j) | |||||||||
Thomas W. |
| 2023 | 900,000 | -0- | 10,807,024 | -0- | -0- | -0- | 47,991 | 11,755,015 | ||||||||
Toomey(2) |
| 2022 | 900,000 | -0- | 7,205,027 | -0- | -0- | -0- | 44,408 | 8,149,435 | ||||||||
Chief Executive Officer |
| 2021 | 800,000 | -0- | 13,384,611 | -0- | -0- | -0- | 43,772 | 14,228,383 | ||||||||
Joseph D. Fisher(3) |
| 2023 | 600,000 | -0- | 4,233,613 | -0- | -0- | -0- | 22,132 | 4,855,745 | ||||||||
President - Chief |
| 2022 | 550,000 | -0- | 7,620,168 | -0- | -0- | -0- | 21,286 | 8,191,454 | ||||||||
Financial Officer |
| 2021 | 500,000 | -0- | 2,547,388 | -0- | -0- | -0- | 20,858 | 3,068,246 | ||||||||
Harry G. Alcock(4) |
| 2023 | 550,000 | -0- | 2,704,593 | -0- | 325,000 | -0- | 21,726 | 3,601,319 | ||||||||
Senior Vice |
| 2022 | 550,000 | -0- | 2,342,912 | -0- | 325,000 | -0- | 18,218 | 3,236,130 | ||||||||
President - Chief Investment Officer | 2021 | 500,000 | -0- | 2,170,751 | -0- | 275,000 | -0- | 17,958 | 2,963,709 | |||||||||
Michael D. Lacy(5) | 2023 | 550,000 | -0- | 1,893,492 | -0- | 300,000 | -0- | 22,362 | 2,765,854 | |||||||||
Senior Vice |
| 2022 | 450,000 | -0- | 1,133,725 | -0- | 210,000 | -0- | 21,673 | 1,815,398 | ||||||||
President - Property Operations |
| 2021 | 400,000 | -0- | 877,736 | -0- | 412,500 | -0- | 21,227 | 1,711,463 |
| (3) | “Stock Awards” for 2023 includes the aggregate grant date fair value of Class 2 LTIP Units awarded under the Company’s short-term and long-term incentive programs. The threshold, target and maximum for these awards were determined prior to the grant date, and the amount of the awards with respect to the portion of the awards with a 1-year performance period was determined in February 2024 based upon the achievement of the performance metrics, and the portion of the long-term award with a 3-year performance period will be determined in February of 2026. The maximum amount of the awards was $3,200,000 for the short-term award and $4,300,000 for the long-term award. “All Other Compensation” includes $11,609 for Company paid health insurance (including dental) in 2023, $623 for Company paid life insurance, accidental death and disability and disability insurance in 2023 and $9,900 for the Company funded non-discretionary 401(k) Plan matching contribution. |
2024 Proxy Statement |
| 89 |
Executive Compensation
| (5) | “Stock Awards” for 2023 includes the aggregate grant date fair value of Class 2 LTIP Units and restricted stock units awarded under the Company’s short-term and long-term incentive programs. The threshold, target and maximum for these awards were determined prior to the grant date, and the amount of the awards with respect to the portion of the awards with a 1-year performance period was determined in February 2024 based upon the achievement of the performance metrics, and the portion of the long-term award with a 3-year performance period will be determined in February of 2026. The maximum amount of the awards was $2,000,000 for the short-term award and $2,500,000 for the long-term award. “All Other Compensation” includes $11,775 for Company paid health insurance (including dental) in 2023, $687 for Company paid life insurance, accidental death and disability and disability insurance in 2023 and $9,900 for the Company funded non-discretionary 401(k) Plan matching contribution. |
Grants of Plan-Based Awards Table
The following table provides information concerning each grant of a plan-based award made to a named executive officer in the 2023 fiscal year.
|
|
|
|
|
|
|
|
|
| All Other |
|
| |||||||||||||
All Other | Option | ||||||||||||||||||||||||
Stock | Awards: | Exercise | |||||||||||||||||||||||
Estimated Possible Payouts | Estimated Future Payouts | Awards: | Number of | or Base | Grant Date | ||||||||||||||||||||
Under Non-Equity | Under Equity | Number | Securities | Price of | Fair Value | ||||||||||||||||||||
Incentive Plan Awards | Incentive Plan Awards | of Shares | Underlying | Option | of Stock | ||||||||||||||||||||
Award | Grant | Threshold | Target | Maximum | Threshold | Target | Maximum | of Stock | Options | Awards | and Option | ||||||||||||||
Name |
| Type |
| Date |
| ($) |
| ($) |
| ($) |
| (#) |
| (#) |
| (#) | or Units | (#) | ($/Sh) | Awards | |||||
(a) |
| (b) |
| (c) |
| (d) |
| (e) |
| (f) |
| (g) |
| (h) |
| (i) | (j) | (k) | (l) | (m) | |||||
Thomas W. Toomey |
| STI |
| 1/3/2023 |
| — |
| — |
| — |
| 127,893 |
| 255,786 |
| 511,572 |
| — |
| — |
| — | $ | 2,010,543 | |
| LTI |
| 1/3/2023 |
| 852,620 |
| 1,705,240 |
| 3,410,480 |
| — |
| — |
| — | $ | 8,796,481 | ||||||||
Joseph D. Fisher |
| STI |
| 1/3/2023 |
| — |
| — |
| — |
| 97,442 |
| 194,884 |
| 389,768 |
| — |
| — |
| — | $ | 1,531,838 | |
| LTI |
| 1/3/2023 |
| 261,876 |
| 523,752 |
| 1,047,504 |
| — |
| — |
| — | $ | 2,701,775 | ||||||||
Harry G. Alcock |
| STI |
| 1/3/2023 |
| 162,500 |
| 325,000 |
| 650,000 |
| 43,797 |
| 87,594 |
| 175,188 |
| — |
| — |
| — | $ | 906,302 | |
| LTI |
| 1/3/2023 |
| 146,746 |
| 293,492 |
| 586,984 |
| — |
| — |
| — | $ | 1,798,291 | ||||||||
Michael D. Lacy |
| STI |
| 1/3/2023 |
| 150,000 |
| 300,000 |
| 600,000 |
| 9,070 |
| 18,139 |
| 36,278 |
| — |
| — |
| — | $ | 611,647 | |
| LTI |
| 1/3/2023 |
| 32,392 |
| 64,784 |
| 129,568 |
| — |
| — |
| — | $ | 1,281,845 | ||||||||
2024 Proxy Statement |
| 90 |
Executive Compensation
Narrative Disclosure to Summary Compensation Table and Grants of Plan-Based Awards Table
Long Term Incentive Compensation
The 2023 LTI Program covers consecutive, rolling three-year tranches (each consisting of 36 months) for an indefinite period. Class 2 LTIP Units and Class 2 Performance LTIP Units are each a class of partnership interests in the Operating Partnership and serve as a form of equity-based award for our annual long-term incentive equity compensation. Class 2 LTIP Units and Class 2 Performance LTIP Units are designed to qualify as “profits interests” in the Operating Partnership for federal income tax purposes, meaning that initially they are not economically equivalent in value to a share of our common stock, but over time can increase in value to one-for-one parity with common stock by operation of special tax rules applicable to profits interests. Class 2 LTIP Units and Class 2 Performance LTIP Units are designed to offer executives a long-term incentive comparable to restricted stock or restricted stock units, while allowing them to enjoy a potentially more favorable income tax treatment. Class 2 Performance LTIP Units, once vested, are convertible into Class 2 LTIP Units. (For further information regarding Class 2 LTIP Units and Class 2 Performance LTIP Units see page 78.) Each Class 2 LTIP Unit awarded is deemed equivalent to an award of one share of common stock reserved under our 1999 Plan. The key difference between Class 2 LTIP Units and restricted stock is that, at the time of award, Class 2 LTIP Units do not have full economic parity with an Operating Partnership Unit (“OP Unit”), but can achieve such parity over time upon the occurrence of specified events. Until and unless such parity is reached, the value that an executive will realize for a given number of vested Class 2 LTIP Units is less than the value of an equal number of shares of our common stock. In addition, Class 2 Performance LTIP Units only have value to the extent the price of our common stock on the date the Class 2 Performance LTIP Unit is exercised, exceeds the price of our common stock on the date of grant.
During the applicable performance period, holders of Class 2 LTIP Units or Class 2 Performance LTIP Units will receive distributions equal to one-tenth (1/10th) for Class 2 Performance LTIP Units or two percent (2%) for Class 2 Performance LTIP Units of the amount of regular quarterly distributions paid on an OP Unit, but will not receive any special distributions. After the end of the performance period, holders of earned Class 2 LTIP Units, both vested and unvested, will be entitled to receive distributions in an amount per Class 2 LTIP Unit equal to the distributions, both regular and special, payable on an OP Unit (which equal per share dividends (both regular and special) on our common stock). Class 2 Performance LTIP Units do not receive full distributions until such time as they are converted into Class 2 LTIP Units. Class 2 LTIP Units awarded with time-based vesting conditions only, both vested and unvested, are entitled to receive distributions in an amount per Class 2 LTIP Unit equal to the distributions, both regular and special, payable on an OP Unit.
In October 2022, the named executive officers were permitted to elect to receive Class 2 LTIP Units or Class 2 Performance LTIP Units in lieu of performance-based restricted stock units, and upon the elections of the named executive officers, the Compensation Committee awarded Class 2 LTIP Units and Class 2 Performance LTIP Units to the electing named executive officers pursuant to the 2022 LTI Program. Subject to the conditions set forth in the Eleventh Amendment to the Amended and Restated Agreement of Limited Partnership of the Operating Partnership and subject to the vesting conditions specified with respect to each Class 2 LTIP Unit (described below), each Class 2 Performance LTIP Unit may be converted into a Class 2 LTIP Unit and each Class 2 LTIP Unit may be converted, at the election of the holder, into an OP Unit of the Operating Partnership provided that such Class 2 LTIP Unit has been outstanding for at least two years from the date of grant. A holder of OP Units has the right to require the Operating Partnership to redeem all or a portion of the OP Units held by the holder in exchange for a cash payment based on the market value of our common stock at the time of redemption. However, the Operating Partnership’s obligation to pay the cash amount is subject to the prior right of the Company to acquire such OP Units in exchange for either the cash amount or shares of our common stock.
The Class 2 LTIP Units and Class 2 Performance LTIP Units are granted at maximum, and will vest only to the extent that pre-established performance metrics are met for the applicable performance period, subject to continuing employment. The 2023 LTI program award opportunity for the three-year performance period which commenced in 2023 has two separate tranches with different performance periods and vesting schedules, as follows: (i) 30% of the award opportunity has an FFO as Adjusted performance period of one year with the intent that one-half would vest in February 2024 and one-half would vest in February 2025; (ii) 35% of the award opportunity has a 3-year relative cumulative TSR versus apartment peers metric and will vest on the date the Compensation Committee determines performance in February of 2026; (iii) 20% of the award has a 3-year relative cumulative TSR versus the NAREIT Equity Total Return Index metric and will vest on the date the Compensation Committee determines performance in February of 2026; and (iv) 15% of the award opportunity has a 3-year FFO as Adjusted Growth Rate versus apartment peers metric and will vest on the date the Compensation Committee determines performance in February of 2026. In this way, the vesting conditions for the Class 2 LTIP Units and Class 2 Performance LTIP Units are comparable to the vesting conditions applicable to our performance-based restricted stock units.
Matching 401(k) Contributions
In 2023, Messrs. Toomey, Fisher, Alcock and Lacy each received a non-discretionary 401(k) matching contribution, including catch-up contributions related to the respective year, made by us in the amount of $9,900, $9,900, $9,900, and $9,900, respectively. In 2022, Messrs. Toomey, Fisher, Alcock, and Lacy each received a non-discretionary 401(k) matching contribution made by us in the amount of $9,150, $9,150, $6,100, and $9,150, respectively. In 2021, Messrs. Toomey, Fisher, Alcock and Lacy each received a non-discretionary 401(k) matching contribution made by us in the amount of $8,700, $8,700, $5,800 and $8,700, respectively.
2024 Proxy Statement |
| 91 |
Executive Compensation
Employment and Other Agreements
In early 2024, we entered into an Executive Agreement with our Chairman and Chief Executive Officer Mr. Toomey. For a description of that agreement see page 85. Other than such agreement we do not have employment agreements or arrangements with our named executive officers other than the agreements and compensation programs described elsewhere in this proxy statement.
In November 2016, we entered into an aircraft time-share agreement with Mr. Toomey, which replaced a prior agreement entered into in December 2011. This agreement was amended and restated in February 2019. Under the aircraft time-share agreement, we have agreed to lease an aircraft that we own and an aircraft in which we own a fractional interest, including crew and flight services, to Mr. Toomey for personal flights from time to time upon his request. Mr. Toomey will pay us a lease fee as may be set by the board from time to time for the flight expenses that may be charged under applicable regulations. We will invoice Mr. Toomey on the last day of the month in which any respective flight occurs. The aircraft time-share agreement will remain in effect until terminated by either party upon ten days’ prior written notice. The agreement automatically terminates upon the date Mr. Toomey is no longer employed by us.
In 2023, Mr. Toomey paid us $199,430 for aircraft lease payments as contemplated by the agreement.
2024 Proxy Statement |
| 92 |
Executive Compensation
Outstanding Equity Awards at 2023 Fiscal Year-End
The following table provides information concerning unexercised options, stock that has not vested and equity incentive plan awards for each named executive officer outstanding as of the end of the 2023 fiscal year:
Equity |
| ||||||||||||||||||
Equity | Incentive |
| |||||||||||||||||
Equity | Incentive | Plan Awards: |
| ||||||||||||||||
Incentive | Market | Plan Awards: | Market or |
| |||||||||||||||
Plan Awards: | Number | Value of | Number of | Payout Value |
| ||||||||||||||
Number of | Number of | Number of | of Shares | Shares or | Unearned | of Unearned |
| ||||||||||||
Securities | Securities | Securities | or Units | Units of | Shares, | Shares, Units |
| ||||||||||||
Underlying | Underlying | Underlying | of Stock | Stock | Units or | or Other |
| ||||||||||||
Unexercised | Unexercised | Unexercised | Option | That | That | Other Rights | Rights That |
| |||||||||||
Option | Option | Unearned | Exercise | Option | Have Not | Have Not | That Have | Have Not |
| ||||||||||
(#) | (#) | Options | Price | Expiration | Vested | Vested | Not Vested | Vested |
| ||||||||||
Name | Exercisable | Unexercisable | (#) | ($) | Date | (#) | ($) | (#) | ($) |
| |||||||||
(a) |
| (b) |
| (c) |
| (d) |
| (e) |
| (f) |
| (g) |
| (h) |
| (i) |
| (j) |
|
Thomas |
|
|
|
|
|
|
|
|
|
|
| — |
| — |
| 549,532 |
| 791,326 | (2) |
W. Toomey |
|
|
|
|
|
|
|
|
|
|
| — |
| — |
| 314,018 |
| 452,186 | (2) |
| — |
| — |
| 235,514 |
| 339,140 | (2) | |||||||||||
| — |
| — |
| 511,571 |
| — | (2) | |||||||||||
| — |
| — |
| 29,445 |
| 1,127,449 | (1) | |||||||||||
| — |
| — |
| 77,879 |
| 2,981,987 | (1) | |||||||||||
| — |
| — |
| 44,504 |
| 1,704,058 | (1) | |||||||||||
| — |
| — |
| 33,378 |
| 1,278,044 | (1) | |||||||||||
| — |
| — |
| 511,572 |
| — | (2) | |||||||||||
| — |
| — |
| 596,834 |
| — | (2) | |||||||||||
| — |
| — |
| 341,048 |
| — | (2) | |||||||||||
| — |
| — |
| 255,786 |
| — | (2) | |||||||||||
Joseph |
|
|
|
|
|
|
|
|
|
|
| 2,056 | 78,724 |
| — |
| — | ||
D. Fisher |
|
|
|
|
|
|
|
|
|
|
| — |
| — |
| 163,552 |
| 235,515 | (2) |
| — |
| — |
| 93,458 |
| 134,580 | (2) | |||||||||||
| — |
| — |
| 70,094 |
| 100,935 | (2) | |||||||||||
| — |
| — |
| 389,769 |
| — | (2) | |||||||||||
| — |
| — |
| 607,532 |
| — | (2) | |||||||||||
| — |
| — |
| 8,431 |
| 322,823 | (1) | |||||||||||
| — |
| — |
| 20,603 |
| 788,889 | (1) | |||||||||||
| — |
| — |
| 11,773 |
| 450,788 | (1) | |||||||||||
| — |
| — |
| 8,829 |
| 338,062 | (1) | |||||||||||
| — |
| — |
| 157,126 |
| — | (2) | |||||||||||
| — |
| — |
| 183,314 |
| — | (2) | |||||||||||
| — |
| — |
| 104,750 |
| — | (2) | |||||||||||
| — |
| — |
| 78,562 |
| — | (2) |
2024 Proxy Statement |
| 93 |
Executive Compensation
Equity |
| ||||||||||||||||||
Equity | Incentive |
| |||||||||||||||||
Equity | Incentive | Plan Awards: |
| ||||||||||||||||
Incentive | Market | Plan Awards: | Market or |
| |||||||||||||||
Plan Awards: | Number | Value of | Number of | Payout Value |
| ||||||||||||||
Number of | Number of | Number of | of Shares | Shares or | Unearned | of Unearned |
| ||||||||||||
Securities | Securities | Securities | or Units | Units of | Shares, | Shares, Units |
| ||||||||||||
Underlying | Underlying | Underlying | of Stock | Stock | Units or | or Other |
| ||||||||||||
Unexercised | Unexercised | Unexercised | Option | That | That | Other Rights | Rights That |
| |||||||||||
Option | Option | Unearned | Exercise | Option | Have Not | Have Not | That Have | Have Not |
| ||||||||||
(#) | (#) | Options | Price | Expiration | Vested | Vested | Not Vested | Vested |
| ||||||||||
Name | Exercisable | Unexercisable | (#) | ($) | Date | (#) | ($) | (#) | ($) |
| |||||||||
(a) |
| (b) |
| (c) |
| (d) |
| (e) |
| (f) |
| (g) |
| (h) |
| (i) |
| (j) |
|
Harry |
|
|
|
|
|
|
|
|
|
|
| 2,827 | 108,246 |
| — |
| — | ||
G. Alcock |
|
|
|
|
|
|
|
|
|
|
| — |
| — |
| 14,845 |
| 568,415 | (1) |
| — |
| — |
| 8,487 |
| 324,967 | (1) | |||||||||||
| — |
| — |
| 6,361 |
| 243,563 | (1) | |||||||||||
| — |
| — |
| 81,776 |
| 117,757 | (2) | |||||||||||
| — |
| — |
| 46,728 |
| 67,288 | (2) | |||||||||||
| — |
| — |
| 35,046 |
| 50,466 | (2) | |||||||||||
| — |
| — |
| 17,972 |
| 688,148 | (1) | |||||||||||
| — |
| — |
| 158,343 |
| — | (2) | |||||||||||
| — |
| — |
| 7,791 |
| 298,317 | (1) | |||||||||||
| — |
| — |
| 20,603 |
| 788,889 | (1) | |||||||||||
| — |
| — |
| 11,773 |
| 450,788 | (1) | |||||||||||
| — |
| — |
| 8,829 |
| 338,062 | (1) | |||||||||||
| — |
| — |
| 6,221 |
| 238,202 | (1) | |||||||||||
| — |
| — |
| 8,154 |
| 312,217 | (1) | |||||||||||
| — |
| — |
| 4,661 |
| 178,470 | (1) | |||||||||||
| — |
| — |
| 3,496 |
| 133,862 | (1) | |||||||||||
| — |
| — |
| 82,216 |
| — | (2) | |||||||||||
— |
| — | 95,920 | — | (2) | ||||||||||||||
— |
| — | 54,812 | — | (2) | ||||||||||||||
— |
| — | 41,108 | — | (2) | ||||||||||||||
Michael |
|
|
|
|
|
|
|
|
|
|
| 2,382 | 91,207 |
| — |
| — | ||
D. Lacy |
| — |
| — |
| 2,820 |
| 107,978 | (1) | ||||||||||
| — |
| — |
| 1,613 |
| 61,762 | (1) | |||||||||||
| — |
| — |
| 1,207 |
| 46,216 | (1) | |||||||||||
| — |
| — |
| 46,612 |
| 67,121 | (2) | |||||||||||
| — |
| — |
| 26,636 |
| 38,356 | (2) | |||||||||||
| — |
| — |
| 19,976 |
| 28,765 | (2) | |||||||||||
| — |
| — |
| 38,708 |
| 1,482,129 | (1) | |||||||||||
| — |
| — |
| 2,726 |
| 104,379 | (1) | |||||||||||
| — |
| — |
| 7,212 |
| 276,147 | (1) | |||||||||||
| — |
| — |
| 4,121 |
| 157,793 | (1) | |||||||||||
| — |
| — |
| 3,091 |
| 118,354 | (1) | |||||||||||
| — |
| — |
| 913 |
| 34,959 | ||||||||||||
| — |
| — |
| 1,100 |
| 42,119 | ||||||||||||
| — |
| — |
| 629 |
| 24,084 | ||||||||||||
| — |
| — |
| 472 |
| 18,073 | ||||||||||||
| — |
| — |
| 20,737 |
| 794,020 | (1) | |||||||||||
| — |
| — |
| 27,175 |
| 1,040,531 | (1) | |||||||||||
| — |
| — |
| 15,526 |
| 594,491 | (1) | |||||||||||
| — |
| — |
| 11,650 |
| 446,079 | (1) |
| (1) | STI and LTIP Units granted at maximum including estimated dividend equivalent shares, subject to forfeiture based upon final performance. |
| (2) | Performance LTIP Units granted at maximum, subject to forfeiture based upon final performance represented at December 31, 2023, close price less strike price at issuance. |
2024 Proxy Statement |
| 94 |
Executive Compensation
The following table provides grant and vesting dates as of December 31, 2023 for each of the unvested stock awards listed in the table above:
|
| Unvested Shares |
| ||||
Grant Date | or Units |
| Vesting Date | ||||
Thomas W. Toomey |
| 1/4/2021 |
| 1,099,064 | (2) | vests in 2/2024 | |
| 1/3/2022 |
| 29,445 | (1) | vests in 2/2024 | ||
| 1/3/2022 |
| 155,761 | (1) | vests in 2/2025 | ||
1/3/2023 | 511,571 | (2) | vests in 2/2024 | ||||
1/3/2023 | 511,572 | (2) | 1/2 vests in 2/2024 and 2/2025 | ||||
| 1/3/2023 |
| 1,193,668 | (2) | vests in 2/2026 | ||
Joseph D. Fisher |
| 2/6/2020 |
| 2,056 | (3) | vests in 2/2024 | |
| 1/4/2021 |
| 327,104 | (2) | vests in 2/2024 | ||
| 1/3/2022 |
| 8,431 | (1) | vests in 2/2024 | ||
| 1/3/2022 |
| 41,205 | (1) | vests in 2/2025 | ||
5/19/2022 | 607,532 | (2) | vests in 5/2028 | ||||
1/3/2023 | 389,769 | (2) | vests in 2/2024 | ||||
1/3/2023 | 157,126 | (2) | 1/2 vests in 2/2024 and 2/2025 | ||||
| 1/3/2023 |
| 366,626 | (2) | vests in 2/2026 | ||
Harry G. Alcock |
| 2/6/2020 |
| 2,827 | (3) | vests in 2/2024 | |
| 1/4/2021 |
| 29,693 | (1) | vests in 2/2024 | ||
| 1/4/2021 |
| 163,550 | (2) | vests in 2/2024 | ||
1/3/2022 | 7,791 | (1) | vests in 2/2024 | ||||
1/3/2022 | 41,205 | (1) | vests in 2/2025 | ||||
| 1/3/2023 |
| 17,972 | (1) | vests in 2/2024 | ||
1/3/2023 | 158,343 | (2) | vests in 2/2024 | ||||
1/3/2023 | 6,221 | (1) | 1/2 vests in 2/2024 and 2/2025 | ||||
1/3/2023 | 16,311 | (1) | vests in 2/2026 | ||||
1/3/2023 | 82,216 | (2) | 1/2 vests in 2/2024 and 2/2025 | ||||
| 1/3/2023 |
| 191,840 | (2) | vests in 2/2026 | ||
Michael D. Lacy |
| 1/4/2021 |
| 5,640 | (1) | vests in 2/2024 | |
| 1/4/2021 |
| 93,224 | (2) | vests in 2/2024 | ||
| 2/18/2021 |
| 2,382 | (3) | 1/2 vests in 2/2024 and 2/2025 | ||
| 1/3/2022 |
| 2,726 | (1) | vests in 2/2024 | ||
| 1/3/2022 |
| 14,424 | (1) | vests in 2/2025 | ||
| 1/3/2022 |
| 913 | (3) | vests in 2/2024 | ||
| 1/3/2022 |
| 2,201 | (3) | vests in 2/2025 | ||
1/3/2023 | 38,708 | (1) | vests in 2/2024 | ||||
1/3/2023 | 20,737 | (1) | 1/2 vests in 2/2024 and 2/2025 | ||||
1/3/2023 | 54,351 | (1) | vests in 2/2026 |
| (1) | Units |
| (2) | Performance Units |
| (3) | Stock |
2024 Proxy Statement |
| 95 |
Executive Compensation
Stock Vested
The following table provides information concerning vesting of stock during the 2023 fiscal year for each of the named executive officers:
|
| Value | ||
Number of Shares | Realized | |||
Acquired on Vesting | on Vesting | |||
Name | (#) | ($) | ||
(a) | (d) | (e) | ||
Thomas W. Toomey |
| 398,962 |
| 9,126,314 |
Joseph D. Fisher |
| 138,848 |
| 3,596,020 |
Harry G. Alcock |
| 102,991 |
| 3,279,757 |
Michael D. Lacy |
| 47,319 |
| 1,363,751 |
Pension Benefits Table
We do not have any pension plans for our associates. We do have a 401(k) plan and our matching contributions are included in the Summary Compensation Table under the heading “All Other Compensation.”
Nonqualified Deferred Compensation Table
We do not have any nonqualified deferred compensation plans for our associates.
Post-Employment Compensation — Severance, Change of Control and Other Arrangements
Change of Control. Under the provisions of our 1999 Plan, all outstanding options, stock appreciation rights, LTIP Units, Performance LTIP Units, and other awards that may be exercised generally become fully exercisable and all restrictions on outstanding awards will lapse upon the occurrence of a change of control unless otherwise provided in the award agreement. “Change of control” is defined in the Plan as (1) a merger or consolidation in which we are not the surviving entity, except for a transaction the principal purpose of which is to change the state in which we are incorporated; (2) the transfer or sale of all or substantially all of our assets other than to an affiliate or subsidiary of ours; (3) the liquidation of our Company; (4) the acquisition by any person, or by a group of persons acting in concert, of more than 50% of our outstanding voting securities, which results in the resignation or addition of 50% or more independent members of our board; (5) certain reverse mergers in which the Company is the surviving entity or (6) a change in the composition of the board over a period of 12 months or less such that a majority of the board ceases, by reason of one or more contested elections, to be comprised of individuals who are “continuing directors” (as defined in the Plan). For grants made in 2021 and thereafter, the Plan provides that in order for the restrictions to lapse the employment of the recipient also must be terminated, other than without cause or for good reason, within 12 months of the date of the change of control.
If a change in control occurred effective as of December 31, 2023, the value of the cash payments and the benefits provided (based on the release of restrictions on previously granted stock awards) to each of the named executive officers who were employed by us as of December 31, 2023 and the named executive officer’s employment were terminated within 12 months as described above, would have been as follows (the following does not include the effect of the executive agreement with Mr. Toomey that was entered into subsequent to December 31, 2023):
|
|
| Value of |
| ||||||
Value of | Outstanding | |||||||||
Outstanding | Restricted | |||||||||
Name | Cash Payments | Options | Stock Awards | Total | ||||||
Thomas W. Toomey |
| — |
| — | $ | 8,674,190 | $ | 8,674,190 | ||
Joseph D. Fisher |
| — |
| — | $ | 2,450,316 | $ | 2,450,316 | ||
Harry G. Alcock |
| — |
| — | $ | 4,907,658 | $ | 4,907,658 | ||
Michael D. Lacy |
| — |
| — | $ | 5,574,562 | $ | 5,574,562 | ||
2024 Proxy Statement |
| 96 |
Executive Compensation
Death, Disability or Retirement. Our 1999 Plan provides that, unless otherwise provided in the award agreement, upon a participant’s death, disability or retirement, all outstanding options, stock appreciation rights and other awards that may be exercised shall become fully exercisable, and all restrictions on outstanding stock awards shall lapse. If the death, disability or retirement of each of our named executive officers who were employed by us as of December 31, 2023, occurred as of December 31, 2023, the benefits provided (based upon the exercise of options and the release of restrictions on previously granted stock awards) would have been as follows (the following does not include the effect of the executive agreement with Mr. Toomey that was entered into subsequent to December 31, 2023):
|
| Value of |
| |||||
Value of | Outstanding | |||||||
Outstanding | Restricted | |||||||
Name | Options | Stock Awards | Total | |||||
Thomas W. Toomey |
| — | $ | 8,674,190 | $ | 8,674,190 | ||
Joseph D. Fisher |
| — | $ | 2,450,316 | $ | 2,450,316 | ||
Harry G. Alcock |
| — | $ | 4,907,658 | $ | 4,907,658 | ||
Michael D. Lacy |
| — | $ | 5,574,562 | $ | 5,574,562 | ||
Severance Benefits. Other than the Executive Agreement with Mr. Toomey described elsewhere in this proxy statement, we currently do not have any contractual severance arrangements with our named executive officers.
CEO Pay Ratio
As required by Section 953(b) of the Dodd-Frank Wall Street Reform and Consumer Protection Act (the “Dodd-Frank Act”), and Item 402(u) of Regulation S-K, we are providing the following information about the relationship of the median annual total compensation of all of our employees and the annual total compensation of Mr. Toomey. For fiscal 2023, the median of the annual total compensation of all 1,409 employees of UDR (other than Mr. Toomey) was $85,212, and the annual total compensation of Mr. Toomey, as reported in the Summary Compensation Table included elsewhere in this Proxy Statement, was $11,755,015. Based on this information, for fiscal 2023, the ratio of the annual total compensation of Mr. Toomey to the median of the annual total compensation of all employees of UDR (other than Mr. Toomey) was 138 to 1.
The ratio of the annual total compensation of Mr. Toomey to the median of the annual total compensation of all employees of UDR (other than Mr. Toomey) presented above is a reasonable estimate calculated in a manner consistent with Item 402(u) of Regulation S-K. This ratio is not comparable to the ratio reported by other public companies, because each company uses its own assumptions, methodologies and estimates when computing the ratio.
To identify the median of the annual total compensation of all our employees, other than Mr. Toomey, as well as to determine the annual total compensation of our median employee and Mr. Toomey, we took the following steps:
| ● | We determined that, as of December 28, 2023, our employee population consisted of approximately 1,410 individuals, with all of these individuals located in the United States. This population consisted of our full-time, part-time, and temporary employees, and does not include any independent contractors that we have engaged. |
| ● | To identify the median employee from our employee population, we compared the amount of total compensation (consisting of salaries, rent discounts, 401(k) matching, benefits paid by us, commissions, bonuses and incentive plan awards) of our employees as reflected in our payroll records as of December 28, 2023. We identified our median employee using this compensation measure, which was consistently applied to all employees included in the calculation. |
| ● | Once we identified our median employee, we combined all of the elements of such employee’s compensation for fiscal 2023 in accordance with the requirements of Item 402(c)(2)(x) of Regulation S-K, resulting in annual total compensation of $85,212. |
| ● | For the annual total compensation of Mr. Toomey, we used the amount reported in the “Total” column (column (j)) of our 2023 Summary Compensation Table included in this proxy statement. |
This information is being provided for compliance purposes. Neither the Compensation Committee nor the management of the Company used the pay ratio measure in making compensation decisions.
As discussed on page 89, the required compensation measure used for Mr. Toomey as set forth in the Summary Compensation Table is determined in accordance with accounting rules and assumptions and does not reflect the compensation actually earned by Mr. Toomey in 2023. Using the compensation earned by Mr. Toomey in 2023 of $6,727,096 as reflected on page 21, the ratio of Mr. Toomey’s compensation to the ratio of the annual total compensation for all employees of UDR (other than Mr. Toomey), calculated as described above would be 79 to 1.
2024 Proxy Statement |
| 97 |
Executive Compensation
Pay Versus Performance
As required by Section 953(a) of the Dodd-Frank Act and Item 402(v) of Regulation S-K, we provide the following disclosure regarding executive “compensation actually paid” (“CAP”), calculated in accordance with SEC rules, and certain Company performance for the fiscal years listed below.
This disclosure was prepared in accordance with the requirements of Item 402(v) of Regulation S-K and does not necessarily reflect the value actually realized by our executives, how our executives’ compensation relates to Company performance, or how the Compensation Committee evaluates compensation decisions in light of Company or individual performance. For example, the Compensation Committee does not use CAP as a basis for making compensation decisions, nor does it use net income (as reflected below) for purposes of determining our executives’ incentive compensation. Please refer to our Compensation Discussion and Analysis for a complete description of how executive compensation relates to Company performance and how the Compensation Committee makes its compensation decisions.
The information provided under this Pay versus Performance section will not be deemed to be incorporated by reference into any filing made by the Company under the Securities Act of 1933, as amended, or the Exchange Act, as amended, except to the extent the Company specifically incorporates it by reference.
Value of Initial Fixed $100 | ||||||||||||||||
Investment Based On: | ||||||||||||||||
Average | ||||||||||||||||
Summary | ||||||||||||||||
Compensation | Average | |||||||||||||||
Table Total for | Compensation | Peer Group | ||||||||||||||
Non-PEO | Actually Paid to | Total | ||||||||||||||
Summary | Named | Non-PEO | Shareholder | |||||||||||||
Compensation | Compensation | Executive | Named | Total | Return | |||||||||||
Table Total for | Actually Paid to | Officers | Executive | Shareholder | (5)(g) | Net Income | ||||||||||
| PEO(1)(b) |
| PEO(2)(c) |
| (3)(d) |
| Officers(4)(e) |
| Return(f) |
| (6)(h) |
| (6)(h) |
| (7)(i) | |
Year(a) | ($) | ($) | ($) | ($) | ($) | ($) | ($) | ($) | ||||||||
2023 | | | | | | | ||||||||||
2022 | | ( | | | | | ||||||||||
2021 | | | | | | | ||||||||||
2020 | | | | | | | ||||||||||
| (1) | The dollar amounts reported in column (b) are the amounts of total compensation reported for |
| (2) | The dollar amounts reported in column (c) represent the amount of compensation actually paid to Mr. Toomey, as computed in accordance with Item 402(v) of Regulation S-K. The dollar amounts do not reflect the actual amount of compensation earned by or paid to Mr. Toomey during the applicable year. In accordance with the requirements of Item 402(v) of Regulation S-K, the following adjustments were made to Mr. Toomey’s total compensation as reported in the Summary Compensation Table for each year to determine the compensation actually paid: |
Reported | ||||||||||||
Summary | Reported Change | |||||||||||
Compensation | in the Actuarial | Total Equity | Compensation | |||||||||
Table | Present Value of | Pension Benefit | Reported Value | Award | Actually Paid | |||||||
Total for PEO | Pension Benefits(a) | Adjustments(a) | of Equity Awards(b) | Adjustments(c) | to PEO | |||||||
Year |
| ($) |
| ($) |
| ($) |
| ($) |
| ($) |
| ($) |
2023 | | — | — | | ( | | ||||||
2022 | | — | — | | ( | ( | ||||||
2021 | | — | — | | | | ||||||
2020 | | — | — | | ( | |
| (a) | The Company does not have any defined benefit or actuarial pension plans applicable to our U.S. employees, including our NEOs. |
| (b) | The grant date fair value of equity awards represents the total of the amounts reported in the “Stock Awards” and “Option Awards” columns in the Summary Compensation Table for the applicable year. |
2024 Proxy Statement |
| 98 |
Executive Compensation
| (c) | The equity award adjustments for each applicable year include the addition (or subtraction, as applicable) of the amounts specified in the following table, in accordance with the requirements of Item 402(v) of Regulation S-K. The valuation assumptions used to calculate fair values did not materially differ from those disclosed at the time of grant. The amounts deducted or added in calculating the equity award adjustments are as follows: |
Values of | ||||||||||||||||
Dividends | ||||||||||||||||
Year over Year | Change in | Fair Value at | or other Earnings | |||||||||||||
Change in Fair | Fair Value | Fair Value of | the End of the | Paid on Stock or | ||||||||||||
Grant Date | Year End | Value of | as of Vesting | Equity Awards | Prior Year of | Option Awards | ||||||||||
Fait Value | Fair Value | Outstanding | Date of Equity | Granted in | Equity Awards | not Otherwise | ||||||||||
of Equity | of Equity | and Unvested | Awards | Prior | that Failed to | Reflected | ||||||||||
Awards | Awards | Equity Awards | Granted | Years that | Meet Vesting | in Fair Value or | Total Equity | |||||||||
Granted in | Granted in | Granted in | and Vested | Vested | Conditions in | Total | Award | |||||||||
the year | the year | Prior Years | in the Year | in the Year | the Year | Compensation | Adjustments** | |||||||||
Year |
| ($) |
| ($) |
| ($) |
| ($) |
| ($) |
| ($) |
| ($) |
| ($) |
2023 | ( | | ( | * | — | | — | | ( | |||||||
2022 | ( | | ( | — | ( | — | | ( | ||||||||
2021 | ( | | | — | | — | | | ||||||||
2020 | ( | | ( | — | | — | | ( |
* | 2023 includes the impact from Mr. Toomey’s voluntary forfeiture in November 2023 of a performance-based supplemental equity award that was originally granted in December of 2021. See further discussion on page 85. |
** | Totals may not match the sum of the preceding columns due to rounding. |
| (3) | The dollar amounts reported in column (d) represent the average of the amounts reported for the Company’s non-PEO NEOs as a group in the “Total” column of the Summary Compensation Table in each applicable year. The names of each of the non-PEO NEOs included in each of the years in the table for purposes of calculating the average amounts are as follows: 2020: Messrs. Fisher, Alcock, and Lacy and Jerry A. Davis, our former President and Chief Operations Officer, and Warren L. Troupe, our former Senior Executive Vice President; 2021; Messrs. Fisher, Alcock, Lacy and Davis; 2022: Messrs. Fisher, Alcock and Lacy; and 2023: Messrs. Fisher, Alcock and Lacy. |
| (4) | The dollar amounts reported in column (e) represent the average amount of compensation actually paid to the non-PEO NEOs as a group, as computed in accordance with Item 402(v) of Regulation S-K. The dollar amounts do not reflect the actual average amount of compensation earned by or paid to the non-PEO NEOs as a group during the applicable year. In accordance with the requirements of Item 402(v) of Regulation S-K, the following adjustments were made to average total compensation for the non-PEO NEOs as a group for each year to determine the compensation actually paid: |
Average | Average | |||||||||||
Reported | Reported | |||||||||||
Summary | Change in the | Average | ||||||||||
Compensation | Actuarial | Average | Compensation | |||||||||
Table Total for | Present Value | Average | Reported Value | Average | Actually Paid | |||||||
Non-PEO | of Pension | Pension Benefit | of Equity | Equity Award | to non-PEO | |||||||
NEOs | Benefits(a) | Adjustments(a) | Awards(b) | Adjustments(c) | NEOs | |||||||
Year | ($) | ($) | ($) | ($) | ($) | ($) | ||||||
2023 | | — | — | | ( | | ||||||
2022 | | — | — | | ( | | ||||||
2021 | | — | — | | | | ||||||
2020 | | — | — | | ( | |
| (a) | The Company does not have any defined benefit or actuarial pension plans applicable to our U.S. employees, including our NEOs. |
| (b) | The grant date fair value of equity awards represents the average of the total amounts reported in the “Stock Awards” and “Option Awards” columns in the Summary Compensation Table for the non-PEO NEOs for the applicable year. |
| (c) | The amounts deducted or added in calculating the total average equity award adjustments, using the same methodology described in footnote (2)(c) above, are as follows: |
2024 Proxy Statement |
| 99 |
Executive Compensation
Average Value of | ||||||||||||||||
Average Year | Average Fair | Dividends or | ||||||||||||||
over Year | Average | Value at the | other | |||||||||||||
Average | Average Year | Change in | Average Fair | Change in Fair | End of the Prior | Earnings Paid | ||||||||||
Grant Date | End Fair | Fair | Value as of | Value of Equity | Year of Equity | on Stock or Option | ||||||||||
Fair Value of | Value of | Value of | Vesting Date of | Awards | Awards that | Awards not | Total | |||||||||
Equity | Equity | Outstanding and | Equity Awards | Granted in Prior | Failed to Meet | Otherwise | Average | |||||||||
Awards | Awards | Unvested Equity | Granted and | Years that | Vesting | Reflected in Fair | Equity | |||||||||
Granted in the | Granted in the | Awards Granted | Vested in the | Vested in the | Conditions in | Value or Total | Award | |||||||||
Year | Year | in Prior Years | Year | Year | the Year | Compensation | Adjustments | |||||||||
Year |
| ($) |
| ($) |
| ($) |
| ($) |
| ($) |
| ($) |
| ($) |
| ($) |
2023 | ( | | ( | — | | — | | ( | ||||||||
2022 | ( | | ( | — | ( | — | | ( | ||||||||
2021 | ( | | | — | | — | | | ||||||||
2020 | ( | | ( | — | | — | | ( |
(5) | The numbers reported in column (g) represent the weighted peer group cumulative TSR, weighted according to the respective companies’ stock market capitalization at the beginning of each period for which a return is indicated. The peer group used for this purpose is the FTSE NAREIT Equity Apartment Index, which is the same published industry index the Company uses for purposes of Item 201(e)(1)(ii) of Regulation S-K. |
(6) | The dollar amounts reported in column (h) represent the amount of net income (loss) previously disclosed in the Company’s audited GAAP financial statements for the applicable year, as required by Regulation S-X. |
(7) | The dollar amounts reported in column (i) represent FFOA for the applicable year. |
The illustrations below provide a graphical description of the relationship between CAP (as calculated in accordance with SEC rules) and the information presented in the Pay versus Performance table.
| |
2024 Proxy Statement |
| 100 |
Executive Compensation

Financial Performance Measures
In our assessment, the most important financial performance measures used to link CAP (as calculated in accordance with the SEC rules) to our NEOs in 2023 to our performance were:
| ● |
| ● |
| ● |
| ● |
Please see the Compensation Discussion and Analysis section of this Proxy Statement for more information on these measures and how they are taken into account in determining compensation for each of our NEOs.
2024 Proxy Statement |
| 102 |
Executive Compensation
Equity Compensation Plan Information
The following table provides information about shares of our common stock that we may issue upon the exercise of options, warrants and rights under our existing equity compensation plans. All information is provided as of December 31, 2023. Our 1999 Plan is our only shareholder approved equity compensation plan.
|
|
| Number of Securities | ||||
Remaining Available for | |||||||
Number of Securities to | Weighted-Average | Future Issuance Under | |||||
be Issued upon Exercise | Exercise Price of | Equity Compensation Plans | |||||
of Outstanding Options, | Outstanding Options, | (Excluding Securities | |||||
Warrants and Rights | Warrants and Rights | Reflected in Column (a)) | |||||
Plan Category | (a) | (b) | (c) | ||||
Equity compensation plans approved by the security holders |
| 1,357,510 | $ | 45.19 |
| 11,974,130 | |
Equity compensation plans not approved by the security holders |
| — |
| — |
| — | |
Total |
| 1,357,510 | $ | 45.19 |
| 11,974,130 | |
2024 Proxy Statement |
| 103 |
Ernst & Young LLP, served as our independent registered public accounting firm, and audited our financial statements for fiscal 2023. Our Audit Committee has selected Ernst & Young LLP to audit our financial statements for fiscal 2024. We expect that a representative of Ernst & Young LLP will be present at the meeting, will have the opportunity to make a statement if he or she desires to do so and will be available to answer any appropriate questions from shareholders.
| Our board recommends that the shareholders vote “FOR” the ratification of the appointment of Emst & Young LLP as our independent registered public accounting firm for fiscal 2024. |
Vote Required and Board of Directors’ Recommendation
Although it is not required to do so, the board is submitting the Audit Committee’s selection of our independent registered public accounting firm for ratification by the shareholders at the meeting in order to ascertain the view of our shareholders regarding such selection. An affirmative vote of a majority of the votes cast at the meeting will be required to approve this proposal. In the event the shareholders do not ratify this appointment, the Audit Committee will reconsider its selection, but still may determine that the appointment of our independent registered public accounting firm is in the best interests of the Company and its shareholders. Even if the appointment is ratified by the shareholders, the Audit Committee, in its discretion, may appoint a different independent registered public accounting firm at any time during the year if the Audit Committee determines that such a change would be in the best interests of the Company and its shareholders.
2024 Proxy Statement |
| 104 |
Audit Fees
In connection with the audit of the 2023 financial statements, we entered into an engagement agreement with Ernst & Young LLP which set forth the terms by which Ernst & Young LLP will perform audit services for us.
The following table sets forth the aggregate fees billed or to be billed by Ernst & Young LLP for the following services during fiscal 2023 and fiscal 2022:
Description of Services |
| 2023 |
| 2022 | ||
Audit Fees | $ | 1,341,609 | $ | 1,476,705 | ||
Audit-Related Fees |
| — |
| — | ||
Tax Fees |
| 68,170 |
| 209,896 | ||
All Other Fees |
| — |
| — | ||
TOTAL | $ | 1,409,779 | $ | 1,686,601 | ||
| (1) | Audit fees consist of fees for the audit and review of the Company’s consolidated financial statements, acquisition audits, statutory audits, comfort letters, consents, debt covenant letters and assistance with and review of documents filed with the SEC. |
| (2) | Audit-related fees consist of fees for audit-related services for partnership and benefit plan audits, review of proxy materials, accounting advice in connection with specific transactions, internal control reviews and various attestation engagements. |
| (3) | Tax fees consist of fees for tax compliance, tax advisory services (1031 and state planning), and tax planning. |
Pre-Approval Policies and Procedures
The charter of the Audit Committee provides that the Audit Committee is responsible for the pre-approval of all audit and permitted non-audit services to be performed for the Company by the independent auditors. All of the fees paid to the independent auditors that are shown in the chart above for 2023 were approved by the Audit Committee in accordance with the procedures described below.
The Audit Committee reviews at its meetings audit and non-audit services proposed to be provided by the independent registered public accounting firm. The Audit Committee has delegated to the Chair, or an alternate member of the Audit Committee, the authority to grant pre-approvals if either deems it necessary or appropriate to consider a pre-approval request without a meeting of the full Audit Committee. Pre-approvals by the Chair or alternate member are reviewed with the Audit Committee at its next regularly scheduled meeting.
In considering the pre-approval of proposed audit or non-audit services by the independent auditors, management reviews with the Audit Committee or its delegate, a description of and the budget for the proposed service and the reasons that the independent auditors are being requested to provide the services, including any possible impact on the independence of the independent auditors. Additional Audit Committee approval is required if the pre-approved services exceed the pre-approved budgeted amount for the services.
2024 Proxy Statement |
| 105 |
Audit Matters
Audit Committee Report
Notwithstanding anything to the contrary set forth in any of our previous or future filings under the Securities Act of 1933 or the Exchange Act that might incorporate this proxy statement or future filings with the Securities and Exchange Commission, in whole or part, the following report shall not be deemed to be incorporated by reference into any such filing.
The Audit Committee has reviewed and discussed our unaudited financial statements for the quarters ended March 31, June 30 and September 30, 2023 and our December 31, 2023 audited financial statements with management and with Ernst & Young LLP, our independent accountants. Each member of the Audit Committee is “independent” in accordance with the applicable corporate governance listing standards of the NYSE.
The Audit Committee has also discussed with Ernst & Young LLP the matters required to be discussed by Auditing Standard No. 1301, Communications with Audit Committees, as adopted by the Public Company Accounting Oversight Board.
In addition, the Audit Committee has received from Ernst & Young LLP the written disclosures required by Rule 3526 of the Public Company Accounting Oversight Board, Communication with Audit Committees Concerning Independence, regarding their independence, and has discussed with Ernst & Young LLP their independence relative to us, including whether the provision of their services is compatible with maintaining Ernst & Young LLP’s independence.
Based on the review and discussions referred to above, the Audit Committee recommended to the board that the December 31, 2023 audited financial statements be included in our Annual Report on Form 10-K filed with the Securities and Exchange Commission.
AUDIT COMMITTEE
Diane M. Morefield, Chair
Katherine A. Cattanach
Clint D. McDonnough
Kevin C. Nickelberry
2024 Proxy Statement |
| 106 |
The following table sets forth the shares of our common stock beneficially owned by (1) each of our directors, (2) the named executive officers, (3) all of our directors and executive officers as a group, and (4) all persons known by us to beneficially own more than 5% of our outstanding voting stock. We have determined the beneficial ownership shown on this table in accordance with the rules of the SEC. Under those rules, shares are considered beneficially owned if held by the person indicated, or if such person, directly or indirectly, through any contract, arrangement, understanding, relationship or otherwise has or shares the power to vote, to direct the voting of and/or to dispose of or to direct the disposition of such security. Except as otherwise indicated in the accompanying footnotes, beneficial ownership is shown as of March 25, 2024.
Amount and Nature of Beneficial Ownership
|
|
| Shares for |
| Shares for Which |
|
| ||||||
Which Beneficial | Beneficial Ownership | Total Beneficial | |||||||||||
Shares | Ownership can be | can be Acquired | Ownership | ||||||||||
Beneficially | Unexercised | Acquired Within | upon Redemption of | Number of | Percent of | ||||||||
Name of Beneficial Owner | Owned(1) | Options | 60 Days | Partnership Interests(2) | Shares(3) | Class(3)(4) | |||||||
Thomas W. Toomey(5) |
| 939,716 |
| — |
| — |
| 3,995,369 |
| 4,935,085 | 1.48 | % | |
James D. Klingbeil(6) |
| 132,093 |
| — |
| — |
| 2,404,329 |
| 2,536,422 | * | ||
Joseph D. Fisher |
| 4,085 |
| — |
| — |
| 2,402,487 |
| 2,406,572 | * | ||
Harry G. Alcock |
| 40,276 |
| — |
| — |
| 1,171,242 |
| 1,211,518 | * | ||
Jon A. Grove |
| 447,268 |
| — |
| — |
| 172,335 |
| 619,603 | * | ||
Michael D. Lacy |
| 13,066 |
| — |
| — |
| 359,347 |
| 372,413 | * | ||
Katherine A. Cattanach |
| 88,308 |
| — |
| — |
| 37,676 |
| 125,984 | * | ||
Clint D. McDonnough |
| 8,496 |
| — |
| — |
| 116,742 |
| 125,238 | * | ||
Mark R. Patterson |
| 8,983 |
| — |
| — |
| 101,055 |
| 110,038 | * | ||
Mary Ann King |
| 2,549 |
| — |
| — |
| 107,400 |
| 109,949 | * | ||
Robert A. McNamara |
| 27,172 |
| 29,738 |
| — |
| 30,790 |
| 87,700 | * | ||
Diane M. Morefield |
| 1,556 |
| — |
| — |
| 43,605 |
| 45,161 | * | ||
Kevin C. Nickelberry |
| 1,400 |
| — |
| — |
| 19,176 |
| 20,576 | * | ||
All directors and executive officers as a group (13 persons) |
| 1,714,968 |
| 29,738 |
| — |
| 10,961,553 |
| 12,706,259 | 3.73 | % | |
The Vanguard Group(7) |
| 50,829,739 |
| — |
| — |
| — |
| 50,829,739 | 15.43 | % | |
BlackRock, Inc.(8) |
| 34,675,552 |
| — |
| — |
| — |
| 34,675,552 | 10.53 | % | |
Norges Bank(10) |
| 27,826,628 |
| — |
| — |
| — |
| 27,826,628 | 8.45 | % | |
Cohen & Steers, Inc.(9) |
| 27,047,814 |
| — |
| — |
| — |
| 27,047,814 | 8.21 | % | |
State Street Corporation(11) |
| 22,569,005 |
| — |
| — |
| — |
| 22,569,005 | 6.85 | % | |
| * | Represents beneficial ownership of less than 1%, based on 329,329,213 shares of common stock outstanding as of March 25, 2024. On March 25, 2024, there were 2,686,308 shares of our Series E preferred stock and 11,785,976 shares of our Series F preferred stock outstanding. |
| (1) | In addition to the shares of common stock beneficially owned, Mr. Klingbeil is deemed to beneficially own indirectly 2,221,214 shares of our Series F preferred stock held by certain trusts, limited partnerships, limited liability companies and other entities, or 18.85% of our outstanding Series F preferred stock. |
2024 Proxy Statement |
| 107 |
Security Ownership of Certain Beneficial Owners And Management
| (2) | This column includes the number of shares of the Company’s common stock that could be issued if the operating partnership units (“OP Units”) of United Dominion Realty, L.P., a Delaware limited partnership (the “Operating Partnership”), beneficially owned by a person listed in the table are redeemed, and the Company elects to issue shares of common stock in exchange for the OP Units rather than pay cash upon such redemption. A holder of OP Units has the right to require the Operating Partnership to redeem all or a portion of the OP Units held by the holder in exchange for a cash payment based on the market value of our common stock at the time of redemption; however, the Operating Partnership’s obligation to pay the cash amount is subject to the prior right of the Company to acquire such OP Units in exchange for either the cash amount or shares of our common stock. This column also includes the number of shares of common stock that could be issued if vested LTIP Units beneficially owned by a person listed in the table were to convert those LTIP Units into OP Units and those OP Units are redeemed, and the Company elects to issue shares of common stock in exchange for the OP Units rather than pay cash upon such redemption, because vested LTIP Units can be converted into OP Units, provided that such LTIP Units have been outstanding for at least two years from the date of grant. Class 1 LTIP Units and Class 1 Performance LTIP Units vest on the first anniversary of the grant date. The Class 2 LTIP Units and Class 2 Performance LTIP Units are granted at the maximum potential amount that could vest upon the achievement of pre-established performance metrics for the applicable performance period, subject to continued employment. If the pre-established performance metrics for the applicable performance period are achieved at less than the maximum level, then a corresponding number of Class 2 LTIP Units and Class 2 Performance LTIP Units are forfeited in accordance with the terms of the awards. Further, in order for the Class 1 Performance LTIP Units or the Class 2 Performance LTIP Units to have value to the holder, the price of our common stock on the date of conversion of the Class 1 Performance LTIP Units or the Class 2 Performance LTIP Units into OP Units has to exceed the price of our common stock as of the date of grant. Therefore, the amount of Class 1 Performance LTIP Units, Class 2 LTIP Units and Class 2 Performance LTIP Units that a person listed in the table could convert into OP Units and, upon redemption of such OP Units, the number of shares that the Company could elect to issue in exchange for such OP Units, could be lower than the number of shares of common stock reported in the table. |
| (3) | Such beneficial ownership calculations assume that all OP Units beneficially owned by the person indicated and outstanding as of March 25, 2024, are redeemed in exchange for shares of common stock (notwithstanding any holding period requirements, payment of exercise price or exchange rights). See Notes (2) and (6). |
| (4) | Based on 329,329,213 shares of common stock outstanding at the close of business on March 25, 2024. Shares issuable upon redemption of the OP Units are deemed outstanding for computing the percentage of the person holding such shares, but are not deemed outstanding for computing the percentage of any other person. |
| (5) | Includes 110,000 shares of common stock indirectly held in a trust for Mr. Toomey’s children. |
| (6) | Mr. Klingbeil is deemed to indirectly beneficially own 909,236 shares of common stock into which OP Units directly owned by certain trusts, limited partnerships, limited liability companies and other entities are redeemable if the Company elects to issue shares of common stock rather than pay cash on such redemption. Includes 592,663 OP Units owned directly by Mr. Klingbeil that were pledged as security for a line of credit, as well as 442,291 OP Units that were pledged as security for a line of credit by companies wholly-owned by Mr. Klingbeil. In connection with the OP Units, Mr. Klingbeil and certain of such trusts, limited partnerships, limited liability companies and other entities have entered into certain reimbursement agreements with us pursuant to which such entities may be required to reimburse us if certain debt owed to us by the Operating Partnership is not paid. |
| (7) | Beneficial ownership is as of December 29, 2023, as reflected in a statement on Schedule 13G filed by The Vanguard Group (“Vanguard”) with the SEC on February 13, 2024. Vanguard has its principal business office at 100 Vanguard Blvd., Malvern, Pennsylvania 19355. Vanguard has shared power to vote or direct the voting of 669,793 shares of common stock owned. Vanguard has the sole power to dispose of 49,230,418 shares of common stock owned and the shared power to dispose of 1,599,321 shares of common stock owned. |
| (8) | Beneficial ownership is as of December 31, 2023, as reflected in a statement on Schedule 13G filed by BlackRock, Inc. (“BlackRock”) with the SEC on January 24, 2024. BlackRock has its principal business office at 50 Hudson Yards, New York, New York 10001. BlackRock has the sole power to vote or direct the voting of 31,363,719 shares of common stock owned and the sole power to dispose of 34,675,552 shares of common stock owned. BlackRock is the beneficial owner as a result of being a parent company or control person of the following subsidiaries, each of which holds less than 5% of the outstanding shares of common stock: BlackRock (Luxembourg) S.A.; BlackRock (Netherlands) B.V.; BlackRock (Singapore) Limited; BlackRock Advisors (UK) Limited; BlackRock Advisors, LLC; BlackRock Asset Management Canada Limited; BlackRock Asset Management Ireland Limited; BlackRock Asset Management North Asia Limited; BlackRock Asset Management Schweiz AG; BlackRock Financial Management, Inc.; BlackRock Fund Advisors; BlackRock Fund Managers Ltd; BlackRock Institutional Trust Company, National Association; BlackRock Investment Management (Australia) Limited; BlackRock Investment Management (UK) Limited; BlackRock Investment Management, LLC; BlackRock Japan Co., Ltd; BlackRock Life Limited; and Aperio Group, LLC. |
| (9) | Beneficial ownership is as of December 31, 2023, as reflected in a statement on Schedule 13G filed by Norges Bank (“Norges”) with the SEC on February 13, 2024. Norges has its principal business office at Bankplassen 2, PO Box 1179 Sentrum, NO 0107 Oslo, Norway. Norges has the sole power to vote or direct the voting of 27,826,628 shares of common stock owned and the sole power to dispose of 27,826,628 shares of common stock owned. |
| (10) | Beneficial ownership is as of December 31, 2023, as reflected in a statement on Schedule 13G filed by Cohen & Steers, Inc. (“C&S”) with the SEC on February 14, 2024. According to such Schedule 13G, C&S, a parent holding company, reported that it has sole power to vote or direct the voting of 18,956,124 shares of common stock and sole dispositive power with respect to 27,047,814 shares of common stock. Cohen & Steers Capital Management, Inc. (“CSCA”), a wholly-owned subsidiary of C&S and an investment adviser registered under Section 203 of the Investment Advisers Act of 1940, reported that it has sole voting power with respect to 18,889,993 shares and sole dispositive power with respect to 26,909,044 shares. Cohen & Steers UK Limited, a wholly-owned subsidiary of C&S and an investment adviser registered under Section 203 of the Investment Advisers Act of 1940, reported that it has sole voting power with respect to 48,073 shares |
2024 Proxy Statement |
| 108 |
Security Ownership of Certain Beneficial Owners And Management
| and sole dispositive power with respect to 120,712 shares. Cohen & Steers Ireland Limited, a wholly-owned subsidiary of C&S, reported that it has sole voting power with respect to 18,058 shares and sole dispositive power with respect to 18,058 shares. The address for each of C&S and CSCA is 1166 Avenue of the Americas, 30th Floor, New York, New York 10036. The address for Cohen & Steers UK Limited is 50 Pall Mall, 7th Floor, London, United Kingdom SW1Y 5JH. The address for Cohen & Steers Ireland Ltd. is 77 Sir John Rogerson’s Quay, Block C, Grand Canal Docklands, Dublin 2 D02 VK60. |
| (11) | Beneficial ownership is as of December 31, 2023, as reflected in a statement on Schedule 13G filed by State Street Corporation (“State Street”) with the SEC on January 29, 2024. State Street has its principal business office at State Street Financial Center, One Congress Street, Boston, Massachusetts 02114. State Street has the shared power to vote or direct the voting of 14,026,198 shares of common stock owned and the shared power to dispose of 22,513,058 shares of common stock owned. State Street is the beneficial owner as a result of being a parent company or control person of the following direct or indirect subsidiaries: SSGA Funds Management, Inc.; State Street Global Advisors Europe Limited; State Street Global Advisors Limited; State Street Global Advisors Trust Company; State Street Global Advisors, Australia, Limited; State Street Global Advisors (Japan) Co., Ltd.; State Street Global Advisors Asia Limited; State Street Global Advisors, Ltd.; and State Street Global Advisors Singapore Limited. |
2024 Proxy Statement |
| 109 |
Why did you provide this proxy statement to me?
We are providing this proxy statement and proxy card to you on the Internet or, upon your request, we are sending printed versions of this proxy statement and proxy card to you by mail, because you owned shares of our common stock and/or our Series E preferred stock or our Series F preferred stock at the close of business on March 25, 2024, which is the record date for the meeting. This proxy statement describes matters on which we would like you, as a shareholder, to vote. It also gives you information on these matters so that you can make an informed decision.
The holders of shares of our common stock and our Series E and Series F preferred stock outstanding at the close of business on the record date are entitled to receive notice of the meeting and are entitled to one vote for each share held on each proposal presented at the meeting. Cumulative voting is not permitted. At the record date of March 25, 2024, we had 329,329,213 shares of common stock issued and outstanding, 2,686,308 shares of our Series E preferred stock issued and outstanding and 11,785,976 shares of Series F preferred stock issued and outstanding. We have no non-voting stock issued or outstanding and, as we are a Maryland corporation which does not recognize treasury stock, we have no treasury shares.
When you vote, you appoint James D. Klingbeil and Thomas W. Toomey, or either of them, as your representatives at the meeting. Messrs. Klingbeil and Toomey will vote your shares at the meeting as you instructed them when you voted. This way, your shares will be voted whether or not you attend the meeting. Even if you plan to attend the meeting, you should vote by telephone, through the Internet or, if you have requested and received a paper copy of the proxy statement, by completing, signing and returning the paper proxy card enclosed with this proxy statement in advance of the meeting, in case your plans change.
Why did I receive a one-page notice in the mail regarding the Internet availability of proxy materials instead of a full set of proxy materials?
In accordance with rules and regulations adopted by the SEC, instead of mailing a printed copy of our proxy materials to each shareholder of record, we may furnish proxy materials, including this proxy statement and our 2023 Annual Report, by providing access to such documents on the Internet. Most shareholders will not receive printed copies of the proxy materials unless they request them, in which case printed copies of the proxy materials will be provided at no charge.
Instead of mailing a printed copy of our proxy materials to each shareholder of record, a Notice of Internet Availability of Proxy Materials (the “Notice of Internet Availability”) was mailed to such shareholders on or about March 25, 2024, that instructs you as to how you may access and review all of the proxy materials on the Internet. The Notice of Internet Availability also instructs you as to how you may submit your proxy on the Internet or by telephone.
Any shareholder may request to receive proxy materials in printed form by mail or electronically by e-mail on an ongoing basis by following the instructions set forth in the Notice of Internet Availability. Choosing to receive future proxy materials by e-mail will save us the cost of printing and delivering documents to shareholders and will reduce the environmental impact of our annual meetings. A shareholder’s election to receive proxy materials by e-mail will remain in effect until the shareholder terminates the election.
What constitutes a quorum in order to hold and transact business at the meeting?
The presence, in person or by proxy, of holders of at least a majority of the total number of shares of our outstanding common stock, Series E preferred stock and Series F preferred stock, taken together, as of the record date, constitutes a quorum that is required to hold the meeting and to conduct business. If a quorum is not present at the meeting, the meeting may be adjourned from time to time until a quorum is obtained. Your shares will be counted as being present at the meeting if you vote your shares in person at the meeting, if you vote your shares by telephone or through the Internet, or if you submit a properly executed proxy card. Votes against a particular proposal will be counted to determine the presence of a quorum. Abstentions, broker non-votes, which are explained below, and shares as to which authority to vote on any proposal is withheld, are each included in the determination of the number of shares present at the meeting for purposes of obtaining a quorum. Each will be tabulated separately.
2024 Proxy Statement |
| 110 |
Frequently Asked Questions About the Annual Meeting
How do I vote?
For Shares Directly Registered in Your Name: |
| If you hold your shares in your own name as holder of record with EQ Shareowner Services, there are four different ways to vote: | |
| Internet You can go to www.proxyvote.com and vote through the Internet. | ||
| Telephone You can submit your vote by proxy over the telephone by following the instructions provided on the separate proxy card if you received a printed set of the proxy materials. | ||
| If you have requested and received a paper copy of the proxy statement, you can mark, sign, date and return the paper proxy card enclosed with the proxy statement in the postage-paid envelope that we have provided to you. Please note that if you vote through the Internet or by telephone, you do not need to return your proxy card. | ||
| In person If you are a shareholder as of the record date, you may vote in person at the meeting. Submitting a proxy prior to the meeting will not prevent a shareholder from attending the meeting and voting in person. | ||
All valid proxies received and not revoked prior to the meeting will be voted in accordance with each shareholder’s instructions. | |||
For Shares Held in “Street Name:” | If your shares are held by a brokerage firm, bank or other nominee (i.e., in “street name”), you will receive instructions from your nominee that you must follow in order to have your shares voted. “Street name” shareholders who wish to vote in person at the meeting will need to obtain a proxy form from the brokerage firm, bank or other nominee that holds their shares of record. In addition, a number of brokers and banks are participating in a program provided through Broadridge Financial Solutions, Inc. (“Broadridge”) that offers telephone and Internet voting options. This program is different from the program provided by EQ Shareowner Services for shares registered directly in the name of the shareholder. If your shares are held in an account with a broker or a bank participating in the Broadridge program, you may vote those shares telephonically by calling the telephone number shown on the voting form received from your broker or bank, or via the Internet at the Broadridge voting website (www.proxyvote.com). | ||
How will my proxy be voted?
All shares represented by properly executed proxies received in time for the meeting will be voted at the meeting in accordance with the instructions marked thereon or otherwise as provided therein, unless such proxies have previously been revoked. Unless instructions to the contrary are marked, or if no instructions are specified, shares represented by proxies will be voted:
| ● | FOR the election of all nominees for director. |
| ● | FOR the approval, on an advisory basis, of the compensation of our named executive officers disclosed in this proxy statement. |
| ● | FOR the ratification of the appointment of Ernst & Young LLP as our independent registered public accounting firm for fiscal 2024. |
Will other matters be voted on at the annual meeting?
We have not received notice of any other matters that may properly be presented at the meeting. However, if a matter comes up for vote at the meeting that is not described in this proxy statement or listed on the proxy card, Messrs. Klingbeil and Toomey will vote your shares, under your proxy, in their discretion. It is the intention of Messrs. Klingbeil and Toomey to vote the shares they represent as directed by the board.
2024 Proxy Statement |
| 111 |
Frequently Asked Questions About the Annual Meeting
Can I revoke my proxy and change my vote?
Yes. If you are a record holder of your shares, you may revoke your proxy at any time prior to the date of the meeting by:
| ● | submitting a later-dated vote in person at the meeting, through the Internet, by telephone or, if you originally voted by returning a paper proxy card to us, by mail; or |
| ● | delivering instructions to the attention of the Corporate Secretary at 1745 Shea Center Drive, Suite 200, Highlands Ranch, Colorado 80129-1540. Any notice of revocation sent to us must include the shareholder’s name and must be received prior to the date of the meeting to be effective. |
If you hold your shares in “street name,” you should follow the directions provided by your broker or other nominee regarding how to revoke your proxy.
What vote is required for the proposals if a quorum is present?
| ● | The affirmative vote of a majority of the votes cast is required for the election of a director in Proposal No. 1. |
| ● | The affirmative vote of a majority of the votes cast is required to approve, on an advisory basis, the compensation of our named executive officers disclosed in this proxy statement, as specified in Proposal No. 2. |
| ● | The affirmative vote of a majority of the votes cast is required to approve Proposal No. 3, the ratification of the appointment of Ernst & Young LLP as our independent registered public accounting firm for fiscal 2024. |
What is an abstention, and how will it affect the vote on a proposal?
An “abstention” occurs when the beneficial owner of shares is present, in person or by proxy, and entitled to vote at the meeting (or when a nominee holding shares for a beneficial owner is present and entitled to vote at the meeting), but such person does not vote on the particular proposal. For purposes of Proposal Nos. 1, 2, and 3, abstentions will not be counted as votes cast and will have no effect on the results of the vote with respect to such proposals. Abstentions will be considered present for the purpose of determining the presence of a quorum.
What are broker non-votes, and how will they affect the vote on a proposal?
A “broker non-vote” occurs when a broker or other nominee holding shares for a beneficial owner does not vote on a particular proposal because the nominee does not have the discretionary voting power with respect to that proposal and has not received instructions from the beneficial owner. Under applicable rules, brokers or other nominees have discretionary voting power with respect to matters that are considered routine, but not with respect to non-routine matters. A broker or other nominee cannot vote without instructions on non-routine matters; therefore, there may be broker non-votes on any such proposals. Broker non-votes will have no effect on the voting results for Proposal Nos. 1, 2, and 3. Broker non-votes will be considered present for the purpose of determining the presence of a quorum.
The effect of broker non-votes is summarized in the table below:
| Proposal No. 1: |
| Proposal No. 2: |
| Proposal No. 3: |
| |
Status of the matter | Non-Routine | Non-Routine | Routine | ||||
Possibility of broker non-votes on the Proposal | Yes | Yes | No | ||||
Status of broker non-votes for purposes of determining whether shareholder approval has been obtained for the Proposal | Broker non-votes are not deemed to be votes cast | Broker non-votes are not deemed to be votes cast | N/A | ||||
Status of broker non-votes for quorum purposes | Considered present | Considered present | N/A |
Who will tabulate the votes?
Broadridge will tabulate votes cast by proxy by an automated system. Votes cast by proxy or in person at the meeting will be counted by the persons appointed by us to act as election inspectors for the meeting.
2024 Proxy Statement |
| 112 |
Frequently Asked Questions About the Annual Meeting
Who is soliciting the proxy, and who will pay for the proxy solicitation?
This solicitation is being made on behalf of our board but may also be made without additional remuneration by our officers or employees by telephone, telegraph, facsimile transmission, e-mail or personal interview. We will bear the expense of the preparation, printing and delivery of the enclosed form of proxy, notice of annual meeting of shareholders and this proxy statement and any additional materials relating to the meeting that may be furnished to our shareholders by our board subsequent to the furnishing of this proxy statement. We will reimburse banks and brokers who hold shares in their name or custody, or in the name of nominees for others, for their out-of-pocket expenses incurred in forwarding copies of the proxy materials to those persons for whom they hold such shares. To obtain the necessary representation of shareholders at the meeting, supplementary solicitations may be made by mail, telephone or interview by our officers or employees, without additional compensation.
Where do I find the voting results of the meeting?
We will announce the preliminary voting results at the meeting and publish the final results in a Current Report on Form 8-K filed with the SEC within four business days following the meeting.
2024 Proxy Statement |
| 113 |
Delinquent Section 16(a) Reports
Mr. Toomey reported on Form 5 a late-reported gift of 100,000 Class 2 LTIP Units to two grantor retained annuity trusts that occurred on November 15, 2023.
Delivery of Voting Materials
To reduce the expense of delivering duplicate materials to our shareholders, we are delivering one copy of the Notice of Internet Availability to shareholders who share the same address unless otherwise requested. The Notice of Internet Availability will instruct you as to how you may access and review all of the proxy materials on the Internet. The Notice of Internet Availability also instructs you as to how you may submit your proxy through the Internet. If you would like to receive a paper or e-mail copy of the proxy materials, you should follow the instructions for requesting such materials in the Notice of Internet Availability.
If you share an address with another shareholder and have received only one copy of the Notice of Internet Availability and would like to request a separate copy of the Notice of Internet Availability, you may write or call us to request a separate copy of the Notice of Internet Availability at no cost to you. For future annual meetings, you may request a separate copy of the Notice of Internet Availability or request that we only send one copy of the Notice of Internet Availability to you if you are receiving multiple copies by calling us at (720) 283-6120 or by writing to us to the attention of Investor Relations, 1745 Shea Center Drive, Suite 200, Highlands Ranch, Colorado 80129-1540.
Annual Report
We will, upon written request and without charge, provide to any person solicited hereunder, a copy of our Annual Report on Form 10-K for the year ended December 31, 2023, including financial statements and financial statement schedules, as filed with the SEC. Requests should be addressed to the attention of Investor Relations, 1745 Shea Center Drive, Suite 200, Highlands Ranch, Colorado 80129-1540.
Shareholder Proposals for the 2025 Annual Meeting of Shareholders
The submission deadline for shareholder proposals to be included in our proxy materials for the 2025 annual meeting of shareholders pursuant to Rule 14a-8 under the Exchange Act is December 5, 2024, except as may otherwise be provided in Rule 14a-8. All such proposals must be in writing and should be sent to our Corporate Secretary at 1745 Shea Center Drive, Suite 200, Highlands Ranch, Colorado 80129-1540.
Advance Notice Procedures for the 2025 Annual Meeting of Shareholders
In accordance with our bylaws, any shareholder who intends to submit a proposal at our 2025 annual meeting of shareholders, or bring a director nominee before the meeting, must, in addition to complying with applicable laws and regulations and the requirements of our bylaws, provide written notice to us for consideration no sooner than November 5, 2024 and no later than December 5, 2024. Such notice should be sent to our Corporate Secretary at 1745 Shea Center Drive, Suite 200, Highlands Ranch, Colorado 80129-1540. Please refer to the full text of our advance notice Bylaw provisions for additional information and requirements. A copy of our bylaws may be obtained by writing to our Corporate Secretary at the address listed above or by visiting the Investor Relations page of our website at ir.udr.com and then clicking on “Corporate Governance.” In addition, shareholders who intend to solicit proxies in support of director nominees other than the Company’s nominees must comply with the additional requirements of Rule 14a-19(b) under the Exchange Act.
2024 Proxy Statement |
| 114 |
Other Matters
Proxy Access Procedures for the 2025 Annual Meeting of Shareholders
In order to be eligible to require that the Company include an eligible shareholder nominee in the proxy materials for the 2025 annual meeting of shareholders pursuant to Section 2.15 of the Company’s bylaws, an eligible shareholder must provide to the Company, in proper form and within the times specified, (i) a written notice expressly electing to have such shareholder nominee included in the Company’s proxy materials pursuant to Section 2.15 (a “Notice of Proxy Access Nomination”) and (ii) any updates or supplements to such Notice of Proxy Access Nomination. To be timely, the Notice of Proxy Access Nomination must be so delivered or mailed to and received at the principal executive offices of the Company not less than one hundred twenty (120) days (December 5, 2024) nor more than one hundred fifty (150) days (November 5, 2024) prior to the one-year anniversary of the date on which the Company first mailed its proxy materials for the 2024 annual meeting of shareholders. In addition, shareholders who intend to solicit proxies in support of a shareholder nominee must also comply with the additional requirements of Rule 14a-19(b). Notice should be sent to our Corporate Secretary at 1745 Shea Center Drive, Suite 200, Highlands Ranch, Colorado 80129-1540. Please refer to the full text of our advance notice Bylaw provisions for additional information and requirements. A copy of our bylaws may be obtained by writing to our Corporate Secretary at the address listed above or by visiting the Investor Relations page of our website at ir.udr.com and then clicking on “Corporate Governance.”
It is important that proxies be returned promptly. We depend upon all shareholders promptly signing and returning the enclosed proxy to avoid costly solicitation. You can save us considerable expense by signing and returning your proxy at once. You may also vote electronically through the Internet or by telephone as shown on the enclosed proxy card and as discussed above. We intend to hold our annual meeting in person. However, in the event it is not possible or advisable to hold our annual meeting in person, we will announce alternative arrangements for the meeting as promptly as practicable, which may include holding the meeting by means of remote communication. Please monitor our annual meeting website at https://www.udr.com/2024annualmeeting for updated information. If you are planning to attend our meeting, please check the website one week prior to the meeting date. |
Dated: April 4, 2024
For the Board of Directors
UDR, INC.

WARREN L. TROUPE
CORPORATE SECRETARY
2024 Proxy Statement |
| 115 |
Definitions of Same-Store, Net Operating Income (“NOI”) and Funds from Operations as Adjusted (“FFOA”) for the year ended December 31, 2023 are contained in either the Company's 2023 Annual Report on Form 10-K filed on February 20, 2024, or in its earnings press release and supplementary financial information furnished on a Current Report on Form 8-K filed on February 6, 2024.
Consolidated Fixed Charge Coverage Ratio - adjusted for non-recurring items: The Company defines Consolidated Fixed Charge Coverage Ratio - adjusted for non-recurring items as Consolidated Interest Coverage Ratio - adjusted for non-recurring items divided by total consolidated interest, excluding the impact of costs associated with debt extinguishment, plus preferred dividends.
Management considers Consolidated Fixed Charge Coverage Ratio - adjusted for non-recurring items a useful metric for investors as it provides ratings agencies, investors and lending partners with a widely-used measure of the Company’s ability to service its consolidated debt obligations as well as compare leverage against that of its peer REITs. A reconciliation of the components that comprise Consolidated Fixed Charge Coverage Ratio - adjusted for non-recurring items is provided below (dollars in thousands).
Consolidated Interest Coverage Ratio - adjusted for non-recurring items: The Company defines Consolidated Interest Coverage Ratio - adjusted for non-recurring items as Consolidated EBITDAre – adjusted for non-recurring items divided by total consolidated interest, excluding the impact of costs associated with debt extinguishment.
Management considers Consolidated Interest Coverage Ratio - adjusted for non-recurring items a useful metric for investors as it provides ratings agencies, investors and lending partners with a widely-used measure of the Company’s ability to service its consolidated debt obligations as well as compare leverage against that of its peer REITs. A reconciliation of the components that comprise Consolidated Interest Coverage Ratio - adjusted for non-recurring items is provided below (dollars in thousands).
Consolidated Net Debt-to-EBITDAre - adjusted for non-recurring items: The Company defines Consolidated Net Debt-to-EBITDAre - adjusted for non-recurring items as total consolidated debt net of cash and cash equivalents divided by annualized Consolidated EBITDAre - adjusted for non-recurring items. Consolidated EBITDAre - adjusted for non-recurring items is defined as EBITDAre excluding the impact of income/(loss) from unconsolidated entities, adjustments to reflect the Company’s share of EBITDAre of unconsolidated joint ventures and other non-recurring items including, but not limited to casualty-related charges/ (recoveries), net of wholly owned communities.
Management considers Consolidated Net Debt-to-EBITDAre - adjusted for non-recurring items a useful metric for investors as it provides ratings agencies, investors and lending partners with a widely-used measure of the Company’s ability to service its consolidated debt obligations as well as compare leverage against that of its peer REITs. A reconciliation between net income/ (loss) and Consolidated EBITDAre - adjusted for non-recurring items is provided below (dollars in thousands).
Controllable Expenses: The Company refers to property operating and maintenance expenses as Controllable Expenses.
Controllable Operating Margin: The Company defines Controllable Operating Margin as (i) rental income less Controllable Expenses (ii) divided by rental income. Management considers Controllable Operating Margin a useful metric as it provides investors with an indicator of the Company’s ability to limit the growth of expenses that are within the control of the Company.
Earnings Before Interest, Taxes, Depreciation and Amortization for Real Estate (EBITDAre): The Company defines EBITDAre as net income/(loss) (computed in accordance GAAP), plus interest expense, including costs associated with debt extinguishment, plus real estate depreciation and amortization, plus other depreciation and amortization, plus (minus) income tax provision/(benefit), net, (minus) plus net gain/(loss) on the sale of depreciable real estate owned, plus impairment write-downs of depreciable real estate, plus the adjustments to reflect the Company’s share of EBITDAre of unconsolidated joint ventures. The Company computes EBITDAre in accordance with standards established by the National Association of Real Estate Investment Trusts, or NAREIT, which may not be comparable to EBITDAre reported by other REITs that do not compute EBITDAre in accordance with the NAREIT definition, or that interpret the NAREIT definition differently than the Company does. The White Paper on EBITDAre was approved by the Board of Governors of NAREIT in September 2017.
2024 Proxy Statement |
| 116 |
Definitions
Management considers EBITDAre a useful metric for investors as it provides an additional indicator of the Company’s ability to incur and service debt, and enables investors to assess our performance against that of its peer REITs. EBITDAre should be considered along with, but not as an alternative to, net income and cash flow as a measure of the Company’s activities in accordance with GAAP. EBITDAre does not represent cash generated from operating activities in accordance with GAAP and is not necessarily indicative of funds available to fund our cash needs. A reconciliation between net income/(loss) and EBITDAre is provided below (dollars in thousands).
A reconciliation between Net income/(loss) and EBITDAre and a reconciliation of the components that comprise Consolidated Fixed Charge Coverage Ratio - adjusted for non-recurring items, Consolidated Interest Coverage Ratio - adjusted for non-recurring items and Consolidated Net Debt-to-EBITDAre - adjusted for non-recurring items is provided below (dollars in thousands).
| Quarter Ended |
| ||
December 31, 2023 |
| |||
Net income/(loss) | $ | 35,961 | ||
Adjustments: |
| |||
Interest expense, including debt extinguishment and other associated costs |
| 47,347 | ||
Real estate depreciation and amortization |
| 170,643 | ||
Other depreciation and amortization |
| 4,397 | ||
Tax provision/(benefit), net |
| 93 | ||
Net (gain)/loss on the sale of depreciable real estate owned |
| (25,308) | ||
Net (gain)/loss on consolidation | 24,257 | |||
Adjustments to reflect the Company’s share of EBITDAre of unconsolidated joint ventures |
| 17,533 | ||
EBITDAre | $ | 274,923 | ||
Casualty-related charges/(recoveries), net |
| (224) | ||
Legal and other costs | 3,763 | |||
Severance costs |
| 4,164 | ||
Unrealized (gain)/loss on real estate technology investments |
| 9,821 | ||
Realized (gain)/loss on real estate technology investments |
| (13,124) | ||
(Income)/loss from unconsolidated entities |
| (4,038) | ||
Adjustments to reflect the Company’s share of EBITDAre of unconsolidated joint ventures |
| (17,533) | ||
Management fee expense on unconsolidated joint ventures |
| (798) | ||
Consolidated EBITDAre - adjusted for non-recurring items | $ | 256,954 | ||
Annualized consolidated EBITDAre - adjusted for non-recurring items | $ | 1,027,816 | ||
Interest expense, including with debt extinguishment and other associated costs |
| 47,347 | ||
Capitalized interest expense |
| 2,893 | ||
Total interest | $ | 50,240 | ||
Preferred dividends | $ | 1,222 | ||
Total debt | $ | 5,798,709 | ||
Cash |
| (2,922) | ||
Net debt | $ | 5,795,787 | ||
Consolidated Interest Coverage Ratio - adjusted for non-recurring items |
| 5.1 | x | |
Consolidated Fixed Charge Coverage Ratio - adjusted for non-recurring items |
| 5.0 | x | |
Consolidated Net Debt-to-EBITDAre - adjusted for non-recurring items |
| 5.6 | x | |
2024 Proxy Statement |
| 117 |
Definitions
The following tables outline our reconciliation of Net income/(loss) attributable to common stockholders to FFO, FFO as Adjusted, and FFOA for the years ended December 31, 2023, 2022, 2021, 2020, 2019, 2018, 2017, 2016, 2015, and 2014 (dollars in thousands):
Year Ended December 31, | ||||||||||||||||
| 2023 |
| 2022 |
| 2021 |
| 2020 |
| 2019 | |||||||
Net income/(loss) attributable to common stockholders | $ | 439,505 | $ | 82,512 | $ | 145,787 | $ | 60,036 | $ | 180,861 | ||||||
Real estate depreciation and amortization |
| 676,419 |
| 665,228 |
| 606,648 |
| 608,616 |
| 501,257 | ||||||
Noncontrolling interests |
| 30,135 |
| 5,655 |
| 10,977 |
| 4,704 |
| 14,614 | ||||||
Real estate depreciation and amortization on unconsolidated joint ventures |
| 42,622 |
| 30,062 |
| 31,967 |
| 35,023 |
| 57,954 | ||||||
Cumulative effect of change in accounting principle |
| — |
| — |
| — |
| — |
| — | ||||||
Net (gain)/loss on consolidation | 24,257 | — | — | — | — | |||||||||||
Net (gain)/loss on the sale of unconsolidated depreciable property |
| — |
| — |
| (2,460) |
| — |
| (125,407) | ||||||
Net (gain)/loss on the sale of depreciable real estate owned, net of tax |
| (349,993) |
| (25,494) |
| (136,001) |
| (118,852) |
| — | ||||||
FFO attributable to common stockholders and unitholders, basic | $ | 862,945 | $ | 757,963 | $ | 656,918 | $ | 589,527 | $ | 629,279 | ||||||
Distributions to preferred stockholders ‒ Series E (Convertible) |
| 4,848 |
| 4,412 |
| 4,229 |
| 4,230 |
| 4,104 | ||||||
FFO attributable to common stockholders and unitholders, diluted | $ | 867,793 | $ | 762,375 | $ | 661,147 | $ | 593,757 | $ | 633,383 | ||||||
Income/(loss) per weighted average common share, diluted | $ | 1.34 | $ | 0.26 | $ | 0.48 | $ | 0.20 | $ | 0.63 | ||||||
FFO per weighted average common share and unit, basic | $ | 2.46 | $ | 2.21 | $ | 2.04 | $ | 1.86 | $ | 2.04 | ||||||
FFO per weighted average common share and unit, diluted | $ | 2.45 | $ | 2.20 | $ | 2.02 | $ | 1.85 | $ | 2.03 | ||||||
Weighted average number of common shares and OP/DownREIT Units outstanding ‒ basic |
| 351,175 |
| 343,149 |
| 322,744 |
| 316,855 |
| 308,020 | ||||||
Weighted average number of common shares, OP/DownREIT Units, and common stock equivalents outstanding ‒ diluted |
| 354,422 |
| 347,094 |
| 327,039 |
| 320,187 |
| 311,799 | ||||||
2024 Proxy Statement |
| 118 |
Definitions
Year Ended December 31, | |||||||||||||||
| 2023 |
| 2022 |
| 2021 |
| 2020 |
| 2019 | ||||||
Impact of adjustments to FFO: |
|
|
|
|
|
|
|
|
|
| |||||
Debt extinguishment and other associated costs | $ | — | $ | — | $ | 42,336 | $ | 49,190 | $ | 29,594 | |||||
Debt extinguishment and other associated costs on unconsolidated joint ventures |
| — |
| — |
| 1,682 |
| — |
| — | |||||
Variable upside participation on DCP, net |
| (204) |
| (10,622) |
| — |
| — |
| — | |||||
Acquisition‒related costs/(fees) |
| — |
| — |
| — |
| — |
| — | |||||
Texas joint venture promote and disposition fee income |
| — |
| — |
| — |
| — |
| — | |||||
Long‒term incentive plan transition costs |
| — |
| — |
| — |
| — |
| — | |||||
Promoted interest on settlement of note receivable, net of tax |
| — |
| — |
| — |
| — |
| (6,482) | |||||
Legal and other |
| 2,869 |
| 1,493 |
| 5,319 |
| 8,973 |
| 3,660 | |||||
Net gain on the sale of non-depreciable real estate owned |
| — |
| — |
| — |
| — |
| (5,282) | |||||
Net loss on sale of unconsolidated land |
| — |
| — |
| — |
| — |
| — | |||||
Net gain on prepayment of note receivable |
| — |
| — |
| — |
| — |
| — | |||||
Realized (gain)/loss on real estate technology investments, net of tax |
| (9,864) |
| (6,992) |
| (1,980) |
| 1,005 |
| — | |||||
Unrealized (gain)/loss on real estate technology investments, net of tax |
| 6,813 |
| 52,663 |
| (55,947) |
| (4,587) |
| (3,300) | |||||
Joint venture development success fee |
| — |
| — |
| — |
| — |
| (3,750) | |||||
Severance costs |
| 4,164 |
| 441 |
| 2,280 |
| 1,948 |
| 390 | |||||
Tax benefit associated with the conversion of certain TRS entities into REITs |
| — |
| — |
| — |
| — |
| — | |||||
Casualty-related charges/(recoveries), net |
| 3,138 |
| 9,733 |
| 3,960 |
| 2,545 |
| 636 | |||||
Casualty-related charges/(recoveries) on unconsolidated joint ventures, net |
| — |
| — |
| — |
| 31 |
| (374) | |||||
$ | 6,916 | $ | 46,716 | $ | (2,350) | $ | 59,105 | $ | 15,092 | ||||||
FFOA attributable to common stockholders and unitholders, diluted | $ | 874,709 | $ | 809,091 | $ | 658,797 | $ | 652,862 | $ | 648,475 | |||||
FFOA per weighted average common share and unit, diluted | $ | 2.47 | $ | 2.33 | $ | 2.01 | $ | 2.04 | $ | 2.08 | |||||
Recurring capital expenditures |
| (90,917) |
| (77,710) |
| (63,820) |
| (56,924) |
| (51,246) | |||||
AFFO attributable to common stockholders and unitholders, diluted | $ | 783,792 | $ | 731,381 | $ | 594,977 | $ | 595,938 | $ | 597,229 | |||||
AFFO per weighted average common share and unit, diluted | $ | 2.21 | $ | 2.11 | $ | 1.82 | $ | 1.86 | $ | 1.92 | |||||
2024 Proxy Statement |
| 119 |
Definitions
| 2018 |
| 2017 |
| 2016 |
| 2015 |
| 2014 | ||||||
Net income/(loss) attributable to common stockholders | $ | 199,238 | $ | 117,850 | $ | 289,001 | $ | 336,661 | $ | 150,610 | |||||
Real estate depreciation and amortization |
| 429,006 |
| 430,054 |
| 419,615 |
| 374,598 |
| 358,154 | |||||
Noncontrolling interests |
| 18,436 |
| 11,097 |
| 27,662 |
| 16,776 |
| 5,508 | |||||
Real estate depreciation and amortization on unconsolidated joint ventures |
| 61,871 |
| 57,102 |
| 47,832 |
| 38,652 |
| 42,133 | |||||
Cumulative effect of change in accounting principle |
| (2,100) |
| — |
| — |
| — |
| — | |||||
Net (gain)/loss on consolidation | — | — |
| — |
| — |
| — | |||||||
Net (gain)/loss on the sale of unconsolidated depreciable property |
| — |
| (35,363) |
| (47,848) |
| (59,445) |
| — | |||||
Net (gain)/loss on the sale of depreciable real estate owned, net of tax |
| (136,197) |
| (41,824) |
| (209,166) |
| (251,677) |
| (144,703) | |||||
FFO attributable to common stockholders and unitholders, basic | $ | 570,254 | $ | 538,916 | $ | 527,096 | $ | 455,565 | $ | 411,702 | |||||
Distributions to preferred stockholders ‒ Series E (Convertible) |
| 3,868 |
| 3,708 |
| 3,717 |
| 3,722 |
| 3,724 | |||||
FFO attributable to common stockholders and unitholders, diluted | $ | 574,122 | $ | 542,624 | $ | 530,813 | $ | 459,287 | $ | 415,426 | |||||
Income/(loss) per weighted average common share, diluted | $ | 0.74 | $ | 0.44 | $ | 1.08 | $ | 1.29 | $ | 0.59 | |||||
FFO per weighted average common share and unit, basic | $ | 1.95 | $ | 1.85 | $ | 1.81 | $ | 1.68 | $ | 1.58 | |||||
FFO per weighted average common share and unit, diluted | $ | 1.93 | $ | 1.83 | $ | 1.80 | $ | 1.66 | $ | 1.56 | |||||
Weighted average number of common shares and OP/DownREIT Units outstanding ‒ basic |
| 292,727 |
| 291,845 |
| 290,516 |
| 271,616 |
| 260,775 | |||||
Weighted average number of common shares and OP/DownREIT Units, and common stock equivalents outstanding ‒ diluted |
| 297,042 |
| 296,672 |
| 295,469 |
| 276,699 |
| 265,728 | |||||
Impact of adjustments to FFO: |
|
|
|
|
|
|
|
|
| ||||||
Debt extinguishment and other associated costs | $ | 3,299 | $ | 9,212 | $ | 1,729 | $ | — | $ | 192 | |||||
Debt extinguishment and other associated costs on unconsolidated joint ventures |
| 177 |
| — |
| — |
| — |
| — | |||||
Variable upside participation on DCP, net |
| — |
| — |
| — |
| — |
| — | |||||
Acquisition‒related costs/(fees) |
| — |
| 371 |
| 213 |
| 3,586 |
| 442 | |||||
Texas joint venture promote and disposition fee income |
| — |
| — |
| — |
| (10,005) |
| — | |||||
2024 Proxy Statement |
| 120 |
Definitions
| 2018 |
| 2017 |
| 2016 |
| 2015 |
| 2014 | ||||||
Long‒term incentive plan transition costs |
| — |
| — |
| 898 |
| 3,537 |
| — | |||||
Promoted interest on settlement of note receivable, net of tax |
| — |
| — |
| — |
| — |
| — | |||||
Legal and other |
| 1,622 |
| — |
| (480) |
| 705 |
| — | |||||
Net gain on the sale of non‒depreciable real estate owned |
| — |
| (1,580) |
| (1,685) |
| — |
| 1,056 | |||||
Net loss on sale of unconsolidated land |
| — |
| — |
| 1,016 |
| — |
| — | |||||
Net gain on prepayment of note receivable |
| — |
| — |
| — |
| — |
| (8,411) | |||||
Realized (gain)/loss on real estate technology investments, net of tax |
| — |
| — |
| — |
| — |
| — | |||||
Unrealized (gain)/loss on real estate technology investments, net of tax |
| — |
| — |
| — |
| — |
| — | |||||
Joint venture development success fee |
| — |
| — |
| — |
| — |
| — | |||||
Severance costs |
| 114 |
| 624 |
| 871 |
| — |
| — | |||||
Tax benefit associated with the conversion of certain TRS entities into REITs |
| — |
| — |
| (2,436) |
| — |
| (5,770) | |||||
Casualty‒related charges/(recoveries), net |
| 2,364 |
| 4,504 |
| 732 |
| 2,335 |
| 541 | |||||
Casualty‒related charges/(recoveries) on unconsolidated joint ventures, net |
| — |
| (881) |
| (3,752) |
| 2,474 |
| — | |||||
$ | 7,576 | $ | 12,250 | $ | (2,894) | $ | 2,632 | $ | (11,950) | ||||||
FFOA attributable to common stockholders and unitholders, diluted | $ | 581,698 | $ | 554,874 | $ | 527,919 | $ | 461,919 | $ | 403,476 | |||||
FFOA per weighted average common share and unit, diluted | $ | 1.96 | $ | 1.87 | $ | 1.79 | $ | 1.67 | $ | 1.52 | |||||
Recurring capital expenditures |
| (46,915) |
| (46,034) |
| (47,257) |
| (45,467) |
| (43,921) | |||||
AFFO attributable to common stockholders and unitholders, diluted | $ | 354,783 | $ | 508,840 | $ | 480,662 | $ | 416,452 | $ | 359,555 | |||||
AFFO per weighted average common share and unit, diluted | $ | 1.80 | $ | 1.72 | $ | 1.63 | $ | 1.51 | $ | 1.35 | |||||
2024 Proxy Statement |
| 121 |
Definitions
The following tables are our reconciliation of FFO share information to weighted average common shares outstanding, basic and diluted, for the years ended December 31, 2023, 2022, 2021, 2020, 2019, 2018, 2017, 2016, 2015, and 2014 (shares in thousands):
Year Ended December 31, | ||||||||||
| 2023 |
| 2022 |
| 2021 |
| 2020 |
| 2019 | |
Weighted average number of common shares and OP/DownREIT Units outstanding — basic |
| 351,175 |
| 343,149 |
| 322,744 |
| 316,855 |
| 308,020 |
Weighted average number of OP/DownREIT Units outstanding |
| (22,410) |
| (21,478) |
| (22,418) |
| (22,310) |
| (22,773) |
Weighted average number of common shares outstanding — basic |
| 328,765 |
| 321,671 |
| 300,326 |
| 294,545 |
| 285,247 |
Weighted average number of common shares, OP/DownREIT Units, and common stock equivalents outstanding — diluted |
| 354,422 |
| 347,094 |
| 327,039 |
| 320,187 |
| 311,799 |
Weighted average number of OP/DownREIT Units outstanding |
| (22,410) |
| (21,478) |
| (22,418) |
| (22,310) |
| (22,773) |
Weighted average number of Series E Cumulative Convertible Preferred shares outstanding |
| (2,908) |
| (2,916) |
| (2,918) |
| (2,950) |
| (3,011) |
Weighted average number of common shares outstanding — diluted |
| 329,104 |
| 322,700 |
| 301,703 |
| 294,927 |
| 286,015 |
Year Ended December 31, | ||||||||||
| 2018 |
| 2017 |
| 2016 |
| 2015 |
| 2014 | |
Weighted average number of common shares and OP/DownREIT Units outstanding — basic |
| 292,727 |
| 291,845 |
| 290,516 |
| 271,616 |
| 260,775 |
Weighted average number of OP/DownREIT Units outstanding |
| (24,548) |
| (24,821) |
| (25,130) |
| (12,947) |
| (9,247) |
Weighted average number of common shares outstanding — basic |
| 268,179 |
| 267,024 |
| 265,386 |
| 258,669 |
| 251,528 |
Weighted average number of common shares, OP/DownREIT Units, and common stock equivalents outstanding — diluted |
| 297,042 |
| 296,672 |
| 295,469 |
| 276,699 |
| 265,728 |
Weighted average number of OP/DownREIT Units outstanding |
| (24,548) |
| (24,821) |
| (25,130) |
| (12,947) |
| (9,247) |
Weighted average number of Series E Cumulative Convertible Preferred shares outstanding |
| (3,011) |
| (3,021) |
| (3,028) |
| — |
| (3,036) |
Weighted average number of common shares outstanding — diluted |
| 269,483 |
| 268,830 |
| 267,311 |
| 263,752 |
| 253,445 |
2024 Proxy Statement |
| 122 |
This Proxy Statement contains forward-looking statements within the meaning of Section 27A of the Securities Act of 1933 and Section 21E of the Exchange Act. Such forward-looking statements include, without limitation, statements concerning property acquisitions and dispositions, development activity and capital expenditures, capital raising activities, rent growth, occupancy, and rental expense growth. Words such as “expects,” “anticipates,” “intends,” “plans,” “likely,” “will,” “believes,” “seeks,” “estimates,” and variations of such words and similar expressions are intended to identify such forward-looking statements. Such statements involve known and unknown risks, uncertainties and other factors which may cause our actual results, performance or achievements to be materially different from the results of operations or plans expressed or implied by such forward-looking statements.
The following factors, among others, could cause our future results to differ materially from those expressed in the forward-looking statements:
| ● | general market and economic conditions; |
| ● | the impact of inflation/deflation; |
| ● | unfavorable changes in apartment market and economic conditions that could adversely affect occupancy levels and rental rates; |
| ● | the failure of acquisitions, developments or redevelopments to achieve anticipated results; |
| ● | possible difficulty in selling apartment communities; |
| ● | competitive factors that may limit our ability to lease apartment homes or increase or maintain rents; |
| ● | insufficient cash flow that could affect our debt financing and create refinancing risk; |
| ● | failure to generate sufficient revenue, which could impair our debt service payments and distributions to stockholders; |
| ● | development and construction risks that may impact our profitability; |
| ● | potential damage from natural disasters, including hurricanes and other weather-related events, which could result in substantial costs to us; |
| ● | risks from climate change that impacts our properties or operations; |
| ● | risks from extraordinary losses for which we may not have insurance or adequate reserves; |
| ● | risks from cybersecurity breaches of our information technology systems and the information technology systems of our third party vendors and other third parties; |
| ● | the availability of capital and the stability of the capital markets; |
| ● | changes in job growth, home affordability and the demand/supply ratio for multifamily housing; |
| ● | the failure of automation or technology to help grow net operating income; |
| ● | uninsured losses due to insurance deductibles, self-insurance retention, uninsured claims or casualties, or losses in excess of applicable coverage; |
| ● | delays in completing developments and lease-ups on schedule or at expected rent and occupancy levels; |
| ● | our failure to succeed in new markets; |
2024 Proxy Statement |
| 123 |
Appendix A: Forward Looking Statements
| ● | risks that third parties who have an interest in or are otherwise involved in projects in which we have an interest, including mezzanine borrowers, joint venture partners or other investors, do not perform as expected; |
| ● | changing interest rates, which could increase interest costs and affect the market price of our securities; |
| ● | potential liability for environmental contamination, which could result in substantial costs to us; |
| ● | the imposition of federal taxes if we fail to qualify as a REIT under the Code in any taxable year; |
| ● | our internal control over financial reporting may not be considered effective which could result in a loss of investor confidence in our financial reports, and in turn have an adverse effect on our stock price; and |
| ● | changes in real estate laws, tax laws, rent control or stabilization laws or other laws affecting our business. |
A discussion of these and other factors affecting our business and prospects is set forth in Part I, Item 1A. Risk Factors of our Annual Report/Form 10-K for the year ended December 31, 2023. We encourage investors to review these risk factors.
Although we believe that the assumptions underlying the forward-looking statements contained herein are reasonable, any of the assumptions could be inaccurate, and therefore such statements included in this Proxy Statement may not prove to be accurate. In light of the significant uncertainties inherent in the forward-looking statements included herein, the inclusion of such information should not be regarded as a representation by us or any other person that the results or conditions described in such statements or our objectives and plans will be achieved.
Forward-looking statements and such risks, uncertainties and other factors speak only as of the date of this Proxy Statement, and we expressly disclaim any obligation or undertaking to update or revise any forward-looking statement contained herein, to reflect any change in our expectations with regard thereto, or any other change in events, conditions or circumstances on which any such statement is based, except to the extent otherwise required by law.
2024 Proxy Statement |
| 124 |
| Signature [PLEASE SIGN WITHIN BOX] Date Signature (Joint Owners) Date TO VOTE, MARK BLOCKS BELOW IN BLUE OR BLACK INK AS FOLLOWS: KEEP THIS PORTION FOR YOUR RECORDS DETACH AND RETURN THIS PORTION ONLY THIS PROXY CARD IS VALID ONLY WHEN SIGNED AND DATED. V39276-P01903 For Against Abstain For Against Abstain ! ! ! ! ! ! ! ! ! ! ! ! ! ! ! ! ! ! ! ! ! ! ! ! ! ! ! ! ! ! ! ! ! ! ! ! UDR, INC. UDR, INC. 1745 SHEA CENTER DRIVE SUITE 200 HIGHLANDS RANCH, CO 80129 1. ELECTION OF DIRECTORS The Board of Directors recommends that you vote "FOR" each of the nominees listed in Item 1: 1a. Katherine A. Cattanach Nominees: 1c. Mary Ann King 1b. Jon A. Grove 1f. Robert A. McNamara 1d. James D. Klingbeil 1e. Clint D. McDonnough 1h. Kevin C. Nickelberry 1i. Mark R. Patterson 1g. Diane M. Morefield 1j. Thomas W. Toomey Please sign exactly as your name(s) appear(s) hereon. All holders must sign. When signing as attorney, executor, administrator, or other fiduciary, please give full title as such. Joint owners should each sign personally. If a corporation, please sign in full corporate name by authorized officer. If a partnership, please sign in partnership name by authorized person. The Board of Directors recommends that you vote "FOR" Items 2 and 3: NOTE: The shares represented by this proxy when properly executed will be voted in the manner directed herein by the undersigned Shareholder(s). If no direction is made, this proxy will be voted "FOR" each of the nominees listed in Item 1 and "FOR" Items 2 and 3. If any other matters properly come before the meeting or any adjournment of the meeting, the person(s) named in this proxy will vote in their discretion. 3. To ratify the appointment of Ernst & Young LLP to serve as independent registered public accounting firm for the year ending December 31, 2024. 2. Advisory vote to approve named executive officer compensation. 4. To transact such other business as may properly come before the meeting and any adjournment or postponement of the meeting. VOTE BY INTERNET - www.proxyvote.com or scan the QR Barcode above Use the Internet to transmit your voting instructions and for electronic delivery of information. Vote by 11:59 P.M. Eastern Time on May 22, 2024 for shares held directly and by 11:59 P.M. Eastern Time on May 20, 2024 for shares held in a Plan. Have your proxy card in hand when you access the web site and follow the instructions to obtain your records and to create an electronic voting instruction form. ELECTRONIC DELIVERY OF FUTURE SHAREHOLDER COMMUNICATIONS If you would like to reduce the costs incurred by UDR, Inc. in mailing proxy materials, you can consent to receiving all future proxy statements, proxy cards and annual reports electronically via e-mail or the Internet. To sign up for electronic delivery, please follow the instructions above to vote using the Internet and, when prompted, indicate that you agree to receive or access Shareholder Communications electronically in future years. VOTE BY PHONE - 1-800-690-6903 Use any touch-tone telephone to transmit your voting instructions. Vote by 11:59 P.M. Eastern Time on May 22, 2024 for shares held directly and by 11:59 P.M. Eastern Time on May 20, 2024 for shares held in a Plan. Have your proxy card in hand when you call and then follow the instructions. VOTE BY MAIL Mark, sign and date your proxy card and return it in the postage-paid envelope we have provided or return it to UDR, Inc. c/o Broadridge, 51 Mercedes Way, Edgewood, NY 11717. SCAN TO VIEW MATERIALS & VOTEw |
| V39277-P01903 Important Notice Regarding the Availability of Proxy Materials for the Annual Meeting: UDR, Inc.'s Notice of Annual Meeting and Proxy Statement, Form 10-K for the year ended December 31, 2023 and Shareholder Letter are available on the Internet at www.proxyvote.com. UDR, INC. ANNUAL MEETING OF SHAREHOLDERS May 23, 2024 10:00 a.m., Local Time Four Seasons Hotel 1111 14th Street Denver, CO 80202 This proxy is solicited on behalf of the Board of Directors of UDR, Inc. for use at the Annual Meeting on May 23, 2024. The shares of stock held in the account or in a dividend reinvestment account will be voted as you specify on the reverse side. If no choice is specified, the proxy will be voted "FOR" each of the nominees listed in Item 1 and "FOR" Items 2 and 3. By signing the proxy, you (i) acknowledge receipt of the notice of annual meeting of shareholders and proxy statement, each dated April 4, 2024, (ii) revoke all prior proxies, and (iii) appoint James D. Klingbeil and Thomas W. Toomey, or either of them, as proxies and attorneys-in-fact, each with the power to appoint his substitute and hereby authorize(s) them to represent and to vote the shares which you would be entitled to vote if then and there personally present on the matters shown on the reverse side and any other matters which may come before the Annual Meeting and any adjournment thereof. See reverse for voting instructions. CONTINUED AND TO BE SIGNED ON REVERSE SIDE UDR, INC. THIS PROXY IS SOLICITED ON BEHALF OF THE BOARD OF DIRECTORS ANNUAL MEETING OF SHAREHOLDERS MAY 23, 2024 The shareholder(s) hereby appoint(s) James D. Klingbeil and Thomas W. Toomey, or either of them, as proxies and attorneys-in-fact, each with the power to appoint his substitute and hereby authorize(s) them to represent and to vote, as designated on the reverse side of this proxy card, all of the shares of common stock, Series E preferred stock or Series F preferred stock of UDR, Inc. that the shareholder(s) is/are entitled to vote at the Annual Meeting of Shareholders to be held at 10:00 a.m., Local Time on May 23, 2024, at the Four Seasons Hotel, 1111 14th Street, Denver, CO 80202, and any adjournment or postponement thereof. THIS PROXY, WHEN PROPERLY EXECUTED, WILL BE VOTED AS DIRECTED BY THE SHAREHOLDER(S). IF NO SUCH DIRECTIONS ARE MADE, THIS PROXY WILL BE VOTED "FOR" EACH OF THE NOMINEES LISTED ON THE REVERSE SIDE FOR THE ELECTION OF DIRECTORS AND "FOR" ITEMS 2 AND 3. PLEASE MARK, SIGN, DATE AND RETURN THIS PROXY CARD PROMPTLY USING THE ENCLOSED REPLY ENVELOPE. |