Table of Contents
UNITED STATES
SECURITIES AND EXCHANGE COMMISSION
Washington, D.C. 20549
Form 10-Q
| x | QUARTERLY REPORT PURSUANT TO SECTION 13 OR 15(d) OF THE SECURITIES EXCHANGE ACT OF 1934 |
For the quarterly period ended June 30, 2012
OR
| ¨ | TRANSITION REPORT PURSUANT TO SECTION 13 OR 15(d) OF THE SECURITIES EXCHANGE ACT OF 1934 |
For the transition period from to
Commission File Number 001-31617
Bristow Group Inc.
(Exact name of registrant as specified in its charter)
| Delaware | 72-0679819 | |
| (State or other jurisdiction of incorporation or organization) |
(IRS Employer Identification Number) | |
| 2103 City West Blvd., 4th Floor Houston, Texas |
77042 | |
| (Address of principal executive offices) | (Zip Code) | |
Registrant’s telephone number, including area code: (713) 267-7600
None
(Former name, former address and former fiscal year, if changed since last report)
Indicate by check mark whether the registrant: (1) has filed all reports required to be filed by Section 13 or 15(d) of the Securities Exchange Act of 1934 during the preceding 12 months (or for such shorter period that the registrant was required to file such reports), and (2) has been subject to such filing requirements for the past 90 days. Yes x No ¨
Indicate by check mark whether the registrant has submitted electronically and posted on its corporate Web site, if any, every Interactive Data File required to be submitted and posted pursuant to Rule 405 of Regulation S-T during the preceding 12 months (or for such shorter period that the registrant was required to submit and post such files). Yes x No ¨
Indicate by check mark whether the registrant is a large accelerated filer, an accelerated filer, a non-accelerated filer, or a smaller reporting company. See definitions of “large accelerated filer,” “accelerated filer” and “smaller reporting company” in Rule 12b-2 of the Exchange Act.
| Large accelerated filer | x | Accelerated filer | ¨ | |||
| Non-accelerated filer | ¨ (Do not check if a smaller reporting company) | Smaller reporting company | ¨ | |||
Indicate by check mark whether the registrant is a shell company (as defined in Rule 12b-2 of the Exchange Act). ¨ Yes x No
Indicate the number shares outstanding of each of the issuer’s classes of Common Stock, as of August 1, 2012.
35,750,092 shares of Common Stock, $.01 par value
Table of Contents
BRISTOW GROUP INC.
| Page | ||||||
| PART I | ||||||
| Item 1. | 1 | |||||
| Item 2. | Management’s Discussion and Analysis of Financial Condition and Results of Operations |
31 | ||||
| Item 3. | 50 | |||||
| Item 4. | 50 | |||||
| PART II | ||||||
| Item 1. | 51 | |||||
| Item 1A. | 51 | |||||
| Item 2. | 51 | |||||
| Item 3. | 51 | |||||
| Item 4. | 51 | |||||
| Item 5. | 51 | |||||
| Item 6. | 52 | |||||
| Signatures | 53 | |||||
Table of Contents
PART I — FINANCIAL INFORMATION
BRISTOW GROUP INC. AND SUBSIDIARIES
Condensed Consolidated Statements of Income
| Three Months Ended | ||||||||
| June 30, | ||||||||
| 2012 | 2011 | |||||||
| (Unaudited) | ||||||||
| (In thousands, except per share amounts) |
||||||||
| Gross revenue: |
||||||||
| Operating revenue from non-affiliates |
$ | 314,849 | $ | 277,029 | ||||
| Operating revenue from affiliates |
5,805 | 9,732 | ||||||
| Reimbursable revenue from non-affiliates |
41,954 | 34,301 | ||||||
| Reimbursable revenue from affiliates |
— | 43 | ||||||
|
|
|
|
|
|||||
| 362,608 | 321,105 | |||||||
|
|
|
|
|
|||||
| Operating expense: |
||||||||
| Direct cost |
222,768 | 196,622 | ||||||
| Reimbursable expense |
40,172 | 33,134 | ||||||
| Depreciation and amortization |
21,372 | 22,708 | ||||||
| General and administrative |
34,977 | 39,645 | ||||||
|
|
|
|
|
|||||
| 319,289 | 292,109 | |||||||
|
|
|
|
|
|||||
| Gain (loss) on disposal of assets |
(5,315 | ) | 1,416 | |||||
| Earnings from unconsolidated affiliates, net of losses |
1,989 | 5,993 | ||||||
|
|
|
|
|
|||||
| Operating income |
39,993 | 36,405 | ||||||
| Interest income |
88 | 171 | ||||||
| Interest expense |
(8,774 | ) | (8,955 | ) | ||||
| Other income (expense), net |
(931 | ) | 204 | |||||
|
|
|
|
|
|||||
| Income before provision for income taxes |
30,376 | 27,825 | ||||||
| Provision for income taxes |
(6,180 | ) | (6,606 | ) | ||||
|
|
|
|
|
|||||
| Net income |
24,196 | 21,219 | ||||||
| Net income attributable to noncontrolling interests |
(534 | ) | (174 | ) | ||||
|
|
|
|
|
|||||
| Net income attributable to Bristow Group |
$ | 23,662 | $ | 21,045 | ||||
|
|
|
|
|
|||||
| Earnings per common share: |
||||||||
| Basic |
$ | 0.66 | $ | 0.58 | ||||
|
|
|
|
|
|||||
| Diluted |
$ | 0.65 | $ | 0.57 | ||||
|
|
|
|
|
|||||
| Cash dividends declared per common share |
$ | 0.20 | $ | 0.15 | ||||
|
|
|
|
|
|||||
The accompanying notes are an integral part of these condensed consolidated financial statements.
1
Table of Contents
BRISTOW GROUP INC. AND SUBSIDIARIES
Condensed Consolidated Statements of Comprehensive Income
| Three Months Ended | ||||||||
| June 30, | ||||||||
| 2012 | 2011 | |||||||
| (Unaudited) | ||||||||
| (In thousands) | ||||||||
| Net income |
$ | 24,196 | $ | 21,219 | ||||
| Other comprehensive income (loss): |
||||||||
| Currency translation adjustments |
305 | (1,364 | ) | |||||
| Unrealized gain on cash flow hedges, net of tax provision of zero and $0.9 million, respectively |
— | 1,653 | ||||||
|
|
|
|
|
|||||
| Total comprehensive income |
24,501 | 21,508 | ||||||
| Total comprehensive income attributable to noncontrolling interests |
(534 | ) | (174 | ) | ||||
|
|
|
|
|
|||||
| Total comprehensive income attributable to Bristow Group |
$ | 23,967 | $ | 21,334 | ||||
|
|
|
|
|
|||||
The accompanying notes are an integral part of these condensed consolidated financial statements.
2
Table of Contents
BRISTOW GROUP INC. AND SUBSIDIARIES
Condensed Consolidated Balance Sheets
| June 30, | March 31, | |||||||
| 2012 | 2012 | |||||||
| (Unaudited) | ||||||||
| (In thousands) | ||||||||
| ASSETS | ||||||||
| Current assets: |
||||||||
| Cash and cash equivalents |
$ | 227,250 | $ | 261,550 | ||||
| Accounts receivable from non-affiliates |
287,131 | 280,985 | ||||||
| Accounts receivable from affiliates |
4,828 | 5,235 | ||||||
| Inventories |
157,543 | 157,825 | ||||||
| Assets held for sale |
18,100 | 18,710 | ||||||
| Prepaid expenses and other current assets |
12,239 | 12,168 | ||||||
|
|
|
|
|
|||||
| Total current assets |
707,091 | 736,473 | ||||||
| Investment in unconsolidated affiliates |
201,042 | 205,100 | ||||||
| Property and equipment – at cost: |
||||||||
| Land and buildings |
81,816 | 80,835 | ||||||
| Aircraft and equipment |
2,143,073 | 2,099,642 | ||||||
|
|
|
|
|
|||||
| 2,224,889 | 2,180,477 | |||||||
| Less – Accumulated depreciation and amortization |
(467,887 | ) | (457,702 | ) | ||||
|
|
|
|
|
|||||
| 1,757,002 | 1,722,775 | |||||||
| Goodwill |
29,339 | 29,644 | ||||||
| Other assets |
45,905 | 46,371 | ||||||
|
|
|
|
|
|||||
| Total assets |
$ | 2,740,379 | $ | 2,740,363 | ||||
|
|
|
|
|
|||||
| LIABILITIES AND STOCKHOLDERS’ INVESTMENT | ||||||||
| Current liabilities: |
||||||||
| Accounts payable |
$ | 57,876 | $ | 56,084 | ||||
| Accrued wages, benefits and related taxes |
42,815 | 44,325 | ||||||
| Income taxes payable |
9,910 | 9,732 | ||||||
| Other accrued taxes |
6,653 | 5,486 | ||||||
| Deferred revenue |
12,914 | 14,576 | ||||||
| Accrued maintenance and repairs |
16,182 | 14,252 | ||||||
| Accrued interest |
7,950 | 2,300 | ||||||
| Other accrued liabilities |
26,615 | 23,005 | ||||||
| Deferred taxes |
14,963 | 15,070 | ||||||
| Short-term borrowings and current maturities of long-term debt |
16,562 | 14,375 | ||||||
|
|
|
|
|
|||||
| Total current liabilities |
212,440 | 199,205 | ||||||
| Long-term debt, less current maturities |
719,737 | 742,870 | ||||||
| Accrued pension liabilities |
109,792 | 111,742 | ||||||
| Other liabilities and deferred credits |
14,823 | 16,768 | ||||||
| Deferred taxes |
142,388 | 147,954 | ||||||
| Commitments and contingencies (Note 6) |
||||||||
| Stockholders’ investment: |
||||||||
| Common stock, $.01 par value, authorized 90,000,000; outstanding: 35,749,889 as of June 30 and 35,755,317 as of March 31 (exclusive of 1,291,741 treasury shares) |
363 | 363 | ||||||
| Additional paid-in capital |
705,984 | 703,628 | ||||||
| Retained earnings |
1,009,952 | 993,435 | ||||||
| Accumulated other comprehensive loss |
(158,934 | ) | (159,239 | ) | ||||
| Treasury shares, at cost (526,895 shares) |
(25,085 | ) | (25,085 | ) | ||||
|
|
|
|
|
|||||
| Total Bristow Group Inc. stockholders’ investment |
1,532,280 | 1,513,102 | ||||||
| Noncontrolling interests |
8,919 | 8,722 | ||||||
|
|
|
|
|
|||||
| Total stockholders’ investment |
1,541,199 | 1,521,824 | ||||||
|
|
|
|
|
|||||
| Total liabilities and stockholders’ investment |
$ | 2,740,379 | $ | 2,740,363 | ||||
|
|
|
|
|
|||||
The accompanying notes are an integral part of these condensed consolidated financial statements.
3
Table of Contents
BRISTOW GROUP INC. AND SUBSIDIARIES
Condensed Consolidated Statements of Cash Flows
| Three Months Ended | ||||||||
| June 30, | ||||||||
| 2012 | 2011 | |||||||
| (In thousands) | ||||||||
| Cash flows from operating activities: |
||||||||
| Net income |
$ | 24,196 | $ | 21,219 | ||||
| Adjustments to reconcile net income to net cash provided by operating activities: |
||||||||
| Depreciation and amortization |
21,372 | 22,708 | ||||||
| Deferred income taxes |
(6,071 | ) | 2,949 | |||||
| Discount amortization on long-term debt |
870 | 822 | ||||||
| Loss (gain) on disposal of assets |
5,315 | (1,416 | ) | |||||
| Stock-based compensation |
2,848 | 5,196 | ||||||
| Equity in earnings from unconsolidated affiliates less than (in excess of) dividends received |
4,129 | (1,393 | ) | |||||
| Tax benefit related to stock-based compensation |
(404 | ) | (101 | ) | ||||
| Increase (decrease) in cash resulting from changes in: |
||||||||
| Accounts receivable |
(10,081 | ) | 10,640 | |||||
| Inventories |
(1,869 | ) | (5,420 | ) | ||||
| Prepaid expenses and other assets |
3,816 | 3,701 | ||||||
| Accounts payable |
960 | (5,527 | ) | |||||
| Accrued liabilities |
11,212 | 459 | ||||||
| Other liabilities and deferred credits |
(881 | ) | (948 | ) | ||||
|
|
|
|
|
|||||
| Net cash provided by operating activities |
55,412 | 52,889 | ||||||
| Cash flows from investing activities: |
||||||||
| Capital expenditures |
(86,555 | ) | (72,235 | ) | ||||
| Proceeds from asset dispositions |
20,227 | 833 | ||||||
| Investment in unconsolidated affiliates |
(850 | ) | — | |||||
|
|
|
|
|
|||||
| Net cash used in investing activities |
(67,178 | ) | (71,402 | ) | ||||
| Cash flows from financing activities: |
||||||||
| Proceeds from borrowings |
— | 55,000 | ||||||
| Repayment of debt |
(21,800 | ) | (31,274 | ) | ||||
| Partial prepayment of put/call obligation |
(17 | ) | (15 | ) | ||||
| Common stock dividends paid |
(7,145 | ) | (5,410 | ) | ||||
| Issuance of common stock |
311 | 1,183 | ||||||
| Tax benefit related to stock-based compensation |
404 | 101 | ||||||
|
|
|
|
|
|||||
| Net cash provided by (used in) financing activities |
(28,247 | ) | 19,585 | |||||
| Effect of exchange rate changes on cash and cash equivalents |
5,713 | (363 | ) | |||||
|
|
|
|
|
|||||
| Net increase (decrease) in cash and cash equivalents |
(34,300 | ) | 709 | |||||
| Cash and cash equivalents at beginning of period |
261,550 | 116,361 | ||||||
|
|
|
|
|
|||||
| Cash and cash equivalents at end of period |
$ | 227,250 | $ | 117,070 | ||||
|
|
|
|
|
|||||
| Supplemental disclosure of non-cash investing activities: |
||||||||
| Cash paid during the period for: |
||||||||
| Interest |
$ | 3,124 | $ | 3,612 | ||||
| Income taxes |
$ | 6,498 | $ | 5,121 | ||||
The accompanying notes are an integral part of these condensed consolidated financial statements.
4
Table of Contents
BRISTOW GROUP INC. AND SUBSIDIARIES
NOTES TO CONDENSED CONSOLIDATED FINANCIAL STATEMENTS
(Unaudited)
Note 1 — BASIS OF PRESENTATION, CONSOLIDATION AND SUMMARY OF SIGNIFICANT ACCOUNTING POLICIES
The condensed consolidated financial statements include the accounts of Bristow Group Inc. and its consolidated entities (“Bristow Group,” the “Company,” “we,” “us,” or “our”) after elimination of all significant intercompany accounts and transactions. Our fiscal year ends March 31, and we refer to fiscal years based on the end of such period. Therefore, the fiscal year ending March 31, 2013 is referred to as “fiscal year 2013.” Pursuant to the rules and regulations of the U.S. Securities and Exchange Commission (“SEC”), the information contained in the following notes to condensed consolidated financial statements is condensed from that which would appear in the annual consolidated financial statements; accordingly, the condensed consolidated financial statements included herein should be read in conjunction with the consolidated financial statements and related notes thereto contained in our fiscal year 2012 Annual Report (the “fiscal year 2012 Financial Statements”). Operating results for the interim period presented are not necessarily indicative of the results that may be expected for the entire fiscal year.
The condensed consolidated financial statements included herein are unaudited; however, they include all adjustments of a normal recurring nature which, in the opinion of management, are necessary for a fair presentation of the consolidated financial position of the Company as of June 30, 2012, the consolidated results of operations for the three months ended June 30, 2012 and 2011, and the consolidated cash flows for the three months ended June 30, 2012 and 2011.
5
Table of Contents
BRISTOW GROUP INC. AND SUBSIDIARIES
NOTES TO CONDENSED CONSOLIDATED FINANCIAL STATEMENTS — (Continued)
(Unaudited)
Foreign Currency
See “Foreign Currency” in Note 1 to the fiscal year 2012 Financial Statements for a discussion of the related accounting policies. During the three months ended June 30, 2012 and 2011, our primary foreign currency exposure was to the British pound sterling, the euro, the Australian dollar and the Nigerian naira. The value of these currencies has fluctuated relative to the U.S. dollar as indicated in the following table:
| Three Months Ended | ||||||||
| June 30, | ||||||||
| 2012 | 2011 | |||||||
| One British pound sterling into U.S. dollars |
||||||||
| High |
1.62 | 1.66 | ||||||
| Average |
1.58 | 1.63 | ||||||
| Low |
1.53 | 1.60 | ||||||
| At period-end |
1.57 | 1.61 | ||||||
| One euro into U.S. dollars |
||||||||
| High |
1.33 | 1.49 | ||||||
| Average |
1.28 | 1.44 | ||||||
| Low |
1.24 | 1.40 | ||||||
| At period-end |
1.27 | 1.45 | ||||||
| One Australian dollar into U.S. dollars |
||||||||
| High |
1.04 | 1.09 | ||||||
| Average |
1.01 | 1.06 | ||||||
| Low |
0.97 | 1.03 | ||||||
| At period-end |
1.03 | 1.07 | ||||||
| One Nigerian naira into U.S. dollars |
||||||||
| High |
0.0065 | 0.0066 | ||||||
| Average |
0.0063 | 0.0065 | ||||||
| Low |
0.0061 | 0.0064 | ||||||
| At period-end |
0.0062 | 0.0065 | ||||||
| Source: | Bank of England and Oanda.com |
Other income (expense), net, in our condensed consolidated statements of income includes foreign currency transaction losses of $0.9 million and foreign currency transaction gains of $0.2 million for the three months ended June 30, 2012 and 2011, respectively.
6
Table of Contents
BRISTOW GROUP INC. AND SUBSIDIARIES
NOTES TO CONDENSED CONSOLIDATED FINANCIAL STATEMENTS — (Continued)
(Unaudited)
Our earnings from unconsolidated affiliates, net of losses, are also affected by the impact of changes in foreign currency exchange rates on the reported results of our unconsolidated affiliates. During the three months ended June 30, 2012 and 2011, earnings from unconsolidated affiliates, net of losses, were decreased by $3.1 million and increased by $0.6 million, respectively, as a result of the impact of changes in foreign currency exchange rates on the results of our unconsolidated affiliates, primarily the impact of changes in the Brazilian real and U.S. dollar exchange rate on results for our affiliate in Brazil. The value of the Brazilian real has fluctuated relative to the U.S. dollar as indicated in the following table:
| Three Months Ended | ||||||||
| June 30, | ||||||||
| 2012 | 2011 | |||||||
| One Brazilian real into U.S. dollars |
||||||||
| High |
0.5488 | 0.6405 | ||||||
| Average |
0.5125 | 0.6274 | ||||||
| Low |
0.4811 | 0.6106 | ||||||
| At period-end |
0.4816 | 0.6380 | ||||||
| Source: | Oanda.com |
We estimate that the fluctuation of currencies versus the same period in the prior fiscal year had the following effect on our financial condition and results of operations discussed below (in thousands):
| Three Months Ended |
||||
| June 30, 2012 | ||||
| Revenue |
$ | (8,778 | ) | |
| Operating expense |
9,699 | |||
| Earnings from unconsolidated affiliates, net of losses |
(3,690 | ) | ||
| Non-operating expense |
(1,192 | ) | ||
|
|
|
|||
| Income before benefit for income taxes |
(3,961 | ) | ||
| Benefit for income taxes |
806 | |||
|
|
|
|||
| Net income |
(3,155 | ) | ||
| Cumulative translation adjustment |
305 | |||
|
|
|
|||
| Total stockholders’ investment |
$ | (2,850 | ) | |
|
|
|
|||
Accounts Receivable
As of June 30 and March 31, 2012, the allowance for doubtful accounts for non-affiliates was $0.2 million and $0.1 million, respectively. As of June 30 and March 31, 2012, there were no allowances for doubtful accounts related to accounts receivable due from affiliates. See “Summary of Significant Accounting Policies” in Note 1 to the fiscal year 2012 Financial Statements for further information.
Property and Equipment
During the three months ended June 30, 2012, we recorded impairment charges of $1.9 million to reduce the carrying value of seven aircraft held for sale. These impairment charges are included as a reduction in gain (loss) on disposal of assets on the condensed consolidated statement of income. Additionally, we sold four aircraft and other equipment during the three months ended June 30, 2012 for proceeds of $20.2 million resulting in a loss of $3.4 million.
7
Table of Contents
BRISTOW GROUP INC. AND SUBSIDIARIES
NOTES TO CONDENSED CONSOLIDATED FINANCIAL STATEMENTS — (Continued)
(Unaudited)
Recent Accounting Pronouncement
In June 2011, the Financial Accounting Standards Board (“FASB”) issued an accounting pronouncement that provided new guidance on the presentation of comprehensive income in financial statements. This pronouncement requires entities to present total comprehensive income either in a single, continuous statement of comprehensive income or in two, separate, but consecutive, statements. Under the single-statement approach, entities must include the components of net income, a total for net income, the components of other comprehensive income and a total for comprehensive income. Under the two-statement approach, entities must report a statement of income and, immediately following, a statement of comprehensive income. Under either method, entities must display adjustments for items reclassified from other comprehensive income to net income in both net income and comprehensive income. In December 2011, the FASB deferred the effective date of the presentation of reclassifications of items out of other comprehensive income. The remaining provisions for this pronouncement were effective for fiscal years, and interim periods within those years, beginning after December 15, 2011, with early adoption permitted. We adopted this pronouncement for our fiscal year beginning April 1, 2012 using the two-statement approach.
Note 2 — VARIABLE INTEREST ENTITIES AND OTHER INVESTMENTS IN SIGNIFICANT AFFILIATES
A Variable Interest Entity (“VIE”) is an entity that either (i) has insufficient equity to permit the entity to finance its activities without additional subordinated financial support or (ii) has equity investors who lack the characteristics of a controlling financial interest. A VIE is consolidated by its primary beneficiary. The primary beneficiary has both the power to direct the activities that most significantly impact the entity’s economic performance and the obligation to absorb losses or the right to receive benefits from the entity that could potentially be significant to the VIE. If we determine that we have operating power and the obligation to absorb losses or receive benefits, we consolidate the VIE as the primary beneficiary, and if not, we do not consolidate.
Variable Interest Entities
As of June 30, 2012, we had interests in three VIEs of which we are the primary beneficiary, which are described below, and had no interests in VIEs of which we are not the primary beneficiary. See Note 3 to the fiscal year 2012 Financial Statements for a description of other investments in significant affiliates.
Bristow Aviation Holdings Limited — We own 49% of Bristow Aviation Holdings Limited’s (“Bristow Aviation”) common stock and a significant amount of its subordinated debt. Bristow Aviation is incorporated in England and holds all of the outstanding shares in Bristow Helicopter Group Limited (“Bristow Helicopters”). Its subsidiaries provide helicopter services to clients primarily in the U.K, Norway, Australia and Nigeria. Bristow Aviation is organized with three different classes of ordinary shares having disproportionate voting rights. The Company, Caledonia Investments plc (“Caledonia”) and a European Union investor (the “E.U. Investor”) own 49%, 46% and 5%, respectively, of Bristow Aviation’s total outstanding ordinary shares, although Caledonia has voting control over the E.U. Investor’s shares.
In addition to our ownership of 49% of Bristow Aviation’s outstanding ordinary shares, in May 2004, we acquired eight million shares of deferred stock, essentially a subordinated class of stock with no voting rights, from Bristow Aviation for £1 per share ($14.4 million in total). We also have £91.0 million ($142.7 million) principal amount of subordinated unsecured loan stock (debt) of Bristow Aviation bearing interest at an annual rate of 13.5% and payable semi-annually. Payment of interest on such debt has been deferred since its incurrence in 1996. Deferred interest accrues at an annual rate of 13.5% and aggregated $1.0 billion as of June 30, 2012.
The Company, Caledonia, the E.U. Investor and Bristow Aviation have entered into a shareholder agreement respecting, among other things, the composition of the board of directors of Bristow Aviation. On matters coming before Bristow Aviation’s board, Caledonia’s representatives have a total of three votes and the two other directors have one vote each. In addition, Caledonia has the right to nominate two persons to our board of directors and to replace any such directors so nominated.
8
Table of Contents
BRISTOW GROUP INC. AND SUBSIDIARIES
NOTES TO CONDENSED CONSOLIDATED FINANCIAL STATEMENTS — (Continued)
(Unaudited)
Caledonia, the Company and the E.U. Investor also have entered into a put/call agreement under which, upon giving specified prior notice, we have the right to buy all the Bristow Aviation shares held by Caledonia and the E.U. Investor, who, in turn, each have the right to require us to purchase such shares. Under current English law, we would be required, in order for Bristow Aviation to retain its operating license, to find a qualified E.U. investor to own any Bristow Aviation shares we have the right to acquire under the put/call agreement. The only restriction under the put/call agreement limiting our ability to exercise the put/call option is a requirement to consult with the Civil Aviation Authority (“CAA”) in the U.K. regarding the suitability of the new holder of the Bristow Aviation shares. The put/call agreement does not contain any provisions should the CAA not approve the new E.U. investor. However, we would work diligently to find an E.U. investor suitable to the CAA. The amount by which we could purchase the shares of the other investors holding 51% of the equity of Bristow Aviation is fixed under the terms of the call option, and we have reflected this amount on our condensed consolidated balance sheets as noncontrolling interest.
Furthermore, the call option provides a mechanism whereby the economic risk for the other investors is limited should the financial condition of Bristow Aviation deteriorate. The call option price is the nominal value of the ordinary shares held by the noncontrolling shareholders (£1.0 million as of June 30, 2012) plus an annual guaranteed rate of return less any prepayments of such call option price and any dividends paid on the shares concerned. We can elect to pre-pay the guaranteed return element of the call option price wholly or in part without exercising the call option. No dividends have been paid. We have accrued the annual return due to the other shareholders at a rate of sterling LIBOR plus 3% (prior to May 2004, the rate was fixed at 12%) by recognizing noncontrolling interest expense in our condensed consolidated statements of income, with a corresponding increase in noncontrolling interest on our condensed consolidated balance sheets. Prepayments of the guaranteed return element of the call option are reflected as a reduction in noncontrolling interest on our condensed consolidated balance sheets. The other investors have an option to put their shares in Bristow Aviation to us. The put option price is calculated in the same way as the call option price except that the guaranteed rate for the period to April 2004 was 10% per annum. If the put option is exercised, any pre-payments of the call option price are set off against the put option price.
9
Table of Contents
BRISTOW GROUP INC. AND SUBSIDIARIES
NOTES TO CONDENSED CONSOLIDATED FINANCIAL STATEMENTS — (Continued)
(Unaudited)
Bristow Aviation and its subsidiaries are exposed to similar operational risks and are therefore monitored and evaluated on a similar basis by management. Accordingly, the financial information reflected on our condensed consolidated balance sheets and statements of income for Bristow Aviation and subsidiaries is presented in the aggregate, including intercompany amounts with other consolidated entities, as follows (in thousands):
| June 30, | March 31, | |||||||
| 2012 | 2012 | |||||||
| Assets |
||||||||
| Cash and cash equivalents |
$ | 56,290 | $ | 31,978 | ||||
| Accounts receivable |
226,552 | 274,853 | ||||||
| Inventories |
98,578 | 98,208 | ||||||
| Prepaid expenses and other current assets |
25,134 | 30,975 | ||||||
|
|
|
|
|
|||||
| Total current assets |
406,554 | 436,014 | ||||||
| Investment in unconsolidated affiliates |
7,547 | 12,370 | ||||||
| Property and equipment, net |
144,622 | 148,622 | ||||||
| Goodwill |
13,263 | 13,528 | ||||||
| Other assets |
18,899 | 11,529 | ||||||
|
|
|
|
|
|||||
| Total assets |
$ | 590,885 | $ | 622,063 | ||||
|
|
|
|
|
|||||
| Liabilities |
||||||||
| Accounts payable |
$ | 82,957 | $ | 109,967 | ||||
| Accrued liabilities |
1,092,139 | 1,049,419 | ||||||
| Deferred taxes |
8,752 | 9,142 | ||||||
|
|
|
|
|
|||||
| Total current liabilities |
1,183,848 | 1,168,528 | ||||||
| Long-term debt, less current maturities |
142,743 | 154,217 | ||||||
| Accrued pension liabilities |
109,792 | 111,742 | ||||||
| Other liabilities and deferred credits |
375 | 719 | ||||||
|
|
|
|
|
|||||
| Total liabilities |
$ | 1,436,758 | $ | 1,435,206 | ||||
|
|
|
|
|
|||||
| Three Months Ended | ||||||||
| June 30, | ||||||||
| 2012 | 2011 | |||||||
| Revenue |
$ | 284,780 | $ | 245,326 | ||||
| Operating income |
3,879 | 1,872 | ||||||
| Net loss |
35,493 | 30,637 | ||||||
Bristow Helicopters Nigeria Ltd. — Bristow Helicopters Nigeria Ltd. (“BHNL”) is a joint venture in Nigeria with local partners, in which we own an interest of 40%. BHNL provides helicopter services to clients in Nigeria.
In order to have a presence in the Nigerian market, we were required to identify local citizens to participate in the ownership of entities domiciled in the region. However, these owners do not have extensive knowledge of the aviation industry and have historically deferred to our expertise in the overall management and day-to-day operation of BHNL (including the establishment of operating and capital budgets and strategic decisions regarding the potential expansion of BHNL’s operations). We have also historically provided subordinated financial support to BHNL and will need to continue to do so unless and until BHNL acquires sufficient equity to permit itself to finance its activities without that additional support from us. Thus, because we have the power to direct the most significant activities affecting the economic performance and ongoing success of BHNL and hold a variable interest in the entity in the form of our equity investment and working capital infusions, we consolidate BHNL as the primary beneficiary.
BHNL is an indirect subsidiary of Bristow Aviation; therefore, financial information for this entity is included within the amounts for Bristow Aviation and its subsidiaries presented above.
10
Table of Contents
BRISTOW GROUP INC. AND SUBSIDIARIES
NOTES TO CONDENSED CONSOLIDATED FINANCIAL STATEMENTS — (Continued)
(Unaudited)
Pan African Airlines Nigeria Ltd. — Pan African Airlines Nigeria Ltd. (“PAAN”) is a joint venture in Nigeria with local partners, in which we currently own an interest of 50.17%. PAAN provides helicopter services to clients in Nigeria.
The activities that most significantly impact PAAN’s economic performance relate to the day-to-day operation of PAAN, setting the operating and capital budgets, and strategic decisions regarding the potential expansion of PAAN’s operations. Throughout the history of PAAN, our representation on the board and our secondment to PAAN of its managing director has enabled us to direct the key operational decisions of PAAN (without objection from the other board members). We have also historically provided subordinated financial support to PAAN and will need to continue to do so unless and until PAAN acquires sufficient equity to permit itself to finance its activities without that additional support from us. As we have the power to direct the most significant activities affecting the economic performance and ongoing success of PAAN and hold a variable interest in the form of our equity investment and working capital infusions, we consolidate the entity as the primary beneficiary. However, as long as we own a majority interest in PAAN, the separate presentation of financial information in a tabular format for PAAN is not required.
Investments in Other Significant Affiliates
Effective June 30, 2012, our ownership interest in Líder Aviação Holding S.A. (“Líder”) in Brazil was reduced from 42.5% to 41.9% resulting from Líder’s issuance of additional shares to improve tax and cost-saving efficiencies. This transaction resulted in no material impact to our condensed consolidated financial statements.
Note 3 — DEBT
Debt as of June 30 and March 31, 2012 consisted of the following (in thousands):
| June 30, | March 31, | |||||||
| 2012 | 2012 | |||||||
|
7 1/2% Senior Notes due 2017, including $0.3 million of unamortized premium |
$ | 350,330 | $ | 350,346 | ||||
| Term Loan |
242,500 | 245,000 | ||||||
| Revolving Credit Facility |
40,000 | 59,300 | ||||||
| 3% Convertible Senior Notes due 2038, including $11.5 million and $12.4 million of unamortized discount, respectively |
103,469 | 102,599 | ||||||
|
|
|
|
|
|||||
| Total debt |
736,299 | 757,245 | ||||||
| Less short-term borrowings and current maturities of long-term debt |
(16,562 | ) | (14,375 | ) | ||||
|
|
|
|
|
|||||
| Total long-term debt |
$ | 719,737 | $ | 742,870 | ||||
|
|
|
|
|
|||||
During the three months ended June 30, 2012, we made payments of $19.3 million and $2.5 million to reduce our borrowings under the Revolving Credit Facility and Term Loan, respectively. For further details on the Revolving Credit Facility and Term Loan, see Note 5 to the fiscal year 2012 Financial Statements.
The balances of the debt and equity components of the 3% Convertible Senior Notes due 2038 (“3% Convertible Senior Notes”) as of each period presented are as follows (in thousands):
| June 30, | March 31, | |||||||
| 2012 | 2012 | |||||||
| Equity component – net carrying value |
$ | 14,905 | $ | 14,905 | ||||
| Debt component: |
||||||||
| Face amount due at maturity |
$ | 115,000 | $ | 115,000 | ||||
| Unamortized discount |
(11,531 | ) | (12,401 | ) | ||||
|
|
|
|
|
|||||
| Debt component – net carrying value |
$ | 103,469 | $ | 102,599 | ||||
|
|
|
|
|
|||||
11
Table of Contents
BRISTOW GROUP INC. AND SUBSIDIARIES
NOTES TO CONDENSED CONSOLIDATED FINANCIAL STATEMENTS — (Continued)
(Unaudited)
The remaining debt discount is being amortized into interest expense over the expected three year remaining life of the 3% Convertible Senior Notes using the effective interest rate. The effective interest rate for the three months ended June 30, 2012 and 2011 was 6.9%. Interest expense related to our 3% Convertible Senior Notes for the three months ended June 30, 2012 and 2011 was as follows (in thousands):
| Three Months Ended | ||||||||
| June 30, | ||||||||
| 2012 | 2011 | |||||||
| Contractual coupon interest |
$ | 863 | $ | 863 | ||||
| Amortization of debt discount |
870 | 822 | ||||||
|
|
|
|
|
|||||
| Total interest expense |
$ | 1,733 | $ | 1,685 | ||||
|
|
|
|
|
|||||
Note 4 — FAIR VALUE DISCLOSURES
Assets and liabilities subject to fair value measurement are categorized into one of three different levels depending on the observability of the inputs employed in the measurement, as follows:
| • | Level 1 – observable inputs that reflect quoted prices (unadjusted) for identical assets or liabilities in active markets. |
| • | Level 2 – inputs reflect quoted prices for identical assets or liabilities in markets that are not active; quoted prices for similar assets or liabilities in active markets; inputs other than quoted prices that are observable for the asset or liability; or inputs that are derived principally from or corroborated by observable market data by correlation or other means. |
| • | Level 3 – unobservable inputs reflecting the Company’s own assumptions incorporated in valuation techniques used to determine fair value. These assumptions are required to be consistent with market participant assumptions that are reasonably available. |
Non-recurring Fair Value Measurements
The majority of our non-financial assets, which include inventories, property and equipment, goodwill and other intangible assets, are not required to be carried at fair value on a recurring basis. However, if certain triggering events occur such that a non-financial asset is required to be evaluated for impairment and deemed to be impaired, the impaired non-financial asset is recorded as its fair value. We had no impaired assets during the three months ended June 30, 2011.
The following table summarizes the assets as of June 30, 2012, which are valued at fair value on a non-recurring basis (in thousands):
| Quoted Prices in Active Markets for Identical Assets (Level 1) |
Significant Other Observable Inputs (Level 2) |
Significant Unobservable Inputs (Level 3) |
Balance as of June 30, 2012 |
Total Gain (Loss) for the Three Months Ended June 30, 2012 |
||||||||||||||||
| Assets held for sale |
$ | — | $ | 3,646 | $ | — | $ | 3,646 | $ | (1,889 | ) | |||||||||
|
|
|
|
|
|
|
|
|
|
|
|||||||||||
| Total assets |
$ | — | $ | 3,646 | $ | — | $ | 3,646 | $ | (1,889 | ) | |||||||||
|
|
|
|
|
|
|
|
|
|
|
|||||||||||
The fair value of the assets held for sale using Level 2 inputs is determined through evaluation of expected sales proceeds for aircraft. This analysis includes estimates based on historical experience with sales, recent transactions involving similar assets, quoted market prices for similar assets and condition and location of aircraft to be sold or otherwise disposed of.
12
Table of Contents
BRISTOW GROUP INC. AND SUBSIDIARIES
NOTES TO CONDENSED CONSOLIDATED FINANCIAL STATEMENTS — (Continued)
(Unaudited)
Recurring Fair Value Measurements
The following table summarizes the financial instruments we had as of June 30, 2012, which are valued at fair value on a recurring basis (in thousands):
| Quoted Prices in Active Markets for Identical Assets (Level 1) |
Significant Other Observable Inputs (Level 2) |
Significant Unobservable Inputs (Level 3) |
Balance as of June 30, 2012 |
Balance Sheet Classification | ||||||||||||||
| Rabbi Trust investments |
$ | 3,948 | $ | — | $ | — | $ | 3,948 | Other assets | |||||||||
|
|
|
|
|
|
|
|
|
|||||||||||
| Total assets |
$ | 3,948 | $ | — | $ | — | $ | 3,948 | ||||||||||
|
|
|
|
|
|
|
|
|
|||||||||||
The following table summarizes the financial instruments we had as of March 31, 2012, which are valued at fair value on a recurring basis (in thousands):
| Quoted Prices in Active Markets for Identical Assets (Level 1) |
Significant Other Observable Inputs (Level 2) |
Significant Unobservable Inputs (Level 3) |
Balance as of March 31, 2012 |
Balance Sheet Classification | ||||||||||||||
| Rabbi Trust investments |
$ | 4,171 | $ | — | $ | — | $ | 4,171 | Other assets | |||||||||
|
|
|
|
|
|
|
|
|
|||||||||||
| Total assets |
$ | 4,171 | $ | — | $ | — | $ | 4,171 | ||||||||||
|
|
|
|
|
|
|
|
|
|||||||||||
The rabbi trust investments consist of mutual funds whose fair value is based on quoted prices in active markets for identical assets, and are designated as Level 1 within the valuation hierarchy. The rabbi trust holds investments related to our non-qualified deferred compensation plan for our senior executives.
Fair Value of Financial Instruments
The fair value of our financial instruments has been estimated in accordance with the accounting standard regarding fair value. The fair value of our fixed rate long-term debt is estimated based on quoted market prices. The carrying and fair value of our long-term debt, including the current portion, are as follows (in thousands):
| June 30, 2012 | March 31, 2012 | |||||||||||||||
| Carrying Value |
Fair Value | Carrying Value |
Fair Value | |||||||||||||
|
7 1/2% Senior Notes |
$ | 350,330 | $ | 336,000 | $ | 350,346 | $ | 364,875 | ||||||||
| Term Loan |
242,500 | 242,500 | 245,000 | 245,000 | ||||||||||||
| Revolving Credit Facility |
40,000 | 40,000 | 59,300 | 59,300 | ||||||||||||
| 3% Convertible Senior Notes |
103,469 | 115,612 | 102,599 | 120,750 | ||||||||||||
|
|
|
|
|
|
|
|
|
|||||||||
| $ | 736,299 | $ | 734,112 | $ | 757,245 | $ | 789,925 | |||||||||
|
|
|
|
|
|
|
|
|
|||||||||
The fair values of our cash and cash equivalents, accounts receivable and accounts payable approximate their carrying values due to the short-term nature of these items.
13
Table of Contents
BRISTOW GROUP INC. AND SUBSIDIARIES
NOTES TO CONDENSED CONSOLIDATED FINANCIAL STATEMENTS — (Continued)
(Unaudited)
NOTE 5 — DERIVATIVE FINANCIAL INSTRUMENTS
From time to time we enter into forward exchange contracts as a hedge against foreign currency asset and liability commitments and anticipated transaction exposures, including intercompany purchases. All derivatives are recognized as assets or liabilities and measured at fair value. Derivatives that are not determined to be effective hedges are adjusted to fair value with a corresponding effect on earnings. We do not use financial instruments for trading or speculative purposes.
We entered into forward contracts during the three months ended June 30, 2011 to mitigate our exposure to exchange rate fluctuations on our euro-denominated aircraft purchase commitments, which were designated as cash flow hedges for accounting purposes. As of June 30 and March 31, 2012, we had no open forward contracts. We had six open forward contracts as of March 31, 2011, which had rates ranging from 1.3153 U.S. dollars per euro to 1.3267 U.S. dollars per euro. These contracts had an underlying notional value of between €5,000,000 and €7,000,000, for a total of €34,300,871, with the first contract having expired in May 2011 and the last in June 2011. During the three months ended June 30, 2011, we entered into an additional open forward contract at a rate of 1.418 U.S. dollars per euro with an underlying notional value of €13,826,241 that expired in July 2011. As of June 30, 2011, an unrecognized gain on these contracts of $1.7 million, net of tax, was included as a component of accumulated other comprehensive loss. No gains or losses relating to forward contracts are recognized in our condensed consolidated statements of income for the three months ended June 30, 2012 and 2011.
Information on the location and amounts of derivative gains and losses on the condensed consolidated balance sheet and the condensed consolidated statement of income as of and for the three months ended June 30, 2011 is as follows (in thousands):
| Derivatives in Cash Flow Hedging Relationships |
Amount of Gain (Loss) Recognized in Other Comprehensive Income (“OCI”) on Derivative (Effective Portion) |
Location of Gain (Loss) Reclassified from Accumulated OCI into Income (Effective Portion) |
Amount of
Gain (Loss) Reclassified from Accumulated OCI into Income (Effective Portion) |
Location of Gain (Loss) Recognized in Income on Derivative (Ineffective Portion and Amount Excluded from Effectiveness Testing) |
Amount
of Gain (Loss) Recognized in Income on Derivative (Ineffective Portion and Amount Excluded from Effectiveness Testing) |
|||||||||||||||
| Foreign currency forward contracts |
$ | 1,653 | Other income (expense), net | $ | — | Other income (expense), net | $ | — | ||||||||||||
|
|
|
|
|
|
|
|||||||||||||||
| $ | 1,653 | $ | — | $ | — | |||||||||||||||
|
|
|
|
|
|
|
|||||||||||||||
14
Table of Contents
BRISTOW GROUP INC. AND SUBSIDIARIES
NOTES TO CONDENSED CONSOLIDATED FINANCIAL STATEMENTS — (Continued)
(Unaudited)
Note 6 — COMMITMENTS AND CONTINGENCIES
Aircraft Purchase Contracts — As shown in the table below, we expect to make additional capital expenditures over the next five fiscal years to purchase additional aircraft. As of June 30, 2012, we had 17 aircraft on order and options to acquire an additional 36 aircraft. Although a similar number of our existing aircraft may be sold during the same period, the additional aircraft on order will provide incremental fleet capacity in terms of revenue and operating income.
| Nine Months Ending |
Fiscal Year Ending March 31, | |||||||||||||||||||||||
| March 31, 2013 |
2014 | 2015 | 2016 | 2017 and thereafter |
Total | |||||||||||||||||||
| Commitments as of June 30, 2012: |
||||||||||||||||||||||||
| Number of aircraft: |
||||||||||||||||||||||||
| Large (1)(2) |
7 | 4 | 3 | 2 | 1 | 17 | ||||||||||||||||||
|
|
|
|
|
|
|
|
|
|
|
|
|
|||||||||||||
| 7 | 4 | 3 | 2 | 1 | 17 | |||||||||||||||||||
|
|
|
|
|
|
|
|
|
|
|
|
|
|||||||||||||
| Related expenditures (in thousands) |
$ | 158,619 | $ | 58,268 | $ | 46,103 | $ | 30,582 | $ | 13,771 | $ | 307,343 | ||||||||||||
|
|
|
|
|
|
|
|
|
|
|
|
|
|||||||||||||
| Options as of June 30, 2012: |
||||||||||||||||||||||||
| Number of aircraft: |
||||||||||||||||||||||||
| Medium |
— | 5 | 5 | 2 | — | 12 | ||||||||||||||||||
| Large |
— | 3 | 4 | 7 | 10 | 24 | ||||||||||||||||||
|
|
|
|
|
|
|
|
|
|
|
|
|
|||||||||||||
| — | 8 | 9 | 9 | 10 | 36 | |||||||||||||||||||
|
|
|
|
|
|
|
|
|
|
|
|
|
|||||||||||||
| Related expenditures (in thousands) |
$ | 87,062 | $ | 170,991 | $ | 175,707 | $ | 184,890 | $ | 194,487 | $ | 813,137 | ||||||||||||
|
|
|
|
|
|
|
|
|
|
|
|
|
|||||||||||||
| (1) | Signed client contracts are currently in place that will utilize five of these aircraft. Six aircraft expected to enter service between fiscal years 2015 and 2017 are subject to the successful development and certification of the aircraft. |
| (2) | Includes progress payments on aircraft scheduled to be delivered in future periods. |
The following chart presents an analysis of our aircraft orders and options during the three months ended June 30, 2012:
| Orders | Options | |||||||
| Beginning of period |
15 | 40 | ||||||
| Aircraft delivered |
(2 | ) | — | |||||
| Exercised options |
4 | (4 | ) | |||||
|
|
|
|
|
|||||
| End of period |
17 | 36 | ||||||
|
|
|
|
|
|||||
We periodically purchase aircraft for which we have no order. During the three months ended June 30, 2012, we purchased one large aircraft which was not on order.
15
Table of Contents
BRISTOW GROUP INC. AND SUBSIDIARIES
NOTES TO CONDENSED CONSOLIDATED FINANCIAL STATEMENTS — (Continued)
(Unaudited)
Operating Leases — We have non-cancelable operating leases in connection with the lease of certain equipment, land and facilities, including leases for aircraft. Rental expense incurred under all operating leases, except for those with terms of a month or less that were not renewed, was $16.3 million and $9.0 million for the three months ended June 30, 2012 and 2011, respectively.
We have initiated a new financing strategy whereby we will be using operating leases to a larger extent than in the past. As part of this operating lease strategy, in fiscal year 2012 we sold seven aircraft for $147.8 million and entered into seven separate agreements to lease back these aircraft. Additionally, in fiscal year 2012, we transferred our interest in two aircraft previously included in construction in progress within property and equipment on our consolidated balance sheet in return for $23.4 million in progress payments previously paid on these aircraft. We also signed two separate agreements to lease back these aircraft, commencing at time of delivery, which occurred July 27, 2012 for the first aircraft and is currently anticipated to occur during the second quarter of fiscal year 2013 for the second aircraft. We did not enter into any new aircraft operating leases with terms in excess of one year during the three months ended June 30, 2012.
The aircraft leases entered into in fiscal year 2012 range from base terms of 60 to 72 months with renewal options of up to 72 months in some cases, include purchase options upon expiration and some include early purchase options. The leases contain terms customary in transactions of this type, including provisions that allow the lessor to repossess the aircraft and require us to pay a stipulated amount if we default on our obligations under the agreements. The following is a summary of the terms related to aircraft leased under operating leases with original or remaining terms in excess of one year:
| End of Lease Term |
Number of Aircraft | Monthly Lease Payments (in thousands) |
||||||
| Fiscal year 2013 to fiscal year 2015 |
6 | $ | 1,010 | |||||
| Fiscal year 2016 to fiscal year 2018 |
7 | 1,200 | ||||||
| Fiscal year 2023 |
9 | 350 | ||||||
|
|
|
|
|
|||||
| 22 | $ | 2,560 | ||||||
|
|
|
|
|
|||||
Employee Agreements — Approximately 51% of our employees are represented by collective bargaining agreements and/or unions. These agreements generally include annual escalations of up to 12%. Periodically, certain groups of our employees who are not covered by a collective bargaining agreement consider entering into such an agreement.
During the three months ended June 30, 2012, we recognized $2.2 million in compensation expense included in direct cost related to severance costs as a result of the termination of a contract in the Southern North Sea. Also, during the three months ended June 30, 2012, we recognized approximately $2.0 million in compensation expense (including expenses recorded for the acceleration of unvested stock options and restricted stock) included in general and administrative expense related to the separation between us and our Senior Vice President and General Counsel.
Nigerian Litigation — In November 2005, two of our consolidated foreign affiliates were named in a lawsuit filed with the High Court of Lagos State, Nigeria by Mr. Benneth Osita Onwubalili and his affiliated company, Kensit Nigeria Limited, which allegedly acted as agents of our affiliates in Nigeria. The claimants allege that an agreement between the parties was terminated without justification and seek damages of $16.3 million. We responded to this claim in early 2006. There has been minimal activity on this claim since then.
16
Table of Contents
BRISTOW GROUP INC. AND SUBSIDIARIES
NOTES TO CONDENSED CONSOLIDATED FINANCIAL STATEMENTS — (Continued)
(Unaudited)
Civil Class Action Lawsuit — On June 12, 2009, Superior Offshore International, Inc. v. Bristow Group Inc., et al, Case No. 1:09-cv-00438, was filed in the U.S. District Court for the District of Delaware. The purported class action complaint, which also named other providers of offshore helicopter services in the Gulf of Mexico as defendants, alleged violations of Section 1 of the Sherman Act. Among other things, the complaint alleged that the defendants unlawfully conspired to raise and maintain the price of offshore helicopter services between January 1, 2001 and December 31, 2005. The plaintiff was seeking to represent a purported class of direct purchasers of offshore helicopter services and was asking for, among other things, unspecified treble monetary damages and injunctive relief. In September 2010, the court granted our and the other defendants’ motion to dismiss the case on several grounds. The plaintiff then filed a motion seeking a rehearing and seeking leave to amend its original complaint, which was partially granted to permit limited discovery. We and the other defendants again filed motions to dismiss the lawsuit, which were granted. The plaintiff appealed the judgment in the U.S. Court of Appeals for the Third Circuit. On July 27, 2012, the United States Court of Appeals for the Third Circuit ruled in our favor on all points and upheld the dismissal of the case. We are unable to predict whether the plaintiff will further appeal this case. If so, we will continue to defend against this lawsuit vigorously. We are currently unable to determine whether it could have a material effect on our business, financial condition or results of operations.
Environmental Contingencies — The U.S. Environmental Protection Agency, also referred to as the EPA, has in the past notified us that we are a potential responsible party, or PRP, at three former waste disposal facilities that are on the National Priorities List of contaminated sites. Under the federal Comprehensive Environmental Response, Compensation and Liability Act, also known as the Superfund law, persons who are identified as PRPs may be subject to strict, joint and several liability for the costs of cleaning up environmental contamination resulting from releases of hazardous substances at National Priorities List sites. Although we have not yet obtained a formal release of liability from the EPA with respect to any of the sites, we believe that our potential liability in connection with the sites is not likely to have a material adverse effect on our business, financial condition or results of operations.
Guarantees — We had guaranteed the repayment of up to £10 million ($15.7 million) of the debt of FBS Limited, an unconsolidated affiliate, which has been repaid. Therefore, as of June 30, 2012 we are no longer a guarantor of this debt.
Other Matters — Although infrequent, aircraft accidents have occurred in the past, and the related losses and liability claims have been covered by insurance subject to deductible, self-insured retention and loss sensitive factors.
We are a defendant in certain claims and litigation arising out of operations in the normal course of business. In the opinion of management, uninsured losses, if any, will not be material to our financial position, results of operations or cash flows.
Note 7 — TAXES
Our effective income tax rates were 20.3% and 23.7% for the three months ended June 30, 2012 and 2011, respectively. During the three months ended June 30, 2012, we released tax contingency related items totaling $0.1 million. During the three months ended June 30, 2011, we accrued tax contingency related items totaling $0.7 million. Our effective tax rate was also impacted by the permanent reinvestment outside the U.S. of foreign earnings, upon which no U.S. tax has been provided, and by the amount of our foreign source income and our ability to realize foreign tax credits.
As of June 30, 2012, there were $1.4 million of unrecognized tax benefits, all of which would have an impact on our effective tax rate, if recognized. For the three months ended June 30, 2012 and 2011, we accrued interest and penalties of $0.1 million in connection with uncertain tax positions.
17
Table of Contents
BRISTOW GROUP INC. AND SUBSIDIARIES
NOTES TO CONDENSED CONSOLIDATED FINANCIAL STATEMENTS — (Continued)
(Unaudited)
Note 8 — EMPLOYEE BENEFIT PLANS
Pension Plans
The following table provides a detail of the components of net periodic pension cost (in thousands):
| Three Months Ended | ||||||||
| June 30, | ||||||||
| 2012 | 2011 | |||||||
| Service cost for benefits earned during the period |
$ | 2,057 | $ | 1,634 | ||||
| Interest cost on pension benefit obligation |
6,433 | 7,212 | ||||||
| Expected return on assets |
(7,281 | ) | (7,489 | ) | ||||
| Amortization of unrecognized losses |
1,657 | 1,377 | ||||||
|
|
|
|
|
|||||
| Net periodic pension cost |
$ | 2,866 | $ | 2,734 | ||||
|
|
|
|
|
|||||
We pre-funded our contributions of £10.4 million ($16.6) million to our U.K. Staff pension plan for fiscal year 2013 in the last quarter of fiscal year 2012. The current estimate of our cash contributions to our Norwegian pension plan and U.K. expatriate plan for fiscal year 2013 are $9.6 million and $0.6 million, respectively, $2.1 million and $0.1 million, respectively, of which were paid during the three months ended June 30, 2012.
Incentive Compensation
Stock–based awards are currently made under the Bristow Group Inc. 2007 Long-Term Incentive Plan (“2007 Plan”). A maximum of 2,400,000 shares of common stock, par value $.01 per share (“Common Stock”), are reserved. Awards granted under the 2007 Plan may be in the form of stock options, stock appreciation rights, shares of restricted stock, other stock-based awards (payable in cash or Common Stock) or performance awards, or any combination thereof, and may be made to outside directors, employees or consultants. As of June 30, 2012, 494,669 shares remained available for grant under the 2007 Plan.
We have a number of other incentive and stock option plans which are described in Note 10 to our fiscal year 2012 Financial Statements.
For the three months ended June 30, 2012 and 2011, total stock-based compensation expense, which includes stock options, restricted stock units and restricted stock, totaled $2.8 million and $5.2 million, respectively. Stock-based compensation expense has been allocated to our various business units. During the three months ended June 30, 2011, we recorded $2.2 million of expense related to stock-based compensation grants to our President and Chief Executive Officer.
During the three months ended June 30, 2012, we awarded 167,293 shares of restricted stock at an average grant date fair value of $43.38 per share. Also during the three months ended June 30, 2012, 324,565 stock options were granted. The following table shows the assumptions used to compute the stock-based compensation expense for stock options granted during the three months ended June 30, 2012:
| Risk free interest rate |
0.76 | % | ||
| Expected life (years) |
5 | |||
| Volatility |
50.20 | % | ||
| Dividend yield |
1.84 | % | ||
| Weighted average exercise price of options granted |
$ | 43.38 | per option | |
| Weighted average grant-date fair value of options granted |
$ | 16.65 | per option |
18
Table of Contents
BRISTOW GROUP INC. AND SUBSIDIARIES
NOTES TO CONDENSED CONSOLIDATED FINANCIAL STATEMENTS — (Continued)
(Unaudited)
Performance cash awards vest and pay out in cash three years after the date of grant at varying levels depending on our performance in Total Shareholder Return against a peer group of companies. These awards were designed to tie a significant portion of total compensation to performance. One of the effects of this type of compensation is that it requires liability accounting which can result in volatility in earnings. The liability recorded for these awards as of June 30 and March 31, 2012 was $3.7 million and $5.7 million, respectively, and represents an accrual based on the fair value of the awards on those dates. The decrease in the liability during the three months ended June 30, 2012 is due to the payout in June 2012 of the awards granted in June 2009, partially offset by an increase recognized as compensation expense for a new award in June 2012. Any changes in fair value of the awards in future quarters will increase or decrease the liability and impact results in those periods. The affect, either positive or negative, on future period earnings can vary based on factors including changes in our stock price or the stock prices of the peer group companies, as well as changes in other market and company-specific assumptions that are factored into the calculation of fair value of the performance cash awards.
Compensation expense recorded related to the performance cash awards during the three months ended June 30, 2012 and 2011 was $0.9 million and $3.7 million, respectively.
Note 9 — DIVIDENDS AND EARNINGS PER SHARE
Dividends
On July 31, 2012, our board of directors approved a dividend of $0.20 per share of Common Stock, payable on September 14, 2012 to shareholders of record on August 31, 2012. See discussion of our dividends in Note 11 to our fiscal year 2012 Financial Statements. The declaration of future dividends is at the discretion of our board of directors and subject to our results of operations, financial condition, cash requirements and other factors and restrictions under applicable law and our debt instruments.
Earnings per Share
Basic earnings per common share is computed by dividing income available to common stockholders by the weighted average number of shares of Common Stock outstanding during the period. Diluted earnings per common share excludes options to purchase shares, restricted stock units and restricted stock awards, which were outstanding during the period but were anti-dilutive, as follows:
| Three Months Ended | ||||||||
| June 30, | ||||||||
| 2012 | 2011 | |||||||
| Options: |
||||||||
| Outstanding |
376,490 | 274,063 | ||||||
| Weighted average exercise price |
$ | 43.65 | $ | 30.16 | ||||
| Restricted stock units: |
||||||||
| Outstanding |
72,592 | 4,040 | ||||||
| Weighted average price |
$ | 46.59 | $ | 53.89 | ||||
| Restricted stock awards: |
||||||||
| Outstanding |
— | 39,220 | ||||||
| Weighted average price |
$ | — | $ | 43.79 | ||||
19
Table of Contents
BRISTOW GROUP INC. AND SUBSIDIARIES
NOTES TO CONDENSED CONSOLIDATED FINANCIAL STATEMENTS — (Continued)
(Unaudited)
The following table sets forth the computation of basic and diluted earnings per share:
| Three Months Ended | ||||||||
| June 30, | ||||||||
| 2012 | 2011 | |||||||
| Net income available to common stockholders (in thousands): |
||||||||
| Income available to common stockholders – basic |
$ | 23,662 | $ | 21,045 | ||||
| Interest expense on assumed conversion of 3% Convertible Senior Notes, net of tax (1) |
— | — | ||||||
|
|
|
|
|
|||||
| Income available to common stockholders – diluted |
$ | 23,662 | $ | 21,045 | ||||
|
|
|
|
|
|||||
| Shares: |
||||||||
| Weighted average number of common shares outstanding – basic |
35,789,700 | 36,352,371 | ||||||
| Assumed conversion of 3% Convertible Senior Notes outstanding during the period (1) |
— | — | ||||||
| Net effect of dilutive stock options, restricted stock units and restricted stock awards based on the treasury stock method |
659,888 | 713,840 | ||||||
|
|
|
|
|
|||||
| Weighted average number of common shares outstanding – diluted |
36,449,588 | 37,066,211 | ||||||
|
|
|
|
|
|||||
| Basic earnings per common share |
$ | 0.66 | $ | 0.58 | ||||
|
|
|
|
|
|||||
| Diluted earnings per common share |
$ | 0.65 | $ | 0.57 | ||||
|
|
|
|
|
|||||
| (1) | Diluted earnings per common share for the three months ended June 30, 2012 and 2011 excludes approximately 1.5 million potentially dilutive shares initially issuable upon the conversion of our 3% Convertible Senior Notes. The 3% Convertible Senior Notes will be convertible, under certain circumstances, using a net share settlement process, into a combination of cash and our Common Stock. As of June 30, 2012, the base conversion price of the notes was approximately $76.56, based on the base conversion rate of 13.0609 shares of Common Stock per $1,000 principal amount of convertible notes (subject to adjustment in certain circumstances, including the payment of dividends). In general, upon conversion of a note, the holder will receive cash equal to the principal amount of the note and Common Stock to the extent of the note’s conversion value in excess of such principal amount. In addition, if at the time of conversion the applicable price of our Common Stock exceeds the base conversion price, holders will receive up to an additional 8.4049 shares of our Common Stock per $1,000 principal amount of notes, as determined pursuant to a specified formula. Such shares did not impact our calculation of diluted earnings per share for three months ended June 30, 2012 and 2011 as our stock price did not meet or exceed the base conversion price. |
20
Table of Contents
BRISTOW GROUP INC. AND SUBSIDIARIES
NOTES TO CONDENSED CONSOLIDATED FINANCIAL STATEMENTS — (Continued)
(Unaudited)
Note 10 — SEGMENT INFORMATION
We conduct our business in one segment: Helicopter Services. The Helicopter Services segment operations are conducted primarily through five business units: Europe, West Africa, North America, Australia, and Other International. Additionally, we also operate a training business unit, Bristow Academy, and provide technical services to clients in the U.S. and U.K.
The following shows reportable segment information for the three months ended June 30, 2012 and 2011 and as of June 30 and March 31, 2012, where applicable, reconciled to consolidated totals, and prepared on the same basis as our condensed consolidated financial statements (in thousands):
| Three Months
Ended June 30, |
||||||||
| 2012 | 2011 | |||||||
| Segment gross revenue from external clients: |
||||||||
| Europe |
$ | 153,957 | $ | 134,280 | ||||
| West Africa |
70,454 | 54,507 | ||||||
| North America |
52,710 | 44,167 | ||||||
| Australia |
44,502 | 45,295 | ||||||
| Other International |
33,475 | 35,467 | ||||||
| Corporate and other |
7,510 | 7,389 | ||||||
|
|
|
|
|
|||||
| Total segment gross revenue |
$ | 362,608 | $ | 321,105 | ||||
|
|
|
|
|
|||||
| Intrasegment gross revenue: |
||||||||
| Europe |
$ | 63 | $ | 258 | ||||
| West Africa |
— | — | ||||||
| North America |
196 | 75 | ||||||
| Australia |
— | 118 | ||||||
| Other International |
— | — | ||||||
| Corporate and other |
120 | (444 | ) | |||||
|
|
|
|
|
|||||
| Total intrasegment gross revenue |
$ | 379 | $ | 7 | ||||
|
|
|
|
|
|||||
| Consolidated gross revenue reconciliation: |
||||||||
| Europe |
$ | 154,020 | $ | 134,538 | ||||
| West Africa |
70,454 | 54,507 | ||||||
| North America |
52,906 | 44,242 | ||||||
| Australia |
44,502 | 45,413 | ||||||
| Other International |
33,475 | 35,467 | ||||||
| Corporate and other |
7,630 | 6,945 | ||||||
| Intrasegment eliminations |
(379 | ) | (7 | ) | ||||
|
|
|
|
|
|||||
| Total consolidated gross revenue |
$ | 362,608 | $ | 321,105 | ||||
|
|
|
|
|
|||||
| Earnings from unconsolidated affiliates, net of losses – equity method investments: |
||||||||
| Europe |
$ | 2,006 | $ | 2,858 | ||||
| Other International |
(17 | ) | 3,135 | |||||
|
|
|
|
|
|||||
| Total earnings from unconsolidated affiliates, net of losses – equity method investments |
$ | 1,989 | $ | 5,993 | ||||
|
|
|
|
|
|||||
21
Table of Contents
BRISTOW GROUP INC. AND SUBSIDIARIES
NOTES TO CONDENSED CONSOLIDATED FINANCIAL STATEMENTS — (Continued)
(Unaudited)
| Three Months
Ended June 30, |
||||||||
| 2012 | 2011 | |||||||
| Consolidated operating income (loss) reconciliation: |
||||||||
| Europe |
$ | 21,876 | $ | 23,249 | ||||
| West Africa |
16,131 | 11,231 | ||||||
| North America |
6,475 | 1,584 | ||||||
| Australia |
6,509 | 4,524 | ||||||
| Other International |
7,387 | 11,910 | ||||||
| Corporate and other |
(13,070 | ) | (17,509 | ) | ||||
| Gain (loss) on disposal of assets |
(5,315 | ) | 1,416 | |||||
|
|
|
|
|
|||||
| Total consolidated operating income |
$ | 39,993 | $ | 36,405 | ||||
|
|
|
|
|
|||||
| Depreciation and amortization: |
||||||||
| Europe |
$ | 7,564 | $ | 7,907 | ||||
| West Africa |
3,142 | 3,270 | ||||||
| North America |
3,266 | 3,687 | ||||||
| Australia |
2,483 | 3,122 | ||||||
| Other International |
4,033 | 3,963 | ||||||
| Corporate and other |
884 | 759 | ||||||
|
|
|
|
|
|||||
| Total depreciation and amortization |
$ | 21,372 | $ | 22,708 | ||||
|
|
|
|
|
|||||
| Identifiable assets: |
||||||||
| Europe |
$ | 850,131 | $ | 779,160 | ||||
| West Africa |
384,242 | 376,903 | ||||||
| North America |
290,428 | 276,074 | ||||||
| Australia |
263,813 | 295,895 | ||||||
| Other International |
561,677 | 602,174 | ||||||
| Corporate and other |
390,088 | 410,157 | ||||||
|
|
|
|
|
|||||
| Total identifiable assets (1) |
$ | 2,740,379 | $ | 2,740,363 | ||||
|
|
|
|
|
|||||
| June 30, 2012 |
March 31, 2012 |
|||||||
| Investments in unconsolidated affiliates – equity method investments: |
||||||||
| Europe |
$ | 6,889 | $ | 11,410 | ||||
| Other International |
184,170 | 184,922 | ||||||
| Corporate and other |
3,228 | 2,378 | ||||||
|
|
|
|
|
|||||
| Total investments in unconsolidated affiliates – equity method investments |
$ | 194,287 | $ | 198,710 | ||||
|
|
|
|
|
|||||
| (1) | Includes $152.2 million and $126.6 million, respectively of construction in progress within property and equipment on our condensed consolidated balance sheets as of June 30 and March 31, 2012, respectively, which primarily represents progress payments on aircraft to be delivered in future periods. |
22
Table of Contents
BRISTOW GROUP INC. AND SUBSIDIARIES
NOTES TO CONDENSED CONSOLIDATED FINANCIAL STATEMENTS — (Continued)
(Unaudited)
Note 11 — SUPPLEMENTAL CONDENSED CONSOLIDATING FINANCIAL INFORMATION
In connection with the sale of the 7 1/2% Senior Notes and the 3% Convertible Senior Notes, the Guarantor Subsidiaries fully, unconditionally, jointly and severally guaranteed the payment obligations under these notes. The following supplemental financial information sets forth, on a consolidating basis, the balance sheet, statement of income and cash flow information for Bristow Group Inc. (“Parent Company Only”), for the Guarantor Subsidiaries and for our other subsidiaries (the “Non-Guarantor Subsidiaries”). We have not presented separate financial statements and other disclosures concerning the Guarantor Subsidiaries because management has determined that such information is not material to investors.
The supplemental condensed consolidating financial information has been prepared pursuant to the rules and regulations for condensed financial information and does not include all disclosures included in annual financial statements, although we believe that the disclosures made are adequate to make the information presented not misleading. The principal eliminating entries eliminate investments in subsidiaries, intercompany balances and intercompany revenue and expense.
The allocation of the consolidated income tax provision was made using the with and without allocation method.
23
Table of Contents
BRISTOW GROUP INC. AND SUBSIDIARIES
NOTES TO CONDENSED CONSOLIDATED FINANCIAL STATEMENTS — (Continued)
(Unaudited)
Supplemental Condensed Consolidating Statement of Income
Three Months Ended June 30, 2012
| Parent Company Only |
Guarantor Subsidiaries |
Non- Guarantor Subsidiaries |
Eliminations | Consolidated | ||||||||||||||||
| (In thousands) | ||||||||||||||||||||
| Revenue: |
||||||||||||||||||||
| Gross revenue |
$ | — | $ | 69,512 | $ | 293,096 | $ | — | $ | 362,608 | ||||||||||
| Intercompany revenue |
578 | 17,299 | — | (17,877 | ) | — | ||||||||||||||
|
|
|
|
|
|
|
|
|
|
|
|||||||||||
| 578 | 86,811 | 293,096 | (17,877 | ) | 362,608 | |||||||||||||||
|
|
|
|
|
|
|
|
|
|
|
|||||||||||
| Operating expense: |
||||||||||||||||||||
| Direct cost and reimbursable expense |
— | 49,772 | 213,168 | — | 262,940 | |||||||||||||||
| Intercompany expenses |
— | — | 17,877 | (17,877 | ) | — | ||||||||||||||
| Depreciation and amortization |
1,069 | 8,075 | 12,228 | — | 21,372 | |||||||||||||||
| General and administrative |
8,929 | 6,851 | 19,197 | — | 34,977 | |||||||||||||||
|
|
|
|
|
|
|
|
|
|
|
|||||||||||
| 9,998 | 64,698 | 262,470 | (17,877 | ) | 319,289 | |||||||||||||||
|
|
|
|
|
|
|
|
|
|
|
|||||||||||
| Loss on disposal of assets |
— | (1,419 | ) | (3,896 | ) | — | (5,315 | ) | ||||||||||||
| Earnings from unconsolidated affiliates, net of losses |
17,739 | — | 1,989 | (17,739 | ) | 1,989 | ||||||||||||||
|
|
|
|
|
|
|
|
|
|
|
|||||||||||
| Operating income |
8,319 | 20,694 | 28,719 | (17,739 | ) | 39,993 | ||||||||||||||
| Interest income |
27,940 | 9 | — | (27,861 | ) | 88 | ||||||||||||||
| Interest expense |
(8,850 | ) | — | (27,785 | ) | 27,861 | (8,774 | ) | ||||||||||||
| Other income (expense), net |
51 | 57 | (1,039 | ) | — | (931 | ) | |||||||||||||
|
|
|
|
|
|
|
|
|
|
|
|||||||||||
| Income (loss) before provision for income taxes |
27,460 | 20,760 | (105 | ) | (17,739 | ) | 30,376 | |||||||||||||
| Allocation of consolidated income taxes |
(3,779 | ) | (1,758 | ) | (643 | ) | — | (6,180 | ) | |||||||||||
|
|
|
|
|
|
|
|
|
|
|
|||||||||||
| Net income (loss) |
23,681 | 19,002 | (748 | ) | (17,739 | ) | 24,196 | |||||||||||||
| Net income attributable to noncontrolling interests |
(19 | ) | — | (515 | ) | — | (534 | ) | ||||||||||||
|
|
|
|
|
|
|
|
|
|
|
|||||||||||
| Net income (loss) attributable to Bristow Group |
$ | 23,662 | $ | 19,002 | $ | (1,263 | ) | $ | (17,739 | ) | $ | 23,662 | ||||||||
|
|
|
|
|
|
|
|
|
|
|
|||||||||||
24
Table of Contents
BRISTOW GROUP INC. AND SUBSIDIARIES
NOTES TO CONDENSED CONSOLIDATED FINANCIAL STATEMENTS — (Continued)
(Unaudited)
Supplemental Condensed Consolidating Statement of Income
Three Months Ended June 30, 2011
| Parent Company Only |
Guarantor Subsidiaries |
Non- Guarantor Subsidiaries |
Eliminations | Consolidated | ||||||||||||||||
| (In thousands) | ||||||||||||||||||||
| Revenue: |
||||||||||||||||||||
| Gross revenue |
$ | — | $ | 67,197 | $ | 253,908 | $ | — | $ | 321,105 | ||||||||||
| Intercompany revenue |
— | 11,773 | — | (11,773 | ) | — | ||||||||||||||
|
|
|
|
|
|
|
|
|
|
|
|||||||||||
| — | 78,970 | 253,908 | (11,773 | ) | 321,105 | |||||||||||||||
|
|
|
|
|
|
|
|
|
|
|
|||||||||||
| Operating expense: |
||||||||||||||||||||
| Direct cost and reimbursable expense |
(730 | ) | 42,961 | 187,525 | — | 229,756 | ||||||||||||||
| Intercompany expenses |
— | — | 11,773 | (11,773 | ) | — | ||||||||||||||
| Depreciation and amortization |
843 | 8,182 | 13,683 | — | 22,708 | |||||||||||||||
| General and administrative |
14,175 | 6,763 | 18,707 | — | 39,645 | |||||||||||||||
|
|
|
|
|
|
|
|
|
|
|
|||||||||||
| 14,288 | 57,906 | 231,688 | (11,773 | ) | 292,109 | |||||||||||||||
|
|
|
|
|
|
|
|
|
|
|
|||||||||||
| Gain on disposal of assets |
— | 180 | 1,236 | — | 1,416 | |||||||||||||||
| Earnings from unconsolidated affiliates, net of losses |
22,219 | — | 5,993 | (22,219 | ) | 5,993 | ||||||||||||||
|
|
|
|
|
|
|
|
|
|
|
|||||||||||
| Operating income |
7,931 | 21,244 | 29,449 | (22,219 | ) | 36,405 | ||||||||||||||
| Interest income |
23,303 | 170 | 162 | (23,464 | ) | 171 | ||||||||||||||
| Interest expense |
(9,259 | ) | — | (23,160 | ) | 23,464 | (8,955 | ) | ||||||||||||
| Other income (expense), net |
14 | 66 | 124 | — | 204 | |||||||||||||||
|
|
|
|
|
|
|
|
|
|
|
|||||||||||
| Income before provision for income taxes |
21,989 | 21,480 | 6,575 | (22,219 | ) | 27,825 | ||||||||||||||
| Allocation of consolidated income taxes |
(929 | ) | (2,663 | ) | (3,014 | ) | — | (6,606 | ) | |||||||||||
|
|
|
|
|
|
|
|
|
|
|
|||||||||||
| Net income |
21,060 | 18,817 | 3,561 | (22,219 | ) | 21,219 | ||||||||||||||
| Net income attributable to noncontrolling interests |
(15 | ) | — | (159 | ) | — | (174 | ) | ||||||||||||
|
|
|
|
|
|
|
|
|
|
|
|||||||||||
| Net income attributable to Bristow Group |
$ | 21,045 | $ | 18,817 | $ | 3,402 | $ | (22,219 | ) | $ | 21,045 | |||||||||
|
|
|
|
|
|
|
|
|
|
|
|||||||||||
25
Table of Contents
BRISTOW GROUP INC. AND SUBSIDIARIES
NOTES TO CONDENSED CONSOLIDATED FINANCIAL STATEMENTS — (Continued)
(Unaudited)
Supplemental Condensed Consolidating Balance Sheet
As of June 30, 2012
| Parent Company Only |
Guarantor Subsidiaries |
Non- Guarantor Subsidiaries |
Eliminations | Consolidated | ||||||||||||||||
| (In thousands) | ||||||||||||||||||||
| ASSETS | ||||||||||||||||||||
| Current assets: |
||||||||||||||||||||
| Cash and cash equivalents |
$ | 54,156 | $ | 4,061 | $ | 169,033 | $ | — | $ | 227,250 | ||||||||||
| Accounts receivable |
15,671 | 85,616 | 239,553 | (48,881 | ) | 291,959 | ||||||||||||||
| Inventories |
— | 57,248 | 100,295 | — | 157,543 | |||||||||||||||
| Assets held for sale |
— | 1,547 | 16,553 | — | 18,100 | |||||||||||||||
| Prepaid expenses and other current assets |
1,182 | (187 | ) | 18,560 | (7,316 | ) | 12,239 | |||||||||||||
|
|
|
|
|
|
|
|
|
|
|
|||||||||||
| Total current assets |
71,009 | 148,285 | 543,994 | (56,197 | ) | 707,091 | ||||||||||||||
| Intercompany investment |
1,029,404 | 111,434 | — | (1,140,838 | ) | — | ||||||||||||||
| Investment in unconsolidated affiliates |
3,228 | 150 | 197,664 | — | 201,042 | |||||||||||||||
| Intercompany notes receivable |
1,296,062 | — | (30,775 | ) | (1,265,287 | ) | — | |||||||||||||
| Property and equipment—at cost: |
||||||||||||||||||||
| Land and buildings |
801 | 48,872 | 32,143 | — | 81,816 | |||||||||||||||
| Aircraft and equipment |
14,267 | 875,832 | 1,252,974 | — | 2,143,073 | |||||||||||||||
|
|
|
|
|
|
|
|
|
|
|
|||||||||||
| 15,068 | 924,704 | 1,285,117 | — | 2,224,889 | ||||||||||||||||
| Less: Accumulated depreciation and amortization |
(7,751 | ) | (190,943 | ) | (269,193 | ) | — | (467,887 | ) | |||||||||||
|
|
|
|
|
|
|
|
|
|
|
|||||||||||
| 7,317 | 733,761 | 1,015,924 | — | 1,757,002 | ||||||||||||||||
| Goodwill |
— | 4,755 | 24,584 | — | 29,339 | |||||||||||||||
| Other assets |
110,883 | 2,418 | 166,881 | (234,277 | ) | 45,905 | ||||||||||||||
|
|
|
|
|
|
|
|
|
|
|
|||||||||||
| Total assets |
$ | 2,517,903 | $ | 1,000,803 | $ | 1,918,272 | $ | (2,696,599 | ) | $ | 2,740,379 | |||||||||
|
|
|
|
|
|
|
|
|
|
|
|||||||||||
LIABILITIES AND STOCKHOLDERS’ INVESTMENT
| Current liabilities: |
||||||||||||||||||||
| Accounts payable |
$ | 3,951 | $ | 17,586 | $ | 80,006 | $ | (43,667 | ) | $ | 57,876 | |||||||||
| Accrued liabilities |
12,452 | 20,429 | 101,338 | (11,180 | ) | 123,039 | ||||||||||||||
| Current deferred taxes |
(1,218 | ) | (133 | ) | 16,314 | — | 14,963 | |||||||||||||
| Short-term borrowings and current maturities of long-term debt |
16,562 | — | — | — | 16,562 | |||||||||||||||
|
|
|
|
|
|
|
|
|
|
|
|||||||||||
| Total current liabilities |
31,747 | 37,882 | 197,658 | (54,847 | ) | 212,440 | ||||||||||||||
| Long-term debt, less current maturities |
719,737 | — | — | — | 719,737 | |||||||||||||||
| Intercompany notes payable |
— | 273,467 | 1,092,844 | (1,366,311 | ) | — | ||||||||||||||
| Accrued pension liabilities |
— | — | 109,792 | — | 109,792 | |||||||||||||||
| Other liabilities and deferred credits |
5,986 | 8,496 | 160,921 | (160,580 | ) | 14,823 | ||||||||||||||
| Deferred taxes |
126,705 | 9,105 | 6,578 | — | 142,388 | |||||||||||||||
| Stockholders’ investment: |
||||||||||||||||||||
| Common stock |
363 | 4,996 | 22,881 | (27,877 | ) | 363 | ||||||||||||||
| Additional paid-in-capital |
705,984 | 9,290 | 243,520 | (252,810 | ) | 705,984 | ||||||||||||||
| Retained earnings |
1,009,952 | 657,567 | 27,272 | (684,839 | ) | 1,009,952 | ||||||||||||||
| Accumulated other comprehensive income (loss) |
(59,033 | ) | — | 49,434 | (149,335 | ) | (158,934 | ) | ||||||||||||
| Treasury shares |
(25,085 | ) | — | — | — | (25,085 | ) | |||||||||||||
|
|
|
|
|
|
|
|
|
|
|
|||||||||||
| Total Bristow Group Inc. stockholders’ investment |
1,632,181 | 671,853 | 343,107 | (1,114,861 | ) | 1,532,280 | ||||||||||||||
| Noncontrolling interests |
1,547 | — | 7,372 | — | 8,919 | |||||||||||||||
|
|
|
|
|
|
|
|
|
|
|
|||||||||||
| Total stockholders’ investment |
1,633,728 | 671,853 | 350,479 | (1,114,861 | ) | 1,541,199 | ||||||||||||||
|
|
|
|
|
|
|
|
|
|
|
|||||||||||
| Total liabilities and stockholders’ investment |
$ | 2,517,903 | $ | 1,000,803 | $ | 1,918,272 | $ | (2,696,599 | ) | $ | 2,740,379 | |||||||||
|
|
|
|
|
|
|
|
|
|
|
|||||||||||
26
Table of Contents
BRISTOW GROUP INC. AND SUBSIDIARIES
NOTES TO CONDENSED CONSOLIDATED FINANCIAL STATEMENTS — (Continued)
(Unaudited)
Supplemental Condensed Consolidating Balance Sheet
As of March 31, 2012
| Parent Company Only |
Guarantor Subsidiaries |
Non- Guarantor Subsidiaries |
Eliminations | Consolidated | ||||||||||||||||
| (In thousands) | ||||||||||||||||||||
| ASSETS | ||||||||||||||||||||
| Current assets: |
||||||||||||||||||||
| Cash and cash equivalents |
$ | 76,609 | $ | 3,155 | $ | 181,786 | $ | — | $ | 261,550 | ||||||||||
| Accounts receivable |
12,884 | 97,732 | 246,297 | (70,693 | ) | 286,220 | ||||||||||||||
| Inventories |
— | 57,957 | 99,868 | — | 157,825 | |||||||||||||||
| Assets held for sale |
— | 1,400 | 17,310 | — | 18,710 | |||||||||||||||
| Prepaid expenses and other current assets |
1,512 | 2,220 | 27,394 | (18,958 | ) | 12,168 | ||||||||||||||
|
|
|
|
|
|
|
|
|
|
|
|||||||||||
| Total current assets |
91,005 | 162,464 | 572,655 | (89,651 | ) | 736,473 | ||||||||||||||
| Intercompany investment |
1,031,041 | 111,434 | — | (1,142,475 | ) | — | ||||||||||||||
| Investment in unconsolidated affiliates |
2,378 | 150 | 202,572 | — | 205,100 | |||||||||||||||
| Intercompany notes receivable |
1,266,714 | — | (13,792 | ) | (1,252,922 | ) | — | |||||||||||||
| Property and equipment—at cost: |
||||||||||||||||||||
| Land and buildings |
801 | 48,855 | 31,179 | — | 80,835 | |||||||||||||||
| Aircraft and equipment |
13,969 | 880,643 | 1,205,030 | — | 2,099,642 | |||||||||||||||
|
|
|
|
|
|
|
|
|
|
|
|||||||||||
| 14,770 | 929,498 | 1,236,209 | — | 2,180,477 | ||||||||||||||||
| Less: Accumulated depreciation and amortization |
(6,705 | ) | (186,876 | ) | (264,121 | ) | — | (457,702 | ) | |||||||||||
|
|
|
|
|
|
|
|
|
|
|
|||||||||||
| 8,065 | 742,622 | 972,088 | — | 1,722,775 | ||||||||||||||||
| Goodwill |
— | 4,755 | 24,889 | — | 29,644 | |||||||||||||||
| Other assets |
111,442 | 2,416 | 166,829 | (234,316 | ) | 46,371 | ||||||||||||||
|
|
|
|
|
|
|
|
|
|
|
|||||||||||
| Total assets |
$ | 2,510,645 | $ | 1,023,841 | $ | 1,925,241 | $ | (2,719,364 | ) | $ | 2,740,363 | |||||||||
|
|
|
|
|
|
|
|
|
|
|
|||||||||||
LIABILITIES AND STOCKHOLDERS’ INVESTMENT
| Current liabilities: |
||||||||||||||||||||
| Accounts payable |
$ | 3,130 | $ | 26,384 | $ | 93,914 | $ | (67,344 | ) | $ | 56,084 | |||||||||
| Accrued liabilities |
11,506 | 20,987 | 102,006 | (20,823 | ) | 113,676 | ||||||||||||||
| Current deferred taxes |
(1,571 | ) | (128 | ) | 16,769 | — | 15,070 | |||||||||||||
| Short-term borrowings and current maturities of long-term debt |
14,375 | — | — | — | 14,375 | |||||||||||||||
|
|
|
|
|
|
|
|
|
|
|
|||||||||||
| Total current liabilities |
27,440 | 47,243 | 212,689 | (88,167 | ) | 199,205 | ||||||||||||||
| Long-term debt, less current maturities |
742,870 | — | — | — | 742,870 | |||||||||||||||
| Intercompany notes payable |
— | 296,335 | 1,057,622 | (1,353,957 | ) | — | ||||||||||||||
| Accrued pension liabilities |
— | — | 111,742 | — | 111,742 | |||||||||||||||
| Other liabilities and deferred credits |
6,738 | 8,754 | 161,168 | (159,892 | ) | 16,768 | ||||||||||||||
| Deferred taxes |
121,385 | 8,903 | 17,666 | — | 147,954 | |||||||||||||||
| Stockholders’ investment: |
||||||||||||||||||||
| Common stock |
363 | 4,996 | 22,828 | (27,824 | ) | 363 | ||||||||||||||
| Additional paid-in-capital |
703,628 | 9,290 | 249,367 | (258,657 | ) | 703,628 | ||||||||||||||
| Retained earnings |
993,435 | 648,320 | 30,335 | (678,655 | ) | 993,435 | ||||||||||||||
| Accumulated other comprehensive income (loss) |
(61,706 | ) | — | 54,679 | (152,212 | ) | (159,239 | ) | ||||||||||||
| Treasury shares |
(25,085 | ) | — | — | — | (25,085 | ) | |||||||||||||
|
|
|
|
|
|
|
|
|
|
|
|||||||||||
| Total Bristow Group Inc. stockholders’ investment |
1,610,635 | 662,606 | 357,209 | (1,117,348 | ) | 1,513,102 | ||||||||||||||
| Noncontrolling interests |
1,577 | — | 7,145 | — | 8,722 | |||||||||||||||
|
|
|
|
|
|
|
|
|
|
|
|||||||||||
| Total stockholders’ investment |
1,612,212 | 662,606 | 364,354 | (1,117,348 | ) | 1,521,824 | ||||||||||||||
|
|
|
|
|
|
|
|
|
|
|
|||||||||||
| Total liabilities and stockholders’ investment |
$ | 2,510,645 | $ | 1,023,841 | $ | 1,925,241 | $ | (2,719,364 | ) | $ | 2,740,363 | |||||||||
|
|
|
|
|
|
|
|
|
|
|
|||||||||||
27
Table of Contents
BRISTOW GROUP INC. AND SUBSIDIARIES
NOTES TO CONDENSED CONSOLIDATED FINANCIAL STATEMENTS — (Continued)
(Unaudited)
Supplemental Condensed Consolidating Statement of Cash Flows
Three Months Ended June 30, 2012
| Parent Company Only |
Guarantor Subsidiaries |
Non- Guarantor Subsidiaries |
Eliminations | Consolidated | ||||||||||||||||
| (In thousands) | ||||||||||||||||||||
| Net cash provided by (used in) operating activities |
$ | (10,350 | ) | $ | 58,170 | $ | 7,592 | $ | — | $ | 55,412 | |||||||||
| Cash flows from investing activities: |
||||||||||||||||||||
| Capital expenditures |
(445 | ) | (35,698 | ) | (50,412 | ) | — | (86,555 | ) | |||||||||||
| Proceeds from asset dispositions |
— | 9,621 | 10,606 | — | 20,227 | |||||||||||||||
| Investment in unconsolidated affiliate |
(850 | ) | — | — | — | (850 | ) | |||||||||||||
|
|
|
|
|
|
|
|
|
|
|
|||||||||||
| Net cash used in investing activities |
(1,295 | ) | (26,077 | ) | (39,806 | ) | — | (67,178 | ) | |||||||||||
|
|
|
|
|
|
|
|
|
|
|
|||||||||||
| Cash flows from financing activities: |
||||||||||||||||||||
| Repayment of debt |
(21,800 | ) | — | — | — | (21,800 | ) | |||||||||||||
| Dividends paid |
4,410 | (9,755 | ) | (1,800 | ) | — | (7,145 | ) | ||||||||||||
| Increases (decreases) in cash related to intercompany advances and debt |
5,884 | (21,432 | ) | 15,548 | — | — | ||||||||||||||
| Partial prepayment of put/call obligation |
(17 | ) | — | — | — | (17 | ) | |||||||||||||
| Issuance of Common Stock |
311 | — | — | — | 311 | |||||||||||||||
| Tax benefit related to stock-based compensation |
404 | — | — | — | 404 | |||||||||||||||
|
|
|
|
|
|
|
|
|
|
|
|||||||||||
| Net cash provided by (used in) financing activities |
(10,808 | ) | (31,187 | ) | 13,748 | — | (28,247 | ) | ||||||||||||
| Effect of exchange rate changes on cash and cash equivalents |
— | — | 5,713 | — | 5,713 | |||||||||||||||
|
|
|
|
|
|
|
|
|
|
|
|||||||||||
| Net increase (decrease) in cash and cash equivalents |
(22,453 | ) | 906 | (12,753 | ) | — | (34,300 | ) | ||||||||||||
| Cash and cash equivalents at beginning of period |
76,609 | 3,155 | 181,786 | — | 261,550 | |||||||||||||||
|
|
|
|
|
|
|
|
|
|
|
|||||||||||
| Cash and cash equivalents at end of period |
$ | 54,156 | $ | 4,061 | $ | 169,033 | $ | — | $ | 227,250 | ||||||||||
|
|
|
|
|
|
|
|
|
|
|
|||||||||||
28
Table of Contents
BRISTOW GROUP INC. AND SUBSIDIARIES
NOTES TO CONDENSED CONSOLIDATED FINANCIAL STATEMENTS — (Continued)
(Unaudited)
Supplemental Condensed Consolidating Statement of Cash Flows
Three Months Ended June 30, 2011
| Parent Company Only |
Guarantor Subsidiaries |
Non- Guarantor Subsidiaries |
Eliminations | Consolidated | ||||||||||||||||
| (In thousands) | ||||||||||||||||||||
| Net cash provided by operating activities |
$ | 8,757 | $ | 31,570 | $ | 12,562 | $ | — | $ | 52,889 | ||||||||||
| Cash flows from investing activities: |
||||||||||||||||||||
| Capital expenditures |
(939 | ) | (34,721 | ) | (36,575 | ) | — | (72,235 | ) | |||||||||||
| Proceeds from asset dispositions |
— | — | 833 | — | 833 | |||||||||||||||
|
|
|
|
|
|
|
|
|
|
|
|||||||||||
| Net cash used in investing activities |
(939 | ) | (34,721 | ) | (35,742 | ) | — | (71,402 | ) | |||||||||||
|
|
|
|
|
|
|
|
|
|
|
|||||||||||
| Cash flows from financing activities: |
||||||||||||||||||||
| Proceeds from borrowings |
55,000 | — | — | — | 55,000 | |||||||||||||||
| Repayment of debt and debt redemption premiums |
(30,000 | ) | — | (1,274 | ) | — | (31,274 | ) | ||||||||||||
| Dividends paid |
3,590 | (8,960 | ) | (40 | ) | — | (5,410 | ) | ||||||||||||
| Increases (decreases) in cash related to intercompany advances and debt |
(4,129 | ) | 11,721 | (7,592 | ) | — | — | |||||||||||||
| Partial prepayment of put/call obligation |
(15 | ) | — | — | — | (15 | ) | |||||||||||||
| Issuance of Common Stock |
1,183 | — | — | — | 1,183 | |||||||||||||||
| Tax benefit related to stock-based compensation |
101 | — | — | — | 101 | |||||||||||||||
|
|
|
|
|
|
|
|
|
|
|
|||||||||||
| Net cash provided by (used in) financing activities |
25,730 | 2,761 | (8,906 | ) | — | 19,585 | ||||||||||||||
| Effect of exchange rate changes on cash and cash equivalents |
— | — | (363 | ) | — | (363 | ) | |||||||||||||
|
|
|
|
|
|
|
|
|
|
|
|||||||||||
| Net increase (decrease) in cash and cash equivalents |
33,548 | (390 | ) | (32,449 | ) | — | 709 | |||||||||||||
| Cash and cash equivalents at beginning of period |
24,075 | 5,233 | 87,053 | — | 116,361 | |||||||||||||||
|
|
|
|
|
|
|
|
|
|
|
|||||||||||
| Cash and cash equivalents at end of period |
$ | 57,623 | $ | 4,843 | $ | 54,604 | $ | — | $ | 117,070 | ||||||||||
|
|
|
|
|
|
|
|
|
|
|
|||||||||||
29
Table of Contents
Report of Independent Registered Public Accounting Firm
The Board of Directors and Shareholders
Bristow Group Inc.:
We have reviewed the condensed consolidated balance sheet of Bristow Group Inc. and subsidiaries (the Company) as of June 30, 2012, the related condensed consolidated statements of income and comprehensive income for the three-month periods ended June 30, 2012 and 2011, and the related condensed consolidated statements of cash flows for the three-month periods ended June 30, 2012 and 2011. These condensed consolidated financial statements are the responsibility of the Company’s management.
We conducted our reviews in accordance with the standards of the Public Company Accounting Oversight Board (United States). A review of interim financial information consists principally of applying analytical procedures and making inquiries of persons responsible for financial and accounting matters. It is substantially less in scope than an audit conducted in accordance with the standards of the Public Company Accounting Oversight Board (United States), the objective of which is the expression of an opinion regarding the financial statements taken as a whole. Accordingly, we do not express such an opinion.
Based on our reviews, we are not aware of any material modifications that should be made to the condensed consolidated financial statements referred to above for them to be in conformity with U.S. generally accepted accounting principles.
We have previously audited, in accordance with standards of the Public Company Accounting Oversight Board (United States), the consolidated balance sheet of the Company as of March 31, 2012, and the related consolidated statements of income, stockholders’ investment, and cash flows for the year then ended (not presented herein); and in our report dated May 23, 2012 we expressed an unqualified opinion on those consolidated financial statements. In our opinion, the information set forth in the accompanying condensed consolidated balance sheet as of March 31, 2012 is fairly stated, in all material respects, in relation to the consolidated balance sheet from which it has been derived.
/s/ KPMG LLP
Houston, Texas
August 6, 2012
30
Table of Contents
Item 2. Management’s Discussion and Analysis of Financial Condition and Results of Operations
Management’s Discussion and Analysis of Financial Condition and Results of Operations, or MD&A, should be read in conjunction with the accompanying unaudited condensed consolidated financial statements and the notes thereto as well as our Annual Report on Form 10-K for the fiscal year ended March 31, 2012 (the “fiscal year 2012 Annual Report”) and the MD&A contained therein. In the discussion that follows, the terms “Current Quarter” and “Comparable Quarter” refer to the three months ended June 30, 2012 and 2011, respectively. Our fiscal year ends March 31, and we refer to fiscal years based on the end of such period. Therefore, the fiscal year ending March 31, 2013 is referred to as “fiscal year 2013.”
Forward-Looking Statements
This Quarterly Report contains “forward-looking statements” within the meaning of Section 27A of the Securities Act of 1933 and Section 21E of the Securities Exchange Act of 1934 (the “Exchange Act”). Forward-looking statements are statements about our future business, strategy, operations, capabilities and results; financial projections; plans and objectives of our management; expected actions by us and by third parties, including our clients, competitors, vendors and regulators; and other matters. Some of the forward-looking statements can be identified by the use of words such as “believes”, “belief”, “expects”, “plans”, “anticipates”, “intends”, “projects”, “estimates”, “may”, “might”, “would”, “could” or other similar words; however, all statements in this Quarterly Report, other than statements of historical fact or historical financial results, are forward-looking statements.
Our forward-looking statements reflect our views and assumptions on the date we are filing this Quarterly Report regarding future events and operating performance. We believe that they are reasonable, but they involve known and unknown risks, uncertainties and other factors, many of which may be beyond our control, that may cause actual results to differ materially from any future results, performance or achievements expressed or implied by the forward-looking statements. Accordingly, you should not put undue reliance on any forward-looking statements.
You should consider the following key factors when evaluating these forward-looking statements:
| • | the possibility of political instability, war or acts of terrorism in any of the countries where we operate; |
| • | fluctuations in worldwide prices of and demand for natural gas and oil; |
| • | fluctuations in levels of natural gas and oil exploration and development activities; |
| • | fluctuations in the demand for our services; |
| • | the existence of competitors; |
| • | the existence of operating risks inherent in our business, including the possibility of declining safety performance; |
| • | the possibility of changes in tax and other laws and regulations; |
| • | the possibility that the major oil companies do not continue to expand internationally; |
| • | the possibility of significant changes in foreign exchange rates and controls; |
| • | general economic conditions including the capital and credit markets; |
| • | the possibility that we may be unable to acquire additional aircraft due to limited availability or unable to exercise aircraft purchase options; |
| • | the possibility that we may be unable to dispose of older aircraft through sales into the aftermarket; |
| • | the possibility that we may be unable to obtain financing or we may be unable to draw on our credit facilities; |
| • | the possibility that we may be unable to re-deploy our aircraft to regions with greater demand; and |
| • | the possibility that we do not achieve the anticipated benefit of our fleet capacity expansion program. |
31
Table of Contents
The above description of risks and uncertainties is by no means all-inclusive, but is designed to highlight what we believe are important factors to consider. For a more detailed description of risk factors, please see the risks and uncertainties described under Item 1A. “Risk Factors” included in the fiscal year 2012 Annual Report.
All forward-looking statements in this Quarterly Report are qualified by these cautionary statements and are only made as of the date of this Quarterly Report. We do not undertake any obligation, other than as required by law, to update or revise any forward-looking statements, whether as a result of new information, future events or otherwise.
Executive Overview
This Executive Overview only includes what management considers to be the most important information and analysis for evaluating our financial condition and operating performance. It provides the context for the discussion and analysis of the financial statements which follow and does not disclose every item impacting our financial condition and operating performance.
General
We are the leading provider of helicopter services to the worldwide offshore energy industry based on the number of aircraft operated and one of two helicopter service providers to the offshore energy industry with global operations. We have a long history in the helicopter services industry through Bristow Helicopters Ltd. and Offshore Logistics, Inc., having been founded in 1955 and 1969, respectively. We have major transportation operations in the North Sea, Nigeria and the U.S. Gulf of Mexico, and in most of the other major offshore energy producing regions of the world, including Alaska, Australia, Brazil, Russia and Trinidad. We generated 81%, 82% and 89% of our consolidated operating revenue, business unit operating income and business unit adjusted EBITDAR, respectively, from operations outside of the U.S. during the Current Quarter.
We conduct our business in one segment: Helicopter Services. The Helicopter Services segment operations are conducted primarily through five business units:
| • | Europe, |
| • | West Africa, |
| • | North America, |
| • | Australia, and |
| • | Other International. |
We provide helicopter services to a broad base of major integrated, national and independent offshore energy companies. Our clients charter our helicopters primarily to transport personnel between onshore bases and offshore production platforms, drilling rigs and other installations. To a lesser extent, our clients also charter our helicopters to transport time-sensitive equipment to these offshore locations. In addition to our primary Helicopter Services operations, we also operate a training business unit, Bristow Academy, and provide technical services to clients in the U.S. and U.K. As of June 30, 2012, we operated 357 aircraft (including 301 owned aircraft and 56 leased aircraft; 17 of the owned aircraft are held for sale) and our unconsolidated affiliates operated 194 aircraft in addition to those aircraft leased from us.
32
Table of Contents
The chart below presents (1) the number of helicopters in our fleet and their distribution among the business units of our Helicopter Services segment as of June 30, 2012; (2) the number of helicopters which we had on order or under option as of June 30, 2012; and (3) the percentage of operating revenue which each of our business units provided during the Current Quarter. For additional information regarding our commitments and options to acquire aircraft, see Note 6 in the “Notes to Condensed Consolidated Financial Statements” included elsewhere in this Quarterly Report.
| Percentage of Current Quarter Operating Revenue |
Aircraft in Consolidated Fleet | Unconsolidated Affiliates (3) |
Total | |||||||||||||||||||||||||||||||||
| Helicopters | Fixed Wing |
Total (1)(2) | ||||||||||||||||||||||||||||||||||
| Small | Medium | Large | Training | |||||||||||||||||||||||||||||||||
| Europe |
39 | % | — | 15 | 43 | — | — | 58 | 64 | 122 | ||||||||||||||||||||||||||
| West Africa |
21 | % | 10 | 25 | 7 | — | 3 | 45 | — | 45 | ||||||||||||||||||||||||||
| North America |
16 | % | 67 | 22 | 2 | — | — | 91 | — | 91 | ||||||||||||||||||||||||||
| Australia |
12 | % | 2 | 10 | 16 | — | — | 28 | — | 28 | ||||||||||||||||||||||||||
| Other International |
10 | % | 4 | 40 | 14 | — | — | 58 | 130 | 188 | ||||||||||||||||||||||||||
| Corporate and other |
2 | % | — | — | — | 77 | — | 77 | — | 77 | ||||||||||||||||||||||||||
|
|
|
|
|
|
|
|
|
|
|
|
|
|
|
|
|
|
|
|||||||||||||||||||
| Total |
100 | % | 83 | 112 | 82 | 77 | 3 | 357 | 194 | 551 | ||||||||||||||||||||||||||
|
|
|
|
|
|
|
|
|
|
|
|
|
|
|
|
|
|
|
|||||||||||||||||||
| Aircraft not currently in fleet: (4) |
||||||||||||||||||||||||||||||||||||
| On order |
— | — | 17 | — | — | 17 | ||||||||||||||||||||||||||||||
| Under option |
— | 12 | 24 | — | — | 36 | ||||||||||||||||||||||||||||||
| (1) | Includes 17 aircraft held for sale and 56 leased aircraft as follows: |
| Held for Sale Aircraft in Consolidated Fleet | ||||||||||||||||||||||||
| Helicopters | ||||||||||||||||||||||||
| Small | Medium | Large | Training | Fixed Wing |
Total | |||||||||||||||||||
| Europe |
— | 2 | 3 | — | — | 5 | ||||||||||||||||||
| West Africa |
— | 1 | — | — | — | 1 | ||||||||||||||||||
| North America |
— | — | — | — | — | — | ||||||||||||||||||
| Australia |
— | 1 | 3 | — | — | 4 | ||||||||||||||||||
| Other International |
— | 7 | — | — | — | 7 | ||||||||||||||||||
| Corporate and other |
— | — | — | — | — | — | ||||||||||||||||||
|
|
|
|
|
|
|
|
|
|
|
|
|
|||||||||||||
| Total |
— | 11 | 6 | — | — | 17 | ||||||||||||||||||
|
|
|
|
|
|
|
|
|
|
|
|
|
|||||||||||||
| Leased Aircraft in Consolidated Fleet | ||||||||||||||||||||||||
| Helicopters | ||||||||||||||||||||||||
| Small | Medium | Large | Training | Fixed Wing |
Total | |||||||||||||||||||
| Europe |
— | — | 8 | — | — | 8 | ||||||||||||||||||
| West Africa |
— | 1 | — | — | — | 1 | ||||||||||||||||||
| North America |
1 | 11 | 2 | — | — | 14 | ||||||||||||||||||
| Australia |
2 | — | 1 | — | — | 3 | ||||||||||||||||||
| Other International |
— | — | — | — | — | — | ||||||||||||||||||
| Corporate and other |
— | — | — | 30 | — | 30 | ||||||||||||||||||
|
|
|
|
|
|
|
|
|
|
|
|
|
|||||||||||||
| Total |
3 | 12 | 11 | 30 | — | 56 | ||||||||||||||||||
|
|
|
|
|
|
|
|
|
|
|
|
|
|||||||||||||
| (2) | The average age of our fleet, excluding training aircraft, was 12 years as of June 30, 2012. |
| (3) | The 194 aircraft operated by our unconsolidated affiliates do not include those aircraft leased from us. |
| (4) | This table does not reflect aircraft which our unconsolidated affiliates may have on order or under option. |
The commercial aircraft in our consolidated fleet represented in the above chart are our primary source of revenue. To normalize the consolidated operating revenue of our fleet for the different revenue productivity and cost of our commercial aircraft, we developed a common weighted factor that combines large, medium and small aircraft into a combined standardized number of revenue producing commercial aircraft assets. We call this measure Large AirCraft
33
Table of Contents
Equivalent (“LACE”). Our large, medium and small aircraft are weighted as 100%, 50%, and 25%, respectively, to arrive at a single LACE number, which excludes Bristow Academy aircraft, fixed wing aircraft, affiliate aircraft, aircraft held for sale and aircraft construction in process. We divide our operating revenue from commercial contracts, which excludes operating revenue from affiliates and reimbursable revenue, by LACE to develop a LACE rate, which is a standardized rate, similar to a day rate, on which we disclose results and provide guidance. Our current number of LACE aircraft is 147 and our historical LACE and LACE rate is as follows:
| Current | Fiscal Year Ended March 31, | |||||||||||||||||||||||
| Quarter | 2012 | 2011 | 2010 | 2009 | 2008 | |||||||||||||||||||
| LACE |
147 | 149 | 153 | 159 | 164 | 161 | ||||||||||||||||||
| LACE Rate (in millions) |
$ | 8.55 | $ | 7.89 | $ | 7.15 | $ | 6.49 | $ | 6.14 | $ | 5.72 | ||||||||||||
The following table presents the percentage of LACE leased as of June 30, 2012:
| Europe |
17 | % | ||
| West Africa |
2 | % | ||
| North America |
26 | % | ||
| Australia |
11 | % | ||
| Other International |
— | % | ||
| Total |
12 | % |
Our Strategy
Our goal is to strengthen our position as a leading helicopter services provider to the offshore energy industry. We intend to employ the following well defined business/commercial and capital allocation strategies to achieve this goal:
Business/Commercial Strategy
| • | Be the preferred provider of helicopter services. We position our business to be the preferred provider of helicopter services by maintaining strong relationships with our clients and providing safe and high-quality service. In order to create differentiation and add value to our clients, we focus on enhancing our value to our clients through the initiatives of “Target Zero Accidents,” “Target Zero Downtime” and “Target Zero Complaints,” which comprise our program called the “Bristow Client Promise.” This program is designed to deliver continuous improvement in all these important areas and demonstrate our commitment to providing higher hours of zero-accident flight time with on-time and up-time helicopter transportation service. We maintain relationships with our clients’ field operations and corporate management that we believe helps us better anticipate client needs and provide our clients with the right aircraft in the right place at the right time, which in turn allows us to better manage our fleet utilization and capital investment program. We also leverage our close relationships with our clients to establish mutually beneficial operating practices and safety standards worldwide. By applying standardized-first-rate operating and safety practices across our global operations, we seek to provide our clients with consistent, high-quality service in each of their areas of operation. By better understanding and delivering on our clients’ needs with our global operations and safety standards, we believe we effectively compete against other helicopter service providers based on aircraft availability, client service, safety and reliability, and not just price. |
| • | Grow our business while managing our assets. We plan to continue to grow our business globally and increase our revenue and profitability over time, while managing through cyclical downturns in the energy industry. We conduct flight operations in most major oil and gas producing regions of the world, and through our strong relationships with our existing clients, we are aware of future business opportunities in the markets we currently serve that would allow us to grow through new contracts. We anticipate these new opportunities will result in the deployment of new or existing aircraft into markets where we expect they will earn desirable rates of return. Additionally, new opportunities may result in growth through acquisitions and investments in existing or new markets, which may include increasing our role and participation with existing unconsolidated affiliates, investing in new companies, or creating partnerships and alliances with existing industry participants. We believe the combination of growth in existing and new markets will deliver improved shareholder returns. |
34
Table of Contents
Capital Allocation Strategy
Our capital allocation strategy is based on three principles as follows:
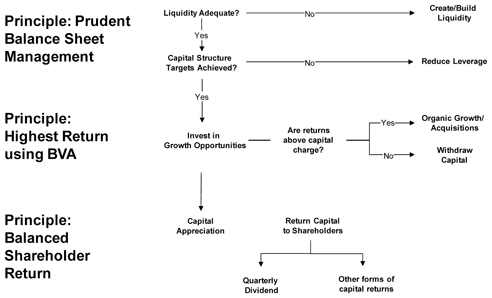
| • | Prudent balance sheet management. Throughout our corporate and business unit management, we proactively manage our capital allocation plan with a concentration on achieving business growth and improving rates of return, within the dictates of prudent balance sheet management. We have funded our successful growth plan and maintained adequate liquidity by raising approximately $1.4 billion of debt and equity by means of both public and private financings since fiscal year 2007, and we intend to continue managing our capital structure and liquidity position relative to our commitments with external financings when necessary and through the use of operating leases for 20-30% of our LACE. During fiscal year 2012, we initiated a new financing strategy whereby we are now using operating leases to a larger extent than in the past. As of June 30, 2012, aircraft under operating leases account for 12% of our LACE. Our adjusted debt to total equity ratio and total liquidity were 69.1% and $386.6 million, respectively, as of June 30, 2012 and 70.8% and $401.6 million, respectively, as of March 31, 2012. Adjusted debt includes the net present value of operating leases totaling $217.0 million and $190.2 million, respectively, letters of credit and guarantees totaling $1.5 million and $17.5 million, respectively, and the unfunded pension liability of $109.8 million and $111.7 million, respectively, as of June 30 and March 31, 2012. |
| • | Highest return. Our internal financial management framework, called Bristow Value Added (“BVA”), focuses on the returns we deliver across our organization. BVA is computed by subtracting a capital charge for the use of gross invested capital from after tax operating cash flow. Our goal is to achieve strong improvements in BVA over time by (1) improving the returns we earn throughout our organization via cost and capital efficiency improvements as well as through better pricing based on the differentiated value we deliver to clients via aircraft safety, availability, client service and reliability; (2) deploying more capital into commercial opportunities where management believes we can deliver strong returns and when we believe it will benefit the Company and our shareholders, including making strategic acquisitions or strategic equity investments; and (3) withdrawing capital from areas where returns are deemed inadequate and unable to be sufficiently improved. When appropriate, we may divest parts of the Company. Improvements in BVA is the primary financial measure in our management incentive plan, which is designed to align the interests of management with shareholders. |
35
Table of Contents
| • | Balanced shareholder return. We have invested $2.0 billion on capital expenditures to grow our business since fiscal year 2007. We believe our liquidity position and cash flows from operations will be adequate to finance operating and maintenance capital expenditures, so we have considered our capital deployment alternatives for the future to deliver a more balanced return to our shareholders. On July 31, 2012, our board of directors approved our sixth consecutive quarterly dividend. Also, on November 2, 2011, our board of directors authorized the expenditure of up to $100 million to repurchase shares of our Common Stock within 12 months from that date, of which $25.1 million was spent in fiscal year 2012. For additional information on our repurchases of Common Stock, see “Share Repurchases” in Note 11 to the fiscal year 2012 Financial Statements. The timing and method of any repurchases under the program will depend on a variety of factors, is subject to our results of operations, financial condition, cash requirements, and other factors and restrictions under applicable law and our debt instruments, and may be suspended or discontinued at any time. |
Market Outlook
Our core business is providing helicopter services to the worldwide oil and gas industry. Our clients’ operating expenditures in the production sector are the principal source of our revenue, while their exploration and development capital expenditures provide a lesser portion of our revenue. Our clients typically base their capital expenditure budgets on their long-term commodity price expectations and not exclusively on the current spot price. In 2009, the credit, equity and commodity markets were quite volatile causing many of our oil and gas company clients to reduce capital spending plans and defer projects. Growing confidence among our clients has led to increased capital expenditure budgets resulting in some larger projects moving ahead that were previously on hold. This led to the recovery in our fiscal year 2011 financial performance and continued slow and steady growth in fiscal year 2012 and into fiscal year 2013.
While we are cautiously optimistic that the economic conditions will continue to recover over the remainder of fiscal year 2013, we continue to seek ways to operate more efficiently and work with our clients to improve the efficiency of their operations. Our global operations and critical mass of helicopters provide us with geographic and client diversity which helps mitigate risks associated with a single market or client. This economic recovery should lead to an accelerated expansion throughout fiscal year 2013 and beyond and increased demand in many of our core markets.
The limited availability of some new aircraft models and the need throughout the industry to retire many of the older aircraft in the worldwide fleet is a driver for our industry. Currently manufacturers have some available aircraft; however, there are some constraints on supply of new large aircraft.
The management of our global aircraft fleet involves a careful evaluation of the expected demand for helicopter services across global energy markets, including the type of aircraft needed to meet this demand. As offshore oil and gas drilling and production globally moves to deeper water, more medium and large aircraft and newer technology aircraft may be required. As older aircraft models come off of current contracts and are replaced by new aircraft, our management evaluates our future needs for these aircraft models and ultimately the ability to recover our remaining investments in these aircraft through sales into the aftermarket. We depreciate our aircraft over their expected useful life to the expected salvage value to be received for the aircraft at the end of that life; however, depending on the market for aircraft or changes in the expected future use of aircraft within our fleet, we may record gains or losses on aircraft sales, impairment charges for aircraft operating or held for sale or accelerate depreciation of aircraft used in our operations. In certain instances where a cash return can be made on newer aircraft in excess of the expected return available through the provision of helicopter services, we may sell newer aircraft. The number of aircraft sales and the amount of gains and losses recorded on these sales is unpredictable. While aircraft sales are common in our business and are reflected in our operating results, gains and losses on aircraft sales may result in our operating results not reflecting the ordinary operating performance of our primary business, which is providing helicopter services to our clients. The gains and losses on aircraft sales are not included in the calculation of adjusted earnings per share or gross cash flows for purposes of calculating BVA.
36
Table of Contents
Brazil continues to represent a significant part of our positive growth outlook. The discovery of pre-salt deepwater fields in Brazil along with the national mandate to significantly increase its production over the next five years will necessitate investment in infrastructure and associated services. The Petrobras five year plan, approved by their board, demands a helicopter fleet growth from 100 to 168 medium and large aircraft. During fiscal year 2012, Líder, our affiliate in Brazil, was awarded contracts for 14 medium aircraft. Seven aircraft commenced operations in fiscal year 2012 and the other seven will commence operations in fiscal year 2013. Aircraft being procured in this market tend to be newer and more sophisticated which is aligned with both Bristow Group’s “Client Promise” and Líder’s “Decolar” service differentiation programs. More recently, Líder was awarded five-year contracts by Petrobras for five large aircraft. One of these aircraft is leased to Líder by Bristow and is scheduled to start work in August 2012, and the remaining four aircraft are scheduled to commence work starting in late 2012 through April 2013.
Despite this growth, Líder’s operating results have been below our fiscal year 2013 expectations due to startup costs related to hiring of support and administrative personnel and training being incurred in preparation for these contract commencements. Líder is expected to perform better during the second half of fiscal year 2013 as new aircraft begin operating; however, currency fluctuations make it difficult to predict when the growth in this market will translate into higher equity earnings for Bristow from our Líder investment. Equity earnings from unconsolidated affiliates, net of losses on our condensed consolidated statement of income, is included in calculating adjusted net income and adjusted EBITDAR.
As discussed in “Item 1A. Risk Factors” in the fiscal year 2012 Annual Report, we are subject to competition and the political environment in the countries where we operate. In Nigeria, we have seen a recent increase in competitive pressure and new regulation that could impact our ability to win future work at levels previously anticipated. In order to properly and fully embrace new regulations, we have agreed in principle to make a number of key changes to our operating model in Nigeria, while maintaining safety as our number one priority at all times. These changes are still being finalized, with the objectives of these changes being (a) allowing each of Bristow Helicopters Nigeria Ltd. (“BHNL”) and Pan African Airlines Nigeria Ltd. (“PAAN”) to have more autonomy over its own flight operations, (b) providing technical aviation maintenance services through a new wholly-owned Bristow Group entity, BGI Aviation Technical Services (“BATS”), (c) enabling BHNL and PAAN to operate freely in the market place each as a completely separate entity with its own distinct identity, management and workforce, and (d) each of BHNL, PAAN and BATS committing to continue to apply and use all key Bristow Group standards and policies, including without limitation our Target Zero safety program, our Code of Business Integrity and our Operations Manuals. As a result of these changes, our ability to continue to consolidate BHNL and PAAN under the current accounting requirements could change.
We conduct business in various foreign countries, and as such, our cash flows and earnings are subject to fluctuations and related risks from changes in foreign currency exchange rates. During the Current Quarter, our primary foreign currency exposure was related to the euro, the British pound sterling, the Australian dollar, the Nigerian naira and the Brazilian real. For details on this exposure and the related impact on our results of operations, see “Item 3. Quantitative and Qualitative Disclosures about Market Risk” and Note 1 in the “Notes to Condensed Consolidated Financial Statements” included elsewhere in this Quarterly Report.
37
Table of Contents
Results of Operations
The following table presents our operating results and other statement of income information for the applicable periods:
| Three Months Ended | ||||||||||||||||
| June 30, | Favorable | |||||||||||||||
| 2012 | 2011 | (Unfavorable) | ||||||||||||||
| (In thousands, except per share | ||||||||||||||||
| amounts, percentages and flight hours) | ||||||||||||||||
| Gross Revenue: |
||||||||||||||||
| Operating revenue |
$ | 320,654 | $ | 286,761 | $ | 33,893 | 11.8 | % | ||||||||
| Reimbursable revenue |
41,954 | 34,344 | 7,610 | 22.2 | % | |||||||||||
|
|
|
|
|
|
|
|||||||||||
| Total gross revenue |
362,608 | 321,105 | 41,503 | 12.9 | % | |||||||||||
|
|
|
|
|
|
|
|||||||||||
| Operating expense: |
||||||||||||||||
| Direct cost |
222,768 | 196,622 | (26,146 | ) | (13.3 | )% | ||||||||||
| Reimbursable expense |
40,172 | 33,134 | (7,038 | ) | (21.2 | )% | ||||||||||
| Depreciation and amortization |
21,372 | 22,708 | 1,336 | 5.9 | % | |||||||||||
| General and administrative |
34,977 | 39,645 | 4,668 | 11.8 | % | |||||||||||
|
|
|
|
|
|
|
|||||||||||
| 319,289 | 292,109 | (27,180 | ) | (9.3 | )% | |||||||||||
| Gain (loss) on disposal of assets |
(5,315 | ) | 1,416 | (6,731 | ) | * | ||||||||||
| Earnings from unconsolidated affiliates, net of losses |
1,989 | 5,993 | (4,004 | ) | * | |||||||||||
|
|
|
|
|
|
|
|||||||||||
| Operating income |
39,993 | 36,405 | 3,588 | 9.9 | % | |||||||||||
| Interest expense, net |
(8,686 | ) | (8,784 | ) | 98 | 1.1 | % | |||||||||
| Other income (expense), net |
(931 | ) | 204 | (1,135 | ) | * | ||||||||||
|
|
|
|
|
|
|
|||||||||||
| Income before provision for income taxes |
30,376 | 27,825 | 2,551 | 9.2 | % | |||||||||||
| Provision for income taxes |
(6,180 | ) | (6,606 | ) | 426 | 6.4 | % | |||||||||
|
|
|
|
|
|
|
|||||||||||
| Net income |
24,196 | 21,219 | 2,977 | 14.0 | % | |||||||||||
| Net income attributable to noncontrolling interests |
(534 | ) | (174 | ) | (360 | ) | (206.9 | )% | ||||||||
|
|
|
|
|
|
|
|||||||||||
| Net income attributable to Bristow Group |
$ | 23,662 | $ | 21,045 | $ | 2,617 | 12.4 | % | ||||||||
|
|
|
|
|
|
|
|||||||||||
| Diluted earnings per common share |
$ | 0.65 | $ | 0.57 | $ | 0.08 | 14.0 | % | ||||||||
| Operating margin (1) |
12.5 | % | 12.7 | % | (0.2 | )% | (1.6 | )% | ||||||||
| Flight hours (2) |
55,128 | 54,056 | 1,072 | 2.0 | % | |||||||||||
| Non-GAAP financial measures: (3) |
||||||||||||||||
| Adjusted operating income |
$ | 47,470 | $ | 34,989 | $ | 12,481 | 35.7 | % | ||||||||
| Adjusted operating income margin (1) |
14.8 | % | 12.2 | % | 2.6 | % | 21.3 | % | ||||||||
| Adjusted EBITDAR |
$ | 84,273 | $ | 67,025 | $ | 17,248 | 25.7 | % | ||||||||
| Adjusted EBITDAR margin (1) |
26.3 | % | 23.4 | % | 2.9 | % | 12.4 | % | ||||||||
| Adjusted net income |
$ | 29,618 | $ | 19,878 | $ | 9,740 | 49.0 | % | ||||||||
| Adjusted diluted earnings per share |
$ | 0.81 | $ | 0.54 | $ | 0.27 | 50.0 | % | ||||||||
| * | percentage change not meaningful |
| (1) | Operating margin is calculated as operating income divided by operating revenue. Adjusted operating margin is calculated as adjusted operating income divided by operating revenue. Adjusted EBITDAR margin is calculated as adjusted EBITDAR divided by operating revenue. |
| (2) | Excludes flight hours from Bristow Academy and unconsolidated affiliates. |
38
Table of Contents
| (3) | These financial measures have not been prepared in accordance with generally accepted accounting principles (“GAAP”) and have not been audited or reviewed by our independent auditor. These financial measures are therefore considered non-GAAP financial measures. Adjusted EBITDAR is calculated by taking our net income and adjusting for interest expense, depreciation and amortization, rent expense (included as components of direct cost and general and administrative expense), provision for income taxes, gain (loss) on disposal of assets and any special items during the reported periods. See further discussion of our use of the adjusted EBITDAR metric below. Adjusted operating income, adjusted net income and adjusted diluted earnings per share are each adjusted for gain (loss) on disposal of assets and any special items during the reported periods. Management believes these non-GAAP financial measures provide meaningful supplemental information regarding our results because they exclude amounts that management does not consider when assessing and measuring the operational and financial performance of the organization. A description of the adjustments to and reconciliations of these non-GAAP financial measures to the most comparable GAAP financial measures is as follows: |
| Three Months Ended | ||||||||
| June 30, | ||||||||
| 2012 | 2011 | |||||||
| (In thousands, except per share amounts) |
||||||||
| Adjusted operating income |
$ | 47,470 | $ | 34,989 | ||||
| Gain (loss) on disposal of assets |
(5,315 | ) | 1,416 | |||||
| Severance costs for termination of a contract |
(2,162 | ) | — | |||||
|
|
|
|
|
|||||
| Operating income |
$ | 39,993 | $ | 36,405 | ||||
|
|
|
|
|
|||||
| Adjusted EBITDAR |
$ | 84,273 | $ | 67,025 | ||||
| Gain (loss) on disposal of assets |
(5,315 | ) | 1,416 | |||||
| Severance costs for termination of a contract |
(2,162 | ) | — | |||||
| Depreciation and amortization |
(21,372 | ) | (22,708 | ) | ||||
| Rent expense |
(16,274 | ) | (8,953 | ) | ||||
| Interest expense |
(8,774 | ) | (8,955 | ) | ||||
| Provision for income taxes |
(6,180 | ) | (6,606 | ) | ||||
|
|
|
|
|
|||||
| Net income |
$ | 24,196 | $ | 21,219 | ||||
|
|
|
|
|
|||||
| Adjusted net income |
$ | 29,618 | $ | 19,878 | ||||
| Gain (loss) on disposal of assets (i) |
(4,234 | ) | 1,167 | |||||
| Severance costs for termination of a contract (i) |
(1,722 | ) | — | |||||
|
|
|
|
|
|||||
| Net income attributable to Bristow Group |
$ | 23,662 | $ | 21,045 | ||||
|
|
|
|
|
|||||
| Adjusted diluted earnings per share |
$ | 0.81 | $ | 0.54 | ||||
| Gain (loss) on disposal of assets (i) |
(0.12 | ) | 0.03 | |||||
| Severance costs for termination of a contract (i) |
(0.05 | ) | — | |||||
| Diluted earnings per share |
0.65 | 0.57 | ||||||
| (i) | These amounts are presented after applying the appropriate tax effect to each item and dividing by the weighted average shares outstanding during the related period to calculate the earnings per share impact. |
Management believes that adjusted EBITDAR provides relevant and useful information, which is widely used by analysts, investors and competitors in our industry as well as by our management in assessing both consolidated and business unit performance. Adjusted EBITDAR provides us with an understanding of one aspect of earnings before the impact of investing and financing transactions and income taxes. Additionally, we believe that adjusted EBITDAR provides us with a better overall measure of our operational performance by excluding the financing decisions we make regarding aircraft purchasing or leasing decisions. Adjusted EBITDAR is not calculated or presented in accordance with GAAP and other companies in our industry may calculate adjusted EBITDAR differently than we do. As a result, these financial measures have limitations as analytical and comparative tools and you should not consider these items in isolation, or as a substitute for analysis of our results as reported under GAAP. Adjusted EBITDAR should not be considered as a measure of discretionary cash available to us to invest in the growth of our business. In calculating these financial measures, we make certain adjustments that are based on assumptions and estimates that may prove to be
39
Table of Contents
inaccurate. In addition, in evaluating these financial measures, you should be aware that in the future we may incur expenses similar to those eliminated in this presentation. Our presentation of adjusted EBITDAR, as well as adjusted operating income, adjusted net income and adjusted diluted earnings per share, should not be construed as an inference that our future results will be unaffected by unusual or special items.
Adjusted EBITDAR has limitations as an analytical tool, and should not be considered in isolation, or as a substitute for analysis of our results reported under GAAP. Some of the limitations are:
| • | Adjusted EBITDAR does not reflect our current or future cash requirements for capital expenditures; |
| • | Adjusted EBITDAR does not reflect changes in, or cash requirements for, our working capital needs; |
| • | Adjusted EBITDAR does not reflect the significant interest expense, or the cash requirements necessary to service interest or principal payments, on our debts; |
| • | Although depreciation and amortization are non-cash charges, the assets being depreciated and amortized will often have to be replaced in the future, and adjusted EBITDAR does not reflect any cash requirements for such replacements; and |
| • | Other companies in our industry may calculate adjusted EBITDAR differently than we do, limiting its usefulness as a comparative measure. |
The following presents business unit adjusted EBITDAR and adjusted EBITDAR margin discussed in “Business Unit Operating Results”, and consolidated adjusted EBITDAR and adjusted EBITDAR margin for the three months ended June 30, 2012 and 2011:
| Three Months Ended | ||||||||
| June 30, | ||||||||
| 2012 | 2011 | |||||||
| (In thousands, except percentages) |
||||||||
| Europe |
$ | 39,664 | $ | 35,700 | ||||
| West Africa |
21,163 | 15,430 | ||||||
| North America |
12,200 | 6,267 | ||||||
| Australia |
10,325 | 8,281 | ||||||
| Other International |
12,014 | 16,624 | ||||||
| Corporate and other |
(11,093 | ) | (15,277 | ) | ||||
|
|
|
|
|
|||||
| Consolidated adjusted EBITDAR |
$ | 84,273 | $ | 67,025 | ||||
|
|
|
|
|
|||||
| Europe |
32.2 | % | 33.0 | % | ||||
| West Africa |
31.9 | % | 29.5 | % | ||||
| North America |
23.2 | % | 14.3 | % | ||||
| Australia |
27.0 | % | 20.2 | % | ||||
| Other International |
36.2 | % | 48.1 | % | ||||
| Consolidated adjusted EBITDAR margin |
26.3 | % | 23.4 | % | ||||
40
Table of Contents
Current Quarter Compared to Comparable Quarter
Our results for the Current Quarter included a $41.5 million, or 12.9% increase in gross revenue over the Comparable Quarter primarily resulting from:
| • | Increased operating revenue from the addition of new contracts and improvements in overall flight activity in our Europe, West Africa and North America business units, and |
| • | Increased reimbursable revenue (primarily in Europe, West Africa and Australia), which was partially offset by: |
| • | Decreased revenue in our Other International business unit as a result of the end of short-term contracts and a decline in activity in certain markets, and |
| • | An unfavorable impact from changes in foreign currency rates that decreased gross revenue by $8.8 million (primarily in Europe and Australia). |
Our results for the Current Quarter also included a $27.2 million, or 9.3% increase in operating expense over the Comparable Quarter primarily resulting from:
| • | Increased maintenance, compensation and fuel costs primarily driven by the increase in flight activity, |
| • | Increased reimbursable expense (primarily in Europe, West Africa and Australia), |
| • | Increased rent expense resulting from increased leasing of aircraft under operating leases as discussed under “– Executive Overview – Our Strategy – Capital Allocation Strategy” included elsewhere in this Quarterly Report, and |
| • | Severance costs of $2.2 million recorded in the Current Quarter related to the termination of a contract in the Southern North Sea, which was partially offset by: |
| • | Decreased general and administrative expense primarily resulting from a decrease in corporate compensation and professional fees, |
| • | Decreased depreciation and amortization expense primarily resulting from aircraft sold in the latter half of fiscal year 2012 that were leased back, and |
| • | A favorable impact from changes in foreign currency exchange rates that decreased operating expense by $9.7 million, which more than offset the unfavorable impact of foreign currency exchange rates on gross revenue. |
In addition to the items impacting revenue and operating expense discussed above, the Current Quarter’s results were also significantly impacted by a loss on disposal of assets of $5.3 million compared to a gain of $1.4 million in the Comparable Quarter and a $4.0 million decrease in earnings from unconsolidated affiliates, net of losses. These items resulted in a slight decrease in operating margin from 12.7% in the Comparable Quarter to 12.5% in the Current Quarter despite an increase in operating income of $3.6 million, or 9.9%.
The loss on disposal of assets in the Current Quarter included a loss of $3.4 million from the sale of four aircraft and impairment charges totaling $1.9 million related to seven held for sale aircraft. The decrease in earnings from unconsolidated affiliates, net of losses, primarily resulted from lower earnings from our investment in Líder in Brazil.
Net income and diluted earnings per share both increased during the Current Quarter by 14.0%, primarily resulting from the increase in operating income.
41
Table of Contents
After adjusting for gains (losses) on disposal of assets and the special item for severance costs incurred in the Southern North Sea, we saw significant improvement in the financial measures used by management to assess and measure the financial performance of the organization, including a 25.7% improvement in adjusted EBITDAR, a 12.4% improvement in adjusted EBITDAR margin, a 49.0% improvement in adjusted net income and a 50.0% improvement in adjusted diluted earnings per share.
Business Unit Operating Results
The following tables set forth certain operating information for the business units comprising our Helicopter Services segment. Intercompany lease revenue and expense are eliminated from our segment reporting, and depreciation expense of aircraft is presented in the segment that operates the aircraft.
Current Quarter Compared to Comparable Quarter
Set forth below is a discussion of the operations of our business units. Our consolidated results are discussed under “Results of Operations” above.
Europe
| Three Months Ended June 30, |
Favorable (Unfavorable) |
|||||||||||||||
| 2012 | 2011 | |||||||||||||||
| (In thousands, except percentages) | ||||||||||||||||
| Operating revenue |
$ | 123,235 | $ | 108,288 | $ | 14,947 | 13.8 | % | ||||||||
| Reimbursable revenue |
$ | 30,785 | $ | 26,250 | $ | 4,535 | 17.3 | % | ||||||||
| Earnings from unconsolidated affiliates, net of losses |
$ | 2,006 | $ | 2,858 | $ | (852 | ) | (29.8 | )% | |||||||
| Operating income |
$ | 21,876 | $ | 23,249 | $ | (1,373 | ) | (5.9 | )% | |||||||
| Operating margin |
17.8 | % | 21.5 | % | (3.7 | )% | (17.2 | )% | ||||||||
| Adjusted EBITDAR |
$ | 39,664 | $ | 35,700 | $ | 3,964 | 11.1 | % | ||||||||
| Adjusted EBITDAR margin |
32.2 | % | 33.0 | % | (0.8 | )% | (2.4 | )% | ||||||||
The operations of our Europe business unit have expanded since the Comparable Quarter with the addition of four large aircraft. These new aircraft, as well as an overall increase in activity with existing clients and under new contracts primarily in the Northern North Sea in the U.K. and in Norway, were the primary contributors to the revenue growth in Europe in the Current Quarter. Additionally, gross revenue was positively impacted by an increase in reimbursable revenue. These increases were partially offset by the impact of changes in exchange rates that decreased gross revenue by $6.4 million.
Despite the revenue growth in the Current Quarter, operating income and margin decreased due to a $4.1 million increase in rent expense primarily resulting from the execution of operating leases for three large aircraft in this market in late fiscal year 2012, the incurrence of $2.2 million in severance costs related to the termination of a contract in the Southern North Sea, and a decrease of $0.9 million in earnings from our unconsolidated affiliate resulting from a reduction in activity.
Adjusted EBITDAR improved by $4.0 million, or 11.1%, in the Current Quarter and adjusted EBITDAR margin was mostly flat compared with the Comparable Quarter. Adjusted EBITDAR excludes the impact of the increase in the number of aircraft on lease and severance costs incurred in the Current Quarter, and reflects the overall growth in this business unit in terms of new contracts, increased pricing and utilization.
42
Table of Contents
West Africa
| Three Months Ended June 30, |
Favorable (Unfavorable) |
|||||||||||||||
| 2012 | 2011 | |||||||||||||||
| (In thousands, except percentages) | ||||||||||||||||
| Operating revenue |
$ | 66,355 | $ | 52,251 | $ | 14,104 | 27.0 | % | ||||||||
| Reimbursable revenue |
$ | 4,099 | $ | 2,256 | $ | 1,843 | 81.7 | % | ||||||||
| Operating income |
$ | 16,131 | $ | 11,231 | $ | 4,900 | 43.6 | % | ||||||||
| Operating margin |
24.3 | % | 21.5 | % | 2.8 | % | 13.0 | % | ||||||||
| Adjusted EBITDAR |
$ | 21,163 | $ | 15,430 | $ | 5,733 | 37.2 | % | ||||||||
| Adjusted EBITDAR margin |
31.9 | % | 29.5 | % | 2.4 | % | 8.1 | % | ||||||||
We continued to see strong levels of activity in the Current Quarter in West Africa with a 12% increase in flight hours over the Comparable Quarter. The increase in flight hours from new contract and ad hoc work, when combined with increased pricing under existing contracts, resulted in the increase in operating revenue for West Africa in the Current Quarter. Additionally, gross revenue was positively impacted by an increase in reimbursable revenue.
The revenue increase translated into improvements in operating income, operating margin, adjusted EBITDAR and adjusted EBITDAR margin in the Current Quarter.
As previously discussed, we have seen recent changes in the West Africa market as a result of new competitors entering this market. Additionally, increasingly active trade unions, changing regulations and the changing political environment have made and are expected to continue to make our operating results from Nigeria unpredictable.
North America
| Three Months Ended June 30, |
Favorable (Unfavorable) |
|||||||||||||||
| 2012 | 2011 | |||||||||||||||
| (In thousands, except percentages) | ||||||||||||||||
| Operating revenue |
$ | 52,625 | $ | 43,913 | $ | 8,712 | 19.8 | % | ||||||||
| Reimbursable revenue |
$ | 281 | $ | 329 | $ | (48 | ) | (14.6 | )% | |||||||
| Operating income |
$ | 6,475 | $ | 1,584 | $ | 4,891 | 308.8 | % | ||||||||
| Operating margin |
12.3 | % | 3.6 | % | 8.7 | % | 241.7 | % | ||||||||
| Adjusted EBITDAR |
$ | 12,200 | $ | 6,267 | $ | 5,933 | 94.7 | % | ||||||||
| Adjusted EBITDAR margin |
23.2 | % | 14.3 | % | 8.9 | % | 62.2 | % | ||||||||
We added two new large and one new medium aircraft to our operations in the U.S. Gulf of Mexico since the Comparable Quarter. This shift toward larger, more profitable aircraft, as well as increased pricing, led to the increase in operating revenue in the Current Quarter despite no significant change in overall flight hours. Operating revenue was also positively impacted by the continuing gradual recovery from the impact of permitting delays from new regulations in the U.S. Gulf of Mexico.
The revenue increase, combined with success by our management team in containing costs in this market, translated into significant improvements in operating income, operating margin, adjusted EBITDAR and adjusted EBITDAR margin in the Current Quarter.
43
Table of Contents
Australia
| Three Months Ended June 30, |
Favorable (Unfavorable) |
|||||||||||||||
| 2012 | 2011 | |||||||||||||||
| (In thousands, except percentages) | ||||||||||||||||
| Operating revenue |
$ | 38,171 | $ | 40,920 | $ | (2,749 | ) | (6.7 | )% | |||||||
| Reimbursable revenue |
$ | 6,331 | $ | 4,493 | $ | 1,838 | 40.9 | % | ||||||||
| Operating income |
$ | 6,509 | $ | 4,524 | $ | 1,985 | 43.9 | % | ||||||||
| Operating margin |
17.1 | % | 11.1 | % | 6.0 | % | 54.1 | % | ||||||||
| Adjusted EBITDAR |
$ | 10,325 | $ | 8,281 | $ | 2,044 | 24.7 | % | ||||||||
| Adjusted EBITDAR margin |
27.0 | % | 20.2 | % | 6.8 | % | 33.7 | % | ||||||||
Operating revenue for Australia decreased primarily due a decrease in overall flight activity compared to the Comparable Quarter driven by the loss of a major contract at the end of May 2011 and an unfavorable impact from changes in foreign currency exchange rates. The loss of this contract last year has been partially offset by new contract work.
Despite the decrease in operating revenue, operating income, operating margin, adjusted EBITDAR and adjusted EBITDAR margin improved significantly mostly due to training costs recorded in the Comparable Quarter for the introduction of a new aircraft type into this market.
In July 2012, INPEX Corporation (“INPEX”) awarded Bristow a ten-year contract for up to six EC225 large helicopters to support drilling, development and production operations on the Ichthys Project. INPEX also has an option to add a long-term search and rescue aircraft. This new contract is scheduled to begin in fiscal year 2014 and reinforces our long term commitment to the Australian market.
Other International
| Three Months Ended June 30, |
Favorable (Unfavorable) |
|||||||||||||||
| 2012 | 2011 | |||||||||||||||
| (In thousands, except percentages) | ||||||||||||||||
| Operating revenue |
$ | 33,227 | $ | 34,549 | $ | (1,322 | ) | (3.8 | )% | |||||||
| Reimbursable revenue |
$ | 248 | $ | 918 | $ | (670 | ) | (73.0 | )% | |||||||
| Earnings from unconsolidated affiliates, net of losses |
$ | (17 | ) | $ | 3,135 | $ | (3,152 | ) | (100.5 | )% | ||||||
| Operating income |
$ | 7,387 | $ | 11,910 | $ | (4,523 | ) | (38.0 | )% | |||||||
| Operating margin |
22.2 | % | 34.5 | % | (12.3 | )% | (35.7 | )% | ||||||||
| Adjusted EBITDAR |
$ | 12,014 | $ | 16,624 | $ | (4,610 | ) | (27.7 | )% | |||||||
| Adjusted EBITDAR margin |
36.2 | % | 48.1 | % | (11.9 | )% | (24.7 | )% | ||||||||
Operating revenue for Other International decreased due to the end of short-term contracts in Ghana and the Baltic Sea, a decline in aircraft on contract in Mexico and a decline in activity in Russia, partially offset by increased activity in Trinidad and Malaysia.
Operating income, operating margin, adjusted EBITDAR and adjusted EBITDAR margin decreased primarily due to a decrease in earnings from unconsolidated affiliates, net of losses, a decline in activity in Mexico and an increase in operating costs in Trinidad.
Earnings from unconsolidated affiliates, net of losses decreased primarily due to a decrease in earnings from our investment in Líder from $2.7 million during the Comparable Quarter compared to zero in the Current Quarter. During the Current Quarter and Comparable Quarter, earnings from Líder decreased by $3.1 million and increased by $0.6 million, respectively, as a result of the impact of changes in the Brazilian real and U.S. dollar exchange rate.
See further discussion of our investment in Líder in “Executive Overview – Market Outlook” discussed elsewhere in this Quarterly Report.
44
Table of Contents
Corporate and Other
| Three Months Ended June 30, |
Favorable (Unfavorable) |
|||||||||||||||
| 2012 | 2011 | |||||||||||||||
| (In thousands, except percentages) | ||||||||||||||||
| Operating revenue |
$ | 7,420 | $ | 6,847 | $ | 573 | 8.4 | % | ||||||||
| Reimbursable revenue |
$ | 210 | $ | 98 | $ | 112 | 114.3 | % | ||||||||
| Operating loss |
$ | (13,070 | ) | $ | (17,509 | ) | $ | 4,439 | 25.4 | % | ||||||
| Adjusted EBITDAR |
$ | (11,093 | ) | $ | (15,277 | ) | $ | 4,184 | 27.4 | % | ||||||
Corporate and other includes our Bristow Academy business unit, technical services business and corporate costs that have not been allocated out to other business units.
Operating revenue increased primarily due to an increase in revenue at Bristow Academy of $1.1 million as a result of an increase in military training, partially offset by a decrease in technical services revenue due to the timing of part sales.
Corporate operating expense primarily represents costs of our corporate office and other general and administrative costs not allocated to our business units. Corporate operating expense decreased due to a decrease in incentive compensation and professional fees during the Current Quarter. During the Comparable Quarter, our stock price performance significantly improved, resulting in an additional $3.7 million in expense recorded related to our performance cash compensation plan for senior management compared to $0.9 million recorded during the Current Quarter. Also, in the Comparable Quarter we recorded $2.2 million in stock-based compensation expense for our President and Chief Executive Officer. This decrease was partially offset by $2.0 million in expense recorded in the Current Quarter related to the separation between our Senior Vice President and General Counsel and the Company (including expenses recorded for the acceleration of unvested stock options and restricted stock). Professional fees declined primarily due to amounts incurred for special projects which were being initiated in the Comparable Quarter, including the Bristow Client Promise and BVA initiatives discussed elsewhere in this Quarterly Report.
Interest Expense, Net
| Three Months Ended June 30, |
Favorable (Unfavorable) |
|||||||||||||||
| 2012 | 2011 | |||||||||||||||
| (In thousands, except percentages) | ||||||||||||||||
| Interest income |
$ | 88 | $ | 171 | $ | (83 | ) | (48.5 | )% | |||||||
| Interest expense |
(9,055 | ) | (9,212 | ) | 157 | 1.7 | % | |||||||||
| Amortization of debt discount |
(870 | ) | (822 | ) | (48 | ) | (5.8 | )% | ||||||||
| Amortization of debt fees |
(437 | ) | (422 | ) | (15 | ) | (3.6 | )% | ||||||||
| Capitalized interest |
1,588 | 1,501 | 87 | 5.8 | % | |||||||||||
|
|
|
|
|
|
|
|||||||||||
| Interest expense, net |
$ | (8,686 | ) | $ | (8,784 | ) | $ | 98 | 1.1 | % | ||||||
|
|
|
|
|
|
|
|||||||||||
Interest expense, net remained flat as there was no significant change in our overall borrowing rate or amount of cash and cash equivalents invested.
45
Table of Contents
Other Income (Expense), Net
| Three Months Ended June 30, |
Favorable (Unfavorable) |
|||||||||||||||
| 2012 | 2011 | |||||||||||||||
| (In thousands, except percentages) | ||||||||||||||||
| Foreign currency gains (losses) |
$ | (931 | ) | $ | 190 | $ | (1,121 | ) | * | |||||||
| Other |
— | 14 | (14 | ) | (100.0 | )% | ||||||||||
|
|
|
|
|
|
|
|||||||||||
| Other income (expense), net |
$ | (931 | ) | $ | 204 | $ | (1,135 | ) | * | |||||||
|
|
|
|
|
|
|
|||||||||||
| * | percentage change not meaningful |
Other income (expense), net decreased due to foreign currency losses in the Current Quarter versus foreign currency gains in the Comparable Quarter primarily resulting from fluctuations in the exchange rate between the U.S. dollar and British pound sterling.
Taxes
| Three Months Ended June 30, |
Favorable (Unfavorable) |
|||||||||||||||
| 2012 | 2011 | |||||||||||||||
| (In thousands, except percentages) | ||||||||||||||||
| Effective tax rate |
20.3 | % | 23.7 | % | 3.4 | % | 14.3 | % | ||||||||
| Net foreign tax on non-U.S. earnings |
$ | 6,714 | $ | 2,604 | $ | (4,110 | ) | (157.8 | )% | |||||||
| Benefit of foreign earnings indefinitely reinvested abroad |
(7,050 | ) | (7,495 | ) | (445 | ) | (5.9 | )% | ||||||||
| Change in valuation allowance for contingency |
(122 | ) | 692 | 814 | 117.6 | % | ||||||||||
| Realization of foreign tax credits |
(1,507 | ) | — | 1,507 | * | |||||||||||
| * | percentage change not meaningful |
Our effective tax rate for the Current Quarter and Comparable Quarter were reduced by the permanent investment outside the U.S. of foreign earnings, upon which no U.S. tax has been provided, and by the amount of our foreign source income and our ability to realize foreign tax credits.
Liquidity and Capital Resources
Cash Flows
Operating Activities
Net cash flows provided by operating activities totaled $55.4 million during the Current Quarter compared to $52.9 million during the Comparable Quarter. Changes in non-cash working capital generated $4.0 million and $3.9 million in cash flows from operating activities for the Current Quarter and Comparable Quarter, respectively.
46
Table of Contents
Investing Activities
Cash flows used in investing activities were $67.2 million and $71.4 million for the Current Quarter and Comparable Quarter, respectively. Cash was used for capital expenditures as follows:
| Three Months Ended June 30, |
||||||||
| 2012 | 2011 | |||||||
| Number of aircraft delivered: |
||||||||
| Large |
3 | 2 | ||||||
|
|
|
|
|
|||||
| Total aircraft |
3 | 2 | ||||||
|
|
|
|
|
|||||
| Capital expenditures (in thousands): |
||||||||
| Aircraft and related equipment |
$ | 79,969 | $ | 69,485 | ||||
| Other |
6,586 | 2,750 | ||||||
|
|
|
|
|
|||||
| Total capital expenditures |
$ | 86,555 | $ | 72,235 | ||||
|
|
|
|
|
|||||
In addition to these capital expenditures, investing cash flows were impacted by aircraft and joint venture sales. During the Current Quarter, we received proceeds of $20.2 million primarily from the sale of four aircraft and certain other equipment. During the Comparable Quarter, we received $0.8 million proceeds from the sale of two aircraft and certain other equipment.
Financing Activities
Cash flows used in financing activities was $28.2 million during the Current Quarter compared to $19.6 million generated from financing activities during the Comparable Quarter. During the Current Quarter, cash was used for the repayment of debt totaling $21.8 million and payment of a dividend on our Common Stock totaling $7.1 million. During the Comparable Quarter, we received $55.0 million from borrowings on our Revolving Credit Facility and $1.2 million for Common Stock issued upon exercise of stock options, and used $31.3 million for the repayment of debt and $5.4 million for payment of a dividend on our Common Stock.
47
Table of Contents
Future Cash Requirements
Contractual Obligations, Commercial Commitments and Off Balance Sheet Arrangements
We have various contractual obligations which are recorded as liabilities on our condensed consolidated balance sheet. Other items, such as certain purchase commitments, interest payments and other executory contracts are not recognized as liabilities on our condensed consolidated balance sheet but are included in the table below. For example, we are contractually committed to make certain minimum lease payments for the use of property and equipment under operating lease agreements.
The following tables summarize our significant contractual obligations and other commercial commitments on an undiscounted basis as of June 30, 2012 and the future periods in which such obligations are expected to be settled in cash. In addition, the table reflects the timing of principal and interest payments on outstanding borrowings. Additional details regarding these obligations are provided in Note 8 in the “Notes to Consolidated Financial Statements” included in the fiscal year 2012 Annual Report and in Note 6 in the “Notes to Condensed Consolidated Financial Statements” included elsewhere in this Quarterly Report.
| Payments Due by Period | ||||||||||||||||||||||||
| Total | Nine Months
Ending March 31, 2013 |
Fiscal Year Ending March 31, | Other | |||||||||||||||||||||
| 2014 - 2015 |
2016 - 2017 |
2018 and beyond |
||||||||||||||||||||||
| (In thousands) | ||||||||||||||||||||||||
| Contractual obligations: |
||||||||||||||||||||||||
| Long-term debt and short-term borrowings: |
||||||||||||||||||||||||
| Principal (1) |
$ | 747,500 | $ | 11,875 | $ | 50,000 | $ | 220,625 | $ | 465,000 | $ | — | ||||||||||||
| Interest |
184,367 | 33,662 | 70,934 | 63,701 | 16,070 | — | ||||||||||||||||||
| Aircraft operating leases (2) |
178,119 | 19,815 | 66,917 | 50,056 | 41,331 | — | ||||||||||||||||||
| Other operating leases (3) |
82,323 | 7,094 | 15,789 | 12,557 | 46,883 | — | ||||||||||||||||||
| Pension obligations (4) |
181,391 | 15,731 | 54,396 | 41,366 | 69,898 | — | ||||||||||||||||||
| Aircraft purchase obligations (5) |
307,343 | 158,619 | 104,371 | 44,353 | — | — | ||||||||||||||||||
| Other purchase obligations (6) |
29,559 | 29,559 | — | — | — | — | ||||||||||||||||||
| Tax reserve (7) |
1,401 | — | — | — | — | 1,401 | ||||||||||||||||||
|
|
|
|
|
|
|
|
|
|
|
|
|
|||||||||||||
| Total contractual cash obligations |
$ | 1,712,003 | $ | 276,355 | $ | 362,407 | $ | 432,658 | $ | 639,182 | $ | 1,401 | ||||||||||||
|
|
|
|
|
|
|
|
|
|
|
|
|
|||||||||||||
| Other commercial commitments: |
||||||||||||||||||||||||
| Letters of credit |
$ | 1,499 | $ | 1,499 | $ | — | $ | — | $ | — | $ | — | ||||||||||||
| Other commitments (8) |
46,000 | — | 46,000 | — | — | — | ||||||||||||||||||
|
|
|
|
|
|
|
|
|
|
|
|
|
|||||||||||||
| Total commercial commitments |
$ | 47,499 | $ | 1,499 | $ | 46,000 | $ | — | $ | — | $ | — | ||||||||||||
|
|
|
|
|
|
|
|
|
|
|
|
|
|||||||||||||
| (1) | Excludes unamortized premium on the 7 1/2% Senior Notes of $0.3 million and unamortized discount on the 3% Convertible Senior Notes of $11.5 million. |
| (2) | Represents minimum rental payments required under operating leases for aircraft that have initial or remaining non-cancelable lease terms in excess of one year. For further details, see Note 6 in the “Notes to Condensed Consolidated Financial Statements” included elsewhere in this Quarterly Report. |
| (3) | Represents minimum rental payments required under non-aircraft operating leases that have initial or remaining non-cancelable lease terms in excess of one year. |
| (4) | Represents expected funding for pension benefits in future periods. These amounts are undiscounted and are based on the expectation that the U.K. and Norway pensions will be fully funded in approximately six and ten years, respectively. As of June 30, 2012, we had recorded on our balance sheet a $109.8 million pension liability associated with these obligations. The timing of the funding is dependent on actuarial valuations and resulting negotiations with the plan trustees. |
48
Table of Contents
| (5) | For further details on our aircraft purchase obligations, see Note 6 in the “Notes to Condensed Consolidated Financial Statements” included elsewhere in this Quarterly Report. |
| (6) | Other purchase obligations primarily represent unfilled purchase orders for aircraft parts and commitments associated with upgrading facilities at our bases. |
| (7) | Represents gross unrecognized tax benefits that may result in cash payments being made to certain tax authorities (see discussion in Note 7 in the “Notes to Condensed Consolidated Financial Statements” included elsewhere in this Quarterly Report). We are not able to reasonably estimate in which future periods this amount will ultimately be settled and paid. |
| (8) | In connection with the Bristow Norway acquisition (see “Part I. Item I. Business — Overview” included in the fiscal year 2012 Annual Report), we granted the former partner in this joint venture an option that if exercised would require us to acquire up to five aircraft from them at fair value upon the expiration of the lease terms for such aircraft. One of the options was exercised in December 2009 and one option expired. The remaining aircraft leases expire in June and August 2014. |
Capital Commitments
We have commitments and options to make capital expenditures over the next five fiscal years to purchase additional aircraft, including aircraft associated with the commitments reflected in the table above. Although a similar number of our existing aircraft may be sold during the same period, the additional aircraft on order are expected to provide incremental fleet capacity in terms of revenue and operating margin. See Note 6 in the “Notes to Condensed Consolidated Financial Statements” included elsewhere in this Quarterly Report for a detail of the number of aircraft under commitments and options expected to be delivered in the current and subsequent five fiscal years by aircraft size along with the related expenditures, and for a rollforward of aircraft commitments and options for the Current Quarter. Also in fiscal year 2013, we expect to invest approximately $70 million in various infrastructure enhancements, including aircraft facilities, training centers and technology. Through June 30, 2012, we had incurred $9.3 million towards these projects.
Financial Condition and Sources of Liquidity
We actively manage our liquidity through generation of cash from operations while assessing our funding needs on an ongoing basis. While we have generated significant cash from operations, our principal source of liquidity over the past several years has been financing cash flows. Accordingly, since the beginning of fiscal year 2007, we raised $1.4 billion of debt and equity capital by means of both public and private financings. During this same period, we invested $2.0 billion on capital expenditures to grow our business. The significant factors that affect our overall liquidity include capital expenditure commitments, pension funding, operating leases, adequacy of bank lines of credit and our ability to attract long-term capital on satisfactory terms.
We expect that our cash on deposit as of June 30, 2012 of $227.3 million, cash flow from operations and proceeds from aircraft sales, as well as available borrowing capacity under our Revolving Credit Facility of $159.4 million as of June 30, 2012, resulting in total liquidity of $386.6 million, will be sufficient to satisfy our capital commitments, including our remaining aircraft purchase commitments of $307.3 million as of June 30, 2012. While we plan to continue to be disciplined concerning future capital commitments, we also intend to continue managing our capital structure and liquidity position with external financings as needed. Our strategy will involve funding our short-term liquidity requirements with borrowings under our Revolving Credit Facility and funding our long-term financing needs, while maintaining a prudent capital structure, among the following alternatives: a) operating leases, b) bank debt, c) private and public debt and/or equity placements and d) export credit agency-supported financings.
Critical Accounting Policies and Estimates
See Item 7. “Management’s Discussion and Analysis of Financial Condition and Results of Operations — Critical Accounting Policies and Estimates” in the fiscal year 2012 Annual Report for a discussion of our critical accounting policies. There have been no material changes to our critical accounting policies and estimates provided in the fiscal year 2012 Annual Report.
49
Table of Contents
Recent Accounting Pronouncements
See Note 1 in the “Notes to Condensed Consolidated Financial Statements” included elsewhere in this Quarterly Report for a discussion of recent accounting pronouncements.
Item 3. Quantitative and Qualitative Disclosures about Market Risk.
We are subject to certain market risks arising from the use of financial instruments in the ordinary course of business. This risk arises primarily as a result of potential changes in the fair market value of financial instruments that would result from adverse fluctuations in foreign currency exchange rates, credit risk, and interest rates as discussed in “Item 7A. Quantitative and Qualitative Disclosures About Market Risk” in the fiscal year 2012 Annual Report and Note 1 in the “Notes to Condensed Consolidated Financial Statements” included elsewhere in this Quarterly Report.
Item 4. Controls and Procedures.
Evaluation of Disclosure Controls and Procedures
We carried out an evaluation, under the supervision of and with the participation of our management, including William E. Chiles, our Chief Executive Officer (“CEO”) and Jonathan E. Baliff, our Chief Financial Officer (“CFO”), of the effectiveness of the Company’s disclosure controls and procedures (as defined in Rule 13a-15(e) of the Exchange Act) as of June 30, 2012. Based on that evaluation, our CEO and CFO concluded that such disclosure controls and procedures were effective to ensure that information required to be disclosed in our periodic reports filed under the Exchange Act is recorded, processed, summarized and reported within the time periods specified by the Securities and Exchange Commission’s rules and forms and such information is accumulated and communicated to our management as appropriate to allow for timely decisions regarding required disclosure under the Exchange Act.
Changes in Internal Control Over Financial Reporting
There have been no changes in our internal control over financial reporting during the quarter ended June 30, 2012 that have materially affected or are reasonably likely to materially affect our internal control over financial reporting.
50
Table of Contents
We have certain actions or claims pending that have been discussed and previously reported in Part I. Item 3. “Legal Proceedings” in the fiscal year 2012 Annual Report. Developments in these previously reported matters are described in Note 6 in the “Notes to Condensed Consolidated Financial Statements” included elsewhere in this Quarterly Report.
There have been no material changes during the three months ended June 30, 2012 in our “Risk Factors” as discussed in the fiscal year 2012 Annual Report.
Item 2. Unregistered Sales of Equity Securities and Use of Proceeds and Issuer Repurchases of Equity Securities.
| Period |
Total Number of Shares Purchased (1) |
Average Price Paid Per Share |
Total Number of Shares Purchased as Part of Publicly Announced Program (2) |
Maximum Number (or Approximate Dollar Value) of Shares That May Yet Be Purchased Under the Plans or Programs (2) |
||||||||||||||
| April 1, 2012 – April 30, 2012 |
— | $ | — | — | $ | — | ||||||||||||
| May 1, 2012 – May 31, 2012 |
— | — | — | — | ||||||||||||||
| June 1, 2012 – June 30, 2012 |
28,896 | 39.70 | — | — | ||||||||||||||
| (1) | The total number of shares purchased in the period consists of shares withheld by us in satisfaction of withholding taxes due upon the vesting of restricted stock awards granted to employees under our Stock Incentive Plans. |
| (2) | On November 2, 2011, our board of directors authorized the expenditure of up to $100 million to repurchase shares of our Common Stock 12 months from that date. On December 15, 2011, we paid $25.1 million to purchase 526,895 shares of our Common Stock. The timing and method of any repurchases under the program will depend on a variety of factors, is subject to our results of operations, financial condition, cash requirements and other factors and restrictions under applicable law and our debt instruments, and may be suspended or discontinued at any time. |
Item 3. Defaults Upon Senior Securities.
Not applicable.
Item 4. Mine Safety Disclosures.
Not applicable.
None.
51
Table of Contents
The following exhibits are filed as part of this Quarterly Report:
| Exhibit Number |
Description of Exhibit | |
| 10.1† | Form of 2012 Stock Option Award Letter (incorporated by reference to Exhibit 10.1 to the Company’s Current Report on Form 8-K dated May 25, 2012). | |
| 10.2† | Form of 2012 Restricted Stock Unit Award Letter (incorporated by reference to Exhibit 10.2 to the Company’s Current Report on Form 8-K dated May 25, 2012). | |
| 10.3† | Form of 2012 Performance Cash Award Letter (incorporated by reference to Exhibit 10.3 to the Company’s Current Report on Form 8-K dated May 25, 2012). | |
| 10.4† | Bristow Group Inc. Fiscal Year 2013 Annual Incentive Compensation Plan (incorporated by reference to Exhibit 10.4 to the Company’s Current Report on Form 8-K dated May 25, 2012). | |
| 10.5† | Separation Agreement and Release (incorporated by reference to Exhibit 10.1 to the Company’s Current Report on Form 8-K dated June 26, 2012). | |
| 15.1* | Letter from KPMG LLP dated August 6, 2012, regarding unaudited interim information. | |
| 31.1** | Rule 13a-14(a) Certification by Chief Executive Officer of Registrant. | |
| 31.2** | Rule 13a-14(a) Certification by Chief Financial Officer of Registrant | |
| 32.1** | Certification of Chief Executive Officer of Registrant pursuant to 18 U.S.C. Section 1350, as adopted pursuant to Section 906 of the Sarbanes-Oxley Act of 2002. | |
| 32.2** | Certification of Chief Financial Officer of Registrant pursuant to 18 U.S.C. Section 1350, as adopted pursuant to Section 906 of the Sarbanes-Oxley Act of 2002. | |
| 101.INS | XBRL Instance Document. | |
| 101.SCH | XBRL Taxonomy Extension Schema Document. | |
| 101.CAL | XBRL Taxonomy Extension Calculation Linkbase Document. | |
| 101.DEF | XBRL Taxonomy Extension Definition Linkbase Document. | |
| 101.LAB | XBRL Taxonomy Extension Labels Linkbase Document. | |
| 101.PRE | XBRL Taxonomy Extension Presentation Linkbase Document. | |
| * | Filed herewith. |
| ** | Furnished herewith. |
| † | Compensatory Plan or Arrangement. |
52
Table of Contents
Pursuant to the requirements of the Securities Exchange Act of 1934, the registrant has duly caused this report to be signed on its behalf by the undersigned thereunto duly authorized.
| BRISTOW GROUP INC. | ||
| By: | /s/ Jonathan E. Baliff | |
| Jonathan E. Baliff | ||
| Senior Vice President and Chief Financial Officer | ||
| By: | /s/ Brian J. Allman | |
| Brian J. Allman | ||
| Vice President, Chief Accounting Officer | ||
August 6, 2012
53
Table of Contents
Index to Exhibits.
| Exhibit Number |
Description of Exhibit | |
| 10.1† | Form of 2012 Stock Option Award Letter (incorporated by reference to Exhibit 10.1 to the Company’s Current Report on Form 8-K dated May 25, 2012). | |
| 10.2† | Form of 2012 Restricted Stock Unit Award Letter (incorporated by reference to Exhibit 10.2 to the Company’s Current Report on Form 8-K dated May 25, 2012). | |
| 10.3† | Form of 2012 Performance Cash Award Letter (incorporated by reference to Exhibit 10.3 to the Company’s Current Report on Form 8-K dated May 25, 2012). | |
| 10.4† | Bristow Group Inc. Fiscal Year 2013 Annual Incentive Compensation Plan (incorporated by reference to Exhibit 10.4 to the Company’s Current Report on Form 8-K dated May 25, 2012). | |
| 10.5† | Separation Agreement and Release (incorporated by reference to Exhibit 10.1 to the Company’s Current Report on Form 8-K dated June 26, 2012). | |
| 15.1* | Letter from KPMG LLP dated August 6, 2012, regarding unaudited interim information. | |
| 31.1** | Rule 13a-14(a) Certification by Chief Executive Officer of Registrant. | |
| 31.2** | Rule 13a-14(a) Certification by Chief Financial Officer of Registrant | |
| 32.1** | Certification of Chief Executive Officer of Registrant pursuant to 18 U.S.C. Section 1350, as adopted pursuant to Section 906 of the Sarbanes-Oxley Act of 2002. | |
| 32.2** | Certification of Chief Financial Officer of Registrant pursuant to 18 U.S.C. Section 1350, as adopted pursuant to Section 906 of the Sarbanes-Oxley Act of 2002. | |
| 101.INS | XBRL Instance Document. | |
| 101.SCH | XBRL Taxonomy Extension Schema Document. | |
| 101.CAL | XBRL Taxonomy Extension Calculation Linkbase Document. | |
| 101.DEF | XBRL Taxonomy Extension Definition Linkbase Document. | |
| 101.LAB | XBRL Taxonomy Extension Labels Linkbase Document. | |
| 101.PRE | XBRL Taxonomy Extension Presentation Linkbase Document. | |
| * | Filed herewith. |
| ** | Furnished herewith. |
| † | Compensatory Plan or Arrangement. |