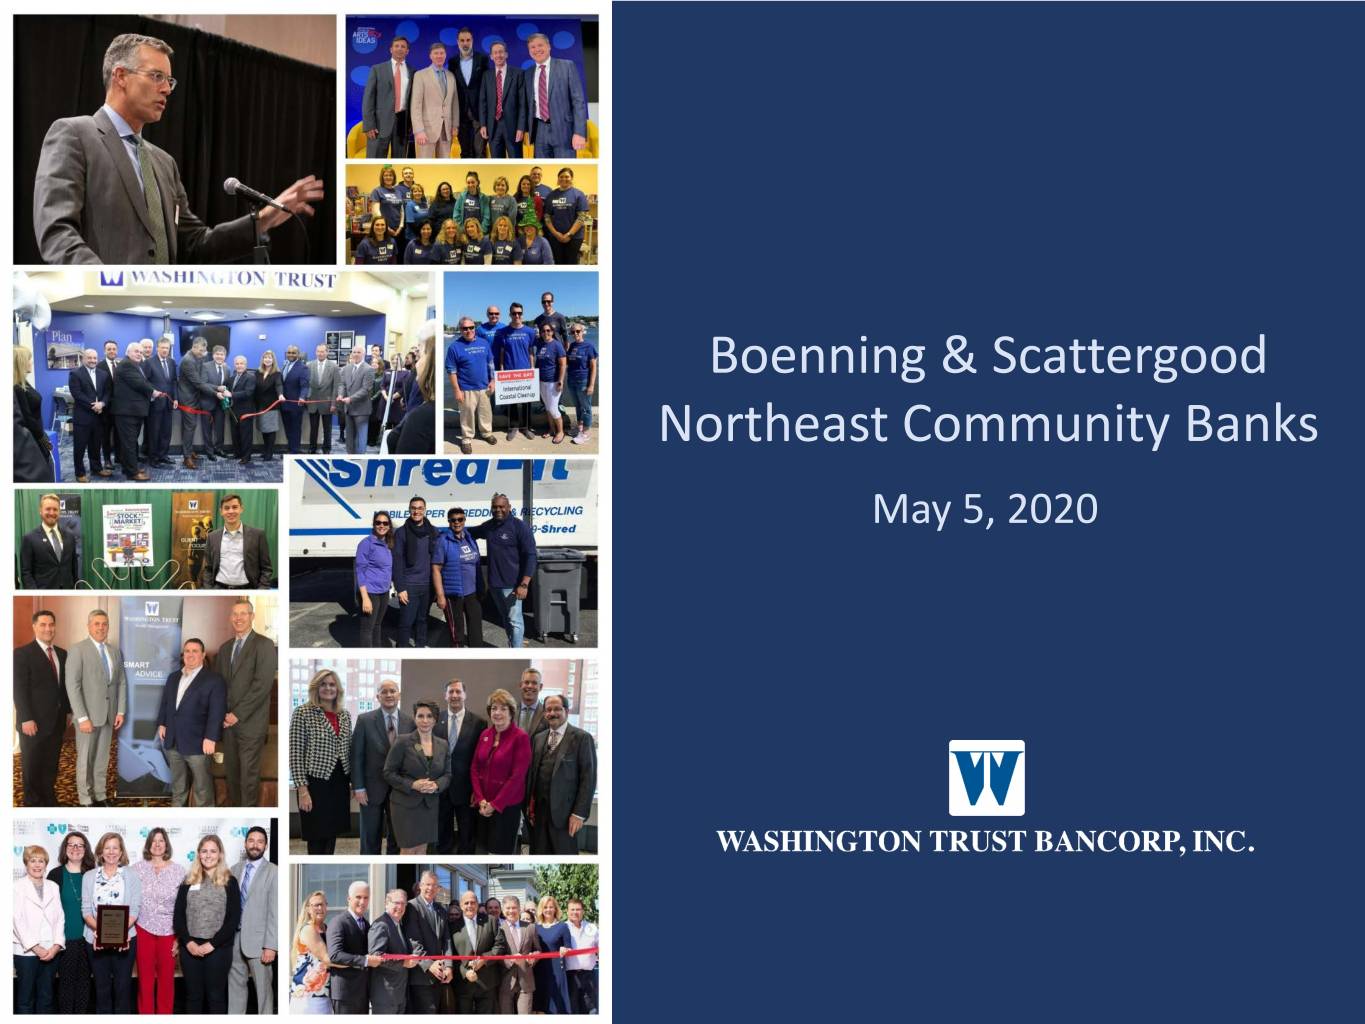
Boenning & Scattergood Northeast Community Banks May 5, 2020
Page Executive Team ……….………….…….……….…..…. 3 Who We Are ………………..………………….........… 4 COVID-19 Response ………………………………….. 10 Strategic Priorities .…………….......................... 18 Financial Overview ..……………………………....... 23 Credit Quality …………………………………….....…. 46 Capital Management ……………………………...… 47 Why Washington Trust …………....................... 51 Supplemental Information ............................ 53 This presentation contains certain statements that may be considered “forward-looking statements” within the meaning of Section 27A of the Securities Act of 1933, as amended, and Section 21E of the Securities Exchange Act of 1934, as amended. Actual results, performance or achievements of Washington Trust may differ materially from those discussed in these forward-looking statements, as a result of, among other factors, the factors described under the caption “Risk Factors” in Item 1A of our Annual Report on Form 10-K for the fiscal year ended December 31, 2019, as filed with the Securities and Exchange Commission and updated by our Quarterly Reports on Form 10-Q. You should carefully review all of these factors, and you should be aware that there may be other factors that could cause these differences. These forward-looking statements were based on information, plans and estimates at the date of this presentation, and Washington Trust assumes no obligation to update forward-looking statements to reflect changes in underlying assumptions or factors, new information, future events or other changes.
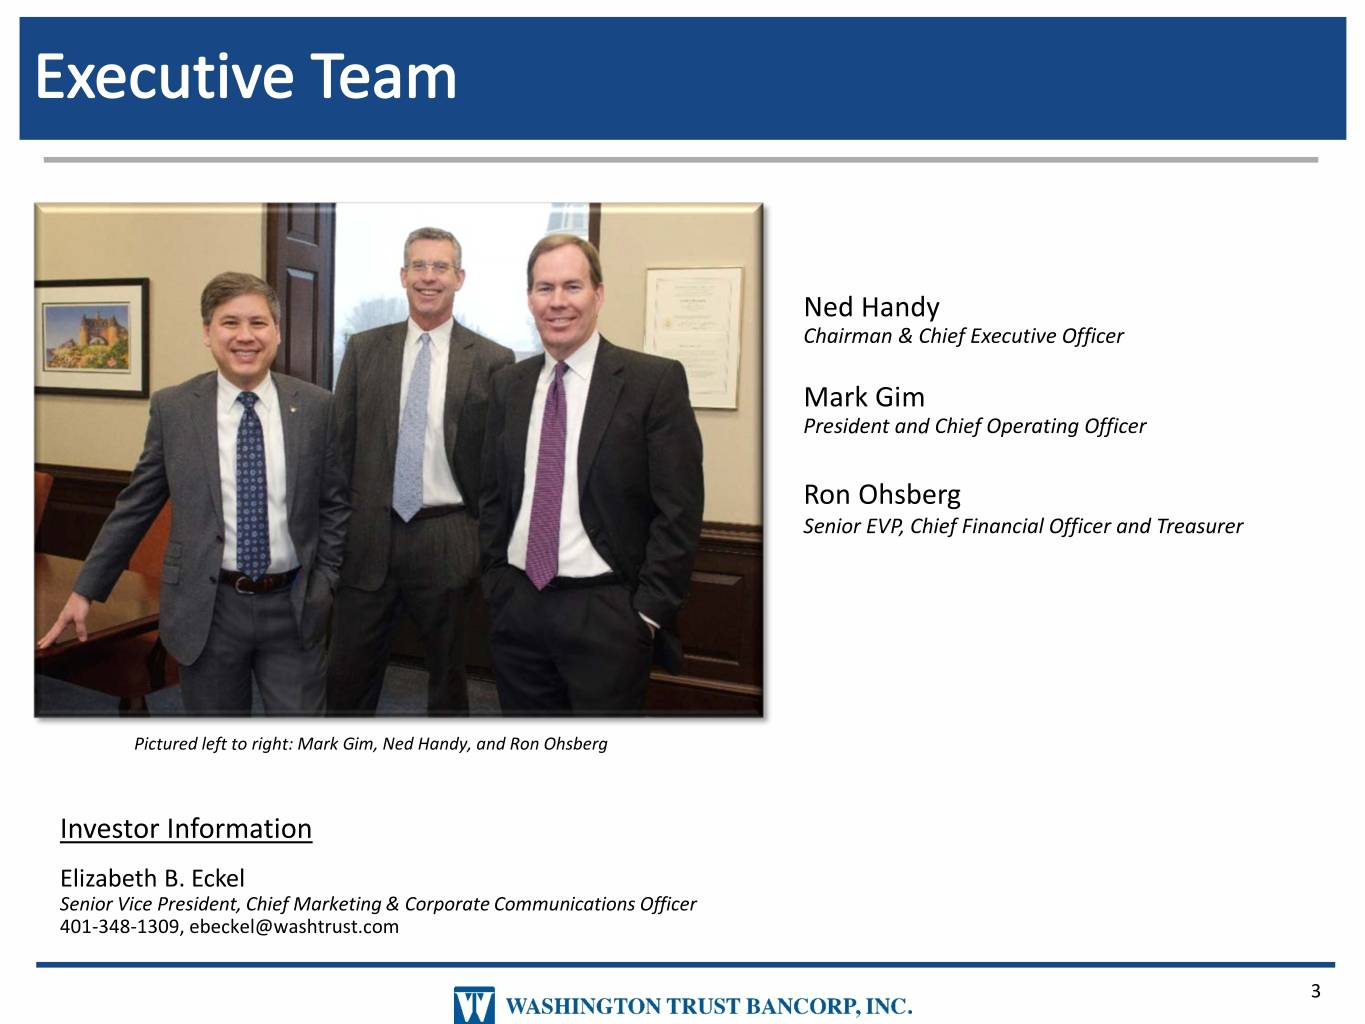
Ned Handy Chairman & Chief Executive Officer Mark Gim President and Chief Operating Officer Ron Ohsberg Senior EVP, Chief Financial Officer and Treasurer Pictured left to right: Mark Gim, Ned Handy, and Ron Ohsberg Investor Information Elizabeth B. Eckel Senior Vice President, Chief Marketing & Corporate Communications Officer 401-348-1309, ebeckel@washtrust.com 3
WHO WE ARE 4
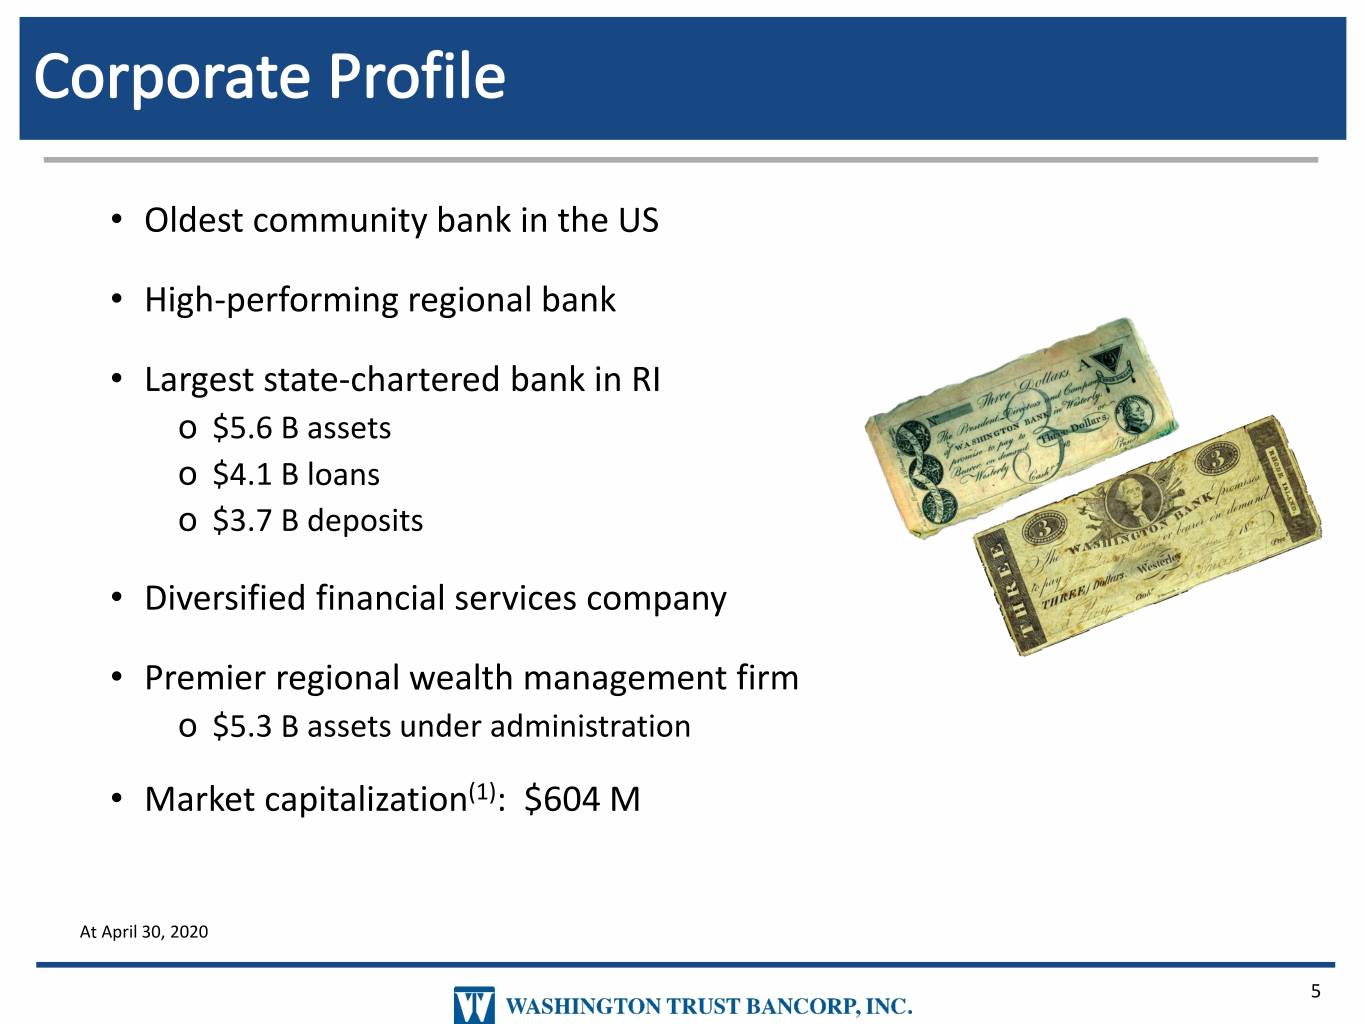
• Oldest community bank in the US • High-performing regional bank • Largest state-chartered bank in RI o $5.6 B assets o $4.1 B loans o $3.7 B deposits • Diversified financial services company • Premier regional wealth management firm o $5.3 B assets under administration • Market capitalization(1): $604 M At April 30, 2020 5
• American Banker “Best Banks to Work For” • American Banker “Top-Performing Mid-Tier Bank” 5th consecutive year • Bank Director “Bank Performance Score Card” 6th consecutive year • Providence Business News “Best Places to Work” 9th consecutive year • S&P Global “Best-Performing Community Banks” • Forbes “Best-In-State Bank” • New England Banking Choice Awards 1st place for “Overall Quality” and “Community Contribution” 6
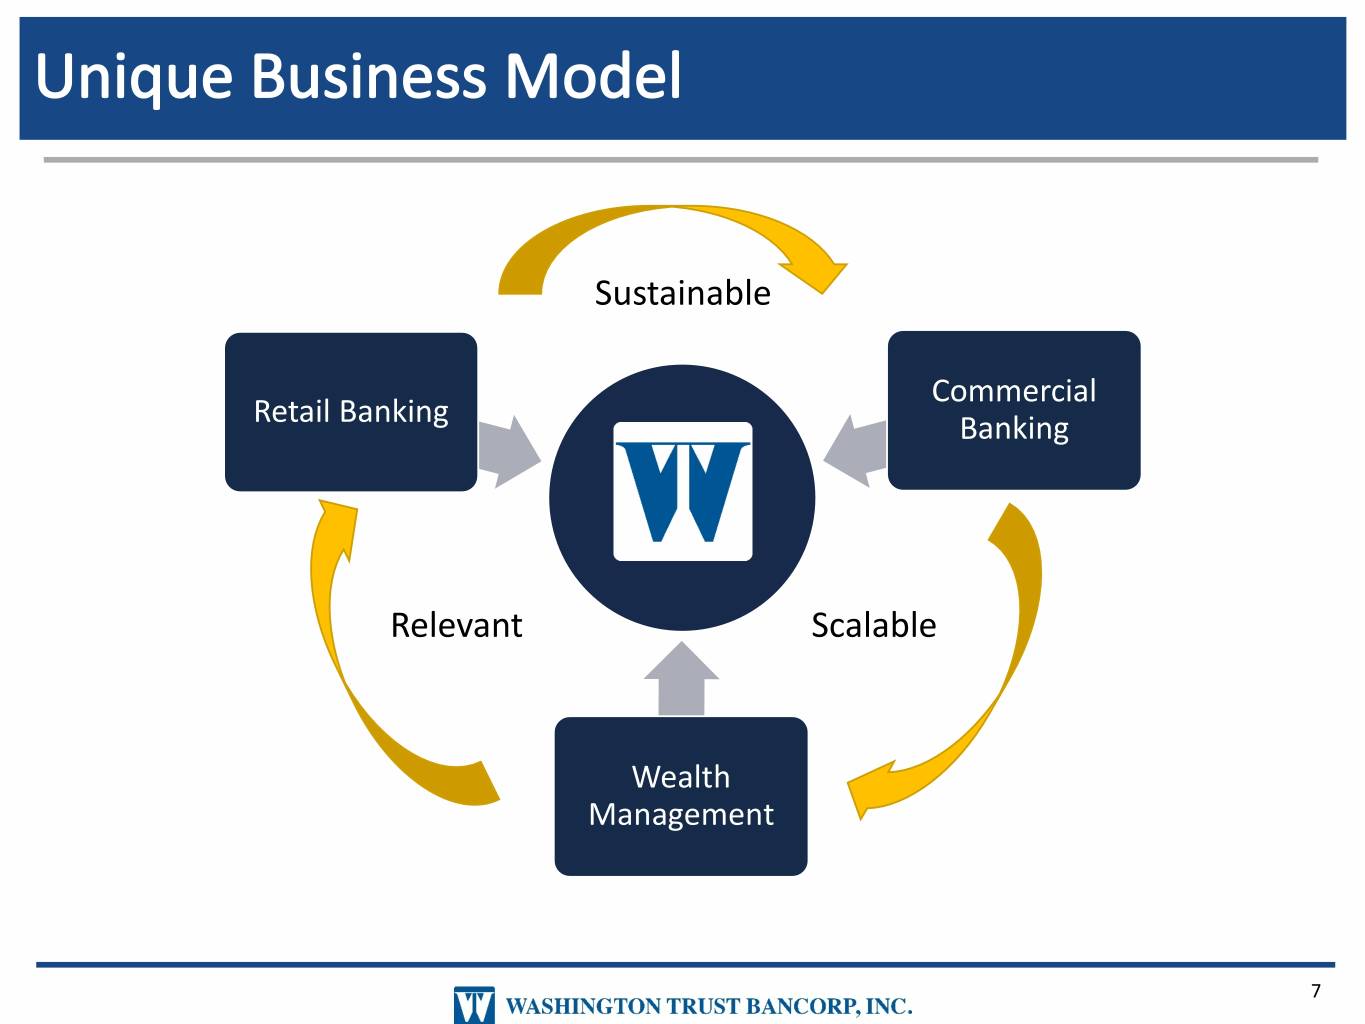
Sustainable Commercial Retail Banking Banking Relevant Scalable Wealth Management 7
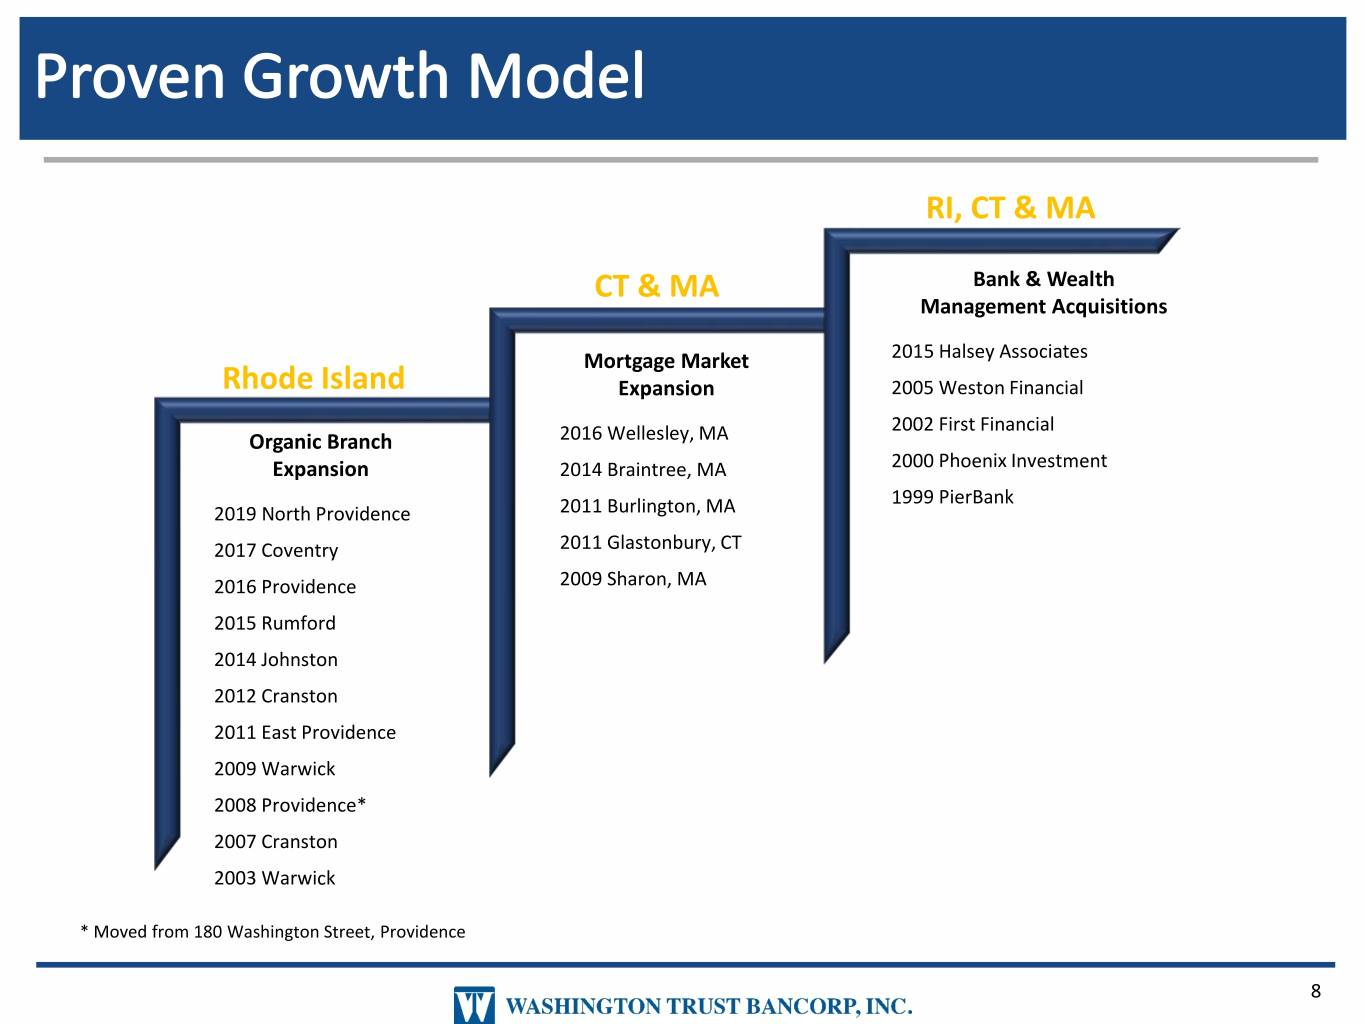
RI, CT & MA CT & MA Bank & Wealth Management Acquisitions Mortgage Market 2015 Halsey Associates Rhode Island Expansion 2005 Weston Financial 2002 First Financial Organic Branch 2016 Wellesley, MA Expansion 2014 Braintree, MA 2000 Phoenix Investment 1999 PierBank 2019 North Providence 2011 Burlington, MA 2017 Coventry 2011 Glastonbury, CT 2016 Providence 2009 Sharon, MA 2015 Rumford 2014 Johnston 2012 Cranston 2011 East Providence 2009 Warwick 2008 Providence* 2007 Cranston 2003 Warwick * Moved from 180 Washington Street, Providence 8
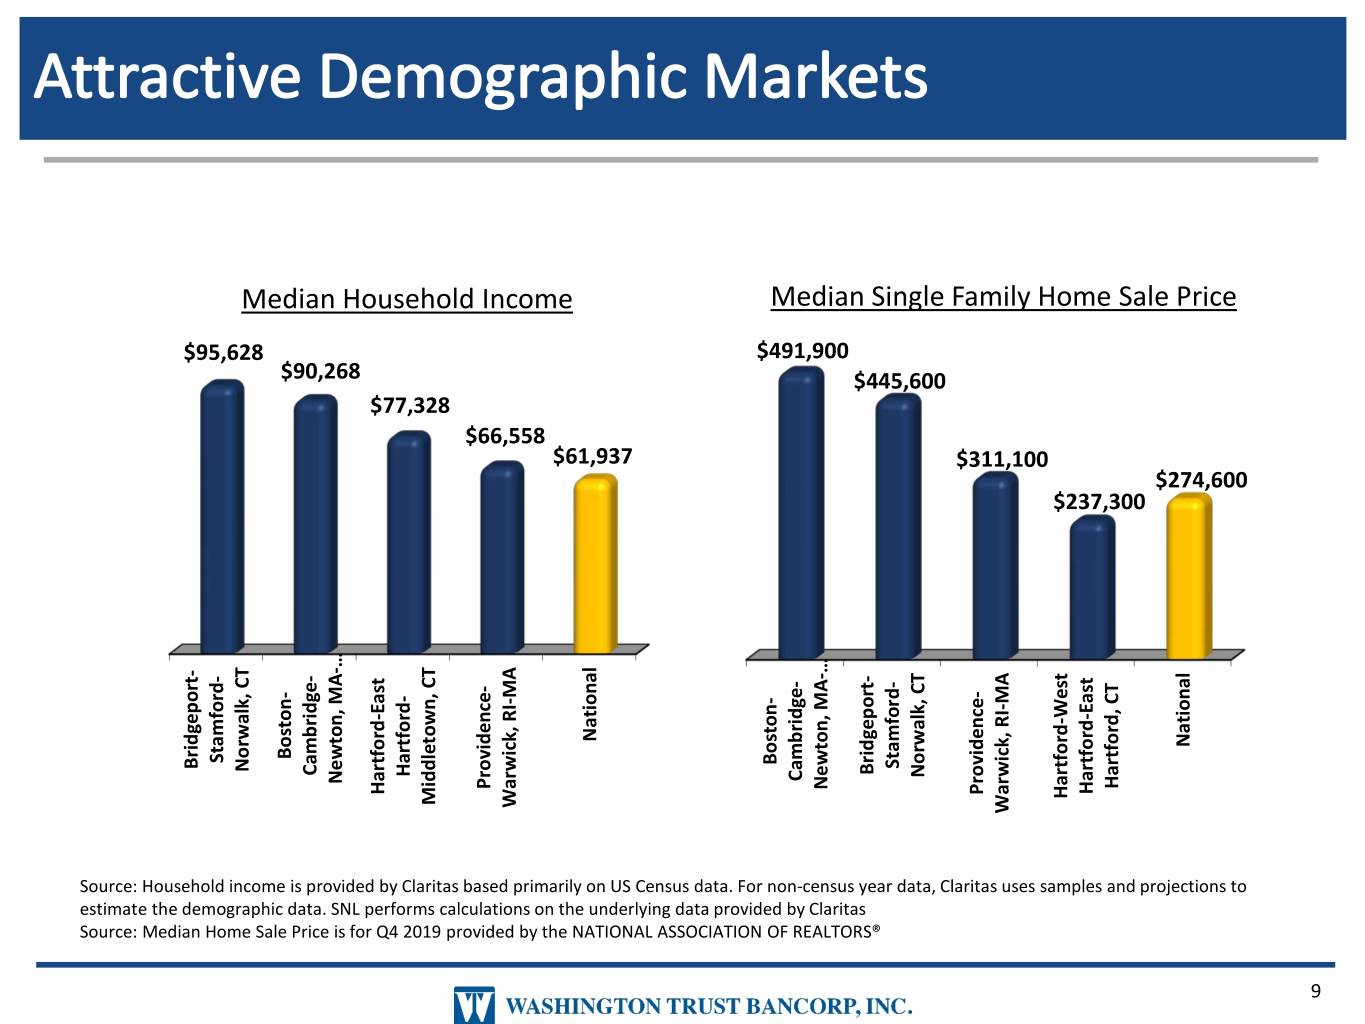
Source: Median Median OF Sale Source: Home isREALTORS® Price ASSOCIATION by provided NATIONAL for the 2019 Q4 estimatethe demographic data. performsSNL calculations on the underlying data provided by Source:Household incomeis provided by $95,628 Bridgeport- Stamford- Norwalk, CT Income HouseholdMedian Boston- $90,268 Cambridge- Newton, MA-… $77,328 Hartford-East Claritas Hartford- Middletown, CT basedprimarily Census on USdata. Fornon- $66,558 Providence- Warwick, RI-MA $61,937 National $491,900 Boston- Price Sale Family Home Single Median census year data, Claritas Cambridge- Newton, MA-… $445,600 Bridgeport- Stamford- Norwalk, CT Claritas $311,100 Providence- uses samples and projections to Warwick, RI-MA $237,300 Hartford-West Hartford-East Hartford, CT $274,600 National 9
COVID-19 RESPONSE 10
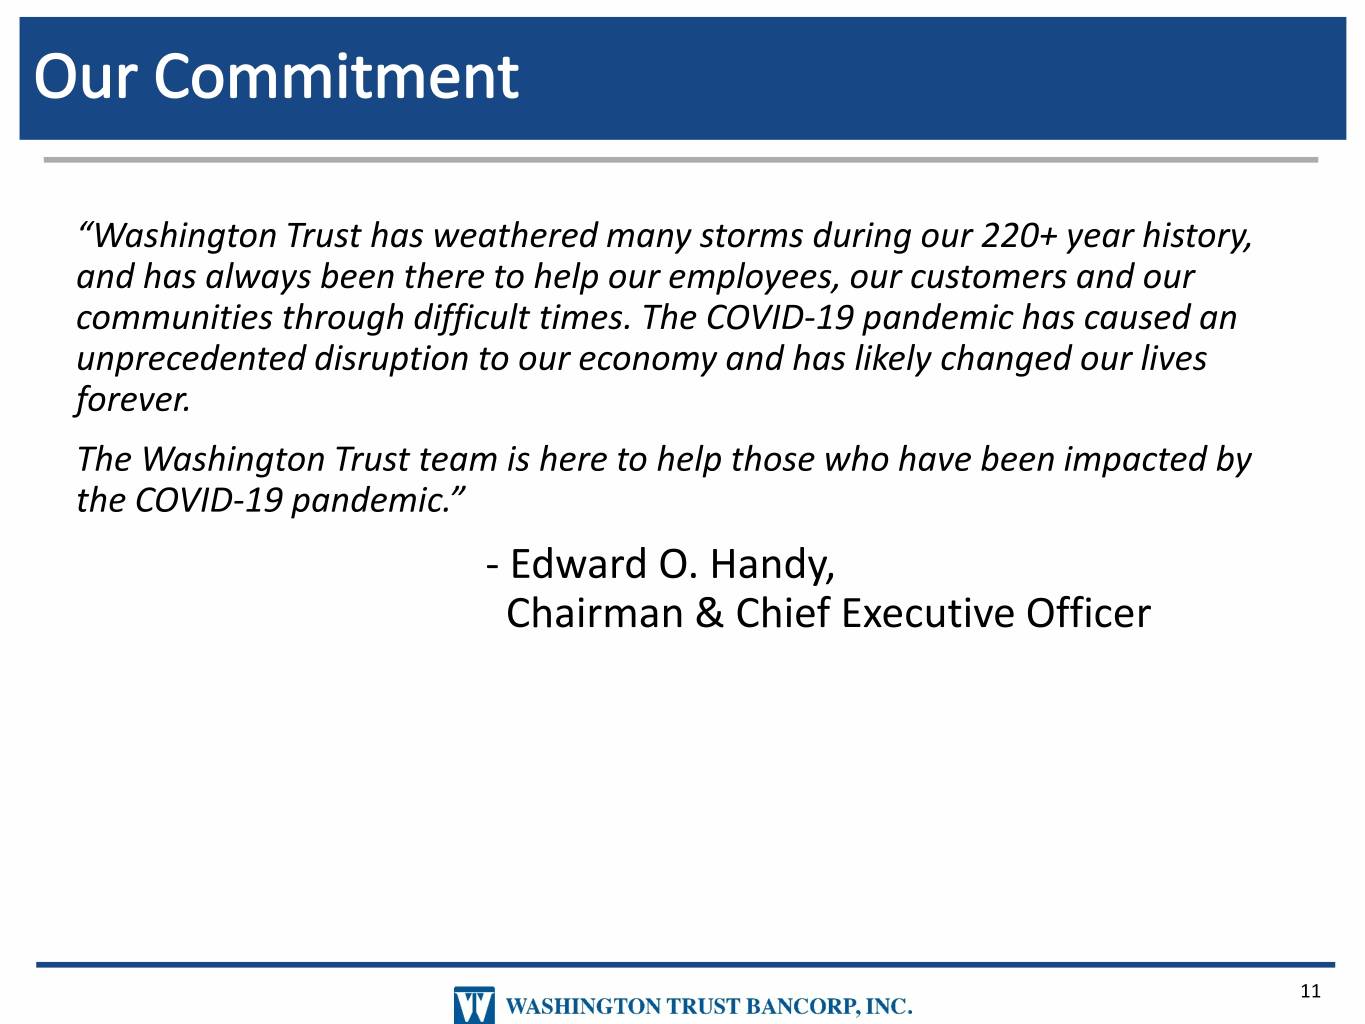
“Washington Trust has weathered many storms during our 220+ year history, and has always been there to help our employees, our customers and our communities through difficult times. The COVID-19 pandemic has caused an unprecedented disruption to our economy and has likely changed our lives forever. The Washington Trust team is here to help those who have been impacted by the COVID-19 pandemic.” - Edward O. Handy, Chairman & Chief Executive Officer 11
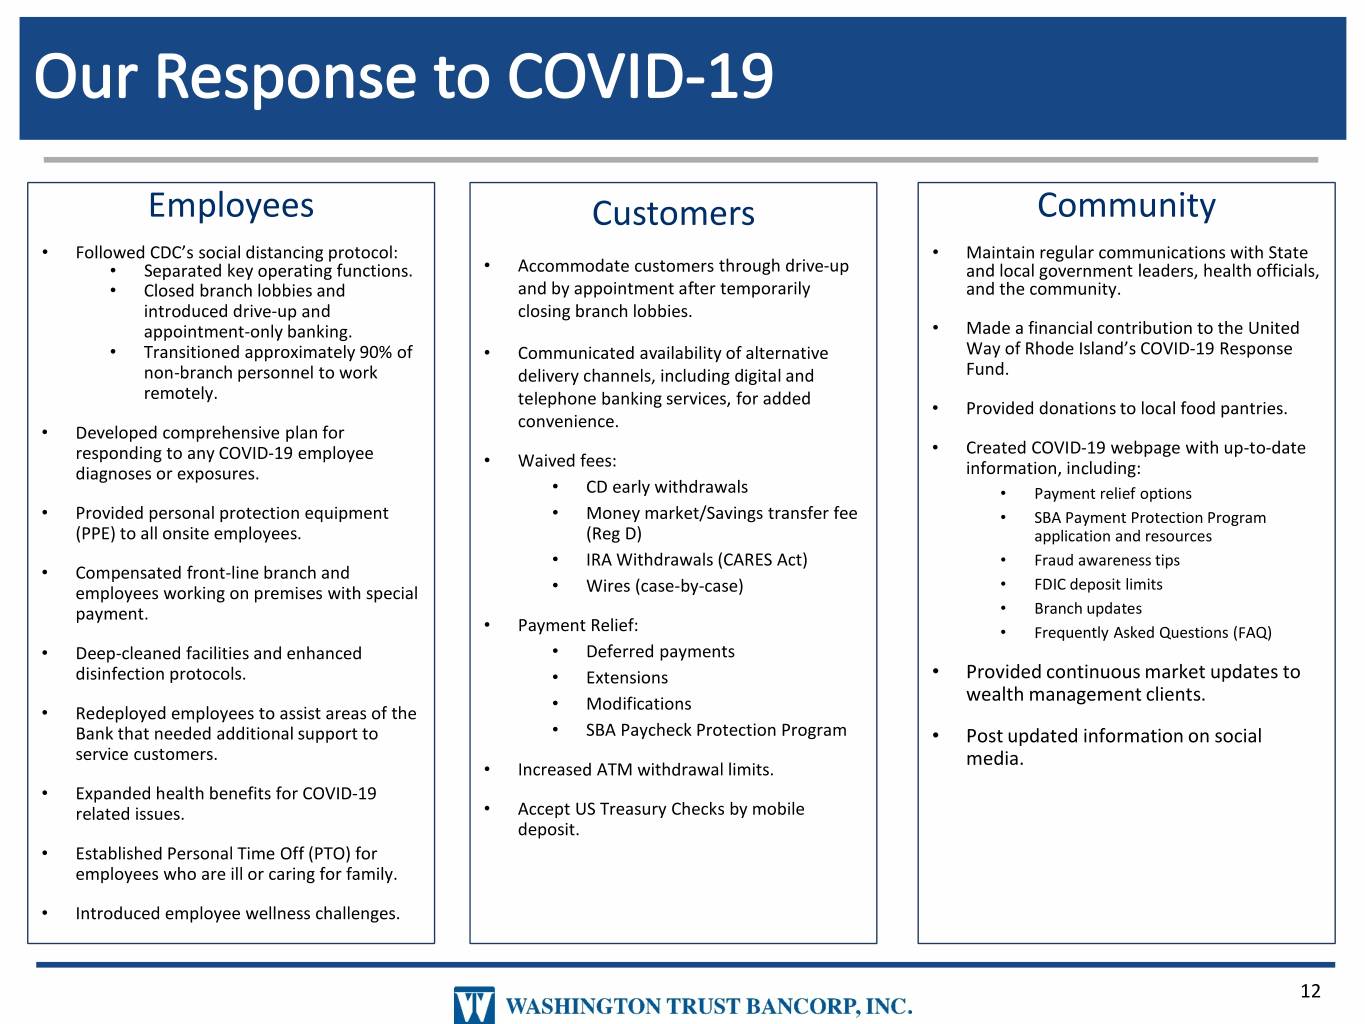
Employees Customers Community • Followed CDC’s social distancing protocol: • Maintain regular communications with State • Separated key operating functions. • Accommodate customers through drive-up and local government leaders, health officials, • Closed branch lobbies and and by appointment after temporarily and the community. introduced drive-up and closing branch lobbies. appointment-only banking. • Made a financial contribution to the United • Transitioned approximately 90% of • Communicated availability of alternative Way of Rhode Island’s COVID-19 Response non-branch personnel to work delivery channels, including digital and Fund. remotely. telephone banking services, for added • Provided donations to local food pantries. convenience. • Developed comprehensive plan for • Created COVID-19 webpage with up-to-date responding to any COVID-19 employee • Waived fees: diagnoses or exposures. information, including: • CD early withdrawals • Payment relief options • Provided personal protection equipment • Money market/Savings transfer fee • SBA Payment Protection Program (PPE) to all onsite employees. (Reg D) application and resources • IRA Withdrawals (CARES Act) • Fraud awareness tips • Compensated front-line branch and employees working on premises with special • Wires (case-by-case) • FDIC deposit limits payment. • Branch updates • Payment Relief: • Frequently Asked Questions (FAQ) • Deep-cleaned facilities and enhanced • Deferred payments disinfection protocols. • Extensions • Provided continuous market updates to Modifications wealth management clients. • Redeployed employees to assist areas of the • Bank that needed additional support to • SBA Paycheck Protection Program • Post updated information on social service customers. media. • Increased ATM withdrawal limits. • Expanded health benefits for COVID-19 related issues. • Accept US Treasury Checks by mobile deposit. • Established Personal Time Off (PTO) for employees who are ill or caring for family. • Introduced employee wellness challenges. 12
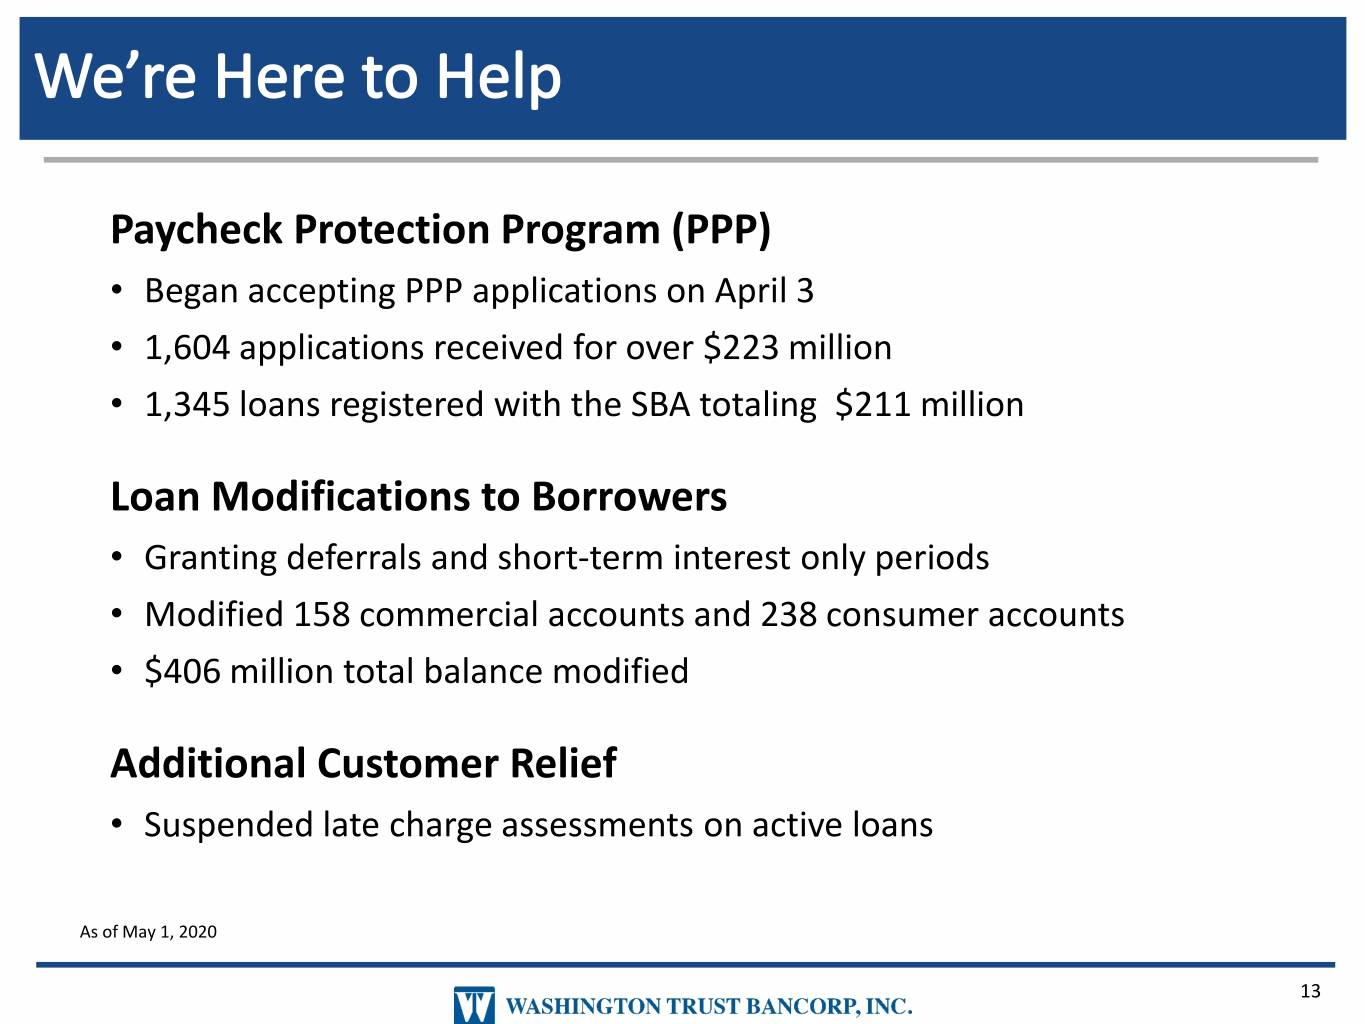
Paycheck Protection Program (PPP) • Began accepting PPP applications on April 3 • 1,604 applications received for over $223 million • 1,345 loans registered with the SBA totaling $211 million Loan Modifications to Borrowers • Granting deferrals and short-term interest only periods • Modified 158 commercial accounts and 238 consumer accounts • $406 million total balance modified Additional Customer Relief • Suspended late charge assessments on active loans As of May 1, 2020 13
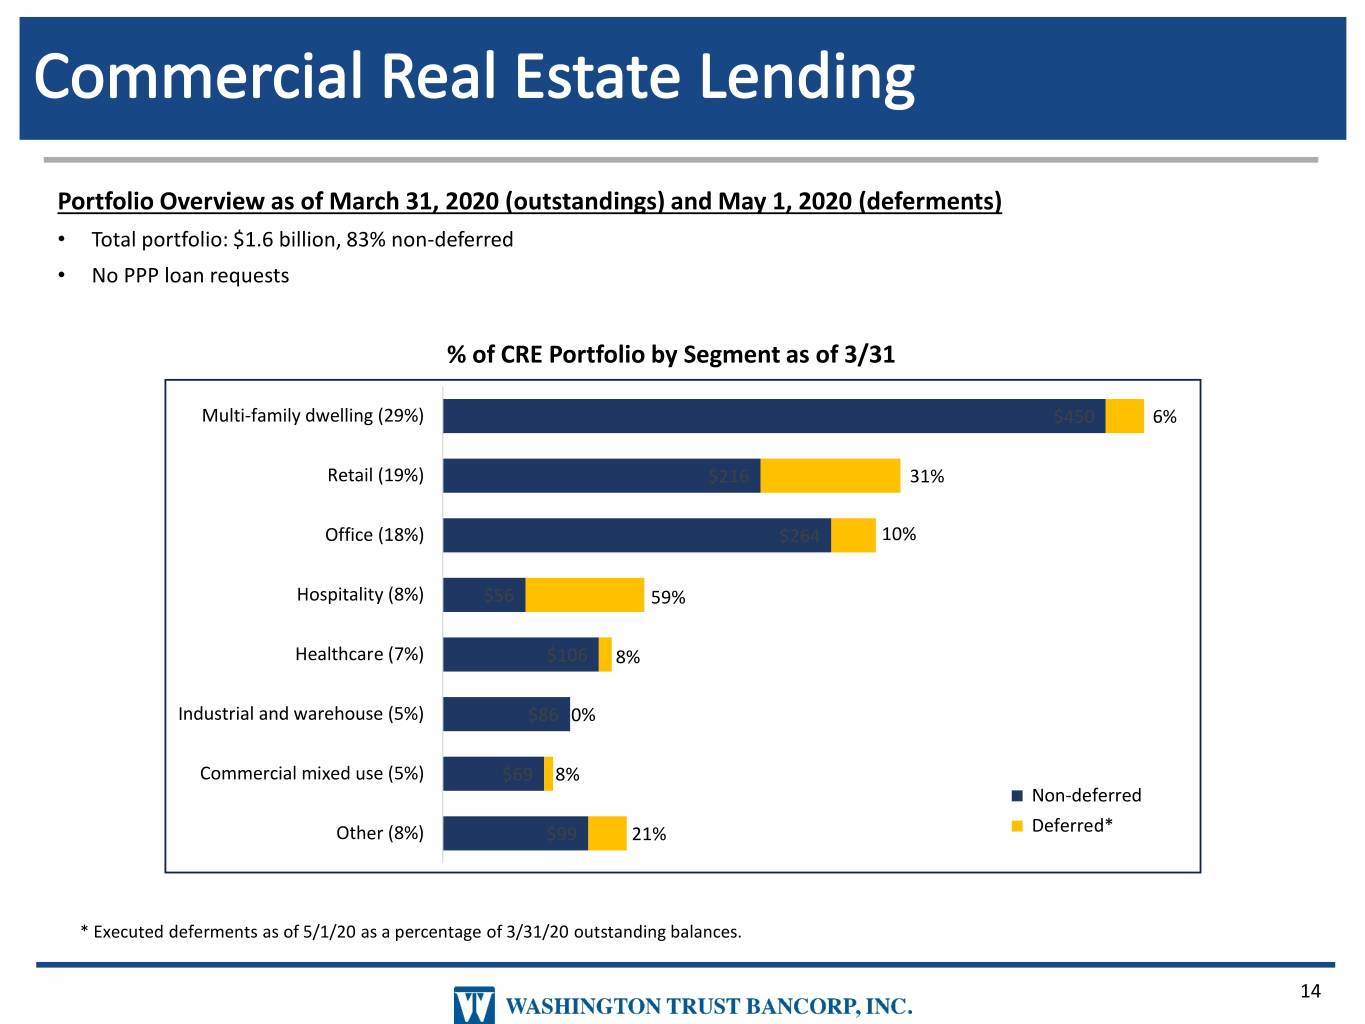
Portfolio Overview as of March 31, 2020 (outstandings) and May 1, 2020 (deferments) • Total portfolio: $1.6 billion, 83% non-deferred • No PPP loan requests % of CRE Portfolio by Segment as of 3/31 Multi-family dwelling (29%) $450 6% Retail (19%) $216 31% Office (18%) $264 10% Hospitality (8%) $56 59% Healthcare (7%) $106 8% Industrial and warehouse (5%) $86 0% Commercial mixed use (5%) $69 8% Non-deferred Other (8%) $99 21% Deferred* * Executed deferments as of 5/1/20 as a percentage of 3/31/20 outstanding balances. 14
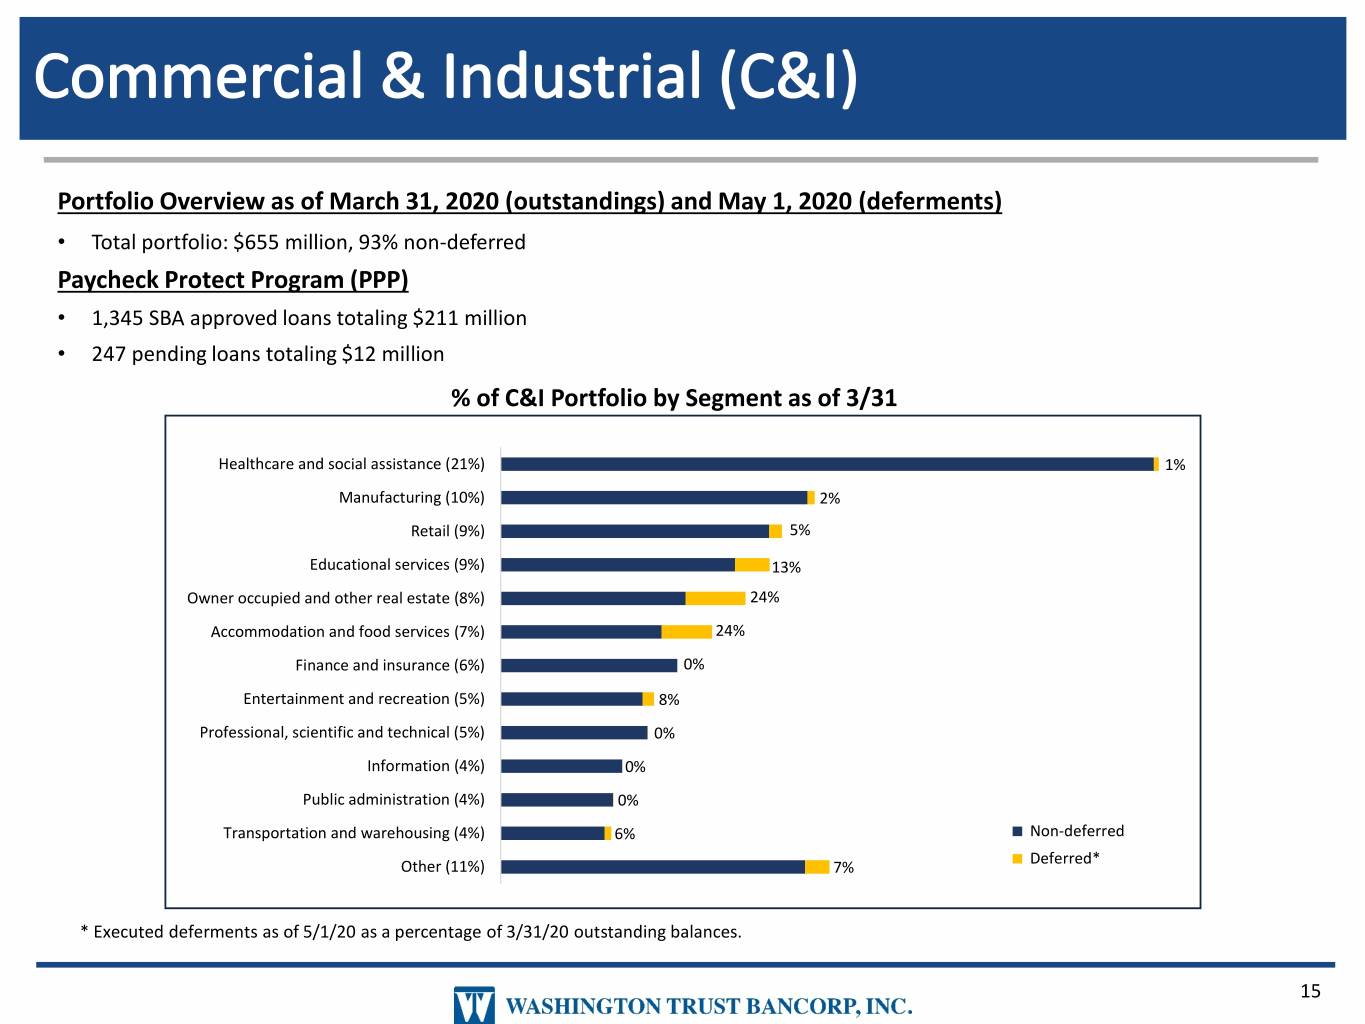
Portfolio Overview as of March 31, 2020 (outstandings) and May 1, 2020 (deferments) • Total portfolio: $655 million, 93% non-deferred Paycheck Protect Program (PPP) • 1,345 SBA approved loans totaling $211 million • 247 pending loans totaling $12 million % of C&I Portfolio by Segment as of 3/31 Healthcare and social assistance (21%) 1% Manufacturing (10%) 2% Retail (9%) 5% Educational services (9%) 13% Owner occupied and other real estate (8%) 24% Accommodation and food services (7%) 24% Finance and insurance (6%) 0% Entertainment and recreation (5%) 8% Professional, scientific and technical (5%) 0% Information (4%) 0% Public administration (4%) 0% Transportation and warehousing (4%) 6% Non-deferred Deferred* Other (11%) 7% * Executed deferments as of 5/1/20 as a percentage of 3/31/20 outstanding balances. 15
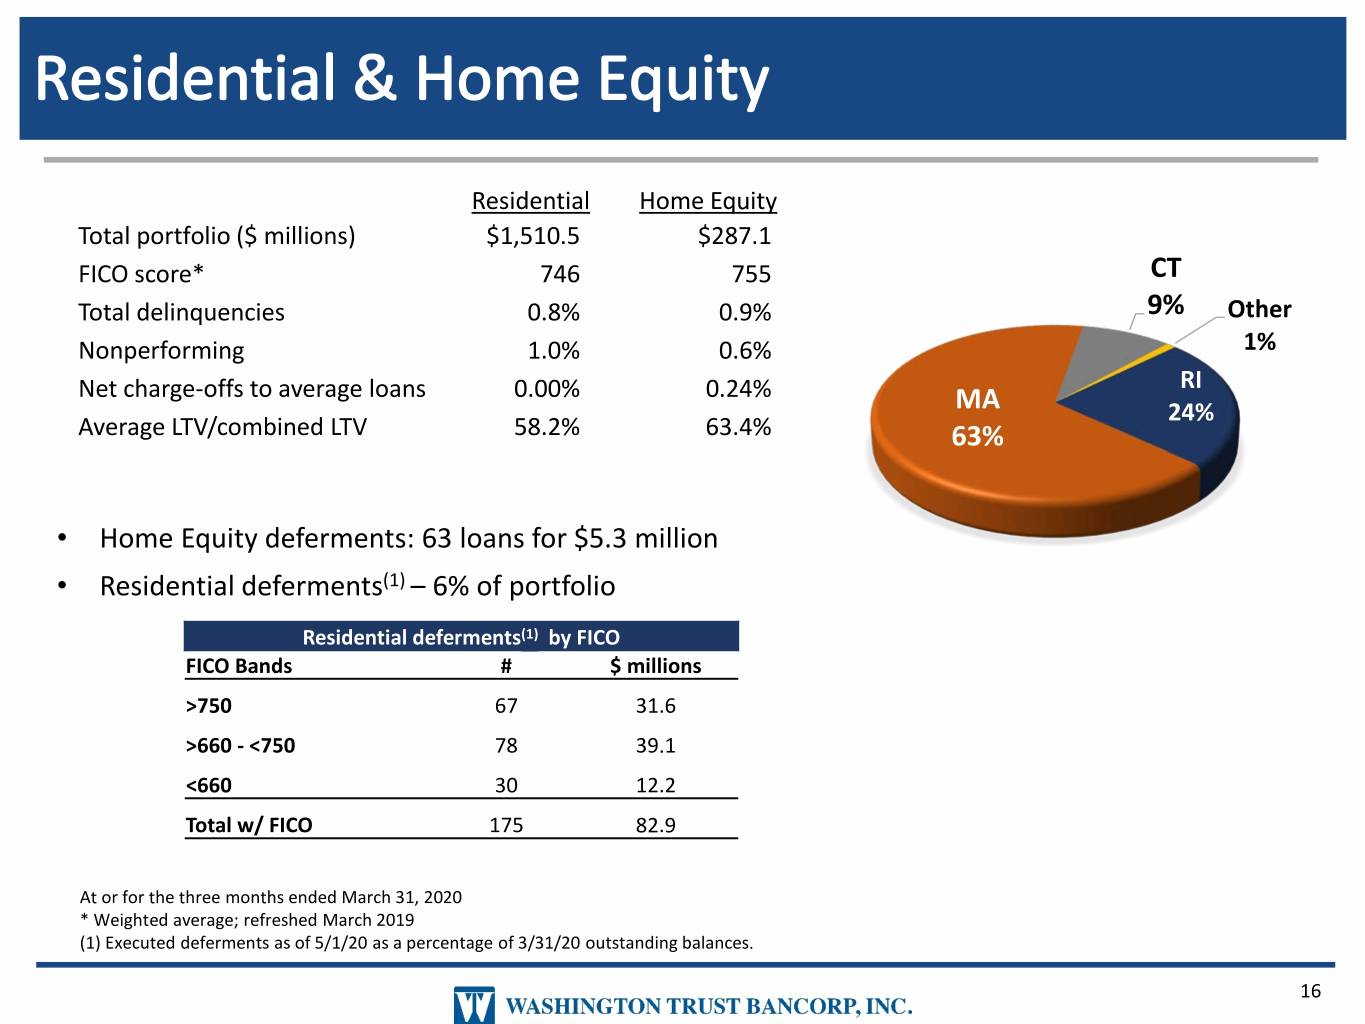
Residential Home Equity Total portfolio ($ millions) $1,510.5 $287.1 FICO score* 746 755 CT Total delinquencies 0.8% 0.9% 9% Other Nonperforming 1.0% 0.6% 1% Net charge-offs to average loans 0.00% 0.24% RI MA 24% Average LTV/combined LTV 58.2% 63.4% 63% • Home Equity deferments: 63 loans for $5.3 million • Residential deferments(1) – 6% of portfolio Residential deferments(1) by FICO FICO Bands # $ millions >750 67 31.6 >660 - <750 78 39.1 <660 30 12.2 Total w/ FICO 175 82.9 At or for the three months ended March 31, 2020 * Weighted average; refreshed March 2019 (1) Executed deferments as of 5/1/20 as a percentage of 3/31/20 outstanding balances. 16
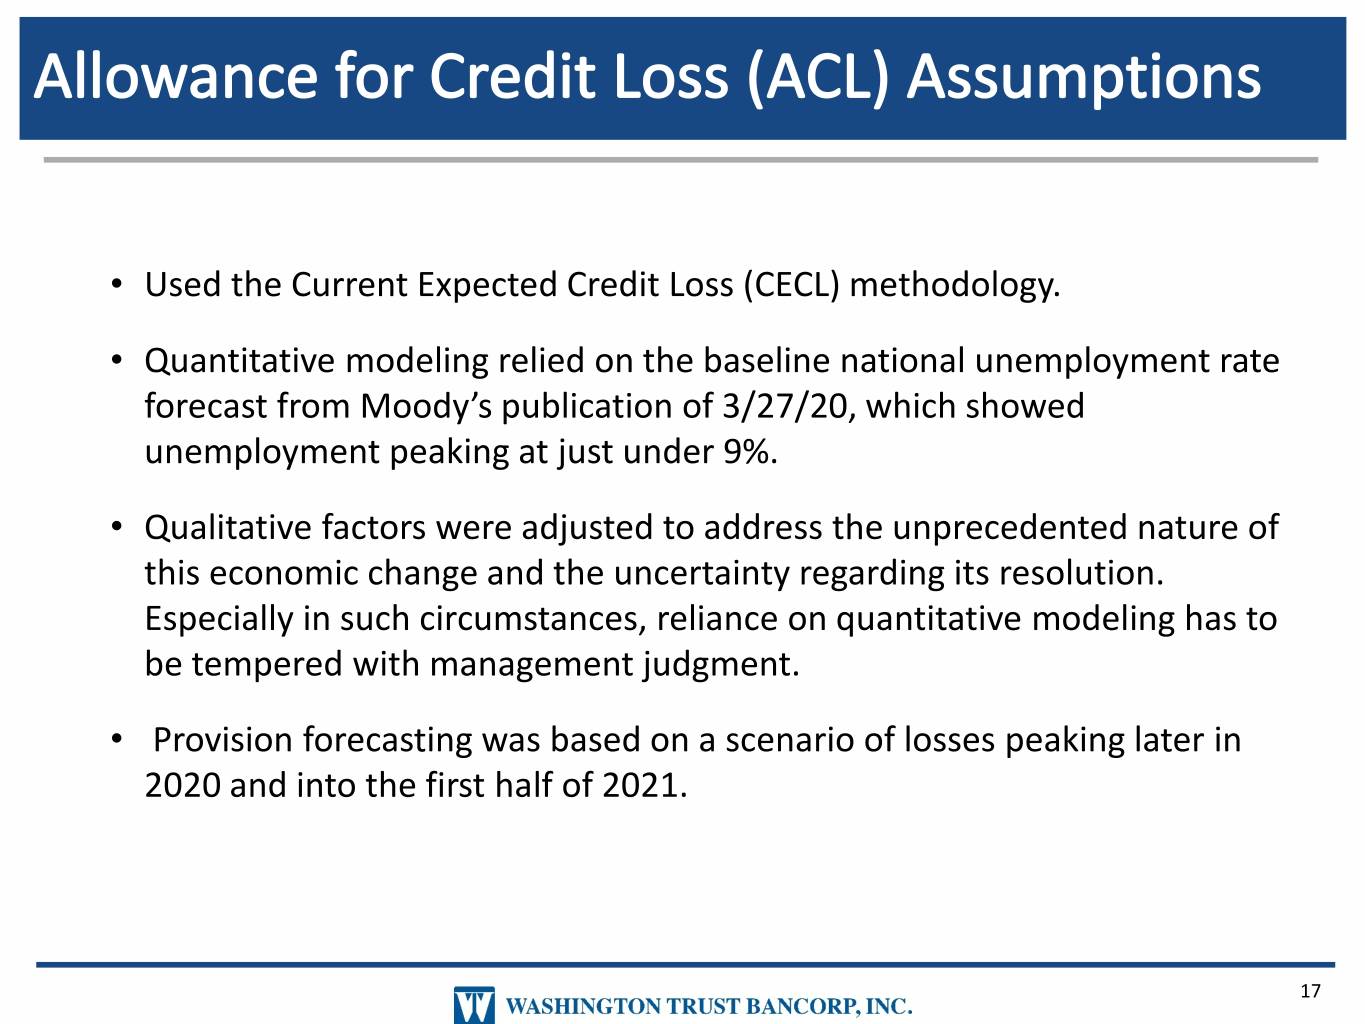
• Used the Current Expected Credit Loss (CECL) methodology. • Quantitative modeling relied on the baseline national unemployment rate forecast from Moody’s publication of 3/27/20, which showed unemployment peaking at just under 9%. • Qualitative factors were adjusted to address the unprecedented nature of this economic change and the uncertainty regarding its resolution. Especially in such circumstances, reliance on quantitative modeling has to be tempered with management judgment. • Provision forecasting was based on a scenario of losses peaking later in 2020 and into the first half of 2021. 17
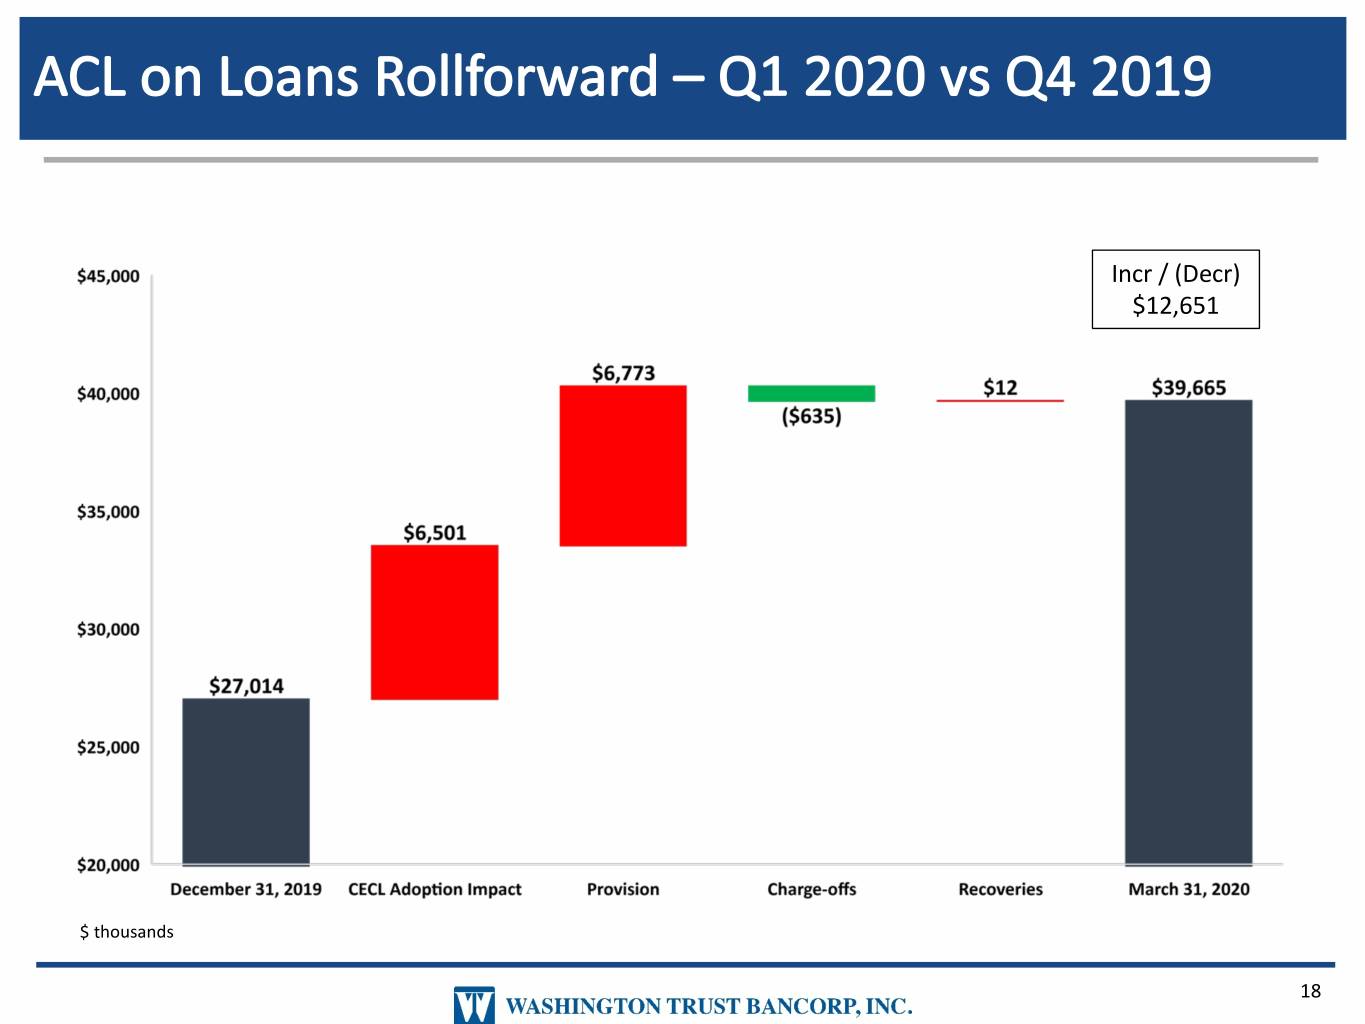
Incr / (Decr) $12,651 $ thousands 18
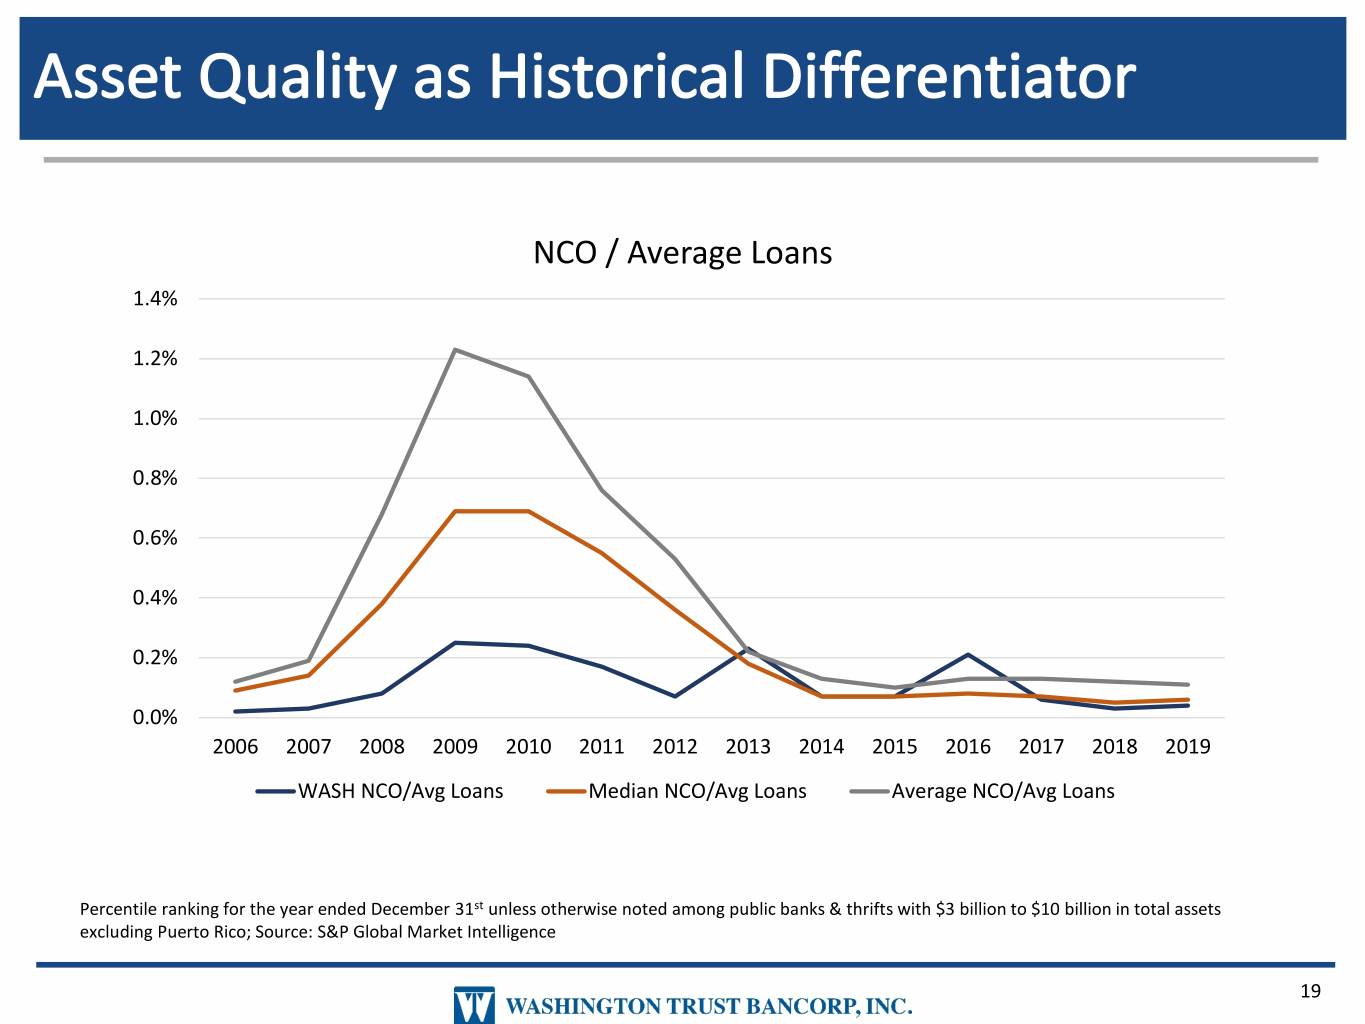
NCO / Average Loans 1.4% 1.2% 1.0% 0.8% 0.6% 0.4% 0.2% 0.0% 2006 2007 2008 2009 2010 2011 2012 2013 2014 2015 2016 2017 2018 2019 WASH NCO/Avg Loans Median NCO/Avg Loans Average NCO/Avg Loans Percentile ranking for the year ended December 31st unless otherwise noted among public banks & thrifts with $3 billion to $10 billion in total assets excluding Puerto Rico; Source: S&P Global Market Intelligence 19
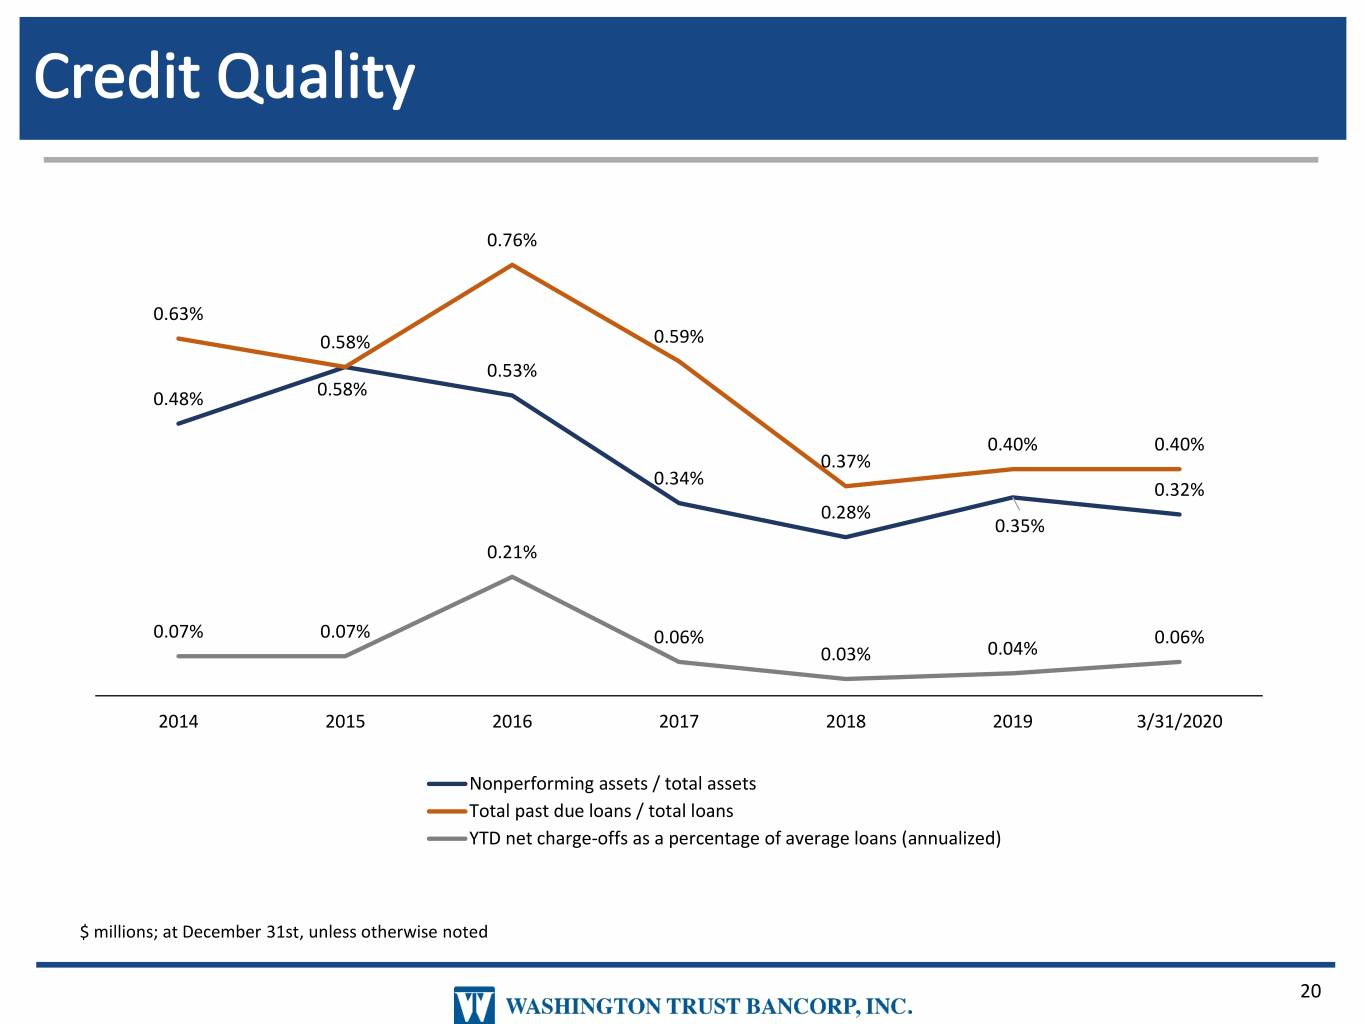
0.76% 0.63% 0.58% 0.59% 0.53% 0.48% 0.58% 0.40% 0.40% 0.37% 0.34% 0.32% 0.28% 0.35% 0.21% 0.07% 0.07% 0.06% 0.06% 0.03% 0.04% 2014 2015 2016 2017 2018 2019 3/31/2020 Nonperforming assets / total assets Total past due loans / total loans YTD net charge-offs as a percentage of average loans (annualized) $ millions; at December 31st, unless otherwise noted 20
STRATEGIC PRIORITIES 21
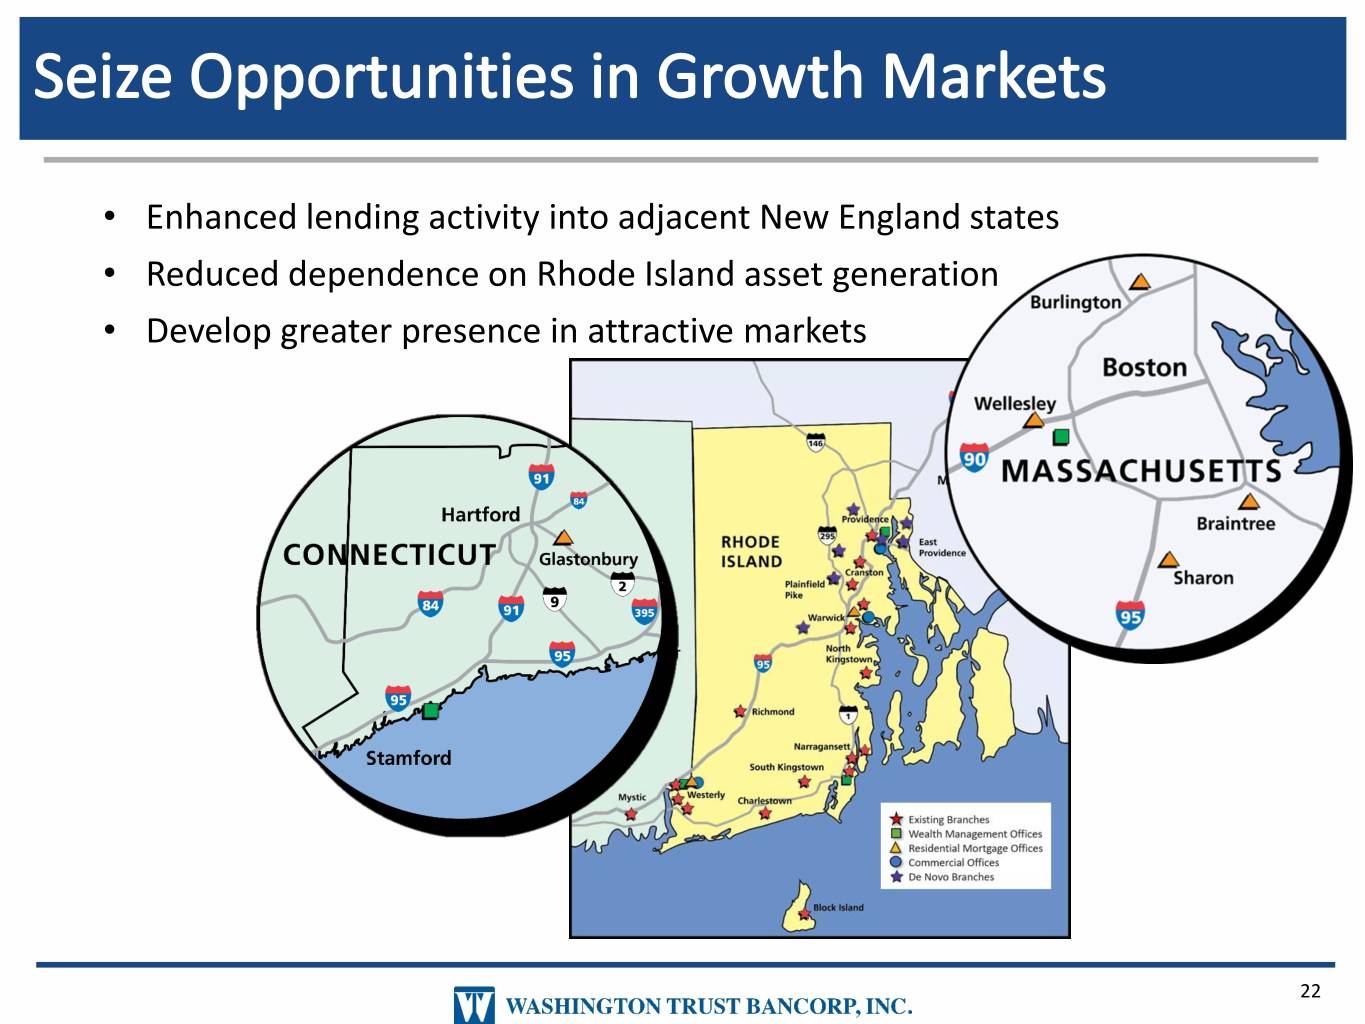
• Enhanced lending activity into adjacent New England states • Reduced dependence on Rhode Island asset generation • Develop greater presence in attractive markets 22
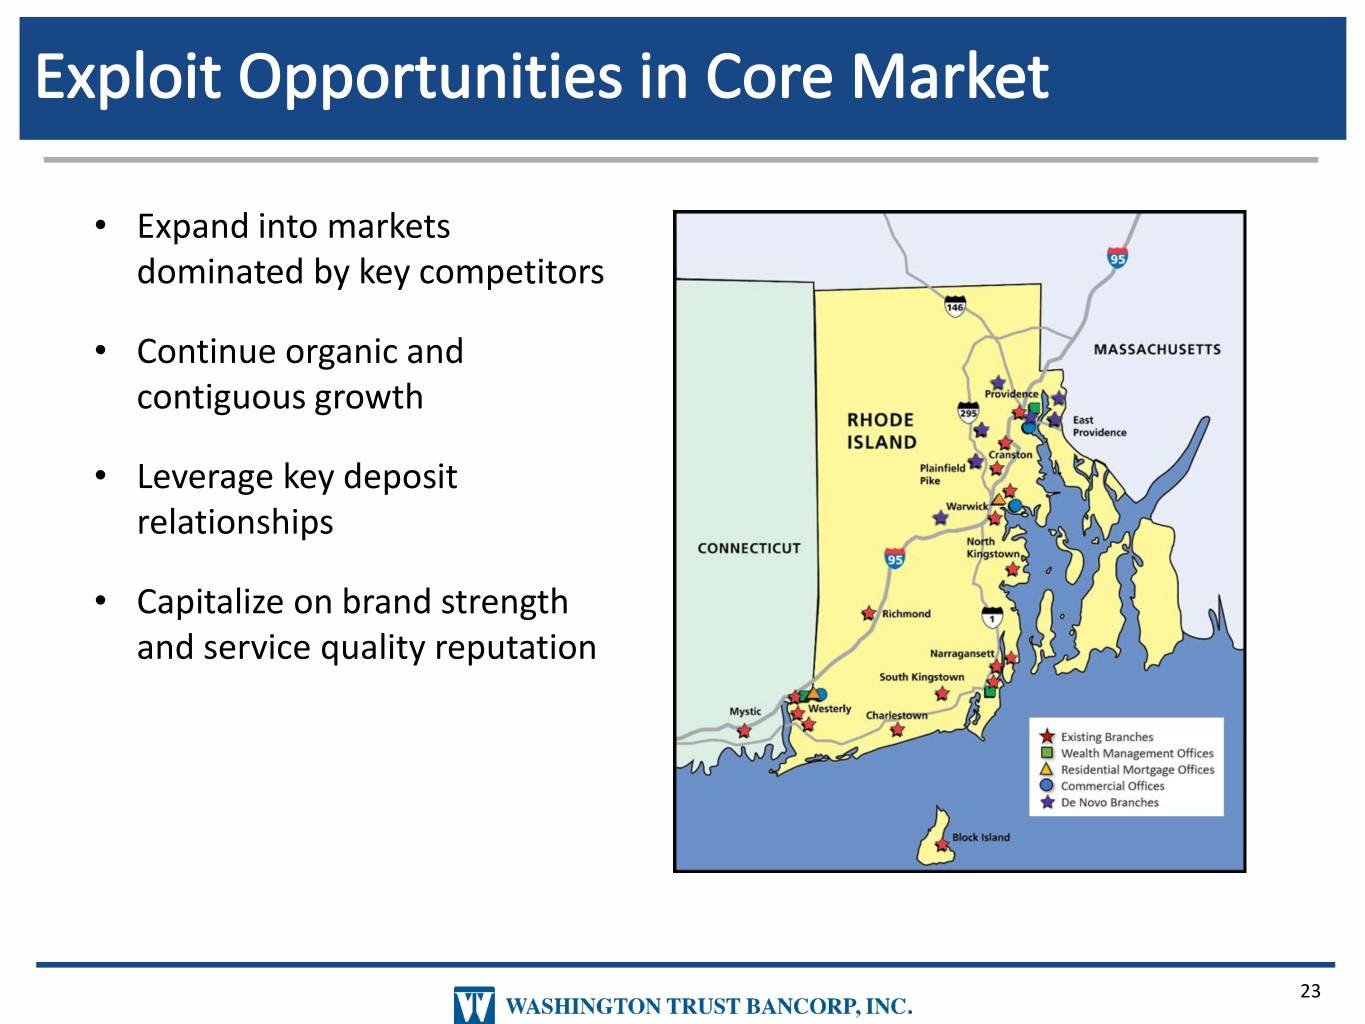
• Expand into markets dominated by key competitors • Continue organic and contiguous growth • Leverage key deposit relationships • Capitalize on brand strength and service quality reputation 23
• Blend high service solutions with clients’ technology needs • Create seamless client experiences across all channels • Deepen client relationships • Optimize branch delivery • Invest in key technology 24
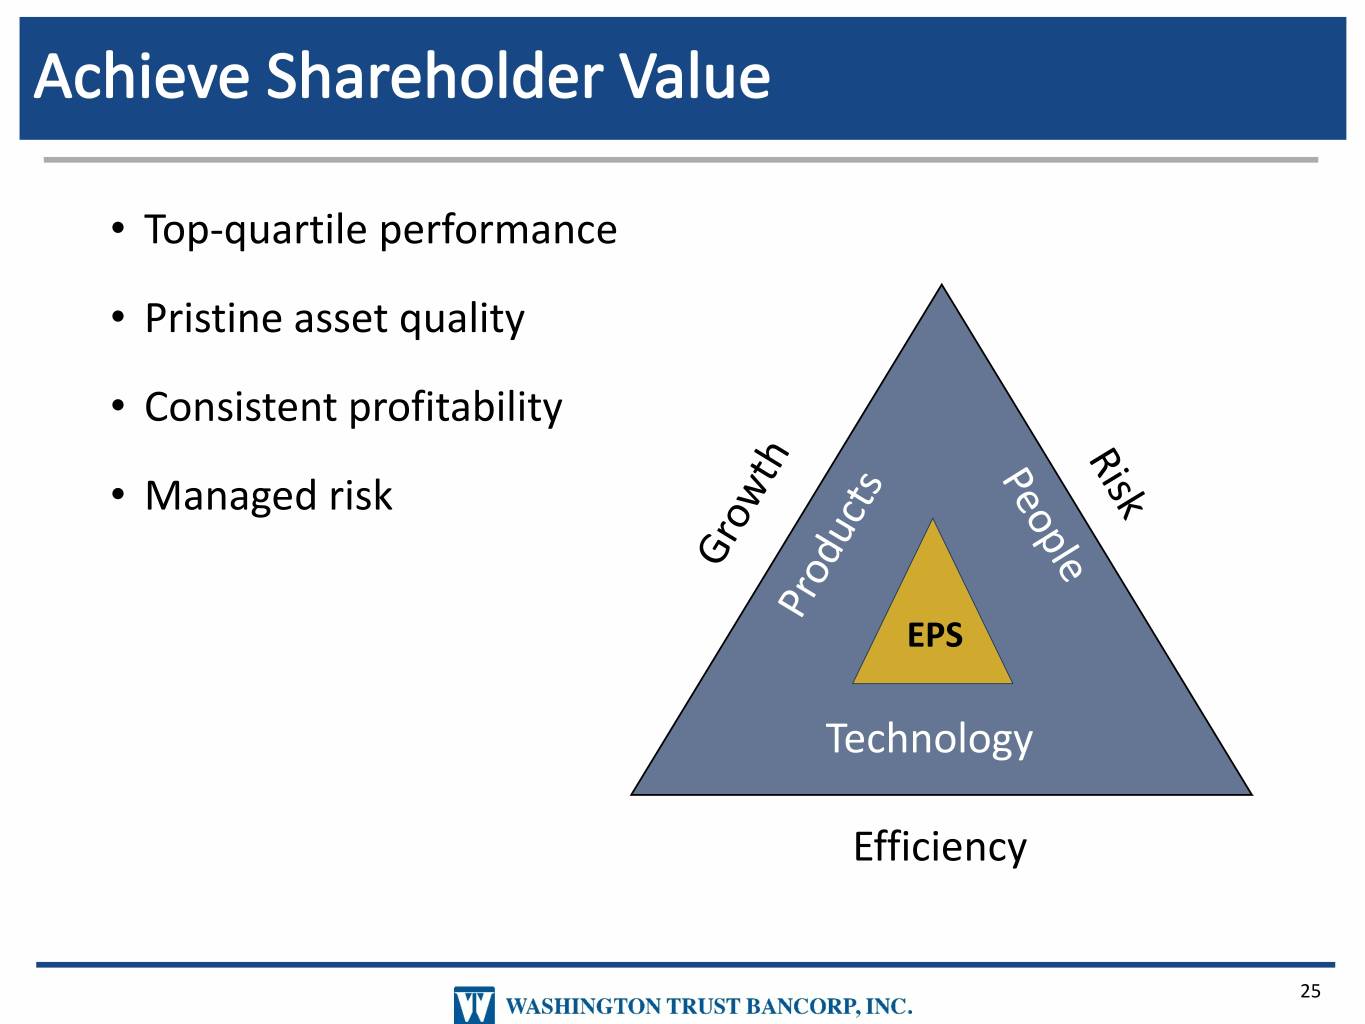
• Top-quartile performance • Pristine asset quality • Consistent profitability • Managed risk EPS Technology Efficiency 25
FINANCIAL OVERVIEW 26
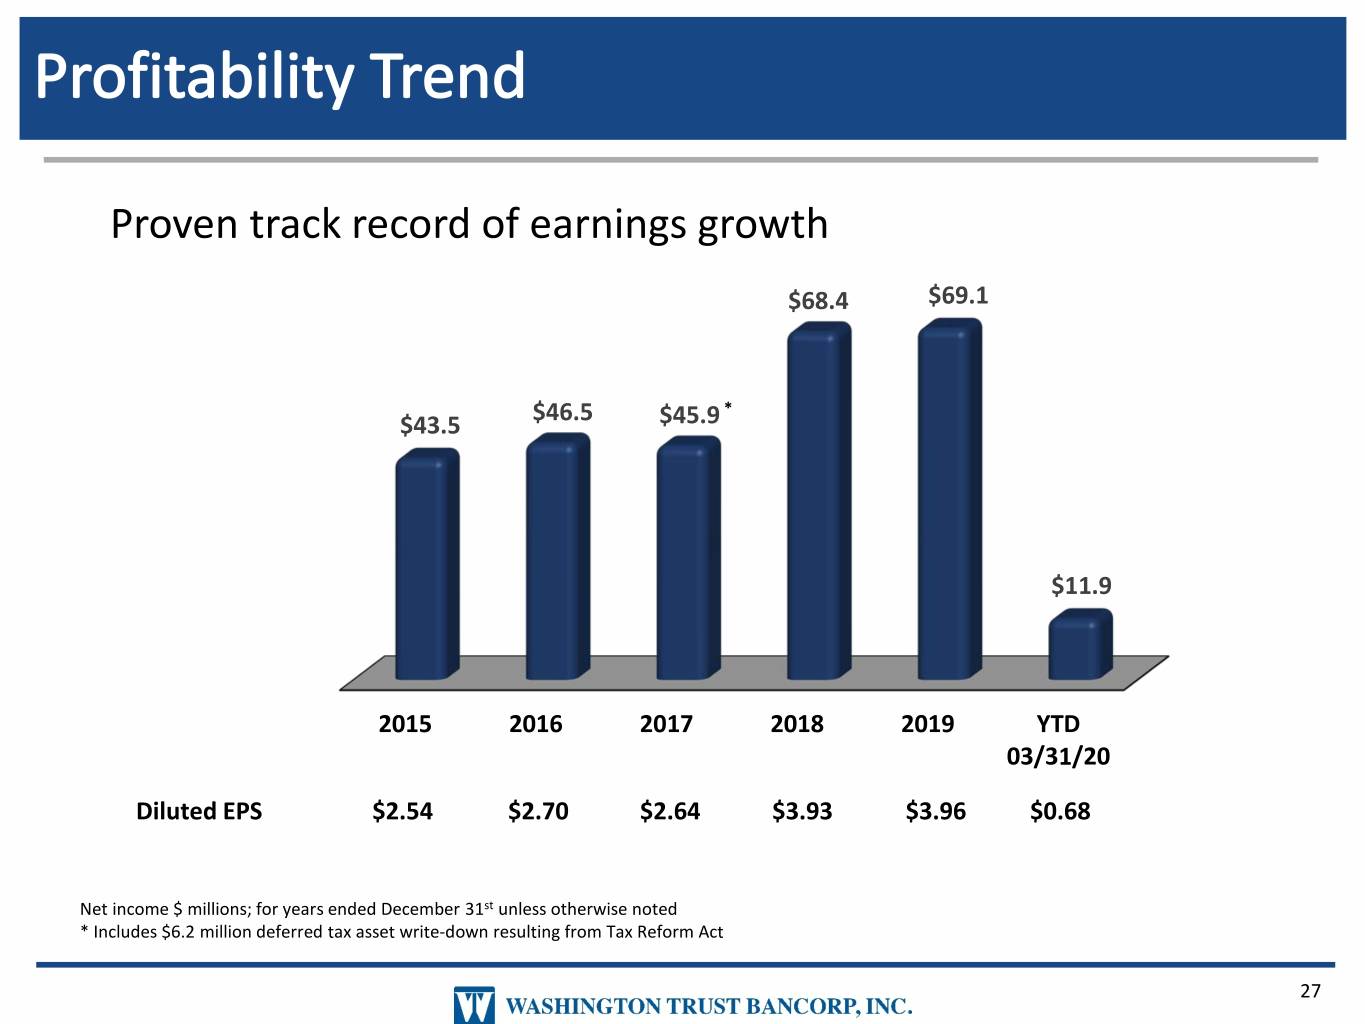
Proven track record of earnings growth $68.4 $69.1 $46.5 * $43.5 $45.9 $11.9 2015 2016 2017 2018 2019 YTD 03/31/20 Diluted EPS $2.54 $2.70 $2.64 $3.93 $3.96 $0.68 Net income $ millions; for years ended December 31st unless otherwise noted * Includes $6.2 million deferred tax asset write-down resulting from Tax Reform Act 27
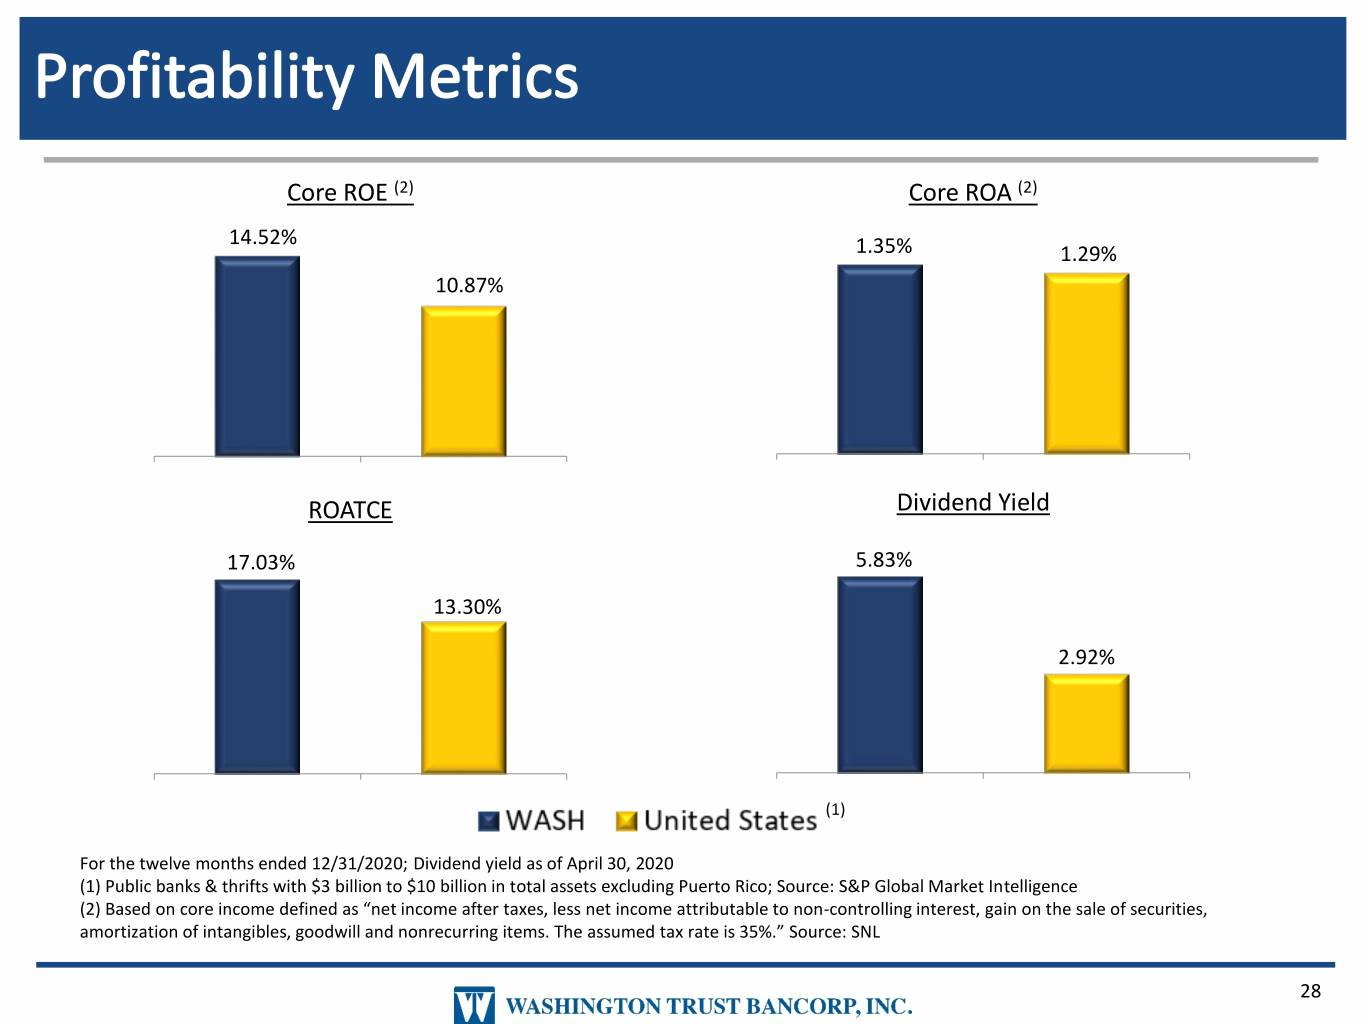
Core ROE (2) Core ROA (2) 14.52% 1.35% 1.29% 10.87% WASH United States WASH United States ROATCE Dividend Yield 17.03% 5.83% 13.30% 2.92% WASH United States WASH United States (1) For the twelve months ended 12/31/2020; Dividend yield as of April 30, 2020 (1) Public banks & thrifts with $3 billion to $10 billion in total assets excluding Puerto Rico; Source: S&P Global Market Intelligence (2) Based on core income defined as “net income after taxes, less net income attributable to non-controlling interest, gain on the sale of securities, amortization of intangibles, goodwill and nonrecurring items. The assumed tax rate is 35%.” Source: SNL 28
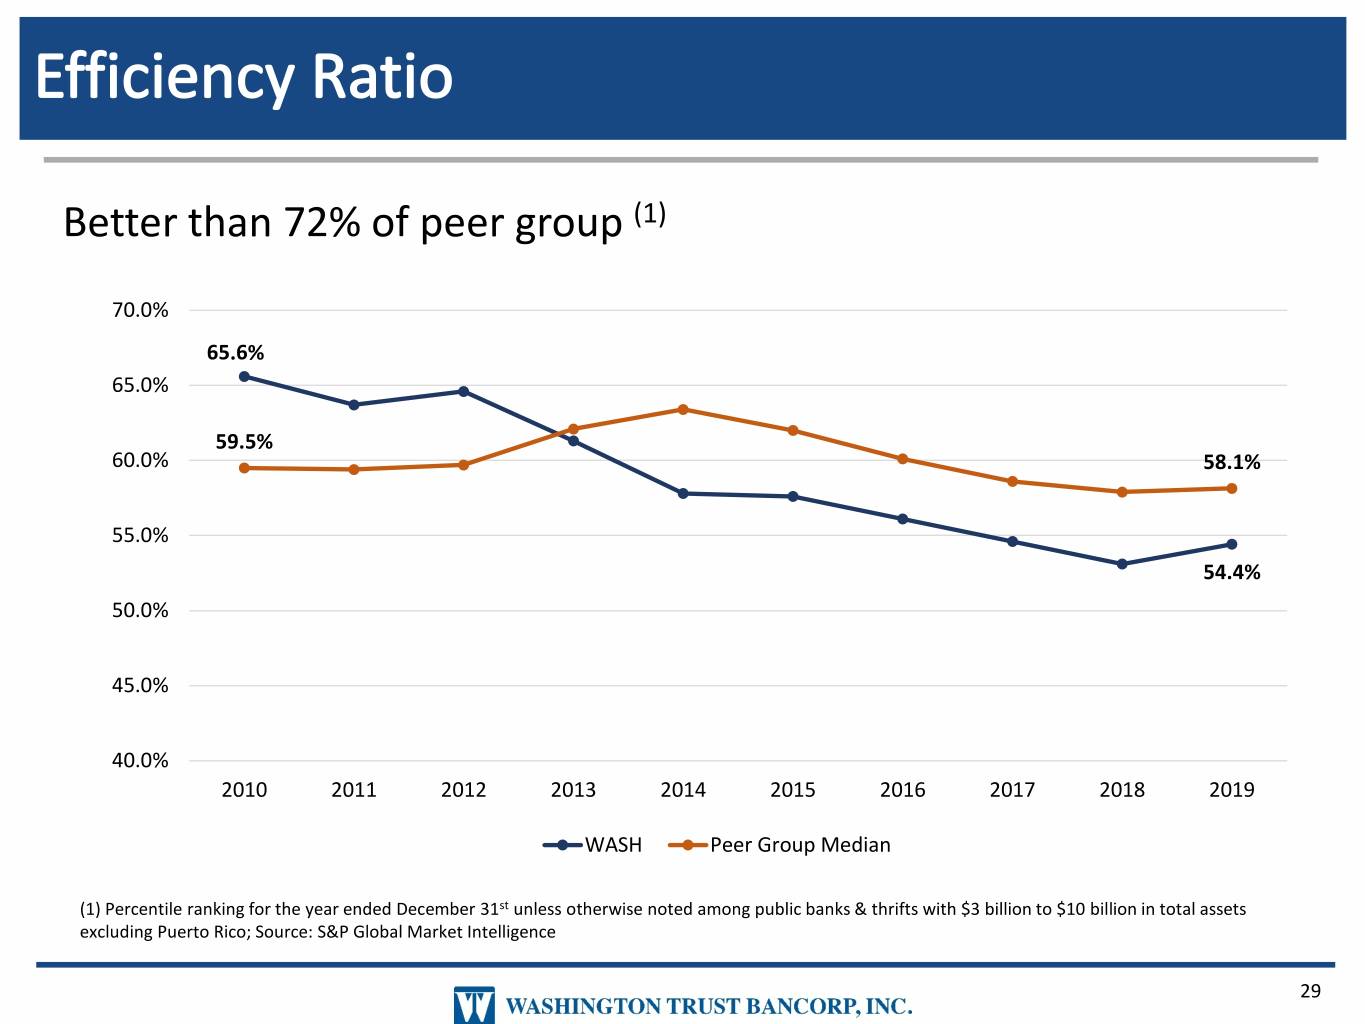
Better than 72% of peer group (1) 70.0% 65.6% 65.0% 59.5% 60.0% 58.1% 55.0% 54.4% 50.0% 45.0% 40.0% 2010 2011 2012 2013 2014 2015 2016 2017 2018 2019 WASH Peer Group Median (1) Percentile ranking for the year ended December 31st unless otherwise noted among public banks & thrifts with $3 billion to $10 billion in total assets excluding Puerto Rico; Source: S&P Global Market Intelligence 29
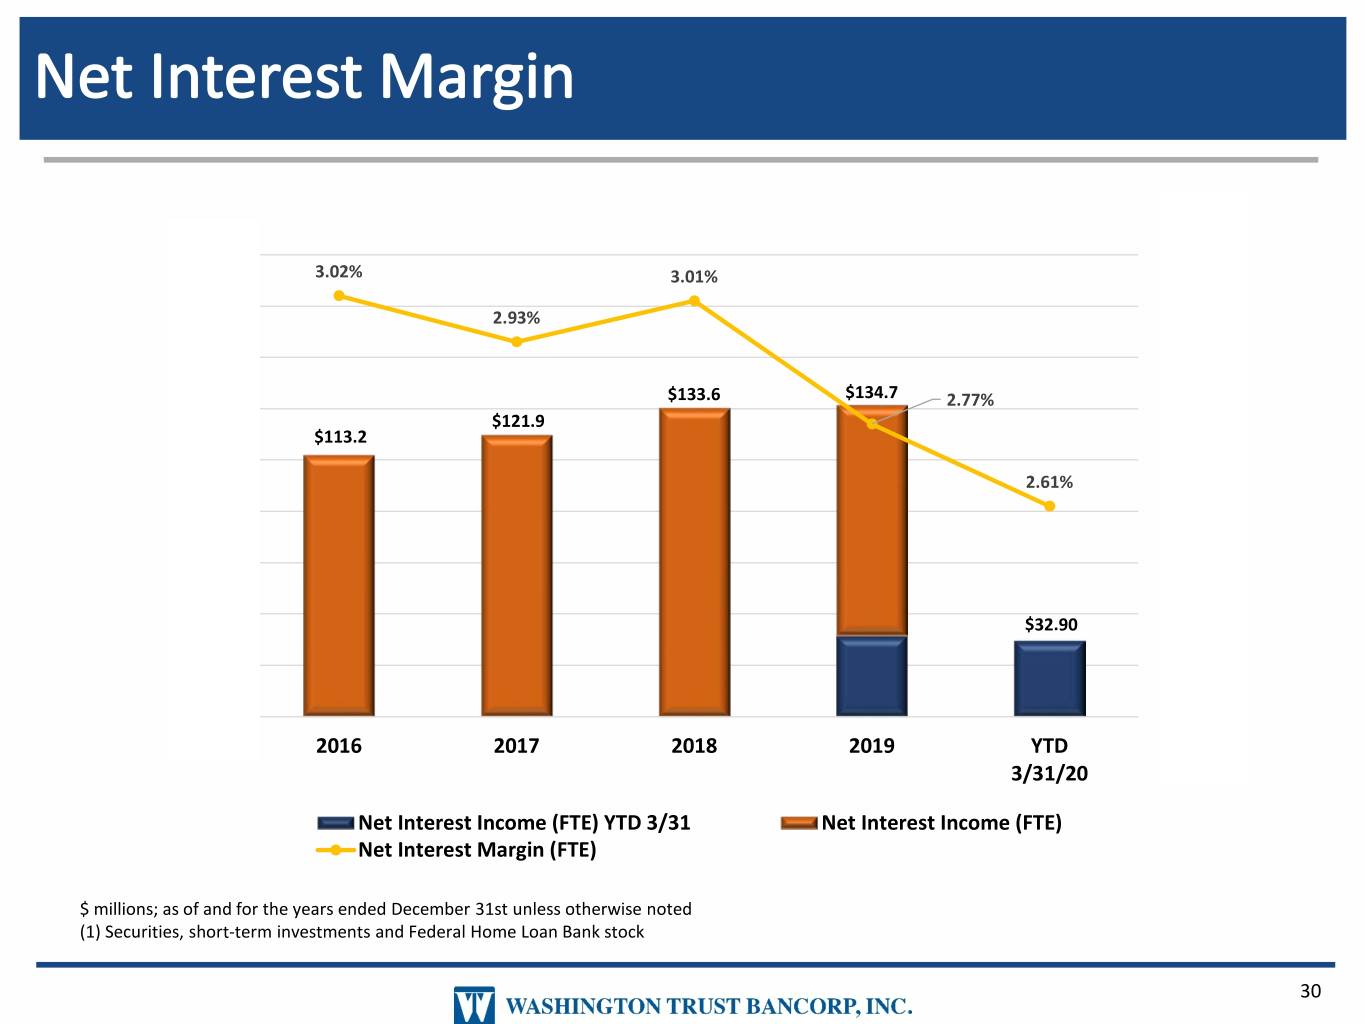
3.10% 200 3.02% 3.01% 3.00% 180 2.93% 2.90% 160 $133.6 $134.7 140 2.80% 2.77% $121.9 $113.2 120 2.70% 2.61% 100 2.60% 80 2.50% 60 2.40% $32.90 40 2.30% 20 2.20% 0 2016 2017 2018 2019 YTD 3/31/20 Net Interest Income (FTE) YTD 3/31 Net Interest Income (FTE) Net Interest Margin (FTE) $ millions; as of and for the years ended December 31st unless otherwise noted (1) Securities, short-term investments and Federal Home Loan Bank stock 30
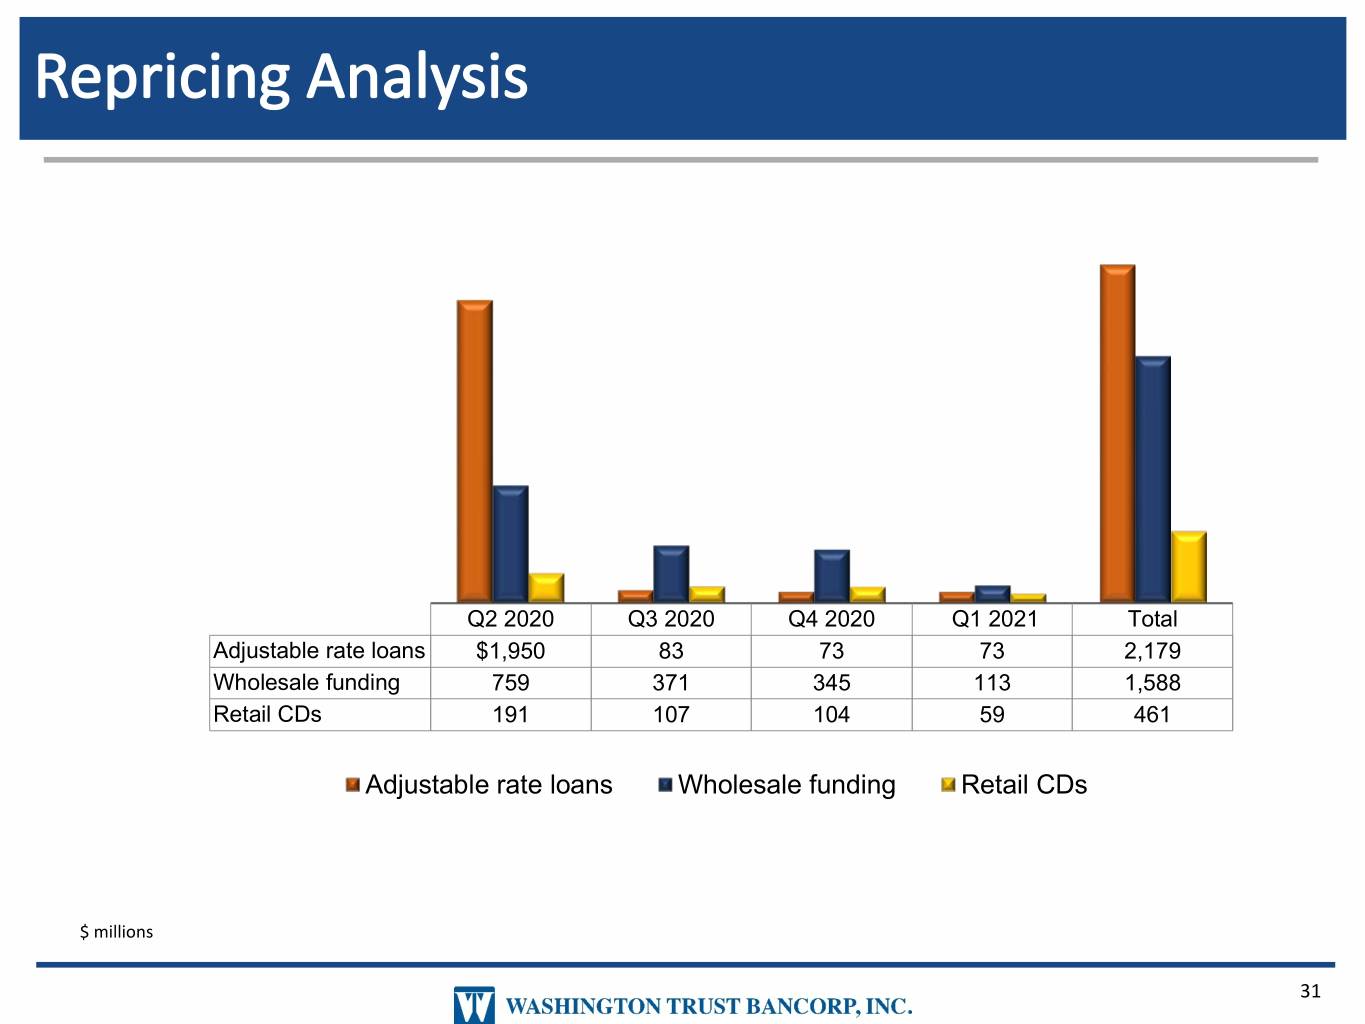
Q2 2020 Q3 2020 Q4 2020 Q1 2021 Total Adjustable rate loans $1,950 83 73 73 2,179 Wholesale funding 759 371 345 113 1,588 Retail CDs 191 107 104 59 461 Adjustable rate loans Wholesale funding Retail CDs $ millions 31
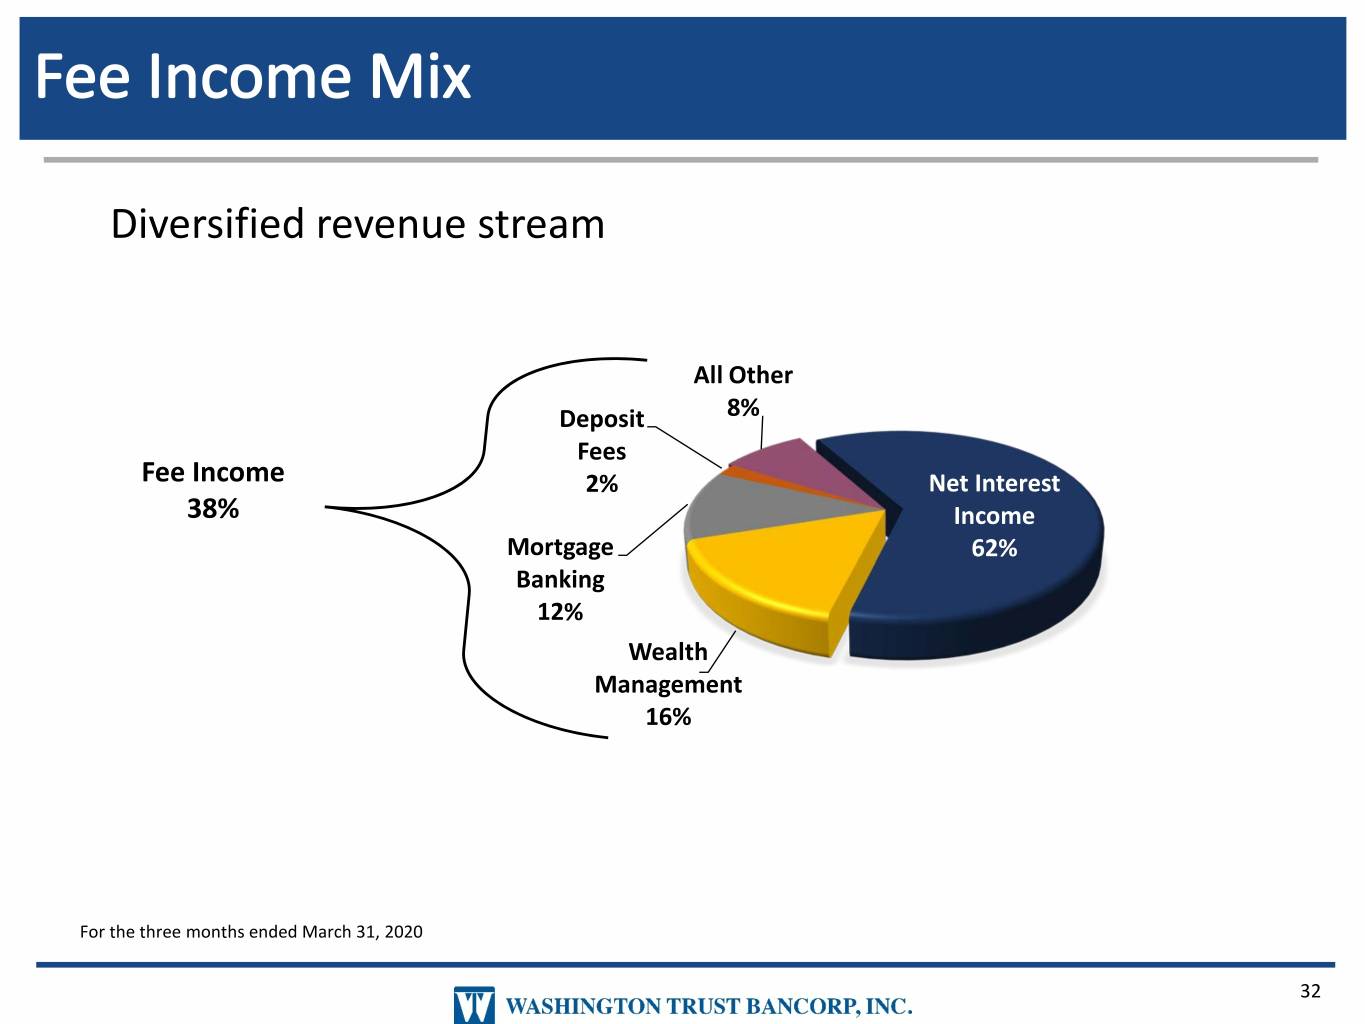
Diversified revenue stream All Other Deposit 8% Fees Fee Income 2% Net Interest 38% Income Mortgage 62% Banking 12% Wealth Management 16% For the three months ended March 31, 2020 32
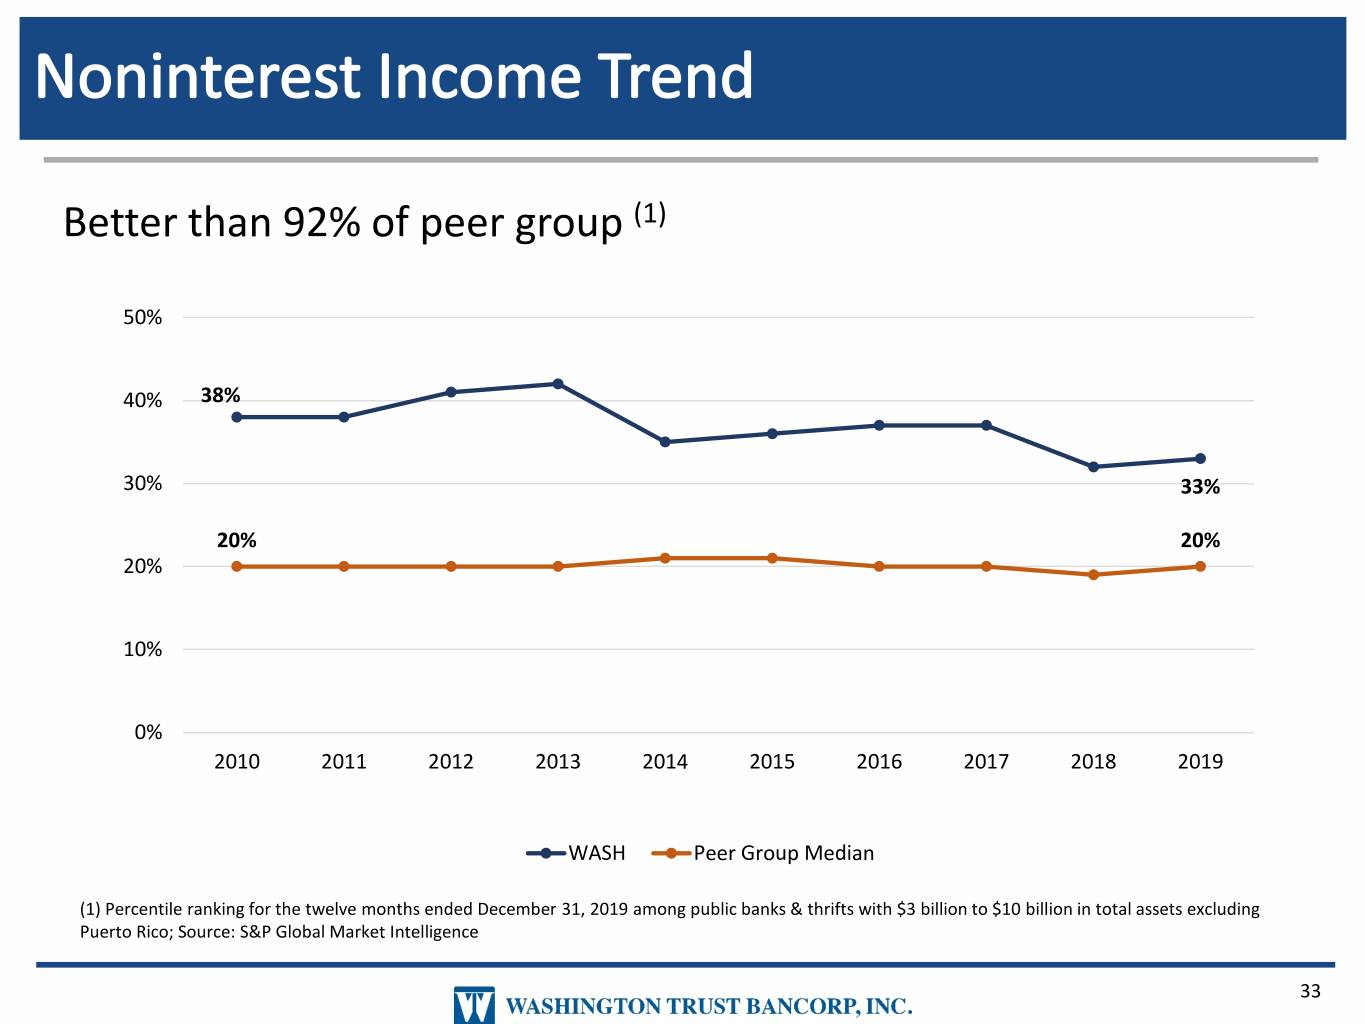
Better than 92% of peer group (1) 50% 40% 38% 30% 33% 20% 20% 20% 10% 0% 2010 2011 2012 2013 2014 2015 2016 2017 2018 2019 WASH Peer Group Median (1) Percentile ranking for the twelve months ended December 31, 2019 among public banks & thrifts with $3 billion to $10 billion in total assets excluding Puerto Rico; Source: S&P Global Market Intelligence 33
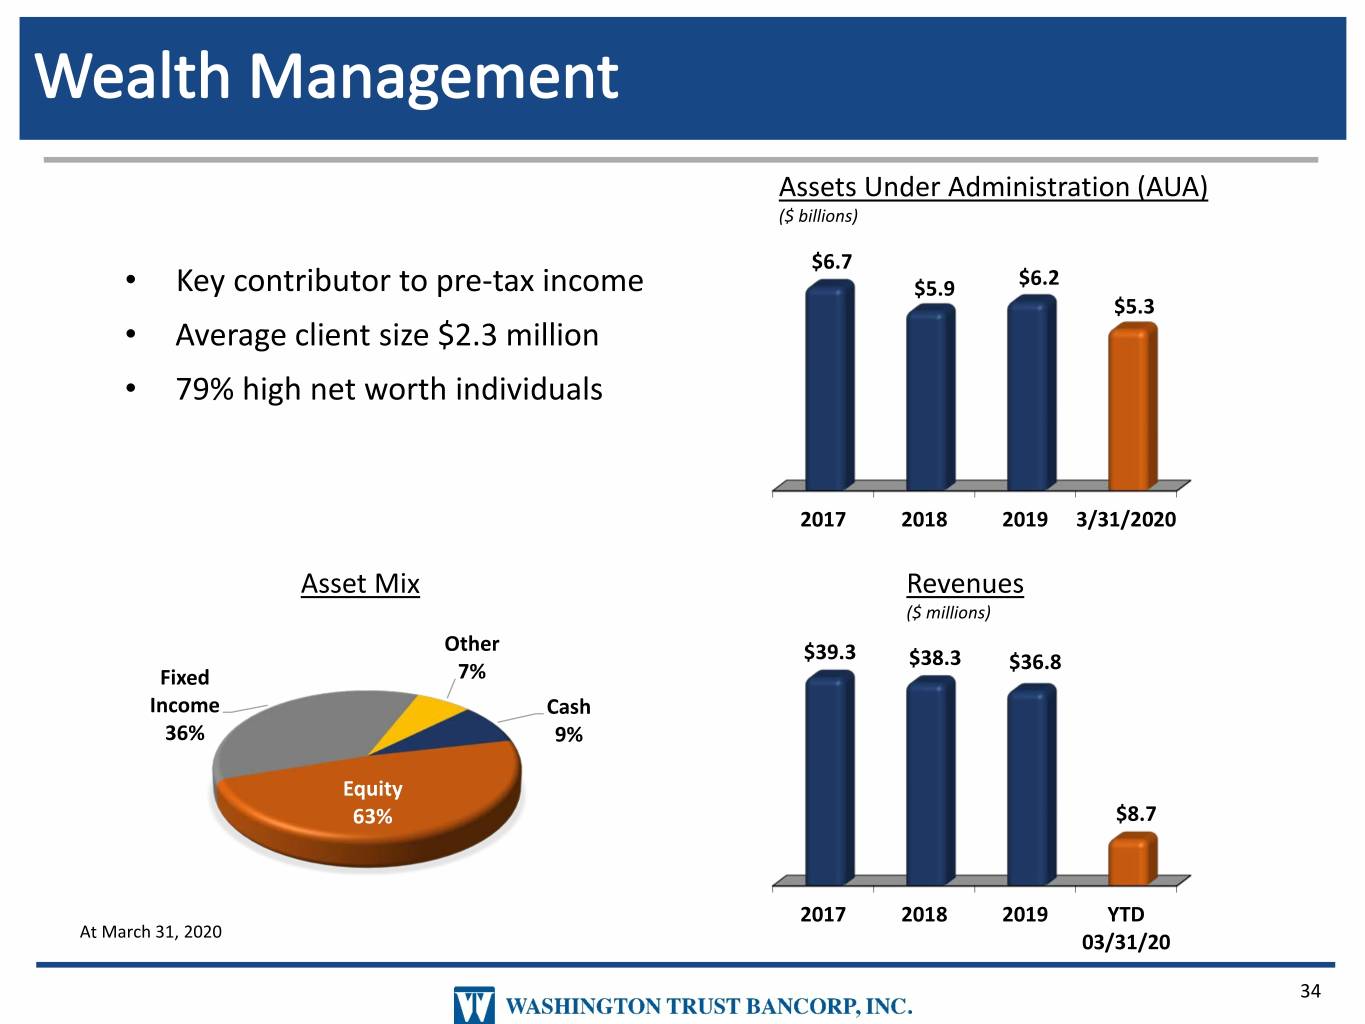
Assets Under Administration (AUA) ($ billions) $6.7 • Key contributor to pre-tax income $5.9 $6.2 $5.3 • Average client size $2.3 million • 79% high net worth individuals 2017 2018 2019 3/31/2020 Asset Mix Revenues ($ millions) Other $39.3 $38.3 $36.8 Fixed 7% Income Cash 36% 9% Equity 63% $8.7 2017 2018 2019 YTD At March 31, 2020 03/31/20 34
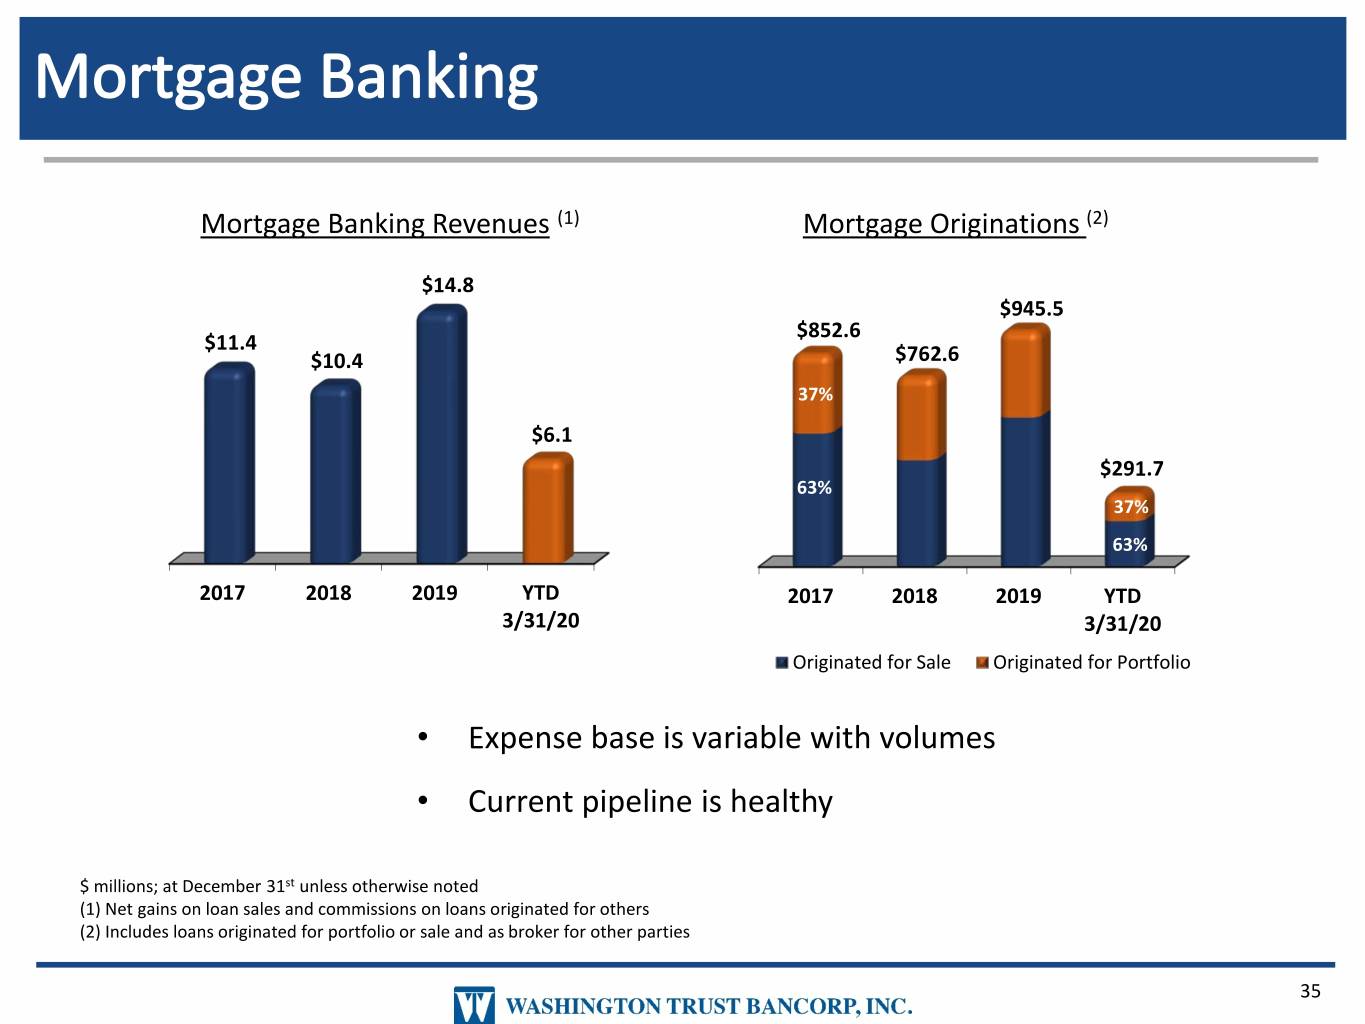
Mortgage Banking Revenues (1) Mortgage Originations (2) $14.8 $945.5 $852.6 $11.4 $10.4 $762.6 37% $6.1 $291.7 63% 37% 63% 2017 2018 2019 YTD 2017 2018 2019 YTD 3/31/20 3/31/20 Originated for Sale Originated for Portfolio • Expense base is variable with volumes • Current pipeline is healthy $ millions; at December 31st unless otherwise noted (1) Net gains on loan sales and commissions on loans originated for others (2) Includes loans originated for portfolio or sale and as broker for other parties 35
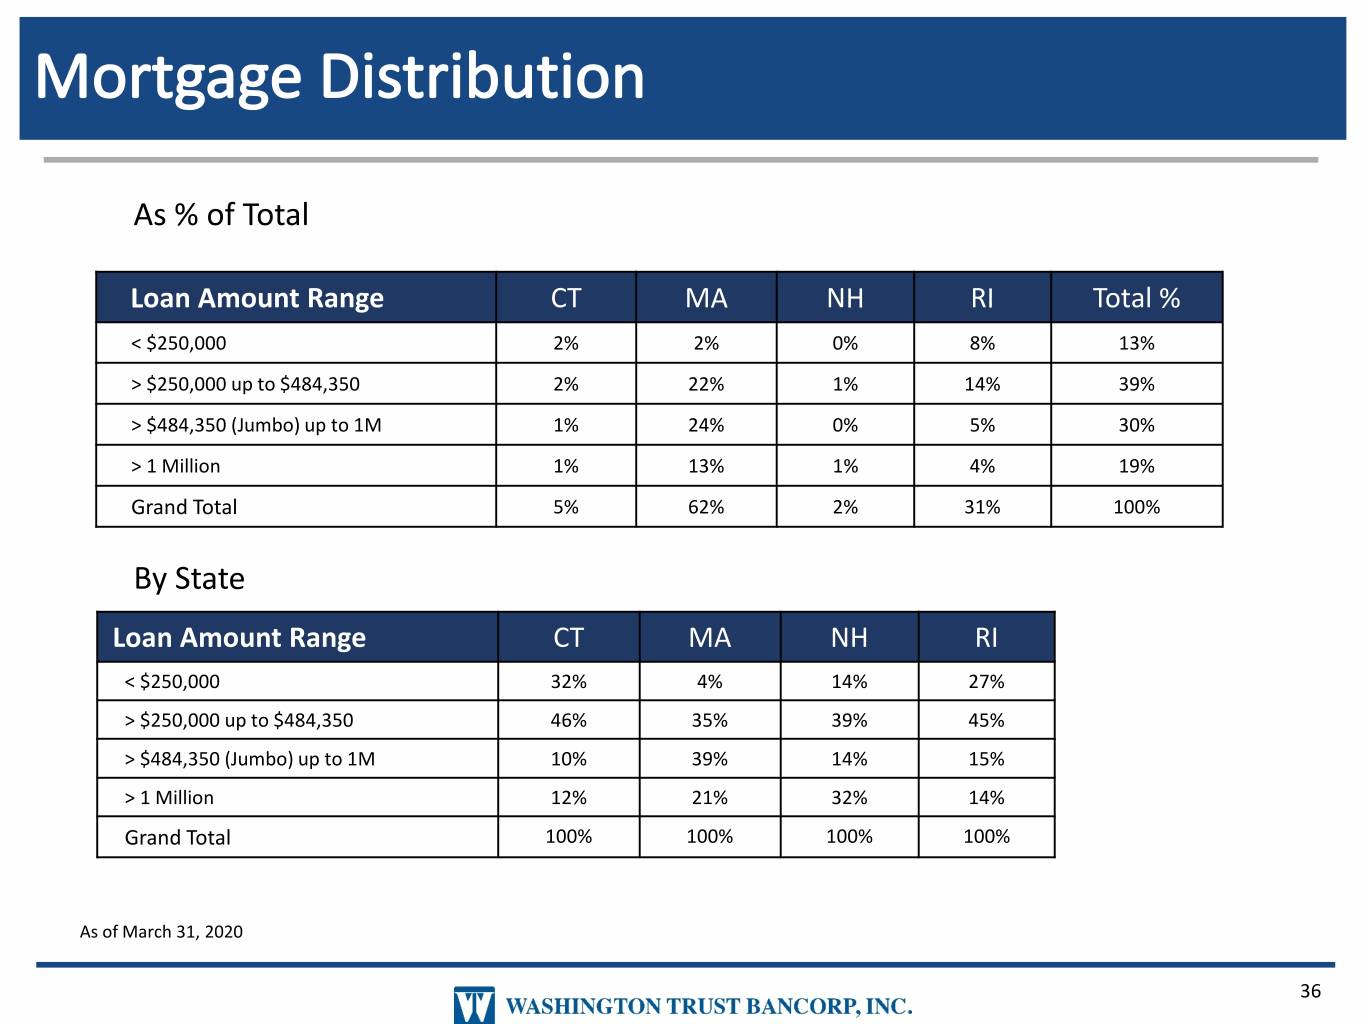
As % of Total Loan Amount Range CT MA NH RI Total % < $250,000 2% 2% 0% 8% 13% > $250,000 up to $484,350 2% 22% 1% 14% 39% > $484,350 (Jumbo) up to 1M 1% 24% 0% 5% 30% > 1 Million 1% 13% 1% 4% 19% Grand Total 5% 62% 2% 31% 100% By State Loan Amount Range CT MA NH RI < $250,000 32% 4% 14% 27% > $250,000 up to $484,350 46% 35% 39% 45% > $484,350 (Jumbo) up to 1M 10% 39% 14% 15% > 1 Million 12% 21% 32% 14% Grand Total 100% 100% 100% 100% As of March 31, 2020 36
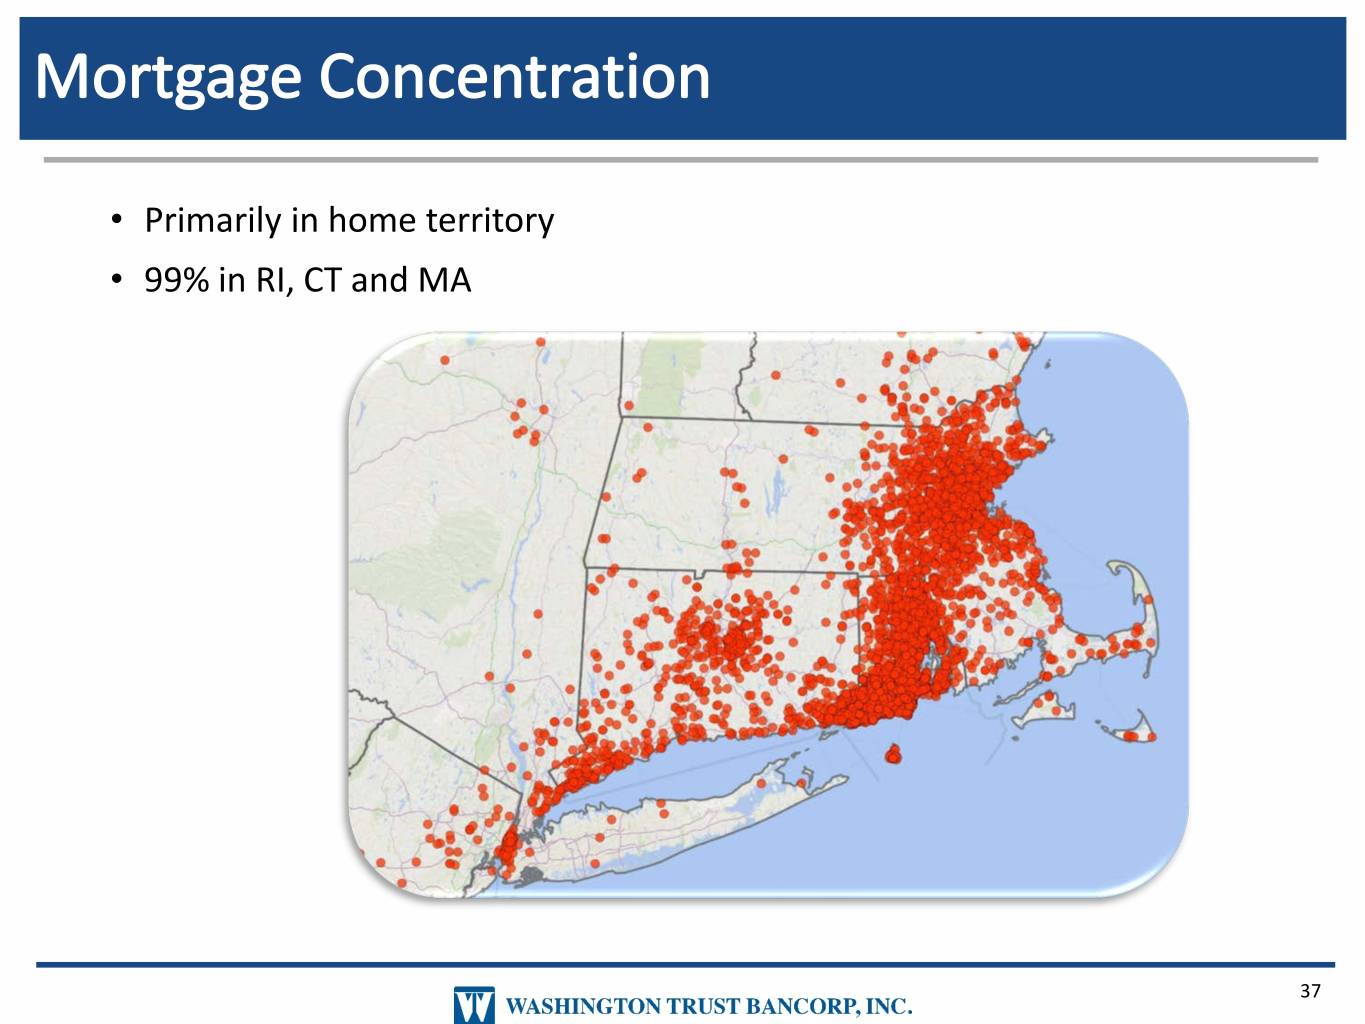
• Primarily in home territory • 99% in RI, CT and MA 37
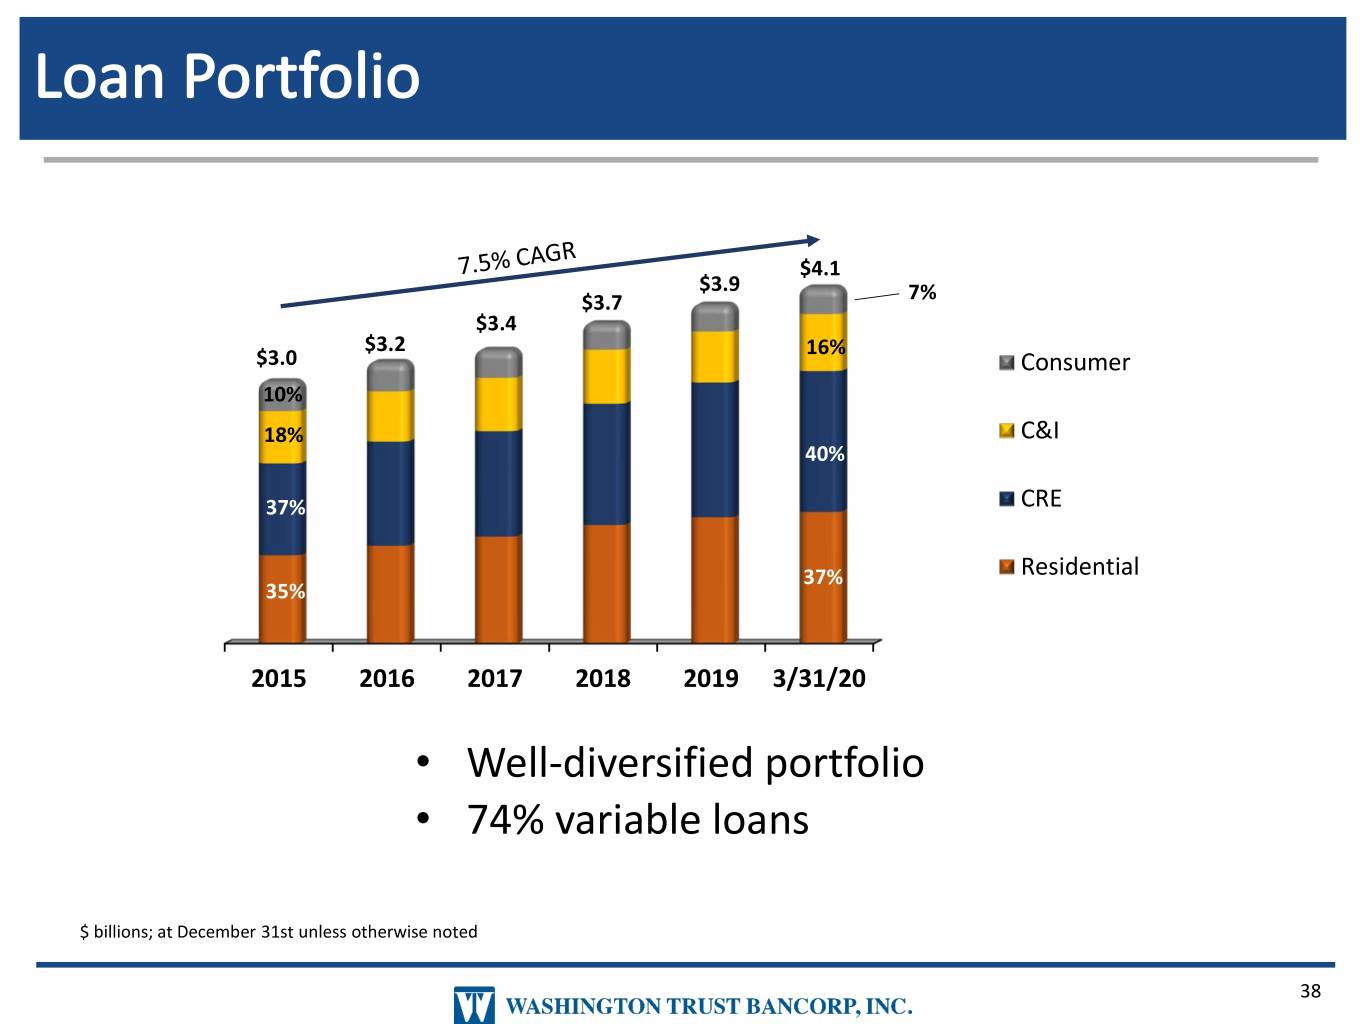
$4.1 $3.9 $3.7 7% $3.4 $3.2 16% $3.0 Consumer 10% 18% C&I 40% 37% CRE 37% Residential 35% 2015 2016 2017 2018 2019 3/31/20 • Well-diversified portfolio • 74% variable loans $ billions; at December 31st unless otherwise noted 38
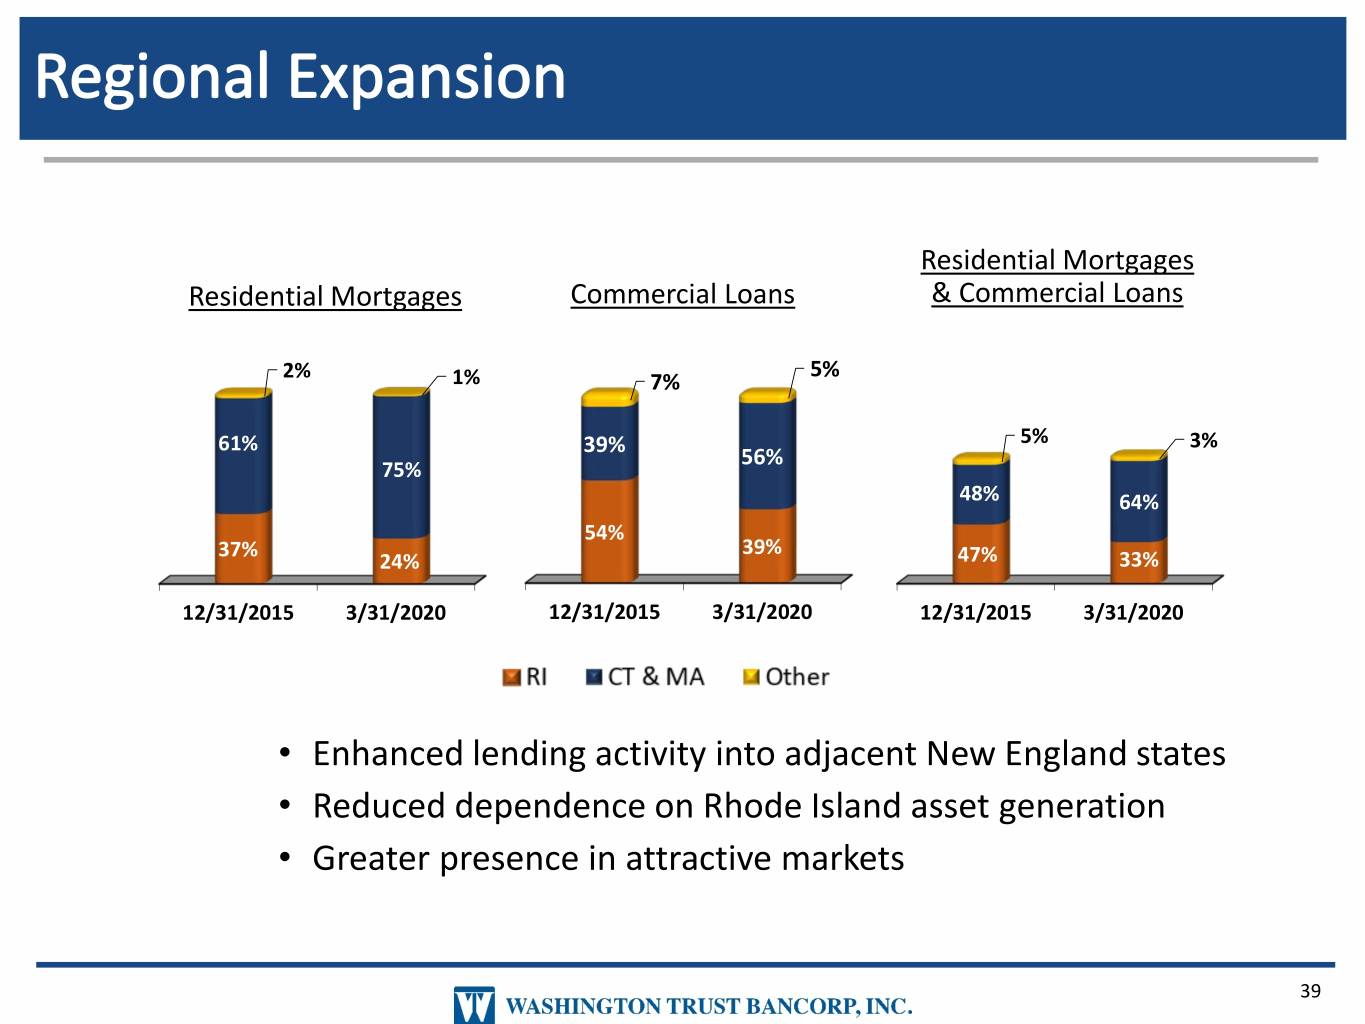
Residential Mortgages Residential Mortgages Commercial Loans & Commercial Loans 5% 2% 1% 7% 61% 39% 5% 3% 56% 75% 48% 64% 54% 37% 39% 24% 47% 33% 12/31/2015 3/31/2020 12/31/2015 3/31/2020 12/31/2015 3/31/2020 • Enhanced lending activity into adjacent New England states • Reduced dependence on Rhode Island asset generation • Greater presence in attractive markets 39
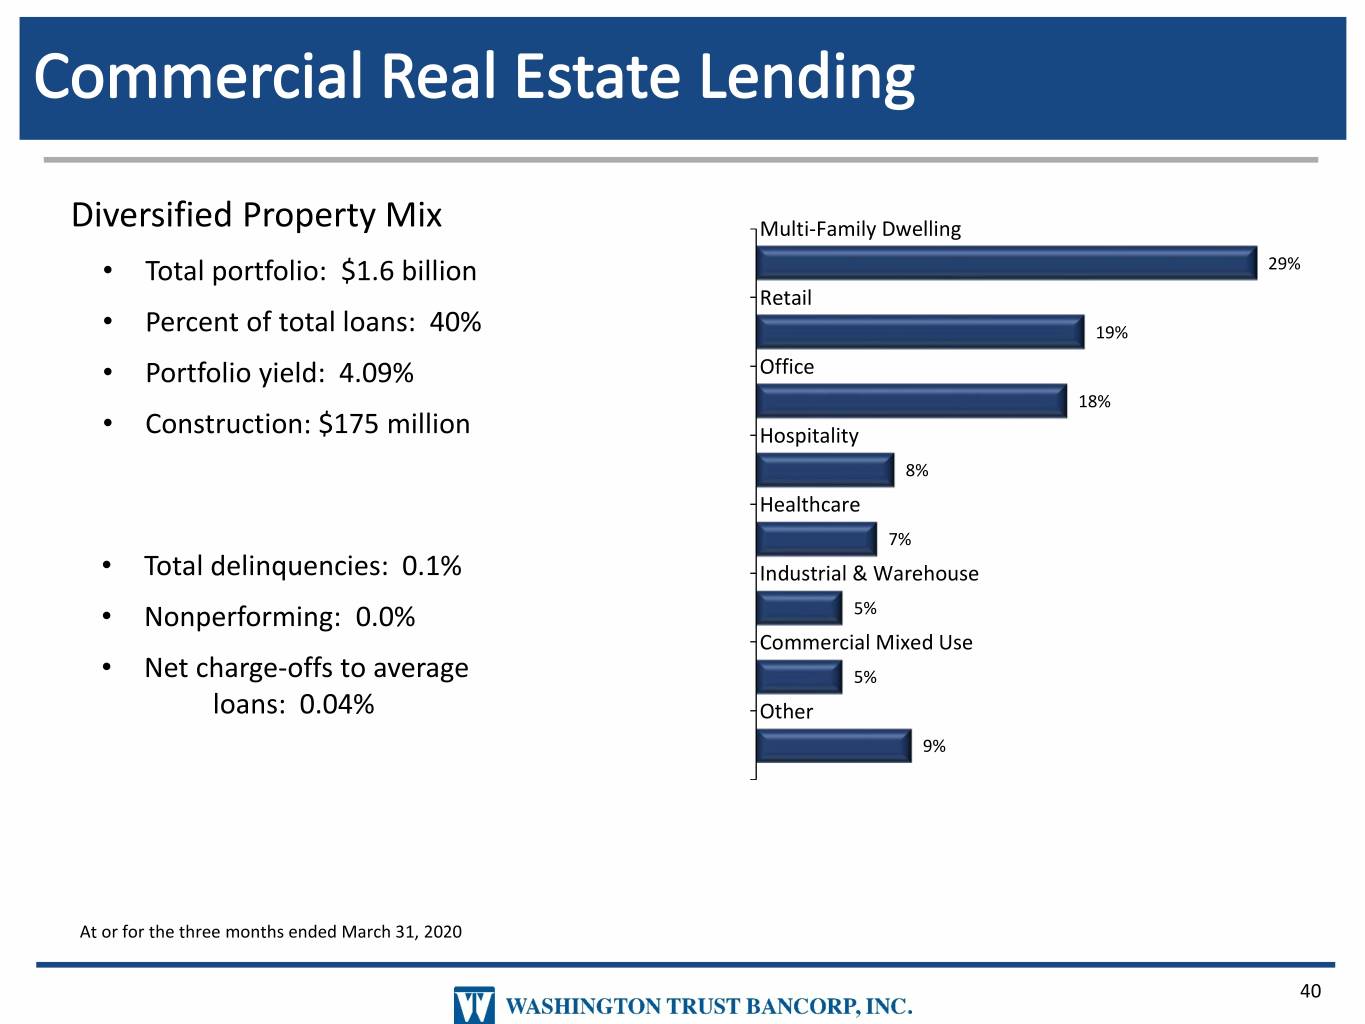
Diversified Property Mix Multi-Family Dwelling • Total portfolio: $1.6 billion 29% Retail • Percent of total loans: 40% 19% • Portfolio yield: 4.09% Office 18% • Construction: $175 million Hospitality 8% Healthcare 7% • Total delinquencies: 0.1% Industrial & Warehouse • Nonperforming: 0.0% 5% Commercial Mixed Use • Net charge-offs to average 5% loans: 0.04% Other 9% At or for the three months ended March 31, 2020 40
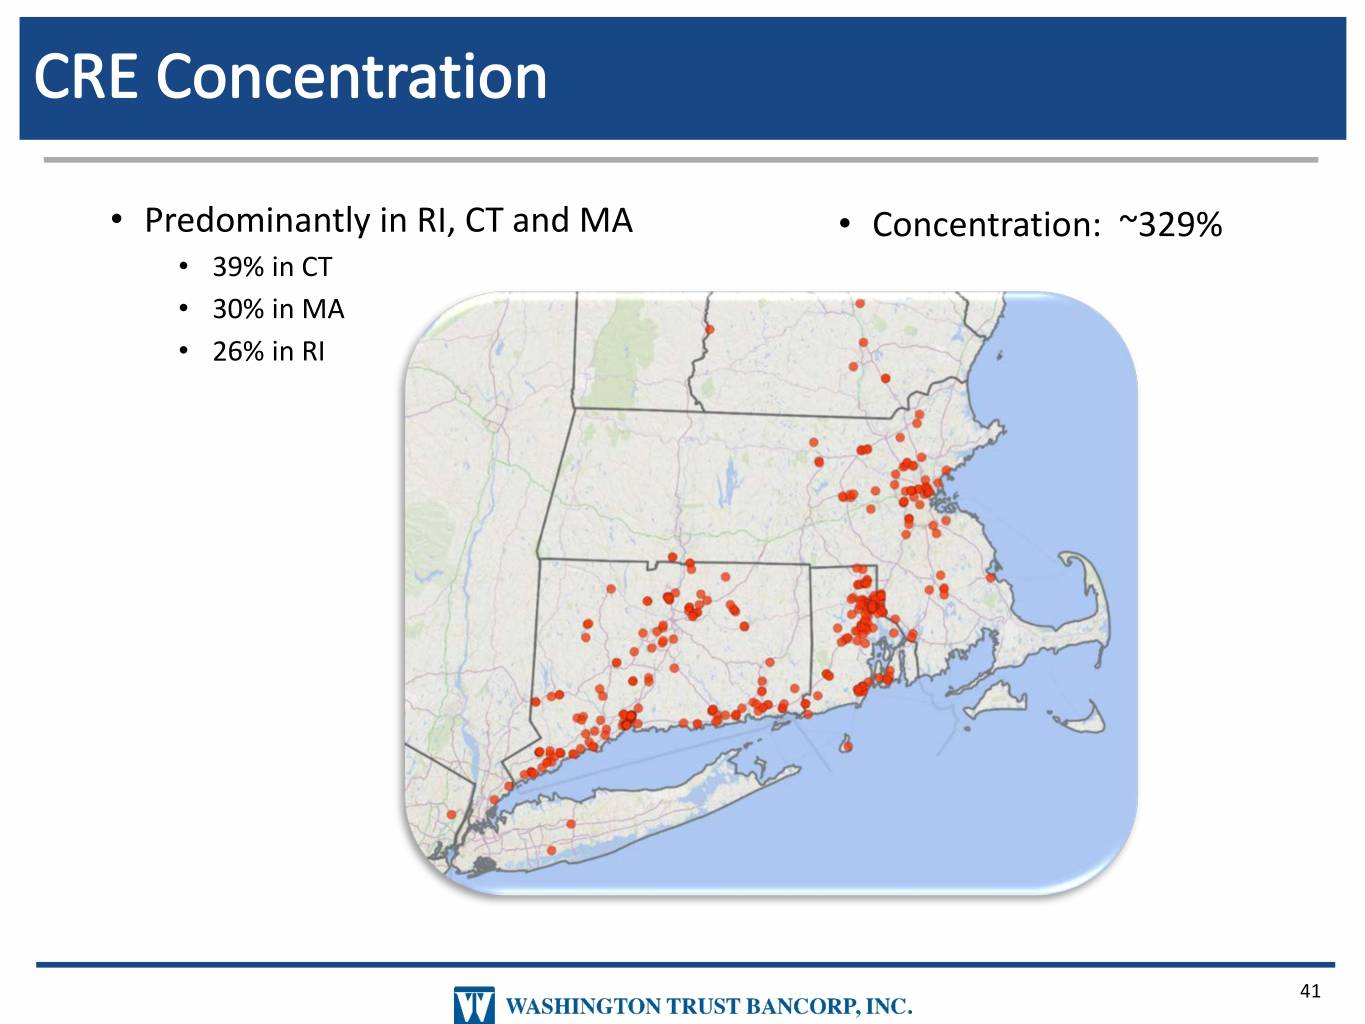
• Predominantly in RI, CT and MA • Concentration: ~329% • 39% in CT • 30% in MA • 26% in RI 41
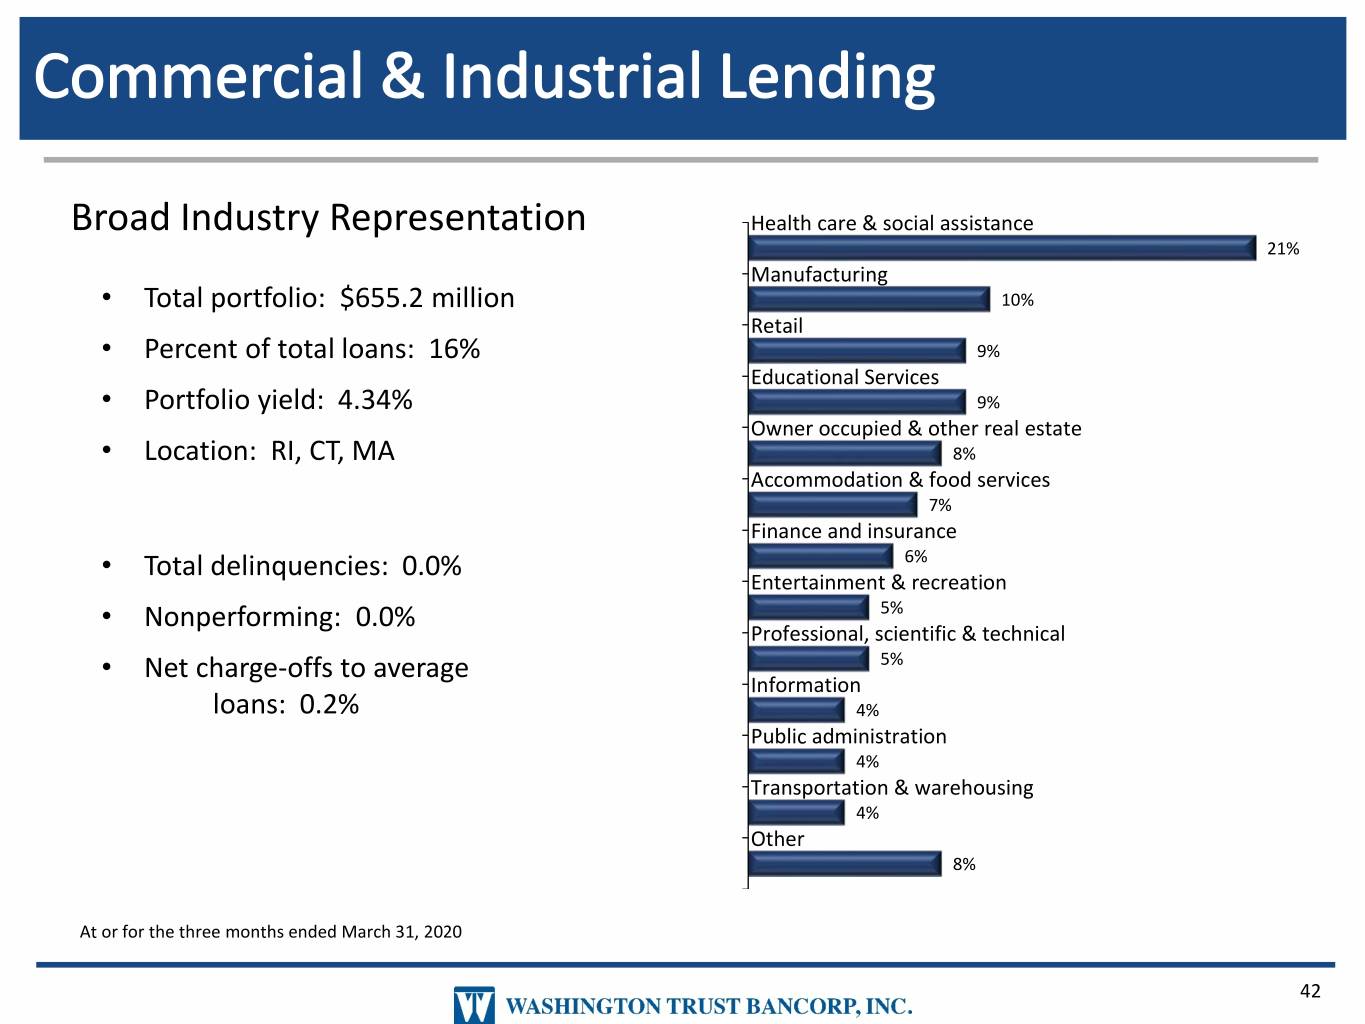
Broad Industry Representation Health care & social assistance 21% Manufacturing • Total portfolio: $655.2 million 10% Retail • Percent of total loans: 16% 9% Educational Services • Portfolio yield: 4.34% 9% Owner occupied & other real estate • Location: RI, CT, MA 8% Accommodation & food services 7% Finance and insurance • Total delinquencies: 0.0% 6% Entertainment & recreation • Nonperforming: 0.0% 5% Professional, scientific & technical • Net charge-offs to average 5% Information loans: 0.2% 4% Public administration 4% Transportation & warehousing 4% Other 8% At or for the three months ended March 31, 2020 42
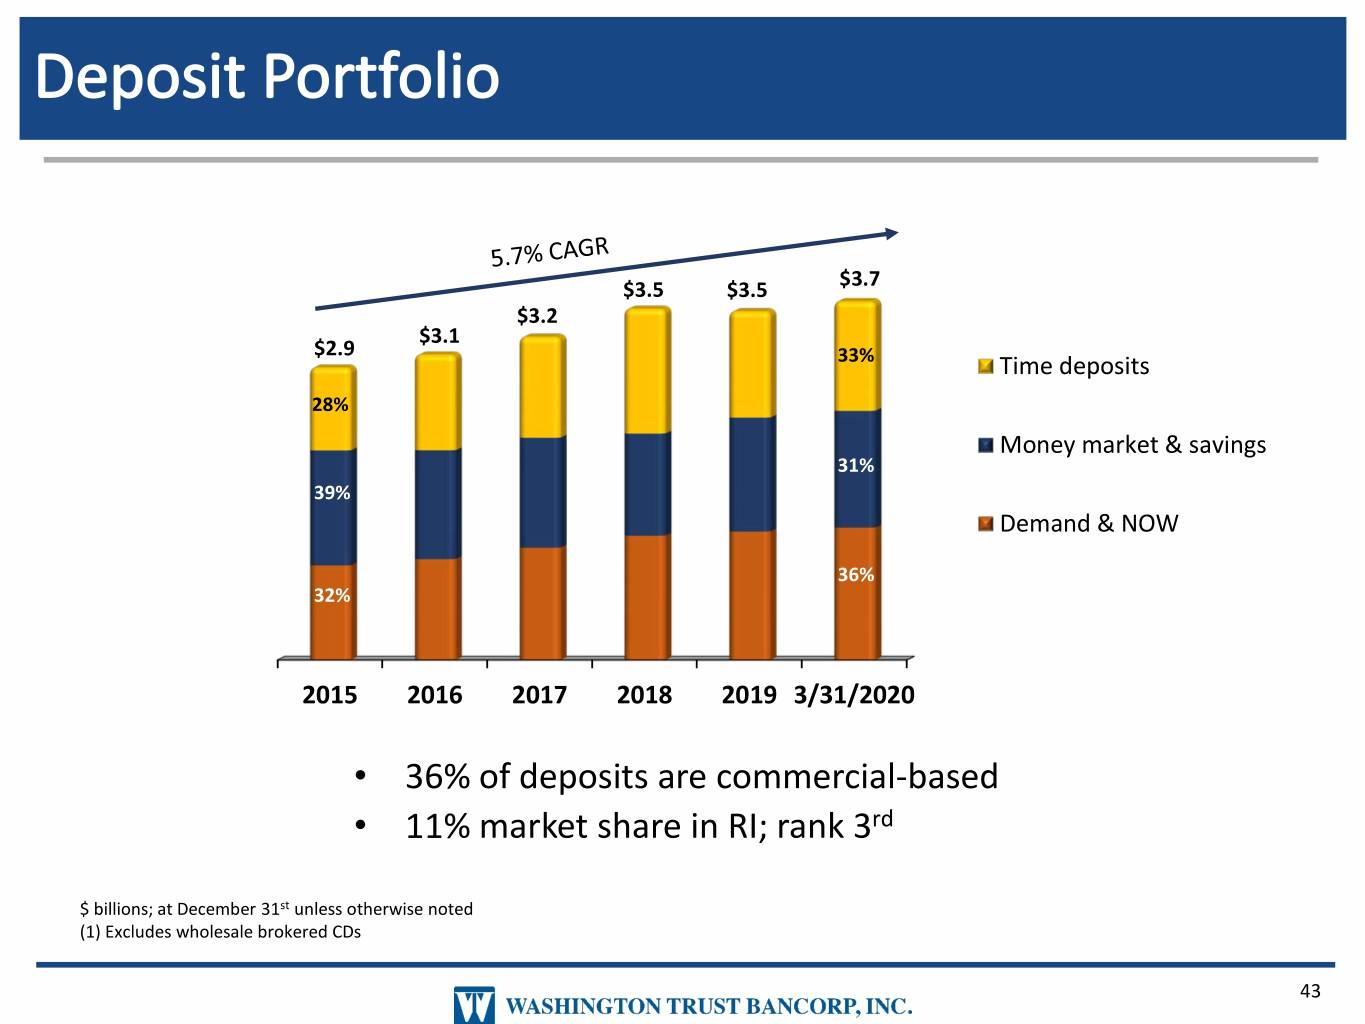
$3.5 $3.5 $3.7 $3.2 $3.1 $2.9 33% Time deposits 28% Money market & savings 31% 39% Demand & NOW 36% 32% 2015 2016 2017 2018 2019 3/31/2020 • 36% of deposits are commercial-based • 11% market share in RI; rank 3rd $ billions; at December 31st unless otherwise noted (1) Excludes wholesale brokered CDs 43
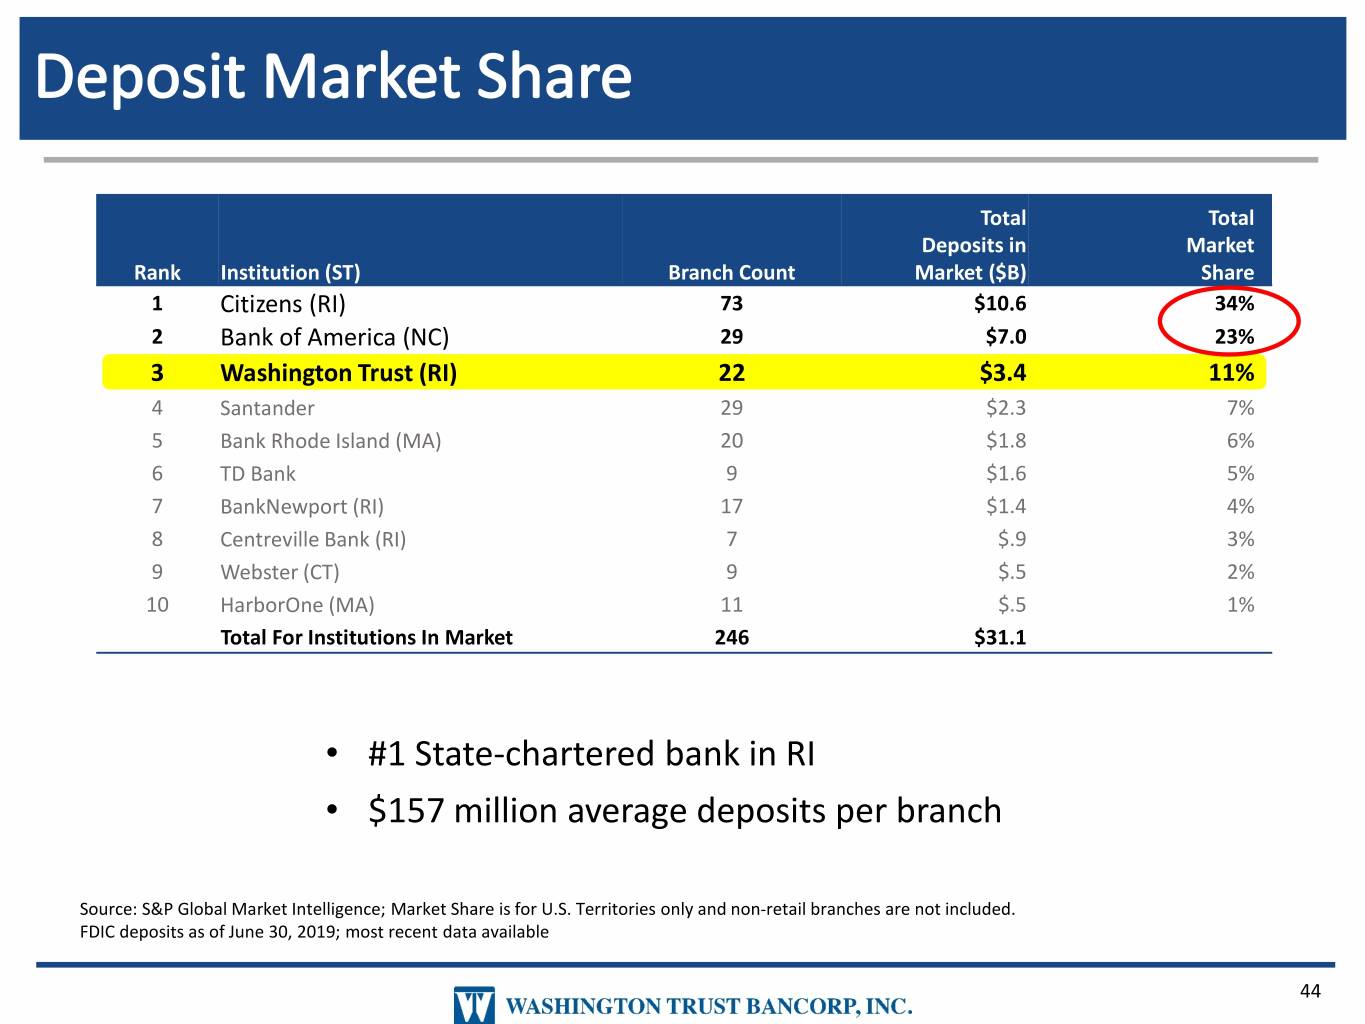
Total Total Deposits in Market Rank Institution (ST) Branch Count Market ($B) Share 1 Citizens (RI) 73 $10.6 34% 2 Bank of America (NC) 29 $7.0 23% 3 Washington Trust (RI) 22 $3.4 11% 4 Santander 29 $2.3 7% 5 Bank Rhode Island (MA) 20 $1.8 6% 6 TD Bank 9 $1.6 5% 7 BankNewport (RI) 17 $1.4 4% 8 Centreville Bank (RI) 7 $.9 3% 9 Webster (CT) 9 $.5 2% 10 HarborOne (MA) 11 $.5 1% Total For Institutions In Market 246 $31.1 • #1 State-chartered bank in RI • $157 million average deposits per branch Source: S&P Global Market Intelligence; Market Share is for U.S. Territories only and non-retail branches are not included. FDIC deposits as of June 30, 2019; most recent data available 44
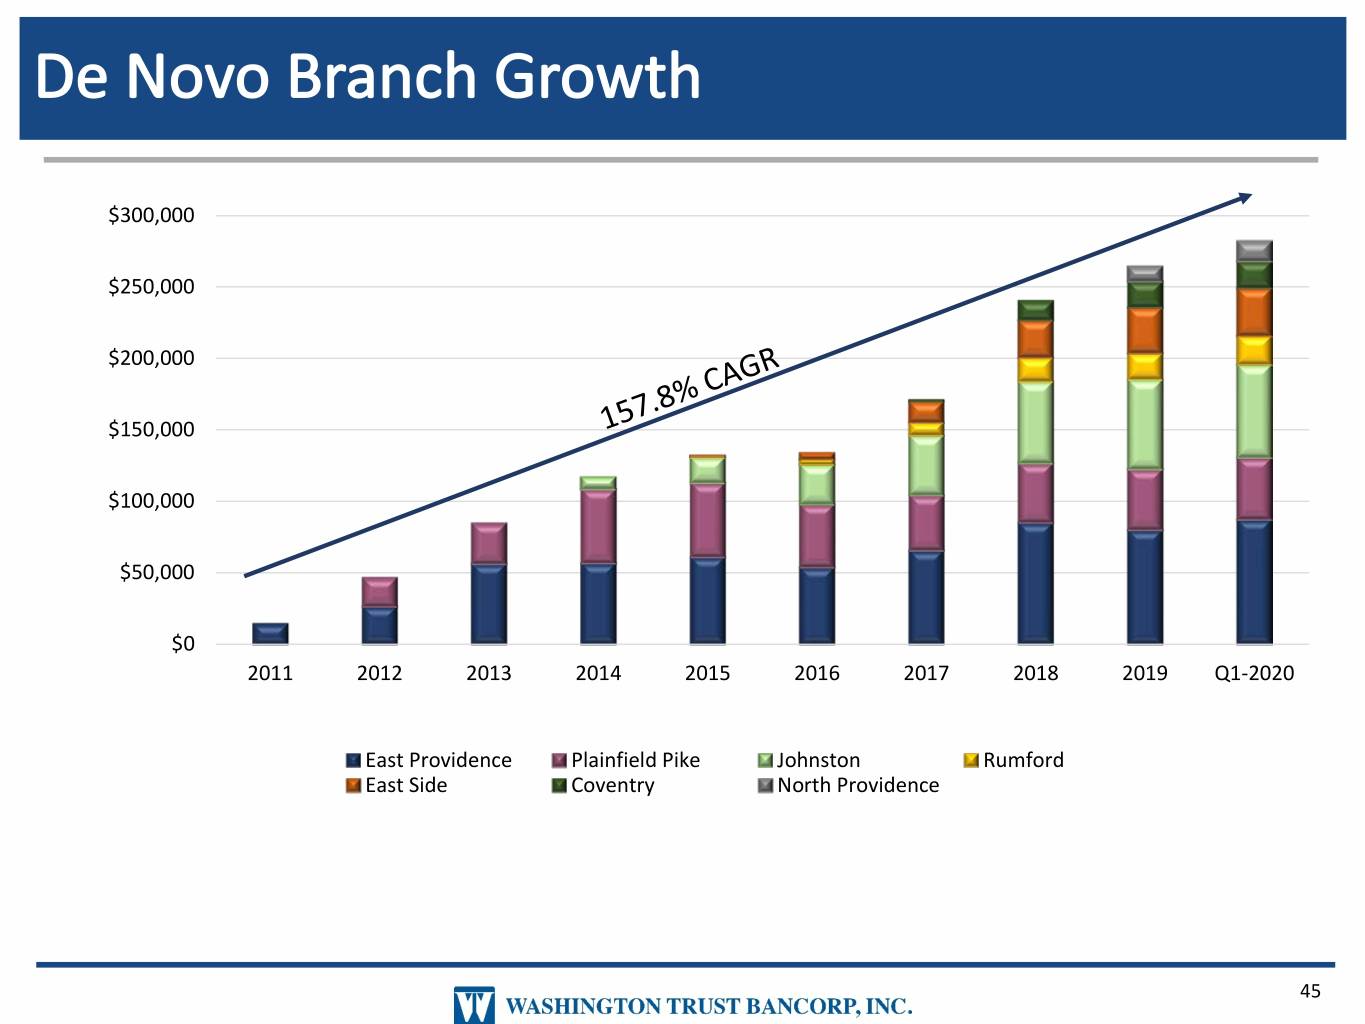
$300,000 $250,000 $200,000 $150,000 $100,000 $50,000 $0 2011 2012 2013 2014 2015 2016 2017 2018 2019 Q1-2020 East Providence Plainfield Pike Johnston Rumford East Side Coventry North Providence 45
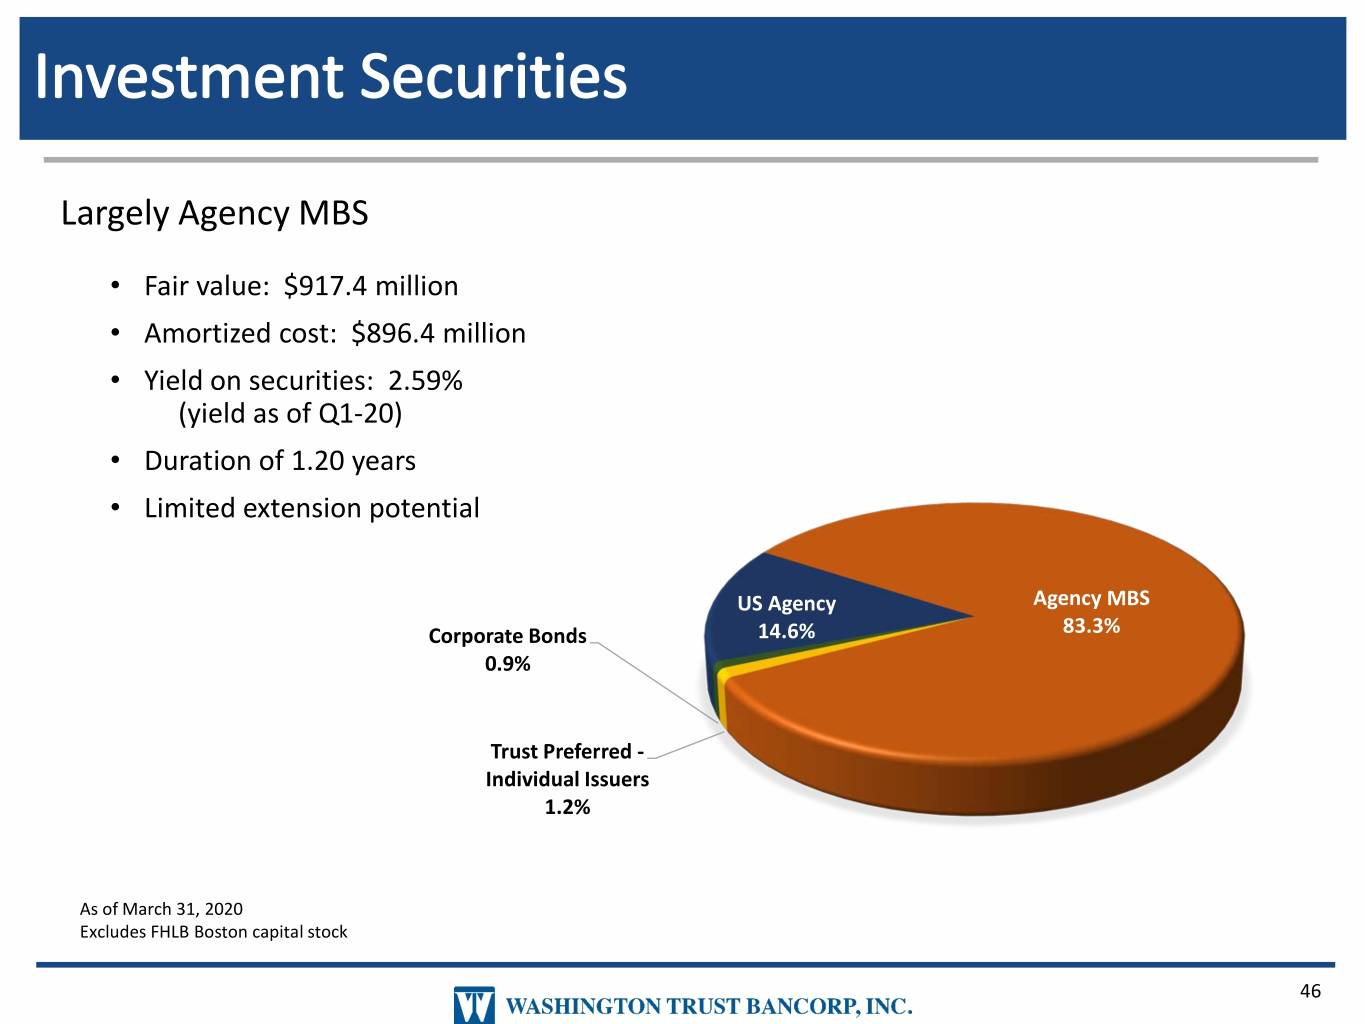
Largely Agency MBS • Fair value: $917.4 million • Amortized cost: $896.4 million • Yield on securities: 2.59% (yield as of Q1-20) • Duration of 1.20 years • Limited extension potential US Agency Agency MBS Corporate Bonds 14.6% 83.3% 0.9% Trust Preferred - Individual Issuers 1.2% As of March 31, 2020 Excludes FHLB Boston capital stock 46
CAPITAL MANAGEMENT 47
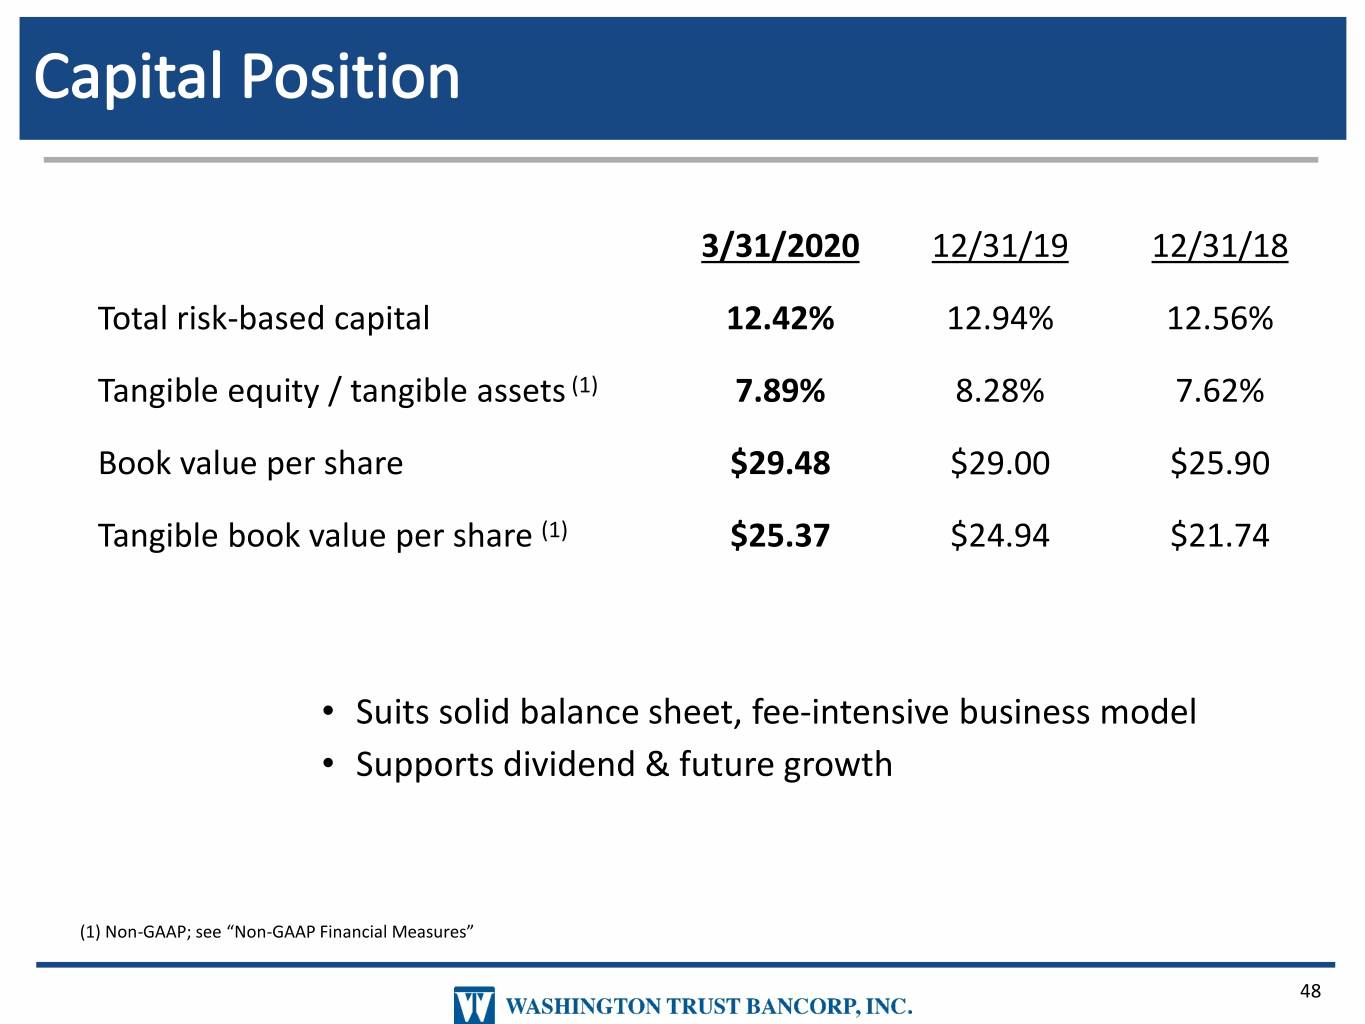
3/31/2020 12/31/19 12/31/18 Total risk-based capital 12.42% 12.94% 12.56% Tangible equity / tangible assets (1) 7.89% 8.28% 7.62% Book value per share $29.48 $29.00 $25.90 Tangible book value per share (1) $25.37 $24.94 $21.74 • Suits solid balance sheet, fee-intensive business model • Supports dividend & future growth (1) Non-GAAP; see “Non-GAAP Financial Measures” 48
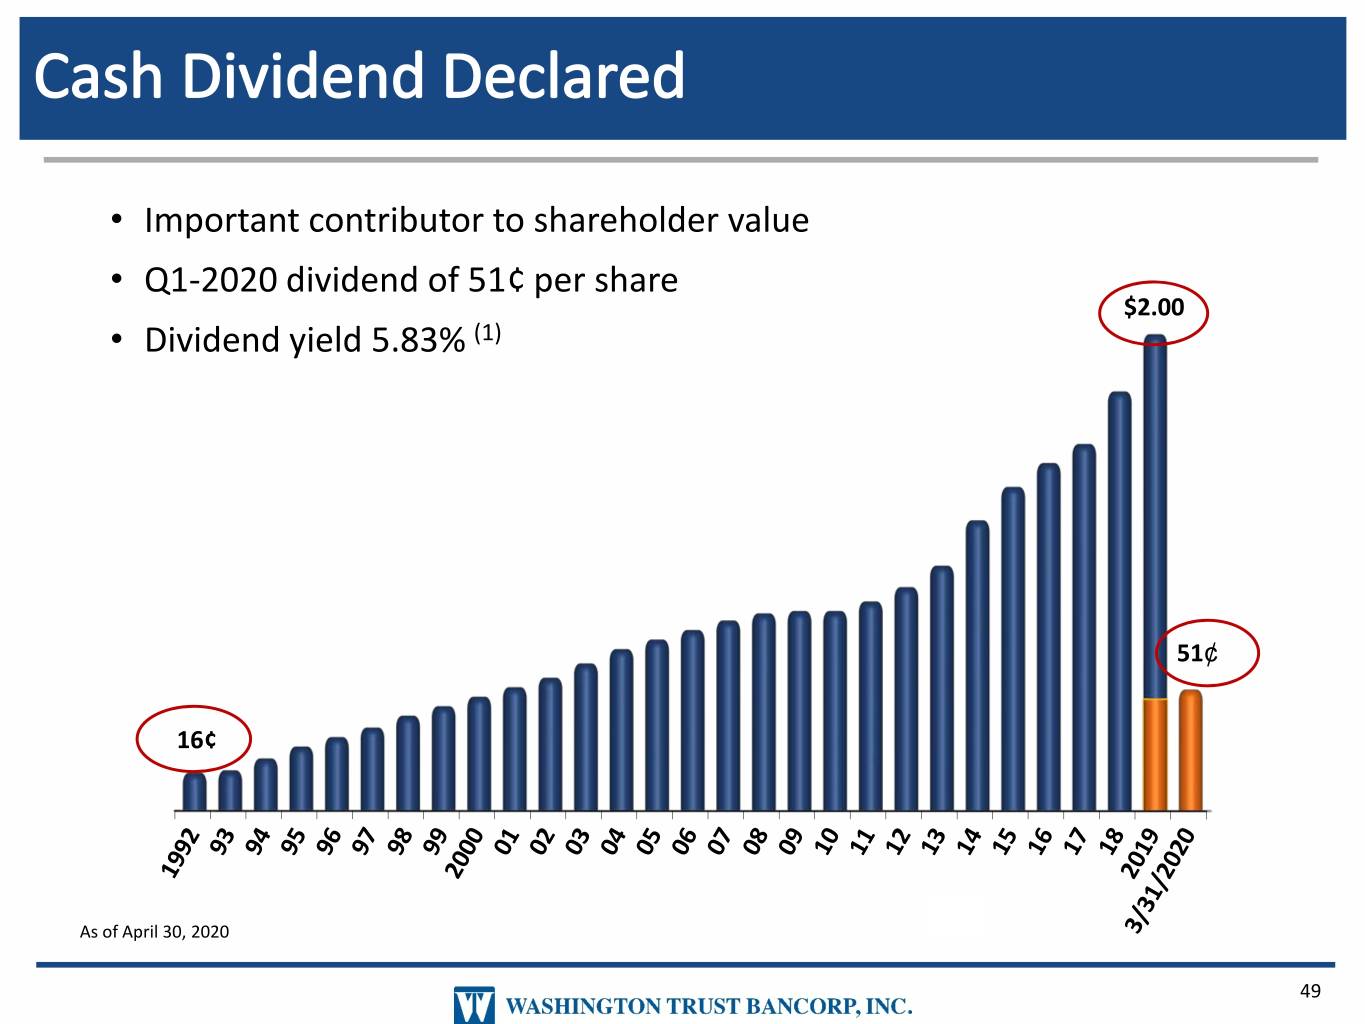
• Important contributor to shareholder value • Q1-2020 dividend of 51¢ per share $2.00 • Dividend yield 5.83% (1) 51¢ 16¢ As of April 30, 2020 49
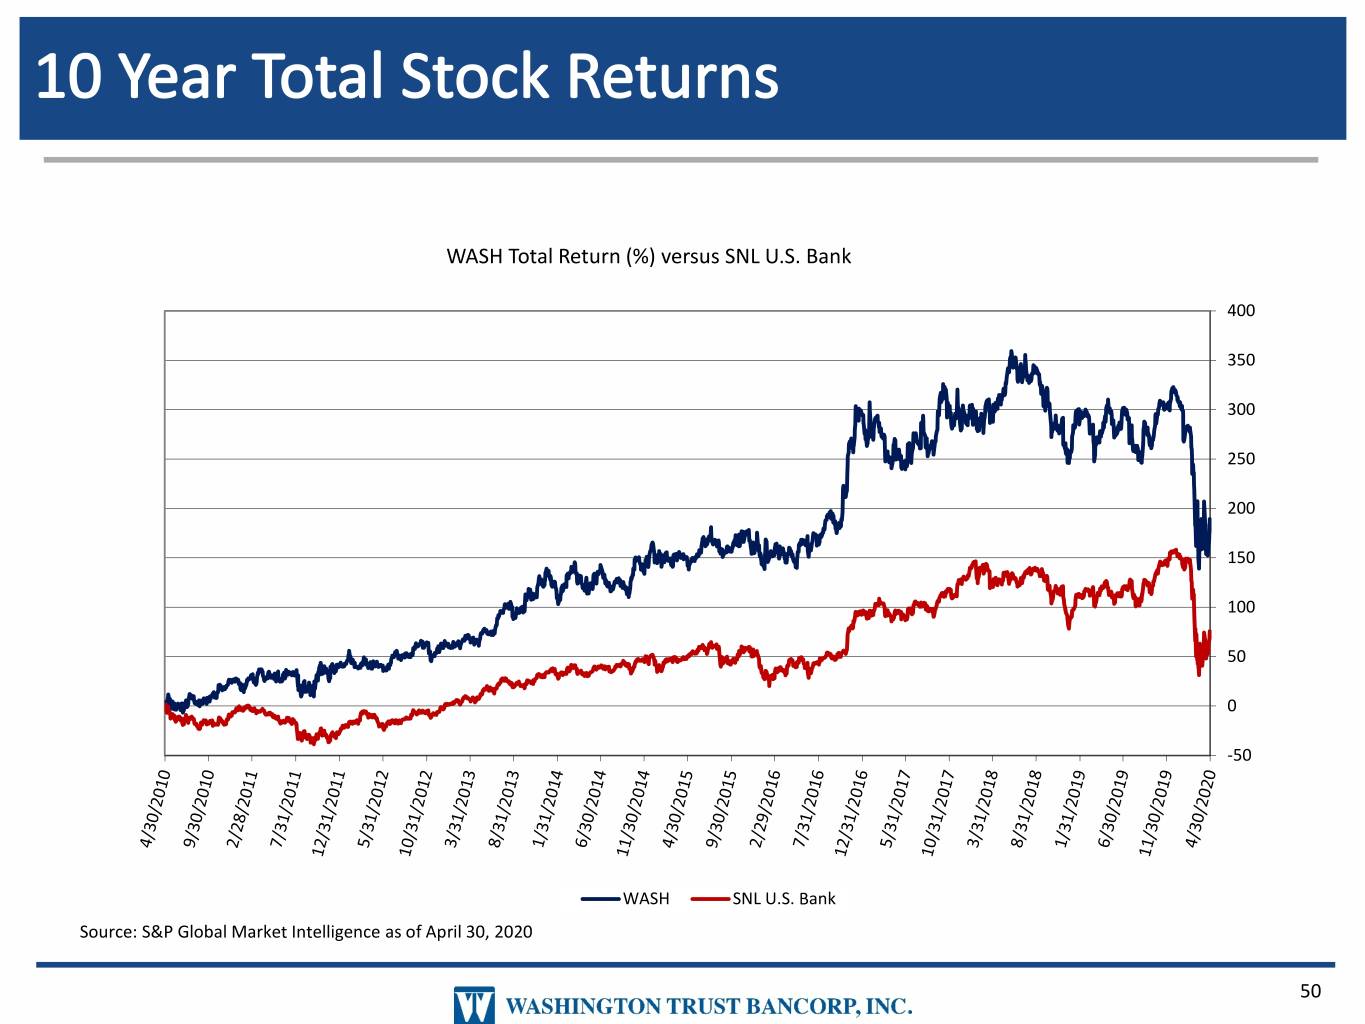
WASH Total Return (%) versus SNL U.S. Bank 400 350 300 250 200 150 100 50 0 -50 WASH SNL U.S. Bank Source: S&P Global Market Intelligence as of April 30, 2020 50
WHY WASHINGTON TRUST 51
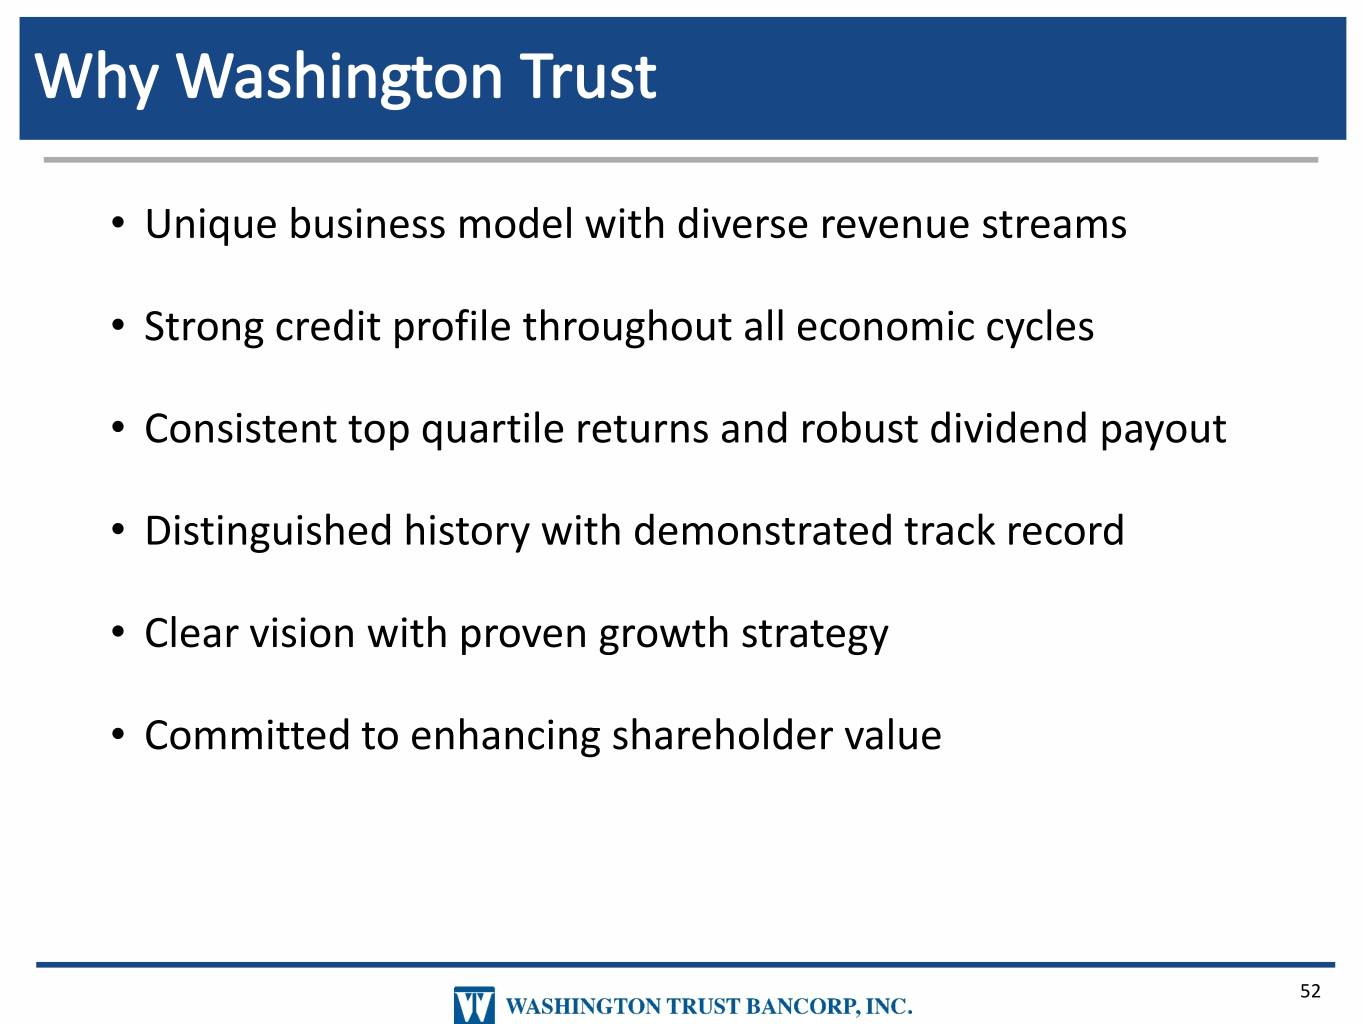
• Unique business model with diverse revenue streams • Strong credit profile throughout all economic cycles • Consistent top quartile returns and robust dividend payout • Distinguished history with demonstrated track record • Clear vision with proven growth strategy • Committed to enhancing shareholder value 52
SUPPLEMENTAL INFORMATION 53
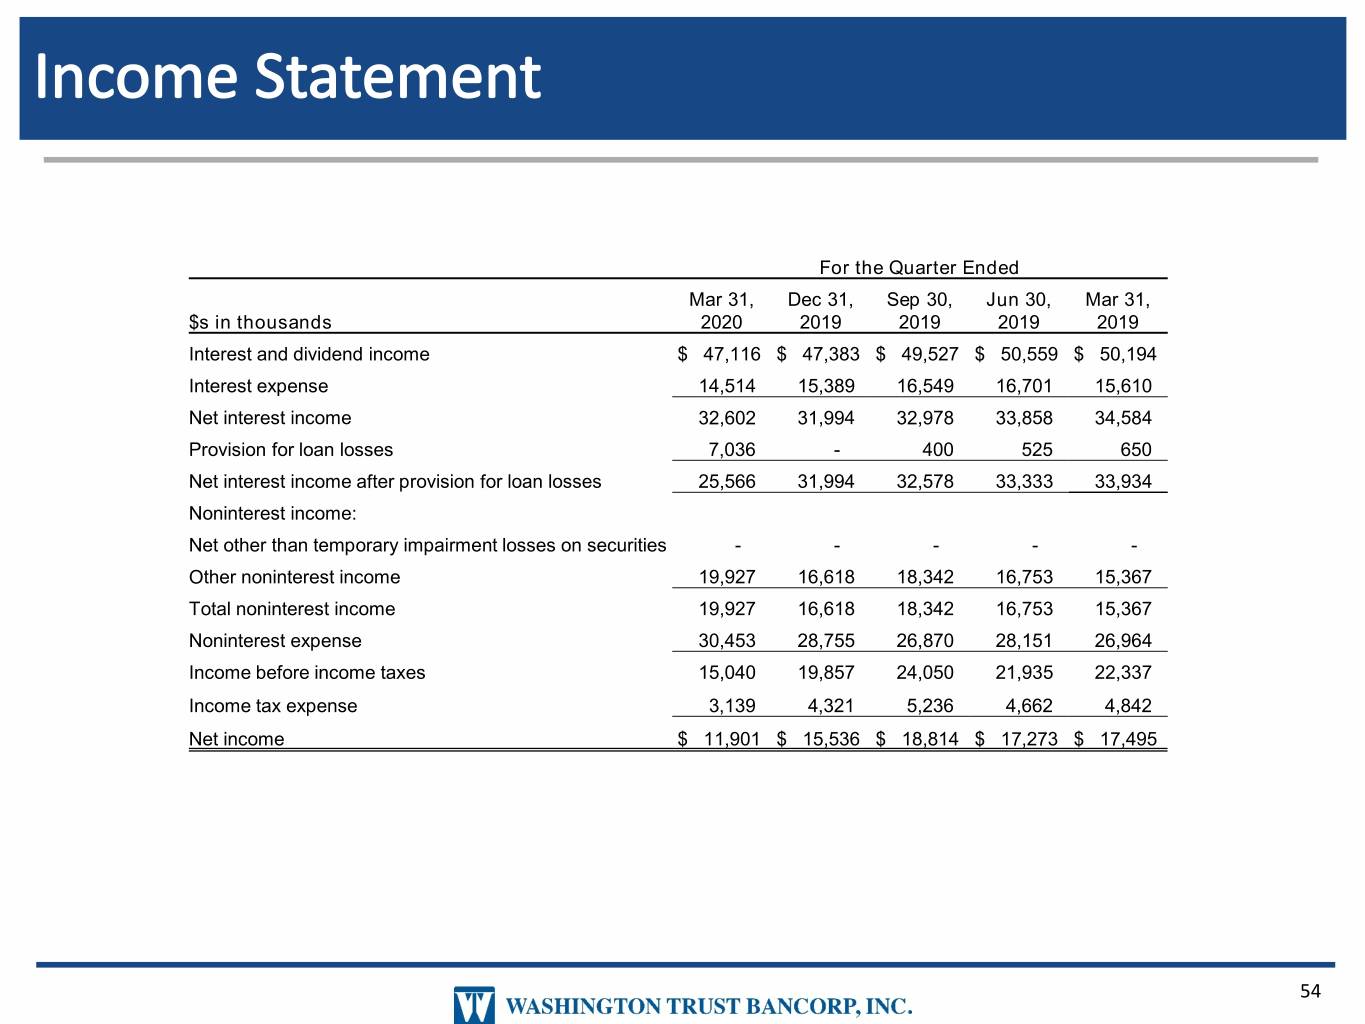
For the Quarter Ended Mar 31, Dec 31, Sep 30, Jun 30, Mar 31, $s in thousands 2020 2019 2019 2019 2019 Interest and dividend income $ 47,116 $ 47,383 $ 49,527 $ 50,559 $ 50,194 Interest expense 14,514 15,389 16,549 16,701 15,610 Net interest income 32,602 31,994 32,978 33,858 34,584 Provision for loan losses 7,036 - 400 525 650 Net interest income after provision for loan losses 25,566 31,994 32,578 33,333 33,934 Noninterest income: Net other than temporary impairment losses on securities - - - - - Other noninterest income 19,927 16,618 18,342 16,753 15,367 Total noninterest income 19,927 16,618 18,342 16,753 15,367 Noninterest expense 30,453 28,755 26,870 28,151 26,964 Income before income taxes 15,040 19,857 24,050 21,935 22,337 Income tax expense 3,139 4,321 5,236 4,662 4,842 Net income $ 11,901 $ 15,536 $ 18,814 $ 17,273 $ 17,495 54
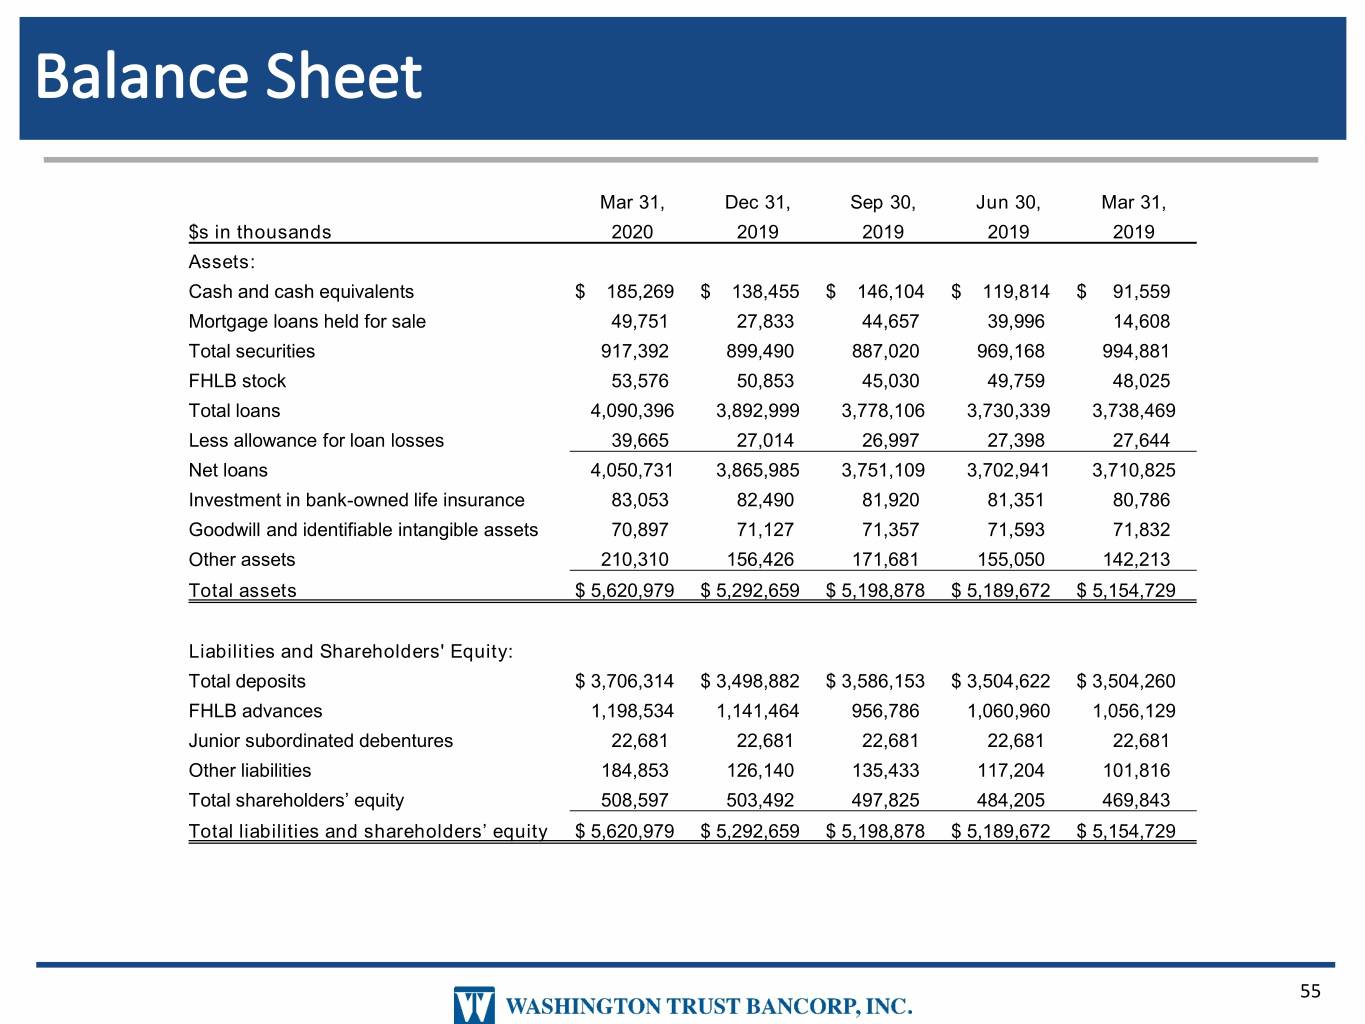
Mar 31, Dec 31, Sep 30, Jun 30, Mar 31, $s in thousands 2020 2019 2019 2019 2019 Assets: Cash and cash equivalents $ 185,269 $ 138,455 $ 146,104 $ 119,814 $ 91,559 Mortgage loans held for sale 49,751 27,833 44,657 39,996 14,608 Total securities 917,392 899,490 887,020 969,168 994,881 FHLB stock 53,576 50,853 45,030 49,759 48,025 Total loans 4,090,396 3,892,999 3,778,106 3,730,339 3,738,469 Less allowance for loan losses 39,665 27,014 26,997 27,398 27,644 Net loans 4,050,731 3,865,985 3,751,109 3,702,941 3,710,825 Investment in bank-owned life insurance 83,053 82,490 81,920 81,351 80,786 Goodwill and identifiable intangible assets 70,897 71,127 71,357 71,593 71,832 Other assets 210,310 156,426 171,681 155,050 142,213 Total assets $ 5,620,979 $ 5,292,659 $ 5,198,878 $ 5,189,672 $ 5,154,729 Liabilities and Shareholders' Equity: Total deposits $ 3,706,314 $ 3,498,882 $ 3,586,153 $ 3,504,622 $ 3,504,260 FHLB advances 1,198,534 1,141,464 956,786 1,060,960 1,056,129 Junior subordinated debentures 22,681 22,681 22,681 22,681 22,681 Other liabilities 184,853 126,140 135,433 117,204 101,816 Total shareholders’ equity 508,597 503,492 497,825 484,205 469,843 Total liabilities and shareholders’ equity $ 5,620,979 $ 5,292,659 $ 5,198,878 $ 5,189,672 $ 5,154,729 55
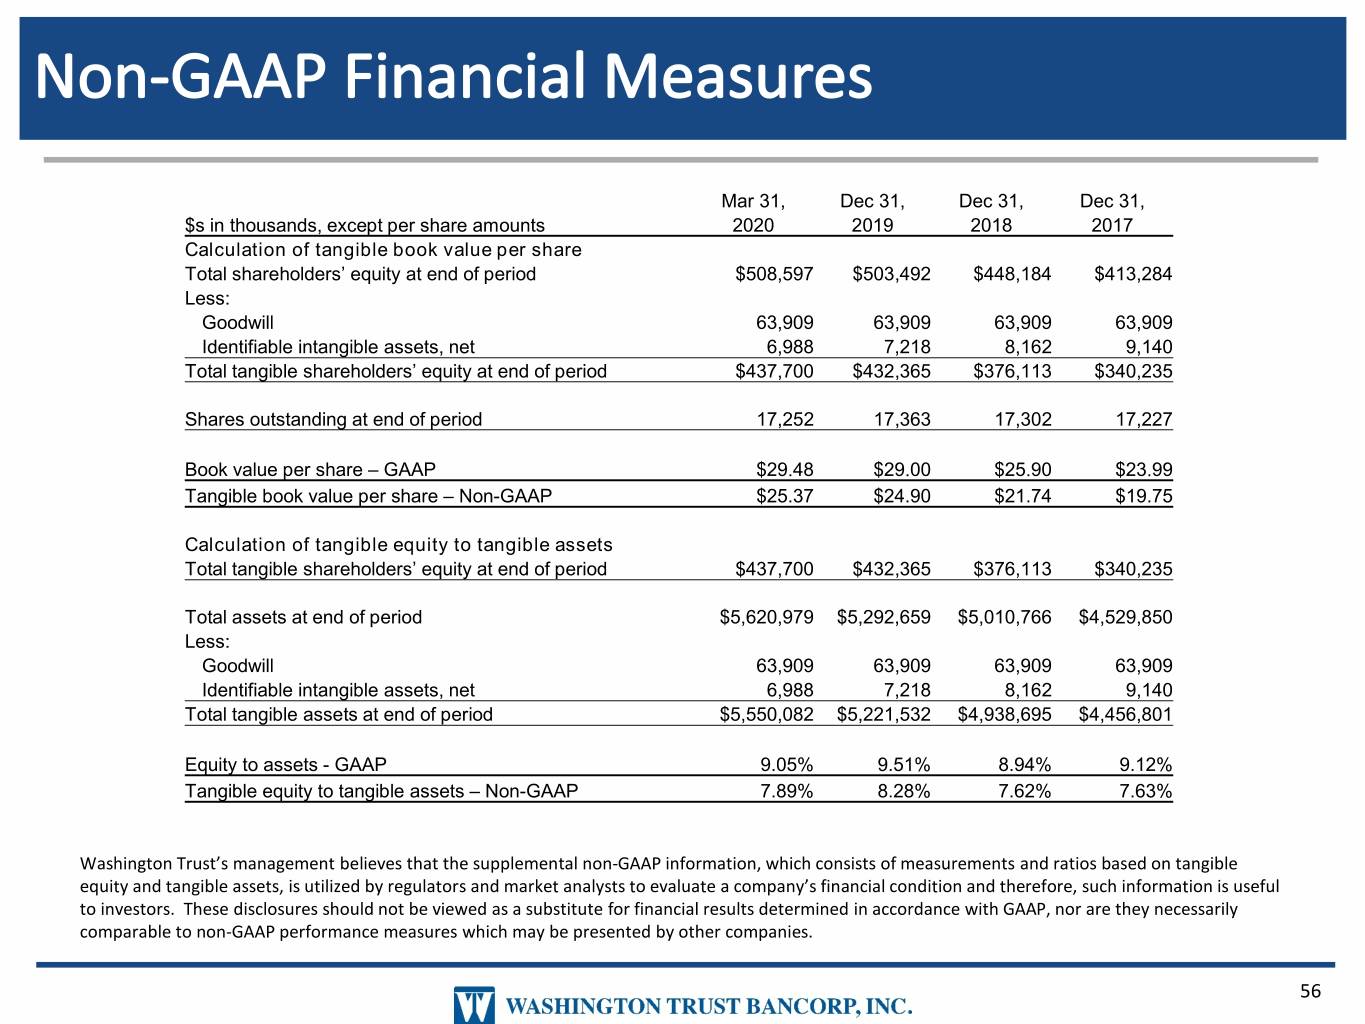
Mar 31, Dec 31, Dec 31, Dec 31, $s in thousands, except per share amounts 2020 2019 2018 2017 Calculation of tangible book value per share Total shareholders’ equity at end of period $508,597 $503,492 $448,184 $413,284 Less: Goodwill 63,909 63,909 63,909 63,909 Identifiable intangible assets, net 6,988 7,218 8,162 9,140 Total tangible shareholders’ equity at end of period $437,700 $432,365 $376,113 $340,235 Shares outstanding at end of period 17,252 17,363 17,302 17,227 Book value per share – GAAP $29.48 $29.00 $25.90 $23.99 Tangible book value per share – Non-GAAP $25.37 $24.90 $21.74 $19.75 Calculation of tangible equity to tangible assets Total tangible shareholders’ equity at end of period $437,700 $432,365 $376,113 $340,235 Total assets at end of period $5,620,979 $5,292,659 $5,010,766 $4,529,850 Less: Goodwill 63,909 63,909 63,909 63,909 Identifiable intangible assets, net 6,988 7,218 8,162 9,140 Total tangible assets at end of period $5,550,082 $5,221,532 $4,938,695 $4,456,801 Equity to assets - GAAP 9.05% 9.51% 8.94% 9.12% Tangible equity to tangible assets – Non-GAAP 7.89% 8.28% 7.62% 7.63% Washington Trust’s management believes that the supplemental non-GAAP information, which consists of measurements and ratios based on tangible equity and tangible assets, is utilized by regulators and market analysts to evaluate a company’s financial condition and therefore, such information is useful to investors. These disclosures should not be viewed as a substitute for financial results determined in accordance with GAAP, nor are they necessarily comparable to non-GAAP performance measures which may be presented by other companies. 56