
Investor Presentation March 2019 Exhibit 99.1

Forward-Looking Statements This presentation includes forward-looking statements within the meaning of Section 27A of the Securities Act of 1933, as amended, and Section 21E of the Securities Exchange Act of 1934, as amended, with respect to the financial condition, liquidity, results of operations, future performance, and business of CNB Financial Corporation. These forward-looking statements are intended to be covered by the safe harbor for “forward-looking statements” provided by the Private Securities Litigation Reform Act of 1995. Forward-looking statements are those that are not historical facts. Forward-looking statements include statements with respect to beliefs, plans, objectives, goals, expectations, anticipations, estimates, and intentions that are subject to significant risks and uncertainties, and are subject to change based on various factors (some of which are beyond our control). Forward-looking statements often include the words “believes,” “expects,” “anticipates,” “estimates,” “forecasts,” “intends,” “plans,” “targets,” “potentially,” “probably,” “projects,” “outlook,” or similar expressions, or future conditional verbs such as “may,” “will,” “should,” “would,” and “could.” Such known and unknown risks, uncertainties and other factors that could cause the actual results to differ materially from the statements include, but are not limited to: (i) changes in general business, industry or economic conditions, or competition; (ii) changes in any applicable law, rule, regulation, policy, guideline, or practice governing or affecting financial holding companies and their subsidiaries or with respect to tax or accounting principles or otherwise; (iii) adverse changes or conditions in capital and financial markets; (iv) changes in interest rates; (v) higher than expected costs or other difficulties related to integration of combined or merged businesses; (vi) the inability to realize expected cost savings or achieve other anticipated benefits in connection with business combinations and other acquisitions; (vii) changes in the quality or composition of our loan and investment portfolios; (viii) adequacy of loan loss reserves; (ix) increased competition; (x) loss of certain key officers; (xi) continued relationships with major customers; (xii) deposit attrition; (xiii) rapidly changing technology; (xiv) unanticipated regulatory or judicial proceedings and liabilities and other costs; (xv) changes in the cost of funds, demand for loan products, or demand for financial services; (xvi) other economic, competitive, governmental, or technological factors affecting our operations, markets, products, services, and prices; and (xvii) our success at managing the foregoing items. Such developments could have an adverse impact on our financial position and our results of operations. The forward-looking statements are based upon management’s beliefs and assumptions. Any forward-looking statement made herein speaks only as of the date of this presentation. Factors or events that could cause our actual results to differ may emerge from time to time, and it is not possible for us to predict all of them. We undertake no obligation to publicly update any forward-looking statement, whether as a result of new information, future developments, or otherwise, except as may be required by law.
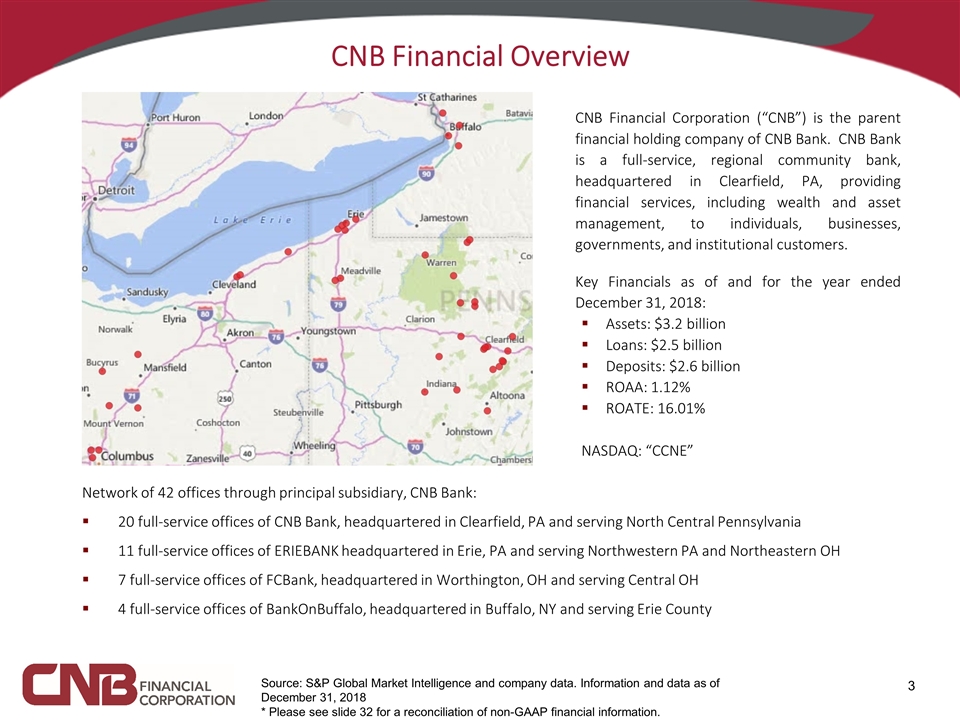
CNB Financial Overview Network of 42 offices through principal subsidiary, CNB Bank: 20 full-service offices of CNB Bank, headquartered in Clearfield, PA and serving North Central Pennsylvania 11 full-service offices of ERIEBANK headquartered in Erie, PA and serving Northwestern PA and Northeastern OH 7 full-service offices of FCBank, headquartered in Worthington, OH and serving Central OH 4 full-service offices of BankOnBuffalo, headquartered in Buffalo, NY and serving Erie County CNB Financial Corporation (“CNB”) is the parent financial holding company of CNB Bank. CNB Bank is a full-service, regional community bank, headquartered in Clearfield, PA, providing financial services, including wealth and asset management, to individuals, businesses, governments, and institutional customers. Key Financials as of and for the year ended December 31, 2018: Assets: $3.2 billion Loans: $2.5 billion Deposits: $2.6 billion ROAA: 1.12% ROATE: 16.01% NASDAQ: “CCNE” Source: S&P Global Market Intelligence and company data. Information and data as of December 31, 2018 * Please see slide 32 for a reconciliation of non-GAAP financial information.

CNB Financial Franchise Geography * Triangle shape denotes headquarters for CNB Bank divisions
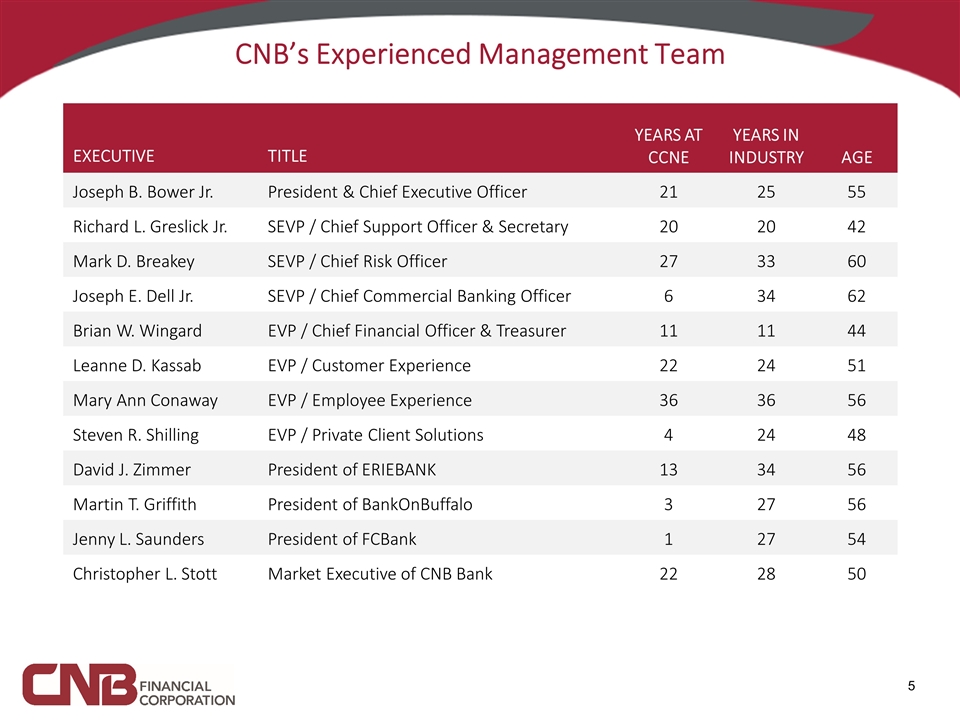
CNB’s Experienced Management Team YEARS AT CCNE YEARS IN INDUSTRY AGE EXECUTIVE TITLE Joseph B. Bower Jr. President & Chief Executive Officer 21 25 55 Richard L. Greslick Jr. SEVP / Chief Support Officer & Secretary 20 20 42 Mark D. Breakey SEVP / Chief Risk Officer 27 33 60 Joseph E. Dell Jr. SEVP / Chief Commercial Banking Officer 6 34 62 Brian W. Wingard EVP / Chief Financial Officer & Treasurer 11 11 44 Leanne D. Kassab EVP / Customer Experience 22 24 51 Mary Ann Conaway EVP / Employee Experience 36 36 56 Steven R. Shilling EVP / Private Client Solutions 4 24 48 David J. Zimmer President of ERIEBANK 13 34 56 Martin T. Griffith President of BankOnBuffalo 3 27 56 Jenny L. Saunders President of FCBank 1 27 54 Christopher L. Stott Market Executive of CNB Bank 22 28 50

Our Vision Look for a way to say yes to our customers, co-workers and communities, every time.

Strategic Principles
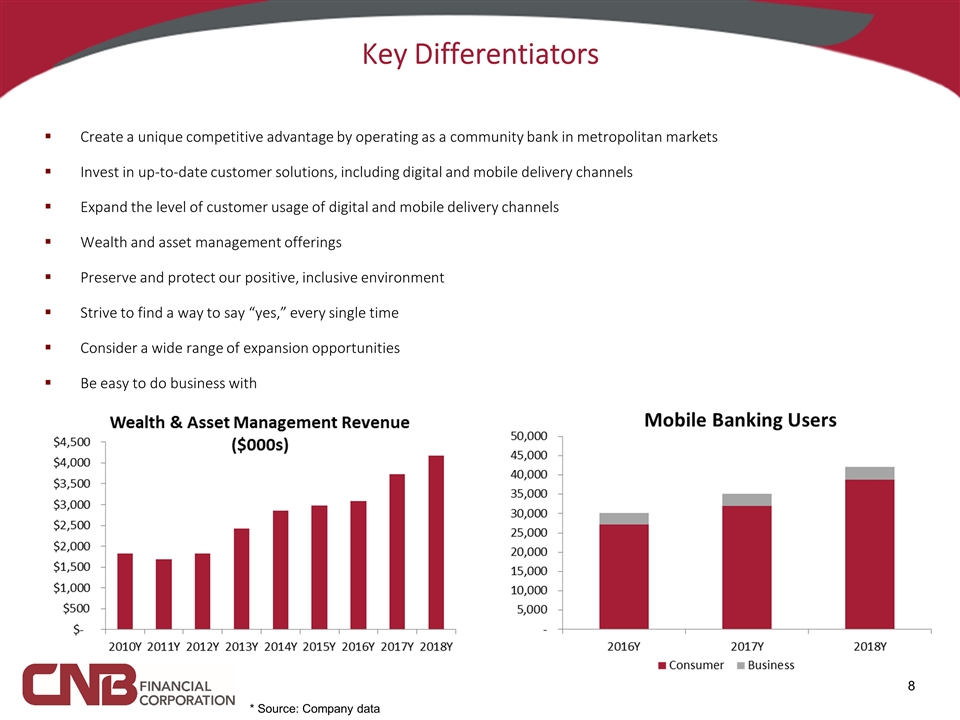
Key Differentiators Create a unique competitive advantage by operating as a community bank in metropolitan markets Invest in up-to-date customer solutions, including digital and mobile delivery channels Expand the level of customer usage of digital and mobile delivery channels Wealth and asset management offerings Preserve and protect our positive, inclusive environment Strive to find a way to say “yes,” every single time Consider a wide range of expansion opportunities Be easy to do business with * Source: Company data
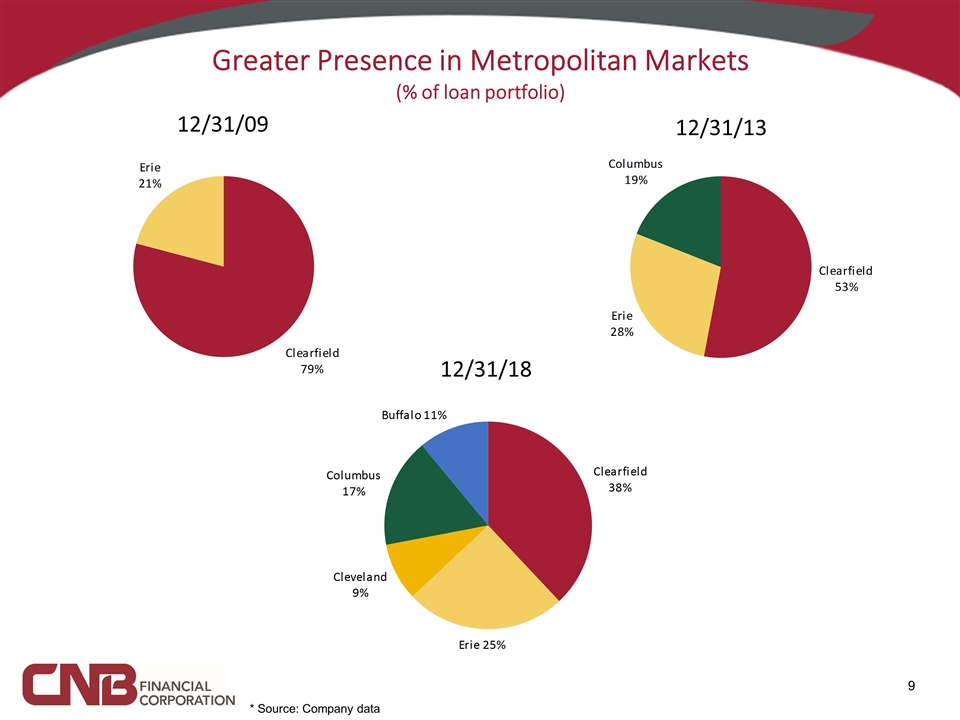
Greater Presence in Metropolitan Markets (% of loan portfolio) 12/31/09 12/31/18 * Source: Company data 12/31/13

Loan & Deposit Composition Source: Company data as of December 31, 2018.

Deposit Market Share Source: S&P Global Market Intelligence. Deposit market share as of June 30, 2018.

At December 31, 2018: 20 branches $929 million in loans and $1.0 billion in deposits; organic loan growth of $89 million, or 10.6%, since December 31, 2017; organic deposit growth of $74 million, or 7.8%, since December 31, 2017 Today there are 14 banks headquartered in the 8 counties within CNB Bank’s market; twenty years ago, there were 24 County National Bank of Clearfield was established in 1865 and rebranded as CNB Bank in 2006

Source: Company data as of December 31, 2018.

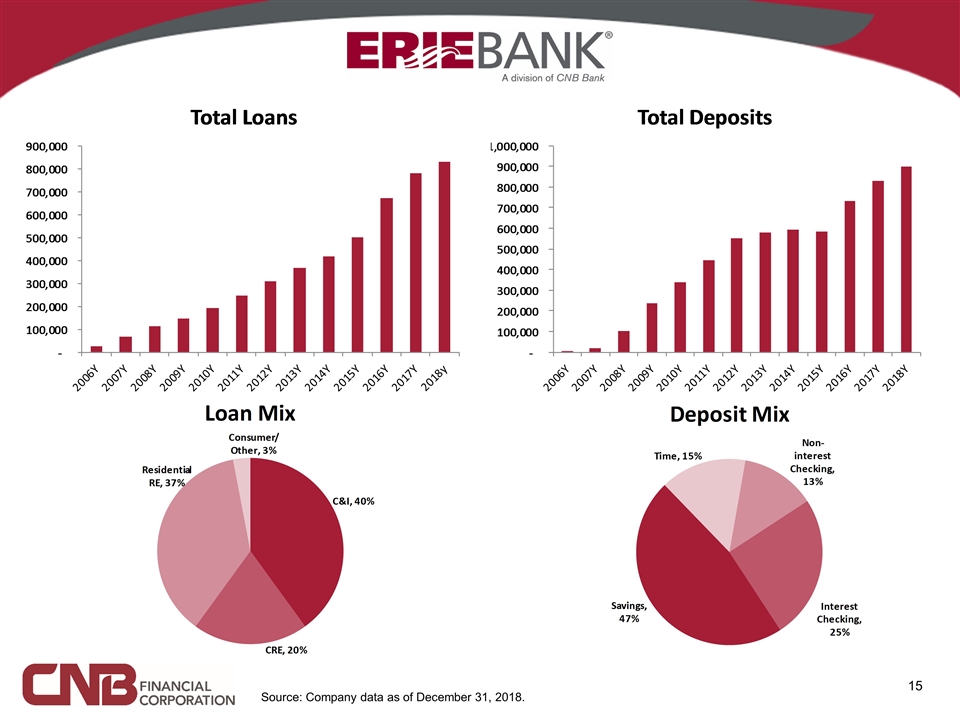
At December 31, 2018: Eleven branches $830 million in loans and $897 million in deposits; organic loan growth of $52 million, or 6.7%, since December 31, 2017; organic deposit growth of $69 million, or 8.3%, since December 31, 2017 Entered the greater Cleveland market with the acquisition of Lake National Bank in July 2016, which allows for continued organic growth In October 2018, hired an experienced market executive to focus on the Cleveland area Northeast Ohio is a logical market extension of ERIEBANK franchise Demographically attractive market with significant organic growth potential; One of eight community banks in a market dominated by larger institutions; and Known for mid-sized commercial and industrial businesses, which is a core strength of CNB. ERIEBANK, a division of CNB Bank, was created de novo in August 2005
Source: Company data as of December 31, 2018.

Cleveland, OH Market Sources: city.cleveland.oh.us, rethinkcleveland.org, largestemployers.org Cleveland, the second largest city in Ohio, is a major manufacturing and commercial center, ranks as one of the chief ports on the Great Lakes and functions as a collecting point for highway and railway traffic from the Midwest Cleveland is reinventing itself into a 21st century city while leveraging billions of public and private investment into a new and changing economy with economic growth in key sectors, including health care, education, research, financial services and manufacturing ERIEBANK appointed Wesley Gillepsie as Regional President to lead its expansion into the metro Cleveland market in October 2018. Mr. Gillespie will serve as a hands-on decision maker and advisor, working with area business owners and executives seeking timely, and in many cases, same-day decisions for their capital and operating fund needs. Mr. Gillespie has over 25 years of banking experience, all in the greater Cleveland area. Major Employers
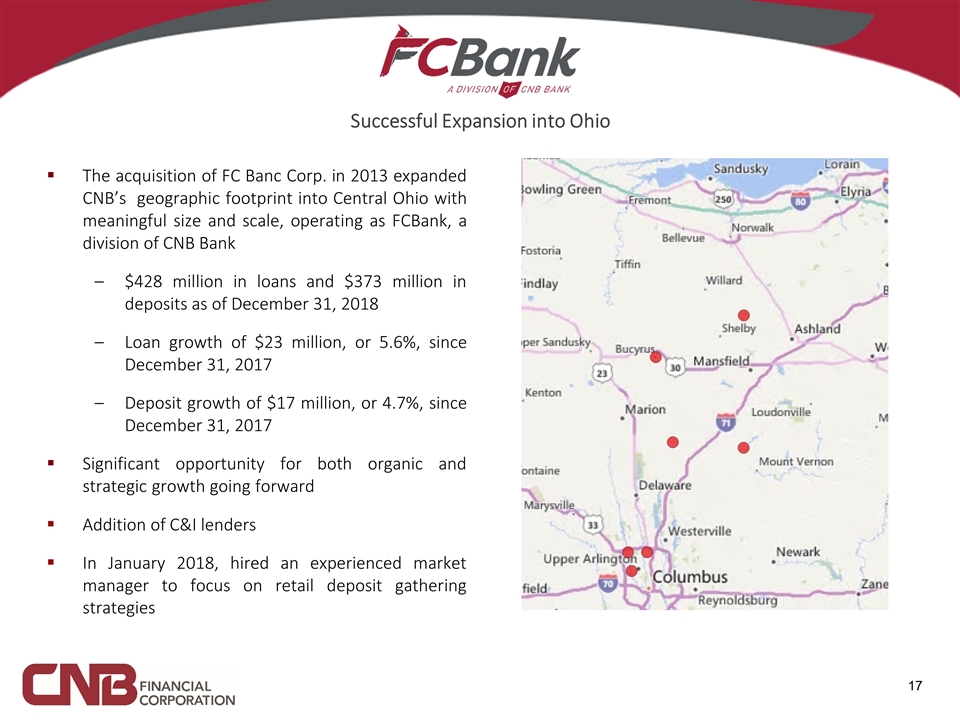
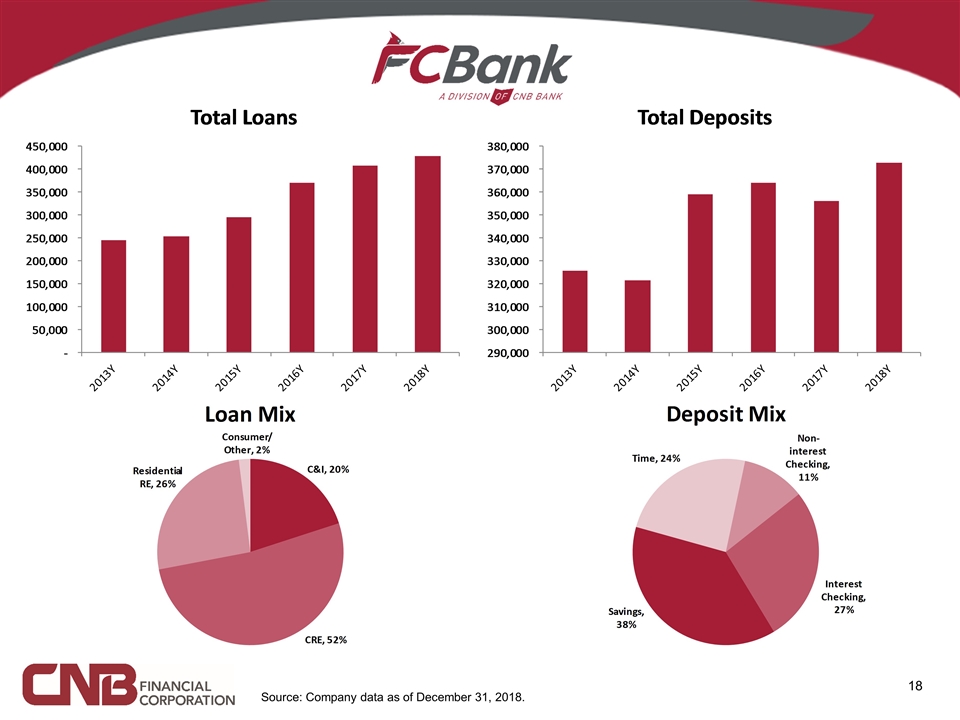
The acquisition of FC Banc Corp. in 2013 expanded CNB’s geographic footprint into Central Ohio with meaningful size and scale, operating as FCBank, a division of CNB Bank $428 million in loans and $373 million in deposits as of December 31, 2018 Loan growth of $23 million, or 5.6%, since December 31, 2017 Deposit growth of $17 million, or 4.7%, since December 31, 2017 Significant opportunity for both organic and strategic growth going forward Addition of C&I lenders In January 2018, hired an experienced market manager to focus on retail deposit gathering strategies Successful Expansion into Ohio
Source: Company data as of December 31, 2018.

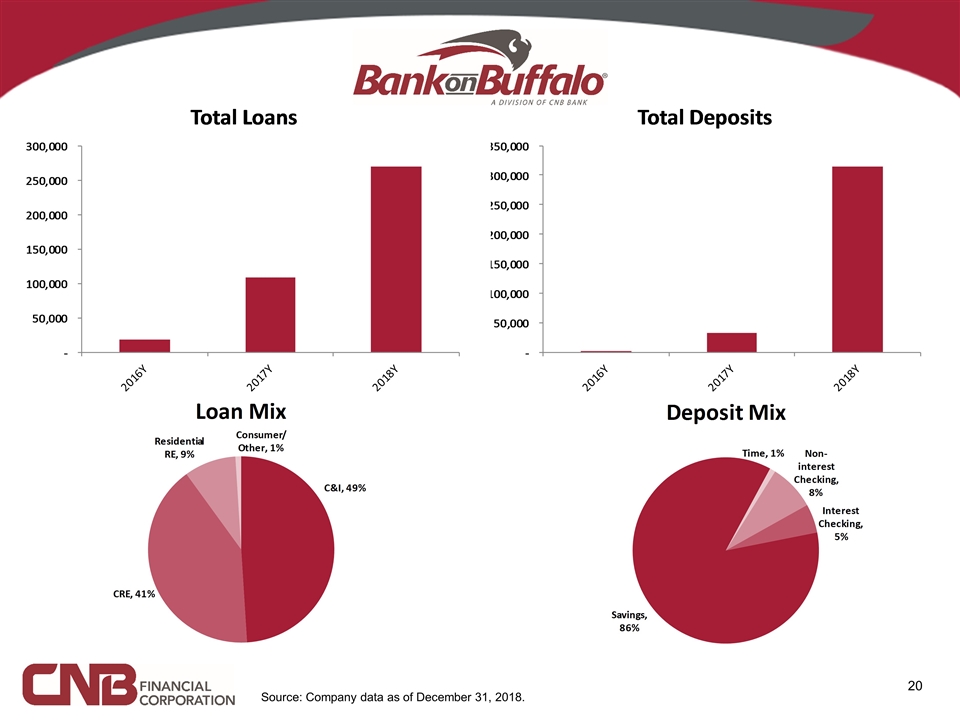
BankOnBuffalo, a division of CNB Bank, formed in 2016, is primarily focused on the large number of commercial and industrial businesses that operate in Erie and Niagara counties of NY The decision to move into this region with a de novo operation came after an extensive evaluation of the market and the competition, as well as a search for the key executive from the area to spearhead the market’s development BankOnBuffalo entered the market with a loan production office located in the Electric Tower building in downtown Buffalo, New York in November 2016. This loan production office converted to a full-service office in February 2017. Subsequently: Two full-service offices opened in November 2017 in the Williamsville and Orchard Park communities A full-service office opened in August 2018 in Niagara Falls $269 million in loans and $315 million in deposits as of December 31, 2018. Deposit growth in 2018 was $282 million.
Source: Company data as of December 31, 2018.

Full-Time Employees by Division * CNB Bank FTEs include all operational functions. Source: Company data as of December 31, 2018. *

Most Recent Quarter Peer Comparison Performance Asset Quality Capital Returns 75th percentile 50th percentile 25th percentile CNB: 1.12 Peers: 1.18 Source: S&P Global Market Intelligence as of December 31, 2018, or most recent quarter. CNB Bank excludes Holiday Financial Services Corporation (“Holiday”). See page 31 for full peer group. CNB and Peers are compared to universe of all nationwide public banks and thrifts. Light colored CNB figures represent asset quality at the bank, excluding Holiday. CNB: 3.76 Peers: 3.55 CNB: 61.1 Peers: 60.5 CNB: 0.58 Peers: 0.70 CNB: 0.26 Peers: 0.05 CNB: 7.02 Peers: 9.05 CNB: 13.21 Peers: 14.09 CNB: 2.36 Peers: 2.24 CNB Bank: 0.46 CNB Bank: 0.18

Capital Management Philosophy Capital plan prepared annually and approved by Board of Directors Dividend payout ratio and dividend yield benchmarked against peers The capital plan establishes the following minimum capital ratios for CNB Bank on a standalone basis: Leverage Ratio: 7.0% Tier 1 Capital Ratio: 9.0% Common Equity Tier 1 Ratio: 8.0% Total Capital Ratio: 11.5% All of these targets meet or exceed the well-capitalized regulatory thresholds, and the capital conservation buffer that is specified in the Basel III capital guidelines will be maintained at an appropriate level Successful execution of recent capital raises: Q3 2016: $50 million subordinated debt Q1 2017: $20 million at-the-market common stock offering

Strong Capital Ratios Source: Company data as of December 31, 2018.

Peer Comparison – Dividend Source: S&P Global Market Intelligence as of December 31, 2018 , or most recent quarter. See page 31 for full peer group.
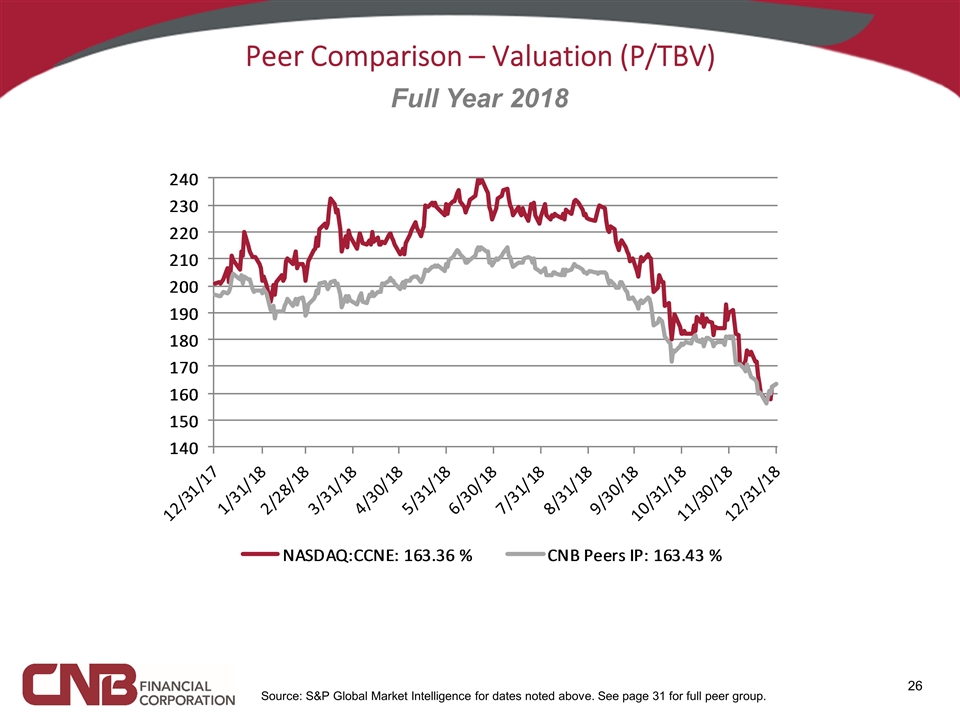
Peer Comparison – Valuation (P/TBV) Full Year 2018 Source: S&P Global Market Intelligence for dates noted above. See page 31 for full peer group.

Peer Comparison – (P/E) Source: S&P Global Market Intelligence for dates noted above. See page 31 for full peer group. Full Year 2018

Peer Comparison – Total Return Source: S&P Global Market Intelligence for dates noted above. See page 31 for full peer group. Full Year 2018
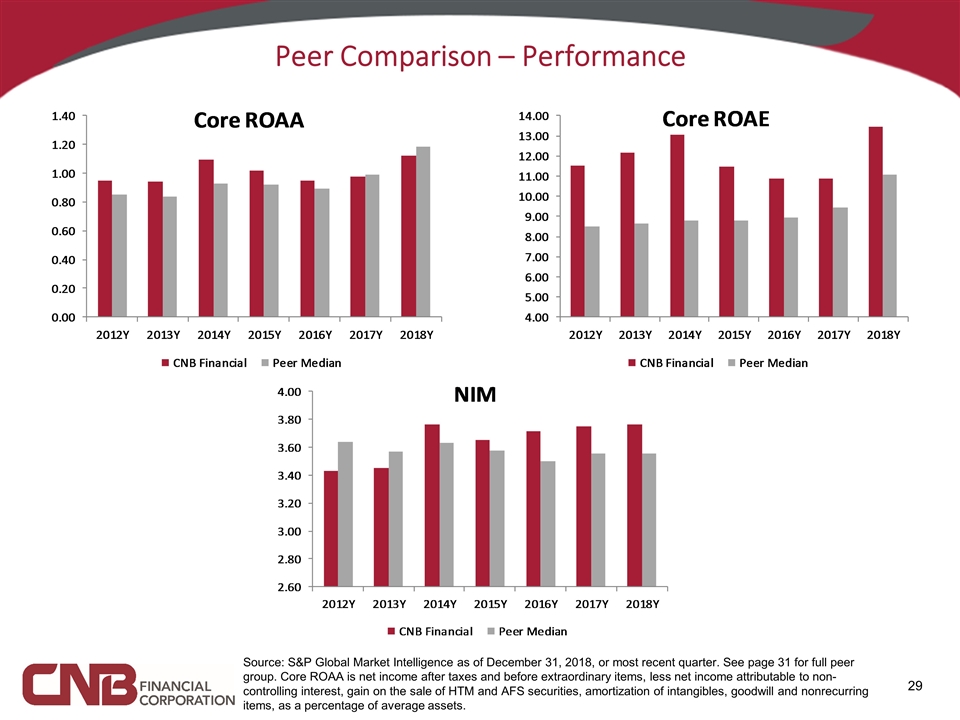
Peer Comparison – Performance Source: S&P Global Market Intelligence as of December 31, 2018, or most recent quarter. See page 31 for full peer group. Core ROAA is net income after taxes and before extraordinary items, less net income attributable to non-controlling interest, gain on the sale of HTM and AFS securities, amortization of intangibles, goodwill and nonrecurring items, as a percentage of average assets.
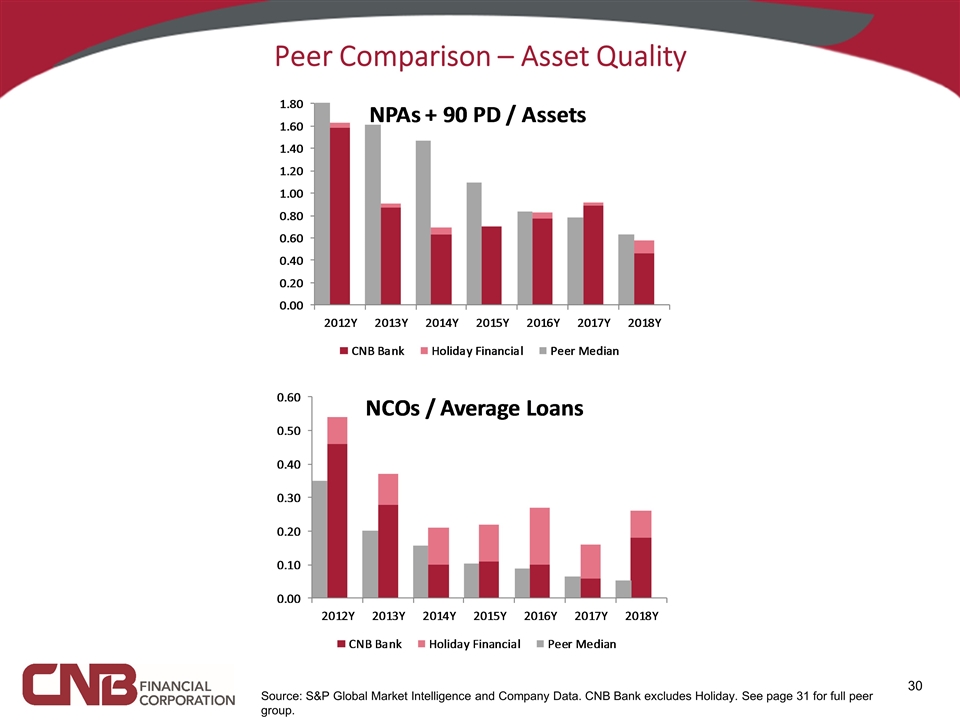
Peer Comparison – Asset Quality Source: S&P Global Market Intelligence and Company Data. CNB Bank excludes Holiday. See page 31 for full peer group.
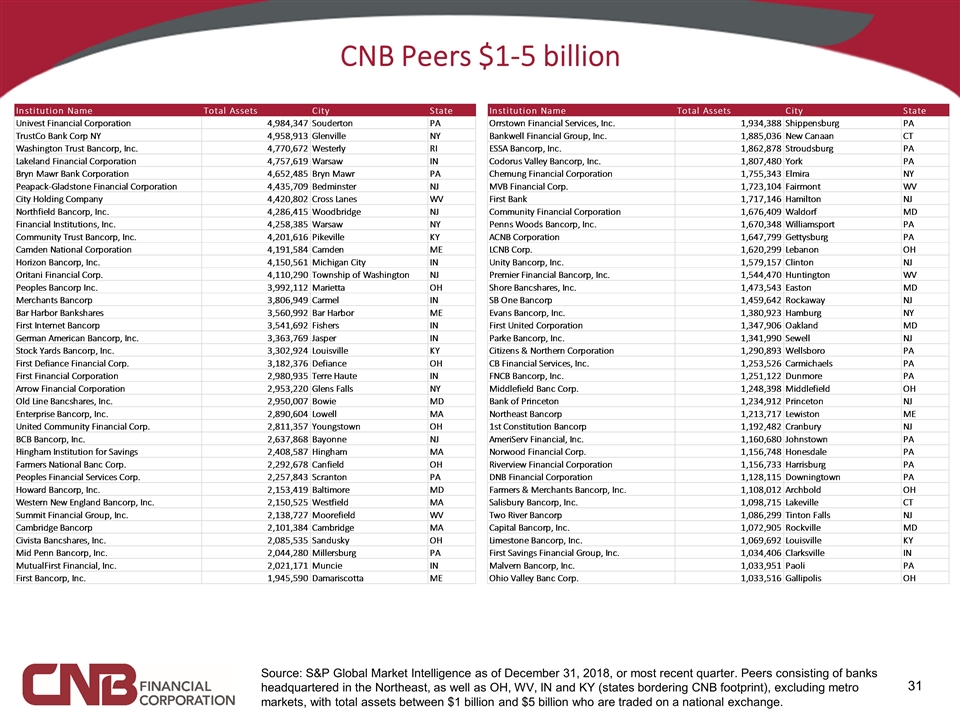
CNB Peers $1-5 billion Source: S&P Global Market Intelligence as of December 31, 2018, or most recent quarter. Peers consisting of banks headquartered in the Northeast, as well as OH, WV, IN and KY (states bordering CNB footprint), excluding metro markets, with total assets between $1 billion and $5 billion who are traded on a national exchange.

Non-GAAP Financial Reconciliation Tangible common equity, tangible assets, and tangible book value per share are non-GAAP financial measures calculated using GAAP amounts. Tangible common equity is calculated by excluding the balance of goodwill and the core deposit intangible from the calculation of shareholders’ equity. Tangible assets are calculated by excluding the balance of goodwill and the core deposit intangible from the calculation of total assets. Tangible book value per share is calculated by dividing tangible common equity by the number of shares outstanding. CNB believes that these non-GAAP financial measures provide information to investors that is useful in understanding its financial condition because, in the case of the tangible common equity to tangible assets ratio, the ratio is an additional measure used to assess capital adequacy and, in the case of tangible book value per share, tangible book value per share is an additional measure used to assess CNB’s value. Because not all companies use the same calculations of tangible common equity and tangible assets, this presentation may not be comparable to other similarly titled measures calculated by other companies. A reconciliation of these non-GAAP financial measures is provided below (dollars in thousands, except share and per share data).