|
UNITED STATES
SECURITIES AND EXCHANGE COMMISSION
Washington, D. C. 20549
FORM 10-K
(Mark One)
[X] ANNUAL REPORT PURSUANT TO SECTION 13 OR 15(d) OF THE SECURITIES EXCHANGE ACT OF 1934
For the fiscal year ended March 31, 2011
OR
[ ] TRANSITION REPORT PURSUANT TO SECTION 13 OR 15(d) OF THE SECURITIES EXCHANGE ACT OF 1934
For the transition period from __________ to __________
|
||||
|
Commission file number 0-13163
|
||||
|
ACXIOM CORPORATION
(Exact name of registrant as specified in its charter)
|
||||
|
DELAWARE
(State or Other Jurisdiction of Incorporation
or Organization)
|
71-0581897
(I.R.S. Employer Identification No.)
|
|||
|
P.O. Box 8180, 601 E. Third Street,
Little Rock, Arkansas
(Address of Principal Executive Offices)
|
72201
(Zip Code)
|
|||
|
(501) 342-1000
(Registrant’s telephone number, including area code)
|
||||
|
Securities registered pursuant to Section 12(b) of the Act:
|
||||
|
Title of each class
|
Name of each exchange
on which registered
|
|||
|
Common Stock, $.10 Par Value
|
The NASDAQ Global Select Market
|
|||
|
Securities registered pursuant to Section 12(g) of the Act: None
|
||||
|
Indicate by check mark if the registrant is a well-known seasoned issuer, as defined in Rule 405 of the Securities Act.
|
||||
|
Yes [X]
|
No [ ]
|
|||
|
Indicate by check mark if the registrant is not required to file reports pursuant to Section 13 or Section 15(d) of the
|
||||
|
Exchange Act.
|
Yes [ ]
|
No [X]
|
||
|
Indicate by check mark whether the registrant (1) has filed all reports required to be filed by Section 13 or 15(d) of the Securities Exchange Act of 1934 during the preceding 12 months (or for such shorter period that the registrant was required to file such reports), and (2) has been subject to such filing requirements for the past 90 days.
|
||||
|
Yes [X]
|
No [ ]
|
|||
|
Indicate by check mark whether the registrant has submitted electronically and posted on its corporate Web site, if any, every Interactive Data File required to be submitted and posted pursuant to Rule 405 of Regulation S-T during the preceding 12 months (or for such shorter period that the registrant was required to submit and post such filings).
|
||||
|
Yes [X]
|
No [ ]
|
|||
|
Indicate by check mark if disclosure of delinquent filers pursuant to Item 405 of Regulation S-K is not contained herein, and will not be contained, to the best of registrant’s knowledge, in definitive proxy or information statements incorporated by reference in Part III of this Form 10-K or any amendment to this Form 10-K. [X]
|
||||
|
Indicate by check mark whether the registrant is a large accelerated filer, an accelerated filer, a non-accelerated filer, or a smaller reporting company. See the definitions of “large accelerated filer, “accelerated filer” and “smaller reporting company” in Rule 12b-2 of the Exchange Act.
|
||||
|
Large accelerated filer [X]
|
Accelerated filer [ ]
|
|||
|
Non-accelerated filer [ ]
|
Smaller reporting company [ ]
|
|||
|
Indicate by check mark whether the registrant is a shell company (as defined in Rule 12b-2 of the Exchange Act).
|
||||
|
Yes [ ]
|
No [X]
|
|||
|
The aggregate market value of the voting stock held by non-affiliates of the registrant, based upon the closing sale price of the registrant’s Common Stock, $.10 par value per share, as of the last business day of the registrant’s most recently completed second fiscal quarter as reported on the NASDAQ Global Select Market was approximately $1,088,762,537. (For purposes of determination of the above stated amount only, all directors, executive officers and 10% or more shareholders of the registrant are presumed to be affiliates.)
|
||||
|
The number of shares of Common Stock, $.10 par value per share, outstanding as of May 25, 2011, was 81,149,455.
|
||||
2
| Table of Contents | Page
|
||
|
4
|
|||
|
Part I
|
|||
|
4
|
|||
| Item 1. |
6
|
||
| Item 1A. |
13
|
||
| Item 1B. |
17
|
||
| Item 2. |
18
|
||
| Item 3. |
20
|
||
|
Part II
|
|||
| Item 5. |
20
|
||
| Item 6. |
23
|
||
| Item 7. |
23
|
||
| Item 7A. |
23
|
||
| Item 8. |
23
|
||
| Item 9. |
23
|
||
| Item 9A. |
23
|
||
| Item 9B. |
24
|
||
|
Part III
|
|||
| Item 10. |
24
|
||
| Item 11. |
24
|
||
| Item 12. |
24
|
||
| Item 13. |
24
|
||
| Item 14. |
24
|
||
|
Part IV
|
|||
| Item 15. |
25
|
||
|
28
|
|||
|
F-1 – F-57
|
|||
3
Portions of the Proxy Statement for the 2011 Annual Meeting of Shareholders (“2011 Proxy Statement”) of Acxiom Corporation (“Acxiom,” the “Company,” “we” or “us”) are incorporated by reference into Part III of this Form 10-K.
PART I
Our website address is www.acxiom.com, where copies of documents which we have filed with the Securities and Exchange Commission (“SEC”) may be obtained free of charge as soon as reasonably practicable after being filed electronically. Included among those documents are our Annual Report on Form 10-K, Quarterly Reports on Form 10-Q, Current Reports on Form 8-K, and amendments to those reports filed or furnished pursuant to Section 13(a) or 15(d) of the Exchange Act. Copies may also be obtained through the SEC’s EDGAR site, or by sending a written request for copies to Acxiom Investor Relations, 601 East Third Street, Little Rock, AR 72201. Copies of all of our SEC filings were available on our website during the past fiscal year covered by this Form 10-K. In addition, at the “Corporate Governance” section of our website, we have posted copies of our Corporate Governance Principles, the charters for the Audit/Finance, Compensation, Executive and Governance/Nominating Committees of the Board of Directors, the codes of ethics applicable to directors, financial personnel and all employees, and other information relating to the governance of the Company. Although referenced herein, information contained on or connected to our corporate website is not incorporated by reference into this annual report on Form 10-K and should not be considered part of this report or any other filing we make with the SEC.
CAUTIONARY STATEMENTS RELEVANT TO FORWARD-LOOKING INFORMATION
This Annual Report on Form 10-K, including, without limitation, the items set forth on pages F-3 – F-19 in Management’s Discussion and Analysis of Financial Condition and Results of Operations, contains and may incorporate by reference certain statements that may be deemed to be “forward-looking statements” within the meaning of the Private Securities Litigation Reform Act of 1995, as amended (as amended, the “PSLRA”), and that are intended to enjoy the protection of the safe harbor for forward-looking statements provided by the PSLRA. These statements, which are not statements of historical fact, may contain estimates, assumptions, projections and/or expectations regarding the Company’s financial position, results of operations, market position, product development, growth opportunities, economic conditions, and other similar forecasts and statements of expectation. Forward-looking statements are often identified by words or phrases such as “anticipate,” “estimate,” “plan,” “expect,” “believe,” “intend,” “foresee,” and similar words or phrases. These forward-looking statements are not guarantees of future performance and are subject to a number of factors and uncertainties that could cause the Company’s actual results and experiences to differ materially from the anticipated results and expectations expressed in the forward-looking statements.
Forward-looking statements may include but are not limited to the following:
|
·
|
management’s expectations about the macro economy;
|
|
·
|
that the amounts for restructuring and impairment charges and accruals for litigation will be within estimated ranges;
|
|
·
|
that the cash flows used in estimating the recoverability of assets will be within the estimated ranges; and
|
|
·
|
that items which management currently believes are not material will continue to not be material in the future.
|
Among the factors that may cause actual results and expectations to differ from anticipated results and expectations expressed in such forward-looking statements are the following:
|
·
|
the risk factors described in Part I, “Item 1A. Risk Factors” and elsewhere in this report and those described from time to time in our future reports filed with the Securities and Exchange Commission;
|
4
|
·
|
the possibility that in the event a change of control of the Company is sought that certain clients may attempt to invoke provisions in their contracts resulting in a decline in revenue and profit;
|
|
·
|
the possibility that the integration of acquired businesses may not be as successful as planned;
|
|
·
|
the possibility that the fair value of certain of our assets may not be equal to the carrying value of those assets now or in future time periods;
|
|
·
|
the possibility that sales cycles may lengthen;
|
|
·
|
the possibility that we won’t be able to properly motivate our sales force or other associates;
|
|
·
|
the possibility that we may not be able to attract and retain qualified technical and leadership associates, or that we may lose key associates to other organizations;
|
|
·
|
the possibility that we may be unable to quickly and seamlessly integrate a new chief executive officer and chief financial officer;
|
|
·
|
the possibility that we won’t be able to continue to receive credit upon satisfactory terms and conditions;
|
|
·
|
the possibility that competent, competitive products, technologies or services will be introduced into the marketplace by other companies;
|
|
·
|
the possibility that there will be changes in consumer or business information industries and markets that negatively impact the Company;
|
|
·
|
the possibility that we won’t be able to protect proprietary information and technology or to obtain necessary licenses on commercially reasonable terms;
|
|
·
|
the possibility that there will be changes in the legislative, accounting, regulatory and consumer environments affecting our business, including but not limited to litigation, legislation, regulations and customs relating to our ability to collect, manage, aggregate and use data;
|
|
·
|
the possibility that data suppliers might withdraw data from us, leading to our inability to provide certain products and services;
|
|
·
|
the possibility that we may enter into short-term contracts which would affect the predictability of our revenues;
|
|
·
|
the possibility that the amount of ad hoc, volume-based and project work will not be as expected;
|
|
·
|
the possibility that we may experience a loss of data center capacity or interruption of telecommunication links or power sources;
|
|
·
|
the possibility that we may experience failures or breaches of our network and data security systems, leading to potential adverse publicity, negative customer reaction, or liability to third parties;
|
|
·
|
the possibility that our clients may cancel or modify their agreements with us;
|
|
·
|
the possibility that we will not successfully complete customer contract requirements on time or meet the service levels specified in the contracts, which may result in contract penalties or lost revenue;
|
|
·
|
the possibility that we experience processing errors which result in credits to customers, re-performance of services or payment of damages to customers; and
|
|
·
|
general and global negative economic conditions.
|
With respect to the provision of products or services outside our primary base of operations in the United States, all of the above factors apply, along with the difficulty of doing business in numerous sovereign jurisdictions due to differences in scale, competition, culture, laws and regulations.
Other factors are detailed from time to time in periodic reports and registration statements filed with the United States Securities and Exchange Commission. The Company believes that we have the product and technology offerings, facilities, associates and competitive and financial resources for continued business success, but future revenues, costs, margins and profits are all influenced by a number of factors, including those discussed above, all of which are inherently difficult to forecast.
5
In light of these risks, uncertainties and assumptions, the Company cautions readers not to place undue reliance on any forward-looking statements. The Company undertakes no obligation to publicly update or revise any forward-looking statements based on the occurrence of future events, the receipt of new information or otherwise.
Acxiom is a recognized leader in marketing technology and services that enable marketers to successfully manage audiences, personalize consumer experiences and create profitable customer relationships. Our superior industry-focused, consultative approach combines consumer data and analytics, databases, data integration and consulting solutions for personalized, multichannel marketing strategies. Acxiom leverages over 40 years of experience in data management to deliver high-performance, highly secure, reliable information management services. Founded in 1969, Acxiom is headquartered in Little Rock, Arkansas, USA, and serves clients around the world from locations in the United States, Europe, Asia-Pacific, South America and the Middle East. For more information about Acxiom, visit www.acxiom.com.
Our client base in the U.S. consists primarily of Fortune 1000 companies in the financial services, insurance, information services, direct marketing, media, retail, consumer packaged goods, technology, automotive, healthcare, travel and telecommunications industries, and the government sector. Our solutions are designed to meet the specific needs of our clients in the industries in which they operate. We focus on organizations that view data as a strategic competitive advantage and an integral component of their business decision-making process. Every day, Acxiom clients benefit from our experience serving their information, technology and marketing services needs. We help our clients with:
|
·
|
Recognition of consumers at any touchpoint, leveraging targeting techniques, such as consumer lifestage and retargeting, and creating a single customer view without compromising the privacy or security of personally identifiable information.
|
|
·
|
Multichannel marketing solutions for campaign management across a broad spectrum of channels, including personalized email, targeted website, banner and other Web advertisements, search engines, mobile devices, digital TV and direct mail
|
|
·
|
Marketing solutions built on our acquisition- and customer-marketing database framework for customer acquisition, customer growth and retention, and multichannel integration
|
|
·
|
Professional consulting that provides analytical tools, household segmentation products, and marketing support infrastructure to help our clients better understand their prospects and customers
|
|
·
|
Large-scale data and systems management through strategic IT infrastructure services
|
|
·
|
Identity verification and risk information, scoring and analytics for fraud and risk management
|
Market Growth Drivers
In today’s technologically advanced and competitive business environment, companies are using vast amounts of customer, prospect and marketplace information to manage their businesses. The information services industry provides a broad range of products and services designed to help companies recognize and engage prospects and customers across the broad spectrum of channels. Acxiom’s consultative capabilities, industry and analytic knowledge, premier data content, and technological innovations combine to enable our clients to efficiently access and manage information throughout the enterprise and on a global scale.
We believe the following trends and dynamics of the information services industry provide us with multiple growth opportunities:
|
·
|
Increasing demand for business intelligence by transforming huge stores of structured and unstructured data into insight for operational decision making
|
|
·
|
Increasingly personalized, interactive and integrated marketing strategies
|
6
|
·
|
Consumer empowerment that enables individuals to better choose, receive and reject information
|
|
·
|
Technological advances in data management
|
|
·
|
Movement toward multiple communication tools/technology, from search engines to blogs to social networking to addressable TV
|
|
·
|
Consumer privacy, security and fraud management demands
|
|
·
|
Increasing demand for identity verification/authentication
|
|
·
|
Globalization
|
Our Growth Strategy
Acxiom’s growth strategy will continue to leverage our deep consumer insights, our expertise in direct and digital marketing services, and our technology and operations skills to serve the most progressive consumer marketers in the world.
More specifically, our strategy is to:
|
·
|
Build on our client relationships as we innovate with them to profitably acquire, retain and develop their customers.
|
|
·
|
Gain new clients, especially in under-penetrated sectors, who demonstrate the potential to become significant long-term partners.
|
|
·
|
Generate new growth avenues for our products by partnering with responsible consumer companies.
|
|
·
|
Selectively pursue acquisitions that profitably provide additional scale or complement and accelerate the development of our products and services.
|
|
·
|
Improve operational efficiency via new technology and processes to continue to add value and remain competitive.
|
|
·
|
Allocate and deploy shareholder capital in a disciplined and value-creating manner.
|
The discussion above is a summary description of our current growth strategy as of the date of the filing of this Annual Report on Form 10-K and is subject to change in the future. We undertake no obligation to update this information in the event of a change in strategy.
Our Competitive Strengths
Using primarily the competencies listed below, Acxiom seeks to capitalize on market trends to drive growth. These competencies also represent competitive differentiators that we believe uniquely position us to deliver high-value solutions to our clients.
We help our clients transform information into insight to improve their marketing and business results. Our ability to deliver the right data to the right place at the right time enhances our clients’ marketing, risk management, and business decisions. Those abilities revolve around the following competencies:
|
·
|
Global multichannel marketing capabilities that can be integrated to form full solutions with measurable ROI
|
|
·
|
Consumer insight products, including data and segmentation
|
|
·
|
Data integration, management and delivery capabilities
|
|
·
|
Information systems technology and management
|
|
·
|
Fraud/risk management and identity authentication
|
7
We believe we have the most comprehensive and accurate collection of U.S. consumer, property and telephone marketing data available from a single supplier. Our InfoBase® consumer database covers almost all households in the U.S. We also have strong “reference” data assets – information that clients use for non-marketing purposes, including data used in our employment screening and risk management solution.
We originated the term “Customer Data Integration” (CDI) and believe we are unmatched in our ability to transform and integrate massive amounts of data. We believe our CDI capabilities, combined with related customer recognition software and infrastructure, constitute the leading solution for companies seeking to better integrate their customer data and engage broader audiences across all devices and channels.
As information grows at unprecedented rates and its value increases, companies face a growing need to effectively manage the massive data volumes and transform the information into meaningful insights that drive business results. As one of the world’s largest processors of data, Acxiom’s IT services are well positioned to help information-intensive companies.
We help companies optimize their IT infrastructures, reduce costs and transform information into meaningful intelligence. We achieve this by delivering standardized computing platforms, innovative technology solutions, best-in-class processes and expertise in data management.
The growth of e-commerce and companies’ needs for consumer information mean that we must work even harder to assure that our history of privacy leadership translates to adequate protection of consumer information. We actively promote a set of effective privacy guidelines for the direct marketing, via all channels of addressable media, e-commerce, risk management and information industries as a whole. Industry-wide compliance helps address privacy concerns across the globe. Furthermore, we are certified under the European Union safe harbor and contractually comply with other international data protection requirements to ensure the continued ability to process information across borders. We have a dedicated team in place to oversee our compliance with the privacy regulations that govern our business activities in the various countries in which we operate.
The U.S. Congress continues to debate privacy legislation, and there are many different types of privacy legislation pending in the 50 states. In many of the non-U.S. locations in which we do business, laws and regulations governing the collection and use of personal data already exist. We expect the trend of enacting data protection laws to continue and that privacy legislation in various forms will be implemented in the U.S. and in non-US countries around the globe. We are supportive of legislation that codifies the current industry guidelines of meaningful transparency for the individual and appropriate choices regarding whether information related to that individual is shared with independent third parties for marketing purposes. We also support legislation requiring all custodians of sensitive information to deploy reasonable information security safeguards to protect that information.
Clients
Our client base consists primarily of Fortune 1000 companies in the financial services, insurance, information services, direct marketing, media, retail, consumer packaged goods, technology, automotive, healthcare, travel and telecommunications industries.
Our 10 largest clients represented approximately 34 percent of our revenue in fiscal 2011. No single client accounted for more than 10 percent of the revenues of the Company as a whole or 10% of the revenues of any individual business segment during the last fiscal year. We seek to maintain long-term relationships with our clients. Many of our clients typically operate under contracts with initial terms of at least two years. We have historically experienced high retention rates among our clients.
8
Sales and Marketing
Our global sales and marketing organizations are focused on ensuring that clients and prospects understand that Acxiom is equipped with the data assets, technology and intellectual capital required to implement fully integrated marketing and business solutions across multiple channels with readily measurable results.
Our Client Development Organization is focused on new business development across all markets – primarily new clients and new lines of business with existing clients, and account management roles focused on revenue growth within existing accounts as well as leading implementations and service delivery.
Our global marketing organization has actively promoted our ability to integrate services across the interactive channels now in use globally. In keeping with external market dynamics, our marketing teams have been increasingly focused on merging online and offline channels for greater market impact.
Competition
We believe we are a U.S. leader in marketing services and technology. Within the industry, we compete against data content providers, database marketing service providers, analytical data application vendors, enterprise software providers, systems integrators, consulting firms, advertising agencies, list brokerage/list management firms, and teleservices companies. Many firms offer a limited number of services within a particular geographic area, and several are national or international companies that offer a broad array of information services. We offer a range of products and services and have the ability to integrate these services effectively for marketing purposes.
In the U.S. services arena, we compete primarily with in-house information technology departments of current and prospective clients, as well as firms that provide data warehousing and database services, mailing list processing and consulting services. Competition is based on the quality and reliability of products and services, industry and technological expertise, historical success, ability to develop customized solutions for clients, processing capabilities and price.
In the U.S. products sector, we compete with two types of firms: data providers and list providers. Competition is based on the quality and comprehensiveness of the information provided, the ability to deliver the information in products and formats that our clients need and, to a lesser extent, the pricing of information products and services.
In the IT management market, competition is based on technical expertise and innovation, financial stability, past experience with the provider, marketplace reputation, cultural fit, quality and reliability of services, project management capabilities, processing environments and price.
In Europe, we face similar competition as in the U.S. in terms of scope and type. While there is a broader range of competitors across Europe, particularly for customer data, the major competitors in both the services and the products markets are very similar to those in the U.S.
In Australia and New Zealand, our competitors in the services arena are predominantly well-established local businesses or companies’ in-house IT departments; however, some large global competitors have begun to offer their services in these countries. Our competitors in the products arena are generally local Australian and New Zealand companies, although global competition in Australia and New Zealand is increasing.
In China, where we have had a presence since 2004, the competition is fragmented, with only a few local firms providing similar services. Well-known global providers, however, have recently been attracted by the potential of the Chinese market and appear to be investing in that market.
In 2010 Acxiom expanded to South America, acquiring a majority share of a Brazilian company with offices in São Paulo and Porto Alegre. Although there are no direct competitors that currently offer the breadth of Acxiom’s services in Brazil, the country’s nascent data business has become the target of a few large credit-reporting agencies seeking to establish a foothold in the region. The country’s robust economic growth has also resulted in many local boutique firms and agencies offering multichannel technology, services and consulting.
9
Maintaining technological competitiveness in our data products, processing functionality, software systems and services is key to our continued success. Our ability to continually improve our current processes and to develop and introduce new products and services is essential in order to maintain our competitive position and meet the increasingly sophisticated requirements of our clients. If we fail to do so, we could lose clients to current or future competitors, which could result in decreased revenues, net income and earnings per share.
Our industry has experienced a variety of business combinations that consolidate our competitors. The possibility of the consolidation or merger of companies who might combine forces to create a single-source provider of multiple services to the marketplace in which we compete could result in increased price competition for us which would negatively affect our business results. As noted above, we currently compete against numerous providers of a single service or product in several separate market spaces. Since we offer a larger variety of services than many of our current competitors, we have been able to successfully compete against them in most instances. However, the dynamics of the marketplace could be significantly altered if some of the single-service providers were to combine with each other to provide a wider variety of services.
The complexity and uncertainty regarding the development of new technologies affect our business greatly, as does the loss of market share through competition, or the extent and timing of market acceptance of innovative products and technology. We are also potentially affected by:
|
|
• Longer sales cycles for our solutions due to the nature of that technology as an enterprise-wide solution;
|
|
|
• The introduction of competent, competitive products or technologies by other companies;
|
|
|
• Changes in the consumer and/or business information industries and markets, including the decline in the use of direct mail marketing and the ever-increasing use of alternative marketing channels such as online
advertising, which could result in lower profit margins;
|
|
|
• The ability to protect our proprietary information and technology or to obtain necessary licenses on commercially reasonable terms; and
|
|
|
• The impact of changing legislative, judicial, accounting, regulatory, cultural and consumer environments in the geographies where our products and services are deployed.
|
Business Segments
Acxiom reports segment information consistent with the way we internally disaggregate our operations to assess performance and to allocate resources. In fiscal 2011 our business segments consisted of Information Services and Information Products. The Information Services segment includes the Company’s global lines of business for CDI, Multichannel Marketing Services, Infrastructure Management Services and Consulting Services. The Information Products segment is comprised of the Company’s global Consumer Insights and Risk Mitigation Products lines of business and the U.S. Background Screening Products line of business. We evaluate performance of the segments based on segment operating income, which excludes certain gains, losses and other items. Information concerning the financial results of our fiscal year 2011 business segments is included in note 17 of the Notes to Consolidated Financial Statements and in Management’s Discussion and Analysis of Financial Condition and Results of Operations, which are attached to this Annual Report as part of the Financial Supplement.
Information Services develops, sells and delivers industry-tailored solutions globally through integration of products, services and consulting. Those services include the design and creation of marketing databases and data warehouses; online data management capabilities; digital advertising; data integration and customer-recognition systems; marketing applications; list processing; and information technology services.
Information Products develops and sells all global data products, including segmentation products and domestic fraud and risk mitigation products as well as online advertising products. For decades, Acxiom has been a leader in creating and making advances in data and segmentation products such as InfoBaseâ, a customer-centric foundation for all marketing needs with the largest collection of U.S. consumer information available in one source, and Personicxâ, the industry-leading household segmentation and visualization system.
Financial information about geographic areas in which we operate, including revenues generated in foreign regions and long-lived assets located in foreign regions, is set forth in note 15, “Foreign Operations” of the Notes to Consolidated Financial Statements, which is attached to this Annual Report as part of the Financial Supplement.
10
Seasonality and Inflation
Historically our traditional direct marketing operations experience their lowest revenue in the first quarter of each fiscal year. In order to minimize the impact of these fluctuations, we continue to seek long-term strategic partnerships with more predictable revenues.
Although we cannot accurately determine the amounts attributable to inflation, we are affected by inflation through increased costs of compensation, and other operating expenses. If inflation were to increase over the low levels of recent years, the impact in the short run would be to cause an increase in costs, which we would attempt to pass on to clients, although there is no assurance we would be able to do so. Generally, the effects of inflation in recent years have been offset by technological advances, economies of scale and other operational efficiencies.
Pricing
Given the diverse nature of the markets and industries in which our clients operate, we deploy a number of pricing techniques designed to yield acceptable margins and returns on invested capital. In our top-tier markets, a substantial portion of Acxiom’s revenue is generated from highly customized, outsourced solutions in which prices are dictated by the scope, complexity, nature of assets deployed and service levels required for the individual client engagements. For mid-tier markets, Acxiom offers pre-packaged or standard solutions for which prices are driven by standard rates applied to the volumes and frequencies of client inputs and outputs. Some product offerings, such as consumer data or data hygiene, are priced under a transactional model and others are priced under a subscription or license model. Acxiom’s consulting and analytical services are typically priced per engagement, using a professional services model or on a fee per model basis.
Employees
Acxiom employs approximately 6,600 employees (associates) worldwide. No U.S. associates are represented by a labor union or are the subject of a collective bargaining agreement. To the best of management’s knowledge, approximately 20 associates are elected members of work councils or trade unions representing Acxiom associates in the EU. Acxiom has never experienced a work stoppage and believes that its employee relations are good.
Executive Officers of the Registrant
Acxiom’s executive officers, their current positions, ages and business experience are listed below. They are elected by the board of directors annually or as necessary to fill vacancies or to fill new positions. There are no family relationships among any of the officers.
Jerry D. Gramaglia, age 55, was appointed by the board of directors on March 28, 2011 to serve as Acxiom’s interim chief executive officer and president. Mr. Gramaglia, a private investor and advisor to consumer-oriented technology start-ups, was previously a partner with Arrowpath Venture Partners, a Silicon Valley-based venture capital firm. Prior to that he served as president and chief operating officer for E*TRADE Group Inc. (NASDAQ: ETFC), a leading provider of electronic financial services. Mr. Gramaglia began his career at Procter & Gamble and later held senior marketing and general management positions for Nestle, PepsiCo, Imasco and Sprint. He currently serves on the boards of Coldwater Creek (NASDAQ: CWTR), a national retailer of women’s apparel, and WageWorks, a privately held leading provider of tax-advantaged employee benefits. He holds a bachelor’s degree in economics from Denison University.
John A. Adams, age 56, is the Company’s chief operating officer and executive vice president and is responsible for directing the operational areas of the business which include our product lines of business, Europe and Asia Pacific, service development and delivery, and information technology. He joined Acxiom in May 2008. Previously Mr. Adams was executive vice president of customer solutions for Eclipsys, a healthcare information software and services
11
vendor. In that capacity, he was responsible for the company’s outsourcing and hosting units as well as a number of administrative functions. From 2003 – 2004, he served as chief financial officer for Exult, Inc., a human resources
business process outsourcing company that was subsequently sold to Hewitt Associates during Mr. Adams’ tenure. From 2000 – 2003 Mr. Adams served as chief financial officer and vice president of AT&T Business Services, a subsidiary of AT&T Corporation. In this role, he led a successful restructuring of the subsidiary’s operations. Prior to that, Mr. Adams was employed by EDS for 15 years, serving most recently as vice president and controller, in which capacity he oversaw the accounting and finance functions for EDS worldwide. Mr. Adams, a British citizen, is a member of the Institute of Chartered Accountants in England and Wales. He holds a bachelor’s degree with honors in economics from the University of Exeter, England.
Christopher W. Wolf, age 49, is the Company’s chief financial officer and executive vice president. He joined Acxiom in 2007 and has been responsible since that time for all aspects of Acxiom’s financial management. He has over 20 years experience as a financial executive and consultant to companies in the marketing, retail and technology sectors. He most recently served as an independent consultant, providing consultation on financial reporting, Sarbanes-Oxley compliance, corporate governance, capital structure, mergers and acquisitions, and tax planning to a variety of public and private entities. From 2005 - 2006, Mr. Wolf served as CFO of NiuTech LLC, an internet marketing services company, where he was responsible for the accounting, financial planning and analysis, treasury, and risk management activities of the company. From 1996 - 2004, Mr. Wolf was employed in various finance and tax positions with Catalina Marketing Corporation, culminating in his service as chief financial officer from 2002 - 2004. Prior to joining Catalina, Mr. Wolf served for 10 years as a tax manager and consultant for Arthur Andersen & Co. He is a certified public accountant and holds a master’s degree in accounting from the University of North Carolina and a bachelor’s degree in the same field from Florida State University. In March 2011 Mr. Wolf announced his intention to resign from the Company for personal reasons effective as of June 1, 2011.
Shawn M. Donovan, age 48, is the Company's executive vice president – sales, marketing and consulting. He joined Acxiom in 2008 and is responsible for Acxiom’s growth strategy and execution. In this role, he leads the client facing areas of the business which include global sales, U.S. markets, and consulting. His responsibilities include expanding the sale of Acxiom’s portfolio of services globally; hiring, developing and retaining world-class sales and account professionals; creating high-impact growth plans, processes, tools and disciplines; and employing diverse Acxiom assets to create mutually beneficial client engagements. Prior to joining Acxiom, he was employed by EDS where he most recently was vice president of Banking & Capital Markets for the financial services industry. In his 20 years at EDS, Mr. Donovan served in numerous sales and sales leadership roles and was often enlisted to create or reinvigorate large sales organizations responsible for billions of dollars in revenue. He holds a bachelor’s degree in public administration from George Mason University.
Jerry C. Jones, age 55, is the Company’s chief legal officer, senior vice president and assistant secretary. He joined Acxiom in 1999, oversees legal and privacy matters and assists in the strategy and execution of mergers and alliances and the Company’s strategic initiatives. Prior to joining Acxiom, he was employed for 19 years as an attorney with the Rose Law Firm in Little Rock, Arkansas, representing a broad range of business interests. He was a member of the board of directors of Entrust, Inc. until it was purchased by private investors in 2009, and he is chairman of the board of the Arkansas Virtual Academy, a statewide online public school. Mr. Jones holds a juris doctorate degree and a bachelor’s degree in public administration from the University of Arkansas.
Cindy K. Childers, age 51, is the Company's senior vice president – human resources. She joined Acxiom in 1985. In her current role, Ms. Childers leads strategic planning and execution in the areas of human resources, business culture, organizational effectiveness, associate development, recruiting and talent management. Previously, she served as leader of the financial services business unit and oversaw all of the financial and accounting functions of the Company. Before joining Acxiom, she was a certified public accountant in audit and tax for KPMG Peat Marwick. Ms. Childers holds a bachelor’s degree in business administration from the University of Central Arkansas.
Timothy J. Suther, age 50, is the Company’s chief marketing officer and senior vice president. Mr. Suther joined Acxiom in 2005 and is responsible for the Company’s global marketing, strategy and business development activities. Previously, he led the Company’s worldwide digital, agency and multichannel marketing services business. Prior to joining Acxiom, Mr. Suther served for three years at Metavante, a leading provider of banking and payment technology solutions, most recently as senior vice president and general manager of its Response Data Corporation subsidiary, a provider of consumer funds transfer services. For the preceding five years he was president of Protagona Worldwide, a then publicly traded global provider of enterprise marketing software. Earlier, he held various leadership positions at Unisys, a global information services provider. He is a member of the Board of Advisors for Loyalty 360, and the North American Advisory Board for the CMO Council. He is also a former member of the executive board of directors for the Sam M. Walton College of Business Center for Retailing Excellence at the University of Arkansas, and the former co-chair of the iDirect Leadership Committee of the Direct Marketing Association. Mr. Suther holds a degree in finance and marketing from Loras College in Dubuque, Iowa.
12
The risks described below could materially and adversely affect our business, financial condition and results of future operations. These risks are not the only ones we face. Our business operations could also be impaired by additional risks and uncertainties that are not presently known to us or that we currently consider immaterial.
We are dependent on our management and other personnel, and the failure to attract and retain such individuals could adversely affect our operations.
We have recently experienced significant changes in our executive leadership. On March 28, 2011, John A. Meyer resigned as the Chief Executive Officer, President and a Director of the Company. The Board of Directors appointed Jerry D. Gramaglia, a member of the Company’s Board of Directors, as interim Chief Executive Officer and President of the Company, while the Board conducts a search for a permanent replacement for Mr. Meyer. Additionally, Christopher W. Wolf intends to resign as the Chief Financial Officer of the Company effective June 1, 2011.
Changes in key leadership positions within the Company, such as the addition of new personnel and the departure of existing personnel, can be disruptive, might lead to additional departures of existing personnel, and could have a material adverse effect on our business, operating results, financial results and internal controls over financial reporting.
Failure to keep up with rapidly changing technologies and marketing practices could cause our products and services to become less competitive.
The complexity and uncertainty regarding the development of new technologies affect our business greatly, as does the loss of market share through competition, and the extent and timing of market acceptance of innovative products and technology. We are also potentially affected by:
|
·
|
Longer sales cycles for our solutions due to the nature of that technology as an enterprise-wide solution;
|
|
·
|
The introduction of competent, competitive products or technologies by other companies;
|
|
·
|
Changes in the consumer and/or business information industries and markets, including the decline in the use of direct mail marketing and the ever-increasing use of alternative marketing channels such as online advertising, which could result in lower profit margins for the Company;
|
|
·
|
The ability to protect our proprietary information and technology or to obtain necessary licenses on commercially reasonable terms; and
|
|
·
|
The impact of changing legislative, judicial, accounting, regulatory, cultural and consumer environments in the geographies where our products and services are deployed.
|
Maintaining technological competitiveness in our data products, processing functionality, software systems and services is key to our continued success. Our ability to continually improve our current processes and to develop and introduce new products and services is essential in order to maintain our competitive position and meet the increasingly sophisticated requirements of our clients. If we fail to do so, we could lose clients to current or future competitors, which could result in decreased revenues, net income and earnings per share.
13
Changes in legislative, judicial, regulatory, cultural or consumer environments relating to consumer privacy or information collection and use may affect our ability to collect and use data.
There could be a material adverse impact on our business due to the enactment of legislation or industry regulations, the issuance of judicial interpretations, or simply a change in customs, arising from the increasing public concern over consumer privacy issues. In the U.S., both the Congress and the legislatures of various states have recently focused their attention on matters concerning the collection and use of consumer data. In most of the non-U.S. locations in which we do business, legislation restricting the collection and use of personal data already exists. Many times restrictions are placed on the use of data upon the occurrence of unanticipated events that rapidly drive the adoption of legislation or regulation. Restrictions could be placed upon the collection, management, aggregation and use of information, which could result in a material increase in the cost of collecting some kinds of data. In the U.S. the general data collection regime provides that non-sensitive data is usable so long as the person does not affirmatively “opt-out” of the collection of such data. In Europe the reverse is true. If the European model were adopted in the U.S. it would lead to less data being available and at a higher cost. It is also possible that we could be prohibited from collecting or disseminating certain types of data, which could in turn materially adversely affect our ability to meet our clients’ requirements, potentially resulting in decreased revenues, net income, and earnings per share.
We could experience a breach of the confidentiality of the information we hold or of the security of our computer systems.
We operate extremely complex computer systems that contain personally identifiable data. Unauthorized third parties could attempt to gain entry to such systems for the purpose of stealing data or disrupting the systems. We believe that we have taken adequate measures to protect them from intrusion, but in the event that our efforts are unsuccessful we could suffer significant harm. Further, we handle large quantities of personally identifiable information that must be maintained on a confidential basis. In the event the confidentiality of such information was compromised, we could suffer significant harm.
Data suppliers might withdraw data from us, leading to our inability to provide products and services to our clients which could lead to decreases in our operating results.
Much of the data that we use is either purchased or licensed from third parties. We compile the remainder of the data that we use from public record sources. We could suffer a material adverse effect if owners of the data we use were to withdraw the data from us. Data providers could withdraw their data from us if there is a competitive reason to do so, or if legislation is passed restricting the use of the data, or if judicial interpretations are issued restricting use of data. If a substantial number of data providers were to withdraw their data, our ability to provide products and services to our clients could be materially adversely impacted, which could result in decreased revenues, net income and earnings per share.
The nature and volume of our customer contracts may affect the predictability of our revenues.
While a significant amount of our total revenue is currently derived from clients who have long-term contracts (defined as contracts with initial terms of two years or more), these contracts have been entered into at various times and therefore some of them are in the latter part of their terms and are approaching their originally scheduled expiration dates. If renewed by the customer, the terms of the renewal contract may not have a term as long as, or may otherwise be on terms less favorable than, the original contract. Revenue from customers with long-term contracts is not necessarily “fixed” or guaranteed as portions of the revenue from these customers is volume-driven or project-related. With respect to the portion of our business that is not under long-term contract, revenues are less predictable and are almost completely volume-driven or project-related. Therefore, we must engage in continual sales efforts to maintain revenue stability and future growth with these customers. In addition, if a significant customer fails to renew a contract, our business could be negatively impacted if additional business is not obtained to replace the business which was lost.
14
Our operations outside the U.S. subject us to risks normally associated with international operations.
During the last fiscal year, we received approximately 14% of our revenues from business outside the United States. As part of our growth strategy, we plan to continue to pursue opportunities outside the U.S. and in order to do this we must continue to strengthen our foreign operations, hire additional personnel, and continue to identify and execute beneficial strategic alliances. To the extent that we are unable to do these things in a timely manner, our growth, if any, in non-U.S. revenues will be limited and our operating results could be materially adversely affected. In general, each of our foreign locations is expected to fund its own operations and cash flows, although periodically funds may be loaned or invested from the U.S. to the foreign subsidiaries. Therefore, exchange rate movements of foreign currencies may have an impact on our future costs or on future cash flows from foreign investments. We have not entered into any foreign currency forward exchange contracts or other derivative instruments to hedge the effects of adverse fluctuations in foreign currency exchange rates. From time to time we enter geographical markets where the types of products and services we offer have not been generally available. As a result of having to educate and condition those markets, it is very difficult to predict the success of such entry. Additional risks inherent in our non-U.S. business activities generally include, among others, potentially longer accounts receivable payment cycles, the costs and difficulties of managing international operations, potentially adverse tax consequences, and greater difficulty enforcing intellectual property rights. The various risks which are inherent in doing business in the United States are also generally applicable to doing business outside of the United States and may be exaggerated by the difficulty of doing business in numerous sovereign jurisdictions due to differences in culture, laws and regulations.
Loss of data center capacity or interruption of telecommunication links could adversely affect our business.
Our business is heavily dependent upon highly complex data processing capability. Our ability to protect our data centers against damage or interruption from fire, power loss, telecommunications failure or other disasters is critical to our future. The online services we provide are dependent on links to telecommunication providers. We believe we have taken reasonable precautions to protect our data centers and telecommunication links from events that could interrupt our operations. Any damage to our data centers or any failure of our telecommunications links that causes interruptions in our operations could materially adversely affect our ability to meet our clients' requirements, which could result in decreased revenues, net income, and earnings per share.
Failure to favorably negotiate or effectively integrate acquisitions or alliances could adversely affect our business.
As part of our growth strategy we may continue to acquire other complementary businesses, products and technologies or enter into joint ventures or similar strategic relationships. While we believe we will be able to successfully integrate recently acquired businesses into our existing operations, there is no certainty that future acquisitions or alliances will be consummated on acceptable terms or that we will be able to integrate successfully the services, content, products and personnel of any such transaction into our operations. In addition, any future acquisitions, joint ventures or similar relationships may cause a disruption in our ongoing business and distract our management. There is also no assurance that we would derive the revenue improvements, cost savings and other intended benefits of any such transaction. The occurrence of any of these events could result in decreased revenues, net income and earnings per share.
Our traditional direct marketing business could be negatively affected by rising postal costs, the green movement and the shift to alternative marketing channels, including online communications.
Postal rate increases are now expected to occur every year. The most recent increase in the U.S. became effective in April 2011. As postal rates rise, we expect to see increased pressure on direct mailers to leverage digital and other forms of online communication and to mail fewer pieces.
Those in the traditional direct mail business, as well as the postal service, are under growing pressure to reduce their impact on the environment. It is uncertain at this time what either marketers or the postal service will do to lessen their impact. From a postal service perspective, the actions to be taken may involve changing certain aspects of mail service that would negatively affect direct marketers. From a marketer’s perspective, such actions could have the same effect as increased rates, thereby causing them to mail fewer pieces.
We are actively investing in multichannel marketing services in addition to maintaining our ability to continue servicing traditional direct mail customers and expect to offset some of the declining revenues associated with regular mail. This dual focus could, however, result in the loss of business with some direct mailers, thereby negatively affecting us by decreasing the amount of processing services our clients purchase from us, which could result in lower revenues, net income and earnings per share.
15
Industry consolidations could result in increased competition for our products and services.
Our industry has experienced a variety of business combinations that have consolidated our competitors. The possibility of the consolidation or merger of companies who might combine forces to create a single-source provider of multiple services to the marketplace in which we compete could result in increased price competition for us which would negatively affect our business results. We currently compete against numerous providers of a single service or product in several separate market spaces. (See the discussion above under “Competition.”) Since we offer a larger variety of services than many of our current competitors, we have been able to successfully compete against them in most instances. However, the dynamics of the marketplace could be significantly altered if some of the single-service providers were to combine with each other to provide a wider variety of services.
Processing errors or delays in completing service level requirements for our clients could result in negative financial consequences.
Processing errors could result in the issuance of credits to clients, the re-performance of work, and/or the payment of damages. Likewise, the failure to meet contractual service level requirements or to meet specified goals with contractual timeframes could result in monetary penalties or lost revenue.
Our engagements with certain clients, particularly those with long-term, fixed-priced agreements, may not be profitable.
The pricing and other terms of our client contracts, particularly our long-term IT outsourcing agreements, require us to make estimates and assumptions at the time we enter into these contracts that could differ from actual results. These estimates reflect our best judgments regarding the nature of the engagement and our expected costs to provide the contracted services. Any increased or unexpected costs or unanticipated delays in connection with the performance of these engagements, including delays caused by factors outside our control, could make these contracts less profitable or unprofitable, which would have an adverse affect on our profit margin. Our exposure to this risk increases generally in proportion to the scope of the client contract and is higher in the early stages of such a contract. In addition, a majority of our IT outsourcing contracts contain some fixed-price, incentive-based or other pricing terms that condition our fee on our ability to meet defined goals. Our failure to meet a client's expectations in any type of contract may result in an unprofitable engagement which could adversely affect our operating results.
Our ability to recover significant up-front capital investments required by certain client contracts is subject to risks.
A few of our client contracts require significant investment in the early stages which is expected to be recovered through billings over the life of the contract. These contracts often involve the construction of new computer systems and communications networks and the development and deployment of new technologies. Substantial performance risk exists in each contract with these characteristics, and some or all elements of service delivery under these contracts are dependent upon successful completion of the development, construction and deployment phases. Failure to recover such capital investments could materially adversely affect our operating results.
Deterioration of economic conditions could negatively impact our business.
Our business may be adversely affected by changes in national or global economic conditions, including inflation, interest rates, availability of capital markets, consumer spending rates, and the effects of governmental initiatives to manage economic conditions. Any such changes could adversely affect our customers’ desire and ability to engage our services, thereby negatively affecting our financial results.
The recent disruptions in credit and other financial markets and deterioration of national and global economic conditions, could, among other things:
16
|
·
|
make it more difficult or costly for us to obtain financing for our operations or investments or to refinance our debt in the future;
|
|
·
|
cause our lenders to depart from prior credit industry practice and make more difficult or expensive the granting of any technical or other waivers under our credit agreements to the extent we may seek them in the future;
|
|
·
|
impair the financial condition of some of our customers and suppliers, thereby increasing customer bad debts;
|
|
·
|
decrease the value of our investments in equity and debt securities; and
|
|
·
|
impair the financial viability of our insurers.
|
Not applicable.
[THIS SPACE LEFT BLANK INTENTIONALLY]
17
Acxiom is headquartered in Little Rock, Arkansas with additional locations around the United States. We also have operations in Europe, Asia-Pacific, the Middle East and South America. In general, our facilities are in good condition, and we believe that they are adequate to meet our current needs. We do not anticipate that any substantial additional properties will be required for our existing business during fiscal year 2012. The table below sets forth the location, ownership and general use of our principal properties currently being used by each business segment.
|
Location
|
Held
|
Use
|
Business Segment
|
|
United States:
|
|||
|
Conway, Arkansas
|
Eleven facilities held in fee
|
Data center; office space
|
Information Services and Information Products
|
|
Fayetteville, Arkansas
|
Lease
|
Office space
|
Information Services and Information Products
|
|
Little Rock, Arkansas
|
Two buildings held in fee
|
Principal executive offices; office space; data center
|
Information Services and Information Products
|
|
Foster City, California
|
Lease
|
Office space
|
Information Services
|
|
Broomfield, Colorado
|
Lease
|
Office space
|
Information Services and Information Products
|
|
Cape Coral, Florida
|
Lease
|
Office space
|
Information Products
|
|
Chicago, Illinois
|
Lease
|
Data center; office space
|
Information Services
|
|
Downers Grove, Illinois
|
Lease
|
Data center; office space
|
Information Services
|
|
Shoreview, Minnesota
|
Lease
|
Office space
|
Information Services
|
|
New York, New York
|
Two leased offices
|
Office space
|
Information Services and Information Products
|
|
Fairlawn, Ohio
|
Lease
|
Office space
|
Information Products
|
|
Independence, Ohio
|
Lease
|
Office space
|
Information Products
|
|
Memphis, Tennessee
|
Lease
|
Office space
|
Information Services
|
|
Nashville, Tennessee
|
Lease
|
Office space
|
Information Services
|
|
Europe:
|
|||
|
London, England
|
Lease
|
Office space
|
Information Services and Information Products
|
|
Normanton, England
|
Lease
|
Data center; office space
|
Information Services and Information Products
|
18
|
Sunderland, England
|
Lease
|
Data center; fulfillment service center; office space; warehouse space
|
Information Services and Information Products
|
|
Paris, France
|
Lease
|
Data center; office space
|
Information Services and Information Products
|
|
Frankfurt, Germany
|
Lease
|
Office space
|
Information Services and Information Products
|
|
Munich, Germany
|
Lease
|
Office space
|
Information Services and Information Products
|
|
Gdansk, Poland
|
Lease
|
Office space
|
Information Services and Information Products
|
|
Warsaw, Poland
|
Lease
|
Office space
|
Information Services and Information Products
|
|
Australia:
|
|||
|
Sydney, Australia
|
Lease
|
Office space
|
Information Services and Information Products
|
|
China:
|
|||
|
Shanghai, China
|
Lease
|
Office space
|
Information Services and Information Products
|
|
Nantong, China
|
Lease
|
Data center; office space
|
Information Services
|
|
Saudi Arabia:
|
|||
|
Jeddah, Saudi Arabia
|
Lease
|
Office space
|
Information Services and Information Products
|
|
South America:
|
|||
|
Porto Alegre, Brazil
|
Lease
|
Office space
|
Information Services and Information Products
|
19
The Company is involved in various claims and litigation matters that arise in the ordinary course of the business. None of these, however, are believed by management to be material in their nature or scope, except those incorporated by reference under this Part I, Item 3.
Please refer to the discussion of certain legal proceedings pending against the Company in the Financial Supplement to this Annual Report on Form 10-K, Notes to Consolidated Financial Statements, Note 11 Commitments and Contingencies, Legal Matters, which discussion is incorporated herein by reference.
Item 4. Reserved
PART II
Market Information
The outstanding shares of Acxiom’s common stock are listed and traded on the NASDAQ Global Select Market and trade under the symbol ACXM. The following table reflects the range of high and low sales prices of Acxiom’s common stock as reported by NASDAQ Online for each quarter in fiscal 2011 and 2010.
|
Fiscal 2011
|
High
|
Low
|
Dividend Declared
|
||
|
Fourth Quarter
|
$ 18.83
|
$ 12.58
|
-
|
||
|
Third Quarter
|
18.79
|
15.38
|
-
|
||
|
Second Quarter
|
16.75
|
12.19
|
-
|
||
|
First Quarter
|
19.99
|
14.51
|
-
|
|
Fiscal 2010
|
High
|
Low
|
Dividend Declared
|
||
|
Fourth Quarter
|
$ 18.74
|
$ 13.50
|
-
|
||
|
Third Quarter
|
14.41
|
9.07
|
-
|
||
|
Second Quarter
|
10.20
|
7.76
|
-
|
||
|
First Quarter
|
12.59
|
7.25
|
-
|
Holders
As of May 25, 2011 the approximate number of record holders of the Company’s common stock was 2,050.
Dividends
In November 2008, the board of directors suspended dividend payments on the Company’s common stock. Prior to that, dividends of $.06 per share were paid in the first two quarters of fiscal year 2009. The board may reconsider reinstituting dividend payments in the future but has no plans to reinstate them in the short term.
20
Performance Graph
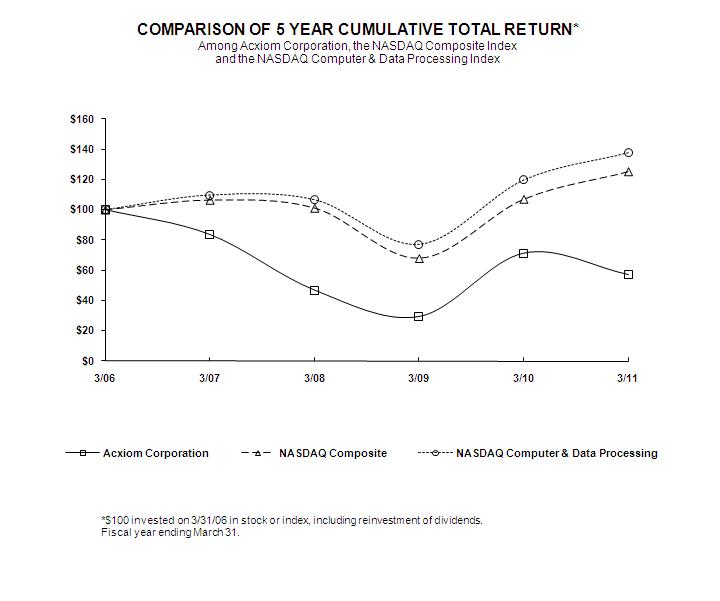
The following graph compares the cumulative five-year total return to shareholders on Acxiom's common stock relative to the cumulative total returns of the NASDAQ Composite index and the NASDAQ Computer & Data Processing index. The graph assumes that the value of the investment in the company's common stock and in each of the indexes (including reinvestment of dividends) was $100 on March 31, 2006, and tracks it through March 31, 2011.
21
Purchases of Equity Securities by the Issuer and Affiliated Purchasers
Not applicable.
Securities Authorized for Issuance Under Equity Compensation Plans
The following table contains information about our common stock which may be issued upon the exercise of options under our existing equity compensation plans as of the end of fiscal 2011 (March 31, 2011):
|
Plan category
|
Number of securities
to be issued upon
exercise of
outstanding options,
warrants and rights
|
Weighted-average
exercise price of
outstanding options,
warrants and rights
|
Number of securities
available for future issuance
under equity compensation
plans (excluding securities
reflected in column (a))
|
||
|
(a)
|
(b)
|
(c)
|
|||
|
Equity compensation plans approved by shareholders
|
9,328,2391
|
$20.95
|
5,343,658
|
||
|
Equity compensation plans not approved by shareholders
|
198,7502
|
11.19
|
149,884
|
||
|
Total
|
9,526,989
|
$20.75
|
5,493,542
|
||
|
1
|
This figure represents stock options issued under shareholder-approved stock option plans, 58,620 of which options were assumed in connection with our acquisitions of May & Speh, Inc. in 1998 and Digital Impact, Inc. in 2006.
|
||||
|
2
|
Issued pursuant to the Company’s 2008 Nonqualified Equity Compensation Plan described below, which does not require shareholder approval under the exception provided for in NASDAQ Marketplace Rule 5635(c)(4).
|
||||
Equity Compensation Plans Not Approved By Security Holders
The Company adopted the 2008 Nonqualified Equity Compensation Plan of Acxiom Corporation (the “2008 Plan”) for the purpose of making equity grants to induce new key executives to join the Company. The awards that may be made under the 2008 Plan include stock options, stock appreciation rights, restricted stock awards, RSU awards, performance awards, performance shares, performance units, qualified-performance based awards, or other stock unit awards. In order to receive such an award, a person must be newly employed with the Company with the award being provided as an inducement material to their employment, provided the award is first properly approved by the board of directors or an independent committee of the board. The board of directors and its compensation committee are the administrators of the 2008 Plan, and as such, determine all matters relating to awards granted under the 2008 Plan, including the eligible recipients, whether and to what extent awards are to be granted, the number of shares to be covered by each grant and the terms and conditions of the awards. The 2008 Plan has not been approved by the Company’s shareholders.
22
For information pertaining to selected financial data of Acxiom, refer to page F-2 of the Financial Supplement, which is attached hereto and incorporated herein by reference.
The information required by this item appears in the Financial Supplement at pp. F-3 – F-19, which is attached hereto and incorporated herein by reference.
Acxiom’s earnings are affected by changes in short-term interest rates primarily as a result of its term loan agreement and its revolving credit agreement, which bear interest at a floating rate. Acxiom currently uses an interest rate swap agreement to mitigate the interest rate risk on $95 million of its term loan. Risk can be estimated by measuring the impact of a near-term adverse movement of one percentage point in short-term market interest rates. If short-term market interest rates increase one percentage point during the next four quarters compared to the previous four quarters, there would be no material adverse impact on Acxiom’s results of operations. Acxiom has no material future earnings or cash flow expenses from changes in interest rates related to its other long-term debt obligations, as substantially all of Acxiom’s remaining long-term debt instruments have fixed rates. At both March 31, 2011 and 2010, the fair value of the Company’s fixed rate long-term obligations approximated carrying value.
Acxiom has a presence in the United Kingdom, France, Germany, Poland, Saudi Arabia, Brazil, Australia and China. In general, each of the foreign locations is expected to fund its own operations and cash flows, although funds may be loaned or invested from the U.S. to the foreign subsidiaries. Therefore, exchange rate movements of foreign currencies may have an impact on Acxiom’s future costs or on future cash flows from foreign investments. Acxiom has not entered into any foreign currency forward exchange contracts or other derivative instruments to hedge the effects of adverse fluctuations in foreign currency exchange rates.
The financial statements required by this item appear in the Financial Supplement at pp. F-23 – F-57, which is attached hereto and incorporated herein by reference.
Not applicable.
Evaluation of Disclosure Controls and Procedures
As of March 31, 2011, under the supervision and with the participation of our management, including our Chief Executive Officer (principal executive officer) and our Chief Financial Officer (principal financial and accounting officer), we evaluated the effectiveness of our disclosure controls and procedures as defined in Rules 13a-15(e) and 15d-15(e) under the Securities Exchange Act of 1934, as amended (“Exchange Act”). Based on this evaluation, our management, including our Chief Executive Officer and our Chief Financial Officer, concluded that as of March 31, 2011, our disclosure controls and procedures were effective to ensure that information required to be disclosed by the Company in reports that it files or submits under the Exchange Act is (i) recorded, processed, summarized and reported within the time periods specified in the Securities and Exchange Commission rules and forms; and (ii) accumulated and communicated to the Company's management, including its principal executive officer and principal financial officer, as appropriate to allow timely decisions regarding required disclosure.
Management’s Report on Internal Control over Financial Reporting
Management’s report on Acxiom’s internal control over financial reporting (as such term is defined in Rules 13a-15(f) and 15d-15(f) under the Exchange Act), and the related report of Acxiom’s independent public accounting firm, are included in the Financial Supplement on pages F-19 and F-21, respectively, and are incorporated by reference.
23
Changes in Internal Controls over Financial Reporting
There has been no change in our internal control over financial reporting that occurred during our last fiscal quarter that has materially affected, or is reasonably likely to materially affect, our internal control over financial reporting.
Not applicable.
PART III
Please see the information concerning our executive officers contained in Part I of this Annual Report on Form 10-K under the caption “Executive Officers of the Registrant” which is included there pursuant to Instruction 3 to Item 401(b) of the SEC’s Regulation S-K.
The Acxiom board of directors has adopted a code of ethics applicable to our principal executive, financial and accounting officers and all other persons performing similar functions. A copy of this code of ethics is posted on Acxiom’s website at www.acxiom.com under the Corporate Governance section of the site. The remaining information required by this item appears under the captions “Election of Directors,” and “Section 16(a) Beneficial Ownership Reporting Compliance” in Acxiom's 2011 Proxy Statement, which information is incorporated herein by reference.
The information required by this item appears under the heading “Executive Compensation” in Acxiom's 2011 Proxy Statement, which information is incorporated herein by reference.
The information required by this item appears under the heading “Stock Ownership” in Acxiom's 2011 Proxy Statement, which information is incorporated herein by reference.
The information required by this item appears under the headings “Related-Party Transactions” and “Board and Committee Matters” in Acxiom's 2011 Proxy Statement, which information is incorporated herein by reference.
The information required by this item appears under the heading “Ratification of Independent Registered Public Accountant - Fees Billed for Services Rendered by Independent Auditor” in Acxiom's 2011 Proxy Statement, which information is incorporated herein by reference.
24
PART IV
(a) The following documents are filed as a part of this report:
|
1.
|
Financial Statements.
|
The following consolidated financial statements of the registrant and its subsidiaries included in the Financial Supplement and the Independent Auditors' Reports thereof are attached hereto. Page references are to page numbers in the Financial Supplement.
|
Page
|
||
| Reports of Independent Registered Public Accounting Firm | F-21- F-22 | |
| Consolidated Balance Sheets as of March 31, 2011 and 2010 | F-23 | |
| Consolidated Statements of Operations for the years ended March 31, 2011, 2010 and 2009 | F-24 | |
| Consolidated Statements of Equity and Comprehensive Income (Loss) for the years ended March 31, 2011, 2010 and 2009 | F-25 | |
| Consolidated Statements of Cash Flows for the years ended March 31, 2011, 2010 and 2009 | F-26 - F-27 | |
| Notes to the Consolidated Financial Statements | F-28- F-57 | |
|
2.
|
Financial Statement Schedules.
|
All schedules are omitted because they are not applicable or not required or because the required information is included in the consolidated financial statements or notes thereto.
|
3.
|
Exhibits.
|
The following exhibits are filed with this report or are incorporated by reference to previously filed material:
Exhibit No.
|
3.1
|
Amended and Restated Certificate of Incorporation (previously filed as Exhibit 3(i) to Acxiom Corporation's Quarterly Report on Form 10-Q for the quarterly period ended June 30, 1996, Commission File No. 0-13163, and incorporated herein by reference)
|
|
3.2
|
Amended and Restated Bylaws (previously filed as Exhibit 3(b) to Acxiom Corporation’s Annual Report on Form 10-K for the fiscal year ended March 31, 2008, and incorporated herein by reference)
|
|
10.1
|
2005 Stock Purchase Plan of Acxiom Corporation (previously filed as Appendix B to Acxiom Corporation’s Proxy Statement dated June 24, 2005, and incorporated herein by reference)
|
|
10.2
|
Amended and Restated Key Associate Stock Option Plan of Acxiom Corporation (previously filed as Exhibit 10(e) to Acxiom Corporation’s Annual Report on Form 10-K for the fiscal year ended March 31, 2000, Commission File No. 0-13163, and incorporated herein by reference)
|
|
10.3
|
2005 Equity Compensation Plan of Acxiom Corporation (formerly known as the Amended and Restated 2000 Associate Stock Option Plan of Acxiom Corporation) (previously filed as Appendix B to Acxiom Corporation’s Proxy Statement dated November 16, 2007, and incorporated herein by reference)
|
25
|
10.4
|
2008 Nonqualified Equity Compensation Plan of Acxiom Corporation (previously filed on May 15, 2008, as Exhibit 10.2 to Acxiom Corporation’s Current Report on Form 8-K, and incorporated herein by reference)
|
|
10.5
|
Acxiom Corporation U.K. Share Option Scheme (previously filed as Exhibit 10(f) to Acxiom Corporation's Annual Report on Form 10-K for the fiscal year ended March 31, 1997, Commission File No. 0-13163, and incorporated herein by reference)
|
|
10.6
|
2010 Executive Cash Incentive Plan of Acxiom Corporation (previously filed as Exhibit 10(g) to Acxiom Corporation’s Annual Report on Form 10-K for the fiscal year ended March 31, 2010, and incorporated herein by reference)
|
|
10.7
|
Acxiom Corporation Executive Officer FY 2012 Cash Incentive Plan
|
|
10.8
|
General Electric Capital Corporation Master Lease Agreement, dated as of September 30, 1999 (previously filed as Exhibit 10(m) to Acxiom Corporation’s Annual Report on Form 10-K for the fiscal year ended March 31, 2001, Commission File No. 0-13163, and incorporated herein by reference)
|
|
10.9
|
Amendment to General Electric Capital Corporation Master Lease Agreement dated as of December 6, 2002 (previously filed as Exhibit 10 (j) to Acxiom Corporation’s Annual Report of Form 10-K for the fiscal year ended March 31, 2003, Commission File No. 0-13163, and incorporated herein by reference)
|
|
10.10
|
Third Amended and Restated Credit Agreement dated as of March 24, 2005, by and among Acxiom Corporation, as borrower, J.P. Morgan, N.A., as agent, and the lenders who are party thereto (previously filed as Exhibit 10.2 to Acxiom Corporation’s Current Report on Form 8-K dated March 24, 2005, and incorporated herein by reference)
|
|
10.11
|
Second Amendment to Third Amended and Restated Credit Agreement, dated as of April 22, 2005, by and among Acxiom Corporation, as borrower, J.P. Morgan, N.A., as agent, and the lenders who are a party thereto (previously filed as Exhibit 10(j) to Acxiom Corporation’s Annual Report on Form 10-K for the fiscal year ended March 31, 2005, Commission File No. 0-13163, and incorporated herein by reference)
|
|
10.12
|
First Amendment to Fourth Amended and Restated Credit Agreement dated as of November 13, 2009, among Acxiom Corporation, a Delaware corporation, the lenders party thereto and JPMorgan Chase Bank, N.A. (previously filed on November 19, 2009, as Exhibit 10.1 to Acxiom Corporation’s Current Report on Form 8-K, and incorporated herein by reference)
|
|
10.13
|
Increased Commitment Supplement to Third Amended and Restated Credit Agreement, dated as of May 13, 2005, by and among Acxiom Corporation, as borrower, J.P. Morgan, N.A., as agent, and the lenders who are a party thereto (previously filed as Exhibit 10(k) to Acxiom Corporation’s Annual Report on Form 10-K for the fiscal year ended March 31, 2005, Commission File No. 0-13163, and incorporated herein by reference)
|
|
10.14
|
Assignment of Head Lease dated as of February 10, 2003, by and between Wells Fargo Bank Northwest, National Association, as Owner Trustee under the AC Trust 2001-1 (“Assignor”) and Acxiom Corporation, assigning all of Assignor’s rights, title and interest in that certain Head Lease Agreement dated as of May 1, 2000, between the City of Little Rock, AR and Assignor, each relating to the lease of an office building in downtown Little Rock which was previously financed pursuant to a terminated synthetic real estate facility (previously filed as Exhibit 10 (l) to Acxiom Corporation’s Annual Report of Form 10-K for the fiscal year ended March 31, 2003, Commission File No. 0-13163, and incorporated herein by reference)
|
|
10.15
|
Form of Executive Security Agreement effective as of April 8, 2008 (previously filed as Exhibit 10(n) to Acxiom Corporation’s Annual Report on Form 10-K for the fiscal year ended March 31, 2008 and incorporated herein by reference)
|
|
10.16
|
Asset Purchase and License Agreement dated December 29, 2005, between Acxiom Corporation and EMC Corporation and EMC (Benelux) B.V., S.à.r.l. (previously filed as Exhibit 10(s) to Acxiom Corporation's Annual Report on Form 10-K for the fiscal year ended March 31, 2008, and incorporated herein by reference)
|
26
|
10.17
|
Transition Amendment dated March 31, 2008, between Acxiom Corporation and EMC Corporation and EMC (Benelux) B.V., S.à.r.l. (previously filed as Exhibit 10(t) to Acxiom Corporation’s Annual Report on Form 10-K for the fiscal year ended March 31, 2008, and incorporated herein by reference)
|
|
10.18
|
Transition Agreement dated March 28, 2011, between Acxiom Corporation and John A. Meyer (previously filed on March 30, 2011, as Exhibit 10.1 to Acxiom Corporation’s Current Report on Form 8-K, and incorporated herein by reference)
|
|
|
|
10.19
|
Retention Agreement dated May 6, 2011, between Acxiom Corporation and Christopher W. Wolf (previously filed on May 9, 2011, as Exhibit 10.1 to Acxiom Corporation’s Current Report on Form 8-K, and incorporated herein by reference)
|
|
10.20
|
Amended and Restated Employment Agreement dated November 15, 2010, between Acxiom Corporation and John A. Adams (previously filed on November 16, 2010 as Exhibit 10.2 to Acxiom Corporation’s Current Report on Form 8-K, and incorporated herein by reference)
|
|
10.21
|
Acxiom Corporation 2010 Executive Officer Severance Policy (previously filed on November 16, 2010 as Exhibit 10.3 to Acxiom Corporation’s Current Report on Form 8-K, and incorporated herein by reference)
|
|
10.22
|
Form of director indemnity agreement (previously filed as Exhibit 10(x) to Acxiom Corporation’s Annual Report on Form 10-K for the fiscal year ended March 31, 2010, and incorporated herein by reference)
|
|
10.23
|
Form of officer and director indemnity agreement (previously filed as Appendix C to Acxiom Corporation’s Proxy Statement dated January 22, 1987)
|
|
|
|
21
|
Subsidiaries of Acxiom Corporation
|
|
23
|
Consent of KPMG LLP
|
|
24
|
Powers of Attorney
|
|
31(1)
|
Certification of Chief Executive Officer pursuant to SEC Rule 13a-14(a)/15d-14(a), as adopted pursuant to Sections 302 and 404 of the Sarbanes-Oxley Act of 2002
|
|
31(2)
|
Certification of Chief Financial Officer pursuant to SEC Rule 13a-14(a)/15d-14(a), as adopted pursuant to Sections 302 and 404 of the Sarbanes-Oxley Act of 2002
|
|
32(1)
|
Certification of Chief Executive Officer pursuant to 18 U.S.C. Section 1350, as adopted pursuant to Section 906 of the Sarbanes-Oxley Act of 2002
|
|
32(2)
|
Certification of Chief Financial Officer pursuant to 18 U.S.C. Section 1350, as adopted pursuant to Section 906 of the Sarbanes-Oxley Act of 2002
|
|
101
|
The following financial information from our Annual Report on Form 10-K for the fiscal year ended March 31, 2011, formatted in XBRL: (i) Consolidated Balance Sheets as of March 31, 2011 and 2010; (ii) Consolidated Statements of Operations for the fiscal years ended March 31, 2011, 2010 and 2009; (iii) Consolidated Statements of Equity and Comprehensive Income (Loss) for the fiscal years ended March 31, 2011, 2010 and 2009; (iv) Consolidated Statements of Cash Flows for the fiscal years ended March 31, 2011, 2010 and 2009; and (v) Notes to the Consolidated Financial Statements
|
27
Pursuant to the requirements of Section 13 or 15(d) of the Securities Exchange Act of 1934, the registrant has duly caused this report to be signed on its behalf by the undersigned, thereunto duly authorized.
ACXIOM CORPORATION
|
Date: May 27, 2011
|
By:
|
/s/ Catherine L. Hughes
|
|
|
Catherine L. Hughes
Corporate Governance Officer & Secretary
|
Pursuant to the requirements of the Securities Exchange Act of 1934, this report has been signed below by the following persons on behalf of the registrant and in the capacities and on the dates indicated.
Signature
|
William T. Dillard II*
|
Director
|
May 27, 2011
|
William T. Dillard II
|
Michael J. Durham*
|
Director (Non-Executive Chairman of the Board)
|
May 27, 2011
|
Michael J. Durham
|
Jerry D. Gramaglia*
|
Director, CEO & President (principal executive officer)
|
May 27, 2011
|
|
Jerry D. Gramaglia
|
|
|
Ann Die Hasselmo*
|
Director
|
May 27, 2011
|
Ann Die Hasselmo
|
William J. Henderson*
|
Director
|
May 27, 2011
|
William J. Henderson
|
Clark M. Kokich*
|
Director
|
|
May 27, 2011
|
|
Clark M. Kokich
|
|
|
Kevin M. Twomey*
|
Director
|
May 27, 2011
|
|
Kevin M. Twomey
|
|
|
R. Halsey Wise*
|
Director
|
May 27, 2011
|
R. Halsey Wise
|
Christopher W. Wolf*
Christopher W. Wolf
|
CFO & Executive Vice President (principal financial
and accounting officer)
|
May 27, 2011
|
|
*By:
|
/s/ Catherine L. Hughes
|
Catherine L. Hughes
Attorney-in-Fact
28
|
Selected Financial Data
|
F-2 | |||
|
Management’s Discussion and Analysis of Financial Condition and Results of Operations
|
F-3 | |||
|
Management’s Report on Internal Control Over Financial Reporting
|
F-20 | |||
|
Reports of Independent Registered Public Accounting Firm
|
F-21 | |||
|
Annual Financial Statements:
|
||||
|
Consolidated Balance Sheets as of March 31, 2011 and 2010
|
F-23 | |||
|
Consolidated Statements of Operations for the years ended March 31, 2011, 2010 and 2009
|
F-24 | |||
|
Consolidated Statements of Equity and Comprehensive Income (Loss)
for the years ended March 31, 2011, 2010 and 2009
|
F-25 | |||
|
Consolidated Statements of Cash Flows
for the years ended March 31, 2011, 2010 and 2009
|
F-26 | |||
|
Notes to the Consolidated Financial Statements
|
F-28 |
F-1
ACXIOM CORPORATION
SELECTED FINANCIAL DATA
(In thousands, except per share data)
|
Years ended March 31,
|
2011
|
2010
|
2009
|
2008
|
2007
|
|||||||||||||||
|
Statement of operations data:
|
||||||||||||||||||||
|
Revenue
|
$ | 1,159,970 | $ | 1,099,235 | $ | 1,276,573 | $ | 1,384,079 | $ | 1,390,511 | ||||||||||
|
Net earnings (loss)
|
$ | (28,442 | ) | $ | 44,159 | $ | 37,504 | $ | (7,780 | ) | $ | 67,873 | ||||||||
|
Net earnings (loss) attributable to Acxiom
|
$ | (23,147 | ) | $ | 44,549 | $ | 37,504 | $ | (7,780 | ) | $ | 67,873 | ||||||||
|
Earnings (loss) per share:
|
||||||||||||||||||||
|
Basic
|
$ | (0.36 | ) | $ | 0.56 | $ | 0.48 | $ | (0.10 | ) | $ | 0.82 | ||||||||
|
Diluted
|
$ | (0.36 | ) | $ | 0.55 | $ | 0.48 | $ | (0.10 | ) | $ | 0.80 | ||||||||
|
Earnings (loss) per share attributable to Acxiom stockholders:
|
||||||||||||||||||||
|
Basic
|
$ | (0.29 | ) | $ | 0.56 | $ | 0.48 | $ | (0.10 | ) | $ | 0.82 | ||||||||
|
Diluted
|
$ | (0.29 | ) | $ | 0.56 | $ | 0.48 | $ | (0.10 | ) | $ | 0.80 | ||||||||
|
Cash dividend per common share
|
$ | 0.00 | $ | 0.00 | $ | 0.12 | $ | 0.12 | $ | 0.22 | ||||||||||
|
As of March 31,
|
2011 | 2010 | 2009 | 2008 | 2007 | |||||||||||||||
|
Balance sheet data:
|
||||||||||||||||||||
|
Current assets
|
$ | 459,250 | $ | 458,705 | $ | 458,522 | $ | 384,508 | $ | 380,495 | ||||||||||
|
Current liabilities
|
$ | 229,494 | $ | 255,056 | $ | 254,554 | $ | 339,626 | $ | 387,788 | ||||||||||
|
Total assets
|
$ | 1,306,625 | $ | 1,363,420 | $ | 1,366,792 | $ | 1,471,304 | $ | 1,623,523 | ||||||||||
|
Long-term debt, excluding current installments
|
$ | 394,260 | $ | 458,629 | $ | 537,272 | $ | 575,308 | $ | 648,879 | ||||||||||
|
Total equity
|
$ | 591,033 | $ | 578,497 | $ | 503,414 | $ | 496,256 | $ | 485,225 | ||||||||||
This information should be read in conjunction with “Management’s Discussion and Analysis of Financial Condition and Results of Operations” and the historical financial statements and related notes. The historical results are not necessarily indicative of results to be expected in any future period.
F-2
Management’s Discussion and Analysis of Financial Condition and Results of Operations
Introduction and Overview
Acxiom is a recognized leader in marketing services and technology that enable marketers to successfully manage audiences, personalize consumer experiences and create profitable customer relationships. Our superior industry-focused, consultative approach combines consumer data and analytics, databases, data integration and consulting solutions for personalized, multichannel marketing strategies. Acxiom leverages over 40 years of experience in data management to deliver high-performance, highly secure, reliable information management services. Founded in 1969, Acxiom is headquartered in Little Rock, Arkansas, USA and serves clients around the world from locations in the United States, Europe, South America, Asia-Pacific and the Middle East.
As the Company completes fiscal 2011 and looks ahead to 2012 the Company is in a transition. The most significant challenges facing the Company involve putting in place a new management team and growing the business for the long term. The Company’s board of directors is searching for a new CEO and expects to search for a new CFO once the new CEO is in place.
Fiscal 2011 revenue growth overall was 5.5% compared to the previous year. The Products segment ended the year strong, but Services was flat in the fourth quarter due to the loss of an Infrastructure Management client during the fourth quarter. Going into fiscal 2012, we expect current trends to continue although the mix of business growth may be different, with core data and marketing services business growth offsetting a challenging year in the Infrastructure Management business due to the client loss.
Highlights of the most recently completed fiscal year are identified below.
|
·
|
Revenue of $1.160 billion, up 5.5 percent from $1.099 billion a year ago, an increase of $60.7 million in annual revenue.
|
|
·
|
Income from operations of $30.9 million compared to $98.8 million last year.
|
|
·
|
Diluted earnings (loss) per share attributable to Acxiom stockholders of ($0.29) compared to $0.56 in fiscal 2010.
|
|
·
|
Pre-tax earnings of $5.6 million, compared to pre-tax earnings of $76.8 million in fiscal 2010.
|
|
·
|
Operating cash flow for the fiscal year was $166.2 million compared to $239.3 million in the prior year.
|
|
·
|
Gross margin was 23.7 percent, compared to 23.6 percent for fiscal 2010.
|
|
·
|
The Company recorded an impairment charge of $79.7 million related to its International operations.
|
|
·
|
The Company recorded $4.4 million in restructuring charges and adjustments included in gains, losses and other items in the consolidated statement of operations.
|
|
·
|
The Company recorded a $3.3 million loss in gains, losses and other items in the consolidated statement of operations resulting from the disposal of its operations in Portugal and The Netherlands.
|
|
·
|
The Company made term loan prepayments of $66.0 million.
|
|
·
|
The Company completed the acquisitions of 100% of the outstanding shares of a digital marketing business (“XYZ”) operating in Australia and New Zealand, and a 70% interest in GoDigital Tecnologia E Participacoes, Ltda. (“GoDigital”), a Brazilian marketing services business.
|
The highlights above are intended to identify to the reader some of the more significant events and transactions of the Company during the fiscal year ended March 31, 2011. However, these highlights are not intended to be a full discussion of the Company’s 2011 fiscal year. These highlights should be read in conjunction with the following discussion of Results of Operations and Capital Resources and Liquidity and with the Company’s consolidated financial statements and footnotes accompanying this report.
F-3
Results of Operations
A summary of selected financial information for each of the years in the three-year period ended March 31, 2011 is presented below (dollars in millions, except per share amounts):
|
2011
|
2010
|
2009
|
% Change
2011-2010
|
% Change
2010-2009
|
||||||||||||||||
|
Revenue
|
||||||||||||||||||||
|
Services
|
$ | 893.6 | $ | 849.4 | $ | 920.3 | 5 | % | (8 | )% | ||||||||||
|
Products
|
266.4 | 249.8 | 356.3 | 7 | (30 | ) | ||||||||||||||
| $ | 1,160.0 | $ | 1,099.2 | $ | 1,276.6 | 6 | % | (14 | )% | |||||||||||
|
Total operating costs and expenses
|
1,129.1 | 1,000.4 | 1,183.7 | (13 | ) | 15 | ||||||||||||||
|
Income from operations
|
$ | 30.9 | $ | 98.8 | $ | 92.9 | (69 | )% | 6 | % | ||||||||||
|
Diluted earnings (loss) per share attributable to Acxiom shareholders
|
$ | (0.29 | ) | $ | 0.56 | $ | 0.48 | (152 | )% | 17 | % | |||||||||
Revenues
For the fiscal year ended March 31, 2011, the Company’s revenue was $1,160.0 million, a 5.5% or $60.7 million increase from fiscal 2010 revenue of $1,099.2 million. Of the revenue increase, $10.1 million related to the MENA and GoDigital acquisitions. Excluding unfavorable exchange rate movements of $2.7 million and the acquisition-related revenue, International operations revenue had an overall decrease of $3.5 million from the prior year. The remaining $57.4 million net revenue increase in US operations revenue was primarily attributed to growth in Infrastructure Management services of $26.9 million from new contracts, a rebound in Consumer Insights products ($9.9 million), and increasing background screening revenue ($10.6 million) resulting from increased hiring trends.
For the fiscal year ended March 31, 2010, the Company’s revenue was $1,099.2 million, compared to revenue of $1,276.6 million in fiscal 2009, reflecting a decrease of $177.3 million or 13.9%. Fiscal 2010 revenue was lower due to a change in a pass-through data contract. Effective February 1, 2009, the pass-through revenue was recorded net rather than gross.
Fiscal 2009 revenue included $71.3 million related to the pass-through contract. Excluding this item, revenue declined 8.8%. Of the revenue decline, $52.0 million was attributable to reductions in services revenue from the Financial Services industry. In addition, approximately $17.6 million of the decrease was due to reductions in international operations products revenue excluding the impact of exchange rate fluctuations. The remaining $36.4 million net decrease was due to unfavorable exchange rate movement in international services revenue ($4.3 million) and contract scope reductions and other net reductions including lower volumes and terminated business.
Services revenue for the year ended March 31, 2011 was $893.6 million. This represents a $44.2 million increase or 5.2% from the prior year. On a geographic basis, International services increased $7.6 million and US services increased $36.6 million, or 4.8%. International services growth included $10.1 million of revenue related to the MENA and GoDigital acquisitions. Excluding unfavorable exchange rate movements and acquisition-related revenue, International services decreased approximately $1.9 million from the prior year. International services were negatively impacted by the loss of certain services contracts in Europe during the prior fiscal year. Revenue increases of approximately $8.2 million in Australia and China mitigated the declines in Europe. US services revenue growth resulted from new IT Services contracts signed in the previous year. Of the $34.1 million of organic services growth, $26.9 million was related to Infrastructure Management. By line of business, revenue increases in Multi-channel Marketing Services ($12.2 million or 3.5%), Consulting ($6.7 million or 18.1%) and Infrastructure Management ($26.9 million or 9.7%) were offset by a decrease in Customer Data Integration (“CDI”) Services ($16.2 million or 10.3%). CDI Services were negatively impacted by the contract and volume losses in Europe and the US of which $11.8 million of the decline was in Europe. Infrastructure Management Services growth slowed in the fourth quarter due to the loss of a contract. Fiscal 2011 revenue associated with the lost business was approximately $18 million.
Services revenue for the year ended March 31, 2010 was $849.4 million. This represents a $70.8 million decrease, or 7.7%, from the prior year. On a geographic basis, International services decreased approximately $2.9 million while US services decreased approximately $67.9 million. International services were impacted by unfavorable exchange rate movement. Excluding exchange rates, International services revenue was relatively flat compared to the prior year. By line of business, a $66.9 million, or 16.9%, decline in Multichannel Marketing Services revenue was the primary cause of the reduced US services revenue. Increases in Consulting revenue offset a smaller decline in CDI revenue and other lines were relatively flat compared to the prior year. Of the $66.9 million decline in Multichannel Marketing Services, the Financial Services vertical accounted for $46.4 million of the decline. During fiscal 2010, revenue reductions occurred due to contract renegotiations for reduced amounts, lost contracts, volume reductions, and contracts terminated because of economic pressures. Other industry verticals were impacted by similar issues to a lesser degree. Although Infrastructure Management Services had similar issues, the signing of a large new Infrastructure Management Services arrangement earlier in the year offset such reductions.
F-4
Products revenue for the year ended March 31, 2011 was $266.4 million, which represents a $16.6 million increase, or 6.6%, compared to the same period last year. International operations decreased $4.1 million during the period. Unfavorable exchange rate movements accounted for $2.1 million of the decrease. In the US, products revenue increased $20.8 million, or 11.5%. Due to increased hiring trends, Background Screening revenue increased approximately 30% for the year. US Consumer Insights revenue grew approximately 8% in the year due to higher levels of project activity in various industry verticals.
Products revenue for the year ended March 31, 2010 was $249.8 million. This represents a $106.5 million decrease or 29.9% when compared to the prior year. Excluding the prior year pass-through revenue of $71.3 million related to the amended data contract discussed above, products revenue was down $35.2 million, or 12.4%. International operations accounted for $20.7 million of the decrease. For the year ended March 31, 2010, exchange rate fluctuations had very little impact on products revenue results. International operations were impacted by much lower ad hoc and project activity, particularly in the UK and the Netherlands. Most US industry verticals also were down year over year due to lower volumes and some contract reductions and terminations.
Operating Costs and Expenses
The following table presents the Company’s operating costs and expenses for each of the years in the three-year period ended March 31, 2011 (dollars in millions):
|
2011
|
2010
|
2009
|
% Change
2011-2010
|
% Change
2010-2009
|
||||||||||||||||
|
Cost of revenue
|
||||||||||||||||||||
|
Services
|
$ | 695.0 | $ | 654.7 | $ | 694.3 | (6 | )% | 6 | % | ||||||||||
|
Products
|
189.9 | 184.6 | 280.8 | (3 | ) | 34 | ||||||||||||||
|
Total cost of revenue
|
884.9 | 839.3 | 975.1 | (5 | ) | 14 | ||||||||||||||
|
Selling, general and administrative
|
159.9 | 162.1 | 170.0 | 1 | 5 | |||||||||||||||
|
Impairment of goodwill and other intangibles
|
79.7 | - | - | (100 | ) | - | ||||||||||||||
|
Gains, losses and other items, net
|
4.6 | (1.0 | ) | 38.6 | (587 | ) | 102 | |||||||||||||
|
Total operating costs and expenses
|
$ | 1,129.1 | $ | 1,000.4 | $ | 1,183.7 | (13 | )% | 15 | % | ||||||||||
Gross Profit Margin
The following table presents the Company’s gross profit margin for each of the years in the three-year period ended March 31, 2011:
|
2011
|
2010
|
2009
|
||||||||||
|
Gross profit margin
|
||||||||||||
|
Services
|
22.2 | % | 22.9 | % | 24.5 | % | ||||||
|
Products
|
28.7 | 26.1 | 21.2 | |||||||||
|
Total gross profit margin
|
23.7 | % | 23.6 | % | 23.6 | % | ||||||
|
Operating profit margin
|
2.7 | % | 9.0 | % | 7.3 | % | ||||||
Gross profit margins for services revenue declined to 22.2 % in fiscal 2011 from 22.9% in fiscal 2010. Margins have been impacted by the decline in higher margin CDI Services revenue. Margins were also negatively impacted by the lost contracts in Europe and negative gross margins on acquired operations in Saudi Arabia and Brazil. Services margins were impacted by higher than expected migration costs of approximately $10.0 million on a large Infrastructure Management contract. The contract migration is now completed.
Gross profit margins for services revenue declined to 22.9% in fiscal 2010 from 24.5% in fiscal 2009. Margins were impacted by the decline in revenue, particularly high-margin volume-based business, and a change in the mix of revenue (higher percent of Infrastructure Management Services revenue). The margin impact on this volume-based business was mitigated by efficiency improvements in the shared IT and delivery functions.
F-5
The gross profit margins for products revenue were 28.7% in fiscal 2011 compared to 26.1% in fiscal 2010. Margins improved primarily due to the fixed cost nature of certain product costs of revenue. Additionally, margins benefited from cost reductions in Europe.
The gross profit margins for products revenue were 26.1% in fiscal 2010 compared to 21.2% in fiscal 2009. Excluding the impact of pass-through revenue, fiscal 2009 gross profit margin was 26.5%. Margins for products were impacted in a similar fashion to services. In particular, the large decline in volume-based business in Europe impacted overall margins.
Selling, general and administrative expense was $159.9 million for the year ended March 31, 2011 representing a $2.2 million decrease from the prior year. As a percent of total revenue, these expenses were 13.8% this year compared to 14.7% in fiscal 2010. Europe costs were approximately $5.1 million lower than the prior year due to cost reductions necessitated by lower revenues. Offsetting these reductions were increases in Australia and China on higher revenue levels.
Selling, general and administrative expense was $162.1 million for the year ended March 31, 2010 representing a $7.9 million decrease from the prior year. As a percent of total revenue, these expenses were 14.7% in 2010 compared to 13.3% in 2009 (14.1% excluding the impact of pass-through data revenue). Selling, general and administrative expenses reflected the cost savings initiated during both 2009 and 2010. Additionally, 2010 costs were lower than 2009 due to lower levels of incentive compensation.
Impairment of goodwill and other intangibles was $79.7 million for the year ended March 31, 2011. During the quarter ended March 31, 2011, triggering events occurred which required the Company to test the goodwill associated with its International operations for impairment. The triggering events were changes to the Company’s projected long-term growth and margins in both Europe and the Middle East and North Africa (MENA), as well as the disposal of the Company’s Portugal and Netherlands operations. Results of the two-step test indicated impairment associated with these operations, and the Company recorded an impairment charge of $79.7 million, of which $77.3 million was related to goodwill and $2.4 million was related to other intangible assets.
Gains, losses and other items for each of the years presented are as follows (dollars in thousands):
|
2011
|
2010
|
2009
|
||||||||||
|
Gain on disposition of operations in France
|
$ | - | $ | (677 | ) | $ | (2,083 | ) | ||||
|
Loss on disposition of operations in Portugal
|
828 | - | - | |||||||||
|
Loss on disposition of operations in The Netherlands
|
2,511 | - | - | |||||||||
|
Legal contingency
|
(2,125 | ) | - | 1,000 | ||||||||
|
Restructuring plan charges and adjustments
|
4,435 | (1,292 | ) | 42,340 | ||||||||
|
Leased airplane disposals
|
- | - | (110 | ) | ||||||||
|
Earnout liability adjustment
|
(1,058 | ) | - | - | ||||||||
|
Other
|
9 | 1,025 | (2,581 | ) | ||||||||
| $ | 4,600 | $ | (944 | ) | $ | 38,566 | ||||||
In fiscal 2011, the Company recorded $4.4 million in restructuring charges and adjustments included in gains, losses and other items in the consolidated statement of operations. The expense includes severance and other associate-related charges of $3.4 million, offset by adjustments to previous restructuring plans of $1.7 million, and executive leadership transition charges of $2.7 million.
In fiscal 2011, the Company entered into an agreement to dispose of the Company’s operations in Portugal. The Company made a cash payment of $0.9 million as part of the disposal and recorded a loss in the statement of operations of $0.8 million. There was no goodwill allocated to the disposed operations. The revenue associated with the Portugal operations was approximately $0.7 million in fiscal 2011.
In fiscal 2011, the Company entered into an agreement to dispose of the Company’s operations in The Netherlands. The Company transferred $0.2 million in cash as part of the sale and recorded a loss in the statement of operations of $2.5 million. There was no goodwill allocated to the disposed operations. Included in the loss calculation was a $1.1 million accrual for exit activities. The revenue associated with The Netherlands operations was approximately $3.5 million in fiscal 2011.
In fiscal 2011, the Company completed the acquisition of a 70% interest in GoDigital Tecnologia E Participacoes, Ltda. (“GoDigital”), a Brazilian marketing services business. The value of the earnout related to this acquisition was originally estimated at $3.6 million. During fiscal 2011, the Company estimated the value of the earnout to have decreased by $1.1 million and recorded the adjustment in gains, losses and other items in the consolidated statement of operations. The value of the earnout liability will continue to be adjusted to its estimated value until the completion of the earnout period.
F-6
In fiscal 2009, the Company recorded a total of $42.3 million in restructuring plan charges and adjustments included in gains, losses and other items in the consolidated statement of operations. The expense includes severance and other associate-related payments of $12.4 million, lease accruals of $3.2 million, asset disposal and write-offs of $26.5 million and $0.2 million in adjustments for the fiscal 2008 restructuring plan. Included in the asset disposal was a $24.6 million loss incurred as a result of the Company terminating a software contract.
In fiscal 2008, the Company sold its GIS operations in France. Adjustments regarding the final calculated purchase price were recorded in fiscal 2009 and 2010 resulting in gains of $2.1 and $0.7 million, respectively.
In fiscal 2008 the Company accrued $4.0 million for the estimated settlement cost on an ongoing lawsuit. In fiscal 2009, another $1.0 million was accrued for the contingency. In fiscal 2011 the Company settled the lawsuit and reversed $2.1 million of the accrual.
The following table shows the balances that were accrued for restructuring plans discussed above, as well as the changes in those balances during the years ended March 31, 2009, 2010 and 2011 (dollars in thousands):
|
Associate-related reserves
|
Ongoing
contract costs
|
Other accruals
|
Total
|
|||||||||||||
|
March 31, 2008
|
$ | 13,648 | $ | 26,880 | $ | 357 | $ | 40,885 | ||||||||
|
Fiscal year 2009 restructuring
plan amount
|
12,434 | 3,210 | - | 15,644 | ||||||||||||
|
Adjustments
|
(1,246 | ) | 752 | (39 | ) | (533 | ) | |||||||||
|
Payments
|
(16,603 | ) | (6,910 | ) | (318 | ) | (23,831 | ) | ||||||||
|
March 31, 2009
|
$ | 8,233 | $ | 23,932 | $ | - | $ | 32,165 | ||||||||
|
Adjustments
|
1,026 | (1,336 | ) | - | (310 | ) | ||||||||||
|
Payments
|
(6,389 | ) | (9,692 | ) | - | (16,081 | ) | |||||||||
|
March 31, 2010
|
$ | 2,870 | $ | 12,904 | $ | - | $ | 15,774 | ||||||||
|
Fiscal year 2011 restructuring
plan amount
|
6,064 | - | - | 6,064 | ||||||||||||
|
Adjustments
|
(291 | ) | (1,338 | ) | - | (1,629 | ) | |||||||||
|
Payments
|
(3,081 | ) | (2,024 | ) | - | (5,105 | ) | |||||||||
|
March 31, 2011
|
$ | 5,562 | $ | 9,542 | $ | - | $ | 15,104 | ||||||||
Operating Margins
Fiscal 2011 operating margins were 2.7% compared to 9.0% for fiscal 2010 and 7.3% for fiscal 2009. Fiscal 2011 margins were impacted by the goodwill and other intangible write-downs which reduced operating margin by 690 basis points, and by the items recorded in gains, losses and other items, net which reduced margins by 40 basis points. Fiscal 2010 margins improved as a result of cost savings initiated during both fiscal 2010 and fiscal 2009. The fiscal 2009 margins were positively impacted by the cost reduction initiative that was implemented during that year but were negatively impacted by the restructuring charges noted above.
Other Income (Expense), Income Taxes and Other Items
Interest expense for the year ended March 31, 2011 was $23.8 million compared to $22.5 million a year ago. The increase is primarily related to the term loan described below. The average balance declined approximately $65 million; however, the average rate increased approximately 75 basis points. Interest on other debt, such as capital leases, was also lower.
Interest expense for the year ended March 31, 2010 was $22.5 million compared to $32.6 million for the year ended March 31, 2009. The decrease was primarily related to the term loan. The average balance of the term loan declined approximately $50 million and the average rate declined approximately 115 basis points. Interest on other debt, such as capital leases, was also lower.
Other expense was $1.5 million in fiscal 2011 compared to other income of $0.4 million in the prior year period. Other income (expense) generally consists of interest and investment income. In addition to interest income, the current year includes a $1.6 million impairment of an equity investment.
F-7
Excluding the impact of the goodwill impairment charges, which were all non-deductible for tax purposes, the fiscal 2011 effective tax rate was 40% compared to 42.5% in fiscal 2010 and 39.7% in fiscal 2009. During fiscal 2011, the Company reduced a reserve for unrecognized tax benefits of approximately $3.5 million due to the expiration of the related statute of limitations. Excluding the impact of the reserve adjustment, the current year rate was approximately 44%. All three fiscal period tax rates were impacted by losses in foreign jurisdictions. The Company does not record the tax benefit of those losses due to uncertainty of future benefit. The fiscal 2011 rate was also impacted by additional foreign losses reflected in the gains, losses, and other items, net account. Additionally, there was no tax benefit recorded related to the impairment of the equity investment. In fiscal 2009 the Company reduced income tax expense by $2.1 million as a result of reducing valuation reserves previously recorded for net operating loss carryforwards in France.
Capital Resources and Liquidity
Working Capital and Cash Flow
Working capital at March 31, 2011 totaled $229.8 million compared to $203.6 million at March 31, 2010. Total current assets increased $0.5 million, resulting primarily from increases in accounts receivable of $8.1 million and refundable income taxes of $7.4 million, offset by a decrease in cash of $17.1 million. Current liabilities decreased $25.6 million, primarily resulting from decreases in current installments of long-term debt of $14.1 million, trade accounts payable of $15.3 million, and income taxes payable of $2.5 million, offset by increases in accrued payroll of $5.7 million.
Cash provided by operating activities was $166.2 million compared to $239.3 million in fiscal 2010 and $268.8 million in fiscal 2009. Higher earnings, excluding non-cash charges, in the current fiscal year were offset by lower depreciation and changes in working capital. Deferred costs are higher in the current fiscal year due to increased Infrastructure Management contract migration activity.
Accounts receivable days sales outstanding (“DSO”) was 53 days at both March 31, 2011 and March 31, 2010, and is calculated as follows (dollars in thousands):
|
March 31,
2011
|
March 31,
2010
|
|||||||
|
Numerator – trade accounts receivable, net
|
$ | 176,654 | $ | 168,522 | ||||
|
Denominator:
|
||||||||
|
Quarter revenue
|
298,796 | 288,342 | ||||||
|
Number of days in quarter
|
90 | 90 | ||||||
|
Average daily revenue
|
$ | 3,320 | $ | 3,204 | ||||
|
Days sales outstanding
|
53 | 53 | ||||||
Investing activities used $90.8 million in cash in fiscal 2011 compared to $89.3 million in fiscal 2010 and $65.4 million in fiscal 2009. Investing activities in fiscal 2011 included capitalized software development costs of $4.6 million compared to $8.3 million in fiscal 2010 and $16.2 million in fiscal 2009. Capital expenditures were $59.0 million in 2011 compared to $57.9 million in fiscal 2010 and $31.4 million in fiscal 2009. Data acquisition costs were $13.4 million in 2011 compared to $18.8 million in fiscal 2010 and $30.6 million in fiscal 2009.
Investing activities also reflect net cash paid for acquisitions of $12.9 million in fiscal 2011 compared to $3.4 million in fiscal 2010 and $15.9 million in fiscal 2009. In fiscal 2011 the Company paid $10.9 million for the purchase of a 70% interest in GoDigital, a Brazilian marketing services business, and paid $1.8 million to acquire 100% of the outstanding shares of XYZ, a digital marketing business operating in Australia and New Zealand. In fiscal 2010 the Company paid $3.8 million for the acquisition of a 51% interest in the assets of DMS, offset by $0.4 million cash returned from escrow related to the Precision Marketing acquisition. Fiscal 2009 included cash paid for the acquisition of Precision Marketing for $9.0 million, the acquisition of Quinetia for $2.9 million and the acquisition of Alvion for $3.6 million. The remainder of the cash paid for acquisitions each year relates to fees and earnout payments paid on acquisitions made in a prior year.
Investing activities in fiscal 2011 also included $1.1 million in payments made for the disposal of the Portugal and Netherlands operations. Investing activities in fiscal 2010 also included $1.1 million in proceeds from the sale of fixed assets. In fiscal 2009 the Company received $24.2 million in proceeds from the sale of the Company’s Phoenix facility. In fiscal 2010 the Company paid $2.0 million for an equity investment. Payments received on investments of $2.6 million in 2009 include sales or collections on a number of investments.
F-8
With respect to certain of its investments in joint ventures and other companies, the Company may provide cash advances to fund losses and cash flow deficits. The Company may, at its discretion, decide not to provide financing to these investments during future periods. In the event that it does not provide funding and these investments have not achieved profitable operations, the Company may be required to record an impairment charge up to the amount of the carrying value of these investments ($1.2 million at March 31, 2011). In fiscal 2011, the Company determined that one of its investments was impaired and recorded an impairment charge of $1.6 million in other, net in the consolidated statement of operations. In the event that declines in the value of its investments occur and continue, the Company may be required to record further impairment charges related to its investments.
During the fiscal year ended March 31, 2009, the Company repurchased 0.3 million shares for $2.1 million under its previously-announced stock buyback program. Cash paid for repurchases differs from the aggregate purchase price due to trades made at the end of the period which were settled in the following period. There were no share repurchases in fiscal 2010 or 2011.
Financing activities in fiscal 2011 used $92.6 million of cash including $102.1 million in payments of debt offset by $9.3 million in proceeds from the sale of common stock. Financing activities in fiscal 2010 used $103.7 million of cash including $104.5 million in debt payments and $4.6 million in debt financing fees offset by $5.9 million in sales of common stock. Financing activities in fiscal 2009 used $86.9 million of cash including $86.8 million in debt payments, dividends paid of $9.3 million and stock repurchases of $1.8 million offset by $10.9 million in sales of stock.
In each of the fiscal years 2011, 2010 and 2009, the Company has incurred debt to finance the acquisition of software licenses and property and equipment. The incurrence of this debt appears on the Consolidated Statements of Cash Flows under “supplemental cash flow information.” Acquisitions under capital leases and installment payment arrangements were $23.8 million in 2011 compared to $24.2 million in 2010 and $11.0 million in 2009. Software licenses acquired under software obligations were $2.2 million in 2010 and $10.0 million in 2009. Payment of this debt in future periods will be reflected as a financing activity. The Company has also included details of its debt payments within the “supplemental cash flow” information.
Credit and Debt Facilities
The Company’s amended and restated credit agreement provides for (1) term loans up to an aggregate principal amount of $600 million and (2) revolving credit facility borrowings consisting of revolving loans, letter of credit participations and swing-line loans up to an aggregate amount of $200 million.
In November 2009, the Company entered into an amendment to its term loan credit facility (the “Amendment”). Under the terms of the Amendment, certain of the lenders agreed to extend the maturity date of the existing term loan, becoming Tranche 2 Term Lenders. Lenders who did not agree to extend the maturity date became Tranche 1 Term Lenders. Certain lenders also agreed to extend the maturity date of the existing revolving loan commitment, becoming Tranche 2 Revolving Lenders. Lenders who did not agree to extend the maturity date of the revolving loan commitment became Tranche 1 Revolving Lenders. Of the $355.0 million balance of the term loan as of March 31, 2011, all of the balance is held by Tranche 2 Term Lenders. The remaining Tranche 1 term loan balance was prepaid in full during fiscal 2011. Of the $200 million revolving loan commitment, $80 million is held by Tranche 1 Revolving Lenders and $120 million is held by Tranche 2 Revolving Lenders.
The term loan is payable in quarterly installments of approximately $1.5 million each, through December 31, 2014, with a final payment of approximately $332.5 million due March 15, 2015. The Tranche 1 revolving loan commitment expires September 15, 2011 and the Tranche 2 revolving loan commitment expires March 15, 2014.
Revolving credit facility borrowings currently bear interest at LIBOR plus a credit spread, or at an alternative base rate or at the Federal Funds rate plus a credit spread, depending on the type of borrowing. The LIBOR credit spread is 1.5% for Tranche 1 and 2.75% for Tranche 2. There were no revolving credit borrowings outstanding at March 31, 2011 or March 31, 2010. Term loan borrowings bear interest at LIBOR plus a credit spread which is 1.75% for Tranche 1, and 3.00% for Tranche 2. The weighted-average interest rate on term loan borrowings at March 31, 2011 was 4.1%. Outstanding letters of credit at March 31, 2011 were $0.5 million.
The term loan allows prepayments before maturity. The credit agreement is secured by the accounts receivable of Acxiom and its domestic subsidiaries, as well as by the outstanding stock of certain Acxiom subsidiaries.
Under the terms of the term loan, the Company is required to maintain certain debt-to-cash flow and debt service coverage ratios, among other restrictions. At March 31, 2011, the Company was in compliance with these covenants and restrictions. In addition, if certain financial ratios and other conditions are not satisfied, the revolving credit facility limits the Company’s ability to pay dividends in excess of $30 million in any fiscal year (plus additional amounts in certain circumstances). The principal factor that could cause the Company to not be able to maintain compliance with its debt covenants would be if the level of operating income (as adjusted for certain non-cash charges, rent expense, and gains, losses, and other items) were to decline, without a corresponding decrease in the Company’s debt levels. The most likely scenario that could cause such a decrease in operating income would be a significant decrease in revenue, without a decrease in operating expenses. Management, however, maintains a focus on operating income to mitigate any such risk. Failure to maintain compliance with debt covenants could lead to the lender declaring the debt to be due and payable immediately, or the Company could be required to renegotiate the debt at terms with are less favorable than the current terms, and the Company could be required to incur fees and expenses to renegotiate or refinance the debt. There can be no assurance that if such a failure were to occur, the Company would be able to renegotiate or refinance the debt.
F-9
In fiscal 2009, the Company entered into an interest rate swap agreement. The agreement provides for the Company to pay interest through July 25, 2011 at a fixed rate of 3.25% plus the applicable credit spread on $95.0 million notional amount while receiving interest for the same period at the LIBOR rate on the same notional amount. The LIBOR rate as of March 31, 2011 was 0.30%. The swap was entered into as a cash flow hedge against LIBOR interest rate movements on the term loan. The Company assesses the effectiveness of the hedge based on the hypothetical derivative method. There was no ineffectiveness for the period ended March 31, 2011. Under the hypothetical derivative method, the cumulative change in fair value of the actual swap is compared to the cumulative change in fair value of the hypothetical swap, which has terms that identically match the critical terms of the hedged transaction. Thus, the hypothetical swap is presumed to perfectly offset the hedged cash flows. The change in the fair value of the hypothetical swap will then be regarded as a proxy for the present value of the cumulative change in the expected future cash flows from the hedged transactions. All of the fair values are derived from an interest-rate futures model. As of March 31, 2011, the hedge relationship qualified as an effective hedge under applicable accounting standards. Consequently, all changes in fair value of the derivative are deferred and recorded in other comprehensive income (loss) until the related forecasted transaction is recognized in the consolidated statement of operations. The fair market value of the derivative was zero at inception and an unrealized loss of $0.9 million since inception is recorded in other comprehensive income (loss) with the offset recorded to other noncurrent liabilities. The fair value of the interest rate swap agreement recorded in accumulated other comprehensive income (loss) may be recognized in the statement of operations if certain terms of the floating-rate debt change, if the floating-rate debt is extinguished or if the interest rate swap agreement is terminated prior to maturity. The Company has assessed the creditworthiness of the counterparty of the swap and concludes that no substantial risk of default exists as of March 31, 2011.
Off-Balance Sheet Items and Commitments
In connection with a certain building, the Company is a party to a 50/50 joint venture with a real estate developer. The Company is guaranteeing a portion of the loan for the building. In addition, in connection with the disposal of certain assets, the Company guaranteed loans for the buyers of the assets. These guarantees were made by the Company primarily to facilitate favorable financing terms for those third parties. Should the third parties default on this indebtedness, the Company would be required to perform under these guarantees. Substantially all of the third-party indebtedness is collateralized by various pieces of real property. At March 31, 2011 the Company’s maximum potential future payments under these guarantees of third-party indebtedness were $1.4 million.
Outstanding letters of credit, which reduce the borrowing capacity under the Company’s revolving credit facility, were $0.5 million at March 31, 2011 and $0.7 million at March 31, 2010.
F-10
Contractual Commitments
The following table presents Acxiom’s contractual cash obligations, exclusive of interest, and purchase commitments at March 31, 2011 (dollars in thousands). The table does not include the future payment of gross unrealized tax benefit liabilities of $3.0 million or the future payment against the Company’s non-current interest rate swap liability of $0.9 million, or the future payment of the Company’s earnout liabilities of $3.6 million as future payment of these liabilities is uncertain and the Company is not able to predict the periods in which these payments, if any, will be made (dollars in thousands):
|
For the years ending March 31
|
||||||||||||||||||||||||||||
|
2012
|
2013
|
2014
|
2015
|
2016
|
Thereafter
|
Total
|
||||||||||||||||||||||
|
Term loan
|
$ | 6,000 | $ | 6,000 | $ | 6,000 | $ | 337,000 | $ | - | $ | - | $ | 355,000 | ||||||||||||||
|
Capital lease and installment payment obligations
|
16,423 | 13,140 | 3,925 | 750 | 863 | 8,094 | 43,195 | |||||||||||||||||||||
|
Software and data license liabilities
|
2,918 | 1,768 | - | - | - | - | 4,686 | |||||||||||||||||||||
|
Other long-term debt
|
2,637 | 2,689 | 1,607 | 1,664 | 7,308 | 3,452 | 19,357 | |||||||||||||||||||||
|
Total long-term debt
|
27,978 | 23,597 | 11,532 | 339,414 | 8,171 | 11,546 | 422,238 | |||||||||||||||||||||
|
Operating lease payments
|
21,484 | 19,758 | 17,725 | 13,656 | 11,142 | 51,895 | 135,660 | |||||||||||||||||||||
|
Total contractual cash obligations
|
$ | 49,462 | $ | 43,355 | $ | 29,257 | $ | 353,070 | $ | 19,313 | $ | 63,441 | $ | 557,898 | ||||||||||||||
|
For the years ending March 31
|
||||||||||||||||||||||||||||
|
2012
|
2013
|
2014
|
2015
|
2016
|
Thereafter
|
Total
|
||||||||||||||||||||||
|
Total purchase commitments
|
$ | 61,243 | $ | 29,397 | $ | 11,193 | $ | 11,008 | $ | 7,338 | $ | 2,296 | $ | 122,475 | ||||||||||||||
Purchase commitments include contractual commitments for the purchase of data and open purchase orders for equipment, paper, office supplies, construction and other items. Purchase commitments in some cases will be satisfied by entering into future operating leases, capital leases, or other financing arrangements, rather than payment of cash. The above commitments relating to long-term obligations do not include future payments of interest. The Company estimates interest payments on debt and capital leases for fiscal 2012 of $22.8 million.
The following table shows contingencies or guarantees under which the Company could be required, in certain circumstances, to make cash payments as of March 31, 2011 (dollars in thousands):
|
Guarantees on certain partnership and other loans
|
$ | 1,351 | ||
|
Outstanding letters of credit
|
506 |
The total of partnership and other loans of which the Company guarantees the portion noted in the above table, is $5.3 million as of March 31, 2011.
While the Company does not have any other material contractual commitments for capital expenditures, certain levels of investments in facilities and computer equipment continue to be necessary to support the growth of the business. In some cases, the Company also sells software and hardware to clients. In addition, new outsourcing or facilities management contracts frequently require substantial up-front capital expenditures to acquire or replace existing assets. Management believes that the Company’s existing available debt and cash flow from operations will be sufficient to meet the Company’s working capital and capital expenditure requirements for the foreseeable future. The Company also evaluates acquisitions from time to time, which may require up-front payments of cash. Depending on the size of the acquisition it may be necessary to raise additional capital. If additional capital becomes necessary as a result of any material variance of operating results from projections or from potential future acquisitions, the Company may access available borrowing capacity under its revolving credit agreement, issue debt, equity or hybrid securities, or take a combination of these actions or other actions. However, no assurance can be given that the Company would be able to obtain funding through the issuance of debt, equity or hybrid securities at terms favorable to the Company, or that the desired funding would be available.
For a description of certain risks that could have an impact on results of operations or financial condition, including liquidity and capital resources, see “Risk Factors” contained in Part I, Item 1A, of this Annual Report.
F-11
Acquisitions
On April 1, 2010, the Company acquired 100% of the outstanding shares of a digital marketing business (“XYZ”) operating in Australia and New Zealand. The acquisition gives the Company additional market opportunities in this region. The Company paid $1.8 million in cash, net of cash acquired, and not including amounts, if any, to be paid under an earnout agreement in which the Company may pay up to an additional $0.6 million if the acquired business achieves a revenue target over the next two years. The value of the earnout is estimated at $0.5 million. The acquired business has annual revenue of less than $2 million. The results of operations for the acquisition are included in the Company’s consolidated results beginning April 1, 2010.
On July 1, 2010, the Company completed the acquisition of a 70% interest in GoDigital Tecnologia E Participacoes, Ltda. (“GoDigital”), a Brazilian marketing services business. The Company paid $10.9 million, net of cash acquired, and not including amounts, if any, to be paid under an earnout agreement in which the Company may pay up to an additional $9.3 million based on the results of the acquired business over approximately the next two years. The acquired business has annual revenue of approximately $8 million. The results of operations for GoDigital are included in the Company’s consolidated results beginning July 1, 2010.
The value of the earnout was originally estimated at $3.6 million. During fiscal 2011, the Company has estimated the value of the earnout to have decreased by $1.1 million and has recorded the adjustment in gains, losses and other items in the consolidated statement of operations. The value of the earnout liability will continue to be adjusted to its estimated value until the completion of the earnout period.
In December 2009, the Company acquired a 51% interest in Direct Marketing Services (“DMS”), with operations in Saudi Arabia and the United Arab Emirates. Subsequently, Acxiom’s ownership has increased to 57%. Upon acquisition DMS was reorganized as a limited liability company registered under the laws and regulations of the Kingdom of Saudi Arabia and renamed Acxiom Middle East and North Africa, LTD (“MENA”). The purchase price for DMS was $3.8 million in cash, not including the amount, if any, to be paid pursuant to an earnout agreement where additional payment is contingent on MENA’s financial performance for the period ending on December 31, 2012. Financial performance under the earnout will be measured based on MENA’s calculation of earnings before interest, taxes, depreciation and amortization (“EBITDA”). The actual EBITDA will be divided by $18.3 million and that percentage multiplied by $6.1 million to determine the earnout payment. There will be no earnout payment if the actual EBITDA does not exceed $12.8 million. DMS has annual revenue of less than $5 million. The results of operations for MENA are included in the Company’s consolidated results beginning December 1, 2009.
During the year ended March 31, 2011, triggering events occurred which required the Company to test the goodwill and other intangible assets of MENA for impairment. Management concluded that all of the goodwill and other intangibles were impaired. A total impairment charge of $7.2 million was recorded in impairment of goodwill and other intangibles in the consolidated statement of operations, of which $4.8 million was goodwill and $2.4 million related to other intangible assets. Approximately 43% of this charge is attributable to the noncontrolling interest.
On November 7, 2008, the Company acquired the assets of Quinetia, LLC, a Rochester, New York-based provider of analytics and predictive modeling for large and medium size businesses. The acquisition provides the Company additional consumer insight capabilities that enable clients to more effectively retain and grow their customer base and optimize pricing. The Company paid $2.7 million, net of cash acquired, for the acquisition not including amounts paid pursuant to an earnout agreement. The earnout agreement allows for payment of up to $1.2 million if the acquired business achieves certain earnings before interest, tax, depreciation and amortization goals. Payments under the earnout agreement are determined based on results in the target measurement periods ending March 31, 2009, 2010 and 2011. The first earnout payment of $0.2 million in fiscal 2009 and the second earnout payment of $0.2 million in fiscal 2010 have been added to the purchase price. The final earnout payment of $0.3 million was added to the purchase price in fiscal 2011. The acquired business has annual revenues of less than $5.0 million. Quinetia’s results of operations are included in the Company’s consolidated results beginning November 7, 2008.
On September 15, 2008, the Company acquired the direct marketing technology unit of Alvion, LLC. The acquisition allowed the Company to obtain a proven online marketing list fulfillment platform that can be used by small and medium-size businesses that need immediate access to marketing information through a software-as-service environment. The Company paid $3.6 million in cash, net of cash acquired, for the acquisition. The acquired business has annual revenues of less than $5.0 million. Alvion’s results of operations are included in the Company’s consolidated results beginning September 15, 2008.
In July 2008, the Company acquired the database marketing unit of ChoicePoint Precision Marketing, LLC (“Precision Marketing”). The Company paid $9.0 million, of which $4.5 million was paid into two escrow accounts which were subject to escrow arrangements which were finally resolved during fiscal 2010. A total of $0.5 million of one of the escrow funds has been released to reimburse the Company for costs incurred. Of the remaining $4.0 million escrow fund, $3.6 million was paid to the sellers and approximately $0.4 million was returned to the Company as a reduction of the purchase price. The acquired business has annual revenue of approximately $16.0 million. Precision Marketing’s results of operations are included in the Company’s consolidated results beginning July 1, 2008.
F-12
Seasonality and Inflation
Although the Company cannot accurately determine the amounts attributable to inflation, the Company is affected by inflation through increased costs of compensation and other operating expenses. If inflation were to increase over the low levels of recent years, the impact in the short run would be to cause increases in costs, which the Company would attempt to pass on to clients, although there is no assurance that it would be able to do so. Generally, the effects of inflation in recent years have been offset by technological advances, economies of scale and other operational efficiencies.
The Company’s traditional direct marketing operations experience their lowest revenue in the first quarter of the fiscal year, with higher revenue in the second, third, and fourth quarters. In order to minimize the impact of these fluctuations, the Company continues to seek long-term strategic partnerships with more predictable revenues.
Non-U.S. Operations
The Company has a presence in the United Kingdom, France, Germany, Poland, Saudi Arabia, Australia, China and Brazil. Most of the Company’s exposure to exchange rate fluctuation is due to translation gains and losses as there are no material transactions that cause exchange rate impact. In general, each of the foreign locations is expected to fund its own operations and cash flows, although funds may be loaned or invested from the U.S. to the foreign subsidiaries subject to limitations in the Company’s revolving credit facility. These advances are considered to be long-term investments, and any gain or loss resulting from changes in exchange rates as well as gains or losses resulting from translating the foreign financial statements into U.S. dollars are included in accumulated other comprehensive income (loss). Exchange rate movements of foreign currencies may have an impact on the Company’s future costs or on future cash flows from foreign investments. The Company has not entered into any foreign currency forward exchange contracts or other derivative instruments to hedge the effects of adverse fluctuations in foreign currency exchange rates.
Critical Accounting Policies
We prepare our consolidated financial statements in conformity with accounting principles generally accepted in the United States of America. These accounting principles require management to make certain judgments and assumptions that affect the reported amounts of assets and liabilities and the disclosure of contingent assets and liabilities as of the date of the financial statements and the reported amounts of revenues and expenses during the reporting periods. Note 1 to the accompanying consolidated financial statements includes a summary of significant accounting policies used in the preparation of Acxiom’s consolidated financial statements. Of those policies, we have identified the following as the most critical because they require management’s use of complex and/or significant judgments:
Revenue Recognition – The Company provides database management and IT management services under long-term arrangements. These arrangements may require the Company to perform setup activities such as the design and build of a database for the customer under the database management contracts and migration of the customer’s IT environment under IT management contracts. In the case of database management contracts, the customer does not acquire any ownership rights to the Company’s intellectual property used in the database and the database itself provides no benefit to the customer outside of the utilization of the system during the term of the database management arrangement. In some cases, the arrangements also contain provisions requiring customer acceptance of the setup activities prior to commencement of the ongoing services arrangement. Up-front fees billed during the setup phase for these arrangements are deferred and setup costs that are direct and incremental to the contract are capitalized and amortized on a straight-line basis over the service term of the contract. Revenue recognition does not begin until after customer acceptance in cases where contracts contain acceptance provisions. Once the setup phase is complete and customer acceptance occurs, the Company recognizes revenue over the remaining service term of the contract. In situations where the arrangement does not require customer acceptance before the Company begins providing services, revenue is recognized over the contract period and no costs are deferred.
Sales of third-party software, hardware and certain other equipment are recognized when delivered. If such sales are part of a multiple-element arrangement, they are recognized as a separate element unless collection of the sales price is dependent upon delivery of other products or services. Additionally, the Company evaluates revenue from the sale of data, software, hardware and equipment in accordance with accounting standards to determine whether such revenue should be recognized on a gross or a net basis. All of the factors in the accounting standards are considered with the primary factor being whether the Company is the primary obligor in the arrangement. “Out-of-pocket” expenses incurred by, and reimbursed to, the Company in connection with customer contracts are recorded as gross revenue.
F-13
The Company evaluates its database management and IT management arrangements to determine whether the arrangement contains a lease. If the arrangement is determined to contain a lease, applicable accounting standards require the Company to account for the lease component separately from the remaining components of the arrangement. In cases where database management or IT management arrangements are determined to include a lease, the lease is evaluated to determine whether it is a capital lease or operating lease and accounted for accordingly. These lease revenues are not significant to the Company’s consolidated financial statements.
Revenues from the licensing of data are recognized upon delivery of the data to the customer. Revenue from the licensing of data to the customer in circumstances where the license agreement contains a volume cap is recognized in proportion to the total records to be delivered under the arrangement. Revenue from the sale of data on a per-record basis is recognized as the records are delivered.
The relative selling price for each unit of accounting in a multiple-element arrangement is established using vendor-specific objective evidence (VSOE), if available, third-party evidence (TPE), if available, or management’s best estimate of stand-alone selling price (BESP). In most cases, the Company has neither VSOE nor TPE and therefore uses BESP. The objective of BESP is to determine the price at which the company would transact a sale if the product or service were sold on a stand-alone basis. Management’s BESP is determined by considering multiple factors, including actual contractual selling prices when the item is sold on a stand-alone basis, as well as market conditions, competition, internal costs, profit objectives and pricing practices. The amount of revenue recognized for a delivered element is limited to an amount that is not contingent upon future delivery of additional products or services. As pricing and marketing strategies evolve, we may modify our pricing practices in the future, which could result in changes to BESP, or to the development of VSOE or TPE for individual products or services. As a result, future revenue recognition for multiple-element arrangements could differ from recognition in the current period. Our relative selling prices are analyzed on an annual basis, or more frequently if we experience significant changes in selling prices.
All taxes assessed on revenue-producing transactions described above are presented on a net basis, or excluded from revenues.
The Company also performs services on a project basis outside of, or in addition to, the scope of long-term arrangements. The Company recognizes revenue from these services as the services are performed.
The Company does not provide end-users with price-protection or rights of return. The Company’s contracts provide a warranty that the services or products will meet the agreed-upon criteria or any necessary modifications will be made. The Company ensures that services or products delivered meet the agreed-upon criteria prior to recognition of revenue.
Included in the Company’s consolidated balance sheets are deferred revenues resulting from billings and/or client payments in advance of revenue recognition. Deferred revenue at March 31, 2011 was $55.9 million compared to $55.6 million at March 31, 2010.
Accounts receivable include amounts billed to clients as well as unbilled amounts recognized in accordance with the Company’s revenue recognition policies. Unbilled amounts included in accounts receivable were $24.8 million and $19.8 million, respectively, at March 31, 2011 and 2010.
Software, Purchased Software Licenses, and Research and Development Costs – The Company capitalizes software development costs following accounting standards regarding the costs of computer software to be sold, leased or otherwise marketed or the costs of computer software developed or obtained for internal use. Although there are differences in the two accounting standards, depending on whether a product is intended for internal use or to be provided to customers, both accounting standards generally require that research and development costs incurred prior to establishing technological feasibility or the beginning of the application development stage of software products are charged to operations as incurred. Costs of internally developed software, upon its general release, are amortized on a straight-line basis over the estimated economic life of the product, generally two to five years, or the amortization that would be recorded by using the ratio of gross revenues for a product to total current and anticipated future gross revenues for that product, whichever is greater. The Company recorded amortization expense related to internally developed computer software of $20.5 million in fiscal 2011, $23.6 million in fiscal 2010 and $21.1 million in fiscal 2009. Additionally, research and development costs associated with internally developed software incurred prior to becoming eligible for capitalization or other research activities of $11.6 million in fiscal 2011, $6.8 million in fiscal 2010 and $19.4 million in fiscal 2009 were charged to operations during those years.
Costs of purchased software licenses are amortized using a units-of-production basis over the estimated economic life of the license, generally not to exceed ten years. The Company recorded amortization of purchased software licenses of $15.6 million in fiscal 2011, $14.5 million in fiscal 2010 and $27.2 million in fiscal 2009. Some of these purchased software licenses are, in effect, volume purchase agreements for software licenses needed for internal use and to provide services to customers over the terms of the agreements. Therefore, amortization lives are periodically reevaluated and, if necessary, adjusted to reflect current and future expected usage based on units-of-production amortization. Factors considered in estimating remaining useful life include, but are not limited to, contract provisions of the underlying licenses, introduction of new mainframe hardware which is compatible with previous generation software, predictions of continuing viability of mainframe architecture, and customers’ continuing commitments to utilize mainframe architecture and the software under contract. While the Company believes current license lives are appropriate and material changes in amortization periods are not anticipated, changes in relevant factors cannot be predicted.
F-14
Capitalized software, including both purchased and internally developed, is reviewed each period and, if necessary, the Company reduces the carrying value of each product to its net realizable value. In performing the net realizable value evaluation of capitalized software, the Company’s projection of potential future cash flows from future gross revenues by product, reduced by the costs of completing and disposing of that product are compared to the carrying value of each product. A write-down of the carrying amount of a product is made to the extent that the carrying value of a product exceeds its net realizable value. No software impairment charges were recorded during the past three fiscal years. At March 31, 2011, the Company’s most recent impairment analysis of its purchased and internally developed software indicates that no further impairment exists. However, no assurance can be given that future analysis of the Company’s capitalized software will not result in an impairment charge. Additionally, should future projected revenues not materialize and/or the cost of completing and disposing of software products significantly exceed the Company’s estimates, write-downs of purchased or internally developed software might be required up to and including the total carrying value of such software ($65.0 million at March 31, 2011).
Valuation of Long-Lived Assets– Long-lived assets and certain identifiable intangibles as well as equity investments are reviewed for impairment whenever events or changes in circumstances indicate that the carrying amount of an asset may not be recoverable. The Company considers factors such as operating losses, declining outlooks, and business conditions when evaluating the necessity for an impairment analysis. Recoverability of assets to be held and used is measured by a comparison of the carrying amount of an asset to the undiscounted cash flows expected to result from the use and eventual disposition of the asset. If such assets are considered to be impaired, the impairment to be recognized is measured by the amount by which the carrying amount of the assets exceeds the fair value of the assets. Assets to be disposed of shall be classified as held for sale and are reported at the lower of the carrying amount or fair value less costs to sell.
During the quarter ended March 31, 2011, triggering events occurred which required the Company to review the carrying amounts of its intangible assets in its International operations for impairment. As a result of that review, the Company has recorded an impairment charge of $2.4 million for intangible assets related to the Middle East operations.
Valuation of Goodwill– Goodwill represents the excess of acquisition costs over the fair values of net assets acquired in business combinations. Goodwill is measured and tested for impairment on an annual basis in the first quarter of the Company’s fiscal year in accordance with applicable accounting standards, or more frequently if indicators of impairment exist. Triggering events for interim impairment testing include indicators such as adverse industry or economic trends, restructuring actions, downward revisions to projections of financial performance, or a sustained decline in market capitalization. The performance of the impairment test involves a two-step process. The first step requires comparing the estimated fair value of a reporting unit to its net book value, including goodwill. A potential impairment exists if the estimated fair value of the reporting unit is lower than its net book value. The second step of the impairment test involves assigning the estimated fair value of the reporting unit to its identifiable assets, with any residual fair value being assigned to goodwill. If the carrying value of an individual indefinite-lived intangible asset (including goodwill) exceeds its estimated fair value, such asset is written down by an amount equal to such excess, and a corresponding amount is recorded as a charge to operations for the period in which the impairment test is completed. Completion of the Company’s annual impairment test during the quarter ended June 30, 2010 indicated no potential impairment of its goodwill balances.
Each quarter the Company considers whether indicators of impairment exist such that additional impairment testing may be necessary. During the quarter ended March 31, 2011, triggering events occurred which required the Company to test the goodwill associated with its International operations for impairment. The triggering events were changes to the Company’s projected long-term revenue growth and margins in both Europe and the Middle East and North Africa (MENA) as well as the disposal of the Company’s Portugal and Netherlands operations. Results of the two-step test indicated impairment associated with these operations, and the Company recorded an impairment charge of $79.7 million, of which $77.3 million was related to goodwill and $2.4 million was related to other intangible assets. The Company had not previously recorded any goodwill impairment, so the amount of goodwill impairment recorded in fiscal 2011 is also the cumulative amount of goodwill impairment as of March 31, 2011.
F-15
Goodwill is tested for impairment at the reporting unit level, which is defined as either an operating segment or one step below operating segment, known as a component. Acxiom’s two operating segments are the Information Services segment and the Information Products segment. Because each of these segments contains both a US component and an International component, and there are some differences in economic characteristics between the US and International components, management tested a total of four components in its annual impairment test performed during the first quarter of fiscal 2011. The goodwill amounts as of April 1, 2010 included in each component tested were US Information Services, $306.1 million; US Information Products, $51.2 million; International Information Services, $42.0 million; and International Information Products $71.0 million.
In order to estimate a valuation for each of the four components tested, management used an income approach based on a discounted cash flow model together with valuations based on an analysis of public company market multiples and a similar transactions analysis.
The income approach involved projecting cash flows for each component into the future and discounting these cash flows at an appropriate discount rate. Management used budget figures for the first year of the projection model, and then projected those figures out into the future years using management’s best estimates of future revenue growth, operating margins, and other cash flow assumptions. The discount rates used for each component in order to arrive at an estimated fair value were estimated as the weighted-average cost of capital which a marketplace participant would use to value each component. These weighted-average costs of capital rates included a market risk factor, added to a risk-free rate of return, and a size premium that was specific to the component being tested. The resulting cost of equity was then weighted-averaged with the after-tax cost of debt.
The public company market multiple method was used to estimate values for each of the components by looking at market value multiples to revenue and EBITDA (earnings before interest, taxes, depreciation and amortization) for selected public companies that were believed to be representative of companies that marketplace participants would use to arrive at comparable multiples for the individual component being tested. These multiples were then used to develop an estimated value for that component.
The similar transactions method compared multiples based on acquisition prices of other companies believed to be those that marketplace participants would use to compare to the individual component being tested. Those multiples were then used to develop an estimated value for that component.
In order to arrive at an estimated value for each component, management used a weighted-average approach to combine the results of each analysis. Management believes that using multiple valuation approaches and then weighting them appropriately is a technique that a marketplace participant would use.
As a final test of the valuation results, the total of the values of the components was reconciled to the actual market value of Acxiom Corporation stock as of the April 1, 2010 valuation date. This reconciliation indicated an implied control premium. Management believes this control premium was reasonable compared to historical control premiums observed in actual transactions.
As of April 1, 2010, each of the components had an estimated fair value in excess of its carrying value, indicating no impairment. All of the components had a significant excess fair value, except for the International Information Products component, for which the excess fair value was 12%.
As described above, the Company historically had concluded that its International Information Products operations, which includes operations in Europe and Asia/Pacific (APAC), were properly aggregated into a single International Information Products component for purposes of impairment testing and its International Information Services operations, which includes operations in Europe, APAC, MENA and Brazil, were properly aggregated into a single International Information Services component for purposes of impairment testing. These conclusions were based on management’s determinations that the operations included in each of these non-US components shared economic characteristics, as well as similar products and services, types of customers, and services distribution methods. The primary economic characteristic that management concluded was similar for each of these units was expected long-term gross margins.
During the fourth quarter of fiscal 2011, as a result of the triggering events described above, and as management was developing revised projections for the Company’s International operations, management concluded that it was no longer appropriate to conclude that the respective operations previously included in the International Information Products component and the International Information Services component, respectively, all shared similar economic characteristics, due to management’s differing expectations for these operations over the long term. Therefore management did not aggregate these operations for testing as it had in the past, but instead performed step-one testing on the operations in the geographic regions described above individually (except for the Brazil operation, which was acquired in the current fiscal year and as to which management concluded the long-term expectations had not changed since the acquisition). The carrying value of the goodwill associated with these operations prior to performing the impairment tests performed in the fourth quarter of fiscal 2011 were: Europe Information Services, $28.8 million; APAC Information Services, $10.8 million; MENA Information Services, $4.8 million; Brazil Information Services, $16.9 million; Europe Information Products, $66.2 million; and APAC Information Products, $10.0 million. Based on the step-one testing, which utilized a weighted average of estimated values derived from a discounted cash flow model, similar transactions analysis, and public company market multiples analysis, the Company determined that there was indicated impairment for Europe Information Services, Europe Information Products, and MENA Information Services units. The estimated fair value for each of APAC Information Services and APAC Information Products exceeded its carrying value by a significant margin.
F-16
Step two of the goodwill test, which was required only for Europe Information Services, Europe Information Products, and MENA Information Services consisted of performing a hypothetical purchase price allocation, under which the estimated fair value was allocated to its tangible and intangible assets based on their estimated fair values. In the case of MENA Information Services, this process indicated that all of its existing goodwill and other intangibles were impaired, and management determined that it was not necessary to perform detailed step two calculations in order to conclude that all of the goodwill and other intangibles related to MENA Information Services should be written off. The total impairment charge for MENA Information Services was therefore $7.2 million, of which $4.8 million related to goodwill and $2.4 million related to other intangible assets.
For the European operations, there was no impairment for other intangible assets, but the hypothetical purchase price allocation indicated goodwill impairment of $72.5 million, of which $15.4 million was for European Information Services and $57.1 million was for European Information Products. The remaining goodwill for all current components, as of March 31, 2011, is US Information Services, $306.3 million; Europe Information Services, $13.4 million; APAC Information Services, $10.8 million; Brazil Information Services, $16.9 million; US Information Products, $51.2 million; Europe Information Products, $9.1 million; and APAC Information Products, $10.0 million.
Management believes that the estimated valuations it arrived at are reasonable and consistent with what other marketplace participants would use in valuing the Company’s components. However, management cannot give any assurance that these market values will not change in the future. For example, if discount rates demanded by the market increase, this could lead to reduced valuations under the income approach. If the Company’s projections are not achieved in the future, this could lead management to reassess their assumptions and lead to reduced valuations under the income approach. If the market price of the Company’s stock decreases, this could cause the Company to reassess the reasonableness of the implied control premium, which might cause management to assume a higher discount rate under the income approach which could lead to reduced valuations. If future similar transactions exhibit lower multiples than those observed in the past, this could lead to reduced valuations under the similar transactions approach. And finally, if there is a general decline in the stock market and particularly in those companies selected as comparable to the Company’s components, this could lead to reduced valuations under the public company market multiple approach. The Company’s next annual impairment test will be performed during the first quarter of fiscal 2012 at which time the Company will perform step-one testing on all of its components (including the US and Brazil components which were not tested in the fourth quarter of fiscal 2011). Given the current market conditions and continued economic uncertainty, the fair value of the Company’s components could deteriorate which could result in the need to record impairment charges in future periods. The Company continues to monitor potential triggering events including changes in the business climate in which it operates, attrition of key personnel, the current volatility in the capital markets, the Company’s market capitalization compared to its book value, the Company’s recent operating performance, and the Company’s financial projections. The occurrence of one or more triggering events could require additional impairment testing, which could result in additional impairment charges.
Deferred Costs and Data Acquisition Costs – The Company defers certain costs, primarily salaries and benefits and other direct and incremental third party costs, in connection with client contracts and various other contracts and arrangements. Direct and incremental costs incurred during the setup phase under client contracts for database management or for IT management arrangements are deferred until such time as the database or the outsourcing services are operational and revenue recognition begins. These costs are directly related to the individual client, are to be used specifically for the individual client and have no other use or future benefit. In addition, revenue recognition of billings, if any, related to these setup activities are deferred during the setup phase under client contracts. All costs and billings deferred are then amortized as contract revenue recognition occurs over the remaining term of the arrangement. During the period when costs are being deferred, the Company performs a net realizable value review on a quarterly basis to ensure that the deferred costs are recoverable through either 1) recognition of previously deferred revenue, 2) future minimum contractual billings or 3) billings in excess of contractual minimum billings that can be reasonably estimated and are deemed likely to occur. Once revenue recognition begins, these deferred costs are assessed for impairment when events or changes in circumstances indicate the carrying value may not be recoverable. Some contracts contain provisions allowing the customer to request reductions in pricing if they can demonstrate that the Company charges lower prices for similar services to other customers, or if the prices charged are higher than certain benchmarks. If pricing is renegotiated, deferred costs are assessed for impairment.
F-17
The test of recoverability is performed by comparing the carrying value of the asset to its undiscounted expected future cash flows. If such review indicates that the carrying amount of an asset exceeds the sum of its expected future cash flows, the asset’s carrying amount is written down to its estimated fair value. Fair value is determined by an internally developed discounted projected cash flow analysis of the asset.
The total deferred costs at March 31, 2011 are $81.8 million. Of that amount, $62.8 million relates to two customers. If the Company were to determine that amounts from either of these two customers are unrecoverable, the resulting write-down in carrying value could be material.
In addition to client contract costs, the Company defers direct and incremental costs incurred in connection with obtaining other contracts, including debt facilities, lease facilities, and various other arrangements. Costs deferred in connection with obtaining scheduled debt facilities are amortized over the term of the arrangement using the interest method. Costs deferred in connection with lease facilities or revolving credit facilities are amortized over the term of the arrangement on a straight-line basis.
The Company also defers costs related to the acquisition or licensing of data for the Company’s proprietary databases which are used in providing data products and services to customers. These costs are amortized over the useful life of the data, which is from two to seven years. In order to estimate the useful life of any acquired data, the Company considers several factors including 1) the kind of data acquired, 2) whether the data becomes stale over time, 3) to what extent the data will be replaced by updated data over time, 4) whether the stale data continues to have value as historical data, 5) whether a license places restrictions on the use of the data, and 6) the term of the license.
Restructuring – The Company records costs associated with employee terminations and other exit activity in accordance with applicable accounting standards, depending on whether the costs relate to exit or disposal activities under the accounting standards, or whether they are other postemployment termination benefits. Under applicable accounting standards related to exit or disposal costs, the Company records employee termination benefits as an operating expense when the benefit arrangement is communicated to the employee and no significant future services are required. Under the accounting standards related to postemployment termination benefits, the Company records employee termination benefits when the termination benefits are probable and can be estimated. The Company recognizes the present value of facility lease termination obligations, net of estimated sublease income and other exit costs, when the Company has future payments with no future economic benefit or a commitment to pay the termination costs of a prior commitment. In future periods the Company will record accretion expense to increase the liability to an amount equal to the estimated future cash payments necessary to exit the leases. This requires a significant amount of judgment and management estimation in order to determine the expected time frame it will take to secure a subtenant, the amount of sublease income to be received and the appropriate discount rate to calculate the present value of the future cash flows. Should actual lease exit costs differ from estimates, the Company may be required to adjust the restructuring charge which would impact net income in the period any adjustment was recorded.
New Accounting Pronouncements
The FASB’s Emerging Issues Task Force has issued new accounting guidance for revenue arrangements with multiple deliverables. Under previous accounting guidance, one of the requirements for recognition of revenue for a delivered item under a multiple element arrangement was that there must be objective and verifiable evidence of the standalone selling price of the undelivered item. The new guidance eliminates that requirement and requires an entity to estimate the selling price of each element in the arrangement. In addition, absent specific software revenue guidance, the residual method of allocating arrangement consideration is no longer permitted. Under the new guidance, a multiple-deliverable arrangement is separated into more than one unit of accounting if the delivered items have value to the client on a stand-alone basis and, if the arrangement includes a general right of return related to the delivered item(s), delivery or performance of the undelivered item(s) is considered probable and substantially in the control of the Company. If these criteria are not met, the arrangement is accounted for as one unit of accounting, which would result in revenue being recognized ratably over the contract term or being deferred until the earlier of when those criteria are met or when the last undelivered item is delivered. If the arrangement is separated into multiple units of accounting, the arrangement consideration is allocated to the separate units of accounting based on each unit’s relative selling price.
F-18
The relative selling price for each unit of accounting in a multiple-element arrangement is established using vendor-specific objective evidence (VSOE), if available, third-party evidence (TPE), if available, or management’s best estimate of stand-alone selling price (BESP). In most cases, the Company has neither VSOE nor TPE and therefore uses BESP. The objective of BESP is to determine the price at which the company would transact a sale if the product or service were sold on a stand-alone basis. Management’s BESP is determined by considering multiple factors, including actual contractual selling prices when the item is sold on a stand-alone basis, as well as market conditions, competition, internal costs, profit objectives and pricing practices. The amount of revenue recognized for a delivered element is limited to an amount that is not contingent upon future delivery of additional products or services. As pricing and marketing strategies evolve, we may modify our pricing practices in the future, which could result in changes to BESP, or to the development of VSOE or TPE for individual products or services. As a result, future revenue recognition for multiple-element arrangements could differ from recognition in the current period. Our relative selling prices are analyzed on an annual basis, or more frequently if we experience significant changes in selling prices.
As allowed, the Company has elected to early-adopt the provisions of the guidance as of April 1, 2010 on a prospective basis for new arrangements entered into or materially modified on or after that date. The impact of the new accounting standard is not expected to be material going forward, nor would it have had a material impact if it had been applied to the previous fiscal year. There was also no material impact from implementation of the guidance in the year ended March 31, 2011.
The FASB has also issued guidance which amended the scope of existing software revenue recognition guidance. Tangible products containing software components and non-software components that function together to deliver the tangible product’s essential functionality are no longer within the scope of software revenue guidance and are accounted for based on other applicable revenue recognition guidance. In addition, the amendments require that hardware components of a tangible product containing software components are always excluded from the software revenue guidance. This guidance must be adopted in the same period that the Company adopts the amended guidance for arrangements with multiple deliverables. Therefore, the Company elected to early-adopt this guidance as of April 1, 2010 on a prospective basis for all new or materially modified arrangements entered into on or after that date. The adoption of this guidance did not have a material impact on the consolidated financial statements.
In December 2007, the FASB issued Statement of Financial Accounting Standards No. 141(R), “Business Combinations,” (“SFAS 141R”), which replaces SFAS 141. SFAS 141R has subsequently been codified in the FASB Accounting Standards Codification Topic 805 (“ASC 805”). ASC 805 requires most assets acquired and liabilities assumed in a business combination, contingent consideration, and certain acquired contingencies to be measured at their fair values as of the date of acquisition. The new standard also requires that acquisition-related costs and restructuring costs be recognized separately from the business combination. The new standard was adopted by the Company as of April 1, 2009 and is effective prospectively for business combinations entered into after that date.
In December 2007, the FASB issued Statement of Financial Accounting Standards No. 160, “Noncontrolling Interest in Consolidated Financial Statements,” (“SFAS 160”). SFAS 160 has subsequently been codified in the FASB Accounting Standards Codification Topic 810 (“ASC 810”). The new standard amends previous accounting standards to establish new accounting and reporting standards for the noncontrolling interest in a subsidiary and for the deconsolidation of a subsidiary. The new standard was adopted by the Company as of April 1, 2009. As a result of adoption of this standard, the Company classifies noncontrolling interests as a component of equity and the results of operations attributable to noncontrolling interests is reported as a part of net earnings.
F-19
Management’s Report on Internal Control Over Financial Reporting
The management of Acxiom Corporation (the Company) is responsible for establishing and maintaining adequate internal control over financial reporting.
The Company’s internal control over financial reporting is a process designed to provide reasonable assurance regarding the reliability of financial reporting and the preparation of financial statements for external purposes in accordance with generally accepted accounting principles, and includes those policies and procedures that:
|
·
|
Pertain to the maintenance of records that, in reasonable detail, accurately and fairly reflect the transactions and dispositions of the assets of the Company;
|
|
·
|
Provide reasonable assurance that transactions are recorded as necessary to permit preparation of financial statements in accordance with generally accepted accounting principles, and that receipts and expenditures of the Company are being made only in accordance with authorizations of management and directors of the Company; and
|
|
·
|
Provide reasonable assurance regarding prevention or timely detection of unauthorized acquisition, use or disposition of the Company’s assets that could have a material effect on the financial statements.
|
Because of its inherent limitations, internal control over financial reporting may not prevent or detect misstatements. Also, projections of any evaluations of effectiveness to future periods are subject to the risk that controls may become inadequate because of changes in conditions, or that the degree of compliance with the policies or procedures may deteriorate.
The Company’s management assessed the effectiveness of the Company’s internal control over financial reporting as of March 31, 2011. In making this assessment, the Company’s management used the criteria set forth by the Committee of Sponsoring Organizations of the Treadway Commission (COSO) in Internal Control-Integrated Framework.
Based on management’s assessment and those criteria, the Company’s management determined that the Company’s internal control over financial reporting was effective as of March 31, 2011.
KPMG LLP, the Company’s independent registered public accounting firm that audited the financial statements included in this annual report, has issued an attestation report, appearing on the following page, regarding its assessment of the Company’s internal control over financial reporting as of March 31, 2011.
F-20
Report of Independent Registered Public Accounting Firm
The Board of Directors and Stockholders
Acxiom Corporation:
We have audited the accompanying consolidated balance sheets of Acxiom Corporation and subsidiaries (the Company) as of March 31, 2011 and 2010, and the related consolidated statements of operations, equity and comprehensive income (loss), and cash flows for each of the years in the three-year period ended March 31, 2011. These consolidated financial statements are the responsibility of the Company’s management. Our responsibility is to express an opinion on these consolidated financial statements based on our audits.
We conducted our audits in accordance with the standards of the Public Company Accounting Oversight Board (United States). Those standards require that we plan and perform the audit to obtain reasonable assurance about whether the financial statements are free of material misstatement. An audit includes examining, on a test basis, evidence supporting the amounts and disclosures in the financial statements. An audit also includes assessing the accounting principles used and significant estimates made by management, as well as evaluating the overall financial statement presentation. We believe that our audits provide a reasonable basis for our opinion.
In our opinion, the consolidated financial statements referred to above present fairly, in all material respects, the financial position of Acxiom Corporation and subsidiaries as of March 31, 2011 and 2010, and the results of their operations and their cash flows for each of the years in the three-year period ended March 31, 2011, in conformity with U.S. generally accepted accounting principles.
We also have audited, in accordance with the standards of the Public Company Accounting Oversight Board (United States), Acxiom Corporation’s internal control over financial reporting as of March 31, 2011, based on criteria established in Internal Control – Integrated Framework issued by the Committee of Sponsoring Organizations of the Treadway Commission (COSO), and our report dated May 27, 2011 expressed an unqualified opinion on the effectiveness of the Company’s internal control over financial reporting.
As discussed in note 1 to the consolidated financial statements, the Company has changed their method of accounting for noncontrolling interests as of April 1, 2009 due to the adoption of FASB Statement No. 160, Noncontrolling Interests in Consolidated Financial Statements (included in FASB ASC Topic 810, Consolidation). In addition, as discussed in note 1 to the consolidated financial statements, the Company changed its method of accounting for business combinations as of April 1, 2009 due to the adoption of FASB Statement No. 141R, Business Combinations (included in FASB ASC Topic 805, Business Combinations).
KPMG LLP
Dallas, Texas
May 27, 2011
F-21
Report of Independent Registered Public Accounting Firm
The Board of Directors and Stockholders
Acxiom Corporation:
We have audited Acxiom Corporation’s (the Company) internal control over financial reporting as of March 31, 2011, based on criteria established in Internal Control – Integrated Framework issued by the Committee of Sponsoring Organizations of the Treadway Commission (COSO). Acxiom Corporation’s management is responsible for maintaining effective internal control over financial reporting and for its assessment of the effectiveness of internal control over financial reporting, included in the accompanying Management’s Report on Internal Control over Financial Reporting. Our responsibility is to express an opinion on the Company’s internal control over financial reporting based on our audit.
We conducted our audit in accordance with the standards of the Public Company Accounting Oversight Board (United States). Those standards require that we plan and perform the audit to obtain reasonable assurance about whether effective internal control over financial reporting was maintained in all material respects. Our audit included obtaining an understanding of internal control over financial reporting, assessing the risk that a material weakness exists, and testing and evaluating the design and operating effectiveness of internal control based on the assessed risk. Our audit also included performing such other procedures as we considered necessary in the circumstances. We believe that our audit provides a reasonable basis for our opinion.
A company’s internal control over financial reporting is a process designed to provide reasonable assurance regarding the reliability of financial reporting and the preparation of financial statements for external purposes in accordance with generally accepted accounting principles. A company’s internal control over financial reporting includes those policies and procedures that (1) pertain to the maintenance of records that, in reasonable detail, accurately and fairly reflect the transactions and dispositions of the assets of the company; (2) provide reasonable assurance that transactions are recorded as necessary to permit preparation of financial statements in accordance with generally accepted accounting principles, and that receipts and expenditures of the company are being made only in accordance with authorizations of management and directors of the company; and (3) provide reasonable assurance regarding prevention or timely detection of unauthorized acquisition, use, or disposition of the company’s assets that could have a material effect on the financial statements.
Because of its inherent limitations, internal control over financial reporting may not prevent or detect misstatements. Also, projections of any evaluation of effectiveness to future periods are subject to the risk that controls may become inadequate because of changes in conditions, or that the degree of compliance with the policies or procedures may deteriorate.
In our opinion, Acxiom Corporation maintained, in all material respects, effective internal control over financial reporting as of March 31, 2011, based on criteria established in Internal Control – Integrated Framework issued by the Committee of Sponsoring Organizations of the Treadway Commission.
We also have audited, in accordance with the standards of the Public Company Accounting Oversight Board (United States), the consolidated balance sheets of Acxiom Corporation and subsidiaries as of March 31, 2011 and 2010, and the related consolidated statements of operations, equity and comprehensive income (loss), and cash flows for each of the years in the three-year period ended March 31, 2011, and our report dated May 27, 2011 expressed an unqualified opinion on those consolidated financial statements.
KPMG LLP
Dallas, Texas
May 27, 2011
F-22
ACXIOM CORPORATION AND SUBSIDIARIES
CONSOLIDATED BALANCE SHEETS
MARCH 31, 2011 AND 2010
(Dollars in thousands)
|
2011
|
2010
|
|||||||
|
ASSETS
|
||||||||
|
Current assets:
|
||||||||
|
Cash and cash equivalents
|
$ | 207,023 | $ | 224,104 | ||||
|
Trade accounts receivable, net
|
176,654 | 168,522 | ||||||
|
Deferred income taxes
|
12,480 | 11,874 | ||||||
|
Refundable income taxes
|
7,402 | - | ||||||
|
Other current assets
|
55,691 | 54,205 | ||||||
|
Total current assets
|
459,250 | 458,705 | ||||||
|
Property and equipment, net of accumulated depreciation and amortization
|
255,307 | 236,839 | ||||||
|
Software, net of accumulated amortization of $214,713 in 2011 and $198,410 in 2010
|
26,412 | 38,845 | ||||||
|
Goodwill
|
417,654 | 470,261 | ||||||
|
Purchased software licenses, net of accumulated amortization of $257,029 in 2011 and $253,434 in 2010
|
38,583 | 51,356 | ||||||
|
Deferred costs, net
|
81,837 | 68,914 | ||||||
|
Data acquisition costs, net
|
17,627 | 21,931 | ||||||
|
Other assets, net
|
9,955 | 16,569 | ||||||
| $ | 1,306,625 | $ | 1,363,420 | |||||
|
LIABILITIES AND EQUITY
|
||||||||
|
Current liabilities:
|
||||||||
|
Current installments of long-term debt
|
$ | 27,978 | $ | 42,106 | ||||
|
Trade accounts payable
|
27,507 | 42,774 | ||||||
|
Accrued expenses
|
||||||||
|
Payroll
|
42,236 | 36,517 | ||||||
|
Other
|
75,852 | 75,632 | ||||||
|
Deferred revenue
|
55,921 | 55,567 | ||||||
|
Income taxes
|
- | 2,460 | ||||||
|
Total current liabilities
|
229,494 | 255,056 | ||||||
|
Long-term debt
|
394,260 | 458,629 | ||||||
|
Deferred income taxes
|
84,360 | 61,284 | ||||||
|
Other liabilities
|
7,478 | 9,954 | ||||||
|
Commitments and contingencies
|
||||||||
|
Equity:
|
||||||||
|
Common stock, $0.10 par value (authorized 200 million shares; issued 117.8 million and 116.6 million shares at March 31, 2011 and 2010, respectively)
|
11,777 | 11,662 | ||||||
|
Additional paid-in capital
|
837,439 | 814,929 | ||||||
|
Retained earnings
|
459,096 | 482,243 | ||||||
|
Accumulated other comprehensive income (loss)
|
15,991 | 4,167 | ||||||
|
Treasury stock, at cost (37.2 million shares at March 31, 2011 and 2010)
|
(739,125 | ) | (738,601 | ) | ||||
|
Total Acxiom stockholders' equity
|
585,178 | 574,400 | ||||||
|
Noncontrolling interest
|
5,855 | 4,097 | ||||||
|
Total equity
|
591,033 | 578,497 | ||||||
| $ | 1,306,625 | $ | 1,363,420 | |||||
|
See accompanying notes to consolidated financial statements.
|
||||||||
F-23
ACXIOM CORPORATION AND SUBSIDIARIES
CONSOLIDATED STATEMENTS OF OPERATIONS
YEARS ENDED MARCH 31, 2011, 2010 AND 2009
(Dollars in thousands, except per share amounts)
|
2011
|
2010
|
2009
|
||||||||||
|
Revenue:
|
||||||||||||
|
Services
|
$ | 893,594 | $ | 849,432 | $ | 920,262 | ||||||
|
Products
|
266,376 | 249,803 | 356,311 | |||||||||
|
Total revenue
|
1,159,970 | 1,099,235 | 1,276,573 | |||||||||
|
Operating costs and expenses:
|
||||||||||||
|
Cost of revenue
|
||||||||||||
|
Services
|
694,988 | 654,659 | 694,340 | |||||||||
|
Products
|
189,900 | 184,610 | 280,846 | |||||||||
|
Total cost of revenue
|
884,888 | 839,269 | 975,186 | |||||||||
|
Selling, general and administrative
|
159,884 | 162,097 | 169,960 | |||||||||
|
Impairment of goodwill and other intangibles
|
79,674 | - | - | |||||||||
|
Gains, losses and other items, net
|
4,600 | (944 | ) | 38,566 | ||||||||
|
Total operating costs and expenses
|
1,129,046 | 1,000,422 | 1,183,712 | |||||||||
|
Income from operations
|
30,924 | 98,813 | 92,861 | |||||||||
|
Other income (expense):
|
||||||||||||
|
Interest expense
|
(23,823 | ) | (22,480 | ) | (32,596 | ) | ||||||
|
Other, net
|
(1,466 | ) | 425 | 1,949 | ||||||||
|
Total other income (expense)
|
(25,289 | ) | (22,055 | ) | (30,647 | ) | ||||||
|
Earnings before income taxes
|
5,635 | 76,758 | 62,214 | |||||||||
|
Income tax expense
|
34,077 | 32,599 | 24,710 | |||||||||
|
Net earnings (loss)
|
(28,442 | ) | 44,159 | 37,504 | ||||||||
|
Less: Net loss attributable to noncontrolling interest
|
(5,295 | ) | (390 | ) | - | |||||||
|
Net earnings (loss) attributable to Acxiom
|
$ | (23,147 | ) | $ | 44,549 | $ | 37,504 | |||||
|
Earnings (loss) per share:
|
||||||||||||
|
Basic
|
$ | (0.36 | ) | $ | 0.56 | $ | 0.48 | |||||
|
Diluted
|
$ | (0.36 | ) | $ | 0.55 | $ | 0.48 | |||||
|
Earnings (loss) per share attributable to Acxiom stockholders:
|
||||||||||||
|
Basic
|
$ | (0.29 | ) | $ | 0.56 | $ | 0.48 | |||||
|
Diluted
|
$ | (0.29 | ) | $ | 0.56 | $ | 0.48 | |||||
|
See accompanying notes to consolidated financial statements.
|
||||||||||||
F-24
ACXIOM CORPORATION AND SUBSIDIARIES
CONSOLIDATED STATEMENTS OF EQUITY AND COMPREHENSIVE INCOME (LOSS)
YEARS ENDED MARCH 31, 2011, 2010 AND 2009
(Dollars in thousands)
|
Common Stock
|
Treasury stock
|
|
Number of shares
|
Amount
|
Additional paid-in capital
|
Comprehensive income (loss)
|
Retained earnings
|
Accumulated other comprehensive income (loss)
|
Number
of shares
|
Amount
|
Noncontrolling interest
|
Total equity
|
|||||||||||||||||||||||||||||||
|
Balances at March 31, 2008
|
114,280,599 | $ | 11,428 | $ | 779,815 | - | $ | 409,502 | $ | 33,976 | (36,996,236 | ) | $ | (738,465 | ) | $ | - | $ | 496,256 | |||||||||||||||||||||
|
Employee stock awards, benefit plans and other issuances
|
1,143,308 | 115 | 10,751 | - | - | - | - | - | - | 10,866 | ||||||||||||||||||||||||||||||
|
Tax impact of stock options, warrants and restricted stock
|
- | - | 34 | - | - | - | - | - | - | 34 | ||||||||||||||||||||||||||||||
|
Non-cash share-based compensation
|
- | - | 9,527 | - | - | - | 53,869 | 815 | - | 10,342 | ||||||||||||||||||||||||||||||
|
Restricted stock units vested
|
332,969 | 33 | (33 | ) | - | - | - | - | - | - | - | |||||||||||||||||||||||||||||
|
Acquisition of treasury stock
|
- | - | - | - | - | - | (282,500 | ) | (2,062 | ) | - | (2,062 | ) | |||||||||||||||||||||||||||
|
Dividends
|
- | - | - | - | (9,312 | ) | - | - | - | - | (9,312 | ) | ||||||||||||||||||||||||||||
|
Comprehensive loss:
|
||||||||||||||||||||||||||||||||||||||||
|
Foreign currency translation
|
- | - | - | (36,163 | ) | - | (36,163 | ) | - | - | - | (36,163 | ) | |||||||||||||||||||||||||||
|
Unrealized loss on interest rate swap
|
- | - | - | (3,956 | ) | - | (3,956 | ) | - | - | - | (3,956 | ) | |||||||||||||||||||||||||||
|
Unrealized loss on marketable securities
|
- | - | - | (95 | ) | - | (95 | ) | - | - | - | (95 | ) | |||||||||||||||||||||||||||
|
Net earnings
|
- | - | - | 37,504 | 37,504 | - | - | - | - | 37,504 | ||||||||||||||||||||||||||||||
|
Total comprehensive loss
|
$ | (2,710 | ) | |||||||||||||||||||||||||||||||||||||
|
Balances at March 31, 2009
|
115,756,876 | $ | 11,576 | $ | 800,094 | $ | 437,694 | $ | (6,238 | ) | (37,224,867 | ) | $ | (739,712 | ) | $ | - | $ | 503,414 | |||||||||||||||||||||
|
Employee stock awards, benefit plans and other issuances
|
559,348 | 56 | 5,869 | - | - | - | - | - | - | 5,925 | ||||||||||||||||||||||||||||||
|
Tax impact of stock options, warrants and restricted stock
|
- | - | (683 | ) | - | - | - | - | - | - | (683 | ) | ||||||||||||||||||||||||||||
|
Non-cash share-based compensation
|
- | - | 9,679 | - | - | - | 70,631 | 1,111 | - | 10,790 | ||||||||||||||||||||||||||||||
|
Restricted stock units vested
|
303,458 | 30 | (30 | ) | - | - | - | - | - | - | - | |||||||||||||||||||||||||||||
|
Purchase of MENA
|
- | - | - | - | - | - | - | - | 4,030 | 4,030 | ||||||||||||||||||||||||||||||
|
Noncontrolling interest equity contributions
|
- | - | - | - | - | - | - | - | 457 | 457 | ||||||||||||||||||||||||||||||
|
Comprehensive income:
|
||||||||||||||||||||||||||||||||||||||||
|
Foreign currency translation
|
- | - | - | 9,674 | - | 9,674 | - | - | - | 9,674 | ||||||||||||||||||||||||||||||
|
Unrealized gain on interest rate swap
|
- | - | - | 758 | - | 758 | - | - | - | 758 | ||||||||||||||||||||||||||||||
|
Unrealized loss on marketable securities
|
- | - | - | (27 | ) | - | (27 | ) | - | - | - | (27 | ) | |||||||||||||||||||||||||||
|
Net earnings
|
- | - | - | 44,549 | 44,549 | - | - | (390 | ) | 44,159 | ||||||||||||||||||||||||||||||
|
Total comprehensive income
|
- | - | - | $ | 54,954 | |||||||||||||||||||||||||||||||||||
|
Balances at March 31, 2010
|
116,619,682 | $ | 11,662 | $ | 814,929 | $ | 482,243 | $ | 4,167 | (37,154,236 | ) | $ | (738,601 | ) | $ | 4,097 | $ | 578,497 | ||||||||||||||||||||||
|
Employee stock awards, benefit plans and other issuances
|
662,988 | 66 | 9,778 | - | - | - | (29,538 | ) | (524 | ) | - | 9,320 | ||||||||||||||||||||||||||||
|
Tax impact of stock options, warrants and restricted stock
|
- | - | (316 | ) | - | - | - | - | - | - | (316 | ) | ||||||||||||||||||||||||||||
|
Non-cash share-based compensation
|
- | - | 13,097 | - | - | - | - | - | - | 13,097 | ||||||||||||||||||||||||||||||
|
Restricted stock units vested
|
484,865 | 49 | (49 | ) | - | - | - | - | - | - | - | |||||||||||||||||||||||||||||
|
Purchase of GoDigital
|
- | - | - | - | - | - | - | - | 6,573 | 6,573 | ||||||||||||||||||||||||||||||
|
Noncontrolling interest equity contribution
|
- | - | - | - | - | - | - | - | 480 | 480 | ||||||||||||||||||||||||||||||
|
Comprehensive income (loss):
|
||||||||||||||||||||||||||||||||||||||||
|
Foreign currency translation
|
- | - | - | 9,518 | - | 9,518 | - | - | - | 9,518 | ||||||||||||||||||||||||||||||
|
Unrealized gain on interest rate swap
|
- | - | - | 2,306 | - | 2,306 | - | - | - | 2,306 | ||||||||||||||||||||||||||||||
|
Net loss
|
- | - | - | (23,147 | ) | (23,147 | ) | - | - | (5,295 | ) | (28,442 | ) | |||||||||||||||||||||||||||
|
Total comprehensive loss
|
- | - | - | $ | (11,323 | ) | ||||||||||||||||||||||||||||||||||
|
Balances at March 31, 2011
|
117,767,535 | $ | 11,777 | $ | 837,439 | $ | 459,096 | $ | 15,991 | (37,183,774 | ) | $ | (739,125 | ) | $ | 5,855 | $ | 591,033 | ||||||||||||||||||||||
|
|
See accompanying notes to consolidated financial statements
|
F-25
ACXIOM CORPORATION AND SUBSIDIARIES
CONSOLIDATED STATEMENTS OF CASH FLOWS
YEARS ENDED MARCH 31, 2011, 2010 AND 2009
(Dollars in thousands)
|
2011
|
2010
|
2009
|
||||||||||
|
Cash flows from operating activities:
|
||||||||||||
|
Net earnings (loss)
|
$ | (28,442 | ) | $ | 44,159 | $ | 37,504 | |||||
|
Adjustments to reconcile net earnings (loss) to net cash provided by operating activities:
|
||||||||||||
|
Impairment of goodwill and other intangibles
|
79,674 | - | - | |||||||||
|
Depreciation, amortization and impairment of long-lived assets
|
146,355 | 167,564 | 198,684 | |||||||||
|
Gain on disposal of assets, net
|
3,883 | 417 | 22,658 | |||||||||
|
Deferred income taxes
|
18,579 | 32,810 | 16,423 | |||||||||
|
Non-cash share-based compensation expense
|
13,097 | 10,790 | 10,342 | |||||||||
|
Changes in operating assets and liabilities:
|
||||||||||||
|
Accounts receivable, net
|
(13,024 | ) | 10,295 | 16,100 | ||||||||
|
Other assets
|
(2,394 | ) | 2,171 | 12,347 | ||||||||
|
Deferred costs
|
(29,385 | ) | (20,289 | ) | (4,743 | ) | ||||||
|
Accounts payable and other liabilities
|
(22,899 | ) | (8,215 | ) | (32,006 | ) | ||||||
|
Deferred revenue
|
775 | (420 | ) | (8,468 | ) | |||||||
|
Net cash provided by operating activities
|
166,219 | 239,282 | 268,841 | |||||||||
|
Cash flows from investing activities:
|
||||||||||||
|
Payments for the disposition of operations
|
(1,079 | ) | - | - | ||||||||
|
Proceeds received from the disposition of assets
|
- | 1,058 | 24,174 | |||||||||
|
Capitalized software development costs
|
(4,555 | ) | (8,257 | ) | (16,239 | ) | ||||||
|
Capital expenditures
|
(59,021 | ) | (57,908 | ) | (31,449 | ) | ||||||
|
Payments received (paid) for investments
|
175 | (2,000 | ) | 2,599 | ||||||||
|
Data acquisition costs
|
(13,366 | ) | (18,808 | ) | (30,561 | ) | ||||||
|
Net cash paid in acquisitions
|
(12,927 | ) | (3,428 | ) | (15,903 | ) | ||||||
|
Cash collected from the sale and license of
software
|
- | - | 2,000 | |||||||||
|
Net cash used in investing activities
|
(90,773 | ) | (89,343 | ) | (65,379 | ) | ||||||
|
Cash flows from financing activities:
|
||||||||||||
|
Payments of debt
|
(102,101 | ) | (104,521 | ) | (86,772 | ) | ||||||
|
Fees for debt refinancing
|
- | (4,564 | ) | - | ||||||||
|
Dividends paid
|
- | - | (9,312 | ) | ||||||||
|
Sale of common stock
|
9,320 | 5,925 | 10,866 | |||||||||
|
Acquisition of treasury stock
|
- | (306 | ) | (1,756 | ) | |||||||
|
Noncontrolling interests equity contributions
|
480 | 457 | - | |||||||||
|
Income tax impact of stock options, warrants and restricted stock
|
(316 | ) | (683 | ) | 34 | |||||||
|
Net cash used in financing activities
|
(92,617 | ) | (103,692 | ) | (86,940 | ) | ||||||
|
Effect of exchange rate changes on cash
|
90 | 691 | (2,017 | ) | ||||||||
|
Net increase in cash and cash equivalents
|
(17,081 | ) | 46,938 | 114,505 | ||||||||
|
Cash and cash equivalents at beginning of period
|
224,104 | 177,166 | 62,661 | |||||||||
|
Cash and cash equivalents at end of period
|
$ | 207,023 | $ | 224,104 | $ | 177,166 | ||||||
|
See accompanying notes to consolidated financial statements
|
||||||||||||
F-26
ACXIOM CORPORATION AND SUBSIDIARIES
CONSOLIDATED STATEMENTS OF CASH FLOWS (Continued)
YEARS ENDED MARCH 31, 2011, 2010 AND 2009
(Dollars in thousands)
|
2011
|
2010
|
2009
|
||||||||||
|
Supplemental cash flow information:
|
||||||||||||
|
Cash paid (received) during the period for:
|
||||||||||||
|
Interest
|
$ | 23,886 | $ | 21,337 | $ | 33,138 | ||||||
|
Income taxes
|
25,339 | (7,549 | ) | (3,189 | ) | |||||||
|
Payments on capital leases and installment payment arrangements
|
22,357 | 29,697 | 40,789 | |||||||||
|
Payments on software and data license liabilities
|
5,316 | 7,526 | 23,217 | |||||||||
|
Prepayment of debt
|
66,000 | 57,500 | 14,500 | |||||||||
|
Other debt payments, excluding line of credit
|
8,428 | 9,798 | 8,266 | |||||||||
|
Noncash investing and financing activities:
|
||||||||||||
|
Acquisition of property and equipment under capital leases and installment payment arrangements
|
23,753 | 24,193 | 11,040 | |||||||||
|
Enterprise software licenses and maintenance acquired under software obligation
|
- | 2,171 | 9,955 | |||||||||
|
See accompanying notes to consolidated financial statements.
|
||||||||||||
F-27
ACXIOM CORPORATION AND SUBSIDIARIES
NOTES TO CONSOLIDATED FINANCIAL STATEMENTS
MARCH 31, 2011, 2010 AND 2009
1. SUMMARY OF SIGNIFICANT ACCOUNTING POLICIES:
Description of Business -
Acxiom is a recognized leader in marketing services and technology that enable marketers to successfully manage audiences, personalize consumer experiences and create profitable customer relationships. Our superior industry-focused, consultative approach combines consumer data and analytics, databases, data integration and consulting solutions for personalized, multichannel marketing strategies. Acxiom leverages over 40 years of experience in data management to deliver high-performance, highly secure, reliable information management services. Founded in 1969, Acxiom is headquartered in Little Rock, Arkansas, USA and serves clients around the world from locations in the United States, Europe, South America, Asia-Pacific and the Middle East.
Basis of Presentation and Principles of Consolidation -
The consolidated financial statements include the accounts of the Company and its subsidiaries. All significant intercompany balances and transactions have been eliminated in consolidation. Investments in 20% to 50% owned entities are accounted for using the equity method with equity in earnings recorded in “other, net” in the accompanying consolidated statements of operations. Investments in less than 20% owned entities are accounted for at cost. Investment income and charges related to investments accounted for at cost are recorded in “other, net.”
Use of Estimates -
Management of the Company has made a number of estimates and assumptions relating to the reporting of assets and liabilities and the disclosure of contingent assets and liabilities to prepare these consolidated financial statements in conformity with accounting principles generally accepted in the United States. Actual results could differ from those estimates. Areas in which significant judgments and estimates are used include projected cash flows associated with recoverability of assets, restructuring and impairment accruals, and litigation loss accruals.
Adoption of New Accounting Standards -
In December 2007, the FASB issued Statement of Financial Accounting Standards No. 141(R), “Business Combinations,” (“SFAS 141R”), which replaces SFAS 141. SFAS 141R has subsequently been codified in the FASB Accounting Standards Codification Topic 805 (“ASC 805”). ASC 805 requires most assets acquired and liabilities assumed in a business combination, contingent consideration, and certain acquired contingencies to be measured at their fair values as of the date of acquisition. The new standard also requires that acquisition-related costs and restructuring costs be recognized separately from the business combination. The new standard was adopted by the Company as of April 1, 2009 and is effective prospectively for business combinations entered into after that date.
In December 2007, the FASB issued Statement of Financial Accounting Standards No. 160, “Noncontrolling Interest in Consolidated Financial Statements,” (“SFAS 160”). SFAS 160 has subsequently been codified in the FASB Accounting Standards Codification Topic 810 (“ASC 810”). The new standard amends previous accounting standards to establish new accounting and reporting standards for the noncontrolling interest in a subsidiary and for the deconsolidation of a subsidiary. The new standard was adopted by the Company as of April 1, 2009. As a result of adoption of this standard, the Company classifies noncontrolling interests as a component of equity and the results of operations attributable to noncontrolling interests is reported as a part of net earnings.
The FASB’s Emerging Issues Task Force has issued new accounting guidance for revenue arrangements with multiple deliverables. Under previous accounting guidance, one of the requirements for recognition of revenue for a delivered item under a multiple element arrangement was that there must be objective and verifiable evidence of the standalone selling price of the undelivered item. The new guidance eliminates that requirement and requires an entity to estimate the selling price of each element in the arrangement. In addition, absent specific software revenue guidance, the residual method of allocating arrangement consideration is no longer permitted. Under the new guidance, a multiple-deliverable arrangement is separated into more than one unit of accounting if the delivered items have value to the client on a stand-alone basis and, if the arrangement includes a general right of return related to the delivered item(s), delivery or performance of the undelivered item(s) is considered probable and substantially in the control of the Company. If these criteria are not met, the arrangement is accounted for as one unit of accounting, which would result in revenue being recognized ratably over the contract term or being deferred until the earlier of when those criteria are met or when the last undelivered item is delivered. If the arrangement is separated into multiple units of accounting, the arrangement consideration is allocated to the separate units of accounting based on each unit’s relative selling price.
F-28
The relative selling price for each unit of accounting in a multiple-element arrangement is established using vendor-specific objective evidence (VSOE), if available, third-party evidence (TPE), if available, or management’s best estimate of stand-alone selling price (BESP). In most cases, the Company has neither VSOE nor TPE and therefore uses BESP. The objective of BESP is to determine the price at which the company would transact a sale if the product or service were sold on a stand-alone basis. Management’s BESP is determined by considering multiple factors including actual contractual selling prices when the item is sold on a stand-alone basis, as well as market conditions, competition, internal costs, profit objectives and pricing practices. The amount of revenue recognized for a delivered element is limited to an amount that is not contingent upon future delivery of additional products or services. As pricing and marketing strategies evolve, we may modify our pricing practices in the future, which could result in changes to BESP, or to the development of VSOE or TPE for individual products or services. As a result, future revenue recognition for multiple-element arrangements could differ from recognition in the current period. Our relative selling prices are analyzed on an annual basis, or more frequently if we experience significant changes in selling prices.
As allowed, the Company has elected to early-adopt the provisions of the guidance as of April 1, 2010 on a prospective basis for new arrangements entered into or materially modified on or after that date. The impact of the new accounting standard is not expected to be material going forward, nor would it have had a material impact if it had been applied to the previous fiscal year. There was also no material impact from implementation of the guidance in the year ended March 31, 2011.
The FASB has also issued guidance which amended the scope of existing software revenue recognition guidance. Tangible products containing software components and non-software components that function together to deliver the tangible product’s essential functionality are no longer within the scope of software revenue guidance and are accounted for based on other applicable revenue recognition guidance. In addition, the amendments require that hardware components of a tangible product containing software components are always excluded from the software revenue guidance. This guidance must be adopted in the same period that the Company adopts the amended guidance for arrangements with multiple deliverables. Therefore, the Company elected to early-adopt this guidance as of April 1, 2010 on a prospective basis for all new or materially modified arrangements entered into on or after that date. The adoption of this guidance did not have a material impact on the consolidated financial statements.
Cash and Cash Equivalents -
The Company considers all highly-liquid investments with original maturities of three months or less to be cash equivalents.
Accounts Receivable -
Accounts receivable include amounts billed to customers as well as unbilled amounts recognized in accordance with the Company’s revenue recognition policies, as stated below. Unbilled amounts included in accounts receivable, which generally arise from the delivery of data and performance of services to customers in advance of billings, were $24.8 million and $19.8 million, respectively, at March 31, 2011 and 2010.
Accounts receivable are presented net of allowance for doubtful accounts. The Company evaluates its allowance for doubtful accounts based on a combination of factors at each reporting date. Each account or group of accounts is evaluated based on specific information known to management regarding each customer’s ability or inability to pay, as well as historical experience for each customer or group of customers, the length of time the receivable has been outstanding, and current economic conditions in the customer’s industry. Accounts receivable that are determined to be uncollectible are charged against the allowance for doubtful accounts.
Property and Equipment -
Property and equipment are stated at cost. Depreciation and amortization are calculated on the straight-line method over the estimated useful lives of the assets as follows: buildings and improvements, 2 - 30 years; data processing equipment, 2 - 5 years, and office furniture and other equipment, 3 - 7 years.
Property held under capitalized lease arrangements is included in property and equipment, and the associated liabilities are included in long-term obligations. Amortization of property under capitalized leases is included in depreciation and amortization expense. Property and equipment taken out of service and held for sale is recorded at the lower of depreciated cost or net realizable value and depreciation is ceased.
F-29
Leases -
Rent expense on operating leases is recorded on a straight-line basis over the term of the lease agreement.
Software and Research and Development Costs –
Costs of internally developed software are amortized on a straight-line basis over the remaining estimated economic life of the software product, generally two to five years, or the amortization that would be recorded by using the ratio of gross revenues for a product to total current and anticipated future gross revenues for that product, whichever is greater. The Company capitalizes software development costs following accounting standards regarding the costs of computer software to be sold, leased or otherwise marketed or the costs of computer software developed or obtained for internal use. Although there are differences in the two accounting standards, depending on whether a product is intended for internal use or to be provided to customers, both accounting standards generally require that research and development costs incurred prior to establishing technological feasibility or the beginning of the application development stage of software products are charged to operations as such costs are incurred. Once technological feasibility is established or the application development stage has begun, costs are capitalized until the software is available for general release. Amortization expense related to both internally developed and purchased software is included in cost of revenue in the accompanying consolidated statements of operations.
Purchased Software Licenses -
Costs of purchased software licenses are amortized using a units-of-production basis over the estimated economic life of the license, generally not to exceed ten years. Amortization of software is included in cost of revenue in the accompanying consolidated statements of operations.
Some of these licenses are, in effect, volume purchase agreements for software licenses needed for internal use and to provide services to customers over the terms of the agreements. Therefore, amortization lives are periodically reevaluated and, if justified, adjusted to reflect current and future expected usage based on units-of-production amortization. Factors considered in estimating remaining useful life include, but are not limited to, contract provisions of the underlying licenses, introduction of new mainframe hardware which is compatible with previous generation software, predictions of continuing viability of mainframe architecture, and customers’ continuing commitments to utilize mainframe architecture and the software under contract.
Goodwill -
Goodwill represents the excess of acquisition costs over the fair values of net assets acquired in business combinations. Goodwill is reviewed at least annually for impairment under a two-part test. Part one of the goodwill impairment test involves a determination of whether the total book value of each reporting unit of the Company (generally defined as the carrying value of assets minus the carrying value of liabilities) exceeds the reporting unit’s estimated fair value. In the event that part one of the impairment test indicates an excess of book value over the estimated fair value of net assets, performance of part two of the impairment test is required, whereby estimated fair values are assigned to identifiable assets with any residual fair value assigned to goodwill. Impairment exists to the extent that the reporting unit’s recorded goodwill exceeds the residual fair value assigned to such goodwill. Any impairment that results from the completion of the two-part test is recorded as a charge to operations during the period in which the impairment test is completed. Completion of the Company’s most recent annual impairment test during the quarter ended June 30, 2010 indicated that no potential impairment of its goodwill balances existed. During the quarter ended March 31, 2011, triggering events occurred which required the Company to test the goodwill in its International operations for impairment. Results of the two-step test indicated impairment in certain units, and the Company has recorded an impairment charge of $77.3 million to those units (see note 6). The Company expects to complete its next annual impairment test during the quarter ending June 30, 2011.
F-30
ACXIOM CORPORATION AND SUBSIDIARIES
NOTES TO CONSOLIDATED FINANCIAL STATEMENTS
MARCH 31, 2011, 2010 AND 2009
Impairment of Long-lived Assets and Long-lived Assets to Be Disposed Of -
Long-lived assets and certain identifiable intangibles as well as equity investments are reviewed for impairment whenever events or changes in circumstances indicate that the carrying amount of an asset may not be recoverable. The Company considers factors such as operating losses, declining outlooks, and business conditions when evaluating the necessity for an impairment analysis. Recoverability of assets to be held and used is measured by a comparison of the carrying amount of an asset to the undiscounted cash flows expected to result from the use and eventual disposition of the asset. If such assets are considered to be impaired, the impairment to be recognized is measured by the amount by which the carrying amount of the assets exceeds the fair value of the assets. Assets to be disposed of shall be classified as held for sale and are reported at the lower of the carrying amount or fair value less costs to sell.
During the quarter ended March 31, 2011, in conjunction with the goodwill impairment test noted above, the Company also tested certain intangible assets in its International operations for impairment. As a result of that review, the Company has recorded an impairment charge of $2.4 million for intangible assets related to the Middle East operations (see note 6).
Deferred Costs and Data Acquisition Costs -
The Company defers certain costs, primarily salaries and benefits and other direct and incremental third party costs, in connection with client contracts and various other contracts and arrangements. Direct and incremental costs incurred during the setup phase under client contracts for database management or for IT management arrangements are deferred until such time as the database or the outsourcing services are operational and revenue recognition begins. These costs are directly related to the individual client, are to be used specifically for the individual client and have no other use or future benefit. In addition, revenue recognition of billings, if any, related to these setup activities are deferred during the setup phase under client contracts. All costs and billings deferred are then amortized as contract revenue recognition occurs over the remaining term of the arrangement. During the period when costs are being deferred, the Company performs a net realizable value review on a quarterly basis to ensure that the deferred costs are recoverable through either 1) recognition of previously deferred revenue, 2) future minimum contractual billings or 3) billings in excess of contractual minimum billings that can be reasonably estimated and are deemed likely to occur. Once revenue recognition begins, these deferred costs are assessed for impairment when events or changes in circumstances indicate the carrying value may not be recoverable. Some contracts contain provisions allowing the customer to request reductions in pricing if they can demonstrate that the Company charges lower prices for similar services to other customers, or if the prices charged are higher than certain benchmarks. If pricing is renegotiated, deferred costs are assessed for impairment.
The test of recoverability is performed by comparing the carrying value of the asset to its undiscounted expected future cash flows. If such review indicates that the carrying amount of an asset exceeds the sum of its expected future cash flows, the asset’s carrying amount is written down to its estimated fair value. Fair value is determined by an internally developed discounted projected cash flow analysis of the asset.
In addition to client contract costs, the Company defers direct and incremental costs incurred in connection with obtaining other contracts, including debt facilities, lease facilities, and various other arrangements. Costs deferred in connection with obtaining scheduled debt facilities are amortized over the term of the arrangement using the interest method. Costs deferred in connection with lease facilities or revolving credit facilities are amortized over the term of the arrangement on a straight-line basis.
The Company also defers costs related to the acquisition or licensing of data for the Company’s proprietary databases which are used in providing data products and services to customers. These costs are amortized over the useful life of the data, which is from two to seven years. In order to estimate the useful life of any acquired data, the Company considers several factors including 1) the kind of data acquired, 2) whether the data becomes stale over time, 3) to what extent the data will be replaced by updated data over time, 4) whether the stale data continues to have value as historical data, 5) whether a license places restrictions on the use of the data, and 6) the term of the license.
F-31
ACXIOM CORPORATION AND SUBSIDIARIES
NOTES TO CONSOLIDATED FINANCIAL STATEMENTS
MARCH 31, 2011, 2010 AND 2009
Deferred Revenue -
Deferred revenue consists of amounts billed in excess of revenue recognized on sales of data licenses, services and equipment. Deferred revenues are subsequently recorded as revenue in accordance with the Company’s revenue recognition policies.
Revenue Recognition -
The Company provides database management and IT management services under long-term arrangements. These arrangements may require the Company to perform setup activities such as the design and build of a database for the customer under the database management contracts and migration of the customer’s IT environment under IT management contracts. In the case of database management contracts, the customer does not acquire any ownership rights to the Company’s intellectual property used in the database and the database itself provides no benefit to the customer outside of the utilization of the system during the term of the database management arrangement. In some cases, the arrangements also contain provisions requiring customer acceptance of the setup activities prior to commencement of the ongoing services arrangement. Up-front fees billed during the setup phase for these arrangements are deferred and setup costs that are direct and incremental to the contract are capitalized and amortized on a straight-line basis over the service term of the contract. Revenue recognition does not begin until after customer acceptance in cases where contracts contain acceptance provisions. Once the setup phase is complete and customer acceptance occurs, the Company recognizes revenue over the remaining service term of the contract. In situations where the arrangement does not require customer acceptance before the Company begins providing services, revenue is recognized over the contract period and no costs are deferred.
Sales of third-party software, hardware and certain other equipment are recognized when delivered. If such sales are part of a multiple-element arrangement, they are recognized as a separate element unless collection of the sales price is dependent upon delivery of other products or services. Additionally, the Company evaluates revenue from the sale of data, software, hardware and equipment in accordance with accounting standards to determine whether such revenue should be recognized on a gross or a net basis. All of the factors in the accounting standards are considered with the primary factor being whether the Company is the primary obligor in the arrangement. “Out-of-pocket” expenses incurred by, and reimbursed to, the Company in connection with customer contracts are recorded as gross revenue.
The Company evaluates its database management and IT management arrangements to determine whether the arrangement contains a lease. If the arrangement is determined to contain a lease, applicable accounting standards require the Company to account for the lease component separately from the remaining components of the arrangement. In cases where database management or IT management arrangements are determined to include a lease, the lease is evaluated to determine whether it is a capital lease or operating lease and accounted for accordingly. These lease revenues are not significant to the Company’s consolidated financial statements.
Revenues from the licensing of data are recognized upon delivery of the data to the customer. Revenue from the licensing of data to the customer in circumstances where the license agreement contains a volume cap is recognized in proportion to the total records to be delivered under the arrangement. Revenue from the sale of data on a per-record basis is recognized as the records are delivered.
The relative selling price for each unit of accounting in a multiple-element arrangement is established using vendor-specific objective evidence (VSOE), if available, third-party evidence (TPE), if available, or management’s best estimate of stand-alone selling price (BESP). In most cases, the Company has neither VSOE nor TPE and therefore uses BESP. The objective of BESP is to determine the price at which the company would transact a sale if the product or service were sold on a stand-alone basis. Management’s BESP is determined by considering multiple factors including actual contractual selling prices when the item is sold on a stand-alone basis, as well as market conditions, competition, internal costs, profit objectives and pricing practices. The amount of revenue recognized for a delivered element is limited to an amount that is not contingent upon future delivery of additional products or services. As pricing and marketing strategies evolve, we may modify our pricing practices in the future, which could result in changes to BESP, or to the development of VSOE or TPE for individual products or services. As a result, future revenue recognition for multiple-element arrangements could differ from recognition in the current period. Our relative selling prices are analyzed on an annual basis, or more frequently if we experience significant changes in selling prices.
All taxes assessed on revenue-producing transactions described above are presented on a net basis, or excluded from revenues.
F-32
The Company also performs services on a project basis outside of, or in addition to, the scope of long-term arrangements. The Company recognizes revenue from these services as the services are performed.
The Company does not provide end-users with price-protection or rights of return. The Company’s contracts provide a warranty that the services or products will meet the agreed-upon criteria or any necessary modifications will be made. The Company ensures that services or products delivered meet the agreed-upon criteria prior to recognition of revenue.
Concentration of Credit Risk -
Financial instruments that potentially subject the Company to concentrations of credit risk consist primarily of trade accounts, unbilled and notes receivable. The Company’s receivables are from a large number of customers. Accordingly, the Company’s credit risk is affected by general economic conditions. The Company maintains deposits in federally insured financial institutions in excess of federally insured limits. Management, however, believes the Company is not exposed to significant credit risk due to the financial position of the depository institutions in which those deposits are held.
Income Taxes -
The Company and its domestic subsidiaries file a consolidated federal income tax return. The Company’s foreign subsidiaries file separate income tax returns in the countries in which their operations are based.
The Company provides for deferred taxes under the asset and liability method. Deferred tax assets and liabilities are recognized for the future tax consequences attributable to differences between the financial statement carrying amounts of existing assets and liabilities and their respective tax bases. Deferred tax assets and liabilities are measured using enacted tax rates expected to apply to taxable income in the years in which those temporary differences are expected to be reversed. Valuation allowances are recorded to reduce deferred tax assets to an amount whose realization is more likely than not. In determining the recognition of uncertain tax positions, the Company applies a more-likely-than-not recognition threshold and determines the measurement of uncertain tax positions considering the amounts and probabilities of the outcomes that could be realized upon ultimate settlement with taxing authorities. Income taxes payable are classified in the accompanying consolidated balance sheets based on their estimated payment date.
Foreign Currency Translation -
The balance sheets of the Company’s foreign subsidiaries are translated at period-end rates of exchange, and the statements of operations are translated at the weighted-average exchange rate for the period. Gains or losses resulting from translating foreign currency financial statements are included in accumulated other comprehensive income (loss) in the consolidated statements of stockholders’ equity and comprehensive income (loss).
Advertising Expense -
The Company expenses advertising costs as incurred. Advertising expense was approximately $7.6 million, $8.1 million and $10.7 million for the years ended March 31, 2011, 2010 and 2009, respectively. Advertising expense is included in selling, general and administrative expense on the accompanying consolidated statements of operations.
Guarantees -
The Company accounts for the guarantees of indebtedness of others under applicable accounting standards which require a guarantor to recognize, at the inception of the guarantee, a liability for the fair value of the obligation undertaken in issuing the guarantee. A guarantor is also required to make additional disclosures in its financial statements about obligations under certain guarantees issued. The Company is required to recognize a liability in its consolidated financial statements equal to the fair value of its guarantees, including any guarantees issued in connection with its synthetic equipment leasing arrangements. However, these provisions are applied only on a prospective basis to guarantees issued or modified after December 31, 2002. The Company’s liability for the fair value of guarantees is not material.
F-33
ACXIOM CORPORATION AND SUBSIDIARIES
NOTES TO CONSOLIDATED FINANCIAL STATEMENTS
MARCH 31, 2011, 2010 AND 2009
Loss Contingencies and Legal Expenses -
The Company records a liability for loss contingencies when the liability is probable and reasonably estimable. Legal fees associated with loss contingencies are recorded when the legal fees are incurred.
Earnings (Loss) per Share -
A reconciliation of the numerator and denominator of basic and diluted earnings (loss) per share is shown below (in thousands, except per share amounts):
|
(dollars in thousands)
|
2011
|
2010
|
2009
|
|||||||||
|
Basic earnings (loss) per share:
|
||||||||||||
|
Numerator – net earnings (loss)
|
$ | (28,442 | ) | $ | 44,159 | $ | 37,504 | |||||
|
Denominator – weighted-average shares outstanding
|
80,111 | 78,974 | 77,892 | |||||||||
|
Basic earnings (loss) per share
|
$ | (0.36 | ) | $ | 0.56 | $ | 0.48 | |||||
|
Diluted earnings (loss) per share:
|
||||||||||||
|
Numerator – net earnings (loss)
|
$ | (28,442 | ) | $ | 44,159 | $ | 37,504 | |||||
|
Denominator:
|
||||||||||||
|
Weighted-average shares outstanding
|
80,111 | 78,974 | 77,892 | |||||||||
|
Dilutive effect of common stock options, warrants,
and restrictive stock as computed under the
treasury stock method
|
- | 751 | 333 | |||||||||
| 80,111 | 79,725 | 78,225 | ||||||||||
|
Diluted earnings (loss) per share
|
$ | (0.36 | ) | $ | 0.55 | $ | 0.48 | |||||
|
Basic earnings (loss) per share attributable to Acxiom stockholders:
|
||||||||||||
|
Numerator – net earnings (loss) attributable to Acxiom
|
$ | (23,147 | ) | $ | 44,549 | $ | 37,504 | |||||
|
Denominator – weighted-average shares outstanding
|
80,111 | 78,974 | 77,892 | |||||||||
|
Basic earnings (loss) per share attributable to Acxiom stockholders
|
$ | (0.29 | ) | $ | 0.56 | $ | 0.48 | |||||
|
Diluted earnings (loss) per share attributable to Acxiom stockholders:
|
||||||||||||
|
Numerator – net earnings (loss) attributable to Acxiom
|
$ | (23,147 | ) | $ | 44,549 | $ | 37,504 | |||||
|
Denominator:
|
||||||||||||
|
Weighted-average shares outstanding
|
80,111 | 78,974 | 77,892 | |||||||||
|
Dilutive effect of common stock options, warrants,
and restrictive stock as computed under the
treasury stock method
|
- | 751 | 333 | |||||||||
| 80,111 | 79,725 | 78,225 | ||||||||||
|
Diluted earnings (loss) per share attributable to Acxiom stockholders
|
$ | (0.29 | ) | $ | 0.56 | $ | 0.48 | |||||
F-34
ACXIOM CORPORATION AND SUBSIDIARIES
NOTES TO CONSOLIDATED FINANCIAL STATEMENTS
MARCH 31, 2011, 2010 AND 2009
Due to the net loss incurred by the Company, the dilutive effect of options, warrants and restricted stock of 1.7 million shares was excluded from the earnings per share calculation for fiscal 2011 since the impact on the calculation was anti-dilutive. In addition, options, warrants and restricted stock units to purchase shares of common stock that were outstanding during the periods presented, but were not included in the computation of diluted earnings per share because the effect was anti-dilutive are shown below (in thousands, except per share amounts):
|
2011
|
2010
|
2009
|
||||||||||
|
Number of shares outstanding under options, warrants and restricted stock units
|
5,938 | 8,839 | 10,773 | |||||||||
|
Range of exercise prices for options and warrants
|
$ | 16.71-$75.55 | $ | 11.87-$268.55 | $ | 10.66-$268.55 | ||||||
Share-based Compensation -
The Company accounts for share-based compensation under applicable accounting standards which require the cost of employee services received in exchange for an award of equity instruments (including stock options) based on the grant-date fair value of the award to be recognized in the statement of earnings over the service period of the award. Expense for awards with graded vesting is recognized on a straight-line basis over the service period of the entire award.
Share-based Compensation Plans -
The Company has stock option plans and equity compensation plans (collectively referred to as the “share-based plans”) administered by the compensation committee of the board of directors under which options and restricted stock units were outstanding as of March 31, 2011.
The Company’s equity compensation plan provides that all associates (employees, officers, directors, affiliates, independent contractors or consultants) are eligible to receive awards (grant of any option, stock appreciation right, restricted stock award, restricted stock unit award, performance award, performance share, performance unit, qualified performance-based award, or other stock unit award) pursuant to the plan with the terms and conditions applicable to an award set forth in applicable grant documents. The Company currently has outstanding, and expects to grant in the future, restricted stock awards, stock options and performance-based awards.
Incentive stock option awards granted pursuant to the share-based plans cannot be granted with an exercise price less than 100% of the per-share market value of the Company’s shares at the date of grant and have a maximum duration of ten years from the date of grant. Board policy currently requires that nonqualified options also must be priced at or above the fair market value of the common stock at the time of grant with a maximum duration of ten years.
Restricted stock units may be issued pursuant to the equity compensation plan and represent the right to receive shares in the future by way of an award agreement which includes vesting provisions. Award agreements can further provide for forfeitures triggered by certain prohibited activities, such as breach of confidentiality. All restricted stock units will be expensed over the vesting period as adjusted for estimated forfeitures. The vesting of some restricted stock units is subject to the Company’s achievement of certain performance criteria, as well as the individual remaining employed by the Company for a period of years.
The Company receives income tax deductions as a result of the exercise of stock options and the vesting of restricted stock units. The tax benefit of share-based compensation expense in excess of the book compensation expense is reflected as a financing cash inflow and operating cash outflow included in changes in operating assets and liabilities. The Company has elected the short-cut method in accounting for the tax benefits of share-based payment awards.
Derivatives and Hedging -
The Company has entered into an interest rate swap as a cash flow hedge against LIBOR interest rate movements on the term loan. The Company assesses the effectiveness of the hedge based on the hypothetical derivative method. Under the hypothetical derivative method, the cumulative change in fair value of the actual swap is compared to the cumulative change in fair value of the hypothetical swap, which has terms that identically match the critical terms of the hedged transaction. Thus, the hypothetical swap is presumed to perfectly offset the hedged cash flows. The change in the fair value of the perfect hypothetical swap will then be regarded as a proxy for the present value of the cumulative change in the expected future cash flows from the hedged transactions. All of the fair values are derived from an interest-rate futures model. All changes in fair value of the derivative are deferred and recorded in other comprehensive income (loss) until the related forecasted transaction is recognized in the consolidated statement of operations. The fair value of the interest rate swap agreement recorded in accumulated other comprehensive income (loss) may be recognized in the statement of operations if certain terms of the floating-rate debt change, if the floating-rate debt is extinguished or if the interest rate swap agreement is terminated prior to maturity.
F-35
Restructuring -
The Company records costs associated with employee terminations and other exit activity in accordance with applicable accounting standards, depending on whether the costs relate to exit or disposal activities under the accounting standards, or whether they are other post employment termination benefits, Under applicable accounting standards related to exit or disposal costs, the Company records employee termination benefits as an operating expense when the benefit arrangement is communicated to the employee and no significant future services are required. Under the accounting standards related to post employment termination benefits the Company records employee termination benefits when the termination benefits are probable and can be estimated. The Company recognizes the present value of facility lease termination obligations, net of estimated sublease income and other exit costs, when the Company has future payments with no future economic benefit or a commitment to pay the termination costs of a prior commitment. In future periods the Company will record accretion expense to increase the liability to an amount equal to the estimated future cash payments necessary to exit the leases. This requires a significant amount of judgment and management estimation in order to determine the expected time frame it will take to secure a subtenant, the amount of sublease income to be received and the appropriate discount rate to calculate the present value of the future cash flows. Should actual lease exit costs differ from estimates, the Company may be required to adjust the restructuring charge which will impact net income in the period any adjustment is recorded.
2. RESTRUCTURING, IMPAIRMENT AND OTHER CHARGES:
The following table summarizes the restructuring activity for the years ended March 31, 2009, 2010 and 2011 (dollars in thousands):
|
Associate-related reserves
|
Ongoing
contract costs
|
Other accruals
|
Total
|
|||||||||||||
|
March 31, 2008
|
$ | 13,648 | $ | 26,880 | $ | 357 | $ | 40,885 | ||||||||
|
Fiscal year 2009 restructuring
plan amount
|
12,434 | 3,210 | - | 15,644 | ||||||||||||
|
Adjustments
|
(1,246 | ) | 752 | (39 | ) | (533 | ) | |||||||||
|
Payments
|
(16,603 | ) | (6,910 | ) | (318 | ) | (23,831 | ) | ||||||||
|
March 31, 2009
|
$ | 8,233 | $ | 23,932 | $ | - | $ | 32,165 | ||||||||
|
Adjustments
|
1,026 | (1,336 | ) | - | (310 | ) | ||||||||||
|
Payments
|
(6,389 | ) | (9,692 | ) | - | (16,081 | ) | |||||||||
|
March 31, 2010
|
$ | 2,870 | $ | 12,904 | $ | - | $ | 15,774 | ||||||||
|
Fiscal year 2011 restructuring plan amount
|
6,064 | - | - | 6,064 | ||||||||||||
|
Adjustments
|
(291 | ) | (1,338 | ) | - | (1,629 | ) | |||||||||
|
Payments
|
(3,081 | ) | (2,024 | ) | - | (5,105 | ) | |||||||||
|
March 31, 2011
|
$ | 5,562 | $ | 9,542 | $ | - | $ | 15,104 | ||||||||
The above balances are included in accrued expenses on the consolidated balance sheet.
Restructuring Plans
In the current fiscal year, the Company recorded $4.4 million in restructuring charges and adjustments included in gains, losses and other items in the consolidated statement of operations. The expense includes severance and other associate-related charges of $3.4 million, offset by adjustments to previous restructuring plans of $1.7 million, and executive leadership transition charges of $2.7 million.
F-36
The associate-related charges of $3.4 million result from the termination of associates in the United States, Australia, and Europe. Of the $3.4 million accrued, $2.8 million remained accrued at March 31, 2011. These amounts are expected to be paid out during fiscal 2012.
The transition charges of $2.7 million result from the transition agreement between the Company and its Chief Executive Officer upon his resignation in March 2011. According to the agreement, one lump sum payment equal to two times the Officer’s annual salary and bonus opportunity was to be paid by the Company. The entire amount of $2.7 million was accrued at March 31, 2011 and was paid in full in April 2011.
In fiscal 2009, the Company recorded a total of $42.3 million in restructuring charges and adjustments included in gains, losses and other items in the consolidated statement of operations. The expense included severance and other associate-related payments of $12.4 million, lease accruals of $3.2 million, asset disposal and write-offs of $26.5 million and adjustments to the fiscal 2008 restructuring plan of $0.2 million. Included in the asset disposal was a $24.6 million loss incurred as a result of the Company terminating a software contract.
The associate-related payments of $12.4 million relate to the termination of associates in the United States and Europe. All of these costs had been paid as of March 31, 2011.
The lease accruals of $3.2 million were evaluated under the accounting standards which govern exit costs. These accounting standards require the Company to make an accrual for the liability for lease costs that will continue to be incurred without economic benefit to the Company upon the date that the Company ceases using the leased property. On or before March 31, 2009, the Company ceased using certain leased office facilities. The Company attempts to sublease those facilities to the extent possible. The Company established a liability for the fair value of the remaining lease payments, partially offset by the estimated sublease payments to be received over the course of those leases. The fair value of these liabilities is based on a net present value model using a credit-adjusted risk-free rate. These liabilities will be paid out over the remainder of the leased properties’ terms, of which the longest continues through August 2015. Actual sublease terms may differ from the estimates originally made by the Company. Any future changes in the estimates or in the actual sublease income could require future adjustments to the liability for these leases, which would impact net income in the period the adjustment is recorded. The remaining amount accrued at March 31, 2011 is $1.2 million.
In fiscal 2008, the Company recorded a total of $75.1 million in restructuring charges and adjustments included in gains, losses and other items in the consolidated statement of operations. The expense included severance and other associate-related payments of $19.3 million, of which $0.1 million remain to be paid at March 31, 2011; lease accruals of $19.0 million, of which $8.3 million remain to be paid over the remainder of the lease terms, of which the longest continues through November 2021; contract accruals of $6.7 million, all of which had been paid by March 31, 2011; asset disposal and write-offs of $29.6 million, and other related costs of $0.5 million.
Disposition of Operations in France
In fiscal 2008, the Company sold its GIS operations in France. Adjustments regarding the final calculated purchase price were recorded in fiscal 2009 and 2010 resulting in gains of $2.1 million and $0.7 million, respectively.
F-37
ACXIOM CORPORATION AND SUBSIDIARIES
NOTES TO CONSOLIDATED FINANCIAL STATEMENTS
MARCH 31, 2011, 2010 AND 2009
Gains, Losses and Other Items
Gains, losses and other items for each of the years presented are as follows (dollars in thousands):
|
2011
|
2010
|
2009
|
||||||||||
|
Gain on disposition of operations in France
|
- | (677 | ) | (2,083 | ) | |||||||
|
Loss on disposition of operations in Portugal (see note 4)
|
828 | - | - | |||||||||
|
Loss on disposition of operations in Netherlands (see note 4)
|
2,511 | - | - | |||||||||
|
Legal contingency
|
(2,125 | ) | - | 1,000 | ||||||||
|
Restructuring plan charges and adjustments
|
4,435 | (1,292 | ) | 42,340 | ||||||||
|
Leased airplane disposals
|
- | - | (110 | ) | ||||||||
|
Earnout liability adjustment (see note 3)
|
(1,058 | ) | - | - | ||||||||
|
Other
|
9 | 1,025 | (2,581 | ) | ||||||||
| $ | 4,600 | $ | (944 | ) | $ | 38,566 | ||||||
3. ACQUISITIONS:
On July 1, 2010, the Company completed the acquisition of a 70% interest in GoDigital Tecnologia E Participacoes, Ltda. (“GoDigital”), a Brazilian marketing services business. The Company paid $10.9 million, net of cash acquired, and not including amounts, if any, to be paid under an earnout agreement in which the Company may pay up to an additional $9.3 million based on the results of the acquired business over approximately the next two years. The acquired business has annual revenue of approximately $8 million. The Company has omitted pro forma disclosures related to this acquisition as the pro forma effect of the acquisition is not material. The results of operations for GoDigital are included in the Company’s consolidated results beginning July 1, 2010.
The value of the earnout was originally estimated at $3.6 million. During the current fiscal period, the Company has estimated the value of the earnout to have decreased by $1.1 million and has recorded the adjustment in gains, losses and other items, net on the consolidated statement of operations. The value of the earnout liability will continue to be adjusted to its estimated value until the completion of the earnout period.
On April 1, 2010, the Company acquired 100% of the outstanding shares of a digital marketing business (“XYZ”) operating in Australia and New Zealand. The acquisition gives the Company additional market opportunities in this region. The Company paid $1.8 million in cash, net of cash acquired, and not including amounts, if any, to be paid under an earnout agreement in which the Company may pay up to an additional $0.6 million if the acquired business achieves a revenue target over the next two years. The value of the earnout is estimated at $0.5 million. The acquired business has annual revenue of less than $2 million. The Company has omitted pro forma disclosures related to this acquisition as the pro forma effect of this acquisition is not material. The results of operation for the acquisition are included in the Company’s consolidated results beginning April 1, 2010.
In December 2009, the Company acquired a 51% interest in Direct Marketing Services (“DMS”), with operations in Saudi Arabia and the United Arab Emirates. Subsequently, Acxiom’s ownership has increased to 57%. Upon acquisition DMS was reorganized as a limited liability company registered under the laws and regulations of the Kingdom of Saudi Arabia and renamed Acxiom Middle East and North Africa, LTD (“MENA”). The purchase price for DMS was $3.8 million in cash, not including the amount, if any, to be paid pursuant to an earnout agreement where additional payment is contingent on MENA’s financial performance for the period ending on December 31, 2012. Financial performance under the earnout will be measured based on MENA’s calculation of earnings before interest, taxes, depreciation and amortization (“EBITDA”). The actual EBITDA will be divided by $18.3 million and that percentage multiplied by $6.1 million to determine the earnout payment. There will be no earnout payment if the actual EBITDA does not exceed $12.8 million. The Company has omitted pro forma disclosures related to this acquisition as the pro forma effect of this acquisition is not material to the Company’s consolidated results for any period presented. DMS has annual revenue of less than $5 million. The results of operations for MENA are included in the Company’s consolidated results beginning December 1, 2009.
During the year ended March 31, 2011, triggering events occurred which required the Company to test the goodwill and other intangible assets of MENA for impairment (see note 6). Management concluded that all of the goodwill and other intangibles were impaired. A total impairment charge of $7.2 million was recorded in impairment of goodwill and other intangibles on the consolidated statement of operations, of which $4.8 million was related to goodwill and $2.4 million related to other intangible assets. Approximately 43% of this charge is attributable to the noncontrolling interest.
F-38
On November 7, 2008, the Company acquired the assets of Quinetia, LLC, a Rochester, New York-based provider of analytics and predictive modeling for large and medium size businesses. The acquisition provides the Company additional consumer insight capabilities that enable clients to more effectively retain and grow their customer base and optimize pricing. The Company paid $2.7 million, net of cash acquired, for the acquisition not including amounts paid pursuant to an earnout agreement. The earnout agreement allows for payment of up to $1.2 million if the acquired business achieves certain earnings before interest, tax, depreciation and amortization goals. Payments under the earnout agreement are determined based on results in the target measurement periods ending March 31, 2009, 2010 and 2011. The first earnout payment of $0.2 million in fiscal 2009 and the second earnout payment of $0.2 million in fiscal 2010 have been added to the purchase price. The final earnout payment of $0.3 million was added to the purchase price in fiscal 2011. The acquired business has annual revenues of less than $5.0 million. The Company has omitted pro forma disclosures related to this acquisition as the pro forma effect of this acquisition is not material to the Company’s consolidated results for any period presented. Quinetia’s results of operations are included in the Company’s consolidated results beginning November 7, 2008.
On September 15, 2008, the Company acquired the direct marketing technology unit of Alvion, LLC. The acquisition allowed the Company to obtain a proven online marketing list fulfillment platform that can be used by small and medium-size businesses that need immediate access to marketing information through a software-as-service environment. The Company paid $3.6 million in cash, net of cash acquired, for the acquisition. The acquired business has annual revenues of less than $5.0 million. The Company has omitted pro forma disclosures related to this acquisition as the pro forma effect of this acquisition is not material to the Company’s consolidated results for any period presented. Alvion’s results of operations are included in the Company’s consolidated results beginning September 15, 2008.
In July 2008, the Company acquired the database marketing unit of ChoicePoint Precision Marketing, LLC (“Precision Marketing”). The Company paid $9.0 million, of which $4.5 million was paid into two escrow accounts which were subject to escrow arrangements which were finally resolved during fiscal 2010. A total of $0.5 million of one of the escrow funds was released to reimburse the Company for costs incurred. Of the remaining $4.0 million escrow fund, $3.6 million was paid to the sellers and approximately $0.4 million was returned to the Company. The $4.0 million placed into escrow was originally treated as purchase price, therefore the $0.4 million returned to the Company was recorded as a reduction of purchase price and the $3.6 million was charged to goodwill. The acquired business had annual revenue of approximately $16.0 million. The Company has omitted pro forma disclosures related to this acquisition as the pro forma effect of this acquisition is not material to the Company’s consolidated results for any period presented. Precision Marketing’s results of operations are included in the Company’s consolidated results beginning July 1, 2008.
F-39
ACXIOM CORPORATION AND SUBSIDIARIES
NOTES TO CONSOLIDATED FINANCIAL STATEMENTS
MARCH 31, 2011, 2010 AND 2009
The following table shows the allocation of GoDigital, XYZ, MENA, Quinetia, Alvion, and Precision Marketing purchase prices to assets acquired and liabilities assumed (dollars in thousands):
|
GoDigital
|
XYZ
|
MENA
|
Quinetia
|
Alvion
|
Precision Marketing
|
|||||||||||||||||||
|
Assets acquired:
|
||||||||||||||||||||||||
|
Cash
|
$ | 776 | $ | 547 | $ | 40 | $ | 138 | $ | 368 | $ | - | ||||||||||||
|
Goodwill
|
15,546 | 1,446 | 4,824 | 2,024 | 873 | 5,715 | ||||||||||||||||||
|
Other intangible assets
|
6,500 | 779 | 3,250 | 900 | 1,860 | 2,300 | ||||||||||||||||||
|
Other current and noncurrent assets
|
1,178 | 184 | 2,139 | 606 | 1,049 | 2,806 | ||||||||||||||||||
| 24,000 | 2,956 | 10,253 | 3,668 | 4,150 | 10,821 | |||||||||||||||||||
|
Accounts payable, accrued expenses and capital leases assumed
|
2,091 | 120 | 2,027 | 191 | 150 | 2,178 | ||||||||||||||||||
|
Net assets acquired
|
21,909 | 2,836 | 8,226 | 3,477 | 4,000 | 8,643 | ||||||||||||||||||
|
Less:
|
||||||||||||||||||||||||
|
Cash acquired
|
776 | 547 | 40 | 138 | 368 | - | ||||||||||||||||||
|
Earnout liability
|
3,611 | 532 | 371 | - | - | - | ||||||||||||||||||
|
Noncontrolling interest
|
6,573 | - | 4,030 | - | - | - | ||||||||||||||||||
|
Net cash paid
|
$ | 10,949 | $ | 1,757 | $ | 3,785 | $ | 3,339 | $ | 3,632 | $ | 8,643 | ||||||||||||
The fair values of the noncontrolling interests in GoDigital and MENA in the table above were derived based on the purchase price paid by Acxiom for its interest. The amount allocated to goodwill is due primarily to assembled work force. The amounts allocated to other intangible assets in the table above include software, customer relationship intangibles and trademarks. Amortization lives for those intangibles range from two years to seven years. The following table shows the amortization activity of these intangible assets (dollars in thousands):
|
2011
|
2010
|
2009
|
||||||||||
|
Database assets, gross
|
$ | - | $ | 10,040 | $ | 10,040 | ||||||
|
Accumulated amortization
|
- | (10,040 | ) | (10,040 | ) | |||||||
|
Net database assets
|
$ | - | $ | - | $ | - | ||||||
|
Developed technology assets, gross
|
$ | 21,165 | $ | 20,990 | $ | 19,590 | ||||||
|
Accumulated amortization
|
(15,679 | ) | (16,615 | ) | (12,650 | ) | ||||||
|
Net developed technology assets
|
$ | 5,486 | $ | 4,375 | $ | 6,940 | ||||||
|
Customer/trademark assets, gross
|
$ | 25,042 | $ | 30,015 | $ | 28,165 | ||||||
|
Accumulated amortization
|
(18,146 | ) | (20,294 | ) | (16,586 | ) | ||||||
|
Net customer/trademark assets
|
$ | 6,896 | $ | 9,721 | $ | 11,579 | ||||||
|
Total intangible assets, gross
|
$ | 46,207 | $ | 61,045 | $ | 57,795 | ||||||
|
Total accumulated amortization
|
(33,825 | ) | (46,949 | ) | (39,276 | ) | ||||||
|
Net intangible assets
|
$ | 12,382 | $ | 14,096 | $ | 18,519 | ||||||
|
Amortization expense
|
$ | 6,950 | $ | 7,673 | $ | 7,929 | ||||||
F-40
ACXIOM CORPORATION AND SUBSIDIARIES
NOTES TO CONSOLIDATED FINANCIAL STATEMENTS
MARCH 31, 2011, 2010 AND 2009
The following table shows a projection of amortization expense associated with the above assets for the next five years (dollars in thousands):
|
Year ending March 31,
|
Projected amortization expense
|
|||
|
2012
|
5,880 | |||
|
2013
|
2,972 | |||
|
2014
|
1,803 | |||
|
2015
|
1,202 | |||
|
2016
|
463 | |||
|
Thereafter
|
62 | |||
The amounts allocated to intangible assets and goodwill for the Quinetia, Alvion, and Precision Marketing acquisitions are expected to be deductible for income tax purposes. The amounts allocated to intangible assets for GoDigital, XYZ and MENA are not expected to be deductible.
4. DIVESTITURES:
On February 1, 2011, the Company entered into an agreement to dispose of the Company’s operations in Portugal. The Company made a cash payment of $0.9 million to the acquirer as part of the disposal and recorded a loss in the statement of operations of $0.8 million. There was no goodwill allocated to the disposed operations. The revenue associated with the Portugal operations was approximately $0.7 million in fiscal 2011.
On March 31, 2011, the Company entered into an agreement to dispose of the Company’s operations in The Netherlands. The Company transferred $0.2 million in cash as part of the sale and recorded a loss in the statement of operations of $2.5 million. There was no goodwill allocated to the disposed operations. Included in the loss calculation was a $1.1 million accrual for exit activities. The revenue associated with The Netherlands operations was approximately $3.5 million in fiscal 2011.
5. OTHER CURRENT AND NONCURRENT ASSETS:
Other current assets consist of the following (dollars in thousands):
|
March 31,
2011
|
March 31,
2010
|
|||||||
|
Current portion of unbilled and notes receivable
|
$ | 738 | $ | 907 | ||||
|
Prepaid expenses
|
40,501 | 40,420 | ||||||
|
Non-trade receivables
|
1,409 | 1,188 | ||||||
|
Assets of non-qualified retirement plan (note 15)
|
12,840 | 11,564 | ||||||
|
Other miscellaneous assets
|
203 | 126 | ||||||
|
Other current assets
|
$ | 55,691 | $ | 54,205 | ||||
Other noncurrent assets consist of the following (dollars in thousands):
|
March 31,
2011
|
March 31,
2010
|
|||||||
|
Acquired intangible assets, net
|
$ | 6,896 | $ | 9,721 | ||||
|
Other miscellaneous noncurrent assets
|
2,748 | 4,975 | ||||||
|
Noncurrent portion of unbilled and notes receivable
|
311 | 1,873 | ||||||
|
Noncurrent assets
|
$ | 9,955 | $ | 16,569 | ||||
F-41
ACXIOM CORPORATION AND SUBSIDIARIES
NOTES TO CONSOLIDATED FINANCIAL STATEMENTS
MARCH 31, 2011, 2010 AND 2009
6. GOODWILL:
Goodwill represents the excess of acquisition costs over the fair values of net assets acquired in business combinations. Goodwill is measured and tested for impairment on an annual basis in the first quarter of the Company’s fiscal year in accordance with applicable accounting standards, or more frequently if indicators of impairment exist. Triggering events for interim impairment testing include indicators such as adverse industry or economic trends, restructuring actions, downward revisions to projections of financial performance, or a sustained decline in market capitalization. The performance of the impairment test involves a two-step process. The first step requires comparing the estimated fair value of a reporting unit to its net book value, including goodwill. A potential impairment exists if the estimated fair value of the reporting unit is lower than its net book value. The second step of the impairment test involves assigning the estimated fair value of the reporting unit to its identifiable assets, with any residual fair value being assigned to goodwill. If the carrying value of an individual indefinite-lived intangible asset (including goodwill) exceeds its estimated fair value, such asset is written down by an amount equal to such excess, and a corresponding amount is recorded as a charge to operations for the period in which the impairment test is completed. Completion of the Company’s annual impairment test during the quarter ended June 30, 2010 indicated no potential impairment of its goodwill balances.
Each quarter the Company considers whether indicators of impairment exist such that additional impairment testing may be necessary. During the quarter ended March 31, 2011, triggering events occurred which required the Company to test the goodwill associated with its International operations for impairment. The triggering events were changes to the Company’s projected long-term revenue growth and margins in both Europe and the Middle East and North Africa (MENA) as well as the disposal of the Company’s Portugal and Netherlands operations. Results of the two-step test indicated impairment associated with these operations, and the Company recorded an impairment charge of $79.7 million, of which $77.3 million was related to goodwill and $2.4 million was related to other intangible assets. The Company had not previously recorded any goodwill impairment, so the amount of goodwill impairment recorded in fiscal 2011 is also the cumulative amount of goodwill impairment as of March 31, 2011.
The carrying amount of goodwill, by operating segment, at March 31, 2011, 2010 and 2009, and the changes in those balances are presented in the following table.
|
(dollars in thousands)
|
Information Services
|
Information Products
|
Total
|
|||||||||
|
Balance at March 31, 2009
|
$ | 336,406 | $ | 118,538 | $ | 454,944 | ||||||
|
Acquisition of MENA
|
4,824 | - | 4,824 | |||||||||
|
Purchase adjustments
|
5,295 | - | 5,295 | |||||||||
|
Change in foreign currency translation adjustment
|
1,559 | 3,639 | 5,198 | |||||||||
|
Balance at March 31, 2010
|
$ | 348,084 | $ | 122,177 | $ | 470,261 | ||||||
|
Acquisition of XYZ
|
1,446 | - | 1,446 | |||||||||
|
Acquisition of GoDigital
|
15,546 | - | 15,546 | |||||||||
|
Purchase adjustments
|
244 | - | 244 | |||||||||
|
Goodwill impairment
|
(20,224 | ) | (57,100 | ) | (77,324 | ) | ||||||
|
Change in foreign currency translation adjustment
|
2,315 | 5,166 | 7,481 | |||||||||
|
Balance at March 31, 2011
|
$ | 347,411 | $ | 70,243 | $ | 417,654 | ||||||
Goodwill is tested for impairment at the reporting unit level, which is defined as either an operating segment or one step below operating segment, known as a component. Acxiom’s two operating segments as presented above are the Information Services segment and the Information Products segment. Because each of these segments contains both a US component and an International component, and there are some differences in economic characteristics between the US and International components, management tested a total of four components in its annual impairment test performed during the first quarter of fiscal 2011. The goodwill amounts as of April 1, 2010 included in each component tested were US Information Services, $306.1 million; US Information Products, $51.2 million; International Information Services, $42.0 million; and International Information Products $71.0 million.
In order to estimate a valuation for each of the four components tested, management used an income approach based on a discounted cash flow model together with valuations based on an analysis of public company market multiples and a similar transactions analysis.
F-42
The income approach involved projecting cash flows for each component into the future and discounting these cash flows at an appropriate discount rate. Management used budget figures for the first year of the projection model, and then projected those figures out into the future years using management’s best estimates of future revenue growth, operating margins, and other cash flow assumptions. The discount rates used for each component in order to arrive at an estimated fair value were estimated as the weighted-average cost of capital which a marketplace participant would use to value each component. These weighted-average costs of capital rates included a market risk factor, added to a risk-free rate of return, and a size premium that was specific to the component being tested. The resulting cost of equity was then weighted-averaged with the after-tax cost of debt.
The public company market multiple method was used to estimate values for each of the components by looking at market value multiples to revenue and EBITDA (earnings before interest, taxes, depreciation and amortization) for selected public companies that were believed to be representative of companies that marketplace participants would use to arrive at comparable multiples for the individual component being tested. These multiples were then used to develop an estimated value for that component.
The similar transactions method compared multiples based on acquisition prices of other companies believed to be those that marketplace participants would use to compare to the individual component being tested. Those multiples were then used to develop an estimated value for that component.
In order to arrive at an estimated value for each component, management used a weighted-average approach to combine the results of each analysis. Management believes that using multiple valuation approaches and then weighting them appropriately is a technique that a marketplace participant would use.
As a final test of the valuation results, the total of the values of the components was reconciled to the actual market value of Acxiom Corporation stock as of the April 1, 2010 valuation date. This reconciliation indicated an implied control premium. Management believes this control premium was reasonable compared to historical control premiums observed in actual transactions.
As of April 1, 2010, each of the components had an estimated fair value in excess of its carrying value, indicating no impairment. All of the components had a significant excess fair value, except for the International Information Products component, for which the excess fair value was 12%.
As described above, the Company historically had concluded that its International Information Products operations, which includes operations in Europe and Asia/Pacific (APAC), were properly aggregated into a single International Information Products component for purposes of impairment testing and its International Information Services operations, which includes operations in Europe, APAC, MENA and Brazil, were properly aggregated into a single International Information Services component for purposes of impairment testing. These conclusions were based on management’s determinations that the operations included in each of these non-US components shared economic characteristics, as well as similar products and services, types of customers, and services distribution methods. The primary economic characteristic that management concluded was similar for each of these units was expected long-term gross margins.
During the fourth quarter of fiscal 2011, as a result of the triggering events described above, and as management was developing revised projections for the Company’s International operations, management concluded that it was no longer appropriate to conclude that the respective operations previously included in the International Information Products component and the International Information Services component, respectively, all shared similar economic characteristics, due to management’s differing expectations for these operations over the long term. Therefore management did not aggregate these operations for testing as it had in the past, but instead performed step-one testing on the operations in the geographic regions described above individually (except for the Brazil operation, which was acquired in the current fiscal year and as to which management concluded the long-term expectations had not changed since the acquisition). The carrying value of the goodwill associated with these operations prior to performing the impairment tests performed in the fourth quarter of fiscal 2011 were: Europe Information Services, $28.8 million; APAC Information Services, $10.8 million; MENA Information Services, $4.8 million; Brazil Information Services, $16.9 million; Europe Information Products, $66.2 million; and APAC Information Products, $10.0 million. Based on the step-one testing, which utilized a weighted average of estimated values derived from a discounted cash flow model, similar transactions analysis, and public company market multiples analysis, the Company determined that there was indicated impairment for Europe Information Services, Europe Information Products, and MENA Information Services units. The estimated fair value for each of APAC Information Services and APAC Information Products exceeded its carrying value by a significant margin.
F-43
Step two of the goodwill test, which was required only for Europe Information Services, Europe Information Products, and MENA Information Services consisted of performing a hypothetical purchase price allocation, under which the estimated fair value was allocated to its tangible and intangible assets based on their estimated fair values. In the case of MENA Information Services, this process indicated that all of its existing goodwill and other intangibles were impaired, and management determined that it was not necessary to perform detailed step two calculations in order to conclude that all of the goodwill and other intangibles related to MENA Information Services should be written off. The total impairment charge for MENA Information Services was therefore $7.2 million, of which $4.8 million related to goodwill and $2.4 million related to other intangible assets.
For the European operations, there was no impairment for other intangible assets, but the hypothetical purchase price allocation indicated goodwill impairment of $72.5 million, of which $15.4 million was for European Information Services and $57.1 million was for European Information Products. The remaining goodwill for all current components, as of March 31, 2011, is US Information Services, $306.3 million; Europe Information Services, $13.4 million; APAC Information Services, $10.8 million; Brazil Information Services, $16.9 million; US Information Products, $51.2 million; Europe Information Products, $9.1 million; and APAC Information Products, $10.0 million.
Management believes that the estimated valuations it arrived at are reasonable and consistent with what other marketplace participants would use in valuing the Company’s components. However, management cannot give any assurance that these market values will not change in the future. For example, if discount rates demanded by the market increase, this could lead to reduced valuations under the income approach. If the Company’s projections are not achieved in the future, this could lead management to reassess their assumptions and lead to reduced valuations under the income approach. If the market price of the Company’s stock decreases, this could cause the Company to reassess the reasonableness of the implied control premium, which might cause management to assume a higher discount rate under the income approach which could lead to reduced valuations. If future similar transactions exhibit lower multiples than those observed in the past, this could lead to reduced valuations under the similar transactions approach. And finally, if there is a general decline in the stock market and particularly in those companies selected as comparable to the Company’s components, this could lead to reduced valuations under the public company market multiple approach. The Company’s next annual impairment test will be performed during the first quarter of fiscal 2012 at which time the Company will perform step-one testing on all of its components (including the US and Brazil components which were not tested in the fourth quarter of fiscal 2011). Given the current market conditions and continued economic uncertainty, the fair value of the Company’s components could deteriorate which could result in the need to record impairment charges in future periods. The Company continues to monitor potential triggering events including changes in the business climate in which it operates, attrition of key personnel, the current volatility in the capital markets, the Company’s market capitalization compared to its book value, the Company’s recent operating performance, and the Company’s financial projections. The occurrence of one or more triggering events could require additional impairment testing, which could result in additional impairment charges.
7. SOFTWARE AND RESEARCH AND DEVELOPMENT COSTS:
The Company recorded amortization expense related to internally developed computer software of $20.5 million, $23.6 million, and $21.1 million for fiscal 2011, 2010, and 2009, respectively, and amortization of purchased software licenses of $15.6 million, $14.5 million and $27.2 million in 2011, 2010 and 2009, respectively. Additionally, research and development costs of $11.6 million, $6.8 million and $19.4 million were charged to cost of revenue during 2011, 2010 and 2009, respectively. Amortization expense related to both internally developed and purchased software is included in cost of revenue in the accompanying consolidated statements of operations.
F-44
ACXIOM CORPORATION AND SUBSIDIARIES
NOTES TO CONSOLIDATED FINANCIAL STATEMENTS
MARCH 31, 2011, 2010 AND 2009
8. PROPERTY AND EQUIPMENT:
Property and equipment, some of which has been pledged as collateral for long-term debt, is summarized as follows (dollars in thousands):
|
March 31,
2011
|
March 31,
2010
|
|||||||
|
Land
|
$ | 6,737 | $ | 6,737 | ||||
|
Buildings and improvements
|
250,193 | 223,861 | ||||||
|
Data processing equipment
|
566,948 | 528,737 | ||||||
|
Office furniture and other equipment
|
64,839 | 64,749 | ||||||
| 888,717 | 824,084 | |||||||
|
Less accumulated depreciation and amortization
|
633,410 | 587,245 | ||||||
| $ | 255,307 | $ | 236,839 | |||||
Depreciation expense on property and equipment (including amortization of property and equipment under capitalized leases) was $64.1 million, $60.7 million and $69.4 million for the years ended March 31, 2011, 2010 and 2009, respectively.
9. LONG-TERM DEBT:
Long-term debt consists of the following (dollars in thousands):
|
March 31,
2011
|
March 31,
2010
|
|||||||
|
Term loan credit agreement
|
$ | 355,000 | $ | 427,000 | ||||
|
Capital leases and installment payment obligations on land, buildings and equipment payable in monthly payments of principal plus interest at rates ranging from approximately 3% to 8%; remaining terms up to twelve years
|
43,195 | 41,788 | ||||||
|
Software license liabilities payable over terms up to three years; effective interest rates ranging from approximately 4% to 7%
|
4,686 | 10,001 | ||||||
|
Other debt and long-term liabilities
|
19,357 | 21,946 | ||||||
|
Total long-term debt and capital leases
|
422,238 | 500,735 | ||||||
|
Less current installments
|
27,978 | 42,106 | ||||||
|
Long-term debt, excluding current installments
|
$ | 394,260 | $ | 458,629 | ||||
The Company’s amended and restated credit agreement provides for (1) term loans up to an aggregate principal amount of $600 million and (2) revolving credit facility borrowings consisting of revolving loans, letter of credit participations and swing-line loans up to an aggregate amount of $200 million.
In November 2009, the Company entered into an amendment to its term loan credit facility (the “Amendment”). Under the terms of the Amendment, certain of the lenders agreed to extend the maturity date of the existing term loan, becoming Tranche 2 Term Lenders. Lenders who did not agree to extend the maturity date became Tranche 1 Term Lenders. Certain lenders also agreed to extend the maturity date of the existing revolving loan commitment, becoming Tranche 2 Revolving Lenders. Lenders who did not agree to extend the maturity date of the revolving loan commitment became Tranche 1 Revolving Lenders. Of the $355.0 million balance of the term loan as of March 31, 2011, all of the balance is held by Tranche 2 Term Lenders. The remaining Tranche 1 term loan balance was prepaid in full during fiscal 2011. Of the $200 million revolving loan commitment, $80 million is held by Tranche 1 Revolving Lenders and $120 million is held by Tranche 2 Revolving Lenders.
F-45
The term loan is payable in quarterly installments of approximately $1.5 million each, through December 31, 2014, with a final payment of approximately $332.5 million due March 15, 2015. The Tranche 1 revolving loan commitment expires September 15, 2011 and the Tranche 2 revolving loan commitment expires March 15, 2014.
Revolving credit facility borrowings currently bear interest at LIBOR plus a credit spread, or at an alternative base rate or at the Federal Funds rate plus a credit spread, depending on the type of borrowing. The LIBOR credit spread is 1.5% for Tranche 1 and 2.75% for Tranche 2. There were no revolving credit borrowings outstanding at March 31, 2011 or March 31, 2010. Term loan borrowings bear interest at LIBOR plus a credit spread which is 1.75% for Tranche 1, and 3.00% for Tranche 2. The weighted-average interest rate on term loan borrowings at March 31, 2011 was 4.1%. Outstanding letters of credit at March 31, 2011 were $0.5 million.
The term loan allows prepayments before maturity. The credit agreement is secured by the accounts receivable of Acxiom and its domestic subsidiaries, as well as by the outstanding stock of certain Acxiom subsidiaries.
Under the terms of the term loan, the Company is required to maintain certain debt-to-cash flow and debt service coverage ratios, among other restrictions. At March 31, 2011, the Company was in compliance with these covenants and restrictions. In addition, if certain financial ratios and other conditions are not satisfied, the revolving credit facility limits the Company’s ability to pay dividends in excess of $30 million in any fiscal year (plus additional amounts in certain circumstances).
In fiscal 2009, the Company entered into an interest rate swap agreement. The agreement provides for the Company to pay interest through July 25, 2011 at a fixed rate of 3.25% plus the applicable credit spread on $95.0 million notional amount while receiving interest for the same period at the LIBOR rate on the same notional amount. The LIBOR rate as of March 31, 2011 was 0.30%. The swap was entered into as a cash flow hedge against LIBOR interest rate movements on the term loan. The Company assesses the effectiveness of the hedge based on the hypothetical derivative method. There was no ineffectiveness for the period ended March 31, 2011. Under the hypothetical derivative method, the cumulative change in fair value of the actual swap is compared to the cumulative change in fair value of the hypothetical swap, which has terms that identically match the critical terms of the hedged transaction. Thus, the hypothetical swap is presumed to perfectly offset the hedged cash flows. The change in the fair value of the hypothetical swap will then be regarded as a proxy for the present value of the cumulative change in the expected future cash flows from the hedged transactions. All of the fair values are derived from an interest-rate futures model. As of March 31, 2011, the hedge relationship qualified as an effective hedge under applicable accounting standards. Consequently, all changes in fair value of the derivative are deferred and recorded in other comprehensive income (loss) until the related forecasted transaction is recognized in the consolidated statement of operations. The fair market value of the derivative was zero at inception and an unrealized loss of $0.9 million since inception is recorded in other comprehensive income (loss) with the offset recorded to other noncurrent liabilities. The fair value of the interest rate swap agreement recorded in accumulated other comprehensive income (loss) may be recognized in the statement of operations if certain terms of the floating-rate debt change, if the floating-rate debt is extinguished or if the interest rate swap agreement is terminated prior to maturity. The Company has assessed the creditworthiness of the counterparty of the swap and concludes that no substantial risk of default exists as of March 31, 2011.
The Company’s future obligations, excluding interest, under its long-term debt at March 31, 2011 are as follows (dollars in thousands):
|
Year ending March 31,
|
||||
|
2012
|
27,978 | |||
|
2013
|
23,597 | |||
|
2014
|
11,532 | |||
|
2015
|
339,414 | |||
|
2016
|
8,171 | |||
|
Thereafter
|
11,546 | |||
| $ | 422,238 | |||
F-46
ACXIOM CORPORATION AND SUBSIDIARIES
NOTES TO CONSOLIDATED FINANCIAL STATEMENTS
MARCH 31, 2011, 2010 AND 2009
10. ALLOWANCE FOR DOUBTFUL ACCOUNTS:
A summary of the activity of the allowance for doubtful accounts, returns and credits is as follows (dollars in thousands):
|
Balance at beginning of period
|
Additions charged to costs and expenses
|
Other changes
|
Bad debts written off, net of amounts recovered
|
Balance at end of period
|
||||||||||||||||
|
2009:
|
||||||||||||||||||||
|
Allowance for doubtful accounts, returns and credits
|
$ | 10,011 | $ | 4,068 | $ | (1,253 | ) | $ | (2,788 | ) | $ | 10,038 | ||||||||
|
2010:
|
||||||||||||||||||||
|
Allowance for doubtful accounts, returns and credits
|
$ | 10,038 | $ | 3,820 | $ | (872 | ) | $ | (6,645 | ) | $ | 6,341 | ||||||||
|
2011:
|
||||||||||||||||||||
|
Allowance for doubtful accounts, returns and credits
|
$ | 6,341 | $ | 940 | $ | 198 | $ | (1,857 | ) | $ | 5,622 | |||||||||
Included in other changes are allowance accounts acquired in connection with business combinations, disposals, and the effects of exchange rates.
11. COMMITMENTS AND CONTINGENCIES:
Legal Matters
The Company is involved in various claims and legal proceedings. Management routinely assesses the likelihood of adverse judgments or outcomes to those matters, as well as ranges of probable losses, to the extent losses are reasonably estimable. The Company records accruals for these matters to the extent that management concludes a loss is probable and the financial impact, should an adverse outcome occur, is reasonably estimable. These accruals are reflected in the Company’s consolidated financial statements. In management’s opinion, the Company has made appropriate and adequate accruals for these matters and management believes the probability of a material loss beyond the amounts accrued to be remote; however, the ultimate liability for these matters is uncertain, and if accruals are not adequate, an adverse outcome could have a material effect on the Company’s consolidated financial condition or results of operations. Listed below are certain claims made against the Company and/or its subsidiaries for which the potential exposure is considered material to the Company’s consolidated financial statements. Management believes the Company has substantial defenses to the claims made and intends to vigorously defend these matters.
On April 26, 2011 a lawsuit styled Macomb County Employees’ Retirement System v. Acxiom Corporation, et al was filed in the United States District Court for the Eastern District of Arkansas against the Company and certain current and former officers and a director of the Company. The action seeks to be certified as a class action covering persons who acquired Acxiom stock between October 27, 2010 and March 30, 2011. The action purports to assert claims that the defendants violated federal securities laws by not properly disclosing that the Company was experiencing a significant decline in its International operations and that the Company failed to properly and timely account for impaired assets related to its International operations. The Company and the individual defendants dispute such allegations and intend to vigorously contest the case.
Richard Fresco, et al. v. R.L. Polk and Company and Acxiom Corporation, (U.S. Dist. Court, S.D. Florida, 07-60695) formerly, Linda Brooks and Richard Fresco v. Auto Data Direct, Inc., et al., (U.S. Dist. Court, S.D. Florida, 03-61063) is a putative class action lawsuit, removed to federal court in May 2003, filed against Acxiom and several other information providers. The plaintiffs alleged that the defendants obtained and used drivers’ license data in violation of the federal Drivers Privacy Protection Act. Among other things, the plaintiffs sought injunctive relief, statutory damages, and attorneys’ fees. Acxiom has agreed to settle the case and the court approved the settlement on July 27, 2010. The settlement became effective January 18, 2011. During fiscal 2008 and 2009 Acxiom accrued $5.0 million for the settlement and ancillary costs to obtain final approval and previously paid $2.5 million of this amount into an escrow fund established for the settlement, and paid approximately $0.4 million in ancillary costs. The remaining accrual of $2.1 million was reversed during fiscal 2011. Two companion cases, Sharon Taylor, et al., v. Acxiom, et al., (U.S. District Court, E.D. Texas, 207CV001) and Sharon Taylor, et al. v. Biometric Access Company, et al., (U.S. District Court, E.D. Texas, 2:07-CV-00018), were filed in January 2007. Both Taylor cases were dismissed by the District Court and the dismissal was upheld on appeal on July 14, 2010. The plaintiffs sought review by the U.S. Supreme Court, which declined to consider the matter on January 10, 2011, bringing both to final resolution.
F-47
The Company is involved in various other claims and legal actions in the ordinary course of business. In the opinion of management, the ultimate disposition of all of these other matters will not have a material adverse effect on the Company’s consolidated financial position, results of operations or cash flows.
Commitments
The Company leases or licenses data processing equipment, software, office furniture and equipment, land and office space under noncancellable operating leases or licenses. The Company has a future commitment for lease or license payments over the next 29 years of $135.7 million.
Total rental expense on operating leases and software licenses was $34.3 million, $35.7 million and $45.5 million for the years ended March 31, 2011, 2010 and 2009, respectively. Future minimum lease payments under all noncancellable operating leases and software licenses for the five years ending March 31, 2016, are as follows: 2012, $21.5 million; 2013, $19.8 million; 2014, $17.7 million; 2015, $13.7 million; and 2016, $11.1 million.
In connection with a certain building, the Company has entered into a 50/50 joint venture with a real estate developer. The Company is guaranteeing a portion of the loan for the building. In addition, in connection with the disposal of certain assets, the Company has guaranteed loans for the buyers of the assets. These guarantees were made by the Company primarily to facilitate favorable financing terms for those third parties. Should the third parties default on this indebtedness, the Company would be required to perform under these guarantees. Substantially all of the third-party indebtedness is collateralized by various pieces of real property. At March 31, 2011 the Company’s maximum potential future payments under these guarantees of third-party indebtedness were $1.4 million.
12. STOCKHOLDERS’ EQUITY:
The Company has authorized 200 million shares of $0.10 par value common stock and 1 million shares of $1.00 par value preferred stock. The board of directors of the Company may designate the relative rights and preferences of the preferred stock when and if issued. Such rights and preferences could include liquidation preferences, redemption rights, voting rights and dividends, and the shares could be issued in multiple series with different rights and preferences. The Company currently has no plans for the issuance of any shares of preferred stock.
The Company has issued warrants to purchase shares of its common stock. The following table shows outstanding warrants as of March 31, 2011:
|
Number of warrants outstanding
|
Issued
|
Vesting date
|
Expiration date
|
Weighted average exercise price
|
|||||||
|
AISS acquisition (fiscal 2003)
|
1,272,024 |
August 2002
|
August 2002
|
August 12, 2017
|
$ | 16.32 | |||||
|
Toplander acquisition (fiscal 2003)
|
102,935 |
March 2004
|
March 2004
|
March 17, 2019
|
$ | 13.24 | |||||
| 1,374,959 | $ | 16.09 | |||||||||
In conjunction with the acquisition of ChinaLOOP in fiscal 2005, the Company issued a warrant to purchase 100,000 shares of its common stock. The exercise price for the warrant was $15 per share and the warrant could be exercised until October 24, 2014. The warrant also contained a put feature, which gave the holders the right to receive up to an additional $1.5 million in Acxiom common stock if the value of the common stock upon exercise was less than $30 per share. The put feature could only be exercised on or after November 1, 2009, and could only be exercised concurrently with the exercise of the warrant. The warrant and put were exercised by all holders during fiscal 2010. The Company agreed with the holders to pay the value of the warrant in cash, rather than in stock. As a result, the Company paid $1.5 million during fiscal 2010.
F-48
During the fiscal year ended March 31, 2009, the Company repurchased 0.3 million shares for $2.1 million. Cash paid for repurchases differs from the aggregate purchase price due to trades made at the end of the period which were settled in the following period.
The Company paid dividends on its common stock in the amount of $0.12 per share in fiscal 2009. No dividends were paid during fiscal 2011 or 2010.
Stock Option Activity
The Company has stock option and equity compensation plans for which a total of 37.7 million shares of the Company’s common stock have been reserved for issuance since inception of the plans. These plans provide that the exercise prices of qualified options will be at or above the fair market value of the common stock at the time of the grant. Board policy has also required that nonqualified options be priced at or above the fair market value of the common stock at the time of grant. At March 31, 2011, there were a total of 5.5 million shares available for future grants under the plans.
The per-share weighted-average fair value of the stock options granted during 2011 was $7.54 on the date of grant using a customized binomial lattice approach with the following weighted-average assumptions: dividend yield of 0.0%; risk-free interest rate of 3.4%; expected option life of 5.6 years; expected volatility of 52% and a suboptimal exercise multiple of 1.9. The per-share weighted-average fair value of stock options granted during 2010 was $4.61 on the date of grant using a customized binomial lattice option pricing model with the following weighted-average assumptions: dividend yield of 0.0%; risk-free interest rate of 3.5%; expected option life of 5.4 years and expected volatility of 54%. The per-share weighted-average fair value of stock options granted during 2009 was $4.37 on the date of grant using a customized binomial lattice option pricing model with the following weighted-average assumptions: dividend yield of 1.6%; risk-free interest rate of 3.9%; expected option life of 5.6 years and expected volatility of 37%.
Total expense related to stock options was approximately $2.4 million for fiscal 2011, $2.4 million for fiscal 2010 and $2.2 million for 2009. Future expense for these options is expected to be approximately $3.7 million in total over the next four years.
Activity in stock options was as follows:
|
Number of shares
|
Weighted-average exercise price per share
|
Weighted-average remaining contractual term (in years)
|
Aggregate Intrinsic value (in thousands)
|
|||||||||||||
|
Outstanding at March 31, 2010
|
10,368,532 | $ | 20.33 | |||||||||||||
|
Granted
|
254,133 | |||||||||||||||
|
Exercised
|
(375,317 | ) | $ | 554 | ||||||||||||
|
Forfeited or cancelled
|
(720,359 | ) | ||||||||||||||
|
Outstanding at March 31, 2011
|
9,526,989 | $ | 20.75 | 4.59 | $ | 6,033 | ||||||||||
|
Exercisable at March 31, 2011
|
8,672,052 | $ | 21.35 | 4.30 | $ | 4,613 | ||||||||||
The aggregate intrinsic value for options exercised in fiscal 2009 was $43 thousand, for fiscal 2010 was $1.1 million and for fiscal 2011 was $0.6 million. The aggregate intrinsic value at period end represents total pre-tax intrinsic value (the difference between Acxiom’s closing stock price on the last trading day of the period and the exercise price for each in-the-money option) that would have been received by the option holders had option holders exercised their options on March 31, 2011. This amount changes based upon changes in the fair market value of Acxiom’s stock.
F-49
ACXIOM CORPORATION AND SUBSIDIARIES
NOTES TO CONSOLIDATED FINANCIAL STATEMENTS
MARCH 31, 2011, 2010 AND 2009
Following is a summary of stock options outstanding as of March 31, 2011:
|
Options outstanding
|
Options exercisable
|
||||||||||||||||||
|
Range of
exercise price
per share
|
Options
outstanding
|
Weighted- average remaining contractual life
|
Weighted-average
exercise price
per share
|
Options
exercisable
|
Weighted-average
exercise price
per share
|
||||||||||||||
| $ | 3.69 - $ 9.62 | 400,649 |
6.53 years
|
$ | 8.72 | 174,399 | $ | 8.47 | |||||||||||
| $ | 10.22 - $ 15.00 | 1,989,406 |
4.92 years
|
$ | 12.45 | 1,697,500 | $ | 12.24 | |||||||||||
| $ | 15.10 - $ 19.82 | 2,384,592 |
5.00 years
|
$ | 16.62 | 2,135,311 | $ | 16.58 | |||||||||||
| $ | 20.12 - $ 25.00 | 2,342,112 |
4.89 years
|
$ | 22.95 | 2,292,112 | $ | 22.90 | |||||||||||
| $ | 25.98 - $ 29.30 | 1,370,719 |
3.53 years
|
$ | 26.80 | 1,333,219 | $ | 26.78 | |||||||||||
| $ | 30.93 - $ 39.12 | 780,889 |
2.89 years
|
$ | 35.70 | 780,889 | $ | 35.70 | |||||||||||
| $ | 40.50 - $ 62.06 | 258,622 |
3.40 years
|
$ | 44.15 | 258,622 | $ | 44.15 | |||||||||||
| 9,526,989 |
4.59 years
|
$ | 20.75 | 8,672,052 | $ | 21.35 | |||||||||||||
Restricted Stock Unit Activity
Non-vested restricted stock units and changes during the year ended March 31, 2011 were as follows:
|
Number
of shares
|
Weighted average fair value per share at
grant date
(in thousands)
|
Weighted-average remaining contractual term (in years)
|
||||||||||
|
Outstanding at March 31, 2010
|
2,495,641 | $ | 11.15 | 2.24 | ||||||||
|
Granted
|
731,519 | $ | 19.32 | |||||||||
|
Vested
|
(484,865 | ) | $ | 10.10 | ||||||||
|
Forfeited or cancelled
|
(960,983 | ) | $ | 11.18 | ||||||||
|
Outstanding at March 31, 2011
|
1,781,312 | $ | 14.08 | 1.60 | ||||||||
During fiscal 2011, the Company granted restricted stock units covering 731,519 shares of common stock with a value at the date of grant of $14.1 million. Of the restricted stock unites granted during fiscal 2011, 467,641 vest in equal annual increments over four years and 72,088 vest in one year. The remaining 191,790 vest subject to attainment of performance criteria established by the compensation committee of the board of directors. Each recipient of the performance units may vest in a number of shares from zero to 200% of their award, based on the total shareholder return of Acxiom stock compared to total shareholder return of a group of peer companies established by the committee for the period from April 1, 2010 to March 29, 2013. The value of the performance units is determined using a Monte Carlo simulation model. Valuation of all other restricted stock units is equal to the quoted market price for the shares on the date of grant. During fiscal 2010, the Company issued restricted stock units covering 1,545,000 shares of common stock with a value at the date of grant of $14.8 million. Of the 1,545,000 restricted stock units issued during fiscal 2010, 599,000 units were performance units. Performance units vest subject to 1) the Company’s achievement of certain performance criteria and 2) the individual remaining employed by the Company for three years from the date of grant. If both criteria are met the units vest after three years. In fiscal 2011, all of the 599,000 performance units were cancelled as the performance criteria was not met. All other restricted stock units vest in equal annual increments over four years. During fiscal 2009, the Company issued restricted stock units covering 861,532 shares of common stock with a value at the date of grant of $11.1 million. All of these restricted stock units vest in equal annual increments over four years. The value at the date of grant for restricted stock units granted during 2009 and 2010 was equal to the quoted market prices for the shares. The expense related to restricted stock was $10.7 million in fiscal 2011, $7.7 million in fiscal 2010 and $6.9 million in fiscal 2009. Future expense for these restricted stock units is expected to be approximately $7.6 million in fiscal 2012, $5.2 million in fiscal 2013, $2.2 million in fiscal 2014, and $0.3 million in fiscal 2015.
Qualified Employee Stock Purchase Plan
In addition to the share-based plans, the Company maintains a qualified employee stock purchase plan (“ESPP”) that permits substantially all employees to purchase shares of common stock. Prior to July 1, 2009 the employees were allowed to purchase shares of stock at 85% of the market price. Subsequent to that date, all purchases by employees have been at the market price. The number of shares available for issuance at March 31, 2011 was approximately 1.0 million. Approximately 471,158 shares were purchased under the ESPP during the combined fiscal years 2011, 2010, and 2009. There was no expense to the Company for the year ended March 31, 2011. The expense for 2010 and 2009 for the discount to the market price was $0.1 million and $0.5 million, respectively.
F-50
Accumulated Other Comprehensive Income
The accumulated balances for each component of other comprehensive income are as follows (dollars in thousands):
|
March 31,
2011
|
March 31,
2010
|
|||||||
|
Foreign currency translation
|
$ | 16,883 | $ | 7,365 | ||||
|
Unrealized loss on interest rate swap
|
(892 | ) | (3,198 | ) | ||||
| $ | 15,991 | $ | 4,167 | |||||
13. INCOME TAXES:
Total income tax expense (benefit) was allocated as follows (dollars in thousands):
|
2011
|
2010
|
2009
|
||||||||||
|
Income from operations
|
$ | 34,077 | $ | 32,599 | $ | 24,710 | ||||||
|
Stockholders’ equity:
|
||||||||||||
|
Tax (benefit) expense of stock options, warrants and restricted stock
|
316 | 683 | (34 | ) | ||||||||
| $ | 34,393 | $ | 33,282 | $ | 24,676 | |||||||
Income tax expense (benefit) attributable to earnings from operations consists of (dollars in thousands):
|
2011
|
2010
|
2009
|
||||||||||
|
Current:
|
||||||||||||
|
U.S. Federal
|
$ | 12,872 | $ | 164 | $ | 6,039 | ||||||
|
Non-U.S.
|
176 | 351 | 20 | |||||||||
|
State
|
2,450 | (726 | ) | 2,228 | ||||||||
| 15,498 | (211 | ) | 8,287 | |||||||||
|
Deferred:
|
||||||||||||
|
U.S. Federal
|
19,477 | 31,641 | 15,938 | |||||||||
|
Non-U.S.
|
(264 | ) | (1,056 | ) | (286 | ) | ||||||
|
State
|
(634 | ) | 2,225 | 771 | ||||||||
| 18,579 | 32,810 | 16,423 | ||||||||||
|
Total
|
$ | 34,077 | $ | 32,599 | $ | 24,710 | ||||||
Deferred income tax expense for 2009 includes expense of $3.1 million, resulting from utilization of acquired deferred tax assets on which full valuation allowances existed and that resulted in reductions in goodwill. In 2010 and 2009, the Company reversed valuation allowances previously recorded for certain deferred tax assets, resulting in a deferred tax benefit of $1.1 million and $2.1 million, respectively. In addition, in fiscal 2009, the Company reversed valuation allowances previously recorded for deferred tax assets on certain acquired companies, resulting in an additional $7.4 million reduction in goodwill.
Earnings (loss) before income tax attributable to U.S. and non-U.S. operations consist of (dollars in thousands):
|
2011
|
2010
|
2009
|
||||||||||
|
U.S.
|
$ | 99,250 | $ | 87,507 | $ | 63,197 | ||||||
|
Non-U.S.
|
(93,615 | ) | (10,749 | ) | (983 | ) | ||||||
|
Total
|
$ | 5,635 | $ | 76,758 | $ | 62,214 | ||||||
F-51
Earnings before income taxes, as shown above, are based on the location of the entity to which such earnings are attributable. However, since such earnings may be subject to taxation in more than one country, the income tax provision shown above as U.S. or non-U.S. may not correspond to the earnings shown above.
Below is a reconciliation of income tax expense (benefit) computed using the U.S. federal statutory income tax rate of 35% of earnings before income taxes to the actual provision for income taxes (dollars in thousands):
|
2011
|
2010
|
2009
|
||||||||||
|
Computed expected tax expense (benefit)
|
$ | 1,972 | $ | 26,865 | $ | 21,775 | ||||||
|
Increase (reduction) in income taxes resulting from:
|
||||||||||||
|
State income taxes, net of federal benefit, exclusive of benefit of reduction in valuation reserves
|
2,079 | 2,124 | 1,949 | |||||||||
|
Reserves for tax items
|
(3,336 | ) | 1,015 | 384 | ||||||||
|
Research, experimentation and other tax credits
|
(561 | ) | (1,167 | ) | - | |||||||
|
Impairment of goodwill and intangibles not deductible for tax
|
28,006 | - | - | |||||||||
|
Other permanent differences between book and tax expense
|
(58 | ) | 1,967 | (4,474 | ) | |||||||
|
Non-U.S. subsidiaries taxed at other than 35%
|
4,409 | 1,655 | 6,684 | |||||||||
|
Adjustment to valuation reserves
|
1,312 | (1,149 | ) | (2,144 | ) | |||||||
|
Other, net
|
254 | 1,289 | 536 | |||||||||
| $ | 34,077 | $ | 32,599 | $ | 24,710 | |||||||
The tax effects of temporary differences that give rise to significant portions of the deferred tax assets and liabilities at March 31, 2011 and 2010 are presented below. In accordance with income tax accounting standards, as of March 31, 2011 the Company has not recognized deferred income taxes on approximately $34.4 million of undistributed earnings of foreign subsidiaries that are indefinitely reinvested outside the respective parent’s country. Calculation of the deferred income tax related to these earnings is not practicable.
|
(dollars in thousands)
|
2011
|
2010
|
||||||
|
Deferred tax assets:
|
||||||||
|
Accrued expenses not currently deductible for tax purposes
|
$ | 12,531 | $ | 11,897 | ||||
|
Revenue recognized for tax purposes in excess of revenue for financial reporting purposes
|
1,718 | - | ||||||
|
Investments, principally due to differences in basis for tax and financial reporting purposes
|
2,050 | 1,776 | ||||||
|
Property and equipment, principally due to differences in depreciation
|
- | 4,728 | ||||||
|
Net operating loss and tax credit carryforwards
|
51,489 | 50,943 | ||||||
|
Other
|
13,554 | 12,994 | ||||||
|
Total deferred tax assets
|
81,342 | 82,338 | ||||||
|
Less valuation allowance
|
36,377 | 30,578 | ||||||
|
Net deferred tax assets
|
44,965 | 51,760 | ||||||
|
Deferred tax liabilities:
|
||||||||
|
Intangible assets, principally due to differences in amortization
|
$ | (68,140 | ) | $ | (64,854 | ) | ||
|
Costs capitalized for financial reporting purposes in excess of amounts capitalized for tax purposes
|
(33,339 | ) | (36,294 | ) | ||||
|
Property and equipment, principally due to differences in depreciation
|
(15,366 | ) | - | |||||
|
Revenue recognized for financial reporting purposes in excess of revenue for tax purposes
|
- | (22 | ) | |||||
|
Total deferred tax liabilities
|
(116,845 | ) | (101,170 | ) | ||||
|
Net deferred tax liability
|
$ | (71,880 | ) | $ | (49,410 | ) | ||
F-52
At March 31, 2011, the Company has net operating loss carryforwards of approximately $21.7 million and $79.6 million for U.S. federal and state income tax purposes, respectively. These net operating loss carryforwards expire in various amounts from 2011 through 2028. The Company has foreign net operating loss carryforwards of approximately $135.1 million. Of this amount, $127.9 million do not have expiration dates. The remainder expires in various amounts through 2016. The increase in the valuation allowance noted in the table above is due primarily to current year foreign losses.
In assessing the realizability of deferred tax assets, management considers whether it is more likely than not that some portion or all of the deferred tax assets will not be realized. The ultimate realization of deferred tax assets is dependent upon the generation of future taxable income during the periods in which those temporary differences become deductible. Based upon the Company’s history of profitability and taxable income and the reversal of taxable temporary differences in the U.S., management believes that with the exception of carryforwards in certain states it is more likely than not the Company will realize the benefits of these deductible differences. The Company has established valuation allowances against $48.5 million of loss carryforwards in the states where activity does not support the deferred tax asset.
Based upon the Company’s history of losses in certain non-U.S. jurisdictions, management believes it is more likely than not the Company will not realize the benefits of certain foreign carryforwards and has established valuation allowances for substantial portions of its foreign deferred assets. The goodwill recorded related to the purchase of certain non-U.S. based subsidiaries includes valuation allowances recorded against their deferred tax assets because these companies had not yet demonstrated consistent and/or sustainable profitability.
The following table sets forth changes in the total gross unrecognized tax benefit liabilities, including accrued interest, for the years ended March 31, 2011 and 2010. The entire liability, if recognized, would reduce the Company’s effective income tax rate in future periods.
|
(dollars in thousands)
|
2011
|
2010
|
2009
|
|||||||||
|
Balance at beginning of period
|
$ | 6,379 | $ | 5,364 | $ | 4,980 | ||||||
|
Additions based on tax positions related to the current year
|
360 | 566 | - | |||||||||
|
Reduction due to lapsing of statute of limitations
|
(3,460 | ) | - | - | ||||||||
|
Adjustments to tax positions taken in prior years
|
(236 | ) | 449 | 384 | ||||||||
|
Balance at end of period included in other liabilities
|
$ | 3,043 | $ | 6,379 | $ | 5,364 | ||||||
The Company reports accrued interest and penalties related to unrecognized tax benefits in income tax expense. For the fiscal year ended March 31, 2011, the Company recognized $0.3 million of tax-related interest expense and penalties and had $0.4 million of accrued interest and penalties at March 31, 2011. During the fiscal year ended March 31, 2011, the expiration of the statute of limitations resulted in a reduction to the unrecognized tax benefits related to certain tax credits by approximately $3.5 million.
The Company files a consolidated U.S. federal income tax return and tax returns in various state and local jurisdictions. The Company’s subsidiaries also file tax returns in various foreign jurisdictions in which it operates. In the U.S., the statute of limitations for Internal Revenue Service examinations remains open for the Company’s federal income tax returns for fiscal years subsequent to 2007. The status of state and local and foreign tax examinations varies by jurisdiction. The Company does not anticipate any material adjustments to its financial statements resulting from tax examinations currently in progress.
14. RETIREMENT PLANS:
The Company has a qualified 401(k) retirement savings plan which covers substantially all U.S. employees. The Company also offers a supplemental nonqualified deferred compensation plan (“SNQDC Plan”) for certain highly-compensated employees. Prior to July 1, 2009, the Company matched 50% of the first 6% of employees’ annual aggregate contributions to both plans and may contribute additional amounts to the plans from the Company’s earnings at the discretion of the board of directors. Effective July 1, 2009, through the remainder of the fiscal year 2010, the Company match was suspended. Effective April 1, 2010, the Company reinstated the match at 25% of the first 6% of employees’ annual aggregate contributions. Effective October 1, 2010, the Company reinstated the full 50% match of the first 6% of employee’s annual aggregate contributions.
F-53
Company contributions for the above plans amounted to approximately $3.9 million, $1.7 million and $7.5 million in fiscal years 2011, 2010 and 2009, respectively. Included in both other current assets and other accrued liabilities are the assets and liabilities of the SNQDC Plan in the amount of $12.8 million and $11.6 million at March 31, 2011 and 2010, respectively.
The Company has one small defined benefit pension plan covering certain European employees. During fiscal 2010, the Company had three small defined benefit pension plans covering certain European employees, however one plan was discontinued at the end of fiscal 2010 and one plan was transferred to the purchaser of the disposed Netherlands operations. Both the projected benefit obligation and accumulated benefit obligation were $0.6 million as of March 31, 2011 and $3.3 million as of March 31, 2010.
There was no fair value in the plan assets as of March 31, 2011 and $2.6 million as of March 31, 2010. The excess of benefit obligations over plan assets was $0.6 million at March 31, 2011 and $0.7 million at March 31, 2010.
15. FOREIGN OPERATIONS:
The Company attributes revenue to each geographic region based on the location of the Company’s operations. The following table shows financial information by geographic area for the years 2011, 2010 and 2009 (dollars in thousands):
Revenue
|
2011
|
2010
|
2009
|
||||||||||
|
United States
|
$ | 997,857 | $ | 940,567 | $ | 1,096,022 | ||||||
|
Foreign
|
||||||||||||
|
Europe
|
$ | 118,072 | $ | 133,625 | $ | 158,058 | ||||||
|
Asia/Pacific
|
32,282 | 23,375 | 22,493 | |||||||||
|
Other
|
11,759 | 1,668 | - | |||||||||
|
All Foreign
|
$ | 162,113 | $ | 158,668 | $ | 180,551 | ||||||
| $ | 1,159,970 | $ | 1,099,235 | $ | 1,276,573 | |||||||
Long-lived assets excluding financial instruments (dollars in thousands)
|
2011
|
2010
|
|||||||
|
United States
|
$ | 751,824 | $ | 732,253 | ||||
|
Foreign
|
||||||||
|
Europe
|
$ | 43,863 | $ | 140,122 | ||||
|
Asia/Pacific
|
26,845 | 21,291 | ||||||
|
Other
|
24,532 | 9,176 | ||||||
|
All Foreign
|
$ | 95,240 | $ | 170,589 | ||||
| $ | 847,064 | $ | 902,842 | |||||
16. FAIR VALUE OF FINANCIAL INSTRUMENTS:
The following methods and assumptions were used to estimate the fair value of each class of financial instruments for which it is practicable to estimate that value.
Cash and cash equivalents, trade receivables, unbilled and notes receivable, short-term borrowings and trade payables - The carrying amount approximates fair value because of the short maturity of these instruments.
Long-term debt - The interest rate on the term loan and revolving credit agreement is adjusted for changes in market rates and therefore the carrying value of these loans approximates fair value. The estimated fair value of other long-term debt was determined based upon the present value of the expected cash flows considering expected maturities and using interest rates currently available to the Company for long-term borrowings with similar terms. At March 31, 2011, the estimated fair value of long-term debt approximates its carrying value.
F-54
Derivative instruments included in other liabilities—The carrying value is adjusted to fair value through other comprehensive income (loss) at each balance sheet date. The fair value is determined from an interest-rate futures model (See note 9).
Under applicable accounting standards financial assets and liabilities are classified in their entirety based on the lowest level of input that is significant to the fair value measurements. The Company assigned assets and liabilities to the hierarchy in the accounting standards, which is Level 1—quoted prices in active markets for identical assets or liabilities, Level 2—significant other observable inputs and Level 3—significant unobservable inputs.
The following table presents the balances of assets and liabilities measured at fair value as of March 31, 2011 (dollars in thousands):
|
Level 1
|
Level 2
|
Level 3
|
Total
|
|||||||||||||
|
Assets:
|
||||||||||||||||
|
Other current assets
|
$ | 12,840 | $ | - | $ | - | $ | 12,840 | ||||||||
|
Total assets
|
$ | 12,840 | $ | - | $ | - | $ | 12,840 | ||||||||
|
Liabilities:
|
||||||||||||||||
|
Other current liabilities
|
$ | 12,840 | $ | - | $ | - | $ | 12,840 | ||||||||
|
Other non current liabilities
|
- | 892 | - | 892 | ||||||||||||
|
Total liabilities
|
$ | 12,840 | $ | 892 | $ | - | $ | 13,732 | ||||||||
17. SEGMENT INFORMATION:
The Company reports segment information consistent with the way management internally disaggregates its operations to assess performance and to allocate resources. The Company’s business segments consist of Information Services and Information Products. The Information Services segment includes the Company’s global lines of business for Customer Data Integration (CDI), Multichannel Marketing Services, Infrastructure Management Services and Consulting Services. The Information Products segment is comprised of the Company’s global Consumer Insights and Risk Mitigation Products lines of business and the U.S. Background Screening Products line of business. Beginning in fiscal 2010, the Company has revised its calculation of segment operating income to allocate all corporate expenses, excluding those reported as gains, losses and other items, to the segments. Segment results for prior periods have been reclassified to reflect the revised segment operating income. These reclassifications had no effect on consolidated results.
F-55
ACXIOM CORPORATION AND SUBSIDIARIES
NOTES TO CONSOLIDATED FINANCIAL STATEMENTS
MARCH 31, 2011, 2010 AND 2009
The following tables present information by business segment (dollars in thousands):
|
2011
|
2010
|
2009
|
||||||||||
|
Revenue:
|
||||||||||||
|
Information services
|
$ | 893,594 | $ | 849,432 | $ | 920,262 | ||||||
|
Information products
|
266,376 | 249,803 | 356,311 | |||||||||
|
Total revenue
|
$ | 1,159,970 | $ | 1,099,235 | $ | 1,276,573 | ||||||
|
Income from operations:
|
||||||||||||
|
Information services
|
$ | 91,402 | $ | 91,013 | $ | 117,397 | ||||||
|
Information products
|
23,796 | 6,856 | 14,030 | |||||||||
|
Other
|
(84,274 | ) | 944 | (38,566 | ) | |||||||
|
Income from operations
|
$ | 30,924 | $ | 98,813 | $ | 92,861 | ||||||
|
Depreciation and amortization:
|
||||||||||||
|
Information services
|
$ | 116,467 | $ | 132,113 | $ | 149,649 | ||||||
|
Information products
|
29,888 | 35,451 | 49,035 | |||||||||
|
Depreciation and amortization
|
$ | 146,355 | $ | 167,564 | $ | 198,684 | ||||||
|
Total assets:
|
||||||||||||
|
Information services
|
$ | 911,821 | $ | 908,554 | ||||||||
|
Information products
|
144,663 | 191,799 | ||||||||||
|
Other
|
250,141 | 263,067 | ||||||||||
|
Total assets
|
$ | 1,306,625 | $ | 1,363,420 | ||||||||
18. UNAUDITED SELECTED QUARTERLY FINANCIAL DATA:
|
(dollars in thousands)
|
Quarter ended
June 30, 2010
|
Quarter ended September 30, 2010
|
Quarter ended December 31, 2010
|
Quarter ended
March 31, 2011
|
||||||||||||
|
Revenue
|
$ | 270,395 | $ | 291,669 | $ | 299,110 | $ | 298,796 | ||||||||
|
Gross profit
|
59,974 | 67,662 | 72,266 | 75,180 | ||||||||||||
|
Income (loss) from operations
|
22,076 | 27,310 | 34,575 | (53,037 | ) | |||||||||||
|
Net earnings (loss)
|
9,436 | 12,697 | 20,414 | (70,989 | ) | |||||||||||
|
Net earnings (loss) attributable to Acxiom
|
9,805 | 13,281 | 20,823 | (67,056 | ) | |||||||||||
|
Basic earnings (loss) per share
|
0.12 | 0.16 | 0.25 | (0.88 | ) | |||||||||||
|
Diluted earnings (loss ) per share
|
0.12 | 0.16 | 0.25 | (0.88 | ) | |||||||||||
|
Basic earnings (loss) per share attributable to Acxiom stockholders
|
0.12 | 0.17 | 0.26 | (0.83 | ) | |||||||||||
|
Diluted earnings (loss) per share attributable to Acxiom stockholders
|
0.12 | 0.16 | 0.25 | (0.83 | ) | |||||||||||
F-56
ACXIOM CORPORATION AND SUBSIDIARIES
NOTES TO CONSOLIDATED FINANCIAL STATEMENTS
MARCH 31, 2011, 2010 AND 2009
|
(dollars in thousands)
|
Quarter ended
June 30, 2009
|
Quarter ended September 30, 2009
|
Quarter ended December 31, 2009
|
Quarter ended
March 31, 2010
|
||||||||||||
|
Revenue
|
$ | 255,981 | $ | 271,105 | $ | 283,807 | $ | 288,342 | ||||||||
|
Gross profit
|
50,486 | 59,184 | 73,874 | 76,422 | ||||||||||||
|
Income from operations
|
12,496 | 21,247 | 29,859 | 35,211 | ||||||||||||
|
Net earnings (loss)
|
4,194 | 9,445 | 14,158 | 16,362 | ||||||||||||
|
Net earnings (loss) attributable to Acxiom
|
4,194 | 9,445 | 14,262 | 16,648 | ||||||||||||
|
Basic earnings (loss) per share
|
0.05 | 0.12 | 0.18 | 0.21 | ||||||||||||
|
Diluted earnings (loss ) per share
|
0.05 | 0.12 | 0.18 | 0.20 | ||||||||||||
|
Basic earnings (loss) per share attributable to Acxiom stockholders
|
0.05 | 0.12 | 0.18 | 0.21 | ||||||||||||
|
Diluted earnings (loss) per share attributable to Acxiom stockholders
|
0.05 | 0.12 | 0.18 | 0.21 | ||||||||||||
In the fourth quarter of fiscal 2011 the Company recorded impairment of goodwill and other intangible assets of $79.7 million. Also in the fourth quarter of fiscal 2011 the Company recorded a total of $8.2 million in gains, losses and other items, net in the consolidated statements of operations. The total included $3.3 million related to the disposal of the Netherlands and Portugal operations and $5.5 million of restructuring charges, offset by a credit of $0.6 million related to the reduction of an earnout liability. In the fourth quarter of fiscal 2011 the Company also recorded $1.6 million in other, net related to the impairment of an investment.
In the third quarter of fiscal 2011, the Company recorded adjustments primarily to restructuring and legal accruals totaling $3.6 million recorded in gains, losses and other items, net. In addition, the Company reduced a reserve for unrecognized tax benefits by approximately $3.5 million due to the expiration of the related statute of limitations.
In the fourth quarter of fiscal 2010 the Company recorded a gain of $1.8 million in gains, losses, and other items in the consolidated statement of operations. The reversal of expense was related to a $1.5 million reversal of lease restructuring charges, a $0.2 million reversal of other restructuring charges, and a $0.1 additional gain recorded on the disposition of operations in France.
In the third quarter of fiscal 2010 the Company recorded a total of $0.5 million expense in gains, losses, and other items in the consolidated statement of operations. These charges included a $1.0 million loss recorded on a contingent liability netted against a $0.5 million additional gain recorded on the disposition of operations in France.
In the first quarter of fiscal 2010 the Company recorded $0.3 million expense in gains, losses and other items in the consolidated statement of operations. The adjustments were related to previous restructuring charges.
F-57