Ultra Series Fund | December 31, 2012
Table of Contents
| Page | ||
| Management’s Discussion of Fund Performance | ||
| 2012 in Review | 2 | |
| Outlook | 3 | |
| Conservative Allocation Fund | 4 | |
| Moderate Allocation Fund | 6 | |
| Aggressive Allocation Fund | 8 | |
| Money Market Fund | 10 | |
| Bond Fund | 12 | |
| High Income Fund | 14 | |
| Diversified Income Fund | 16 | |
| Large Cap Value Fund | 18 | |
| Large Cap Growth Fund | 20 | |
| Mid Cap Fund | 22 | |
| Small Cap Fund | 24 | |
| International Stock Fund | 26 | |
| Madison Target Retirement 2020 Fund | 28 | |
| Madison Target Retirement 2030 Fund | 30 | |
| Madison Target Retirement 2040 Fund | 32 | |
| Madison Target Retirement 2050 Fund | 34 | |
| Notes to Management’s Discussion of Fund Performance | 36 | |
| Portfolios of Investments | ||
| Conservative Allocation Fund | 38 | |
| Moderate Allocation Fund | 39 | |
| Aggressive Allocation Fund | 40 | |
| Money Market Fund | 41 | |
| Bond Fund | 43 | |
| High Income Fund | 46 | |
| Diversified Income Fund | 49 | |
| Large Cap Value Fund | 52 | |
| Large Cap Growth Fund | 53 | |
| Mid Cap Fund | 55 | |
| Small Cap Fund | 56 | |
| International Stock Fund | 58 | |
| Madison Target Retirement 2020 Fund | 60 | |
| Madison Target Retirement 2030 Fund | 61 | |
| Madison Target Retirement 2040 Fund | 62 | |
| Madison Target Retirement 2050 Fund | 63 | |
| Financial Statements | ||
| Statements of Assets and Liabilities | 64 | |
| Statements of Operations | 67 | |
| Statements of Changes in Net Assets | 70 | |
| Financial Highlights | 76 | |
| Notes to Financial Statements | 92 | |
| Report of Independent Registered Public Accounting Firm | 108 | |
| Other Information | 109 | |
| Trustees and Officers | 114 |
Nondeposit investment products are not federally insured, involve investment risk, may lose value and are not obligations of or guaranteed by any financial institution. For more complete information about Ultra Series Fund, including charges and expenses, request a prospectus from your financial advisor or from CMFG Life Insurance Company, 2000 Heritage Way, Waverly, IA 50677. Consider the investment objectives, risks, and charges and expenses of any fund carefully before investing. The prospectus contains this and other information about the investment company. For more current Ultra Series Fund performance information, please call 1-800-670-3600. Current performance may be lower or higher than the performance data quoted within. Past performance does not guarantee future results. Nothing in this report represents a recommendation of a security by the investment adviser. Portfolio holdings may have changed since the date of this report.
1
Ultra Series Fund | December 31, 2012
Management’s Discussion of Fund Performance
2012 IN REVIEW
The old adage that markets climb “a wall of worry” was demonstrated by domestic and international stock and bond markets in 2012. Despite signs of sluggish economic growth in the U.S., a recession in Europe, and slowing growth in the emerging markets, investors were well rewarded for holding stocks. The domestic stock market, as measured by the S&P 500, was up 16.0%, while the broad international market, as measured by the MSCI EAFE Index advanced 17.9%. The Russell Emerging Markets Index advanced 19.2%, and even investors in Europe found enough good news in the midst of a still-uncertain sovereign debt crisis to push stock valuations up strongly. The Morningstar Europe Stock Category showed mutual funds specializing in this region up 20.9% for the year. We believe the largest reason for these positive returns was the continued, unprecedented stimulus from the Federal Reserve and central banks around the world.
Stocks were not uniformly positive for the year, with a wide disparity of returns among U.S. Sectors. The Utilities Sector trailed with a loss of -2.9%, while the Financials Sector led the market with a 26.3% return, followed by the Consumer Discretionary Sector, with a 21.9% return. In general, more economically sensitive and lower-quality stocks rallied, while the more defensive sectors such as Utilities and Consumer Staples lagged the broader market. Lower demand and increased energy production, particularly in domestic natural gas, dampened commodity returns, with the S&P Energy Sector up just 2.3% for the year. In general, small and mid-cap stocks advanced in the same range as large stocks, while value stocks had a slight advantage over similarly sized stocks classified as “growth.”
Bond investors enjoyed positive returns, with the most conservative short-term government issuances producing minor advances, while riskier long-term and lower-quality bonds flourished. The bond markets were led by high-yield bonds, which tend to move in tandem with the stock markets. The Barclays High-Yield Bond Index was up 15.8%, the broader Barclay’s Corporate Bond Index advanced 9.8%, while the thin-yielding U.S. Treasuries showed a more modest 2.0% gain, as measured by Barclays U.S. Treasury Bond Index.
While investment returns were heartening to investors, the journey was uneven. Headlines seemed to provide an endless stream of uncertainties from around the world. The most potent of these influences was the sovereign debt crisis in Europe. Worries over the possible default of debt by the most economically troubled countries in southern Europe took the steam out of the year’s first quarter rally, as the S&P 500 dipped -9.6% between April 2 and June 1 when perceived progress on resolving Greece’s debt crisis fueled a rally. The S&P 500 advanced 15.4% between June 1 and September 14, as confidence rose for a positive resolution in Europe, fueled by European Central bank President Mario Draghi’s July statement that he would do “whatever it takes” to hold the Eurozone together. As the year progressed the nation’s attention turned away from Europe to the presidential election and only late in the period did investors begin to focus on the so-called “fiscal cliff.” The January 2013 deadline for automatic shifts to higher taxes and lower spending was partially fended off with a late-December, last-minute compromise which came too late to make up for the stock market’s December losses in response to nervousness regarding the pending fiscal cliff.
2
Ultra Series Fund | Management’s Discussion of Fund Performance | December 31, 2012
OUTLOOK
While optimism prevailed in 2012, we believe that the market may be overlooking the wide variety of risks that remain unresolved. These include worldwide credit issues, the upcoming battle over the domestic debt ceiling, and the possibility that the Federal Reserve may begin to shift its long-standing policy of near-zero rates. A sign that the “risk on” trade prevailed in 2012 was the rally in the stocks of speculative and highly leveraged companies, matched in the bond market by the preference for long-term and low-quality issuance. This risk concern shouldn’t suggest that we recommend shifting sensible asset allocation strategies. Instead, we believe investors should consider rebalancing portfolios and examining the underlying risks of their holdings.
In stocks, we remain convinced that fundamentals continue to count, and investors may benefit from owning solid companies with the ability to potentially produce strong results in all kinds of environments.
In bonds, we anticipate the 10-year Treasury yield will fluctuate in a much wider range than experienced in 2012 and volatility will increase. We believe the high corporate bond valuations have largely run their course and anticipate increased volatility in 2013 as demand for corporate bonds transitions to more normal levels, especially if investors begin to rebalance their portfolios to a more normal stock allocation. We estimate investment-grade bond returns in 2013 may equal the yield to maturity, and at worst believe a moderate increase in rates could challenge returns in 2013. As a result, we encourage investors to look beyond the broad classification such as “bond” to see what sort of interest-rate and credit risks they may be holding. Our outlook suggests that risk-averse investors with an interest in capital preservation should focus on higher-quality, and lower to intermediate maturity issues to mitigate the potential damages of rising rates or lower valuations on corporate bonds.
3
Ultra Series Fund | Management’s Discussion of Fund Performance | December 31, 2012
CONSERVATIVE ALLOCATION FUND
INVESTMENT STRATEGY HIGHLIGHTS
The Ultra Series Conservative Allocation Fund invests primarily in shares of registered investment companies (the “underlying funds”). The fund will be diversified among a number of asset classes and its allocation among underlying funds will be based on an asset allocation model developed by Madison Asset Management, LLC (“Madison”), the fund’s investment adviser.
The team may use multiple analytical approaches to determine the appropriate asset allocation, including, but not limited to:
| • | Asset allocation optimization analysis – considers the degree to which returns in different asset classes do or do not move together, and the fund’s aim to achieve a favorable overall risk profile for any targeted portfolio return. |
| • | Scenario analysis – historical and expected return data is analyzed to model how individual asset classes and combinations of asset classes would affect the fund under different economic and market conditions. |
| • | Fundamental analysis – draws upon Madison’s investment teams to judge each asset class against current and forecasted market condi-tions. Economic, industry and security analysis is used to develop return and risk expectations that may influence asset class selection. |
In addition, Madison employs a risk management sleeve within the fund for the purpose of risk reduction when and if conditions exist that require reduction of equity exposure.
PERFORMANCE HISTORY
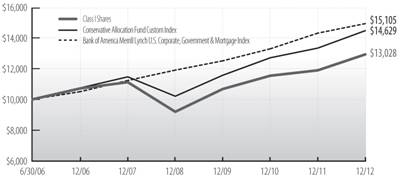
Cumulative Performance of $10,000 Investment Since Inception1,2
| Average Annual Total Return through December 31, 20121,2 | ||||||||||||||||
| 1 Year | 3 Years | 5 Years | Since 6/30/06 Inception |
Since 5/1/09 Inception |
||||||||||||
| Ultra Series Conservative Allocation, Class I | 8.98 | % | 6.80 | % | 3.15 | % | 4.15 | % | — | |||||||
| Ultra Series Conservative Allocation, Class II | 8.71 | 6.53 | — | — | 9.38 | % | ||||||||||
| Conservative Allocation Fund Custom Index | 8.75 | 7.98 | 4.91 | 6.02 | 11.46 | |||||||||||
| Bank of America Merrill Lynch US Corp, Govt & Mortg Index | 4.43 | 6.24 | 6.03 | 6.54 | 6.46 | |||||||||||
See accompanying Notes to Management’s Discussion of Fund Performance.
4
Ultra Series Fund | Management’s Discussion of Fund Performance | December 31, 2012
Conservative Allocation Fund (concluded)
| PORTFOLIO ALLOCATION AS A PERCENTAGE OF NET ASSETS
AS OF 12/31/12 |
|||
| Bond Funds | 60 | % | |
| Foreign Bond Funds | 6 | % | |
| Stock Funds | 26 | % | |
| Foreign Stock Funds | 6 | % | |
| Money Market Funds and Other Net Assets | 2 | % | |
PERFORMANCE DISCUSSION
For the twelve-month period ended December 31, 2012, the Conservative Allocation Fund returned 8.98% (Class I Shares), while the custom blended Conservative Allocation benchmark returned 8.75%. While the fund beat its blended benchmark, it finished behind the Morningstar Conservative Allocation Category average return of 9.40%. We believe outperformance against the benchmark was a result of strong manager performance within the fixed income holdings and an overweight position to corporate bonds. In general, our allocation and manager selection leaned toward lower-risk, which we believe made a difference when compared to the Morningstar peer group in a year in which riskier assets showed a large gap over more conservative securities.
FUND CHANGES
After beginning the year with a modest underweight to equities, the fund ended the year roughly neutral relative to its benchmark. Our confidence to increase equities was underpinned by improved economic data and massive global central bank liquidity measures. In the middle of the year, we began to increase foreign equity exposure. This came on the heels of decisive action by Mario Draghi and the European Central Bank, which we believed removed much of the near-term tail risk from the European markets. However, the fund still remains underweight in comparison to its benchmark in foreign equities as we believe risks from Europe are still very much present. Late in the year, we began to materially reduce the level of both investment grade and high yield credit in the fund. We believe the credit markets have become fully valued and wanted to profit from these investments and dampen the risk level of the fixed income holdings. Finally, throughout the year we opportunistically increased exchange traded fund (“ETF”) holdings to better align the underlying cost structure and upside participation level of the fund.
5
Ultra Series Fund | Management’s Discussion of Fund Performance | December 31, 2012
MODERATE ALLOCATION FUND
INVESTMENT STRATEGY HIGHLIGHTS
The Ultra Series Moderate Allocation Fund invests primarily in shares of registered investment companies (the “underlying funds”). The fund will be diversified among a number of asset classes and its allocation among underlying funds will be based on an asset allocation model developed by Madison Asset Management, LLC (“Madison”), the fund’s investment adviser.
The team may use multiple analytical approaches to determine the appropriate asset allocation, including, but not limited to:
| • | Asset allocation optimization analysis – considers the degree to which returns in different asset classes do or do not move together, and the fund’s aim to achieve a favorable overall risk profile for any targeted portfolio return. |
| • | Scenario analysis – historical and expected return data is analyzed to model how individual asset classes and combinations of asset classes would affect the fund under different economic and market conditions. |
| • | Fundamental analysis – draws upon Madison’s investment teams to judge each asset class against current and forecasted market conditions. Economic, industry and security analysis is used to develop return and risk expectations that may influence asset class selection. |
In addition, Madison employs a risk management sleeve within the fund for the purpose of risk reduction when and if conditions exist that require reduction of equity exposure.
PERFORMANCE HISTORY
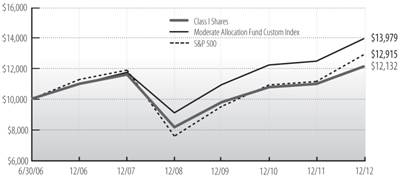
Cumulative Performance of $10,000 Investment Since Inception1,2
| Average Annual Total Return through December 31, 20121,2 | ||||||||||||||||
| 1 Year | 3 Years | 5 Years | Since 6/30/06 Inception |
Since 5/1/09 Inception |
||||||||||||
| Ultra Series Moderate Allocation, Class I | 10.54 | % | 7.52 | % | 0.90 | % | 3.01 | % | — | |||||||
| Ultra Series Moderate Allocation, Class II | 10.26 | 7.26 | — | — | 10.99 | % | ||||||||||
| Moderate Allocation Fund Custom Index | 11.94 | 8.55 | 3.55 | 5.28 | 14.75 | |||||||||||
| S&P 500 Index | 16.00 | 10.87 | 1.66 | 4.01 | 16.77 | |||||||||||
See accompanying Notes to Management’s Discussion of Fund Performance.
6
Ultra Series Fund | Management’s Discussion of Fund Performance | December 31, 2012
Moderate Allocation Fund (concluded)
| PORTFOLIO ALLOCATION AS A PERCENTAGE OF NET ASSETS
AS OF 12/31/12 |
|||
| Bond Funds | 37 | % | |
| Foreign Bond Funds | 3 | % | |
| Stock Funds | 47 | % | |
| Foreign Stock Funds | 11 | % | |
| Money Market Funds and Other Net Assets | 2 | % | |
PERFORMANCE DISCUSSION
For the twelve-month period ended December 31, 2012, the Moderate Allocation Fund returned 10.54% (Class I Shares), while the custom blended Moderate Allocation benchmark returned 11.94%. The fund also trailed the Morningstar Moderate Allocation Category average return of 11.72%. In a year of strong equity returns, the fund was hurt by an underweight position to equities at the start of the period, even as it ended the year roughly neutral relative to its benchmark. We also underweighted foreign equities in a year in which the broad international indices were stronger than the domestic indices. Our confidence to increase equities was underpinned by improved economic data and massive global central bank liquidity measures.
FUND CHANGES
In the middle of the year, we began to increase foreign equity exposure. This came on the heels of decisive action by Mario Draghi and the European Central Bank, which we believed removed much of the near-term tail risk from the European markets. However, the fund still remains underweight in comparison to our benchmark in foreign equities as we believe risks from Europe are still very much present. Late in the year, we began to materially reduce the level of both investment grade and high yield credit in the fund. We believe that the credit markets have become fully valued and wanted to profit from these investments and dampen the risk level of the fixed income holdings. Finally, throughout the year we opportunistically increased exchange traded fund (“ETF”) holdings to better align the underlying cost structure and upside participation level of the fund.
7
Ultra Series Fund | Management’s Discussion of Fund Performance | December 31, 2012
AGGRESSIVE ALLOCATION FUND
INVESTMENT STRATEGY HIGHLIGHTS
The Ultra Series Aggressive Allocation Fund invests primarily in shares of registered investment companies (the “underlying funds”). The fund will be diversified among a number of asset classes and its allocation among underlying funds will be based on an asset allocation model developed by Madison Asset Management, LLC (“Madison”), the fund’s investment adviser.
The team may use multiple analytical approaches to determine the appropriate asset allocation, including, but not limited to:
| • | Asset allocation optimization analysis – considers the degree to which returns in different asset classes do or do not move together, and the fund’s aim to achieve a favorable overall risk profile for any targeted portfolio return. |
| • | Scenario analysis – historical and expected return data is analyzed to model how individual asset classes and combinations of asset classes would affect the fund under different economic and market conditions. |
| • | Fundamental analysis – draws upon Madison’s investment teams to judge each asset class against current and forecasted market conditions. Economic, industry and security analysis is used to develop return and risk expectations that may influence asset class selection. |
In addition, Madison employs a risk management sleeve within the fund for the purpose of risk reduction when and if conditions exist that require reduction of equity exposure.
PERFORMANCE HISTORY
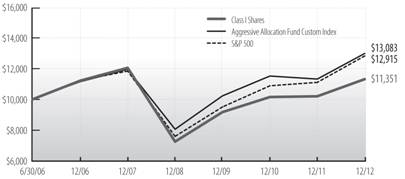
Cumulative Performance of $10,000 Investment Since Inception1,2
| Average Annual Total Return through December 31, 20121,2 | ||||||||||||||||
| 1 Year | 3 Years | 5 Years | Since 6/30/06 Inception |
Since 5/1/09 Inception |
||||||||||||
| Ultra Series Aggressive Allocation, Class I | 11.34 | % | 7.53 | % | -1.29 | % | 1.97 | % | — | |||||||
| Ultra Series Aggressive Allocation, Class II | 11.06 | 7.27 | — | — | 12.56 | % | ||||||||||
| Aggressive Allocation Fund Custom Index | 15.18 | 8.56 | 1.71 | 4.21 | 17.77 | |||||||||||
| S&P 500 Index | 16.00 | 10.87 | 1.66 | 4.01 | 16.77 | |||||||||||
See accompanying Notes to Management’s Discussion of Fund Performance.
8
Ultra Series Fund | Management’s Discussion of Fund Performance | December 31, 2012
Aggressive Allocation Fund (concluded)
| PORTFOLIO ALLOCATION AS A PERCENTAGE OF NET ASSETS
AS OF 12/31/12 |
|||
| Bond Funds | 13 | % | |
| Foreign Bond Funds | 1 | % | |
| Stock Funds | 67 | % | |
| Foreign Stock Funds | 18 | % | |
| Money Market Funds and Other Net Assets | 1 | % | |
PERFORMANCE DISCUSSION
For the twelve-month period ended December 31, 2012, the Aggressive Allocation Fund returned 11.34% (Class I Shares), while the custom blended Aggressive Allocation benchmark return of 15.18%. The fund’s performance also trailed the Morningstar Aggressive Allocation Category average return of 13.42%. Underperformance was largely a result of our underweighting to equities during the first months of the year versus the benchmark during a very strong, double-digit quarter. Additionally, weak relative returns in the fund’s core U.S. equities provided a drag on performance. In general, these results reflect the fund’s overall risk posture. We believe that even an aggressive allocation fund should be constructed to have lower volatility than a pure equity portfolio. This philosophy does have the potential to constrain performance when worldwide equities are not only up strongly, but favor lower-quality, speculative companies as was the case in 2012.
FUND CHANGES
After beginning the year with a modest underweight to equities, the fund ended the year roughly neutral relative to its benchmark. Our confidence to increase equities was underpinned by improved economic data and massive global central bank liquidity measures. In the middle of the year, we began to increase foreign equity exposure. This came on the heels of decisive action by Mario Draghi and the European Central Bank, which we believed removed much of the near-term tail risk from the European markets. By the end of the year, the fund’s overall international equity allocation moved to roughly neutral relative to the benchmark, although the fund still remains underweight European equities. Finally, late in the year we began to materially reduce the level of both investment grade and high yield credit in the fund. We believe that the credit markets have become fully valued and wanted to profit from these investments and dampen the risk level of the fixed income holdings. Finally, throughout the year we opportunistically increased exchange traded fund (“ETF”) holdings to better align the underlying cost structure and upside participation level of the fund.
9
Ultra Series Fund | Management’s Discussion of Fund Performance | December 31, 2012
MONEY MARKET FUND
INVESTMENT STRATEGY HIGHLIGHTS
The Ultra Series Money Market Fund invests exclusively in U.S. dollar-denominated money market securities maturing in thirteen months or less from the date of purchase. These securities will be obligations of the U.S. Government and its agencies and instrumentalities, but may also include securities issued by U.S. and foreign financial institutions, corporations, municipalities, foreign governments, and multi-national organizations, such as the World Bank. The fund may invest in mortgage-backed and asset-backed securities, including those representing pools of mortgage, commercial, or consumer loans originated by credit unions or other financial institutions.
| PORTFOLIO ALLOCATION AS A PERCENTAGE OF NET ASSETS
AS OF 12/31/12 |
|||
| Federal Farm Credit Bank | 5 | % | |
| Fannie Mae | 17 | % | |
| Federal Home Loan Bank | 23 | % | |
| Freddie Mac | 22 | % | |
| U.S. Treasury Notes | 8 | % | |
| Commercial Paper | 19 | % | |
| Cash and Other Net Assets | 6 | % | |
10
Ultra Series Fund | Management’s Discussion of Fund Performance | December 31, 2012
This page was intentionally left blank.
11
Ultra Series Fund | Management’s Discussion of Fund Performance | December 31, 2012
BOND FUND
INVESTMENT STRATEGY HIGHLIGHTS
Under normal circumstances, the Ultra Series Bond Fund invests at least 80% of its assets in bonds. To keep current income relatively stable and to limit share price volatility, the fund emphasizes investment grade securities and maintains an intermediate (typically 3-6 year) average portfolio duration (a measure of a security’s price sensitivity to changes in interest rates). The fund also strives to minimize risk in the portfolio by making strategic decisions relating to credit risk and yield curve outlook. The fund may invest in corporate debt securities, U.S. Government debt securities, foreign government debt securities, non-rated debt securities, and asset-backed, mortgage-backed and commercial mortgage-backed securities.
PERFORMANCE HISTORY
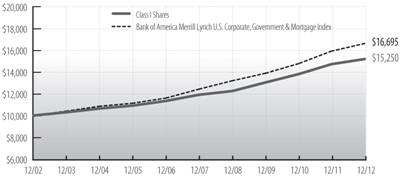
Cumulative Performance of $10,000 Investment Since Inception1
| Average Annual Total Return through December 31, 20121 | ||||||||||||||||
| 1 Year | 3 Years | 5 Years | 10 Years | Since 5/1/09 Inception |
||||||||||||
| Ultra Series Bond, Class I | 3.21 | % | 5.28 | % | 5.03 | % | 4.31 | % | — | |||||||
| Ultra Series Bond, Class II | 2.96 | 5.02 | — | — | 5.63 | % | ||||||||||
| Bank of America Merrill Lynch US Corp, Govt & Mortg Index | 4.43 | 6.24 | 6.03 | 5.26 | 6.46 | |||||||||||
See accompanying Notes to Management’s Discussion of Fund Performance.
12
Ultra Series Fund | Management’s Discussion of Fund Performance | December 31, 2012
Bond Fund (concluded)
| PORTFOLIO ALLOCATION AS A PERCENTAGE OF NET ASSETS
AS OF 12/31/12 |
|||
| Asset Backed | 1 | % | |
| Corporate Notes and Bonds | 28 | % | |
| Mortgage Backed | 16 | % | |
| U.S. Government and Agency Obligations | 51 | % | |
| Cash and Other Net Assets | 4 | % | |
PERFORMANCE DISCUSSION
For the twelve-month period ended December 31, 2012, the Ultra Series Bond Fund returned 3.21% (Class I shares), while the Bank of America Merrill Lynch U.S. Corp. Government & Mortgage Index returned 4.43%. The most important factor for the underperformance was a significant underweighting to banks and to financials in general. The banking sector earned an excess return over Treasuries of more than 13% which was almost as high a return as the high yield market in 2012. Sector allocation relative to this sector helps explain performance in 2012. Fund performance was also modestly hurt by an underweighting to the mortgage sector and by its relatively shorter duration in a declining rate environment. The performance was positively impacted by an overweighting of corporate bonds in general and BBB rated securities in particular. It also benefitted from individual security selection in that a number of investments such as Transocean Inc. and Westvaco Corp. were perceived as improving. Sector allocation and duration remained stable throughout the period.
13
Ultra Series Fund | Management’s Discussion of Fund Performance | December 31, 2012
HIGH INCOME FUND
INVESTMENT STRATEGY HIGHLIGHTS
The Ultra Series High Income Fund invests primarily in lower-rated, higher-yielding income bearing securities, such as “junk” bonds. Because the performance of these securities has historically been strongly influenced by economic conditions, the fund may emphasize security selection in business sectors that favor the economic outlook. Under normal market conditions, the fund invests at least 80% of its assets in bonds rated lower than investment grade (BBB/Baa) and their unrated equivalents or other high-yielding securities.
PERFORMANCE HISTORY
Cumulative Performance of $10,000 Investment Since Inception1
| Average Annual Total Return through December 31, 20121 | ||||||||||||||||
| 1 Year | 3 Years | 5 Years | 10 Years | Since 5/1/09 Inception |
||||||||||||
| Ultra Series High Income, Class I | 11.23 | % | 9.28 | % | 8.36 | % | 8.23 | % | — | |||||||
| Ultra Series High Income, Class II | 10.95 | 9.01 | — | — | 12.12 | % | ||||||||||
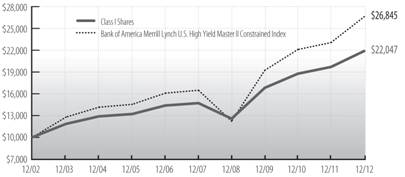
| Bank of America Merrill Lynch US High Yield Master II, Constrained | 15.55 | 11.54 | 10.14 | 10.38 | 18.54 | |||||||||||
See accompanying Notes to Management’s Discussion of Fund Performance.
14
Ultra Series Fund | Management’s Discussion of Fund Performance | December 31, 2012
High Income Fund (concluded)
| SECTOR ALLOCATION AS A PERCENTAGE OF NET ASSETS
AS OF 12/31/12 |
|||
| Consumer Discretionary† | 35 | % | |
| Consumer Staples | 6 | % | |
| Energy | 14 | % | |
| Financials | 3 | % | |
| Health Care | 9 | % | |
| Industrials | 7 | % | |
| Information Technology | 3 | % | |
| Materials | 9 | % | |
| Telecommunication Services | 6 | % | |
| Utilities | 2 | % | |
| Cash and Other Net Assets | 6 | % | |
| †Consumer Discretionary includes securities in the following industries: auto components; automobiles; hotels, restaurants & leisure; household durables; media; specialty retail; and textiles, apparel & luxury goods. | |||
PERFORMANCE DISCUSSION
The Ultra Series High Income Fund was more conservative and less volatile than the overall high yield market during 2012. The fund produced a return of 11.23% (Class I shares), underperforming the Bank of America Merrill Lynch U.S. High Yield Master II Constrained Index (HUCO), which returned 15.55%. Being underweight the Financials Sector was a key detractor, as was negative selection within the Telecommunication Services Sector. However, being underweight the Energy Sector contributed strongly to performance, as did positive selection within the Utilities Sector.
The high-yield bond market rallied strong through most of 2012, capping off a banner year in which overwhelmingly positive technical forces and strong fundamentals herded yield-hungry investors to the high yield bond market’s relative value in a low-interest rate environment. We believe high yield was a direct beneficiary of the U.S. Federal Reserve’s latest round of quantitative easing and near-zero interest rate policies, which drove investors to purchase riskier assets and issuers to capitalize on the favorable market conditions. While 15% returns for 2013 are unlikely, we believe the market is well positioned to continue on a strong path. Demand for high yield remained solid through the fourth quarter and showed little sign of slowing. With anemic economic growth, an entrenched low-interest rate environment, modest defaults and strong corporate balance sheets, high yield seems well positioned heading into 2013.
FUND CHANGES
The fund was selectively active as we increased exposure in more stable credits with higher earnings predictability and reduced holdings of volatile components. For the year, there were 130 purchases aggregating $45.3 million and 183 sales totaling $50.8 million. In terms of new issues, the fund participated in 48 new deals. We increased sector allocations in Oil & Gas, Media-Cable, and Automotive while reducing holdings in Utilities, Telecommunication Services and Media-Diversified & Services. The portfolio also shifted towards higher ratings categories, with a roughly 1% increase in B rated bonds and 1% decrease in CCC rated exposure. As such, the portfolio’s ratings weightings were 33% in BB rated bonds, 48% in B rated bonds and 13% in CCC rated bonds. Also, as of year-end, the fund had fully exited all convertible bond positions.
15
Ultra Series Fund | Management’s Discussion of Fund Performance | December 31, 2012
DIVERSIFIED INCOME FUND
INVESTMENT STRATEGY HIGHLIGHTS
The Ultra Series Diversified Income Fund seeks income by investing in a broadly diversified array of securities including bonds, common stocks, real estate securities, foreign market bonds and stocks and money market instruments. Bonds, stock and cash components will vary, reflecting the portfolio managers’ judgments of the relative availability of attractively yielding and priced stocks and bonds. Generally, however, bonds will constitute up to 80% of the fund’s assets, stocks will constitute up to 60% of the fund’s assets, real estate securities will constitute up to 25% of the fund’s assets, foreign stocks and bonds will constitute up to 25% of the fund’s assets and money market instruments may constitute up to 25% of the fund’s assets. The fund intends to limit the investment in lower credit quality bonds to less than 50% of the fund’s assets. The balance between the two strategies of the fund (fixed income and equity investing) is determined after reviewing the risks associated with each type of investment, with the goal of meaningful risk reduction as market conditions demand. The fund typically sells a stock when the fundamental expectations for producing competitive yields at an acceptable level of price risk no longer apply, the price exceeds the intrinsic value or other stocks appear more attractive.
PERFORMANCE HISTORY
Cumulative Performance of $10,000 Investment Since Inception1
| Average Annual Total Return through December 31, 20121 | ||||||||||||||||
| 1 Year | 3 Years | 5 Years | 10 Years | Since 5/1/09 Inception |
||||||||||||
| Ultra Series Diversified Income, Class I | 8.16 | % | 9.33 | % | 4.66 | % | 6.41 | % | — | |||||||
| Ultra Series Diversified Income, Class II | 7.89 | 9.06 | — | — | 11.36 | % | ||||||||||
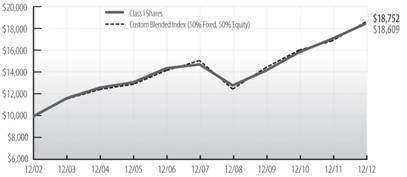
| Custom Blended Index (50% Fixed, 50% Equity) | 10.24 | 8.90 | 4.31 | 6.49 | 11.85 | |||||||||||
| S&P 500 Index | 16.00 | 10.87 | 1.66 | 7.10 | 16.77 | |||||||||||
| Bank of America Merrill Lynch US Corp, Govt & Mortg Index | 4.43 | 6.24 | 6.03 | 5.26 | 6.46 | |||||||||||
See accompanying Notes to Management’s Discussion of Fund Performance.
16
Ultra Series Fund | Management’s Discussion of Fund Performance | December 31, 2012
Diversified Income Fund (concluded)
| PORTFOLIO ALLOCATION AS A PERCENTAGE OF NET ASSETS
AS OF 12/31/12 |
|||
| Common Stocks | 55 | % | |
| Corporate Notes and Bonds | 16 | % | |
| Mortgage Backed | 7 | % | |
| U.S. Government and Agency Obligations | 18 | % | |
| Cash and Other Net Assets | 4 | % | |
PERFORMANCE DISCUSSION
During the twelve-month period, the Diversified Income Fund gained 8.16% (Class I Shares), while the Custom Blended Index returned 10.24%. The S&P 500 Index of large-cap stocks returned 16.00%, and the broad bond market returned 4.43% as measured by the Bank of America Merrill Lynch U.S. Corporate, Government & Mortgage Index. The portfolio was conservatively positioned during the period, with approximately 55% of the fund invested in mature dividend-paying stocks and 45% in bonds. The fund’s stock portfolio did not keep up with the market as measured by the S&P 500 Index. Compared to the S&P 500 Index, sector allocation was positive due mainly to the fund’s underweight position in Technology, while stock selection was detractive with the largest impact from underperforming stocks in Technology, Health Care and Industrial Sectors. Intel and Broadridge Financial Solutions hurt results in Technology, while Johnson & Johnson, Merck and Medtronic negatively impact performance in Health Care. Within Industrials, Norfolk Southern and UPS lagged. On the positive side, Ensco, Diageo and Time Warner contributed positively to returns.
The bond portion of the fund contributed positively to overall fund performance, but did not pace the overall market as measured by the Bank of America Merrill Lynch U.S. Corporate, Government & Mortgage Index. The market heavily favored lower quality and longer bonds, the areas of the market subject to the greatest potential volatility. During the annual period, Barclays measured the top-rated intermediate-term corporate bonds (AAA) advancing 3.19% while the lowest-rated segment (CA-D) rose 27.61%. The fund is managed with an emphasis on risk control and the goal of moderating losses in a down market. As a result, the fund held shorter bonds and higher quality issuance, areas which had modest returns in a year in which more speculative issues with higher yields were preferred.
FUND CHANGES
Stock sector allocation was generally stable through this period, even as we made a number of portfolio changes. We sold Broadridge and Norfolk Southern due to worries about sub-par earnings growth related to a lack of pricing power. The other stocks mentioned above appear to us to have solid prospects and we continue to hold them. We will look to add on weakness or fundamental improvement. We have maintained a conservative posture on the bond side, believing that the long bull market in bonds has squeezed the bulk of the value out of this sector. Our strategy is to emphasize capital preservation, giving us the ability to add yield should the opportunity arise.
17
Ultra Series Fund | Management’s Discussion of Fund Performance | December 31, 2012
LARGE CAP VALUE FUND
INVESTMENT STRATEGY HIGHLIGHTS
The Ultra Series Large Cap Value Fund will, under normal market conditions, invest primarily in large cap stocks. The fund follows a “value” approach, meaning the portfolio managers seek to invest in stocks at prices below their perceived intrinsic value as estimated based on fundamental analysis of the issuing company and its prospects. By investing in value stocks, the fund attempts to limit the downside risk over time but may also produce smaller gains than other stock funds if their intrinsic values are not realized by the market or if growth-oriented investments are favored by investors. The fund will diversify its holdings among various industries and among companies within those industries. The fund typically sells a stock when the fundamental expectations for buying it no longer apply, the price exceeds its intrinsic value or other stocks appear more attractively priced relative to their intrinsic values.
PERFORMANCE HISTORY
Cumulative Performance of $10,000 Investment Since Inception1
| Average Annual Total Return through December 31, 20121 | ||||||||||||||||
| 1 Year | 3 Years | 5 Years | 10 Years | Since 5/1/09 Inception |
||||||||||||
| Ultra Series Large Cap Value, Class I | 11.82 | % | 9.15 | % | -0.56 | % | 5.83 | % | — | |||||||
| Ultra Series Large Cap Value, Class II | 11.55 | 8.88 | — | — | 14.19 | % | ||||||||||
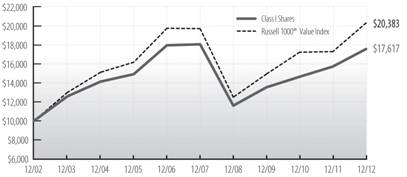
| Russell 1000 Value Index | 17.51 | 10.86 | 0.59 | 7.38 | 16.81 | |||||||||||
See accompanying Notes to Management’s Discussion of Fund Performance.
PERFORMANCE DISCUSSION
The Ultra Large Cap Value Fund returned 11.82% (Class I Shares) for the annual period. During the twelve-month period ended December 31, 2012, large-cap value stocks demonstrated somewhat better performance than the robust returns of the overall market. With the S&P 500 up 16.00%, the S&P 500 Value Index rose 17.76% and the Russell 1000® Value Index rose 17.51%. While we were pleased to deliver double-digit returns to shareholders, the fund’s return of 11.82% was disappointing in light of the strength in the value indices. However, the underperformance in 2012 was very much in line with the outperformance in 2011. This is an often-observed market pattern of market
18
Ultra Series Fund | Management’s Discussion of Fund Performance | December 31, 2012
Large Cap Value Fund (concluded)
| SECTOR ALLOCATION AS A PERCENTAGE OF NET ASSETS
AS OF 12/31/12 |
|||||||
| Fund | Russell 1000® Value Index |
||||||
| Consumer Discretionary | 9 | % | 8 | % | |||
| Consumer Staples | 10 | % | 7 | % | |||
| Energy | 14 | % | 16 | % | |||
| Financials† | 26 | % | 28 | % | |||
| Health Care | 17 | % | 12 | % | |||
| Industrials | 12 | % | 9 | % | |||
| Information Technology | 4 | % | 6 | % | |||
| Materials | 3 | % | 4 | % | |||
| Telecommunication Services | 1 | % | 3 | % | |||
| Utilities | — | % | 7 | % | |||
| Cash and Other Net Assets | 4 | % | — | % | |||
| †Financials includes securities in the following industries: capital markets; commercial banks; insurance; and real estate management & development. | |||||||
fluctuation, as the stocks that outperform during one period revert back to the mean over the subsequent one.
The most important component of the fund’s underperformance was the relative returns across the quality spectrum. As measured by Merrill Lynch Quantitative Strategy, A+ and A-rated stocks each returned 10.4% while B-rated stocks were up 18.9% and the lowest-rated segment of C&D stocks returned 25.3%. We have a preference for stocks whose strong fundamentals put them in the higher quality categories.
Stock selection and sector allocation were also a relative drag on performance. The fund’s stocks underperformed their S&P Sectors in Industrial, Financials and Energy. While we have great confidence in insurance holding Markel, it was punished for an acquisition which we believe will turn out to be profitable. While Markel contributed to the financial underperformance, the greater impact came from not owning what we believe to be the riskier, credit-sensitive banks. Other lagging stocks included Norfolk Southern and UPS in Industrials and Canadian Natural Resources and Occidental in Energy.
We continue to find value in stocks that have above-average dividend yields and that are likely to provide dividend growth. These stocks make up 75% of the Large Cap Value portfolio. We have a favorable outlook for this group of blue chip, dividend-paying stocks. The average yield of stock held in the portfolio at year-end was 2.5%, higher than the yield on the S&P 500 of 2.1% and the 10-year Treasury bond yield of 1.8%. High dividend stocks have historically been more resilient in times of stress and sharply dropping markets, which makes the Large-Cap Value portfolio particularly attractive to investors who want the growth potential of stocks, but have concerns regarding downside volatility.
FUND CHANGES
Over the course of the year the fund did not undergo any major strategic or sector shifts. Weighting in the top-performing Financials Sector was up 2.6%, Health Care was up 2.8% and Consumer Discretionary was up 2.9%. The weighting in Technology fell -3.5%, Utilities decreased -2.8% as we stepped out of the sector entirely, and Telecommunication Services fell -1.2%. Among the new issues in the portfolio were Health Care stock Becton Dickinson, and Consumer Discretionary holding Viacom. We sold Broadridge Financial Solutions, IBM and Paychex out of Information Technology, added Accenture and Automatic Data Processing, and trimmed positions in Intel and Microsoft. In exiting the Utilities Sector we sold Exelon and First Energy.
19
Ultra Series Fund | Management’s Discussion of Fund Performance | December 31, 2012
LARGE CAP GROWTH FUND
INVESTMENT STRATEGY HIGHLIGHTS
The Ultra Series Large Cap Growth Fund invests primarily in common stocks of larger companies and will, under normal market conditions, maintain at least 80% of its assets in large cap stocks. The fund follows a “growth” approach, meaning the portfolio managers seek stocks that have low market prices relative to their perceived growth capabilities as estimated based on fundamental analysis of the issuing companies and their prospects. The fund typically seeks higher earnings growth capabilities in the stocks it purchases, and may include some companies undergoing more significant changes in their operations or experiencing significant changes in their markets. The fund will diversify its holdings among various industries and among companies within those industries. The fund has an active trading strategy which will lead to more portfolio turnover than a more passively-managed fund. The fund typically sells a stock when the fundamental expectations for buying it no longer apply, the price exceeds its perceived value or other stocks appear more attractively priced relative to their prospects.
PERFORMANCE HISTORY
Cumulative Performance of $10,000 Investment Since Inception1
| Average Annual Total Return through December 31, 20121 | ||||||||||||||||
| 1 Year | 3 Years | 5 Years | 10 Years | Since 5/1/09 Inception |
||||||||||||
| Ultra Series Large Cap Growth, Class I | 11.20 | % | 7.21 | % | 1.32 | % | 6.43 | % | — | |||||||
| Ultra Series Large Cap Growth, Class II | 10.93 | 6.94 | — | — | 12.56 | % | ||||||||||
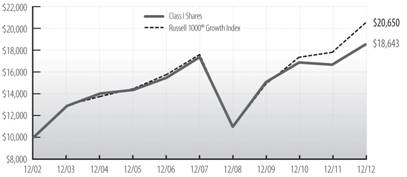
| Russell 1000® Growth Index | 15.26 | 11.35 | 3.12 | 7.52 | 17.40 | |||||||||||
See accompanying Notes to Management’s Discussion of Fund Performance.
PERFORMANCE DISCUSSION
For the twelve-month period ended December 31, 2012 the Large Cap Growth Fund returned 11.20% (Class I Shares), while the Russell 1000® Growth Index returned 15.26%. We were disappointed by this relative return, which was handicapped by the outperformance of lower-quality stocks over higher-quality companies and underperformance in individual stock selection.
From a sector attribution perspective, the fund’s two largest detractors were Health Care and Information Technology. Health Care as a sector produced above-benchmark results for the period, with particular strength in the biotech
20
Ultra Series Fund | Management’s Discussion of Fund Performance | December 31, 2012
Large Cap Growth Fund (concluded)
| SECTOR ALLOCATION AS A PERCENTAGE OF NET ASSETS
AS OF 12/31/12 |
|||||||
| Fund | Russell 1000® Growth Index |
||||||
| Consumer Discretionary | 17 | % | 17 | % | |||
| Consumer Staples | 8 | % | 12 | % | |||
| Energy | 5 | % | 4 | % | |||
| Financials | 5 | % | 5 | % | |||
| Health Care | 10 | % | 12 | % | |||
| Industrials | 12 | % | 13 | % | |||
| Information Technology† | 33 | % | 31 | % | |||
| Materials | 4 | % | 4 | % | |||
| Telecommunication Services | 2 | % | 2 | % | |||
| Utilities | — | % | — | % | |||
| Cash and Other Net Assets | 4 | % | — | % | |||
| †Information Technology includes securities in the following industries: communications equipment; computers and peripherals; electrical equipment; internet software & services; IT services; semiconductors & semiconductor equipment; and software. | |||||||
area. The fund’s biotech holdings produced positive returns, but did not include the sector leaders. For instance, the portfolio’s largest biotech holding was Celgene, one of the five largest domestic biotech firms. It returned 16.08% in 2012, while the average return of the other top four largest biotechs, none of which were held by the fund, was 46.92%. We believe this leaves Celgene with unrealized upside potential in upcoming quarters.
The technology holdings in the Russell 1000® Growth benchmark advanced 17.52%, ahead of the overall return of the boarder Russell 1000® Index’s 16.42%. The portfolio had some strong stocks in this area, including Apple. However, the fund had two disappointing holdings, Sandisk and MICROS Systems. Sandisk is a flash memory company whose products appear in tablets and smart phones. Excess industry-wide capacity restrained expected pricing advances. Micros, a provider of hotel and restaurant reservation systems, is one of our higher conviction holdings. The stock dropped over the course of the year as the hospitality industry continued to struggle in the slow-growth economic climate, depressing sales of new product.
The fund had strong relative performance in Consumer Staples and Energy, producing returns above the Index sectors of 0.75% and 0.60% respectively. In Consumer Staples Hershey was additive as it gained almost 20% for the year. The fund’s holding in Petrobras, a Brazilian based international oil company, was also additive to performance.
Finally, the fund began the year with exposure to several smaller companies which appeared poised for strong returns. This strategy did not work as planned. For instance, Acme Packet, a technology company whose products are essential to the build-out of higher speed digital networks, received reduced orders from some major telecom companies and the stock price declined.
FUND CHANGES
With a recognition near mid-year that global growth was likely to remain tepid for some time, we reduced the fund’s exposure to economically sensitive, smaller companies. We deployed the proceeds into larger, higher-quality issues while sector diversification increased within the portfolio. Entering 2013, we believe the operating environment for companies should continue to be challenging, but absent another major unforeseen economic shock, can continue to produce selective opportunities for growth. Consequently, the fund remains focused on companies which have intrinsic reasons for driving success. For example, Google in the internet space, continues its innovation in global search and to maintain global leadership with its Android operating system for smart phones and tablets. Given expectations for the continued strength in mobile computing, the fund invested in a number of companies which continue to gain share from older ways of doing business, such as Nuance, the leading voice recognition company whose products are used in Apple’s Siri offering as well as in health care transcription services.
21
Ultra Series Fund | Management’s Discussion of Fund Performance | December 31, 2012
MID CAP FUND
INVESTMENT STRATEGY HIGHLIGHTS
The Ultra Series Mid Cap Fund generally invests in common stocks of midsize companies and will, under normal market conditions, maintain at least 80% of its assets in mid cap securities. However, the fund will not automatically sell a stock because its market capitalization has changed and such positions may be increased through additional purchases. The fund seeks attractive long-term returns through bottom-up security selection based on fundamental analysis in a diversified portfolio of high-quality growth companies with attractive valuations. These will typically be industry leading companies in niches with strong growth prospects. The fund’s portfolio managers believe in selecting stocks for the fund that show steady, sustainable growth and reasonable valuations. As a result, stocks of issuers that are believed to have a blend of both value and growth potential will be selected for investment. Stocks are generally sold when target prices are reached, company fundamentals deteriorate or more attractive stocks are identified.
PERFORMANCE HISTORY
Cumulative Performance of $10,000 Investment Since Inception1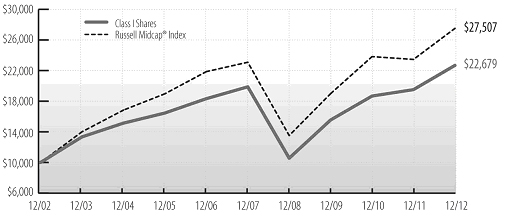
| Average Annual Total Return through December 31, 20121 | ||||||||||||||||||||
| Since | ||||||||||||||||||||
| 5/1/09 | ||||||||||||||||||||
| 1 Year | 3 Years | 5 Years | 10 Years | Inception | ||||||||||||||||
| Ultra Series Mid Cap, Class I | 16.24 | % | 13.41 | % | 2.67 | % | 8.53 | % | — | |||||||||||
| Ultra Series Mid Cap, Class II | 15.95 | 13.13 | — | — | 17.84 | % | ||||||||||||||
| Russell Midcap Index | 17.28 | 13.15 | 3.57 | 10.65 | 19.73 | |||||||||||||||
See accompanying Notes to Management’s
Discussion of Fund Performance.
PERFORMANCE DISCUSSION
For the year ended December 31, 2012, the Mid Cap Fund gained 16.24% (Class I Shares), while the Russell Midcap® Index returned 17.28%. While the fund trailed the benchmark slightly, we were content with performance for the year, considering the market environment which favored riskier stocks over fundamentally solid ones. The strongest returns came from the market’s best returning sectors: Financials and Consumer Discretionary. The fund’s financials holdings, which emphasized insurance firms over credit-sensitive banks, did not keep up with the 24.1% return of the Russell Midcap® Index’s Financials Sector, but did contribute to the fund’s positive results second only to Consumer
22
Ultra Series Fund | Management’s Discussion of Fund Performance | December 31, 2012
Mid Cap Fund (concluded)
|
SECTOR ALLOCATION AS A PERCENTAGE OF NET ASSETS AS OF 12/31/12 |
||||||||
| Russell | ||||||||
| Midcap® | ||||||||
| Fund | Index | |||||||
| Consumer Discretionary | 21 | % | 17 | % | ||||
| Consumer Staples | 3 | % | 6 | % | ||||
| Energy | 7 | % | 7 | % | ||||
| Financials | 23 | % | 20 | % | ||||
| Health Care | 8 | % | 10 | % | ||||
| Industrials | 20 | % | 13 | % | ||||
| Information Technology | 4 | % | 13 | % | ||||
| Materials | 7 | % | 7 | % | ||||
| Telecommunication | ||||||||
| Services | – | 2 | % | |||||
| Utilities | – | 5 | % | |||||
| Cash and Other Net Assets | 7 | % | – | |||||
Discretionary. The fund’s Consumer Discretionary holdings were mixed, but overall additive to performance. While the Energy Sector was relatively weak, with the Index sector up 7.2%, the fund’s Energy holdings saw relative strength. The fund lost ground to the Index in the Health Care and Technology Sectors. Among individual holdings, the largest contributions to return came from Brookfield Asset Management, Copart Inc. and M&T Bank. On the other hand, stocks which trailed the market’s return included technology holdings Micros Systems, Broadridge Financial Solutions and FLIR Systems, the latter two of which were sold during the course of the year.
FUND CHANGES
We made relatively few changes to the portfolio
over the year, but did find some attractive opportunities. Examining two of these
illustrates our bottom-up stock selection process. Expeditors International is a
stock we purchased early in the fall and a good example of the sort of company we
like to hold when valuations are attractive. We had an opportunity to purchase the
company at 15 times forward earnings, excluding the cash on the balance sheet. We
think of Expeditors as a travel agent for freight movement across the globe. In
addition to shipping goods it provides other services such as distribution management,
cargo insurance, and customs clearance. The business model is “asset light” since there is very little need for capital expenditures. The company has
what we believe to be a solid balance sheet, with over six dollars a share in net
cash, and a highly capable management team. Recent valuation has been compressed
due to concerns over global growth and weak air travel and ocean travel volumes.
We believe these are temporary issues and conditions will improve once the global
macro-economy and global trade improve.
Another addition of the portfolio early
in the fourth quarter was Crown Holding, a manufacturer of aluminum cans which are
used for beverages, food products and other consumer products. The industry in which
it participates is a global oligopoly, so there are just a few players. Management
is shareholder friendly and has a track record of wise allocation of capital. Crown
Holding has invested to build capacity in developing markets, particularly China
and Brazil. These markets may generate higher returns on invested capital than developed
markets, and future growth should be stronger. We believe this investment will pay
off, going forward. We purchased the stock at what we calculate to be about 8.5
times future normalized free cash flow, which we believe was an attractive multiple.
23
Ultra Series Fund | Management’s Discussion of Fund Performance | December 31, 2012
SMALL CAP FUND
INVESTMENT STRATEGY HIGHLIGHTS
The Ultra Series Small Cap Fund invests primarily in a diversified mix of common stocks of small cap U.S. companies that are believed to be undervalued by various measures and offer sound prospects for capital appreciation. The portfolio managers employ a value-oriented investment approach in selecting stocks, using proprietary fundamental research to identify securities of companies they believe have attractive valuations. The portfolio managers focus on companies with a record of above average rates of profitability that sell at a discount relative to the overall small cap market. Through fundamental research, the portfolio managers seek to identify those companies that possess one or more of the following characteristics: sustainable competitive advantages within a market niche; strong profitability and free cash flows; strong market share positions and trends; quality of and share ownership by management; and financial structures that are more conservative than the relevant industry average.
PERFORMANCE HISTORY
Cumulative Performance of $10,000 Investment Since Inception1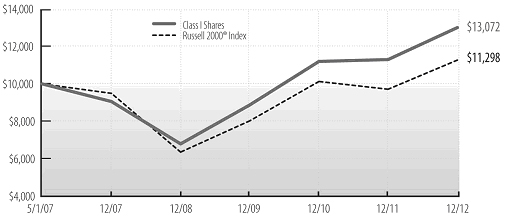
| Average Annual Total Return through December 31, 20121 | ||||||||||||||||||||
| Since | Since | |||||||||||||||||||
| 5/1/07 | 5/1/09 | |||||||||||||||||||
| 1 Year | 3 Years | 5 Years | 10 Years | Inception | ||||||||||||||||
| Class I Shares | 15.39 | % | 13.87 | % | 7.66 | % | 4.84 | % | — | |||||||||||
| Class II Shares | 15.10 | 13.59 | — | — | 19.60 | % | ||||||||||||||
| Russell 2000® Index | 16.35 | 12.26 | 3.56 | 2.17 | 17.91 | |||||||||||||||
See accompanying Notes to Management’s Discussion of Fund Performance.
24
Ultra Series Fund | Management’s Discussion of Fund Performance | December 31, 2012
Small Cap Fund (concluded)
|
SECTOR ALLOCATION AS A PERCENTAGE OF NET ASSETS AS OF 12/31/12 |
||||||||
| Russell | ||||||||
| Midcap® | ||||||||
| Fund | Index | |||||||
| Consumer Discretionary | 14 | % | 12 | % | ||||
| Consumer Staples | 2 | % | 3 | % | ||||
| Energy | 4 | % | 6 | % | ||||
| Financials | 19 | % | 37 | % | ||||
| Health Care | 11 | % | 4 | % | ||||
| Industrials† | 27 | % | 13 | % | ||||
| Information Technology | 8 | % | 12 | % | ||||
| Materials | 8 | % | 6 | % | ||||
| Telecommunication | ||||||||
| Services | – | 1 | % | |||||
| Utilities | 4 | % | 6 | % | ||||
| Cash and Other Net Assets | 3 | % | – | |||||
|
||||||||
PERFORMANCE DISCUSSION
The Ultra Series Small Cap Fund returned 15.39% (Class I Shares) for the twelve-month period ended December 31, 2012, underperforming its benchmark, the Russell 2000® Index, which returned 16.35% for the same period.
Sector allocation, a residual of the bottom-up stock selection process, was a significant contributor to relative results primarily due to underweight exposure to the Energy and Information Technology sectors and an overweight exposure to the Industrials sector. Cash held during the period had a negative impact on relative results. Weak selection in the Financials, Materials, and Industrials sectors was partially offset by strong stock selection within Health Care, Energy, and Information Technology.
The fund’s largest contributors to relative and absolute performance during the period included retailer Stage Stores, contract research organization ICON, and Maximus, an outsourcing provider for government health and human services. Diversified industrial manufacturer Carlisle Companies was also among top contributors to absolute performance. The fund’s largest detractors from relative returns during the period included office supplier ACCO Brands, office product wholesaler United Stationers, and packaging company Aptargroup. PSS World Medical, a distributor of medical products and equipment to physi-cian offices and assisted living facilities, and Websense were also among the largest detractors from absolute returns during the period.
FUND CHANGES
The fund’s investment approach emphasizes individual stock selection; sector weights are a residual of our bottom-up investment process. The manager does, however, carefully consider diversification across economic sectors to limit risk. Based on bottom-up stock decisions, exposure to the Materials and Industrials Sectors increased during the period and exposure to the Financials and Consumer Discretionary Sectors fell. We initiated positions in Materials companies Innospec and Sensient Technologies. In Industrials, we initiated positions in Atlas Air Worldwide and Cubic. Within Financials, we eliminated positions in Delphi Financial Group, Alleghany, and Education Realty Trust. As of the end of the period, the fund was most overweight in the Industrials and Materials Sectors relative to the Russell 2000® Index, and most underweight in Information Technology. Based on our two- to three-year time horizon, we continue to find opportunities created by the inefficiencies frequently found among small-cap companies.
25
Ultra Series Fund | Management’s Discussion of Fund Performance | December 31, 2012
INTERNATIONAL STOCK FUND
INVESTMENT STRATEGY HIGHLIGHTS
The Ultra Series International Stock Fund will invest, under normal market conditions, primarily in foreign equity securities. Typically, a majority of the fund’s assets are invested in relatively large capitalization stocks of companies located or operating in developed countries. The fund may also invest up to 30% of its assets in securities of companies whose principal business activities are located in emerging market countries. The portfolio managers typically maintain this segment of the fund’s portfolio in such stocks which it believes have a low market price relative to their perceived value based on fundamental analysis of the issuing company and its prospects. The fund may also invest in foreign debt and other income bearing securities at times when it believes that income bearing securities have greater capital appreciation potential than equity securities.
PERFORMANCE HISTORY
Cumulative Performance of $10,000 Investment Since Inception1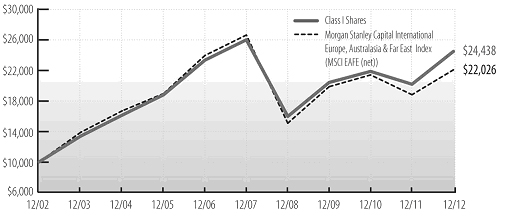
| Average Annual Total Return through December 31, 20121 | ||||||||||||||||||||
| Since | ||||||||||||||||||||
| 5/1/09 | ||||||||||||||||||||
| 1 Year | 3 Years | 5 Years | 10 Years | Inception | ||||||||||||||||
| Ultra Series International Stock, Class I | 21.31 | % | 6.24 | % | -1.20 | % | 9.35 | % | — | |||||||||||
| Ultra Series International Stock, Class II | 21.01 | 5.98 | — | — | 13.18 | % | ||||||||||||||
| MSCI EAFE Index (net) | 17.32 | 3.56 | -3.69 | 8.21 | 11.81 | |||||||||||||||
See accompanying Notes to Management’s Discussion of Fund Performance.
26
Ultra Series Fund | Management’s Discussion of Fund Performance | December 31, 2012
International Stock Fund (concluded)
|
SECTOR ALLOCATION AS A PERCENTAGE OF NET ASSETS AS OF 12/31/12 |
||||||||
| Africa | 1 | % | ||||||
| Europe (excluding United Kingdom) | 42 | % | ||||||
| Japan | 15 | % | ||||||
| Latin America | 3 | % | ||||||
| Pacific Basin | 8 | % | ||||||
| United Kingdom | 23 | % | ||||||
| Other Countries | 6 | % | ||||||
| Cash and Other Net Assets | 2 | % | ||||||
PERFORMANCE DISCUSSION
The Ultra Series International Stock fund’s 21.31% return for the year bested the MSCI EAFE Index (net), which was up 17.32%.This strong performance was primarily driven by stock selection. Within the Materials Sector, James Hardie performed well on strong demand from a recovering U.S. housing industry. In the Information Technology Sector, Samsung continued to outperform on strong smart phone sales.
The fund was negatively impacted by the Financials Sector, as Credit Suisse Group underperformed following a report which called for a strengthening of its capital base. Stock selection in Japan also detracted from relative returns, as SoftBank declined following the announced acquisition of 70% of Sprint Nextel.
FUND CHANGES
During the period attractive stock-specific opportunities led to changes in the portfolio’s exposures. Additions included Bayer (Germany), Genomma Lab Internacional (Mexico) and Getinge (Sweden), increasing exposure to the Health Care Sector. Purchasing Red Electrica (Spain) and RWE (Germany) increased exposure to the Utilities Sector. The fund sold positions in AXA (France), Banco do Brasil (Brazil), QBE Insurance (Australia), and Credit Suisse Group (Switzerland), reducing exposure to the Financials Sector. Selling a position in Amadeus IT Holding (Spain) and trimming other existing positions lowered holdings in Information Technology stocks. From a regional perspective, exposure to emerging markets increased by purchasing the aforementioned Genomma Lab Internacional in addition to Mediclinic International (South Africa) and Bank Mandiri (Indonesia). Purchasing Bayer, Getinge, and RWE led to increased continental Europe exposure. Lastly, the sale of British Sky Broadcasting, GlaxoSmithKline, and International Power reduced UK exposure.
27
Ultra Series Fund | Management’s Discussion of Fund Performance | December 31, 2012
MADISON TARGET RETIREMENT 2020 FUND
INVESTMENT STRATEGY HIGHLIGHTS
The Ultra Series Target Retirement 2020 Fund invests primarily in shares of registered investment companies (the “underlying funds”) according to an asset allocation strategy developed by Madison Asset Management, LLC (“Madison”), the fund’s investment adviser, for investors planning to retire in or within a few years of 2020. Over time, the fund’s asset allocation will become more conservative until it reaches approximately 15-30% in stock funds and 70-85% in bond funds. The asset allocation strategy is designed to reduce the volatility of investment returns in the later years while still providing the potential for higher total returns over the target period.
On a periodic basis, Madison will evaluate and sometimes revise the fund’s asset allocations, including revising the asset class weightings and adding and/or removing underlying funds. Madison will also monitor the underlying funds on an ongoing basis and may increase or decrease the fund’s investment in one or several underlying funds. The underlying fund selections are made based on several considerations, including the fund’s style or asset class exposures, portfolio characteristics, risk profile, and investment process.
PERFORMANCE HISTORY
Cumulative Performance of $10,000 Investment Since Inception1,2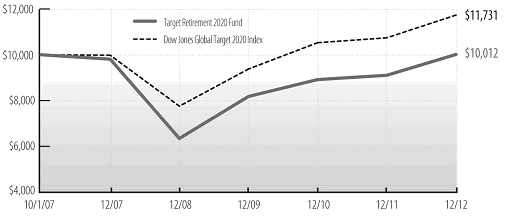
| Average Annual Total Return through December 31, 20121,2 | ||||||||||||||||||||
| Since | ||||||||||||||||||||
| 10/1/07 | ||||||||||||||||||||
| 1 Year | 3 Years | 5 Years | Inception | |||||||||||||||||
| Ultra Series Target Retirement 2020, Class I | 9.98 | % | 6.98 | % | 0.42 | % | 0.02 | % | ||||||||||||
| Dow Jones Global Target 2020 Index | 9.23 | 7.80 | 3.32 | 3.08 | ||||||||||||||||
See accompanying Notes to Management’s Discussion of Fund Performance.
28
Ultra Series Fund | Management’s Discussion of Fund Performance | December 31, 2012
Madison Target Retirement 2020 Fund (concluded)
|
PORTFOLIO ALLOCATION AS A PERCENTAGE OF NET ASSETS AS OF 12/31/12 |
||||||||
| Bond Funds | 52 | % | ||||||
| Foreign Bond Funds | 3 | % | ||||||
| Stock Funds | 34 | % | ||||||
| Foreign Stock Funds | 8 | % | ||||||
| Money Market Funds and Other Net Assets | 3 | % | ||||||
PERFORMANCE DISCUSSION
For the twelve-month period ended December 31, 2012, the Ultra Series Target Retirement 2020 Fund returned 9.98%, ahead the benchmark Dow Jones Global Target 2020 Index return of 9.23%. The fund’s performance trailed the Morningstar Target Date 2016-2020 peer average return of 11.68%. Outperformance against the benchmark was a result of strong manager performance within the fixed income holdings, an overweight position to corporate bonds, and a slight overweight position to equities relative to the benchmark. With the S&P 500 up 16.00%, the Barclays Capital U.S. Corporate High Yield Bond Index up 15.81%, and broad international indices outpacing the domestic indices, portfolios willing to take a more aggressive stance generally would have outpaced the fund’s performance. We believe that our conservative approach was the reason for underperformance compared to the Morningstar peer group, as we began the period leery of international equities given the underlying and unresolved sovereign debt crisis in Europe.
FUND CHANGES
We began the year with a sizable underweight position to international equities based on concerns over the ongoing European debt crisis. By the middle of the year, we began to increase foreign equity exposure. Our decision to increase equities exposure was a result of improved economic data and massive global central bank liquidity measures. Most notably, the decisive action by Mario Draghi and the European Central Bank, which we believed removed much of the near-term tail risk from the European markets. The increase proved timely as international equities rallied hard through the rest of the year. We remain underweight to foreign equities as we believe risks from Europe are still present.
Around the same time, with interest rates near record lows in the late summer/early fall, we significantly reduced the fund’s exchange traded fund (“ETF”) bond holdings in favor of actively managed funds. We believe the current ultra-low interest rate environment should favor active bond funds moving forward. Finally, late in the year, we began to trim the level of both investment grade and high yield credit investments in the fund. We believe that the credit markets have become fully valued and wanted to take advantage of potential profits while dampening the risk level of our fixed income holdings.
29
Ultra Series Fund | Management’s Discussion of Fund Performance | December 31, 2012
MADISON TARGET RETIREMENT 2030 FUND
INVESTMENT STRATEGY HIGHLIGHTS
The Ultra Series Target Retirement 2030 Fund invests primarily in shares of registered investment companies (the “"underlying funds”) according to an asset allocation strategy developed by Madison Asset Management, LLC (“Madison”), the fund’s investment adviser, for investors planning to retire in or within a few years of 2030. Over time, the fund’s asset allocation will become more conservative until it reaches approximately 15-30% in stock funds and 70-85% in bond funds. The asset allocation strategy is designed to reduce the volatility of investment returns in the later years while still providing the potential for higher total returns over the target period.
On a periodic basis, Madison will evaluate and sometimes revise the fund’s asset allocations, including revising the asset class weightings and adding and/or removing underlying funds. Madison will also monitor the underlying funds on an ongoing basis and may increase or decrease the fund’s investment in one or several underlying funds. The underlying fund selections are made based on several considerations, including the fund’s style or asset class exposures, portfolio characteristics, risk profile, and investment process.
PERFORMANCE HISTORY
Cumulative Performance of $10,000 Investment Since Inception1,2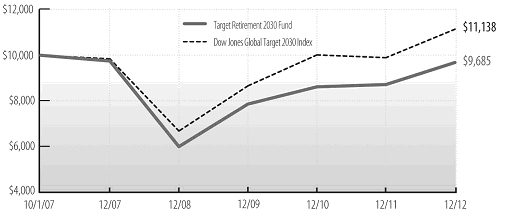
| Average Annual Total Return through December 31, 20121,2 | ||||||||||||||||||||
| Since | ||||||||||||||||||||
| 10/1/07 | ||||||||||||||||||||
| 1 Year | 3 Years | 5 Years | Inception | |||||||||||||||||
| Ultra Series Target Retirement 2030, Class I | 11.05 | % | 7.17 | % | -0.13 | % | -0.61 | % | ||||||||||||
| Dow Jones Global Target 2030 Index | 12.56 | 8.76 | 2.52 | 2.07 | ||||||||||||||||
See accompanying Notes to Management’s Discussion of Fund Performance.
30
Ultra Series Fund | Management’s Discussion of Fund Performance | December 31, 2012
Madison Target Retirement 2030 Fund (concluded)
|
PORTFOLIO ALLOCATION AS A PERCENTAGE OF NET ASSETS AS OF 12/31/12 |
||||||||
| Bond Funds | 36 | % | ||||||
| Foreign Bond Funds | 3 | % | ||||||
| Stock Funds | 48 | % | ||||||
| Foreign Stock Funds | 12 | % | ||||||
| Money Market Funds and Other Net Assets | 1 | % | ||||||
PERFORMANCE DISCUSSION
For the twelve-month period ended December 31, 2012, the Ultra Series Target Retirement 2030 Fund returned 11.05%, while the Dow Jones Global Target 2030 Index returned 12.56%. The fund’s performance also trailed the Morningstar Target Date 2026-2030 peer average return of 13.59%. With the S&P 500 Index up 16.00% for the year, the Barclays Capital U.S. Corporate High Yield Bond Index up 15.81%, and broad international indices outpacing the domestic indices, portfolios willing to take a more aggressive stance would have likely outpaced the fund’s performance. We believe the reason for underperformance compared to the Morningstar peer group was primarily due to the fund’s relatively light equity exposure associated with our conservative approach towards the fund’s target asset allocation position.
FUND CHANGES
We began the year with a sizable underweight to international equities based on concerns over the ongoing European debt crisis. By the middle of the year, we began to increase foreign equity exposure. Our decision to increase equities exposure was a result of improved economic data and massive global central bank liquidity measures. Most notably, the decisive action by Mario Draghi and the European Central Bank, which we believed removed much of the near-term tail risk from the European markets. The increase proved timely as international equities rallied hard through the rest of the year. We remain underweighted to foreign equities as we believe risks from Europe are still present.
With interest rates near record lows in the late summer/early fall, we significantly reduced the fund’s exchange traded fund (“ETF”) bond holdings in favor of actively managed funds. We believe the current ultra-low interest rate environment should favor active bond funds moving forward. Finally, late in the year, we began to materially trim the level of both investment grade and high yield credit in the fund. We believe that the credit markets have become fully valued and wanted to take advantage of potential profits while dampening the risk level of our fixed income holdings.
31
Ultra Series Fund | Management’s Discussion of Fund Performance | December 31, 2012
MADISON TARGET RETIREMENT 2040 FUND
INVESTMENT STRATEGY HIGHLIGHTS
The Ultra Series Target Retirement 2040 Fund invests primarily in shares of registered investment companies (the “"underlying funds”) according to an asset allocation strategy developed by Madison Asset Management, LLC (“Madison”), the fund’s investment adviser, for investors planning to retire in or within a few years of 2040. Over time, the fund’s asset allocation will become more conservative until it reaches approximately 15-30% in stock funds and 70-85% in bond funds. The asset allocation strategy is designed to reduce the volatility of investment returns in the later years while still providing the potential for higher total returns over the target period.
On a periodic basis, Madison will evaluate and sometimes revise the fund’s asset allocations, including revising the asset class weightings and adding and/or removing underlying funds. Madison will also monitor the underlying funds on an ongoing basis and may increase or decrease the fund’s investment in one or several underlying funds. The underlying fund selections are made based on several considerations, including the fund’s style or asset class exposures, portfolio characteristics, risk profile, and investment process.
PERFORMANCE HISTORY
Cumulative Performance of $10,000 Investment Since Inception1,2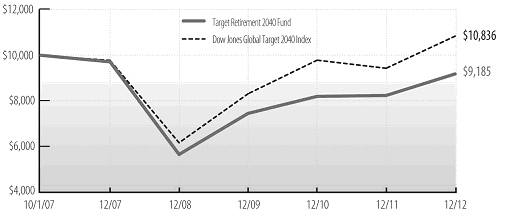
| Average Annual Total Return through December 31, 20121,2 | ||||||||||||||||||||
| Since | ||||||||||||||||||||
| 10/1/07 | ||||||||||||||||||||
| 1 Year | 3 Years | 5 Years | Inception | |||||||||||||||||
| Ultra Series Target Retirement 2040, Class I | 11.42 | % | 7.17 | % | -1.11 | % | -1.60 | % | ||||||||||||
| Dow Jones Global Target 2040 Index | 14.88 | 9.23 | 2.09 | 1.54 | ||||||||||||||||
See accompanying Notes to Management’s Discussion of Fund Performance.
32
Ultra Series Fund | Management’s Discussion of Fund Performance | December 31, 2012
Madison Target Retirement 2040 Fund (concluded)
|
PORTFOLIO ALLOCATION AS A PERCENTAGE OF NET ASSETS AS OF 12/31/12 |
||||||||
| Bond Funds | 26 | % | ||||||
| Foreign Bond Funds | 2 | % | ||||||
| Stock Funds | 56 | % | ||||||
| Foreign Stock Funds | 15 | % | ||||||
| Money Market Funds and Other Net Assets | 1 | % | ||||||
PERFORMANCE DISCUSSION
For the twelve-month period ended December 31, 2012, the Madison Target Retirement 2040 Fund returned 11.42%, while the Dow Jones Global Target 2040 Index returned 14.88%. The fund’s performance also trailed the Morningstar Target Date 2036-2040 peer average return of 14.64%. With the S&P 500 Index up 16.00%, the Barclays Capital U.S. Corporate High Yield Bond Index up 15.81%, and broad international indices outpacing the domestic indices, portfolios willing to take a more aggressive stance would have likely outpaced the fund’s performance. We believe the reason for underperformance compared to the Morningstar peer group was primarily due to the fund’s relatively low equity exposure associated with our conservative approach towards the target asset allocation position.
FUND CHANGES
We began the year with a sizable underweight to international equities based on concerns over the ongoing European debt crisis. By the middle of the year, we began to increase foreign equity exposure. Our decision to increase equities exposure was a result of improved economic data and massive global central bank liquidity measures. Most notably, the decisive action by Mario Draghi and the European Central Bank, which we believed removed much of the near-term tail risk from the European markets. The increase proved timely as international equities rallied hard through the rest of the year. We remain underweighted to foreign equities as we believe risks from Europe are still very much present.
Around the same time, with interest rates near record lows in the late summer/early fall, we significantly reduced the fund’s exchange traded fund (“ETF”) bond holdings in favor of actively managed funds. We believe the current ultra-low interest rate environment should favor active bond funds moving forward. And finally, late in the year, we began to materially trim the level of both investment grade and high yield credit in the fund. We believe that the credit markets have become fully valued and wanted to take advantage of potential profits while dampening the risk level of our fixed income holdings.
33
Ultra Series Fund | Management’s Discussion of Fund Performance | December 31, 2012
MADISON TARGET RETIREMENT 2050 FUND
INVESTMENT STRATEGY HIGHLIGHTS
The Madison Target Retirement 2050 Fund invests primarily in shares of registered investment companies (the “"underlying funds”) according to an asset allocation strategy developed by Madison Asset Management, LLC (“Madison”), the fund’s investment adviser, for investors planning to retire in or within a few years of 2050. Over time, the fund’s asset allocation will become more conservative until it reaches approximately 15-30% in stock funds and 70-85% in bond funds. The asset allocation strategy is designed to reduce the volatility of investment returns in the later years while still providing the potential for higher total returns over the target period.
On a periodic basis, Madison will evaluate and sometimes revise the fund’s asset allocations, including revising the asset class weightings and adding and/or removing underlying funds. Madison will also monitor the underlying funds on an ongoing basis and may increase or decrease the fund’s investment in one or several underlying funds. The underlying fund selections are made based on several considerations, including the fund’s style or asset class exposures, portfolio characteristics, risk profile, and investment process.
PERFORMANCE HISTORY
Cumulative Performance of $10,000 Investment Since Inception1,2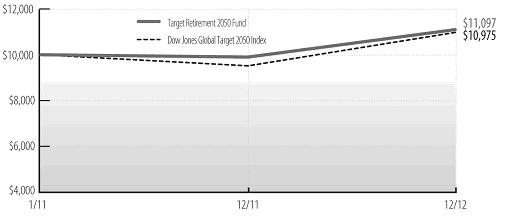
| Average Annual Total Return through December 31, 20121,2 | ||||||||||||
| Since | ||||||||||||
| 1/3/11 | ||||||||||||
| 1 Year | Inception | |||||||||||
| Ultra Series Target Retirement 2050, Class I | 12.12 | % | 5.36 | % | ||||||||
| Dow Jones Global Target 2050 Index | 15.35 | 4.78 | ||||||||||
See accompanying Notes to Management’s Discussion of Fund Performance.
34
Ultra Series Fund | Management’s Discussion of Fund Performance | December 31, 2012
Madison Target Retirement 2050 Fund (concluded)
|
PORTFOLIO ALLOCATION AS A PERCENTAGE OF NET ASSETS AS OF 12/31/12 |
||||||||
| Bond Funds | 15 | % | ||||||
| Foreign Bond Funds | 2 | % | ||||||
| Stock Funds | 63 | % | ||||||
| Foreign Stock Funds | 18 | % | ||||||
| Money Market Funds and Other Net Assets | 2 | % | ||||||
PERFORMANCE DISCUSSION
The Madison Target Retirement 2050 Fund returned 12.12%, while the Dow Jones Global Target 2050 Index returned 15.35% and the Morningstar Target 2046-2050 Category returned 15.07%. With the S&P 500 up 16.00%, the Barclays Capital U.S. Corporate High Yield Bond Index up 15.81%, and broad international indices outpacing the domestic indices, portfolios willing to take a more aggressive stance would have likely outpaced the fund’s performance. We believe the reason for the fund’s underperformance compared to the Morningstar peer group was primarily due to the fund’s relatively light equity exposure associated with our conservative approach towards the fund’s target asset allocation position.
FUND CHANGES
We began the year with a sizable underweight to international equities based on concerns over the ongoing European debt crisis. By the middle of the year we began to increase foreign equity exposure. Our decision to increase equities exposure was a result of improved economic data and massive global central bank liquidity measures. Most notably, the decisive action by Mario Draghi and the European Central Bank, which we believed removed much of the near-term tail risk from the European markets. The increase proved timely as international equities rallied hard through the rest of the year. We remain underweighted to foreign equities as we believe risks from Europe are still present.
Around the same time, with interest rates near record lows in the late summer/early fall, we significantly reduced the fund’s exchange traded fund (“ETF”) bond holdings in favor of actively managed funds. We believe the current ultra-low interest rate environment should favor active bond funds moving forward. Finally, late in the year, we began to materially trim the level of both investment grade and high yield credit in the fund. We believe that the credit markets have become fully valued and wanted to take advantage of potential profits while dampening the risk level of our fixed income holdings.
35
Ultra Series Fund | December 31, 2012
Notes to Management’s Discussion of Fund Performance
| 1 | Fund returns are calculated after fund level
expenses have been subtracted, but do not include any separate
account fees, charges or expenses imposed by the variable annuity and
variable life insurance contracts that invest in the fund, as
described in the Prospectus. If these fees, charges, or expenses were
included, fund returns would have been lower. Fund returns also
assume that dividends and capital gains are reinvested in additional
shares of the fund. Investment return and principal value will
fluctuate, so an investor’s shares, when redeemed, may be worth more
or less than when purchased. Further information relating to the
fund’s performance is contained in the Prospectus and elsewhere in
this report. The fund’s past performance is not indicative of future
performance. Current performance may be lower or higher than the
performance data cited. For Ultra Series Fund performance data
current to the most recent month-end, please call 1-800-670-3600 or
visit www.ultraseriesfund.com. Indices are unmanaged and investors
cannot invest in them directly. Index returns do not reflect fees or
expenses. |
| 2 | The
management fee for the Conservative, Moderate, and Aggressive Allocation Funds was
reduced from June 30, 2006-April 30, 2008. Effective October 1, 2009, Madison
contractually agreed to waive a portion of the management fee of the Target Retirement
Date 2020, 2030 and 2040 Funds from 0.40% to 0.20%. Effective February 17, 2011, the fee
was permanently reduced to 0.20%. On September 1, 2011, shareholders of the Target
Retirement Date Funds approved a new fee arrangement which includes an investment
advisory fee of 0.25% annualized and a services agreement fee of 0.05% annualized. If the
management fees had not been reduced, returns would have been lower. |
Morningstar Percentile rankings note: 1st percentile is top, 99th percentile is bottom.
©Morningstar, Inc. All Rights Reserved. The Morningstar related information contained herein: (1) is proprietary to Morningstar and/or its content providers; (2) may not be copied or distributed; and (3) is not warranted to be accurate, complete or timely. Neither Morningstar nor its content providers are responsible for any damages or losses arising from any use of this information.
BENCHMARK DESCRIPTIONS
Allocation Fund Indexes
The Conservative Allocation Fund Custom Index consists of 65% Merrill Lynch U.S. Corporate, Government and Mortgage Index, 30% Russell 3000® Index and 5% MSCI EAFE Index. See market indexes descriptions below.
The Moderate Allocation Fund Custom Index consists of 40% Merrill Lynch U.S. Corporate, Government and Mortgage Index, 45% Russell 3000® Index and 15% MSCI EAFE Index. See market indexes descriptions below.
The Aggressive Allocation Fund Custom Index consists of 15% Merrill Lynch U.S. Corporate, Government and Mortgage Index, 55% Russell 3000® Index and 30% MSCI EAFE Index. See market indexes descriptions below.
Hybrid Fund Indexes
The Custom Blended Index consists of 50% S&P 500 Index and 50% Bank of America Merrill Lynch U.S. Corporate, Government & Mortgage Index. See market indexes' descriptions below.
Market Indexes
The Bank of America Merrill Lynch U.S. Corporate, Government & Mortgage Index is a broad-based measure of the total rate of return performance of the U.S. investment-grade bond markets. The index is a capitalization-weighted aggregation of outstanding U.S. treasury, agency and supranational mortgage pass-through, and investment-grade corporate bonds meeting specified selection criteria.
36
Ultra Series Fund | Management’s Discussion of Fund Performance | December 31, 2012
Benchmark Descriptions - Market Indexes (concluded)
The Bank of America Merrill Lynch U.S. High Yield Master II Constrained Index tracks the performance of below investment grade U.S. dollar denominated corporate bonds publicly issued in the U.S. domestic market, but limits any individual issuer to a maximum weighting of 2%.
The Dow Jones Global Target 2020 Index is a benchmark for multi-asset class portfolios with risk profiles that become more conservative as the year 2020 approaches. The index is a composite of other indexes that represent stocks, bonds and cash.
The Dow Jones Global Target 2030 Index is a benchmark for multi-asset class portfolios with risk profiles that become more conservative as the year 2030 approaches. The index is a composite of other indexes that represent stocks, bonds and cash.
The Dow Jones Global Target 2040 Index is a benchmark for multi-asset class portfolios with risk profiles that become more conservative as the year 2040 approaches. The index is a composite of other indexes that represent stocks, bonds and cash.
The Dow Jones Global Target 2050 Index is a benchmark for multi-asset class portfolios with risk profiles that become more conservative as the year 2050 approaches. The index is a composite of other indexes that represent stocks, bonds and cash.
The MSCI EAFE (Europe, Australasia & Far East) Index is a free float-adjusted market capitalization index that is designed to measure developed market equity performance, excluding the U.S. and Canada. The MSCI EAFE Index (net) is calculated on a total return basis with dividends reinvested after the deduction of withholding taxes.
The Russell 1000® Index is a large-cap market index which measures the performance of the 1,000 largest companies in the Russell 3000® Index (see definition below).
The Russell 1000® Growth Index is a large-cap market index which measures the performance of those Russell 1000 companies with higher price-to-book ratios and higher forecasted growth values.
The Russell 1000® Value Index is a large-cap market index which measures the performance of those Russell 1000 companies with lower price-to-book ratios and lower forecasted growth values.
The Russell 2000® Index is a small-cap market index which measures the performance of the smallest 2,000 companies in the Russell 3000® Index (see definition below.)
The Russell 3000® Index measures the performance of the 3,000 largest U.S. companies based on total market capitalization, which represents 98% of the investable U.S. equity market.
The Russell Midcap® Index is a mid-cap market index which measures the performance of the mid-cap segment of the U.S. equity universe.
The S&P 500 Index is a large-cap market index which measures the performance of a representative sample of 500 leading companies in leading industries in the U.S.
37
Ultra Series Fund | December 31, 2012
Conservative Allocation Fund Portfolio of Investments
| Shares | Value (Note 2) | ||||
| INVESTMENT COMPANIES - 99.9% | |||||
| Bond Funds - 60.3% | |||||
| DoubleLine Total Return Bond Fund Class I | 719,654 | $ | 8,153,676 | ||
| Franklin Floating Rate Daily Access Fund Advisor Class | 1,700,520 | 15,525,747 | |||
| Madison Investment Grade Corporate Bond Fund (A) | 1,277,935 | 14,913,498 | |||
| Madison Mosaic Institutional Bond Fund (A) | 1,641,621 | 18,402,574 | |||
| MEMBERS Bond Fund Class Y (A) | 1,904,243 | 20,127,845 | |||
| MEMBERS High Income Fund Class Y (A) | 1,737,052 | 12,350,442 | |||
| Metropolitan West Total Return Bond Fund Class I | 2,055,086 | 22,379,889 | |||
| PIMCO Investment Grade Corporate Bond Fund Institutional Class | 846,139 | 9,409,067 | |||
| PIMCO Total Return Fund Institutional Class | 1,991,300 | 22,382,215 | |||
| 143,644,953 | |||||
| Foreign Bond Funds - 6.5% | |||||
| TCW Emerging Markets Income Fund Class I | 1,017,849 | 9,486,351 | |||
| Templeton Global Bond Fund Advisor Class | 449,078 | 5,990,696 | |||
| 15,477,047 | |||||
| Foreign Stock Funds - 5.9% | |||||
| MEMBERS International Stock Fund Class Y (A) | 592,560 | 6,695,928 | |||
| Vanguard FTSE All-World ex-US ETF | 163,158 | 7,464,479 | |||
| 14,160,407 | |||||
| Shares | Value (Note 2) | ||||
| Money Market Funds - 1.6% | |||||
| State Street Institutional U.S. Government Money Market Fund | 3,739,633 | $ | 3,739,633 | ||
| Stock Funds - 25.6% | |||||
| iShares Russell Midcap Index Fund | 52,696 | 5,959,918 | |||
| iShares S&P 100 Index Fund ETF | 109,518 | 7,083,624 | |||
| Madison Mosaic Disciplined Equity Fund (A) | 980,883 | 13,124,209 | |||
| MEMBERS Equity Income Fund Class Y (A) | 958,772 | 9,271,324 | |||
| MEMBERS Large Cap Growth Fund Class Y (A) | 407,511 | 7,098,844 | |||
| MEMBERS Large Cap Value Fund Class Y (A) | 1,076,398 | 14,843,529 | |||
| Vanguard Dividend Appreciation ETF | 59,607 | 3,550,789 | |||
| 60,932,237 | |||||
| TOTAL INVESTMENTS - 99.9% (Cost $222,364,188**) | 237,954,277 | ||||
| NET OTHER ASSETS AND LIABILITIES - 0.1% | 262,330 | ||||
| TOTAL NET ASSETS - 100.0% | $ | 238,216,607 | |||
| ** | Aggregate cost for Federal tax purposes was $224,385,052. |
| (A) | Affiliated Company (see Note 10). |
| ETF | Exchange Traded Fund. |
Ultra Series Fund | December 31, 2012
Moderate Allocation Fund Portfolio of Investments
| Shares | Value (Note 2) | ||||
| INVESTMENT COMPANIES - 99.3% | |||||
| Bond Funds - 36.7% | |||||
| DoubleLine Total Return Bond Fund Class I | 1,048,861 | $ | 11,883,593 | ||
| Franklin Floating Rate Daily Access Fund Advisor Class | 2,382,356 | 21,750,911 | |||
| Madison Mosaic Institutional Bond Fund (A) | 1,393,750 | 15,623,934 | |||
| MEMBERS Bond Fund Class Y (A) | 2,405,616 | 25,427,362 | |||
| MEMBERS High Income Fund Class Y (A) | 2,455,877 | 17,461,282 | |||
| Metropolitan West Total Return Bond Fund Class I | 3,540,055 | 38,551,204 | |||
| PIMCO Investment Grade Corporate Bond Fund Institutional Class | 1,224,971 | 13,621,675 | |||
| 144,319,961 | |||||
| Foreign Bond Funds - 3.1% | |||||
| TCW Emerging Markets Income Fund Class I | 1,305,762 | 12,169,702 | |||
| Foreign Stock Funds - 11.5% | |||||
| Matthews Asian Growth and Income Fund Institutional Shares | 316,920 | 5,894,713 | |||
| MEMBERS International Stock Fund Class Y (A) | 708,463 | 8,005,628 | |||
| NorthRoad International Fund Class Y (A) | 1,378,003 | 14,317,452 | |||
| Vanguard FTSE All-World ex-US ETF | 323,701 | 14,809,321 | |||
| WisdomTree Japan Hedged Equity Fund ETF | 55,233 | 2,036,993 | |||
| 45,064,107 | |||||
| Money Market Funds - 1.1% | |||||
| State Street Institutional U.S. Government Money Market Fund | 4,421,329 | 4,421,329 | |||
| Shares | Value (Note 2) | ||||
| Stock Funds - 46.9% | |||||
| iShares Core S&P Mid-Cap ETF | 48,734 | $ | 4,956,248 | ||
| iShares S&P 100 Index Fund ETF | 213,507 | 13,809,633 | |||
| iShares S&P Global Energy Sector Index Fund ETF | 50,688 | 1,938,816 | |||
| Madison Mosaic Disciplined Equity Fund (A) | 2,220,189 | 29,706,124 | |||
| MEMBERS Equity Income Fund Class Y (A) | 1,319,334 | 12,757,964 | |||
| MEMBERS Large Cap Growth Fund Class Y (A) | 1,513,868 | 26,371,588 | |||
| MEMBERS Large Cap Value Fund Class Y (A) | 2,356,806 | 32,500,352 | |||
| MEMBERS Mid Cap Fund Class Y (A) * | 2,263,279 | 17,812,004 | |||
| MEMBERS Small Cap Fund Class Y (A) | 619,710 | 7,244,407 | |||
| Schwab Fundamental U.S. Large Company Index Fund | 2,647,531 | 28,434,482 | |||
| Vanguard Health Care ETF | 54,251 | 3,888,169 | |||
| Vanguard Information Technology ETF | 70,910 | 4,900,590 | |||
| 184,320,377 | |||||
| TOTAL INVESTMENTS - 99.3% (Cost $351,324,878**) | 390,295,476 | ||||
| NET OTHER ASSETS AND LIABILITIES - 0.7% | 2,762,997 | ||||
| TOTAL NET ASSETS - 100.0% | $ | 393,058,473 | |||
| * | Non-income producing. |
| ** | Aggregate cost for Federal tax purposes was $355,477,443. |
| (A) | Affiliated Company (see Note 10). |
| ETF | Exchange Traded Fund. |
Ultra Series Fund | December 31, 2012
Aggressive Allocation Fund Portfolio of Investments
| Shares | Value (Note 2) | ||||
| INVESTMENT COMPANIES - 99.8% | |||||
| Bond Funds - 12.7% | |||||
| MEMBERS High Income Fund Class Y (A) | 429,563 | $ | 3,054,190 | ||
| Metropolitan West Total Return Bond Fund Class I | 1,146,245 | 12,482,602 | |||
| PIMCO Investment Grade Corporate Bond Fund Institutional Class | 260,402 | 2,895,675 | |||
| 18,432,467 | |||||
| Foreign Bond Funds - 0.5% | |||||
| TCW Emerging Markets Income Fund Class I | 79,680 | 742,616 | |||
| Foreign Stock Funds - 18.3% | |||||
| Market Vectors Agribusiness ETF | 20,701 | 1,092,185 | |||
| Market Vectors Gold Miners ETF | 27,102 | 1,257,262 | |||
| Matthews Asian Growth and Income Fund Institutional Shares | 230,835 | 4,293,530 | |||
| MEMBERS International Stock Fund Class Y (A) | 321,305 | 3,630,741 | |||
| NorthRoad International Fund Class Y (A) | 492,632 | 5,118,451 | |||
| Vanguard FTSE All-World ex-US ETF | 192,953 | 8,827,600 | |||
| WisdomTree Japan Hedged Equity Fund ETF | 60,439 | 2,228,990 | |||
| 26,448,759 | |||||
| Money Market Funds - 1.6% | |||||
| State Street Institutional U.S. Government Money Market Fund | 2,375,855 | 2,375,855 | |||
| Shares | Value (Note 2) | ||||
| Stock Funds - 66.7% | |||||
| iShares Core S&P Mid-Cap ETF | 21,468 | $ | 2,183,296 | ||
| iShares S&P 100 Index Fund ETF | 122,897 | 7,948,978 | |||
| iShares S&P Global Energy Sector Index Fund ETF | 36,809 | 1,407,944 | |||
| Madison Mosaic Disciplined Equity Fund (A) | 1,236,305 | 16,541,758 | |||
| MEMBERS Equity Income Fund Class Y (A) | 333,863 | 3,228,452 | |||
| MEMBERS Large Cap Growth Fund Class Y (A) | 618,663 | 10,777,117 | |||
| MEMBERS Large Cap Value Fund Class Y (A) | 1,180,844 | 16,283,838 | |||
| MEMBERS Mid Cap Fund Class Y (A) * | 1,544,805 | 12,157,615 | |||
| MEMBERS Small Cap Fund Class Y (A) | 255,585 | 2,987,791 | |||
| Schwab Fundamental U.S. Large Company Index Fund | 1,470,319 | 15,791,229 | |||
| Vanguard Health Care ETF | 39,782 | 2,851,176 | |||
| Vanguard Information Technology ETF | 61,691 | 4,263,465 | |||
| 96,422,659 | |||||
| TOTAL INVESTMENTS - 99.8% (Cost $127,681,907**) | 144,422,356 | ||||
| NET OTHER ASSETS AND LIABILITIES - 0.2% | 253,063 | ||||
| TOTAL NET ASSETS - 100.0% | $ | 144,675,419 | |||
| * | Non-income producing. |
| ** | Aggregate cost for Federal tax purposes was $129,719,193. |
| (A) | Affiliated Company (see Note 10). |
| ETF | Exchange Traded Fund. |
Ultra Series Fund | December 31, 2012
Money Market Fund Portfolio of Investments
| Par Value | Value (Note 2) | ||||
| U.S. GOVERNMENT AND AGENCY OBLIGATIONS - 74.9% | |||||
| Fannie Mae - 16.9% | |||||
| 0.132%, 1/30/13 (A) | $ | 428,000 | $ | 427,955 | |
| 3.625%, 2/12/13 | 500,000 | 501,970 | |||
| 0.135%, 2/13/13 (A) | 550,000 | 549,911 | |||
| 4.750%, 2/21/13 | 1,647,000 | 1,657,467 | |||
| 1.750%, 2/22/13 | 750,000 | 751,684 | |||
| 4.250%, 2/25/13 | 400,000 | 402,438 | |||
| 0.750%, 2/26/13 | 1,297,000 | 1,298,231 | |||
| 0.122%, 3/6/13 (A) | 1,600,000 | 1,599,659 | |||
| 4.375%, 3/15/13 | 1,287,000 | 1,298,125 | |||
| 8,487,440 | |||||
| Federal Farm Credit Bank - 4.8% | |||||
| 0.140%, 1/28/13 (A) | 100,000 | 99,999 | |||
| 2.150%, 2/4/13 | 735,000 | 736,371 | |||
| 3.400%, 2/7/13 | 1,110,000 | 1,113,568 | |||
| 1.750%, 2/21/13 | 300,000 | 300,667 | |||
| 4.500%, 2/25/13 | 144,000 | 144,934 | |||
| 2,395,539 | |||||
| Federal Home Loan Bank - 22.9% | |||||
| 0.122%, 1/2/13 (A) | 100,000 | 100,000 | |||
| 0.101%, 1/4/13 (A) | 200,000 | 199,998 | |||
| 0.210%, 1/4/13 | 1,000,000 | 1,000,007 | |||
| 0.112%, 1/9/13 (A) | 575,000 | 574,986 | |||
| 0.180%, 1/9/13 | 200,000 | 200,001 | |||
| 1.500%, 1/16/13 | 1,105,000 | 1,105,604 | |||
| 0.170%, 1/17/13 | 200,000 | 200,001 | |||
| 0.129%, 1/23/13 (A) | 1,100,000 | 1,099,913 | |||
| 0.020%, 1/30/13 (A) | 1,400,000 | 1,399,977 | |||
| 0.119%, 2/1/13 (A) | 958,000 | 957,909 | |||
| 0.136%, 2/5/13 (A) | 400,000 | 399,949 | |||
| 0.150%, 2/6/13 | 600,000 | 600,020 | |||
| 0.170%, 2/11/13 | 500,000 | 500,017 | |||
| 0.180%, 2/15/13 | 125,000 | 125,007 | |||
| 0.079%, 2/20/13 (A) | 1,043,000 | 1,042,914 | |||
| 0.125%, 3/5/13 (A) | 400,000 | 399,986 | |||
| 5.000%, 3/8/13 | 750,000 | 756,663 | |||
| 0.130%, 3/14/13 (A) | 700,000 | 699,820 | |||
| 0.300%, 3/19/13 | 160,000 | 160,061 | |||
| 11,522,833 | |||||
| Freddie Mac - 22.3% | |||||
| 0.122%, 1/3/13 (A) | 500,000 | 499,997 | |||
| 0.101%, 1/7/13 (A) | 210,000 | 209,996 | |||
| 1.375%, 1/9/13 | 1,375,000 | 1,375,366 | |||
| Par Value | Value (Note 2) | ||||
| 0.152%, 1/14/13 (A) | $ | 305,000 | $ | 304,983 | |
| 0.132%, 1/22/13 (A) | 250,000 | 249,981 | |||
| 0.167%, 1/28/13 (A) | 2,550,000 | 2,549,675 | |||
| 0.142%, 2/19/13 (A) | 400,000 | 399,924 | |||
| 0.128%, 2/25/13 (A) | 1,500,000 | 1,499,725 | |||
| 0.041%, 2/27/13 (A) | 1,250,000 | 1,249,921 | |||
| 0.032%, 3/5/13 (A) | 500,000 | 499,972 | |||
| 0.091%, 3/18/13 (A) | 2,000,000 | 1,999,620 | |||
| 1.720%, 4/11/13 | 400,000 | 401,732 | |||
| 11,240,892 | |||||
| U.S. Treasury Notes - 8.0% | |||||
| 1.375%, 1/15/13 | 3,000,000 | 3,001,428 | |||
| 0.625%, 1/31/13 | 550,000 | 550,221 | |||
| 2.750%, 2/28/13 | 500,000 | 502,105 | |||
| 4,053,754 | |||||
Total U.S. Government and Agency Obligations (Cost $37,700,458) |
37,700,458 | ||||
| SHORT-TERM INVESTMENTS - 19.8% | |||||
| Consumer Discretionary - 0.2% | |||||
| McDonald’s Corp., 4.3%, 3/1/13 | 100,000 | 100,654 | |||
| Consumer Staples - 6.1% | |||||
| Coca-Cola Co. (A), 0.162%, 3/4/13 | 1,000,000 | 999,725 | |||
| PepsiCo Inc., 4.65%, 2/15/13 | 720,000 | 723,767 | |||
| Proctor & Gamble Co. (A), 0.162%, 2/12/13 | 1,350,000 | 1,349,748 | |||
| 3,073,240 | |||||
| Financials - 9.9% | |||||
| Bank One Corp., 5.25%, 1/30/13 | 500,000 | 501,879 | |||
| John Deere Bank S.A. (A), 0.172%, 1/17/13 | 1,000,000 | 999,925 | |||
| John Deere Bank S.A. (A), 0.172%, 1/23/13 | 500,000 | 499,948 | |||
| John Deere Bank S.A. (A), 0.162%, 1/24/13 | 500,000 | 499,949 | |||
| JPMorgan Chase & Co., 5.75%, 1/2/13 | 300,000 | 300,041 | |||
| Wells Fargo & Co., 4.375%, 1/31/13 | 150,000 | 150,493 | |||
| Wells Fargo & Co. (A), 0.142%, 2/25/13 | 1,000,000 | 999,786 | |||
| Wells Fargo & Co. (A), 0.142%, 3/7/13 | 1,000,000 | 999,747 | |||
| 4,951,768 | |||||
| Industrials - 2.2% | |||||
| Emerson Electric Co. (A), 0.152%, 1/17/13 | 1,000,000 | 999,934 | |||
| General Electric Capital Corp. (A), 0.203%, 1/4/13 | 100,000 | 99,998 | |||
| 1,099,932 | |||||
| Information Technology - 1.4% | |||||
| Oracle Corp., 4.95%, 4/15/13 | 700,000 | 709,098 | |||
Total Short-Term Investments (Cost $9,934,692) |
9,934,692 | ||||
Ultra Series Fund | December 31, 2012
Money Market Fund Portfolio of Investments
| Shares | Value (Note 2) | ||||
| INVESTMENT COMPANIES - 4.9% | |||||
| State Street Institutional U.S. Government Money Market Fund | 2,476,374 | $ | 2,476,374 | ||
Total Investment Companies (Cost $2,476,374) |
2,476,374 | ||||
| TOTAL INVESTMENTS - 99.6% (Cost $50,111,524**) | 50,111,524 | ||||
| NET OTHER ASSETS AND LIABILITIES - 0.4% | 212,153 | ||||
| TOTAL NET ASSETS - 100.0% | $ | 50,323,677 | |||
| ** | Aggregate cost for Federal tax purposes was $50,111,524. |
| (A) | Rate noted represents annualized yield at time of purchase. |
Ultra Series Fund | December 31, 2012
Bond Fund Portfolio of Investments
| Par Value | Value (Note 2) | ||||
| ASSET BACKED SECURITIES - 0.9% | |||||
| ABSC Long Beach Home Equity Loan Trust, Series 2000-LB1, Class AF5 (A), 8.55%, 9/21/30 | $ | 652,045 | $ | 660,454 | |
| New Century Home Equity Loan Trust, Series 2003-5, Class AI5 (B), 5.5%, 11/25/33 | 2,799,669 | 2,815,790 | |||
Total Asset Backed Securities (Cost $3,472,353) |
3,476,244 | ||||
| CORPORATE NOTES AND BONDS - 27.5% | |||||
| Consumer Discretionary - 2.6% | |||||
| American Association of Retired Persons (C) (D), 7.5%, 5/1/31 | 2,500,000 | 3,466,302 | |||
| DR Horton Inc., 5.25%, 2/15/15 | 1,140,000 | 1,199,850 | |||
| ERAC USA Finance LLC (C) (D), 6.7%, 6/1/34 | 4,400,000 | 5,327,472 | |||
| 9,993,624 | |||||
| Consumer Staples - 1.1% | |||||
| PepsiCo Inc., 4.65%, 2/15/13 | 1,165,000 | 1,171,372 | |||
| WM Wrigley Jr. Co. (C) (D), 3.05%, 6/28/13 | 3,170,000 | 3,207,625 | |||
| 4,378,997 | |||||
| Energy - 2.8% | |||||
| Hess Corp., 7.875%, 10/1/29 | 2,460,000 | 3,420,369 | |||
| Transocean Inc., 6%, 3/15/18 | 1,400,000 | 1,623,705 | |||
| Transocean Inc., 7.5%, 4/15/31 | 2,310,000 | 2,870,794 | |||
| Valero Energy Corp., 7.5%, 4/15/32 | 2,275,000 | 2,918,832 | |||
| 10,833,700 | |||||
| Financials - 2.6% | |||||
| American Express Credit Corp., 2.375%, 3/24/17 | 1,080,000 | 1,130,022 | |||
| HCP Inc., 6.7%, 1/30/18 | 2,725,000 | 3,286,590 | |||
| Lehman Brothers Holdings Inc. (E) *, 5.75%, 1/3/17 | 3,135,000 | 314 | |||
| Simon Property Group L.P., 5.875%, 3/1/17 | 1,060,000 | 1,255,035 | |||
| Swiss Re Solutions Holding Corp., 7%, 2/15/26 | 1,250,000 | 1,589,066 | |||
| UBS AG (F), 5.75%, 4/25/18 | 750,000 | 890,357 | |||
| US Bank NA, 6.3%, 2/4/14 | 2,000,000 | 2,120,934 | |||
| 10,272,318 | |||||
| Health Care - 4.5% | |||||
| Eli Lilly & Co., 6.57%, 1/1/16 | 2,600,000 | 2,991,521 | |||
| Genentech Inc., 5.25%, 7/15/35 | 1,740,000 | 2,097,672 | |||
| Merck & Co. Inc., 5.75%, 11/15/36 | 3,960,000 | 5,236,209 | |||
| Quest Diagnostics Inc., 5.45%, 11/1/15 | 3,500,000 | 3,886,330 | |||
| Wyeth LLC, 6.5%, 2/1/34 | 2,370,000 | 3,239,873 | |||
| 17,451,605 | |||||
| Industrials - 4.9% | |||||
| Boeing Co./The, 8.625%, 11/15/31 | 760,000 | 1,179,939 | |||
| Boeing Co./The, 6.875%, 10/15/43 | 1,380,000 | 1,945,629 | |||
| Par Value | Value (Note 2) | ||||
| Burlington Northern Santa Fe LLC, 8.125%, 4/15/20 | $ | 2,925,000 | $ | 3,881,882 | |
| EI du Pont de Nemours & Co., 5%, 1/15/13 | 195,000 | 195,305 | |||
| General Electric Capital Corp., 3.35%, 10/17/16 | 3,200,000 | 3,434,835 | |||
| Lockheed Martin Corp., 7.65%, 5/1/16 | 1,450,000 | 1,755,969 | |||
| Norfolk Southern Corp., 5.59%, 5/17/25 | 1,268,000 | 1,557,176 | |||
| Norfolk Southern Corp., 7.05%, 5/1/37 | 1,400,000 | 1,989,585 | |||
| Waste Management Inc., 7.125%, 12/15/17 | 2,465,000 | 2,997,026 | |||
| 18,937,346 | |||||
| Information Technology - 0.7% | |||||
| Cisco Systems Inc., 5.5%, 2/22/16 | 2,400,000 | 2,743,332 | |||
| Materials - 1.7% | |||||
| Westvaco Corp., 8.2%, 1/15/30 | 2,250,000 | 2,968,724 | |||
| Weyerhaeuser Co., 7.375%, 3/15/32 | 3,000,000 | 3,780,225 | |||
| 6,748,949 | |||||
| Telecommunication Services - 2.0% | |||||
| Comcast Cable Communications Holdings Inc., 9.455%, 11/15/22 | 3,080,000 | 4,656,526 | |||
| Rogers Communications Inc. (F), 6.25%, 6/15/13 | 3,000,000 | 3,077,292 | |||
| 7,733,818 | |||||
| Utilities - 4.6% | |||||
| Indianapolis Power & Light Co. (C) (D), 6.05%, 10/1/36 | 3,445,000 | 4,176,528 | |||
| Interstate Power & Light Co., 6.25%, 7/15/39 | 2,925,000 | 3,836,942 | |||
| Sierra Pacific Power Co., Series M, 6%, 5/15/16 | 3,250,000 | 3,761,300 | |||
| Southwestern Electric Power Co., Series E, 5.55%, 1/15/17 | 2,165,000 | 2,442,014 | |||
| Wisconsin Electric Power Co., 6.5%, 6/1/28 | 3,000,000 | 3,787,149 | |||
| 18,003,933 | |||||
Total Corporate Notes and Bonds (Cost $94,785,082) |
107,097,622 | ||||
| MORTGAGE BACKED SECURITIES - 16.2% | |||||
| Fannie Mae - 13.7% | |||||
| 4%, 4/1/15 Pool # 255719 | 379,601 | 406,596 | |||
| 5.5%, 4/1/16 Pool # 745444 | 682,655 | 733,677 | |||
| 6%, 5/1/16 Pool # 582558 | 36,660 | 38,962 | |||
| 5.5%, 9/1/17 Pool # 657335 | 96,624 | 104,035 | |||
| 5.5%, 2/1/18 Pool # 673194 | 340,731 | 367,012 | |||
| 5%, 5/1/20 Pool # 813965 | 1,246,066 | 1,360,769 | |||
| 4.5%, 9/1/20 Pool # 835465 | 933,122 | 1,005,312 | |||
| 6%, 5/1/21 Pool # 253847 | 137,543 | 151,142 | |||
| 7%, 12/1/29 Pool # 762813 | 106,896 | 124,576 | |||
| 7%, 11/1/31 Pool # 607515 | 75,522 | 90,233 | |||
| 6.5%, 3/1/32 Pool # 631377 | 194,524 | 220,741 | |||
| 7%, 4/1/32 Pool # 641518 | 4,876 | 5,819 | |||
| 7%, 5/1/32 Pool # 644591 | 98,120 | 117,233 | |||
Ultra Series Fund | December 31, 2012
Bond Fund Portfolio of Investments
| Par Value | Value (Note 2) | ||||
| MORTGAGE BACKED SECURITIES (continued) | |||||
| Fannie Mae (continued) | |||||
| 6.5%, 6/1/32 Pool # 545691 | $ | 1,126,604 | $ | 1,283,331 | |
| 5.5%, 4/1/33 Pool # 690206 | 1,439,349 | 1,581,886 | |||
| 5%, 10/1/33 Pool # 254903 | 2,010,627 | 2,190,574 | |||
| 5.5%, 11/1/33 Pool # 555880 | 1,666,965 | 1,832,043 | |||
| 5%, 5/1/34 Pool # 782214 | 59,025 | 64,160 | |||
| 5%, 6/1/34 Pool # 778891 | 494,158 | 537,149 | |||
| 5.5%, 6/1/34 Pool # 780384 | 1,818,203 | 1,989,168 | |||
| 7%, 7/1/34 Pool # 792636 | 42,248 | 48,412 | |||
| 5.5%, 8/1/34 Pool # 793647 | 259,938 | 292,584 | |||
| 5.5%, 3/1/35 Pool # 810075 | 958,372 | 1,048,887 | |||
| 5.5%, 3/1/35 Pool # 815976 | 1,294,109 | 1,416,333 | |||
| 5.5%, 7/1/35 Pool # 825283 | 1,312,833 | 1,437,262 | |||
| 5%, 8/1/35 Pool # 829670 | 1,537,205 | 1,669,018 | |||
| 5.5%, 8/1/35 Pool # 826872 | 793,858 | 868,091 | |||
| 5%, 9/1/35 Pool # 820347 | 1,631,520 | 1,847,897 | |||
| 5%, 9/1/35 Pool # 835699 | 1,577,080 | 1,786,237 | |||
| 5%, 10/1/35 Pool # 797669 | 2,196,046 | 2,473,567 | |||
| 5.5%, 10/1/35 Pool # 836912 | 128,499 | 140,455 | |||
| 5%, 11/1/35 Pool # 844809 | 964,192 | 1,046,870 | |||
| 5%, 12/1/35 Pool # 850561 | 1,058,250 | 1,148,992 | |||
| 5.5%, 2/1/36 Pool # 851330 | 245,879 | 269,084 | |||
| 5.5%, 10/1/36 Pool # 896340 | 336,406 | 366,808 | |||
| 5.5%, 10/1/36 Pool # 901723 | 1,855,026 | 2,017,859 | |||
| 6.5%, 10/1/36 Pool # 894118 | 1,377,630 | 1,558,398 | |||
| 6%, 11/1/36 Pool # 902510 | 2,108,180 | 2,364,715 | |||
| 5.5%, 2/1/37 Pool # 905140 | 1,632,698 | 1,837,751 | |||
| 5.5%, 5/1/37 Pool # 899323 | 957,162 | 1,044,471 | |||
| 5.5%, 5/1/37 Pool # 928292 | 973,696 | 1,095,984 | |||
| 6%, 10/1/37 Pool # 947563 | 2,010,020 | 2,254,611 | |||
| 5.5%, 7/1/38 Pool # 986973 | 1,299,679 | 1,435,168 | |||
| 5%, 8/1/38 Pool # 988934 | 2,691,675 | 2,951,922 | |||
| 6.5%, 8/1/38 Pool # 987711 | 2,369,386 | 2,817,900 | |||
| 3.5%, 6/1/42 Pool # AO4136 | 3,795,828 | 4,058,431 | |||
| 53,502,125 | |||||
| Freddie Mac - 2.4% | |||||
| 5%, 5/1/18 Pool # E96322 | 693,180 | 745,779 | |||
| 8%, 6/1/30 Pool # C01005 | 53,693 | 66,426 | |||
| 7%, 3/1/31 Pool # C48129 | 218,655 | 257,732 | |||
| 5%, 7/1/33 Pool # A11325 | 1,226,603 | 1,368,197 | |||
| 6%, 10/1/34 Pool # A28439 | 275,683 | 303,285 | |||
| 6%, 10/1/34 Pool # A28598 | 187,975 | 206,796 | |||
| 5.5%, 11/1/34 Pool # A28282 | 2,464,371 | 2,763,094 | |||
| 5%, 4/1/35 Pool # A32314 | 351,693 | 393,830 | |||
| 5%, 4/1/35 Pool # A32315 | 556,231 | 612,444 | |||
| 5%, 4/1/35 Pool # A32316 | 768,925 | 865,856 | |||
| Par Value | Value (Note 2) | ||||
| 5%, 4/1/35 Pool # A32509 | $ | 198,149 | $ | 218,174 | |
| 5%, 1/1/37 Pool # A56371 | 1,547,515 | 1,666,671 | |||
| 9,468,284 | |||||
| Ginnie Mae - 0.1% | |||||
| 8%, 10/20/15 Pool # 2995 | 24,876 | 26,555 | |||
| 6.5%, 2/20/29 Pool # 2714 | 127,063 | 146,164 | |||
| 6.5%, 4/20/31 Pool # 3068 | 99,235 | 114,091 | |||
| 286,810 | |||||
Total Mortgage Backed Securities (Cost $57,109,291) |
63,257,219 | ||||
| U.S. GOVERNMENT AND AGENCY OBLIGATIONS - 51.2% | |||||
| Fannie Mae - 1.1% | |||||
| 4.625%, 10/15/14 | 3,905,000 | 4,207,161 | |||
| Federal Farm Credit Bank - 1.2% | |||||
| 5.875%, 10/3/16 | 4,000,000 | 4,772,500 | |||
| Freddie Mac - 2.4% | |||||
| 4.875%, 11/15/13 | 2,500,000 | 2,603,268 | |||
| 4.500%, 1/15/14 | 5,500,000 | 5,744,326 | |||
| 1.000%, 9/29/17 | 1,000,000 | 1,010,507 | |||
| 9,358,101 | |||||
| U.S. Treasury Bonds - 4.3% | |||||
| 6.625%, 2/15/27 | 7,350,000 | 11,306,365 | |||
| 4.500%, 5/15/38 | 4,000,000 | 5,287,500 | |||
| 16,593,865 | |||||
| U.S. Treasury Notes - 42.2% | |||||
| 3.625%, 5/15/13 | 4,000,000 | 4,051,564 | |||
| 3.125%, 8/31/13 | 2,710,000 | 2,762,718 | |||
| 4.000%, 2/15/14 | 9,500,000 | 9,902,639 | |||
| 4.250%, 8/15/14 | 11,200,000 | 11,925,379 | |||
| 2.375%, 9/30/14 | 3,600,000 | 3,733,592 | |||
| 2.625%, 12/31/14 | 26,000,000 | 27,226,888 | |||
| 2.500%, 3/31/15 | 1,750,000 | 1,836,954 | |||
| 4.250%, 8/15/15 | 8,900,000 | 9,805,993 | |||
| 3.250%, 12/31/16 | 8,000,000 | 8,860,000 | |||
| 3.125%, 1/31/17 | 4,000,000 | 4,415,936 | |||
| 2.375%, 7/31/17 | 5,250,000 | 5,661,385 | |||
| 0.750%, 10/31/17 | 13,000,000 | 13,042,653 | |||
| 4.250%, 11/15/17 | 9,100,000 | 10,655,536 | |||
| 2.750%, 2/15/19 | 16,750,000 | 18,546,705 | |||
| 3.375%, 11/15/19 | 15,000,000 | 17,246,490 | |||
| 2.625%, 11/15/20 | 6,500,000 | 7,133,750 | |||
| 2.000%, 11/15/21 | 7,500,000 | 7,784,183 | |||
| 164,592,365 | |||||
Total U.S. Government and Agency Obligations (Cost $184,704,850) |
199,523,992 | ||||
Ultra Series Fund | December 31, 2012
Bond Fund Portfolio of Investments
| Shares | Value (Note 2) | ||||
| INVESTMENT COMPANIES - 3.4% | |||||
| State Street Institutional U.S. Government Money Market Fund | 13,441,891 | $ | 13,441,891 | ||
Total Investment Companies (Cost $13,441,891) |
13,441,891 | ||||
| TOTAL INVESTMENTS - 99.2% (Cost $353,513,467**) | 386,796,968 | ||||
| NET OTHER ASSETS AND LIABILITIES - 0.8% | 2,993,956 | ||||
| TOTAL NET ASSETS - 100.0% | $ | 389,790,924 | |||
| * | Non-income producing. |
| ** | Aggregate cost for Federal tax purposes was $353,550,521. |
| (A) | Stepped rate security. Rate shown is as of December 31, 2012. |
| (B) | Floating rate or variable rate note. Rate shown is as of December 31, 2012. |
| (C) | Security sold within terms of a private placement memorandum exempt from registration under section 144A of the Securities Act of 1933, as amended, and may be sold only to dealers in that program or other “qualified institutional investors.” |
| (D) | Illiquid security (See Note 2). |
| (E) | In default. Issuer is bankrupt. |
| (F) | Notes and bonds, issued by foreign entities, denominated in U.S. dollars. The aggregate of these securities is 1.02% of total net assets. |
Ultra Series Fund | December 31, 2012
High Income Fund Portfolio of Investments
| Par Value | Value (Note 2) | ||||
| CORPORATE NOTES AND BONDS - 94.0% | |||||
| Consumer Discretionary - 34.9% | |||||
| Auto Components - 3.9% | |||||
| Allison Transmission Inc. (A), 7.125%, 5/15/19 | $ | 300,000 | $ | 320,250 | |
| American Axle & Manufacturing Inc., 7.875%, 3/1/17 | 750,000 | 776,250 | |||
| Dana Holding Corp., 6.5%, 2/15/19 | 350,000 | 373,625 | |||
| Dana Holding Corp., 6.75%, 2/15/21 | 250,000 | 268,750 | |||
| Goodyear Tire & Rubber Co., 7%, 5/15/22 | 500,000 | 536,250 | |||
| Tenneco Inc., 6.875%, 12/15/20 | 325,000 | 353,844 | |||
| 2,628,969 | |||||
| Automobiles - 0.4% | |||||
| Cooper Standard Automotive Inc., 8.5%, 5/1/18 | 250,000 | 268,750 | |||
| Hotels, Restaurants & Leisure - 6.2% | |||||
| Ameristar Casinos Inc., 7.5%, 4/15/21 | 800,000 | 867,000 | |||
| Boyd Acquisition Sub LLC / Boyd Acquisition Finance Corp. (A), 8.375%, 2/15/18 | 200,000 | 208,000 | |||
| Boyd Gaming Corp., 7.125%, 2/1/16 | 150,000 | 147,000 | |||
| Boyd Gaming Corp., 9.125%, 12/1/18 | 500,000 | 510,000 | |||
| Felcor Lodging L.P., 6.75%, 6/1/19 | 950,000 | 1,009,375 | |||
| MGM Resorts International, 7.5%, 6/1/16 | 250,000 | 268,125 | |||
| MGM Resorts International, 7.625%, 1/15/17 | 500,000 | 535,000 | |||
| Pinnacle Entertainment Inc., 8.75%, 5/15/20 | 300,000 | 324,000 | |||
| Scientific Games International Inc. (A), 6.25%, 9/1/20 | 300,000 | 309,750 | |||
| 4,178,250 | |||||
| Household Durables - 1.6% | |||||
| Griffon Corp., 7.125%, 4/1/18 | 500,000 | 530,000 | |||
| Spectrum Brands Holdings Inc., 9.5%, 6/15/18 | 500,000 | 567,500 | |||
| 1,097,500 | |||||
| Media - 16.6% | |||||
| Allbritton Communications Co., 8%, 5/15/18 | 950,000 | 1,030,750 | |||
| AMC Networks Inc., 4.75%, 12/15/22 | 700,000 | 703,500 | |||
| Cablevision Systems Corp., 7.75%, 4/15/18 | 250,000 | 278,125 | |||
| Cablevision Systems Corp., 5.875%, 9/15/22 | 200,000 | 200,250 | |||
| CCO Holdings LLC / CCO Holdings Capital Corp., 6.5%, 4/30/21 | 750,000 | 809,062 | |||
| Cequel Communications Holdings I LLC / Cequel Capital Corp. (A), 8.625%, 11/15/17 | 142,000 | 151,940 | |||
| Cequel Communications Holdings I LLC / Cequel Capital Corp. (A), 6.375%, 9/15/20 | 400,000 | 416,500 | |||
| CSC Holdings LLC (A), 6.75%, 11/15/21 | 400,000 | 443,500 | |||
| Cumulus Media Holdings Inc., 7.75%, 5/1/19 | 900,000 | 884,250 | |||
| DISH DBS Corp., 5.875%, 7/15/22 | 100,000 | 107,500 | |||
| DISH DBS Corp. (A), 5%, 3/15/23 | 300,000 | 300,000 | |||
| Par Value | Value (Note 2) | ||||
| Hughes Satellite Systems Corp., 6.5%, 6/15/19 | $ | 500,000 | $ | 551,250 | |
| Intelsat Jackson Holdings S.A. (A) (B), 7.25%, 10/15/20 | 325,000 | 352,625 | |||
| Intelsat Jackson Holdings S.A. (B), 7.5%, 4/1/21 | 250,000 | 275,625 | |||
| Intelsat Luxembourg S.A., PIK (B), 11.5%, 2/4/17 | 375,000 | 398,438 | |||
| Lamar Media Corp., 5.875%, 2/1/22 | 500,000 | 542,500 | |||
| Mediacom Broadband LLC / Mediacom Broadband Corp. (A), 6.375%, 4/1/23 | 800,000 | 814,000 | |||
| Telesat Canada / Telesat LLC (A) (B), 6%, 5/15/17 | 500,000 | 525,000 | |||
| UPCB Finance V Ltd. (A) (B), 6.875%, 1/15/22 | 350,000 | 378,875 | |||
| Videotron Ltee (B), 5%, 7/15/22 | 750,000 | 786,562 | |||
| Virgin Media Finance PLC (B), 4.875%, 2/15/22 | 600,000 | 613,500 | |||
| XM Satellite Radio Inc. (A), 7.625%, 11/1/18 | 500,000 | 557,500 | |||
| 11,121,252 | |||||
| Specialty Retail - 4.2% | |||||
| Jo-Ann Stores Inc. (A), 8.125%, 3/15/19 | 600,000 | 610,500 | |||
| Michaels Stores Inc., 7.75%, 11/1/18 | 500,000 | 548,750 | |||
| Penske Automotive Group Inc. (A), 5.75%, 10/1/22 | 500,000 | 515,000 | |||
| Sally Holdings LLC / Sally Capital Inc., 5.75%, 6/1/22 | 1,000,000 | 1,085,000 | |||
| Yankee Candle Co. Inc., Series B, 8.5%, 2/15/15 | 23,000 | 23,115 | |||
| 2,782,365 | |||||
| Textiles, Apparel & Luxury Goods - 2.0% | |||||
| Hanesbrands Inc., 6.375%, 12/15/20 | 250,000 | 275,000 | |||
| Levi Strauss & Co., 7.625%, 5/15/20 | 500,000 | 545,000 | |||
| PVH Corp., 4.5%, 12/15/22 | 500,000 | 505,000 | |||
| 1,325,000 | |||||
| Consumer Staples - 5.9% | |||||
| Central Garden and Pet Co., 8.25%, 3/1/18 | 500,000 | 528,750 | |||
| Dole Food Co. Inc. (A), 8%, 10/1/16 | 200,000 | 208,000 | |||
| Ingles Markets Inc., 8.875%, 5/15/17 | 750,000 | 799,688 | |||
| Mead Products LLC / ACCO Brands Corp. (A), 6.75%, 4/30/20 | 250,000 | 262,500 | |||
| Pinnacle Foods Finance LLC / Pinnacle Foods Finance Corp., 9.25%, 4/1/15 | 378,000 | 383,670 | |||
| Pinnacle Foods Finance LLC / Pinnacle Foods Finance Corp., 8.25%, 9/1/17 | 500,000 | 532,500 | |||
| Stater Brothers Holdings, 7.75%, 4/15/15 | 500,000 | 510,000 | |||
| Tops Markets LLC, 10.125%, 10/15/15 | 500,000 | 527,500 | |||
| US Foodservice (A), 8.5%, 6/30/19 | 200,000 | 204,000 | |||
| 3,956,608 | |||||
Ultra Series Fund | December 31, 2012
High Income Fund Portfolio of Investments
| Par Value | Value (Note 2) | ||||
| CORPORATE NOTES AND BONDS (continued) | |||||
| Energy - 14.2% | |||||
| Access Midstream Partners L.P. / ACMP Finance Corp., 4.875%, 5/15/23 | $ | 500,000 | $ | 507,500 | |
| AmeriGas Finance LLC / AmeriGas Finance Corp., 7%, 5/20/22 | 250,000 | 278,125 | |||
| AmeriGas Partners L.P. / AmeriGas Finance Corp., 6.25%, 8/20/19 | 500,000 | 535,000 | |||
| Chaparral Energy Inc., 8.25%, 9/1/21 | 500,000 | 542,500 | |||
| Chesapeake Energy Corp., 6.775%, 3/15/19 | 750,000 | 750,937 | |||
| Cie Generale de Geophysique – Veritas (B), 6.5%, 6/1/21 | 300,000 | 321,000 | |||
| Continental Resources Inc., 8.25%, 10/1/19 | 250,000 | 280,000 | |||
| Copano Energy LLC / Copano Energy Finance Corp., 7.125%, 4/1/21 | 550,000 | 590,562 | |||
| Exterran Holdings Inc., 7.25%, 12/1/18 | 500,000 | 530,000 | |||
| Helix Energy Solutions Group Inc. (A), 9.5%, 1/15/16 | 87,000 | 89,175 | |||
| Key Energy Services Inc., 6.75%, 3/1/21 | 500,000 | 500,000 | |||
| MarkWest Energy Partners L.P. / MarkWest Energy Finance Corp., 6.75%, 11/1/20 | 500,000 | 545,000 | |||
| Oasis Petroleum Inc., 6.875%, 1/15/23 | 500,000 | 536,250 | |||
| PetroBakken Energy Ltd. (A) (B), 8.625%, 2/1/20 | 700,000 | 710,500 | |||
| Plains Exploration & Production Co., 6.5%, 11/15/20 | 500,000 | 553,750 | |||
| Precision Drilling Corp. (B), 6.5%, 12/15/21 | 850,000 | 905,250 | |||
| QEP Resources Inc., 5.25%, 5/1/23 | 500,000 | 535,000 | |||
| Regency Energy Partners L.P. / Regency Energy Finance Corp., 6.875%, 12/1/18 | 500,000 | 545,000 | |||
| Unit Corp., 6.625%, 5/15/21 | 250,000 | 256,563 | |||
| 9,512,112 | |||||
| Financials - 3.4% | |||||
| Ally Financial Inc., 5.5%, 2/15/17 | 700,000 | 748,834 | |||
| CIT Group Inc., 5%, 5/15/17 | 50,000 | 53,000 | |||
| MPT Operating Partnership L.P. / MPT Finance Corp., 6.875%, 5/1/21 | 500,000 | 542,500 | |||
| Nuveen Investments Inc. (A), 9.125%, 10/15/17 | 400,000 | 393,000 | |||
| Toys R Us Property Co. I LLC, 10.75%, 7/15/17 | 500,000 | 538,750 | |||
| 2,276,084 | |||||
| Health Care - 8.8% | |||||
| Air Medical Group Holdings Inc., 9.25%, 11/1/18 | 500,000 | 552,500 | |||
| Biomet Inc. (A), 6.5%, 8/1/20 | 250,000 | 265,625 | |||
| DaVita HealthCare Partners Inc., 6.375%, 11/1/18 | 500,000 | 536,250 | |||
| Endo Health Solutions Inc., 7%, 12/15/20 | 500,000 | 533,125 | |||
| Par Value | Value (Note 2) | ||||
| Fresenius Medical Care US Finance II Inc. (A), 5.625%, 7/31/19 | $ | 200,000 | $ | 214,750 | |
| Fresenius Medical Care US Finance II Inc. (A), 5.875%, 1/31/22 | 200,000 | 217,000 | |||
| HCA Inc., 5.875%, 3/15/22 | 250,000 | 271,875 | |||
| HCA Inc., 5.875%, 5/1/23 | 800,000 | 828,000 | |||
| Multiplan Inc. (A), 9.875%, 9/1/18 | 250,000 | 278,750 | |||
| Tenet Healthcare Corp., 6.25%, 11/1/18 | 250,000 | 274,375 | |||
| Tenet Healthcare Corp., 8%, 8/1/20 | 850,000 | 915,344 | |||
| Valeant Pharmaceuticals International (A), 6.875%, 12/1/18 | 500,000 | 538,750 | |||
| Vanguard Health Holding Co. II LLC / Vanguard Holding Co. II Inc. (A), 7.75%, 2/1/19 | 500,000 | 517,500 | |||
| 5,943,844 | |||||
| Industrials - 6.8% | |||||
| Alliance Data Systems Corp. (A), 5.25%, 12/1/17 | 50,000 | 50,750 | |||
| Alliance Data Systems Corp. (A), 6.375%, 4/1/20 | 400,000 | 426,000 | |||
| Ashtead Capital Inc. (A), 6.5%, 7/15/22 | 500,000 | 542,500 | |||
| Avis Budget Car Rental LLC / Avis Budget Finance Inc., 8.25%, 1/15/19 | 500,000 | 552,500 | |||
| Belden Inc. (A), 5.5%, 9/1/22 | 500,000 | 513,750 | |||
| Moog Inc., 7.25%, 6/15/18 | 500,000 | 525,625 | |||
| RBS Global Inc. / Rexnord LLC, 8.5%, 5/1/18 | 300,000 | 325,125 | |||
| Tomkins LLC / Tomkins Inc., 9%, 10/1/18 | 325,000 | 364,000 | |||
| TransDigm Inc. (A), 5.5%, 10/15/20 | 200,000 | 208,000 | |||
| United Rentals North America Inc., 8.25%, 2/1/21 | 175,000 | 197,312 | |||
| United Rentals North America Inc. (A), 7.625%, 4/15/22 | 500,000 | 558,750 | |||
| West Corp., 8.625%, 10/1/18 | 100,000 | 104,750 | |||
| West Corp., 7.875%, 1/15/19 | 200,000 | 207,000 | |||
| 4,576,062 | |||||
| Information Technology - 3.3% | |||||
| Level 3 Financing Inc., 8.125%, 7/1/19 | 400,000 | 436,000 | |||
| SunGard Data Systems Inc., 7.375%, 11/15/18 | 800,000 | 857,000 | |||
| Syniverse Holdings Inc., 9.125%, 1/15/19 | 850,000 | 907,375 | |||
| 2,200,375 | |||||
| Materials - 8.8% | |||||
| ArcelorMittal (B), 5.75%, 8/5/20 | 500,000 | 501,005 | |||
| Ardagh Packaging Finance PLC / Ardagh MP Holdings USA Inc. (A) (B), 9.125%, 10/15/20 | 300,000 | 325,500 | |||
| Boise Cascade LLC / Boise Cascade Finance Corp. (A), 6.375%, 11/1/20 | 600,000 | 618,000 | |||
| FMG Resources August 2006 Pty Ltd. (A) (B), 7%, 11/1/15 | 200,000 | 210,000 | |||
Ultra Series Fund | December 31, 2012
High Income Fund Portfolio of Investments
| Par Value | Value (Note 2) | ||||
| CORPORATE NOTES AND BONDS (continued) | |||||
| Materials (continued) | |||||
| Graphic Packaging International Inc., 9.5%, 6/15/17 | $ | 350,000 | $ | 378,000 | |
| Huntsman International LLC, 5.5%, 6/30/16 | 250,000 | 250,313 | |||
| Huntsman International LLC (A), 4.875%, 11/15/20 | 250,000 | 252,812 | |||
| JMC Steel Group (A), 8.25%, 3/15/18 | 1,000,000 | 1,045,000 | |||
| Penn Virginia Resource Partners L.P. / Penn Virginia Resource Finance Corp., 8.25%, 4/15/18 | 700,000 | 742,000 | |||
| Polymer Group Inc., 7.75%, 2/1/19 | 500,000 | 536,250 | |||
| Reynolds Group Issuer Inc. / Reynolds Group Issuer LLC, 8.5%, 5/15/18 | 250,000 | 256,250 | |||
| Reynolds Group Issuer Inc. / Reynolds Group Issuer LLC, 9%, 4/15/19 | 250,000 | 260,000 | |||
| Reynolds Group Issuer Inc. / Reynolds Group Issuer LLC, 8.25%, 2/15/21 | 500,000 | 507,500 | |||
| 5,882,630 | |||||
| Telecommunication Services - 5.6% | |||||
| CenturyLink Inc., 5.8%, 3/15/22 | 500,000 | 528,563 | |||
| CommScope Inc. (A), 8.25%, 1/15/19 | 500,000 | 547,500 | |||
| Crown Castle International Corp., 7.125%, 11/1/19 | 150,000 | 165,750 | |||
| Crown Castle International Corp. (A), 5.25%, 1/15/23 | 600,000 | 642,000 | |||
| SBA Telecommunications Inc. (A), 5.75%, 7/15/20 | 300,000 | 318,750 | |||
| Sprint Nextel Corp., 7%, 8/15/20 | 325,000 | 355,063 | |||
| Sprint Nextel Corp., 6%, 11/15/22 | 200,000 | 205,500 | |||
| tw telecom holdings, Inc., 8%, 3/1/18 | 500,000 | 547,500 | |||
| Windstream Corp., 7%, 3/15/19 | 475,000 | 485,688 | |||
| 3,796,314 | |||||
| Utilities - 2.3% | |||||
| GenOn Energy Inc., 7.875%, 6/15/17 | 300,000 | 331,500 | |||
| Mirant Americas Generation LLC, 8.5%, 10/1/21 | 300,000 | 342,000 | |||
| NRG Energy Inc., 8.25%, 9/1/20 | 475,000 | 532,000 | |||
| Suburban Propane Partners L.P. / Suburban Energy Finance Corp., 7.375%, 8/1/21 | 309,000 | 336,038 | |||
| 1,541,538 | |||||
Total Corporate Notes and Bonds (Cost $59,983,869) |
63,087,653 | ||||
| Shares | Value (Note 2) | ||||
| INVESTMENT COMPANIES - 4.7% | |||||
| State Street Institutional U.S. Government Money Market Fund | 3,135,148 | $ | 3,135,148 | ||
Total Investment Companies (Cost $3,135,148) |
3,135,148 | ||||
| TOTAL INVESTMENTS - 98.7% (Cost $63,119,017**) | 66,222,801 | ||||
| NET OTHER ASSETS AND LIABILITIES - 1.3% | 876,800 | ||||
| TOTAL NET ASSETS - 100.0% | $ | 67,099,601 | |||
| ** | Aggregate cost for Federal tax purposes was $63,119,017. |
| (A) | Security sold within terms of a private placement memorandum exempt from registration under section 144A of the Securities Act of 1933, as amended, and may be sold only to dealers in that program or other “qualified institutional investors.” |
| (B) | Notes and bonds, issued by foreign entities, denominated in U.S. dollars. The aggregate of these securities is 9.39% of total net assets. |
| PIK | Payment in Kind Security. Pays interest in additional bonds rather than in cash. |
| PLC | Public Limited Company. |
Ultra Series Fund | December 31, 2012
Diversified Income Fund Portfolio of Investments
| Shares | Value (Note 2) | ||||
| COMMON STOCKS - 54.8% | |||||
| Consumer Discretionary - 5.4% | |||||
| McDonald’s Corp. | 52,500 | $ | 4,631,025 | ||
| Omnicom Group Inc. | 71,500 | 3,572,140 | |||
| Target Corp. | 69,000 | 4,082,730 | |||
| Time Warner Inc. | 130,000 | 6,217,900 | |||
| Viacom Inc., Class B | 55,500 | 2,927,070 | |||
| 21,430,865 | |||||
| Consumer Staples - 7.7% | |||||
| Coca-Cola Co./The | 93,000 | 3,371,250 | |||
| Diageo PLC, ADR | 27,000 | 3,147,660 | |||
| Nestle S.A., ADR | 59,000 | 3,845,030 | |||
| PepsiCo Inc. | 107,300 | 7,342,539 | |||
| Philip Morris International Inc. | 31,000 | 2,592,840 | |||
| Procter & Gamble Co./The | 74,000 | 5,023,860 | |||
| Sysco Corp. | 82,000 | 2,596,120 | |||
| Wal-Mart Stores Inc. | 35,000 | 2,388,050 | |||
| 30,307,349 | |||||
| Energy - 6.3% | |||||
| Chevron Corp. | 91,500 | 9,894,810 | |||
| ConocoPhillips | 145,000 | 8,408,550 | |||
| Exxon Mobil Corp. | 38,000 | 3,288,900 | |||
| Occidental Petroleum Corp. | 43,000 | 3,294,230 | |||
| 24,886,490 | |||||
| Financials - 10.5% | |||||
| Axis Capital Holdings Ltd. | 100,500 | 3,481,320 | |||
| Bank of New York Mellon Corp./The | 109,100 | 2,803,870 | |||
| BlackRock Inc. | 26,700 | 5,519,157 | |||
| M&T Bank Corp. | 36,000 | 3,544,920 | |||
| Northern Trust Corp. | 58,500 | 2,934,360 | |||
| PartnerRe Ltd. | 50,500 | 4,064,745 | |||
| Travelers Cos. Inc./The | 126,000 | 9,049,320 | |||
| US Bancorp | 134,000 | 4,279,960 | |||
| Wells Fargo & Co. | 167,000 | 5,708,060 | |||
| 41,385,712 | |||||
| Health Care - 10.1% | |||||
| Becton, Dickinson and Co. | 34,000 | 2,658,460 | |||
| Johnson & Johnson | 145,000 | 10,164,500 | |||
| Medtronic Inc. | 95,800 | 3,929,716 | |||
| Merck & Co. Inc. | 206,000 | 8,433,640 | |||
| Novartis AG, ADR | 63,000 | 3,987,900 | |||
| Pfizer Inc. | 430,019 | 10,784,876 | |||
| 39,959,092 | |||||
| Industrials - 7.3% | |||||
| 3M Co. | 78,500 | 7,288,725 | |||
| Boeing Co./The | 60,000 | 4,521,600 | |||
| Shares | Value (Note 2) | ||||
| Emerson Electric Co. | 69,000 | $ | 3,654,240 | ||
| United Parcel Service Inc., Class B | 64,000 | 4,718,720 | |||
| United Technologies Corp. | 74,000 | 6,068,740 | |||
| Waste Management Inc. | 72,000 | 2,429,280 | |||
| 28,681,305 | |||||
| Information Technology - 5.3% | |||||
| Accenture PLC, Class A | 42,600 | 2,832,900 | |||
| Automatic Data Processing Inc. | 60,500 | 3,449,105 | |||
| Intel Corp. | 113,000 | 2,331,190 | |||
| Linear Technology Corp. | 90,000 | 3,087,000 | |||
| Microchip Technology Inc. | 75,000 | 2,444,250 | |||
| Microsoft Corp. | 247,000 | 6,602,310 | |||
| 20,746,755 | |||||
| Materials - 0.9% | |||||
| Air Products & Chemicals Inc. | 41,000 | 3,444,820 | |||
| Telecommunication Service - 1.3% | |||||
| AT&T Inc. | 155,515 | 5,242,411 | |||
Total Common Stocks (Cost $174,701,827) |
216,084,799 | ||||
| Par Value | |||||
| ASSET BACKED SECURITIES - 0.2% | |||||
| ABSC Long Beach Home Equity Loan Trust, Series 2000-LB1, Class AF5 (A), 8.55%, 9/21/30 | $ | 599,648 | 607,382 | ||
Total Asset Backed Securities (Cost $618,567) |
607,382 | ||||
| CORPORATE NOTES AND BONDS - 16.0% | |||||
| Consumer Discretionary - 1.9% | |||||
| American Association of Retired Persons (B) (C), 7.5%, 5/1/31 | 2,000,000 | 2,773,042 | |||
| DR Horton Inc., 5.25%, 2/15/15 | 515,000 | 542,037 | |||
| ERAC USA Finance LLC (B) (C), 6.7%, 6/1/34 | 1,850,000 | 2,239,960 | |||
| Royal Caribbean Cruises Ltd. (D), 7.25%, 6/15/16 | 1,600,000 | 1,808,000 | |||
| 7,363,039 | |||||
| Consumer Staples - 1.2% | |||||
| Kraft Foods Inc., 6.5%, 11/1/31 | 2,025,000 | 2,609,992 | |||
| PepsiCo Inc., 4.65%, 2/15/13 | 620,000 | 623,392 | |||
| WM Wrigley Jr. Co. (B) (C), 3.05%, 6/28/13 | 1,310,000 | 1,325,548 | |||
| 4,558,932 | |||||
| Energy - 1.4% | |||||
| ConocoPhillips, 6.65%, 7/15/18 | 1,500,000 | 1,902,687 | |||
| Hess Corp., 7.875%, 10/1/29 | 1,150,000 | 1,598,953 | |||
| Transocean Inc. (D), 6%, 3/15/18 | 750,000 | 869,842 | |||
| Transocean Inc. (D), 7.5%, 4/15/31 | 1,030,000 | 1,280,051 | |||
| 5,651,533 | |||||
Ultra Series Fund | December 31, 2012
Diversified Income Fund Portfolio of Investments
| Par Value | Value (Note 2) | ||||
| CORPORATE NOTES AND BONDS (continued) | |||||
| Financials - 1.6% | |||||
| American Express Credit Corp., 2.375%, 3/24/17 | $ | 450,000 | $ | 470,843 | |
| HCP Inc., 6.7%, 1/30/18 | 1,450,000 | 1,748,828 | |||
| Lehman Brothers Holdings Inc. (E) *, 5.75%, 1/3/17 | 1,735,000 | 173 | |||
| Simon Property Group L.P., 5.875%, 3/1/17 | 530,000 | 627,517 | |||
| Swiss Re Solutions Holding Corp., 7%, 2/15/26 | 1,000,000 | 1,271,253 | |||
| US Bank NA, 6.3%, 2/4/14 | 2,000,000 | 2,120,934 | |||
| 6,239,548 | |||||
| Health Care - 3.3% | |||||
| AbbVie Inc. (B) (C), 2%, 11/6/18 | 1,200,000 | 1,215,510 | |||
| Amgen Inc., 5.85%, 6/1/17 | 3,950,000 | 4,677,728 | |||
| Eli Lilly & Co., 6.57%, 1/1/16 | 1,200,000 | 1,380,702 | |||
| Genentech Inc., 5.25%, 7/15/35 | 740,000 | 892,114 | |||
| Merck & Co. Inc., 5.75%, 11/15/36 | 1,320,000 | 1,745,403 | |||
| Quest Diagnostics Inc., 5.45%, 11/1/15 | 1,500,000 | 1,665,570 | |||
| Wyeth LLC, 6.5%, 2/1/34 | 1,100,000 | 1,503,738 | |||
| 13,080,765 | |||||
| Industrials - 2.1% | |||||
| Boeing Co./The, 8.625%, 11/15/31 | 350,000 | 543,393 | |||
| Boeing Co./The, 6.875%, 10/15/43 | 620,000 | 874,123 | |||
| Burlington Northern Santa Fe LLC, 8.125%, 4/15/20 | 1,365,000 | 1,811,545 | |||
| EI du Pont de Nemours & Co., 5%, 1/15/13 | 103,000 | 103,161 | |||
| Lockheed Martin Corp., 7.65%, 5/1/16 | 780,000 | 944,590 | |||
| Norfolk Southern Corp., 5.59%, 5/17/25 | 957,000 | 1,175,250 | |||
| Norfolk Southern Corp., 7.05%, 5/1/37 | 1,050,000 | 1,492,189 | |||
| Waste Management Inc., 7.125%, 12/15/17 | 1,150,000 | 1,398,207 | |||
| 8,342,458 | |||||
| Information Technology - 0.7% | |||||
| Cisco Systems Inc., 5.5%, 2/22/16 | 960,000 | 1,097,333 | |||
| International Business Machines Corp., 1.875%, 8/1/22 | 1,600,000 | 1,539,689 | |||
| 2,637,022 | |||||
| Materials - 0.3% | |||||
| Westvaco Corp., 8.2%, 1/15/30 | 1,025,000 | 1,352,419 | |||
| Telecommunication Services - 1.0% | |||||
| Comcast Cable Communications Holdings Inc., 9.455%, 11/15/22 | 1,780,000 | 2,691,109 | |||
| Rogers Communications Inc. (D), 6.25%, 6/15/13 | 1,315,000 | 1,348,880 | |||
| 4,039,989 | |||||
| Utilities - 2.5% | |||||
| Indianapolis Power & Light Co. (B) (C), 6.05%, 10/1/36 | 1,555,000 | 1,885,196 | |||
| Par Value | Value (Note 2) | ||||
| Interstate Power & Light Co., 6.25%, 7/15/39 | $ | 1,365,000 | $ | 1,790,573 | |
| Nevada Power Co., Series R, 6.75%, 7/1/37 | 1,600,000 | 2,219,242 | |||
| Sierra Pacific Power Co., Series M, 6%, 5/15/16 | 474,000 | 548,571 | |||
| Southwestern Electric Power Co., Series E, 5.55%, 1/15/17 | 835,000 | 941,839 | |||
| Westar Energy Inc., 6%, 7/1/14 | 2,400,000 | 2,570,081 | |||
| 9,955,502 | |||||
Total Corporate Notes and Bonds (Cost $55,906,823) |
63,221,207 | ||||
| MORTGAGE BACKED SECURITIES - 6.9% | |||||
| Fannie Mae - 6.0% | |||||
| 4%, 4/1/15 Pool # 255719 | 178,216 | 190,890 | |||
| 5.5%, 4/1/16 Pool # 745444 | 263,817 | 283,535 | |||
| 6%, 5/1/16 Pool # 582558 | 67,211 | 71,430 | |||
| 5%, 12/1/17 Pool # 672243 | 604,719 | 657,173 | |||
| 4.5%, 9/1/20 Pool # 835465 | 573,640 | 618,020 | |||
| 6%, 5/1/21 Pool # 253847 | 117,014 | 128,583 | |||
| 7%, 12/1/29 Pool # 762813 | 50,060 | 58,340 | |||
| 7%, 11/1/31 Pool # 607515 | 75,522 | 90,233 | |||
| 7%, 4/1/32 Pool # 641518 | 2,611 | 3,117 | |||
| 7%, 5/1/32 Pool # 644591 | 53,943 | 64,451 | |||
| 5.5%, 10/1/33 Pool # 254904 | 558,585 | 613,901 | |||
| 5.5%, 11/1/33 Pool # 555880 | 1,666,965 | 1,832,043 | |||
| 5%, 5/1/34 Pool # 780890 | 2,093,567 | 2,275,704 | |||
| 7%, 7/1/34 Pool # 792636 | 20,221 | 23,172 | |||
| 5.5%, 8/1/34 Pool # 793647 | 251,127 | 282,666 | |||
| 5.5%, 3/1/35 Pool # 815976 | 1,255,573 | 1,374,157 | |||
| 5.5%, 7/1/35 Pool # 825283 | 545,799 | 597,529 | |||
| 5.5%, 8/1/35 Pool # 826872 | 348,358 | 380,932 | |||
| 5%, 9/1/35 Pool # 820347 | 666,810 | 755,245 | |||
| 5%, 9/1/35 Pool # 835699 | 660,147 | 747,697 | |||
| 5%, 10/1/35 Pool # 797669 | 687,918 | 774,852 | |||
| 5.5%, 10/1/35 Pool # 836912 | 280,799 | 306,926 | |||
| 5%, 12/1/35 Pool # 850561 | 442,694 | 480,654 | |||
| 5.5%, 12/1/35 Pool # 844583 | 1,365,921 | 1,492,792 | |||
| 5.5%, 2/1/36 Pool # 851330 | 110,434 | 120,856 | |||
| 5.5%, 9/1/36 Pool # 831820 | 1,437,280 | 1,647,435 | |||
| 6%, 9/1/36 Pool # 831741 | 634,439 | 693,909 | |||
| 5.5%, 10/1/36 Pool # 896340 | 151,359 | 165,038 | |||
| 5.5%, 10/1/36 Pool # 901723 | 695,635 | 756,697 | |||
| 5.5%, 12/1/36 Pool # 902853 | 1,268,169 | 1,402,870 | |||
| 5.5%, 12/1/36 Pool # 903059 | 1,050,415 | 1,188,575 | |||
| 5.5%, 12/1/36 Pool # 907512 | 690,238 | 753,200 | |||
| 5.5%, 12/1/36 Pool # 907635 | 910,503 | 1,034,813 | |||
| 3.5%, 6/1/42 Pool # AO4136 | 1,423,436 | 1,521,912 | |||
| 23,389,347 | |||||
Ultra Series Fund | December 31, 2012
Diversified Income Fund Portfolio of Investments
| Par Value | Value (Note 2) | ||||
| MORTGAGE BACKED SECURITIES (continued) | |||||
| Freddie Mac - 0.9% | |||||
| 8%, 6/1/30 Pool # C01005 | $ | 42,955 | $ | 53,141 | |
| 6.5%, 1/1/32 Pool # C62333 | 140,476 | 162,956 | |||
| 5%, 7/1/33 Pool # A11325 | 1,226,603 | 1,368,197 | |||
| 6%, 10/1/34 Pool # A28439 | 127,853 | 140,654 | |||
| 6%, 10/1/34 Pool # A28598 | 87,177 | 95,905 | |||
| 5%, 4/1/35 Pool # A32314 | 190,183 | 212,969 | |||
| 5%, 4/1/35 Pool # A32315 | 248,382 | 273,484 | |||
| 5%, 4/1/35 Pool # A32316 | 264,317 | 297,637 | |||
| 5%, 4/1/35 Pool # A32509 | 131,600 | 144,900 | |||
| 5%, 1/1/37 Pool # A56371 | 773,757 | 833,335 | |||
| 3,583,178 | |||||
| Ginnie Mae - 0.0% | |||||
| 6.5%, 4/20/31 Pool # 3068 | 81,723 | 93,957 | |||
| Total Mortgage Backed Securities (Cost $24,529,551) | 27,066,482 | ||||
| U.S. GOVERNMENT AND AGENCY OBLIGATIONS - 18.2% | |||||
| U.S. Treasury Bond - 1.3% | |||||
| 6.625%, 2/15/27 | 3,270,000 | 5,030,179 | |||
| U.S. Treasury Notes - 16.9% | |||||
| 1.375%, 1/15/13 | 4,000,000 | 4,001,720 | |||
| 3.625%, 5/15/13 | 1,980,000 | 2,005,524 | |||
| 3.125%, 8/31/13 | 1,175,000 | 1,197,857 | |||
| 4.000%, 2/15/14 | 4,810,000 | 5,013,862 | |||
| 4.250%, 8/15/14 | 4,965,000 | 5,286,563 | |||
| 2.375%, 9/30/14 | 1,400,000 | 1,451,953 | |||
| 0.500%, 10/15/14 | 5,000,000 | 5,022,655 | |||
| 2.500%, 3/31/15 | 795,000 | 834,502 | |||
| 4.500%, 2/15/16 | 3,550,000 | 4,001,237 | |||
| 3.250%, 12/31/16 | 2,500,000 | 2,768,750 | |||
| 3.125%, 1/31/17 | 2,000,000 | 2,207,968 | |||
| 0.500%, 7/31/17 | 4,000,000 | 3,975,936 | |||
| 2.375%, 7/31/17 | 2,000,000 | 2,156,718 | |||
| 4.250%, 11/15/17 | 12,100,000 | 14,168,350 | |||
| 2.750%, 2/15/19 | 1,300,000 | 1,439,446 | |||
| 3.375%, 11/15/19 | 1,000,000 | 1,149,766 | |||
| 2.625%, 11/15/20 | 7,400,000 | 8,121,500 | |||
| 1.750%, 5/15/22 | 1,750,000 | 1,765,176 | |||
| 66,569,483 | |||||
Total U.S. Government and Agency Obligations (Cost $67,276,218) |
71,599,662 | ||||
| Shares | Value (Note 2) | ||||
| INVESTMENT COMPANIES - 3.6% | |||||
| State Street Institutional U.S. Government Money Market Fund | 14,006,365 | $ | 14,006,365 | ||
Total Investment Companies (Cost $14,006,365) |
14,006,365 | ||||
| TOTAL INVESTMENTS - 99.7% (Cost $337,039,351**) | 392,585,897 | ||||
| NET OTHER ASSETS AND LIABILITIES - 0.3% | 1,344,592 | ||||
| TOTAL NET ASSETS - 100.0% | $ | 393,930,489 | |||
| * | Non-income producing. |
| ** | Aggregate cost for Federal tax purposes was $337,889,040. |
| (A) | Stepped rate security. Rate shown is as of December 31, 2012. |
| (B) | Security sold within terms of a private placement memorandum exempt from registration under section 144A of the Securities Act of 1933, as amended, and may be sold only to dealers in that program or other “qualified institutional investors.” |
| (C) | Illiquid security (See Note 2). |
| (D) | Notes and bonds, issued by foreign entities, denominated in U.S. dollars. The aggregate of these securities is 1.35% of total net assets. |
| (E) | In default. Issuer is bankrupt. |
| ADR | American Depositary Receipt. |
| PLC | Public Limited Company. |
Ultra Series Fund | December 31, 2012
Large Cap Value Fund Portfolio of Investments
| Shares | Value (Note 2) | |||||
| COMMON STOCKS - 96.2% | ||||||
| Consumer Discretionary - 8.5% | ||||||
| McDonald’s Corp. | 58,000 | $ | 5,116,180 | |||
| Omnicom Group Inc. | 174,000 | 8,693,040 | ||||
| Target Corp. | 160,000 | 9,467,200 | ||||
| Time Warner Inc. | 236,500 | 11,311,795 | ||||
| Viacom Inc., Class B | 151,000 | 7,963,740 | ||||
| 42,551,955 | ||||||
| Consumer Staples - 10.1% | ||||||
| Diageo PLC, ADR | 42,500 | 4,954,650 | ||||
| Nestle S.A., ADR | 94,000 | 6,125,980 | ||||
| PepsiCo Inc. | 151,000 | 10,332,930 | ||||
| Philip Morris International Inc. | 67,000 | 5,603,880 | ||||
| Procter & Gamble Co./The | 177,000 | 12,016,530 | ||||
| Sysco Corp. | 184,000 | 5,825,440 | ||||
| Wal-Mart Stores Inc. | 82,000 | 5,594,860 | ||||
| 50,454,270 | ||||||
| Energy - 13.5% | ||||||
| Apache Corp. | 123,500 | 9,694,750 | ||||
| Chevron Corp. | 143,046 | 15,468,994 | ||||
| ConocoPhillips | 198,000 | 11,482,020 | ||||
| Exxon Mobil Corp. | 59,000 | 5,106,450 | ||||
| National Oilwell Varco Inc. | 37,000 | 2,528,950 | ||||
| Occidental Petroleum Corp. | 158,500 | 12,142,685 | ||||
| Schlumberger Ltd. | 161,000 | 11,155,690 | ||||
| 67,579,539 | ||||||
| Financials - 26.2% | ||||||
| Capital Markets - 4.7% | ||||||
| Bank of New York Mellon Corp./The | 480,000 | 12,336,000 | ||||
| BlackRock Inc. | 31,000 | 6,408,010 | ||||
| Franklin Resources Inc. | 40,000 | 5,028,000 | ||||
| 23,772,010 | ||||||
| Commercial Banks - 6.7% | ||||||
| M&T Bank Corp. | 55,000 | 5,415,850 | ||||
| US Bancorp | 405,000 | 12,935,700 | ||||
| Wells Fargo & Co. | 450,000 | 15,381,000 | ||||
| 33,732,550 | ||||||
| Insurance - 13.0% | ||||||
| American International Group Inc. * | 157,000 | 5,542,100 | ||||
| Arch Capital Group Ltd. * | 202,500 | 8,914,050 | ||||
| Berkshire Hathaway Inc., Class B * | 162,000 | 14,531,400 | ||||
| Markel Corp. * | 32,576 | 14,119,090 | ||||
| Travelers Cos. Inc./The | 217,500 | 15,620,850 | ||||
| WR Berkley Corp. | 165,032 | 6,228,308 | ||||
| 64,955,798 | ||||||
| Real Estate Management & Development - 1.8% | ||||||
| Brookfield Asset Management Inc., Class A | 240,000 | 8,796,000 | ||||
| Shares | Value (Note 2) | |||||
| Health Care - 16.7% | ||||||
| Johnson & Johnson | 309,000 | $ | 21,660,900 | |||
| Laboratory Corp. of America Holdings * | 70,000 | 6,063,400 | ||||
| Medtronic Inc. | 233,000 | 9,557,660 | ||||
| Merck & Co. Inc. | 461,500 | 18,893,810 | ||||
| Novartis AG, ADR | 119,000 | 7,532,700 | ||||
| Pfizer Inc. | 796,000 | 19,963,680 | ||||
| 83,672,150 | ||||||
| Industrials - 12.4% | ||||||
| 3M Co. | 179,000 | 16,620,150 | ||||
| Boeing Co./The | 123,500 | 9,306,960 | ||||
| Danaher Corp. | 94,000 | 5,254,600 | ||||
| Emerson Electric Co. | 160,000 | 8,473,600 | ||||
| General Dynamics Corp. | 78,000 | 5,403,060 | ||||
| United Parcel Service Inc., Class B | 122,000 | 8,995,060 | ||||
| United Technologies Corp. | 100,000 | 8,201,000 | ||||
| 62,254,430 | ||||||
| Information Technology - 3.9% | ||||||
| Intel Corp. | 245,000 | 5,054,350 | ||||
| International Business Machines Corp. | 35,500 | 6,800,025 | ||||
| Microsoft Corp. | 282,000 | 7,537,860 | ||||
| 19,392,235 | ||||||
| Materials - 3.4% | ||||||
| Air Products & Chemicals Inc. | 86,000 | 7,225,720 | ||||
| Mosaic Co./The | 46,000 | 2,604,980 | ||||
| Newmont Mining Corp. | 149,000 | 6,919,560 | ||||
| 16,750,260 | ||||||
| Telecommunication Service - 1.4% | ||||||
| AT&T Inc. | 212,987 | 7,179,792 | ||||
Total Common Stocks (Cost $399,218,418) |
481,090,989 | |||||
| INVESTMENT COMPANIES - 4.0% | ||||||
| State Street Institutional U.S. Government Money Market Fund | 20,226,182 | 20,226,182 | ||||
Total Investment Companies (Cost $20,226,182) |
20,226,182 | |||||
| TOTAL INVESTMENTS - 100.2% (Cost $419,444,600**) | 501,317,171 | |||||
| NET OTHER ASSETS AND LIABILITIES - (0.2%) | (848,044 | ) | ||||
| TOTAL NET ASSETS - 100.0% | $ | 500,469,127 | ||||
| * | Non-income producing. |
| ** | Aggregate cost for Federal tax purposes was $419,832,130. |
| ADR | American Depositary Receipt. |
| PLC | Public Limited Company. |
Ultra Series Fund | December 31, 2012
Large Cap Growth Fund Portfolio of Investments
| Shares | Value (Note 2) | ||||
| COMMON STOCKS - 95.4% | |||||
| Consumer Discretionary - 16.7% | |||||
| Amazon.com Inc. * | 22,097 | $ | 5,549,441 | ||
| CarMax Inc. * | 57,568 | 2,161,103 | |||
| Chipotle Mexican Grill Inc. * | 5,165 | 1,536,381 | |||
| Comcast Corp., Class A | 134,817 | 5,039,459 | |||
| Discovery Communications Inc., Class C * | 64,335 | 3,763,597 | |||
| Home Depot Inc./The | 77,125 | 4,770,181 | |||
| J.C. Penney Company Inc. | 90,852 | 1,790,693 | |||
| Lululemon Athletica Inc. * | 24,685 | 1,881,738 | |||
| Nielsen Holdings N.V. * | 76,523 | 2,340,839 | |||
| NIKE Inc. | 56,918 | 2,936,969 | |||
| Omnicom Group Inc. | 79,720 | 3,982,811 | |||
| Panera Bread Co., Class A * | 28,003 | 4,447,716 | |||
| priceline.com Inc. * | 6,943 | 4,312,992 | |||
| Starbucks Corp. | 56,378 | 3,022,988 | |||
| Tractor Supply Co. | 18,405 | 1,626,266 | |||
| Walt Disney Co./The | 67,630 | 3,367,298 | |||
| Yum! Brands Inc. | 78,870 | 5,236,968 | |||
| 57,767,440 | |||||
| Consumer Staples - 7.7% | |||||
| Coca-Cola Co./The | 236,890 | 8,587,262 | |||
| Costco Wholesale Corp. | 57,304 | 5,659,916 | |||
| Diageo PLC, ADR | 29,717 | 3,464,408 | |||
| Hershey Co./The | 31,875 | 2,302,013 | |||
| PepsiCo Inc. | 99,563 | 6,813,096 | |||
| 26,826,695 | |||||
| Energy - 4.8% | |||||
| Exxon Mobil Corp. | 80,810 | 6,994,105 | |||
| Schlumberger Ltd. | 138,765 | 9,615,027 | |||
| 16,609,132 | |||||
| Financials - 4.8% | |||||
| Aon PLC | 15,505 | 862,078 | |||
| Brookfield Asset Management Inc., Class A | 97,582 | 3,576,380 | |||
| IntercontinentalExchange Inc. * | 55,442 | 6,864,274 | |||
| T Rowe Price Group Inc. | 84,254 | 5,487,463 | |||
| 16,790,195 | |||||
| Health Care - 10.5% | |||||
| Allergan Inc. | 38,628 | 3,543,347 | |||
| Becton, Dickinson and Co. | 31,965 | 2,499,343 | |||
| Biogen Idec Inc. * | 26,105 | 3,828,820 | |||
| Celgene Corp. * | 67,595 | 5,321,078 | |||
| Cerner Corp. * | 74,564 | 5,789,149 | |||
| Eli Lilly & Co. | 36,430 | 1,796,728 | |||
| Johnson & Johnson | 82,125 | 5,756,963 | |||
| UnitedHealth Group Inc. | 147,345 | 7,991,993 | |||
| 36,527,421 | |||||
| Shares | Value (Note 2) | ||||
| Industrials - 11.9% | |||||
| 3M Co. | 50,963 | $ | 4,731,915 | ||
| Boeing Co./The | 77,597 | 5,847,710 | |||
| C.H. Robinson Worldwide Inc. | 43,470 | 2,748,173 | |||
| Copart Inc. * | 72,802 | 2,147,659 | |||
| Danaher Corp. | 82,145 | 4,591,905 | |||
| Emerson Electric Co. | 87,988 | 4,659,844 | |||
| Expeditors International of Washington Inc. | 49,867 | 1,972,240 | |||
| IHS Inc., Class A * | 25,953 | 2,491,488 | |||
| Roper Industries Inc. | 37,893 | 4,224,312 | |||
| United Parcel Service Inc., Class B | 74,075 | 5,461,550 | |||
| W.W. Grainger Inc. | 11,825 | 2,393,025 | |||
| 41,269,821 | |||||
| Information Technology - 33.1% | |||||
| Communications Equipment - 2.8% | |||||
| QUALCOMM Inc. | 154,710 | 9,595,114 | |||
| Computers & Peripherals - 8.6% | |||||
| Apple Inc. | 50,848 | 27,103,509 | |||
| EMC Corp. * | 109,275 | 2,764,658 | |||
| 29,868,167 | |||||
| Electrical Equipment - 0.6% | |||||
| Sensata Technologies Holding N.V. * | 63,077 | 2,048,741 | |||
| Internet Software & Services - 5.9% | |||||
| Baidu Inc., ADR * | 14,180 | 1,422,112 | |||
| eBay Inc. * | 79,935 | 4,078,284 | |||
| Google Inc., Class A * | 21,348 | 15,143,631 | |||
| 20,644,027 | |||||
| IT Services - 3.9% | |||||
| Accenture PLC, Class A | 114,662 | 7,625,023 | |||
| Visa Inc., Class A | 38,321 | 5,808,697 | |||
| 13,433,720 | |||||
| Semiconductors & Semiconductor Equipment - 2.3% | |||||
| ASML Holding N.V. | 48,040 | 3,094,256 | |||
| Intel Corp. | 234,915 | 4,846,297 | |||
| 7,940,553 | |||||
| Software - 9.0% | |||||
| MICROS Systems Inc. * | 112,038 | 4,754,893 | |||
| Microsoft Corp. | 434,685 | 11,619,130 | |||
| Nuance Communications Inc. * | 228,411 | 5,098,133 | |||
| Oracle Corp. | 227,391 | 7,576,668 | |||
| SAP AG, ADR | 26,550 | 2,134,089 | |||
| 31,182,913 | |||||
Ultra Series Fund | December 31, 2012
Large Cap Growth Fund Portfolio of Investments
| Shares | Value (Note 2) | ||||
| COMMON STOCKS (continued) | |||||
| Materials - 4.1% | |||||
| Ecolab Inc. | 42,352 | $ | 3,045,109 | ||
| International Flavors & Fragrances Inc. | 58,145 | 3,868,968 | |||
| Monsanto Co. | 77,130 | 7,300,355 | |||
| 14,214,432 | |||||
| Telecommunication Service - 1.8% | |||||
| Verizon Communications Inc. | 142,720 | 6,175,494 | |||
Total Common Stocks (Cost $259,589,772) |
330,893,865 | ||||
| INVESTMENT COMPANIES - 4.3% | |||||
| State Street Institutional U.S. Government Money Market Fund | 15,071,048 | 15,071,048 | |||
Total Investment Companies (Cost $15,071,048) |
15,071,048 | ||||
| TOTAL INVESTMENTS - 99.7% (Cost $274,660,820**) | 345,964,913 | ||||
| NET OTHER ASSETS AND LIABILITIES - 0.3% | 1,160,940 | ||||
| TOTAL NET ASSETS - 100.0% | $ | 347,125,853 | |||
| * | Non-income producing. |
| ** | Aggregate cost for Federal tax purposes was $276,357,865. |
| ADR | American Depositary Receipt. |
| PLC | Public Limited Company. |
Ultra Series Fund | December 31, 2012
Mid Cap Fund Portfolio of Investments
| Shares | Value (Note 2) | |||||
| COMMON STOCKS - 93.3% | ||||||
| Consumer Discretionary - 21.0% | ||||||
| Advance Auto Parts Inc. | 91,899 | $ | 6,648,893 | |||
| Bed Bath & Beyond Inc. * | 186,786 | 10,443,205 | ||||
| CarMax Inc. * | 298,482 | 11,205,014 | ||||
| Discovery Communications Inc., Class C * | 126,266 | 7,386,561 | ||||
| Liberty Global Inc., Series C * | 164,597 | 9,670,074 | ||||
| Omnicom Group Inc. | 227,693 | 11,375,542 | ||||
| Tiffany & Co. | 158,225 | 9,072,622 | ||||
| TJX Cos. Inc. | 285,782 | 12,131,446 | ||||
| 77,933,357 | ||||||
| Consumer Staples - 3.1% | ||||||
| Brown-Forman Corp., Class B | 53,198 | 3,364,773 | ||||
| McCormick & Co. Inc. | 128,511 | 8,164,304 | ||||
| 11,529,077 | ||||||
| Energy - 7.3% | ||||||
| Ensco PLC, Class A | 125,332 | 7,429,681 | ||||
| EOG Resources Inc. | 45,949 | 5,550,180 | ||||
| Noble Corp. | 172,962 | 6,022,537 | ||||
| World Fuel Services Corp. | 192,203 | 7,912,997 | ||||
| 26,915,395 | ||||||
| Financials - 23.1% | ||||||
| Arch Capital Group Ltd. * | 223,394 | 9,833,804 | ||||
| Brookfield Asset Management Inc., Class A | 408,688 | 14,978,415 | ||||
| Brown & Brown Inc. | 283,468 | 7,217,095 | ||||
| Glacier Bancorp Inc. | 369,276 | 5,432,050 | ||||
| Leucadia National Corp. | 363,038 | 8,636,674 | ||||
| M&T Bank Corp. | 99,109 | 9,759,263 | ||||
| Markel Corp. * | 39,038 | 16,919,850 | ||||
| WR Berkley Corp. | 337,337 | 12,731,099 | ||||
| 85,508,250 | ||||||
| Health Care - 8.1% | ||||||
| DENTSPLY International Inc. | 215,177 | 8,523,161 | ||||
| Laboratory Corp. of America Holdings * | 136,204 | 11,797,990 | ||||
| Techne Corp. | 140,314 | 9,589,059 | ||||
| 29,910,210 | ||||||
| Industrials - 19.6% | ||||||
| C.H. Robinson Worldwide Inc. | 206,960 | 13,084,011 | ||||
| Copart Inc. * | 504,136 | 14,872,012 | ||||
| Expeditors International of Washington Inc. | 240,205 | 9,500,108 | ||||
| IDEX Corp. | 175,615 | 8,171,366 | ||||
| Jacobs Engineering Group Inc. * | 182,189 | 7,755,786 | ||||
| Ritchie Bros Auctioneers Inc. | 412,237 | 8,611,631 | ||||
| Wabtec Corp. | 121,973 | 10,677,516 | ||||
| 72,672,430 | ||||||
| Shares | Value (Note 2) | |||||
| Information Technology - 4.1% | ||||||
| Amphenol Corp., Class A | 107,591 | $ | 66,961,138 | |||
| MICROS Systems Inc. * | 195,752 | 8,307,715 | ||||
| 15,268,853 | ||||||
| Materials - 7.0% | ||||||
| Crown Holdings Inc. * | 241,779 | 8,899,885 | ||||
| Ecolab Inc. | 125,183 | 9,000,658 | ||||
| Valspar Corp. | 125,518 | 7,832,323 | ||||
| 25,732,866 | ||||||
Total Common Stocks (Cost $263,047,742) |
345,470,438 | |||||
| INVESTMENT COMPANIES - 7.0% | ||||||
| State Street Institutional U.S. Government Money Market Fund | 26,049,776 | 26,049,776 | ||||
Total Investment Companies (Cost $26,049,776) |
26,049,776 | |||||
| TOTAL INVESTMENTS - 100.3% (Cost $289,097,518**) | 371,520,214 | |||||
| NET OTHER ASSETS AND LIABILITIES - (0.3%) | (1,059,207 | ) | ||||
| TOTAL NET ASSETS - 100.0% | $ | 370,461,007 | ||||
| * | Non-income producing. |
| ** | Aggregate cost for Federal tax purposes was $289,340,679. |
| PLC | Public Limited Company. |
Ultra Series Fund | December 31, 2012
Small Cap Fund Portfolio of Investments
| Shares | Value (Note 2) | ||||
| COMMON STOCKS - 97.0% | |||||
| Consumer Discretionary - 13.8% | |||||
| Arbitron Inc. | 7,040 | $ | 328,627 | ||
| Ascena Retail Group Inc. * | 10,720 | 198,213 | |||
| Cato Corp./The, Class A | 9,840 | 269,911 | |||
| CEC Entertainment Inc. | 6,020 | 199,804 | |||
| Choice Hotels International Inc. | 2,020 | 67,912 | |||
| Fred’s Inc., Class A | 11,800 | 157,058 | |||
| Helen of Troy Ltd. * | 7,110 | 237,403 | |||
| Matthews International Corp., Class A | 6,240 | 200,304 | |||
| Stage Stores Inc. | 7,910 | 196,010 | |||
| 1,855,242 | |||||
| Consumer Staples - 1.9% | |||||
| Casey’s General Stores Inc. | 3,080 | 163,548 | |||
| Post Holdings Inc. * | 2,800 | 95,900 | |||
| 259,448 | |||||
| Energy - 3.9% | |||||
| Bristow Group Inc. | 2,400 | 128,784 | |||
| Halcon Resources Corp. * | 7,341 | 50,800 | |||
| Penn Virginia Corp. | 5,070 | 22,358 | |||
| Scorpio Tankers Inc. * | 18,200 | 129,402 | |||
| SEACOR Holdings Inc. | 2,290 | 191,902 | |||
| 523,246 | |||||
| Financials - 19.6% | |||||
| AMERISAFE Inc. * | 5,370 | 146,332 | |||
| Ares Capital Corp. | 3,763 | 65,853 | |||
| Assured Guaranty Ltd. | 7,700 | 109,571 | |||
| Campus Crest Communities Inc., REIT | 11,400 | 139,764 | |||
| DiamondRock Hospitality Co., REIT | 12,529 | 112,761 | |||
| First Busey Corp. | 21,607 | 100,473 | |||
| First Midwest Bancorp Inc. | 16,230 | 203,200 | |||
| First Niagara Financial Group Inc. | 15,507 | 122,971 | |||
| Flushing Financial Corp. | 7,981 | 122,429 | |||
| Hancock Holding Co. | 3,500 | 111,090 | |||
| International Bancshares Corp. | 11,150 | 201,257 | |||
| Mack-Cali Realty Corp., REIT | 3,600 | 93,996 | |||
| MB Financial Inc. | 6,330 | 125,017 | |||
| Northwest Bancshares Inc. | 17,180 | 208,565 | |||
| Platinum Underwriters Holdings Ltd. | 3,660 | 168,360 | |||
| Primerica Inc. | 7,000 | 210,070 | |||
| Summit Hotel Properties Inc., REIT | 11,200 | 106,400 | |||
| Webster Financial Corp. | 11,080 | 227,694 | |||
| Westamerica Bancorporation | 1,170 | 49,830 | |||
| 2,625,633 | |||||
| Shares | Value (Note 2) | ||||
| Health Care - 10.8% | |||||
| Allscripts Healthcare Solutions Inc. * | 5,400 | $ | 50,868 | ||
| Amsurg Corp. * | 7,190 | 215,772 | |||
| Charles River Laboratories International Inc. * | 8,300 | 311,001 | |||
| Corvel Corp. * | 2,730 | 122,386 | |||
| Haemonetics Corp. * | 1,400 | 57,176 | |||
| ICON PLC, ADR * | 11,830 | 328,401 | |||
| ICU Medical Inc. * | 3,670 | 223,613 | |||
| STERIS Corp. | 4,000 | 138,920 | |||
| 1,448,137 | |||||
| Industrials - 27.3% | |||||
| Aerospace & Defense - 0.9% | |||||
| Cubic Corp. | 2,400 | 115,128 | |||
| Air Freight & Logistics - 1.7% | |||||
| Atlas Air Worldwide Holdings Inc. * | 2,900 | 128,499 | |||
| UTi Worldwide Inc. | 7,800 | 104,520 | |||
| 233,019 | |||||
| Commercial Services & Supplies - 6.2% | |||||
| ACCO Brands Corp. * | 25,840 | 189,665 | |||
| G&K Services Inc., Class A | 5,900 | 201,485 | |||
| McGrath RentCorp | 1,000 | 29,020 | |||
| Standard Parking Corp. * | 5,490 | 120,725 | |||
| United Stationers Inc. | 9,220 | 285,728 | |||
| 826,623 | |||||
| Construction & Engineering - 0.3% | |||||
| Sterling Construction Co. Inc. * | 3,390 | 33,697 | |||
| Electrical Equipment - 4.1% | |||||
| Acuity Brands Inc. | 1,810 | 122,591 | |||
| Belden Inc. | 9,430 | 424,256 | |||
| 546,847 | |||||
| Industrial Conglomerates - 3.8% | |||||
| Carlisle Cos. Inc. | 8,750 | 514,150 | |||
| Machinery - 5.7% | |||||
| Albany International Corp., Class A | 10,250 | 232,470 | |||
| ESCO Technologies Inc. | 5,790 | 216,604 | |||
| Mueller Industries Inc. | 6,300 | 315,189 | |||
| 764,263 | |||||
| Marine - 1.8% | |||||
| Kirby Corp. * | 3,930 | 243,228 | |||
| Road & Rail - 1.1% | |||||
| Genesee & Wyoming Inc., Class A * | 2,000 | 152,160 | |||
| Trading Companies & Distributors - 1.7% | |||||
| GATX Corp. | 5,370 | 232,521 | |||
Ultra Series Fund | December 31, 2012
Small Cap Fund Portfolio of Investments
| Shares | Value (Note 2) | |||||
| COMMON STOCKS (continued) | ||||||
| Information Technology - 7.9% | ||||||
| Coherent Inc. | 2,470 | $ | 125,031 | |||
| Diebold Inc. | 5,370 | 164,376 | ||||
| Forrester Research Inc. | 4,000 | 107,200 | ||||
| MAXIMUS Inc. | 3,480 | 220,006 | ||||
| MTS Systems Corp. | 3,730 | 189,969 | ||||
| Websense Inc. * | 6,500 | 97,760 | ||||
| Zebra Technologies Corp., Class A * | 4,000 | 157,120 | ||||
| 1,061,462 | ||||||
| Materials - 7.6% | ||||||
| Aptargroup Inc. | 3,720 | 177,518 | ||||
| Deltic Timber Corp. | 2,480 | 175,138 | ||||
| Greif Inc., Class A | 2,700 | 120,150 | ||||
| Innospec Inc. | 4,600 | 158,654 | ||||
| Koppers Holdings Inc. | 3,100 | 118,265 | ||||
| Sensient Technologies Corp. | 2,800 | 99,568 | ||||
| Zep Inc. | 11,740 | 169,526 | ||||
| 1,018,819 | ||||||
| Shares | Value (Note 2) | |||||
| Utilities - 4.2% | ||||||
| Atmos Energy Corp. | 4,250 | $ | 149,260 | |||
| New Jersey Resources Corp. | 1,470 | 58,241 | ||||
| UNS Energy Corp. | 3,140 | 133,199 | ||||
| Westar Energy Inc. | 4,190 | 119,918 | ||||
| WGL Holdings Inc. | 2,560 | 100,326 | ||||
| 560,944 | ||||||
Total Common Stocks (Cost $9,726,642) |
13,014,567 | |||||
| INVESTMENT COMPANIES - 3.7% | ||||||
| State Street Institutional U.S. Government Money Market Fund | 496,276 | 496,276 | ||||
Total Investment Companies (Cost $496,276) |
496,276 | |||||
| TOTAL INVESTMENTS - 100.7% (Cost $10,222,918**) | 13,510,843 | |||||
| NET OTHER ASSETS AND LIABILITIES - (0.7%) | (88,445 | ) | ||||
| TOTAL NET ASSETS - 100.0% | $ | 13,422,398 | ||||
| * | Non-income producing. |
| ** | Aggregate cost for Federal tax purposes was $10,324,427. |
| ADR | American Depository Receipt. |
| PLC | Public Limited Company. |
| REIT | Real Estate Investment Trust. |
Ultra Series Fund | December 31, 2012
International Stock Fund Portfolio of Investments
| Shares | Value (Note 2) | ||||
| COMMON STOCKS - 98.4% | |||||
| Australia - 2.5% | |||||
| James Hardie Industries PLC (A) | 156,266 | $ | 1,511,750 | ||
| Orica Ltd. (A) | 32,178 | 846,170 | |||
| 2,357,920 | |||||
| Belgium - 3.5% | |||||
| Anheuser-Busch InBev N.V. (A) | 37,741 | 3,298,134 | |||
| Brazil - 1.6% | |||||
| Anhanguera Educacional Participacoes S.A. (A) | 41,900 | 715,818 | |||
| Cielo S.A. (A) | 28,035 | 784,978 | |||
| 1,500,796 | |||||
| Canada - 2.8% | |||||
| MacDonald Dettwiler & Associates Ltd. | 2,600 | 146,271 | |||
| Potash Corp. of Saskatchewan Inc. | 27,200 | 1,106,923 | |||
| Rogers Communications Inc. | 30,700 | 1,393,799 | |||
| 2,646,993 | |||||
| Finland - 1.3% | |||||
| Sampo (A) | 37,795 | 1,222,154 | |||
| France - 9.8% | |||||
| BNP Paribas S.A. (A) | 31,917 | 1,799,070 | |||
| Cie Generale de Geophysique - Veritas (A) * | 32,979 | 993,941 | |||
| Rexel S.A. (A) | 52,783 | 1,078,551 | |||
| Sanofi S.A. (A) | 32,571 | 3,088,878 | |||
| Technip S.A. (A) | 10,646 | 1,225,666 | |||
| Valeo S.A. (A) | 21,801 | 1,105,450 | |||
| 9,291,556 | |||||
| Germany - 9.8% | |||||
| Bayer AG (A) | 22,801 | 2,165,241 | |||
| Bayerische Motoren Werke AG (A) | 14,718 | 1,419,433 | |||
| Merck KGaA (A) | 15,289 | 2,017,199 | |||
| RWE AG (A) | 29,001 | 1,197,240 | |||
| SAP AG (A) | 21,745 | 1,741,916 | |||
| ThyssenKrupp AG (A) | 35,281 | 828,972 | |||
| 9,370,001 | |||||
| Indonesia - 0.8% | |||||
| Bank Mandiri Persero Tbk PT, ADR | 93,300 | 782,227 | |||
| Ireland - 0.8% | |||||
| Ryanair Holdings PLC, ADR | 21,900 | 750,732 | |||
| Italy - 2.9% | |||||
| Atlantia SpA (A) | 67,122 | 1,217,393 | |||
| Eni SpA (A) | 64,298 | 1,586,202 | |||
| 2,803,595 | |||||
| Japan - 15.3% | |||||
| Asics Corp. (A) | 87,090 | 1,326,803 | |||
| Canon Inc. (A) | 27,900 | 1,094,298 | |||
| Shares | Value (Note 2) | ||||
| Daikin Industries Ltd. (A) | 33,300 | $ | 1,144,203 | ||
| Daito Trust Construction Co. Ltd. (A) | 16,310 | 1,534,807 | |||
| Don Quijote Co. Ltd. (A) | 38,000 | 1,392,114 | |||
| FANUC Corp. (A) | 4,400 | 818,241 | |||
| Komatsu Ltd. (A) | 47,500 | 1,215,500 | |||
| LIXIL Group Corp. (A) | 66,000 | 1,469,749 | |||
| Seven & I Holdings Co. Ltd. (A) | 37,200 | 1,046,992 | |||
| Softbank Corp. (A) | 21,200 | 775,745 | |||
| Sumitomo Mitsui Financial Group Inc. (A) | 53,700 | 1,950,868 | |||
| Yahoo! Japan Corp. (A) | 2,521 | 815,970 | |||
| 14,585,290 | |||||
| Mexico - 0.9% | |||||
| Genomma Lab Internacional S.A.B. de C.V. * | 416,700 | 856,204 | |||
| Netherlands - 2.0% | |||||
| ING Groep N.V. (A) * | 196,350 | 1,877,635 | |||
| New Zealand - 0.7% | |||||
| Telecom Corp. of New Zealand Ltd. (A) | 352,716 | 667,033 | |||
| Philippines - 0.6% | |||||
| BDO Unibank Inc. (A) * | 301,150 | 535,027 | |||
| Russia - 1.5% | |||||
| Sberbank of Russia (A) | 459,600 | 1,419,872 | |||
| South Africa - 1.1% | |||||
| Mediclinic International Ltd. (A) | 158,599 | 1,026,517 | |||
| South Korea - 2.5% | |||||
| Hyundai Mobis (A) | 4,232 | 1,147,831 | |||
| Samsung Electronics Co. Ltd., GDR (A) | 1,779 | 1,264,343 | |||
| 2,412,174 | |||||
| Spain - 2.4% | |||||
| Mediaset Espana Comunicacion S.A. (A) | 177,783 | 1,224,209 | |||
| Red Electrica Corp. S.A. (A) | 22,173 | 1,095,514 | |||
| 2,319,723 | |||||
| Sweden - 5.4% | |||||
| Assa Abloy AB (A) | 40,239 | 1,515,218 | |||
| Getinge AB (A) | 30,603 | 1,036,711 | |||
| Sandvik AB (A) | 87,345 | 1,403,855 | |||
| Swedbank AB (A) | 59,766 | 1,176,099 | |||
| 5,131,883 | |||||
| Switzerland - 4.6% | |||||
| Novartis AG (A) | 52,425 | 3,319,106 | |||
| Swatch Group AG/The (A) | 1,965 | 1,011,257 | |||
| 4,330,363 | |||||
| Thailand - 1.0% | |||||
| Krung Thai Bank PCL | 1,524,000 | 996,404 | |||
Ultra Series Fund | December 31, 2012
International Stock Fund Portfolio of Investments
| Shares | Value (Note 2) | |||||
| COMMON STOCKS (continued) | ||||||
| Turkey - 1.6% | ||||||
| KOC Holding AS (A) | 114,302 | $ | 594,655 | |||
| Turkcell Iletisim Hizmetleri AS (A) * | 149,050 | 964,351 | ||||
| 1,559,006 | ||||||
| United Kingdom - 23.0% | ||||||
| BG Group PLC (A) | 47,335 | 793,726 | ||||
| BHP Billiton PLC (A) | 77,044 | 2,707,288 | ||||
| British American Tobacco PLC (A) | 37,033 | 1,876,463 | ||||
| Direct Line Insurance Group PLC (A) * | 268,768 | 939,895 | ||||
| Informa PLC (A) | 265,979 | 1,967,701 | ||||
| Petrofac Ltd. (A) | 31,391 | 850,471 | ||||
| Prudential PLC (A) | 133,057 | 1,856,582 | ||||
| Reed Elsevier PLC (A) | 105,680 | 1,109,629 | ||||
| Rexam PLC (A) | 295,403 | 2,075,835 | ||||
| Royal Dutch Shell PLC (A) | 72,881 | 2,575,216 | ||||
| Signet Jewelers Ltd. (A) | 11,682 | 616,058 | ||||
| Standard Chartered PLC (A) | 64,810 | 1,642,847 | ||||
| Unilever PLC (A) | 75,610 | 2,869,991 | ||||
| 21,881,702 | ||||||
Total Common Stocks (Cost $75,337,507) |
93,622,941 | |||||
| INVESTMENT COMPANIES - 1.7% | ||||||
| State Street Institutional U.S. Government Money Market Fund | 1,655,652 | 1,655,652 | ||||
Total Investment Companies (Cost $1,655,652) |
1,655,652 | |||||
| TOTAL INVESTMENTS - 100.1% (Cost $76,993,159**) | 95,278,593 | |||||
| NET OTHER ASSETS AND LIABILITIES - (0.1%) | (96,488 | ) | ||||
| TOTAL NET ASSETS - 100.0% | $ | 95,182,105 | ||||
| * | Non-income producing. |
| ** | Aggregate cost for Federal tax purposes was $77,447,915. |
| (A) | Due to events that occurred between the close of the exchange on which this security is traded and that of the New York Stock Exchange, fair value was determined for this security using methods determined in good faith by or at the discretion of the Board of Trustees (see Note 2). |
| ADR | American Depositary Receipt. |
| GDR | Global Depositary Receipt. |
| PLC | Public Limited Company. |
| OTHER INFORMATION: | % of Net | ||
| Sector Concentration | Assets | ||
| Consumer Discretionary | 14 | % | |
| Consumer Staples | 10 | % | |
| Energy | 8 | % | |
| Financials | 19 | % | |
| Health Care | 14 | % | |
| Industrials | 12 | % | |
| Information Technology | 6 | % | |
| Materials | 9 | % | |
| Money Market Funds | 2 | % | |
| Telecommunication Services | 4 | % | |
| Utilities | 2 | % | |
| Net Other Assets and Liabilities | – | ||
| 100 | % | ||
Ultra Series Fund | December 31, 2012
Madison Target Retirement 2020 Fund Portfolio of Investments
| Shares | Value (Note 2) | ||||
| INVESTMENT COMPANIES - 97.9% | |||||
| Bond Funds - 52.0% | |||||
| Baird Aggregate Bond Fund | 369,017 | $ | 4,018,593 | ||
| DoubleLine Total Return Bond Fund Class I | 216,058 | 2,447,935 | |||
| Franklin Floating Rate Daily Access Fund Advisor Class | 575,643 | 5,255,616 | |||
| iShares Barclays 20+ Year Treasury Bond Fund ETF | 5,751 | 696,906 | |||
| iShares Barclays TIPS Bond Fund ETF | 713 | 86,565 | |||
| Metropolitan West High Yield Bond Fund Class I | 63,929 | 666,136 | |||
| Metropolitan West Total Return Bond Fund Class I | 404,091 | 4,400,547 | |||
| PIMCO Investment Grade Corporate Bond Fund Institutional Class | 180,033 | 2,001,963 | |||
| PIMCO Total Return Fund Institutional Class | 196,584 | 2,209,609 | |||
| Vanguard Total Bond Market ETF | 91,350 | 7,676,141 | |||
| 29,460,011 | |||||
| Foreign Bond Funds - 2.8% | |||||
| TCW Emerging Markets Income Fund Class I | 167,032 | 1,556,737 | |||
| Foreign Stock Funds - 8.6% | |||||
| iShares MSCI EAFE Index Fund ETF | 5,024 | 285,464 | |||
| IVA Worldwide Fund Class I | 83,219 | 1,323,184 | |||
| Market Vectors Agribusiness ETF | 5,386 | 284,165 | |||
| Vanguard FTSE All-World ex-US ETF | 49,577 | 2,268,148 | |||
| WisdomTree Japan Hedged Equity Fund ETF | 19,392 | 715,177 | |||
| 4,876,138 | |||||
| Shares | Value (Note 2) | ||||
| Money Market Funds - 0.8% | |||||
| State Street Institutional U.S. Government Money Market Fund | 447,082 | $ | 447,082 | ||
| Stock Funds - 33.7% | |||||
| iShares Core S&P Mid-Cap ETF | 19,762 | 2,009,795 | |||
| iShares S&P 100 Index Fund ETF | 41,765 | 2,701,360 | |||
| iShares S&P Global Energy Sector Index Fund ETF | 10,408 | 398,106 | |||
| Schwab Fundamental U.S. Large Company Index Fund | 360,026 | 3,866,676 | |||
| SPDR S&P 500 ETF Trust | 30,702 | 4,375,649 | |||
| Vanguard Dividend Appreciation ETF | 61,150 | 3,642,706 | |||
| Vanguard Health Care ETF | 12,887 | 923,611 | |||
| Vanguard Information Technology ETF | 16,570 | 1,145,153 | |||
| 19,063,056 | |||||
| TOTAL INVESTMENTS - 97.9% (Cost $52,904,034**) | 55,403,024 | ||||
| NET OTHER ASSETS AND LIABILITIES - 2.1% | 1,204,266 | ||||
| TOTAL NET ASSETS - 100.0% | $ | 56,607,290 | |||
| ** | Aggregate cost for Federal tax purposes was $53,405,823. |
| ETF | Exchange Traded Fund. |
Ultra Series Fund | December 31, 2012
Madison Target Retirement 2030 Fund Portfolio of Investments
| Shares | Value (Note 2) | ||||
| INVESTMENT COMPANIES - 100.0% | |||||
| Bond Funds - 35.6% | |||||
| Baird Aggregate Bond Fund | 339,027 | $ | 3,691,999 | ||
| DoubleLine Total Return Bond Fund Class I | 217,762 | 2,467,239 | |||
| Franklin Floating Rate Daily Access Fund Advisor Class | 609,190 | 5,561,909 | |||
| iShares Barclays 20+ Year Treasury Bond Fund ETF | 6,862 | 831,537 | |||
| iShares Barclays TIPS Bond Fund ETF | 840 | 101,984 | |||
| Metropolitan West High Yield Bond Fund Class I | 46,448 | 483,993 | |||
| Metropolitan West Total Return Bond Fund Class I | 396,481 | 4,317,676 | |||
| PIMCO Investment Grade Corporate Bond Fund Institutional Class | 148,966 | 1,656,507 | |||
| PIMCO Total Return Fund Institutional Class | 160,021 | 1,798,641 | |||
| Vanguard Total Bond Market ETF | 39,541 | 3,322,630 | |||
| 24,234,115 | |||||
| Foreign Bond Funds - 2.7% | |||||
| TCW Emerging Markets Income Fund Class I | 197,875 | 1,844,199 | |||
| Foreign Stock Funds - 11.8% | |||||
| iShares MSCI EAFE Index Fund ETF | 5,952 | 338,193 | |||
| IVA Worldwide Fund Class I | 126,932 | 2,018,213 | |||
| Market Vectors Agribusiness ETF | 6,492 | 342,518 | |||
| Vanguard FTSE All-World ex-US ETF | 93,601 | 4,282,246 | |||
| WisdomTree Japan Hedged Equity Fund ETF | 27,688 | 1,021,133 | |||
| 8,002,303 | |||||
| Shares | Value (Note 2) | ||||
| Money Market Funds - 1.4% | |||||
| State Street Institutional U.S. Government Money Market Fund | 938,288 | $ | 938,288 | ||
| Stock Funds - 48.5% | |||||
| iShares Core S&P Mid-Cap ETF | 34,606 | 3,519,430 | |||
| iShares S&P 100 Index Fund ETF | 81,641 | 5,280,540 | |||
| iShares S&P Global Energy Sector Index Fund ETF | 21,335 | 816,064 | |||
| Schwab Fundamental U.S. Large Company Index Fund | 651,338 | 6,995,374 | |||
| SPDR S&P 500 ETF Trust | 56,307 | 8,024,874 | |||
| Vanguard Dividend Appreciation ETF | 82,516 | 4,915,478 | |||
| Vanguard Health Care ETF | 20,439 | 1,464,863 | |||
| Vanguard Information Technology ETF | 28,210 | 1,949,593 | |||
| 32,966,216 | |||||
| TOTAL INVESTMENTS - 100.0% (Cost $64,617,960**) | 67,985,121 | ||||
| NET OTHER ASSETS AND LIABILITIES - 0.0% | 24,346 | ||||
| TOTAL NET ASSETS - 100.0% | $ | 68,009,467 | |||
| ** | Aggregate cost for Federal tax purposes was $65,295,958. |
| ETF | Exchange Traded Fund. |
Ultra Series Fund | December 31, 2012
Madison Target Retirement 2040 Fund Portfolio of Investments
| Shares | Value (Note 2) | ||||
| INVESTMENT COMPANIES - 99.8% | |||||
| Bond Funds - 25.4% | |||||
| Baird Aggregate Bond Fund | 181,074 | $ | 1,971,892 | ||
| DoubleLine Total Return Bond Fund Class I | 134,557 | 1,524,527 | |||
| Franklin Floating Rate Daily Access Fund Advisor Class | 376,239 | 3,435,065 | |||
| iShares Barclays 20+ Year Treasury Bond Fund ETF | 4,957 | 600,689 | |||
| iShares Barclays TIPS Bond Fund ETF | 605 | 73,453 | |||
| Metropolitan West Total Return Bond Fund Class I | 219,530 | 2,390,684 | |||
| PIMCO Investment Grade Corporate Bond Fund Institutional Class | 70,097 | 779,481 | |||
| PIMCO Total Return Fund Institutional Class | 61,532 | 691,618 | |||
| Vanguard Total Bond Market ETF | 12,404 | 1,042,308 | |||
| 12,509,717 | |||||
| Foreign Bond Funds - 1.9% | |||||
| TCW Emerging Markets Income Fund Class I | 104,262 | 971,725 | |||
| Foreign Stock Funds - 15.3% | |||||
| iShares MSCI EAFE Index Fund ETF | 5,156 | 292,964 | |||
| IVA Worldwide Fund Class I | 122,882 | 1,953,817 | |||
| Market Vectors Agribusiness ETF | 5,597 | 295,298 | |||
| Market Vectors Gold Miners ETF | 5,314 | 246,516 | |||
| Vanguard FTSE All-World ex-US ETF | 83,149 | 3,804,067 | |||
| WisdomTree Japan Hedged Equity Fund ETF | 25,300 | 933,064 | |||
| 7,525,726 | |||||
| Shares | Value (Note 2) | ||||
| Money Market Funds - 1.4% | |||||
| State Street Institutional U.S. Government Money Market Fund | 666,826 | $ | 666,826 | ||
| Stock Funds - 55.8% | |||||
| iShares Core S&P Mid-Cap ETF | 31,868 | 3,240,976 | |||
| iShares S&P 100 Index Fund ETF | 70,011 | 4,528,312 | |||
| iShares S&P Global Energy Sector Index Fund ETF | 19,525 | 746,831 | |||
| Schwab Fundamental U.S. Large Company Index Fund | 540,235 | 5,802,124 | |||
| SPDR S&P 500 ETF Trust | 46,672 | 6,651,693 | |||
| Vanguard Dividend Appreciation ETF | 62,557 | 3,726,521 | |||
| Vanguard Health Care ETF | 17,087 | 1,224,625 | |||
| Vanguard Information Technology ETF | 22,776 | 1,574,049 | |||
| 27,495,131 | |||||
| TOTAL INVESTMENTS - 99.8% (Cost $46,606,039**) | 49,169,125 | ||||
| NET OTHER ASSETS AND LIABILITIES - 0.2% | 99,505 | ||||
| TOTAL NET ASSETS - 100.0% | $ | 49,268,630 | |||
| ** | Aggregate cost for Federal tax purposes was $47,149,568. |
| ETF | Exchange Traded Fund. |
Ultra Series Fund | December 31, 2012
Madison Target Retirement 2050 Fund Portfolio of Investments
| Shares | Value (Note 2) | ||||
| INVESTMENT COMPANIES - 99.8% | |||||
| Bond Funds - 15.3% | |||||
| Baird Aggregate Bond Fund | 12,244 | $ | 133,336 | ||
| DoubleLine Total Return Bond Fund Class I | 12,736 | 144,293 | |||
| Franklin Floating Rate Daily Access Fund Advisor Class | 39,757 | 362,978 | |||
| iShares Barclays 20+ Year Treasury Bond Fund ETF | 728 | 88,219 | |||
| Metropolitan West Total Return Bond Fund Class I | 17,891 | 194,831 | |||
| PIMCO Investment Grade Corporate Bond Fund Institutional Class | 4,065 | 45,205 | |||
| Vanguard Total Bond Market ETF | 1,491 | 125,289 | |||
| 1,094,151 | |||||
| Foreign Bond Funds - 1.5% | |||||
| TCW Emerging Markets Income Fund Class I | 11,336 | 105,652 | |||
| Foreign Stock Funds - 18.4% | |||||
| iShares MSCI EAFE Index Fund ETF | 744 | 42,274 | |||
| IVA Worldwide Fund Class I | 22,288 | 354,383 | |||
| Market Vectors Agribusiness ETF | 1,348 | 71,121 | |||
| Market Vectors Gold Miners ETF | 770 | 35,720 | |||
| Vanguard FTSE All-World ex-U.S. ETF | 12,075 | 552,431 | |||
| WisdomTree Japan Hedged Equity Fund ETF | 7,176 | 264,651 | |||
| 1,320,580 | |||||
| Shares | Value (Note 2) | ||||
| Money Market Funds - 1.8% | |||||
| State Street Institutional U.S. Government Money Market Fund | 131,941 | $ | 131,941 | ||
| Stock Funds - 62.8% | |||||
| iShares Core S&P Mid-Cap ETF | 5,096 | 518,263 | |||
| iShares Core S&P Small-Cap ETF | 768 | 60,065 | |||
| iShares S&P 100 Index Fund ETF | 10,359 | 670,020 | |||
| iShares S&P Global Energy Sector Index Fund ETF | 3,700 | 141,525 | |||
| Schwab Fundamental U.S. Large Company Index Fund | 102,037 | 1,095,881 | |||
| SPDR S&P 500 ETF Trust | 6,723 | 958,162 | |||
| Vanguard Dividend Appreciation ETF | 10,840 | 645,739 | |||
| Vanguard Health Care ETF | 2,338 | 167,565 | |||
| Vanguard Information Technology ETF | 3,453 | 238,637 | |||
| 4,495,857 | |||||
| TOTAL INVESTMENTS - 99.8% (Cost $6,831,788**) | 7,148,181 | ||||
| NET OTHER ASSETS AND LIABILITIES - 0.2% | 11,901 | ||||
| TOTAL NET ASSETS - 100.0% | $ | 7,160,082 | |||
| ** | Aggregate cost for Federal tax purposes was $6,904,344. |
| ETF | Exchange Traded Fund. |
Ultra Series Fund | December 31, 2012
Statements of Assets and Liabilities as of December 31, 2012
| Conservative | Moderate | Aggressive | Money | |||||||||
| Allocation | Allocation | Allocation | Market | |||||||||
| Fund | Fund | Fund | Fund | |||||||||
| Assets: | ||||||||||||
| Investments in securities, at cost | ||||||||||||
Unaffiliated issuers |
$118,362,775 | $177,195,734 | $68,291,152 | $50,111,524 | ||||||||
Affiliated issuers1 |
104,001,413 | 174,129,144 | 59,390,755 | – | ||||||||
| Net unrealized appreciation | ||||||||||||
Unaffiliated issuers |
2,763,309 | 5,871,645 | 2,351,251 | – | ||||||||
Affiliated issuers1 |
12,826,780 | 33,098,953 | 14,389,198 | – | ||||||||
Total investments at value |
237,954,277 | 390,295,476 | 144,422,356 | 50,111,524 | ||||||||
| Foreign currency (cost of $185,201)(Note 2) | – | – | – | – | ||||||||
| Receivables: | ||||||||||||
Investments sold |
120,911 | 4,870,131 | 976,622 | – | ||||||||
Fund shares sold |
135,945 | 463,231 | 290,729 | 82,196 | ||||||||
Dividends and interest |
2,648,259 | 4,844,792 | 1,920,871 | 193,595 | ||||||||
Due from Adviser |
– | – | – | 13,379 | ||||||||
| Other assets | – | – | – | – | ||||||||
Total assets |
240,859,392 | 400,473,630 | 147,610,578 | 50,400,694 | ||||||||
| Liabilities: | ||||||||||||
| Payables: | ||||||||||||
Investments purchased |
2,495,564 | 7,152,657 | 2,887,690 | – | ||||||||
Fund shares repurchased |
65,340 | 134,349 | 2,456 | 55,151 | ||||||||
Auditor fees |
12,471 | 21,081 | 7,991 | 2,841 | ||||||||
Management fees |
60,336 | 99,753 | 36,610 | 18,722 | ||||||||
Distribution fees – Class II |
9,058 | 7,315 | 412 | 303 | ||||||||
| Accrued expenses and other payables | 16 | 2 | – | – | ||||||||
Total liabilities |
2,642,785 | 7,415,157 | 2,935,159 | 77,017 | ||||||||
| Net assets applicable to outstanding capital stock | $238,216,607 | $393,058,473 | $144,675,419 | $50,323,677 | ||||||||
| Net assets consist of: | ||||||||||||
Paid-in capital |
$227,033,525 | $398,191,534 | $143,020,596 | $50,323,677 | ||||||||
Accumulated undistributed net investment income |
– | – | – | – | ||||||||
Accumulated net realized loss on investments sold and foreign currency related |
||||||||||||
transactions |
(4,407,007 | ) | (44,103,659 | ) | (15,085,626 | ) | – | |||||
Net unrealized appreciation of investments (including appreciation of foreign |
||||||||||||
currency related transactions) |
15,590,089 | 38,970,598 | 16,740,449 | – | ||||||||
| Net Assets | $238,216,607 | $393,058,473 | $144,675,419 | $50,323,677 | ||||||||
| Class I Shares: | ||||||||||||
Net Assets |
$195,525,680 | $358,485,606 | $142,754,683 | $48,647,940 | ||||||||
Shares of beneficial interest outstanding |
18,705,307 | 35,475,778 | 14,634,543 | 48,647,940 | ||||||||
Net Asset Value and redemption price per share |
$10.45 | $10.11 | $9.75 | $1.00 | ||||||||
| Class II Shares: | ||||||||||||
Net Assets |
$42,690,927 | $34,572,867 | $1,920,736 | $1,675,737 | ||||||||
Shares of beneficial interest outstanding |
4,092,439 | 3,429,909 | 197,521 | 1,675,737 | ||||||||
Net Asset Value and redemption price per share |
$10.43 | $10.08 | $9.72 | $1.00 | ||||||||
1 See Note 10 for information on affiliated issuers.
See accompanying Notes to Financial Statements.
64
Ultra Series Fund | December 31, 2012
Statements of Assets and Liabilities as of December 31, 2012
| High | Diversified | Large Cap | Large Cap | |||||||||||
| Bond | Income | Income | Value | Growth | Mid Cap | Small Cap | International | |||||||
| Fund | Fund | Fund | Fund | Fund | Fund | Fund | Stock Fund | |||||||
| $353,513,467 | $63,119,017 | $337,039,351 | $419,444,600 | $274,660,820 | $289,097,518 | $10,222,918 | $76,993,159 | |||||||
| – | – | – | – | – | – | – | – | |||||||
| 33,283,501 | 3,103,784 | 55,546,546 | 81,872,571 | 71,304,093 | 82,422,696 | 3,287,925 | 18,285,434 | |||||||
| – | – | – | – | – | – | – | – | |||||||
| 386,796,968 | 66,222,801 | 392,585,897 | 501,317,171 | 345,964,913 | 371,520,214 | 13,510,843 | 95,278,593 | |||||||
| – | – | – | – | – | – | – | 185,567 | |||||||
| – | – | – | 4,137,872 | 2,024,186 | 1,757,905 | – | – | |||||||
| 611,992 | 13,836 | 86,739 | 114,253 | 97,313 | 123,156 | 191 | 35,551 | |||||||
| 3,047,855 | 1,051,342 | 1,749,928 | 515,769 | 147,851 | 119,606 | 6,424 | 58,226 | |||||||
| – | – | – | – | – | – | – | – | |||||||
| – | – | – | – | 4,285 | – | – | 133,211 | |||||||
| 390,456,815 | 67,287,979 | 394,422,564 | 506,085,065 | 348,238,548 | 373,520,881 | 13,517,458 | 95,691,148 | |||||||
| – | – | – | 3,398,326 | – | 2,063,735 | 77,673 | 239,999 | |||||||
| 450,252 | 139,143 | 227,471 | 1,933,656 | 845,518 | 690,065 | 4,098 | 154,160 | |||||||
| 22,894 | 5,146 | 21,994 | 25,231 | 19,257 | 18,910 | 685 | 5,409 | |||||||
| 182,280 | 42,669 | 235,203 | 257,479 | 241,733 | 284,209 | 12,297 | 96,027 | |||||||
| 10,465 | 1,420 | 7,407 | 1,246 | 6,187 | 2,955 | 307 | 3,823 | |||||||
| – | – | – | – | – | – | – | 9,625 | |||||||
| 665,891 | 188,378 | 492,075 | 5,615,938 | 1,112,695 | 3,059,874 | 95,060 | 509,043 | |||||||
| $389,790,924 | $67,099,601 | $393,930,489 | $500,469,127 | $347,125,853 | $370,461,007 | $13,422,398 | $95,182,105 | |||||||
| $368,713,364 | $72,302,752 | $363,916,417 | $491,526,158 | $289,028,728 | $349,634,957 | $11,152,204 | $111,826,657 | |||||||
| 215,795 | 206,043 | 215,755 | 210,348 | 51,752 | 22,758 | – | 14,030 | |||||||
| (12,421,736 | ) | (8,512,978 | ) | (25,748,229 | ) | (73,139,950 | ) | (13,258,720 | ) | (61,619,404 | ) | (1,017,731 | ) | (34,944,499) |
| 33,283,501 | 3,103,784 | 55,546,546 | 81,872,571 | 71,304,093 | 82,422,696 | 3,287,925 | 18,285,917 | |||||||
| $389,790,924 | $67,099,601 | $393,930,489 | $500,469,127 | $347,125,853 | $370,461,007 | $13,422,398 | $95,182,105 | |||||||
| $340,335,203 | $60,362,209 | $359,022,419 | $494,587,388 | $318,024,367 | $356,534,317 | $11,936,476 | $76,919,053 | |||||||
| 32,251,636 | 6,444,757 | 19,626,542 | 18,235,984 | 13,200,004 | 20,861,534 | 968,498 | 7,135,995 | |||||||
| $10.55 | $9.37 | $18.29 | $27.12 | $24.09 | $17.09 | $12.32 | $10.78 | |||||||
| $49,455,721 | $6,737,392 | $34,908,070 | $5,881,739 | $29,101,486 | $13,926,690 | $1,485,922 | $18,263,052 | |||||||
| 4,691,955 | 718,806 | 1,911,452 | 217,446 | 1,211,637 | 817,023 | 120,953 | 1,697,354 | |||||||
| $10.54 | $9.37 | $18.26 | $27.05 | $24.02 | $17.05 | $12.29 | $10.76 | |||||||
See accompanying Notes to Financial Statements.
65
Ultra Series Fund | December 31, 2012
Statements of Assets and Liabilities as of December 31, 2012
| Madison | Madison | Madison | Madison | |||||
| Target | Target | Target | Target | |||||
| Retirement | Retirement | Retirement | Retirement | |||||
| 2020 Fund | 2030 Fund | 2040 Fund | 2050 Fund | |||||
| Assets: | ||||||||
| Investments in securities, at cost | ||||||||
Unaffiliated issuers |
$52,904,034 | $64,617,960 | $46,606,039 | $6,831,788 | ||||
| Net unrealized appreciation | ||||||||
Unaffiliated issuers |
2,498,990 | 3,367,161 | 2,563,086 | 316,393 | ||||
Total investments at value |
55,403,024 | 67,985,121 | 49,169,125 | 7,148,181 | ||||
| Cash | 38,953 | 18,839 | 5,763 | 672 | ||||
| Receivables: | ||||||||
Investments sold |
2,154,968 | 701,789 | 611,902 | 103,401 | ||||
Fund shares sold |
128,369 | 194,823 | 206,868 | 69,241 | ||||
Dividends and interest |
170,958 | 192,513 | 118,249 | 12,653 | ||||
Total assets |
57,896,272 | 69,093,085 | 50,111,907 | 7,334,148 | ||||
| Liabilities: | ||||||||
| Payables: | ||||||||
Investments purchased |
1,274,537 | 1,034,496 | 822,729 | 167,143 | ||||
Fund shares repurchased |
195 | 32,134 | 8,283 | 5,197 | ||||
Management fees |
11,873 | 14,155 | 10,220 | 1,438 | ||||
Service agreement fees |
2,377 | 2,833 | 2,045 | 288 | ||||
Total liabilities |
1,288,982 | 1,083,618 | 843,277 | 174,066 | ||||
| Net assets applicable to outstanding capital stock | $56,607,290 | $68,009,467 | $49,268,630 | $7,160,082 | ||||
| Net assets consist of: | ||||||||
Paid-in capital |
$54,484,227 | $65,239,542 | $47,180,500 | $6,908,840 | ||||
Accumulated undistributed net investment income |
– | – | – | – | ||||
Accumulated net realized loss on investments sold and foreign currency related |
||||||||
transactions |
(375,927 | ) | (597,236 | ) | (474,956 | ) | (65,151) | |
Net unrealized appreciation of investments (including appreciation of foreign |
||||||||
currency related transactions) |
2,498,990 | 3,367,161 | 2,563,086 | 316,393 | ||||
| Net Assets | $56,607,290 | $68,009,467 | $49,268,630 | $7,160,082 | ||||
| Class I Shares: | ||||||||
Net Assets |
$56,607,290 | $68,009,467 | $49,268,630 | $7,160,082 | ||||
Shares of beneficial interest outstanding |
6,810,862 | 8,462,795 | 6,476,739 | 670,081 | ||||
Net Asset Value and redemption price per share |
$8.31 | $8.04 | $7.61 | $10.69 | ||||
See accompanying Notes to Financial Statements.
66
Ultra Series Fund | December 31, 2012
Statements of Operations for the Period Ended December 31, 2012
| Conservative | Moderate | Aggressive | Money | |||||
| Allocation | Allocation | Allocation | Market | |||||
| Fund | Fund | Fund | Fund | |||||
| Investment Income: | ||||||||
Interest |
$503 | $719 | $395 | $59,193 | ||||
Dividends |
||||||||
Unaffiliated issuers |
4,303,920 | 5,895,764 | 1,755,094 | – | ||||
Affiliated issuers1 |
2,944,763 | 4,454,779 | 1,231,850 | – | ||||
Less: Foreign taxes withheld |
– | – | – | – | ||||
Total investment income |
7,249,186 | 10,351,262 | 2,987,339 | 59,193 | ||||
| Expenses: | ||||||||
Management fees |
703,713 | 1,181,297 | 424,625 | 246,548 | ||||
Audit fees |
21,471 | 36,081 | 12,991 | 4,841 | ||||
Trustees’ fees |
11,516 | 19,458 | 6,913 | 2,941 | ||||
Distribution fees – Class II |
107,863 | 89,493 | 4,762 | 2,248 | ||||
Other expenses |
– | 269 | 215 | 12 | ||||
Total expenses before reimbursement/waiver |
844,563 | 1,326,598 | 449,506 | 256,590 | ||||
Less reimbursement/waiver2 |
– | – | – | (197,397) | ||||
Total expenses net of reimbursement/waiver |
844,563 | 1,326,598 | 449,506 | 59,193 | ||||
| Net Investment Income | 6,404,623 | 9,024,664 | 2,537,833 | – | ||||
| Net Realized and Unrealized Gain (Loss) on Investments | ||||||||
Net realized gain (loss) on investments (including net realized gain (loss) on foreign |
||||||||
currency related transactions)3 |
||||||||
Unaffiliated issuers |
(651,093 | ) | 2,753,203 | 602,131 | – | |||
Affiliated issuers1 |
3,265,237 | 3,497,666 | 2,891,351 | – | ||||
Capital gain distributions received from underlying funds |
||||||||
Unaffiliated issuers |
1,513,238 | 1,490,305 | 362,318 | – | ||||
Affiliated issuers1 |
1,827,008 | 3,216,468 | 1,324,017 | – | ||||
Net change in unrealized appreciation (depreciation) on investments (including net |
||||||||
unrealized appreciation (depreciation) on foreign currency related transactions)4 |
||||||||
Unaffiliated issuers |
6,387,515 | 8,358,573 | 3,363,010 | – | ||||
Affiliated issuers1 |
1,232,500 | 10,811,706 | 3,985,407 | – | ||||
| Net Realized and Unrealized Gain on Investments | 13,574,405 | 30,127,921 | 12,528,234 | – | ||||
| Net Increase in Net Assets from Operations | $19,979,028 | $39,152,585 | $15,066,067 | $– | ||||
| 1 | See Note 10 for information on affiliated issuers. |
| 2 | Waiver includes management fees of $195,149, and distribution fees of $2,248, for the Money Market Fund. |
| 3 | Includes foreign capital gains taxes paid of $16,623 for the International Stock Fund. |
| 4 | Net of change in deferred foreign capital gains taxes of $9,625 for the International Stock Fund. |
See accompanying Notes to Financial Statements.
67
Ultra Series Fund | December 31, 2012
Statements of Operations for the Period Ended December 31, 2012
| High | Diversified | Large Cap | ||||||||||
| Bond | Income | Income | Value | |||||||||
| Fund | Fund | Fund | Fund | |||||||||
| Investment Income: | ||||||||||||
Interest |
$15,310,482 | $6,145,623 | $6,638,082 | $ 5,807 | ||||||||
Dividends |
||||||||||||
Unaffiliated issuers |
– | 17,438 | 7,115,032 | 13,745,217 | ||||||||
Affiliated issuers1 |
– | – | – | – | ||||||||
Less: Foreign taxes withheld |
– | – | (33,689 | ) | (94,811 | ) | ||||||
Total investment income |
15,310,482 | 6,163,061 | 13,719,425 | 13,656,213 | ||||||||
| Expenses: | ||||||||||||
Management fees |
2,278,703 | 654,589 | 2,822,232 | 3,079,980 | ||||||||
Audit fees |
37,894 | 8,146 | 36,994 | 47,433 | ||||||||
Trustees’ fees |
20,960 | 4,544 | 19,947 | 25,119 | ||||||||
Distribution fees – Class II |
123,329 | 16,179 | 82,765 | 14,717 | ||||||||
Service agreement fees4 |
– | – | – | – | ||||||||
Other expenses |
6 | 42 | 3 | – | ||||||||
Total expenses before reimbursement/waiver |
2,460,892 | 683,500 | 2,961,941 | 3,167,249 | ||||||||
Less reimbursement/waiver |
– | – | – | – | ||||||||
Total expenses net of reimbursement/waiver |
2,460,892 | 683,500 | 2,961,941 | 3,167,249 | ||||||||
| Net Investment Income | 12,849,590 | 5,479,561 | 10,757,484 | 10,488,964 | ||||||||
| Net Realized and Unrealized Gain (Loss) on Investments | ||||||||||||
Net realized gain (loss) on investments (including net realized gain (loss) on foreign currency related transactions)2 |
||||||||||||
Unaffiliated issuers |
255,801 | 3,222,281 | 6,819,611 | 22,534,576 | ||||||||
Affiliated issuers1 |
– | – | – | – | ||||||||
Capital gain distributions received from underlying funds |
||||||||||||
Unaffiliated issuers |
– | – | – | – | ||||||||
Affiliated issuers1 |
– | – | – | – | ||||||||
Net change in unrealized appreciation (depreciation) on investments (including net unrealized appreciation (depreciation) on foreign currency related transactions)3 |
||||||||||||
Unaffiliated issuers |
(41,918 | ) | 860,384 | 14,057,412 | 24,248,240 | |||||||
Affiliated issuers1 |
– | – | – | – | ||||||||
| Net Realized and Unrealized Gain on Investments | 213,883 | 4,082,665 | 20,877,023 | 46,782,816 | ||||||||
| Net Increase in Net Assets from Operations | $13,063,473 | $9,562,226 | $31,634,507 | $57,271,780 | ||||||||
| 1 | See Note 10 for information on affiliated issuers. |
| 2 | Includes foreign capital gains taxes paid of $16,623 for the International Stock Fund. |
| 3 | Net of change in deferred foreign capital gains taxes of $9,625 for the International Stock Fund. |
| 4 | See Note 3 for information on service agreement fees. |
See accompanying Notes to Financial Statements.
68
Ultra Series Fund | December 31, 2012
Statements of Operations for the Period Ended December 31, 2012
| Madison | Madison | Madison | Madison | ||||||||||||||||||
| Large Cap | Target | Target | Target | Target | |||||||||||||||||
| Growth | Mid Cap | Small Cap | International | Retirement | Retirement | Retirement | Retirement | ||||||||||||||
| Fund | Fund | Fund | Stock Fund | 2020 Fund | 2030 Fund | 2040 Fund | 2050 Fund | ||||||||||||||
| $3,592 | $6,358 | $101 | $6,274 | $151 | $188 | $143 | $25 | ||||||||||||||
| 5,860,990 | 4,603,125 | 305,845 | 2,950,833 | 1,580,007 | 1,790,411 | 1,237,285 | 141,743 | ||||||||||||||
| – | – | – | – | – | – | – | – | ||||||||||||||
| (28,963 | ) | (71,212 | ) | – | (246,069 | ) | – | – | – | – | |||||||||||
| 5,835,619 | 4,538,271 | 305,946 | 2,711,038 | 1,580,158 | 1,790,599 | 1,237,428 | 141,768 | ||||||||||||||
| 2,973,834 | 3,354,279 | 143,011 | 1,103,516 | 120,883 | 142,264 | 104,554 | 11,023 | ||||||||||||||
| 34,257 | 33,910 | 1,185 | 8,409 | – | – | – | – | ||||||||||||||
| 18,537 | 18,589 | 646 | 4,520 | – | – | – | – | ||||||||||||||
| 73,275 | 34,711 | 3,615 | 42,259 | – | – | – | – | ||||||||||||||
| – | – | – | – | 24,176 | 28,453 | 20,911 | 2,205 | ||||||||||||||
| 2,103 | – | 67 | 232 | 539 | 553 | 482 | 15 | ||||||||||||||
| 3,102,006 | 3,441,489 | 148,524 | 1,158,936 | – | – | – | – | ||||||||||||||
| – | – | – | – | – | – | – | – | ||||||||||||||
| 3,102,006 | 3,441,489 | 148,524 | 1,158,936 | 145,598 | 171,270 | 125,947 | 13,243 | ||||||||||||||
| 2,733,613 | 1,096,782 | 157,422 | 1,552,102 | 1,434,560 | 1,619,329 | 1,111,481 | 128,525 | ||||||||||||||
| 5,568,234 | 12,645,399 | 585,925 | 2,784,165 | (182,476 | ) | (112,211 | ) | (25,695 | ) | (12,307 | ) | ||||||||||
| – | – | – | – | – | – | – | – | ||||||||||||||
| – | – | – | – | ||||||||||||||||||
| – | – | – | – | 347,650 | 315,166 | 166,574 | 13,840 | ||||||||||||||
| – | – | – | – | – | – | – | – | ||||||||||||||
| 31,642,311 | 42,480,016 | 1,117,532 | 13,554,327 | 2,879,364 | 3,982,918 | 3,160,888 | 333,215 | ||||||||||||||
| – | – | – | – | – | – | – | – | ||||||||||||||
| 37,210,545 | 55,125,415 | 1,703,457 | 16,338,492 | 3,044,538 | 4,185,873 | 3,301,767 | 334,748 | ||||||||||||||
| $39,944,158 | $56,222,197 | $1,860,879 | $17,890,594 | $4,479,098 | $5,805,202 | $4,413,248 | $? 463,273 | ||||||||||||||
See accompanying Notes to Financial Statements.
69
Ultra Series Fund | December 31, 2012
Statements of Changes in Net Assets
| Conservative Allocation Fund | Moderate Allocation Fund | |||||||||||
| Year Ended December 31, | 2012 | 2011 | 2012 | 2011 | ||||||||
| Net Assets at beginning of period | $227,634,129 | $231,082,035 | $382,606,027 | $384,260,026 | ||||||||
| Increase (decrease) in net assets from operations: | ||||||||||||
Net investment income |
6,404,623 | 6,421,140 | 9,024,664 | 7,973,809 | ||||||||
Net realized gain on investment transactions |
5,954,390 | 1,603,964 | 10,957,642 | 4,470,788 | ||||||||
Net change in unrealized appreciation (depreciation) on investments transactions |
7,620,015 | (1,101,366 | ) | 19,170,279 | (4,681,805 | ) | ||||||
Net increase in net assets from operations |
19,979,028 | 6,923,738 | 39,152,585 | 7,762,792 | ||||||||
| Distributions to shareholders from: | ||||||||||||
Net investment income |
||||||||||||
Class I |
(7,226,155 | ) | (6,348,062 | ) | (10,646,775 | ) | (9,241,042 | ) | ||||
Class II |
(1,526,152 | ) | (1,388,479 | ) | (985,020 | ) | (885,425 | ) | ||||
Return of Capital |
||||||||||||
Class I |
– | (127,373 | ) | – | – | |||||||
Class II |
– | (28,768 | ) | – | – | |||||||
Total distributions |
(8,752,307 | ) | (7,892,682 | ) | (11,631,795 | ) | (10,126,467 | ) | ||||
| Capital Stock transactions: | ||||||||||||
Class I Shares |
||||||||||||
Shares sold |
36,406,472 | 20,354,867 | 45,709,365 | 23,367,824 | ||||||||
Issued to shareholders in reinvestment of distributions |
7,226,139 | 6,475,435 | 10,646,773 | 9,241,042 | ||||||||
Shares redeemed |
(41,688,374 | ) | (37,440,903 | ) | (69,665,565 | ) | (36,466,538 | ) | ||||
Net increase (decrease) in net assets from capital stock transactions |
1,944,237 | (10,610,601 | ) | (13,309,427 | ) | (3,857,672 | ) | |||||
Class II Shares |
||||||||||||
Shares sold |
1,950,081 | 9,767,995 | 1,099,583 | 6,691,106 | ||||||||
Issued to shareholders in reinvestment of distributions |
1,526,152 | 1,417,247 | 985,020 | 885,425 | ||||||||
Shares redeemed |
(6,064,713 | ) | (3,053,604 | ) | (5,843,520 | ) | (3,009,183 | ) | ||||
Net increase (decrease) in net assets from capital stock transactions |
(2,588,480 | ) | 8,131,638 | (3,758,917 | ) | 4,567,348 | ||||||
| Total increase (decrease) from capital stock transactions | (644,243 | ) | (2,478,963 | ) | (17,068,344 | ) | 709,676 | |||||
| Total increase (decrease) in net assets | 10,582,478 | (3,447,906 | ) | 10,452,446 | (1,653,999 | ) | ||||||
| Net Assets at end of period | $238,216,607 | $227,634,129 | $393,058,473 | $382,606,027 | ||||||||
Undistributed net investment income (loss) included in net assets |
$– | $– | $– | $– | ||||||||
| Capital Share transactions: | ||||||||||||
Class I Shares |
||||||||||||
Shares sold |
3,483,197 | 1,989,887 | 4,586,565 | 2,426,221 | ||||||||
Issued to shareholders in reinvestment of distributions |
691,344 | 649,610 | 1,053,646 | 980,151 | ||||||||
Shares redeemed |
(3,985,882 | ) | (3,674,546 | ) | (6,964,923 | ) | (3,768,817 | ) | ||||
Net increase (decrease) from capital share transactions |
188,659 | (1,035,049 | ) | (1,324,712 | ) | (362,445 | ) | |||||
Class II Shares |
||||||||||||
Shares sold |
187,427 | 955,023 | 112,305 | 685,655 | ||||||||
Issued to shareholders in reinvestment of distributions |
146,308 | 142,423 | 97,726 | 94,103 | ||||||||
Shares redeemed |
(582,367 | ) | (298,720 | ) | (592,373 | ) | (313,358 | ) | ||||
Net increase (decrease) from capital share transactions |
(248,632 | ) | 798,726 | (382,342 | ) | 466,400 | ||||||
See accompanying Notes to Financial Statements.
70
Ultra Series Fund | December 31, 2012
Statements of Changes in Net Assets
| Aggressive Allocation Fund | Money Market Fund | Bond Fund | High Income Fund | |||||||||||||||||||
| 2012 | 2011 | 2012 | 2011 | 2012 | 2011 | 2012 | 2011 | |||||||||||||||
| $134,360,528 | $127,694,004 | $62,660,366 | $70,211,054 | $425,099,202 | $465,248,826 | $92,675,282 | $99,838,101 | |||||||||||||||
| 2,537,833 | 1,663,434 | – | – | 12,849,590 | 15,963,320 | 5,479,561 | 6,540,601 | |||||||||||||||
| 5,179,817 | 3,126,456 | – | – | 255,801 | 1,004,732 | 3,222,281 | 1,733,903 | |||||||||||||||
| 7,348,417 | (4,143,997 | ) | – | – | (41,918 | ) | 11,605,808 | 860,384 | (3,502,188 | ) | ||||||||||||
| 15,066,067 | 645,893 | – | – | 13,063,473 | 28,573,860 | 9,562,226 | 4,772,316 | |||||||||||||||
| (3,193,957 | ) | (2,322,867 | ) | – | – | (11,250,243 | ) | (14,079,587 | ) | (5,116,320 | ) | (6,211,217 | ) | |||||||||
| (39,884 | ) | (28,384 | ) | – | – | (1,526,409 | ) | (1,752,712 | ) | (542,703 | ) | (428,405 | ) | |||||||||
| – | – | – | – | – | – | – | – | |||||||||||||||
| – | – | – | – | – | – | – | – | |||||||||||||||
| (3,233,841 | ) | (2,351,251 | ) | – | – | (12,776,652 | ) | (15,832,299 | ) | (5,659,023 | ) | (6,639,622 | ) | |||||||||
| 30,425,398 | 16,814,313 | 15,456,536 | 26,296,004 | 80,281,951 | 32,933,180 | 6,340,313 | 3,676,230 | |||||||||||||||
| 3,193,957 | 2,322,867 | – | – | 11,250,243 | 14,079,587 | 5,116,320 | 6,211,217 | |||||||||||||||
| (35,113,393 | ) | (11,163,455 | ) | (28,490,349 | ) | (34,247,892 | ) | (126,901,735 | ) | (112,759,403 | ) | (41,331,439 | ) | (17,304,019 | ) | |||||||
| (1,494,038 | ) | 7,973,725 | (13,033,813 | ) | (7,951,888 | ) | (35,369,541 | ) | (65,746,636 | ) | (29,874,806 | ) | (7,416,572 | ) | ||||||||
| 103,181 | 467,480 | 2,213,981 | 2,272,356 | 3,009,622 | 12,844,910 | 356,009 | 1,915,219 | |||||||||||||||
| 39,884 | 28,384 | – | – | 1,526,409 | 1,752,712 | 542,703 | 428,405 | |||||||||||||||
| (166,362 | ) | (97,707 | ) | (1,516,857 | ) | (1,871,156 | ) | (4,761,589 | ) | (1,742,169 | ) | (502,790 | ) | (222,564 | ) | |||||||
| (23,297 | ) | 398,157 | 697,124 | 401,200 | (225,558 | ) | 12,855,453 | 395,922 | 2,121,060 | |||||||||||||
| (1,517,335 | ) | 8,371,882 | (12,336,689 | ) | (7,550,688 | ) | (35,595,099 | ) | (52,891,183 | ) | (29,478,884 | ) | (5,295,512 | ) | ||||||||
| 10,314,891 | 6,666,524 | (12,336,689 | ) | (7,550,688 | ) | (35,308,278 | ) | (40,149,624 | ) | (25,575,681 | ) | (7,162,819 | ) | |||||||||
| $144,675,419 | $134,360,528 | $50,323,677 | $62,660,366 | $389,790,924 | $425,099,202 | $67,099,601 | $92,675,282 | |||||||||||||||
| $ – | $ – | $– | $– | $215,795 | $270,176 | $206,043 | $118,232 | |||||||||||||||
| 3,188,342 | 1,829,853 | 15,456,536 | 26,296,004 | 7,495,349 | 3,144,908 | 651,888 | 380,515 | |||||||||||||||
| 327,438 | 259,040 | – | – | 1,064,171 | 1,333,622 | 545,827 | 675,860 | |||||||||||||||
| (3,674,003 | ) | (1,205,025 | ) | (28,490,349 | ) | (34,247,892 | ) | (11,809,745 | ) | (10,714,251 | ) | (4,170,438 | ) | (1,786,259 | ) | |||||||
| (158,223 | ) | 883,868 | (13,033,813 | ) | (7,951,888 | ) | (3,250,225 | ) | (6,235,721 | ) | (2,972,723 | ) | (729,884 | ) | ||||||||
| 10,752 | 49,960 | 2,213,981 | 2,272,356 | 279,678 | 1,232,926 | 36,572 | 197,713 | |||||||||||||||
| 4,102 | 3,173 | – | – | 144,622 | 166,154 | 57,879 | 46,641 | |||||||||||||||
| (16,989 | ) | (10,546 | ) | (1,516,857 | ) | (1,871,156 | ) | (444,157 | ) | (163,213 | ) | (51,896 | ) | (23,060 | ) | |||||||
| (2,135 | ) | 42,587 | 697,124 | 401,200 | (19,857 | ) | 1,235,867 | 42,555 | 221,294 | |||||||||||||
See accompanying Notes to Financial Statements.
71
Ultra Series Fund | December 31, 2012
Statements of Changes in Net Assets
| Diversified Income Fund | Large Cap Value Fund | |||||||||||
| Year Ended December 31, | 2012 | 2011 | 2012 | 2011 | ||||||||
| Net Assets at beginning of period | $403,211,434 | $407,017,583 | $491,674,493 | $530,247,917 | ||||||||
| Increase (decrease) in net assets from operations: | ||||||||||||
Net investment income |
10,757,484 | 11,868,731 | 10,488,964 | 10,296,797 | ||||||||
Net realized gain on investments transactions |
6,819,611 | 16,259,876 | 22,534,576 | 31,920,133 | ||||||||
Net change in unrealized appreciation (depreciation) on investments transactions |
14,057,412 | 2,343,286 | 24,248,240 | (5,336,866 | ) | |||||||
Net increase (decrease) in net assets from operations |
31,634,507 | 30,471,893 | 57,271,780 | 36,880,064 | ||||||||
| Distributions to shareholders from: | ||||||||||||
Net investment income |
||||||||||||
Class I |
(9,820,039 | ) | (11,046,222 | ) | (10,356,142 | ) | (10,095,971 | ) | ||||
Class II |
(889,234 | ) | (837,747 | ) | (112,931 | ) | (109,873 | ) | ||||
Total distributions |
(10,709,273 | ) | (11,883,969 | ) | (10,469,073 | ) | (10,205,844 | ) | ||||
| Capital Stock transactions: | ||||||||||||
Class I Shares |
||||||||||||
Shares sold |
33,291,125 | 8,647,928 | 69,507,711 | 13,848,340 | ||||||||
Issued to shareholders in reinvestment of distributions |
9,820,039 | 11,046,222 | 10,356,143 | 10,095,971 | ||||||||
Shares redeemed |
(76,259,090 | ) | (48,976,196 | ) | (117,526,447 | ) | (89,269,316 | ) | ||||
Net decrease in net assets from capital stock transactions |
(33,147,926 | ) | (29,282,046 | ) | (37,662,593 | ) | (65,325,005 | ) | ||||
Class II Shares |
||||||||||||
Shares sold |
5,148,640 | 8,977,582 | 224,114 | 544,221 | ||||||||
Issued to shareholders in reinvestment of distributions |
889,234 | 837,747 | 112,931 | 109,873 | ||||||||
Shares redeemed |
(3,096,127 | ) | (2,927,356 | ) | (682,525 | ) | (576,733 | ) | ||||
Net increase (decrease) in net assets from capital stock transactions |
2,941,747 | 6,887,973 | (345,480 | ) | 77,361 | |||||||
| Total net decrease from capital stock transactions | (30,206,179 | ) | (22,394,073 | ) | (38,008,073 | ) | (65,247,644 | ) | ||||
| Total increase (decrease) in net assets | (9,280,945 | ) | (3,806,149 | ) | 8,794,634 | (38,573,424 | ) | |||||
| Net Assets at end of period | $393,930,489 | $403,211,434 | $500,469,127 | $491,674,493 | ||||||||
Undistributed net investment income (loss) included in net assets |
$215,755 | $207,484 | $210,348 | $190,026 | ||||||||
| Capital Share transactions: | ||||||||||||
Class I Shares |
||||||||||||
Shares sold |
1,813,514 | 502,323 | 2,587,667 | 559,931 | ||||||||
Issued to shareholders in reinvestment of distributions |
539,704 | 634,293 | 386,381 | 405,964 | ||||||||
Shares redeemed |
(4,167,601 | ) | (2,847,528 | ) | (4,353,429 | ) | (3,629,634 | ) | ||||
Net decrease from capital share transactions |
(1,814,383 | ) | (1,710,912 | ) | (1,379,381 | ) | (2,663,739 | ) | ||||
Class II Shares |
||||||||||||
Shares sold |
284,063 | 526,321 | 8,317 | 22,164 | ||||||||
Issued to shareholders in reinvestment of distributions |
48,943 | 48,142 | 4,222 | 4,426 | ||||||||
Shares redeemed |
(169,225 | ) | (170,150 | ) | (25,462 | ) | (23,662 | ) | ||||
Net increase (decrease) from capital share transactions |
163,781 | 404,313 | (12,923 | ) | 2,928 | |||||||
See accompanying Notes to Financial Statements.
72
Ultra Series Fund | December 31, 2012
Statements of Changes in Net Assets
| Large Cap Growth Fund | Mid Cap Fund | Small Cap Fund | International Stock Fund | |||||||||||||||||||
| 2012 | 2011 | 2012 | 2011 | 2012 | 2011 | 2012 | 2011 | |||||||||||||||
| $358,620,849 | $395,446,443 | $365,102,889 | $397,169,596 | $12,661,690 | $13,097,057 | $88,163,466 | $105,304,241 | |||||||||||||||
| 2,733,613 | 872,256 | 1,096,782 | 602,185 | 157,422 | 50,950 | 1,552,102 | 1,855,913 | |||||||||||||||
| 5,568,234 | 39,422,276 | 12,645,399 | 36,438,566 | 585,925 | 357,045 | 2,784,165 | 3,479,732 | |||||||||||||||
| 31,642,311 | (44,255,836 | ) | 42,480,016 | (19,534,163 | ) | 1,117,532 | (368,723 | ) | 13,554,327 | (12,765,450 | ) | |||||||||||
| 39,944,158 | (3,961,304 | ) | 56,222,197 | 17,506,588 | 1,860,879 | 39,272 | 17,890,594 | (7,429,805 | ) | |||||||||||||
| (2,515,455 | ) | (861,866 | ) | (1,067,719 | ) | (687,090 | ) | (139,045 | ) | (45,846 | ) | (1,223,367 | ) | (1,510,650 | ) | |||||||
| (189,383 | ) | (31,319 | ) | (22,229 | ) | (4,200 | ) | (15,378 | ) | (3,723 | ) | (263,629 | ) | (291,401 | ) | |||||||
| (2,704,838 | ) | (893,185 | ) | (1,089,948 | ) | (691,290 | ) | (154,423 | ) | (49,569 | ) | (1,486,996 | ) | (1,802,051 | ) | |||||||
| 51,759,146 | 11,740,628 | 46,160,581 | 14,847,888 | 567,964 | 1,567,954 | 6,139,330 | 3,327,511 | |||||||||||||||
| 2,515,455 | 861,866 | 1,067,719 | 687,090 | 139,045 | 45,846 | 1,223,367 | 1,510,650 | |||||||||||||||
| (101,706,126 | ) | (51,986,645 | ) | (95,640,480 | ) | (65,250,198 | ) | (1,550,153 | ) | (2,049,990 | ) | (16,609,228 | ) | (16,569,485 | ) | |||||||
| (47,431,525 | ) | (39,384,151 | ) | (48,412,180 | ) | (49,715,220 | ) | (843,144 | ) | (436,190 | ) | (9,246,531 | ) | (11,731,324 | ) | |||||||
| 1,039,287 | 8,340,118 | 205,290 | 1,744,989 | 28,404 | 290,607 | 867,658 | 4,073,516 | |||||||||||||||
| 189,383 | 31,319 | 22,229 | 4,200 | 15,378 | 3,723 | 263,629 | 291,401 | |||||||||||||||
| (2,531,461 | ) | (958,391 | ) | (1,589,470 | ) | (915,974 | ) | (146,386 | ) | (283,210 | ) | (1,269,715 | ) | (542,512 | ) | |||||||
| (1,302,791 | ) | 7,413,046 | (1,361,951 | ) | 833,215 | (102,604 | ) | 11,120 | (138,428 | ) | 3,822,405 | |||||||||||
| (48,734,316 | ) | (31,971,105 | ) | (49,774,131 | ) | (48,882,005 | ) | (945,748 | ) | (425,070 | ) | (9,384,959 | ) | (7,908,919 | ) | |||||||
| (11,494,996 | ) | (36,825,594 | ) | 5,358,118 | (32,066,707 | ) | 760,708 | (435,367 | ) | 7,018,639 | (17,140,775 | ) | ||||||||||
| $347,125,853 | $358,620,849 | $370,461,007 | $365,102,889 | $13,422,398 | $12,661,690 | $95,182,105 | $88,163,466 | |||||||||||||||
| $51,752 | $23,005 | $22,758 | $15,924 | $– | $– | $14,030 | $(78) | |||||||||||||||
| 2,172,455 | 521,785 | 2,819,510 | 993,405 | 49,083 | 142,303 | 624,736 | 332,788 | |||||||||||||||
| 106,135 | 39,349 | 63,373 | 46,410 | 11,463 | 4,205 | 114,510 | 167,339 | |||||||||||||||
| (4,235,335 | ) | (2,310,549 | ) | (5,878,665 | ) | (4,419,911 | ) | (133,951 | ) | (193,625 | ) | (1,660,974 | ) | (1,658,271 | ) | |||||||
| (1,956,745 | ) | (1,749,415 | ) | (2,995,782 | ) | (3,380,096 | ) | (73,405 | ) | (47,117 | ) | (921,728 | ) | (1,158,144 | ) | |||||||
| 44,301 | 368,460 | 12,749 | 117,974 | 2,393 | 26,862 | 91,269 | 403,814 | |||||||||||||||
| 8,013 | 1,433 | 1,321 | 284 | 1,272 | 342 | 24,683 | 32,404 | |||||||||||||||
| (106,446 | ) | (43,744 | ) | (98,269 | ) | (62,644 | ) | (12,565 | ) | (26,457 | ) | (126,337 | ) | (54,302 | ) | |||||||
| (54,132 | ) | 326,149 | (84,199 | ) | 55,614 | (8,900 | ) | 747 | (10,385 | ) | 381,916 | |||||||||||
See accompanying Notes to Financial Statements.
73
Ultra Series Fund | December 31, 2012
Statements of Changes in Net Assets
| Madison Target | Madison Target | |||||||||||
| Retirement 2020 Fund | Retirement 2030 Fund | |||||||||||
| Year Ended December 31, | 2012 | 2011 | 2012 | 2011 | ||||||||
| Net Assets at beginning of period | $39,580,036 | $27,647,785 | $45,404,453 | $31,278,843 | ||||||||
| Increase (decrease) in net assets from operations: | ||||||||||||
Net investment income |
1,434,560 | 927,037 | 1,619,329 | 923,593 | ||||||||
Net realized gain (loss) on investments |
165,174 | 2,004,820 | 202,955 | 2,414,365 | ||||||||
Net change in unrealized appreciation (depreciation) on investments |
2,879,364 | (2,269,004 | ) | 3,982,918 | (2,911,351 | ) | ||||||
Net increase (decrease) in net assets from operations |
4,479,098 | 662,853 | 5,805,202 | 426,607 | ||||||||
| Distributions to shareholders from: | ||||||||||||
Net investment income |
||||||||||||
Class I |
(1,667,275 | ) | (1,096,421 | ) | (1,812,454 | ) | (1,091,758 | ) | ||||
Net realized gains |
||||||||||||
Class I |
(178,482 | ) | (897,737 | ) | (440,797 | ) | (1,764,696 | ) | ||||
Return of Capital |
||||||||||||
Class I |
– | – | – | – | ||||||||
Total distributions |
(1,845,757 | ) | (1,994,158 | ) | (2,253,251 | ) | (2,856,454 | ) | ||||
| Capital Stock transactions: | ||||||||||||
Class I Shares |
||||||||||||
Shares sold |
26,778,150 | 15,901,069 | 29,952,292 | 15,550,888 | ||||||||
Issued to shareholders in reinvestment of distributions |
1,845,756 | 1,994,158 | 2,253,248 | 2,856,454 | ||||||||
Shares redeemed |
(14,229,993 | ) | (4,631,671 | ) | (13,152,477 | ) | (1,851,885 | ) | ||||
Net increase from capital stock transactions |
14,393,913 | 13,263,556 | 19,053,063 | 16,555,457 | ||||||||
| Total increase in net assets | 17,027,254 | 11,932,250 | 22,605,014 | 14,125,610 | ||||||||
| Net Assets at end of period | $56,607,290 | $39,580,036 | $68,009,467 | $45,404,453 | ||||||||
Undistributed net investment income included in net assets |
$– | $– | $– | $– | ||||||||
| Capital Share transactions: | ||||||||||||
Class I Shares |
||||||||||||
Shares sold |
3,249,949 | 1,939,616 | 3,774,920 | 1,952,016 | ||||||||
Issued to shareholders in reinvestment of distributions |
222,629 | 255,016 | 281,135 | 381,214 | ||||||||
Shares redeemed |
(1,725,495 | ) | (560,216 | ) | (1,656,361 | ) | (228,251 | ) | ||||
Net increase from capital share transactions |
1,747,083 | 1,634,416 | 2,399,694 | 2,104,979 | ||||||||
| 1 | The Madison Target Retirement 2050 Fund commenced operations on January 3, 2011. |
See accompanying Notes to Financial Statements.
74
Ultra Series Fund | December 31, 2012
Statements of Changes in Net Assets
| Madison Target | Madison Target | |||||||||
| Retirement 2040 Fund | Retirement 2050 Fund | |||||||||
| 2012 | 2011 | 2012 | 20111 | |||||||
| $35,182,268 | $26,146,753 | $2,236,241 | $– | |||||||
| 1,111,481 | 642,632 | 128,525 | 27,410 | |||||||
| 140,879 | 2,303,584 | 1,533 | (29,923 | ) | ||||||
| 3,160,888 | (2,809,726 | ) | 333,215 | (16,822 | ) | |||||
| 4,413,248 | 136,490 | 463,273 | (19,335 | ) | ||||||
| (1,199,277 | ) | (767,165 | ) | (134,118 | ) | (31,450 | ) | |||
| (401,247 | ) | (1,885,854 | ) | (27,128 | ) | – | ||||
| – | – | – | (1,099 | ) | ||||||
| (1,600,524 | ) | (2,653,019 | ) | (161,246 | ) | (32,549 | ) | |||
| 21,643,373 | 10,698,786 | 5,538,045 | 2,473,782 | |||||||
| 1,600,523 | 2,653,019 | 161,246 | 32,549 | |||||||
| (11,970,258 | ) | (1,799,761 | ) | (1,077,477 | ) | (218,206 | ) | |||
| 11,273,638 | 11,552,044 | 4,621,814 | 2,288,125 | |||||||
| 14,086,362 | 9,035,515 | 4,923,841 | 2,236,241 | |||||||
| $49,268,630 | $35,182,268 | $7,160,082 | $2,236,241 | |||||||
| $– | $– | $– | $– | |||||||
| 2,875,883 | 1,399,765 | 528,566 | 248,588 | |||||||
| 210,569 | 375,570 | 15,091 | 3,338 | |||||||
| (1,594,072 | ) | (230,919 | ) | (102,883 | ) | (22,619 | ) | |||
| 1,492,380 | 1,544,416 | 440,774 | 229,307 | |||||||
See accompanying Notes to Financial Statements.
75
Ultra Series Fund | December 31, 2012
Financial Highlights for a Share of Beneficial Interest Outstanding
| CONSERVATIVE ALLOCATION FUND | |||||||||||||||
| Year Ended December 31, | |||||||||||||||
| 2012 | 2011 | 2010 | 2009 | 2008 | |||||||||||
| CLASS I | |||||||||||||||
| Net Asset Value at beginning of period | $9.96 | $10.01 | $9.61 | $8.48 | $10.77 | ||||||||||
Income from Investment Operations: |
|||||||||||||||
Net investment income2 |
0.29 | 0.28 | 0.29 | 0.29 | 0.35 | ||||||||||
Net realized and unrealized gain (loss) on investments |
0.60 | 0.03 | 0.52 | 1.12 | (2.27 | ) | |||||||||
Total from investment operations |
0.89 | 0.31 | 0.81 | 1.41 | (1.92 | ) | |||||||||
Less Distributions: |
|||||||||||||||
Distributions from net investment income |
(0.40 | ) | (0.35 | ) | (0.41 | ) | (0.28 | ) | (0.27 | ) | |||||
Distributions from capital gains |
– | – | – | – | (0.10 | ) | |||||||||
Distributions from return of capital |
– | (0.01 | ) | – | – | – | |||||||||
Total distributions |
(0.40 | ) | (0.36 | ) | (0.41 | ) | (0.28 | ) | (0.37 | ) | |||||
| Net increase (decrease) in net asset value | 0.49 | (0.05 | ) | 0.40 | 1.13 | (2.29 | ) | ||||||||
| Net Asset Value at end of period | $10.45 | $9.96 | $10.01 | $9.61 | $8.48 | ||||||||||
| Total Return3 (%) | 8.98 | 3.14 | 8.37 | 16.76 | (17.89 | ) | |||||||||
| Ratios/Supplemental Data: | |||||||||||||||
| Net Assets at end of period (in 000’s) | $195,526 | $184,431 | $195,657 | $176,322 | $116,678 | ||||||||||
| Ratios of expenses to average net assets: | |||||||||||||||
Before management fee reduction (%) |
0.31 | 0.31 | 0.31 | 0.31 | 0.31 | ||||||||||
After management fee reduction (%) |
0.31 | 0.31 | 0.31 | 0.31 | 0.28 | ||||||||||
| Ratio of net investment income to average net assets (%) | 2.79 | 2.76 | 2.90 | 3.23 | 3.53 | ||||||||||
| Portfolio Turnover6 (%) | 44 | 36 | 36 | 47 | 71 | ||||||||||
| Inception to | |||||||||||||||
| CLASS II | 2012 | 2011 | 2010 | 12/31/091 | |||||||||||
| Net Asset Value at beginning of period | $9.95 | $10.00 | $9.61 | $8.51 | |||||||||||
Income from Investment Operations: |
|||||||||||||||
Net investment income2 |
0.26 | 0.27 | 0.35 | 0.28 | |||||||||||
Net realized and unrealized gain (loss) on investments |
0.61 | 0.02 | 0.43 | 0.99 | |||||||||||
Total from investment operations |
0.87 | 0.29 | 0.78 | 1.27 | |||||||||||
Less Distributions: |
|||||||||||||||
Distributions from net investment income |
(0.39 | ) | (0.33 | ) | (0.39 | ) | (0.17 | ) | |||||||
Distributions from return of capital |
– | (0.01 | ) | – | – | ||||||||||
| Net increase (decrease) in net asset value | 0.48 | (0.05 | ) | 0.39 | 1.10 | ||||||||||
| Net Asset Value at end of period | $10.43 | $9.95 | $10.00 | $9.61 | |||||||||||
| Total Return3 (%) | 8.71 | 2.89 | 8.10 | 14.91 | 4 | ||||||||||
| Ratios/Supplemental Data: | |||||||||||||||
| Net Assets at end of period (in 000’s) | $42,691 | $43,203 | $35,425 | $12,829 | |||||||||||
| Ratios of expenses to average net assets (%) | 0.56 | 0.56 | 0.55 | 0.56 | 5 | ||||||||||
| Ratio of net investment income to average net assets (%) | 2.49 | 2.67 | 3.47 | 4.38 | 5 | ||||||||||
| Portfolio Turnover6 (%) | 44 | 36 | 36 | 47 | 4 | ||||||||||
| 1 | Commenced investment operations May 1, 2009 | |
| 2 | Based on average shares outstanding during the year. | |
| 3 | These returns are after all charges at the mutual fund level have been subtracted. These returns are higher than the returns at the separate account level because charges made at the separate account level have not been subtracted. | |
| 4 | Not annualized. | |
| 5 | Annualized. | |
| 6 | Portfolio Turnover is calculated at the fund level and represents the entire fiscal year or period. |
See accompanying Notes to Financial Statements.
76
Ultra Series Fund | December 31, 2012
Financial Highlights for a Share of Beneficial Interest Outstanding
| MODERATE ALLOCATION FUND | |||||||||||||||
| Year Ended December 31, | |||||||||||||||
| 2012 | 2011 | 2010 | 2009 | 2008 | |||||||||||
| CLASS I | |||||||||||||||
| Net Asset Value at beginning of period | $9.42 | $9.49 | $8.87 | $7.51 | $11.21 | ||||||||||
Income from Investment Operations: |
|||||||||||||||
Net investment income2 |
0.23 | 0.20 | 0.20 | 0.18 | 0.21 | ||||||||||
Net realized and unrealized gain (loss) on investments |
0.77 | (0.01 | ) | 0.71 | 1.37 | (3.55 | ) | ||||||||
Total from investment operations |
1.00 | 0.19 | 0.91 | 1.55 | (3.34 | ) | |||||||||
Less Distributions: |
|||||||||||||||
Distributions from net investment income |
(0.31 | ) | (0.26 | ) | (0.29 | ) | (0.19 | ) | (0.17 | ) | |||||
Distributions from capital gains |
– | – | – | – | (0.19 | ) | |||||||||
Total distributions |
(0.31 | ) | (0.26 | ) | (0.29 | ) | (0.19 | ) | (0.36 | ) | |||||
| Net increase (decrease) in net asset value | 0.69 | (0.07 | ) | 0.62 | 1.36 | (3.70 | ) | ||||||||
| Net Asset Value at end of period | $10.11 | $9.42 | $9.49 | $8.87 | $7.51 | ||||||||||
| Total Return3 (%) | 10.54 | 2.03 | 10.22 | 20.61 | (30.23 | ) | |||||||||
| Ratios/Supplemental Data: | |||||||||||||||
| Net Assets at end of period (in 000’s) | $358,486 | $346,733 | $352,545 | $332,428 | $243,761 | ||||||||||
| Ratios of expenses to average net assets: | |||||||||||||||
Before management fee reduction (%) |
0.31 | 0.31 | 0.31 | 0.31 | 0.31 | ||||||||||
After management fee reduction (%) |
0.31 | 0.31 | 0.31 | 0.31 | 0.28 | ||||||||||
| Ratio of net investment income to average net assets (%) | 2.32 | 2.07 | 2.24 | 2.29 | 2.20 | ||||||||||
| Portfolio Turnover6 (%) | 49 | 25 | 34 | 52 | 69 | ||||||||||
| Inception to | |||||||||||||||
| CLASS II | 2012 | 2011 | 2010 | 12/31/091 | |||||||||||
| Net Asset Value at beginning of period | $9.41 | $9.48 | $8.87 | $7.56 | |||||||||||
Income from Investment Operations: |
|||||||||||||||
Net investment income2 |
0.20 | 0.18 | 0.25 | 0.19 | |||||||||||
Net realized and unrealized gain (loss) on investments |
0.77 | (0.01 | ) | 0.63 | 1.24 | ||||||||||
Total from investment operations |
0.97 | 0.17 | 0.88 | 1.43 | |||||||||||
Less Distributions: |
|||||||||||||||
Distributions from net investment income |
(0.30 | ) | (0.24 | ) | (0.27 | ) | (0.12 | ) | |||||||
| Net increase (decrease) in net asset value | 0.67 | (0.07 | ) | 0.61 | 1.31 | ||||||||||
| Net Asset Value at end of period | $10.08 | $9.41 | $9.48 | $8.87 | |||||||||||
| Total Return3 (%) | 10.26 | 1.78 | 9.94 | 18.82 | 4 | ||||||||||
| Ratios/Supplemental Data: | |||||||||||||||
| Net Assets at end of period (in 000’s) | $34,573 | $35,873 | $31,715 | $12,162 | |||||||||||
| Ratios of expenses to average net assets (%) | 0.56 | 0.56 | 0.56 | 0.56 | 5 | ||||||||||
| Ratio of net investment income to average net assets (%) | 2.01 | 1.86 | 2.76 | 3.33 | 5 | ||||||||||
| Portfolio Turnover6 (%) | 49 | 25 | 34 | 52 | 4 | ||||||||||
| 1 | Commenced investment operations May 1, 2009. | |
| 2 | Based on average shares outstanding during the year. | |
| 3 | These returns are after all charges at the mutual fund level have been subtracted. These returns are higher than the returns at the separate account level because charges made at the separate account level have not been subtracted. | |
| 4 | Not annualized. | |
| 5 | Annualized. | |
| 6 | Portfolio Turnover is calculated at the fund level and represents the entire fiscal year or period. |
See accompanying Notes to Financial Statements.
77
Ultra Series Fund | December 31, 2012
Financial Highlights for a Share of Beneficial Interest Outstanding
| AGGRESSIVE ALLOCATION FUND | |||||||||||||||
| Year Ended December 31, | |||||||||||||||
| 2012 | 2011 | 2010 | 2009 | 2008 | |||||||||||
| CLASS I | |||||||||||||||
| Net Asset Value at beginning of period | $8.96 | $9.08 | $8.30 | $6.57 | $11.61 | ||||||||||
Income from Investment Operations: |
|||||||||||||||
Net investment income2 |
0.17 | 0.12 | 0.11 | 0.10 | 0.09 | ||||||||||
Net realized and unrealized gain (loss) on investments |
0.84 | (0.08 | ) | 0.81 | 1.74 | (4.74 | ) | ||||||||
Total from investment operations |
1.01 | 0.04 | 0.92 | 1.84 | (4.65 | ) | |||||||||
Less Distributions: |
|||||||||||||||
Distributions from net investment income |
(0.22 | ) | (0.16 | ) | (0.14 | ) | (0.11 | ) | (0.06 | ) | |||||
Distributions from capital gains |
– | – | – | – | (0.33 | ) | |||||||||
Total distributions |
(0.22 | ) | (0.16 | ) | (0.14 | ) | (0.11 | ) | (0.39 | ) | |||||
| Net increase (decrease) in net asset value | 0.79 | (0.12 | ) | 0.78 | 1.73 | (5.04 | ) | ||||||||
| Net Asset Value at end of period | $9.75 | $8.96 | $9.08 | $8.30 | $6.57 | ||||||||||
| Total Return3 (%) | 11.34 | 0.48 | 11.15 | 27.91 | (41.09 | ) | |||||||||
| Ratios/Supplemental Data: | |||||||||||||||
| Net Assets at end of period (in 000’s) | $142,755 | $132,575 | $126,270 | $114,492 | $69,616 | ||||||||||
| Ratios of expenses to average net assets: | |||||||||||||||
Before management fee reduction (%) |
0.31 | 0.31 | 0.31 | 0.31 | 0.31 | ||||||||||
After management fee reduction (%) |
0.31 | 0.31 | 0.31 | 0.31 | 0.28 | ||||||||||
| Ratio of net investment income to average net assets (%) | 1.80 | 1.26 | 1.27 | 1.44 | 0.94 | ||||||||||
| Portfolio Turnover6 (%) | 69 | 32 | 33 | 58 | 67 | ||||||||||
| Inception to | |||||||||||||||
| CLASS II | 2012 | 2011 | 2010 | 12/31/091 | |||||||||||
| Net Asset Value at beginning of period | $8.95 | $9.07 | $8.30 | $6.69 | |||||||||||
Income from Investment Operations: |
|||||||||||||||
Net investment income2 |
0.15 | 0.10 | 0.17 | 0.15 | |||||||||||
Net realized and unrealized gain (loss) on investments |
0.83 | (0.08 | ) | 0.73 | 1.54 | ||||||||||
Total from investment operations |
0.98 | 0.02 | 0.90 | 1.69 | |||||||||||
Less Distributions: |
|||||||||||||||
Distributions from net investment income |
(0.21 | ) | (0.14 | ) | (0.13 | ) | (0.08 | ) | |||||||
| Net increase (decrease) in net asset value | 0.77 | (0.12 | ) | 0.77 | 1.61 | ||||||||||
| Net Asset Value at end of period | $9.72 | $8.95 | $9.07 | $8.30 | |||||||||||
| Total Return3 (%) | 11.06 | 0.23 | 10.87 | 25.09 | 4 | ||||||||||
| Ratios/Supplemental Data: | |||||||||||||||
| Net Assets at end of period (in 000’s) | $1,921 | $1,786 | $1,424 | $514 | |||||||||||
| Ratios of expenses to average net assets (%) | 0.56 | 0.56 | 0.56 | 0.56 | 5 | ||||||||||
| Ratio of net investment income to average net assets (%) | 1.55 | 1.05 | 1.99 | 2.86 | 5 | ||||||||||
| Portfolio Turnover6 (%) | 69 | 32 | 33 | 58 | 4 | ||||||||||
| 1 | Commenced investment operations May 1, 2009. | |
| 2 | Based on average shares outstanding during the year. | |
| 3 | These returns are after all charges at the mutual fund level have been subtracted. These returns are higher than the returns at the separate account level because charges made at the separate account level have not been subtracted. | |
| 4 | Not annualized. | |
| 5 | Annualized. | |
| 6 | Portfolio Turnover is calculated at the fund level and represents the entire fiscal year or period. |
See accompanying Notes to Financial Statements.
78
Ultra Series Fund | December 31, 2012
Financial Highlights for a Share of Beneficial Interest Outstanding
| MONEY MARKET FUND | |||||||||||||||
| Year Ended December 31, | |||||||||||||||
| 2012 | 2011 | 2010 | 2009 | 2008 | |||||||||||
| CLASS I | |||||||||||||||
| Net Asset Value at beginning of period | $1.00 | $1.00 | $1.00 | $1.00 | $1.00 | ||||||||||
Income from Investment Operations: |
|||||||||||||||
Net investment income2 |
– | – | – | 0.00 | 4 | 0.02 | |||||||||
Net realized and unrealized gain (loss) on investments |
– | – | – | – | 0.00 | 4 | |||||||||
Total from investment operations |
0.00 | 0.00 | 0.00 | 0.00 | 0.02 | ||||||||||
Less Distributions: |
|||||||||||||||
Distributions from net investment income |
– | – | – | (0.00 | )4 | (0.02 | ) | ||||||||
| Net increase in net asset value | 0.00 | 0.00 | 0.00 | 0.00 | 0.00 | ||||||||||
| Net Asset Value at end of period | $1.00 | $1.00 | $1.00 | $1.00 | $1.00 | ||||||||||
| Total Return3 (%) | 0.00 | 0.00 | 0.00 | 0.00 | 1.75 | ||||||||||
| Ratios/Supplemental Data: | |||||||||||||||
| Net Assets at end of period (in 000’s) | $48,648 | $61,682 | $69,634 | $92,463 | $159,349 | ||||||||||
| Ratios of expenses to average net assets: | |||||||||||||||
Before waiver of expenses by Adviser (%) |
0.46 | 0.47 | 0.47 | 0.47 | 0.47 | ||||||||||
After waiver of expenses by Adviser (%) |
0.11 | 7 | 0.08 | 7 | 0.14 | 7 | 0.28 | 7 | 0.47 | ||||||
| Ratio of net investment income to average net assets (%) | 0.00 | 0.00 | 0.00 | 0.00 | 1.67 | ||||||||||
| Inception to | |||||||||||||||
| CLASS II | 2012 | 2011 | 2010 | 12/31/091 | |||||||||||
| Net Asset Value at beginning of period | $1.00 | $1.00 | $1.00 | $1.00 | |||||||||||
Income from Investment Operations: |
|||||||||||||||
Net investment income2 |
– | – | – | – | |||||||||||
Net realized and unrealized gain (loss) on investments |
– | – | – | – | |||||||||||
Total from investment operations |
0.00 | 0.00 | 0.00 | 0.00 | |||||||||||
Less Distributions: |
|||||||||||||||
Distributions from net investment income |
– | – | – | – | |||||||||||
| Net increase in net asset value | 0.00 | 0.00 | 0.00 | 0.00 | |||||||||||
| Net Asset Value at end of period | $1.00 | $1.00 | $1.00 | $1.00 | |||||||||||
| Total Return3 (%) | 0.00 | 0.00 | 0.00 | 0.00 | 5 | ||||||||||
| Ratios/Supplemental Data: | |||||||||||||||
| Net Assets at end of period (in 000’s) | $1,676 | $979 | $577 | $185 | |||||||||||
| Ratios of expenses to average net assets: | |||||||||||||||
Before waiver of expenses by Adviser (%) |
0.71 | 0.72 | 0.73 | 0.73 | 6 | ||||||||||
After waiver of expenses by Adviser (%) |
0.12 | 7 | 0.07 | 7 | 0.16 | 7 | 0.20 | 6,7 | |||||||
| Ratio of net investment income to average net assets (%) | 0.00 | 0.00 | 0.00 | 0.00 | 6 | ||||||||||
| 1 | Commenced investment operations May 1, 2009 | ||
| 2 | Based on average shares outstanding during the year. | ||
| 3 | These returns are after all charges at the mutual fund level have been subtracted. These returns are higher than the returns at the separate account level because charges made at the separate account level have not been subtracted. | ||
| 4 | Amounts represent less than $0.005 per share. | ||
| 5 | Not annualized. | ||
| 6 | Annualized. | ||
| 7 | Amount includes fees waived by the adviser (see Note 3). |
See accompanying Notes to Financial Statements.
79
Ultra Series Fund | December 31, 2012
Financial Highlights for a Share of Beneficial Interest Outstanding
| BOND FUND | |||||||||||||||
| Year Ended December 31, | |||||||||||||||
| 2012 | 2011 | 2010 | 2009 | 2008 | |||||||||||
| CLASS I | |||||||||||||||
| Net Asset Value at beginning of period | $10.57 | $10.29 | $10.14 | $9.94 | $10.19 | ||||||||||
Income from Investment Operations: |
|||||||||||||||
Net investment income2 |
0.34 | 0.38 | 0.40 | 0.43 | 0.50 | ||||||||||
Net realized and unrealized gain (loss) on investments |
0.00 | 0.31 | 0.20 | 0.21 | (0.21 | ) | |||||||||
Total from investment operations |
0.34 | 0.69 | 0.60 | 0.64 | 0.29 | ||||||||||
Less Distributions: |
|||||||||||||||
Distributions from net investment income |
(0.36 | ) | (0.41 | ) | (0.45 | ) | (0.44 | ) | (0.54 | ) | |||||
| Net increase (decrease) in net asset value | (0.02 | ) | 0.28 | 0.15 | 0.20 | (0.25 | ) | ||||||||
| Net Asset Value at end of period | $10.55 | $10.57 | $10.29 | $10.14 | $9.94 | ||||||||||
| Total Return3 (%) | 3.21 | 6.73 | 5.92 | 6.50 | 2.86 | ||||||||||
| Ratios/Supplemental Data: | |||||||||||||||
| Net Assets at end of period (in 000’s) | $340,335 | $375,325 | $429,499 | $541,789 | $572,562 | ||||||||||
| Ratios of expenses to average net assets (%) | 0.56 | 0.57 | 0.56 | 0.57 | 0.56 | ||||||||||
| Ratio of net investment income to average net assets (%) | 3.13 | 3.62 | 3.76 | 4.28 | 4.84 | ||||||||||
| Portfolio Turnover6 (%) | 11 | 6 | 2 | 25 | 12 | ||||||||||
| Inception to | |||||||||||||||
| CLASS II | 2012 | 2011 | 2010 | 12/31/091 | |||||||||||
| Net Asset Value at beginning of period | $10.56 | $10.28 | $10.14 | $9.85 | |||||||||||
Income from Investment Operations: |
|||||||||||||||
Net investment income2 |
0.31 | 0.36 | 0.37 | 0.27 | |||||||||||
Net realized and unrealized gain (loss) on investments |
0.01 | 0.31 | 0.20 | 0.28 | |||||||||||
Total from investment operations |
0.32 | 0.67 | 0.57 | 0.55 | |||||||||||
Less Distributions: |
|||||||||||||||
Distributions from net investment income |
(0.34 | ) | (0.39 | ) | (0.43 | ) | (0.26 | ) | |||||||
| Net increase (decrease) in net asset value | (0.02 | ) | 0.28 | 0.14 | 0.29 | ||||||||||
| Net Asset Value at end of period | $10.54 | $10.56 | $10.28 | $10.14 | |||||||||||
| Total Return3 (%) | 2.96 | 6.47 | 5.66 | 5.55 | 4 | ||||||||||
| Ratios/Supplemental Data: | |||||||||||||||
| Net Assets at end of period (in 000’s) | $49,456 | $49,774 | $35,750 | $9,719 | |||||||||||
| Ratios of expenses to average net assets (%) | 0.81 | 0.82 | 0.81 | 0.82 | 5 | ||||||||||
| Ratio of net investment income to average net assets (%) | 2.88 | 3.36 | 3.49 | 3.86 | 5 | ||||||||||
| Portfolio Turnover6 (%) | 11 | 6 | 2 | 25 | 4 | ||||||||||
| 1 | Commenced investment operations May 1, 2009. | |
| 2 | Based on average shares outstanding during the year. | |
| 3 | These returns are after all charges at the mutual fund level have been subtracted. These returns are higher than the returns at the separate account level because charges made at the separate account level have not been subtracted. | |
| 4 | Not annualized. | |
| 5 | Annualized. | |
| 6 | Portfolio Turnover is calculated at the fund level and represents the entire fiscal year or period. |
See accompanying Notes to Financial Statements.
80
Ultra Series Fund | December 31, 2012
Financial Highlights for a Share of Beneficial Interest Outstanding
| HIGH INCOME FUND | |||||||||||||||
| Year Ended December 31, | |||||||||||||||
| 2012 | 2011 | 2010 | 2009 | 2008 | |||||||||||
| CLASS I | |||||||||||||||
| Net Asset Value at beginning of period | $9.18 | $9.42 | $9.11 | $7.34 | $9.54 | ||||||||||
Income from Investment Operations: |
|||||||||||||||
Net investment income2 |
0.61 | 0.65 | 0.72 | 0.68 | 0.67 | ||||||||||
Net realized and unrealized gain (loss) on investments |
0.42 | (0.18 | ) | 0.35 | 1.80 | (2.07 | ) | ||||||||
Total from investment operations |
1.03 | 0.47 | 1.07 | 2.48 | (1.40 | ) | |||||||||
Less Distributions: |
|||||||||||||||
Distributions from net investment income |
(0.84 | ) | (0.71 | ) | (0.76 | ) | (0.71 | ) | (0.80 | ) | |||||
| Net increase (decrease) in net asset value | 0.19 | (0.24 | ) | 0.31 | 1.77 | (2.20 | ) | ||||||||
| Net Asset Value at end of period | $9.37 | $9.18 | $9.42 | $9.11 | $7.34 | ||||||||||
| Total Return3 (%) | 11.23 | 5.01 | 11.73 | 34.29 | (14.74 | ) | |||||||||
| Ratios/Supplemental Data: | |||||||||||||||
| Net Assets at end of period (in 000’s) | $60,362 | $86,462 | $95,552 | $107,722 | $90,728 | ||||||||||
| Ratios of expenses to average net assets (%) | 0.77 | 0.77 | 0.77 | 0.77 | 0.76 | ||||||||||
| Ratio of net investment income to average net assets (%) | 6.31 | 6.76 | 7.54 | 7.94 | 7.42 | ||||||||||
| Portfolio Turnover6 (%) | 55 | 54 | 53 | 73 | 45 | ||||||||||
| Inception | |||||||||||||||
| to | |||||||||||||||
| 2012 | 2011 | 2010 | 12/31/091 | ||||||||||||
| CLASS II | |||||||||||||||
| Net Asset Value at beginning of period | $9.19 | $9.42 | $9.11 | $8.14 | |||||||||||
Income from Investment Operations: |
|||||||||||||||
Net investment income2 |
0.58 | 0.63 | 0.70 | 0.47 | |||||||||||
Net realized and unrealized gain (loss) on investments |
0.42 | (0.18 | ) | 0.34 | 0.96 | ||||||||||
Total from investment operations |
1.00 | 0.45 | 1.04 | 1.43 | |||||||||||
Less Distributions: |
|||||||||||||||
Distributions from net investment income |
(0.82 | ) | (0.68 | ) | (0.73 | ) | (0.46 | ) | |||||||
| Net increase (decrease) in net asset value | 0.18 | (0.23 | ) | 0.31 | 0.97 | ||||||||||
| Net Asset Value at end of period | $9.37 | $9.19 | $9.42 | $9.11 | |||||||||||
| Total Return3 (%) | 10.95 | 4.75 | 11.45 | 17.49 | 4 | ||||||||||
| Ratios/Supplemental Data: | |||||||||||||||
| Net Assets at end of period (in 000’s) | $6,737 | $6,213 | $4,286 | $1,148 | |||||||||||
| Ratios of expenses to average net assets (%) | 1.02 | 1.02 | 1.01 | 1.01 | 5 | ||||||||||
| Ratio of net investment income to average net assets (%) | 6.02 | 6.52 | 7.20 | 7.65 | 5 | ||||||||||
| Portfolio Turnover6 (%) | 55 | 54 | 53 | 73 | 4 | ||||||||||
See accompanying Notes to Financial Statements. 81 Ultra Series Fund | December 31, 2012 Financial Highlights for a Share of Beneficial
Interest Outstanding
Income from Investment Operations: Net
investment income2 Net
realized and unrealized gain (loss) on investments Total
from investment operations Distributions
from net investment income Distributions
from capital gains Total
distributions
Income from Investment Operations: Net
investment income2 Net
realized and unrealized gain (loss) on investments Total
from investment operations
Less Distributions: Distributions
from net investment income See accompanying Notes to Financial Statements. 82 Ultra Series Fund | December 31, 2012 Financial Highlights for a Share of Beneficial
Interest Outstanding See accompanying Notes to Financial Statements. 83 Ultra Series Fund | December 31, 2012 Financial Highlights for a Share of Beneficial
Interest Outstanding
Income from Investment Operations: Net
investment income2 Net
realized and unrealized gain (loss) on investments Total
from investment operations
Less Distributions: Distributions
from net investment income Distributions
from capital gains Total
distributions
Income from Investment Operations: Net
investment income2 Net
realized and unrealized gain (loss) on investments Total
from investment operations
Less Distributions: Distributions
from net investment income See accompanying Notes to Financial Statements. 84 Ultra Series Fund | December 31, 2012 Financial Highlights for a Share of Beneficial
Interest Outstanding
Income from Investment Operations: Net
investment income2 Net
realized and unrealized gain (loss) on investments Total
from investment operations
Less Distributions: Distributions
from net investment income Distributions
from capital gains Total
distributions
Income from Investment Operations: Net
investment income2 Net
realized and unrealized gain (loss) on investments Total
from investment operations
Less Distributions: Distributions
from net investment income See accompanying Notes to Financial Statements. 85 Ultra Series Fund | December 31, 2012 Financial Highlights for a Share of Beneficial
Interest Outstanding
Income from Investment Operations: Net
investment income2 Net
realized and unrealized gain (loss) on investments Total
from investment operations
Less Distributions: Distributions
from net investment income Distributions
from capital gains Total
distributions
Income from Investment Operations: Net
investment income2 Net
realized and unrealized gain (loss) on investments Total
from investment operations
Less Distributions: Distributions
from net investment income See accompanying Notes to Financial Statements. 86 Ultra Series Fund | December 31, 2012 Financial Highlights for a Share of Beneficial
Interest Outstanding
Income from Investment Operations: Net
investment income2
Net realized and unrealized gain (loss) on investments Total
from investment operations
Less Distributions: Distributions
from net investment income Distributions
from capital gains Total
distributions
Income from Investment Operations: Net
investment income2 Net
realized and unrealized gain (loss) on investments Total
from investment operations
Less Distributions: Distributions
from net investment income See accompanying Notes to Financial Statements. 87 Ultra Series Fund | December 31, 2012 Financial Highlights for a Share of Beneficial
Interest Outstanding
Income from Investment Operations: Net
investment income1 Net
realized and unrealized gain (loss) on investments Total
from investment operations
Less Distributions: Distributions
from net investment income Distributions
from capital gains Total
distributions Before
reimbursement of expenses by Adviser (%) After
reimbursement of expenses by Adviser (%) See accompanying Notes to Financial Statements. 88 Ultra Series Fund | December 31, 2012 Financial Highlights for a Share of Beneficial
Interest Outstanding
Income from Investment Operations: Net
investment income1 Net
realized and unrealized gain (loss) on investments Total
from investment operations
Less Distributions: Distributions
from net investment income Distributions
from capital gains Total
distributions Before
reimbursement of expenses by Adviser (%) After
reimbursement of expenses by Adviser (%) See accompanying Notes to Financial Statements. 89 Ultra Series Fund | December 31, 2012 Financial Highlights for a Share of Beneficial
Interest Outstanding
Income from Investment Operations: Net
investment income1 Net
realized and unrealized gain (loss) on investments Total
from investment operations
Less Distributions: Distributions
from net investment income Distributions
from capital gains Total
distributions Before
reimbursement of expenses by Adviser (%) After
reimbursement of expenses by Adviser (%) See accompanying Notes to Financial Statements. 90 Ultra Series Fund | December 31, 2012 Financial Highlights for a Share of Beneficial
Interest Outstanding
Income from Investment Operations: Net
investment income2 Net
realized and unrealized gain (loss) on investments Total
from investment operations
Less Distributions: Distributions
from net investment income Distributions
from return of capital Distributions
from capital gains Total
distributions Before
reimbursement of expenses by Adviser (%) After
reimbursement of expenses by Adviser (%) See accompanying Notes to Financial Statements. 91
1. ORGANIZATION The Ultra Series Fund (the “Trust”), a Massachusetts business trust, is registered under the Investment Company
Act of 1940 (the “1940 Act”), as amended, as a diversified, open-end
management investment company. The Trust is a series fund with, at the end of the
period covered by this report, 16 investment portfolios (individually, a “fund,” and collectively, the “funds”), each with different investment
objectives and policies. The funds currently available at the end of the period
were the Money Market Fund, Bond Fund, High Income Fund, Diversified Income Fund,
Large Cap Value Fund, Large Cap Growth Fund, Mid Cap Fund, Small Cap Fund and International
Stock Fund (collectively, the “Core Funds”), the Conservative Allocation
Fund, Moderate Allocation Fund and Aggressive Allocation Fund (collectively, the
“Target Allocation Funds”), and the Madison Target Retirement 2020
Fund, Madison Target Retirement 2030 Fund, Madison Target Retirement 2040 Fund,
and Madison Target Retirement 2050 Fund, (collectively, the “Target Date Funds”). The Declaration of Trust permits the Board
of Trustees to issue an unlimited number of full and fractional shares of the Trust
without par value. All funds, except for the Target Date Funds, offer Class I and
II shares. The Target Date Funds only offer a single class of shares, Class I shares.
Each class of shares represents an interest in the assets of the respective fund
and has identical voting, dividend, liquidation and other rights, except that each
class of shares bears its own distribution fees, if any, and its proportional share
of fund level expenses, and has exclusive voting rights on matters pertaining to
Rule 12b-1 under the 1940 Act as it relates to that class and other class specific
matters. Shares are offered to separate accounts (the “Accounts”)
of CMFG Life Insurance Company and to qualified pension and retirement plans of
CMFG Life Insurance Company or it’s affiliates (“CUNA Mutual Group”). The Trust may, in the future, offer other share classes to separate accounts
of insurance companies and to qualified pension and retirement plans that are not
affiliated with CUNA Mutual Group. The Trust does not offer shares directly to the
general public. The Trust has entered into a Management
Agreement with Madison Asset Management, LLC. (the “Investment Adviser”
or “Madison”). The Investment Adviser, in turn, has entered into subadvisory
agreements with certain subadvisers (“Subadvisers”) for the management
of the investments of the High Income, Small Cap and International Stock Funds. 2. SIGNIFICANT ACCOUNTING POLICIES The preparation of financial statements
requires management to make estimates and assumptions that affect the reported amounts
of assets and liabilities and disclosure of contingent assets and liabilities at
the date of the financial statements and the reported amounts of income and expenses
during the reported period. Actual results could differ from those estimates. The
following is a summary of significant accounting policies consistently followed
by each fund in the preparation of its financial statements. Portfolio Valuation: Equity securities,
including American Depositary Receipts (“ADRs”), Global Depositary Receipts
(“GDRs”) and exchange-traded funds (“ETFs”) listed on any U.S.
or foreign stock exchange or quoted on the National Association of Securities Dealers
Automated Quotation System (“NASDAQ”) are valued at the last quoted
sale price or official closing price on that exchange or NASDAQ on the valuation
day (provided that, for securities traded on NASDAQ, the funds utilize the NASDAQ
Official Closing Price). If no sale occurs, (a) equities traded on a U.S. exchange
or on NASDAQ are valued at the mean between the closing bid and closing asked prices
and (b) equity securities traded on a foreign exchange are valued at the official
bid price. Debt securities purchased with a remaining maturity of 61 days or more
are valued on the basis of last available bid prices or current market quotations
provided by dealers or pricing services approved by the Trust. In determining the
value of a particular investment, pricing services may use certain information with
respect to transactions in such investments, quotations from dealers, pricing matrixes,
market transactions in comparable investments, various relationships observed in
the market between investments and calculated yield measures based on valuation
technology commonly 92 employed in the market for such investments.
Asset-backed and mortgage-backed securities are valued by independent pricing services
using models that consider estimated cash flows of each tranche of the security,
establish a benchmark yield and develop an estimated tranche specific spread to
the benchmark yield based on the unique attributes of the tranche. Investments in shares of open-end mutual
funds, including money market funds, are valued at their daily net asset value (“NAV”) which is calculated as of the close of regular trading on the New
York Stock Exchange (usually 4:00 p.m. Eastern Standard Time) on each day on which
the New York Stock Exchange is open for business. NAV per share is determined by
dividing each fund’s total net assets by the number of shares of such fund
outstanding at the time of calculation. Because the assets of each Target Allocation
and each Target Date Fund consist primarily of shares of underlying funds, the NAV
of each fund is determined based on the NAV’s of the underlying funds. Total
net assets are determined by adding the total current value of portfolio securities,
cash, receivables, and other assets and subtracting liabilities. Short-term instruments
having maturities of 60 days or less and all securities in the Money Market Fund
are valued on an amortized cost basis, which approximates market value. Over-the-counter securities not listed or
traded on NASDAQ are valued at the last sale price on the valuation day. If no sale
occurs on the valuation day, an over-the-counter security is valued at the mean
between the last bid and asked prices. Spot and forward foreign currency exchange
contracts are valued based on quotations supplied by dealers in such contracts.
Overnight repurchase agreements are valued at cost, and term repurchase agreements
(i.e., those whose maturity exceeds seven days), swaps, caps, collars and floors,
if any, are valued at the average of the closing bids obtained daily from at least
one dealer. Through the end of this reporting period,
the value of all assets and liabilities expressed in foreign currencies was converted
into U.S. dollar values using the then-current exchange rate at the close of regular
trading on the New York Stock Exchange (usually 4:00 p.m. Eastern Standard Time). All other securities for which either quotations
are not readily available, no other sales have occurred, or in the Investment Adviser’s opinion, do not reflect the current market value, are appraised at their
fair values as determined in good faith by The Trust’s Pricing Committee (the
“Committee”) and under the general supervision of the Board of Trustees.
When fair value pricing of securities is employed, the prices of securities used
by the funds to calculate NAV may differ from market quotations or official closing
prices. Because the Target Allocation and Target Date Funds primarily invest in
underlying funds, government securities and short-term paper, it is not anticipated
that the Investment Adviser will need to fair value any of the investments of these
funds. However, an underlying fund may need to fair value one or more of its investments,
which may, in turn, require a Target Allocation or Target Date Fund to do the same
because of delays in obtaining the underlying Fund’s NAV. A fund’s investments (or underlying
fund) will be valued at fair value, if in the judgment of the Committee an event
impacting the value of an investment occurred between the closing time of a security’s primary market or exchange (for example, a foreign exchange or market) and
the time the fund’s share price is calculated as of the close of regular trading
on the New York Stock Exchange (usually 4:00 p.m. Eastern Standard Time). Significant
events may include, but are not limited to, the following: (1) significant fluctuations
in domestic markets, foreign markets or foreign currencies; (2) occurrences not
directly tied to the securities markets such as natural disasters, armed conflicts
or significant government actions; and (3) major announcements affecting a single
issuer or an entire market or market sector. In responding to a significant event,
the Committee would determine the fair value of affected securities considering
factors including, but not limited to: fundamental analytical data relating to the
investment; the nature and duration of any restrictions on the disposition of the
investment; and the forces influencing the market(s) in which the investment is
purchased or sold. The Committee may 93 rely on an independent fair valuation service
to adjust the valuations of foreign equity securities based on specific market-movement
parameters established by the Committee and approved by the Trust. Security Transactions and Investment Income:
Security transactions are accounted for on a trade date basis. Net realized gains
or losses on sales are determined by the identified cost method. Interest income
is recorded on an accrual basis. Dividend income is recorded on ex-dividend date.
Amortization and accretion are recorded on the effective yield method. Expenses: Expenses that are directly related
to one fund are charged directly to that fund. Other operating expenses are prorated
to the funds on the basis of relative net assets. Class-specific expenses are borne
by that class. Classes: Income and realized and unrealized
gains/losses are allocated to the respective classes on the basis of relative net
assets. Repurchase Agreements: Each fund may engage
in repurchase agreements. In a repurchase agreement, a security is purchased for
a relatively short period (usually not more than 7 days) subject to the obligation
to sell it back to the issuer at a fixed time and price plus accrued interest. The
funds will enter into repurchase agreements only with member banks of the Federal
Reserve System and with “primary dealers” in U.S. Government securities.
As of December 31, 2012, none of the funds held open repurchase agreements. The Trust has established a procedure providing
that the securities serving as collateral for each repurchase agreement must be
delivered to the Trust’s custodian either physically or in book-entry form
and that the collateral must be marked to market daily to ensure that the repurchase
agreement is fully collateralized at all times. In the event of bankruptcy or other
default by a seller of a repurchase agreement, a fund could experience one of the
following: delays in liquidating the underlying securities during the period in
which the fund seeks to enforce its rights thereto, possible subnormal levels of
income, declines in value of the underlying securities, or lack of access to income
during this period and the expense of enforcing its rights. In April 2011, the Financial Accounting
Standards Board (“FASB”) issued Accounting Standards Update (“ASU”) No. 2011-03 “Reconsideration of Effective Control of Repurchase Agreements”. ASU 2011-03 is an amendment to Topic 860 “Transfers and Servicing”.
These amendments simplify the accounting for repurchase agreements by eliminating
the requirement that the transferor demonstrate it has adequate collateral to fund
substantially all the cost of purchasing replacement assets. As a result, more arrangements
could be accounted for as secured borrowings rather than sales. The guidance applies
to public and nonpublic companies and is effective for interim and annual reporting
periods beginning on or after December 15, 2011. The guidance should be applied
prospectively to transactions or modifications of existing transactions that occur
on or after the effective date. The funds have adopted this guidance and have determined
that the updated standards have no material impact on the funds’ financial
statements. Foreign Currency Transactions: The books
and records are maintained in U.S. dollars. Foreign currency denominated transactions
(i.e., market value of investment securities, assets and liabilities, purchases
and sales of investment securities, and income and expenses) are translated into
U.S. dollars at the current rate of exchange. The funds enter into contracts on
the trade date to settle any securities transactions denominated in foreign currencies
on behalf of the funds at the spot rate at settlement. Each fund, except the Money Market Fund,
which can only invest in U.S. dollar-denominated foreign money market securities,
reports certain foreign currency-related transactions as components of realized
gains or losses for financial reporting purposes, whereas such components are treated
as ordinary income for federal income tax purposes. Only the 94 International Stock Fund had net realized
gains, and that amount of $196,482 is included in the Statements of Operations under
the heading “Net realized gain (loss) on investments” for that fund. The Funds do not isolate the portion of
gains and losses on investments in securities that is due to changes in the foreign
exchange rates from that which is due to changes in market prices of securities.
Such amounts are categorized as gain or loss on investments for financial reporting
purposes. Forward Foreign Currency Exchange Contracts:
Each fund, except the Money Market Fund, may purchase and sell forward foreign currency
exchange contracts for defensive or hedging purposes. When entering into forward
foreign currency exchange contracts, the funds agree to receive or deliver a fixed
quantity of foreign currency for an agreed-upon price on an agreed future date.
These contracts are valued daily. The funds’ net assets reflect unrealized
gains or losses on the contracts as measured by the difference between the forward
foreign currency exchange rates at the dates of entry into the contracts and the
forward rates at the reporting date. The funds realize a gain or a loss at the time
the forward foreign currency exchange contracts are settled or closed out with an
offsetting contract. Realized and unrealized gains and losses are included in the
Statements of Operations. As of December 31, 2012, none of the funds had open forward
foreign currency exchange contracts. If a fund enters into a forward foreign
currency exchange contract to buy foreign currency for any purpose, the fund will
be required to place cash or other liquid assets in a segregated account with the
fund’s custodian in an amount equal to the value of the fund’s total assets
committed to the consummation of the forward contract. If the value of the securities
in the segregated account declines, additional cash or securities will be placed
in the segregated account so that the value of the account will equal the amount
of the fund’s commitment with respect to the contract. Illiquid Securities: Each fund currently
limits investments in illiquid securities to 15% of net assets at the time of purchase,
except for Money Market which limits the investment in illiquid securities to 5%
of net assets. An illiquid security is generally defined as any investment that
may be difficult to sell within seven days for the price at which the fund values
it. At December 31, 2012, investments in securities of the Bond and Diversified
Income Funds include issues that are illiquid. The aggregate values of illiquid
securities held by Bond and Diversified Income Funds were $16,177,927 and $9,439,256,
respectively, which represent 4.2% and 2.4% of net assets, respectively. Pursuant
to guidelines adopted by the Board of Trustees, certain unregistered securities
are determined to be liquid and are not included within the percent limitations
specified above. Information concerning the illiquid securities held at December
31, 2012, which includes cost and acquisition date, is as follows: 95 Delayed Delivery Securities: Each fund may
purchase securities on a when-issued or delayed delivery basis. “When-issued” refers to securities whose terms are available and for which a market
exists, but that have not been issued. For when-issued or delayed delivery transactions,
no payment is made until delivery date, which is typically longer than the normal
course of settlement, and often a month or more after the purchase. When a fund
enters into an agreement to purchase securities on a when-issued or delayed delivery
basis, the fund segregates cash or other liquid securities, of any type or maturity,
equal in value to the fund’s commitment. Losses may arise due to changes in
the market value of the underlying securities, if the counterparty does not perform
under the contract, or if the issuer does not issue the securities due to political,
economic or other factors. As of December 31, 2012, none of the funds had entered
into such transactions. Fair Value Measurements: Each fund has adopted
the FASB guidance on fair value measurements. Fair value is defined as the price
that each fund would receive upon selling an investment in a timely transaction
to an independent buyer in the principal or most advantageous market of the investment.
A three-tier hierarchy is used to maximize the use of observable market data “inputs” and minimize the use of unobservable “inputs” and to establish classification
of fair value measurements for disclosure purposes. Inputs refer broadly to the
assumptions that market participants would use in pricing the asset or liability,
including assumptions about risk (for example, the risk inherent in a particular
valuation technique used to measure fair value including such a pricing model and/or
the risk inherent in the inputs used in the valuation technique). Inputs may be
observable or unobservable. Observable inputs are inputs that reflect
the assumptions market participants would use in pricing the asset or liability
developed based on market data obtained from sources independent of the reporting
entity. Unobservable inputs are inputs that reflect the reporting entity’s
own assumptions about the assumptions market participants would use in pricing the
asset or liability developed based on the best information available in the circumstances.
The three-tier hierarchy of inputs is summarized in the three broad Levels listed
below: • Level 1 – unadjusted quoted
prices in active markets for identical investments • Level 2 – other significant
observable inputs (including quoted prices for similar investments, interest rate
volatilities, prepayment speeds, credit risk, benchmark yields, transactions, bids,
offers, new issues, spreads and other relationships observed in the markets among
comparable securities, underlying equity of the issuer; and proprietary pricing
models such as yield measures calculated using factors such as cash flows, financial
or collateral performance and other reference data, etc.) • Level 3 – significant
unobservable inputs (including the Fund’s own assumptions in determining the
fair value of investments) The valuation techniques used by the Funds
to measure fair value for the period ended December 31, 2012 maximized the use of
observable inputs and minimized the use of unobservable inputs. The Funds utilized
the following fair value techniques: multidimensional relational pricing model and
option adjusted spread pricing; the Funds estimated the price that would have prevailed
in a liquid market for an international equity security given information available
at the time of evaluation. Through the period ended December 31, 2012, none of the
Funds held securities deemed as a Level 3 and there were no transfers between classification
levels. 96 The following is a summary of the inputs
used as of December 31, 2012 in valuing the funds’ investments carried at fair
value (please see the Portfolio of Investments for each Fund for a listing of all
securities within each category): Asset
Backed Corporate
Notes and Bonds Mortgage
Backed U.S.
Government and Agency Obligations Investment
Companies Corporate
Notes and Bonds Investment
Companies Common
Stocks Asset
Backed Corporate
Notes and Bonds Mortgage
Backed U.S.
Government and Agency Obligations Investment
Companies Common
Stocks Investment
Companies Common
Stocks Investment
Companies Common
Stocks Investment
Companies Common
Stocks Investment
Companies 97 Common
Stocks Australia Belgium Brazil Canada Finland France Germany Indonesia Ireland Italy Japan Mexico Netherlands New
Zealand Philippines Russia South
Africa South
Korea Spain Sweden Switzerland Thailand Turkey United
Kingdom New Accounting Pronouncements: In May 2011,
the FASB issued ASU 2011-04, modifying Topic 820, “Fair Value Measurements
and Disclosures.” At the same time, the International Accounting Standards
Board (“IASB”) issued International Financial Reporting Standard (“IFRS”) 13, “Fair Value Measurement.” The objective by the FASB and IASB
is convergence of their guidance on fair value measurements and disclosures. The
effective date of the ASU is for interim and annual periods beginning after December
15, 2011. The funds have adopted the disclosures required by this update. In December 2011, the IASB and the FASB
issued ASU 2011-11 “Disclosures about Offsetting Assets and Liabilities.”
These common disclosure requirements are intended to help investors and other financial
statement users to better assess the effect or potential effect of offsetting arrangements
on a portfolio’s financial position. They also improve transparency in the
reporting of how companies mitigate credit risk, including disclosure of related
collateral pledged or received. In addition, ASU 2011-11 facilitates comparison
between these entities that prepare their financial statements on the basis of U.S.
GAAP and those entities that prepare their financial statements on the basis of
IFRS. ASU 2011-11 requires entities to disclose both gross and net information about
both instruments and transactions eligible for offset in the financial position;
and disclose 98 instruments and transactions subject to
an agreement similar to a master netting agreement. ASU 2011-11 is effective for
fiscal years beginning on or after January 1, 2013 and interim periods within those
annual periods. The funds are currently evaluating the implications of ASU 2011-11
and its impact on financial statements disclosures. 3. MANAGEMENT, SERVICES AND DISTRIBUTION
AGREEMENTS Management Agreement: For services under
the Management Agreement, the Investment Adviser is entitled to receive a management
fee, which is calculated daily and paid monthly, at an annual rate based upon the
following percentages of average daily net assets: 0.45% for the Money Market Fund,
0.55% for the Bond Fund, 0.75% for the High Income Fund, 0.70% for the Diversified
Income Fund, 0.60% for the Large Cap Value Fund, 0.80% for the Large Cap Growth
Fund, 0.90% for the Mid Cap Fund, 1.10% for the Small Cap Fund, 1.20% for the International
Stock Fund, 0.30% for each of the Target Allocation Funds and 0.25% for each of
the Target Date Funds. The Management Agreement requires the Investment
Adviser to provide or arrange to provide overall management of the funds, including
but not limited to, investment advisory services, custody, transfer agency, dividend
disbursing, legal, accounting and administrative services. It does not include Trustee
compensation or the fees paid to the Trust’s independent Registered Public
Accountant. The Investment Adviser is solely responsible
for the payment of all fees to the Subadvisers. The Subadvisers for the funds are
Shenkman Capital Management, Inc. for the High Income Fund, Wellington Management
Company, LLP for the Small Cap Fund and Lazard Asset Management LLC for the International
Stock Fund. The Investment Adviser manages the Money Market Fund, Bond Fund, Diversified
Income Fund, Large Cap Growth Fund, Large Cap Value Fund, Mid Cap Fund, Target Allocation
Funds and the Target Date Funds without the aid of a Subadviser. The Investment Adviser may from time to
time voluntarily agree to waive a portion of its fees or expenses related to the
Funds. In that regard, the Investment Adviser waived a portion of management fees
on the Money Market Class I Shares and Class II Shares for the purpose of maintaining
a one-day yield of zero. The amount of the daily waiver is equal to the amount required
to maintain a minimum daily distribution rate of zero. For the period ended December
31, 2012, the waivers totaled $192,101 for Class I Shares and $3,048 for Class II
Shares and are reflected as fees waived by the Investment Advisor in the accompanying
Statements of Operations. The Investment Adviser does not have the right to recoup
these waived fees. Services Agreement: Effective September
1, 2011, the Investment Adviser entered into a services agreement (“Services Agreement”) for the Target Date Funds.
Under the Services Agreement, Madison provides either directly or through outsourced
arrangements all operational and support services of the Target Date Funds not provided
under the Management Agreement discussed above. Under this Services Agreement, Madison
receives a fee of 0.05% (annualized) of the average daily net assets of each Target
Date Fund. In exchange for the aforementioned fee, Madison is responsible for paying
all of the funds’ fees and expenses, other than (i) the management fee (described
above), (ii) fees related to the funds’ portfolio holdings (such as brokerage
commissions, interest on loans, etc.), (iii) acquired fund fees, and (iv) extraordinary
or non-recurring fees (such as fees and costs relating to any temporary line of
credit the funds may maintain for emergency or extraordinary purposes). The direct
expenses of the funds’ independent Trustees and independent auditors are paid
out of this fee by the funds. Pursuant to the Services Agreement, Madison has also
agreed, until April 30, 2013, to waive and/or reimburse investment advisory fees
and/or its services fee to the extent necessary to limit each fund’s total
operating expenses and underlying fees and expenses to 0.65% of average daily net
assets of each Target Date Fund. In applying this waiver, Madison must utilize good
faith estimates of the fees and expenses of the underlying funds. The Investment
Adviser does not have the right to recoup these waived fees. 99 Distribution Agreement: Mosaic Funds Distributor,
LLC (“MFD”) serves as distributor of the funds. The Trust adopted a distribution
and service plan with respect to the Trust’s Class II shares pursuant to Rule
12b-1 under the 1940 Act. Under the plan, the Trust will pay a service fee with
regard to Class II shares at an annual rate of 0.25% of each fund’s daily net
assets. MFD arranges to provide compensation to others that provide distribution
and shareholder servicing services to the funds and their shareholders. Fees incurred
by the Funds under the plan are detailed in the Statements of Operations. The distributor may from time to time voluntarily
agree to waive a portion of its fees or expenses related to the funds. In this regard,
the distributor waived a portion of 12b-1 fees on the Money Market Class II shares
for the purpose of maintaining a one-day yield of zero. For the period ended December
31, 2012, the waivers totaled $2,248 and are reflected as fees waived in the Statements
of Operations. Neither MFD nor the Investment Adviser has the right to recoup these
waived fees. MFD changed its name to MFD Distributor,
LLC on February 1, 2013, after the date of the period covered by this report. Other Expenses: In addition to the management
fee, the Trust, except for the Target Date Funds effective September 1, 2011, is
responsible for fees of the disinterested trustees, brokerage commissions and other
expenses incurred in connection with the acquisition or disposition of investments,
costs of borrowing money, expenses for independent audits, any potential taxes owed
and extraordinary expenses as approved by a majority of Independent Trustees. Effective
September 1, 2011, the fees for the disinterested trustees and independent audits
are paid out of the Services Agreement fee (noted above) for the Target Date Funds. Certain officers and trustees of the Trust
are also officers of the Investment Adviser. The funds do not compensate their officers
or affiliated trustees. Unaffiliated trustees receive from the Trust an attendance
fee for each Board or Committee meeting attended, with additional remuneration paid
to Audit Committee and Nominating and Governance Committee Chairpersons. 4. DIVIDENDS FROM NET INCOME AND DISTRIBUTIONS
OF CAPITAL GAINS The Money Market Fund declares dividends
from net investment income and net realized gains from investment transactions,
if any, daily, and net realized gains from investment transactions, if any, annually,
which are reinvested in additional full and fractional shares of the fund. The Bond
Fund, High Income Fund, Diversified Income Fund, Large Cap Value Fund, Large Cap
Growth Fund, Small Cap, Mid Cap Fund, International Stock Fund, Target Allocation
Funds, and Target Date Funds declare dividends from net investment income and net
realized gains from investment transactions, if any, annually, which are reinvested
in additional full and fractional shares of the respective funds. Income and capital gain distributions, if
any, are determined in accordance with federal income tax regulations, which may
differ from accounting principles generally accepted in the United States of America.
Taxable distributions from income and realized capital gains of the funds may differ
from book amounts earned during the period due to differences in the timing of capital
gains recognition, and due to the reclassification of certain gains or losses from
capital to income. 5. SECURITIES TRANSACTIONS For the period ended December 31, 2012,
aggregate cost of purchases and proceeds from sales of securities, other than short-term
investments, were as follows: 100 6. FOREIGN SECURITIES Each fund may invest in foreign securities;
however, the Money Market Fund is limited to U.S. dollar-denominated foreign money
market securities. Foreign securities include American Depositary Receipts (“ADRs”), European Depositary Receipts (“EDRs”), Global Depositary
Receipts (“GDRs”), Swedish Depositary Receipts (“SDRs”) and foreign money market securities. Dollar-denominated securities that are
part of the Merrill Lynch U.S. Domestic Master Index are not considered a foreign
security. Certain funds have reclaim receivable balances,
in which the funds are due a reclaim on the taxes that have been paid to some foreign
jurisdictions. The values of all reclaims are not significant for any of the Funds
and are reflected in Other Assets on the Statements of Assets and Liabilities. These
receivables are reviewed to ensure the current receivable balance is reflective
of the amount deemed to be collectable. 7. SECURITIES LENDING Each fund, except the Target Allocation,
Money Market, Small Cap and Target Retirement Funds, entered into a Securities Lending
Agreement (the “Agreement”) with State Street Bank and Trust Company (“State Street”). Under the terms of the Agreement, the funds may lend portfolio
securities to qualified borrowers in order to earn additional income. The Agreement
requires that loans are collateralized at all times by cash or other liquid assets
at least equal to 102% of the value of the securities, which is determined on a
daily basis. Amounts earned as interest on investments of cash collateral, net of
rebates and fees, if any, are included in the Statements of Operations. The primary
risk associated with securities lending is if the borrower defaults on its obligation
to return the securities loaned because of insolvency or other reasons, the funds
could experience delays and costs in recovering securities loaned or in gaining
access to the collateral. At December 31, 2012, none of the funds
had securities out on loan. 8. FEDERAL INCOME TAX INFORMATION It is each fund’s policy to comply
with the requirements of Subchapter M of the Internal Revenue Code of 1986 applicable
to regulated investment companies and to distribute all its taxable income to its
shareholders. Accordingly, no provisions for federal income taxes are recorded in
the accompanying financial statements. The funds have not recorded any liabilities
for material unrecognized tax benefits as of December 31, 2012. It is the funds’ policy to recognize accrued interest and penalties related to uncertain tax
benefits in income taxes, as appropriate. Tax years 101 that remain open to examination by major
tax jurisdictions include tax years ended December 31, 2009 through December 31,
2012. The tax character of distributions paid
during the years ended December 31, 2012 and 2011 was as follows: As of December 31, 2012, the components
of distributable earnings on a tax basis were as follows: The Regulated Investment Company (“RIC”) Modernization Act of 2010 (the “Modernization Act”) modernized
several of the federal income and excise tax provisions related to RICs. The Modernization
Act contains simplification provisions which are aimed at preventing disqualification
of a RIC for “inadvertent” failures of the asset diversification and/or
qualifying income tests. These changes are effective for tax years ending after
December 22, 2010. Additionally, the Modernization Act allows capital losses to
be carried forward indefinitely, and retain the character of the original loss,
exempts RICs from the preferential dividend rule, and repealed the 60-day designation
requirement for certain types of pay-through income and gains. These changes are
effective for tax years beginning after December 22, 2010. Previously, net capital
losses were carried forward for up to eight years and treated as short-term losses.
As a transition rule, the Modernization Act requires that post-enactment net capital
losses be used before pre-enactment net capital losses. For federal income tax purposes, the Funds
listed below have capital loss carryovers as of December 31, 2012, which are available
to offset future capital gains, if any, realized through the fiscal year listed: 102 Included in the net capital loss carryovers
for Mid Cap Fund, Small Cap Fund and International Stock Fund is $23,007,112, $810,060
and $9,802,327, respectively, of capital loss carryovers subject to certain limitations
upon availability, to offset future gains, if any, as the successor of a merger.
These acquired losses are included in the total losses available noted above. Certain specified losses incurred after
October 31 and within the taxable year are deemed to arise on the first day of the
funds’ next taxable year, if the funds so elect. For the year ended December
31, 2012, only the International Stock Fund elected to defer late-year ordinary
losses of $9,369. For the year ended December 31, 2012, capital
losses utilized for each fund were as follows: The Bond Fund had a capital loss carryover
expire unused in the current year in the amount of $73,579. At December 31, 2012, the aggregate gross
unrealized appreciation/depreciation and net unrealized appreciation (depreciation)
for all securities as computed on a federal income tax basis for each fund were
as follows: 103 The differences between cost amounts for
book purposes and tax purposes are primarily due to the tax deferral of losses. Reclassification Adjustments: Paid-in capital,
undistributed net investment income, and accumulated net realized gain (loss) have
been adjusted in the Statements of Assets and Liabilities for permanent book-tax
differences for all funds. Differences primarily relate to the tax
treatment of net operating losses, paydown gains and losses, foreign currency gains
and losses, and distributions from real estate investment trusts and passive foreign
investment companies. To the extent these book and tax differences
are permanent in nature, such amounts are reclassified at the end of the fiscal
year among paid-in capital in excess of par value, undistributed net investment
income (loss) and undistributed net realized gain (loss) on investments and foreign
currency translations. Accordingly, at December 31, 2012 reclassifications were
recorded as follows: 9. CONCENTRATION OF RISK Investing in certain financial instruments,
including forward foreign currency contracts and futures contracts, involves certain
risks. Risks associated with these instruments include potential for an illiquid
secondary market for the instruments or inability of counterparties to perform under
the terms of the contracts, changes in the value of foreign currency relative to
the U.S. dollar and financial statement volatility resulting from an imperfect correlation
between the movements in the prices of 104 the instruments and the prices of the underlying
securities and interest rates being hedged. The International Stock Fund may enter
into these contracts primarily to protect these funds from adverse currency movements. Investing in foreign securities involves
certain risks not necessarily found in U.S. markets. These include, but are not
limited to, risks associated with adverse changes in economic, political, regulatory
and other conditions, changes in currency exchange rates, exchange control regulations,
expropriation of assets or nationalization, imposition of withholding taxes on dividend
or interest payments or capital gains, and possible difficulty in obtaining and
enforcing judgments against foreign entities. Further, issuers of foreign securities
are subject to different, and often less comprehensive, accounting, reporting and
disclosure requirements than domestic issuers. The High Income Fund invests in securities
offering high current income which generally will include bonds in the below investment
grade categories of recognized ratings agencies (so-called “junk bonds”). These securities generally involve more credit risk than securities in the
higher rating categories. In addition, the trading market for high yield securities
may be relatively less liquid than the market for higher-rated securities. The High
Income Fund generally invests at least 80% of its assets in high yield securities. The Target Allocation Funds and Target Date
Funds are fund of funds, meaning that they invest primarily in the shares of other
registered investment companies (the “underlying funds”), including
exchange traded funds (“ETFs”). Thus, each fund’s investment performance
and its ability to achieve its investment goal are directly related to the performance
of the underlying funds in which it invests; and the underlying fund’s performance,
in turn, depends on the particular securities in which that underlying fund invests
and the expenses of that fund. Accordingly, these funds are subject to the risks
of the underlying funds in direct proportion to the allocation of their respective
assets among the underlying funds. Additionally, the Target Allocation Funds
and Target Date Funds are subject to asset allocation risk and manager risk. Manager
risk (i.e., fund selection risk) is the risk that the fund(s) selected to fulfill
a particular asset class underperforms its peers. Asset allocation risk is the risk
that the allocation of the fund’s assets among the various asset classes and
market segments will cause the fund to underperform other funds with a similar investment
objective. While investments in stocks and bonds have
been keystones in wealth building and management, at times these investments have
produced surprises. Those who enjoyed growth and income of their investments generally
were rewarded for the risks they took by investing in the markets. Although the
Investment Adviser seeks to appropriately address and manage the risks identified
and disclosed to you in connection with the management of the securities in the
funds, you should understand that the very nature of the securities markets includes
the possibility that there may be additional risks of which we are not aware. We
certainly seek to identify all applicable risks and then appropriately address the,
take appropriate action to reasonably manage them and, of course, to make you aware
of them so you can determine if they exceed your risk tolerance. Nevertheless, the
often volatile nature of the securities markets and the global economy in which
we work suggests that the risk of the unknown is something to consider in connection
with an investment in securities. Unforeseen events could under certain circumstances
produce a material loss of the value of some or all of the securities we manage
for you in the funds. 105 10. CAPITAL SHARES AND AFFILIATED OWNERSHIP
All capital shares outstanding at December
31, 2012, are owned by separate investment accounts and/or pension plans of CMFG
Life Insurance Company. The Target Allocation Funds invest in underlying
funds, of which certain underlying funds (the “affiliated underlying funds”), may be deemed to be under common control because of the same Board
of Trustees. The MEMBERS Mutual Funds audited financial statements for the fiscal
year ended October 31, 2012 are available at no cost on the Securities and Exchange
Commission’s website at www.sec.gov, by calling 1-202-551-8090 or by visiting
the MEMBERS Mutual Funds’ website at www.membersfunds.com. The Madison Mosaic
audited financial statements for the fiscal year ended December 31, 2012 are also
available at www.sec.gov, by calling 1-800-368-3195 or visiting www.mosaicfunds.com.
A summary of the transactions with each affiliated underlying fund as of December
31, 2012 follows:
106
11. SUBSEQUENT EVENTS Management has evaluated the impact of all
subsequent events on the funds through the date the financial statements were available
for issue. The Trust is aware of litigation relating
to attempts by certain fixed income security-holders of Lyondell Chemical company
(LYO) to retrieve proceeds from the sale by equity security-holders of LYO shares
occurring pursuant to its acquisition by merger in December 2007. The Midcap Fund
received proceeds of approximately $1,574,400 from the sale of its LYO equity securities
in December 2007. The Trust has not been named as a defendant in this litigation
as of the date of this report. No other events have taken place that meet
the definition of a subsequent event that require adjustment to, or disclosure in
the financial statements. 107 Ultra Series Fund | December 31, 2012 Report of Independent Registered Public
Accounting Firm To the Shareholders and Board of Trustees
of Ultra Series Fund: We have audited the accompanying statements
of assets and liabilities, including the portfolios of investments, of Ultra Series
Fund, comprising the Conservative Allocation Fund, Moderate Allocation Fund, Aggressive
Allocation Fund, Money Market Fund, Bond Fund, High Income Fund, Diversified Income
Fund, Large Cap Value Fund, Large Cap Growth Fund, Mid Cap Fund, Small Cap Fund,
International Stock Fund, Madison Target Retirement 2020 Fund, Madison Target Retirement
2030 Fund, Madison Target Retirement 2040 Fund, and Madison Target Retirement 2050
Fund (collectively, the “Funds”) as of December 31, 2012, and the related
statements of operations for the year then ended, and the statements of changes
in net assets and the financial highlights for each of the periods presented. These
financial statements and financial highlights are the responsibility of the Funds’ management. Our responsibility is to express an opinion on these financial
statements and financial highlights based on our audits. We conducted our audits in accordance with
the standards of the Public Company Accounting Oversight Board (United States).
Those standards require that we plan and perform the audit to obtain reasonable
assurance about whether the financial statements and financial highlights are free
of material misstatement. The Funds are not required to have, nor were we engaged
to perform, an audit of their internal control over financial reporting. Our audits
included consideration of internal control over financial reporting as a basis for
designing audit procedures that are appropriate in the circumstances, but not for
the purpose of expressing an opinion on the effectiveness of the Funds’ internal
control over financial reporting. Accordingly, we express no such opinion. An audit
also includes examining, on a test basis, evidence supporting the amounts and disclosures
in the financial statements, assessing the accounting principles used and significant
estimates made by management, as well as evaluating the overall financial statement
presentation. Our procedures included confirmation of securities owned as of December
31, 2012, by correspondence with the custodian and brokers; where replies were not
received from brokers, we performed other auditing procedures. We believe that our
audits provide a reasonable basis for our opinion. In our opinion, the financial statements
and financial highlights referred to above present fairly, in all material respects,
the financial position of each of the Funds as of December 31, 2012, the results
of their operations for the year then ended, and the changes in their net assets
and the financial highlights for each of the periods presented, in conformity with
accounting principles generally accepted in the United States of America. /s/ DELOITTE & TOUCHE LLP Milwaukee, WI 108 Ultra Series Fund | December 31, 2012 Other Information (unaudited) BOARD APPROVAL OF ADVISORY AND SUBADVISORY
CONTRACTS The Board reviewed a variety of matters
in connection with the Trust’s investment advisory contract with the Adviser
and applicable subadvisers. The following description of the Board’s considerations
summarizes the process: With regard to the nature, extent and quality
of the services to be provided by the Adviser and each subadviser, the Board reviewed
the biographies and tenure of the personnel involved in Trust management and the
experience of the Adviser (and applicable subadviser) and its affiliates as investment
manager to other investment companies with similar investment strategies or to individual
clients or institutions with similar investment strategies. They recognized the
wide array of investment professionals employed by the respective firm or firms.
Representatives of the Adviser and each subadviser discussed their firms’ ongoing
investment philosophies and strategies intended to provide performance consistent
with each Trust portfolio’s investment objectives under various market scenarios.
The Trustees also noted their familiarity with the Adviser and its affiliates due
to the Adviser’s history of providing advisory services to its proprietary
investment company clients. The Board also discussed the quality of
services provided to the Trust portfolio by its transfer agent, fund administrator
and custodian as well as the various administrative services provided directly by
the Adviser. Such services included arranging for third party service providers
to provide all necessary administration as well as supervising any subadvisers to
Trust portfolios. With regard to the investment performance
of the Trusts and the investment adviser, the Board reviewed current performance
information provided in the written Board materials. They discussed the reasons
for both outperformance and underperformance compared with peer groups and applicable
indices and benchmarks. They reviewed both long-term and short-term performance
and considered the effect on long-term performance that may have been attributable
to any previous investment advisers to any Trust portfolio. They also considered
whether any relative underperformance was appropriate to the Adviser’s conservative
investment philosophy. The Board performed this review in connection with the Adviser
and each subadviser that manages a subadvised Fund portfolio. A comprehensive discussion of performance
and market conditions occurred during the course of the Board’s review. Representatives
of the Adviser and each subadviser discussed with the Board the methodology for
arriving at peer groups and indices used for performance comparisons. With regard to the costs of the services
to be provided and the profits to be realized by the investment adviser and its
affiliates from the relationship with the Trust, the Board reviewed the expense
ratios for a variety of other funds in each Trust portfolio’s peer group with
similar investment objectives. Again, the Board reviewed these matters in connection
with the Adviser and each subadviser that manages a subadvised Trust portfolio. The Board noted that the Adviser or its
affiliates, and, as applicable, each subaviser, provided investment management services
to other investment company and/or non-investment company clients and considered
the fees charged by the Adviser (and respective subadviser) to such portfolios and
clients for purposes of determining whether the given advisory fee was disproportionately
large under the so-called Gartenberg standard traditionally used by investment company
boards in connection with contract renewal considerations. The Board took those
fees into account and considered the differences in services and time required by
the various types of funds and clients to which the Adviser (or subadviser, if applicable)
provided services. The Board recognized that significant differences may exist between
the services provided to one type of fund or client and those provided to others,
such as those resulting from a greater frequency of shareholder redemptions in a
mutual fund and the higher turnover of mutual fund assets. The Board gave such comparisons
the weight that they merit in light of the similarities and differences between
the services that the various portfolios require and were wary of “inapt 109 Ultra Series Fund | December 31, 2012 Other Information (unaudited) comparisons.” They considered that,
if the services rendered by the Adviser (or subadviser, if applicable) to one type
of fund or client differed significantly from others, then the comparison should
not be used. In the case of non-investment company clients for which the Adviser
(or subadviser, if applicable) may act as either investment adviser or subadviser,
the Board noted that the fee may be lower than the fee charged to the Trust. The
Board noted too the various administrative, operational, compliance, legal and corporate
communication services required to be handled by the Adviser (or subadviser, if
applicable) which are performed for investment company clients but are not performed
for other institutional clients. The Trustees reviewed each portfolio’s
fee structure based on total fund expense ratio as well as by comparing fund advisory
fees to other fund advisory fees. The Board noted the simple expense structure maintained
by the Trust: (1) an advisory fee and a capped administrative “services”
expense for the Target Retirement Date Funds; and (2) for the remaining series of
Trust, a unitary fee with limited independent expenses for Trustee compensation
and audit fees not covered by the unitary fee. The Board noted the total expense
ratios paid by other funds with similar investment objectives, recognizing that
such a comparison, while not dispositive, was an important consideration. The Trustees sought to ensure that fees
paid by the Trust were appropriate. The Board reviewed materials demonstrating that
although the Adviser is compensated for a variety of the administrative services
it provides or arranges to provide to the Target Retirement Date Funds of the Trust
pursuant to its administrative services agreements with each of these series, such
compensation does not always cover all costs due to the cap on administrative expenses.
Administrative, operational, legal and compliance fees and costs in excess of the
Services Agreement fees, in the case of the Target Retirement Date series of the
Trust, or in excess of the unitary fee, in the case of the remaining series of the
Trust, are paid by the Adviser from the investment advisory fees earned. In this
regard, the Trustees noted that examination of each Trust portfolio’s total
expense ratio compared to those of other investment companies was more meaningful
than a simple comparison of basic “investment management only” fee schedules. The Board recognized that to the extent
a Trust portfolio invests in other mutual funds also managed by the Adviser (or
its affiliates), the Adviser (or an affiliate) receives investment advisory fees
from both the Trust portfolio and the underlying mutual fund. The Board was satisfied
in this regard that the Adviser (or an affiliate) provides separate services to
each respective Trust’s “fund of funds” portfolios and the underlying
mutual funds in which each such portfolio invests in exchange for the fees received
from them. In reviewing costs and profits, the Board
noted that for some smaller portfolios or Trust, the salaries of all portfolio management
personnel, trading desk personnel, corporate accounting personnel and employees
of the Adviser who serve as Trust officers, as well as facility costs (rent), could
not be supported by fees received from such portfolios alone. However, the Board
recognized that the Trust is profitable to the Adviser because such salaries and
fixed costs are already paid in whole or in part from revenue generated by management
of other client assets managed by the Adviser. The Trustees noted that total assets
managed by the Adviser and its affiliates approximated $16 billion at the time of
the meeting. As a result, although the fees paid by each Trust portfolio at its
present size might not be sufficient to profitably support a stand-alone fund, each
Trust portfolio is reasonably profitable to the Adviser as part of its larger, diversified
organization. In sum, the Trustees recognized that each Trust portfolio is important
to the Adviser and is managed with the attention given to the Adviser’s other
clients. With regard to the extent to which economies
of scale would be realized as each Trust portfolio grows, the Trustees recognized
that at their current sizes, it was premature to discuss any economies of scale
not already factored into existing advisory and services agreements. In addition,
the Trustees recognized that the Adviser was currently waiving fees with regard
to the Money Market Fund portfolio of the Trust. 110 Ultra Series Fund | December 31, 2012 Other Information (unaudited) During the course of the review, counsel
to the Independent Trustees confirmed that the Trust’s Independent Trustees
met previously in executive session and reviewed the written contract renewal materials
provided by the Adviser. He noted that the Independent Trustees had considered such
materials in light of the aforementioned Gartenberg standards as well as criteria
either set forth or discussed in the recent Supreme Court decision in Jones v. Harris
regarding the investment company contract renewal process under Section 15(c) of
the Investment Company Act of 1940, as amended. The Independent Trustees made a
variety of additional inquiries regarding such written materials to the Adviser
and the subadvisers and representatives of the Adviser and subadvisers, respectively,
discussed each matter raised. After further discussion, analysis and review
of the totality of the information presented, including the information set forth
above and the other information considered by the Board of Trustees, the Trustees,
including the Independent Trustees, concluded that the respective Trusts’ advisory
fees (including applicable subadvisory fees) are fair and reasonable for each respective
portfolio and that renewal of their respective Advisory, Subadvisory and Services
Agreements are in the best interests of each respective Trust portfolio and its
shareholders. In the course of their review of the contract
renewal materials, the Board also reviewed and discussed with counsel the “Rule
12b-1” plans adopted by certain of the Trust’s portfolios. The Board directed
its attention to written materials regarding these matters during the course of
the Board’s consideration of the Rule 12b-1 plans. Finally, the Board also
reviewed the Trust’s distribution agreements and the information provided in
the written materials regarding the distributor as well as applicable Codes of Ethics. Based on the above, the Board renewed the
Trust’s contracts for another year. FUND EXPENSES PAID BY SHAREHOLDERS As a shareholder of the funds, you pay no
transaction costs, but do incur ongoing costs which include management fees; disinterested
trustee fees; brokerage commissions and other expenses incurred in connection with
the acquisition or disposition of investments; costs of borrowing money; expenses
for independent audits, taxes, and extraordinary expenses as approved by a majority
of the disinterested trustees. The examples in the table that follows are intended
to help you understand your ongoing costs (in dollars) of investing in the funds
and to compare these costs with the ongoing costs of investing in other mutual funds. The examples below are based on an investment
of $1,000 invested at the beginning of the period and held for the entire six month
period ended December 31, 2012. Expenses paid during the period in the table below
are equal to the fund’s annualized expense ratio, multiplied by the average
account value over the period, multiplied by 184/366 (to reflect the one-half fiscal
year period). Actual Expenses 111 Ultra Series Fund | December 31, 2012 Other Information (unaudited) Hypothetical Example for Comparison Purposes
112 Ultra Series Fund | December 31, 2012 Other Information (unaudited) Please note that the expenses shown in the
table are meant to highlight your ongoing costs only and do not reflect any separate
account fees, charges, or expenses imposed by the variable annuity or variable life
insurance contracts, or retirement and pension plans that use the funds. The information
provided in the hypothetical example table is useful in comparing ongoing fund costs
only, and will not help you determine the relative total costs of owning different
funds. In addition, if these fees, charges or expenses were included, your costs
would have been higher. AVAILABILITY OF QUARTERLY PORTFOLIO SCHEDULES
The Trust files its complete schedule of
portfolio holdings with the SEC for the first and third quarters of each fiscal
year on Form N-Q. Form N-Q is available to shareholders at no cost on the SEC’s
website at www.sec.gov. Form N-Q may also be reviewed and copied at the Commission’s Public Reference Room in Washington, DC. More information on the operation
of the Public Reference Room may be obtained by calling 1-202-551-8090. Form N-Q
and other information about the Trust are available on the EDGAR database on the
SEC’s Internet site at http://www.sec.gov. Copies of this information may also
be obtained, upon payment of a duplicating fee, by electronic request at the following
email address: publicinfo@sec.gov, or by writing the SEC’s Public Reference
Section, Washington, DC 20549-0102. PROXY VOTING POLICIES, PROCEDURES AND
RECORDS A description of the policies and procedures
used by the Trust to vote proxies related to portfolio securities is available to
shareholders at no cost on the SEC’s website at www.sec.gov and is also located
in the funds’ Statement of Additional Information. The proxy voting records
for the Trust for the most recent twelve-month period ended December 31 are available
to shareholders at no cost on the SEC’s website at www.sec.gov. FORWARD-LOOKING STATEMENT DISCLOSURE One of our most important responsibilities
as investment company managers is to communicate with shareholders in an open and
direct manner. Some of our comments in our letters to shareholders are based on
current management expectations and are considered “forward-looking statements.” Actual future results, however, may prove to be different from our expectations.
You can identify forward-looking statements by words such as “estimate,””may,””will,””expect,””believe,””plan” and other similar terms. We cannot promise future returns. Our opinions are
a reflection of our best judgment at the time this report is compiled, and we disclaim
any obligation to update or after forward-looking statements as a result of new
information, future events, or otherwise. TAX INFORMATION Foreign Tax Credits: The International Stock
Fund expects to make an election under Internal Revenue Code Section 853 to pass
through foreign taxes paid by the Fund to its shareholders. For the year ended December
31, 2012, the total amount of foreign taxes that is expected to pass through to
shareholders and foreign source income for information reporting purposes will be
$187,951 (all of which represents taxes withheld) and $2,950,833, respectively. Corporate Dividends Received Deduction:
Of the dividends paid by the Conservative Allocation, Moderate Allocation, Aggressive
Allocation, Diversified Income, Large Cap Value, Large Cap Growth, Mid Cap, Small
Cap, Madison Target Retirement 2020, Madison Target Retirement 2030, Madison Target
Retirement 2040, and Madison Target Retirement 2050 Funds, 7.16%, 11.48%, 19.76%,
59.76%, 100%, 100%, 100%, 100%, 11.94%, 16.14%, 19.34%, 27.07%, respectively, qualify
for the corporate dividends received deduction. 113 Ultra Series Fund | December 31, 2012 Ultra Series Fund’s Trustees and
Officers The address of each trustee and officer
of the Trust is 550 Science Drive, Madison, Wisconsin 53711, except for Mr. Mason
for which it is 8777 N. Gainey Center Drive, #220, Scottsdale, Arizona 85258. The
Statement of Additional Information, which includes additional information about
the trustees and officers, is available at no cost on the SEC’s website at
www.sec.gov or by calling CMFG Life Insurance Company at 1-800-798-5500. 114 Ultra Series Fund | December 31, 2012 Ultra Series Fund’s Trustees and
Officers 115 Ultra Series Fund | December 31, 2012 116 Ultra Series Fund | December 31, 2012 117 Ultra Series Fund | December 31, 2012 118 Ultra Series Fund | December 31, 2012 119 This page was intentionally left blank. SEC File Number: 811-04815
1
Commenced
investment operations May 1, 2009.
2
Based on
average shares outstanding during the year.
3
These returns
are after all charges at the mutual fund level have been subtracted. These returns
are higher than the returns at the separate account level because charges made at
the separate account level have not been subtracted.
4
Not annualized.
5
Annualized.
6
Portfolio
Turnover is calculated at the fund level and represents the entire fiscal year or
period.
DIVERSIFIED
INCOME FUND
Year Ended December 31,
2012
2011
2010
2009
2008
CLASS I
Net Asset
Value at beginning of period
$17.39
$16.62
$15.37
$14.46
$17.62
0.49
0.51
0.56
0.60
0.72
0.92
0.79
1.29
0.92
(3.05
)
1.41
1.30
1.85
1.52
(2.33
)
Less Distributions:
(0.51
)
(0.53
)
(0.60
)
(0.61
)
(0.81
)
–
–
–
–
(0.02
)
(0.51
)
(0.53
)
(0.60
)
(0.61
)
(0.83
)
Net increase
(decrease) in net asset value
0.90
0.77
1.25
0.91
(3.16
)
Net Asset
Value at end of period
$18.29
$17.39
$16.62
$15.37
$14.46
Total Return3 (%)
8.16
7.84
12.04
10.74
(13.25
)
Ratios/Supplemental
Data:
Net Assets
at end of period (in 000’s)
$359,022
$372,852
$384,709
$418,381
$438,047
Ratios of
expenses to average net assets (%)
0.71
0.72
0.72
0.72
0.71
Ratio of net
investment income to average net assets (%)
2.69
2.94
3.50
4.12
4.37
Portfolio
Turnover6 (%)
17
19
23
26
14
Inception
to
2012
2011
2010
12/31/091
CLASS II
Net Asset
Value at beginning of period
$17.37
$16.61
$15.37
$13.74
0.44
0.46
0.52
0.35
0.93
0.79
1.29
1.64
1.37
1.25
1.81
1.99
(0.48
)
(0.49
)
(0.57
)
(0.36
)
Net increase
in net asset value
0.89
0.76
1.24
1.63
Net Asset
Value at end of period
$18.26
$17.37
$16.61
$15.37
Total Return3 (%)
7.89
7.57
11.77
14.43
4
Ratios/Supplemental
Data:
Net Assets
at end of period (in 000’s)
$34,908
$30,360
$22,309
$6,261
Ratios of
expenses to average net assets (%)
0.96
0.97
0.97
0.97
5
Ratio of net
investment income to average net assets (%)
2.43
2.69
3.20
3.44
5
Portfolio
Turnover6 (%)
17
19
23
26
4
1
Commenced
investment operations May 1, 2009
2
Based on average
shares outstanding during the year.
3
These returns
are after all charges at the mutual fund level have been subtracted. These returns
are higher than the returns at the separate account level because charges made at
the separate account level have not been subtracted.
4
Not annualized.
5
Annualized.
6
Portfolio
Turnover is calculated at the fund level and represents the entire fiscal year or
period.
LARGE CAP
VALUE FUND
Year Ended December 31,
2012
2011
2010
2009
2008
CLASS I
Net Asset
Value at beginning of period
$24.78
$23.56
$22.17
$19.42
$31.49
Income
from Investment Operations:
Net investment
income2
0.55
0.50
0.38
0.43
0.65
Net realized
and unrealized gain (loss) on investments
2.37
1.24
1.46
2.76
(11.99
)
Total from
investment operations
2.92
1.74
1.84
3.19
(11.34
)
Less Distributions:
Distributions
from net investment income
(0.58
)
(0.52
)
(0.45
)
(0.44
)
(0.71
)
Distributions
from capital gains
–
–
–
–
(0.02
)
Total distributions
(0.58
)
(0.52
)
(0.45
)
(0.44
)
(0.73
)
Net increase
(decrease) in net asset value
2.34
1.22
1.39
2.75
(12.07
)
Net Asset
Value at end of period
$27.12
$24.78
$23.56
$22.17
$19.42
Total Return3 (%)
11.82
7.38
8.29
16.79
(35.99
)
Ratios/Supplemental
Data:
Net Assets
at end of period (in 000’s)
$494,587
$485,978
$524,894
$630,764
$609,444
Ratios of
expenses to average net assets (%)
0.61
0.62
0.62
0.62
0.61
Ratio of net
investment income to average net assets (%)
2.05
2.03
1.72
2.23
2.42
Portfolio
Turnover6 (%)
27
29
63
81
38
Inception
to
2012
2011
2010
12/31/091
CLASS II
Net Asset
Value at beginning of period
$24.73
$23.54
$22.17
$17.74
Income
from Investment Operations:
Net investment
income2
0.48
0.43
0.34
0.18
Net realized
and unrealized gain (loss) on investments
2.37
1.25
1.44
4.45
Total from
investment operations
2.85
1.68
1.78
4.63
Less Distributions:
Distributions
from net investment income
(0.53
)
(0.49
)
(0.41
)
(0.20
)
Net increase
in net asset value
2.32
1.19
1.37
4.43
Net Asset
Value at end of period
$27.05
$24.73
$23.54
$22.17
Total Return3 (%)
11.55
7.11
8.02
26.09
4
Ratios/Supplemental
Data:
Net Assets
at end of period (in 000’s)
$5,882
$5,697
$5,354
$2,552
Ratios of
expenses to average net assets (%)
0.86
0.87
0.87
0.87
5
Ratio of net
investment income to average net assets (%)
1.80
1.78
1.51
1.28
5
Portfolio
Turnover6 (%)
27
29
63
81
4
1
Commenced
investment operations May 1, 2009.
2
Based on average
shares outstanding during the year.
3
These returns
are after all charges at the mutual fund level have been subtracted. These returns
are higher than the returns at the separate account level because charges made at
the separate account level have not been subtracted.
4
Not annualized.
5
Annualized.
6
Portfolio
Turnover is calculated at the fund level and represents the entire fiscal year or
period.
LARGE CAP
GROWTH FUND
Year Ended December 31,
2012
2011
2010
2009
2008
CLASS I
Net Asset
Value at beginning of period
$21.84
$22.16
$19.87
$14.50
$23.36
0.18
0.05
0.10
0.12
0.12
2.26
(0.31
)
2.31
5.37
(8.80
)
2.44
(0.26
)
2.41
5.49
(8.68
)
(0.19
)
(0.06
)
(0.12
)
(0.12
)
(0.14
)
–
–
–
–
(0.04
)
(0.19
)
(0.06
)
(0.12
)
(0.12
)
(0.18
)
Net increase
(decrease) in net asset value
2.25
(0.32
)
2.29
5.37
(8.86
)
Net Asset
Value at end of period
$24.09
$21.84
$22.16
$19.87
$14.50
Total Return3 (%)
11.20
(1.19
)
12.13
37.98
(37.20
)
Ratios/Supplemental
Data:
Net Assets
at end of period (in 000’s)
$318,024
$331,032
$374,644
$433,483
$352,473
Ratios of
expenses to average net assets (%)
0.82
0.82
0.82
0.82
0.82
Ratio of net
investment income to average net assets (%)
0.76
0.24
0.51
0.72
0.62
Portfolio
Turnover8 (%)
64
85
78
89
123
Inception
to
2012
2011
2010
12/31/091
CLASS II
Net Asset
Value at beginning of period
$21.80
$22.14
$19.87
$15.78
0.12
(0.00
)7
0.06
0.05
2.26
(0.32
)
2.30
4.09
2.38
(0.32
)
2.36
4.14
(0.16
)
(0.02
)
(0.09
)
(0.05
)
Net increase
(decrease) in net asset value
2.22
(0.34
)
2.27
4.09
Net Asset
Value at end of period
$24.02
$21.80
$22.14
$19.87
Total Return3 (%)
10.93
(1.43
)
11.85
26.21
4
Ratios/Supplemental
Data:
Net Assets
at end of period (in 000’s)
$29,101
$27,589
$20,802
$6,003
Ratios of
expenses to average net assets (%)
1.07
1.07
1.07
1.07
5
Ratio of net
investment income to average net assets (%)
0.51
–
6
0.29
0.36
5
Portfolio
Turnover8 (%)
64
85
78
89
4
1
Commenced
investment operations May 1, 2009.
2
Based on average
shares outstanding during the year.
3
These returns
are after all charges at the mutual fund level have been subtracted. These returns
are higher than the returns at the separate account level because charges made at
the separate account level have not been subtracted.
4
Not annualized.
5
Annualized.
6
Amount represents
less than 0.01%.
7
Amount represents
less than $0.005 per share.
8
Portfolio
Turnover is calculated at the fund level and represents the entire fiscal year or
period.
MID CAP FUND
Year Ended
December 31,
2012
2011
20103
20093
20083
CLASS I
Net Asset
Value at beginning of period
$14.75
$14.14
$11.82
$8.01
$15.31
0.05
0.02
0.04
0.00
5
0.00
5
2.34
0.62
2.33
3.81
(7.13
)
2.39
0.64
2.37
3.81
(7.13
)
(0.05
)
(0.03
)
(0.05
)
(0.00
)5
(0.00
)5
–
–
–
–
(0.16
)
(0.05
)
(0.03
)
(0.05
)
(0.00
)
(0.16
)
Net increase
(decrease) in net asset value
2.34
0.61
2.32
3.81
(7.29
)
Net Asset
Value at end of period
$17.09
$14.75
$14.14
$11.82
$8.01
Total Return4 (%)
16.24
4.47
20.12
47.28
(46.89
)
Ratios/Supplemental
Data:
Net Assets
at end of period (in 000’s)
$356,534
$351,833
$385,219
$229,395
$166,465
Ratios of
expenses to average net assets (%)
0.91
0.91
0.90
0.87
0.87
Ratio of net
investment income to average net assets (%)
0.30
0.16
0.42
(0.05
)
0.09
Portfolio
Turnover8 (%)
25
52
46
186
108
Inception
to
2012
2011
20103
12/31/091,3
CLASS II
Net Asset
Value at beginning of period
$14.72
$14.13
$11.82
$9.36
0.01
(0.01
)
0.04
(0.00
)5
2.35
0.60
2.30
2.45
2.36
0.59
2.34
2.45
(0.03
)
–
(0.03
)
–
Net increase
in net asset value
2.33
0.59
2.31
2.45
Net Asset
Value at end of period
$17.05
$14.72
$14.13
$11.82
Total Return4 (%)
15.95
4.22
19.82
26.13
6
Ratios/Supplemental
Data:
Net Assets
at end of period (in 000’s)
$13,927
$13,270
$11,951
$1,745
Ratios of
expenses to average net assets (%)
1.16
1.17
1.16
1.12
7
Ratio of net
investment income to average net assets (%)
0.05
(0.07
)
0.38
(0.14
)7
Portfolio
Turnover8 (%)
25
52
46
1866
1
Commenced
investment operations May 1, 2009
2
Based on average
shares outstanding during the year.
3
The financial
highlights prior to May 1, 2010 are those of the Mid Cap Growth Fund, the accounting
survivor of the reorganization of the Mid Cap Value and Mid Cap Growth Funds. The
net asset values and other per share information of the Mid Cap Growth Fund have
been restated by the conversion ratio of 2.6623 for Class I shares and 2.6678 for
Class II shares to reflect those of the legal survivor of the reorganization, the
Mid Cap Value Fund, which was renamed the Mid Cap Fund after the reorganization.
4
These returns
are after all charges at the mutual fund level have been subtracted. These returns
are higher than the returns at the separate account level because charges made at
the separate account level have not been subtracted.
5
Amounts represents
less than $0.005 per share.
6
Not annualized.
7
Annualized.
8
Portfolio
Turnover is calculated at the fund level and represents the entire fiscal year or
period.
SMALL CAP
FUND
Year Ended December 31,
2012
2011
2010
2009
2008
CLASS I
Net Asset
Value at beginning of period
$10.81
$10.75
$8.54
$6.53
$8.86
0.14
0.04
0.08
0.05
0.08
1.52
0.06
2.20
2.00
(2.34
)
1.66
0.10
2.28
2.05
(2.26
)
(0.15
)
(0.04
)
(0.07
)
(0.04
)
(0.07
)
–
–
–
–
(0.00
)7
(0.15
)
(0.04
)
(0.07
)
(0.04
)
(0.07
)
Net increase
(decrease) in net asset value
1.51
0.06
2.21
2.01
(2.33
)
Net Asset
Value at end of period
$12.32
$10.81
$10.75
$8.54
$6.53
Total Return3 (%)
15.39
0.91
26.80
31.56
(25.54
)
Ratios/Supplemental
Data:
Net Assets
at end of period (in 000’s)
$11,936
$11,261
$11,710
$7,989
$5,986
Ratios of
expenses to average net assets (%)
1.11
1.11
1.11
1.11
1.12
Ratio of net
investment income to average net assets (%)
1.24
0.41
0.85
0.77
1.03
Portfolio
Turnover6 (%)
15
22
33
21
28
Inception
to
2012
2011
2010
12/31/091
CLASS II
Net Asset
Value at beginning of period
$10.79
$10.74
$8.54
$6.50
0.11
0.02
0.06
0.02
1.52
0.06
2.20
2.03
1.63
0.08
2.26
2.05
(0.13
)
(0.03
)
(0.06
)
(0.01
)
Net increase
in net asset value
1.50
0.05
2.20
2.04
Net Asset
Value at end of period
$12.29
$10.79
$10.74
$8.54
Total Return3 (%)
15.10
0.66
26.48
31.57
4
Ratios/Supplemental
Data:
Net Assets
at end of period (in 000’s)
$1,486
$1,401
$1,387
$616
Ratios of
expenses to average net assets (%)
1.36
1.36
1.36
1.36
5
Ratio of net
investment income to average net assets (%)
0.99
0.16
0.67
0.44
5
Portfolio
Turnover6 (%)
15
22
33
21
4
1
Commenced
investment operations May 1, 2009.
2
Based on average
shares outstanding during the year.
3
These returns
are after all charges at the mutual fund level have been subtracted. These returns
are higher than the returns at the separate account level because charges made at
the separate account level have not been subtracted.
4
Not annualized.
5
Annualized.
6
Portfolio
Turnover is calculated at the fund level and represents the entire fiscal year or
period
7
Amount represents
less than $0.005 per share.
INTERNATIONAL
STOCK FUND
Year Ended
December 31,
2012
2011
2010
2009
2008
CLASS I
Net Asset
Value at beginning of period
$9.03
$9.99
$9.53
$7.59
$13.40
0.17
0.19
0.14
0.17
0.26
1.75
(0.96
)
0.53
1.95
(5.27
)
1.92
(0.77
)
0.67
2.12
(5.01
)
(0.17
)
(0.19
)
(0.21
)
(0.18
)
(0.26
)
–
–
–
–
(0.54
)
(0.17
)
(0.19
)
(0.21
)
(0.18
)
(0.80
)
Net increase
(decrease) in net asset value
1.75
(0.96
)
0.46
1.94
(5.81
)
Net Asset
Value at end of period
$10.78
$9.03
$9.99
$9.53
$7.59
Total Return3 (%)
21.31
(7.70
)
7.09
27.90
(38.62
)
Ratios/Supplemental
Data:
Net Assets
at end of period (in 000’s)
$76,919
$72,756
$92,063
$77,997
$72,768
Ratios of
expenses to average net assets (%)
1.21
1.22
1.22
1.22
1.22
Ratio of net
investment income to average net assets (%)
1.74
1.90
1.48
2.08
2.45
Portfolio
Turnover6 (%)
42
38
79
87
43
Inception
to
2012
2011
2010
12/31/091
CLASS II
Net Asset
Value at beginning of period
$9.02
$9.99
$9.53
$7.32
0.14
0.16
0.09
0.04
1.76
(0.96
)
0.56
2.33
1.90
(0.80
)
0.65
2.37
(0.16
)
(0.17
)
(0.19
)
(0.16
)
Net increase
(decrease) in net asset value
1.74
(0.97
)
0.46
2.21
Net Asset
Value at end of period
$10.76
$9.02
$9.99
$9.53
Total Return3 (%)
21.01
(7.91
)
6.83
32.30
4
Ratios/Supplemental
Data:
Net Assets
at end of period (in 000’s)
$18,263
$15,407
$13,241
$3,962
Ratios of
expenses to average net assets (%)
1.46
1.47
1.47
1.48
5
Ratio of net
investment income to average net assets (%)
1.45
1.58
1.00
0.57
5
Portfolio
Turnover6 (%)
42
38
79
87
4
1
Commenced
investment operations May 1, 2009.
2
Based on average
shares outstanding during the year.
3
These returns
are after all charges at the mutual fund level have been subtracted. These returns
are higher than the returns at the separate account level because charges made at
the separate account level have not been subtracted.
4
Not annualized.
5
Annualized.
6
Portfolio
Turnover is calculated at the fund level and represents the entire fiscal year or
period.
MADISON TARGET
RETIREMENT 2020 FUND
Year Ended December 31,
2012
2011
2010
2009
2008
CLASS I
Net Asset
Value at beginning of period
$7.82
$8.06
$7.64
$6.04
$9.63
0.24
0.22
0.20
0.15
0.22
0.53
(0.04
)
0.49
1.59
(3.60
)
0.77
0.18
0.69
1.74
(3.38
)
(0.25
)
(0.23
)
(0.27
)
(0.14
)
(0.16
)
(0.03
)
(0.19
)
–
–
(0.05
)
(0.28
)
(0.42
)
(0.27
)
(0.14
)
(0.21
)
Net increase
(decrease) in net asset value
0.49
(0.24
)
0.42
1.60
(3.59
)
Net Asset
Value at end of period
$8.31
$7.82
$8.06
$7.64
$6.04
Total Return2 (%)
9.98
2.11
9.01
28.93
(35.31
)
Ratios/Supplemental
Data:
Net Assets
at end of period (in 000’s)
$56,607
$39,580
$27,648
$19,300
$8,719
Ratios of
expenses to average net assets
0.30
0.26
0.40
0.41
0.40
0.30
0.24
3
0.20
3
0.34
3
0.40
Ratio of net
investment income to average net assets (%)
2.96
2.70
2.61
2.24
2.80
Portfolio
Turnover4 (%)
90
114
51
78
74
1
Based on average
shares outstanding during the year.
2
These returns
are after all charges at the mutual fund level have been subtracted. These returns
are higher than the returns at the separate account level because charges made at
the separate account level have not been subtracted.
3
Amount includes
fees waived by the Adviser through a contractual management fee reduction from 0.40%
to 0.20% effective October 1, 2009 to February 16, 2011. Effective February 17,
2011 to August 31, 2011, the fee was permanently reduced to 0.20%. Effective September
1, 2011, shareholders approved a new fee arrangement which includes an advisory
fee of 0.25% and services agreement fee of 0.05%.
4
Portfolio
Turnover is calculated at the fund level and represents the entire fiscal year or
period.
MADISON TARGET
RETIREMENT 2030 FUND
Year Ended
December 31,
2012
2011
2010
2009
2008
CLASS I
Net Asset
Value at beginning of period
$7.49
$7.90
$7.41
$5.75
$9.54
0.23
0.19
0.18
0.12
0.18
0.60
(0.09
)
0.52
1.65
(3.82
)
0.83
0.10
0.70
1.77
(3.64
)
(0.22
)
(0.20
)
(0.21
)
(0.11
)
(0.11
)
(0.06
)
(0.31
)
–
–
(0.04
)
(0.28
)
(0.51
)
(0.21
)
(0.11
)
(0.15
)
Net increase
(decrease) in net asset value
0.55
(0.41
)
0.49
1.66
(3.79
)
Net Asset
Value at end of period
$8.04
$7.49
$7.90
$7.41
$5.75
Total Return2 (%)
11.05
1.16
9.56
30.94
(38.35
)
Ratios/Supplemental
Data:
Net Assets
at end of period (in 000’s)
$68,009
$45,404
$31,279
$19,330
$8,010
Ratios of
expenses to average net assets
0.30
0.26
0.40
0.41
0.40
0.30
0.24
3
0.20
3
0.34
3
0.40
Ratio of net
investment income to average net assets (%)
2.84
2.43
2.42
1.87
2.38
Portfolio
Turnover4 (%)
86
108
43
78
52
1
Based on average
shares outstanding during the year.
2
These returns
are after all charges at the mutual fund level have been subtracted. These returns
are higher than the returns at the separate account level because charges made at
the separate account level have not been subtracted.
3
Amount includes
fees waived by the Adviser through a contractual management fee reduction from 0.40%
to 0.20% effective October 1, 2009 to February 16, 2011. Effective February 17,
2011 to August 31, 2011, the fee was permanently reduced to 0.20%. Effective September
1, 2011, shareholders approved a new fee arrangement which includes an advisory
fee of 0.25% and services agreement fee of 0.05%.
4
Portfolio
Turnover is calculated at the fund level and represents the entire fiscal year or
period.
MADISON TARGET
RETIREMENT 2040 FUND
Year Ended
December 31,
2012
2011
2010
2009
2008
CLASS I
Net Asset
Value at beginning of period
$7.06
$7.60
$7.07
$5.43
$9.48
0.20
0.16
0.15
0.08
0.14
0.61
(0.12
)
0.55
1.63
(4.06
)
0.81
0.04
0.70
1.71
(3.92
)
(0.19
)
(0.17
)
(0.17
)
(0.07
)
(0.08
)
(0.07
)
(0.41
)
–
–
(0.05
)
(0.26
)
(0.58
)
(0.17
)
(0.07
)
(0.13
)
Net increase
(decrease) in net asset value
0.55
(0.54
)
0.53
1.64
(4.05
)
Net Asset
Value at end of period
$7.61
$7.06
$7.60
$7.07
$5.43
Total Return2 (%)
11.42
0.47
9.97
31.64
(41.65
)
Ratios/Supplemental
Data:
Net Assets
at end of period (in 000’s)
$49,269
$35,182
$26,147
$16,656
$6,385
Ratios of
expenses to average net assets
0.30
0.26
0.40
0.41
0.40
0.30
0.24
3
0.20
3
0.34
3
0.40
Ratio of net
investment income to average net assets (%)
2.65
2.11
2.14
1.22
1.99
Portfolio
Turnover4 (%)
101
115
40
86
62
1
Based on average
shares outstanding during the year.
2
These returns
are after all charges at the mutual fund level have been subtracted. These returns
are higher than the returns at the separate account level because charges made at
the separate account level have not been subtracted.
3
Amount includes
fees waived by the Adviser through a contractual management fee reduction from 0.40%
to 0.20% effective October 1, 2009 to February 16, 2011. Effective February 17,
2011 to August 31, 2011, the fee was permanently reduced to 0.20%. Effective September
1, 2011, shareholders approved a new fee arrangement which includes an advisory
fee of 0.25% and services agreement fee of 0.05%.
4
Portfolio
Turnover is calculated at the fund level and represents the entire fiscal year or
period.
MADISON TARGET
RETIREMENT 2050 FUND
Year Ended
December 31,
Inception to
2012
12/31/111
CLASS I
Net Asset
Value at beginning of period
$9.75
$10.00
0.30
0.26
0.89
(0.36
)
1.19
(0.10
)
(0.21
)
(0.14
)
–
(0.01
)
(0.04
)
–
(0.25
)
(0.15
)
Net increase
(decrease) in net asset value
0.94
(0.25
)
Net Asset
Value at end of period
$10.69
$9.75
Total Return3 (%)
12.12
(1.03
)4
Ratios/Supplemental
Data:
Net Assets
at end of period (in 000’s)
$7,160
$2,236
Ratios of
expenses to average net assets
0.30
0.26
5
0.30
0.26
5,6
Ratio of net
investment income to average net assets (%)
2.90
2.61
5
Portfolio
Turnover7 (%)
86
75
4
1
Commenced
investment operations January 3, 2011.
2
Based on average
shares outstanding during the year.
3
These returns
are after all charges at the mutual fund level have been subtracted. These returns
are higher than the returns at the separate account level because charges made at
the separate account level have not been subtracted.
4
Not annualized.
5
Annualized.
6
Amount includes
fees waived by the Adviser through a contractual management fee reduction from 0.40%
to 0.20% effective October 1, 2009 to February 16, 2011. Effective February 17,
2011 to August 31, 2011, the fee was permanently reduced to 0.20%. Effective September
1, 2011, shareholders approved a new fee arrangement which includes an advisory
fee of 0.25% and services agreement fee of 0.05%.
7
Portfolio
Turnover is calculated at the fund level and represents the entire fiscal year or
period.
Ultra Series Fund | December 31, 2012
Notes to Financial Statements
Ultra Series Fund | December 31, 2012
Notes to Financial Statements
Ultra Series Fund | December 31, 2012
Notes to Financial Statements
Ultra Series Fund | December 31, 2012
Notes to Financial Statements
Security
Acquisition Date
Acquisition Cost
Bond Fund
American Association
of Retired Persons
5/16/02
$
2,620,162
ERAC USA Finance
LLC
12/16/04
4,762,254
Indianapolis
Power & Light Co.
10/2/06
3,424,873
WM Wrigley
Jr. Co.
6/21/10
3,169,571
$
13,976,860
Diversified
Income Fund
AbbVie Inc.
11/5/12
$
1,193,825
American Association
of Retired Persons
5/16/02
2,096,129
ERAC USA Finance
LLC
12/16/04
2,002,311
Indianapolis
Power & Light Co.
10/2/06
1,545,915
WM Wrigley
Jr. Co.
6/21/10
1,309,823
$
8,148,003
Ultra Series Fund | December 31, 2012
Notes to Financial Statements
Ultra Series Fund | December 31, 2012
Notes to Financial Statements
Quoted Prices in
Significant Other
Significant
Active Markets for
Observable
Unobservable
Identical Investments
Inputs
Inputs
Value at
Fund
(Level 1)
(Level 2)
(Level 3)
12/31/12
Conservative
Allocation
$
237,954,277
$
–
$
–
$
237,954,277
Moderate Allocation
390,295,476
–
–
390,295,476
Aggressive
Allocation
144,422,356
–
–
144,422,356
Money Market1
2,476,374
47,635,150
–
50,111,524
Bond
–
3,476,244
–
3,476,244
–
107,097,622
–
107,097,622
–
63,257,219
–
63,257,219
–
199,523,992
–
199,523,992
13,441,891
–
–
13,441,891
13,441,891
373,355,077
–
386,796,968
High Income
–
63,087,653
–
63,087,653
3,135,148
–
–
3,135,148
3,135,148
63,087,653
–
66,222,801
Diversified
Income
216,084,799
–
–
216,084,799
–
607,382
–
607,382
–
63,221,207
–
63,221,207
–
27,066,482
–
27,066,482
–
71,599,662
–
71,599,662
14,006,365
–
–
14,006,365
230,091,164
162,494,733
–
392,585,897
Large Cap
Value
481,090,989
–
–
481,090,989
20,226,182
–
–
20,226,182
501,317,171
–
–
501,317,171
Large Cap
Growth
330,893,865
–
–
330,893,865
15,071,048
–
–
15,071,048
345,964,913
–
–
345,964,913
Mid Cap
345,470,438
–
–
345,470,438
26,049,776
–
–
26,049,776
371,520,214
–
–
371,520,214
Small Cap
13,014,567
–
–
13,014,567
496,276
–
–
496,276
13,510,843
–
–
13,510,843
1
At December
31, 2012, all Level 2 securities held are short-term investments. See respective portfolio of investments.
Ultra Series Fund | December 31, 2012
Notes to Financial Statements
Quoted Prices in
Significant Other
Significant
Active Markets for
Observable
Unobservable
Identical Investments
Inputs
Inputs
Value at
Fund
(Level 1)
(Level 2)
(Level 3)
12/31/12
International
Stock
$
–
$
2,357,920
$
–
$
2,357,920
–
3,298,134
–
3,298,134
–
1,500,796
–
1,500,796
–
2,646,993
–
2,646,993
–
1,222,154
–
1,222,154
–
9,291,556
–
9,291,556
–
9,370,001
–
9,370,001
782,227
–
–
782,227
750,732
–
–
750,732
–
2,803,595
–
2,803,595
–
14,585,290
–
14,585,290
–
856,204
–
856,204
–
1,877,635
–
1,877,635
–
667,033
–
667,033
–
535,027
–
535,027
–
1,419,872
–
1,419,872
–
1,026,517
–
1,026,517
–
2,412,174
–
2,412,174
–
2,319,723
–
2,319,723
–
5,131,883
–
5,131,883
–
4,330,363
–
4,330,363
–
996,404
–
996,404
–
1,559,006
–
1,559,006
–
21,881,702
–
21,881,702
Investment
Companies
1,655,652
–
–
1,655,652
3,188,611
92,089,982
–
95,278,593
Madison Target
Retirement 2020
55,403,024
–
–
55,403,024
Madison Target
Retirement 2030
67,985,121
–
–
67,985,121
Madison Target
Retirement 2040
49,169,125
–
–
49,169,125
Madison Target
Retirement 2050
7,148,181
–
–
7,148,181
Ultra Series Fund | December 31, 2012
Notes to Financial Statements
Ultra Series Fund | December 31, 2012
Notes to Financial Statements
U.S. Government Securities
Other Investment Securities
Fund
Purchases
Sales
Purchases
Sales
Conservative
Allocation
$
–
$
–
$
102,995,930
$
100,886,745
Moderate Allocation
–
–
188,655,060
197,009,347
Aggressive
Allocation
–
–
96,645,731
96,111,705
Ultra Series Fund | December 31, 2012
Notes to Financial Statements
U.S. Government Securities
Other Investment Securities
Fund
Purchases
Sales
Purchases
Sales
Bond
$
41,368,402
$
53,662,524
$
1,077,073
$
19,886,369
High Income
–
–
44,855,707
73,808,062
Diversified
Income
15,888,514
17,931,147
49,659,557
71,058,643
Large Cap
Value
–
–
131,804,244
170,877,404
Large Cap
Growth
–
–
228,393,097
282,078,764
Mid Cap
–
–
86,158,002
141,818,151
Small Cap
–
–
1,940,987
2,640,379
International
Stock
–
–
37,706,972
45,867,961
Madison Target
Retirement 2020
–
–
56,517,798
42,594,477
Madison Target
Retirement 2030
–
–
67,570,170
48,312,962
Madison Target
Retirement 2040
–
–
52,972,399
41,834,212
Madison Target
Retirement 2050
–
–
8,296,496
3,760,697
Ultra Series Fund | December 31, 2012
Notes to Financial Statements
Ordinary Income
Long-Term Capital Gain
Return of Capital
Fund
2012
2011
2012
2011
2012
2011
Conservative
Allocation
$
8,752,307
$
7,736,541
$
–
$
–
$
–
$
156,141
Moderate Allocation
11,631,795
10,126,467
–
–
–
–
Aggressive
Allocation
3,233,841
2,351,251
–
–
–
–
Money Market
–
–
–
–
–
–
Bond
12,776,652
15,832,299
–
–
–
–
High Income
5,659,023
6,639,622
–
–
–
–
Diversified
Income
10,709,273
11,883,969
–
–
–
–
Large Cap
Value
10,469,073
10,205,844
–
–
–
–
Large Cap
Growth
2,704,838
893,185
–
–
–
–
Mid Cap
1,089,948
691,290
–
–
–
–
Small Cap
154,423
49,569
–
–
–
–
International
Stock
1,486,996
1,802,051
–
–
–
–
Madison Target
Retirement 2020
1,701,151
1,042,918
144,606
951,240
–
–
Madison Target
Retirement 2030
2,082,265
1,048,477
170,986
1,807,977
–
–
Madison Target
Retirement 2040
1,497,374
746,609
103,150
1,906,410
–
–
Madison Target
Retirement 2050
146,274
31,450
14,972
–
–
1,099
Fund
Ordinary Income
Long-Term
Capital Gain
Fund
Ordinary Income
Long-Term
Capital Gain
Conservative
Allocation
$
–
$
–
Large Cap Growth
$
51,752
$
–
Moderate Allocation
–
–
Mid Cap
22,758
–
Aggressive
Allocation
–
–
Small Cap
–
–
Money Market
–
–
International
Stock
42,221
–
Bond
252,849
–
Madison Target
Retirement 2020
24,607
101,255
High Income
206,043
–
Madison Target
Retirement 2030
–
80,762
Diversified
Income
215,755
–
Madison Target
Retirement 2040
9,458
59,115
Large Cap
Value
210,348
–
Madison Target
Retirement 2050
–
7,405
Ultra Series Fund | December 31, 2012
Notes to Financial Statements
No Expiration-
Fund
2013
2014
2015
2016
2017
2018
Short Term
Conservative
Allocation
$
–
$
–
$
–
$
–
$
2,386,143
$
–
$
–
Moderate Allocation
–
–
–
9,202,459
20,811,527
9,937,108
–
Aggressive
Allocation
–
–
–
329,267
6,205,447
6,513,626
–
Money Market
–
–
–
–
–
–
–
Bond
1,445,891
816,322
228,563
–
9,584,651
346,309
–
High Income
–
–
–
3,871,343
4,641,635
–
–
Diversified
Income
–
–
–
–
24,898,540
–
–
Large Cap
Value
–
–
–
30,899,868
41,852,552
–
–
Large Cap
Growth
–
–
–
–
11,561,675
–
–
Mid Cap
–
–
–
23,007,112
38,369,131
–
–
Small Cap
–
–
–
810,060
106,162
–
–
International
Stock
–
–
751,246
8,819,661
21,825,302
1,915,037
1,197,463
Madison Target
Retirement 2020
–
–
–
–
–
–
–
Madison Target
Retirement 2030
–
–
–
–
–
–
–
Madison Target
Retirement 2040
–
–
–
–
–
–
–
Madison Target
Retirement 2050
–
–
–
–
–
–
–
Fund
Amount Utilized
Fund
Amount Utilized
Conservative
Allocation
$
3,557,105
Large Cap Growth
$
5,477,866
Moderate Allocation
7,141,391
Mid Cap
11,125,063
Aggressive
Allocation
3,663,456
Small Cap
512,761
Money Market
–
International
Stock
1,221,270
Bond
383,120
Madison Target
Retirement 2020
–
High Income
2,842,301
Madison Target
Retirement 2030
–
Diversified
Income
6,859,551
Madison Target
Retirement 2040
–
Large Cap
Value
22,472,298
Madison Target
Retirement 2050
5,446
Fund
Appreciation
Depreciation
Net
Conservative
Allocation
$
13,643,579
$
74,354
$
13,569,225
Moderate Allocation
35,591,405
773,372
34,818,033
Aggressive
Allocation
15,037,562
334,399
14,703,163
Bond
36,427,229
3,180,782
33,246,447
High Income
3,151,494
47,710
3,103,784
Ultra Series Fund | December 31, 2012
Notes to Financial Statements
Fund
Appreciation
Depreciation
Net
Diversified
Income
$
57,528,149
$
2,831,292
$
54,696,857
Large Cap
Value
87,081,732
5,596,691
81,485,041
Large Cap
Growth
75,394,278
5,787,230
69,607,048
Mid Cap
83,394,951
1,215,416
82,179,535
Small Cap
3,388,162
201,746
3,186,416
International
Stock
18,456,433
625,755
17,830,678
Madison Target
Retirement 2020
2,087,072
89,871
1,997,201
Madison Target
Retirement 2030
2,770,800
81,637
2,689,163
Madison Target
Retirement 2040
2,100,822
81,265
2,019,557
Madison Target
Retirement 2050
251,778
7,941
243,837
Undistributed Net
Accumulated Net
Fund
Paid-in Capital
Investment Income (Loss)
Realized Gain (Loss)
Conservative
Allocation
$
(237,932
)
$
2,347,684
$
(2,109,752
)
Moderate Allocation
(219,174
)
2,607,131
(2,387,957
)
Aggressive
Allocation
(94,454
)
696,008
(601,554
)
Money Market
–
–
–
Bond
(73,579
)
(127,319
)
200,898
High Income
–
267,273
(267,273
)
Diversified
Income
–
(39,940
)
39,940
Large Cap
Value
–
431
(431
)
Large Cap
Growth
–
(28
)
28
Mid Cap
–
–
–
Small Cap
(9,333
)
(2,999
)
12,332
International
Stock
–
(50,998
)
50,998
Madison Target
Retirement 2020
–
232,716
(232,716
)
Madison Target
Retirement 2030
–
193,125
(193,125
)
Madison Target
Retirement 2040
–
87,796
(87,796
)
Madison Target
Retirement 2050
–
5,593
(5,593
)
Ultra Series Fund | December 31, 2012
Notes to Financial Statements
Ultra Series Fund | December 31, 2012
Notes to Financial Statements
Balance of
Balance of
Shares
Shares
Held at
Gross
Gross
Held at
Value at
Realized
Distributions
Fund/Underlying
Fund
12/31/11
Additions
Sales
12/31/12
12/31/12
Gain (Loss)
Received1
Conservative Allocation Fund
Madison Investment
Grade Corporate Bond Fund
1,205,357
72,578
–
1,277,935
$
14,913,498
$
–
$
301,664
Madison Mosaic
Disciplined Equity Fund
881,454
219,625
120,196
980,883
13,124,209
174,024
835,359
Madison Mosaic
Institutional Bond Fund
1,756,767
–
115,146
1,641,621
18,402,574
36,964
283,171
MEMBERS Bond
Fund Class Y
3,695,022
4,516
1,795,295
1,904,243
20,127,845
1,424,739
762,875
MEMBERS Equity
Income Fund Class Y
1,388,402
103,330
532,960
958,772
9,271,324
(182,640
)
1,085,560
MEMBERS High
Income Fund Class Y
2,807,172
–
1,070,120
1,737,052
12,350,442
331,284
1,114,963
MEMBERS International
Stock Fund Class Y
423,641
171,022
2,103
592,560
6,695,928
1,304
89,391
MEMBERS Large
Cap Growth Fund Class Y
439,308
198,887
230,684
407,511
7,098,844
1,056,278
44,554
MEMBERS Large
Cap Value Fund Class Y
1,003,905
280,051
207,558
1,076,398
14,843,529
423,284
254,234
Totals
$
116,828,193
$
3,265,237
$
4,771,771
Moderate Allocation
Fund
Madison Mosaic
Disciplined Equity Fund
2,379,388
–
159,199
2,220,189
$
29,706,124
$
341,252
$
1,890,802
Madison Mosaic
Institutional Bond Fund
1,538,367
44,924
189,541
1,393,750
15,623,934
73,568
250,324
MEMBERS Bond
Fund Class Y
3,954,926
29,811
1,579,121
2,405,616
25,427,362
1,011,824
951,296
MEMBERS Equity
Income Fund Class Y
1,523,183
28,930
232,779
1,319,334
12,757,964
(46,007
)
1,296,471
MEMBERS High
Income Fund Class Y
4,596,563
72,464
2,213,150
2,455,877
17,461,282
403,253
1,803,827
MEMBERS International
Stock Fund Class Y
1,961,026
58,771
1,311,334
708,463
8,005,628
835,422
106,875
MEMBERS Large
Cap Growth Fund Class Y
1,726,326
43,205
255,663
1,513,868
26,371,588
556,080
169,870
MEMBERS Large
Cap Value Fund Class Y
2,645,715
102,076
390,985
2,356,806
32,500,352
(286,017
)
556,653
MEMBERS Mid
Cap Fund Class Y2
1,421,439
861,972
20,132
2,263,279
17,812,004
15,054
–
MEMBERS Small
Cap Fund Class Y
794,942
–
175,232
619,710
7,244,407
593,237
414,613
NorthRoad
International Fund Class Y
–
1,378,003
–
1,378,003
14,317,452
–
230,517
Totals
$
207,228,097
$
3,497,666
$
7,671,248
1
Distributions
received include distributions from net investment income and from capital gains
from the underlying funds.
2
Non-income
producing.
Ultra Series Fund | December 31, 2012
Notes to Financial Statements
Balance of
Balance of
Shares
Shares
Held at
Gross
Gross
Held at
Value at
Realized
Distributions
Fund/Underlying
Fund
12/31/11
Additions
Sales
12/31/12
12/31/12
Gain (Loss)
Received1
Aggressive
Allocation Fund
Madison Mosaic
Disciplined Equity Fund
1,318,039
29,040
110,774
1,236,305
$
16,541,758
$
185,548
$
1,052,886
MEMBERS Equity
Income Fund Class Y
301,130
109,648
76,915
333,863
3,228,452
(11,284
)
331,850
MEMBERS High
Income Fund Class Y
1,549,510
49,557
1,169,504
429,563
3,054,190
887,846
520,815
MEMBERS International
Stock Fund Class Y
797,169
68,662
544,526
321,305
3,630,741
563,445
48,470
MEMBERS Large
Cap Growth Fund Class Y
821,449
99,782
302,568
618,663
10,777,117
919,764
69,536
MEMBERS Large
Cap Value Fund Class Y
1,238,799
45,113
103,068
1,180,844
16,283,838
(33,165
)
278,903
MEMBERS Mid
Cap Fund Class Y2
903,562
646,128
4,885
1,544,805
12,157,615
6,069
–
MEMBERS Small
Cap Fund Class Y
374,420
–
118,835
255,585
2,987,791
355,307
170,998
NorthRoad
International Fund Class Y
–
595,750
103,118
492,632
5,118,451
17,821
82,409
Totals
$
73,779,953
$
2,891,351
$
2,555,867
1
Distributions
received include distributions from net investment income and from capital gains
from the underlying funds.
2
Non-income
producing.
February 21, 2013
The table below provides
information about actual account values using actual expenses and actual returns
for the Funds. You may use the information in this table, together with the amount
you invested, to estimate the expenses that you paid over the period. Simply divide
your account value by $1,000 (for example, an $8,600 account value divided by $1,000
= 8.6), then multiply the result by the number in the table for the fund you own
under the heading entitled “Actual” to estimate the expenses you paid
on your account during this period.
CLASS I
CLASS II
Expenses
Expenses
Beginning
Ending
Annual
Paid
Ending
Annual
Paid
Account
Account
Expense
During
Account
Expense
During
Fund
Value
Value
Ratio
Period
Value
Ratio
Period
Conservative
Allocation
$
1,000
$
1,048.00
0.31
%
$
1.60
$
1,046.70
0.56
%
$
2.88
Moderate Allocation
1,000
1,055.40
0.31
%
1.60
1,054.00
0.56
%
2.89
Aggressive
Allocation
1,000
1,063.80
0.31
%
1.61
1,062.40
0.56
%
2.90
Money Market
1,000
1,000.00
0.14
%
0.70
1,000.00
0.14
%
0.70
Bond
1,000
1,013.80
0.57
%
2.89
1,012.50
0.81
%
4.10
High Income
1,000
1,055.40
0.77
%
3.98
1,054.10
1.02
%
5.27
Diversified
Income
1,000
1,032.70
0.71
%
3.63
1,031.40
0.96
%
4.90
Large Cap
Value
1,000
1,043.70
0.61
%
3.13
1,042.40
0.86
%
4.42
Large Cap
Growth
1,000
1,042.00
0.81
%
4.16
1,040.70
1.06
%
5.44
Mid Cap
1,000
1,078.50
0.91
%
4.75
1,077.10
1.16
%
6.06
Small Cap
1,000
1,082.90
1.11
%
5.81
1,081.50
1.36
%
7.12
International
Stock
1,000
1,145.80
1.21
%
6.53
1,144,40
1.46
%
7.87
Madison Target
Retirement
2020
1,000
1,053.80
0.30
%
1.55
Madison Target
Retirement
2030
1,000
1,060.70
0.30
%
1.55
Madison Target
Retirement
2040
1,000
1,062.10
0.30
%
1.56
Madison Target
Retirement
2050
1,000
1,066.50
0.30
%
1.56
The table also provides information about hypothetical account values and hypothetical
expenses based on the funds’ actual expense ratios and an assumed rate of return
of 5% per year before expenses, which are not the funds’ actual returns. The hypothetical
account values and expenses may not be used to estimate the actual ending account
balance or expenses you paid for the period. You may use this information to compare
the ongoing costs of investing in the funds and other funds. To do so, compare the
5% hypothetical example of the funds you own with the 5% hypothetical examples that
appear in the shareholder reports of other similar funds.
CLASS I
CLASS II
Expenses
Expenses
Beginning
Ending
Annual
Paid
Ending
Annual
Paid
Account
Account
Expense
During
Account
Expense
During
Fund
Value
Value
Ratio
Period
Value
Ratio
Period
Conservative
Allocation
$
1,000
$
1,023.58
0.31
%
$
1.58
$
1,022.32
0.56
%
$
2.85
Moderate Allocation
1,000
1,023.58
0.31
%
1.58
1,022.32
0.56
%
2.85
Aggressive
Allocation
1,000
1,023.58
0.31
%
1.58
1,022.32
0.56
%
2.85
Money Market
1,000
1,024.43
0.14
%
0.71
1,024.43
0.14
%
0.71
Bond
1,000
1,022.27
0.57
%
2.90
1,021.06
0.81
%
4.12
High Income
1,000
1,021.27
0.77
%
3.91
1,020.01
1.02
%
5.18
Diversified
Income
1,000
1,021.57
0.71
%
3.61
1,020.31
0.96
%
4.88
Large Cap
Value
1,000
1,022.07
0.61
%
3.10
1,020.81
0.86
%
4.37
Large Cap
Growth
1,000
1,021.06
0.81
%
4.12
1,019.81
1.06
%
5.38
Mid Cap
1,000
1,020.56
0.91
%
4.62
1,019.30
1.16
%
5.89
Small Cap
1,000
1,019.56
1.11
%
5.63
1,018.30
1.36
%
6.90
International
Stock
1,000
1,019.05
1.21
%
6.14
1,017.80
1.46
%
7.41
Madison Target
Retirement
2020
1,000
1,023.63
0.30
%
1.53
Madison Target
Retirement
2030
1,000
1,023.63
0.30
%
1.53
Madison Target
Retirement
2040
1,000
1,023.63
0.30
%
1.53
Madison Target
Retirement
2050
1,000
1,047.00
0.30
%
3.07
Interested Trustees and Officers
Name and Year of Birth
Position(s)
and Length of Time Served
Principal Occupation(s) During Past Five Years
Other Directorships/Trusteeships
Katherine
L. Frank1 1960
Trustee and
President,
2009 - Present
Madison Investment
Holdings, Inc. (“MIH”) (affiliated investment advisory firm of Madison),
Executive Director and Chief Operating Officer, 2010 - Present; Managing Director
and Vice President,
1986 - 2010
Madison Asset Management, LLC (“Madison”), Executive Director and Chief Operating Officer, 2010 - Present; Vice President,
2004 - 2010
Madison Investment Advisors, LLC (“MIA”) (affiliated investment
advisory firm of Madison), Executive Director and Chief Operating Officer, 2010
- Present; President, 1996 - 2010
Madison Mosaic Funds (12) (mutual funds),
President, 1996 - Present; Madison Strategic Sector Premium Fund (closed end fund),
President, 2005 - Present; Madison Covered Call and Equity Strategy Fund (closed
end fund), President, 2013 - Present; Madison Funds (13) (mutual funds), President,
2009 - Present
Madison Mosaic
Funds (all but Equity Trust), 1996 - Present; Madison
Strategic Sector Premium Fund,
2005 - Present;
Madison Funds (13), 2009 - Present
Frank E. Burgess
1942
Trustee,
2009
- Present
MIH, Founder;
Chairman of the Board, 2012 - Present; Executive Director and President, 2010 -
2012; Managing Director and President, 1973 - 2010
Madison, Executive Director
and President, 2010 - 2012; President, 2004 - 2010
MIA, Executive Director and President,
2010 - 2012
Madison Mosaic Funds (12), Vice President, 1996 - 2012; Madison
Strategic Sector Premium Fund, Vice President, 2005 - 2012; Madison Funds (13),
Vice President, 2009 - Present
N/A
1
“Interested person” as defined in the Investment Company Act of 1940.
Considered an interested Trustee because of the position held with the investment
adviser of the Trust.
Name and Year of Birth
Position(s)
and Length of Time Served
Principal Occupation(s) During Past Five Years
Other Directorships/Trusteeships
Jay R. Sekelsky
1959
Vice President,
2009 - Present
MIH, Executive
Director and Chief Investment Officer, 2010 - Present; Managing Director and Vice
President, 1990 - 2010
Madison, Executive Director and Chief Investment Officer,
2010 - Present MIA,
Executive Director and Chief Investment Officer, 2010 - Present;
Vice President, 1996 - 2010
Madison Mosaic Funds (12), Vice President, 1996
- Present; Madison Strategic Sector Premium Fund, Vice President, 2005 - Present;
Madison Covered Call and Equity Strategy Fund, Vice President, 2013 - Present; Madison
Funds (13), Vice President, 2009 - Present
N/A
Paul Lefurgey
1964
Vice President,
2009 - Present
MIH, Managing
Director and Head of Fixed Income Investments, 2005 - Present; Madison and MIA,
Managing Director and Head of Fixed Income Investments, 2010 - Present
MEMBERS Capital
Advisors, Inc. (“MCA”) (investment advisory firm), Madison, WI, Vice President,
2003 - 2005
Madison Mosaic Funds (12), Vice President, 2009 - Present; Madison
Strategic Sector Premium Fund, Vice President, 2010 - Present; Madison Covered Call
and Equity Strategy Fund, Vice President, 2013 - Present; Madison Funds (13), Vice
President, 2009 - Present
N/A
Greg D. Hoppe
1969
Treasurer,
2009 - Present
MIH and MIA, Vice President, 1999 - Present; Madison,
Vice President, 2009 - Present
Madison Mosaic Funds (12), Treasurer, 2009 - Present;
Chief Financial Officer, 1999 - 2009
Madison Strategic Sector Premium Fund, Treasurer,
2009 - Present; Chief Financial Officer, 2005 - 2009
Madison Covered Call and
Equity Strategy Fund, Vice President, 2008 - Present
Madison Funds (13),
Treasurer, 2009 - Present
N/A
Ultra Series Fund’s Trustees
and Officers
Name and Year of Birth
Position(s)
and Length of Time Served
Principal Occupation(s) During Past Five Years
Other Directorships/Trusteeships
Holly S. Baggot
1960
Secretary,
1999 - Present; Assistant Treasurer, 1999 - 2007; 2009 - Present; Treasurer,
2008
- 2009
MIH and MIA,
Vice President, 2010 - Present; Madison, Vice President, 2009 - Present; MFD Distributor,
LLC (“MFD”) (an affiliated brokerage firm of Madison), Vice President,
2012 - Present
MCA, Director-Mutual Funds, 2008-2009; Director-Mutual Fund Operations,
2006 - 2008; Operations Officer-Mutual Funds, 2005-2006; Senior Manager-Product
& Fund Operations, 2001-2005
Madison Mosaic Funds (12), Secretary and Assistant
Treasurer, 2009 -
Present; Madison Strategic Sector Premium Fund, Secretary
and Assistant Treasurer, 2010 - Present; Madison Covered Call and Equity Strategy
Fund, Secretary and Assistant Treasurer, 2013 - Present; Madison Funds (13), Secretary,
1999 - Present and Treasurer, 2008-2009 and Assistant Treasurer, 1997-2007 and 2009 -
Present
N/A
W. Richard
Mason
1960
Chief
Compliance Officer,
Corporate Counsel and Assistant Secretary,
2009 - Present
MIH, MIA,
Madison and Madison Scottsdale, LC (an affiliated investment advisory firm of Madison),
Chief Compliance Officer and Corporate Counsel, 2009 - Present; General Counsel
and Chief Compliance Officer, 1996 - 2009
MFD, Principal, 1998 - Present; Concord
Asset Management, LLC (“Concord”) (an affiliated investment advisory firm
of Madison), General Counsel, 1996 - 2009; NorthRoad Capital Management LLC (“NorthRoad”) (an affiliated investment advisory firm of Madison), Chief Compliance Officer
and Corporate Counsel, 2011 - Present
Madison Mosaic Funds (12), Chief Compliance
Officer, Corporate Counsel and Assistant Secretary, 2009 - Present; Secretary, General
Counsel and Chief Compliance Officer, 1992 - 2009
Madison Strategic Sector Premium
Fund, Chief Compliance Officer, Corporate Counsel and Assistant Secretary, 2009
- Present; Secretary, General Counsel and Chief Compliance Officer, 2005 - 2009
Madison Covered Call and Equity Strategy Fund, Chief Compliance Officer, Corporate
Counsel and Assistant Secretary, 2013 - Present
Madison Funds (13), Chief Compliance
Officer, Corporate Counsel and Assistant Secretary, 2009 - Present
N/A
Ultra Series Fund’s Trustees
and Officers
Name and Year of Birth
Position(s)
and Length of Time Served
Principal Occupation(s) During Past Five Years
Other Directorships/Trusteeships
Pamela M.
Krill
1966
General Counsel, Chief Legal Officer and Assistant Secretary,
2009 - Present
MIH, MIA,
Madison, Madison Scottsdale, LC, MFD, and
Concord, General Counsel and Chief Legal Officer, 2009 - Present
NorthRoad, General
Counsel & Chief Legal Officer, 2011 - Present
Madison Mosaic Funds (12),
General Counsel, Chief Legal Officer and Assistant Secretary, 2009 - Present; Madison
Strategic Sector Premium Fund, General Counsel, Chief Legal Officer and Assistant
Secretary, 2010 - Present; Madison Covered Call and Equity Strategy Fund, General
Counsel, Chief Legal Officer and Assistant Secretary, 2013 - Present; Madison Funds
(13), General Counsel, Chief Legal Officer and Assistant Secretary, 2009 - Present
CUNA Mutual Insurance Society (insurance company with affiliated investment
advisory, brokerage and mutual fund operations), Madison, WI, Managing Associate
General Counsel-Securities & Investments, 2007 - 2009
Godfrey & Kahn,
S.C. (law firm), Madison and Milwaukee, WI, Shareholder/Partner, Securities Practice
Group, 1994-2007
N/A
Independent Trustees
Name and Year of Birth
Position(s)
and Length of Time Served1
Principal Occupation(s) During Past Five Years
Portfolios
Overseen in
Fund Complex2
Other Directorships/Trusteeships
Philip E.
Blake
1943
Trustee,
2009 - Present
Retired Investor
Lee Enterprises, Inc (news and advertising publisher),
Madison, WI, Vice President,
1998 - 2001
Madison Newspapers, Inc., Madison, WI, President and Chief Executive
Officer, 1993 - 2000
43
Edgewood College,
2003 - Present; Chairman of the Board, 2010 - Present; Nerites Corporation (technology
company), 2004 - Present; Madison Mosaic Funds (12), 2001 - Present; Madison Strategic
Sector Premium Fund, 2005 - Present; Madison Covered Call & Equity Strategy
Fund, 2012 - Present; Madison Funds (13), 2009 - Present
1
Independent Trustees serve in such capacity until the Trustee reaches the age of
76, unless retirement is waived by unanimous vote of the remaining Trustees on an
annual basis.
2
As of December 31, 2012, the fund complex consists of the Trust with 16 portfolios,
the Madison Funds (formerly known as MEMBERS Mutual Funds) with 13 portfolios, the
Madison Strategic Sector Premium Fund (a closed-end fund), the Madison Covered
Call & Equity Strategy Fund (a closed-end fund) and the Madison Mosaic Equity,
Income, Tax-Free and Government Money Market Trusts, which together have 12 portfolios,
for a grand total of 43 separate portfolios in the fund complex. Not every Trustee
is a member of the Board of Trustees of every fund in the fund complex, as noted
above.
Ultra Series Fund’s Trustees
and Officers
Name and Year of Birth
Position(s)
and Length of Time Served1
Principal Occupation(s) During Past Five Years
Portfolios
Overseen in
Fund Complex2
Other Directorships/Trusteeships
James R Imhoff,
Jr.
1944
Trustee,
2009
- Present
First Weber
Group (real estate brokers), Madison, WI, Chief Executive Officer, 1996 - Present
43
Park Bank,
1978 - Present; Madison Mosaic Funds (12), 1996 - Present; Madison Strategic Sector
Premium Fund, 2005 - Present; Madison Covered Call & Equity Strategy Fund,
2005 - Present; Madison Funds (13), 2009 - Present
Steven P.
Riege
1954
Trustee,
2005 -
Present
Ovation Leadership
(management consulting), Milwaukee, WI, Owner/President, 2001 - Present; Robert
W. Baird & Company (financial services), Milwaukee, WI, Senior Vice President-
Marketing and Vice President-Human Resources, 1986 - 2001
29
Madison Funds
(13), 2005 - Present
Richard E.
Struthers
1952
Trustee,
2004 -
Present
Clearwater
Capital Management (investment advisory firm), Minneapolis, MN, Chair and Chief
Executive Officer, 1998 - Present; Park Nicollet Health Services, Minneapolis, MN,
Chairman, Finance and Investment Committee, 2006 - 2012; IAI Mutual Funds, Minneapolis,
MN, President and Director, 1992 - 1997
29
Health Partners,
2013 - Present; Park Nicolet Health Services, 2001 - 2012; Madison Funds (12), 2004
- Present
Ultra Series Fund’s Trustees and Officers
Name and Year of Birth
Position(s)
and Length of Time Served1
Principal Occupation(s) During Past Five Years
Portfolios
Overseen in
Fund Complex2
Other Directorships/Trusteeships
Richard E.
Struthers
1952
Trustee,
2004 -
Present
Clearwater
Capital Management (investment advisory firm), Minneapolis, MN, Chair and Chief
Executive Officer, 1998 - Present; Park Nicollet Health Services, Minneapolis, MN,
Chairman, Finance and Investment Committee, 2006 - 2012; IAI Mutual Funds, Minneapolis,
MN, President and Director, 1992 -1997
29
Health Partners,
2013 - Present; Park Nicolet Health Services, 2001 - 2012; Madison Funds (12), 2004
- Present
Lorence D.
Wheeler
1938
Trustee,
2009
- Present
Retired investor;
Credit Union Benefits Services, Inc. (a provider of retirement plans and related
services for credit union employees nationwide), Madison, WI, President,
1986 -
1997
43
Grand Mountain
Bank FSB and Grand Mountain Bancshares, Inc. 2003 - Present; Madison Mosaic Funds
(12), 1996 - Present; Madison Strategic Sector Premium Fund, 2005 - Present; Madison
Covered Call & Equity Strategy Fund, 2005 - Present; Madison Funds (13), 2009
- Present
1
Independent Trustees serve in such capacity until the Trustee reaches the age of
76, unless retirement is waived by unanimous vote of the remaining Trustees on an
annual basis.
2
As of December 31, 2012, the fund complex consists of the Trust with 16 portfolios,
the Madison Funds (formerly known as MEMBERS Mutual Funds) with 13 portfolios, the
Madison Strategic Sector Premium Fund (a closed-end fund), the Madison Covered
Call & Equity Strategy Fund (a closed-end fund) and the Madison Mosaic Equity,
Income, Tax-Free and Government Money Market Trusts, which together have 12 portfolios,
for a grand total of 43 separate portfolios in the fund complex. Not every Trustee
is a member of the Board of Trustees of every fund in the fund complex, as noted
above.