UNITED STATES
SECURITIES AND EXCHANGE COMMISSION
WASHINGTON, DC 20549
FORM 8-K
CURRENT REPORT
PURSUANT TO SECTION 13 OR 15(d) OF THE
SECURITIES EXCHANGE ACT OF 1934
Date of report (Date of earliest event reported) February 1, 2017
SEACOAST BANKING CORPORATION OF FLORIDA
(Exact Name of Registrant as Specified in Charter)
Florida | 0-13660 | 59-2260678 | ||
(State or Other Jurisdiction of Incorporation) |
(Commission File Number |
(IRS Employer Identification No.) |
815 Colorado Avenue, Stuart, FL | 34994 | |
(Address of Principal Executive Offices) | (Zip Code) |
Registrant’s telephone number, including area code (772) 287-4000
Check the appropriate box below if the Form 8-K filing is intended to simultaneously satisfy the filing obligation of the registrant under any of the following provisions (see General Instruction A.2.)
¨ | Written communications pursuant to Rule 425 under the Securities Act (17 CFR 230.425) |
¨ | Soliciting material pursuant to Rule 14a-12 under the Exchange Act (17 CFR 240.14a-12) |
¨ | Pre-commencement communications pursuant to Rule 14d-2(b) under the Exchange Act (17 CFR 240.14d-2(b)) |
¨ | Pre-commencement communications pursuant to Rule 13e-4(c) under the Exchange Act (17 CFR 240.13e-4(c)) |
8-K – page 2 of 5
SEACOAST BANKING CORPORATION OF FLORIDA
Item 2.02 | Results of Operations and Financial Condition |
On February 1, 2017, Seacoast Banking Corporation of Florida (“Seacoast” or the “Company”) announced its financial results for the fourth quarter and year ended December 31, 2016.
A copy of the press release announcing Seacoast’s results for the fourth quarter and year ended December 31, 2016 is attached hereto as Exhibit 99.1 and incorporated herein by reference.
Item 7.01 | Regulation FD Disclosure |
On February 2, 2017, Seacoast held an investor conference call to discuss its financial results for the fourth quarter and year ended December 31, 2016. A transcript of this conference call is attached hereto as Exhibit 99.2 and incorporated herein by reference. Also attached as Exhibit 99.3 are charts (available on the Company’s website at www.seacoastbanking.net) containing information used in the conference call and incorporated herein by reference. All information included in the transcript and the charts is presented as of December 31, 2016, and the Company does not assume any obligation to correct or update said information in the future.
The information in Items 2.02 and 7.01, as well as Exhibits 99.1, 99.2 and 99.3, is being furnished and shall not be deemed “filed” for purposes of Section 18 of the Securities Exchange Act of 1934, nor shall it be deemed incorporated by reference in any filing under the Securities Act of 1933.
Item 9.01 | Financial Statements and Exhibits |
(d) Exhibits
Exhibit No. | Description | |
99.1 |
Press Release dated February 1, 2017 with respect to Seacoast’s financial results for the fourth quarter and year ended December 31, 2016 | |
99.2 |
Transcript of Seacoast’s investor conference call held on February 2, 2017 to discuss the Company’s financial results for the fourth quarter and year ended December 31, 2016 | |
99.3 |
Data on website containing information used in the conference call held on February 2, 2017 |
8-K – page 3 of 5
Exhibits 99.1, 99.2 and 99.3 referenced herein contain “forward-looking statements” within the meaning of Section 28A of the Securities Act of 1933 and Section 21E of the Securities Exchange Act of 1934, including, without limitation, statements about future financial and operating results, ability to realized deferred tax assets, cost savings, enhanced revenues, economic and seasonal conditions in our markets, and improvements to reported earnings that may be realized from cost controls and for integration of banks that we have acquired, as well as statements with respect to Seacoast’s objectives, expectations and intentions and other statements that are not historical facts. Actual results may differ from those set forth in the forward-looking statements.
Forward-looking statements include statements with respect to our beliefs, plans, objectives, goals, expectations, anticipations, estimates and intentions, and involve known and unknown risks, uncertainties and other factors, which may be beyond our control, and which may cause the actual results, performance or achievements of Seacoast to be materially different from future results, performance or achievements expressed or implied by such forward-looking statements. You should not expect us to update any forward-looking statements.
You can identify these forward-looking statements through our use of words such as “may,” “will,” “anticipate,” “assume,” “should,” “support”, “indicate,” “would,” “believe,” “contemplate,” “expect,” “estimate,” “continue,” “further”, “point to,” “project,” “could,” “intend” or other similar words and expressions of the future. These forward-looking statements may not be realized due to a variety of factors, including, without limitation: the effects of future economic and market conditions, including seasonality; governmental monetary and fiscal policies, as well as legislative, tax and regulatory changes; changes in accounting policies, rules and practices; the risks of changes in interest rates on the level and composition of deposits, loan demand, liquidity and the values of loan collateral, securities, and interest sensitive assets and liabilities; interest rate risks, sensitivities and the shape of the yield curve; the effects of competition from other commercial banks, thrifts, mortgage banking firms, consumer finance companies, credit unions, securities brokerage firms, insurance companies, money market and other mutual funds and other financial institutions operating in our market areas and elsewhere, including institutions operating regionally, nationally and internationally, together with such competitors offering banking products and services by mail, telephone, computer and the Internet; and the failure of assumptions underlying the establishment of reserves for possible loan losses. The risks of mergers and acquisitions, include, without limitation: unexpected transaction costs, including the costs of integrating operations; the risks that the businesses will not be integrated successfully or that such integration may be more difficult, time-consuming or costly than expected; the potential failure to fully or timely realize expected revenues and revenue synergies, including as the result of revenues following the merger being lower than expected; the risk of deposit and customer attrition; any changes in deposit mix; unexpected operating and other costs, which may differ or change from expectations; the risks of customer and employee loss and business disruption, including, without limitation, as the result of difficulties in maintaining relationships with employees; increased competitive pressures and solicitations of customers by competitors; as well as the difficulties and risks inherent with entering new markets.
All written or oral forward-looking statements attributable to us are expressly qualified in their entirety by this cautionary notice, including, without limitation, those risks and uncertainties described in our annual report on Form 10-K for the year ended December 31, 2015 under “Special Cautionary Notice Regarding Forward-Looking Statements” and “Risk Factors”, and otherwise in our SEC reports and filings. Such reports are available upon request from the Company, or from the Securities and Exchange Commission, including through the SEC’s Internet website at http://www.sec.gov.
8-K – page 4 of 5
SIGNATURES
Pursuant to the requirements of the Securities Exchange Act of 1934, the registrant has duly caused this report to be signed on its behalf by the undersigned hereunto duly authorized.
SEACOAST BANKING CORPORATION OF FLORIDA | ||
(Registrant) | ||
Date: February 7, 2017 | By: | /s/ Stephen Fowle |
Stephen Fowle | ||
Executive Vice President and Chief Financial Officer |
8-K – page 5 of 5
EXHIBIT INDEX
Exhibit No. | Description | |
99.1 | Press Release dated February 1, 2017 with respect to Seacoast’s financial results for the fourth quarter and year ended December 31, 2016 | |
99.2 | Transcript of Seacoast’s investor conference call held on February 2, 2017 to discuss the Company’s financial results for the fourth quarter and year ended December 31, 2016 | |
99.3 | Data on website containing information used in the conference call held on February 2, 2017 |
Exhibit 99.1
Stephen Fowle
Executive Vice President
Chief Financial Officer
(772) 463-8977
Steve.fowle@seacoastbank.com
Seacoast
Achieves Ambitious 2016 Earnings Goal And
Establishes Guidance for 2017
Fourth Quarter EPS Increased 56% Year-over-Year;
Second Consecutive
Quarter of Record Loan Production; Strong Expense Management
and Ongoing Transformation Continue to Benefit Shareholders
STUART, Fla., February 1, 2017 /PRNewswire/ — Seacoast Banking Corporation of Florida (“Seacoast” or “the Company”) (NASDAQ: SBCF) today reported results for the fourth quarter and full year 2016.
Full-year 2016 net income improved $7.1 million to $29.2 million, up 32%; and fully diluted earnings per share increased 18% to $0.78 compared with $0.66 per diluted common share in 2015. Adjusted net income1 increased to $37.5 million in 2016 from $25.3 million in 2015, up 48%; and adjusted diluted earnings per share1 rose 33% to $1.00 for the year, meeting Seacoast’s 2016 earnings target.
Fourth quarter 2016 net income totaled $10.8 million, an increase of $4.7 million, or 78%, from the same period of the prior year; and rose $1.6 million or 18% compared with third quarter 2016 levels. Adjusted net income1 increased $4.8 million, or 73%, from year-ago levels and $0.7 million or 7%, above the third quarter. Diluted earnings per common share (EPS) were $0.28 and adjusted diluted EPS1 were $0.30 in the fourth quarter, compared to diluted EPS of $0.18 and adjusted diluted EPS1 of $0.19 in the fourth quarter last year.
Seacoast announced 2017 earnings guidance with expected full year adjusted EPS of $1.24 to $1.28 per share.
Growth and Transformation Highlights Reflect Significant Franchise Gains
· | Loans grew $723 million, or 34%, from year-ago levels. Adjusting for acquisitions, loan growth was $383 million, or 18%. Loans increased $110 million sequentially, recording a 16% annualized growth rate. |
· | Seacoast maintained its balanced growth focus and conservative risk posture ending the year with commercial real estate loan concentration levels well below regulatory guidance. |
· | Seacoast’s customer-analytics-driven transformation continues with debit card spend up 17% year-over-year, a new high, consumer loans sold to existing customers up 62% and 37% of deposits made outside the branch. |
1 Non-GAAP measure, see “Explanation of Certain Unaudited Non-GAAP Financial Measures”
1
Financial Highlights Reflect Significant Efficiency Gains
· | Full year total revenues increased $35.3 million, or 25%, year-over-year to $177.4 million, reflecting significant franchise growth. Fourth quarter revenues increased $10.1 million, or 27%, from fourth quarter 2015 levels. |
· | Fourth quarter efficiency ratio improved to 62.4%, down from 72.6% in the fourth quarter 2015. Adjusted efficiency ratio1 was 60.8% an 830 basis points improvement from fourth quarter 2015. |
· | Fourth quarter return on average assets (ROA) and return on average equity (ROE) improved to 0.94% and 9.80%, up from 0.69% and 6.78%, respectively, in the fourth quarter 2015. Adjusted ROA1 was 0.99%, a 24 basis points improvement over fourth quarter 2015. Adjusted return on tangible common equity1 (ROTCE) gained 420 basis points, reaching 13.1% during the fourth quarter. |
Dennis S. Hudson, III, Chairman and CEO said, “We are pleased that we achieved our $1.00 adjusted EPS goal for 2016. Seacoast’s execution of our balanced growth strategy and continuing transformation drove exceptional franchise growth and performance improvement, allowing us to overcome unanticipated headwinds from a declining rate environment over much of 2016.
“Continued analytics-driven marketing and improved sales execution, combined with the favorable Florida economy, drove record loan production. This produced 16% annualized growth in total loans as compared with the third quarter of this year. We continue to honor our lending guardrails, resulting in a balanced approach and a well-diversified loan portfolio. Our portfolio remains extremely granular, with low commercial real estate concentration of approximately 214% of total capital.
“The fourth quarter also reflects the first full quarter of benefit from our 2016 acquisitions. Organic growth, targeted expense reduction strategies, and successful merger implementations drove significant continued operating leverage. Year-over-year revenues grew 27%, outpacing a twelve percent increase in noninterest expense over the corresponding period. Adjusted revenues,1 excluding securities gains and a bargain purchase gain taken in Q4 2015, grew 28%, outpacing a 14% increase in adjusted expenses1 over this same period.
”On an annual basis, we’ve now moved nearly 1 million basic check deposits out of our branch network and in to lower cost channels like ATMs and mobile. When looking at all routine transactions in total, our customers are increasingly choosing more convenient channels to manage routine transactions. At this point, we expect we’ll process more routine transactions through lower cost channels than in our branch network by July of this year.
“One year ago, we announced our $1.00 adjusted EPS goal for 2016. This was an aggressive target, a 33% increase from the prior year. We achieved that goal, and exited 2016 with improved results in all key performance measures and strong momentum in each of our business units. Adjusted ROA1 improved 24 basis points to 0.99% and adjusted ROTCE1 increased 420 basis points to 13.1% during last year.
“We begin 2017 with much improved performance and on a trajectory to outperform our peers.
1Non-GAAP measure, see “Explanation of Certain Unaudited Non-GAAP Financial Measures”
2
We will provide a broader discussion of our strategy to deliver long-term value for our shareholders and our three-year expectations at our upcoming investor day on February 22, 2017,” Hudson concluded.
FINANCIAL HIGHLIGHTS | 4Q16 | 3Q16 | 2Q16 | 1Q16 | 4Q15 | |||||||||||||||
(Dollars in thousands except per share data) | ||||||||||||||||||||
Total Assets | $ | 4,680,932 | $ | 4,513,934 | $ | 4,381,204 | $ | 4,001,323 | $ | 3,534,780 | ||||||||||
Loans | 2,879,536 | 2,769,338 | 2,616,052 | 2,455,214 | 2,156,330 | |||||||||||||||
Deposits | 3,523,245 | 3,510,493 | 3,501,316 | 3,222,447 | 2,844,387 | |||||||||||||||
Net Income | 10,771 | 9,133 | 5,332 | 3,966 | 6,036 | |||||||||||||||
Diluted Earnings Per Share | 0.28 | 0.24 | 0.14 | 0.11 | 0.18 | |||||||||||||||
Return on Average Assets (ROA) | 0.94 | % | 0.82 | % | 0.51 | % | 0.44 | % | 0.69 | % | ||||||||||
Return on Average Tangible Common Equity(ROTCE)1 | 12.5 | 10.9 | 6.6 | 5.1 | 7.8 | |||||||||||||||
Net Interest Margin | 3.56 | 3.69 | 3.63 | 3.68 | 3.67 | |||||||||||||||
Efficiency Ratio | 62.4 | 68.6 | 78.0 | 81.7 | 72.6 | |||||||||||||||
Pretax, Pre-provision Income 1 | $ | 17,058 | $ | 14,002 | $ | 8,842 | $ | 6,600 | $ | 10,130 | ||||||||||
Average Diluted Shares Outstanding (000) | 38,252 | 38,170 | 38,142 | 35,453 | 34,395 | |||||||||||||||
Adjusted Net Income 1 | $ | 11,337 | $ | 10,588 | $ | 8,773 | $ | 6,758 | $ | 6,569 | ||||||||||
Adjusted Diluted Earnings Per Share 1 | 0.30 | 0.28 | 0.23 | 0.19 | 0.19 | |||||||||||||||
Adjusted ROA 1 | 0.99 | % | 0.95 | % | 0.84 | % | 0.75 | % | 0.75 | % | ||||||||||
Adjusted ROTCE 1 | 13.1 | 12.6 | 10.6 | 8.5 | 8.9 | |||||||||||||||
Adjusted Efficiency Ratio 1 | 60.8 | 63.1 | 64.8 | 69.6 | 69.1 | |||||||||||||||
Adjusted Pretax, Pre-provision Income 1 | $ | 17,775 | $ | 16,370 | $ | 14,607 | $ | 11,082 | $ | 10,990 | ||||||||||
Annualized Adjusted Noninterest Expenses as a Percentage of Average Assets 1 | 2.57 | % | 2.78 | % | 2.77 | % | 3.05 | % | 2.97 | % |
1Non-GAAP measure, see “Explanation of Certain Unaudited Non-GAAP Financial Measures”
3
Acquisitions Update
During the fourth quarter, we announced our acquisition of GulfShore Bancshares, Inc. (“GulfShore”) which accelerated our entry into the fast-growing, business-rich Tampa market, Florida’s second largest. We look forward to welcoming GulfShore’s customers to Seacoast following the integration, which is expected to be completed in the second quarter of 2017.
“In Tampa, we intend to follow our Orlando playbook, which has made us a Top Ten bank in only 20 months. In the first half of 2016, we acquired Floridian Financial Corporation and BMO Harris’ Orlando banking operations, making us the largest Florida-based bank in Orlando. Orlando now represents 37% of our franchise, measured by deposits, up from virtually no presence three years ago,” Hudson said.
Florida Economic Update
"Economic indicators continue to show strength for Florida’s economy and housing market,” Hudson commented. “A December 2016 report released by Wells Fargo Securities Economics Group commented, ‘The recently updated state GDP data and the Quarterly Census of Employment and Wages (QCEW) provide additional insight into Florida’s recent strong economic performance. Florida’s economy grew 2.9 percent year to year in Q2, far exceeding the nation’s 1.2 percent growth.” Hudson continued, “Their November report forecasted, ‘We look for Florida’s strong run of economic growth to carry over into 2017, albeit at a slightly more modest pace. Real GDP should grow 3.3 percent next year and nonfarm payrolls should add around 235,000 new jobs. Homebuilding should continue to gain momentum, as stronger jobs and income growth boosts household formation and encourages more job seekers to move to Florida.2
“Florida’s residential real estate market remains solid. November statistics released by Florida REALTORS continue to show a year-over-year increase in closed sales and median sales price, with time to contract continuing a shortening trend. With this improvement, however, home prices still remain well below pre-recession levels.” Hudson concluded.3
Management Update
“On January 26th, we announced that Charles M. (Chuck) Shaffer, who is currently executive vice president and head of community banking, was appointed chief financial officer and head of strategy, effective March 15th. This appointment reflects our commitment to identify and groom talent that will support the execution of our long-term growth strategy. Having spent nearly 20 years with Seacoast, across a variety of operational and financial roles, Chuck has the perfect complement of skills to lead Seacoast’s financial and strategic initiatives. I would also like to thank Steve Fowle for his invaluable contribution to Seacoast’s transformation over the past two years and wish him well in his next endeavor.
2 https://www08.wellsfargomedia.com/assets/pdf/commercial/insights/economics/regional-reports/fl-economic-outlook-20161101.pdf
3http://blog.comerica.com/2016/11/15/florida-economy-gains-momentum-heading-into-2017/
4
“I am also pleased to announce that we have appointed Julie Kleffel, currently executive vice president and head of small-business banking, to succeed Chuck as head of community banking, which includes our small-business unit. Julie has been a major asset in the growth of our small-business operations and possesses the leadership qualities that will enable her to continue to succeed in this new role,” Hudson stated.
Conference Call and Investor Day Information
Seacoast will host a conference call on Thursday, February 2, 2017 at 10:00 a.m. (Eastern Time) to discuss the earnings results. Investors may call in (toll-free) by dialing (800)-774-6070 (passcode: 9408 151). Slides will be used during the conference call and may be accessed at Seacoast's website at SeacoastBanking.com by selecting "Presentations" under the heading "Investor Services." A replay of the call will be available for one month, beginning late afternoon of February 2, by dialing (888) 843-7419 and using passcode: 9408 151.
Alternatively, individuals may listen to the live webcast of the presentation by visiting Seacoast's website at SeacoastBanking.com. The link is located in the subsection "Presentations" under the heading "Investor Services." Beginning the afternoon of February 2, an archived version of the webcast can be accessed from this same subsection of the website. The archived webcast will be available for one year.
In addition, Seacoast will host an investor day in New York on Wednesday, February 22 from 8:00 a.m. to 12:00 p.m. Eastern Standard Time. Investors wishing to attend may contact Debra Policino via email at Debra.Policino@seacoastbank.com. The investor day will also be webcast and details will be provided closer to the date.
Fourth Quarter 2016 Income Statement Highlights
Strong Organic Growth Drives Continued Net Interest Income Improvement
Net interest income for the quarter totaled $37.4 million, an $8.3 million, or 29%, increase from fourth quarter 2015 levels. Net interest margin was 3.56%, down 11 basis points from the prior year. Year-over-year net interest income improvement reflects strong organic loan growth combined with growth from successful acquisitions in the first half of the year. The decrease in margin reflects decreased loan yields, reflecting the current low interest rate environment, partially offset by improved balance sheet mix.
Net interest income was level compared to the third quarter of 2016 and net interest margin decreased 13 basis points from 3.69% in the prior quarter. While quarter over quarter the Company recorded strong loan growth, the decrease reflects lower purchased loan accretion (approximately 6 basis points) combined with the impact of wholesale leverage (approximately 5 basis points) which improved net interest income and reduced margin.
Noninterest Income Growth Benefits from Acquisitions, Loan Growth
Noninterest income totaled $9.9 million for the fourth quarter of 2016, $1.7 million, or 21%, above the $8.2 million recorded in the same quarter of 2015. Excluding securities gains and a bargain purchase gain taken in the fourth quarter 2015, noninterest income totaled $9.9 million, $2.1 million, or 27%, above last year. Significant contributors to the increase in noninterest income include mortgage banking revenue, which increased $0.7 million, or 69%, from the year-ago period; deposit service charges, which increased $0.4 million, or 17%; interchange income, which increased $0.3 million, or 17%; other income, which increased $0.5 million, or 75%, and bank owned life insurance (“BOLI”) income which increased $0.2 million, or 54%, due to additional purchases during the quarter.
5
Noninterest income excluding securities gains increased $0.2 million from third quarter 2016 levels. Declines of $0.3 million in mortgage banking fees during the quarter were more than offset by increases in wealth management fees, up $0.2 million, or 13%, as a result of customer growth, additional BOLI income, up $0.2 million, or 60%, and growth-driven increases in transaction based services (service charges on deposits, interchange income, other deposit fees and other fees). Transaction-based revenue increased, in aggregate, despite the disruption of Hurricane Matthew in October.
Noninterest Expense Growth Reflects Merger Activity
Noninterest expense increased $3.1 million from the fourth quarter of 2015, including $1.6 million higher compensation-related costs. Fourth quarter 2016 expenses were impacted by $0.7 million in acquisition and other nonrecurring expenses compared to $1.3 million in the fourth quarter of 2015. Adjusted noninterest expense1 increased $3.7 million from prior-year levels. The year-over-year increase in adjusted expense reflects ongoing costs related to the acquisitions of Floridian Financial Group and BMO Harris’ Orlando operations, including salaries and benefits, occupancy and equipment, and data processing costs associated with the acquisitions, and costs to support significant organic growth and investment in the franchise. Revenues, excluding securities gains and the bargain purchase gain recognized in fourth quarter 2015, grew $10.3 million, or 28%, compared to prior year levels while adjusted noninterest expense1 grew 14% primarily related to salaries, data processing, and occupancy expenses, which increased $1.7 million, $0.8 million, and $0.5 million, respectively.
Noninterest expense decreased $3.1 million from the third quarter 2016, partially due to a higher level of merger expenses and other nonrecurring expenses recorded in the third quarter. Of the salary decrease of $1.7 million, $0.9 million related to accrual reversals for cash and stock compensation incentives that we anticipate will start accruing again during first quarter 2017. Adjusted noninterest expense1 declined $1.3 million, or 4%. Contributing to the lower adjusted noninterest expense1 during the fourth quarter of 2016 were $1.2 million of reductions for salary costs, occupancy, and data processing expense.
Fourth Quarter 2016 Balance Sheet Highlights
Strong Originations Drive Loan Portfolio Even Higher
Net loans totaled $2.88 billion, an increase of $723 million, or 34%, above the fourth quarter 2015. Excluding acquisitions, loans increased $383 million, or 18%, above the prior year. Loans increased $110 million or 16%, annualized, from third quarter 2016.
Loan production continued at a record pace for a second consecutive quarter. Commercial loan originations reached $145 million, a record quarter and well ahead of $80 million of production in the fourth quarter of 2015. The commercial pipeline (in underwriting and approval or approved and not yet closed) totaled $89 million at December 31, 2016.
1Non-GAAP measure, see “Explanation of Certain Unaudited Non-GAAP Financial Measures”
6
Consumer loan and small business originations totaled $83 million during the fourth quarter of 2016 compared to $60 million one year ago. Closed residential production for the quarter totaled $119 million compared with $60 million during the fourth quarter 2015, with a total residential pipeline of $73 million as of December 31, 2016, up from a pipeline of $30 million one year ago.
(Dollars in thousands) | 4Q16 | 3Q16 | 2Q16 | 1Q16 | 4Q15 | |||||||||||||||
Commercial pipeline | $ | 88,814 | $ | 119,394 | $ | 113,261 | $ | 97,953 | $ | 105,556 | ||||||||||
Commercial loans closed | 144,975 | 109,078 | 111,133 | 67,252 | 80,003 | |||||||||||||||
Residential pipeline | $ | 72,604 | $ | 79,379 | $ | 66,083 | $ | 57,739 | $ | 30,340 | ||||||||||
Residential loans retained | 74,745 | 68,748 | 64,003 | 36,335 | 24,905 | |||||||||||||||
Residential loans sold | 81,141 | 79,151 | 39,499 | 30,345 | 35,278 |
Credit Quality Remains Stable and Strong
The provision for loan losses was $1.0 million for the fourth quarter of 2016, up from $369,000 in the fourth quarter 2015 and $550,000 recorded in the third quarter 2016. The higher provision was the result of strong loan growth along with net charge-offs of $283,000 during the quarter, compared to $1.4 million in net recoveries collected during the third quarter 2016 and $569,000 in net charge-offs in the fourth quarter 2015. The ratio of allowance for loan losses to non-acquired loans was 0.96% as of December 31 2016, a slight decrease from 1.00% as of September 30, 2016.
Additional highlights include:
· | Nonperforming assets to total assets declined to 0.60%, compared to 0.69% one year ago. Of $28.0 million in nonperforming assets, nine properties at a carrying value of $5.7 million relate to closed branch properties held as REO. |
· | The ratio of allowance for loan losses to nonperforming loans stood at 106.8%, more than covering nonperforming loans. |
Deposits Built on Core Customer Growth and Acquired Deposits
Total deposits were $3.52 billion as of December 31, 2016, $679 million or 24% above the fourth quarter 2015. Core customer funding increased to $3.38 billion, a $653 million or 24% increase. Excluding acquisitions, core customer funding increased by $143 million or 5% and total deposits increased $13 million or 2% above the fourth quarter 2015. Core customer funding increased $63 million and total deposits grew $13 million compared to the third quarter 2016. Seacoast realized growth in deposits despite planned decreases in high-cost acquired certificates of deposit and significant branch consolidation. Total deposits per branch location increased to $75 million as of December 31, 2016, compared to $66 million one year prior.
Aggregate noninterest demand and low cost interest-bearing demand deposits increased $77 million or 4% (not annualized) from the third quarter of 2016 and $433 million or 27% from the fourth quarter of 2015. Excluding acquired deposits, noninterest demand deposits increased $110 million over the fourth quarter 2015. No cost demand and interest bearing demand accounts were 57% of deposit balances.
7
(Dollars in thousands) | Fourth Quarter 2016 | Third Quarter 2016 | Second Quarter 2016 | First Quarter 2016 | Fourth Quarter 2015 | |||||||||||||||
Customer Relationship Funding | ||||||||||||||||||||
Noninterest demand | $ | 1,148,309 | $ | 1,168,542 | $ | 1,146,792 | $ | 1,054,069 | $ | 854,447 | ||||||||||
Interest-bearing demand | 873,727 | 776,480 | 776,388 | 750,904 | 734,749 | |||||||||||||||
Money market | 802,697 | 858,931 | 860,930 | 741,657 | 665,353 | |||||||||||||||
Savings | 346,662 | 340,899 | 330,928 | 313,179 | 295,851 | |||||||||||||||
Time certificates of deposit | 351,850 | 365,641 | 386,278 | 362,638 | 293,987 | |||||||||||||||
Total deposits | $ | 3,523,245 | $ | 3,510,493 | $ | 3,501,316 | $ | 3,222,447 | $ | 2,844,387 | ||||||||||
Customer sweep accounts | $ | 204,202 | $ | 167,693 | $ | 183,387 | $ | 198,330 | $ | 172,005 | ||||||||||
Total core customer funding | $ | 3,375,597 | $ | 3,312,545 | $ | 3,298,425 | $ | 3,058,139 | $ | 2,722,405 | ||||||||||
Demand deposit mix (noninterest bearing) | 32.6 | % | 33.3 | % | 32.8 | % | 32.7 | % | 30.0 | % |
Other Highlights
Income Taxes
Seacoast recorded a $5.3 million income tax provision in the fourth quarter of 2016, compared to $4.3 million in the third quarter of 2016 and $3.7 million in the prior year. The fourth and third quarter 2016 tax provisions benefited from the early adoption of ASU 2016-09, Improvements to Employee Share-Based Payment Accounting. As a result, Seacoast recorded a benefit of $383,000 and $418,000 for the fourth and third quarter, respectively, adding approximately $0.01 per diluted share to each quarter.
Excluding the adoption of ASU 2016-09, the total year effective tax rate was 35.6%, down from 37.9% in 2015, reflecting active management of the company’s tax position. Implementation of this new accounting standard will continue to have an impact on the effective tax rate in future periods depending on stock-based compensation grants and their related vesting and exercise timing, as well as stock price.
Capital Ratios Remain at Strong Levels
The common equity tier 1 capital ratio (CET1) was 10.8%, total capital ratio was 13.3% and the tier 1 leverage ratio was 9.2% at December 31, 2016, essentially flat with the prior quarter as strong earnings grew capital in line with balance sheet growth.
Tangible book value per share increased $0.02 to $9.37 while book value per share remained flat at $11.45 compared to the third quarter of 2016. Tangible common equity to assets was 7.7% at December 31, 2016. Tangible book value and tangible common equity ratios were impacted by earnings strength, offset by a decrease in unrealized gains (losses) on AFS securities.
8
About Seacoast Banking Corporation of Florida (NASDAQ: SBCF)
Seacoast Banking Corporation of Florida is one of the largest community banks headquartered in Florida with approximately $4.7 billion in assets and $3.5 billion in deposits as of December 31, 2016. The Company provides integrated financial services including commercial and retail banking, wealth management, and mortgage services to customers through advanced banking solutions, 47 traditional branches of its locally-branded wholly-owned subsidiary bank, Seacoast Bank, and five commercial banking centers. Offices stretch from Ft. Lauderdale, Boca Raton and West Palm Beach north through the Daytona Beach area, into Orlando and Central Florida, and west to Okeechobee and surrounding counties. More information about the Company is available at SeacoastBanking.com.
Important information About the Proposed Merger and Where to Find It
This document does not constitute an offer to sell or the solicitation of an offer to buy any securities, or a solicitation of any vote or approval, nor shall there be any sale of securities in any jurisdiction in which such offer, solicitation or sale would be unlawful prior to registration or qualification under the securities laws of any such jurisdiction. Seacoast has filed a registration statement on Form S-4 with the SEC, which includes a preliminary proxy statement of GulfShore and a preliminary prospectus of Seacoast regarding the proposed merger with GulfShore into Seacoast. After the registration statement is declared effective by the SEC, GulfShore will deliver a definitive proxy statement to its shareholders. INVESTORS AND SECURITY HOLDERS ARE URGED TO READ THE PROXY STATEMENT/PROSPECTUS REGARDING THE PROPOSED MERGER AND OTHER DOCUMENTS FILED BY SEACOAST WITH THE SEC CAREFULLY AND IN THEIR ENTIRETY, AS WELL AS ANY AMENDMENTS OR SUPPLEMENTS TO THOSE DOCUMENTS WHEN THEY BECOME AVAILABLE, BECAUSE THEY DO OR WILL CONTAIN IMPORTANT INFORMATION.
Investors can obtain (when available) a free copy of the proxy statement/prospectus, as well as other filings containing information about Seacoast and GulfShore, at the SEC's website (http://www.sec.gov), with respect to information about Seacoast, and GulfShore’s website (www.gulfshorebank.com), with respect to information about GulfShore. Investors can also obtain these documents, free of charge, at http://www.seacoastbanking.com under the tab "Investor Relations" and then under the tab "Financials/Regulatory Filings." Copies of the proxy statement/prospectus and any other filing by Seacoast with the SEC can also be obtained, free of charge, by directing a request to Investor Relations, 815 Colorado Avenue, P.O. Box 9012, Stuart, FL 34994, (772) 288-6085.
Seacoast, GulfShore, their respective directors and executive officers and other members of management and employees may be considered participants in the solicitation of proxies in connection with the proposed merger. Information about the directors and executive officers of Seacoast is set forth in its proxy statement for its 2016 annual meeting of shareholders, which was filed with the SEC on April 7, 2016, and amendments thereto, and its Current Reports on Form 8-K. Other information regarding the participants in the proxy solicitation and a description of their direct and indirect interests, by security holdings or otherwise, is contained in the Proxy Statement/Prospectus. You may obtain free copies of these documents as described in the preceding paragraph.
9
Cautionary Notice Regarding Forward-Looking Statements
This press release contains "forward-looking statements" within the meaning of Section 27A of the Securities Act of 1933 and Section 21E of the Securities Exchange Act of 1934, including, without limitation, statements about future financial and operating results, cost savings, enhanced revenues, economic and seasonal conditions in our markets, and improvements to reported earnings that may be realized from cost controls and for integration of banks that we have acquired, or expect to acquire, as well as statements with respect to Seacoast's objectives, expectations and intentions and other statements that are not historical facts. Actual results may differ from those set forth in the forward-looking statements.
Forward-looking statements include statements with respect to our beliefs, plans, objectives, goals, expectations, anticipations, estimates and intentions, and involve known and unknown risks, uncertainties and other factors, which may be beyond our control, and which may cause the actual results, performance or achievements of Seacoast to be materially different from future results, performance or achievements expressed or implied by such forward-looking statements. You should not expect us to update any forward-looking statements.
You can identify these forward-looking statements through our use of words such as "may," "will," "anticipate," "assume," "should," "support", "indicate," "would," "believe," "contemplate," "expect," "estimate," "continue," "further", "point to," "project," "could," "intend" or other similar words and expressions of the future. These forward-looking statements may not be realized due to a variety of factors, including, without limitation: the effects of future economic and market conditions, including seasonality; governmental monetary and fiscal policies, as well as legislative, tax and regulatory changes; changes in accounting policies, rules and practices; the risks of changes in interest rates on the level and composition of deposits, loan demand, liquidity and the values of loan collateral, securities, and interest sensitive assets and liabilities; interest rate risks, sensitivities and the shape of the yield curve; the effects of competition from other commercial banks, thrifts, mortgage banking firms, consumer finance companies, credit unions, securities brokerage firms, insurance companies, money market and other mutual funds and other financial institutions operating in our market areas and elsewhere, including institutions operating regionally, nationally and internationally, together with such competitors offering banking products and services by mail, telephone, computer and the Internet; and the failure of assumptions underlying the establishment of reserves for possible loan losses. The risks of mergers and acquisitions, include, without limitation: unexpected transaction costs, including the costs of integrating operations; the risks that the businesses will not be integrated successfully or that such integration may be more difficult, time-consuming or costly than expected; the potential failure to fully or timely realize expected revenues and revenue synergies, including as the result of revenues following the merger being lower than expected; the risk of deposit and customer attrition; any changes in deposit mix; unexpected operating and other costs, which may differ or change from expectations; the risks of customer and employee loss and business disruption, including, without limitation, as the result of difficulties in maintaining relationships with employees; increased competitive pressures and solicitations of customers by competitors; as well as the difficulties and risks inherent with entering new markets.
10
All written or oral forward-looking statements attributable to us are expressly qualified in their entirety by this cautionary notice, including, without limitation, those risks and uncertainties described in our annual report on Form 10-K for the year ended December 31, 2015, under "Special Cautionary Notice Regarding Forward-looking Statements" and "Risk Factors", and otherwise in our SEC reports and filings. Such reports are available upon request from the Company, or from the Securities and Exchange Commission, including through the SEC's Internet website at http://www.sec.gov.
Explanation of Certain Unaudited Non-GAAP Financial Measures
The measures entitled adjusted net income; adjusted diluted earnings per share; return on average tangible common equity; adjusted revenue; adjusted return on assets; adjusted return on average tangible common equity; adjusted efficiency ratio; adjusted pre-tax, pre-provision income; annualized adjusted operating expenses as a percent of average assets; and adjusted noninterest expense are not measures recognized under U.S. generally accepted accounting principles (GAAP) and therefore are considered non-GAAP financial measures. The most comparable GAAP measures are net income, diluted earnings per share, return on average equity, revenues, return on average assets, return on average equity, expenses/revenues, net income, noninterest expense as a percent of average assets, and noninterest expense, respectively.
Management uses the non-GAAP financial measures in its analysis of the Company's performance and believes these presentations provide useful supplemental information, and a clearer understanding of the Company's performance, and if not provided would be requested by the investor community. The Company believes the non-GAAP measures enhance investors' understanding of the Company's business and performance. These measures are also useful in understanding performance trends and in facilitating comparisons with the performance of other financial institutions. The limitations associated with operating measures are the risk that persons might disagree as to the appropriateness of items comprising these measures and that different companies might calculate these measures differently. The company presents non-GAAP measures to remove or adjust for items like transaction related merger and acquisition costs or other costs or revenue items that are not related to the ongoing operations of the company as well as to adjust intangible assets and intangible asset amortization from acquired companies. The Company believes these measures are useful to investors because removing the amount of intangible assets and amortization thereof, and removing costs and revenues not related to ongoing operations of the company (the level of which may vary from company to company and from period to period), allows investors to more easily compare the Company's capital position and financial performance to other companies in the industry that present similar measures. The Company also believes that removing these items provides a more relevant measure of the Company's financial performance from period to period. These measures are utilized by management to assess the capital adequacy and profitability of the Company. These disclosures should not be considered an alternative to GAAP. The computations of adjusted net income; adjusted diluted earnings per share; return on average tangible common equity; adjusted revenue; adjusted return on assets; adjusted return on average tangible common equity; adjusted efficiency ratio; adjusted pre-tax, pre-provision income; annualized adjusted operating expenses as a percent of average assets; and adjusted noninterest expense and the reconciliation of these measures are set forth in the tables below:
11
(Dollars in thousands except per share data) | Fourth Quarter | Third Quarter | Second Quarter | First Quarter | Fourth Quarter | |||||||||||||||
2016 | 2016 | 2016 | 2016 | 2015 | ||||||||||||||||
Net income | $ | 10,771 | $ | 9,133 | $ | 5,332 | $ | 3,966 | $ | 6,036 | ||||||||||
BOLI income (benefits upon a death) | 0 | 0 | 0 | (464 | ) | 0 | ||||||||||||||
Security gains | (7 | ) | (225 | ) | (47 | ) | (89 | ) | (1 | ) | ||||||||||
Bargain purchase gain | 0 | 0 | 0 | 0 | (416 | ) | ||||||||||||||
Total Adjustments to Revenue | (7 | ) | (225 | ) | (47 | ) | (553 | ) | (417 | ) | ||||||||||
Severance | 165 | 287 | 464 | 306 | 187 | |||||||||||||||
Merger related charges | 559 | 1,628 | 2,448 | 4,038 | 1,043 | |||||||||||||||
Branch closure charges and costs related to expense initiative | 0 | 678 | 1,121 | 691 | 0 | |||||||||||||||
Miscellaneous losses | 0 | 0 | 0 | 0 | 48 | |||||||||||||||
Early redemption cost for FHLB advances | 0 | 0 | 1,777 | 0 | 0 | |||||||||||||||
Total Adjustments to Noninterest Expense | 724 | 2,593 | 5,810 | 5,035 | 1,278 | |||||||||||||||
Effective tax rate on adjustments | (152 | ) | (913 | ) | (2,322 | ) | (1,690 | ) | (328 | ) | ||||||||||
Adjusted Net Income | $ | 11,337 | $ | 10,588 | $ | 8,773 | $ | 6,758 | $ | 6,569 | ||||||||||
Earnings per diluted share, as reported | $ | 0.28 | $ | 0.24 | $ | 0.14 | $ | 0.11 | $ | 0.18 | ||||||||||
Adjusted Earnings per Diluted Share | 0.30 | 0.28 | 0.23 | 0.19 | 0.19 | |||||||||||||||
Average shares outstanding (000) | 38,252 | 38,170 | 38,142 | 35,453 | 34,395 | |||||||||||||||
Adjusted net income | $ | 11,337 | $ | 10,588 | $ | 8,773 | $ | 6,758 | $ | 6,569 | ||||||||||
Provision for loan losses | 1,000 | 550 | 662 | 199 | 369 | |||||||||||||||
Income taxes | 5,438 | 5,232 | 5,172 | 4,125 | 4,052 | |||||||||||||||
Adjusted Pretax, Pre-provision Income | $ | 17,775 | $ | 16,370 | $ | 14,607 | $ | 11,082 | $ | 10,990 | ||||||||||
Revenue | $ | 47,354 | $ | 47,437 | $ | 43,651 | $ | 38,941 | $ | 37,299 | ||||||||||
Total adjustments to revenue | (7 | ) | (225 | ) | (47 | ) | (553 | ) | (417 | ) | ||||||||||
Adjusted Revenue | $ | 47,347 | $ | 47,212 | $ | 43,604 | $ | 38,388 | $ | 36,882 | ||||||||||
Noninterest Expense | $ | 30,297 | $ | 33,435 | $ | 34,808 | $ | 32,341 | $ | 27,169 | ||||||||||
Total adjustments to noninterest expense | 724 | 2,593 | 5,810 | 5,035 | 1,278 | |||||||||||||||
Adjusted Noninterest Expense | $ | 29,573 | $ | 30,842 | $ | 28,998 | $ | 27,306 | $ | 25,891 | ||||||||||
Adjusted noninterest expense | $ | 29,573 | $ | 30,842 | $ | 28,998 | $ | 27,306 | $ | 25,891 | ||||||||||
Foreclosed property expense & amortization of intangibles | (641 | ) | (851 | ) | (553 | ) | (484 | ) | (324 | ) | ||||||||||
Net adjusted noninterest expense | $ | 28,932 | $ | 29,990 | $ | 28,445 | $ | 26,822 | $ | 25,567 | ||||||||||
Adjusted revenue | $ | 47,347 | $ | 47,212 | $ | 43,604 | $ | 38,388 | $ | 36,882 | ||||||||||
Impact of FTE adjustment | 204 | 287 | 308 | 127 | 117 | |||||||||||||||
Adjusted revenue on a fully taxable equivalent basis | $ | 47,551 | $ | 47,499 | $ | 43,912 | $ | 38,515 | $ | 36,999 | ||||||||||
Adjusted Efficiency Ratio | 60.84 | % | 63.14 | % | 64.78 | % | 69.64 | % | 69.10 | % | ||||||||||
Return on average assets (ROA) | 0.94 | % | 0.82 | % | 0.51 | % | 0.44 | % | 0.69 | % | ||||||||||
Impact of adjustments for adjusted net income | 0.05 | 0.13 | 0.33 | 0.31 | 0.06 | |||||||||||||||
Adjusted Return on Average Assets (Adjusted ROA) | 0.99 | % | 0.95 | % | 0.84 | % | 0.75 | % | 0.75 | % | ||||||||||
Return on Average Common Equity | 9.8 | % | 8.4 | % | 5.2 | % | 4.3 | % | 6.8 | % | ||||||||||
Impact of removing average intangible assets and related amortization | 2.7 | 2.5 | 1.4 | 0.8 | 1.0 | |||||||||||||||
Return on Average Tangible Common Equity (ROTCE) | 12.5 | 10.9 | 6.6 | 5.1 | 7.8 | |||||||||||||||
Impact of adjustments for adjusted net income | 0.6 | 1.7 | 4.0 | 3.4 | 1.1 | |||||||||||||||
Adjusted Return on Average Tangible Common Equity | 13.1 | % | 12.6 | % | 10.6 | % | 8.5 | % | 8.9 | % |
12
NONINTEREST EXPENSE | ||||||||||||||||||||
Fourth | Third | Second | First | Fourth | ||||||||||||||||
Quarter | Quarter | Quarter | Quarter | Quarter | ||||||||||||||||
(Dollars in thousands) | 2016 | 2016 | 2016 | 2016 | 2015 | |||||||||||||||
Salaries and wages | $ | 12,324 | $ | 13,431 | $ | 12,769 | $ | 12,137 | $ | 10,948 | ||||||||||
Employee benefits | 2,475 | 2,397 | 2,476 | 2,389 | 2,178 | |||||||||||||||
Outsourced data processing costs | 3,030 | 3,223 | 2,698 | 2,488 | 2,457 | |||||||||||||||
Telephone / data lines | 502 | 539 | 539 | 529 | 412 | |||||||||||||||
Occupancy expense | 2,783 | 2,806 | 2,523 | 2,251 | 2,314 | |||||||||||||||
Furniture and equipment expense | 1,177 | 1,073 | 1,122 | 966 | 952 | |||||||||||||||
Marketing expense | 816 | 768 | 836 | 997 | 1,128 | |||||||||||||||
Legal and professional fees | 1,922 | 1,696 | 1,574 | 1,583 | 1,568 | |||||||||||||||
FDIC assessments | 661 | 517 | 643 | 544 | 551 | |||||||||||||||
Asset Management Disposition | 84 | 219 | 160 | 90 | 84 | |||||||||||||||
OREO & REPO Loss/(Gain) | (161 | ) | (96 | ) | (201 | ) | (51 | ) | (157 | ) | ||||||||||
Amortization of intangibles | 719 | 727 | 594 | 446 | 397 | |||||||||||||||
Other | 3,241 | 3,542 | 3,265 | 2,937 | 3,059 | |||||||||||||||
Total Adjusted Noninterest Expense | 29,573 | 30,842 | 28,998 | 27,306 | 25,891 | |||||||||||||||
Severance and organizational changes | 165 | 287 | 464 | 306 | 187 | |||||||||||||||
Legal and professional fees for acquisition and expense initiatives | 559 | 1,628 | 2,448 | 4,038 | 1,043 | |||||||||||||||
Branch closure | 0 | 678 | 1,121 | 691 | 0 | |||||||||||||||
Miscellaneous losses | 0 | 0 | 0 | 0 | 48 | |||||||||||||||
Early redemption cost for FHLB advances | 0 | 0 | 1,777 | 0 | 0 | |||||||||||||||
Total Noninterest Expense | $ | 30,297 | $ | 33,435 | $ | 34,808 | $ | 32,341 | $ | 27,169 |
13
FINANCIAL HIGHLIGHTS | (Unaudited) |
SEACOAST BANKING CORPORATION OF FLORIDA AND SUBSIDIARIES
(Dollars in thousands, except share data) | Three Months Ended | Twelve Months Ended | ||||||||||||||||||
December 31, | September 30, | December 31, | December 31, | December 31, | ||||||||||||||||
2016 | 2016 | 2015 | 2016 | 2015 | ||||||||||||||||
Summary of Earnings | ||||||||||||||||||||
Net income | $ | 10,771 | $ | 9,133 | $ | 6,036 | $ | 29,202 | $ | 22,141 | ||||||||||
Net interest income (1) | 37,628 | 37,735 | 29,216 | 140,514 | 109,968 | |||||||||||||||
Net interest margin (1), (2) | 3.56 | % | 3.69 | 3.67 | 3.63 | 3.64 | ||||||||||||||
. | ||||||||||||||||||||
Performance Ratios | ||||||||||||||||||||
Return on average assets-GAAP basis (2), (3) | 0.94 | % | 0.82 | % | 0.69 | % | 0.69 | % | 0.67 | % | ||||||||||
Return on average shareholders' equity-GAAP basis (2), (3) | 9.80 | 8.44 | 6.78 | 7.06 | 6.56 | |||||||||||||||
Return on average tangible shareholders' equity-GAAP basis (2), (3), (4) | 12.51 | 10.91 | 7.83 | 8.87 | 7.59 | |||||||||||||||
Efficiency ratio (5) | 62.36 | 68.60 | 72.57 | 72.13 | 71.58 | |||||||||||||||
Noninterest income to total revenue | 20.96 | 20.68 | 21.10 | 21.14 | 22.63 | |||||||||||||||
Per Share Data | ||||||||||||||||||||
Net income diluted-GAAP basis | $ | 0.28 | $ | 0.24 | $ | 0.18 | $ | 0.78 | $ | 0.66 | ||||||||||
Net income basic-GAAP basis | 0.29 | 0.24 | 0.18 | 0.79 | 0.66 | |||||||||||||||
Book value per share common | 11.45 | 11.45 | 10.29 | 11.45 | 10.29 | |||||||||||||||
Tangible book value per share | 9.37 | 9.35 | 9.31 | 9.37 | 9.31 | |||||||||||||||
Cash dividends declared | 0.00 | 0.00 | 0.00 | 0.00 | 0.00 |
(1) | Calculated on a fully taxable equivalent basis using amortized cost. |
(2) | These ratios are stated on an annualized basis and are not necessarily indicative of future periods. |
(3) | The calculation of ROA and ROE do not include the mark-to-market unrealized gains (losses) because the unrealized gains (losses) are not included in net income. |
(4) | The Company defines tangible common equity as total shareholder's equity less intangible assets. |
(5) | Defined as (noninterest expense less foreclosed property expense and amortization of intangibles) divided by net operating revenue |
(net interest income on a fully taxable equivalent basis plus noninterest income excluding securities gains and bargain purchase gain, net). |
FINANCIAL HIGHLIGHTS |
SEACOAST BANKING CORPORATION OF FLORIDA AND SUBSIDIARIES
December 31, | September 30, | December 31, | ||||||||||
(Dollars in thousands, except share data) | 2016 | 2016 | 2015 | |||||||||
Selected Financial Data | ||||||||||||
Total assets | $ | 4,680,932 | $ | 4,513,934 | $ | 3,534,780 | ||||||
Securities available for sale (at fair value) | 950,503 | 866,613 | 790,766 | |||||||||
Securities held for investment (at amortized cost) | 372,498 | 392,138 | 203,525 | |||||||||
Net loans | 2,856,136 | 2,746,654 | 2,137,202 | |||||||||
Deposits | 3,523,245 | 3,510,493 | 2,844,387 | |||||||||
Total shareholders' equity | 435,397 | 435,519 | 353,453 | |||||||||
Average Balances (Year-to-Date) | ||||||||||||
Total average assets | $ | 4,201,822 | $ | 4,077,463 | $ | 3,304,397 | ||||||
Less: intangible assets | 66,611 | 62,240 | 33,277 | |||||||||
Total average tangible assets | $ | 4,135,211 | $ | 4,015,223 | $ | 3,271,120 | ||||||
Total average equity | $ | 413,874 | $ | 406,080 | $ | 337,367 | ||||||
Less: intangible assets | 66,611 | 62,240 | 33,277 | |||||||||
Total average tangible equity | $ | 347,264 | $ | 343,840 | $ | 304,090 | ||||||
Credit Analysis | ||||||||||||
Net (recoveries) year-to-date - non-acquired loans | $ | (2,040 | ) | $ | (2,182 | ) | $ | (609 | ) | |||
Net charge-offs year-to-date - acquired loans | 178 | 37 | 1,196 | |||||||||
Total net charge-offs (recoveries) year-to-date | $ | (1,862 | ) | $ | (2,145 | ) | $ | 587 | ||||
Net (recoveries) to average loans (annualized) - non-acquired loans | (0.08 | )% | (0.12 | )% | (0.03 | )% | ||||||
Net charge-offs to average loans (annualized) - acquired loans | 0.01 | 0.01 | 0.06 | |||||||||
Total net charge-offs (recoveries) to average loans (annualized) | (0.07 | ) | (0.11 | ) | 0.03 | |||||||
Loan loss provision (recapture) year-to-date - non-acquired loans | $ | 2,213 | $ | 1,052 | $ | 1,375 | ||||||
Loan loss provision year-to-date - acquired loans | 198 | 359 | 1,269 | |||||||||
Total loan loss provision year-to-date | $ | 2,411 | $ | 1,411 | $ | 2,644 | ||||||
Allowance to loans at end of period - non-acquired loans | 0.96 | % | 1.00 | % | 1.03 | % | ||||||
Discount for credit losses to acquired loans at end of period | 4.18 | 4.24 | 4.24 | |||||||||
Nonperforming loans - non-acquired loans | $ | 11,023 | $ | 10,561 | $ | 12,758 | ||||||
Nonperforming loans - acquired loans | 7,048 | 7,876 | 4,628 | |||||||||
Other real estate owned - non-acquired | 3,041 | 3,681 | 3,699 | |||||||||
Other real estate owned - acquired | 1,203 | 1,468 | 3,340 | |||||||||
Bank branches closed inculded in other real estate owned | 5,705 | 7,585 | 0 | |||||||||
Total nonperforming assets | $ | 28,020 | $ | 31,171 | $ | 24,425 | ||||||
Restructured loans (accruing) | $ | 17,711 | $ | 19,272 | $ | 19,970 | ||||||
Purchased noncredit impaired loans | $ | 440,690 | $ | 484,006 | $ | 308,737 | ||||||
Purchased credit impaired loans | 12,996 | 13,057 | 12,109 | |||||||||
Total acquired loans | $ | 453,686 | $ | 497,063 | $ | 320,846 | ||||||
Nonperforming loans to loans at end of period - non-acquired loans | 0.38 | % | 0.38 | % | 0.59 | % | ||||||
Nonperforming loans to loans at end of period - acquired loans | 0.24 | 0.28 | 0.22 | |||||||||
Total nonperforming loans to loans at end of period | 0.63 | 0.66 | 0.81 | |||||||||
Nonperforming assets to total assets - non-acquired | 0.42 | % | 0.48 | % | 0.47 | % | ||||||
Nonperforming assets to total assets - aquired | 0.18 | 0.21 | 0.22 | |||||||||
Total nonperforming assets to total assets | 0.60 | 0.69 | 0.69 |
14
CONDENSED CONSOLIDATED STATEMENTS OF INCOME | (Unaudited) |
SEACOAST BANKING CORPORATION OF FLORIDA AND SUBSIDIARIES
Three Months Ended | Twelve Months Ended | |||||||||||||||
December 31, | December 31, | |||||||||||||||
(Dollars in thousands, except per share data) | 2016 | 2015 | 2016 | 2015 | ||||||||||||
Interest on securities: | ||||||||||||||||
Taxable | $ | 6,880 | $ | 5,312 | $ | 26,133 | $ | 20,341 | ||||||||
Nontaxable | 287 | 144 | 1,036 | 585 | ||||||||||||
Interest and fees on loans | 32,007 | 25,184 | 119,217 | 94,469 | ||||||||||||
Interest on federal funds sold and other investments | 517 | 275 | 1,669 | 1,022 | ||||||||||||
Total Interest Income | 39,691 | 30,915 | 148,055 | 116,417 | ||||||||||||
Interest on deposits | 622 | 598 | 2,593 | 2,085 | ||||||||||||
Interest on time certificates | 598 | 265 | 2,074 | 1,228 | ||||||||||||
Interest on borrowed money | 1,046 | 952 | 3,800 | 3,617 | ||||||||||||
Total Interest Expense | 2,266 | 1,815 | 8,467 | 6,930 | ||||||||||||
Net Interest Income | 37,425 | 29,100 | 139,588 | 109,487 | ||||||||||||
Provision for loan losses | 1,000 | 369 | 2,411 | 2,644 | ||||||||||||
Net Interest Income After Provision for Loan Losses | 36,425 | 28,731 | 137,177 | 106,843 | ||||||||||||
Noninterest income: | ||||||||||||||||
Service charges on deposit accounts | 2,612 | 2,229 | 9,669 | 8,563 | ||||||||||||
Trust fees | 969 | 791 | 3,433 | 3,132 | ||||||||||||
Mortgage banking fees | 1,616 | 955 | 5,864 | 4,252 | ||||||||||||
Brokerage commissions and fees | 480 | 511 | 2,044 | 2,132 | ||||||||||||
Marine finance fees | 115 | 205 | 673 | 1,152 | ||||||||||||
Interchange income | 2,334 | 1,989 | 9,227 | 7,684 | ||||||||||||
Other deposit based EFT fees | 125 | 99 | 477 | 397 | ||||||||||||
BOLI income | 611 | 396 | 2,213 | 1,426 | ||||||||||||
Gain on participated loan | 0 | 0 | 0 | 725 | ||||||||||||
Other | 1,060 | 607 | 3,827 | 2,555 | ||||||||||||
9,922 | 7,782 | 37,427 | 32,018 | |||||||||||||
Securities gains, net | 7 | 1 | 368 | 161 | ||||||||||||
Bargain purchase gain, net | 0 | 416 | 0 | 416 | ||||||||||||
Total Noninterest Income | 9,929 | 8,199 | 37,795 | 32,595 | ||||||||||||
Noninterest expenses: | ||||||||||||||||
Salaries and wages | 12,476 | 11,135 | 54,096 | 41,075 | ||||||||||||
Employee benefits | 2,475 | 2,178 | 9,903 | 9,564 | ||||||||||||
Outsourced data processing costs | 3,076 | 2,455 | 13,516 | 10,150 | ||||||||||||
Telephone / data lines | 502 | 412 | 2,108 | 1,797 | ||||||||||||
Occupancy | 2,830 | 2,314 | 13,122 | 8,744 | ||||||||||||
Furniture and equipment | 1,211 | 1,000 | 4,720 | 3,434 | ||||||||||||
Marketing | 847 | 1,128 | 3,633 | 4,428 | ||||||||||||
Legal and professional fees | 2,370 | 2,580 | 9,596 | 8,022 | ||||||||||||
FDIC assessments | 661 | 551 | 2,365 | 2,212 | ||||||||||||
Amortization of intangibles | 719 | 397 | 2,486 | 1,424 | ||||||||||||
Asset dispositions expense | 84 | 79 | 553 | 472 | ||||||||||||
Net (gain)/loss on other real estate owned and repossessed assets | (161 | ) | (157 | ) | (509 | ) | 239 | |||||||||
Early redemption cost for Federal Home Loan Bank advances | 0 | 0 | 1,777 | 0 | ||||||||||||
Other | 3,207 | 3,097 | 13,515 | 12,209 | ||||||||||||
Total Noninterest Expenses | 30,297 | 27,169 | 130,881 | 103,770 | ||||||||||||
Income Before Income Taxes | 16,058 | 9,761 | 44,091 | 35,668 | ||||||||||||
Income taxes | 5,286 | 3,725 | 14,889 | 13,527 | ||||||||||||
Net Income | $ | 10,771 | $ | 6,036 | $ | 29,202 | $ | 22,141 | ||||||||
Per share of common stock: | ||||||||||||||||
Net income diluted | $ | 0.28 | $ | 0.18 | $ | 0.78 | $ | 0.66 | ||||||||
Net income basic | 0.29 | 0.18 | 0.79 | 0.66 | ||||||||||||
Cash dividends declared | 0.00 | 0.00 | 0.00 | 0.00 | ||||||||||||
Average diluted shares outstanding | 38,252,351 | 34,395,373 | 37,508,046 | 33,744,171 | ||||||||||||
Average basic shares outstanding | 37,603,789 | 34,115,697 | 36,872,007 | 33,495,827 |
15
CONDENSED CONSOLIDATED STATEMENTS OF INCOME | (Unaudited) |
SEACOAST BANKING CORPORATION OF FLORIDA AND SUBSIDIARIES
QUARTER | ||||||||||||||||||||
2016 | 2015 | |||||||||||||||||||
(Dollars in thousands, except per share data) | Fourth | Third | Second | First | Fourth | |||||||||||||||
Interest on securities: | ||||||||||||||||||||
Taxable | $ | 6,880 | $ | 6,966 | $ | 6,603 | $ | 5,683 | $ | 5,312 | ||||||||||
Nontaxable | 287 | 287 | 299 | 164 | 144 | |||||||||||||||
Interest and fees on loans | 32,007 | 31,932 | 29,244 | 26,034 | 25,184 | |||||||||||||||
Interest on federal funds sold and other investments | 517 | 429 | 433 | 290 | 275 | |||||||||||||||
Total Interest Income | 39,691 | 39,614 | 36,579 | 32,171 | 30,915 | |||||||||||||||
Interest on deposits | 622 | 679 | 688 | 604 | 598 | |||||||||||||||
Interest on time certificates | 598 | 613 | 550 | 313 | 265 | |||||||||||||||
Interest on borrowed money | 1,046 | 874 | 848 | 1,032 | 952 | |||||||||||||||
Total Interest Expense | 2,266 | 2,166 | 2,086 | 1,949 | 1,815 | |||||||||||||||
Net Interest Income | 37,425 | 37,448 | 34,493 | 30,222 | 29,100 | |||||||||||||||
Provision for loan losses | 1,000 | 550 | 662 | 199 | 369 | |||||||||||||||
Net Interest Income After Provision for Loan Losses | 36,425 | 36,898 | 33,831 | 30,023 | 28,731 | |||||||||||||||
Noninterest income: | ||||||||||||||||||||
Service charges on deposit accounts | 2,612 | 2,698 | 2,230 | 2,129 | 2,229 | |||||||||||||||
Trust fees | 969 | 820 | 838 | 806 | 791 | |||||||||||||||
Mortgage banking fees | 1,616 | 1,885 | 1,364 | 999 | 955 | |||||||||||||||
Brokerage commissions and fees | 480 | 463 | 470 | 631 | 511 | |||||||||||||||
Marine finance fees | 115 | 138 | 279 | 141 | 205 | |||||||||||||||
Interchange income | 2,334 | 2,306 | 2,370 | 2,217 | 1,989 | |||||||||||||||
Other deposit based EFT fees | 125 | 109 | 116 | 127 | 99 | |||||||||||||||
BOLI income | 611 | 382 | 379 | 841 | 396 | |||||||||||||||
Other | 1,060 | 963 | 1,065 | 739 | 607 | |||||||||||||||
9,922 | 9,764 | 9,111 | 8,630 | 7,782 | ||||||||||||||||
Securities gains, net | 7 | 225 | 47 | 89 | 1 | |||||||||||||||
Bargain purchase gain, net | 0 | 0 | 0 | 0 | 416 | |||||||||||||||
Total Noninterest Income | 9,929 | 9,989 | 9,158 | 8,719 | 8,199 | |||||||||||||||
Noninterest expenses: | ||||||||||||||||||||
Salaries and wages | 12,476 | 14,337 | 13,884 | 13,399 | 11,135 | |||||||||||||||
Employee benefits | 2,475 | 2,425 | 2,521 | 2,482 | 2,178 | |||||||||||||||
Outsourced data processing costs | 3,076 | 3,198 | 2,803 | 4,439 | 2,455 | |||||||||||||||
Telephone / data lines | 502 | 539 | 539 | 528 | 412 | |||||||||||||||
Occupancy | 2,830 | 3,675 | 3,645 | 2,972 | 2,314 | |||||||||||||||
Furniture and equipment | 1,211 | 1,228 | 1,283 | 998 | 1,000 | |||||||||||||||
Marketing | 847 | 780 | 957 | 1,049 | 1,128 | |||||||||||||||
Legal and professional fees | 2,370 | 2,213 | 2,656 | 2,357 | 2,580 | |||||||||||||||
FDIC assessments | 661 | 517 | 643 | 544 | 551 | |||||||||||||||
Amortization of intangibles | 719 | 728 | 593 | 446 | 397 | |||||||||||||||
Asset dispositions expense | 84 | 219 | 160 | 90 | 79 | |||||||||||||||
Net gain on other real estate owned and repossessed assets | (161 | ) | (96 | ) | (201 | ) | (51 | ) | (157 | ) | ||||||||||
Early redemption cost for Federal Home Loan Bank advances | 0 | 0 | 1,777 | 0 | 0 | |||||||||||||||
Other | 3,207 | 3,672 | 3,548 | 3,088 | 3,097 | |||||||||||||||
Total Noninterest Expenses | 30,297 | 33,435 | 34,808 | 32,341 | 27,169 | |||||||||||||||
Income Before Income Taxes | 16,057 | 13,452 | 8,181 | 6,401 | 9,761 | |||||||||||||||
Income taxes | 5,286 | 4,319 | 2,849 | 2,435 | 3,725 | |||||||||||||||
Net Income | $ | 10,771 | $ | 9,133 | $ | 5,332 | $ | 3,966 | $ | 6,036 | ||||||||||
Per share of common stock: | ||||||||||||||||||||
Net income diluted | $ | 0.28 | $ | 0.24 | $ | 0.14 | $ | 0.11 | $ | 0.18 | ||||||||||
Net income basic | 0.29 | 0.24 | 0.14 | 0.11 | 0.18 | |||||||||||||||
Cash dividends declared | 0.00 | 0.00 | 0.00 | 0.00 | 0.00 | |||||||||||||||
Average diluted shares outstanding | 38,252,351 | 38,169,863 | 38,141,550 | 35,452,968 | 34,395,373 | |||||||||||||||
Average basic shares outstanding | 37,603,789 | 37,549,804 | 37,470,071 | 34,848,875 | 34,115,697 |
16
CONDENSED CONSOLIDATED BALANCE SHEETS | (Unaudited) |
SEACOAST BANKING CORPORATION OF FLORIDA AND SUBSIDIARIES
December 31, | December 31, | |||||||
(Dollars in thousands, except share data) | 2016 | 2015 | ||||||
Assets | ||||||||
Cash and due from banks | $ | 82,520 | $ | 81,216 | ||||
Interest bearing deposits with other banks | 27,124 | 54,851 | ||||||
Total Cash and Cash Equivalents | 109,644 | 136,067 | ||||||
Securities: | ||||||||
Available for sale (at fair value) | 950,503 | 790,766 | ||||||
Held for investment (at amortized cost) | 372,498 | 203,525 | ||||||
Total Securities | 1,323,001 | 994,291 | ||||||
Loans held for sale | 15,332 | 23,998 | ||||||
Loans | 2,879,536 | 2,156,330 | ||||||
Less: Allowance for loan losses | (23,400 | ) | (19,128 | ) | ||||
Net Loans | 2,856,136 | 2,137,202 | ||||||
Bank premises and equipment, net | 58,684 | 54,579 | ||||||
Other real estate owned | 9,949 | 7,039 | ||||||
Goodwill | 64,649 | 25,211 | ||||||
Other intangible assets | 14,572 | 8,594 | ||||||
Bank owned life insurance | 84,580 | 43,579 | ||||||
Net deferred tax assets | 60,818 | 60,274 | ||||||
Other assets | 83,567 | 43,946 | ||||||
$ | 4,680,932 | $ | 3,534,780 | |||||
Liabilities and Shareholders' Equity | ||||||||
Liabilities | ||||||||
Deposits | ||||||||
Noninterest demand | $ | 1,148,309 | $ | 854,447 | ||||
Interest-bearing demand | 873,727 | 734,749 | ||||||
Savings | 346,662 | 295,851 | ||||||
Money market | 802,697 | 665,353 | ||||||
Other time certificates | 159,887 | 153,318 | ||||||
Brokered time certificates | 7,342 | 9,403 | ||||||
Time certificates of $100,000 or more | 184,621 | 131,266 | ||||||
Total Deposits | 3,523,245 | 2,844,387 | ||||||
Securities sold under agreements to repurchase | 204,202 | 172,005 | ||||||
Federal Home Loan Bank borrowings | 415,000 | 50,000 | ||||||
Subordinated debt | 70,241 | 69,961 | ||||||
Other liabilities | 32,847 | 44,974 | ||||||
4,245,535 | 3,181,327 | |||||||
Shareholders' Equity | ||||||||
Common stock | 3,802 | 3,435 | ||||||
Additional paid in capital | 454,001 | 399,162 | ||||||
Accumulated deficit | (13,657 | ) | (42,858 | ) | ||||
Treasury stock | (1,236 | ) | (73 | ) | ||||
442,910 | 359,666 | |||||||
Accumulated other comprehensive (loss), net | (7,513 | ) | (6,213 | ) | ||||
Total Shareholders' Equity | 435,397 | 353,453 | ||||||
$ | 4,680,932 | $ | 3,534,780 | |||||
Common Shares Outstanding | 38,021,835 | 34,351,409 |
Note: The balance sheet at December 31, 2015 has been derived from the audited financial statements at that date.
17
CONSOLIDATED QUARTERLY FINANCIAL DATA | (Unaudited) |
SEACOAST BANKING CORPORATION OF FLORIDA AND SUBSIDIARIES
QUARTERS | ||||||||||||||||||||
2016 | 2015 | |||||||||||||||||||
(Dollars in thousands, except per share data) | Fourth | Third | Second | First | Fourth | |||||||||||||||
Net income | $ | 10,771 | $ | 9,133 | $ | 5,332 | $ | 3,966 | $ | 6,036 | ||||||||||
Operating Ratios | ||||||||||||||||||||
Return on average assets-GAAP basis (2),(3) | 0.94 | % | 0.82 | % | 0.51 | % | 0.44 | % | 0.69 | % | ||||||||||
Return on average tangible assets (2),(3),(4) | 1.00 | 0.88 | 0.56 | 0.48 | 0.73 | |||||||||||||||
Return on average shareholders' equity-GAAP basis (2),(3) | 9.80 | 8.44 | 5.15 | 4.30 | 6.78 | |||||||||||||||
Efficiency ratio (5) | 62.36 | 68.60 | 78.01 | 81.73 | 72.57 | |||||||||||||||
Noninterest income to total revenue | 20.96 | 20.68 | 20.89 | 22.21 | 21.10 | |||||||||||||||
Net interest margin (1),(2) | 3.56 | % | 3.69 | 3.63 | 3.68 | 3.67 | ||||||||||||||
Average equity to average assets | 9.56 | 9.74 | 9.91 | 10.30 | 10.20 | |||||||||||||||
Credit Analysis Excluding Acquired Loans | ||||||||||||||||||||
Net charge-offs (recoveries) - non-acquired loans | $ | 142 | $ | (1,328 | ) | $ | (315 | ) | $ | (539 | ) | $ | 245 | |||||||
Net charge-offs - acquired loans | 141 | (81 | ) | (24 | ) | 142 | 324 | |||||||||||||
Total net charge-offs (recoveries) | $ | 283 | $ | (1,409 | ) | $ | (339 | ) | $ | (397 | ) | $ | 569 | |||||||
Net charge-offs (recoveries) to average loans - non-acquired loans | 0.02 | % | (0.20 | )% | (0.05 | )% | (0.10 | )% | 0.05 | % | ||||||||||
Net charge-offs to average loans - acquired loans | 0.02 | (0.01 | ) | 0.00 | 0.03 | 0.06 | ||||||||||||||
Toral net charge-offs (recoveries) to average loans | 0.04 | (0.21 | ) | (0.05 | ) | (0.07 | ) | 0.11 | ||||||||||||
Loan loss provision (recapture) - non-acquired loans | $ | 1,161 | $ | 649 | $ | 423 | $ | (20 | ) | $ | (40 | ) | ||||||||
Loan loss provision - acquired loans | (161 | ) | (99 | ) | 239 | 219 | 409 | |||||||||||||
Total loan loss provision | $ | 1,000 | $ | 550 | $ | 662 | $ | 199 | $ | 369 | ||||||||||
Allowance to loans at end of period - non-acquired loans | 0.96 | % | 1.00 | % | 1.01 | % | 1.04 | % | 1.03 | % | ||||||||||
Discount for credit losses to acquired loans at end of period | 4.18 | 4.24 | 3.96 | 3.79 | 4.24 | |||||||||||||||
Nonperforming loans - non-acquired loans | $ | 11,023 | $ | 10,561 | $ | 10,919 | $ | 11,881 | $ | 12,758 | ||||||||||
Nonperforming loans - acquired loans | 7,048 | 7,876 | 4,360 | 3,707 | 4,628 | |||||||||||||||
Other real estate owned - non-acquired | 3,041 | 3,681 | 3,791 | 5,042 | 3,699 | |||||||||||||||
Other real estate owned - acquired | 1,203 | 1,468 | 1,644 | 2,415 | 3,340 | |||||||||||||||
Bank branches closed inculded in other real estate owned | 5,705 | 7,585 | 3,259 | 634 | 0 | |||||||||||||||
Total nonperforming assets | $ | 28,020 | $ | 31,171 | $ | 23,973 | $ | 23,679 | $ | 24,425 | ||||||||||
Restructured loans (accruing) | $ | 17,711 | $ | 19,272 | $ | 20,337 | $ | 19,956 | $ | 19,970 | ||||||||||
Purchased noncredit impaired loans | $ | 440,690 | $ | 484,006 | $ | 554,519 | $ | 558,262 | $ | 320,349 | ||||||||||
Purchased credit impaired loans | 12,996 | 13,057 | 13,652 | 16,531 | 12,109 | |||||||||||||||
Total acquired loans | $ | 453,686 | $ | 497,063 | $ | 568,171 | $ | 574,793 | $ | 332,458 | ||||||||||
Nonperforming loans to loans at end of period - non-acquired loans | 0.38 | % | 0.38 | % | 0.42 | % | 0.48 | % | 0.59 | % | ||||||||||
Nonperforming loans to loans at end of period - acquired loans | 0.24 | 0.28 | 0.16 | 0.15 | 0.22 | |||||||||||||||
Total nonperforming loans to loans at end of period | 0.63 | 0.66 | 0.58 | 0.63 | 0.81 | |||||||||||||||
Nonperforming assets to total assets - non-acquired | 0.42 | % | 0.48 | % | 0.41 | % | 0.44 | % | 0.47 | % | ||||||||||
Nonperforming assets to total assets - acquired | 0.18 | 0.21 | 0.14 | 0.15 | 0.22 | |||||||||||||||
Total nonperforming assets to total assets | 0.60 | 0.69 | 0.55 | 0.59 | 0.69 | |||||||||||||||
Per Share Common Stock | ||||||||||||||||||||
Net income diluted-GAAP basis | $ | 0.28 | $ | 0.24 | $ | 0.14 | $ | 0.11 | $ | 0.18 | ||||||||||
Net income basic-GAAP basis | 0.29 | 0.24 | 0.14 | 0.11 | 0.18 | |||||||||||||||
Cash dividends declared | 0.00 | 0.00 | 0.00 | 0.00 | 0.00 | |||||||||||||||
Book value per share common | 11.45 | 11.45 | 11.20 | 10.91 | 10.29 | |||||||||||||||
Average Balances | ||||||||||||||||||||
Total average assets | $ | 4,572,188 | $ | 4,420,438 | $ | 4,206,800 | $ | 3,601,381 | $ | 3,463,277 | ||||||||||
Less: Intangible assets | 79,677 | 80,068 | 69,449 | 37,006 | 34,457 | |||||||||||||||
Total average tangible assets | $ | 4,492,512 | $ | 4,340,370 | $ | 4,137,351 | $ | 3,564,375 | $ | 3,428,820 | ||||||||||
Total average equity | $ | 437,077 | $ | 430,410 | $ | 416,748 | $ | 370,816 | $ | 353,392 | ||||||||||
Less: Intangible assets | 79,677 | 80,068 | 69,449 | 37,006 | 34,457 | |||||||||||||||
Total average tangible equity | $ | 357,400 | $ | 350,342 | $ | 347,299 | $ | 333,810 | $ | 318,935 |
(1) | Calculated on a fully taxable equivalent basis using amortized cost. |
(2) | These ratios are stated on an annualized basis and are not necessarily indicative of future periods. |
(3) | The calculation of ROA and ROE do not include the mark-to-market unrealized gains (losses), because the unrealized gains (losses) are not included in net income (loss). |
(4) | The Company believes that return on average assets and equity excluding the impacts of noncash amortization expense on intangible assets is a better measurement of the Company's trend in earnings growth. |
(5) | Defined as (noninterest expense less foreclosed property expense and amortization of intangibles) divided by net operating revenue |
(net interest income on a fully taxable equivalent basis plus noninterest income excluding securities gains and bargain purchase gain, net). |
December 31, | December 31, | |||||||
SECURITIES | 2016 | 2015 | ||||||
Mortgage-backed | ||||||||
U.S. Treasury and U.S. Government Agencies | $ | 12,328 | $ | 3,911 | ||||
Mortgage-backed | 616,820 | 539,688 | ||||||
Collateralized loan obligations | 124,889 | 122,583 | ||||||
Obligations of states and political subdivisions | 62,888 | 39,891 | ||||||
Corporate and other debt securities | 73,861 | 44,273 | ||||||
Private commercial mortgage backed securities | 59,717 | 40,420 | ||||||
Securities Available for Sale | 950,503 | 790,766 | ||||||
Mortgage-backed | 313,576 | 162,225 | ||||||
Collateralized loan obligations | 41,547 | 41,300 | ||||||
Securities Held for Investment | 355,123 | 203,525 | ||||||
Total Securities | $ | 1,305,626 | $ | 994,291 |
December 31, | December 31, | |||||||
LOANS | 2016 | 2015 | ||||||
Construction and land development | $ | 160,116 | $ | 108,787 | ||||
Real estate mortgage | 2,194,379 | 1,733,163 | ||||||
Installment loans to individuals | 153,945 | 85,356 | ||||||
Commercial and financial | 370,589 | 228,517 | ||||||
Other loans | 507 | 507 | ||||||
Total Loans | $ | 2,879,536 | $ | 2,156,330 |
18
AVERAGE BALANCES, INTEREST INCOME AND EXPENSES, YIELDS AND RATES (1) | (Unaudited) |
SEACOAST BANKING CORPORATION OF FLORIDA AND SUBSIDIARIES
2016 | 2015 | |||||||||||||||||||||||||||||||||||
Fourth Quarter | Third Quarter | Fourth Quarter | ||||||||||||||||||||||||||||||||||
Average | Yield/ | Average | Yield/ | Average | Yield/ | |||||||||||||||||||||||||||||||
(Dollars in thousands) | Balance | Interest | Rate | Balance | Interest | Rate | Balance | Interest | Rate | |||||||||||||||||||||||||||
Assets | ||||||||||||||||||||||||||||||||||||
Earning assets: | ||||||||||||||||||||||||||||||||||||
Securities: | ||||||||||||||||||||||||||||||||||||
Taxable | $ | 1,251,015 | $ | 6,880 | 2.20 | % | $ | 1,264,345 | $ | 6,966 | 2.20 | % | $ | 924,730 | $ | 5,312 | 2.30 | % | ||||||||||||||||||
Nontaxable | 28,589 | 441 | 6.17 | 28,344 | 441 | 6.22 | 14,932 | 220 | 5.89 | |||||||||||||||||||||||||||
Total Securities | 1,279,604 | 7,321 | 2.29 | 1,292,689 | 7,407 | 2.29 | 939,662 | 5,532 | 2.35 | |||||||||||||||||||||||||||
Federal funds sold and other investments | 90,437 | 517 | 2.28 | 55,465 | 429 | 3.08 | 93,728 | 275 | 1.16 | |||||||||||||||||||||||||||
Loans, net | 2,833,895 | 32,056 | 4.50 | 2,720,121 | 32,065 | 4.69 | 2,121,053 | 25,224 | 4.72 | |||||||||||||||||||||||||||
Total Earning Assets | 4,203,936 | 39,894 | 3.78 | 4,068,275 | 39,901 | 3.90 | 3,154,442 | 31,031 | 3.90 | |||||||||||||||||||||||||||
Allowance for loan losses | (22,819 | ) | (21,934 | ) | (19,940 | ) | ||||||||||||||||||||||||||||||
Cash and due from banks | 90,082 | 84,592 | 85,951 | |||||||||||||||||||||||||||||||||
Premises and equipment | 59,108 | 62,552 | 55,139 | |||||||||||||||||||||||||||||||||
Intangible assets | 79,620 | 80,068 | 34,457 | |||||||||||||||||||||||||||||||||
Bank owned life insurance | 48,954 | 43,860 | 43,419 | |||||||||||||||||||||||||||||||||
Other assets | 113,307 | 103,025 | 109,809 | |||||||||||||||||||||||||||||||||
$ | 4,572,188 | $ | 4,420,438 | $ | 3,463,277 | |||||||||||||||||||||||||||||||
Liabilities and Shareholders' Equity | ||||||||||||||||||||||||||||||||||||
Interest-bearing liabilities: | ||||||||||||||||||||||||||||||||||||
Interest-bearing demand | $ | 812,056 | $ | 149 | 0.07 | % | $ | 781,620 | $ | 151 | 0.08 | % | $ | 666,640 | $ | 129 | 0.08 | % | ||||||||||||||||||
Savings | 343,753 | 44 | 0.05 | 331,685 | 41 | 0.05 | 292,761 | 39 | 0.05 | |||||||||||||||||||||||||||
Money market | 824,440 | 429 | 0.21 | 864,228 | 487 | 0.22 | 664,512 | 430 | 0.26 | |||||||||||||||||||||||||||
Time deposits | 360,712 | 598 | 0.66 | 374,852 | 613 | 0.65 | 299,189 | 265 | 0.35 | |||||||||||||||||||||||||||
Federal funds purchased and securities sold under agreements to repurchase | 184,612 | 110 | 0.24 | 184,170 | 118 | 0.25 | 168,444 | 89 | 0.21 | |||||||||||||||||||||||||||
Federal Home Loan Bank borrowings | 339,457 | 392 | 0.46 | 223,467 | 240 | 0.43 | 50,000 | 405 | 3.21 | |||||||||||||||||||||||||||
Other borrowings | 70,197 | 544 | 3.08 | 70,137 | 516 | 2.93 | 69,927 | 458 | 2.60 | |||||||||||||||||||||||||||
Total Interest-Bearing Liabilities | 2,935,227 | 2,266 | 0.31 | 2,830,159 | 2,166 | 0.30 | 2,211,473 | 1,815 | 0.33 | |||||||||||||||||||||||||||
Noninterest demand | 1,167,687 | 1,131,073 | 878,709 | |||||||||||||||||||||||||||||||||
Other liabilities | 32,197 | 28,796 | 19,703 | |||||||||||||||||||||||||||||||||
Total Liabilities | 4,135,111 | 3,990,028 | 3,109,885 | |||||||||||||||||||||||||||||||||
Shareholders' equity | 437,077 | 430,410 | 353,392 | |||||||||||||||||||||||||||||||||
$ | 4,572,188 | $ | 4,420,438 | $ | 3,463,277 | |||||||||||||||||||||||||||||||
Interest expense as a % of earning assets | 0.21 | % | 0.21 | % | 0.23 | % | ||||||||||||||||||||||||||||||
Net interest income as a % of earning assets | $ | 37,628 | 3.56 | % | $ | 37,735 | 3.69 | % | $ | 29,216 | 3.67 | % |
(1) | On a fully taxable equivalent basis. All yields and rates have been computed on an annualized basis using amortized cost. |
Fees on loans have been included in interest on loans. Nonaccrual loans are included in loan balances. |
19
CONSOLIDATED QUARTERLY FINANCIAL DATA | (Unaudited) |
SEACOAST BANKING CORPORATION OF FLORIDA AND SUBSIDIARIES
2016 | 2015 | |||||||||||||||||||
(Dollars in thousands) | Fourth Quarter | Third Quarter | Second Quarter | First Quarter | Fourth Quarter | |||||||||||||||
Customer Relationship Funding (Period End) | ||||||||||||||||||||
Noninterest demand | ||||||||||||||||||||
Commercial | $ | 860,449 | $ | 892,876 | $ | 860,953 | $ | 768,890 | $ | 592,621 | ||||||||||
Retail | 220,134 | 209,351 | 211,722 | 212,367 | 198,077 | |||||||||||||||
Public funds | 48,690 | 42,147 | 44,275 | 52,244 | 46,300 | |||||||||||||||
Other | 19,036 | 24,168 | 29,842 | 20,568 | 17,449 | |||||||||||||||
1,148,309 | 1,168,542 | 1,146,792 | 1,054,069 | 854,447 | ||||||||||||||||
Commercial | 102,320 | 100,824 | 102,105 | 101,767 | 77,500 | |||||||||||||||
Retail | 591,808 | 567,286 | 549,301 | 496,846 | 479,056 | |||||||||||||||
Public funds | 179,599 | 108,370 | 124,982 | 152,291 | 178,193 | |||||||||||||||
873,727 | 776,480 | 776,388 | 750,904 | 734,749 | ||||||||||||||||
Total transaction accounts | ||||||||||||||||||||
Commercial | 962,769 | 993,700 | 963,058 | 870,657 | 670,121 | |||||||||||||||
Retail | 811,942 | 776,637 | 761,023 | 709,213 | 677,133 | |||||||||||||||
Public funds | 228,289 | 150,517 | 169,257 | 204,535 | 224,493 | |||||||||||||||
Other | 19,036 | 24,168 | 29,842 | 20,568 | 17,449 | |||||||||||||||
2,022,036 | 1,945,022 | 1,923,180 | 1,804,973 | 1,589,196 | ||||||||||||||||
Savings | 346,662 | 340,899 | 330,928 | 313,179 | 295,851 | |||||||||||||||
Money market | ||||||||||||||||||||
Commercial | 286,879 | 313,200 | 293,724 | 271,567 | 208,520 | |||||||||||||||
Retail | 411,696 | 411,550 | 419,821 | 380,233 | 312,756 | |||||||||||||||
Public funds | 104,122 | 134,181 | 147,385 | 89,857 | 144,077 | |||||||||||||||
802,697 | 858,931 | 860,930 | 741,657 | 665,353 | ||||||||||||||||
Time certificates of deposit | 351,850 | 365,641 | 386,278 | 362,638 | 293,987 | |||||||||||||||
Total Deposits | $ | 3,523,245 | $ | 3,510,493 | $ | 3,501,316 | $ | 3,222,447 | $ | 2,844,387 | ||||||||||
Customer sweep accounts | $ | 204,202 | $ | 167,693 | $ | 183,387 | $ | 198,330 | $ | 172,005 | ||||||||||
Total core customer funding (1) | $ | 3,375,597 | $ | 3,312,545 | $ | 3,298,425 | $ | 3,058,139 | $ | 2,722,405 |
(1) Total deposits and customer sweep accounts, excluding certificates of deposits.
20
EXHIBIT 99.2
To Form 8-K dated February 2, 2017
Transcript
Seacoast Banking Corporation of Florida Fourth Quarter Earnings Conference Call February 2, 2017 10:00 AM Eastern Time
|
SPEAKERS
Dennis Hudson - Chairman & CEO
Chuck Shaffer - Executive Vice President
Steve Fowle - Executive Vice President & CFO
Chuck Cross - Executive Vice President Commercial Banking
Julie Kleffel - Executive Vice President Community Banking
ANALYSTS
Michael Young - SunTrust Robinson Humphrey
Bob Ramsey - FBR
Stephen Scouten - Sandler O’Neill
David Feaster - Raymond James
PRESENTATION
Operator: Welcome to the Seacoast Fourth Quarter Earnings Conference Call. My name is Richard and I will be your operator for today’s call. At this time, all participants are in a listen-only mode. Later, we will conduct a question and answer session. Please note that this conference is being recorded.
I will now turn the call over to Mr. Dennis Hudson. You may begin.
Dennis Hudson: Thank you very much and thank you all for joining us today for our Fourth Quarter 2016 Earnings Conference Call. Our press release issued yesterday after the market closed and then updated investor presentation with supplementary information are posted on the Investor portion of our website at SeacoastBanking.com. You can find that information under Presentations.
Seacoast Banking Corporation of Florida
Exhibit 99.2
to Form 8-K Dated February 2, 2017
Page 2
Before we begin, as always, I’ll direct your attention to the statement contained at the end of our press release regarding forward-looking statements that we will be making during the call. We’ll be discussing issues that constitute forward-looking statements within the meaning of the Securities and Exchange Act and our comments today are intended to be covered within the meaning of that section of the Act.
With me today is Chuck Shaffer, who will discuss our financial and operating results. Also joining us in the room is Steve Fowle, our Chief Financial Officer; Chuck Cross, our Commercial Banking Executive; David Houdeshell, our Chief Credit Officer; and Jeff Lee, our Chief Marketing and Analytics Officer.
Last week, we issued a press release describing a management transition that will drive our growth into 2017 and beyond. Effective on March 15th, Chuck Shaffer will assume the newly created position of CFO and Head of Strategy, a role for which he has the experience, the skill, and vision for our business to lead our financial and strategic objectives. Julie Kleffel, who’s also on the call today, a home-grown Floridian who has headed our small business banking unit for the past two years, will succeed Chuck as head of our community banking division, which includes small business banking. In addition, we announced last December, the appointment of Jeff Bray as an Executive Vice President for Service and Operations. These appointments position us well for continued success as the community banking industry continues to undergo its rapid evolution.
Steve Fowle, our current CFO will continue in that role until mid-March to ensure a smooth transition. I just want to say Steve has played an invaluable part in our transformation and fulfilled his mission to help put the bank on a more robust growth trajectory. And we wish him well in his success as he moves on to his next endeavor.
Chuck has the ideal expertise and experience to build on Steve’s work and to take Seacoast to the next level of performance.
Seacoast Banking Corporation of Florida
Exhibit 99.2
to Form 8-K Dated February 2, 2017
Page 3
Looking at our financial and operating 
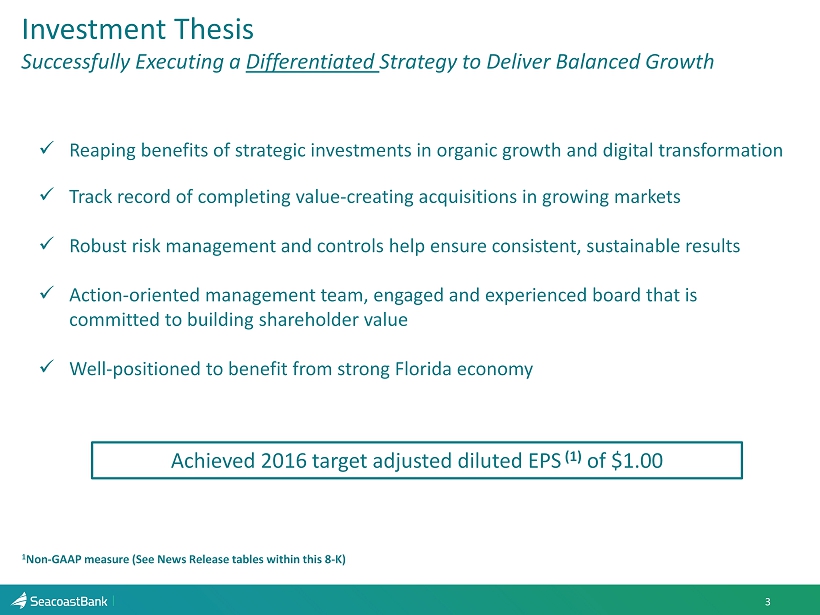
results, it’s clear that 2016 was a breakout year for Seacoast. Our balanced growth strategy, combining investments in organic growth with well-conceived acquisitions, continued to deliver results for shareholders. At the beginning of 2016, we set an aggressive adjusted earnings target of $1 per share. We achieved that target and we achieved it despite interest rate environment related changes that we encountered along the way. We responded to those changes by growing organically, executing smart M&A and exhibiting strong expense management.
Our focus on executing our model, even 
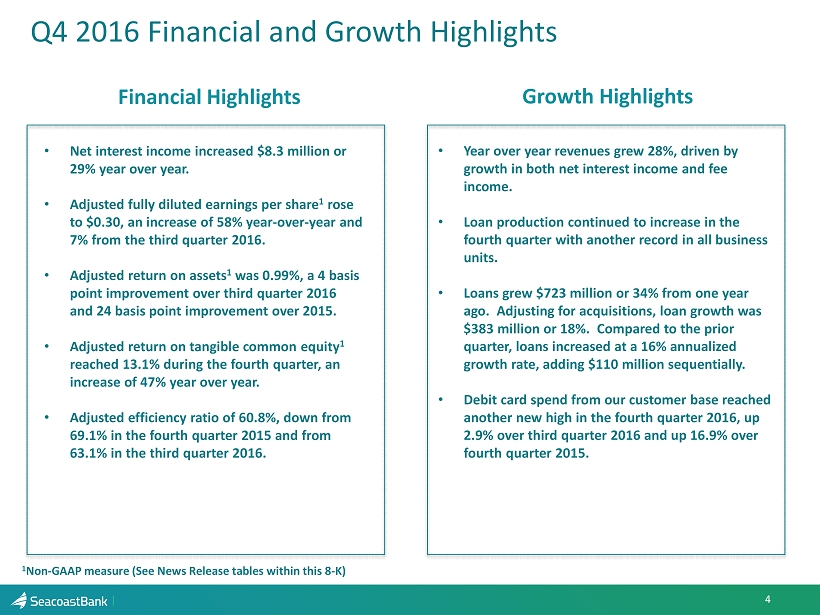
during changing times like today, led to strong results. For perspective, I’d like to share what we achieved in 2016 for our shareholders. During the year, we increased our adjusted earnings per share 56% year-on-year. We achieved an 880 basis point 
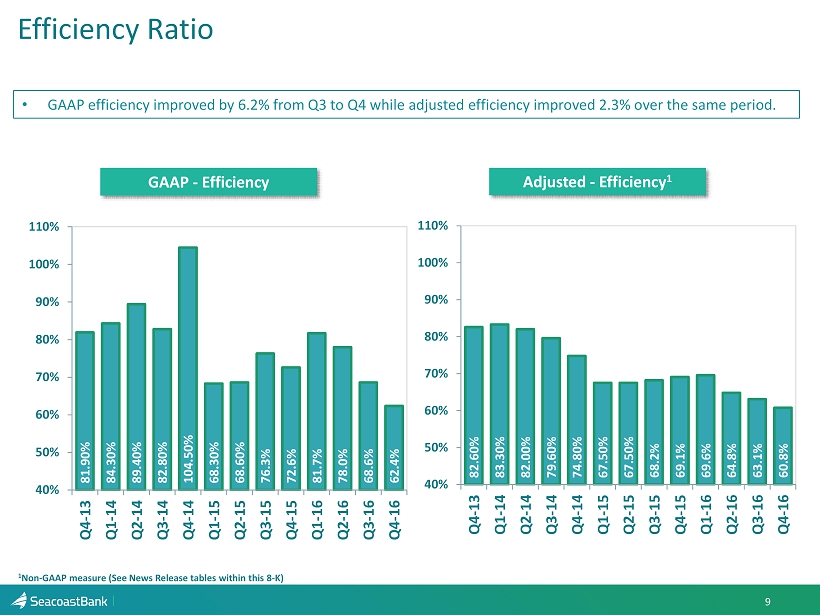
improvement in our adjusted efficiency ratio which moved from 69.6% in our first quarter to 60.8% by year end. We increased our adjusted return on average assets up to 0.99% almost a 1% return, up from 0.75% in the first quarter. And we increased our adjusted return on tangible common equity, 460 basis points, to 13.1% in the quarter, the last quarter of this year, compared to 8.5% in the first quarter.
These results evidence a remarkable turnaround for Seacoast over the past three years. While these and other key metrics are clearly at more respectable levels than they were a few years ago, we believe our model still has plenty of room to run. Before I go on, I’d like to just thank all of our associates for the role they played in getting us to this point. Their focus every day on serving our customers and helping them achieve their financial goals is what makes the difference.
Building on a strong third quarter, we continued our momentum, producing strong organic growth last quarter. Loan production continued at a record pace across all of our business lines, growing 16% annualized during the fourth quarter. In particular, commercial loan originations hit $145 million during the fourth quarter up more than 81% over the year-ago number. Our investment four years ago in our innovative commercial banking delivery model - our Accelerate platform - has certainly paid off, and it has grown to become a significant part of our business.
Seacoast Banking Corporation of Florida
Exhibit 99.2
to Form 8-K Dated February 2, 2017
Page 4
Our business units’ results continue to meet or exceed our expectation. In the fourth quarter, consumer and small business originations totaled $83 million, up 38% year-over-year. Mortgage loan originations exceeded $119 million, up 98% year-over-year. The transformation of our retail network continued during the quarter, highlighted by our momentum in moving routine transactions out of the branch and into our digital channels. The pace of customers choosing these convenient lower cost channels continues to accelerate. One proof point: In the fourth quarter, nearly 37% of all paper checks were deposited remotely, compared to the just 22% in the fourth quarter of 2015.
Mobile adoption continues to rise, now up to 30% of eligible customers compared with 26% in last year’s fourth quarter. Moreover because we’re able to serve customers more efficiently through non-branched channels we were able to continue to rationalize our physical footprint as shown by the deposits per branch, which now exceeds $78 million at yearend. These metrics compare very favorably to top money center banks and are far ahead of most community banks. In fact that increase was very substantial; I think in the beginning of the year that average number was down in the 50s.
I would add that we have achieved this performance while competing very differently than many of Florida banking peers. We continue to maintain a very granular loan portfolio with very modest levels of CRE exposure.
Our M&A work during 2016 performed well, as we expected, and our playbook that we use is now proven and effective. We completed two transactions in Orlando in 2016, the Floridian and BMO Harris branch acquisition that built on top of our 2014 foothold which was completed with the acquisition of BankFIRST. Combined, all of these acquisitions made us a top ten bank in Orlando, Orlando being Florida’s third largest market at year-end.
Seacoast Banking Corporation of Florida
Exhibit 99.2
to Form 8-K Dated February 2, 2017
Page 5
We’ve now taken the first step to executing the Orlando playbook in the Tampa market with the acquisition of GulfShore Bank announced last November, and we’re on target to close sometime towards the end of this quarter. Our acquisition of Grand Bank, which strengthened our position in Palm Beach County in 2015, is going strong, with households up 9% to 10% since that deal was closed.
At Seacoast our aim is to be able to meet the financial needs of the customers we serve, just like we did 90 years ago when this bank was founded. We firmly believe that while the way we addressed customers’ financial needs has changed dramatically, the needs themselves really haven’t changed at all. We believe that a strong locally relevant brand combined with a digitally enabled low cost delivery structure combines really the best of both worlds, enabling us to generate consistent lower risk returns for our shareholders.
Let me share two final thoughts. The convenience of mobile always in service is now expected by everyone regardless of age or industry. From commercial businesses to small businesses to consumers we now live in a world where everyone expects convenience and they expect their bank - and their banker - to always be on demand.
For the past few years we have been methodically executing a digital transformation strategy that is now positioning us very well. The digital explosion certainly can’t be denied. It is not something that will happen in the distant future. It’s really happening right now and we’re seeing it in our numbers. And banks that aren’t executing and showing progress both to their customers and the shareholders I believe are at serious risk.
The second point I’d like to make that as I look across the state of Florida, now the nation’s third largest state, and our position within it, I continue to see opportunity ahead for our franchise. Our legacy of establishing relationships with customers, understanding and meeting their financial service needs, and serving them through cost-effective distribution channels is very much relevant in the world ahead. And as our experience with digital delivery continues to grow, I think it positions us well.
Seacoast Banking Corporation of Florida
Exhibit 99.2
to Form 8-K Dated February 2, 2017
Page 6
With all that said, after a lot of hard work and commitment to executing on our balanced growth strategy, we are entering 2017 we believe from a position of strength. We’re proud of our financial performance that we delivered for our shareholders in 2016, and as we address in detail momentarily our expectations for the full year 2017, I think we’ll underline the opportunity that lies ahead for Seacoast and what we believe we can achieve.
Finally before I hand off to Chuck to share a few financial highlights and take your questions, I want to invite all of you to attend our first Investor Day on February 22nd. It will be held in New York at the Westin on West 43rd Street and it will also be webcast. We’re also excited in that venue to be able to provide all of you with a much closer look at our differentiated business model to discuss how we think about the future and to discuss the value-creating implications that we see for shareholders over the next couple of years. Thanks a lot for your attention.
Now over to you, Chuck, for some financial highlights.
Chuck Shaffer: Thank you, Denny, and thank you all for joining us this morning. As I provide my comments I will reference the slide deck which can be found at www.seacoastbanking.com.
Let me open by congratulating all of our team members on helping achieve our dollar per share goal announced at the start of the prior year. This was a significant accomplishment, and it was a result of our continued strategy of growing topline revenue through better execution of our business units, the successful integration of two acquisition targets in 2016, and a disciplined and focused program to become a much more efficient organization.
Seacoast Banking Corporation of Florida
Exhibit 99.2
to Form 8-K Dated February 2, 2017
Page 7
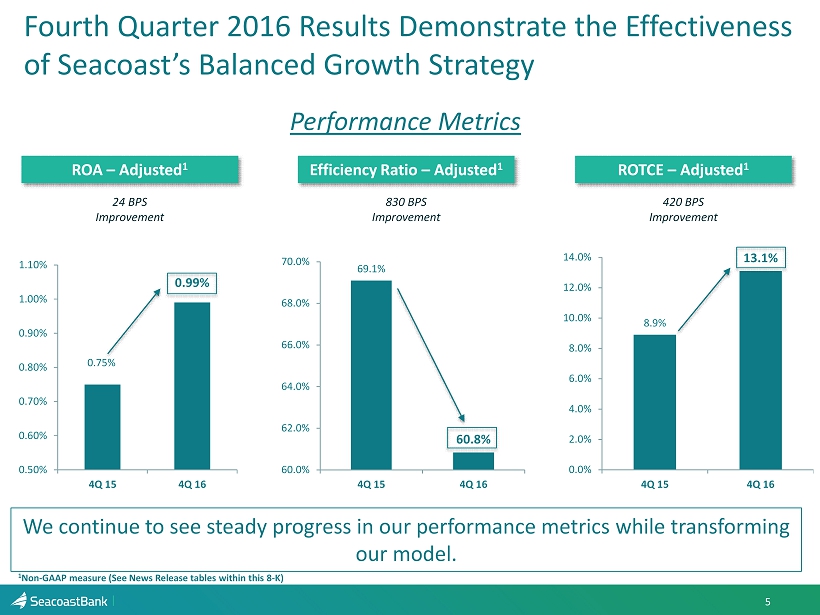
As shown on slide 5 of the deck, our results signal a significant improvement of performance over the past year accomplished without taking outside lending or operational risk. On an adjusted basis, our return on assets ended the year 0.99% up from 0.75% at the end of the prior year. Adjusted return on tangible common equity ended the year at 13.1% up from 8.9% at the end of the prior year, and our adjusted efficiency ratio declined to 60.8%, reflecting the additional operating leverage and efficiency gains created throughout 2016. We believe we are now operating at a level performance that is inline, or ahead of most peers, with a trajectory to improve this performance into 2017.
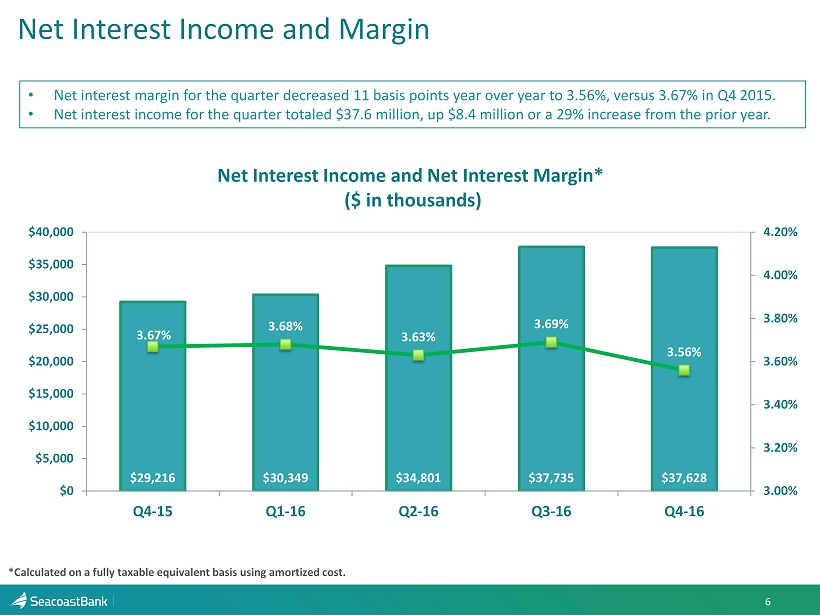
Looking more deeply at the quarter, moving to slide 6, net interest income remained roughly in line with the third quarter and up $8.4 million from the prior year’s fourth quarter, reflecting the full impact of integrating BMO and Floridian and strong loan demand throughout the year. Net interest margin declined 13 basis points from the prior quarter, largely due to less loan accretion and additional balance sheet leverage. Looking forward, we expect the net interest margin to be in the high 350’s and likely increase to the mid-360’s by yearend 2017. The NIM trend will be dependent on where interest rates head in 2017. And we remain moderately asset sensitive with 100 to 200 basis point increase in rates, equating to approximately 2% to 4% improvement in net interest income.
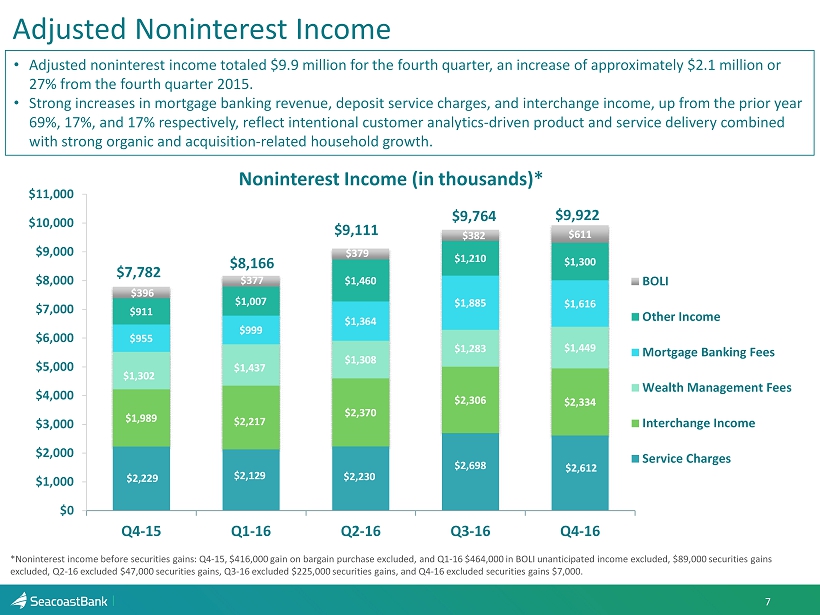
Moving to slide 7, adjusted non-interest income remained relatively in line with the third quarter and is up $2.1 million from the prior year’s fourth quarter, the result of stronger service charges on deposits primarily due to the acquisition of BMO’s operations in Orlando, better performance in our wealth and mortgage banking units, expansion of our BOLI program and continued increases in interchange income, the result of driving spin and activation using our automated marketing tools, and continued household acquisition. As a reminder, our operating markets were impacted by Hurricane Matthew, negatively impacting our transactional fee categories during the quarter.
Seacoast Banking Corporation of Florida
Exhibit 99.2
to Form 8-K Dated February 2, 2017
Page 8
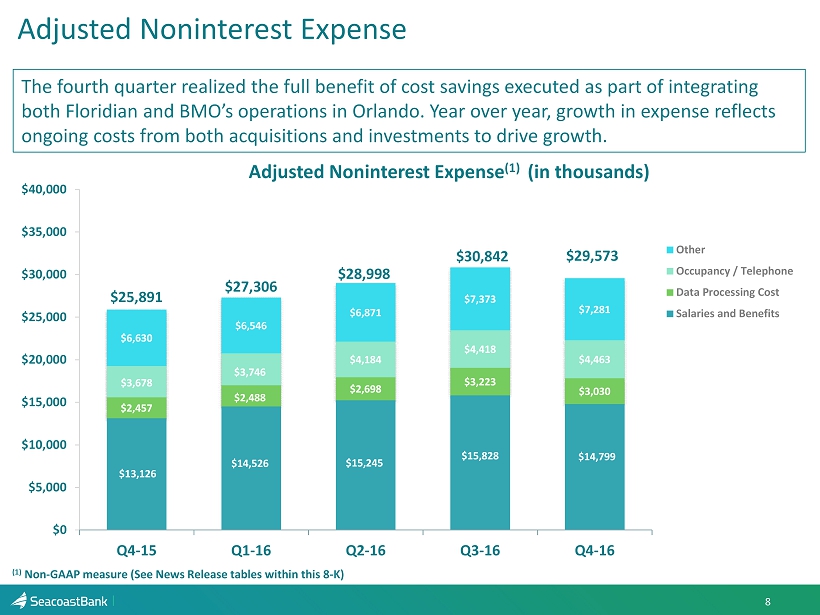
Moving to slide 8, adjusted noninterest expense was down $1.3 million from the prior quarter and up $3.7 million from the prior year’s fourth quarter. The fourth quarter realized the full benefit of cost savings executed from the Floridian and BMO mergers, as we finalized and closed ten locations in the central Florida market during the third quarter. The year-over-year increase reflects ongoing costs associated with two bank acquisitions, investments in technology and investments to drive our franchise’s growth.
And as a remainder, salary and wages should increase by approximately 10% from the fourth quarter of 2016 to the first quarter of 2017, as seasonal increases in 401(k) and related payroll taxes begin to reappear at the start of a new year and accrual levels for compensation return to more normalized levels. We’ll continue to carefully manage the expenses as we move forward and become more efficient in our retail network.
We believe branches are still valuable to our customers for more complex transactions, but simple tasks such as depositing or withdrawing funds are rapidly migrating to a digital world. During the fourth quarter deposits outside the branch network increased to 37% from 22% in the same quarter one year prior. We expect to close 20% of our locations over the next 24 to 36 months and some of this operational expense savings will be reinvested into technology and talent, to deliver products and services in new more convenient ways. We will continue to carefully balance our investments for growth to bottom line performance as we move forward.
Moving to slide 9, our adjusted efficiency ratio improved to 60.8%, evidencing that our transformation continues to get meaningful traction. We remain highly focused on driving shareholder value by executing a transformative strategy, meeting our customer needs with digital offerings and reducing our traditional cost to serve. We recorded a $5.3 million in income tax provision in the fourth quarter of 2016, compared to $4.3 million in the third quarter of 2016 and $3.7 million in the prior year. The fourth and third quarter 2016 tax provisions have been benefited from the early adoption of ASU2016-9, Improvements to Employee Share-Based payment accounting. As a result the company recorded a benefit of $383,000 and $418,000 in the fourth and third quarter, respectively, adding $0.01 per diluted share to each quarter. Looking forward, we expect our effective tax rate to be 36%.
Seacoast Banking Corporation of Florida
Exhibit 99.2
to Form 8-K Dated February 2, 2017
Page 9
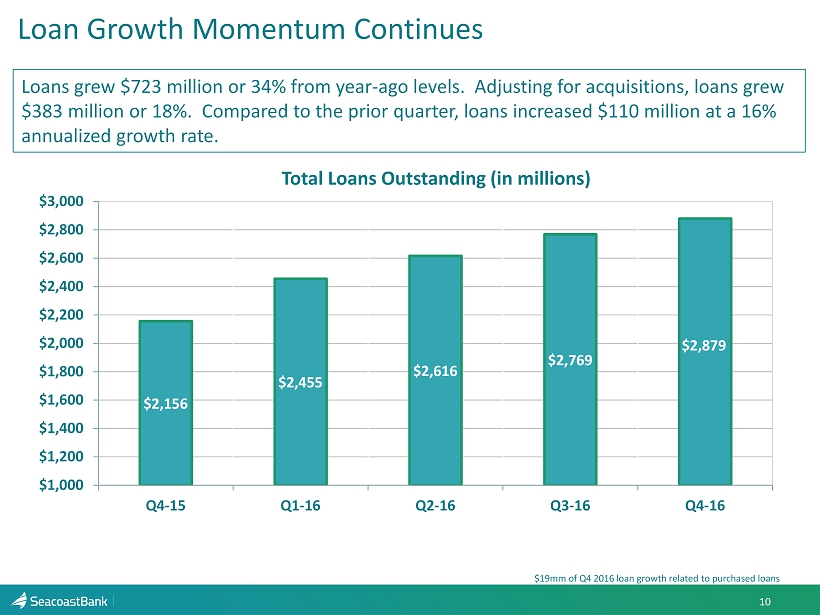
Turning to slide 10, loan outstandings again grew at record pace during the fourth quarter, up $110 million from the third quarter, or 16% annualized. Loan outstandings grew $723 million or 34% from the fourth quarter in the prior year.
Four years ago we made an investment in an innovative commercial banking platform, we call it Accelerate Business Banking. This platform has matured and is now producing over $100 million per quarter in commercial loan originations with production increasing from approximately $200 million in 2013 to $432 million in 2016. The following year we invested in a data-driven lead program in automated marketing, which began to fuel our consumer and small business franchise, increasing total aggregate consumer and small business funding from $31 million in 2013 to $300 million in 2016. We believe we’re still early on the growth curve in this business and expect productivity to continue to improve as we move into 2017.
Our mortgage banking business has also grown substantially in 2016, growing overall originations to $403 million up from $251 million in 2013. The expansion into Orlando, South Florida and ultimately Tampa with the GulfShore acquisition should continue to provide opportunity for our mortgage business. We also continue to focus on building a well-diversified loan book. Our average commercial loan size of $339 million. Our top ten relationships as a percentage of total capital are 40%, up from 36% at the end of the prior year. Looking forward, we expect organic loan growth to continue to be in mid to high teens.
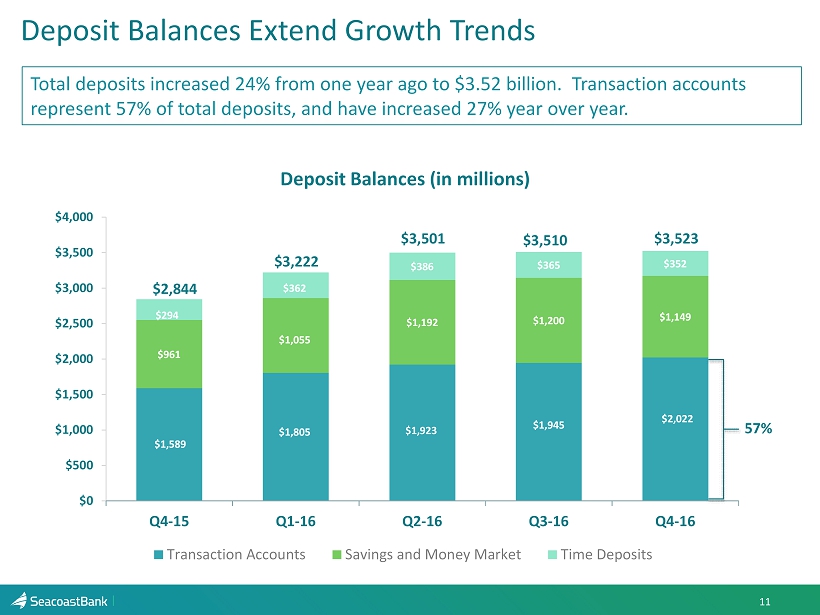
Turning to slide 11, deposit outstandings grew modestly during the fourth quarter, up $13 million from the third quarter, and up $679 million from the fourth quarter in the prior year. Deposits per branch increased to $78 million from $66 million one year ago. Core customer funding, which excludes CDs, increased $63 million or 8% annualized. Rates paid on deposits remain stable quarter-over-quarter. And looking ahead we expect to grow deposit outstandings in the 7% range with some minor increases in deposit rates paid to customers.
Seacoast Banking Corporation of Florida
Exhibit 99.2
to Form 8-K Dated February 2, 2017
Page 10
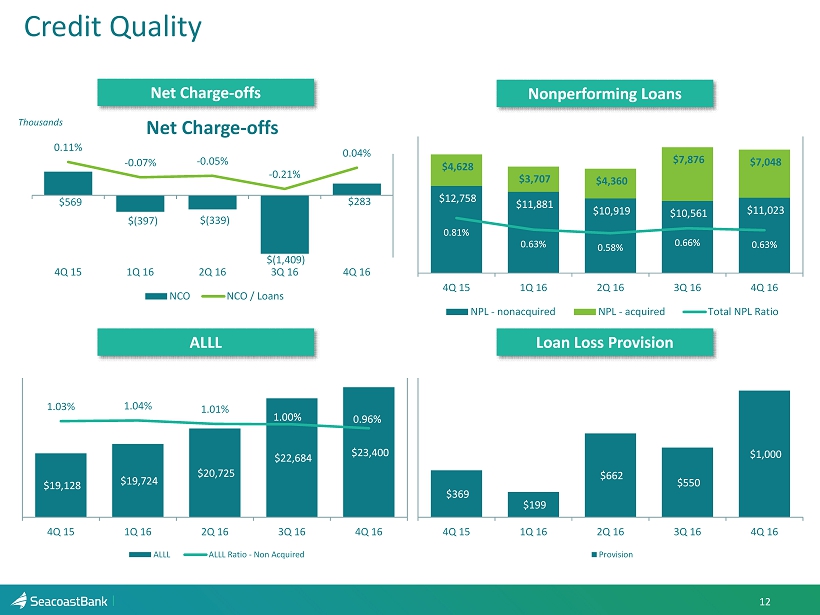
Turning to slide 12, credit quality range continues to be strong, and our risk profile well maintained. In the legacy portfolio, the ALLL ended the quarter at 0.96% of loan outstandings down from 1% at the end of the prior quarter. Net charge-offs were $283,000 for the quarter compared to $1.4 million in recoveries in the prior quarter and charge-offs of $569,000 in the fourth quarter of the prior year. Looking forward the provision for credit losses will continue to be influenced by loan growth.
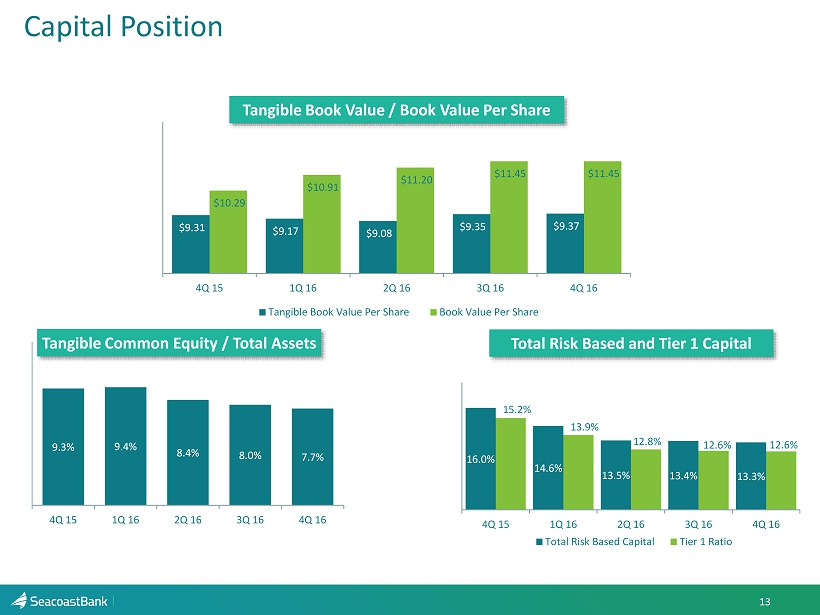
Turning to slide 13, our capital position remains strong. The common equity tier 1 capital ratio was 12.6%, total capital ratio was 13.3%, and the tier 1 leverage ratio was 9.2% at December 31, 2016. Our ratios increased slightly as earnings outpaced balance sheet growth. We’re issuing guidance for adjusted earnings per share of $1.24 to $1.28 for the fiscal year 2017. This assumes the yield curve remains unchanged and continued forward progress in our Florida economy. We’re excited about the year ahead and we work diligently and improved our ability to execute. We’ve made investments in technology and talent in prior years that are now paying off, and we believe we’re operating in some of the best markets of Florida.
I’ll turn to call back over to Denny.
Dennis Hudson: Thank you, Chuck, and I appreciate you hitting a few of highlights for the quarter. Just again, I’d like to remind everybody, we’re going to take a deeper dive into our go-forward strategy at our Investor Day which is scheduled to be in New York on February 22nd. During that meeting, we’ll have a greater number of our key team players presenting different sections of the discussion during that morning and I think it will give investors an opportunity to again take a deeper dive into the business model that we’re creating here, and the implications looking forward for value creation out in the medium term. So we look forward to seeing you then.
I’d like to throw the floor open to any questions that we might have. Operator?
Seacoast Banking Corporation of Florida
Exhibit 99.2
to Form 8-K Dated February 2, 2017
Page 11
Operator: Thank you. We will now begin the question and answer session. [Operator instructions]. Our first question comes from Mr. Michael Young from SunTrust Robinson Humphrey. Please go ahead.
Michael Young: Hi, good morning, everyone.
Dennis Hudson: Hi, Michael.
Michael Young: I wanted to start, Chuck, I think you mentioned you’re going to close ten branches in 2017. Is that the right number?
Chuck Shaffer: We closed 10 branches in the third quarter in the Orlando market and looking forward, we plan to close 20% in the next 24 to 36 months.
Michael Young: Okay. Over two to three years, okay. Got it, yes. And so maybe just backing that up and hold then on the expense line item for next year, do you expect continued sort of net declines, maybe absent the first quarter from the first quarter run rate?
Chuck Shaffer: Yes, the first quarter will, yes as I mentioned in my comments, we shouldn’t expect that to go back up due to normalized sort of compensation type issues. But looking forward through the remainder of the year, I would expect non-interest income to remain relatively flat to down. We’ll continue to focus on efficiency throughout the year and as we continue to work through some of that consolidation work, we should see some benefit.
Dennis Hudson: You’re speaking about non-interest expenses, flat to down?
Chuck Shaffer: Non-interest expenses. Yes, right.
Seacoast Banking Corporation of Florida
Exhibit 99.2
to Form 8-K Dated February 2, 2017
Page 12
Michael Young: Okay and also just on the deposit side, I think earlier this year you guys were hoping for maybe about $80 million in deposits per branch, we’re a little light of that. I just wasn’t sure, was there more deposit outflow maybe from the BMO branches or did you decide to keep a couple of extra branches that maybe you weren’t planning on originally?
Chuck Shaffer: If you look at our core customer funding, it continues to grow quarter-over-quarter. One of the things that did impact that number is that we purposely allowed some of the higher rate CDs acquired through some of the acquisitions to run off; the core deposits underneath that continue to grow, the two acquisitions that performed basically in line with what we expected on the customer side of the transactions, as well as we are impacted a little bit on public funds. We chose not to compete for some public funds. As rates have increased here, the public fund market has gotten more competitive and we saw some money move up to the state of Florida SBA fund as well as some competition at some prices and some rates that we were unwilling to pay.
Dennis Hudson: In fact that brought down our deposit growth rate on a total basis in Q4. If you take that out I think our deposit growth was actually right in line with what we expected in 6% or 7% range.
Michael Young: All right, and maybe just lastly hitting on M&A. Obviously you got the Tampa deal is going to close, kind of midyear, but I assume you’re still kind of in the market looking selectively for new acquisitions. Do you still bias towards market expansion at this point?
Dennis Hudson: Good question, we continue to focus our attention on organic growth, as you’ve heard through most of the call, and we look for selective M&A opportunities when we see value in the customer base that we can further monetize and create revenue growth. And so we’re continuing to look for those opportunities and when we see one, we get excited about it and try to tackle it. I wouldn’t say it’s our primary goal, but it’s an important part of the balanced growth strategy.
Seacoast Banking Corporation of Florida
Exhibit 99.2
to Form 8-K Dated February 2, 2017
Page 13
Michael Young: Okay, congrats on the good quarter and good luck to Steve and Chuck and everyone else.
Dennis Hudson: Thanks, Mike.
Operator: Thank you. Our next question comes from Mr. Bob Ramsey from FBR. Please go ahead.
Bob Ramsey: Hi, good morning, guys. I just wanted to follow up a little bit on the deposit conversation there, it sounds like there were some areas you pulled back on. I’m curious if you see ongoing pressure in those areas, obviously you grew some of the wholesale funding this quarter, and how you’re thinking about funding loan growth as we go forward, where the opportunities and challenges are.
Chuck Shaffer: Thanks, Bob. We have a strong retail bank. We’ll continue to use that retail bank to produce low cost retail deposits and that will be our first source as we move forward. You’re right, the deposit environment is changing here, particularly as the yield curve increases and as banks sort of fill up on loan to deposit ratio. That being said, we’ve been a good deposit gatherer over time and we’ll begin to focus more of our attention there and focus on growing small business in retail, and the public fund market is always there for us if we want to go back into that to fund loan growth.
Dennis Hudson: As we said earlier, the underlying deposit trend actually was quite positive during the quarter. The big impact was the reduction in some of the balances that we might have expected in the public funds area and that was directly related to what has happened with some of that funding as some of our excess deposits that we would normally get out of that class, at yearend and end of the fourth quarter, kind of moved over into SBA funds, which are invested in mortgage backs and things like that.
Seacoast Banking Corporation of Florida
Exhibit 99.2
to Form 8-K Dated February 2, 2017
Page 14
Chuck Shaffer: And Bob just to add on to that, too, if you think about the full balance sheet, the investment portfolio runs off about $180 million in cash over the next 12 months. We don’t expect to rebuild that investment portfolio so that helps fund run loan growth as we move forward as well.
Bob Ramsey: Okay, that’s helpful. Then sort of I guess somewhat related, could you sort of provide an update for us on where you stand in terms of interest rate sensitivity particularly in light of the Fed’s December move and what further moves may mean for you?
Dennis Hudson: Sure. I made a comment in my address, but I’ll repeat it. We’re moderately asset sensitive, 100 to 200 basis point increase in rates basically equates to 2% to 4% improvement in net interest income, and I think that’s the best way to think about it. If we do see the Fed increase rates throughout the year depending on how the yield curve reacts that’s assuming kind of a parallel shift, but we are asset sensitive and any increase in rates does work to our benefit.
Bob Ramsey: Okay, all right, great. I think I did not quite pull that out of the intro comments. I think at the same time you were talking about margin guidance for the year. Did I catch you correct that you expect high 350s this quarter and maybe low 360s by yearend?
Dennis Hudson: Yes, the exact language was mid-360s, but the driver to that is as we allow the investment portfolio decline and fund loan growth as we move forward that should positively impact the margin.
Bob Ramsey: Got it. So mix shift is the biggest driver.
Dennis Hudson: Yes.
Seacoast Banking Corporation of Florida
Exhibit 99.2
to Form 8-K Dated February 2, 2017
Page 15
Bob Ramsey: In terms of the margin this quarter, I know you guys highlighted 6 basis point hit from lower purchase accounting accretion. What was the amount of purchase accounting accretion this quarter and is this a good level you think as we sort of run through next year?
Dennis Hudson: Yes, I think this is an okay way to think about it this quarter, but good ways is it runs around 10 basis points, somewhere 10 to 15 basis points depending on the quarter. It’s volatile, you have to be careful and assuming that loan payoffs and things can impact that meaningfully but that’s probably about the way to think about it.
Bob Ramsey: And I’m sorry, how much was it this quarter?
Chuck Shaffer: I don’t have the exact number, but yes I think you can say about 10 to 15 basis points is about we have in loan accretion in any normalized quarter.
Bob Ramsey: Okay, all right, fair enough. Last question and then I’ll hop out. This was definitely a good quarter for loan growth, loan originations. It looked like the commercial pipeline was lower at period end. I’m just kind of curious, was there any element of pulling volume forward or how you’re thinking about that commercial pipeline headed into the first quarter?
Dennis Hudson: Chuck Cross, do you want to take a stab at that?
Chuck Shaffer: We might not have Cross.
Dennis Hudson: I’m sorry? I guess they must have dropped off or something.
Seacoast Banking Corporation of Florida
Exhibit 99.2
to Form 8-K Dated February 2, 2017
Page 16
Chuck Shaffer: Yes, I’ll take it, since Cross has dropped off. I think we just cleared pipeline as we normally do. The first quarter is the toughest quarter and that’s usual as we enter yearend that the pipelines get cleared, but we expect that to build here as we go.
Dennis Hudson: The other thing I would say is what we disclosed I think is our solid parts of the pipeline. I know the discovery and underway kind of parts of the pipeline have actually grown in January and we have a pretty optimistic view of Q1 and it should be fine. We’re actually looking for pretty decent Q1. But you’re right, we did clear out a lot of the approved weighting at year end. And we’re now seeing it build back as we’ve gotten further into Q1.
Bob Ramsey: Okay, great, thank you, guys.
Dennis Hudson: Thanks, Bob.
Operator: Thank you. [Operator instructions]. Our next question on line comes from Stephen Scouten from Sandler O’Neill. Please go ahead.
Stephen Scouten: Hi, guys, good morning.
Chuck Shaffer: Hi, Stephen.
Stephen Scouten: Question for you maybe to follow up on the loan growth conversation there. You guys noted that you have an opportunity to a degree with the CRE level at about 214 on risk based capital. Is that something with competitors facing some constraints in your market, that you might look to pursue more aggressively? And within that, do you think you’ll shift away from any of the granularity of your portfolio and maybe start to take a stab at some larger deals on the CRE side?
Seacoast Banking Corporation of Florida
Exhibit 99.2
to Form 8-K Dated February 2, 2017
Page 17
Dennis Hudson: I’ll take a stab at that, I would say we established guardrails covering credit risk back in 2009, and we haven’t changed any of those guardrails nor do we have any intent to change those guardrails. So one of the key metrics that we keep an eye on is granularity and we’re going to continue to focus on that. We have built the loan growth that we’ve been talking about here across a whole host of asset classes on the balance sheet and certainly CRE is one of those, but it is by no means the only thing that we focus on.
Having said that, I think we have an opportunity to have some focus there. It’s not something currently under way, nor that is really currently anticipated. We also note that as we look at acquisitions, often times we see larger CRE exposures in the smaller companies, and I think this provides us some room for that. We can acquire those assets at the right marks, put them in the portfolio and while it may increase our CRE exposure a little bit, it’s the right kind of exposure with the right kind of marks, and we feel pretty good about that. Having said that, our guardrails are going to require us to keep a lower focus on CRE.
Chuck Cross, are you back on line, did you have any comments on that?
Chuck Cross: Yes, my comment to Stephen would be we had 18% year-over-year growth last year excluding acquisitions. The loan production last year was over a billion dollars. It was about 50% consumer and residential, 25% C&I, and 25% CRE. Since that time, we added BMO and Floridian about mid-year, so we think we’re going to have extra production capacity in 2017 in addition to the GulfShore acquisition in Tampa and the teams that we’re building over in the Tampa market.
So those new markets will help us continue with the loan production we’ve had in the past, but as Denny said, sticking to our guardrails.
Seacoast Banking Corporation of Florida
Exhibit 99.2
to Form 8-K Dated February 2, 2017
Page 18
Stephen Scouten: Okay, yes that’s great, that makes a lot of sense. And then maybe if I could go back to the NIM here for a second, I know, Chuck, you gave kind of a range for Q1 there, but I’m wondering what the kind of puts and takes are there. Do you have a way to quantify what the benefit of the recent rate high case into Q1 numbers? I mean will that provide a little bit of a lift? And then with the wholesale fundings, you mentioned not reinvesting in securities, so should we see those wholesale fundings kind of come down throughout the year?
Chuck Shaffer: I think to answer the question I’ll start with the wholesale fundings. I don’t think from this point forward, we may see a small build in wholesale funding, but we don’t plan to continue to build that as we move through the remainder of the year. So that’s the approach for wholesale funding.
On the NIM drivers, the three sort of biggest issues there are going to be loan growth, as that builds throughout the year, as the investment portfolio declines, as well as the voluntarily around accretion in that 10 to 15 basis points, but we generally should see it improve as we move through the year.
Steve Fowle: And that’s assuming flat rates. So an up rate environment would only benefit us from there.
Chuck Shaffer: And around the increase in the most recent Fed, that’ll benefit us. I don’t have the number here to talk about today, but it is beneficial and it’s worked into the guidance that we provided for 2017.
Stephen Scouten: Okay, okay, so the mid-350 in 1Q and mid-360 by yearend, that all assumes no further rate hikes.
Chuck Shaffer: Correct.
Stephen Scouten: Okay, great that’s good to know. Okay and then last one for me, just on the expense front, I know this quarter there was obviously a big move down in salary, some of that was an accrual reversal, a big move down in occupancy and a big move up in the other non-interest expense, can you give any—I know there’s some color in the release—but maybe a good starting point for 1Q expense run rate or kind of how this—with any unusual items that was within there that we’re not aware?
Seacoast Banking Corporation of Florida
Exhibit 99.2
to Form 8-K Dated February 2, 2017
Page 19
Chuck Shaffer: The best way to think about Q3 to Q4 is the biggest change there was the consolidation of the ten branches in Orlando and the final sort of closure to the Floridian and BMO mergers.
Dennis Hudson: And a full quarter impact of everything that had happened in Q3 and a little bit in Q2.
Chuck Shaffer: Correct. Except for salary and wages, I think it reflects the real trends. We should see increased payroll and 401(k), as well as some more normalized compensation accruals will come back in. The way to think about salaries and wages we should expect it to go up about 10% Q4 to Q1. Outside of that the rest of the line items are pretty normalized.
Stephen Scouten: Okay. So, that jump to $3.7 million from $1.6 million in the other that’s going to be something that’ll stick around?
Steve Fowle: The other expenses were flat, Stephen, flat or down quarter-to-quarter.
Stephen Scouten: Okay. Alright, I’ll have to go back and look at my numbers, maybe that’s me, sorry about that.
Steve Fowle: Yes, okay. And as a reminder Q1, I think we said this already, but as a reminder, Q1 is for like for the rest of the industry, Q1 is a tough quarter. Less days to earn fees on, less days to earn net interest income on and expenses pop up with the salary and benefits dynamics Chuck talked about.
Operator: [Operator instructions]. Our question online comes from Mr. David Feaster from Raymond James. Please go ahead. Your line is open.
Seacoast Banking Corporation of Florida
Exhibit 99.2
to Form 8-K Dated February 2, 2017
Page 20
David Feaster: Good morning, guys. I would like to talk about fee income for a second. It was up nicely in 2016. As we head into 2017 obviously mortgage is going to be under some pressure. Could you just give us some color on your expectations for fee income businesses and how you think about trends and would you consider maybe doing some non-bank M&A to supplement some of your trust or what management lines of the business?
Chuck Shaffer: Yes, thanks, David. So, the way to think about it, as you think about the components of our non-interest income, our service charges on deposits are largely correlated with growth in the organization and household growth. So, continuing our focus on organic growth should benefit that as we move through the year. And our trust and wealth businesses, we began to reinvest in that in 2016. Looking forward into 2017 we’d like to see that continue to grow. We have considered all kinds of options, things are always on the table. We’re always considering M&A in various ways so that’s out there. There’s nothing M&A or nothing that’s being worked out currently but we are open to it.
In mortgage banking we expect a good year as we continue to build out in Orlando and continue to build out into south Florida. We should continue to see check and debit card interchange continuing to perform well. Some of the investments we made in the talent in the automation and the marketing team we brought in over the past few years, has led to good results there that’s driving spend and we continue to focus on that line item moving forward as well.
So, I think you’d continue to see positive trends throughout 2017.
David Feaster: Okay that’s helpful. On provision expense, it was a bit higher than expected. You actually saw charge-offs after several quarters of net recoveries. Do you think we’re kind of ending the credit cycle or entering the credit cycle and that reserve releases should slow and that we should start to see more normalized levels of provisioning and charge-offs going forward?
Seacoast Banking Corporation of Florida
Exhibit 99.2
to Form 8-K Dated February 2, 2017
Page 21
Dennis Hudson: I would just say that you’re right. We didn’t have the recoveries this quarter. We’ve had kind of an unusual series of recoveries during a good part of 2016 that kind of went to basically nothing or very low this quarter. And I think that was certainly impactful, but of course the driver to provision in the quarter and really throughout the year has been loan growth. It’s been covered to some degree with unusual levels of recoveries; those recoveries did not occur this quarter. I think we would expect to see those recoveries continue to remain a little more modest going forward than they were in 2016. So, we’re counting on generally higher provisioning in ‘17 than we would have seen in ‘16 primarily driven, all totally driven, by more aggressive loan growth.
David Feaster: Okay, that’s helpful. Last one from me, more of a high level question, you have a pretty wide footprint across Florida’s West Coast. Could you just give us a pulse of the Florida economy? It’s still 1,000 people moving here a day. Are you seeing increased optimism in your clients and after the election and increased willingness to grow and invest in their businesses? What are some notable trends that you’re seeing in the Florida economy?
Dennis Hudson: I think there’s no doubt that we are now seeing increased optimism on the part of our customer base as we talk with small businesses (and) as we talk with larger commercial clients. What I see and some of the things that we’re working on are folks more willing to invest and grow, but I think it’s more fundamental than that, I think the economy in Florida continues to perform extremely well.
I think the thing that has kicked in the last quarter or two which I’ve been talking about all year, is a return of broader base construction primarily around residential and that’s being driven by a lack of inventory for new product across the state. So, whether it would be Orlando or South Florida or Tampa, we’re seeing much higher levels of constructions spend. I’m not talking high rise; I’m talking more broad-based type construction which is certainly helping with the employment situation. There was kind of the lapse, the structure component to GDP growth is back, and so I think we’ll continue to see positive things there.
Seacoast Banking Corporation of Florida
Exhibit 99.2
to Form 8-K Dated February 2, 2017
Page 22
Any insights, Chuck or Julie, that you’ve noticed?
Julie Kleffel: Denny, this is Julie. I would echo your comments as we spend a lot of time with small business owners, optimism is very high and investments in their business continue both in expansion and in innovation and so I believe that it’s a forward-looking positivity across the state of Florida.
David Feaster: That’s helpful. Thanks.
Dennis Hudson: So, optimism got huge. But I think it’s more fundamental than that and really I have a pretty positive outlook. I think we have some nice runway ahead of us over the next couple of years in the state as things have fully come back on line. And the other thing that’s no surprise to any of us, is the number of folks moving to the state is back up to a pretty high level now, and we’re seeing it consistently across the state.
I guess one other final comment I’ll make is I’m amazed with some of the industrial growth. We’re seeing industrial warehouse really advancing very quickly, particularly around the center part of the state, and I think it’s a function of what’s happening to a great degree in the way the business model is changing for retailing and other things like that; we see tremendous growth there. That is not something I am interested in having us participate in very strongly. It tends to be more speculative and not something that fits our risk profile, and they also tends to be larger than our risk appetite in terms of size. But that’s been big delta, I’d say, over the last 12 months in those markets.
David Feaster: That’s very helpful. Thank you.
Dennis Hudson: Great. Thanks, David.
Seacoast Banking Corporation of Florida
Exhibit 99.2
to Form 8-K Dated February 2, 2017
Page 23
Operator: And this time I see we have no further question in queue. I would like to turn the call back over to Mr. Dennis Hudson for closing remarks.
Dennis Hudson: Great. Well, thank you all for joining us today. Again we look forward to seeing you hopefully on February 22nd in New York where we’re going to be talking more deeply about our go-forward strategy and implications in the medium term. Thank you for attending today. Look forward to seeing you then and on next quarter’s call.
Operator: Thank you, ladies and gentlemen. This concludes today’s conference. Thank you for participating. You may now disconnect.
Exhibit 99.3
Earnings Presentation Q4 - 2016 Contact : (email) Steve.Fowle@SeacoastBank.com (phone) 772.463.8977 (web) www.Sea coa stBanking.com
This presentation contains “forward - looking statements” within the meaning of Section 27 A of the Securities Act of 1933 and Section 21 E of the Securities Exchange Act of 1934 , including, without limitation, statements about future financial and operating results, ability to realized deferred tax assets, cost savings, enhanced revenues, economic and seasonal conditions in our markets, and improvements to reported earnings that may be realized from cost controls and for integration of banks that we have acquired, as well as statements with respect to Seacoast’s objectives, expectations and intentions and other statements that are not historical facts . Actual results may differ from those set forth in the forward - looking statements . Forward - looking statements include statements with respect to our beliefs, plans, objectives, goals, expectations, anticipations, estimates and intentions, and involve known and unknown risks, uncertainties and other factors, which may be beyond our control, and which may cause the actual results, performance or achievements of Seacoast to be materially different from future results, performance or achievements expressed or implied by such forward - looking statements . You should not expect us to update any forward - looking statements . You can identify these forward - looking statements through our use of words such as “may,” “will,” “anticipate,” “assume,” “should,” “support”, “indicate,” “would,” “believe,” “contemplate,” “expect,” “estimate,” “continue,” “further”, “point to,” “project,” “could,” “intend” or other similar words and expressions of the future . These forward - looking statements may not be realized due to a variety of factors, including, without limitation : the effects of future economic and market conditions, including seasonality ; governmental monetary and fiscal policies, as well as legislative, tax and regulatory changes ; changes in accounting policies, rules and practices ; the risks of changes in interest rates on the level and composition of deposits, loan demand, liquidity and the values of loan collateral, securities, and interest sensitive assets and liabilities ; interest rate risks, sensitivities and the shape of the yield curve ; the effects of competition from other commercial banks, thrifts, mortgage banking firms, consumer finance companies, credit unions, securities brokerage firms, insurance companies, money market and other mutual funds and other financial institutions operating in our market areas and elsewhere, including institutions operating regionally, nationally and internationally, together with such competitors offering banking products and services by mail, telephone, computer and the Internet ; and the failure of assumptions underlying the establishment of reserves for possible loan losses . The risks of mergers and acquisitions, include, without limitation : unexpected transaction costs, including the costs of integrating operations ; the risks that the businesses will not be integrated successfully or that such integration may be more difficult, time - consuming or costly than expected ; the potential failure to fully or timely realize expected revenues and revenue synergies, including as the result of revenues following the merger being lower than expected ; the risk of deposit and customer attrition ; any changes in deposit mix ; unexpected operating and other costs, which may differ or change from expectations ; the risks of customer and employee loss and business disruption, including, without limitation, as the result of difficulties in maintaining relationships with employees ; increased competitive pressures and solicitations of customers by competitors ; as well as the difficulties and risks inherent with entering new markets . All written or oral forward - looking statements attributable to us are expressly qualified in their entirety by this cautionary notice, including, without limitation, those risks and uncertainties described in our annual report on Form 10 - K for the year ended December 31 , 2015 under “Special Cautionary Notice Regarding Forward - Looking Statements” and “Risk Factors”, and otherwise in our SEC reports and filings . Such reports are available upon request from the Company, or from the Securities and Exchange Commission, including through the SEC’s Internet website at http : //www . sec . gov . 2 Cautionary Notice Regarding Forward - Looking Statements
Agenda Investment Thesis Successfully Executing a Differentiated Strategy to Deliver Balanced Growth 3 x Reaping benefits of strategic investments in organic growth and digital transformation x Track record of completing val ue - creating acquisitions in growing markets x Robust risk management and controls help ensure consistent , sustainable results x Action - oriented management team, engaged and experienced board that is committed to building shareholder value x Well - positioned to benefit from strong Florida economy Achieved 2016 target adjusted diluted EPS (1) of $ 1.00 1 Non - GAAP measure (See News Release tables within this 8 - K )
4 Financial Highlights Growth Highlights Q4 2016 Financial and Growth Highlights • Year over year revenues grew 28%, driven by growth in both net interest income and fee income. • Loan production continued to increase in the fourth quarter with another record in all business units. • Loans grew $ 723 million or 34% from one year ago. Adjusting for acquisitions, loan growth was $383 million or 18%. Compared to the prior quarter, loans increased at a 16% annualized growth rate, adding $110 million sequentially. • Debit card spend from our customer base reached another new high in the fourth quarter 2016, up 2.9% over third quarter 2016 and up 16.9% over fourth quarter 2015. • Net interest income increased $8.3 million or 29% year over year. • Adjusted fully diluted earnings per share 1 rose to $ 0.30, an increase of 58% year - over - year and 7% from the third quarter 2016. • Adjusted return on assets 1 was 0.99%, a 4 basis point improvement over third quarter 2016 and 24 basis point improvement over 2015. • Adjusted return on tangible common equity 1 reached 13.1% during the fourth quarter, an increase of 47% year over year. • Adjusted efficiency ratio of 60.8%, down from 69.1% in the fourth quarter 2015 and from 63.1% in the third quarter 2016. 1 Non - GAAP measure (See News Release tables within this 8 - K)
8.9% 13.1% 0.0% 2.0% 4.0% 6.0% 8.0% 10.0% 12.0% 14.0% 4Q 15 4Q 16 69.1% 60.8% 60.0% 62.0% 64.0% 66.0% 68.0% 70.0% 4Q 15 4Q 16 0.75% 0.99% 0.50% 0.60% 0.70% 0.80% 0.90% 1.00% 1.10% 4Q 15 4Q 16 Fourth Quarter 2016 Results Demonstrate the Effectiveness of Seacoast’s Balanced Growth Strategy 5 1 Non - GAAP measure (See News Release tables within this 8 - K) We continue to see steady progress in our performance metrics while transforming our model. ROA – Adjusted 1 Efficiency Ratio – Adjusted 1 ROTCE – Adjusted 1 Performance Metrics 24 BPS Improvement 830 BPS Improvement 420 BPS Improvement
Net Interest Income and Margin 6 $29,216 $30,349 $34,801 $37,735 $37,628 3.67% 3.68% 3.63% 3.69% 3.56% 3.00% 3.20% 3.40% 3.60% 3.80% 4.00% 4.20% $0 $5,000 $10,000 $15,000 $20,000 $25,000 $30,000 $35,000 $40,000 Q4-15 Q1-16 Q2-16 Q3-16 Q4-16 Net Interest Income and Net Interest Margin* ($ in thousands) • Net interest margin for the quarter decreased 11 basis points year over year to 3.56%, versus 3.67% in Q4 2015. • Net interest income for the quarter totaled $ 37.6 million , up $8.4 million or a 29% increase from the prior year. *Calculated on a fully taxable equivalent basis using amortized cost.
Adjusted Noninterest Income 7 $2,229 $2,129 $2,230 $2,698 $2,612 $1,989 $2,217 $2,370 $2,306 $2,334 $1,302 $1,437 $1,308 $1,283 $1,449 $955 $999 $1,364 $1,885 $1,616 $911 $1,007 $1,460 $1,210 $1,300 $377 $379 $382 $611 $0 $1,000 $2,000 $3,000 $4,000 $5,000 $6,000 $7,000 $8,000 $9,000 $10,000 $11,000 Q4-15 Q1-16 Q2-16 Q3-16 Q4-16 BOLI Other Income Mortgage Banking Fees Wealth Management Fees Interchange Income Service Charges Noninterest Income (in thousands)* $7,782 *Noninterest income before securities gains: Q4 - 15, $416,000 gain on bargain purchase excluded, and Q1 - 16 $464,000 in BOLI unant icipated income excluded, $89,000 securities gains excluded, Q2 - 16 excluded $47,000 securities gains, Q3 - 16 excluded $225,000 securities gains, and Q4 - 16 excluded securities gains $7,000. • Adjusted noninterest income totaled $9.9 million for the fourth quarter , an increase of approximately $2.1 million or 27% from the fourth quarter 2015. • Strong increases in mortgage banking revenue, deposit service charges, and interchange income, up from the prior year 69%, 17%, and 17% respectively, reflect intentional customer analytics - driven product and service delivery combined with strong organic and acquisition - related household growth. $8,166 $9,111 $9,764 $9,922 $396
Adjusted Noninterest Expense 8 $13,126 $14,526 $15,245 $15,828 $14,799 $2,457 $2,488 $2,698 $3,223 $3,030 $3,678 $3,746 $4,184 $4,418 $4,463 $6,630 $6,546 $6,871 $7,373 $7,281 $0 $5,000 $10,000 $15,000 $20,000 $25,000 $30,000 $35,000 $40,000 Q4-15 Q1-16 Q2-16 Q3-16 Q4-16 Other Occupancy / Telephone Data Processing Cost Salaries and Benefits Adjusted Noninterest Expense (1) (in thousands) $29,573 $25,891 $27,306 $28,998 (1) Non - GAAP measure (See News Release tables within this 8 - K) $30,842 The fourth quarter realized the full benefit of cost savings executed as part of integrating both Floridian and BMO’s operations in Orlando. Year over year, growth in expense reflects ongoing costs from both acquisitions and investments to drive growth.
Efficiency Ratio 9 81.90% 84.30% 89.40% 82.80% 104.50% 68.30% 68.60% 76.3% 72.6% 81.7% 78.0% 68.6% 62.4% 40% 50% 60% 70% 80% 90% 100% 110% Q4-13 Q1-14 Q2-14 Q3-14 Q4-14 Q1-15 Q2-15 Q3-15 Q4-15 Q1-16 Q2-16 Q3-16 Q4-16 GAAP - Efficiency • GAAP efficiency improved by 6.2% from Q3 to Q4 while adjusted efficiency improved 2.3% over the same period. 82.60% 83.30% 82.00% 79.60% 74.80% 67.50% 67.50% 68.2% 69.1% 69.6% 64.8% 63.1% 60.8% 40% 50% 60% 70% 80% 90% 100% 110% Q4-13 Q1-14 Q2-14 Q3-14 Q4-14 Q1-15 Q2-15 Q3-15 Q4-15 Q1-16 Q2-16 Q3-16 Q4-16 Adjusted - Efficiency 1 1 Non - GAAP measure (See News Release tables within this 8 - K)
Loan Growth Momentum Continues 10 $2,156 $2,455 $2,616 $2,769 $2,879 $1,000 $1,200 $1,400 $1,600 $1,800 $2,000 $2,200 $2,400 $2,600 $2,800 $3,000 Q4-15 Q1-16 Q2-16 Q3-16 Q4-16 Total Loans Outstanding (in millions) Loans grew $723 million or 34% from year - ago levels. Adjusting for acquisitions, loans grew $ 383 million or 18%. Compared to the prior quarter, loans increased $110 million at a 16% annualized growth rate. $19mm of Q4 2016 loan growth related to purchased loans
Deposit Balances Extend Growth Trends 11 Total deposits increased 24% from one year ago to $3.52 billion. Transaction accounts represent 57% of total deposits, and have increased 27% year over year. $1,589 $1,805 $1,923 $1,945 $2,022 $961 $1,055 $1,192 $1,200 $1,149 $294 $362 $386 $365 $352 $0 $500 $1,000 $1,500 $2,000 $2,500 $3,000 $3,500 $4,000 Q4-15 Q1-16 Q2-16 Q3-16 Q4-16 Transaction Accounts Savings and Money Market Time Deposits Deposit Balances (in millions) $3,523 $2,844 $3,222 $3,501 57% $3,510
Credit Quality 12 Net Charge - offs Nonperforming Loans ALLL Thousands $12,758 $11,881 $10,919 $10,561 $11,023 $4,628 $3,707 $4,360 $7,876 $7,048 0.81% 0.63% 0.58% 0.66% 0.63% 4Q 15 1Q 16 2Q 16 3Q 16 4Q 16 NPL - nonacquired NPL - acquired Total NPL Ratio $19,128 $19,724 $20,725 $22,684 $23,400 1.03% 1.04% 1.01% 1.00% 0.96% 4Q 15 1Q 16 2Q 16 3Q 16 4Q 16 ALLL ALLL Ratio - Non Acquired $369 $199 $662 $550 $1,000 4Q 15 1Q 16 2Q 16 3Q 16 4Q 16 Provision Loan Loss Provision $569 $(397) $(339) $(1,409) $283 0.11% - 0.07% - 0.05% - 0.21% 0.04% 4Q 15 1Q 16 2Q 16 3Q 16 4Q 16 Net Charge - offs NCO NCO / Loans
Capital Position 13 Tangible Book Value / Book Value Per Share 56% YoY Improvement $9.31 $9.17 $9.08 $9.35 $9.37 $10.29 $10.91 $11.20 $11.45 $11.45 4Q 15 1Q 16 2Q 16 3Q 16 4Q 16 Tangible Book Value Per Share Book Value Per Share 9.3% 9.4% 8.4% 8.0% 7.7% 4Q 15 1Q 16 2Q 16 3Q 16 4Q 16 Tangible Common Equity / Total Assets 16.0% 14.6% 13.5% 13.4% 13.3% 15.2% 13.9% 12.8% 12.6% 12.6% 4Q 15 1Q 16 2Q 16 3Q 16 4Q 16 Total Risk Based Capital Tier 1 Ratio Total Risk Based and Tier 1 Capital
Contact Details : Seacoast Banking Corporation of Florida [ NASDAQ: SBCF] 14 Steve Fowle, CFO (email) Steve.Fowle@SeacoastBank.com (phone) 772.463.8977 Investor Relations www.SeacoastBanking.com