UNITED STATES
SECURITIES AND EXCHANGE COMMISSION
WASHINGTON, DC 20549
FORM 8-K
CURRENT REPORT
PURSUANT TO SECTION 13 OR 15(d) OF THE
SECURITIES EXCHANGE ACT OF 1934
Date of report (Date of earliest event reported) January 29, 2014
SEACOAST BANKING CORPORATION OF FLORIDA |
(Exact Name of Registrant as Specified in Charter) |
Florida | 1-13660 | 59-2260678 | ||
(State or Other Jurisdiction | (Commission | (IRS Employer | ||
of Incorporation) | File Number | Identification No.) |
815 Colorado Avenue, Stuart, FL | 34994 | |
(Address of Principal Executive Offices) | (Zip Code) |
Registrant’s telephone number, including area code (772) 287-4000
Check the appropriate box below if the Form 8-K filing is intended to simultaneously satisfy the filing obligation of the registrant under any of the following provisions (see General Instruction A.2.)
¨ | Written communications pursuant to Rule 425 under the Securities Act (17 CFR 230.425) |
¨ | Soliciting material pursuant to Rule 14a-12 under the Exchange Act (17 CFR 240.14a-12) |
¨ | Pre-commencement communications pursuant to Rule 14d-2(b) under the Exchange Act (17 CFR 240.14d-2(b)) |
¨ | Pre-commencement communications pursuant to Rule 13e-4(c) under the Exchange Act (17 CFR 240.13e-4(c)) |
SEACOAST BANKING CORPORATION OF FLORIDA
Item 2.02 | Results of Operations and Financial Condition |
On January 29, 2014, the Seacoast Banking Corporation of Florida (“Seacoast” or the “Company”) announced its financial results for the fourth quarter and year ended December 31, 2013.
A copy of the press release announcing Seacoast’s results for the fourth quarter and year ended December 31, 2013 is attached hereto as Exhibit 99.1 and incorporated herein by reference.
Item 7.01 | Regulation FD Disclosure |
On January 30, 2014, Seacoast held an investor conference call to discuss its financial results for the fourth quarter and year ended December 31, 2013. A transcript of this conference call is attached hereto as Exhibit 99.2 and incorporated herein by reference. Also attached as Exhibit 99.3 are charts (available on the Company’s website at www.seacoastbanking.net) containing information used in the conference call and incorporated herein by reference. All information included in the transcript and the charts is presented as of December 31, 2013, and the Company does not assume any obligation to correct or update said information in the future.
The information in Items 2.02 and 7.01, as well as Exhibits 99.1, 99.2 and 99.3, is being furnished and shall not be deemed “filed” for purposes of Section 18 of the Securities Exchange Act of 1934, nor shall it be deemed incorporated by reference in any filing under the Securities Act of 1933.
Page 1 of 5 |
Item 9.01 | Financial Statements and Exhibits |
(d) Exhibits
Exhibit | ||
No. | Description | |
99.1 | Press Release dated January 29, 2014 with respect to Seacoast’s financial results for the fourth quarter and year ended December 31, 2013 | |
99.2 | Transcript of Seacoast’s investor conference call held on January 30, 2014 to discuss the Company’s financial results for the fourth quarter and year ended December 31, 2013 | |
99.3 | Data on website containing information used in the conference call held on January 30, 2014 |
Exhibits 99.1, 99.2 and 99.3 referenced herein contain “forward-looking statements” within the meaning of Section 27A of the Securities Act of 1933 and Section 21E of the Securities Exchange Act of 1934, including, without limitation, statements about future financial and operating results, ability to realized deferred tax assets, cost savings, enhanced revenues, economic and seasonal conditions in our markets, and improvements to reported earnings that may be realized from cost controls and for integration of banks that we have acquired, as well as statements with respect to Seacoast’s objectives, expectations and intentions and other statements that are not historical facts. Actual results may differ from those set forth in the forward-looking statements.
Forward-looking statements include statements with respect to our beliefs, plans, objectives, goals, expectations, anticipations, estimates and intentions, and involve known and unknown risks, uncertainties and other factors, which may be beyond our control, and which may cause the actual results, performance or achievements of Seacoast to be materially different from future results, performance or achievements expressed or implied by such forward-looking statements. You should not expect us to update any forward-looking statements.
Page 2 of 5 |
You can identify these forward-looking statements through our use of words such as “may,” “will,” “anticipate,” “assume,” “should,” “support”, “indicate,” “would,” “believe,” “contemplate,” “expect,” “estimate,” “continue,” “further”, “point to,” “project,” “could,” “intend” or other similar words and expressions of the future. These forward-looking statements may not be realized due to a variety of factors, including, without limitation: the effects of future economic and market conditions, including seasonality; governmental monetary and fiscal policies, as well as legislative, tax and regulatory changes; changes in accounting policies, rules and practices; the risks of changes in interest rates on the level and composition of deposits, loan demand, liquidity and the values of loan collateral, securities, and interest sensitive assets and liabilities; interest rate risks, sensitivities and the shape of the yield curve; the effects of competition from other commercial banks, thrifts, mortgage banking firms, consumer finance companies, credit unions, securities brokerage firms, insurance companies, money market and other mutual funds and other financial institutions operating in our market areas and elsewhere, including institutions operating regionally, nationally and internationally, together with such competitors offering banking products and services by mail, telephone, computer and the Internet; and the failure of assumptions underlying the establishment of reserves for possible loan losses. The risks of mergers and acquisitions, include, without limitation: unexpected transaction costs, including the costs of integrating operations; the risks that the businesses will not be integrated successfully or that such integration may be more difficult, time-consuming or costly than expected; the potential failure to fully or timely realize expected revenues and revenue synergies, including as the result of revenues following the merger being lower than expected; the risk of deposit and customer attrition; any changes in deposit mix; unexpected operating and other costs, which may differ or change from expectations; the risks of customer and employee loss and business disruption, including, without limitation, as the result of difficulties in maintaining relationships with employees; increased competitive pressures and solicitations of customers by competitors; as well as the difficulties and risks inherent with entering new markets.
All written or oral forward-looking statements attributable to us are expressly qualified in their entirety by this cautionary notice, including, without limitation, those risks and uncertainties described in our annual report on Form 10-K for the year ended December 31, 2012 under “Special Cautionary Notice Regarding Forward-Looking Statements” and “Risk Factors”, and otherwise in our SEC reports and filings. Such reports are available upon request from the Company, or from the Securities and Exchange Commission, including through the SEC’s Internet website at http://www.sec.gov.
Page 3 of 5 |
SIGNATURES
Pursuant to the requirements of the Securities Exchange Act of 1934, the registrant has duly caused this report to be signed on its behalf by the undersigned hereunto duly authorized.
SEACOAST BANKING CORPORATION OF FLORIDA | ||
(Registrant) | ||
Date: February 3, 2014 | By: | /s/ Dennis S. Hudson, III |
Dennis S. Hudson, II | ||
Chairman and Chief Executive Officer |
Page 4 of 5 |
EXHIBIT 99.1
To Form 8-K dated January 29, 2014
NEWS RELEASE
SEACOAST BANKING CORPORATION OF FLORIDA
Dennis S. Hudson, III
Chairman and Chief Executive Officer
Seacoast Banking Corporation of Florida
(772) 288-6085
William R. Hahl
Executive Vice President/
Chief Financial Officer
(772) 221-2825
SEACOAST REPORTS EARNINGS FOR FOURTH QUARTER AND YEAR 2013
· | Net income for the year totaled $52.0 million, including income tax benefit of $40.4 million from reversal of deferred tax asset allowance |
· | Pretax income was $3.1 million for the quarter compared to $240,000 in 2012 and $3.5 million in the prior quarter |
· | Loan originations up 18.8 percent for the year and totaled $563 million |
STUART, FL., January 29, 2014 – Seacoast Banking Corporation of Florida (NASDAQ-NMS: SBCF), today reported fourth quarter 2013 net income of $1,850,000 compared to $240,000 for the same quarter last year. Net income available to common shareholders for the quarter totaled $588,000 or $0.03 per diluted common share, compared with a net loss of $(697,000) or $(0.04) per diluted common share for 2012. Net income available to common shareholders for the year totaled $47.9 million or $2.44 per diluted common share, compared with a net loss of $(4.5) million or $(0.24) per diluted common share for 2012.
- continued - |
Pretax earnings for the quarter and the year were substantially improved over the prior year due to our ongoing investments in loan production personnel, digital technologies and the effects of asset quality improvements and expense management. During 2013 we reduced our total noninterest expense structure by $7.4 million or 9.0 percent while also absorbing increases in core operating expenses totaling approximately $3.7 million related to new investments including (5) new Accelerate business offices in Ft. Lauderdale, Boca Raton and Orlando as well as costs associated with faster customer adoption of our digital product offerings. Revenue growth continued to improve throughout the year as our new investments began to produce results and our legacy franchise experienced continued organic growth.
When compared with the prior quarter, pretax earnings fell 11 percent due to the recovery of interest income from a nonaccrual loan which was recovered and disclosed in the prior quarter, lower mortgage banking fees, additional investments in production personnel and year end incentive adjustments related to higher than expected production for 2013. Additional cost reductions totaling approximately $1.2 million are being implemented in first quarter 2014 and include expenses related to slower growth expected for mortgage production in 2014.
The Company’s $50 million in outstanding Series A Preferred Stock was redeemed in full at year end which will increase net income available to common shareholders in 2014 and beyond. During the fourth quarter the Company also successfully raised $75 million in common equity. “These actions taken together with last quarter’s recapture of our deferred tax asset strengthened capital levels, improved the quality of our capital structure and were key objectives accomplished to support our strategic growth objectives going forward,” said Dennis S. Hudson, III, Chief Executive Officer.
- continued - |
Revenue initiatives continue to produce results
· | Noninterest income (excluding securities gains) increased by 13.4 percent for the year and 6.4 percent for the quarter in spite of lower mortgage banking fees |
· | Ending net loan balances up 6.4 percent compared to a year ago |
· | Noninterest income to total revenue at year end increased to 27.2 percent compared to 24.9 percent a year ago |
Expense reduction objectives for 2013 were accomplished while providing significant investments in growth initiatives
· | Total noninterest expenses down $7.4 million or 9.0 percent |
· | Total core expenses down $2.7 million or 3.5 percent |
· | New investment spend (core operating expenses) totaled approximately $3.7 million for the year primarily related to revenue related personnel and build out of our digital product suite |
Investments in loan production personnel producing results
· | Loan production for the year totaled $563 million, up 18.8 percent compared to 2012 |
· | Much stronger commercial production of $200 million for the year, up 80 percent or $89 million compared to 2012 |
· | Residential loan production grew at a slower pace compared to 2012 and totaled $251 million for the year |
- continued - |
We will continue to refine and expand our investments in our existing growth initiatives while we implement other initiatives to support continued earnings growth in 2014 and beyond.
Over the last several years, our focused tactical initiatives have produced strong organic core customer deposit account growth and increased core customer funding. Transaction accounts (demand deposits and NOW accounts) surpassed $1 billion for the first time ever this quarter. Core customer funding totaled $1.7 billion at December 31, 2013, up $101.4 million from last year’s fourth quarter and up 21.1 percent since the fourth quarter 2011. In addition, deposit mix continued to improve with noninterest bearing deposits nearly 26 percent of total deposits at year end 2013 and transaction accounts increasing to over 55 percent of deposits.
(Dollars in thousands) | Fourth Quarter 2013 | Fourth Quarter 2012 | Fourth Quarter 2011 | 2013 vs 2012 Change | 2013 vs 2011 Change | |||||||||||||||
Customer Relationship Funding | ||||||||||||||||||||
Demand deposits (noninterest bearing) | $ | 464,006 | $ | 422,833 | $ | 328,356 | 9.7 | % | 41.3 | % | ||||||||||
NOW | 540,288 | 509,371 | 469,631 | 6.1 | 15.0 | |||||||||||||||
Money market accounts | 331,184 | 343,915 | 319,152 | (3.7 | ) | 3.8 | ||||||||||||||
Savings deposits | 192,491 | 164,956 | 133,578 | 16.7 | 44.1 | |||||||||||||||
Time certificates of deposit | 278,076 | 317,886 | 468,024 | (12.5 | ) | (40.6 | ) | |||||||||||||
Total deposits | 1,806,045 | 1,758,961 | 1,718,741 | 2.7 | 5.1 | |||||||||||||||
Sweep repurchase agreements | 151,310 | 136,803 | 136,252 | 10.6 | 11.1 | |||||||||||||||
Total core customer funding (1) | 1,679,279 | 1,577,878 | 1,386,969 | 6.4 | 21.1 | |||||||||||||||
Demand deposit mix (noninterest bearing) | 25.7 | % | 24.0 | % | 19.1 | % |
(1) Total deposits and sweep repurchase agreements, excluding certificates of deposits.
- continued - |
Additional growth highlights for fourth quarter 2013:
· | Interchange fees and service charges on deposit accounts grew by 20.5 percent and 6.0 percent, respectively, compared to last year’s fourth quarter; |
· | Wealth management fees totaled $1.2 million for the fourth quarter, up $270,000 or 30.5 percent compared to a year ago; |
· | Net interest income totaled $16.3 million compared to $16.2 million a year ago and was lower than the linked quarter as a result of a $505,000 recovery of interest income related to nonaccrual loans in the third quarter 2013; and |
· | While annual mortgage banking fees increased in 2013 by $463,000 or 12.5 percent compared to a year ago, mortgage fees were $302,000 lower compared to one year earlier and $347,000 lower compared to the prior quarter, as a result of higher interest rates. |
The following details noninterest income for the fourth quarter ended December 31, 2013 compared to the last four quarters:
(Dollars in thousands) | Fourth Quarter 2013 | Third Quarter 2013 | Second Quarter 2013 | First Quarter 2013 | Fourth Quarter 2012 | |||||||||||||||
Service charges on deposit accounts | $ | 1,778 | $ | 1,741 | $ | 1,641 | $ | 1,551 | $ | 1,677 | ||||||||||
Trust income | 693 | 667 | 675 | 676 | 592 | |||||||||||||||
Mortgage banking fees | 728 | 1,075 | 1,256 | 1,114 | 1,030 | |||||||||||||||
Brokerage commissions and fees | 461 | 383 | 362 | 425 | 292 | |||||||||||||||
Marine finance fees | 215 | 283 | 419 | 272 | 258 | |||||||||||||||
Interchange income | 1,394 | 1,358 | 1,388 | 1,264 | 1,157 | |||||||||||||||
Other deposit based EFT fees | 80 | 77 | 87 | 98 | 83 | |||||||||||||||
Other | 617 | 503 | 507 | 531 | 520 | |||||||||||||||
Total | 5,966 | 6,087 | 6,335 | 5,931 | 5,609 | |||||||||||||||
Loss on sale of commercial loan held for sale | 0 | 0 | 0 | 0 | (1,238 | ) | ||||||||||||||
Securities gains, net | 0 | 280 | 114 | 25 | 582 | |||||||||||||||
$ | 5,966 | $ | 6,367 | $ | 6,449 | $ | 5,956 | $ | 4,953 |
- continued - |
Credit Quality Improves to Pre-Crisis Levels
· | Net charge-offs totaled 0.26 percent of average loans for fourth quarter, compared to 0.69 percent a year ago; |
· | Annual net charge-offs to average loans of 0.41 percent for 2013 was down 75 basis points compared to 2012; |
· | Net loss on other real estate owned and repossessed assets at December 31, 2013 declined $2.2 million from December 31, 2012 as other real estate owned was reduced by $5.0 million or 42.3 percent from 2012; |
· | Restructured loans reduced to $25.1 million, down $16.8 million compared to a year ago; |
· | Nonperforming loans totaled 2.12 percent of loans, compared with 2.27 percent last quarter and 3.34 percent one year ago; and |
· | Nonperforming assets to total assets declined to 1.52 percent, compared to 2.43 percent a year ago. |
- continued - |
(Dollars in thousands ) | Fourth Quarter 2013 | Third Quarter 2013 | Second Quarter 2013 | First Quarter 2013 | Fourth Quarter 2012 | |||||||||||||||
Net charge-offs (recoveries) | $ | 838 | $ | 842 | $ | 2,027 | $ | 1,517 | $ | 2,151 | ||||||||||
Net charge-offs (recoveries) to average loans | 0.26 | % | 0.26 | % | 0.64 | % | 0.49 | % | 0.69 | % | ||||||||||
Loan loss provision | $ | 490 | $ | 1,180 | $ | 565 | $ | 953 | $ | 1,136 | ||||||||||
Allowance to loans at end of period | 1.54 | % | 1.62 | % | 1.59 | % | 1.76 | % | 1.80 | % | ||||||||||
Restructured loans (accruing) | $ | 25,137 | $ | 25,509 | $ | 29,612 | $ | 41,170 | $ | 41,946 | ||||||||||
Nonperforming loans | $ | 27,672 | $ | 28,724 | $ | 33,266 | $ | 35,208 | $ | 40,955 | ||||||||||
Other real estate owned | 6,860 | 5,589 | 10,063 | 10,850 | 11,887 | |||||||||||||||
Nonperforming assets | $ | 34,532 | $ | 34,313 | $ | 43,329 | $ | 46,058 | $ | 52,842 | ||||||||||
Nonperforming loans to loans outstanding at end of period | 2.12 | % | 2.27 | % | 2.63 | % | 2.88 | % | 3.34 | % | ||||||||||
Nonperforming assets to total assets | 1.52 | 1.60 | 1.98 | 2.09 | 2.43 |
Noninterest Expenses
Total noninterest expenses fell by $1.1 million or 5.8 percent for the fourth quarter compared with the prior year. Contributing to the decline were lower expenses related to OREO and other asset disposition costs as overall asset quality continued to improve as well as reduced core operating expenses. Core operating expenses for the quarter were reduced by $311,000 or 1.6 percent compared with the prior year and were down $2.7 million or 3.5 percent annually compared to 2012. One time expenses for employee incentives of $203,000 unfavorably impacted core operating expenses.
- continued - |
Noninterest expenses for the fourth quarter 2013 are presented below compared to the prior four quarters:
(Dollars in thousands) | Fourth Quarter 2013 | Third Quarter 2013 | Second Quarter 2013 | First Quarter 2013 | Fourth Quarter 2012 | |||||||||||||||
Noninterest Expense: | ||||||||||||||||||||
Salaries and wages | $ | 8,077 | $ | 7,533 | $ | 7,892 | $ | 7,437 | $ | 7,258 | ||||||||||
Employee benefits | 1,568 | 1,713 | 1,823 | 2,223 | 1,860 | |||||||||||||||
Outsourced data processing costs | 1,586 | 1,657 | 1,631 | 1,498 | 1,904 | |||||||||||||||
Telephone / data lines | 325 | 318 | 325 | 285 | 293 | |||||||||||||||
Occupancy expense | 1,824 | 1,824 | 1,775 | 1,755 | 1,896 | |||||||||||||||
Furniture and equipment expense | 597 | 605 | 571 | 561 | 585 | |||||||||||||||
Marketing expense | 749 | 456 | 685 | 449 | 707 | |||||||||||||||
Legal and professional fees | 839 | 874 | 949 | 796 | 1,114 | |||||||||||||||
FDIC assessments | 451 | 713 | 720 | 717 | 697 | |||||||||||||||
Amortization of intangibles | 196 | 195 | 197 | 195 | 195 | |||||||||||||||
Other | 2,414 | 2,203 | 2,512 | 2,153 | 2,428 | |||||||||||||||
Total Core Operating Expense | 18,626 | 18,091 | 19,080 | 18,069 | 18,937 | |||||||||||||||
Severance and organizational changes | 0 | 24 | 10 | 33 | 84 | |||||||||||||||
Branch consolidation | 0 | 0 | 0 | 0 | 407 | |||||||||||||||
Miscellaneous Losses | 190 | 0 | 0 | 0 | 0 | |||||||||||||||
Recovery of prior legal fees | (350 | ) | 0 | (650 | ) | 0 | 0 | |||||||||||||
Net loss on OREO and repossessed assets | 0 | 229 | 493 | 567 | 157 | |||||||||||||||
Asset dispositions expense | 180 | 159 | 111 | 290 | 200 | |||||||||||||||
Total | $ | 18,646 | $ | 18,503 | $ | 19,044 | $ | 18,959 | $ | 19,785 |
- continued - |
Investments in new channels and digital technology
Over the past year, we redeployed a portion of our overhead savings to build out new delivery channels. We also added loan production personnel and implemented and promoted new digital products while simultaneously reducing overall operating expenses. During 2013 we incurred substantial core operating expenses associated with investment in our new Accelerate business banking channel. Through the implementation of five Accelerate locations, we continued to focus on reaching our customers in unique ways, creating a path to achieve higher customer satisfaction. The Accelerate model focuses on providing our customers with talented, results oriented staff, specializing in the small business market segment. From their tenure and market experience, our bankers are familiar with the multitude of challenges our small business customers face in their lives. This strategy allows Seacoast to build customer relationships with depth that surpasses traditional commercial lending, and opens opportunities into other areas in which we provide services. Annual salaries and benefits added to our lending and credit support teams (including the Accelerate business channel) during 2013 and each of the past two years are presented in the table below:
Annual Salaries and Benefits Added to Lending and Credit Support Teams
Year-end | ||||||||||||||||
(Dollars in thousands) | 2013 | 2012 | 2011 | Total | ||||||||||||
Loan production and support personnel: | ||||||||||||||||
Commercial | $ | 2,254 | $ | 2,065 | $ | 527 | ||||||||||
Residential | 487 | 396 | 248 | |||||||||||||
$ | 2,741 | $ | 2,461 | $ | 775 | $ | 5,977 |
As indicated in the table below, total commercial loan originations for the fourth quarter totaled nearly $60 million as a result of the investments in the Accelerate business channel and other revenue producing personnel. Also included in the table below, are the salaries and benefits associated with new commercial loan officers and credit support personnel with tenures of six months or less for each quarter of 2013 and the final quarter of 2012. These costs are included in core operating expenses, are significant, and are considered investments that impact our efficiency in the short run.
- continued - |
(Dollars in thousands) | Fourth Quarter 2013 | Third Quarter 2013 | Second Quarter 2013 | First Quarter 2013 | Fourth Quarter 2012 | |||||||||||||||
Commercial pipeline | $ | 27,830 | $ | 54,600 | $ | 46,850 | $ | 63,842 | $ | 26,809 | ||||||||||
Commercial loans closed | $ | 59,775 | 32,988 | 68,388 | 36,973 | 49,190 | ||||||||||||||
Total loan originations and pipeline | $ | 87,605 | $ | 87,588 | $ | 115,238 | $ | 100,815 | $ | 75,999 | ||||||||||
Salaries and benefits, lenders and support personnel < six months | $ | 440 | $ | 553 | $ | 585 | $ | 538 | $ | 345 | ||||||||||
Total revenues, excluding securities gains and loss on sale of commercial loan | $ | 22,243 | $ | 22,902 | $ | 22,449 | $ | 21,931 | $ | 21,817 |
Our successful customer growth strategy has included investments in digital delivery and products we believe have contributed to increasing core customer funding. As of December 31, 2013, nearly 43 percent of our online customers have adopted our mobile product offerings. Our mobile users grew by over 90 percent during 2013. We are concentrating on building a more integrated distribution system which will allow us to reduce our fixed costs as we further invest in technology designed to better serve our customers.
The Company’s tier 1 capital ratio was 15.6 percent and the total risk based capital ratio was 16.9 percent at December 31, 2013. The tier 1 leverage ratio was 9.6 percent at December 31, 2013, reflecting the reversal of the deferred tax valuation allowance in the prior quarter and the sale of $50 million of common equity this quarter. The Company closed on the sale of an additional $25 million in common equity in January 2014 which further strengthens our capital ratios.
Seacoast will host a conference call on Thursday, January 30, 2014 at 10:00 a.m. (Eastern Time) to discuss the earnings results and business trends. Investors may call in (toll-free) by dialing (888) 517-2458 (passcode: 7789246; host: Dennis S. Hudson). Charts will be used during the conference call and may be accessed at Seacoast’s website at SeacoastBanking.net by selecting “Presentations” under the heading “Investor Services”. A replay of the call will be available for one month, beginning the afternoon of January 30, by dialing (888) 843-7419 (domestic), using the passcode 7789246.
- continued - |
Alternatively, individuals may listen to the live webcast of the presentation by visiting Seacoast’s website at SeacoastBanking.net. The link is located in the subsection “Presentations” under the heading “Investor Services”. Beginning the afternoon of January 30, an archived version of the webcast can be accessed from this same subsection of the website. The archived webcast will be available for one year.
Seacoast Banking Corporation of Florida is one of the largest community banks headquartered in Florida with approximately $2.3 billion in assets and $1.8 billion in deposits as of December 31, 2013. The Company provides integrated financial services including commercial and retail banking, wealth management, and mortgage services to customers through 34 traditional branches of its locally-branded wholly-owned subsidiary bank, Seacoast National Bank, and five Accelerate offices fueled by the power of Seacoast National Bank. Offices stretch from Broward County north through the Treasure Coast and into Orlando, and west to Okeechobee and surrounding counties.
Cautionary Notice Regarding Forward-Looking Statements
This press release contains “forward-looking statements” within the meaning of Section 27A of the Securities Act of 1933 and Section 21E of the Securities Exchange Act of 1934, including, without limitation, statements about future financial and operating results, ability to realized deferred tax assets, cost savings, enhanced revenues, economic and seasonal conditions in our markets, and improvements to reported earnings that may be realized from cost controls and for integration of banks that we have acquired, as well as statements with respect to Seacoast’s objectives, expectations and intentions and other statements that are not historical facts. Actual results may differ from those set forth in the forward-looking statements.
- continued - |
Forward-looking statements include statements with respect to our beliefs, plans, objectives, goals, expectations, anticipations, estimates and intentions, and involve known and unknown risks, uncertainties and other factors, which may be beyond our control, and which may cause the actual results, performance or achievements of Seacoast to be materially different from future results, performance or achievements expressed or implied by such forward-looking statements. You should not expect us to update any forward-looking statements.
You can identify these forward-looking statements through our use of words such as “may,” “will,” “anticipate,” “assume,” “should,” “support”, “indicate,” “would,” “believe,” “contemplate,” “expect,” “estimate,” “continue,” “further”, “point to,” “project,” “could,” “intend” or other similar words and expressions of the future. These forward-looking statements may not be realized due to a variety of factors, including, without limitation: the effects of future economic and market conditions, including seasonality; governmental monetary and fiscal policies, as well as legislative, tax and regulatory changes; changes in accounting policies, rules and practices; the risks of changes in interest rates on the level and composition of deposits, loan demand, liquidity and the values of loan collateral, securities, and interest sensitive assets and liabilities; interest rate risks, sensitivities and the shape of the yield curve; the effects of competition from other commercial banks, thrifts, mortgage banking firms, consumer finance companies, credit unions, securities brokerage firms, insurance companies, money market and other mutual funds and other financial institutions operating in our market areas and elsewhere, including institutions operating regionally, nationally and internationally, together with such competitors offering banking products and services by mail, telephone, computer and the Internet; and the failure of assumptions underlying the establishment of reserves for possible loan losses. The risks of mergers and acquisitions, include, without limitation: unexpected transaction costs, including the costs of integrating operations; the risks that the businesses will not be integrated successfully or that such integration may be more difficult, time-consuming or costly than expected; the potential failure to fully or timely realize expected revenues and revenue synergies, including as the result of revenues following the merger being lower than expected; the risk of deposit and customer attrition; any changes in deposit mix; unexpected operating and other costs, which may differ or change from expectations; the risks of customer and employee loss and business disruption, including, without limitation, as the result of difficulties in maintaining relationships with employees; increased competitive pressures and solicitations of customers by competitors; as well as the difficulties and risks inherent with entering new markets.
All written or oral forward-looking statements attributable to us are expressly qualified in their entirety by this cautionary notice, including, without limitation, those risks and uncertainties described in our annual report on Form 10-K for the year ended December 31, 2012 under “Special Cautionary Notice Regarding Forward-Looking Statements” and “Risk Factors”, and otherwise in our SEC reports and filings. Such reports are available upon request from the Company, or from the Securities and Exchange Commission, including through the SEC’s Internet website at http://www.sec.gov.
FINANCIAL HIGHLIGHTS | (Unaudited) |
SEACOAST BANKING CORPORATION OF FLORIDA AND SUBSIDIARIES |
(Dollars in thousands, except share data) | Three Months Ended | Twelve Months Ended | ||||||||||||||||||
December 31, | September 30, | December 31, | December 31, | December 31, | ||||||||||||||||
2013 | 2013 | 2012 | 2013 | 2012 | ||||||||||||||||
Summary of Earnings | ||||||||||||||||||||
Net income (loss) | $ | 1,850 | $ | 45,141 | $ | 240 | $ | 51,989 | $ | (710 | ) | |||||||||
Net income available to common shareholders (loss) | 588 | 44,204 | (697 | ) | 47,916 | (4,458 | ) | |||||||||||||
Net interest income (1) | 16,336 | 16,872 | 16,254 | 65,435 | 64,990 | |||||||||||||||
Net interest margin (1), (2) | 3.08 | 3.25 | 3.22 | 3.13 | 3.22 | |||||||||||||||
Performance Ratios | ||||||||||||||||||||
Return on average assets-GAAP basis (2), (3), (5) | 0.33 | % | 8.32 | % | 0.05 | % | 2.38 | % | (0.03 | )% | ||||||||||
Return on average shareholders' equity-GAAP basis (2), (3), (5) | 3.10 | 106.55 | 0.58 | 28.36 | (0.01 | ) | ||||||||||||||
Return on average tangible common shareholders' equity-GAAP basis (2), (3), (4) | 3.32 | 152.80 | 0.07 | 28.81 | (0.43 | ) | ||||||||||||||
Efficiency ratio (6) | 81.92 | 78.05 | 87.97 | 80.60 | 88.89 | |||||||||||||||
Noninterest income to total revenue | 26.82 | 26.58 | 25.71 | 27.16 | 24.86 | |||||||||||||||
Per Share Data | ||||||||||||||||||||
Net income (loss) diluted-GAAP basis (7) | $ | 0.03 | $ | 2.31 | $ | (0.04 | ) | $ | 2.44 | $ | (0.24 | ) | ||||||||
Net income (loss) basic-GAAP basis (7) | 0.03 | 2.35 | (0.04 | ) | 2.46 | (0.24 | ) | |||||||||||||
Book value per share common (7) | 8.40 | 8.12 | 6.16 | 8.40 | 6.16 | |||||||||||||||
Tangible book value per share (7) | 8.37 | 10.69 | 8.65 | 8.37 | 8.65 | |||||||||||||||
Tangible common book value per share (4), (7) | 8.37 | 8.07 | 6.08 | 8.37 | 6.08 | |||||||||||||||
Cash dividends declared | 0.00 | 0.00 | 0.00 | 0.00 | 0.00 |
(1) | Calculated on a fully taxable equivalent basis using amortized cost. |
(2) | These ratios are stated on an annualized basis and are not necessarily indicative of future periods. |
(3) | The calculation of ROA and ROE do not include the mark-to-market unrealized gains (losses) because the unrealized gains (losses) are not included in net income (loss). |
(4) | The Company defines tangible common equity as total shareholders equity less preferred stock and intangible assets. |
5) | Excluding the income tax benefit related to the reversal of the valuation allowance for deferred tax assets and reflecting tax provisioning of $1,351 for the third quarter 2013 and $4,555 for the total year 2013, adjusted return on average assets for these periods was 0.40 percent and 0.32 percent, respectively, and adjusted return on average shareholders' equity was 5.07 percent and 3.85 percent, respectively. |
(6) | Defined as (non-interest expense less foreclosed property expense and amortization of intangibles) divided by net operating revenue (net interest income on a fully taxable equivalent basis plus non-interest income excluding securities gains). |
(7) | Calculated based on total shares outstanding subsequent to the 5/1 reverse stock split. |
FINANCIAL HIGHLIGHTS |
SEACOAST BANKING CORPORATION OF FLORIDA AND SUBSIDIARIES |
December 31, | September 30, | December 31, | ||||||||||
(Dollars in thousands, except share data) | 2013 | 2013 | 2012 | |||||||||
Selected Financial Data | ||||||||||||
Total assets | $ | 2,268,940 | $ | 2,149,777 | $ | 2,173,929 | ||||||
Securities available for sale (at fair value) | 641,611 | 650,445 | 643,050 | |||||||||
Securities held for investment (at amortized cost) | 0 | 0 | 13,818 | |||||||||
Net loans | 1,284,139 | 1,242,496 | 1,203,977 | |||||||||
Deposits | 1,806,045 | 1,698,910 | 1,758,961 | |||||||||
Total shareholders' equity | 198,604 | 203,858 | 165,546 | |||||||||
Common shareholders' equity | 198,604 | 154,175 | 116,800 | |||||||||
Average Balances (Year-to-Date) | ||||||||||||
Total average assets | $ | 2,186,757 | $ | 2,167,077 | $ | 2,117,075 | ||||||
Less: intangible assets | 1,104 | 1,202 | 1,889 | |||||||||
Total average tangible assets | $ | 2,185,653 | $ | 2,165,875 | $ | 2,115,186 | ||||||
Total average equity | $ | 183,304 | $ | 165,226 | $ | 165,381 | ||||||
Less: intangible assets | 1,104 | 1,202 | 1,889 | |||||||||
Total average tangible equity | $ | 182,200 | $ | 164,024 | $ | 163,492 | ||||||
Credit Analysis | ||||||||||||
Net charge-offs year-to-date | $ | 5,224 | $ | 4,386 | $ | 14,257 | ||||||
Net charge-offs to average loans (annualized) | 0.41 | % | 0.46 | % | 1.16 | % | ||||||
Loan loss provision year-to-date | $ | 3,188 | $ | 2,698 | $ | 10,796 | ||||||
Allowance to loans at end of period | 1.54 | % | 1.62 | % | 1.80 | % | ||||||
Nonperforming loans | $ | 27,672 | $ | 28,724 | $ | 40,955 | ||||||
Other real estate owned | 6,860 | 5,589 | 11,887 | |||||||||
Total nonperforming assets | $ | 34,532 | $ | 34,313 | $ | 52,842 | ||||||
Restructured loans (accruing) | $ | 25,137 | $ | 25,509 | $ | 41,946 | ||||||
Nonperforming loans to loans at end of period | 2.12 | % | 2.27 | % | 3.34 | % | ||||||
Nonperforming assets to total assets | 1.52 | % | 1.60 | % | 2.43 | % |
CONDENSED CONSOLIDATED STATEMENTS OF INCOME | (Unaudited) |
SEACOAST BANKING CORPORATION OF FLORIDA AND SUBSIDIARIES |
Three Months Ended | Twelve Months Ended | |||||||||||||||
December 31, | December 31, | |||||||||||||||
(Dollars in thousands, except per share data) | 2013 | 2012 | 2013 | 2012 | ||||||||||||
Interest on securities: | ||||||||||||||||
Taxable | $ | 3,452 | $ | 3,130 | $ | 12,856 | $ | 13,964 | ||||||||
Nontaxable | 16 | 12 | 68 | 80 | ||||||||||||
Interest and fees on loans | 13,924 | 14,438 | 56,971 | 58,290 | ||||||||||||
Interest on federal funds sold and other investments | 224 | 226 | 868 | 953 | ||||||||||||
Total Interest Income | 17,616 | 17,806 | 70,763 | 73,287 | ||||||||||||
Interest on deposits | 196 | 275 | 782 | 1,522 | ||||||||||||
Interest on time certificates | 444 | 598 | 1,947 | 3,969 | ||||||||||||
Interest on borrowed money | 699 | 725 | 2,828 | 2,987 | ||||||||||||
Total Interest Expense | 1,339 | 1,598 | 5,557 | 8,478 | ||||||||||||
Net Interest Income | 16,277 | 16,208 | 65,206 | 64,809 | ||||||||||||
Provision for loan losses | 490 | 1,136 | 3,188 | 10,796 | ||||||||||||
Net Interest Income After Provision for Loan Losses | 15,787 | 15,072 | 62,018 | 54,013 | ||||||||||||
Noninterest income: | ||||||||||||||||
Service charges on deposit accounts | 1,778 | 1,677 | 6,711 | 6,245 | ||||||||||||
Trust income | 693 | 592 | 2,711 | 2,279 | ||||||||||||
Mortgage banking fees | 728 | 1,030 | 4,173 | 3,710 | ||||||||||||
Brokerage commissions and fees | 461 | 292 | 1,631 | 1,071 | ||||||||||||
Marine finance fees | 215 | 258 | 1,189 | 1,111 | ||||||||||||
Interchange income | 1,394 | 1,157 | 5,404 | 4,501 | ||||||||||||
Other deposit based EFT fees | 80 | 83 | 342 | 336 | ||||||||||||
Other | 617 | 520 | 2,158 | 2,191 | ||||||||||||
5,966 | 5,609 | 24,319 | 21,444 | |||||||||||||
Change in fair value of loan held for sale | 0 | (1,238 | ) | 0 | (1,238 | ) | ||||||||||
Securities gains, net | 0 | 582 | 419 | 7,619 | ||||||||||||
Total Noninterest Income | 5,966 | 4,953 | 24,738 | 27,825 | ||||||||||||
Noninterest expenses: | ||||||||||||||||
Salaries and wages | 8,077 | 7,342 | 31,006 | 29,935 | ||||||||||||
Employee benefits | 1,568 | 1,860 | 7,327 | 7,710 | ||||||||||||
Outsourced data processing costs | 1,586 | 1,904 | 6,372 | 7,382 | ||||||||||||
Telephone / data lines | 325 | 293 | 1,253 | 1,178 | ||||||||||||
Occupancy | 1,824 | 2,241 | 7,178 | 8,146 | ||||||||||||
Furniture and equipment | 597 | 647 | 2,334 | 2,319 | ||||||||||||
Marketing | 749 | 707 | 2,339 | 3,095 | ||||||||||||
Legal and professional fees | 489 | 1,114 | 2,458 | 5,241 | ||||||||||||
FDIC assessments | 451 | 697 | 2,601 | 2,805 | ||||||||||||
Amortization of intangibles | 196 | 195 | 783 | 788 | ||||||||||||
Asset dispositions expense | 180 | 200 | 740 | 1,459 | ||||||||||||
Net loss on other real estate owned and repossessed assets | 0 | 157 | 1,289 | 3,467 | ||||||||||||
Other | 2,604 | 2,428 | 9,472 | 9,023 | ||||||||||||
Total Noninterest Expenses | 18,646 | 19,785 | 75,152 | 82,548 | ||||||||||||
Income Before Income Taxes | 3,107 | 240 | 11,604 | (710 | ) | |||||||||||
Income taxes (benefit) | 1,257 | 0 | (40,385 | ) | 0 | |||||||||||
Net Income | 1,850 | 240 | 51,989 | (710 | ) | |||||||||||
Preferred stock dividends and accretion on preferred stock discount | 1,262 | 937 | 4,073 | 3,748 | ||||||||||||
Net Income Available to Common Shareholders | $ | 588 | $ | (697 | ) | $ | 47,916 | $ | (4,458 | ) | ||||||
Per share of common stock: | ||||||||||||||||
Net income diluted | $ | 0.03 | $ | (0.04 | ) | $ | 2.44 | $ | (0.24 | ) | ||||||
Net income basic | 0.03 | (0.04 | ) | 2.46 | (0.24 | ) | ||||||||||
Cash dividends declared | 0.00 | 0.00 | 0.00 | 0.00 | ||||||||||||
Average diluted shares outstanding | 21,558,079 | 18,781,986 | 19,650,005 | 18,748,757 | ||||||||||||
Average basic shares outstanding | 21,386,775 | 18,781,986 | 19,449,560 | 18,748,757 |
CONDENSED CONSOLIDATED BALANCE SHEETS | (Unaudited) |
SEACOAST BANKING CORPORATION OF FLORIDA AND SUBSIDIARIES |
December 31, | December 31, | |||||||
(Dollars in thousands, except share data) | 2013 | 2012 | ||||||
Assets | ||||||||
Cash and due from banks | $ | 48,561 | $ | 45,620 | ||||
Interest bearing deposits with other banks | 143,063 | 129,367 | ||||||
Total Cash and Cash Equivalents | 191,624 | 174,987 | ||||||
Securities: | ||||||||
Available for sale (at fair value) | 641,611 | 643,050 | ||||||
Held for investment (at amortized cost) | 0 | 13,818 | ||||||
Total Securities | 641,611 | 656,868 | ||||||
Loans available for sale | 13,832 | 36,021 | ||||||
Loans, net of deferred costs | 1,304,207 | 1,226,081 | ||||||
Less: Allowance for loan losses | (20,068 | ) | (22,104 | ) | ||||
Net Loans | 1,284,139 | 1,203,977 | ||||||
Bank premises and equipment, net | 34,505 | 34,465 | ||||||
Other real estate owned | 6,860 | 11,887 | ||||||
Other intangible assets | 718 | 1,501 | ||||||
Other assets | 95,651 | 54,223 | ||||||
$ | 2,268,940 | $ | 2,173,929 | |||||
Liabilities and Shareholders' Equity | ||||||||
Liabilities | ||||||||
Deposits | ||||||||
Demand deposits (noninterest bearing) | $ | 464,006 | $ | 422,833 | ||||
NOW | 540,288 | 509,371 | ||||||
Savings deposits | 192,491 | 164,956 | ||||||
Money market accounts | 331,184 | 343,915 | ||||||
Other time certificates | 154,743 | 182,495 | ||||||
Brokered time certificates | 9,776 | 8,203 | ||||||
Time certificates of $100,000 or more | 113,557 | 127,188 | ||||||
Total Deposits | 1,806,045 | 1,758,961 | ||||||
Federal funds purchased and securities sold under agreements to repurchase, maturing within 30 days | 151,310 | 136,803 | ||||||
Borrowed funds | 50,000 | 50,000 | ||||||
Subordinated debt | 53,610 | 53,610 | ||||||
Other liabilities | 9,371 | 9,009 | ||||||
2,070,336 | 2,008,383 | |||||||
Shareholders' Equity | ||||||||
Preferred stock - Series A | 0 | 48,746 | ||||||
Common stock | 2,364 | 1,897 | ||||||
Additional paid in capital | 277,290 | 230,438 | ||||||
Accumulated deficit | (70,695 | ) | (118,611 | ) | ||||
Treasury stock | (11 | ) | (62 | ) | ||||
208,948 | 162,408 | |||||||
Accumulated other comprehensive gain (loss), net | (10,344 | ) | 3,138 | |||||
Total Shareholders' Equity | 198,604 | 165,545 | ||||||
$ | 2,268,940 | $ | 2,173,928 | |||||
Common Shares Outstanding | 23,637,434 | 18,967,434 |
Note: The balance sheet at December 31, 2012 has been derived from the audited financial statements at that date.
CONSOLIDATED QUARTERLY FINANCIAL DATA | (Unaudited) |
SEACOAST BANKING CORPORATION OF FLORIDA AND SUBSIDIARIES |
QUARTERS | ||||||||||||||||||||
2013 | 2012 | |||||||||||||||||||
(Dollars in thousands, except per share data) | Fourth | Third | Second | First | Fourth | |||||||||||||||
Net income (loss) | $ | 1,850 | $ | 45,141 | $ | 2,954 | $ | 2,044 | $ | 240 | ||||||||||
Operating Ratios | ||||||||||||||||||||
Return on average assets-GAAP basis (2),(3), (5) | 0.33 | % | 8.32 | % | 0.54 | % | 0.38 | % | 0.05 | % | ||||||||||
Return on average tangible assets (2),(3),(4) | 0.35 | 8.34 | 0.57 | 0.41 | 0.07 | |||||||||||||||
Return on average shareholders' equity-GAAP basis (2),(3), (5) | 3.10 | 106.55 | 7.19 | 5.09 | 0.58 | |||||||||||||||
Efficiency ratio (6) | 81.92 | 78.05 | 81.05 | 81.45 | 87.97 | |||||||||||||||
Noninterest income to total revenue | 26.82 | 26.58 | 28.22 | 27.04 | 25.71 | |||||||||||||||
Net interest margin (1),(2) | 3.08 | 3.25 | 3.12 | 3.15 | 3.22 | |||||||||||||||
Average equity to average assets | 10.55 | 7.80 | 7.56 | 7.50 | 7.73 | |||||||||||||||
Credit Analysis | ||||||||||||||||||||
Net charge-offs (recoveries) | $ | 838 | $ | 842 | $ | 2,027 | $ | 1,517 | $ | 2,151 | ||||||||||
Net charge-offs to average loans (recoveries) | 0.26 | % | 0.26 | % | 0.64 | % | 0.49 | % | 0.69 | % | ||||||||||
Loan loss provision | $ | 490 | $ | 1,180 | $ | 565 | $ | 953 | $ | 1,136 | ||||||||||
Allowance to loans at end of period | 1.54 | % | 1.62 | % | 1.59 | % | 1.76 | % | 1.80 | % | ||||||||||
Restructured loans (accruing) | $ | 25,137 | $ | 25,509 | $ | 29,612 | $ | 41,170 | $ | 41,946 | ||||||||||
Nonperforming loans | $ | 27,672 | $ | 28,724 | $ | 33,266 | $ | 35,208 | $ | 40,955 | ||||||||||
Other real estate owned | 6,860 | 5,589 | 10,063 | 10,850 | 11,887 | |||||||||||||||
Nonperforming assets | $ | 34,532 | $ | 34,313 | $ | 43,329 | $ | 46,058 | $ | 52,842 | ||||||||||
Nonperforming loans to loans at end of period | 2.12 | % | 2.27 | % | 2.63 | % | 2.88 | % | 3.34 | % | ||||||||||
Nonperforming assets to total assets | 1.52 | 1.60 | 1.98 | 2.09 | 2.43 | |||||||||||||||
Per Share Common Stock | ||||||||||||||||||||
Net income (loss) diluted-GAAP basis | $ | 0.03 | $ | 2.31 | $ | 0.11 | $ | 0.06 | $ | (0.04 | ) | |||||||||
Net income (loss) basic-GAAP basis | 0.03 | 2.35 | 0.11 | 0.06 | $ | (0.04 | ) | |||||||||||||
Cash dividends declared | 0.00 | 0.00 | 0.00 | 0.00 | 0.00 | |||||||||||||||
Book value per share common | 8.40 | 8.12 | 5.89 | 6.20 | 6.16 | |||||||||||||||
Average Balances | ||||||||||||||||||||
Total average assets | $ | 2,245,155 | $ | 2,153,830 | $ | 2,178,242 | $ | 2,169,329 | $ | 2,111,986 | ||||||||||
Less: Intangible assets | 813 | 1,009 | 1,205 | 1,395 | 1,596 | |||||||||||||||
Total average tangible assets | $ | 2,244,342 | $ | 2,152,821 | $ | 2,177,038 | $ | 2,167,934 | $ | 2,110,390 | ||||||||||
Total average equity | $ | 236,950 | $ | 168,078 | $ | 164,747 | $ | 162,795 | $ | 163,341 | ||||||||||
Less: Intangible assets | 813 | 1,009 | 1,205 | 1,395 | 1,596 | |||||||||||||||
Total average tangible equity | $ | 236,137 | $ | 167,069 | $ | 163,541 | $ | 161,400 | $ | 161,745 |
(1) | Calculated on a fully taxable equivalent basis using amortized cost. |
(2) | These ratios are stated on an annualized basis and are not necessarily indicative of future periods. |
(3) | The calculation of ROA and ROE do not include the mark-to-market unrealized gains (losses), because the unrealized gains (losses) are not included in net income (loss). |
(4) | The Company believes that return on average assets and equity excluding the impacts of noncash amortization expense on intangible assets is a better measurement of the Company's trend in earnings growth. |
(5) | Excluding the income tax benfit related to the reversal of the valutaion allowance for deferred tax assets and reflecting tax provisioning of $1,351 for the third quarter 2013, adjusted return on average assets and adjusted return on average shareholders' equity for the third quarter was 0.40 percent and 5.07 percent, respectively. |
(6) | Defined as (non-interest expense less foreclosed property expense and amortization of intangibles) divided by net operating revenue (net interest income on a fully taxable equivalent basis plus non-interest income excluding securities gains). |
December 31, | December 31, | |||||||
SECURITIES | 2013 | 2012 | ||||||
U.S. Treasury and U.S. Government Agencies | $ | 100 | $ | 1,707 | ||||
Mortgage-backed | 602,568 | 640,445 | ||||||
Collateralized loan obligations | 32,179 | 0 | ||||||
Obligations of states and political subdivisions | 6,764 | 898 | ||||||
Securities Available for Sale | 641,611 | 643,050 | ||||||
Mortgage-backed | 0 | 5,965 | ||||||
Obligations of states and political subdivisions | 0 | 6,353 | ||||||
Other securities | 0 | 1,500 | ||||||
Securities Held for Investment (1) | 0 | 13,818 | ||||||
Total Securities | $ | 641,611 | $ | 656,868 |
(1) | Securities Held for Investment were transferred to Securities Available for Sale for more options to manage interest rate risk prospectively. |
December 31, | December 31, | |||||||
LOANS | 2013 | 2012 | ||||||
Construction and land development | $ | 67,450 | $ | 60,736 | ||||
Real estate mortgage | 1,113,128 | 1,056,159 | ||||||
Installment loans to individuals | 44,713 | 46,930 | ||||||
Commercial and financial | 78,636 | 61,903 | ||||||
Other loans | 280 | 353 | ||||||
Total Loans | $ | 1,304,207 | $ | 1,226,081 |
AVERAGE BALANCES | (Unaudited) |
SEACOAST BANKING CORPORATION OF FLORIDA AND SUBSIDIARIES |
QUARTER | Percent Change vs. | |||||||||||||||||||||||||||
2013 | 2012 | 3rd Qtr | 4th Qtr | |||||||||||||||||||||||||
(Dollars in thousands) | Fourth | Third | Second | First | Fourth | 2013 | 2012 | |||||||||||||||||||||
Assets | ||||||||||||||||||||||||||||
Earning assets: | ||||||||||||||||||||||||||||
Securities: | ||||||||||||||||||||||||||||
Taxable | $ | 655,176 | $ | 664,103 | $ | 639,769 | $ | 646,184 | $ | 604,412 | (1.3 | )% | 8.4 | % | ||||||||||||||
Nontaxable | 1,560 | 1,560 | 1,647 | 1,666 | 1,670 | 0.0 | (6.6 | ) | ||||||||||||||||||||
Total Securities | 656,736 | 665,663 | 641,416 | 647,850 | 606,082 | (1.3 | ) | 8.4 | ||||||||||||||||||||
Federal funds sold and other investments | 156,823 | 113,798 | 168,740 | 172,505 | 162,599 | 37.8 | (3.6 | ) | ||||||||||||||||||||
Loans, net | 1,293,373 | 1,278,391 | 1,269,789 | 1,247,666 | 1,241,711 | 1.2 | 4.2 | |||||||||||||||||||||
Total Earning Assets | 2,106,932 | 2,057,852 | 2,079,945 | 2,068,021 | 2,010,392 | 2.4 | 4.8 | |||||||||||||||||||||
Allowance for loan losses | (20,817 | ) | (20,206 | ) | (21,515 | ) | (22,018 | ) | (23,820 | ) | 3.0 | (12.6 | ) | |||||||||||||||
Cash and due from banks | 40,836 | 35,810 | 34,279 | 34,706 | 39,321 | 14.0 | 3.9 | |||||||||||||||||||||
Premises and equipment | 34,750 | 34,834 | 35,121 | 34,516 | 34,566 | (0.2 | ) | 0.5 | ||||||||||||||||||||
Other assets | 83,454 | 45,540 | 50,413 | 54,104 | 51,527 | 83.3 | 62.0 | |||||||||||||||||||||
$ | 2,245,155 | $ | 2,153,830 | $ | 2,178,242 | $ | 2,169,329 | $ | 2,111,986 | 4.2 | 6.3 | |||||||||||||||||
Liabilities and Shareholders' Equity | ||||||||||||||||||||||||||||
Interest-bearing liabilities: | ||||||||||||||||||||||||||||
NOW | $ | 483,569 | $ | 447,350 | $ | 461,005 | $ | 474,915 | $ | 449,476 | 8.1 | % | 7.6 | % | ||||||||||||||
Savings deposits | 190,558 | 185,918 | 180,915 | 170,502 | 161,156 | 2.5 | 18.2 | |||||||||||||||||||||
Money market accounts | 332,576 | 336,229 | 339,058 | 341,833 | 346,089 | (1.1 | ) | (3.9 | ) | |||||||||||||||||||
Time deposits | 282,543 | 289,408 | 302,110 | 311,945 | 330,556 | (2.4 | ) | (14.5 | ) | |||||||||||||||||||
Federal funds purchased and other short term borrowings | 142,999 | 157,607 | 159,847 | 160,600 | 131,628 | (9.3 | ) | 8.6 | ||||||||||||||||||||
Other borrowings | 103,610 | 103,610 | 103,610 | 103,610 | 103,610 | 0.0 | 0.0 | |||||||||||||||||||||
Total Interest-Bearing Liabilities | 1,535,855 | 1,520,122 | 1,546,545 | 1,563,405 | 1,522,515 | 1.0 | 0.9 | |||||||||||||||||||||
Demand deposits (noninterest-bearing) | 462,830 | 454,642 | 455,525 | 433,757 | 416,482 | 1.8 | 11.1 | |||||||||||||||||||||
Other liabilities | 9,520 | 10,988 | 11,426 | 9,372 | 9,648 | (13.4 | ) | (1.3 | ) | |||||||||||||||||||
Total Liabilities | 2,008,205 | 1,985,750 | 2,013,496 | 2,006,534 | 1,948,645 | 1.1 | 3.1 | |||||||||||||||||||||
Shareholders' equity | 236,950 | 168,078 | 164,747 | 162,795 | 163,341 | 41.0 | 45.1 | |||||||||||||||||||||
$ | 2,245,155 | $ | 2,153,830 | $ | 2,178,242 | $ | 2,169,329 | $ | 2,111,986 | 4.2 | 6.3 |
AVERAGE YIELDS / RATES (1) | (Unaudited) |
SEACOAST BANKING CORPORATION OF FLORIDA AND SUBSIDIARIES |
QUARTER | ||||||||||||||||||||
2013 | 2012 | |||||||||||||||||||
(Dollars in thousands) | Fourth | Third | Second | First | Fourth | |||||||||||||||
Assets | ||||||||||||||||||||
Earning assets: | ||||||||||||||||||||
Securities: | ||||||||||||||||||||
Taxable | 2.11 | % | 1.93 | % | 1.88 | % | 1.97 | % | 2.07 | % | ||||||||||
Nontaxable | 6.41 | 6.67 | 6.55 | 6.37 | 4.31 | |||||||||||||||
Total Securities | 2.12 | 1.95 | 1.89 | 1.98 | 2.08 | |||||||||||||||
Federal funds sold and other investments | 0.57 | 0.67 | 0.53 | 0.54 | 0.55 | |||||||||||||||
Loans, net | 4.29 | 4.59 | 4.52 | 4.57 | 4.64 | |||||||||||||||
Total Earning Assets | 3.33 | 3.52 | 3.39 | 3.43 | 3.53 | |||||||||||||||
Liabilities and Shareholders' Equity | ||||||||||||||||||||
Interest-bearing liabilities: | ||||||||||||||||||||
NOW | 0.08 | 0.08 | 0.09 | 0.10 | 0.11 | |||||||||||||||
Savings deposits | 0.05 | 0.05 | 0.05 | 0.06 | 0.09 | |||||||||||||||
Money market accounts | 0.09 | 0.08 | 0.08 | 0.08 | 0.13 | |||||||||||||||
Time deposits | 0.62 | 0.64 | 0.67 | 0.69 | 0.72 | |||||||||||||||
Federal funds purchased and other short term borrowings | 0.17 | 0.17 | 0.18 | 0.21 | 0.23 | |||||||||||||||
Other borrowings | 2.44 | 2.44 | 2.45 | 2.48 | 2.50 | |||||||||||||||
Total Interest-Bearing Liabilities | 0.35 | 0.36 | 0.36 | 0.38 | 0.42 | |||||||||||||||
Interest expense as a % of earning assets | 0.25 | 0.26 | 0.27 | 0.29 | 0.32 | |||||||||||||||
Net interest income as a % of earning assets | 3.08 | 3.25 | 3.12 | 3.15 | 3.22 |
(1) | On a fully taxable equivalent basis. All yields and rates have been computed on an annualized basis using amortized cost. |
Fees | on loans have been included in interest on loans. Nonaccrual loans are included in loan balances. |
INTEREST INCOME / EXPENSE (1) | (Unaudited) |
SEACOAST BANKING CORPORATION OF FLORIDA AND SUBSIDIARIES |
QUARTER | Percent Change vs. | |||||||||||||||||||||||||||
2013 | 2012 | 3rd Qtr | 4th Qtr | |||||||||||||||||||||||||
(Dollars in thousands) | Fourth | Third | Second | First | Fourth | 2013 | 2012 | |||||||||||||||||||||
Assets | ||||||||||||||||||||||||||||
Earning assets: | ||||||||||||||||||||||||||||
Securities: | ||||||||||||||||||||||||||||
Taxable | $ | 3,452 | $ | 3,212 | $ | 3,008 | $ | 3,184 | $ | 3,130 | 7.5 | % | 10.4 | % | ||||||||||||||
Nontaxable | 25 | 26 | 27 | 27 | 19 | (3.8 | ) | 31.6 | ||||||||||||||||||||
Total Securities | 3,477 | 3,238 | 3,035 | 3,211 | 3,149 | 7.4 | 10.4 | |||||||||||||||||||||
Federal funds sold and other investments | 224 | 192 | 224 | 228 | 226 | (16.7 | ) | (0.9 | ) | |||||||||||||||||||
Loans, net | 13,974 | 14,804 | 14,312 | 14,073 | 14,477 | (5.6 | ) | (3.5 | ) | |||||||||||||||||||
Total Earning Assets | 17,675 | 18,234 | 17,571 | 17,512 | 17,852 | (3.1 | ) | (0.9 | ) | |||||||||||||||||||
Liabilities and Shareholders' Equity | ||||||||||||||||||||||||||||
Interest-bearing liabilities: | ||||||||||||||||||||||||||||
NOW | 96 | 93 | 100 | 112 | 128 | 3.3 | (25.0 | ) | ||||||||||||||||||||
Savings deposits | 26 | 25 | 24 | 26 | 36 | 4.0 | (27.8 | ) | ||||||||||||||||||||
Money market accounts | 74 | 69 | 67 | 70 | 111 | 7.2 | (33.3 | ) | ||||||||||||||||||||
Time deposits | 444 | 470 | 501 | 532 | 598 | (5.5 | ) | (25.8 | ) | |||||||||||||||||||
Federal funds purchased and | ||||||||||||||||||||||||||||
other short term borrowings | 62 | 68 | 73 | 83 | 75 | (8.8 | ) | (17.3 | ) | |||||||||||||||||||
Other borrowings | 637 | 637 | 634 | 634 | 650 | (0.0 | ) | (2.0 | ) | |||||||||||||||||||
Total Interest-Bearing Liabilities | 1,339 | 1,362 | 1,399 | 1,457 | 1,598 | (1.7 | ) | (16.2 | ) | |||||||||||||||||||
Net interest income | 16,336 | 16,872 | 16,172 | 16,055 | 16,254 | (3.2 | ) | 0.5 |
(1) On a fully taxable equivalent basis. Fees on loans have been included in interest on loans
CONSOLIDATED QUARTERLY FINANCIAL DATA | (Unaudited) |
SEACOAST BANKING CORPORATION OF FLORIDA AND SUBSIDIARIES |
2013 | 2012 | |||||||||||||||||||
(Dollars in thousands) | Fourth Quarter | Third Quarter | Second Quarter | First Quarter | Fourth Quarter | |||||||||||||||
Customer Relationship Funding (Period End) | ||||||||||||||||||||
Demand deposits (noninterest bearing) | ||||||||||||||||||||
Commercial | $ | 261,938 | $ | 254,373 | $ | 260,325 | $ | 246,849 | $ | 232,413 | ||||||||||
Retail | 159,117 | 155,281 | 163,551 | 167,516 | 153,428 | |||||||||||||||
Public funds | 32,971 | 27,002 | 29,487 | 26,166 | 21,799 | |||||||||||||||
Other | 9,980 | 16,293 | 15,154 | 12,613 | 15,193 | |||||||||||||||
464,006 | 452,949 | 468,517 | 453,144 | 422,833 | ||||||||||||||||
NOW accounts | ||||||||||||||||||||
Commercial | 43,241 | 35,029 | 35,714 | 39,303 | 32,701 | |||||||||||||||
Retail | 324,583 | 305,055 | 308,390 | 307,545 | 308,633 | |||||||||||||||
Public funds | 172,464 | 100,785 | 108,965 | 136,065 | 168,037 | |||||||||||||||
540,288 | 440,869 | 453,069 | 482,913 | 509,371 | ||||||||||||||||
Total Transaction Accounts | ||||||||||||||||||||
Commercial | 305,179 | 289,402 | 296,039 | 286,152 | 265,114 | |||||||||||||||
Retail | 483,700 | 460,336 | 471,941 | 475,061 | 462,061 | |||||||||||||||
Public funds | 205,435 | 127,787 | 138,452 | 162,231 | 189,836 | |||||||||||||||
Other | 9,980 | 16,293 | 15,154 | 12,613 | 15,193 | |||||||||||||||
1,004,294 | 893,818 | 921,586 | 936,057 | 932,204 | ||||||||||||||||
Savings accounts | 192,491 | 187,181 | 184,219 | 177,213 | 164,956 | |||||||||||||||
Money market accounts | ||||||||||||||||||||
Commercial | 100,601 | 107,767 | 109,938 | 111,580 | 114,965 | |||||||||||||||
Retail | 221,062 | 217,176 | 216,370 | 220,555 | 220,601 | |||||||||||||||
Public funds | 9,521 | 9,735 | 9,639 | 9,081 | 8,349 | |||||||||||||||
331,184 | 334,678 | 335,947 | 341,216 | 343,915 | ||||||||||||||||
Time certificates of deposit | 278,076 | 283,233 | 296,857 | 307,678 | 317,886 | |||||||||||||||
Total Deposits | $ | 1,806,045 | $ | 1,698,910 | $ | 1,738,609 | $ | 1,762,164 | $ | 1,758,961 | ||||||||||
Sweep repurchase agreements | $ | 151,310 | $ | 134,338 | $ | 160,934 | $ | 161,678 | $ | 136,803 | ||||||||||
Total core customer funding (1) | $ | 1,679,279 | $ | 1,550,015 | $ | 1,602,686 | $ | 1,616,164 | $ | 1,577,878 |
(1) | Total deposits and sweep repurchase agreements, excluding certificates of deposits. |
QUARTERLY TRENDS - LOANS AT END OF PERIOD (Dollars in Millions) | (Unaudited) |
SEACOAST BANKING CORPORATION OF FLORIDA AND SUBSIDIARIES |
2013 | 2012 | |||||||||||||||||||||||||||||||
4th Qtr | 3rd Qtr | 2nd Qtr | 1st Qtr | 4th Qtr | 3rd Qtr | 2nd Qtr | 1st Qtr | |||||||||||||||||||||||||
Installment loans to individuals | ||||||||||||||||||||||||||||||||
Automobile and trucks | $ | 6.6 | $ | 7.1 | $ | 7.5 | $ | 7.8 | $ | 7.8 | $ | 8.0 | $ | 8.1 | $ | 8.2 | ||||||||||||||||
Marine loans | 20.2 | 21.3 | 16.7 | 15.4 | 18.4 | 23.0 | 20.8 | 21.1 | ||||||||||||||||||||||||
Other | 17.9 | 18.8 | 20.1 | 20.0 | 20.7 | 20.6 | 21.3 | 21.5 | ||||||||||||||||||||||||
44.7 | 47.2 | 44.3 | 43.2 | 46.9 | 51.6 | 50.2 | 50.8 | |||||||||||||||||||||||||
Construction and land development to individuals | ||||||||||||||||||||||||||||||||
Lot loans | 12.9 | 14.7 | 15.5 | 16.6 | 16.7 | 16.4 | 17.6 | 18.4 | ||||||||||||||||||||||||
Construction | 21.3 | 19.7 | 20.7 | 20.8 | 22.2 | 18.9 | 16.6 | 13.5 | ||||||||||||||||||||||||
34.2 | 34.4 | 36.2 | 37.4 | 38.9 | 35.3 | 34.2 | 31.9 | |||||||||||||||||||||||||
Residential real estate | ||||||||||||||||||||||||||||||||
Adjustable | 391.9 | 378.4 | 372.6 | 365.8 | 361.0 | 353.7 | 359.4 | 341.6 | ||||||||||||||||||||||||
Fixed rate | 91.1 | 94.7 | 97.5 | 98.2 | 99.0 | 99.7 | 95.4 | 96.2 | ||||||||||||||||||||||||
Home equity mortgages | 62.0 | 61.8 | 62.2 | 61.3 | 58.0 | 58.4 | 58.3 | 59.5 | ||||||||||||||||||||||||
Home equity lines | 47.7 | 47.7 | 49.1 | 49.3 | 51.4 | 50.6 | 50.8 | 53.0 | ||||||||||||||||||||||||
592.7 | 582.6 | 581.4 | 574.6 | 569.4 | 562.4 | 563.9 | 550.3 | |||||||||||||||||||||||||
TOTAL CONSUMER | 671.6 | 664.2 | 661.9 | 655.2 | 655.2 | 649.3 | 648.3 | 633.0 | ||||||||||||||||||||||||
Commercial & financial | 78.6 | 70.8 | 65.2 | 64.8 | 61.9 | 58.2 | 56.2 | 54.6 | ||||||||||||||||||||||||
Construction and land development for commercial | ||||||||||||||||||||||||||||||||
Residential | ||||||||||||||||||||||||||||||||
Single family residences | 2.0 | - | - | - | - | - | - | - | ||||||||||||||||||||||||
Single family land and lots | 4.9 | 4.9 | 5.0 | 4.9 | 5.6 | 5.8 | 5.9 | 6.0 | ||||||||||||||||||||||||
Multifamily | 3.7 | 3.8 | 3.9 | 3.9 | 4.3 | 4.6 | 4.7 | 4.9 | ||||||||||||||||||||||||
10.6 | 8.7 | 8.9 | 8.8 | 9.9 | 10.4 | 10.6 | 10.9 | |||||||||||||||||||||||||
Commercial | ||||||||||||||||||||||||||||||||
Office buildings | - | 1.6 | 1.6 | 1.1 | - | - | - | 0.3 | ||||||||||||||||||||||||
Retail trade | 7.7 | 1.8 | 1.8 | - | - | - | - | - | ||||||||||||||||||||||||
Land | 4.9 | 7.3 | 7.2 | 7.8 | 9.6 | 9.8 | 10.7 | 9.2 | ||||||||||||||||||||||||
Healthcare | 5.4 | 4.7 | 2.9 | 3.3 | 1.8 | - | - | - | ||||||||||||||||||||||||
Churches and educational facilities | 3.8 | 4.0 | 2.5 | 1.2 | 0.5 | 0.7 | 0.3 | 0.3 | ||||||||||||||||||||||||
Lodging | 0.9 | 0.3 | - | - | - | - | - | - | ||||||||||||||||||||||||
Convenience stores | - | - | - | - | - | - | 1.4 | 1.4 | ||||||||||||||||||||||||
22.7 | 19.7 | 16.0 | 13.4 | 11.9 | 10.5 | 12.4 | 11.2 | |||||||||||||||||||||||||
Total construction and land development | 33.3 | 28.4 | 24.9 | 22.2 | 21.8 | 20.9 | 23.0 | 22.1 | ||||||||||||||||||||||||
Commercial real estate | ||||||||||||||||||||||||||||||||
Office buildings | 118.7 | 118.2 | 112.0 | 112.5 | 104.7 | 102.4 | 113.4 | 118.0 | ||||||||||||||||||||||||
Retail trade | 130.6 | 128.9 | 135.5 | 122.2 | 126.7 | 121.1 | 128.5 | 139.3 | ||||||||||||||||||||||||
Industrial | 81.1 | 79.6 | 83.3 | 73.4 | 72.6 | 71.3 | 72.0 | 70.0 | ||||||||||||||||||||||||
Healthcare | 45.5 | 38.8 | 42.1 | 39.4 | 40.7 | 35.8 | 42.0 | 40.2 | ||||||||||||||||||||||||
Churches and educational facilities | 25.3 | 24.2 | 26.4 | 26.9 | 28.6 | 26.2 | 26.7 | 27.0 | ||||||||||||||||||||||||
Recreation | 2.5 | 2.5 | 2.6 | 2.6 | 2.7 | 2.7 | 3.1 | 3.1 | ||||||||||||||||||||||||
Multifamily | 16.8 | 6.2 | 9.5 | 8.5 | 9.0 | 7.8 | 8.3 | 8.8 | ||||||||||||||||||||||||
Mobile home parks | 1.9 | 1.9 | 1.9 | 2.0 | 2.0 | 2.1 | 2.1 | 2.1 | ||||||||||||||||||||||||
Lodging | 17.1 | 17.3 | 17.5 | 18.0 | 18.7 | 19.1 | 19.3 | 19.4 | ||||||||||||||||||||||||
Restaurant | 3.7 | 3.8 | 3.5 | 3.6 | 3.5 | 4.4 | 4.7 | 4.6 | ||||||||||||||||||||||||
Agricultural | 7.0 | 7.2 | 7.1 | 5.9 | 6.1 | 7.3 | 7.4 | 7.6 | ||||||||||||||||||||||||
Convenience stores | 20.8 | 21.0 | 20.2 | 20.2 | 20.5 | 16.6 | 15.4 | 15.5 | ||||||||||||||||||||||||
Marina | 21.3 | 21.5 | 20.9 | 21.1 | 21.2 | 21.4 | 21.5 | 21.6 | ||||||||||||||||||||||||
Other | 28.1 | 27.9 | 31.1 | 25.1 | 29.8 | 35.6 | 29.3 | 29.3 | ||||||||||||||||||||||||
520.4 | 499.0 | 513.6 | 481.4 | 486.8 | 473.8 | 493.7 | 506.5 | |||||||||||||||||||||||||
TOTAL COMMERCIAL | 632.3 | 598.2 | 603.7 | 568.4 | 570.5 | 552.9 | 572.9 | 583.2 | ||||||||||||||||||||||||
Other | 0.3 | 0.5 | 0.3 | 0.2 | 0.4 | 0.3 | 0.2 | 0.2 | ||||||||||||||||||||||||
$ | 1,304.2 | $ | 1,262.9 | $ | 1,265.9 | $ | 1,223.8 | $ | 1,226.1 | $ | 1,202.5 | $ | 1,221.4 | $ | 1,216.4 |
QUARTERLY TRENDS - INCREASE (DECREASE) IN LOANS BY QUARTER (Dollars in Millions) | (Unaudited) |
SEACOAST BANKING CORPORATION OF FLORIDA AND SUBSIDIARIES |
2013 | 2012 | |||||||||||||||||||||||||||||||
4th Qtr | 3rd Qtr | 2nd Qtr | 1st Qtr | 4th Qtr | 3rd Qtr | 2nd Qtr | 1st Qtr | |||||||||||||||||||||||||
Installment loans to individuals | ||||||||||||||||||||||||||||||||
Automobile and trucks | $ | (0.5 | ) | $ | (0.4 | ) | $ | (0.3 | ) | $ | - | $ | (0.2 | ) | $ | (0.1 | ) | $ | (0.1 | ) | $ | (0.5 | ) | |||||||||
Marine loans | (1.1 | ) | 4.6 | 1.3 | (3.0 | ) | (4.6 | ) | 2.2 | (0.3 | ) | 1.2 | ||||||||||||||||||||
Other | (0.9 | ) | (1.3 | ) | 0.1 | (0.7 | ) | 0.1 | (0.7 | ) | (0.2 | ) | (0.5 | ) | ||||||||||||||||||
(2.5 | ) | 2.9 | 1.1 | (3.7 | ) | (4.7 | ) | 1.4 | (0.6 | ) | 0.2 | |||||||||||||||||||||
Construction and land development to individuals | ||||||||||||||||||||||||||||||||
Lot loans | (1.8 | ) | (0.8 | ) | (1.1 | ) | (0.1 | ) | 0.3 | (1.2 | ) | (0.8 | ) | 0.5 | ||||||||||||||||||
Construction | 1.6 | (1.0 | ) | (0.1 | ) | (1.4 | ) | 3.3 | 2.3 | 3.1 | 4.8 | |||||||||||||||||||||
(0.2 | ) | (1.8 | ) | (1.2 | ) | (1.5 | ) | 3.6 | 1.1 | 2.3 | 5.3 | |||||||||||||||||||||
Residential real estate | ||||||||||||||||||||||||||||||||
Adjustable | 13.5 | 5.8 | 6.8 | 4.8 | 7.3 | (5.7 | ) | 17.8 | 7.5 | |||||||||||||||||||||||
Fixed rate | (3.6 | ) | (2.8 | ) | (0.7 | ) | (0.8 | ) | (0.7 | ) | 4.3 | (0.8 | ) | (0.8 | ) | |||||||||||||||||
Home equity mortgages | 0.2 | (0.4 | ) | 0.9 | 3.3 | (0.4 | ) | 0.1 | (1.2 | ) | (0.7 | ) | ||||||||||||||||||||
Home equity lines | - | (1.4 | ) | (0.2 | ) | (2.1 | ) | 0.8 | (0.2 | ) | (2.2 | ) | (1.9 | ) | ||||||||||||||||||
10.1 | 1.2 | 6.8 | 5.2 | 7.0 | (1.5 | ) | 13.6 | 4.1 | ||||||||||||||||||||||||
TOTAL CONSUMER | 7.4 | 2.3 | 6.7 | 0.0 | 5.9 | 1.0 | 15.3 | 9.6 | ||||||||||||||||||||||||
Commercial & financial | 7.8 | 5.6 | 0.4 | 2.9 | 3.7 | 2.0 | 1.6 | 1.5 | ||||||||||||||||||||||||
Construction and land development for commercial | ||||||||||||||||||||||||||||||||
Residential | ||||||||||||||||||||||||||||||||
Single family residences | 2.0 | - | - | - | - | - | - | - | ||||||||||||||||||||||||
Single family land and lots | - | (0.1 | ) | 0.1 | (0.7 | ) | (0.2 | ) | (0.1 | ) | (0.1 | ) | (0.2 | ) | ||||||||||||||||||
Multifamily | (0.1 | ) | (0.1 | ) | - | (0.4 | ) | (0.3 | ) | (0.1 | ) | (0.2 | ) | (0.2 | ) | |||||||||||||||||
1.9 | (0.2 | ) | 0.1 | (1.1 | ) | (0.5 | ) | (0.2 | ) | (0.3 | ) | (0.4 | ) | |||||||||||||||||||
Commercial | ||||||||||||||||||||||||||||||||
Office buildings | (1.6 | ) | - | 0.5 | 1.1 | - | - | (0.3 | ) | 0.1 | ||||||||||||||||||||||
Retail trade | 5.9 | - | 1.8 | - | - | - | - | - | ||||||||||||||||||||||||
Land | (2.4 | ) | 0.1 | (0.6 | ) | (1.8 | ) | (0.2 | ) | (0.9 | ) | 1.5 | (0.1 | ) | ||||||||||||||||||
Healthcare | 0.7 | 1.8 | (0.4 | ) | 1.5 | 1.8 | - | - | - | |||||||||||||||||||||||
Churches and educational facilities | (0.2 | ) | 1.5 | 1.3 | 0.7 | (0.2 | ) | 0.4 | - | 0.2 | ||||||||||||||||||||||
Lodging | 0.6 | 0.3 | - | - | - | - | - | - | ||||||||||||||||||||||||
Convenience stores | - | - | - | - | - | (1.4 | ) | - | (0.3 | ) | ||||||||||||||||||||||
3.0 | 3.7 | 2.6 | 1.5 | 1.4 | (1.9 | ) | 1.2 | (0.1 | ) | |||||||||||||||||||||||
Total construction and land development | 4.9 | 3.5 | 2.7 | 0.4 | 0.9 | (2.1 | ) | 0.9 | (0.5 | ) | ||||||||||||||||||||||
Commercial real estate | ||||||||||||||||||||||||||||||||
Office buildings | 0.5 | 6.2 | (0.5 | ) | 7.8 | 2.3 | (11.0 | ) | (4.6 | ) | (1.6 | ) | ||||||||||||||||||||
Retail trade | 1.7 | (6.6 | ) | 13.3 | (4.5 | ) | 5.6 | (7.4 | ) | (10.8 | ) | (1.3 | ) | |||||||||||||||||||
Industrial | 1.5 | (3.7 | ) | 9.9 | 0.8 | 1.3 | (0.7 | ) | 2.0 | (0.7 | ) | |||||||||||||||||||||
Healthcare | 6.7 | (3.3 | ) | 2.7 | (1.3 | ) | 4.9 | (6.2 | ) | 1.8 | 1.4 | |||||||||||||||||||||
Churches and educational facilities | 1.1 | (2.2 | ) | (0.5 | ) | (1.7 | ) | 2.4 | (0.5 | ) | (0.3 | ) | (0.4 | ) | ||||||||||||||||||
Recreation | - | (0.1 | ) | - | (0.1 | ) | - | (0.4 | ) | - | (0.1 | ) | ||||||||||||||||||||
Multifamily | 10.6 | (3.3 | ) | 1.0 | (0.5 | ) | 1.2 | (0.5 | ) | (0.5 | ) | (0.6 | ) | |||||||||||||||||||
Mobile home parks | - | - | (0.1 | ) | - | (0.1 | ) | - | - | (0.1 | ) | |||||||||||||||||||||
Lodging | (0.2 | ) | (0.2 | ) | (0.5 | ) | (0.7 | ) | (0.4 | ) | (0.2 | ) | (0.1 | ) | (0.2 | ) | ||||||||||||||||
Restaurant | (0.1 | ) | 0.3 | (0.1 | ) | 0.1 | (0.9 | ) | (0.3 | ) | 0.1 | (0.1 | ) | |||||||||||||||||||
Agricultural | (0.2 | ) | 0.1 | 1.2 | (0.2 | ) | (1.2 | ) | (0.1 | ) | (0.2 | ) | (1.2 | ) | ||||||||||||||||||
Convenience stores | (0.2 | ) | 0.8 | - | (0.3 | ) | 3.9 | 1.2 | (0.1 | ) | 0.4 | |||||||||||||||||||||
Marina | (0.2 | ) | 0.6 | (0.2 | ) | (0.1 | ) | (0.2 | ) | (0.1 | ) | (0.1 | ) | 0.3 | ||||||||||||||||||
Other | 0.2 | (3.2 | ) | 6.0 | (4.7 | ) | (5.8 | ) | 6.3 | - | 2.3 | |||||||||||||||||||||
21.4 | (14.6 | ) | 32.2 | (5.4 | ) | 13.0 | (19.9 | ) | (12.8 | ) | (1.9 | ) | ||||||||||||||||||||
TOTAL COMMERCIAL | 34.1 | (5.5 | ) | 35.3 | (2.1 | ) | 17.6 | (20.0 | ) | (10.3 | ) | (0.9 | ) | |||||||||||||||||||
Other | (0.2 | ) | 0.2 | 0.1 | (0.2 | ) | 0.1 | 0.1 | - | (0.4 | ) | |||||||||||||||||||||
$ | 41.3 | $ | (3.0 | ) | $ | 42.1 | $ | (2.3 | ) | $ | 23.6 | $ | (18.9 | ) | $ | 5.0 | $ | 8.3 |
EXHIBIT 99.2
To Form 8-K dated January 29, 2014
Seacoast Banking Corporation of Florida
Fourth Quarter & Year-End 2013 Earnings Conference Call
January 30, 2014
10:00 AM Eastern Time
Company Participants:
Dennis S. Hudson, III, Chairman and Chief Executive Officer, Seacoast Banking Corporation of Florida
William R. Hahl, Executive Vice President and Chief Financial Officer, Seacoast Banking Corporation of Florida
Other Participants:
Enrique Acedo, Analyst, Raymond James & Associates, Inc.
Management Discussion:
Operator: Welcome to the Seacoast Fourth Quarter and Year End 2013 Earnings Conference Call. My name is Loraine, and I will be your operator for today’s call. At this time, all participants are in a listen-only mode. Later, we will conduct a question-and-answer session. Please note that this conference is being recorded.
I will now turn the call over to Mr. Dennis Hudson. Mr. Hudson, you may begin.
Dennis S. Hudson III: Thank you very much. As always, we’d like to first of all welcome you to the Fourth Quarter 2013 Conference Call.
We’d like to direct your attention to the statement that we’ve placed at the end of our press release regarding our forward statements. During the call, we’ll be discussing certain issues that constitute forward-looking statements within the meaning of the Securities and Exchange Act, and our comments are intended to be covered within the meaning of Section 27A of this Act.
With me today is Bill Hahl, our CFO; David Houdeshell, our Chief Credit Officer; and Chuck Shaffer, who is running our Retail Operations network.
2013 was truly a transformational year for Seacoast. We dramatically increased our market presence across every one of our business lines. We added new revenue-producing personnel to our teams in every area from commercial lending to small business banking to wealth management to mortgage banking. We implemented better processes around relationship-building in our traditional retail offices to help improve our organic growth in our legacy markets. We also rolled out significant investments in our new distribution channel focused on growing small business relationships in several metro areas adjacent to our legacy markets, a distribution channel we call Accelerate Business, which now operates in five locations, staffed with some of the best customer acquisition team members in the business.
-1- |
Our internet and our digital distribution platform was transformed as well during the year as we added, I think, 19 new digital products for both consumers and our business clients, and we saw a tremendous engagement by our customer base throughout the year as almost half of our Internet banking users moved into our new digital product suite. We actually almost doubled our mobile banking users during the year and transaction volumes were even higher in terms of the growth rate. We did this—made these investments—just as the markets here in Florida began to move beyond recovery and into early stages of a return to growth. I think our timing was spot on. The investments we made this year helped drive much better growth, as detailed in our earnings release. We were able to absorb all of these investments in people and in technology into our cost structure and still bring down our overall total expenses and operating expenses for the year. In fact, overall top total expense structure this year was reduced by 9 percent.
As a result, our pretax earnings were improved each quarter, and I’m referring to pretax earnings because I think it’s a better measure of our progress given the large recapture of our deferred tax asset last quarter. Pretax earnings were improved each quarter when compared to the prior year and totaled $11.6 million for 2013. Earnings are not where we want them to be, but they’re moving in the right direction, and we look to produce additional progress in 2014. More importantly, however, our investments and increased market presence set the stage for better growth rates in 2014 and beyond. This growth together with additional planned reductions in cost for the first quarter coming up will be key to more earnings growth in 2014.
Another important milestone this quarter was the redemption of all of our 50 million in outstanding preferred stock at yearend. We also completed our $75 million common equity raise, including $25 million which closed early in January. These milestones, together with last quarter’s recovery of our deferred tax asset, dramatically improved the quality of our capital structure and resulted in a TCE ratio of little over 10 percent.
I’m now going to turn the call over to Bill for a few comments on the quarter, and then I’ll have some closing comments to make before we open it up to questions. Bill.
William R. Hahl: Thanks, Denny; and good morning, everyone. My remarks will reference the slide deck we posted for the call on our website, and so I’ll begin with some highlights on slide three.
Net income for the year totaled $52 million, including the net tax benefit that Denny referred to of $40 million related to the reversal of the deferred tax valuation allowance. Probably a better measure of the progress for this year is the increase in income before-taxes which totaled $11.6 million compared to a loss last year of $710,000. This increase in results was driven across the board with the results of revenue growth, expense management, and decline in cyclical credit costs and other expense items. Pretax fourth quarter income totaled $3.1 million, up from $2.9 million a year earlier. Net income available to common shareholders for the year was $47.9 million, or $2.44 per diluted common share compared to a net loss last year of $0.24. In December, we redeemed all of the outstanding Series A Preferred Stock and thus eliminated future dividends for that stock, which totaled $4.1 million in 2013. As Denny mentioned, this action, along with the $75 million common equity raise completed in the fourth quarter, has significantly improved the quantity and quality of our capital. We believe our capital strength with allow us to participate in future bank consolidations in our markets and for us to continue to execute on growing our franchise at a faster pace.
-2- |
Total revenues, excluding security gains and losses, for the fourth quarter were $22.3 million and were up about $500,000 from a year ago. On a linked-quarter basis, revenues were slightly lower, reflecting the impact of higher interest rates which lowered residential loan demand and our mortgage banking fees. The linked-quarter comparison was also impacted by a recovery of interest income of about $500,000 related to nonaccrual loans in the third quarter and we had no comparable recovery in the fourth quarter. Year-to-date, our tactics designed to build noninterest income have had positive impacts with fees overall growing by 13.4 percent for the year. Total revenues year-to-date were up by $3.2 million, or 3.7 percent, with mortgage banking fees up 12.5 percent, service charges up 6 [percent], interchange fees up 20.5 [percent]. In addition, wealth management fees were also strong and were up 30 percent year-over-year.
Slide six has some additional highlights about noninterest income growth, so I refer you to that slide. Total assets increased by about $95 million and it were funded with core customer funds with solid growth in our noninterest bearing transaction accounts, which were up 10 percent year-over-year and which now comprise approximately 26 percent of total deposits, up from 24 [percent] and 19 [percent] for the two previous years respectively. Total transaction accounts now exceed $1 billion and were up 7.7 percent year-over-year and now comprise approximately 56 percent of total deposits compared to 53 percent a year ago.
We also have highlighted on slide three our reduced risk posture, which is now quantitatively at pre-crisis levels. We have included additional information on our much improved credit quality and reduced costs on slides seven through nine.
Now I’ll turn to slide four and a few comments on cost reductions in noninterest expenses. The quarter expenses were lower by $1.1 million, or 6 percent, compared to a year ago and are down $7.4 million year-to-date, in-line with the guidance we provided last year. Lower noninterest expenses for the year were the result of credit costs declining, savings from our branch consolidations we executed in 2012, as well as our other cost-cutting initiatives.
In order to improve the margin and continue to grow loans, as Denny mentioned, we’ve invested a significant portion of our expense reduction into additional business bankers and credit support personnel and, more recently, in enhancing our customer experience with additional ways our customers can access their accounts through our digital channels. Our redeployment of overhead savings has been focused on delivery channels, the increased loan production personnel, and new digital products that Denny mentioned. These costs over the last three years have been significant and impactful on the efficiency ratio in the short run, but are considered investments for future revenue growth. We want to continue to grow the revenues at a faster pace and to look for ways to redeploy and reduce our fixed legacy costs as we better align our delivery channels with the evolving customer needs. We began implementing cost reductions of about $1.2 million in January of 2014 in support of our goal to continuously to improve the operating leverage, while also improving the overall top line revenue growth rates.
-3- |
Now I’ll move onto slide five with some highlights related to our loan growth this year. Loan production over the last 12 months totaled $563 million and was up 18.8 percent compared to a year ago. Net loans were up $78 million, or 6.4 percent year-over-year. The improvement in loan growth is a result of continued growth across all of our portfolios, but it also includes much better growth this year coming from our commercial and business lending, which totaled $200 million, an increase of $89 million compared to 2012, proving that the investments we’ve been making in loan personnel and the Accelerate Business is beginning to payoff. We predicted on last quarter’s call that our commercial volume would be better in the fourth quarter, and it was. Commercial production totaled $60 million compared to about $38 million in the third quarter. We continue to refine our Accelerate Business banking model and, as we do, we should see sustained increases in quarterly loan production, particularly, as Denny mentioned, as the economy in our markets begins to move to a growth mode.
Now some color on the net interest margin. The margin declined by 17 basis points in the fourth quarter compared to the third quarter, but as we mentioned last quarter, we [had expected we] would see some pressure on the margin as a result of increased seasonal public customer funds invested at low spreads. We also had some interest recovered on nonperforming loans in the third quarter. As I said earlier, in the third quarter, we received about $500,000. That increased the third quarter margin by about 10 basis points of that 17 delta that I talked about. In addition, we had early payoffs of some TDR loans in the third quarter, which had been booked with valuation discounts, which also had a positive impact on the net interest margin in the third quarter by about 5 basis points. I think going forward, we’ll probably see less impact on these types of items. Like the margin, the loan yield was impacted by these items and was lower in the fourth quarter and totaled 4.29 percent compared to 4.59 percent in the third quarter.
In the securities portfolio, our prepay speeds remain slow, and those yields improved by 17 basis points in response to a steeper yield curve. Our continued progress in improving our core customer funding and our improved deposit mix reduced interest-bearing deposit costs by about one basis point in the fourth quarter. Our normal seasonally higher funding from public funds’ relationships also contributed, as I mentioned earlier, to that decline in a margin for the quarter.
Growing net interest income continues and remains our focus. We believe that we should be able to generate growth in that line item, even in this lower interest rate environment, as our primary opportunities for growth in that remain the improved loan production, improving the earning asset mix in favor of loans, and continued further growth in our low-cost customer funding.
With that, I’ll turn the call back to Denny for some questions.
-4- |
Dennis S. Hudson III: Hey, thanks, Bill. As I said, it’s been a transformational year for Seacoast. We positioned ourselves for even better growth in 2014 and beyond. This past year, we simplified and strengthened our capital structure. We made meaningful improvement in our earnings. We’ve turned around our loan growth. We’ve continued to aggressively grow our core deposits. And we’ve done all of this while also cutting our total expense structure as we reinvest some of the savings back into the revenue initiatives we’ve just talked about. All of us, as I said last quarter, continue to challenge each other to find innovative ways to grow our revenues faster and to fund the innovation required with redeployment of our heavy legacy costs, even as we continue to bring down the overall cost structure. We must bring down legacy cost by discovering ways to better align our delivery channels with customer needs that are just now starting to rapidly change. As I said last quarter, this is not going to occur overnight, but it’s going to occur on a more compressed timeframe probably, we think, than most community banks believe. This will result in greater convenience and an improved experience for our customers.
So with that, I’ll turn the call back over to our operator and we’d be pleased to take a few questions.
Operator: Thank you. We will now begin the question-and-answer session. If you have a question, please press star then one on your touchtone phone. If you wish to be removed from the queue, please press the pound sign or the hash key. There will be a delay before the first question is announced. If you are using a speakerphone, you may need to pick up the handset first before pressing the numbers. Once again, if you have a question, please press star then one on your touchtone phone.
And our first question comes from Enrique Acedo from Raymond James. Please go ahead.
Enrique Acedo: Hey, good morning guys.
Dennis S. Hudson III: Good morning.
Enrique Acedo: Hey, I was curious as to why period-end share count only went up about 4.65 million shares from 3Q13? If I recall correctly, your offering was 34.9 million shares. So if you divide that by 5 to split-adjust it, I’m coming out at 7 million shares. Does that imply a lower diluted share count going forward?
William R. Hahl: It could be… I mean I don’t know... You realize that $25 million in common shares, we didn’t close that until early January.
Enrique Acedo: Okay.
William R. Hahl: $25 million….I’m sorry, not 25 million shares, but $25 million.
Dennis S. Hudson III: A portion of the capital raised was delayed and closed in January.
Enrique Acedo: Okay, that actually…
William R. Hahl: So those aren’t outstanding [at yearend] yet.
Enrique Acedo: Okay, that makes sense. And maybe if I can move on to the fee income side: should we think of 4Q13 as a bottom for mortgage banking, and what categories are you most focused on for 2014?
Dennis S. Hudson III: This is in the area of fees?
-5- |
Enrique Acedo: Yeah fees, right.
Dennis S. Hudson III: Yeah. We’re growing every fee item across the board, as you saw. Our wealth management fees grew dramatically—on the order of 30 percent in 2013—and across the board, all our deposit fees and so forth, all are being driven by growth in customers, growth in customer balances and growth in usage of some of our new digital products out there. Those trends we believe will continue into 2014. You’re right, we had a disappointment in the fourth quarter with respect to our mortgage fees. Mortgage fees were up, I think, over the prior year, but disappointed us, and we had a pretty soft quarter in the fourth quarter. We think that will be a challenge in 2014, when compared to 2013, but we are also working pretty hard to extend our market coverage to a larger market area and make up that difference. So sorry I can’t give any better guidance with that, other than nationally there has been some softness in the mortgage market as a result of the rate movement that occurred late in the summer and so forth. So we think it’s a more challenging environment for us in '14 than '13 was, but we have also been have been executing strategies to increase our volume with entry into other markets, and that’s showing some signs of success. So we’ll hopefully close that gap.
William R. Hahl: Yeah, and coupled with that, I’ll just point out that, as I said, we began implementing some cost reductions. The mortgage area is one of the areas that we are trying to rationalize the expense structure there.
Enrique Acedo: Okay, that’s actually really helpful. And just one last one, I promise. Do you guys have the exact impact on NIMs that the inflow on public deposits had during the quarter?
William R. Hahl: No… It was… I mean you could probably do the math. When I say very low spreads, I mean very low spreads like 8 basis points. I think if you look at the line for our sweep repurchases, they were up about $44 million, I think, on average, so you can do the math and sort of calculate what that cost was.
Enrique Acedo: All right, well thanks, guys. Appreciate it.
Dennis S. Hudson III: Okay. Yeah.
Operator: Thank you. And once again, that’s star then one on your touchtone phone if you have a question. Standing by for questions. And at this time, I am showing no further questions.
Dennis S. Hudson III: Okay. Well thank you very much, and we look forward to reporting additional progress next quarter. Thank you.
Operator: Thank you. And thank you, ladies and gentlemen. This concludes today’s conference. Thank you for participating. You may now disconnect.
-6- |
Fourth Quarter 2013 January 30, 2014
2 Cautionary Notice Regarding Forward - Looking Statements This press release contains “forward - looking statements” within the meaning of Section 27 A of the Securities Act of 1933 and Section 21 E of the Securities Exchange Act of 1934 , including, without limitation, statements about future financial and operating results, ability to realized deferred tax assets, cost savings, enhanced revenues, economic and seasonal conditions in our markets, and improvements to reported earnings that may be realized from cost controls and for integration of banks that we have acquired, as well as statements with respect to Seacoast’s objectives, expectations and intentions and other statements that are not historical facts . Actual results may differ from those set forth in the forward - looking statements . Forward - looking statements include statements with respect to our beliefs, plans, objectives, goals, expectations, anticipations, estimates and intentions, and involve known and unknown risks, uncertainties and other factors, which may be beyond our control, and which may cause the actual results, performance or achievements of Seacoast to be materially different from future results, performance or achievements expressed or implied by such forward - looking statements . You should not expect us to update any forward - looking statements . You can identify these forward - looking statements through our use of words such as “may,” “will,” “anticipate,” “assume,” “should,” “support”, “indicate,” “would,” “believe,” “contemplate,” “expect,” “estimate,” “continue,” “further”, “point to,” “project,” “could,” “intend” or other similar words and expressions of the future . These forward - looking statements may not be realized due to a variety of factors, including, without limitation : the effects of future economic and market conditions, including seasonality ; governmental monetary and fiscal policies, as well as legislative, tax and regulatory changes ; changes in accounting policies, rules and practices ; the risks of changes in interest rates on the level and composition of deposits, loan demand, liquidity and the values of loan collateral, securities, and interest sensitive assets and liabilities ; interest rate risks, sensitivities and the shape of the yield curve ; the effects of competition from other commercial banks, thrifts, mortgage banking firms, consumer finance companies, credit unions, securities brokerage firms, insurance companies, money market and other mutual funds and other financial institutions operating in our market areas and elsewhere, including institutions operating regionally, nationally and internationally, together with such competitors offering banking products and services by mail, telephone, computer and the Internet ; and the failure of assumptions underlying the establishment of reserves for possible loan losses . The risks of mergers and acquisitions, include, without limitation : unexpected transaction costs, including the costs of integrating operations ; the risks that the businesses will not be integrated successfully or that such integration may be more difficult, time - consuming or costly than expected ; the potential failure to fully or timely realize expected revenues and revenue synergies, including as the result of revenues following the merger being lower than expected ; the risk of deposit and customer attrition ; any changes in deposit mix ; unexpected operating and other costs, which may differ or change from expectations ; the risks of customer and employee loss and business disruption, including, without limitation, as the result of difficulties in maintaining relationships with employees ; increased competitive pressures and solicitations of customers by competitors ; as well as the difficulties and risks inherent with entering new markets . All written or oral forward - looking statements attributable to us are expressly qualified in their entirety by this cautionary notice, including, without limitation, those risks and uncertainties described in our annual report on Form 10 - K for the year ended December 31 , 2012 under “Special Cautionary Notice Regarding Forward - Looking Statements” and “Risk Factors”, and otherwise in our SEC reports and filings . Such reports are available upon request from the Company, or from the Securities and Exchange Commission, including through the SEC’s Internet website at http : //www . sec . gov .
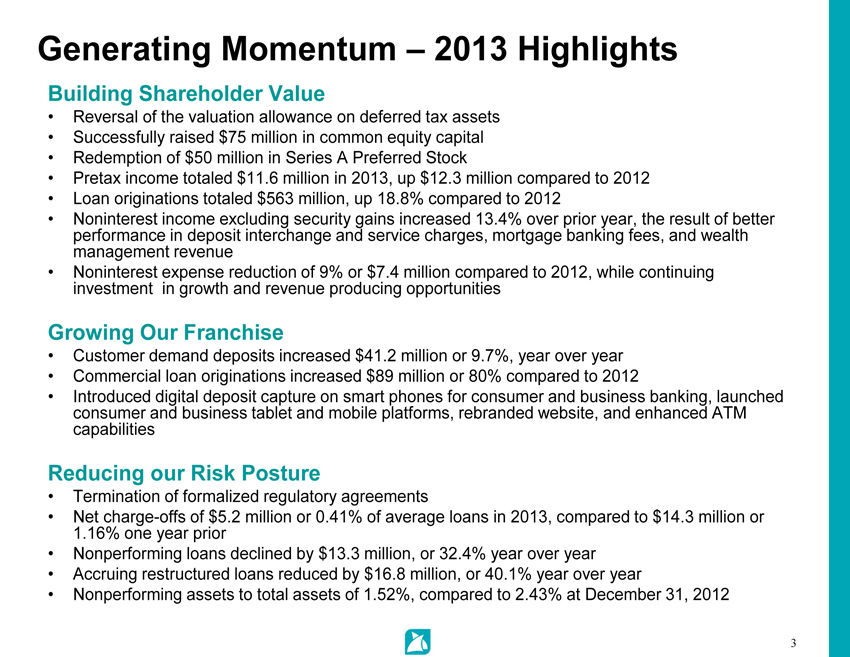
3 Generating Momentum – 2013 Highlights Building Shareholder Value • Reversal of the valuation allowance on deferred tax assets • Successfully raised $75 million in common equity capital • Redemption of $50 million in Series A Preferred Stock • Pretax income totaled $11.6 million in 2013, up $12.3 million compared to 2012 • Loan originations totaled $563 million, up 18.8% compared to 2012 • Noninterest income excluding security gains increased 13.4% over prior year, the result of better performance in deposit interchange and service charges, mortgage banking fees, and wealth management revenue • Noninterest expense reduction of 9 % or $7.4 million compared to 2012, while continuing investment in growth and revenue producing opportunities Growing Our Franchise • Customer demand deposits increased $41.2 million or 9 .7%, year over year • Commercial loan originations increased $89 million or 80% compared to 2012 • I ntroduced digital deposit capture on smart phones for consumer and business banking, launched consumer and business tablet and mobile platforms, rebranded website, and enhanced ATM capabilities Reducing our Risk Posture • Termination of formalized regulatory agreements • Net charge - offs of $5.2 million or 0.41% of average loans in 2013, compared to $14.3 million or 1.16% one year prior • Nonperforming loans declined by $13.3 million, or 32.4% year over year • Accruing restructured loans reduced by $16.8 million, or 40.1% year over year • Nonperforming assets to total assets of 1.52%, compared to 2.43% at December 31, 2012
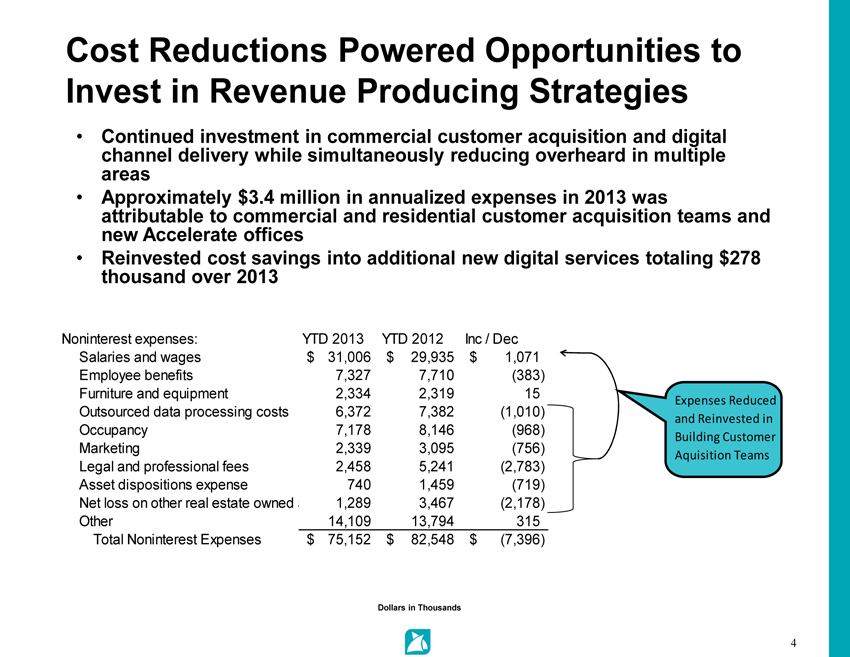
4 Cost Reductions Powered Opportunities to Invest in Revenue Producing Strategies • Continued investment in commercial customer acquisition and digital channel delivery while simultaneously reducing overheard in multiple areas • Approximately $3.4 million in annualized expenses in 2013 was attributable to commercial and residential customer acquisition teams and new Accelerate offices • Reinvested cost savings into additional new digital services totaling $278 thousand over 2013 Dollars in Thousands Noninterest expenses: YTD 2013 YTD 2012 Inc / Dec Salaries and wages 31,006$ 29,935$ 1,071$ Employee benefits 7,327 7,710 (383) Furniture and equipment 2,334 2,319 15 Outsourced data processing costs 6,372 7,382 (1,010) Occupancy 7,178 8,146 (968) Marketing 2,339 3,095 (756) Legal and professional fees 2,458 5,241 (2,783) Asset dispositions expense 740 1,459 (719) Net loss on other real estate owned and repossessed assets1,289 3,467 (2,178) Other 14,109 13,794 315 Total Noninterest Expenses 75,152$ 82,548$ (7,396)$ Expenses Reduced and Reinvested in Building Customer Aquisition Teams
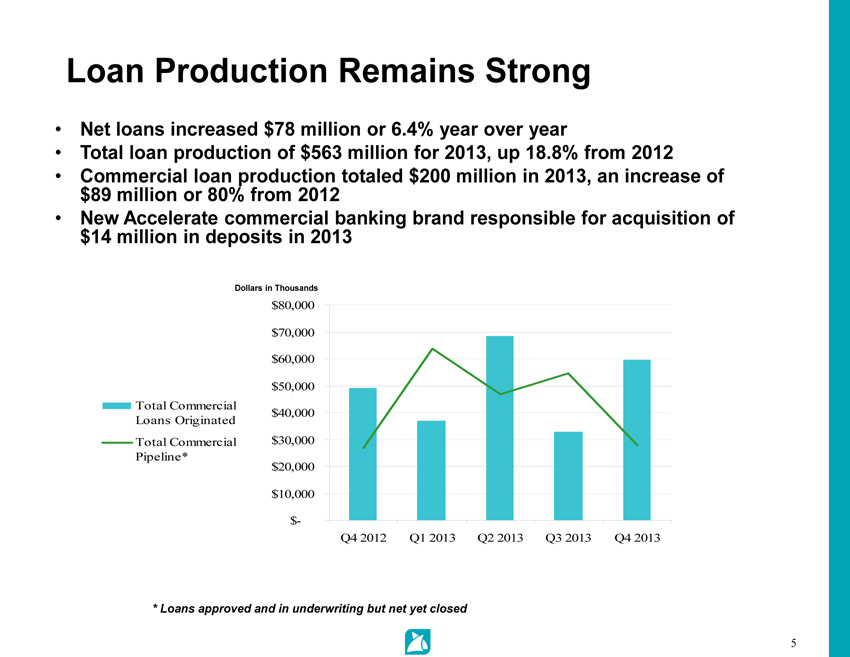
5 Loan Production Remains Strong • Net loans increased $78 million or 6.4% year over year • Total loan production of $563 million for 2013, up 18.8% from 2012 • Commercial loan production totaled $200 million in 2013, an increase of $89 million or 80% from 2012 • New Accelerate commercial banking brand responsible for acquisition of $14 million in deposits in 2013 * * Loans approved and in underwriting but net yet closed Dollars in Thousands $- $10,000 $20,000 $30,000 $40,000 $50,000 $60,000 $70,000 $80,000 Q4 2012 Q1 2013 Q2 2013 Q3 2013 Q4 2013 Total Commercial Loans Originated Total Commercial Pipeline*
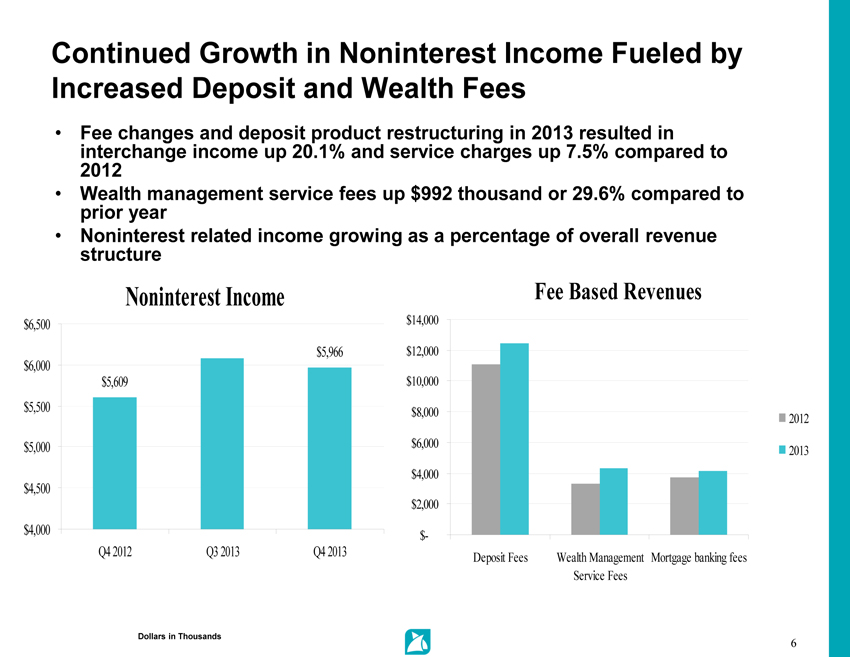
6 Continued Growth in Noninterest Income Fueled by Increased Deposit and Wealth Fees • Fee changes and deposit product restructuring in 2013 resulted in interchange income up 20.1% and service charges up 7.5% compared to 2012 • Wealth management service fees up $992 thousand or 29.6% compared to prior year • Noninterest related income growing as a percentage of overall revenue structure 21% Dollars in Thousands Fee Based Revenues $- $2,000 $4,000 $6,000 $8,000 $10,000 $12,000 $14,000 Deposit Fees Wealth Management Service Fees Mortgage banking fees 2012 2013 Noninterest Income $5,609 $5,966 $4,000 $4,500 $5,000 $5,500 $6,000 $6,500 Q4 2012 Q3 2013 Q4 2013
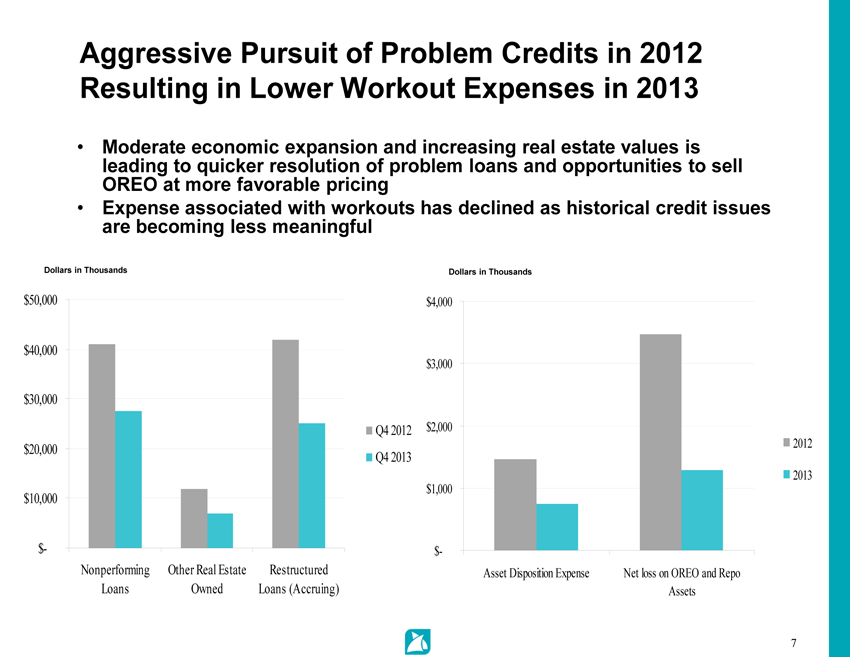
7 Aggressive Pursuit of Problem Credits in 2012 Resulting in Lower Workout Expenses in 2013 • Moderate economic expansion and increasing real estate values is leading to quicker resolution of problem loans and opportunities to sell OREO at more favorable pricing • Expense associated with workouts has declined as historical credit issues are becoming less meaningful Dollars in Thousands Dollars in Thousands $- $1,000 $2,000 $3,000 $4,000 Asset Disposition Expense Net loss on OREO and Repo Assets 2012 2013 $- $10,000 $20,000 $30,000 $40,000 $50,000 Nonperforming Loans Other Real Estate Owned Restructured Loans (Accruing) Q4 2012 Q4 2013
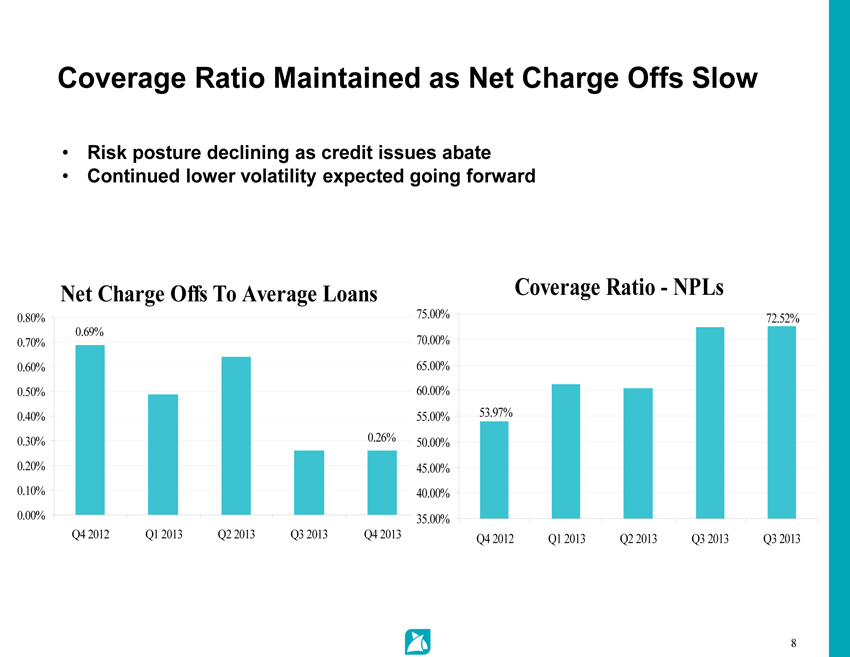
8 Coverage Ratio Maintained as Net Charge Offs Slow • Risk posture declining as credit issues abate • Continued lower volatility expected going forward Net Charge Offs To Average Loans 0.69% 0.26% 0.00% 0.10% 0.20% 0.30% 0.40% 0.50% 0.60% 0.70% 0.80% Q4 2012 Q1 2013 Q2 2013 Q3 2013 Q4 2013 Coverage Ratio - NPLs 72.52% 53.97% 35.00% 40.00% 45.00% 50.00% 55.00% 60.00% 65.00% 70.00% 75.00% Q4 2012 Q1 2013 Q2 2013 Q3 2013 Q3 2013
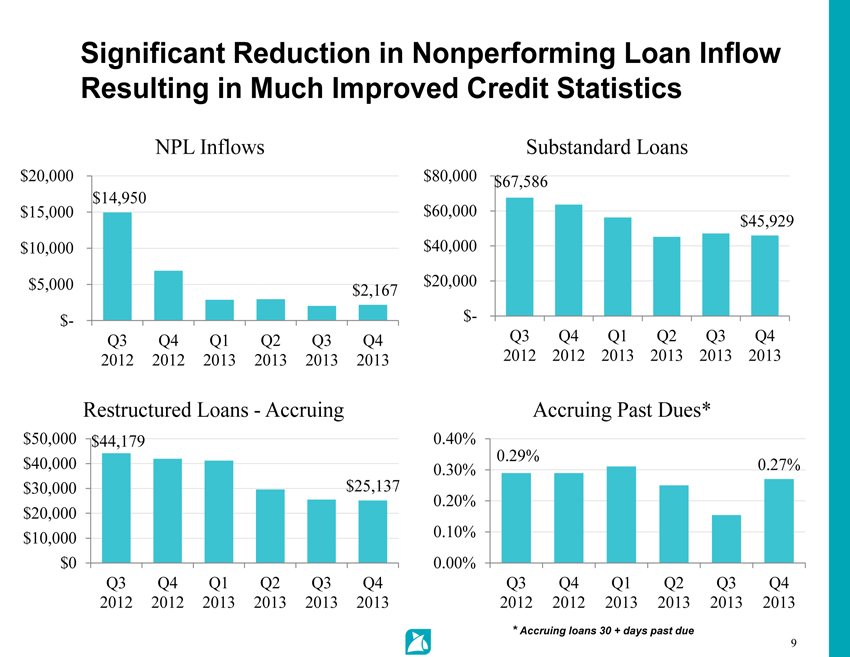
9 Significant Reduction in Nonperforming Loan Inflow Resulting in Much Improved Credit Statistics * Accruing loans 30 + days past due $14,950 $2,167 $- $5,000 $10,000 $15,000 $20,000 Q3 2012 Q4 2012 Q1 2013 Q2 2013 Q3 2013 Q4 2013 NPL Inflows $44,179 $25,137 $0 $10,000 $20,000 $30,000 $40,000 $50,000 Q3 2012 Q4 2012 Q1 2013 Q2 2013 Q3 2013 Q4 2013 Restructured Loans - Accruing $67,586 $45,929 $- $20,000 $40,000 $60,000 $80,000 Q3 2012 Q4 2012 Q1 2013 Q2 2013 Q3 2013 Q4 2013 Substandard Loans 0.29% 0.27% 0.00% 0.10% 0.20% 0.30% 0.40% Q3 2012 Q4 2012 Q1 2013 Q2 2013 Q3 2013 Q4 2013 Accruing Past Dues*
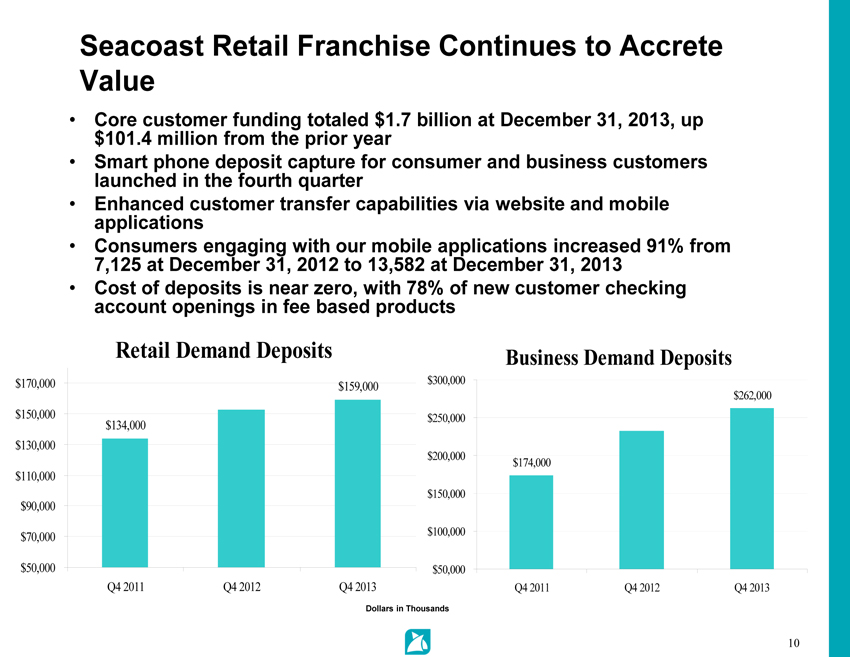
10 Seacoast Retail Franchise Continues to Accrete Value • Core customer funding totaled $1.7 billion at December 31, 2013, up $101.4 million from the prior year • Smart phone deposit capture for consumer and business customers launched in the fourth quarter • Enhanced customer transfer capabilities via website and mobile applications • Consumers engaging with our mobile applications increased 91% from 7,125 at December 31, 2012 to 13,582 at December 31, 2013 • Cost of deposits is near zero, with 78% of new customer checking account openings in fee based products Dollars in Thousands Retail Demand Deposits $134,000 $159,000 $50,000 $70,000 $90,000 $110,000 $130,000 $150,000 $170,000 Q4 2011 Q4 2012 Q4 2013 Business Demand Deposits $174,000 $262,000 $50,000 $100,000 $150,000 $200,000 $250,000 $300,000 Q4 2011 Q4 2012 Q4 2013
11 2014 Priorities Building Shareholder Value • After raising capital and redeeming our preferred stock we have taken an offensive position and shifted our focus to accelerating growth and acquisition opportunities • Moving into 2014 we will continue to invest in revenue growth while maintaining our focus on a prudent expense structure Growing Our Franchise • Examine branch network for opportunities for reinvestment and enhancements to the customer experience • Continued improvement on our value proposition with concentration on a robust customer engagement strategy and targeted customer acquisition utilizing numerous marketing channels • Refinement of our commercial and business banking strategy; continue development of our branding and presence in Orlando, Boca Raton and Ft. Lauderdale
12
L9)B]M1>U,>.M;TK>;S:NR(BL[9F(C;/
M0NR3VO:85&L\3D3RVX[\?\VOL%B?%U[D5_C7?(H3$KR,4NZEWBPQ(ZJK^35;
M"I,:JJ5HAY?2IB$\UIUUKWX;W/O'>&AQVF)S4I-:3,=GJ^EM,_JGJV[L0FVO
MF \-S<&:3=V],5L.MQSEZU)V;8
MZV6]H[$S'3$Q/9[;&?.NXNX;XYYZ;YXFX2U>/7;AU%=)WO-2+16W4T>GQWV1
M>M;>EO6U9VUCICHVQLE8\9ZKHGVX`[*X@Z;XGY-:[GR9LFE>0^Y%75O+,U@V
M*?= C'GK'32;1MG9,3:NV-NS;%NG9L1+REYF<-<
M@.>^JWANC/DWQRVMDU&@S9(KLOJ=WY+Q$9JX[=6)O$TQYHI:(ZT5G'MKUYM%
MS$+C%VUK1L-O<;_-?'KEHV'=$Y=#TLWC\]W8\AEF32Y1L%EUI(K?7+;1::1U
MUK:&Y;C']6I:%5K(IBV3BKF=FW;.Y*[CR5W]:O>YU/7B,,3LV3ECHZNWMQ_6
M36)Z=DQZ5+^#D]YINAXICC[+Q]ILW+RF7WS7=48,DZZU8MUXTENGOTT__',^
M]HR6IZ69K;^M6(\T.24CE9R!RW;"($BSXXXS`QK!;'*JWZ5:<,L"'&;4W,2R
MMQEJ?<7WGYLA#:E-M/RE(2I24TK60.".&*\)<.X=TS:+ZK;-\MH[%LE^FVSM
M[(C96)G9,Q6)F-LJT^EPQ,8XMLF8B]
MYFV6\1,UK?):M9FL1+[.">>X?J_EOI'/L_OT3&,.QG);C-OM^GHDN1+;%=Q>
M_0FG7D0V),E27)M$IHIQ:$*XG?>^]V\
M/;NR;UWKDC%I,<=GMVF>Q6L=FUK=J(_7T1$S&9<`\`\5DO>)DNL6O.W/ENTL?Y*<>>8L#B]D
M]JOS>9HUYL/#K+=(.+9#5;KLAFSX_ELJT1&(R%O*JAEB5=(;"J]8RD)2VE$7
M:C>7,G1[JR<,<2;FMO72WQ][[]AR6K.2G8B;7QQ:=O=F:X[3_*B9F=MO=V\+
M>:QOOC#3
T
M:?!K+9]7GM.>G6TT8IK@FWOCIPWZ;UV7GK5M&V)YW;D6/%[XV+4C,ML4?VCJ
M26]1M-$T
UU^F+S'_P#D_@R5?+S2F.4?FF\+<7#&HZL;XW?7%BS16>QWFVJI?I[,UB<63M1VT-5N:>?
MN-O8CTK60_/ALQZ)ZT55]V2TVS1-:>6BJN*IT)MRS6N*UK_LQ69G]6Q0#18\
MF75XL6';WVV2L5_7,QL_RI9^].ZRKEUCT9-4UE0M'8)'G].E5)D*O>8O)2Y7
MKUJKS#J:^7R]*T(@Y'Q/S.R6_DVU^68_5U<<>C$KN?B!6I/._2XX_P#5Q\.Z
M.M_YW?=5/3^GJVK_``(C"8U&@"Z7BCQ&VIRYSU.)X%"I;L=M2X\C.MA71ES^
M6<*M+JE*J_+=I5ND^\266U^AV]I='I"DU4JK;*7'D8EQ=QCNG@[=_OO7VZVI
MOMC%AK/I\ENY'
&L]:\Q/36E;Y*7E
6JV8\TP_E6?WAMQ")5LP:R
M283=X5;D+HJKMUN4B='@Q>B5T;?E)=73S:%F<\<\4XN$.'\N]K5Z^IF8QXJ]
MJV6T3U=O^C$1-K=C;%9B)VS"`/-]Y0:OG9S-TG!V._>=UUK.IUF2-G6QZ3%:
MD99I$]G)>;TQ8^BT1?)6UHFE;)+=X:IY9[CY8:0>QCC-LO">->A,]UWBNI,>
MK8D0;5C^!8SEMA5=
UII2U8FDSCZTXXQ4KDM>UYM%*3
M:AP7Y48;C.ZMX67D1,I!U9R]L.68QLZ\LT72'CM^RF==YT2_/T2T^XQ:VU9#
M/B+=HA7HWI2'U_(:74R_CWA+7:G<>@S\.1UM[;FR8[X*SV;UQQ6)I'8VV])2
MT1_*ZLUCIF$*^;ESGX?W7S`XBW;S0OWO@WCG3:G3Z_+$3%<.746R6KFMLZTU
MI$YLV.9B)[WWV,D^EI*O.O>W%K74&S[/M_<7++0%RXW8'?86:0+I8