UNITED STATES
SECURITIES AND EXCHANGE COMMISSION
WASHINGTON, DC 20549
FORM 8-K
CURRENT REPORT
PURSUANT TO SECTION 13 OR 15(d) OF THE
SECURITIES EXCHANGE ACT OF 1934
Date of report (Date of earliest event reported) | October 28, 2013 |
SEACOAST BANKING CORPORATION OF FLORIDA |
(Exact Name of Registrant as Specified in Charter) |
Florida | 1-13660 | 59-2260678 | ||
(State or Other Jurisdiction of Incorporation) |
(Commission File Number |
(IRS Employer Identification No.) |
815 Colorado Avenue, Stuart, FL | 34994 | |
(Address of Principal Executive Offices) | (Zip Code) |
Registrant’s telephone number, including area code | (772) 287-4000 |
Check the appropriate box below if the Form 8-K filing is intended to simultaneously satisfy the filing obligation of the registrant under any of the following provisions (see General Instruction A.2.)
¨ | Written communications pursuant to Rule 425 under the Securities Act (17 CFR 230.425) |
¨ | Soliciting material pursuant to Rule 14a-12 under the Exchange Act (17 CFR 240.14a-12) |
¨ | Pre-commencement communications pursuant to Rule 14d-2(b) under the Exchange Act (17 CFR 240.14d-2(b)) |
¨ | Pre-commencement communications pursuant to Rule 13e-4(c) under the Exchange Act (17 CFR 240.13e-4(c)) |
SEACOAST BANKING CORPORATION OF FLORIDA
Item 2.02 | Results of Operations and Financial Condition |
On October 28, 2013, the Seacoast Banking Corporation of Florida (“Seacoast” or the “Company”) announced its financial results for the third quarter ended September 30, 2013.
A copy of the press release announcing Seacoast’s results for the third quarter ended September 30, 2013 is attached hereto as Exhibit 99.1 and incorporated herein by reference.
Item 7.01 | Regulation FD Disclosure |
On October 28, 2013, Seacoast held an investor conference call to discuss its financial results for the third quarter ended September 30, 2013. A transcript of this conference call is attached hereto as Exhibit 99.2 and incorporated herein by reference. Also attached as Exhibit 99.3 are charts (available on the Company’s website at www.seacoastbanking.net) containing information used in the conference call and incorporated herein by reference. All information included in the transcript and the charts is presented as of September 30, 2013, and the Company does not assume any obligation to correct or update said information in the future.
The information in Items 2.02 and 7.01, as well as Exhibits 99.1, 99.2 and 99.3, is being furnished and shall not be deemed “filed” for purposes of Section 18 of the Securities Exchange Act of 1934, nor shall it be deemed incorporated by reference in any filing under the Securities Act of 1933.
page 2 of 5 |
Item 9.01 | Financial Statements and Exhibits |
(d) Exhibits
Exhibit No. |
Description | |
99.1 | Press Release dated October 28, 2013 with respect to Seacoast’s financial results for the third quarter ended September 30, 2013 | |
99.2 | Transcript of Seacoast’s investor conference call held on October 28, 2013 to discuss the Company’s financial results for the third quarter ended September 30, 2013 | |
99.3 | Data on website containing information used in the conference call held on October 28, 2013 |
Exhibits 99.1, 99.2 and 99.3 referenced herein contain “forward-looking statements” within the meaning of Section 27A of the Securities Act of 1933 and Section 21E of the Securities Exchange Act of 1934, including, without limitation, statements about future financial and operating results, ability to realized deferred tax assets, cost savings, enhanced revenues, economic and seasonal conditions in our markets, and improvements to reported earnings that may be realized from cost controls and for integration of banks that we have acquired, as well as statements with respect to Seacoast’s objectives, expectations and intentions and other statements that are not historical facts. Actual results may differ from those set forth in the forward-looking statements.
Forward-looking statements include statements with respect to our beliefs, plans, objectives, goals, expectations, anticipations, estimates and intentions, and involve known and unknown risks, uncertainties and other factors, which may be beyond our control, and which may cause the actual results, performance or achievements of Seacoast to be materially different from future results, performance or achievements expressed or implied by such forward-looking statements. You should not expect us to update any forward-looking statements.
page 3 of 5 |
You can identify these forward-looking statements through our use of words such as “may,” “will,” “anticipate,” “assume,” “should,” “support”, “indicate,” “would,” “believe,” “contemplate,” “expect,” “estimate,” “continue,” “further”, “point to,” “project,” “could,” “intend” or other similar words and expressions of the future. These forward-looking statements may not be realized due to a variety of factors, including, without limitation: the effects of future economic and market conditions, including seasonality; governmental monetary and fiscal policies, as well as legislative, tax and regulatory changes; changes in accounting policies, rules and practices; the risks of changes in interest rates on the level and composition of deposits, loan demand, liquidity and the values of loan collateral, securities, and interest sensitive assets and liabilities; interest rate risks, sensitivities and the shape of the yield curve; the effects of competition from other commercial banks, thrifts, mortgage banking firms, consumer finance companies, credit unions, securities brokerage firms, insurance companies, money market and other mutual funds and other financial institutions operating in our market areas and elsewhere, including institutions operating regionally, nationally and internationally, together with such competitors offering banking products and services by mail, telephone, computer and the Internet; and the failure of assumptions underlying the establishment of reserves for possible loan losses. The risks of mergers and acquisitions, include, without limitation: unexpected transaction costs, including the costs of integrating operations; the risks that the businesses will not be integrated successfully or that such integration may be more difficult, time-consuming or costly than expected; the potential failure to fully or timely realize expected revenues and revenue synergies, including as the result of revenues following the merger being lower than expected; the risk of deposit and customer attrition; any changes in deposit mix; unexpected operating and other costs, which may differ or change from expectations; the risks of customer and employee loss and business disruption, including, without limitation, as the result of difficulties in maintaining relationships with employees; increased competitive pressures and solicitations of customers by competitors; as well as the difficulties and risks inherent with entering new markets.
All written or oral forward-looking statements attributable to us are expressly qualified in their entirety by this cautionary notice, including, without limitation, those risks and uncertainties described in our annual report on Form 10-K for the year ended December 31, 2012 under “Special Cautionary Notice Regarding Forward-Looking Statements” and “Risk Factors”, and otherwise in our SEC reports and filings. Such reports are available upon request from the Company, or from the Securities and Exchange Commission, including through the SEC’s Internet website at http://www.sec.gov.
page 4 of 5 |
SIGNATURES
Pursuant to the requirements of the Securities Exchange Act of 1934, the registrant has duly caused this report to be signed on its behalf by the undersigned hereunto duly authorized.
SEACOAST BANKING CORPORATION OF FLORIDA | ||
(Registrant) | ||
Date: October 30, 2013 | By: | /s/ William R. Hahl |
William R. Hahl | ||
Executive Vice President and Chief Financial Officer |
page 5 of 5 |
EXHIBIT 99.1
To Form 8-K dated October 28, 2013
NEWS RELEASE
SEACOAST BANKING CORPORATION OF FLORIDA
Dennis S. Hudson, III
Chairman and Chief Executive Officer
Seacoast Banking Corporation of Florida
(772) 288-6085
William R. Hahl
Executive Vice President/
Chief Financial Officer
(772) 221-2825
SEACOAST REPORTS EARNINGS OF $45.9 MILLION FOR THIRD QUARTER 2013
· | Valuation allowance on deferred tax assets reversed |
· | Pretax income increased 62.1% to $4.7 million compared with $2.9 in the second quarter 2013 |
· | All regulatory agreements terminated |
STUART, FL., October 28, 2013 – Seacoast Banking Corporation of Florida (NASDAQ-NMS: SBCF), today reported third quarter 2013 net income of $45,867,000 compared to $447,000 for the same quarter last year. Net income available to common shareholders for the third quarter 2013 totaled $44,930,000 or $0.47 per diluted common share, compared with a net loss of $490,000 or $0.01 per diluted common share for 2012. The results include an income tax benefit of $41,188,000 that includes the reversal of the valuation allowance on the net deferred tax assets for the quarter ended September 30, 2013.
- continued -
Third quarter’s net income before taxes increased to $4.7 million compared to $447,000 for the third quarter 2012 and were significantly improved compared to the second quarter’s $2.9 million. The improvements in net income before taxes, year over year, are driven by our investments in loan production personnel, digital technologies, and the effects of asset quality improvements and expense management.
The quarter was highlighted by two important events: the termination of all regulatory agreements by the Office of the Comptroller of the Currency as a result of the continued reduction in credit issues and improved operating results from 2010 forward and the reversal of the valuation allowance for deferred tax assets.
Revenue and growth initiatives continue to produce results
· | Noninterest income (excluding securities gains) year to date (YTD) up 15.9 percent |
· | Ending net loan balances up 5.2 percent compared to a year ago |
· | Noninterest income to total revenue YTD increased to 27.3 percent compared to 24.6 percent a year ago |
Expense reductions remain on target
· | Total expenses YTD down $6.3 million or 10.0 percent |
· | Core expenses down $2.3 million or 4.0 percent YTD compared to year ago |
· | Targeting at least $7.4 million in reduced expenses for 2013 |
- continued -
Investments in loan production personnel producing results
· | Higher loan production YTD of $430.3 million, up 29.9 percent compared to 2012 |
· | Much stronger commercial production of $138.3 million YTD, a $78.5 million increase over 2012 |
· | Residential loan production increased $21.1 million YTD and totaled $198.3 million |
“The key to revenue growth in this low interest rate environment continues to be growing new households and business customers, increasing services per household, and growing our retail and commercial loan portfolios. Year to date loan growth and noninterest income have improved indicating we are expanding both the number of new customers while increasing our share of wallet of all customers. Total revenue continued to increase this quarter and we are on track to achieve our expense reduction goals for the year,” said Dennis S. Hudson, III Chairman and CEO.
Growth Initiatives Build Core Earnings
· | Total revenues, excluding securities gains for the quarter ended September 30, 2013 were $22.9 million, compared to $22.4 million for the second quarter 2013 and up $1.3 million compared to third quarter 2012. YTD revenues were $67.3 million compared to $64.4 million a year ago; |
· | Period-end noninterest bearing deposits totaled $452.9 million at September 30, 2013, up $43.8 million or 10.7 percent from the same quarter last year; |
- continued -
· | Third quarter average loans, net increased $8.6 million linked quarter or 2.7 percent annualized and were up $55.0 million year over year or a growth rate of 4.5 percent; |
· | Average total deposits increased $33.8 million or 2.0 percent year over year; and |
· | Several factors contributed to the sequential improvement in the net interest margin by 13 basis points to 3.25%. While loan growth, increased yields on the investment portfolio and a stable cost of funds aided the margin, the recovery of interest income related to nonaccrual loans ($505,000) provided 10 basis points improvement for the third quarter. |
Over the last several years, our focused tactical initiatives have produced strong organic core customer deposit account growth and increased core customer funding. Core customer funding totaled $1.6 billion at September 30, 2013, up $91.5 million from last year’s third quarter and up 21.3 percent since the third quarter 2011. In addition, deposit mix continued to improve with noninterest bearing deposits increasing to almost 27 percent of total deposits at quarter end 2013.
Third Quarter | Third Quarter | Third Quarter | 2013 vs 2012 | 2012 vs 2011 | ||||||||||||||||
(Dollars in thousands) | 2013 | 2012 | 2011 | Change | Change | |||||||||||||||
Customer Relationship Funding | ||||||||||||||||||||
Demand deposits (noninterest bearing) | $ | 452,949 | $ | 409,145 | $ | 324,256 | 10.7 | % | 26.2 | % | ||||||||||
NOW | 440,869 | 420,477 | 391,318 | 4.8 | 7.5 | |||||||||||||||
Money market accounts | 334,678 | 348,275 | 327,654 | (3.9 | ) | 6.3 | ||||||||||||||
Savings deposits | 187,181 | 158,208 | 128,543 | 18.3 | 23.1 | |||||||||||||||
Time certificates of deposit | 283,233 | 343,361 | 489,503 | (17.5 | ) | (29.9 | ) | |||||||||||||
Total deposits | 1,698,910 | 1,679,466 | 1,661,274 | 1.2 | 1.1 | |||||||||||||||
Sweep repurchase agreements | 134,338 | 122,393 | 106,562 | 9.8 | 14.9 | |||||||||||||||
Total core customer funding (1) | 1,550,015 | 1,458,498 | 1,278,333 | 6.3 | 14.1 | |||||||||||||||
Demand deposit mix (noninterest bearing) | 26.7 | % | 24.4 | % | 19.5 | % |
(1) Total deposits and sweep repurchase agreements, excluding certificates of deposits.
- continued -
Additional growth highlights for third quarter 2013:
· | Interchange fees and service charges on deposit accounts grew by 21.4% and 7.5%, respectively, compared to last year’s third quarter; |
· | Fees from wealth management services totaled $1,050,000 for the third quarter, up $253,000 or 31.7 percent compared to a year ago; and |
· | Mortgage banking fees YTD increased $765,000 or 28.5 percent compared to a year ago but were lower compared to the sequential quarter by $181,000, as a result of higher interest rates during the quarter reducing the demand for mortgage loans. |
The following details noninterest income for the third quarter ended September 30, 2013 compared to the last four quarters:
Third | Second | First | Fourth | Third | ||||||||||||||||
Quarter | Quarter | Quarter | Quarter | Quarter | ||||||||||||||||
(Dollars in thousands) | 2013 | 2013 | 2013 | 2012 | 2012 | |||||||||||||||
Noninterest Income: | ||||||||||||||||||||
Service charges on deposit accounts | $ | 1,741 | $ | 1,641 | $ | 1,551 | $ | 1,677 | $ | 1,620 | ||||||||||
Trust income | 667 | 675 | 676 | 592 | 550 | |||||||||||||||
Mortgage banking fees | 1,075 | 1,256 | 1,114 | 1,030 | 1,155 | |||||||||||||||
Brokerage commissions and fees | 383 | 362 | 425 | 292 | 247 | |||||||||||||||
Marine finance fees | 283 | 419 | 272 | 258 | 279 | |||||||||||||||
Interchange income | 1,358 | 1,388 | 1,264 | 1,157 | 1,119 | |||||||||||||||
Other deposit based EFT fees | 77 | 87 | 98 | 83 | 70 | |||||||||||||||
Other | 503 | 507 | 531 | 520 | 639 | |||||||||||||||
Total | 6,087 | 6,335 | 5,931 | 5,609 | 5,679 | |||||||||||||||
Loss on sale of commercial loan held for sale | 0 | 0 | 0 | (1,238 | ) | 0 | ||||||||||||||
Securities gains, net | 280 | 114 | 25 | 582 | 48 | |||||||||||||||
$ | 6,367 | $ | 6,449 | $ | 5,956 | $ | 4,953 | $ | 5,727 |
- continued -
Credit Quality Improves to Pre-Crisis Levels
· | The Company had net recoveries of previously charged off loans of $704,000 during the third quarter 2013 which offset the need for a provision for loan losses. |
· | Net loss on other real estate owned and repossessed assets declined by $322,000 or 59.2 percent during the third quarter year over year, as other real estate owned was reduced by 44.5 percent during the quarter. |
· | Restructured loans reduced to $25.5 million down $18.7 million compared to a year ago; and |
· | Nonperforming loans totaled 2.27 percent of loans, compared with 2.63 percent last quarter and 4.40 percent one year ago; |
· | Nonperforming assets to total assets of 1.60 percent is lower compared to 2.56 percent a year ago; |
· | Classified assets as a ratio of tier one capital plus the allowance is down to 22.7% and special mention assets ratio declined to 4.6% at quarter end. |
- continued -
Third | Second | First | Fourth | Third | ||||||||||||||||
Quarter | Quarter | Quarter | Quarter | Quarter | ||||||||||||||||
(Dollars in thousands ) | 2013 | 2013 | 2013 | 2012 | 2012 | |||||||||||||||
Net charge-offs (recoveries) | $ | (704 | ) | $ | 2,027 | $ | 1,517 | $ | 2,151 | $ | 2,416 | |||||||||
Net charge-offs (recoveries) to average loans | (0.22 | )% | 0.64 | % | 0.49 | % | 0.69 | % | 0.79 | % | ||||||||||
Loan loss provision | 0 | $ | 565 | $ | 953 | $ | 1,136 | $ | 900 | |||||||||||
Allowance to loans at end of period | 1.64 | % | 1.59 | % | 1.76 | % | 1.80 | % | 1.92 | % | ||||||||||
Restructured loans (accruing) | $ | 25,509 | $ | 29,612 | $ | 41,170 | $ | 41,946 | $ | 44,179 | ||||||||||
Nonperforming loans | $ | 28,724 | $ | 33,266 | $ | 35,208 | $ | 40,955 | $ | 44,450 | ||||||||||
Other real estate owned | 5,589 | 10,063 | 10,850 | 11,887 | 8,888 | |||||||||||||||
Nonperforming assets | $ | 34,313 | $ | 43,329 | $ | 46,058 | $ | 52,842 | $ | 53,338 | ||||||||||
Nonaccrual loans and accruing loans 90 days or more past due to loans outstanding at end of period | 2.27 | % | 2.63 | % | 2.88 | % | 3.34 | % | 3.70 | % | ||||||||||
Nonperforming assets to total assets | 1.60 | 1.98 | 2.09 | 2.43 | 2.56 |
Noninterest Expenses
Previously announced plans to reduce both core operating expenses and total expenses were fully implemented at year end 2012 which meaningfully reduced our expense structure for 2013. Total noninterest expenses fell by $1.8 million or 9.0 percent for the quarter compared with the prior year. Contributing to the decline were lower expenses related to OREO and other asset disposition costs as overall asset quality continued to improve as well as reduced core operating expenses.
- continued -
Core operating expenses for the quarter were reduced by $745 thousand or 4.0 percent compared with the prior year and were down $1.9 million or 3.3 percent for the first nine months compared to 2012. Core operating expenses for the quarter included $553 thousand in salaries and employee benefits expense associated with investments in new lending and credit personnel related to our growth initiatives.
Noninterest expenses for the third quarter 2013 are presented below compared to the prior four quarters:
- continued -
Third | Second | First | Fourth | Third | ||||||||||||||||
Quarter | Quarter | Quarter | Quarter | Quarter | ||||||||||||||||
(Dollars in thousands) | 2013 | 2013 | 2013 | 2012 | 2012 | |||||||||||||||
Noninterest Expense: | ||||||||||||||||||||
Salaries and wages | $ | 7,533 | $ | 7,892 | $ | 7,437 | $ | 7,258 | $ | 7,442 | ||||||||||
Employee benefits | 1,713 | 1,823 | 2,223 | 1,860 | 1,924 | |||||||||||||||
Outsourced data processing costs | 1,657 | 1,631 | 1,498 | 1,904 | 1,923 | |||||||||||||||
Telephone / data lines | 318 | 325 | 285 | 293 | 299 | |||||||||||||||
Occupancy expense | 1,824 | 1,775 | 1,755 | 1,896 | 1,876 | |||||||||||||||
Furniture and equipment expense | 605 | 571 | 561 | 585 | 556 | |||||||||||||||
Marketing expense | 456 | 685 | 449 | 707 | 785 | |||||||||||||||
Legal and professional fees | 874 | 949 | 796 | 1,114 | 1,122 | |||||||||||||||
FDIC assessments | 713 | 720 | 717 | 697 | 695 | |||||||||||||||
Amortization of intangibles | 195 | 197 | 195 | 195 | 196 | |||||||||||||||
Other | 2,203 | 2,512 | 2,153 | 2,428 | 2,018 | |||||||||||||||
Total Core Operating Expense | 18,091 | 19,080 | 18,069 | 18,937 | 18,836 | |||||||||||||||
Severance and organizational changes | 24 | 10 | 33 | 84 | 839 | |||||||||||||||
Branch consolidation | 0 | 0 | 0 | 407 | 232 | |||||||||||||||
Recovery of prior legal fees | 0 | (650 | ) | 0 | 0 | (500 | ) | |||||||||||||
Net loss on OREO and repossessed assets | 229 | 493 | 567 | 157 | 561 | |||||||||||||||
Asset dispositions expense | 159 | 111 | 290 | 200 | 364 | |||||||||||||||
Total | 18,503 | $ | 19,044 | $ | 18,959 | $ | 19,785 | $ | 20,332 |
Over the past year, we redeployed overhead savings into additional loan production personnel and new digital products while simultaneously reducing overall operating expenses. We believe the investments are particularly important components of our growth over the last twelve months. Annual salaries and benefits added to our lending and credit support teams during each of the past two years and YTD for 2013 are presented in the table below:
Annual Salaries and Benefits Added to Lending and Credit Support Teams
- continued -
Year to | ||||||||||||||||
Date | Year-end | |||||||||||||||
(Dollars in thousands) | 2013 | 2012 | 2011 | Total | ||||||||||||
Loan production and support personnel: | ||||||||||||||||
Commercial | $ | 553 | $ | 2,065 | $ | 527 | ||||||||||
Residential | 65 | 396 | 248 | |||||||||||||
$ | 618 | $ | 2,461 | $ | 775 | $ | 3,854 |
As shown in the table below, total loan originations and pipeline balances have been growing over the prior four quarters and totaled over $88 million for the third quarter 2013 as a result of the investments in revenue producing personnel in 2011 and 2012. Also included in the table below, are the salaries and benefits associated with new commercial loan officers and credit support personnel with tenures of six months or less for each quarter of 2013 and the last two quarters of 2012. These costs are included in core operating expenses, are significant and are considered investments that impact our efficiency in the short run.
- continued -
Third | Second | First | Fourth | Third | ||||||||||||||||
Quarter | Quarter | Quarter | Quarter | Quarter 2012 | ||||||||||||||||
(Dollars in thousands) | 2013 | 2013 | 2012 | 2012 | ||||||||||||||||
Commercial pipeline | $ | 54,600 | $ | 46,850 | $ | 63,842 | $ | 26,809 | $ | 45,769 | ||||||||||
Commercial loans closed | 32,988 | 68,388 | 36,973 | 49,190 | 24,628 | |||||||||||||||
Total loan originations and pipeline | $ | 87,588 | $ | 115,238 | $ | 100,815 | $ | 75,999 | $ | 70,397 | ||||||||||
Salaries and benefits, lenders and support personnel < six months | $ | 553 | $ | 585 | $ | 538 | $ | 345 | $ | 332 | ||||||||||
Total revenues, excluding securities gains and loss on sale of commercial Loan | $ | 22,902 | $ | 22,449 | $ | 21,931 | $ | 21,817 | $ | 21,631 |
Our successful customer growth strategy has included investments in enhancing the customer experience by more conveniently providing customer access to their accounts through digital technologies. Nearly forty percent of our online customers have adopted our mobile product offerings and mobile users grew by over 92 percent annualized in third quarter 2013. The investments have included the addition of 24 new products to our digital product suite. We believe these investments in digital delivery and products have contributed to increasing core customer funding (10.4 percent CAGR since 2010) and fee revenues which increased 15.9 percent during the first nine months of 2013 compared to 2012. We are building a more integrated distribution system which will allow us to continue to reduce our fixed costs in the future as a result of the new investments designed to better serve our customers.
- continued -
The Company’s tier 1 capital ratio was 16.1 percent and the total risk based capital ratio was 17.3 percent at September 30, 2013. The tangible common equity ratio was 7.35 percent at September 30, 2013, reflecting the reversal of the deferred tax valuation allowance. Our improved earnings and lower credit risk permitted recovery of the allowance.
The Company will host a conference call on Monday, October 28, 2013 at 10:00 a.m. (Eastern Time) to discuss its earnings results and business trends. Investors may call in (toll-free) by dialing (888) 517-2458 (access code: 7789246; leader: Dennis S. Hudson). Charts will be used during the conference call and may be accessed at Seacoast’s website at www.seacoastbanking.net by selecting “Presentations” under the heading “Investor Services”. A replay of the conference call will be available beginning the afternoon of October 28 by dialing (888) 843-7419 (domestic), using the passcode 7789246.
Alternatively, individuals may listen to the live webcast of the presentation by visiting the Company’s website at www.seacoastbanking.net. The link to the live audio webcast is located in the subsection “Presentations” under the heading “Investor Services”. Beginning the afternoon of October 28, 2013, an archived version of the webcast can be accessed from this same subsection of the website. This webcast will be archived and available for one year.
With over $2.1 billion in assets, 34 traditional branches and offering business banking loan and deposit products and services in 5 Accelerate offices fueled by the power of Seacoast National Bank, Seacoast is one of the largest community banks headquartered in Florida. Offices stretch from Broward County north through the Treasure Coast and into Orlando, and west to Okeechobee and surrounding counties.
- continued -
Cautionary Notice Regarding Forward-Looking Statements
This press release contains “forward-looking statements” within the meaning of Section 27A of the Securities Act of 1933 and Section 21E of the Securities Exchange Act of 1934, including, without limitation, statements about future financial and operating results, ability to realized deferred tax assets, cost savings, enhanced revenues, economic and seasonal conditions in our markets, and improvements to reported earnings that may be realized from cost controls and for integration of banks that we have acquired, as well as statements with respect to Seacoast’s objectives, expectations and intentions and other statements that are not historical facts. Actual results may differ from those set forth in the forward-looking statements.
Forward-looking statements include statements with respect to our beliefs, plans, objectives, goals, expectations, anticipations, estimates and intentions, and involve known and unknown risks, uncertainties and other factors, which may be beyond our control, and which may cause the actual results, performance or achievements of Seacoast to be materially different from future results, performance or achievements expressed or implied by such forward-looking statements. You should not expect us to update any forward-looking statements.
You can identify these forward-looking statements through our use of words such as “may,” “will,” “anticipate,” “assume,” “should,” “support”, “indicate,” “would,” “believe,” “contemplate,” “expect,” “estimate,” “continue,” “further”, “point to,” “project,” “could,” “intend” or other similar words and expressions of the future. These forward-looking statements may not be realized due to a variety of factors, including, without limitation: the effects of future economic and market conditions, including seasonality; governmental monetary and fiscal policies, as well as legislative, tax and regulatory changes; changes in accounting policies, rules and practices; the risks of changes in interest rates on the level and composition of deposits, loan demand, liquidity and the values of loan collateral, securities, and interest sensitive assets and liabilities; interest rate risks, sensitivities and the shape of the yield curve; the effects of competition from other commercial banks, thrifts, mortgage banking firms, consumer finance companies, credit unions, securities brokerage firms, insurance companies, money market and other mutual funds and other financial institutions operating in our market areas and elsewhere, including institutions operating regionally, nationally and internationally, together with such competitors offering banking products and services by mail, telephone, computer and the Internet; and the failure of assumptions underlying the establishment of reserves for possible loan losses. The risks of mergers and acquisitions, include, without limitation: unexpected transaction costs, including the costs of integrating operations; the risks that the businesses will not be integrated successfully or that such integration may be more difficult, time-consuming or costly than expected; the potential failure to fully or timely realize expected revenues and revenue synergies, including as the result of revenues following the merger being lower than expected; the risk of deposit and customer attrition; any changes in deposit mix; unexpected operating and other costs, which may differ or change from expectations; the risks of customer and employee loss and business disruption, including, without limitation, as the result of difficulties in maintaining relationships with employees; increased competitive pressures and solicitations of customers by competitors; as well as the difficulties and risks inherent with entering new markets.
- continued -
All written or oral forward-looking statements attributable to us are expressly qualified in their entirety by this cautionary notice, including, without limitation, those risks and uncertainties described in our annual report on Form 10-K for the year ended December 31, 2012 under “Special Cautionary Notice Regarding Forward-Looking Statements” and “Risk Factors”, and otherwise in our SEC reports and filings. Such reports are available upon request from the Company, or from the Securities and Exchange Commission, including through the SEC’s Internet website at http://www.sec.gov.
- continued -
FINANCIAL HIGHLIGHTS | (Unaudited) |
SEACOAST BANKING CORPORATION OF FLORIDA AND SUBSIDIARIES |
(Dollars in thousands, except share data) | Three Months Ended | Nine Months Ended | ||||||||||||||||||
September 30, | June 30, | September 30, | September 30, | September 30, | ||||||||||||||||
2013 | 2013 | 2012 | 2013 | 2012 | ||||||||||||||||
Summary of Earnings | ||||||||||||||||||||
Net income (loss) | $ | 45,867 | $ | 2,954 | $ | 447 | $ | 50,865 | $ | (950 | ) | |||||||||
Net income available to common shareholders (loss) | 44,930 | 2,017 | (490 | ) | 48,054 | (3,761 | ) | |||||||||||||
Net interest income (1) | 16,872 | 16,172 | 15,995 | 49,099 | 48,736 | |||||||||||||||
Net interest margin (1), (2) | 3.25 | 3.12 | 3.17 | 3.17 | 3.22 | |||||||||||||||
Performance Ratios | ||||||||||||||||||||
Return on average assets-GAAP basis (2), (3), (5) | 8.45 | % | 0.54 | % | 0.08 | % | 3.14 | % | (0.06 | )% | ||||||||||
Return on average shareholders' equity-GAAP basis (2), (3) | 108.27 | 7.19 | 1.09 | 41.16 | (0.76 | ) | ||||||||||||||
Return on average tangible common shareholders' equity-GAAP basis (2), (3), (4), (5) | 155.25 | 7.53 | 0.11 | 59.68 | (0.04 | ) | ||||||||||||||
Efficiency ratio (6) | 78.05 | 81.05 | 88.64 | 80.16 | 89.21 | |||||||||||||||
Noninterest income to total revenue | 26.58 | 28.22 | 26.25 | 27.28 | 24.57 | |||||||||||||||
Per Share Data | ||||||||||||||||||||
Net income (loss) diluted-GAAP basis | $ | 0.47 | $ | 0.02 | $ | (0.01 | ) | $ | 0.51 | $ | (0.04 | ) | ||||||||
Net income (loss) basic-GAAP basis | 0.48 | 0.02 | (0.01 | ) | 0.51 | (0.04 | ) | |||||||||||||
Book value per share common | 1.63 | 1.18 | 1.25 | 1.63 | 1.25 | |||||||||||||||
Tangible book value per share | 2.15 | 1.70 | 1.75 | 2.15 | 1.75 | |||||||||||||||
Tangible common book value per share (4) | 1.62 | 1.17 | 1.23 | 1.62 | 1.23 | |||||||||||||||
Cash dividends declared | 0.00 | 0.00 | 0.00 | 0.00 | 0.00 |
(1) | Calculated on a fully taxable equivalent basis using amortized cost. |
(2) | These ratios are stated on an annualized basis and are not necessarily indicative of future periods. |
(3) | The calculation of ROA and ROE do not include the mark-to-market unrealized gains (losses) because the unrealized gains (losses) are not included in net income (loss). |
(4) | The Company defines tangible common equity as total shareholders equity less preferred stock and intangible assets. |
(5) | Excluding the income tax benefit related to the reversal of the valuation allowance for deferred tax assets and reflecting tax provisioning of $1,805 for the third quarter 2013 and $3.752 for year-to-date 2013, adjusted return on average assets for these periods was 0.53 percent and 0.37 percent, respectively, and adjusted return on average shareholders' equity was 6.78 percent and 4.81 percent, respectively. |
(6) | Defined as (non-interest expense less foreclosed property expense and amortization of intangibles) divided by net operating revenue (net interest income on a fully taxable equivalent basis plus non-interest income excluding securities gains) |
FINANCIAL HIGHLIGHTS |
SEACOAST BANKING CORPORATION OF FLORIDA AND SUBSIDIARIES |
September 30, | June 30, | September 30, | ||||||||||
(Dollars in thousands, except share data) | 2013 | 2013 | 2012 | |||||||||
Selected Financial Data | ||||||||||||
Total assets | $ | 2,150,503 | $ | 2,183,680 | $ | 2,081,693 | ||||||
Securities available for sale (at fair value) | 650,445 | 672,809 | 588,248 | |||||||||
Securities held for investment (at amortized cost) | 0 | 0 | 15,556 | |||||||||
Net loans | 1,243,676 | 1,245,815 | 1,179,359 | |||||||||
Deposits | 1,698,910 | 1,738,609 | 1,679,466 | |||||||||
Total shareholders' equity | 204,584 | 161,248 | 167,209 | |||||||||
Common shareholders' equity | 154,901 | 111,878 | 118,775 | |||||||||
Average Balances (Year-to-Date) | ||||||||||||
Total average assets | $ | 2,167,077 | $ | 2,173,810 | $ | 2,118,784 | ||||||
Less: intangible assets | 1,202 | 1,299 | 1,988 | |||||||||
Total average tangible assets | $ | 2,165,875 | $ | 2,172,511 | $ | 2,116,796 | ||||||
Total average equity | $ | 165,226 | $ | 163,776 | $ | 166,066 | ||||||
Less: intangible assets | 1,202 | 1,299 | 1,988 | |||||||||
Total average tangible equity | $ | 164,024 | $ | 162,477 | $ | 164,078 | ||||||
Credit Analysis | ||||||||||||
Net charge-offs year-to-date | $ | 2,840 | $ | 3,544 | $ | 12,106 | ||||||
Net charge-offs to average loans (annualized) | 0.30 | % | 0.57 | % | 1.32 | % | ||||||
Loan loss provision year-to-date | $ | 1,518 | $ | 1,518 | $ | 9,660 | ||||||
Allowance to loans at end of period | 1.64 | % | 1.59 | % | 1.92 | % | ||||||
Nonperforming loans | $ | 28,724 | $ | 33,266 | $ | 44,450 | ||||||
Other real estate owned | 5,589 | 10,063 | 8,888 | |||||||||
Total nonperforming assets | $ | 34,313 | $ | 43,329 | $ | 53,338 | ||||||
Restructured loans (accruing) | $ | 25,509 | $ | 29,612 | $ | 44,179 | ||||||
Nonperforming loans to loans at end of period | 2.27 | % | 2.63 | % | 4.40 | % | ||||||
Nonperforming assets to total assets | 1.60 | % | 1.98 | % | 2.56 | % |
CONDENSED CONSOLIDATED STATEMENTS OF INCOME | (Unaudited) | 10/22/13 |
SEACOAST BANKING CORPORATION OF FLORIDA AND SUBSIDIARIES |
Three Months Ended | Nine Months Ended | |||||||||||||||
September 30, | September 30, | |||||||||||||||
(Dollars in thousands, except per share data) | 2013 | 2012 | 2013 | 2012 | ||||||||||||
Interest on securities: | ||||||||||||||||
Taxable | $ | 3,212 | $ | 3,190 | $ | 9,404 | $ | 10,834 | ||||||||
Nontaxable | 17 | 21 | 52 | 68 | ||||||||||||
Interest and fees on loans | 14,756 | 14,371 | 43,047 | 43,852 | ||||||||||||
Interest on federal funds sold and other investments | 192 | 243 | 644 | 727 | ||||||||||||
Total Interest Income | 18,177 | 17,825 | 53,147 | 55,481 | ||||||||||||
Interest on deposits | 187 | 380 | 586 | 1,247 | ||||||||||||
Interest on time certificates | 470 | 738 | 1,503 | 3,371 | ||||||||||||
Interest on borrowed money | 705 | 755 | 2,129 | 2,262 | ||||||||||||
Total Interest Expense | 1,362 | 1,873 | 4,218 | 6,880 | ||||||||||||
Net Interest Income | 16,815 | 15,952 | 48,929 | 48,601 | ||||||||||||
Provision for loan losses | 0 | 900 | 1,518 | 9,660 | ||||||||||||
Net Interest Income After Provision for Loan Losses | 16,815 | 15,052 | 47,411 | 38,941 | ||||||||||||
Noninterest income: | ||||||||||||||||
Service charges on deposit accounts | 1,741 | 1,620 | 4,933 | 4,568 | ||||||||||||
Trust income | 667 | 550 | 2,018 | 1,687 | ||||||||||||
Mortgage banking fees | 1,075 | 1,155 | 3,445 | 2,680 | ||||||||||||
Brokerage commissions and fees | 383 | 247 | 1,170 | 779 | ||||||||||||
Marine finance fees | 283 | 279 | 974 | 853 | ||||||||||||
Interchange income | 1,358 | 1,119 | 4,010 | 3,344 | ||||||||||||
Other deposit based EFT fees | 77 | 70 | 262 | 253 | ||||||||||||
Other | 503 | 639 | 1,541 | 1,671 | ||||||||||||
6,087 | 5,679 | 18,353 | 15,835 | |||||||||||||
Securities gains, net | 280 | 48 | 419 | 7,037 | ||||||||||||
Total Noninterest Income | 6,367 | 5,727 | 18,772 | 22,872 | ||||||||||||
Noninterest expenses: | ||||||||||||||||
Salaries and wages | 7,557 | 8,103 | 22,929 | 22,593 | ||||||||||||
Employee benefits | 1,713 | 1,924 | 5,759 | 5,850 | ||||||||||||
Outsourced data processing costs | 1,657 | 1,923 | 4,786 | 5,478 | ||||||||||||
Telephone / data lines | 318 | 299 | 928 | 885 | ||||||||||||
Occupancy | 1,824 | 2,080 | 5,354 | 5,905 | ||||||||||||
Furniture and equipment | 605 | 570 | 1,737 | 1,672 | ||||||||||||
Marketing | 456 | 785 | 1,590 | 2,388 | ||||||||||||
Legal and professional fees | 874 | 714 | 1,969 | 4,127 | ||||||||||||
FDIC assessments | 713 | 695 | 2,150 | 2,108 | ||||||||||||
Amortization of intangibles | 195 | 196 | 587 | 593 | ||||||||||||
Asset dispositions expense | 159 | 364 | 560 | 1,259 | ||||||||||||
Net loss on other real estate owned and repossessed assets | 229 | 561 | 1,289 | 3,310 | ||||||||||||
Other | 2,203 | 2,118 | 6,868 | 6,595 | ||||||||||||
Total Noninterest Expenses | 18,503 | 20,332 | 56,506 | 62,763 | ||||||||||||
Income Before Income Taxes | 4,679 | 447 | 9,677 | (950 | ) | |||||||||||
Income taxes (benefit) | (41,188 | ) | 0 | (41,188 | ) | 0 | ||||||||||
Net Income | 45,867 | 447 | 50,865 | (950 | ) | |||||||||||
Preferred stock dividends and accretion on preferred stock discount | 937 | 937 | 2,811 | 2,811 | ||||||||||||
Net Income Available to Common Shareholders | $ | 44,930 | $ | (490 | ) | $ | 48,054 | $ | (3,761 | ) | ||||||
Per share of common stock: | ||||||||||||||||
Net income diluted | $ | 0.47 | $ | (0.01 | ) | $ | 0.51 | $ | (0.04 | ) | ||||||
Net income basic | 0.48 | (0.01 | ) | 0.51 | (0.04 | ) | ||||||||||
Cash dividends declared | 0.00 | 0.00 | 0.00 | 0.00 | ||||||||||||
Average diluted shares outstanding | 95,490,153 | 94,481,997 | 94,936,042 | 94,443,215 | ||||||||||||
Average basic shares outstanding | 94,029,583 | 93,777,662 | 93,983,629 | 93,688,003 |
CONDENSED CONSOLIDATED BALANCE SHEETS | (Unaudited) | 10/22/13 |
SEACOAST BANKING CORPORATION OF FLORIDA AND SUBSIDIARIES |
September 30, | December 31, | September 30, | ||||||||||
(Dollars in thousands, except share data) | 2013 | 2012 | 2012 | |||||||||
Assets | ||||||||||||
Cash and due from banks | $ | 36,977 | $ | 45,620 | $ | 30,935 | ||||||
Interest bearing deposits with other banks | 71,374 | 129,367 | 141,783 | |||||||||
Total Cash and Cash Equivalents | 108,351 | 174,987 | 172,718 | |||||||||
Securities: | ||||||||||||
Available for sale (at fair value) | 650,445 | 643,050 | 588,248 | |||||||||
Held for investment (at amortized cost) | 0 | 13,818 | 15,556 | |||||||||
Total Securities | 650,445 | 656,868 | 603,804 | |||||||||
Loans available for sale | 14,322 | 36,021 | 28,042 | |||||||||
Loans, net of deferred costs | 1,264,458 | 1,226,081 | 1,202,478 | |||||||||
Less: Allowance for loan losses | (20,782 | ) | (22,104 | ) | (23,119 | ) | ||||||
Net Loans | 1,243,676 | 1,203,977 | 1,179,359 | |||||||||
Bank premises and equipment, net | 34,651 | 34,465 | 34,884 | |||||||||
Other real estate owned | 5,589 | 11,887 | 8,888 | |||||||||
Other intangible assets | 914 | 1,501 | 1,697 | |||||||||
Other assets | 92,555 | 54,223 | 52,301 | |||||||||
$ | 2,150,503 | $ | 2,173,929 | $ | 2,081,693 | |||||||
Liabilities and Shareholders' Equity | ||||||||||||
Liabilities | ||||||||||||
Deposits | ||||||||||||
Demand deposits (noninterest bearing) | $ | 452,949 | $ | 422,833 | $ | 409,145 | ||||||
NOW | 440,869 | 509,371 | 420,477 | |||||||||
Savings deposits | 187,181 | 164,956 | 158,208 | |||||||||
Money market accounts | 334,678 | 343,915 | 348,275 | |||||||||
Other time certificates | 160,695 | 182,495 | 192,297 | |||||||||
Brokered time certificates | 11,323 | 8,203 | 8,429 | |||||||||
Time certificates of $100,000 or more | 111,215 | 127,188 | 142,635 | |||||||||
Total Deposits | 1,698,910 | 1,758,961 | 1,679,466 | |||||||||
Federal funds purchased and securities sold under agreements to repurchase, maturing within 30 days | 134,338 | 136,803 | 122,393 | |||||||||
Borrowed funds | 50,000 | 50,000 | 50,000 | |||||||||
Subordinated debt | 53,610 | 53,610 | 53,610 | |||||||||
Other liabilities | 9,061 | 9,009 | 9,015 | |||||||||
1,945,919 | 2,008,383 | 1,914,484 | ||||||||||
Shareholders' Equity | ||||||||||||
Preferred stock - Series A | 49,683 | 48,746 | 48,434 | |||||||||
Common stock | 9,492 | 9,484 | 9,481 | |||||||||
Additional paid in capital | 222,987 | 222,851 | 222,744 | |||||||||
Accumulated deficit | (70,557 | ) | (118,611 | ) | (117,914 | ) | ||||||
Treasury stock | (11 | ) | (62 | ) | (101 | ) | ||||||
211,594 | 162,408 | 162,644 | ||||||||||
Accumulated other comprehensive gain (loss), net | (7,010 | ) | 3,138 | 4,565 | ||||||||
Total Shareholders' Equity | 204,584 | 165,546 | 167,209 | |||||||||
$ | 2,150,503 | $ | 2,173,929 | $ | 2,081,693 | |||||||
Common Shares Outstanding | 94,911,529 | 94,837,170 | 94,810,684 |
Note: The balance sheet at December 31, 2012 has been derived from the audited financial statements at that date.
CONSOLIDATED QUARTERLY FINANCIAL DATA | (Unaudited) | 10/22/13 |
SEACOAST BANKING CORPORATION OF FLORIDA AND SUBSIDIARIES |
QUARTERS | ||||||||||||||||||||
2013 | 2012 | |||||||||||||||||||
(Dollars in thousands, except per share data) | Third | Second | First | Fourth | Third | |||||||||||||||
Net income (loss) | $ | 45,867 | $ | 2,954 | $ | 2,044 | $ | 240 | $ | 447 | ||||||||||
Operating Ratios | ||||||||||||||||||||
Return on average assets-GAAP basis (2),(3),(4) | 8.45 | % | 0.54 | % | 0.38 | % | 0.05 | % | 0.08 | % | ||||||||||
Return on average tangible assets (2),(3) | 8.48 | 0.57 | 0.41 | 0.07 | 0.11 | |||||||||||||||
Return on average shareholders' equity-GAAP basis (2),(3),(4) | 108.27 | 7.19 | 5.09 | 0.58 | 1.09 | |||||||||||||||
Efficiency ratio (5) | 78.05 | 81.05 | 81.45 | 87.97 | 88.64 | |||||||||||||||
Noninterest income to total revenue | 26.58 | 28.22 | 27.04 | 25.71 | 26.25 | |||||||||||||||
Net interest margin (1),(2) | 3.25 | 3.12 | 3.15 | 3.22 | 3.17 | |||||||||||||||
Average equity to average assets | 7.80 | 7.56 | 7.50 | 7.73 | 7.77 | |||||||||||||||
Credit Analysis | ||||||||||||||||||||
Net charge-offs (recoveries) | $ | (704 | ) | $ | 2,027 | $ | 1,517 | $ | 2,151 | $ | 2,416 | |||||||||
Net charge-offs to average loans (recoveries) | (0.22 | )% | 0.64 | % | 0.49 | % | 0.69 | % | 0.79 | % | ||||||||||
Loan loss provision | $ | 0 | $ | 565 | $ | 953 | $ | 1,136 | $ | 900 | ||||||||||
Allowance to loans at end of period | 1.64 | % | 1.59 | % | 1.76 | % | 1.80 | % | 1.92 | % | ||||||||||
Restructured loans (accruing) | $ | 25,509 | 29,612 | 41,170 | 41,946 | 44,179 | ||||||||||||||
Nonperforming loans | $ | 28,724 | 33,266 | 35,208 | 40,955 | 44,450 | ||||||||||||||
Other real estate owned | 5,589 | 10,063 | 10,850 | 11,887 | 8,888 | |||||||||||||||
Nonperforming assets | $ | 34,313 | $ | 43,329 | $ | 46,058 | $ | 52,842 | $ | 53,338 | ||||||||||
Nonperforming loans to loans at end of period | 2.27 | % | 2.63 | % | 2.88 | % | 3.34 | % | 3.70 | % | ||||||||||
Nonperforming assets to total assets | 1.60 | 1.98 | 2.09 | 2.43 | 2.56 | |||||||||||||||
Per Share Common Stock | ||||||||||||||||||||
Net income (loss) diluted-GAAP basis | $ | 0.47 | $ | 0.02 | $ | 0.01 | $ | (0.01 | ) | $ | (0.01 | ) | ||||||||
Net income (loss) basic-GAAP basis | 0.48 | 0.02 | 0.01 | (0.01 | ) | (0.01 | ) | |||||||||||||
Cash dividends declared | 0.00 | 0.00 | 0.00 | 0.00 | 0.00 | |||||||||||||||
Book value per share common | 1.63 | 1.18 | 1.24 | 1.23 | 1.25 | |||||||||||||||
Average Balances | ||||||||||||||||||||
Total average assets | $ | 2,153,830 | $ | 2,178,242 | $ | 2,169,329 | $ | 2,111,986 | $ | 2,096,694 | ||||||||||
Less: Intangible assets | 1,009 | 1,205 | 1,395 | 1,596 | 1,793 | |||||||||||||||
Total average tangible assets | $ | 2,152,821 | $ | 2,177,038 | $ | 2,167,934 | $ | 2,110,390 | $ | 2,094,901 | ||||||||||
Total average equity | $ | 168,078 | $ | 164,747 | $ | 162,795 | $ | 163,341 | $ | 162,902 | ||||||||||
Less: Intangible assets | 1,009 | 1,205 | 1,395 | 1,596 | 1,793 | |||||||||||||||
Total average tangible equity | $ | 167,069 | $ | 163,541 | $ | 161,400 | $ | 161,745 | $ | 161,109 |
(1) | Calculated on a fully taxable equivalent basis using amortized cost. |
(2) | These ratios are stated on an annualized basis and are not necessarily indicative of future periods. |
(3) | The calculation of ROA and ROE do not include the mark-to-market unrealized gains (losses), because the unrealized gains (losses) are not included in net income (loss). |
(4) | Excluding the income tax benefit related to the reversal of the valuation allowance for deferred tax assets and reflecting tax provisioning of $1,805 for the third quarter 2013, adjusted return on average assets and adjusted return on average shareholders' equity was 0.53 percent and 6.78 percent, respectively. |
(5) | Defined as (non-interest expense less foreclosed property expense and amortization of intangibles) divided by net operating revenue (net interest income on a fully taxable equivalent basis plus non-interest income excluding securities gains) |
September 30, | December 31, | September 30, | ||||||||||
SECURITIES | 2013 | 2012 | 2012 | |||||||||
U.S. Treasury and U.S. Government Agencies | $ | 101 | $ | 1,707 | $ | 1,711 | ||||||
Mortgage-backed | 611,128 | 640,445 | 585,632 | |||||||||
Collateralized loan obligations | 32,334 | 0 | 0 | |||||||||
Obligations of states and political subdivisions | 6,882 | 898 | 905 | |||||||||
Other securities | 0 | 0 | 0 | |||||||||
Securities Available for Sale | 650,445 | 643,050 | 588,248 | |||||||||
Mortgage-backed | 0 | 5,965 | 7,397 | |||||||||
Obligations of states and political subdivisions | 0 | 6,353 | 6,659 | |||||||||
Other securities | 0 | 1,500 | 1,500 | |||||||||
Securities Held for Investment (1) | 0 | 13,818 | 15,556 | |||||||||
Total Securities | $ | 650,445 | $ | 656,868 | $ | 603,804 |
(1) Securities Held for Investment were transferred to Securities Available for Sale for more options to manage interest rate risk prospectively.
September 30, | December 31, | September 30, | ||||||||||
LOANS | 2013 | 2012 | 2012 | |||||||||
Construction and land development | $ | 62,766 | $ | 60,736 | $ | 56,213 | ||||||
Real estate mortgage | 1,083,192 | 1,056,159 | 1,036,224 | |||||||||
Installment loans to individuals | 47,231 | 46,930 | 51,564 | |||||||||
Commercial and financial | 70,779 | 61,903 | 58,222 | |||||||||
Other loans | 490 | 353 | 255 | |||||||||
Total Loans | $ | 1,264,458 | $ | 1,226,081 | $ | 1,202,478 |
AVERAGE BALANCES | (Unaudited) |
SEACOAST BANKING CORPORATION OF FLORIDA AND SUBSIDIARIES |
QUARTER | Percent Change vs. | |||||||||||||||||||||||||||
2013 | 2012 | 2nd Qtr | 3rd Qtr | |||||||||||||||||||||||||
(Dollars in thousands) | Third | Second | First | Fourth | Third | 2013 | 2012 | |||||||||||||||||||||
Assets | ||||||||||||||||||||||||||||
Earning assets: | ||||||||||||||||||||||||||||
Securities: | ||||||||||||||||||||||||||||
Taxable | $ | 664,103 | $ | 639,769 | $ | 646,184 | $ | 604,412 | $ | 572,328 | 3.8 | % | 16.0 | % | ||||||||||||||
Nontaxable | 1,560 | 1,647 | 1,666 | 1,670 | 1,972 | (5.3 | ) | (20.9 | ) | |||||||||||||||||||
Total Securities | 665,663 | 641,416 | 647,850 | 606,082 | 574,300 | 3.8 | 15.9 | |||||||||||||||||||||
Federal funds sold and other investments | 113,798 | 168,740 | 172,505 | 162,599 | 209,461 | (32.6 | ) | (45.7 | ) | |||||||||||||||||||
Loans, net | 1,278,391 | 1,269,789 | 1,247,666 | 1,241,711 | 1,223,313 | 0.7 | 4.5 | |||||||||||||||||||||
Total Earning Assets | 2,057,852 | 2,079,945 | 2,068,021 | 2,010,392 | 2,007,074 | (1.1 | ) | 2.5 | ||||||||||||||||||||
Allowance for loan losses | (20,206 | ) | (21,515 | ) | (22,018 | ) | (23,820 | ) | (24,807 | ) | (6.1 | ) | (18.5 | ) | ||||||||||||||
Cash and due from banks | 35,810 | 34,279 | 34,706 | 39,321 | 29,227 | 4.5 | 22.5 | |||||||||||||||||||||
Premises and equipment | 34,834 | 35,121 | 34,516 | 34,566 | 35,003 | (0.8 | ) | (0.5 | ) | |||||||||||||||||||
Other assets | 45,540 | 50,413 | 54,104 | 51,527 | 50,197 | (9.7 | ) | (9.3 | ) | |||||||||||||||||||
$ | 2,153,830 | $ | 2,178,242 | $ | 2,169,329 | $ | 2,111,986 | $ | 2,096,694 | (1.1 | ) | 2.7 | ||||||||||||||||
Liabilities and Shareholders' Equity | ||||||||||||||||||||||||||||
Interest-bearing liabilities: | ||||||||||||||||||||||||||||
NOW | $ | 447,350 | $ | 461,005 | $ | 474,915 | $ | 449,476 | $ | 419,007 | (3.0 | )% | 6.8 | % | ||||||||||||||
Savings deposits | 185,918 | 180,915 | 170,502 | 161,156 | 157,577 | 2.8 | 18.0 | |||||||||||||||||||||
Money market accounts | 336,229 | 339,058 | 341,833 | 346,089 | 350,213 | (0.8 | ) | (4.0 | ) | |||||||||||||||||||
Time deposits | 289,408 | 302,110 | 311,945 | 330,556 | 358,504 | (4.2 | ) | (19.3 | ) | |||||||||||||||||||
Federal funds purchased and other short term borrowings | 157,607 | 159,847 | 160,600 | 131,628 | 140,932 | (1.4 | ) | 11.8 | ||||||||||||||||||||
Other borrowings | 103,610 | 103,610 | 103,610 | 103,610 | 103,610 | 0.0 | 0.0 | |||||||||||||||||||||
Total Interest-Bearing Liabilities | 1,520,122 | 1,546,545 | 1,563,405 | 1,522,515 | 1,529,843 | (1.7 | ) | (0.6 | ) | |||||||||||||||||||
Demand deposits (noninterest-bearing) | 454,642 | 455,525 | 433,757 | 416,482 | 394,467 | (0.2 | ) | 15.3 | ||||||||||||||||||||
Other liabilities | 10,988 | 11,426 | 9,372 | 9,648 | 9,482 | (3.8 | ) | 15.9 | ||||||||||||||||||||
Total Liabilities | 1,985,750 | 2,013,496 | 2,006,534 | 1,948,645 | 1,933,792 | (1.4 | ) | 2.7 | ||||||||||||||||||||
Shareholders' equity | 168,078 | 164,747 | 162,795 | 163,341 | 162,902 | 2.0 | 3.2 | |||||||||||||||||||||
$ | 2,153,830 | $ | 2,178,242 | $ | 2,169,329 | $ | 2,111,986 | $ | 2,096,694 | (1.1 | ) | 2.7 |
AVERAGE YIELDS / RATES (1) | (Unaudited) |
SEACOAST BANKING CORPORATION OF FLORIDA AND SUBSIDIARIES |
QUARTER | ||||||||||||||||||||
2013 | 2012 | |||||||||||||||||||
(Dollars in thousands) | Third | Second | First | Fourth | Third | |||||||||||||||
Assets | ||||||||||||||||||||
Earning assets: | ||||||||||||||||||||
Securities: | ||||||||||||||||||||
Taxable | 1.93 | % | 1.88 | % | 1.97 | % | 2.07 | % | 2.23 | % | ||||||||||
Nontaxable | 6.67 | 6.55 | 6.37 | 4.31 | 6.49 | |||||||||||||||
Total Securities | 1.95 | 1.89 | 1.98 | 2.08 | 2.24 | |||||||||||||||
Federal funds sold and other investments | 0.67 | 0.53 | 0.54 | 0.55 | 0.46 | |||||||||||||||
Loans, net | 4.59 | 4.52 | 4.57 | 4.64 | 4.68 | |||||||||||||||
Total Earning Assets | 3.52 | 3.39 | 3.43 | 3.53 | 3.54 | |||||||||||||||
Liabilities and Shareholders' Equity | ||||||||||||||||||||
Interest-bearing liabilities: | ||||||||||||||||||||
NOW | 0.08 | 0.09 | 0.10 | 0.11 | 0.15 | |||||||||||||||
Savings deposits | 0.05 | 0.05 | 0.06 | 0.09 | 0.11 | |||||||||||||||
Money market accounts | 0.08 | 0.08 | 0.08 | 0.13 | 0.21 | |||||||||||||||
Time deposits | 0.64 | 0.67 | 0.69 | 0.72 | 0.82 | |||||||||||||||
Federal funds purchased and other short term borrowings | 0.17 | 0.18 | 0.21 | 0.23 | 0.24 | |||||||||||||||
Other borrowings | 2.44 | 2.45 | 2.48 | 2.50 | 2.57 | |||||||||||||||
Total Interest-Bearing Liabilities | 0.36 | 0.36 | 0.38 | 0.42 | 0.49 | |||||||||||||||
Interest expense as a % of earning assets | 0.26 | 0.27 | 0.29 | 0.32 | 0.37 | |||||||||||||||
Net interest income as a % of earning assets | 3.25 | 3.12 | 3.15 | 3.22 | 3.17 |
(1) On a fully taxable equivalent basis. All yields and rates have been computed on an annualized basis using amortized cost. Fees on loans have been included in interest on loans. Nonaccrual loans are included in loan balances.
INTEREST INCOME / EXPENSE (1) | (Unaudited) |
SEACOAST BANKING CORPORATION OF FLORIDA AND SUBSIDIARIES |
QUARTER | Percent Change vs. | |||||||||||||||||||||||||||
2013 | 2012 | 2nd Qtr | 3rd Qtr | |||||||||||||||||||||||||
(Dollars in thousands) | Third | Second | First | Fourth | Third | 2013 | 2012 | |||||||||||||||||||||
Assets | ||||||||||||||||||||||||||||
Earning assets: | ||||||||||||||||||||||||||||
Securities: | ||||||||||||||||||||||||||||
Taxable | $ | 3,212 | $ | 3,008 | $ | 3,184 | $ | 3,130 | $ | 3,190 | 6.8 | % | 0.7 | % | ||||||||||||||
Nontaxable | 26 | 27 | 27 | 19 | 32 | (3.7 | ) | (18.8 | ) | |||||||||||||||||||
Total Securities | 3,238 | 3,035 | 3,211 | 3,149 | 3,222 | 6.7 | 0.5 | |||||||||||||||||||||
Federal funds sold and other investments | 192 | 224 | 228 | 226 | 243 | 14.3 | (21.0 | ) | ||||||||||||||||||||
Loans, net | 14,804 | 14,312 | 14,073 | 14,477 | 14,403 | 3.4 | 2.8 | |||||||||||||||||||||
Total Earning Assets | 18,234 | 17,571 | 17,512 | 17,852 | 17,868 | 3.8 | 2.0 | |||||||||||||||||||||
Liabilities and Shareholders' Equity | ||||||||||||||||||||||||||||
Interest-bearing liabilities: | ||||||||||||||||||||||||||||
NOW | 93 | 100 | 112 | 128 | 156 | (7.0 | ) | (40.4 | ) | |||||||||||||||||||
Savings deposits | 25 | 24 | 26 | 36 | 42 | 4.2 | (40.5 | ) | ||||||||||||||||||||
Money market accounts | 69 | 67 | 70 | 111 | 182 | 3.0 | (62.1 | ) | ||||||||||||||||||||
Time deposits | 470 | 501 | 532 | 598 | 738 | (6.2 | ) | (36.3 | ) | |||||||||||||||||||
Federal funds purchased and other short term borrowings | 68 | 73 | 83 | 75 | 86 | (6.8 | ) | (20.9 | ) | |||||||||||||||||||
Other borrowings | 637 | 634 | 634 | 650 | 669 | 0.5 | (4.8 | ) | ||||||||||||||||||||
Total Interest-Bearing Liabilities | 1,362 | 1,399 | 1,457 | 1,598 | 1,873 | (2.6 | ) | (27.3 | ) | |||||||||||||||||||
Net interest income | 16,872 | 16,172 | 16,055 | 16,254 | 15,995 | 4.3 | 5.5 |
(1) On a fully taxable equivalent basis. Fees on loans have been included in interest on loans
CONSOLIDATED QUARTERLY FINANCIAL DATA | (Unaudited) |
SEACOAST BANKING CORPORATION OF FLORIDA AND SUBSIDIARIES |
2013 | 2012 | |||||||||||||||||||
(Dollars in thousands) | Third Quarter | Second Quarter | First Quarter | Fourth Quarter | Third Quarter | |||||||||||||||
Customer Relationship Funding (Period End) | ||||||||||||||||||||
Demand deposits (noninterest bearing) | ||||||||||||||||||||
Commercial | $ | 254,373 | $ | 260,325 | $ | 246,849 | $ | 232,413 | $ | 220,225 | ||||||||||
Retail | 155,281 | 163,551 | 167,516 | 153,428 | 156,329 | |||||||||||||||
Public funds | 27,002 | 29,487 | 26,166 | 21,799 | 16,103 | |||||||||||||||
Other | 16,293 | 15,154 | 12,613 | 15,193 | 16,488 | |||||||||||||||
452,949 | 468,517 | 453,144 | 422,833 | 409,145 | ||||||||||||||||
NOW accounts | ||||||||||||||||||||
Commercial | 35,029 | 35,714 | 39,303 | 32,701 | 33,083 | |||||||||||||||
Retail | 305,055 | 308,390 | 307,545 | 308,633 | 296,078 | |||||||||||||||
Public funds | 100,785 | 108,965 | 136,065 | 168,037 | 91,316 | |||||||||||||||
440,869 | 453,069 | 482,913 | 509,371 | 420,477 | ||||||||||||||||
Total Transaction Accounts | ||||||||||||||||||||
Commercial | 289,402 | 296,039 | 286,152 | 265,114 | 253,308 | |||||||||||||||
Retail | 460,336 | 471,941 | 475,061 | 462,061 | 452,407 | |||||||||||||||
Public funds | 127,787 | 138,452 | 162,231 | 189,836 | 107,419 | |||||||||||||||
Other | 16,293 | 15,154 | 12,613 | 15,193 | 16,488 | |||||||||||||||
893,818 | 921,586 | 936,057 | 932,204 | 829,622 | ||||||||||||||||
Savings accounts | 187,181 | 184,219 | 177,213 | 164,956 | 158,208 | |||||||||||||||
Money market accounts | ||||||||||||||||||||
Commercial | 107,767 | 109,938 | 111,580 | 114,965 | 122,485 | |||||||||||||||
Retail | 217,176 | 216,370 | 220,555 | 220,601 | 216,775 | |||||||||||||||
Public funds | 9,735 | 9,639 | 9,081 | 8,349 | 9,015 | |||||||||||||||
334,678 | 335,947 | 341,216 | 343,915 | 348,275 | ||||||||||||||||
Time certificates of deposit | 283,233 | 296,857 | 307,678 | 317,886 | 343,361 | |||||||||||||||
Total Deposits | $ | 1,698,910 | $ | 1,738,609 | $ | 1,762,164 | $ | 1,758,961 | $ | 1,679,466 | ||||||||||
Sweep repurchase agreements | $ | 134,338 | $ | 160,934 | $ | 161,678 | $ | 136,803 | $ | 122,393 | ||||||||||
Total core customer funding (1) | $ | 1,550,015 | $ | 1,602,686 | $ | 1,616,164 | $ | 1,577,878 | $ | 1,458,498 |
(1) Total deposits and sweep repurchase agreements, excluding certificates of deposits.
QUARTERLY TRENDS - LOANS AT END OF PERIOD (Dollars in Millions) | (Unaudited) |
SEACOAST BANKING CORPORATION OF FLORIDA AND SUBSIDIARIES |
2013 | 2012 | |||||||||||||||||||||||||||
3rd Qtr | 2nd Qtr | 1st Qtr | 4th Qtr | 3rd Qtr | 2nd Qtr | 1st Qtr | ||||||||||||||||||||||
Installment loans to individuals | ||||||||||||||||||||||||||||
Automobile and trucks | $ | 7.1 | $ | 7.5 | $ | 7.8 | $ | 7.8 | $ | 8.0 | $ | 8.1 | $ | 8.2 | ||||||||||||||
Marine loans | 21.3 | 16.7 | 15.4 | 18.4 | 23.0 | 20.8 | 21.1 | |||||||||||||||||||||
Other | 18.8 | 20.1 | 20.0 | 20.7 | 20.6 | 21.3 | 21.5 | |||||||||||||||||||||
47.2 | 44.3 | 43.2 | 46.9 | 51.6 | 50.2 | 50.8 | ||||||||||||||||||||||
Construction and land development to individuals | ||||||||||||||||||||||||||||
Lot loans | 14.7 | 15.5 | 16.6 | 16.7 | 16.4 | 17.6 | 18.4 | |||||||||||||||||||||
Construction | 19.7 | 20.7 | 20.8 | 22.2 | 18.9 | 16.6 | 13.5 | |||||||||||||||||||||
34.4 | 36.2 | 37.4 | 38.9 | 35.3 | 34.2 | 31.9 | ||||||||||||||||||||||
Residential real estate | ||||||||||||||||||||||||||||
Adjustable | 378.4 | 372.6 | 365.8 | 361.0 | 353.7 | 359.4 | 341.6 | |||||||||||||||||||||
Fixed rate | 94.7 | 97.5 | 98.2 | 99.0 | 99.7 | 95.4 | 96.2 | |||||||||||||||||||||
Home equity mortgages | 61.8 | 62.2 | 61.3 | 58.0 | 58.4 | 58.3 | 59.5 | |||||||||||||||||||||
Home equity lines | 47.7 | 49.1 | 49.3 | 51.4 | 50.6 | 50.8 | 53.0 | |||||||||||||||||||||
582.6 | 581.4 | 574.6 | 569.4 | 562.4 | 563.9 | 550.3 | ||||||||||||||||||||||
TOTAL CONSUMER | 664.2 | 661.9 | 655.2 | 655.2 | 649.3 | 648.3 | 633.0 | |||||||||||||||||||||
Commercial & financial | 70.8 | 65.2 | 64.8 | 61.9 | 58.2 | 56.2 | 54.6 | |||||||||||||||||||||
Construction and land development for commercial | ||||||||||||||||||||||||||||
Residential | ||||||||||||||||||||||||||||
Single family land and lots | 4.9 | 5.0 | 4.9 | 5.6 | 5.8 | 5.9 | 6.0 | |||||||||||||||||||||
Multifamily | 3.8 | 3.9 | 3.9 | 4.3 | 4.6 | 4.7 | 4.9 | |||||||||||||||||||||
8.7 | 8.9 | 8.8 | 9.9 | 10.4 | 10.6 | 10.9 | ||||||||||||||||||||||
Commercial | ||||||||||||||||||||||||||||
Office buildings | 1.6 | 1.6 | 1.1 | - | - | - | 0.3 | |||||||||||||||||||||
Retail trade | 1.8 | 1.8 | - | - | - | - | - | |||||||||||||||||||||
Land | 7.3 | 7.2 | 7.8 | 9.6 | 9.8 | 10.7 | 9.2 | |||||||||||||||||||||
Healthcare | 4.7 | 2.9 | 3.3 | 1.8 | - | - | - | |||||||||||||||||||||
Churches and educational facilities | 4.0 | 2.5 | 1.2 | 0.5 | 0.7 | 0.3 | 0.3 | |||||||||||||||||||||
Lodging | 0.3 | - | - | - | - | - | - | |||||||||||||||||||||
Convenience stores | - | - | - | - | - | 1.4 | 1.4 | |||||||||||||||||||||
19.7 | 16.0 | 13.4 | 11.9 | 10.5 | 12.4 | 11.2 | ||||||||||||||||||||||
Total construction and land development | 28.4 | 24.9 | 22.2 | 21.8 | 20.9 | 23.0 | 22.1 | |||||||||||||||||||||
Commercial real estate | ||||||||||||||||||||||||||||
Office buildings | 118.2 | 112.0 | 112.5 | 104.7 | 102.4 | 113.4 | 118.0 | |||||||||||||||||||||
Retail trade | 128.9 | 135.5 | 122.2 | 126.7 | 121.1 | 128.5 | 139.3 | |||||||||||||||||||||
Industrial | 81.2 | 83.3 | 73.4 | 72.6 | 71.3 | 72.0 | 70.0 | |||||||||||||||||||||
Healthcare | 38.8 | 42.1 | 39.4 | 40.7 | 35.8 | 42.0 | 40.2 | |||||||||||||||||||||
Churches and educational facilities | 24.2 | 26.4 | 26.9 | 28.6 | 26.2 | 26.7 | 27.0 | |||||||||||||||||||||
Recreation | 2.5 | 2.6 | 2.6 | 2.7 | 2.7 | 3.1 | 3.1 | |||||||||||||||||||||
Multifamily | 6.2 | 9.5 | 8.5 | 9.0 | 7.8 | 8.3 | 8.8 | |||||||||||||||||||||
Mobile home parks | 1.9 | 1.9 | 2.0 | 2.0 | 2.1 | 2.1 | 2.1 | |||||||||||||||||||||
Lodging | 17.3 | 17.5 | 18.0 | 18.7 | 19.1 | 19.3 | 19.4 | |||||||||||||||||||||
Restaurant | 3.8 | 3.5 | 3.6 | 3.5 | 4.4 | 4.7 | 4.6 | |||||||||||||||||||||
Agricultural | 7.2 | 7.1 | 5.9 | 6.1 | 7.3 | 7.4 | 7.6 | |||||||||||||||||||||
Convenience stores | 21.0 | 20.2 | 20.2 | 20.5 | 16.6 | 15.4 | 15.5 | |||||||||||||||||||||
Marina | 21.5 | 20.9 | 21.1 | 21.2 | 21.4 | 21.5 | 21.6 | |||||||||||||||||||||
Other | 27.9 | 31.1 | 25.1 | 29.8 | 35.6 | 29.3 | 29.3 | |||||||||||||||||||||
500.6 | 513.6 | 481.4 | 486.8 | 473.8 | 493.7 | 506.5 | ||||||||||||||||||||||
TOTAL COMMERCIAL | 599.8 | 603.7 | 568.4 | 570.5 | 552.9 | 572.9 | 583.2 | |||||||||||||||||||||
Other | 0.5 | 0.3 | 0.2 | 0.4 | 0.3 | 0.2 | 0.2 | |||||||||||||||||||||
$ | 1,264.5 | $ | 1,265.9 | $ | 1,223.8 | $ | 1,226.1 | $ | 1,202.5 | $ | 1,221.4 | $ | 1,216.4 |
QUARTERLY TRENDS - INCREASE (DECREASE) IN LOANS BY QUARTER (Dollars in Millions) | (Unaudited) |
SEACOAST BANKING CORPORATION OF FLORIDA AND SUBSIDIARIES |
2013 | 2012 | |||||||||||||||||||||||||||
3rd Qtr | 2nd Qtr | 1st Qtr | 4th Qtr | 3rd Qtr | 2nd Qtr | 1st Qtr | ||||||||||||||||||||||
Installment loans to individuals | ||||||||||||||||||||||||||||
Automobile and trucks | $ | (0.4 | ) | $ | (0.3 | ) | $ | - | $ | (0.2 | ) | $ | (0.1 | ) | $ | (0.1 | ) | $ | (0.5 | ) | ||||||||
Marine loans | 4.6 | 1.3 | (3.0 | ) | (4.6 | ) | 2.2 | (0.3 | ) | 1.2 | ||||||||||||||||||
Other | (1.3 | ) | 0.1 | (0.7 | ) | 0.1 | (0.7 | ) | (0.2 | ) | (0.5 | ) | ||||||||||||||||
2.9 | 1.1 | (3.7 | ) | (4.7 | ) | 1.4 | (0.6 | ) | 0.2 | |||||||||||||||||||
Construction and land development to individuals | ||||||||||||||||||||||||||||
Lot loans | (0.8 | ) | (1.1 | ) | (0.1 | ) | 0.3 | (1.2 | ) | (0.8 | ) | 0.5 | ||||||||||||||||
Construction | (1.0 | ) | (0.1 | ) | (1.4 | ) | 3.3 | 2.3 | 3.1 | 4.8 | ||||||||||||||||||
(1.8 | ) | (1.2 | ) | (1.5 | ) | 3.6 | 1.1 | 2.3 | 5.3 | |||||||||||||||||||
Residential real estate | ||||||||||||||||||||||||||||
Adjustable | 5.8 | 6.8 | 4.8 | 7.3 | (5.7 | ) | 17.8 | 7.5 | ||||||||||||||||||||
Fixed rate | (2.8 | ) | (0.7 | ) | (0.8 | ) | (0.7 | ) | 4.3 | (0.8 | ) | (0.8 | ) | |||||||||||||||
Home equity mortgages | (0.4 | ) | 0.9 | 3.3 | (0.4 | ) | 0.1 | (1.2 | ) | (0.7 | ) | |||||||||||||||||
Home equity lines | (1.4 | ) | (0.2 | ) | (2.1 | ) | 0.8 | (0.2 | ) | (2.2 | ) | (1.9 | ) | |||||||||||||||
1.2 | 6.8 | 5.2 | 7.0 | (1.5 | ) | 13.6 | 4.1 | |||||||||||||||||||||
TOTAL CONSUMER | 2.3 | 6.7 | 0.0 | 5.9 | 1.0 | 15.3 | 9.6 | |||||||||||||||||||||
Commercial & financial | 5.6 | 0.4 | 2.9 | 3.7 | 2.0 | 1.6 | 1.5 | |||||||||||||||||||||
Construction and land development for commercial | ||||||||||||||||||||||||||||
Residential | ||||||||||||||||||||||||||||
Single family land and lots | (0.1 | ) | 0.1 | (0.7 | ) | (0.2 | ) | (0.1 | ) | (0.1 | ) | (0.2 | ) | |||||||||||||||
Multifamily | (0.1 | ) | - | (0.4 | ) | (0.3 | ) | (0.1 | ) | (0.2 | ) | (0.2 | ) | |||||||||||||||
(0.2 | ) | 0.1 | (1.1 | ) | (0.5 | ) | (0.2 | ) | (0.3 | ) | (0.4 | ) | ||||||||||||||||
Commercial | ||||||||||||||||||||||||||||
Office buildings | - | 0.5 | 1.1 | - | - | (0.3 | ) | 0.1 | ||||||||||||||||||||
Retail trade | - | 1.8 | - | - | - | - | - | |||||||||||||||||||||
Land | 0.1 | (0.6 | ) | (1.8 | ) | (0.2 | ) | (0.9 | ) | 1.5 | (0.1 | ) | ||||||||||||||||
Healthcare | 1.8 | (0.4 | ) | 1.5 | 1.8 | - | - | - | ||||||||||||||||||||
Churches and educational facilities | 1.5 | 1.3 | 0.7 | (0.2 | ) | 0.4 | - | 0.2 | ||||||||||||||||||||
Lodging | 0.3 | - | - | - | - | - | - | |||||||||||||||||||||
Convenience stores | - | - | - | - | (1.4 | ) | - | (0.3 | ) | |||||||||||||||||||
3.7 | 2.6 | 1.5 | 1.4 | (1.9 | ) | 1.2 | (0.1 | ) | ||||||||||||||||||||
Total construction and land development | 3.5 | 2.7 | 0.4 | 0.9 | (2.1 | ) | 0.9 | (0.5 | ) | |||||||||||||||||||
Commercial real estate | ||||||||||||||||||||||||||||
Office buildings | 6.2 | (0.5 | ) | 7.8 | 2.3 | (11.0 | ) | (4.6 | ) | (1.6 | ) | |||||||||||||||||
Retail trade | (6.6 | ) | 13.3 | (4.5 | ) | 5.6 | (7.4 | ) | (10.8 | ) | (1.3 | ) | ||||||||||||||||
Industrial | (2.1 | ) | 9.9 | 0.8 | 1.3 | (0.7 | ) | 2.0 | (0.7 | ) | ||||||||||||||||||
Healthcare | (3.3 | ) | 2.7 | (1.3 | ) | 4.9 | (6.2 | ) | 1.8 | 1.4 | ||||||||||||||||||
Churches and educational facilities | (2.2 | ) | (0.5 | ) | (1.7 | ) | 2.4 | (0.5 | ) | (0.3 | ) | (0.4 | ) | |||||||||||||||
Recreation | (0.1 | ) | - | (0.1 | ) | - | (0.4 | ) | - | (0.1 | ) | |||||||||||||||||
Multifamily | (3.3 | ) | 1.0 | (0.5 | ) | 1.2 | (0.5 | ) | (0.5 | ) | (0.6 | ) | ||||||||||||||||
Mobile home parks | - | (0.1 | ) | - | (0.1 | ) | - | - | (0.1 | ) | ||||||||||||||||||
Lodging | (0.2 | ) | (0.5 | ) | (0.7 | ) | (0.4 | ) | (0.2 | ) | (0.1 | ) | (0.2 | ) | ||||||||||||||
Restaurant | 0.3 | (0.1 | ) | 0.1 | (0.9 | ) | (0.3 | ) | 0.1 | (0.1 | ) | |||||||||||||||||
Agricultural | 0.1 | 1.2 | (0.2 | ) | (1.2 | ) | (0.1 | ) | (0.2 | ) | (1.2 | ) | ||||||||||||||||
Convenience stores | 0.8 | - | (0.3 | ) | 3.9 | 1.2 | (0.1 | ) | 0.4 | |||||||||||||||||||
Marina | 0.6 | (0.2 | ) | (0.1 | ) | (0.2 | ) | (0.1 | ) | (0.1 | ) | 0.3 | ||||||||||||||||
Other | (3.2 | ) | 6.0 | (4.7 | ) | (5.8 | ) | 6.3 | - | 2.3 | ||||||||||||||||||
(13.0 | ) | 32.2 | (5.4 | ) | 13.0 | (19.9 | ) | (12.8 | ) | (1.9 | ) | |||||||||||||||||
TOTAL COMMERCIAL | (3.9 | ) | 35.3 | (2.1 | ) | 17.6 | (20.0 | ) | (10.3 | ) | (0.9 | ) | ||||||||||||||||
Other | 0.2 | 0.1 | (0.2 | ) | 0.1 | 0.1 | - | (0.4 | ) | |||||||||||||||||||
$ | (1.4 | ) | $ | 42.1 | $ | (2.3 | ) | $ | 23.6 | $ | (18.9 | ) | $ | 5.0 | $ | 8.3 |
EXHIBIT 99.2
To Form 8-K dated October 28, 2013
Seacoast Banking Corporation of Florida
Third Quarter 2013 Earnings Conference Call
October 28, 2013
10:00 AM Eastern Time
Company Participants:
Dennis S. Hudson, III, Chairman and Chief Executive Officer, Seacoast Banking Corporation of Florida
William R. Hahl, Executive Vice President and Chief Financial Officer, Seacoast Banking Corporation of Florida
Other Participants:
Scott J. Valentin, Analyst, FBR Capital Markets
Robert S. Madsen, Analyst, Stephens, Inc.
Jefferson Harralson, Analyst, Keefe, Bruyette & Woods, Inc.
Kyle A. Oliver, Analyst, Raymond James & Associates, Inc.
Management Discussion:
Operator: Good morning and welcome to the Seacoast Third Quarter 2013 Earnings Conference Call. My name is Brandon, and I'll be the operator for today's call. At this time, all participants are in a listen-only mode. Later, we will conduct a question-and-answer session. Please note that this conference is being recorded.
I will now turn it over to Mr. Dennis Hudson. Sir, you may begin.
Dennis S. Hudson III: Thank you very much, and welcome to Seacoast's Third Quarter 2013 Conference Call. Before we begin, as always, I direct your attention to the statement contained at the end of our press release regarding forward statements. During the call, we may be discussing certain issues that constitute forward-looking statements within the meaning of the SEC Act. Accordingly, our comments are intended to be covered within the meaning of Section 27A of that Act.
With me today is Bill Hahl, our CFO, and David Houdeshell, our Chief Credit Officer.
- 1 - |
Well, we certainly achieved some critical milestones this quarter. Our regulatory and capital agreement and capital restrictions were completely terminated over the summer, as we had previously announced, and, as indicated this morning in our release, our sustained earnings' improvements and our earnings' outlook allowed us to bring the deferred tax asset back onto the balance sheet. Most pleasing to me anyway, however, was our continued earnings improvement this quarter. When you exclude the one-time impact of the DTA recapture, our Q3 earnings before tax increased 62 percent over last quarter to $4.7 million. This is the third quarter in a row with greater than a 50 percent sequential growth in earnings. So our before-tax earnings trend has been quite positive this year with us earning $2 million in Q1, $3 million in Q2, and well over $4 million in Q3, and we expect to close out the year with continued strength. This improvement is the result of our expense reductions, a portion of which was redeployed into new investments that are designed to grow revenue, and also it was due to reduced credit cost.
These improvements in quarterly earnings, together with the DTA recapture, resulted in GAAP earnings for the quarter of $45.9 million. Our tangible book value per common share increased as a result and stood at $1.62 at September 30. Return on average assets for the quarter, including a normal tax provision, but excluding the impact of the DTA recapture, was 0.53 on an ROA basis and return on average equity was 6.78 percent. 
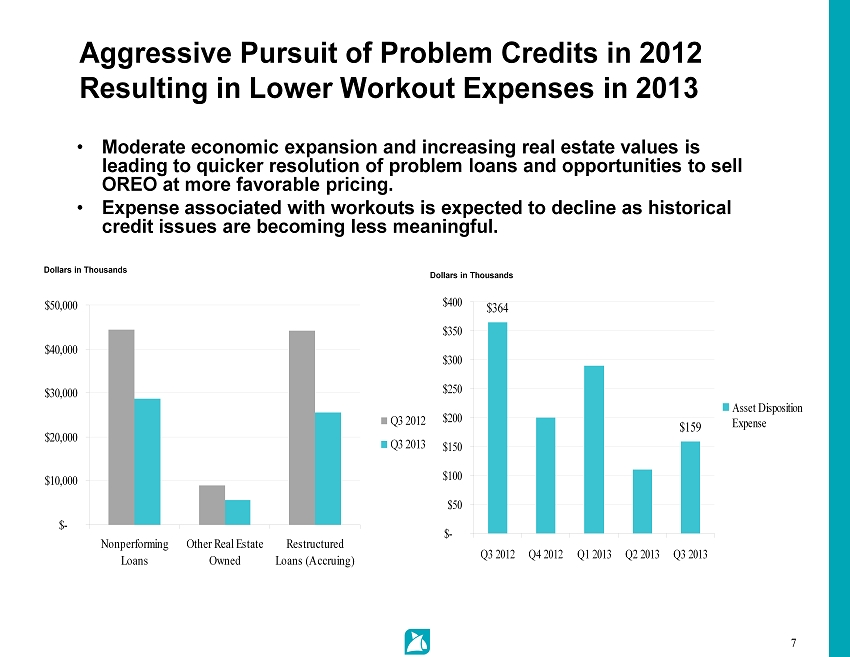
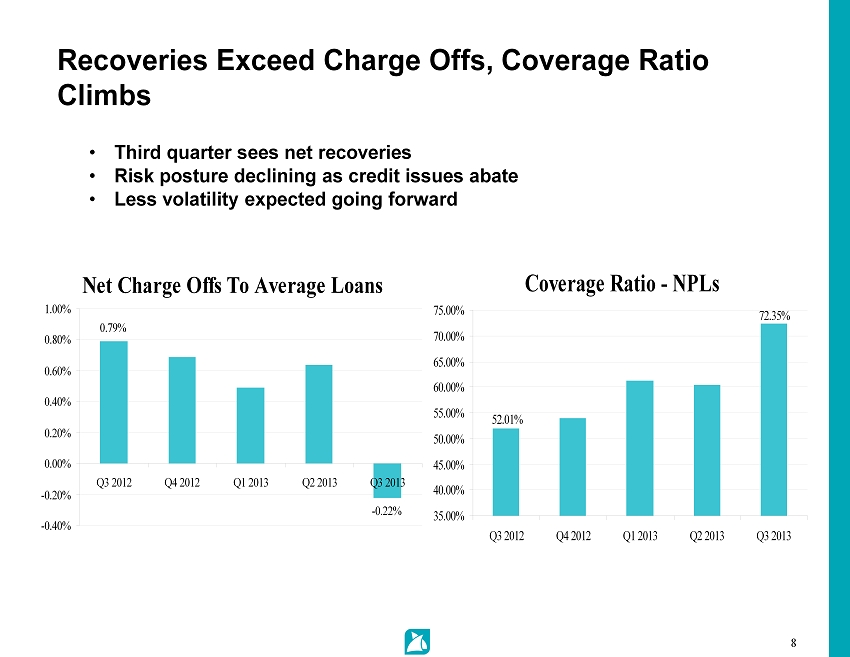
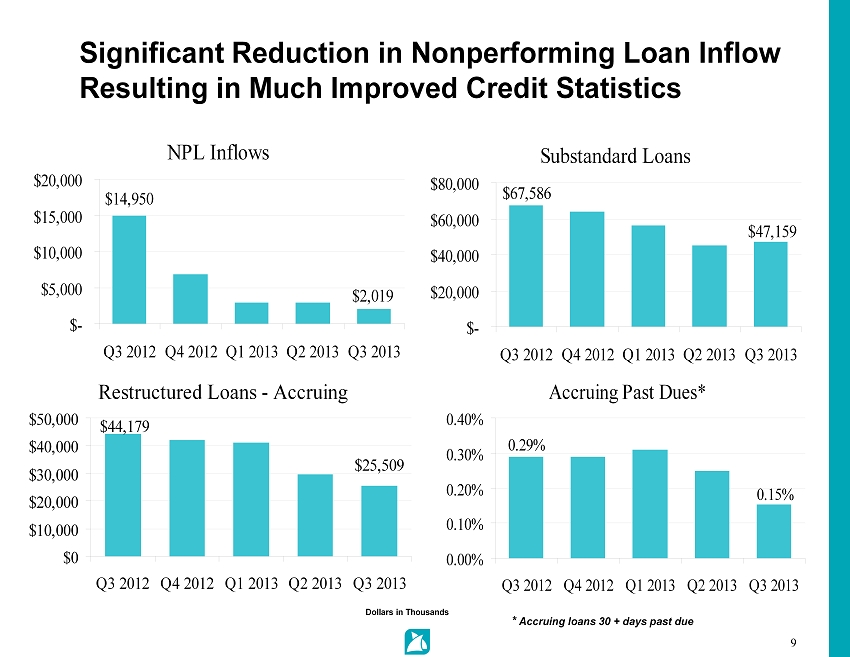
Our asset quality continued to improve this quarter, as it has done for many quarters. Nonperforming assets, which last quarter fell below 2 percent of assets, were further reduced during the quarter to 1.6 percent of assets. We booked net recoveries during the quarter, which negated the need for a provision. The allowance for loan losses actually increased to 1.64 percent of loans from 1.59 percent last quarter. Coverage ratios have clearly increased substantially, and we believe our asset quality today is, simply stated, now satisfactory.
Looking ahead, we see an improving local economy; we see population growth returning to Florida; and most importantly, we now see construction activities starting to increase all over our markets, all of which suggest to me that the state is now moving through an important inflection point and improving economy. I believe now is a critical time for Seacoast to push forward faster with our revenue and our growth initiatives, again 
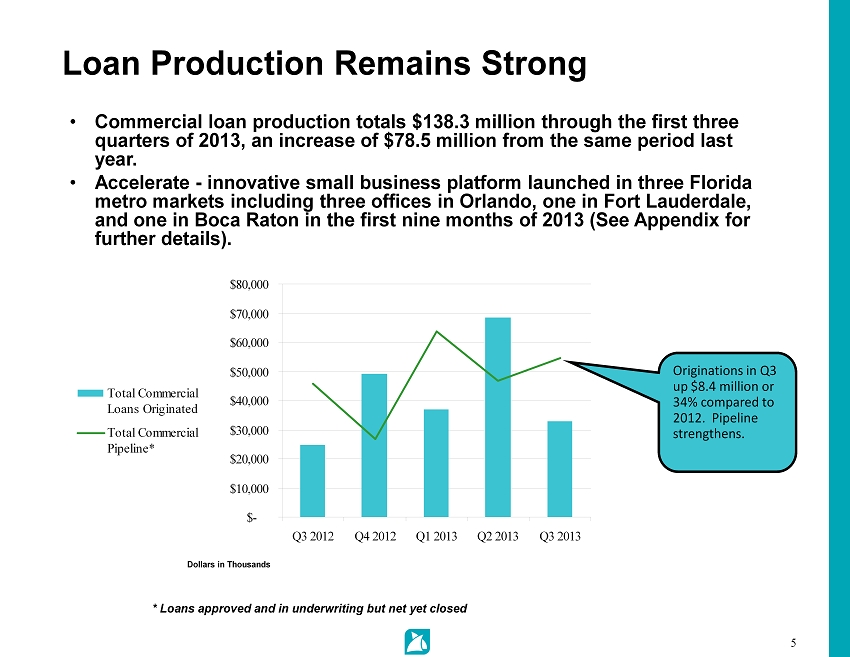
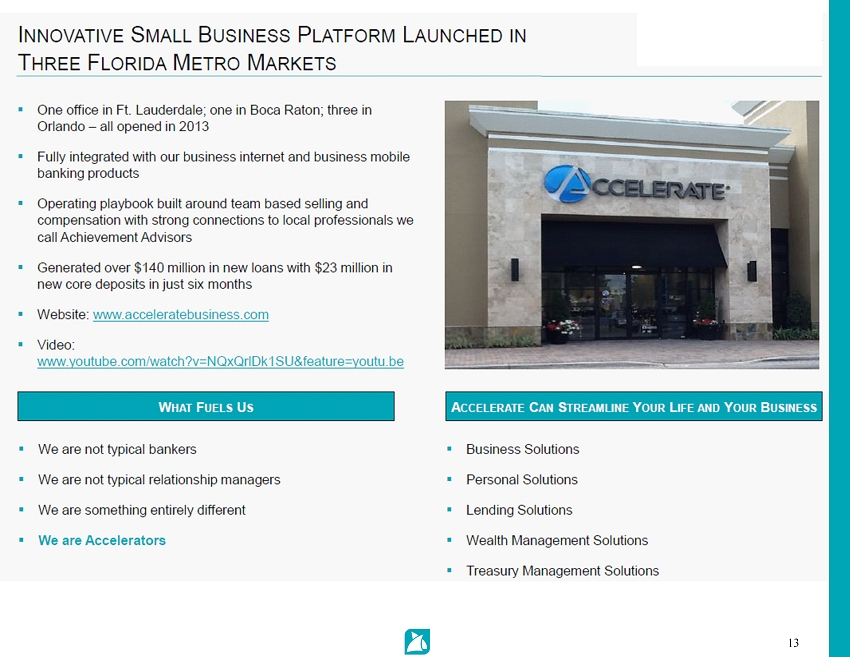
to drive better results, and I’ve been challenging our team to do just that. Earlier this year, we rolled out an innovative business banking platform in three metro Florida markets. Accelerate business is an integrated business banking solution built around strong and experienced commercial leading teams, called Accelerators, and local professionals that we call Achievement Advisors, who’ve been operating in markets together for many, many years. Accelerate Business is fueled by Seacoast to help move small and medium sized businesses forward further and move them faster. We’ve integrated our comprehensive suite of Internet banking services with our new business mobile platforms and have added deposit capture across all of our digital channels to bring branch services right into the office of every one of our business clients. The bank comes to you, not the other way around; and when we’re asked where our nearest branch is, we tell them it’s right here in your office. We added a couple of slides towards the end of our deck that was posted for this call that provide a little more color on this latest growth initiative, and I invite you to take a look. So far the results that have been produced have been quite impressive. Since rollout, we have more than doubled our pace of business loan production and our new core business deposits. We expect this project will help us drive better performance going forward into 2014 and we expect it to drive revenue growth at a higher pace in 2014 than we’ve achieved in 2013. I want us to find more ways to redeploy our legacy expense structure into further expansion of both this platform and other digital innovation projects our teams are working on.
- 2 - |
So with that, I’d like to turn the call over to Bill for a few more comments on the quarter. Bill.
William R. Hahl: Thanks, Denny; and good morning, everyone. My remarks will reference the slide deck we posted for this call on our website, and I will begin on slide three, and then Denny and I will take your questions.
As Denny mentioned, we did reverse the deferred tax valuation allowance, which increased net income for the quarter by $41.2 million. Without the reversal, it was still a much improved quarter without any negative surprises with net income before tax of $4.7 million, up $1.7 million linked quarter, 
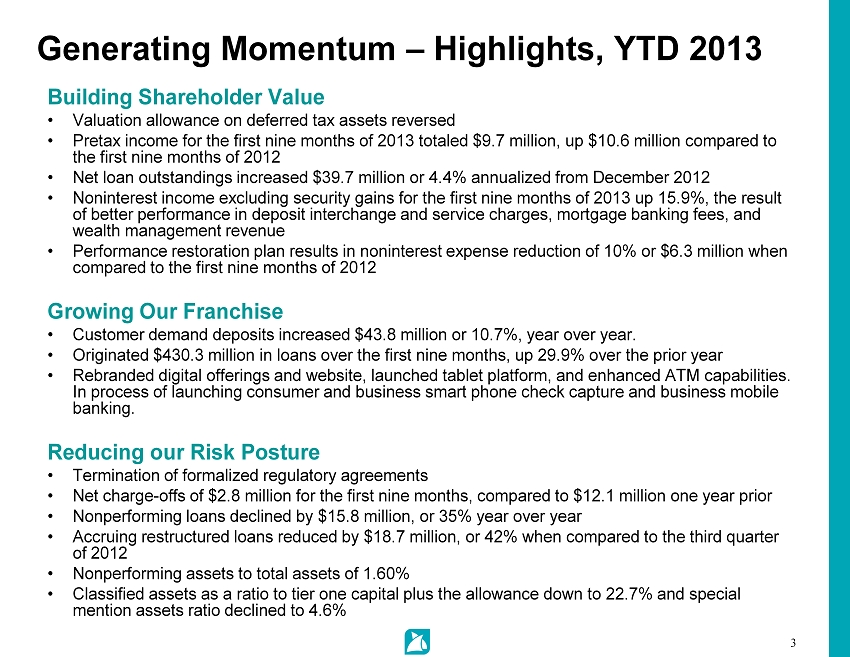
and up $4 million compared to the prior year. Pre-tax income for the first nine months, excluding the DTA reversal, was $9.7 million, up $10.6 million from last year’s net loss of $950,000. Net income available to common shareholders year-to-date was $48.1 million, or $0.51 per diluted common share compared to a net loss of $0.04 last year. Total revenue, excluding security gains, for the third quarter were $22.9 million and were up $1.3 million compared to a year ago. On a linked quarter basis, revenues were up approximately $500,000, reflecting the seasonally slower third quarter and the impact of higher interest rates which lowered residential loan demand and fees from mortgage banking.
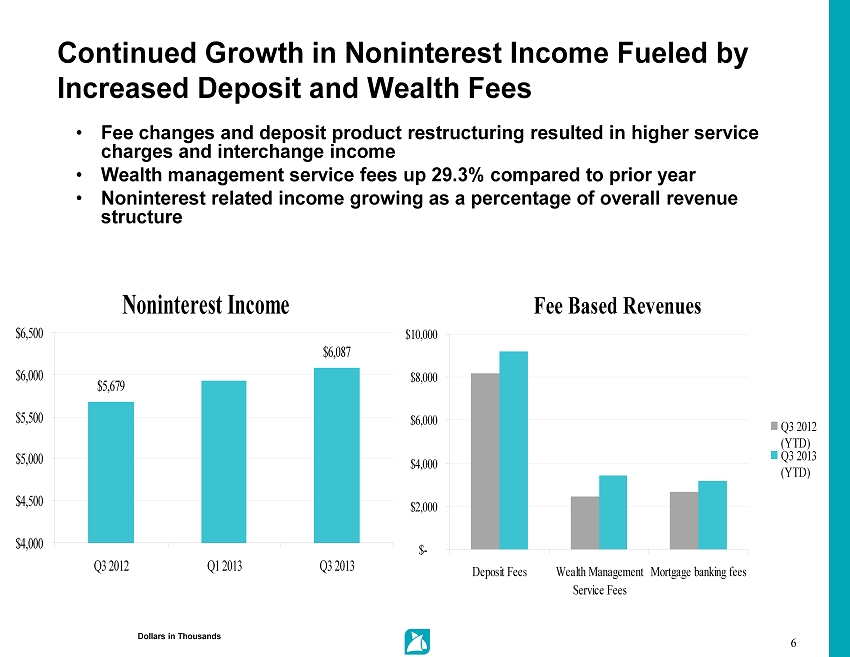
Year-to-date our tactics designed to build noninterest income had positive impacts with fees higher by 15.9 percent year-over-year. Total revenues year-to-date grew year-over-year by $2.9 million, or 4.5 percent, with mortgage banking up 28.5 percent, service charges up 8.0 percent, interchange fees up 19.9 percent. Slide six has some additional highlights about noninterest income growth for the quarter. Total assets increased year-over-year by $67 million, funded by core customer funds with solid growth in noninterest-bearing transaction accounts which were up 10.7 percent year-over-year and now comprise about 27 percent of total deposits. Likewise, total transaction accounts were up 7.7 percent year-over-year and they now comprise 53 percent of total deposits. Loan production year-to-date has increased nearly 30 percent compared to 2012 and totaled $430 million and is the result of our investments in additional loan production personnel over the last 12 to 15 months.
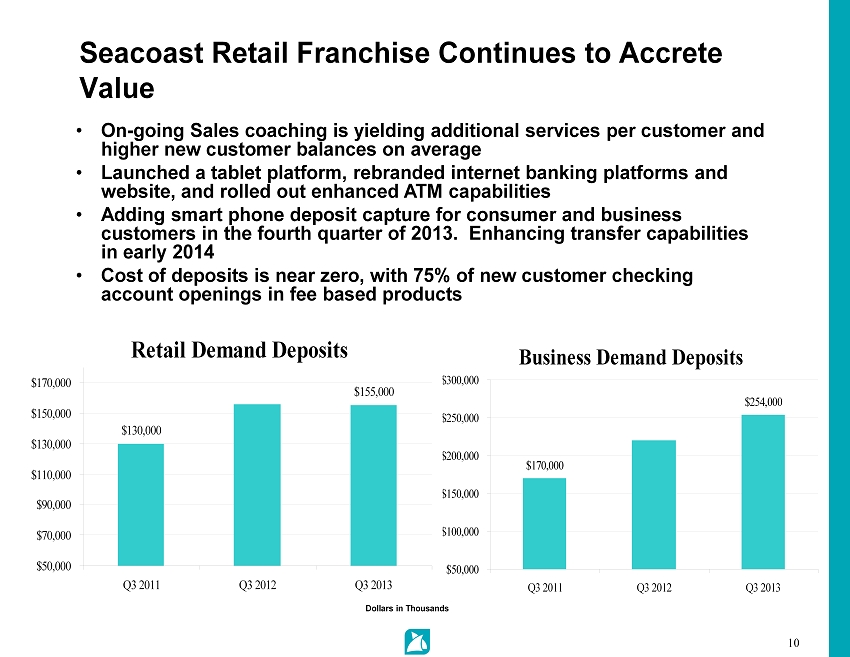
We look forward to taking advantage of all the opportunities ahead of us and to positively leverage the strong core franchise we’ve built. Our focus has been on expanding our products and services through to already stellar deposit franchise and enhancing customer experience by providing convenient access to their accounts through digital technology. Nearly 40 percent of online customers have already adopted our mobile products, and the annual growth rate for the mobile product adoption in the current quarter was over 92 percent. We have more to come as we increase our services per household and our revenues from our core deposit accounts. If you take a look at slide 10, you can see some of the things that we are doing to grow the franchise and the results we are producing.
- 3 - |
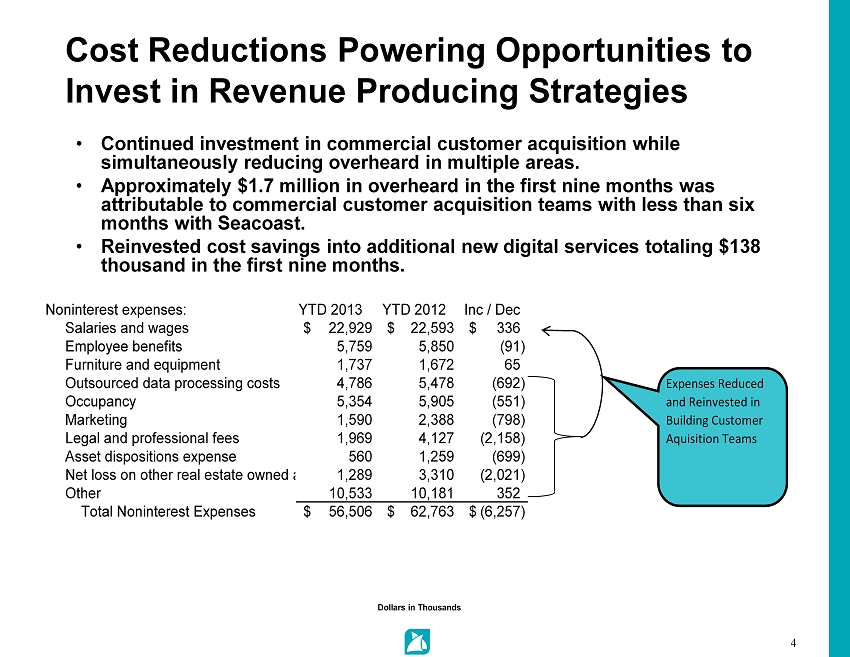
Now I’ll turn to slide four for a few comments about cost reductions of noninterest expenses compared to a year ago. Over the last year, quarterly expenses have been managed lower as a result of cyclical credit costs declining and our branch consolidations as well as other cost cutting initiatives. In order to improve the margin and continue to grow loans, we have invested a significant portion of the expense reductions into additional business bankers and credit support personnel and, more recently, enhancing the customer experience with additional ways our customers can access their accounts through our digital channel. This quarter expenses are lower by $1.8 million, or 9 percent, compared to a year ago and are down $6.3 million year-to-date. This, together with revenue improvement, is reducing efficiency ratio, indicating operating leverage is improving. We want to continue to grow revenues at a faster pace and to look for ways to redeploy and reduce our legacy costs as we better align our delivery channels with evolving customer needs. The goal is to continue to improve operating leverage while improving our overall top line growth rates.
Loan production over the last twelve months totaled $573 million and is up 120 percent compared to a year ago. Net loans were up 5.2 percent year-over-year. The improvement in loan growth is the result of continued growth across most of our portfolios, including much better growth this year coming from the commercial and business lending. We predicted on last quarter’s call that our commercial volume would be a little softer due to the summer season and the higher interest rate environment, and it was. However, we are seeing stronger pipelines and expect higher production through the rest of the year.
Now some color on the net interest margin. After declining 7 basis points in Q1 and 3 basis points in Q2, the margin increased 13 basis points this quarter. Several factors contributed to this improvement. The loan portfolio positively impacted by lower nonaccruals and higher average balances. Additionally, the margin was positively impacted by 10 basis points from the recovery of interest income on a loan that had been on nonaccrual, so net of this recovery the margin improved 3 basis points. Prepay speeds declined and yields increased by 6 basis points in the securities portfolio in response to the increase in yield curve. Our continued progress improving core customer funding and the improved deposit mix reduced both noninterest-bearing and sweep repo costs by one basis point. These results all contributed to the increase in the margin for the quarter. Growing our net interest income remains our focus, and we believe we can continue to generate growth even in this low rate environment. The primary opportunities for growth in net interest margin remain an improved earning asset mix in favor of loans and further growth in core customer funding.
With that, I’ll turn the call back to Denny.
Dennis S. Hudson III: Thank you, Bill. You know something Bill said earlier in his comments I think bears repeating. He said our goal is to continue to improve operating leverage while also improving our overall top line growth rates. I said earlier that I felt the Florida economy is an important inflection point and I’m convinced this is going to drive more opportunities for growth here at Seacoast, but I also believe we’re well into a critical inflection point of our own here at Seacoast. All of us are challenging each other to find innovative ways to grow our revenues faster and to fund innovation required with the redeployment of our heavy legacy costs, even as we continue to bring down our overall expense structure, and we must bring down legacy costs by discovering ways to better align and integrate our delivery channels with customer preferences that are now starting to rapidly change. This is not a process that is going to occur overnight, but it must occur over a more compressed timeframe than most community banks believe, and it’ll result I think in greater convenience and an improved experience for our customers. What I’ve just said is going to drive a lot of innovation over the next couple of years and it’s going to separate the winners from the losers in the marketplace. For me it’s an invigorating challenge and I’m going to have fun reporting back to you our progress as we continue to discover new opportunities for growth.
- 4 - |
With that, I’d like to open it up for a few questions.
Question & Answer Section:
Operator: Thank you, and we will now begin the question-and-answer session. If you have a question, please press star/one on your touchtone phone. If you wish to be removed from the queue, please press the pound sign or the hash key. There may be a delay before the first question is announced. If you’re on a speakerphone, please pick up your handset first before pressing the numbers. Once again, if you have a question, please press star/one on your touchtone phone.
And from FBR Capital Markets we have Scott Valentin online. Please go ahead.
Scott Valentin: Good morning, and thanks for taking my question. Just with regard - - you mentioned regulatory agreements have been lifted, the DTA valuation allowance has been recovered. Can you address maybe the TARP repayment, and you still have some preferreds outstanding, just wondering as we approach the reset date in early ’14 if you have any plans?
Dennis S. Hudson III: Yeah, we haven’t announced any plans. It’s obviously something we continue to focus on and explore all of our options and when we have something to say, we will. I would say that we have many options. We’re considering all of them. We’ll take a look at it, anywhere from funding it internally to other capital transactions. So we’ll look at everything and we’ll let you know when we have something to say.
Scott Valentin: Okay, thanks, and then just a follow-up question. Loan origination volume was pretty strong, but the overall loan growth was less than we expected. Is that just a function of high payoffs during the quarter I assume?
Dennis S. Hudson III: Yeah, we actually did have some fairly unusual and high payoffs this quarter and it included some larger troubled debt restructures, which of course were accruing and so forth, so we continue to work through those. I would say our outlook, Bill, is probably for fewer payoffs as we look ahead. We’re running out of large credits to get refi’d and paid off.
William R. Hahl: Yep.
Dennis S. Hudson III: And David’s shaking his head as well, so probably continued decent volume will result in a little better loan growth as we look forward. That’s our plan.
Scott Valentin: Okay, thanks. I’ll get back in the queue. Thank you.
Operator: From Stephens we have Robert Madsen online. Please go ahead.
- 5 - |
Robert Madsen: Yeah, good morning, gentlemen.
William R. Hahl: Good morning.
Robert Madsen: I was just curious, how many new lenders did you hire during the quarter and how does that shake out year-to-date, and then what is your expectation for the size of books that these lenders should have and the timeline for them to get to a full book?
Dennis S. Hudson III: In the press release, we disclosed quite a bit of information about the incremental costs associated with those hires. There’s a table in the back or the body of the release that describes the investment, and today we’re carrying… One way we look at it is we expect in 90 days we should see a pipeline growing after a new hire, and at the six-month mark we expect to see production actually hitting the books. We firmly believe the first six months are really an investment period; and we’re carrying about $0.5 million a quarter of incremental expense, which is a pretty significant number on an $18 million core overall expense structure. We’re carrying $0.5 million a quarter, maybe $2.0 million a year of incremental expense related to people who have been here six months or less. I don’t think we’ve published the number in terms of what we’ve hired this quarter. But in aggregate, if you go back to the middle of ’12 when we started some of this hiring, we’ve probably hired 30 plus guys, I would say.
Robert Madsen: Okay. So then just moving onto the expense side, so you’ve targeted it looks like $7.4 million of expense reductions for the year and then you’re adding these lenders, you’re getting - - you’re going to get increased loan growth. So could you talk a little bit about your goals for the efficiency ratio and where you can see that going over the next year or so?
Dennis S. Hudson III: Yeah, we haven’t said anything about the next year, but clearly we need to get our overall efficiency ratio in much better shape. It’s begun to move a little better in the last couple of quarters, as you can see, but we are targeting that down in the mid 60s over the next couple of years. It’s going to come through a combination of all the things we talked about during the call—revenue growth as well as redeployment as well as just wringing costs out. One big factor to that over time clearly is adjusting our distribution costs, so we have a lot of plans in and around that. We’re not pleased with where our efficiency ratio is today. We want to get it down, but we also want to take advantage of what we see as a pretty significant turn in the economy here, so we want to be investing and driving revenue growth in this period. That’s the most important thing for us to be doing, but all the while finding ways to rationalize our expense structure, and we think in a couple of years it could be in a much better position. It’ll take a little bit of time, but we’re making good progress every quarter.
Robert Madsen: Okay, thank you.
Operator: We have Jefferson Harralson online. Please go ahead.
- 6 - |
Jefferson Harralson: Hi, thanks. I want to ask my first question on the business model change that you were talking about—the Accelerators and your Achievement Advisors. Can you just talk about just what you’re doing there and how’d you characterize that relative to the former model and why you went to it and what you expect to get out of that change?
Dennis S. Hudson III: We did a lot of work contacting some of our existing business clients and shadowed them in terms of what they do every day with respect to their need for financial services and banking services. It really, Jefferson, answers the question: As more and more of our transactions get ported over to digital channels, particularly in the business area, we think there’s a great opportunity to do a much better job serving our business clients. And we think the way we serve those business clients is take the bank into their office. It answers the question for us, as a community bank: How do we grow our exposure, particularly in more metro markets where we’re currently operating in South Florida and Orlando? How do we grow our franchise and our customer base there without a huge branch infrastructure, and couldn’t that actually be a competitive advantage for us to approach it that way? This project, which we developed about a year ago, was something that we felt answered that question and most importantly met customer needs. With continuing growth in remote deposit capture now rolling out in all of our digital products, we just don’t see the need for the branch, particularly when it comes to the business customer. We also focused our selling effort and our marketing into businesses that can connect with this technology more easily. I think that’s a key focus for us in that business line, and yet it also comes with a guy that you know as a business owner and he is your guy and he takes care of everything you need because he’s backed by a good-sized community organization with all of the products and services that you need, but he brings them into your office. So these guys are less about big office buildings, they’re more about being in our customers’ offices.
Jefferson Harralson: All right, awesome, thank you. I want to follow up just with a model question: Can I get the bank level leverage ratio and the holding company cash for the model?
Dennis S. Hudson III: We’ll get back to you on those ratios. They’re stronger than the consolidated ratios a little bit, so we’ll get back with you on that.
Jefferson Harralson: All right, thank you.
Operator: From Raymond James, we have Kyle Oliver online. Please go ahead.
Kyle Oliver: Hey, guys, how’s it going?
Dennis S. Hudson III: Good.
Kyle Oliver: Just looking at loan growth during the quarter, I know you said there were some large payoffs, but where are you seeing the most strength by market?
Dennis S. Hudson III: I would say the South Florida market. Wouldn’t you agree, David?
David D. Houdeshell: Yes, I certainly would.
- 7 - |
Dennis S. Hudson III: Yeah, the South Florida market is extremely busy today. We’re doing quite a bit in Broward County, which would be Boca and South. Palm Beach County is doing much better, and our Treasure Coast region is doing… I mean we’re really seeing strengthening occurring all over, but clearly a lot of opportunities in South Florida. The Orlando market has also improved quite a bit for us and we’re seeing sort of continued growth in that market. So it’s kind of all over, but I would say it’s particularly strong the further south we go. Miami was very quick to come back and that’s spreading up the East Coast and we’re feeling that big time I would say up here in Palm Beach County and north finally, which is great. One thing I mentioned on the call was the return of construction. That’s a key industry in the State of Florida and it was a pummeled industry during the downturn. You know you saw a lot of construction cranes in Miami early on as things turned, but we’re now seeing lots of houses and construction starting to occur in Orlando and even in the Treasure Coast area where we have a big concentration. That’s really beginning to drive I think employment numbers in the right direction; and it’ll be interesting to see as we hit the end of the year what kind of impact that has, but a lot of houses, a lot of construction. Things are starting to turn in a more remarkable way.
Kyle Oliver: Okay, great. And just along with the growth, have you started to see the big box competitors come back in those markets or is it still mostly community banks?
Dennis S. Hudson III: Well, I would say many of the community banks were wiped out and many of the competitors that we had prior to the crisis no longer exist. Frankly, we find in most of our markets that it’s us competing with the mega banks. The mega banks have become more competitive in the last year as they have struggled I think to maintain some of their lending balances and struggled with the same things all of us are in this low rate environment. We find it’s become a more stark, bifurcated market that actually is an advantage for us. So that’s one reason we’re so excited about some of the new projects we have to grow revenues. We think we look very different compared to the mega banks and there are very few community banks out there today that are able to compete.
Kyle Oliver: Okay, great, guys. Thank you very much.
Operator: And from FBR Capital Markets we have Scott Valentin back online. Please go ahead.
Scott Valentin: Thanks for taking the follow-up question. With regards to margin, I know you pointed out I think in the 13 basis points, 10 basis points was recovery of accrued interest, but yet you had about 3 basis points of core expansion. Is it fair to assume going forward we can get a couple of basis points every quarter due to mix shift?
Dennis S. Hudson III: Generally I would say yes; however, we are going in, Bill, into Q4, which we tend to see the balance sheet grow there.
William R. Hahl: Right.
Dennis S. Hudson III: And we’re going to probably have too much liquidity as we go into Q4, which could limit the margin in Q4. So if you go back and … Well, you really can’t because of the last several years we really haven’t had a normal seasonal growth, but we’re looking to try to preserve that I would say in Q4 and then it starts growing as we get beyond the seasonal growth impact that happens in the winter to us.
- 8 - |
Scott Valentin: Okay. And then just a follow-up on the… Oh, sorry.
Dennis S. Hudson III: Just to be clear, we are seeing margin expansion out over the next few quarters, but there may be some short-term mitigation due to the seasonal impacts, but it is going to yield higher net interest income.
Scott Valentin: Okay, and then…
Dennis S. Hudson III: Yeah, you had a follow-up.
Scott Valentin: Yep, just a follow-up on the deferred tax asset valuation allowance, is there anything left, or you fully used the valuation - - recovered the valuation allowance?
William R. Hahl: Yeah, we fully recovered it.
Scott Valentin: Fully recovered it, okay. And then the effective tax rate going forward you expect?
William R. Hahl: Thirty-eight percent.
Scott Valentin: Thirty-eight, okay. Thank you.
Operator: And we are standing by for any further questions.
From Stephens, we have Robert Madsen back online. Please go ahead.
Dennis S. Hudson III: Robert.
Robert Madsen: With the improvement… Yeah, sorry about that. With the improvement in your credit quality and the removal of the regulatory orders, when do you think you could start seeing an improvement in the FDIC assessment expense?
William R. Hahl: Those two aren’t really tied for community banks at all. It’s just a straight calculation, so there won’t be any improvement in the FDIC expense. We had all the improvement a year ago I think when we switched over.
Dennis S. Hudson III: Does that answer your question?
Robert Madsen: Yeah, thank you.
Dennis S. Hudson III: Thank you.
Operator: And we have Jefferson Harralson back online. Please go ahead.
Jefferson Harralson: Hi. A quick one on the regulatory capital. How much of the DTA has come back into regulatory capital and how much still will come in over time?
- 9 - |
William R. Hahl: Yeah, Jefferson, nothing really additional. We’ve been recognizing in the past from some tax planning strategies and so we were including some of the deferred tax asset in regulatory capital, so there really won’t be a big change to our regulatory capital ratios as a result of the recovery.
Dennis S. Hudson III: But, as you know, as earnings improve and our forward view of earnings improves, it will gradually increase more of that deferred asset that can be pulled into regulatory capital. You know there are severe limitations on it, but you can look at the next year’s earnings estimates and come up with a conservative number you can throw into regulatory capital. Up until recently, that obviously has not been as significant as it will be going forward, so Bill’s right. Obviously we don’t look for any immediate change of any significance, but over time, and I’m talking over the next year, that will gradually increase.
Jefferson Harralson: Okay. And so how much is allowed to come through? Is it in the 40s?
William R. Hahl: How much that’s excluded?
Jefferson Harralson: Right.
William R. Hahl: About 50 million - - about 50 million is excluded.
Jefferson Harralson: All right, great. Thank you.
Operator: And once again, we'll stand by for any further questions. Okay, it looks like no further questions at the moment. Mr. Hudson, I’ll turn it back to you for any closing remarks.
Dennis S. Hudson III: Thank you very much. We appreciate your attendance today and look forward to next quarter’s results. Thank you.
Operator: And this concludes today’s conference. Thank you for joining. You may now disconnect.
- 10 - |
Third Quarter 2013 October 28, 2013
2 Cautionary Notice Regarding Forward - Looking Statements This press release contains “forward - looking statements” within the meaning of Section 27 A of the Securities Act of 1933 and Section 21 E of the Securities Exchange Act of 1934 , including, without limitation, statements about future financial and operating results, ability to realized deferred tax assets, cost savings, enhanced revenues, economic and seasonal conditions in our markets, and improvements to reported earnings that may be realized from cost controls and for integration of banks that we have acquired, as well as statements with respect to Seacoast’s objectives, expectations and intentions and other statements that are not historical facts . Actual results may differ from those set forth in the forward - looking statements . Forward - looking statements include statements with respect to our beliefs, plans, objectives, goals, expectations, anticipations, estimates and intentions, and involve known and unknown risks, uncertainties and other factors, which may be beyond our control, and which may cause the actual results, performance or achievements of Seacoast to be materially different from future results, performance or achievements expressed or implied by such forward - looking statements . You should not expect us to update any forward - looking statements . You can identify these forward - looking statements through our use of words such as “may,” “will,” “anticipate,” “assume,” “should,” “support”, “indicate,” “would,” “believe,” “contemplate,” “expect,” “estimate,” “continue,” “further”, “point to,” “project,” “could,” “intend” or other similar words and expressions of the future . These forward - looking statements may not be realized due to a variety of factors, including, without limitation : the effects of future economic and market conditions, including seasonality ; governmental monetary and fiscal policies, as well as legislative, tax and regulatory changes ; changes in accounting policies, rules and practices ; the risks of changes in interest rates on the level and composition of deposits, loan demand, liquidity and the values of loan collateral, securities, and interest sensitive assets and liabilities ; interest rate risks, sensitivities and the shape of the yield curve ; the effects of competition from other commercial banks, thrifts, mortgage banking firms, consumer finance companies, credit unions, securities brokerage firms, insurance companies, money market and other mutual funds and other financial institutions operating in our market areas and elsewhere, including institutions operating regionally, nationally and internationally, together with such competitors offering banking products and services by mail, telephone, computer and the Internet ; and the failure of assumptions underlying the establishment of reserves for possible loan losses . The risks of mergers and acquisitions, include, without limitation : unexpected transaction costs, including the costs of integrating operations ; the risks that the businesses will not be integrated successfully or that such integration may be more difficult, time - consuming or costly than expected ; the potential failure to fully or timely realize expected revenues and revenue synergies, including as the result of revenues following the merger being lower than expected ; the risk of deposit and customer attrition ; any changes in deposit mix ; unexpected operating and other costs, which may differ or change from expectations ; the risks of customer and employee loss and business disruption, including, without limitation, as the result of difficulties in maintaining relationships with employees ; increased competitive pressures and solicitations of customers by competitors ; as well as the difficulties and risks inherent with entering new markets . All written or oral forward - looking statements attributable to us are expressly qualified in their entirety by this cautionary notice, including, without limitation, those risks and uncertainties described in our annual report on Form 10 - K for the year ended December 31 , 2012 under “Special Cautionary Notice Regarding Forward - Looking Statements” and “Risk Factors”, and otherwise in our SEC reports and filings . Such reports are available upon request from the Company, or from the Securities and Exchange Commission, including through the SEC’s Internet website at http : //www . sec . gov .
3 Generating Momentum – Highlights, YTD 2013 Building Shareholder Value • Valuation allowance on deferred tax assets reversed • Pretax income for the first nine months of 2013 totaled $9.7 million, up $10.6 million compared to the first nine months of 2012 • Net loan outstandings increased $39.7 million or 4.4% annualized from December 2012 • Noninterest income excluding security gains for the first nine months of 2013 up 15.9%, the result of better performance in deposit interchange and service charges, mortgage banking fees, and wealth management revenue • Performance restoration plan results in noninterest expense reduction of 10% or $6.3 million when compared to the first nine months of 2012 Growing Our Franchise • Customer demand deposits increased $43.8 million or 10.7%, year over year. • Originated $430.3 million in loans over the first nine months, up 29.9% over the prior year • Rebranded digital offerings and website, launched tablet platform, and enhanced ATM capabilities. In process of launching consumer and business smart phone check capture and business mobile banking. Reducing our Risk Posture • Termination of formalized regulatory agreements • Net charge - offs of $2.8 million for the first nine months, compared to $12.1 million one year prior • Nonperforming loans declined by $15.8 million, or 35% year over year • Accruing restructured loans reduced by $18.7 million, or 42% when compared to the third quarter of 2012 • Nonperforming assets to total assets of 1.60% • Classified assets as a ratio to tier one capital plus the allowance down to 22.7% and special mention assets ratio declined to 4.6%
4 Cost Reductions Powering Opportunities to Invest in Revenue Producing Strategies • Continued investment in commercial customer acquisition while simultaneously reducing overheard in multiple areas. • Approximately $1.7 million in overheard in the first nine months was attributable to commercial customer acquisition teams with less than six months with Seacoast. • Reinvested cost savings into additional new digital services totaling $138 thousand in the first nine months. Dollars in Thousands Noninterest expenses: YTD 2013 YTD 2012 Inc / Dec Salaries and wages 22,929$ 22,593$ 336$ Employee benefits 5,759 5,850 (91) Furniture and equipment 1,737 1,672 65 Outsourced data processing costs 4,786 5,478 (692) Occupancy 5,354 5,905 (551) Marketing 1,590 2,388 (798) Legal and professional fees 1,969 4,127 (2,158) Asset dispositions expense 560 1,259 (699) Net loss on other real estate owned and repossessed assets1,289 3,310 (2,021) Other 10,533 10,181 352 Total Noninterest Expenses 56,506$ 62,763$ (6,257)$ Expenses Reduced and Reinvested in Building Customer Aquisition Teams
5 Loan Production Remains Strong • Commercial loan production totals $138.3 million through the first three quarters of 2013, an increase of $78.5 million from the same period last year. • Accelerate - innovative small business platform launched in three Florida metro markets including three offices in Orlando, one in Fort Lauderdale, and one in Boca Raton in the first nine months of 2013 (See Appendix for further details). * * Loans approved and in underwriting but net yet closed Dollars in Thousands $- $10,000 $20,000 $30,000 $40,000 $50,000 $60,000 $70,000 $80,000 Q3 2012 Q4 2012 Q1 2013 Q2 2013 Q3 2013 Total Commercial Loans Originated Total Commercial Pipeline* Originations in Q3 up $8.4 million or 34% compared to 2012. Pipeline strengthens.
6 Continued Growth in Noninterest Income Fueled by Increased Deposit and Wealth Fees • Fee changes and deposit product restructuring resulted in higher service charges and interchange income • Wealth management service fees up 29.3% compared to prior year • Noninterest related income growing as a percentage of overall revenue structure 21% Dollars in Thousands Noninterest Income $5,679 $6,087 $4,000 $4,500 $5,000 $5,500 $6,000 $6,500 Q3 2012 Q1 2013 Q3 2013 Fee Based Revenues $- $2,000 $4,000 $6,000 $8,000 $10,000 Deposit Fees Wealth Management Service Fees Mortgage banking fees Q3 2012 (YTD) Q3 2013 (YTD)
7 Aggressive Pursuit of Problem Credits in 2012 Resulting in Lower Workout Expenses in 2013 • Moderate economic expansion and increasing real estate values is leading to quicker resolution of problem loans and opportunities to sell OREO at more favorable pricing. • Expense associated with workouts is expected to decline as historical credit issues are becoming less meaningful. Dollars in Thousands Dollars in Thousands $- $10,000 $20,000 $30,000 $40,000 $50,000 Nonperforming Loans Other Real Estate Owned Restructured Loans (Accruing) Q3 2012 Q3 2013 $364 $159 $- $50 $100 $150 $200 $250 $300 $350 $400 Q3 2012 Q4 2012 Q1 2013 Q2 2013 Q3 2013 Asset Disposition Expense
8 Recoveries Exceed Charge Offs, Coverage Ratio Climbs • Third quarter sees net recoveries • Risk posture declining as credit issues abate • Less volatility expected going forward Net Charge Offs To Average Loans 0.79% -0.22% -0.40% -0.20% 0.00% 0.20% 0.40% 0.60% 0.80% 1.00% Q3 2012 Q4 2012 Q1 2013 Q2 2013 Q3 2013 Coverage Ratio - NPLs 72.35% 52.01% 35.00% 40.00% 45.00% 50.00% 55.00% 60.00% 65.00% 70.00% 75.00% Q3 2012 Q4 2012 Q1 2013 Q2 2013 Q3 2013
9 Significant Reduction in Nonperforming Loan Inflow Resulting in Much Improved Credit Statistics Dollars in Thousands * Accruing loans 30 + days past due Restructured Loans - Accruing $25,509 $44,179 $0 $10,000 $20,000 $30,000 $40,000 $50,000 Q3 2012 Q4 2012 Q1 2013 Q2 2013 Q3 2013 NPL Inflows $14,950 $2,019 $- $5,000 $10,000 $15,000 $20,000 Q3 2012 Q4 2012 Q1 2013 Q2 2013 Q3 2013 Substandard Loans $47,159 $67,586 $- $20,000 $40,000 $60,000 $80,000 Q3 2012 Q4 2012 Q1 2013 Q2 2013 Q3 2013 Accruing Past Dues* 0.29% 0.15% 0.00% 0.10% 0.20% 0.30% 0.40% Q3 2012 Q4 2012 Q1 2013 Q2 2013 Q3 2013
10 Seacoast Retail Franchise Continues to Accrete Value • On - going Sales coaching is yielding additional services per customer and higher new customer balances on average • Launched a tablet platform, rebranded internet banking platforms and website, and rolled out enhanced ATM capabilities • Adding smart phone deposit capture for consumer and business customers in the fourth quarter of 2013. Enhancing transfer capabilities in early 2014 • Cost of deposits is near zero, with 75% of new customer checking account openings in fee based products Dollars in Thousands Business Demand Deposits $170,000 $254,000 $50,000 $100,000 $150,000 $200,000 $250,000 $300,000 Q3 2011 Q3 2012 Q3 2013 Retail Demand Deposits $130,000 $155,000 $50,000 $70,000 $90,000 $110,000 $130,000 $150,000 $170,000 Q3 2011 Q3 2012 Q3 2013
11 2013 - 2014 Priorities Building Shareholder Value • Continue expense control posture, maximize revenue opportunities and position the bank for stronger earnings in 2014 • Position for offensive strategic opportunities and higher ROE in 2014 Growing Our Franchise • Improved value proposition with innovative digital product offerings and enhanced customer interactions • Examine branch network for opportunities for reinvestment and enhancements to the customer experience • Continue refining our commercial and business banking strategy; develop out branding and presence in Orlando, Boca Raton and Ft. Lauderdale • Look for opportunities to expand our presence into the deeper markets of Orlando and South Florida
12 Appendix
13
14
15
&I1A2PV&H0DTDE*K6
MJ2J5Z]6I4J-KNS_BK"<1?11K8/+.&,DX5RO(/&K@S+\/A,IA7JXK,<5/P\XP
MGF.=YYFF,JUL9F>:YEB(J ?@+_P`%)_V4/V@/V7?B-^V#
MH_C'7OAK\%?@YJ_Q#\/_`!BU'XW>$=<^%GB/X5Z_\*9#!X^T/QOX7\16\>JZ
M7K'A^Y'V*XTR**[O9]2*Z5:PSZHPLZ_.[_@UZ\)^$/"__!%#]D>X\)P622>+
M9OB_XL\5WEK]F>;4_%]Y\8_'.F:G/J,UL6,][86ND:=H2_:6-S:V&CV.GR!%
MLTC3\U?^#M_0_!OP/_X)6Z[HGP'6P\+Q?M`_\%(_AOK_`.TOI'A?46N8O$?B
M37O@O\5_'=]<>+=.CNKB/1KC6?%'PU^&7BRYM3#817^M:?8:V\$M]J!P
%;3P_H[ZA6I^Q
M]XA_9A\4?\$W/BC^SY\>/C9X0^%M]\1_CQ=PZ/9'_ST3_OI?\:`L^S^YCZ*9YD?
M_/1/^^E_QH\R/_GHG_?2_P"-`6?9_
9'_ST3_OI?\:`L^S^
MYCZ*9YD?_/1/^^E_QH\R/_GHG_?2_P"-`6?9_
9'_ST3_OI
M?\:`L^S^YCZ*9YD?_/1/^^E_QH\R/_GHG_?2_P"-`6?9_
9
M'_ST3_OI?\:`L^S^YCZ*9YD?_/1/^^E_QH\R/_GHG_?2_P"-`6?9_
9'_ST3_OI?\:`L^S^YCZ*9YD?_/1/^^E_QH\R/_GHG_?2_P"-`6?9
M_
9'_ST3_OI?\:`L^S^YCZ*9YD?_/1/^^E_QI0RM]UE;Z$'
M^1H"S[/[AU%%%`@HHHH`_O=_X9K_`&<_^B`_!3_PU?@7_P"4-'_#-?[.?_1`
M?@I_X:OP+_\`*&O:Z*_SM_M/,O\`H8X[_P`*\1_\L/\`I_\`]4N%/^B9X>_\
M,N6__,WDON/%/^&:_P!G/_H@/P4_\-7X%_\`E#1_PS7^SG_T0'X*?^&K\"__
M`"AKVNBC^T\R_P"ACCO_``KQ'_RP/]4N%/\`HF>'O_#+EO\`\S>2^X\4_P"&
M:_V<_P#H@/P4_P##5^!?_E#1_P`,U_LY_P#1`?@I_P"&K\"__*&O:Z*/[3S+
M_H8X[_PKQ'_RP/\`5+A3_HF>'O\`PRY;_P#,WDON/%/^&:_V<_\`H@/P4_\`
M#5^!?_E#1_PS7^SG_P!$!^"G_AJ_`O\`\H:]KHH_M/,O^ACCO_"O$?\`RP/]
M4N%/^B9X>_\`#+EO_P`S>2^X\4_X9K_9S_Z(#\%/_#5^!?\`Y0T?\,U_LY_]
M$!^"G_AJ_`O_`,H:]KHH_M/,O^ACCO\`PKQ'_P`L#_5+A3_HF>'O_#+EO_S-
MY+[CQ3_AFO\`9S_Z(#\%/_#5^!?_`)0T?\,U_LY_]$!^"G_AJ_`O_P`H:]KH
MH_M/,O\`H8X[_P`*\1_\L#_5+A3_`*)GA[_PRY;_`/,WDON/%/\`AFO]G/\`
MZ(#\%/\`PU?@7_Y0T?\`#-?[.?\`T0'X*?\`AJ_`O_RAKVNBC^T\R_Z&.._\
M*\1_\L#_`%2X4_Z)GA[_`,,N6_\`S-Y+[CQ3_AFO]G/_`*(#\%/_``U?@7_Y
M0T?\,U_LY_\`1`?@I_X:OP+_`/*&O:Z*/[3S+_H8X[_PKQ'_`,L#_5+A3_HF
M>'O_``RY;_\`,WDON/%/^&:_V<_^B`_!3_PU?@7_`.4-'_#-?[.?_1`?@I_X
M:OP+_P#*&O:Z*/[3S+_H8X[_`,*\1_\`+`_U2X4_Z)GA[_PRY;_\S>2^X\4_
MX9K_`&<_^B`_!3_PU?@7_P"4-'_#-?[.?_1`?@I_X:OP+_\`*&O:Z*/[3S+_
M`*&.._\`"O$?_+`_U2X4_P"B9X>_\,N6_P#S-Y+[CQ3_`(9K_9S_`.B`_!3_
M`,-7X%_^4-'_``S7^SG_`-$!^"G_`(:OP+_\H:]KHH_M/,O^ACCO_"O$?_+`
M_P!4N%/^B9X>_P##+EO_`,S>2^X\4_X9K_9S_P"B`_!3_P`-7X%_^4-'_#-?
M[.?_`$0'X*?^&K\"_P#RAKVNBC^T\R_Z&.._\*\1_P#+`_U2X4_Z)GA[_P`,
MN6__`#-Y+[CQ3_AFO]G/_H@/P4_\-7X%_P#E#1_PS7^SG_T0'X*?^&K\"_\`
MRAKVNBC^T\R_Z&.._P#"O$?_`"P/]4N%/^B9X>_\,N6__,WDON/%/^&:_P!G
M/_H@/P4_\-7X%_\`E#1_PS7^SG_T0'X*?^&K\"__`"AKVNBC^T\R_P"ACCO_
M``KQ'_RP/]4N%/\`HF>'O_#+EO\`\S>2^X\4_P"&:_V<_P#H@/P4_P##5^!?
M_E#1_P`,U_LY_P#1`?@I_P"&K\"__*&O:Z*/[3S+_H8X[_PKQ'_RP/\`5+A3
M_HF>'O\`PRY;_P#,WDON/%/^&:_V<_\`H@/P4_\`#5^!?_E#1_PS7^SG_P!$
M!^"G_AJ_`O\`\H:]KHH_M/,O^ACCO_"O$?\`RP/]4N%/^B9X>_\`#+EO_P`S
M>2^X\4_X9K_9S_Z(#\%/_#5^!?\`Y0T?\,U_LY_]$!^"G_AJ_`O_`,H:]KHH
M_M/,O^ACCO\`PKQ'_P`L#_5+A3_HF>'O_#+EO_S-Y+[CQ3_AFO\`9S_Z(#\%
M/_#5^!?_`)0T?\,U_LY_]$!^"G_AJ_`O_P`H:]KHH_M/,O\`H8X[_P`*\1_\
ML#_5+A3_`*)GA[_PRY;_`/,WDON/%/\`AFO]G/\`Z(#\%/\`PU?@7_Y0T?\`
M#-?[.?\`T0'X*?\`AJ_`O_RAKVNBC^T\R_Z&.._\*\1_\L#_`%2X4_Z)GA[_
M`,,N6_\`S-Y+[CQ3_AFO]G/_`*(#\%/_``U?@7_Y0T?\,U_LY_\`1`?@I_X:
MOP+_`/*&O:Z*/[3S+_H8X[_PKQ'_`,L#_5+A3_HF>'O_``RY;_\`,WDON/%/
M^&:_V<_^B`_!3_PU?@7_`.4-'_#-?[.?_1`?@I_X:OP+_P#*&O:Z*/[3S+_H
M8X[_`,*\1_\`+`_U2X4_Z)GA[_PRY;_\S>2^X\4_X9K_`&<_^B`_!3_PU?@7
M_P"4-'_#-?[.?_1`?@I_X:OP+_\`*&O:Z*/[3S+_`*&.._\`"O$?_+`_U2X4
M_P"B9X>_\,N6_P#S-Y+[CQ3_`(9K_9S_`.B`_!3_`,-7X%_^4-'_``S7^SG_
M`-$!^"G_`(:OP+_\H:]KHH_M/,O^ACCO_"O$?_+`_P!4N%/^B9X>_P##+EO_
M`,S>2^X\4_X9K_9S_P"B`_!3_P`-7X%_^4-'_#-?[.?_`$0'X*?^&K\"_P#R
MAKVNBC^T\R_Z&.._\*\1_P#+`_U2X4_Z)GA[_P`,N6__`#-Y+[CQ3_AFO]G/
M_H@/P4_\-7X%_P#E#1_PS7^SG_T0'X*?^&K\"_\`RAKVNBC^T\R_Z&.._P#"
MO$?_`"P/]4N%/^B9X>_\,N6__,WDON/%/^&:_P!G/_H@/P4_\-7X%_\`E#1_
MPS7^SG_T0'X*?^&K\"__`"AKVNBC^T\R_P"ACCO_``KQ'_RP/]4N%/\`HF>'
MO_#+EO\`\S>2^X\4_P"&:_V<_P#H@/P4_P##5^!?_E#1_P`,U_LY_P#1`?@I
M_P"&K\"__*&O:Z*/[3S+_H8X[_PKQ'_RP/\`5+A3_HF>'O\`PRY;_P#,WDON
M/%/^&:_V<_\`H@/P4_\`#5^!?_E#1_PS7^SG_P!$!^"G_AJ_`O\`\H:]KHH_
MM/,O^ACCO_"O$?\`RP/]4N%/^B9X>_\`#+EO_P`S>2^X\4_X9K_9S_Z(#\%/
M_#5^!?\`Y0T?\,U_LY_]$!^"G_AJ_`O_`,H:]KHH_M/,O^ACCO\`PKQ'_P`L
M#_5+A3_HF>'O_#+EO_S-Y+[CQ3_AFO\`9S_Z(#\%/_#5^!?_`)0T?\,U_LY_
M]$!^"G_AJ_`O_P`H:]KHH_M/,O\`H8X[_P`*\1_\L#_5+A3_`*)GA[_PRY;_
M`/,WDON/%/\`AFO]G/\`Z(#\%/\`PU?@7_Y0T?\`#-?[.?\`T0'X*?\`AJ_`
MO_RAKVNBC^T\R_Z&.._\*\1_\L#_`%2X4_Z)GA[_`,,N6_\`S-Y+[CQ3_AFO
M]G/_`*(#\%/_``U?@7_Y0T?\,U_LY_\`1`?@I_X:OP+_`/*&O:Z*/[3S+_H8
MX[_PKQ'_`,L#_5+A3_HF>'O_``RY;_\`,WDON/%/^&:_V<_^B`_!3_PU?@7_
M`.4-'_#-?[.?_1`?@I_X:OP+_P#*&O:Z*/[3S+_H8X[_`,*\1_\`+`_U2X4_
MZ)GA[_PRY;_\S>2^X\4_X9K_`&<_^B`_!3_PU?@7_P"4-'_#-?[.?_1`?@I_
MX:OP+_\`*&O:Z*/[3S+_`*&.._\`"O$?_+`_U2X4_P"B9X>_\,N6_P#S-Y+[
MCQ3_`(9K_9S_`.B`_!3_`,-7X%_^4-'_``S7^SG_`-$!^"G_`(:OP+_\H:]K
MHH_M/,O^ACCO_"O$?_+`_P!4N%/^B9X>_P##+EO_`,S>2^X\4_X9K_9S_P"B
M`_!3_P`-7X%_^4-'_#-?[.?_`$0'X*?^&K\"_P#RAKVNBC^T\R_Z&.._\*\1
M_P#+`_U2X4_Z)GA[_P`,N6__`#-Y+[CQ3_AFO]G/_H@/P4_\-7X%_P#E#1_P
MS7^SG_T0'X*?^&K\"_\`RAKVNBC^T\R_Z&.._P#"O$?_`"P/]4N%/^B9X>_\
M,N6__,WDON/%/^&:_P!G/_H@/P4_\-7X%_\`E#1_PS7^SG_T0'X*?^&K\"__
M`"AKVNBC^T\R_P"ACCO_``KQ'_RP/]4N%/\`HF>'O_#+EO\`\S>2^X\4_P"&
M:_V<_P#H@/P4_P##5^!?_E#1_P`,U_LY_P#1`?@I_P"&K\"__*&O:Z*/[3S+
M_H8X[_PKQ'_RP/\`5+A3_HF>'O\`PRY;_P#,WDON/%/^&:_V<_\`H@/P4_\`
M#5^!?_E#1_PS7^SG_P!$!^"G_AJ_`O\`\H:]KHH_M/,O^ACCO_"O$?\`RP/]
M4N%/^B9X>_\`#+EO_P`S>2^X\4_X9K_9S_Z(#\%/_#5^!?\`Y0T?\,U_LY_]
M$!^"G_AJ_`O_`,H:]KHH_M/,O^ACCO\`PKQ'_P`L#_5+A3_HF>'O_#+EO_S-
MY+[CQ3_AFO\`9S_Z(#\%/_#5^!?_`)0T?\,U_LY_]$!^"G_AJ_`O_P`H:]KH
MH_M/,O\`H8X[_P`*\1_\L#_5+A3_`*)GA[_PRY;_`/,WDON/%/\`AFO]G/\`
MZ(#\%/\`PU?@7_Y0T?\`#-?[.?\`T0'X*?\`AJ_`O_RAKVNBC^T\R_Z&.._\
M*\1_\L#_`%2X4_Z)GA[_`,,N6_\`S-Y+[CQ3_AFO]G/_`*(#\%/_``U?@7_Y
M0T?\,U_LY_\`1`?@I_X:OP+_`/*&O:Z*/[3S+_H8X[_PKQ'_`,L#_5+A3_HF
M>'O_``RY;_\`,WDON/%/^&:_V<_^B`_!3_PU?@7_`.4-'_#-?[.?_1`?@I_X
M:OP+_P#*&O:Z*/[3S+_H8X[_`,*\1_\`+`_U2X4_Z)GA[_PRY;_\S>2^X\4_
MX9K_`&<_^B`_!3_PU?@7_P"4-'_#-?[.?_1`?@I_X:OP+_\`*&O:Z*/[3S+_
M`*&.._\`"O$?_+`_U2X4_P"B9X>_\,N6_P#S-Y+[CQ3_`(9K_9S_`.B`_!3_
M`,-7X%_^4-'_``S7^SG_`-$!^"G_`(:OP+_\H:]KHH_M/,O^ACCO_"O$?_+`
M_P!4N%/^B9X>_P##+EO_`,S>2^X\4_X9K_9S_P"B`_!3_P`-7X%_^4-'_#-?
M[.?_`$0'X*?^&K\"_P#RAKVNBC^T\R_Z&.._\*\1_P#+`_U2X4_Z)GA[_P`,
MN6__`#-Y+[CQ3_AFO]G/_H@/P4_\-7X%_P#E#1_PS7^SG_T0'X*?^&K\"_\`
MRAKVNBC^T\R_Z&.._P#"O$?_`"P/]4N%/^B9X>_\,N6__,WDON/%/^&:_P!G
M/_H@/P4_\-7X%_\`E#1_PS7^SG_T0'X*?^&K\"__`"AKVNBC^T\R_P"ACCO_
M``KQ'_RP/]4N%/\`HF>'O_#+EO\`\S>2^X\4_P"&:_V<_P#H@/P4_P##5^!?
M_E#1_P`,U_LY_P#1`?@I_P"&K\"__*&O:Z*/[3S+_H8X[_PKQ'_RP/\`5+A3
M_HF>'O\`PRY;_P#,WDON/%/^&:_V<_\`H@/P4_\`#5^!?_E#7Y!_\%I/A)\*
M?`'[,OPWU;P)\,OA[X*U6[^/_AS3;K4_"7@OPWX;U&YTZ7X:_%:ZET^>^T?3
M+.ZFL9;JSL[F2TDE:WDN+2UF>-I;>%D_>>OQ9_X+I?\`)JOPO_[.,\,_^JN^
M+U?9^'>88^KQMPY3JXW%U*<\Q@I0J8FM.$E[.II*,IN+7DTT?A/TG>&N',)X
M`^*>)PF09+A<11X6Q,Z.(P^58&C6I35?#)2IU:="-2$DM.:,D[:7/Y7:***_
MM\_Y]@HHHH`_T2****_S?/\`J@"BBB@`HHHH`****`"BBB@`HHHH`****`"B
MBB@`HHHH`****`"BBB@`HHHH`****`"BBB@`HHHH`****`"BBB@`HHHH`***
M*`"BBB@`HHHH`****`"BBB@`HHHH`****`"BBB@`HHHH`****`"BBB@`HHHH
M`****`"BBB@`HHHH`****`"BBB@`HHHH`****`"BBB@`HHHH`****`"BBB@`
MHHHH`****`"BBB@`HHHH`****`"BBB@`HHHH`****`"BBB@`HHHH`*_%G_@N
ME_R:K\+_`/LXSPS_`.JN^+U?M-7XL_\`!=+_`)-5^%__`&<9X9_]5=\7J^V\
M./\`DN>&O^QE#_TW4/P+Z4O_`"CWXL?]DIB?_4C#'\KM%%%?W4?\[@4444`?
MZ)%%%%?YOG_5`%%%%`!1110`4444`%%%%`!1110`4444`%%%%`!1110`4444
M`%%%%`!1110`4444`%%%%`!1110`4444`%%%%`!1110`4444`%%%%`!1110`
M4444`%%%%`!1110`4444`%%%%`!1110`4444`%%%%`!1110`4444`%%%%`!1
M110`4444`%%%%`!1110`4444`%%%%`!1110`4444`%%%%`!1110`4444`%%%
M%`!1110`4444`%%%%`!1110`4444`%%%%`!1110`5^+/_!=+_DU7X7_]G&>&
M?_57?%ZOVFK\6?\`@NE_R:K\+_\`LXSPS_ZJ[XO5]MX\ESPU_V,H?^FZA^
M!?2E_P"4>_%C_LE,3_ZD88_E=HHHK^ZC_G<"BBB@#_1(HHHK_-\_ZH`HHHH`
M****`"BBB@`HHHH`****`"BBB@`HHHH`****`"BBB@`HHHH`****`"BBB@`H
MHHH`****`"BBB@`HHHH`****`"BBB@`HHHH`****`"BBB@`HHHH`****`"BB
MB@`HHHH`****`"BBB@`HHHH`****`"BBB@`HHHH`****`"BBB@`HHHH`****
M`"BBB@`HHHH`****`"BBB@`HHHH`****`"BBB@`HHHH`****`"BBB@`HHHH`
M****`"BBB@`HHHH`****`"OQ9_X+I?\`)JOPO_[.,\,_^JN^+U?M-7XL_P#!
M=+_DU7X7_P#9QGAG_P!5=\7J^V\./^2YX:_[&4/_`$W4/P+Z4O\`RCWXL?\`
M9*8G_P!2,,?RNT445_=1_P`[@4444`?Z)%%%%?YOG_5`%%%%`!1110`4444`
M%%%%`!1110`4444`%%%%`!1110`4444`%%%%`!1110`4444`%%%%`!1110`4
M444`%%%%`!1110`4444`%%%%`!1110`4444`%%%%`!1110`4444`%%%%`!11
M10`4444`%%%%`!1110`4444`%%%%`!1110`4444`%%%%`!1110`4444`%%%%
M`!1110`4444`%%%%`!1110`4444`%%%%`!1110`4444`%%%%`!1110`4444`
M%%%%`!1110`5^+/_``72_P"35?A?_P!G&>&?_57?%ZOVFK\6?^"Z7_)JOPO_
M`.SC/#/_`*J[XO5]MX\ESPU_V,H?\`INH?@7TI?^4>_%C_`+)3$_\`J1AC
M^5VBBBO[J/\`G<"BBB@#_1(HHHK_`#?/^J`****`"BBB@`HHHH`****`"BBB
M@`HHHH`****`"BBB@`HHHH`****`"BBB@`HHHH`****`"BBB@`HHHH`****`
M"BBB@`HHHH`****`"BBB@`HHHH`****`"BBB@`HHHH`****`"BBB@`HHHH`*
M***`"BBB@`HHHH`****`"BBB@`HHHH`****`"BBB@`HHHH`****`"BBB@`HH
MHH`****`"BBB@`HHHH`****`"BBB@`HHHH`****`"BBB@`HHHH`****`"BBB
M@`K\6?\`@NE_R:K\+_\`LXSPS_ZJ[XO5^TU?BS_P72_Y-5^%_P#V<9X9_P#5
M7?%ZOMO#C_DN>&O^QE#_`--U#\"^E+_RCWXL?]DIB?\`U(PQ_*[1117]U'_.
MX%%%%`'^B11117^;Y_U0!1110`4444`%%%%`!1110`4444`%%%%`!1110`44
M44`%%%%`!1110`4444`%%%%`!1110`4444`%%%%`!1110`4444`%%%%`!111
M0`4444`%%%%`!1110`4444`%%%%`!1110`4444`%%%%`!1110`4444`%%%%`
M!1110`4444`%%%%`!1110`4444`%%%%`!1110`4444`%%%%`!1110`4444`%
M%%%`!1110`4444`%%%%`!1110`4444`%%%%`!1110`4444`%?BS_`,%TO^35
M?A?_`-G&>&?_`%5WQ>K]IJ_%G_@NE_R:K\+_`/LXSPS_`.JN^+U?;>''_)<\
M-?\`8RA_Z;J'X%]*7_E'OQ8_[)3$_P#J1AC^5VBBBO[J/^=P****`/\`1(HH
MHK_-\_ZH`HHHH`****`"BBB@`HHHH`****`"BBB@`HHHH`****`"BBB@`HHH
MH`****`"BBB@`HHHH`****`"BBB@`HHHH`****`"BBB@`HHHH`****`"BBB@
M`HHHH`****`"BBB@`HHHH`****`"BBB@`HHHH`****`"BBB@`HHHH`****`"
MBBB@`HHHH`****`"BBB@`HHHH`****`"BBB@`HHHH`****`"BBB@`HHHH`**
M**`"BBB@`HHHH`****`"BBB@`HHHH`****`"OQ9_X+I?\FJ_"_\`[.,\,_\`
MJKOB]7[35^+/_!=+_DU7X7_]G&>&?_57?%ZOMO#C_DN>&O\`L90_]-U#\"^E
M+_RCWXL?]DIB?_4C#'\KM%%%?W4?\[@4444`?Z)%%%%?YOG_`%0!1110`444
M4`%%%%`!1110`4444`%%%%`!1110`4444`%%%%`!1110`4444`%%%%`!1110
M`4444`%%%%`!1110`4444`%%%%`!1110`4444`%%%%`!1110`4444`%%%%`!
M1110`4444`%%%%`!1110`4444`%%%%`!1110`4444`%%%%`!1110`4444`%%
M%%`!1110`4444`%%%%`!1110`4444`%%%%`!1110`4444`%%%%`!1110`444
M4`%%%%`!1110`4444`%?BS_P72_Y-5^%_P#V<9X9_P#57?%ZOVFK\6?^"Z7_
M`":K\+_^SC/#/_JKOB]7VWAQ_P`ESPU_V,H?^FZA^!?2E_Y1[\6/^R4Q/_J1
MAC^5VBBBO[J/^=P****`/]$BBBBO\WS_`*H`HHHH`****`"BBB@`HHHH`***
M*`"BBB@`HHHH`****`"BBB@`HHHH`****`"BBB@`HHHH`****`"BBB@`HHHH
M`****`"BBB@`HHHH`****`"BBB@`HHHH`****`"BBB@`HHHH`****`"BBB@`
MHHHH`****`"BBB@`HHHH`****`"BBB@`HHHH`****`"BBB@`HHHH`****`"B
MBB@`HHHH`****`"BBB@`HHHH`****`"BBB@`HHHH`****`"BBB@`HHHH`***
M*`"OQ9_X+I?\FJ_"_P#[.,\,_P#JKOB]7[35^+/_``72_P"35?A?_P!G&>&?
M_57?%ZOMO#C_`)+GAK_L90_]-U#\"^E+_P`H]^+'_9*8G_U(PQ_*[1117]U'
M_.X%%%%`'^B11117^;Y_U0!1110`4444`%%%%`!1110`4444`%%%%`!1110`
M4444`%%%%`!1110`4444`%%%%`!1110`4444`%%%%`!1110`4444`%%%%`!1
M110`4444`%%%%`!1110`4444`%%%%`!1110`4444`%%%%`!1110`4444`%%%
M%`!1110`4444`%%%%`!1110`4444`%%%%`!1110`4444`%%%%`!1110`4444
M`%%%%`!1110`4444`%%%%`!1110`4444`%%%%`!1110`4444`%?BS_P72_Y-
M5^%__9QGAG_U5WQ>K]IJ_%G_`(+I?\FJ_"__`+.,\,_^JN^+U?;>''_)<\-?
M]C*'_INH?@7TI?\`E'OQ8_[)3$_^I&&/Y7:***_NH_YW`HHHH`_T2****_S?
M/^J`****`"BBB@`HHHH`****`"BBB@`HHHH`****`"BBB@`HHHH`****`"BB
MB@`HHHH`****`"BBB@`HHHH`****`"BBB@`HHHH`****`"BBB@`HHHH`****
M`"BBB@`HHHH`****`"BBB@`HHHH`***AN+B"T@FNKJ>&VMK:*2>XN+B1(8((
M(D,DLTTTC+'%%$BL\DCLJ(BEF(`)H2;=DKMZ)+=OL)M13E)I12;;;2225VVW
MHDEJV]$B:BOSH^,7_!5/]C/X.ZG=Z#-\0;[XD>(-/N#;7^E?"C1G\6P6DB\.
MK>*)KG2?!%Q+"X:&YM;+Q1=7MI/')#=6L,B[:^=Q_P`%Q?V7<<_#WXW@]Q_8
M7@PX_P#+XK[#!\`<:8^A#$X;AK-IT:B4J
<19MF.20X@RS.UE.
M99;'#5*F'SG+
&_AS\,+C6[:PU31M(\
M=^*(8-3U6Z\3ZCH=]#JZ>%_#VDW%Q965WITVKZCIKWUO;R_'&N_\%B?^#DWP
MS\`X_P!K/6?^".'P@B^`I\,Q?$6Y@MM?\3WOQ.TSX=3V9U1==U?X;V/Q:NOB
M=I45KI'_`!,M4DOOAM#?:-IT
D>&O"'A6
MSL_#GB#4K_7_`!?XDT.PL=%T+6]>N)$T71]3O[7^>G]K+]E/]L'_`(+'_M`?
M\$?)?`'[)7QK_94_9\_80U#0_B9\7/VAOVG;WX6>!-;\1C5S\`_$J^'?@MX)
M\`_$SXB^/M5O9].^$%Q;66NSV&FZ/_PDVK:6VMW/A_3M$L]5UWB_^".][J7Q
M._X.?O\`@M5\0?BD9KGX@_#[0/BA\./`%OJ<4UPVF?#72/CA\.?!V@7NE-/*
M\6G`^"/!?@F*W>WA66>Q\0:AY$L,%]J$5V`?T?\`[/\`_P`%1_V;_CG^TCXE
M_8TUW2OBM^SO^UUX9\/MXP;]GK]HKP,_@3QCXI\&J)9#XL^'6O:9J7B7X>?$
M?0UMXI;J2?P7XSUJ=;>UU2X2WDMM$UF>P^>M:_X+G_LQ:/\`M0^,/V+XO@%^
MW+X@_:=\#V-_KFM?"'PI^S+K'B3Q.WA2QLX=3B\::