UNITED STATES
SECURITIES AND EXCHANGE COMMISSION
WASHINGTON, DC 20549
FORM 8-K
CURRENT REPORT
PURSUANT TO SECTION 13 OR 15(d) OF THE
SECURITIES EXCHANGE ACT OF 1934
Date of report (Date of earliest event reported) July 26, 2012
SEACOAST BANKING CORPORATION OF FLORIDA |
(Exact Name of Registrant as Specified in Charter) |
Florida | 1-13660 | 59-2260678 | ||
(State or Other Jurisdiction of Incorporation) |
(Commission File Number |
(IRS Employer Identification No.) |
815 Colorado Avenue, Stuart, FL | 34994 | |
(Address of Principal Executive Offices) | (Zip Code) |
Registrant’s telephone number, including area code (772) 287-4000
Check the appropriate box below if the Form 8-K filing is intended to simultaneously satisfy the filing obligation of the registrant under any of the following provisions (see General Instruction A.2.)
¨ | Written communications pursuant to Rule 425 under the Securities Act (17 CFR 230.425) |
¨ | Soliciting material pursuant to Rule 14a-12 under the Exchange Act (17 CFR 240.14a-12) |
¨ | Pre-commencement communications pursuant to Rule 14d-2(b) under the Exchange Act (17 CFR 240.14d-2(b)) |
¨ | Pre-commencement communications pursuant to Rule 13e-4(c) under the Exchange Act (17 CFR 240.13e-4(c)) |
SEACOAST BANKING CORPORATION OF FLORIDA
Item 2.02 | Results of Operations and Financial Condition |
On July 26, 2012, the Seacoast Banking Corporation of Florida (“Seacoast” or the “Company”) announced its financial results for the second quarter ended June 30, 2012.
A copy of the press release announcing Seacoast’s results for the second quarter ended June 30, 2012 is attached hereto as Exhibit 99.1 and incorporated herein by reference.
Item 7.01 | Regulation FD Disclosure |
On July 27, 2012, Seacoast held an investor conference call to discuss its financial results for the second quarter ended June 30, 2012. A transcript of this conference call is attached hereto as Exhibit 99.2 and incorporated herein by reference. Also attached as Exhibit 99.3 are charts (available on the Company’s website at www.seacoastbanking.net) containing information used in the conference call and incorporated herein by reference. All information included in the transcript and the charts is presented as of June 30, 2012, and the Company does not assume any obligation to correct or update said information in the future.
The information in Items 2.02 and 7.01, as well as Exhibits 99.1, 99.2 and 99.3, is being furnished and shall not be deemed “filed” for purposes of Section 18 of the Securities Exchange Act of 1934, nor shall it be deemed incorporated by reference in any filing under the Securities Act of 1933.
page 2 of 5 |
Item 9.01 | Financial Statements and Exhibits |
(d) Exhibits
Exhibit No. |
Description | |
99.1 |
Press Release dated July 26, 2012 with respect to Seacoast’s financial results for the second quarter ended June 30, 2012
| |
99.2 |
Transcript of Seacoast’s investor conference call held on July 27, 2012 to discuss the Company’s financial results for the second quarter ended June 30, 2012
| |
99.3 | Data on website containing information used in the conference call held on July 27, 2012 |
Exhibits 99.1, 99.2 and 99.3 referenced herein contain “forward-looking statements” within the meaning of Section 27A of the Securities Act of 1933 and Section 21E of the Securities Exchange Act of 1934, including, without limitation, statements about future financial and operating results, ability to realized deferred tax assets, cost savings, enhanced revenues, economic and seasonal conditions in our markets, and improvements to reported earnings that may be realized from cost controls and for integration of banks that we have acquired, as well as statements with respect to Seacoast’s objectives, expectations and intentions and other statements that are not historical facts. Actual results may differ from those set forth in the forward-looking statements.
Forward-looking statements include statements with respect to our beliefs, plans, objectives, goals, expectations, anticipations, estimates and intentions, and involve known and unknown risks, uncertainties and other factors, which may be beyond our control, and which may cause the actual results, performance or achievements of Seacoast to be materially different from future results, performance or achievements expressed or implied by such forward-looking statements. You should not expect us to update any forward-looking statements.
page 3 of 5 |
You can identify these forward-looking statements through our use of words such as “may,” “will,” “anticipate,” “assume,” “should,” “support”, “indicate,” “would,” “believe,” “contemplate,” “expect,” “estimate,” “continue,” “further”, “point to,” “project,” “could,” “intend” or other similar words and expressions of the future. These forward-looking statements may not be realized due to a variety of factors, including, without limitation: the effects of future economic and market conditions, including seasonality; governmental monetary and fiscal policies, as well as legislative, tax and regulatory changes; changes in accounting policies, rules and practices; the risks of changes in interest rates on the level and composition of deposits, loan demand, liquidity and the values of loan collateral, securities, and interest sensitive assets and liabilities; interest rate risks, sensitivities and the shape of the yield curve; the effects of competition from other commercial banks, thrifts, mortgage banking firms, consumer finance companies, credit unions, securities brokerage firms, insurance companies, money market and other mutual funds and other financial institutions operating in our market areas and elsewhere, including institutions operating regionally, nationally and internationally, together with such competitors offering banking products and services by mail, telephone, computer and the Internet; and the failure of assumptions underlying the establishment of reserves for possible loan losses. The risks of mergers and acquisitions, include, without limitation: unexpected transaction costs, including the costs of integrating operations; the risks that the businesses will not be integrated successfully or that such integration may be more difficult, time-consuming or costly than expected; the potential failure to fully or timely realize expected revenues and revenue synergies, including as the result of revenues following the merger being lower than expected; the risk of deposit and customer attrition; any changes in deposit mix; unexpected operating and other costs, which may differ or change from expectations; the risks of customer and employee loss and business disruption, including, without limitation, as the result of difficulties in maintaining relationships with employees; increased competitive pressures and solicitations of customers by competitors; as well as the difficulties and risks inherent with entering new markets.
All written or oral forward-looking statements attributable to us are expressly qualified in their entirety by this cautionary notice, including, without limitation, those risks and uncertainties described in our annual report on Form 10-K/A for the year ended December 31, 2011 under “Special Cautionary Notice Regarding Forward-Looking Statements” and “Risk Factors”, and otherwise in our SEC reports and filings. Such reports are available upon request from the Company, or from the Securities and Exchange Commission, including through the SEC’s Internet website at http://www.sec.gov.
page 4 of 5 |
SIGNATURES
Pursuant to the requirements of the Securities Exchange Act of 1934, the registrant has duly caused this report to be signed on its behalf by the undersigned hereunto duly authorized.
SEACOAST BANKING CORPORATION OF FLORIDA | ||
(Registrant) | ||
Date: July 31, 2012 | By: | /s/ William R. Hahl |
William R. Hahl | ||
Executive Vice President and Chief Financial Officer |
page 5 of 5 |
EXHIBIT 99.1
To Form 8-K dated July 26, 2012
NEWS RELEASE
SEACOAST BANKING CORPORATION OF FLORIDA
Dennis S. Hudson, III
Chairman and Chief Executive Officer
Seacoast Banking Corporation of Florida
(772) 288-6085
William R. Hahl
Executive Vice President/
Chief Financial Officer
(772) 221-2825
SEACOAST REPORTS SECOND QUARTER RESULTS
Highlights compared to a year ago
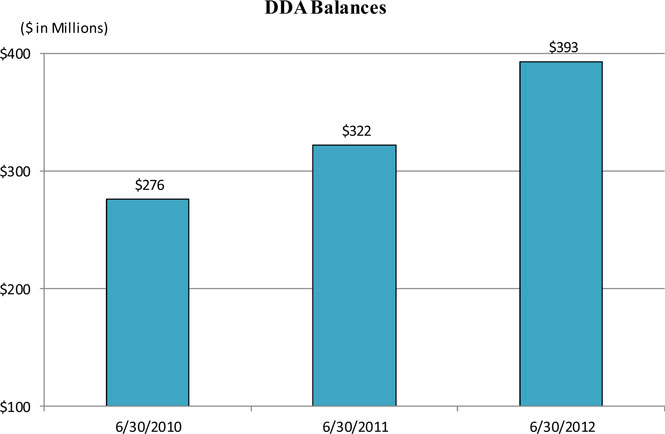
· Demand deposit balances increased 22.3%
· Noninterest income (excluding securities gains) grew 14.8%
· Other real estate owned declined by 72%
· Nonperforming assets decline to 2.64% of assets
· Risk-based capital ratio of 18.4%
STUART, FL., July 26, 2012 – Seacoast Banking Corporation of Florida (NASDAQ-NMS: SBCF) (the “Company”) today reported a net loss for the quarter ended June 30, 2012 of $2.335 million compared with net income of $1.113 million one year earlier. The net loss for the first six months of 2012 was $1.397 million compared with net income of $1.471 million in the first six months of 2011. Including preferred stock dividends and accretion of $937,000, the net loss applicable to common shareholders was $3.272 million or $0.03 per average common diluted share for the second quarter 2012, compared to net income of $176,000 or $0.00 per average common diluted share for the second quarter of 2011.
- continued -
New household acquisition was strong again during the second quarter 2012. New personal retail checking relationships opened during the quarter rose 23.7 percent compared to the same quarter in 2011. Likewise, new commercial business checking deposit relationships opened increased by 65.5 percent compared with the same quarter one year ago. Along with the new relationships, our programs have improved market share, increased average services per household and improved customer retention.
We were pleased to complete all of the previously announced sales related to a substantial portion of foreclosed properties during the quarter. In addition, market conditions permitted us to negotiate and close additional foreclosed property sales during the quarter. As a result, other real estate owned fell by 54% during the quarter and 72% compared with one year earlier to $7.2 million at June 30, 2012. This represents the lowest level of other real estate owned since 2008. Nonperforming assets (loans on nonaccrual and other real estate owned) to total assets fell to 2.64% compared with 3.46% one year earlier.
During the quarter we also continued to review our remaining problem loan assets and took substantial write downs and added additional specific reserves for certain loan assets which we determined late in the quarter could potentially be liquidated over the balance of this year. As a result, the provision for loan losses was $6,455,000 for the quarter compared with $902,000 one year earlier. Nonperforming loans in the second quarter totaled 3.97 percent of loans outstanding nearly unchanged from 3.88 percent at June 30, 2011.
- continued -
The decision to further accelerate our problem loan liquidation activities was part of a larger project initiated during the quarter to improve earnings in the near term. We are currently evaluating a combination of additional actions we intend to take, including office consolidations, revenue enhancements, acceleration of growth initiatives and a variety of cost-saving opportunities.
“Our growth initiatives have proven to be effective as demonstrated by strong performance during the quarter and over the last year in household build, core deposit growth and revenue improvements. We are pleased with the steady improvement in asset quality, and we intend to make further improvements at a faster pace which will also help us achieve expense savings. While we are pleased with having produced four consecutive quarters of profitability prior to this quarter, we are taking action to restore higher levels of profitability while also recognizing the need to continue to support our growth initiatives,” said Dennis S. Hudson, III, Chairman and Chief Executive Officer. In addition, our franchise picks up value as total customer funding (total deposits and repurchase agreements, excluding certificates of deposits) increases. Customer funding was up $200 million or 15.9 percent compared to June 30, 2011 and totaled $1.456 billion at June 30, 2012.”
- continued -
2012 | 2011 | |||||||||||
(Dollars in thousands) | Second Quarter | Second Quarter | Change | |||||||||
Customer Relationship Funding (Period End) | ||||||||||||
Demand deposits (noninterest bearing) | $ | 393,681 | $ | 321,876 | 22.3 | % | ||||||
NOW | 420,449 | 385,640 | 9.0 | |||||||||
Savings deposits | 156,019 | 125,221 | 24.6 | |||||||||
Money market accounts | 346,191 | 320,510 | 8.0 | |||||||||
Time certificates of deposit | 373,244 | 528,214 | (29.3 | ) | ||||||||
Total Deposits | 1,689,584 | 1,681,461 | 0.5 | |||||||||
Sweep repurchase agreements | 139,489 | 102,827 | 35.7 | |||||||||
Total core customer funding (1) | 1,455,829 | 1,256,074 | 15.9 |
(1) Total deposits and sweep repurchase agreements, excluding certificates of deposits.
The Company’s retail and business core deposit focus has produced strong growth in valuable deposit customer relationships and has resulted in increased balances and improved deposit mix. Small business and commercial relationship growth initiatives are also starting to produce improved loan growth. The improved deposit mix and lower rates paid on interest bearing deposits during the second quarter reduced the overall cost of total deposits to 0.37 percent, 9 basis points lower than in the first quarter 2012 and 33 basis points lower than the second quarter 2011.
Additional highlights include:
· | Mortgage banking revenue in the second quarter 2012 was up $279,000 or 44.8 percent compared to first quarter 2012, and up $393,000 or 77.2 percent over the prior year due to higher volume and spreads; |
- continued -
· | Interchange income totaled $1,154,000 for the quarter, an increase of $83,000 or 7.7 percent compared to first quarter 2012 and up $159,000 or 16.0 percent over the prior year; |
· | Total noninterest bearing deposits at June 30, 2012 comprised 23.3 percent of total deposits, up from 19.1 percent a year ago; |
· | Checking account household growth was 7.1 percent annualized for the first half of 2012 compared to 3.5 percent annualized for the same period in 2011; |
· | Regulatory capital ratios remained strong with the total risk based capital ratio of 18.4 percent (estimated) at June 30, 2012, compared with 18.6 percent in the prior quarter; and |
· | Wealth management fees were up $55,000 or 6.8 percent linked quarter. |
Over the last two years, the Company has experienced strong growth in core deposit customer relationships since implementing its growth strategy. A total of 10,635 new households started banking with Seacoast over the past 12 months, up 19.7 percent over the same period one year earlier. These new households have opened 10,382 new checking accounts, an increase of 21.9 percent over the number of new accounts opened during the prior twelve months. These new relationships have also increased services and average balances per household.
These results reflect our relationship-based growth strategy which will continue to strengthen our valuable customer franchise in the state of Florida. This strategy will continue to serve us well in the current environment and was designed to position the franchise for added earnings growth in a more typical yield curve environment and as excess liquidity is deployed into higher rate earning assets.
- continued -
Average total deposits for the second quarter ended June 30, 2012 totaled $1.7 billion, up slightly compared to June 30, 2011 and first quarter 2012. Compared to the prior year, the mix of deposits continued to improve with run-off of customers with single-service certificates of deposits offset by increases in lower cost and no cost deposits. The mix of deposits improved with low cost interest bearing NOW and savings deposits increasing $11.4 million or 5.1 percent annualized, and average demand deposits increasing $32.7 million or 37.0 percent annualized compared to the first quarter 2012. Average demand deposits increased $57.2 million or 17.3 percent compared with second quarter a year ago. The average cost of interest bearing core deposits (NOW, savings and MMDA) during the second quarter was 0.18 percent, down 13 basis points from the second quarter of 2011. Interest rates paid on certificate of deposit rates were also lower compared to the second quarter last year and totaled 1.12 percent during the second quarter 2012, a decline of 62 basis points. The average cost of total interest bearing liabilities was 0.59 percent, down 9 basis points compared to the first quarter 2012 and 36 basis points lower than the second quarter of 2011.
- continued -
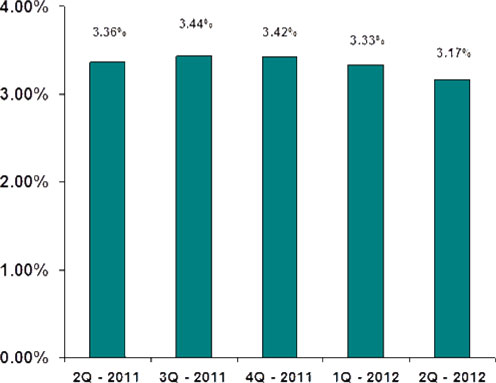
Net interest income for the quarter totaled $16.0 million, down $534,000 compared to the prior year. The decline in net interest income this quarter was a result of lower yields due to Federal Reserve policy to lower interest rates, partially offset by lower deposit costs and lower rates paid on interest bearing liabilities. The net interest margin for the second quarter totaled 3.17 percent, down 16 basis points compared to the first quarter of 2012 and down 19 basis points compared to the second quarter 2011. In the first and second quarters of 2012, a portion of the investment portfolio was sold to manage interest rate risk and price risk. This also reduced net interest income compared to prior periods. Over the past 12 months, the net interest margin was aided by much lower nonperforming assets and lower costs for interest bearing liabilities, offset by lower asset yields caused by Federal Reserve actions to stimulate economic growth. In addition the net interest margin continues to be negatively impacted by higher levels of overnight liquidity and short-term investments. Interest bearing deposit costs decreased 11 basis points to 0.47 percent during the second quarter 2012, and the total cost of interest bearing liabilities decreased from 0.95 percent for the second quarter 2011 to 0.59 percent in the second quarter 2012. The mix in deposits continues to improve, which strengthens the net interest margin, and is a result of our tactical activities designed to attract, onboard and retain new personal and business relationships. Noninterest bearing demand deposits increased to 23.3 percent of total deposits from 19.1 percent a year ago, and total transaction accounts and customer sweep repurchase accounts now account for more than two-thirds of total customer relationship funding.
Loan growth has improved over the last twelve months with total loans outstanding increasing year-over-year by $32.4 million or 2.7 percent. Loan growth improved due to new loan production, excluding loans originated for sale, which totaled $243.5 million, which was offset by nonperforming loan resolutions and increased principal prepayments. Loan production over the last year has consisted primarily of commercial loans with average balances of approximately $350,600 comprised of owner occupied real estate loans amortizing adjustable rate prime residential loans with initial interest rates fixed for 3, 5 and 7-year terms, and consumer installment loans as follows:
- continued -
Residential loans | $ | 138,600,000 | ||
Commercial loans | 68,000,000 | |||
Consumer loans | 36,900,000 | |||
$ | 243,500,000 |
The Company recorded a provision for loan losses in the second quarter 2012 of $6.5 million compared to $0.9 million for the second quarter of 2011. The allowance for loan losses as a percentage of loans was 2.02 percent at June 30, 2012, compared to 2.01 percent for the first quarter this year and 2.63 percent at June 30, 2011. The higher provision for loan losses resulted from our decision to accelerate plans to liquidate underperforming loans more quickly than originally planned. Current quarter net loan charge-offs totaled $6.3 million compared to $4.0 million for the second quarter 2011 and $3.4 million for the first quarter 2012.
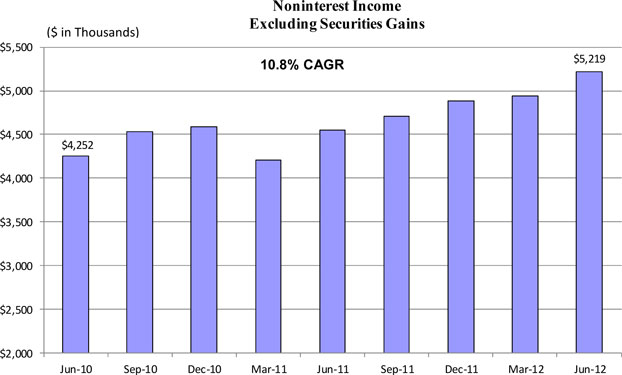
Second quarter 2012 noninterest income, excluding securities gains, was up $282,000 or 5.7% compared to the first quarter and was up $672,000 or 14.8% compared to the second quarter of 2011. Mortgage banking fees increased by $279,000 compared to the first quarter of 2012 with revenues of $902,000, and were $393,000 higher than the second quarter 2011. Aggregate service charges on deposits and interchange income were up when compared to the first quarter 2012 and last year’s second quarter as a result of the increases in new business and retail households. Combined, these deposit account-related revenues totaled $2.6 million in the second quarter, up $100,000 or 3.9 percent compared with second quarter 2011.
- continued -
(Dollars in thousands) | Q-2 2012 | Q-1 2012 | Q-4 2011 | Q-3 2011 | Q-2 2011 | |||||||||||||||
Noninterest Income: | ||||||||||||||||||||
Service charges on deposit accounts | $ | 1,487 | $ | 1,461 | $ | 1,599 | $ | 1,675 | $ | 1,546 | ||||||||||
Trust income | 564 | 573 | 530 | 541 | 517 | |||||||||||||||
Mortgage banking fees | 902 | 623 | 680 | 556 | 509 | |||||||||||||||
Brokerage commissions and fees | 298 | 234 | 258 | 321 | 223 | |||||||||||||||
Marine finance fees | 244 | 330 | 333 | 229 | 349 | |||||||||||||||
Interchange income | 1,154 | 1,071 | 953 | 969 | 995 | |||||||||||||||
Other deposit based EFT fees | 84 | 99 | 78 | 71 | 79 | |||||||||||||||
Other | 486 | 546 | 452 | 344 | 329 | |||||||||||||||
5,219 | 4,937 | 4,883 | 4,706 | 4,547 | ||||||||||||||||
Securities gains | 3,615 | 3,374 | 1,083 | 137 | 0 | |||||||||||||||
Total | $ | 8,834 | $ | 8,311 | $ | 5,966 | $ | 4,843 | $ | 4,547 |
The Company’s residential lending group has produced solid, quality mortgage loan growth in 2012. A total of 409 applications were accepted in the second quarter 2012 for total loans of $95.2 million, and 784 applications were taken in the first six months for $186.1 million. A total of $26 million in residential mortgage loans were sold in the second quarter of 2012. Over the first six months of 2012, a total of $47 million in residential mortgage loans were sold, and $67 million were added to the portfolio.
Core operating expenses were nearly unchanged for the quarter, but were up by $2.1 million over the prior year, related mainly to the overall growth initiatives.
- continued -
(Dollars in thousands) | Q-2 2012 | Q-1 2012 | Q-4 2011 | Q-3 2011 | Q-2 2011 | |||||||||||||||
Noninterest Expense: | ||||||||||||||||||||
Salaries and wages | $ | 7,435 | $ | 7,055 | $ | 7,301 | $ | 6,902 | $ | 6,534 | ||||||||||
Employee benefits | 1,916 | 2,010 | 1,447 | 1,391 | 1,437 | |||||||||||||||
Outsourced data processing costs | 1,834 | 1,721 | 1,677 | 1,685 | 1,699 | |||||||||||||||
Telephone / data lines | 297 | 289 | 285 | 286 | 319 | |||||||||||||||
Occupancy expense | 1,943 | 1,882 | 1,795 | 1,967 | 1,919 | |||||||||||||||
Furniture and equipment expense | 607 | 495 | 525 | 555 | 618 | |||||||||||||||
Marketing expense | 677 | 926 | 947 | 551 | 667 | |||||||||||||||
Legal and professional fees | 1,637 | 1,776 | 1,299 | 1,496 | 1,585 | |||||||||||||||
FDIC assessments | 707 | 706 | 679 | 687 | 688 | |||||||||||||||
Amortization of intangibles | 196 | 201 | 212 | 211 | 212 | |||||||||||||||
Other | 2,314 | 2,163 | 2,264 | 1,947 | 1,812 | |||||||||||||||
Total Core Operating Expense | 19,563 | 19,224 | 18,431 | 17,678 | 17,490 | |||||||||||||||
Net loss on OREO | 790 | 1,959 | 1,254 | 906 | 441 | |||||||||||||||
Asset dispositions expense | 368 | 527 | 275 | 479 | 1,142 | |||||||||||||||
Total | $ | 20,721 | $ | 21,710 | $ | 19,960 | $ | 19,063 | $ | 19,073 |
Total noninterest expenses were up $1.6 million in the second quarter of 2012 compared to a year ago. Salaries wages and benefit expenses were higher by $1.4 million as a result of adding lending production personnel and increased incentive payments due to higher revenues generated from wealth management and residential lending production. Costs associated with outsourced data processing services were also higher as a result of the increased account levels associated with household growth. Total expenses remain elevated due to the continued costs associated with the management and disposal of nonperforming assets.
- continued -
The Company will host a conference call on Friday, July 27, 2012 at 9:00 a.m. (Eastern Time) to discuss its earnings results and business trends. Investors may call in (toll-free) by dialing (888) 517-2458 (access code: 7659998; leader: Dennis S. Hudson). Charts will be used during the conference call and may be accessed at the Company’s website at www.seacoastbanking.net by selecting Presentations under the heading Investor Services. A replay of the conference call will be available beginning the afternoon of July 27 by dialing (888) 843-7419 (domestic), using the passcode 7659998.
Alternatively, individuals may listen to the live webcast of the presentation by visiting the Company’s website at www.seacoastbanking.net. The link to the live audio webcast is located in the subsection Presentations under the heading Investor Relations. Beginning the afternoon of July 27, 2012, an archived version of the webcast can be accessed from this same subsection of the website. This webcast will be archived and available for one year.
Seacoast Banking Corporation of Florida has approximately $2.1 billion in assets. It is one of the largest independent commercial banking organizations in Florida, headquartered on Florida’s Treasure Coast, one of the wealthiest and fastest growing areas in the nation.
Cautionary Notice Regarding Forward-Looking Statements
This press release contains “forward-looking statements” within the meaning of Section 27A of the Securities Act of 1933 and Section 21E of the Securities Exchange Act of 1934, including, without limitation, statements about future financial and operating results, ability to realized deferred tax assets, cost savings, enhanced revenues, economic and seasonal conditions in our markets, and improvements to reported earnings that may be realized from cost controls and for integration of banks that we have acquired, as well as statements with respect to Seacoast’s objectives, expectations and intentions and other statements that are not historical facts. Actual results may differ from those set forth in the forward-looking statements.
- continued -
Forward-looking statements include statements with respect to our beliefs, plans, objectives, goals, expectations, anticipations, estimates and intentions, and involve known and unknown risks, uncertainties and other factors, which may be beyond our control, and which may cause the actual results, performance or achievements of Seacoast to be materially different from future results, performance or achievements expressed or implied by such forward-looking statements. You should not expect us to update any forward-looking statements.
You can identify these forward-looking statements through our use of words such as “may,” “will,” “anticipate,” “assume,” “should,” “support”, “indicate,” “would,” “believe,” “contemplate,” “expect,” “estimate,” “continue,” “further”, “point to,” “project,” “could,” “intend” or other similar words and expressions of the future. These forward-looking statements may not be realized due to a variety of factors, including, without limitation: the effects of future economic and market conditions, including seasonality; governmental monetary and fiscal policies, as well as legislative, tax and regulatory changes; changes in accounting policies, rules and practices; the risks of changes in interest rates on the level and composition of deposits, loan demand, liquidity and the values of loan collateral, securities, and interest sensitive assets and liabilities; interest rate risks, sensitivities and the shape of the yield curve; the effects of competition from other commercial banks, thrifts, mortgage banking firms, consumer finance companies, credit unions, securities brokerage firms, insurance companies, money market and other mutual funds and other financial institutions operating in our market areas and elsewhere, including institutions operating regionally, nationally and internationally, together with such competitors offering banking products and services by mail, telephone, computer and the Internet; and the failure of assumptions underlying the establishment of reserves for possible loan losses. The risks of mergers and acquisitions, include, without limitation: unexpected transaction costs, including the costs of integrating operations; the risks that the businesses will not be integrated successfully or that such integration may be more difficult, time-consuming or costly than expected; the potential failure to fully or timely realize expected revenues and revenue synergies, including as the result of revenues following the merger being lower than expected; the risk of deposit and customer attrition; any changes in deposit mix; unexpected operating and other costs, which may differ or change from expectations; the risks of customer and employee loss and business disruption, including, without limitation, as the result of difficulties in maintaining relationships with employees; increased competitive pressures and solicitations of customers by competitors; as well as the difficulties and risks inherent with entering new markets.
All written or oral forward-looking statements attributable to us are expressly qualified in their entirety by this cautionary notice, including, without limitation, those risks and uncertainties described in our annual report on Form 10-K for the year ended December 31, 2011 under “Special Cautionary Notice Regarding Forward-Looking Statements” and “Risk Factors”, and otherwise in our SEC reports and filings. Such reports are available upon request from the Company, or from the Securities and Exchange Commission, including through the SEC’s Internet website at http://www.sec.gov.
- continued -
FINANCIAL HIGHLIGHTS (Unaudited) |
SEACOAST BANKING CORPORATION OF FLORIDA AND SUBSIDIARIES |
Three Months Ended | Six Months Ended | |||||||||||||||
(Dollars in thousands, | June 30, | June 30, | ||||||||||||||
except share data) | 2012 | 2011 | 2012 | 2011 | ||||||||||||
Summary of Earnings | ||||||||||||||||
Net income (loss) | $ | (2,335 | ) | $ | 1,113 | $ | (1,397 | ) | $ | 1,471 | ||||||
Net income (loss) available to common shareholders | (3,272 | ) | 176 | (3,271 | ) | (403 | ) | |||||||||
Net interest income (1) | 16,052 | 16,596 | 32,741 | 33,114 | ||||||||||||
Performance Ratios | ||||||||||||||||
Return on average assets-GAAP basis (2), (3) | (0.44 | )% | 0.21 | % | (0.13 | )% | 0.14 | % | ||||||||
Return on average tangible assets (2), (3), (4) | (0.42 | ) | 0.24 | (0.11 | ) | 0.17 | ||||||||||
Return on average shareholders' equity-GAAP basis (2), (3) | (5.56 | ) | 2.68 | (1.68 | ) | 1.79 | ||||||||||
Net interest margin (1), (2) | 3.17 | 3.36 | 3.25 | 3.42 | ||||||||||||
Per Share Data | ||||||||||||||||
Net income (loss) diluted-GAAP basis | $ | (0.03 | ) | $ | 0.00 | $ | (0.03 | ) | $ | 0.00 | ||||||
Net income (loss) basic-GAAP basis | (0.03 | ) | 0.00 | (0.03 | ) | 0.00 | ||||||||||
Cash dividends declared | 0.00 | 0.00 | 0.00 | 0.00 |
June 30, | Increase/ | |||||||||||
2012 | 2011 | (Decrease) | ||||||||||
Credit Analysis | ||||||||||||
Net charge-offs year-to-date | $ | 9,690 | $ | 8,055 | 20.3 | % | ||||||
Net charge-offs to average loans | 1.59 | % | 1.32 | % | 20.5 | |||||||
Loan loss provision year-to-date | $ | 8,760 | $ | 1,542 | 468.1 | |||||||
Allowance to loans at end of period | 2.02 | % | 2.63 | % | (23.2 | ) | ||||||
Nonperforming loans | $ | 48,482 | $ | 46,165 | 5.0 | |||||||
Other real estate owned | 7,219 | 25,877 | (72.1 | ) | ||||||||
Total non-performing assets | $ | 55,701 | $ | 72,042 | (22.7 | ) | ||||||
Restructured loans (accruing) | $ | 54,842 | $ | 60,238 | (9.0 | ) | ||||||
Nonperforming assets to loans and other real estate owned at end of period | 4.53 | % | 5.93 | % | (23.6 | ) | ||||||
Nonperforming assets to total assets | 2.64 | % | 3.46 | % | (23.7 | ) | ||||||
Selected Financial Data | ||||||||||||
Total assets | $ | 2,106,514 | $ | 2,082,863 | 1.1 | |||||||
Securities available for sale (at fair value) | 562,691 | 611,231 | (7.9 | ) | ||||||||
Securities held for investment (at amortized cost) | 17,122 | 25,159 | (31.9 | ) | ||||||||
Net loans | 1,196,719 | 1,157,714 | 3.4 | |||||||||
Deposits | 1,689,584 | 1,681,461 | 0.5 | |||||||||
Total shareholders' equity | 165,453 | 171,148 | (3.3 | ) | ||||||||
Common shareholders' equity | 117,332 | 124,276 | (5.6 | ) | ||||||||
Book value per share common | 1.24 | 1.33 | (6.8 | ) | ||||||||
Tangible book value per share | 1.73 | 1.80 | (3.9 | ) | ||||||||
Tangible common book value per share (5) | 1.22 | 1.30 | (6.2 | ) | ||||||||
Average shareholders' equity to average assets | 7.87 | % | 8.06 | % | (2.4 | ) | ||||||
Tangible common equity to tangible assets (5), (6) | 5.49 | 5.84 | (6.0 | ) | ||||||||
Average Balances (Year-to-Date) | ||||||||||||
Total assets | $ | 2,129,949 | $ | 2,057,099 | 3.5 | |||||||
Less: intangible assets | 2,086 | 2,921 | (28.6 | ) | ||||||||
Total average tangible assets | $ | 2,127,863 | $ | 2,054,178 | 3.6 | |||||||
Total equity | $ | 167,665 | $ | 165,748 | 1.2 | |||||||
Less: intangible assets | 2,086 | 2,921 | (28.6 | ) | ||||||||
Total average tangible equity | $ | 165,579 | $ | 162,827 | 1.7 |
(1) | Calculated on a fully taxable equivalent basis using amortized cost. |
(2) | These ratios are stated on an annualized basis and are not necessarily indicative of future periods. |
(3) | The calculation of ROA and ROE do not include the mark-to-market unrealized gains (losses) because the unrealized gains (losses) are not included in net income (loss). |
(4) | The Company believes that return on average assets and equity excluding the impacts of noncash amortization expense on intangible assets is a better measurement of the Company's trend in earnings growth. |
(5) | The Company defines tangible common equity as total shareholders equity less preferred stock and intangible assets. |
(6) | The ratio of tangible common equity to tangible assets is a non-GAAP ratio used by the investment community to measure capital adequacy. |
CONDENSED CONSOLIDATED STATEMENTS OF INCOME (Unaudited) |
SEACOAST BANKING CORPORATION OF FLORIDA AND SUBSIDIARIES |
Three Months Ended | Six Months Ended | |||||||||||||||
June 30, | June 30, | |||||||||||||||
(Dollars in thousands, except per share data) | 2012 | 2011 | 2012 | 2011 | ||||||||||||
Interest on securities: | ||||||||||||||||
Taxable | $ | 3,309 | $ | 4,575 | $ | 7,644 | $ | 8,251 | ||||||||
Nontaxable | 23 | 38 | 47 | 85 | ||||||||||||
Interest and fees on loans | 14,707 | 15,476 | 29,481 | 31,689 | ||||||||||||
Interest on federal funds sold and other investments | 267 | 198 | 484 | 431 | ||||||||||||
Total Interest Income | 18,306 | 20,287 | 37,656 | 40,456 | ||||||||||||
Interest on deposits | 418 | 643 | 867 | 1,235 | ||||||||||||
Interest on time certificates | 1,133 | 2,307 | 2,633 | 4,655 | ||||||||||||
Interest on borrowed money | 748 | 796 | 1,507 | 1,569 | ||||||||||||
Total Interest Expense | 2,299 | 3,746 | 5,007 | 7,459 | ||||||||||||
Net Interest Income | 16,007 | 16,541 | 32,649 | 32,997 | ||||||||||||
Provision for loan losses | 6,455 | 902 | 8,760 | 1,542 | ||||||||||||
Net Interest Income After Provision for Loan Losses | 9,552 | 15,639 | 23,889 | 31,455 | ||||||||||||
Noninterest income: | ||||||||||||||||
Service charges on deposit accounts | 1,487 | 1,546 | 2,948 | 2,988 | ||||||||||||
Trust income | 564 | 517 | 1,137 | 1,040 | ||||||||||||
Mortgage banking fees | 902 | 509 | 1,525 | 904 | ||||||||||||
Brokerage commissions and fees | 298 | 223 | 532 | 543 | ||||||||||||
Marine finance fees | 244 | 349 | 574 | 647 | ||||||||||||
Interchange income | 1,154 | 995 | 2,225 | 1,886 | ||||||||||||
Other deposit based EFT fees | 84 | 79 | 183 | 169 | ||||||||||||
Other | 486 | 329 | 1,032 | 579 | ||||||||||||
5,219 | 4,547 | 10,156 | 8,756 | |||||||||||||
Securities gains, net | 3,615 | 0 | 6,989 | 0 | ||||||||||||
Total Noninterest Income | 8,834 | 4,547 | 17,145 | 8,756 | ||||||||||||
Noninterest expenses: | ||||||||||||||||
Salaries and wages | 7,435 | 6,534 | 14,490 | 13,085 | ||||||||||||
Employee benefits | 1,916 | 1,437 | 3,926 | 3,037 | ||||||||||||
Outsourced data processing costs | 1,834 | 1,699 | 3,555 | 3,221 | ||||||||||||
Telephone / data lines | 297 | 319 | 586 | 608 | ||||||||||||
Occupancy | 1,943 | 1,919 | 3,825 | 3,865 | ||||||||||||
Furniture and equipment | 607 | 618 | 1,102 | 1,211 | ||||||||||||
Marketing | 677 | 667 | 1,603 | 1,419 | ||||||||||||
Legal and professional fees | 1,637 | 1,585 | 3,413 | 3,342 | ||||||||||||
FDIC assessments | 707 | 688 | 1,413 | 1,647 | ||||||||||||
Amortization of intangibles | 196 | 212 | 397 | 424 | ||||||||||||
Asset dispositions expense | 368 | 441 | 895 | 1,527 | ||||||||||||
Net loss on other real estate owned and repossessed assets | 790 | 1,142 | 2,749 | 1,591 | ||||||||||||
Other | 2,314 | 1,812 | 4,477 | 3,763 | ||||||||||||
Total Noninterest Expenses | 20,721 | 19,073 | 42,431 | 38,740 | ||||||||||||
Income (Loss) Before Income Taxes | (2,335 | ) | 1,113 | (1,397 | ) | 1,471 | ||||||||||
Provision for income taxes | 0 | 0 | 0 | 0 | ||||||||||||
Net Income (Loss) | (2,335 | ) | 1,113 | (1,397 | ) | 1,471 | ||||||||||
Preferred stock dividends and accretion on preferred stock discount | 937 | 937 | 1,874 | 1,874 | ||||||||||||
Net Income (Loss) Available to Common Shareholders | $ | (3,272 | ) | $ | 176 | $ | (3,271 | ) | $ | (403 | ) | |||||
Per share of common stock: | ||||||||||||||||
Net income (loss) diluted | $ | (0.03 | ) | $ | 0.00 | $ | (0.03 | ) | $ | 0.00 | ||||||
Net income (loss) basic | (0.03 | ) | 0.00 | (0.03 | ) | 0.00 | ||||||||||
Cash dividends declared | 0.00 | 0.00 | 0.00 | 0.00 | ||||||||||||
Average diluted shares outstanding | 94,452,317 | 93,492,169 | 94,423,611 | 93,475,523 | ||||||||||||
Average basic shares outstanding | 93,667,231 | 93,492,169 | 93,642,680 | 93,475,523 |
CONDENSED CONSOLIDATED BALANCE SHEETS (Unaudited) |
SEACOAST BANKING CORPORATION OF FLORIDA AND SUBSIDIARIES |
June 30, | December 31, | June 30, | ||||||||||
(Dollars in thousands, except share data) | 2012 | 2011 | 2011 | |||||||||
Assets | ||||||||||||
Cash and due from banks | $ | 29,333 | $ | 41,136 | $ | 28,782 | ||||||
Interest bearing deposits with other banks | 190,302 | 125,945 | 138,109 | |||||||||
Total Cash and Cash Equivalents | 219,635 | 167,081 | 166,891 | |||||||||
Securities: | ||||||||||||
Available for sale (at fair value) | 562,691 | 648,362 | 611,231 | |||||||||
Held for investment (at amortized cost) | 17,122 | 19,977 | 25,159 | |||||||||
Total Securities | 579,813 | 668,339 | 636,390 | |||||||||
Loans available for sale | 11,186 | 6,795 | 4,758 | |||||||||
Loans, net of deferred costs | 1,221,354 | 1,208,074 | 1,188,945 | |||||||||
Less: Allowance for loan losses | (24,635 | ) | (25,565 | ) | (31,231 | ) | ||||||
Net Loans | 1,196,719 | 1,182,509 | 1,157,714 | |||||||||
Bank premises and equipment, net | 35,044 | 34,227 | 34,892 | |||||||||
Other real estate owned | 7,219 | 20,946 | 25,877 | |||||||||
Other intangible assets | 1,892 | 2,289 | 2,713 | |||||||||
Other assets | 55,006 | 55,189 | 53,628 | |||||||||
$ | 2,106,514 | $ | 2,137,375 | $ | 2,082,863 | |||||||
Liabilities and Shareholders' Equity | ||||||||||||
Liabilities | ||||||||||||
Deposits | ||||||||||||
Demand deposits (noninterest bearing) | $ | 393,681 | $ | 328,356 | $ | 321,876 | ||||||
NOW | 420,449 | 469,631 | 385,640 | |||||||||
Savings deposits | 156,019 | 133,578 | 125,221 | |||||||||
Money market accounts | 346,191 | 319,152 | 320,510 | |||||||||
Other time certificates | 207,062 | 244,886 | 274,565 | |||||||||
Brokered time certificates | 7,130 | 4,558 | 7,532 | |||||||||
Time certificates of $100,000 or more | 159,052 | 218,580 | 246,117 | |||||||||
Total Deposits | 1,689,584 | 1,718,741 | 1,681,461 | |||||||||
Federal funds purchased and securities sold under agreements to repurchase, maturing within 30 days | 139,489 | 136,252 | 102,827 | |||||||||
Borrowed funds | 50,000 | 50,000 | 50,000 | |||||||||
Subordinated debt | 53,610 | 53,610 | 53,610 | |||||||||
Other liabilities | 8,378 | 8,695 | 23,817 | |||||||||
1,941,061 | 1,967,298 | 1,911,715 | ||||||||||
Shareholders' Equity | ||||||||||||
Preferred stock - Series A | 48,121 | 47,497 | 46,872 | |||||||||
Common stock | 9,477 | 9,469 | 9,354 | |||||||||
Additional paid in capital | 222,391 | 222,048 | 221,760 | |||||||||
Accumulated deficit | (117,423 | ) | (114,152 | ) | (111,849 | ) | ||||||
Treasury stock | (32 | ) | (13 | ) | (4 | ) | ||||||
162,534 | 164,849 | 166,133 | ||||||||||
Accumulated other comprehensive gain, net | 2,919 | 5,228 | 5,015 | |||||||||
Total Shareholders' Equity | 165,453 | 170,077 | 171,148 | |||||||||
$ | 2,106,514 | $ | 2,137,375 | $ | 2,082,863 | |||||||
Common Shares Outstanding | 94,779,981 | 94,686,801 | 93,541,902 |
Note: The balance sheet at December 31, 2011 has been derived from the audited financial statements at that date.
CONSOLIDATED QUARTERLY FINANCIAL DATA (Unaudited) |
SEACOAST BANKING CORPORATION OF FLORIDA AND SUBSIDIARIES |
QUARTERS | ||||||||||||||||||||
2012 | 2011 | Last 12 | ||||||||||||||||||
(Dollars in thousands, except per share data) | Second | First | Fourth | Third | Months | |||||||||||||||
Net income | $ | (2,335 | ) | $ | 938 | $ | 2,548 | $ | 2,648 | $ | 3,799 | |||||||||
Operating Ratios | ||||||||||||||||||||
Return on average assets-GAAP basis (2),(3) | (0.44 | )% | 0.18 | % | 0.48 | % | 0.51 | % | 0.18 | % | ||||||||||
Return on average tangible assets (2),(3),(4) | (0.42 | ) | 0.20 | 0.51 | 0.54 | 0.21 | ||||||||||||||
Return on average shareholders' equity-GAAP basis (2),(3) | (5.56 | ) | 2.26 | 6.17 | 6.33 | 2.29 | ||||||||||||||
Net interest margin (1),(2) | 3.17 | 3.33 | 3.42 | 3.44 | 3.34 | |||||||||||||||
Average equity to average assets | 7.90 | 7.85 | 7.86 | 8.07 | 7.92 | |||||||||||||||
Credit Analysis | ||||||||||||||||||||
Net charge-offs | $ | 6,275 | $ | 3,415 | $ | 3,268 | $ | 2,830 | $ | 15,788 | ||||||||||
Net charge-offs to average loans | 2.05 | % | 1.13 | % | 1.07 | % | 0.94 | % | 1.30 | % | ||||||||||
Loan loss provision | $ | 6,455 | $ | 2,305 | $ | 432 | $ | 0 | $ | 9,192 | ||||||||||
Allowance to loans at end of period | 2.02 | % | 2.01 | % | 2.12 | % | 2.35 | % | ||||||||||||
Restructured loans (accruing) | $ | 54,842 | 57,665 | 71,611 | 72,751 | |||||||||||||||
Nonperforming loans | $ | 48,482 | 41,716 | 28,526 | 32,627 | |||||||||||||||
Other real estate owned | 7,219 | 15,530 | 20,946 | 23,702 | ||||||||||||||||
Nonperforming assets | $ | 55,701 | $ | 57,246 | $ | 49,472 | $ | 56,329 | ||||||||||||
Nonperforming assets to loans and other real estate owned at end of period | 4.53 | % | 4.65 | % | 4.03 | % | 4.57 | % | ||||||||||||
Nonperforming assets to total assets | 2.64 | 2.64 | 2.31 | 2.75 | ||||||||||||||||
Nonaccrual loans and accruing loans 90 days or more past due to loans outstanding at end of period | 3.97 | 3.43 | 2.36 | 2.70 | ||||||||||||||||
Per Share Common Stock | ||||||||||||||||||||
Net income (loss) diluted-GAAP basis | $ | (0.03 | ) | $ | 0.00 | $ | 0.02 | $ | 0.02 | $ | 0.00 | |||||||||
Net income (loss) basic-GAAP basis | (0.03 | ) | 0.00 | 0.02 | 0.02 | $ | 0.00 | |||||||||||||
Cash dividends declared | - | - | - | - | $ | - | ||||||||||||||
Book value per share common | 1.24 | 1.30 | 1.29 | 1.31 | ||||||||||||||||
Average Balances | ||||||||||||||||||||
Total assets | $ | 2,133,713 | $ | 2,126,186 | $ | 2,085,466 | $ | 2,054,856 | ||||||||||||
Less: Intangible assets | 1,988 | 2,184 | 2,392 | 2,605 | ||||||||||||||||
Total average tangible assets | $ | 2,131,725 | $ | 2,124,002 | $ | 2,083,074 | $ | 2,052,251 | ||||||||||||
Total equity | $ | 168,457 | $ | 166,874 | $ | 163,857 | $ | 165,845 | ||||||||||||
Less: Intangible assets | 1,988 | 2,184 | 2,392 | 2,605 | ||||||||||||||||
Total average tangible equity | $ | 166,469 | $ | 164,690 | $ | 161,465 | $ | 163,240 |
(1) | Calculated on a fully taxable equivalent basis using amortized cost. |
(2) | These ratios are stated on an annualized basis and are not necessarily indicative of future periods. |
(3) | The calculation of ROA and ROE do not include the mark-to-market unrealized gains (losses), because the unrealized gains (losses) are not included in net income (loss). |
(4) | The Company believes that return on average assets and equity excluding the impacts of noncash amortization expense on intangible assets is a better measurement of the Company's trend in earnings growth. |
June 30, | December 31, | June 30, | ||||||||||
SECURITIES | 2012 | 2011 | 2011 | |||||||||
U.S. Treasury and U.S. Government Agencies | $ | 1,714 | $ | 1,724 | $ | 4,224 | ||||||
Mortgage-backed | 560,070 | 645,471 | 602,882 | |||||||||
Obligations of states and political subdivisions | 907 | 1,167 | 1,400 | |||||||||
Other securities | 0 | 0 | 2,725 | |||||||||
Securities Available for Sale | 562,691 | 648,362 | 611,231 | |||||||||
Mortgage-backed | 8,962 | 12,315 | 16,448 | |||||||||
Obligations of states and political subdivisions | 6,660 | 6,662 | 7,711 | |||||||||
Other securities | 1,500 | 1,000 | 1,000 | |||||||||
Securities Held for Investment | 17,122 | 19,977 | 25,159 | |||||||||
Total Securities | $ | 579,813 | $ | 668,339 | $ | 636,390 |
June 30, | December 31, | June 30, | ||||||||||
LOANS | 2012 | 2011 | 2011 | |||||||||
Construction and land development | $ | 57,228 | $ | 49,184 | $ | 49,193 | ||||||
Real estate mortgage | 1,057,551 | 1,054,599 | 1,039,997 | |||||||||
Installment loans to individuals | 50,133 | 50,611 | 51,351 | |||||||||
Commercial and financial | 56,220 | 53,105 | 48,012 | |||||||||
Other loans | 222 | 575 | 392 | |||||||||
Total Loans | $ | 1,221,354 | $ | 1,208,074 | $ | 1,188,945 |
AVERAGE BALANCES, YIELDS AND RATES (1) (Unaudited) |
SEACOAST BANKING CORPORATION OF FLORIDA AND SUBSIDIARIES |
2012 | 2011 | |||||||||||||||||||||||
Second Quarter | First Quarter | Second Quarter | ||||||||||||||||||||||
Average | Yield/ | Average | Yield/ | Average | Yield/ | |||||||||||||||||||
(Dollars in thousands) | Balance | Rate | Balance | Rate | Balance | Rate | ||||||||||||||||||
Assets | ||||||||||||||||||||||||
Earning assets: | ||||||||||||||||||||||||
Securities: | ||||||||||||||||||||||||
Taxable | $ | 552,501 | 2.40 | % | $ | 620,666 | 2.79 | % | $ | 591,265 | 3.10 | % | ||||||||||||
Nontaxable | 2,055 | 6.81 | 2,223 | 6.48 | 3,518 | 6.48 | ||||||||||||||||||
Total Securities | 554,556 | 2.41 | 622,889 | 2.81 | 594,783 | 3.11 | ||||||||||||||||||
Federal funds sold and other investments | 248,944 | 0.43 | 179,337 | 0.49 | 163,847 | 0.48 | ||||||||||||||||||
Loans, net | 1,231,239 | 4.81 | 1,213,796 | 4.91 | 1,221,388 | 5.09 | ||||||||||||||||||
Total Earning Assets | 2,034,739 | 3.63 | 2,016,022 | 3.87 | 1,980,018 | 4.12 | ||||||||||||||||||
Allowance for loan losses | (23,677 | ) | (25,104 | ) | (33,425 | ) | ||||||||||||||||||
Cash and due from banks | 31,795 | 36,513 | 29,513 | |||||||||||||||||||||
Premises and equipment | 34,197 | 34,237 | 35,368 | |||||||||||||||||||||
Other assets | 56,659 | 64,518 | 72,384 | |||||||||||||||||||||
$ | 2,133,713 | $ | 2,126,186 | $ | 2,083,858 | |||||||||||||||||||
Liabilities and Shareholders' Equity | ||||||||||||||||||||||||
Interest-bearing liabilities: | ||||||||||||||||||||||||
NOW (2) | $ | 423,240 | 0.16 | % | $ | 432,515 | 0.17 | % | $ | 392,514 | 0.26 | % | ||||||||||||
Savings deposits | 152,333 | 0.10 | 140,941 | 0.11 | 123,759 | 0.11 | ||||||||||||||||||
Money market accounts (2) | 336,392 | 0.26 | 327,071 | 0.28 | 319,098 | 0.45 | ||||||||||||||||||
Time deposits | 406,292 | 1.12 | 443,538 | 1.36 | 530,906 | 1.74 | ||||||||||||||||||
Federal funds purchased and other short term borrowings | 146,510 | 0.25 | 147,413 | 0.23 | 105,134 | 0.27 | ||||||||||||||||||
Other borrowings | 103,610 | 2.55 | 103,610 | 2.61 | 103,610 | 2.81 | ||||||||||||||||||
Total Interest-Bearing Liabilities | 1,568,377 | 0.59 | 1,595,088 | 0.68 | 1,575,021 | 0.95 | ||||||||||||||||||
Demand deposits (noninterest-bearing) | 388,060 | 355,362 | 330,858 | |||||||||||||||||||||
Other liabilities | 8,819 | 8,862 | 11,637 | |||||||||||||||||||||
Total Liabilities | 1,965,256 | 1,959,312 | 1,917,516 | |||||||||||||||||||||
Shareholders' equity | 168,457 | 166,874 | 166,342 | |||||||||||||||||||||
$ | 2,133,713 | $ | 2,126,186 | $ | 2,083,858 | |||||||||||||||||||
Interest expense as a % of earning assets | 0.45 | % | 0.54 | % | 0.76 | % | ||||||||||||||||||
Net interest income as a % of earning assets | 3.17 | 3.33 | 3.36 |
(1) | On a fully taxable equivalent basis. All yields and rates have been computed on an annualized basis using amortized cost. Fees on loans have been included in interest on loans. Nonaccrual loans are included in loan balances. |
(2) | Certain reclassifications have been made to prior years' presentations to conform to the current year presentation. |
CONSOLIDATED QUARTERLY FINANCIAL DATA (Unaudited) |
SEACOAST BANKING CORPORATION OF FLORIDA AND SUBSIDIARIES |
2012 | 2011 | |||||||||||||||||||
(Dollars in thousands) | Second Quarter | First Quarter | Fourth Quarter | Third Quarter | Second Quarter | |||||||||||||||
Customer Relationship Funding (Period End) | ||||||||||||||||||||
Demand deposits (noninterest bearing) | $ | 393,681 | $ | 394,532 | $ | 328,356 | $ | 324,256 | $ | 321,876 | ||||||||||
NOW accounts | 420,449 | 436,712 | 469,631 | 391,318 | 385,640 | |||||||||||||||
Money market accounts | 346,191 | 330,409 | 319,152 | 327,654 | 320,510 | |||||||||||||||
Savings savings accounts | 156,019 | 148,068 | 133,578 | 128,543 | 125,221 | |||||||||||||||
Time certificates of deposit | 373,244 | 427,738 | 468,024 | 489,503 | 528,214 | |||||||||||||||
Total Deposits | 1,689,584 | 1,737,459 | 1,718,741 | 1,661,274 | 1,681,461 | |||||||||||||||
Sweep repurchase agreements | 139,489 | 149,316 | 136,252 | 106,562 | 102,827 | |||||||||||||||
Total core customer funding (1) | 1,455,829 | 1,459,037 | 1,386,969 | 1,278,333 | 1,256,074 |
(1) | Total deposits and sweep repurchase agreements, excluding certificates of deposits. |
QUARTERLY TRENDS - LOANS AT END OF PERIOD (Dollars in Millions) (Unaudited) |
SEACOAST BANKING CORPORATION OF FLORIDA AND SUBSIDIARIES |
2011 | 2012 | |||||||||||||||||||||||
1st Qtr | 2nd Qtr | 3rd Qtr | 4th Qtr | 1st Qtr | 2nd Qtr | |||||||||||||||||||
Construction and land development | ||||||||||||||||||||||||
Residential | ||||||||||||||||||||||||
Condominiums | $ | 0.5 | $ | - | $ | - | $ | - | $ | - | $ | - | ||||||||||||
Townhomes | - | - | - | - | - | - | ||||||||||||||||||
Single family residences | - | - | - | - | - | - | ||||||||||||||||||
Single family land and lots | 6.6 | 6.5 | 6.4 | 6.2 | 6.0 | 5.9 | ||||||||||||||||||
Multifamily | 6.1 | 5.7 | 5.5 | 5.1 | 4.9 | 4.7 | ||||||||||||||||||
13.2 | 12.2 | 11.9 | 11.3 | 10.9 | 10.6 | |||||||||||||||||||
Commercial | ||||||||||||||||||||||||
Office buildings | - | - | - | 0.2 | 0.3 | - | ||||||||||||||||||
Retail trade | - | - | - | - | - | - | ||||||||||||||||||
Land | 33.9 | 10.3 | 10.2 | 9.3 | 9.2 | 10.7 | ||||||||||||||||||
Industrial | - | - | - | - | - | - | ||||||||||||||||||
Healthcare | - | - | - | - | - | - | ||||||||||||||||||
Churches and educational facilities | - | - | - | 0.1 | 0.3 | 0.3 | ||||||||||||||||||
Lodging | - | - | - | - | - | - | ||||||||||||||||||
Convenience stores | 0.5 | 0.6 | 0.6 | 1.7 | 1.4 | 1.4 | ||||||||||||||||||
Marina | - | - | - | - | - | - | ||||||||||||||||||
Other | - | - | - | - | - | - | ||||||||||||||||||
34.4 | 10.9 | 10.8 | 11.3 | 11.2 | 12.4 | |||||||||||||||||||
Individuals | ||||||||||||||||||||||||
Lot loans | 20.8 | 19.4 | 18.6 | 17.9 | 18.4 | 17.6 | ||||||||||||||||||
Construction | 7.3 | 6.7 | 6.4 | 8.7 | 13.5 | 16.6 | ||||||||||||||||||
28.1 | 26.1 | 25.0 | 26.6 | 31.9 | 34.2 | |||||||||||||||||||
Total construction and land development | 75.7 | 49.2 | 47.7 | 49.2 | 54.0 | 57.2 | ||||||||||||||||||
Real estate mortgages | ||||||||||||||||||||||||
Residential real estate | ||||||||||||||||||||||||
Adjustable | 308.6 | 314.3 | 324.4 | 334.1 | 341.6 | 359.4 | ||||||||||||||||||
Fixed rate | 86.6 | 88.8 | 92.8 | 97.0 | 96.2 | 95.4 | ||||||||||||||||||
Home equity mortgages | 67.7 | 63.1 | 63.6 | 60.2 | 59.5 | 58.3 | ||||||||||||||||||
Home equity lines | 57.4 | 56.9 | 55.1 | 54.9 | 53.0 | 50.8 | ||||||||||||||||||
520.3 | 523.1 | 535.9 | 546.2 | 550.3 | 563.9 | |||||||||||||||||||
Commercial real estate | ||||||||||||||||||||||||
Office buildings | 121.3 | 120.0 | 122.0 | 119.6 | 118.0 | 113.4 | ||||||||||||||||||
Retail trade | 150.6 | 149.6 | 146.1 | 140.6 | 139.3 | 128.5 | ||||||||||||||||||
Industrial | 76.3 | 68.5 | 72.5 | 70.7 | 70.0 | 72.0 | ||||||||||||||||||
Healthcare | 26.6 | 26.3 | 29.6 | 38.8 | 40.2 | 42.0 | ||||||||||||||||||
Churches and educational facilities | 28.6 | 28.2 | 27.8 | 27.4 | 27.0 | 26.7 | ||||||||||||||||||
Recreation | 2.8 | 2.8 | 2.7 | 3.2 | 3.1 | 3.1 | ||||||||||||||||||
Multifamily | 14.2 | 16.8 | 15.4 | 9.4 | 8.8 | 8.3 | ||||||||||||||||||
Mobile home parks | 2.5 | 2.4 | 2.2 | 2.2 | 2.1 | 2.1 | ||||||||||||||||||
Lodging | 21.7 | 20.0 | 19.8 | 19.6 | 19.4 | 19.3 | ||||||||||||||||||
Restaurant | 4.2 | 4.3 | 4.3 | 4.7 | 4.6 | 4.7 | ||||||||||||||||||
Agricultural | 9.2 | 9.2 | 8.9 | 8.8 | 7.6 | 7.4 | ||||||||||||||||||
Convenience stores | 20.1 | 20.0 | 19.8 | 15.1 | 15.5 | 15.4 | ||||||||||||||||||
Marina | 21.7 | 21.5 | 21.4 | 21.3 | 21.6 | 21.5 | ||||||||||||||||||
Other | 27.4 | 27.3 | 26.9 | 27.0 | 29.3 | 29.3 | ||||||||||||||||||
527.2 | 516.9 | 519.4 | 508.4 | 506.5 | 493.7 | |||||||||||||||||||
Total real estate mortgages | 1,047.5 | 1,040.0 | 1,055.3 | 1,054.6 | 1,056.8 | 1,057.6 | ||||||||||||||||||
Commercial & financial | 51.5 | 48.0 | 53.5 | 53.1 | 54.6 | 56.2 | ||||||||||||||||||
Installment loans to individuals | ||||||||||||||||||||||||
Automobile and trucks | 10.1 | 9.5 | 9.2 | 8.7 | 8.2 | 8.1 | ||||||||||||||||||
Marine loans | 19.4 | 20.2 | 21.6 | 19.9 | 21.1 | 20.8 | ||||||||||||||||||
Other | 20.9 | 21.6 | 20.9 | 22.0 | 21.5 | 21.3 | ||||||||||||||||||
50.4 | 51.3 | 51.7 | 50.6 | 50.8 | 50.2 | |||||||||||||||||||
Other | 0.3 | 0.4 | 0.3 | 0.6 | 0.2 | 0.2 | ||||||||||||||||||
$ | 1,225.4 | $ | 1,188.9 | $ | 1,208.5 | $ | 1,208.1 | $ | 1,216.4 | $ | 1,221.4 |
QUARTERLY TRENDS - INCREASE (DECREASE) IN LOANS BY QUARTER (Dollars in Millions) (Unauduited) |
SEACOAST BANKING CORPORATION OF FLORIDA AND SUBSIDIARIES |
2011 | 2012 | |||||||||||||||||||||||
1st Qtr | 2nd Qtr | 3rd Qtr | 4th Qtr | 1st Qtr | 2nd Qtr | |||||||||||||||||||
Construction and land development | ||||||||||||||||||||||||
Residential | ||||||||||||||||||||||||
Condominiums | $ | (0.4 | ) | $ | (0.5 | ) | $ | - | $ | - | $ | - | $ | - | ||||||||||
Townhomes | - | - | - | - | - | - | ||||||||||||||||||
Single family residences | - | - | - | - | - | - | ||||||||||||||||||
Single family land and lots | (0.4 | ) | (0.1 | ) | (0.1 | ) | (0.2 | ) | (0.2 | ) | (0.1 | ) | ||||||||||||
Multifamily | - | (0.4 | ) | (0.2 | ) | (0.4 | ) | (0.2 | ) | (0.2 | ) | |||||||||||||
(0.8 | ) | (1.0 | ) | (0.3 | ) | (0.6 | ) | (0.4 | ) | (0.3 | ) | |||||||||||||
Commercial | ||||||||||||||||||||||||
Office buildings | - | - | - | 0.2 | 0.1 | (0.3 | ) | |||||||||||||||||
Retail trade | - | - | - | - | - | - | ||||||||||||||||||
Land | 0.3 | (23.6 | ) | (0.1 | ) | (0.9 | ) | (0.1 | ) | 1.5 | ||||||||||||||
Industrial | - | - | - | - | - | - | ||||||||||||||||||
Healthcare | - | - | - | - | - | - | ||||||||||||||||||
Churches and educational facilities | - | - | - | 0.1 | 0.2 | - | ||||||||||||||||||
Lodging | - | - | - | - | - | - | ||||||||||||||||||
Convenience stores | 0.3 | 0.1 | - | 1.1 | (0.3 | ) | - | |||||||||||||||||
Marina | - | - | - | - | - | - | ||||||||||||||||||
Other | - | - | - | - | - | - | ||||||||||||||||||
0.6 | (23.5 | ) | (0.1 | ) | 0.5 | (0.1 | ) | 1.2 | ||||||||||||||||
Individuals | ||||||||||||||||||||||||
Lot loans | (3.6 | ) | (1.4 | ) | (0.8 | ) | (0.7 | ) | 0.5 | (0.8 | ) | |||||||||||||
Construction | 0.2 | (0.6 | ) | (0.3 | ) | 2.3 | 4.8 | 3.1 | ||||||||||||||||
(3.4 | ) | (2.0 | ) | (1.1 | ) | 1.6 | 5.3 | 2.3 | ||||||||||||||||
Total construction and land development | (3.6 | ) | (26.5 | ) | (1.5 | ) | 1.5 | 4.8 | 3.2 | |||||||||||||||
Real estate mortgages | ||||||||||||||||||||||||
Residential real estate | ||||||||||||||||||||||||
Adjustable | 5.3 | 5.7 | 10.1 | 9.7 | 7.5 | 17.8 | ||||||||||||||||||
Fixed rate | 4.0 | 2.2 | 4.0 | 4.2 | (0.8 | ) | (0.8 | ) | ||||||||||||||||
Home equity mortgages | (5.7 | ) | (4.6 | ) | 0.5 | (3.4 | ) | (0.7 | ) | (1.2 | ) | |||||||||||||
Home equity lines | (0.3 | ) | (0.5 | ) | (1.8 | ) | (0.2 | ) | (1.9 | ) | (2.2 | ) | ||||||||||||
3.3 | 2.8 | 12.8 | 10.3 | 4.1 | 13.6 | |||||||||||||||||||
Commercial real estate | ||||||||||||||||||||||||
Office buildings | (0.7 | ) | (1.3 | ) | 2.0 | (2.4 | ) | (1.6 | ) | (4.6 | ) | |||||||||||||
Retail trade | (0.9 | ) | (1.0 | ) | (3.5 | ) | (5.5 | ) | (1.3 | ) | (10.8 | ) | ||||||||||||
Industrial | (1.7 | ) | (7.8 | ) | 4.0 | (1.8 | ) | (0.7 | ) | 2.0 | ||||||||||||||
Healthcare | (3.4 | ) | (0.3 | ) | 3.3 | 9.2 | 1.4 | 1.8 | ||||||||||||||||
Churches and educational facilities | (0.2 | ) | (0.4 | ) | (0.4 | ) | (0.4 | ) | (0.4 | ) | (0.3 | ) | ||||||||||||
Recreation | (0.1 | ) | - | (0.1 | ) | 0.5 | (0.1 | ) | - | |||||||||||||||
Multifamily | (8.2 | ) | 2.6 | (1.4 | ) | (6.0 | ) | (0.6 | ) | (0.5 | ) | |||||||||||||
Mobile home parks | - | (0.1 | ) | (0.2 | ) | - | (0.1 | ) | - | |||||||||||||||
Lodging | (0.2 | ) | (1.7 | ) | (0.2 | ) | (0.2 | ) | (0.2 | ) | (0.1 | ) | ||||||||||||
Restaurant | (0.3 | ) | 0.1 | - | 0.4 | (0.1 | ) | 0.1 | ||||||||||||||||
Agricultural | (1.4 | ) | - | (0.3 | ) | (0.1 | ) | (1.2 | ) | (0.2 | ) | |||||||||||||
Convenience stores | 1.5 | (0.1 | ) | (0.2 | ) | (4.7 | ) | 0.4 | (0.1 | ) | ||||||||||||||
Marina | (0.2 | ) | (0.2 | ) | (0.1 | ) | (0.1 | ) | 0.3 | (0.1 | ) | |||||||||||||
Other | (0.6 | ) | (0.1 | ) | (0.4 | ) | 0.1 | 2.3 | - | |||||||||||||||
(16.4 | ) | (10.3 | ) | 2.5 | (11.0 | ) | (1.9 | ) | (12.8 | ) | ||||||||||||||
Total real estate mortgages | (13.1 | ) | (7.5 | ) | 15.3 | (0.7 | ) | 2.2 | 0.8 | |||||||||||||||
Commercial & financial | 2.7 | (3.5 | ) | 5.5 | (0.4 | ) | 1.5 | 1.6 | ||||||||||||||||
Installment loans to individuals | ||||||||||||||||||||||||
Automobile and trucks | (0.8 | ) | (0.6 | ) | (0.3 | ) | (0.5 | ) | (0.5 | ) | (0.1 | ) | ||||||||||||
Marine loans | (0.4 | ) | 0.8 | 1.4 | (1.7 | ) | 1.2 | (0.3 | ) | |||||||||||||||
Other | - | 0.7 | (0.7 | ) | 1.1 | (0.5 | ) | (0.2 | ) | |||||||||||||||
(1.2 | ) | 0.9 | 0.4 | (1.1 | ) | 0.2 | (0.6 | ) | ||||||||||||||||
Other | - | 0.1 | (0.1 | ) | 0.3 | (0.4 | ) | - | ||||||||||||||||
$ | (15.2 | ) | $ | (36.5 | ) | $ | 19.6 | $ | (0.4 | ) | $ | 8.3 | $ | 5.0 |
EXHIBIT 99.2
To Form 8-K dated July 26, 2012
Seacoast Banking Corporation of Florida
Second Quarter 2012 Earnings Conference Call
July 27, 2012
9:00 AM Eastern Time
Operator: Welcome to the Seacoast Second Quarter 2012 Earnings Conference Call. My name is Dawn, and I will be your operator for today's call. At this time, all participants are in a listen-only mode. Later, we will conduct a question-and-answer session. Please note that this conference is being recorded.
I will now turn the call over to Dennis S. Hudson. Mr. Hudson, you may begin.
Dennis S. Hudson III: Thank you very much, and welcome to Seacoast's Second Quarter Conference Call. Before I begin, as always, we direct your attention to the statement contained at the end of our press release regarding forward statements. During the call, we may be discussing issues that constitute forward-looking statements within the meaning of the Securities and Exchange Act and, accordingly, our comments are intended to be covered within the meaning of 27A of that Act.
With me today is Bill Hahl, our CFO; Russ Holland, our Chief Lending Officer; and David Houdeshell, our Chief Credit Officer.
Our progress this quarter continued on the problem asset front, which I want to talk about in a minute. But first, I want to talk about our decision to wind down the remaining problem assets at a faster pace, and our decision to more aggressively execute cost reductions and accelerate growth initiatives designed to build revenue. I have in many ways been pleased with our progress. We have been bringing down the level of problem assets consistently over the past couple of years while maintaining high levels of capital. We have in the past year significantly ramped up our performance in terms of our new household growth at a time when most banks, particularly large banks, are losing households. We know they are losing them because they are showing up in our offices. Over the past year, we ramped up our lending production capacity and have produced now several consecutive quarters of net loan growth. Our residential mortgage production this past quarter was record-breaking and contributed to some of the best growth in total noninterest income we have seen in many years. We expanded our household growth initiatives to include small business and have had great success over this past year, particularly in this quarter. And finally, we emerged with positive profitability throughout 2011 and into the first quarter of this year.
- 1 - |
As proud as I am of the work by our associates to accomplish these tremendous improvements, we need to move faster to strengthen our results in the coming year. As a result, we launched an internal project a couple of months ago with an objective to achieve faster improvement in our earnings in the coming year. The project has identified a number of actions we intend to take over the coming months. Some of these actions impacted the current quarter. To be clear, our focus going forward will be on three main themes. First, we are going to pick-up the pace in liquidating our remaining problem assets. Second, we are going to accelerate the execution of our very successful initiatives to grow personal and business relationships and the revenue that comes with that. And third, we are going to be taking a number of actions to reduce our overall cost structure. We intend to execute these actions quickly, and we have established goals and checkpoints to keep us on track. In the coming quarters, we are going to be reporting our progress.
The results of this quarter were impacted by substantial write-downs and specific reserves taken on certain loan assets that we determined could potentially be resolved more quickly over the balance of this year. This decision was made late in the quarter and it resulted from our project to accelerate performance. As a result, our provision for the quarter totaled $6.5 million, which contributed to our loss for the quarter, which was $2.3 million. After preferred stock dividends and accretion, the loss to common shareholders was $0.03 per share.
During the quarter, we were pleased to complete all of the sales of foreclosed properties, OREO, which we projected last quarter during this call, and we picked up a few new sales, which were also completed. As a result, our other real estate-owned balances fell to just over $7 million. This represents the lowest level we’ve seen since 2008, and it represented a 54% decline for the quarter and 72% decline for the year.
Our growth initiatives continue to perform well in the quarter. Customer funding was up $200 million, or 16% for the year. Deposit mix continued to improve with noninterest-bearing deposits growing 22.3% for the year, and they now total 23% of total deposits. This compares with a mix of 19% one year ago. Interest-bearing checking deposits were also up 9% for the year. Our growth in households is now improving our growth in fees as well. Debit card fees grew 16% year-over-year, which of course is directly related to our successful household growth. Total fees, excluding security gains, grew by 15% in the quarter compared with the same quarter last year. This improvement came across a broad range of categories, including trust, mortgage, and marine fees, as well as service charges and other deposit fees that are associated with our household growth.
Loan production and loan pipelines continued to grow for the quarter as they have every quarter over the past year. Total production over the past 12 months has exceeded $240 million, and our pipelines continue to be strong as we look forward. Much of our production has been focused on the home purchase market, which has continued to show signs of strengthening here in our markets and across Florida. In fact, inventory levels for existing homes in many of our markets is now at a three- or four-month supply, some of the lowest levels we’ve seen since the bubble period, and they are being priced at price points that predate that bubble period.
I’m going to turn the call over to Bill now for a few more comments on the quarter, and then we’d be pleased to open the line for a few questions. Bill.
William R. Hahl: Thanks, Denny. Good morning. Thank you for joining us today. We posted some slides on our website for this morning’s call that I will be referring to during my comments; however, I’ll begin with a high level review of the income statement.
- 2 - |
The low rate environment continues to be very challenging. While low rates are positive for cost of funds, principal payments will likely remain higher, creating tougher reinvestment decisions. In addition, like last quarter, we sold some investments to reduce our price risk as a result of those accelerating prepayments of principal. So interest income from securities this quarter was lower, partially offset by lower funding costs, while interest from loans was stable compared to the prior quarter. However, higher revenue from noninterest income areas, excluding security gains, during the quarter allowed total revenue to remain flat at around $21 million for the second quarter, comparable to the first quarter this year and last year’s second quarter. Core operating expenses were nearly unchanged for the quarter compared to the first quarter, as reduction in expenses has been reinvested to increase future earnings growth at an accelerating pace. More on this in a minute. So as Denny mentioned, the accelerating resolution of nonperforming assets this quarter increased the provisioning for loan losses and other credit costs and resulted in a bottom line loss for the quarter and the six months.
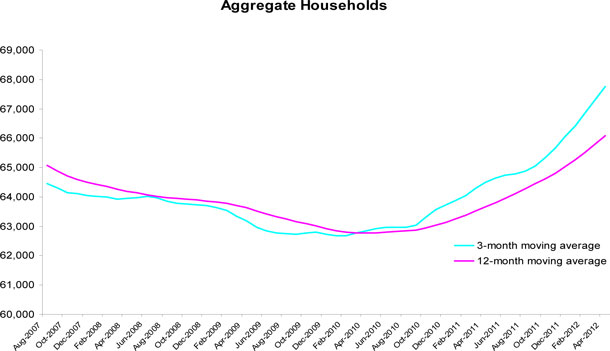
Now let’s take a look at some of our successful household growth over the last several quarters and how that’s driving fee income improvement and loan growth. Looking at slide five, you can see the increasing growth in households since 2009. We began a focus with retail households in 2008 and added businesses beginning late in 2010. In 2011, we added new commercial relationship managers, and this resulted in even better business household growth and both increased new loan balances and core deposit relationships. On a sequential basis, household growth is up 19.2% over the last 12 months compared to the same period for 2011. Over the first six months this year, new checking household growth has doubled compared to 2011.
Loan growth over the past 12 months is up $32 million, but, as Denny mentioned, new loan production was even much better. A total of $244 million of new loans was produced and added to the portfolio during the last 12 months ended June 30, with $196 million of consumer loans and $68 million of commercial loans. On a sequential quarterly basis, loan production totaled $91.9 million and was up 25.2% in the second quarter. We expect to see increased loan growth, which will be additive to net interest income going forward. Although, as you are aware, most of the add-on rates are lower than the portfolio’s current yield, they are still better than cash and securities.
Our security balances declined somewhat this quarter as a result of the sales I discussed earlier as we didn’t see many attractive alternatives in light of the continued low yields. We continue to look for opportunities to invest our excess liquidity, but believe the best current use is to fund loan growth. The key to improving net interest income and the margin will be to increase the loan portfolio while continuing to improve the deposit mix at an accelerated pace. Without the decline in interest income from investment sales, net interest income would have increased this quarter. Our expectation for total revenues is that the run rate will resume its growth in the third quarter 2012 and that total revenues will exceed the $21 million we earned this quarter.
Moving to slide six, we show the impact that increases in households have had on revenues and fees. The onboarding of new revenue from our well-executed process to cross-sell additional products during and after the initial account opening has resulted in nearly an 11% compounded annual growth rate for noninterest income since the second quarter of 2010. Despite lower overdraft income, primarily the result of the implementation of Reg E, total interest income increased 5.7% linked-quarter or 22.8% annualized compared to the first quarter of 2012 and is up 15% compared to last year’s second quarter. What these results show is that continued increases in households are restoring a major element of normalized earnings and that our goal to complete the process in 2013 is achievable.
- 3 - |
I’ll now turn to the liability side and our deposit cost, mix and growth results. As Denny mentioned, the real story for deposits is the favorable shift in mix towards lower cost accounts, most notably the DDA growth he mentioned of 22% year-over-year, and lower deposit costs including NOW and regular savings have also increased by $35 million and $30 million, respectively, over the last 12 months. The growth in lower cost and no cost accounts throughout the last 12 months has enabled us to manage down the higher cost time deposits and helped with the net interest margin. Deposit costs have also benefited from the higher cost CDs maturing and rolling into lower rate products. As a result, it has reduced time certificates to 22% of total deposits compared to 31% last year.
Turning to slide 10 and a review of expenses, total noninterest expenses were lower linked-quarter as a result of lower net losses on OREO and repossessed assets. Salaries and wages were up in the quarter compared to the second quarter of 2011, as the result of additional relationship managers who, as I mentioned, have assisted us in building momentum leading to the increases in net new loan volumes. In addition, commissions and incentives related to our revenue growth in various fee-based businesses have also been higher. Core operating expenses we believe are being well managed, but we have areas that we are looking at, as Denny mentioned. In addition, credit-related expenses remain high, but we continue to expect those to trend lower, as they have, as we resolve our nonperforming assets. In addition, we expect to add some additional commercial relationship managers over the balance of 2012 which will further help in increasing loan growth in 2013.
I’ll continue my comments by turning to slide 12 on capital. Capital ratios remain well above regulatory minimums. Our Tier 1 and risk-based capital ratios remain very strong and at levels higher than before the bubble at 17.2% and 18.4%, respectively. These ratios indicate that we have capacity to grow the balance sheet. In that respect, we will continue to take advantage, we think, of the great opportunity to take market share from the mega banks. Our most immediate capital deployment opportunity is to grow our loan portfolio, which we have done over the last three quarters, as Denny has mentioned.
That concludes my remarks. I’ll turn the call back to Denny.
Dennis S. Hudson III: Thanks, Bill. I guess to sum things up, we are seeing good results with our growth initiatives, but we are in a tough environment. As I see and look out over the next several quarters, I think we are going to remain in a tough environment, and the industry will face that environment and will likely make it difficult for us to achieve spreads we would like to see. As a result, we are adjusting our plan to meet this reality and to achieve the earnings power this franchise is capable of producing.
I’d be happy now to open the call for a few questions.
Operator: Thank you. We will now begin the question-and-answer session. If you do have a question, please press star then one on your touchtone phone. If you wish to be removed from the queue, please press the pound sign or hash key. If you are using a speakerphone, you may need to pick up the handset first before pressing the numbers. Once again, if you have a question, please press star then one on your touchtone phone.
- 4 - |
Our first question comes from Jefferson Harralson from KBW. Please go ahead.
Jefferson Harralson: Hi. Thanks, guys. Can I ask you a question on capital and how you think about it with the changes in the rules that are going on, with your TARP auction and trust preferreds possibly not being Tier 1, and OCI being most likely in the regulatory ratios; has all that changed how you think about your capital structure?
William R. Hahl: Hi, Jefferson. It’s Bill. I just had a little coughing jag here, but I’ll tell you what we’ve learned over the last couple of weeks as we’ve looked at the proposed regulations on capital. We’ve taken a look at our ratios post—and, as you know, the key is the risk-weighted asset ratios—and we find that our ratios remain quite strong in spite of the fact that, as you pointed out, there are some adjustments that they are proposing. We’ll wait and see whether or not from the comments that all of those proposals go through in terms of how OCI is going to be impacted by the unrealized gains and losses in the securities book, et cetera. Long and short of it, we think we have plenty of capacity to grow the balance sheet under the new regulations as well.
Jefferson Harralson: Okay. Thanks, guys.
Dennis S. Hudson III: Thanks, Jefferson.
Operator: Thank you. Our next question comes from Michael Rose with Raymond James. Please go ahead.
Michael Rose: Hey, good morning, everyone. How are you?
Dennis S. Hudson III: Good morning, Mike.
Michael Rose: Just a question on your comments, Denny, on your more cautious outlook over the next couple quarters. Some of your competitors or other Florida-based banks have actually expressed that banks are starting to turn up here and pipelines are growing, particularly on the commercial and commercial real estate side. How do you couch that?
Dennis S. Hudson III: Well, my caution was more related to the rather unusual interest rate environment we find ourselves in. I think we made pretty clear in our comments that we are seeing, just as you are hearing, very healthy pipelines and we are anticipating loan growth. We are having to work for it. We are having to go out and find those opportunities, but we are getting some good growth there. Again, the caution that I talked about was more that I’m afraid the spreads that we are going to book on that new volume may be less attractive than we would have thought they would have been even six or eight months ago. As a result, I think it’s imperative that we adjust our plan to face that reality, and that leads us to some of the acceleration activities that I’ve mentioned and also some of the looks at various things, including office consolidations and other ways to adjust our cost structure. So we are in the middle of that review. We’re about half way through it, and we are looking to make some pretty meaningful progress as we go forward. Again, as I said at the end of the call, this franchise has an earnings power that it is capable of producing, and we are committed to working faster to help the franchise achieve that result. So my caution is not so much related to the business environment as much as it is the interest rate environment. I will tell you, the business environment has certainly stabilized, although it is still tough out there. We have focused our lending activities in areas where we think we are seeing some growth, probably the most obvious of that is the good results we are getting with home purchase mortgages. We’ve had some great results there, and that market is frankly quite hot throughout the state, we think.
- 5 - |
Michael Rose: Okay, that’s helpful. Then as a follow-up, now with other real estate balances at very low levels, how should we think about provisioning on a go-forward basis now that most of the heavy lifting has been done. Your loan loss reserve ratio is about 2%. Where do you think that normalizes, and what should we expect in terms of inflows into nonperformers in future quarters? Thanks.
Dennis S. Hudson III: Right. Well you know we had some inflows this quarter. They were around $6 million in inflows that we produced. Those inflows were primarily local, and half of them were related to retail and the other half office. When I look at that, the issue is how fast we wind down the classifieds. We came to the conclusion this quarter, in fact as we tackled our project, that there are a number of our classified credits, frankly, that have not progressed forward. These are performing classified credits that have not progressed forward with improvements that we would have expected to see by now. So our judgment is that they will likely remain classified for a longer period of time than we maybe would have thought a year ago, and so we are adjusting our plan to seek resolution strategies for those assets to achieve more rapid improvement of our classified exposure. We think that’s important because it continues to cost us overhead and money to monitor and resolve those assets. We just think we are at a point where things have stabilized generally in the market, not getting worse, and we are now taking another look at the remaining problem assets that we are dealing with and seeking ways to achieve resolution more quickly perhaps than we would have planned six months ago with some of those assets. These are generally things that have some cash flow associated with them, but the cash flow hasn't improved enough to get it repaired to a better quality.
Michael Rose: So would that include additional bulk sales?
Dennis S. Hudson III: We don't know. We think there is some of that, but I also think it’s just adjusting our resolution strategies in a more aggressive fashion. Looking at several assets this quarter, we increased write downs and reserves on specific assets that we have adjusted our outlook on in terms of creating a faster wind down. So to your question “What does the provisioning look like going forward?”, we haven’t completed our work, but we’ve done a lot of it. We think we got a lot of it behind us this quarter. We’ll have some provisioning next quarter. We don’t think it’s going to be nearly what it was this quarter, obviously. Our objective is to get all of this completed to position us in a much stronger fashion as we enter 2013.
Michael Rose: Okay. Thanks for taking my questions.
Dennis S. Hudson III: Yep.
- 6 - |
Operator: Thank you. Our next question comes from David Bishop from Stifel Nicolaus. Please go ahead.
David Bishop: Yeah. Hey, good morning, Denny.
Dennis S. Hudson III: Hi, David.
David Bishop: Hey, a follow-up on Mike’s question, in terms of the inflows of the nonperforming loans this quarter, when we think about loss content relative to what we saw a couple years ago or so, how should we think about it on a go-forward basis in terms of net charge offs as well?
Dennis S. Hudson III: Well the loss content isn’t anywhere near what it was several years ago because we blew through a lot of land and extreme high loss content assets. I think what we are dealing with now is the more traditional commercial real estate asset that is performing, perhaps, but not where we would like to see it, or it is partially performing.
David, any general thoughts or comments there?
David D. Houdeshell: I think you’re right on point. Good morning, David. This is David Houdeshell. Most of our emerging problems have been in our commercial real estate income portfolio where we have seen continued economic conditions strain rental factors, and as they are adjusted and netted down, we are having to reevaluate the cash flow and the workout strategies for these assets. There is some good cash flow coming off these assets that we can work with to resolve these more quickly than we would a land loan or things we have struggled with in the past years.
Dennis S. Hudson III: Does that answer your question, David?
David Bishop: Yeah. Thank you. And, Denny, maybe just commentary in terms of the overall commercial pipeline, what you are seeing?
Dennis S. Hudson III: Yeah.
H. Russell Holland III: Good morning. This is Russ Holland. Our pipeline is pretty broad. We have teams covering Orlando down through the Treasure Coast into Palm Beach, and generally our focus is on the small business segment. Owner-occupied real estate is our primary pipeline right now, but we also have some small balance investor real estate opportunities and lines of credit, equipment loans. It’s a pretty general community bank type commercial pipeline.
Dennis S. Hudson III: And Russ…
H. Russell Holland III: The average loan we have originated this year is $500,000. That’s the loan size.
Dennis S. Hudson III: …On the commercial side.
- 7 - |
H. Russell Holland III: Yes, on the commercial side. On the residential side, as Denny described, it’s purchase money financing.
Dennis S. Hudson III: And, Russ, any comments on where that production is coming from? I mean it’s not…
H. Russell Holland III: It’s very balanced throughout our footprint. Orlando is about a third of it. A third to half is coming out of the Treasure Coast and the balance is Palm Beach County.
Dennis S. Hudson III: Yeah, and a lot of this production is a result of our growth in commercial households. We are focusing on acquiring those deposit relationships and, in so doing, moving credit relationships over. We’ve hired a number of lenders, as you well know, over the last year. We are continuing to recruit in that area, which is adding to our cost, but we think it’s important as we ramp up our production capacity, particularly in the small business area. We are having some great success with it, so we’re very pleased. And again, whether it be on the consumer side of the bank or the small business side of the bank, there is just really a lot of interest I think out there on the part of individuals and businesses in getting away from some of the mega banks that have really struggled from a service standpoint over the last year.
David Bishop: Thanks for the color.
Operator: Thank you. Our next question comes from Mac Hodgson from SunTrust Robinson Humphrey. Please go ahead.
Michael Young: Hi, this is Michael Young in for Mac. Just wanted to ask a question regarding DTA recapture timing. We have seen some other banks take about five quarters of profitability. Do you feel that this quarter acts as a reset to that timeline?
Dennis S. Hudson III: I don’t think it resets it. I don’t think the fundamentals have changed. I think the challenge we’ve had is, as you probably are aware, there is no rule that follows recapture after five consecutive quarters or anything like that. It’s really more of a focus on what the forward earnings, near-term earnings, look like. I think that we are still looking at probably the earliest would be late this year and more likely sometime in 2013.
Bill, any other comments? We have commented on that before. It’s a very complex discussion and we are confident it will happen. I’ll state that again. It absolutely happens. I think it is just a question of timing.
William R. Hahl: Right, and I think that the whole thought process of acceleration of our earnings back to more normalized earnings is the key, and that’s why we are focused on '13. As soon as that can be revealed in a way that can be objectively looked at by the external auditors, we’ll be there.
Michael Young: Okay. And I was just going to also see if you could provide some color on some of the cost cutting initiatives. You mentioned potentially considering office consolidations and things of that nature.
- 8 - |
Dennis S. Hudson III: We are not prepared to talk about that today, but we will be in the next call. We are focused on a whole host of issues, and it covers the gamut across the organization. I think we’ll just push that off until next quarter. It does include the possibility of office combinations. I don’t know that we are looking at a significant number there, but we have been doing some modeling over the past two months on that score. We consolidated one office this quarter with a nearby office. It happened late this quarter. We will just have to see. We are looking at a couple more probably in the next quarter or two. We would like to get all of this completed by year-end.
Michael Young: Thanks.
Operator: Thank you. Our next question comes from Timothy Orkins from FIG Partners. Please go ahead.
Timothy Orkins: Good morning, everybody.
Dennis S. Hudson III: Good morning.
William R. Hahl: Good morning.
Timothy Orkins: My first question is: Could you all tell me what percentage of the charge-offs this quarter has specific reserves against them?
Dennis S. Hudson III: Say that again, what percentage… Say that again.
Timothy Orkins: Of the charge-offs had specific reserves against them?
William R. Hahl: I’m not sure that there… I think most of the charge-offs… for the most part, we were adding specific reserves to certain credits…
Dennis S. Hudson III: Yeah, our charge-off…
William R. Hahl: …rather to our provisioning, and we charged down loans, I think.
Dennis S. Hudson III: I would say generally speaking, most of the charge downs tended to have additional reserves associated with those assets, generally speaking.
William R. Hahl: Right.
Dennis S. Hudson III: Right?
William R. Hahl: Yes.
Dennis S. Hudson III: Yeah. Hope that answers your question.
Operator: At this time, I’m showing no further questions.
- 9 - |
Dennis S. Hudson III: Well, thank you very much for attending today, and we look forward to reporting further progress when we next speak together in the coming quarter. Thank you.
Operator: Thank you, ladies and gentlemen. This concludes today’s conference. Thank you for participating. You may now disconnect.
Please Note: * Proper names/organizations spelling not verified.
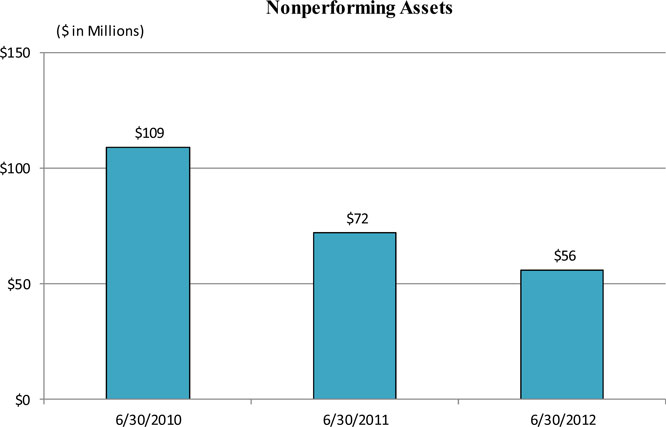
- 10 - |
EXHIBIT 99.3
To Form 8-K dated July 26, 2012
Seacoast Banking Corporation of Florida
Second Quarter 2012
Cautionary Notice Regarding Forward-Looking Statements
This information contains “forward-looking statements” within the meaning of Section 27A of the Securities Act of 1933 and Section 21E of the Securities Exchange Act of 1934, including, without limitation, statements about future financial and operating results, ability to realized deferred tax assets, cost savings, enhanced revenues, economic and seasonal conditions in our markets, and improvements to reported earnings that may be realized from cost controls and for integration of banks that we have acquired, as well as statements with respect to Seacoast’s objectives, expectations and intentions and other statements that are not historical facts. Actual results may differ from those set forth in the forward-looking statements.
Forward-looking statements include statements with respect to our beliefs, plans, objectives, goals, expectations, anticipations, estimates and intentions, and involve known and unknown risks, uncertainties and other factors, which may be beyond our control, and which may cause the actual results, performance or achievements of Seacoast to be materially different from future results, performance or achievements expressed or implied by such forward-looking statements. You should not expect us to update any forward-looking statements.
You can identify these forward-looking statements through our use of words such as “may,” “will,” “anticipate,” “assume,” “should,” “support”, “indicate,” “would,” “believe,” “contemplate,” “expect,” “estimate,” “continue,” “further”, “point to,” “project,” “could,” “intend” or other similar words and expressions of the future. These forward-looking statements may not be realized due to a variety of factors, including, without limitation: the effects of future economic and market conditions, including seasonality; governmental monetary and fiscal policies, as well as legislative, tax and regulatory changes; changes in accounting policies, rules and practices; the risks of changes in interest rates on the level and composition of deposits, loan demand, liquidity and the values of loan collateral, securities, and interest sensitive assets and liabilities; interest rate risks, sensitivities and the shape of the yield curve; the effects of competition from other commercial banks, thrifts, mortgage banking firms, consumer finance companies, credit unions, securities brokerage firms, insurance companies, money market and other mutual funds and other financial institutions operating in our market areas and elsewhere, including institutions operating regionally, nationally and internationally, together with such competitors offering banking products and services by mail, telephone, computer and the Internet; and the failure of assumptions underlying the establishment of reserves for possible loan losses. The risks of mergers and acquisitions, include, without limitation: unexpected transaction costs, including the costs of integrating operations; the risks that the businesses will not be integrated successfully or that such integration may be more difficult, time-consuming or costly than expected; the potential failure to fully or timely realize expected revenues and revenue synergies, including as the result of revenues following the merger being lower than expected; the risk of deposit and customer attrition; any changes in deposit mix; unexpected operating and other costs, which may differ or change from expectations; the risks of customer and employee loss and business disruption, including, without limitation, as the result of difficulties in maintaining relationships with employees; increased competitive pressures and solicitations of customers by competitors; as well as the difficulties and risks inherent with entering new markets.
All written or oral forward-looking statements attributable to us are expressly qualified in their entirety by this cautionary notice, including, without limitation, those risks and uncertainties described in our annual report on Form 10-K for the year ended December 31, 2010 under “Special Cautionary Notice Regarding Forward-Looking Statements” and “Risk Factors”, and otherwise in our SEC reports and filings. Such reports are available upon request from the Company, or from the Securities and Exchange Commission, including through the SEC’s Internet website at http://www.sec.gov.
Highlights
• | Growth initiatives producing results |
• | Organic growth in households continued to increase this quarter resulting in 2,638 new household relationships up 543 or 26% compared to second quarter 2011 |
• | Noninterest bearing demand deposit organic growth was $71.8 million or 22% year over year |
• | Residential mortgage production was strong supporting both loan and noninterest income growth |
• | Growth in fee-based noninterest income up 14.8% |
• | Asset quality improves |
• | Other real estate owned declined by 54% from the prior quarter and 72% year over year |
• | Nonperforming assets declined $16.3 million to $55.7 million compared to last year |
• | Further improvements expected as a result of more aggressive actions taken to accelerate problem asset liquidations |
• | Capital strong and stable |
• | Solid capital position with estimated tangible common equity (TCE) ratio of 7.5% when DTA valuation allowance of $45.4 million is recaptured. |
• | Total risk-based capital stable at 18.4% |
• | Profitability initiative underway |
• | Aggressive reduction in OREO balances achieved during quarter |
• | Additional credit marks taken to reflect faster wind down of problem assets |
• | Comprehensive review of cost structure and revenue opportunities under review |
Aggressively Dealing with Credit Issues
Growth Initiatives Producing Results
Momentum is Increasing
Net Loan Growth
DDA Trends Reflect Household Growth Success
Core Ending Deposit Growth
Favorable Mix Shift
($ in thousands) | ||||||||||||||||||||||||
2Q-2012 | Mix | 4Q-2011 | Mix | 2Q-2011 | Mix | |||||||||||||||||||
Demand deposits (noninterest bearing) | $ | 393,681 | 23.3 | % | $ | 328,356 | 19.1 | % | $ | 321,876 | 19.1 | % | ||||||||||||
Savings deposits | 922,659 | 54.6 | % | 922,361 | 53.7 | % | 831,371 | 49.4 | % | |||||||||||||||
Total Demand and Savings | $ | 1,316,340 | 77.9 | % | $ | 1,250,717 | 72.8 | % | $ | 1,153,247 | 68.6 | % | ||||||||||||
Other time certificates | 207,062 | 12.3 | % | 244,886 | 14.2 | % | 274,565 | 16.3 | % | |||||||||||||||
Brokered time certificates | 7,130 | 0.4 | % | 4,558 | 0.3 | % | 7,532 | 0.4 | % | |||||||||||||||
Time certificates of $100,000 or more | 159,052 | 9.4 | % | 218,580 | 12.7 | % | 246,117 | 14.6 | % | |||||||||||||||
Total Time Deposits | $ | 373,244 | 22.1 | % | $ | 468,024 | 27.2 | % | $ | 528,214 | 31.4 | % | ||||||||||||
Total Deposits | $ | 1,689,584 | $ | 1,718,741 | $ | 1,681,461 |
Noninterest Expenses
Aggressively Dealing with Credit Issues
($ in thousands) | ||||||||||||||||||||
2Q–2012 |
1Q–2012 |
2Q–2011 | 2Q 2012 vs 1Q 2012 | 2Q 2012 vs 2Q 2011 | ||||||||||||||||
Noninterest expenses | $ | 20,721 | $ | 21,710 | $ | 19,073 | -4.6 | % | 8.6 | % | ||||||||||
Loss on mortgage buy-backs | 126 | — | — | |||||||||||||||||
Severance | 138 | — | 13 | |||||||||||||||||
TARP Legal and Professional Expenses | — | 235 | — | |||||||||||||||||
Branch Consolidation Expense | 125 | — | — | |||||||||||||||||
OREO and REPO expenses (1) | 719 | 843 | 768 | |||||||||||||||||
Net loss on OREO and repossessed assets | 790 | 1,959 | 1,142 | |||||||||||||||||
Nonrecurring expenses | $ | 1,898 | $ | 3,037 | $ | 1,923 | -37.5 | % | -1.3 | % | ||||||||||
Investments in future growth (2) | 1,574 | 1,255 | 1,141 | 25.4 | % | 37.9 | % | |||||||||||||
Recurring operating expenses | $ | 17,249 | $ | 17,418 | $ | 16,009 | -1.0 | % | 7.7 | % |
(1) | Does not include personnel expense related to credit administration or default management costs |
(2) | Expenses related to new commercial relationship managers and mortgage loan originators |
Credit Analysis
($ in thousands) | ||||||||||||||||||||
2Q-2012 | 1Q-2012 | 4Q-2011 | 3Q-2011 | 2Q-2011 | ||||||||||||||||
Net charge-offs | $ | 6,275 | $ | 3,415 | $ | 3,268 | $ | 2,830 | $ | 4,024 | ||||||||||
Net charge-offs to average loans | 2.05 | % | 1.13 | % | 1.07 | % | 0.94 | % | 1.32 | % | ||||||||||
Loan loss provision | $ | 6,455 | $ | 2,305 | $ | 432 | — | $ | 902 | |||||||||||
Allowance to loans at end of period | 2.02 | % | 2.01 | % | 2.12 | % | 2.35 | % | 2.63 | % | ||||||||||
Coverage ratio – NPLs | 50.81 | % | 58.62 | % | 89.62 | % | 87.05 | % | 67.65 | % |
Capital Ratios
2Q-2012 Estimate | 1Q-2012 Actual | 4Q-2011 Actual | 3Q-2011 Actual | |||||||||||||
Tier 1 Capital Ratio | 17.17 | % | 17.36 | % | 17.51 | % | 17.42 | % | ||||||||
Total Risk Based Capital Ratio | 18.43 | % | 18.62 | % | 18.77 | % | 18.68 | % | ||||||||
YTD Average Equity to YTD Average Assets | 7.87 | % | 7.85 | % | 8.01 | % | 8.06 | % | ||||||||
Tangible Equity to Tangible Assets | 7.78 | % | 7.79 | % | 7.86 | % | 8.22 | % | ||||||||
Tangible Common Equity to Tangible Assets | 5.49 | % | 5.58 | % | 5.63 | % | 5.91 | % | ||||||||
Tangible Common Equity to Risk Weighted Assets | 9.52 | % | 9.90 | % | 9.81 | % | 9.97 | % |
Net Interest Margin
· | Focus on deposit pricing and favorable deposit mix trends benefited the margin |
· | Increasing loan growth will result in margin improvement |
· | Excess liquidity has reduced margin expansion in recent quarters |
Noninterest Income (excluding securities gains)
$ in thousands | Q-2-2012 | Q-1-2012 | Q-4-2011 | Q-3-2011 | Q-2-2011 | |||||||||||||||
Total Noninterest Income (excluding securities gains) | $ | 5,219 | $ | 4,937 | $ | 4,883 | $ | 4,706 | $ | 4,547 | ||||||||||
Highlights include: | ||||||||||||||||||||
Service Charges | $ | 1,487 | $ | 1,461 | $ | 1,599 | $ | 1,675 | $ | 1,546 | ||||||||||
Trust Income | 564 | 573 | 530 | 541 | 517 | |||||||||||||||
Mortgage Banking | 902 | 623 | 680 | 556 | 509 | |||||||||||||||
Brokerage | 298 | 234 | 258 | 321 | 223 | |||||||||||||||
Marine | 244 | 330 | 333 | 229 | 349 | |||||||||||||||
Interchange Income | 1,154 | 1,071 | 953 | 969 | 995 |
Service Area
GMU`F````````.9[W^H.=>M6?`TQ6T'9-+
MF.:S8\>LJ9N2`````````!ZM/?S)?7"?"5!BU_96K\+G3X^SIHD.G```````
M`````````'+_`/.,P]>77XR0M:/+AR7*_D6JOHJ&I.`````````&2^"_ZI7;
MJ.#XR0E DK59I-?/'(GDTF[(
M'G+M-?\`(,UNR2L%KKZBHL-8MKNUMIW4]:U]NC8B+5-<^73;*Y[<'HJ>Z*JH;
K9BN01N1AMG@=WC/4"%_
M+KX/T0?,EQ/CV2S>.S=ZF,^4Q03QT+!$?V86@V3#L9V`F,>C[F=!!X/X/?#C
M!YB++XS#!#Q;C/8\:9KXL6(.0Q18T(Y,>$'
M?*O:8JLUD7`RTA>;;)W#T#L"T1#+YFWLX]`],`MP"6CCN9GVOT=M?8Z"$Y5R
M1L-3)H(9+.1EAGEJ011E*S-"+;I)!#S=L",-VW4NO1G00'PTY?F R=.WZF7UD=:?MU)J,Y::C%#&SOJ1$1.S-J3ZN[N@J7)N?-+DJV
M(P8V++>IA"]
,VVGA4MS\5TMUBM-ILQ"_016%A`?JHZ]IL2[LN:U26GZK3+RE=>
M?%-Y3;2G#6:4OM.8BC)*BL/%46#"5IV6F$=>S6*[7M5FL1NOTEM2[L3E4V;&
MB2G6D2&VW6S2IM[%RB#]K#[)VV?08#]WEUZ5VA'7F8%$C/Q+LTRF5)UQ^2Z2
MW&9V32;1$3:O;3E,"C5Z,("8O!K!O&SK6N]28QL,W==HLBM34K->56A-A*QL
M4C*UM)&:$ELGLGL`."+KVK
M?62$FHR,R(K=D[",\'H`$7BH"Y,&*BHQER:HV;].92Z@UR&DIQS<:(CM6G%P
MXQ8`'XI5Z+NU>5)B4RI1YLF(=DEIEQ*U(]HTVF1'L8R33;])6`),````````
M!%%XI/02SQ@)4``````````````````````````````````05];UM77H3E35
M!E5)[&)J+`A-*===>41FE.#`A/LF:EJP)(!06M<]:EW`N=5H%+CNWGOI(X)`
M@N.K;B-*)2\=UUPB6YB(0WA(BMP@+=JSOR[?"[[\R5$3!JE.FR:758B%Y1M$
MJ(O%7DUF234DR,C*TO2`I-R->=;O!>F!3I-(BM0:NNHMQHL:2IVIPCIIJ(SJ
M,3%B353
M4I90RRS.)2FC=)UU#MMC9XQ)0JP!U4B^<6H5Y^A.T^93I[
M`!;(#2]4GEC=?LV/FR&'NK*RMHY```4O7+Y;5G:C_F6A+AWVZQU>31GBMT>V
M8VL*[P!ZG=%MA(T?4_Y97=T1/O&,1DW3K*S"X#@`````````````$-?7P;7N
MSI>86`Q6D=$P=&9S:1M\>V%:76.QZC=IVR"1H>IKRSH?PG<^X,3EWSK*Q"Z"
M-Z``",O/X:JVA2,TH!A])Z)@Z,SFTC;X]L*TNL=CU.Z+;"1I&J3R\I'[KWYA
MP8K/R7=T]5B*+>(GH``(R]/AFKZ%(S2AY(PN@=`TS0X^:2-OAV1HK2[Q(`"[
MZE/#]7[:F_:@8_SN:[5/;1H(JN@``<=:Z&GZ.[[A@,!NSX:I&A1LRD;7!LMT
MA6FJ2$H`+OJ4\/U?MJ;]J!C_`#N:[5/;1H(JN@``<=:Z&GZ.[[A@,!NSX:I&
MA1LRD;7!LMTA6FJ2$H`+KJ5Z'KW;4C,,#(_(
@EGC`2H"DZYO+R?I
M-._N$<3^-RV]T=7DT9\K9,;-7>``#3M5/EG=?LR+FDC#7565J'@``"GZV_`%
M1^)$_.,B?QN6WNCJ\FC.%;)C9J[P`+9`:7JD\L;K]FQ\V0P]U965M'(``"EZ
MY?+:L[4?\RT)<.^W6.KR:,\5NCVS&UA7>`/4[HML)&CZG_+*[NB)]XQB,FZ=
M9687`<```(:^G@ZN]G2\PL!C,'^AC?!;]PAN;:*S[CT>IW1;82-'U/\`EE=W
M1$^\8Q&3=.LK,+@.```$-?7P;7NSI>86`Q6D=$P=&9S:1M\>V%:76.QZC=IV
MR"1H>IKRSH?PG<^X,3EWSK*Q"Z"-Z``",O/X:JVA2,TH!A])Z)@Z,SFTC;X]
ML*TNL=CU.Z+;"1I&J3R\I'[KWYAP8K/R7=T]5B*+>(GH``(R]/AFKZ%(S2AY
M(PN@=`TS0X^:2-OAV1HK2[Q(`"[ZE/#]7[:F_:@8_P`[FNU3VT:"*KH``''6
MNAI^CN^X8#`;L^&J1H4;,I&UP;+=(5IJDA*`"[ZE/#]7[:F_:@8_SN:[5/;1
MH(JN@``<=:Z&GZ.[[A@,!NSX:I&A1LRD;7!LMTA6FJ2$H`+KJ5Z'KW;4C,,#
M(_(