UNITED STATES
SECURITIES AND EXCHANGE COMMISSION
Washington, D.C. 20549
FORM 8–K
CURRENT REPORT
Pursuant to Section 13 or 15 (d) of the
Securities Exchange Act of 1934
Date of Report (Date of Earliest Event Reported): June 10, 2019
Thor Industries, Inc.
(Exact Name of Registrant as Specified in Charter)
Delaware (State or Other Jurisdiction of Incorporation) |
1-9235 (Commission File Number) |
93-0768752 (IRS Employer Identification No.) |
601 East Beardsley Avenue, Elkhart, Indiana (Address of Principal Executive Offices) |
46514-3305 (Zip Code) |
Registrant’s telephone number, including area code: (574) 970-7460
N/A
(Former Name or Former Address, if Changed Since Last Report)
Check the appropriate box below if the Form 8-K filing is intended to simultaneously satisfy the filing obligation of the registrant under any of the following provisions:
¨ | Written communications pursuant to Rule 425 under the Securities Act (17 CFR 230.425) |
¨ | Soliciting material pursuant to Rule 14a-12 under the Exchange Act (17 CFR 240.14a-12) |
¨ | Pre-commencement communications pursuant to Rule 14d-2(b) under the Exchange Act (17 CFR 240.14d-2(b)) |
¨ | Pre-commencement communications pursuant to Rule 13e-4(c) under the Exchange Act (17 CFR 240.13e-4(c)) |
Indicate by check mark whether the registrant is an emerging growth company as defined in Rule 405 of the Securities Act of 1933 or Rule 12b-2 of the Securities Exchange Act of 1934.
Emerging growth company ¨
If an emerging growth company, indicate by check mark if the registrant has elected not to use the extended transition period for complying with any new or revised financial accounting standards pursuant to Section 13(a) of the Exchange Act. ¨
Securities registered pursuant to Section 12(b) of the Act: | ||
Title of each class | Ticker symbol(s) | Name of each exchange on which registered |
Common stock (Par value $.10 Per Share) | THO | New York Stock Exchange |
Item 2.02 Results of Operations and Financial Condition
On June 10, 2019, Thor Industries, Inc. (the “Company”) issued a press release announcing certain financial results for the third quarter and nine months ended April 30, 2019. A copy of the Company’s press release is attached hereto as Exhibit 99.1 and is incorporated by reference herein. The Company also posted an updated investor slide presentation and a list of investor questions and answers to the “Investors” section of its website. A copy of the Company’s slide presentation and investor questions and answers are attached hereto as Exhibit 99.2 and 99.3, respectively, and are incorporated by reference herein.
Item 7.01 Regulation FD Disclosure
The slide presentation attached hereto as Exhibit 99.2, and incorporated by reference herein, also provides updated information on industry wholesale shipments and retail market share. The Company also posted an updated list of investor questions and answers to the “Investors” section of its website. A copy of the Company’s investor questions and answers is attached hereto as Exhibit 99.3 and is incorporated by reference herein.
In accordance with general instruction B.2 to Form 8-K, the information set forth in Items 2.02 and 7.01 of this Form 8-K (including Exhibits 99.1, 99.2, and 99.3) shall be deemed “furnished” and not “filed” with the Securities and Exchange Commission for purposes of Section 18 of the Securities Exchange Act of 1934, as amended, and shall not be incorporated by reference into any filing thereunder or under the Securities Act of 1933, as amended.
Item 9.01 Financial Statements and Exhibits
(d) | Exhibits |
SIGNATURES
Pursuant to the requirements of the Securities Exchange Act of 1934, the registrant has duly caused this report to be signed on its behalf by the undersigned hereunto duly authorized.
Thor Industries, Inc. |
Date: June 10, 2019 | By: | /s/ Colleen Zuhl |
Name: Colleen Zuhl | ||
Title: Senior Vice President and | ||
Chief Financial Officer |
Exhibit 99.1
601 East Beardsley Avenue, Elkhart, Indiana 46514-3305
FOR IMMEDIATE RELEASE
THOR ANNOUNCES FINANCIAL RESULTS FOR THIRD QUARTER OF FISCAL 2019
AND THE PAY DOWN OF APPROXIMATELY $255 MILLION OF ACQUISITION-RELATED DEBT TO DATE
• | Increase in net sales for the third quarter reflects the acquisition of Erwin Hymer Group (EHG) which was completed at the start of the third quarter, with European RV segment contributing $767.5 million in net sales. |
• | Financial results for the third quarter include acquisition-related costs and purchase accounting adjustments related to the EHG acquisition. In addition, the Company incurred costs related to the acquisition that will be ongoing, including amortization expense and interest expense. |
• | Continued rationalization in North American independent dealer inventory levels supports positive outlook for the North American industry supported by long-term favorable demand trends. |
• | To date, the Company has paid approximately $255 million of principal on the debt incurred to finance the EHG acquisition, including paying down all $100 million outstanding on its asset-based credit facility (ABL) and approximately $155 million of its term loan. |
Elkhart, Indiana, June 10, 2019 – Thor Industries, Inc. (NYSE: THO) today announced third-quarter results with record net sales of $2.51 billion, compared with the previous sales record posted in the third quarter of the prior year. Current year third-quarter net sales include the net sales of EHG since the date of acquisition on February 1, 2019. Net income attributable to Thor and diluted earnings per share for the third quarter of fiscal 2019 were $32.7 million and $0.59, respectively. Third-quarter results include acquisition-related costs and purchase accounting adjustments related to the EHG acquisition, which total $74.8 million, or $1.06 per diluted share. In addition, ongoing amortization expense and interest expense were incurred as a result of the acquisition which also impacted the third-quarter results.
"EHG made a significant contribution to our top-line results for the quarter, and as we move through some of the transitional costs, we look forward to EHG's meaningful contribution to our bottom line as well,” said Bob Martin, Thor President and CEO. "This transformational acquisition is a critical first step in our long-term strategic plan to expand outside of the North American market. Beyond the acquisition, we have seen improvements in the operating results of our North American segments, reflecting a more stable environment as we finish the fiscal year.”
Third quarter fiscal 2019 financial results also reflect the impact of the ongoing North American independent dealer inventory rationalization, as dealers continued to reduce inventory levels to better match ongoing retail demand for RVs in North America.
The Company's third-quarter financial results were impacted by certain acquisition-related items as noted below.
• | Transaction-related Impacts to Third Quarter Results: |
• | Purchase Accounting Costs: During the quarter, gross profit of the European RV segment was impacted by the step up in assigned value of acquired inventory, which was subsequently sold during the quarter, to fair value less cost to sell, which increased cost of goods sold by approximately $61.4 million. |
• | Acquisition-related Costs: During the third quarter, Thor incurred $13.4 million in net expenses related to the acquisition of EHG. These net costs include $16.3 million of expenses consisting primarily of bank fees, professional and advisory integration fees and the write off of the remaining unamortized debt fees related to Thor's previous asset-based loan facility, partially offset by a $2.9 million favorable change in value of the acquisition-related foreign currency forward contract. |
• | Total Acquisition Impact: In aggregate, acquisition-related costs and the purchase accounting adjustment impacted third quarter reported results by $74.8 million, or $1.06 per diluted share. |
• | Ongoing Incremental Costs: During the quarter, the Company also incurred other ongoing expenses related to the acquisition of EHG, including EHG amortization expense of $12.8 million and interest expense of $35.4 million. These two items, combined, further impacted diluted EPS by $0.69 per share. |
As a result of the acquisition of EHG, the Company has expanded its reporting segments to include a European RV segment, which consists solely of the operations of the recently acquired EHG business. This new segment complements the Company's North American Towable RV and North American Motorized RV reporting segments.
The North American independent dealer inventory rationalization process continued during the third quarter, as North American industry wholesale shipments declined at a double-digit percentage compared with a single-digit decrease in retail registrations through the end of March 2019. As a result of the lower wholesale shipments relative to retail demand, Thor’s North American independent dealer inventory levels decreased by 20.3% to approximately 132,500 units, compared to approximately 166,200 units as of April 30, 2018.
Third-quarter net sales increased 11.3%, as the inclusion of $767.5 million in net sales from the European RV segment was partially offset by a 23.1% decrease in North American Towable RV sales and a 23.3% decrease in North American Motorized RV sales. Overall gross profit margin was 11.7% in the quarter, compared to 14.1% in the prior-year period, primarily reflecting the $61.4 million impact on the European RV segment gross profit as a result of the acquired inventory, which was subsequently sold during the quarter, being stepped up under purchase accounting, as well as the impact of lower North American sales levels and higher relative sales discounts and promotions compared with unusually low levels in the prior year. North American overhead costs increased as a percentage of sales due to lower fixed cost absorption over the reduced net sales in the quarter. The Company’s third-quarter effective tax rate was 24.3% compared to a tax rate of 25.9% in the prior year due to favorable impacts of certain foreign rate differences resulting from the acquisition of EHG. The Company expects an effective rate that approximates the Company’s combined federal and state statutory rates of between 21% and 23% for the remainder of fiscal 2019, before consideration of any discrete tax items.
As North American independent dealers continue to rationalize inventory levels following the unusually high seasonal order and wholesale delivery patterns in the first nine months of fiscal 2018, the Company has taken steps to adjust its North American production levels accordingly. A number of Thor's North American production facilities have reduced their production unit rates, while others have shifted to four-day production weeks, with the option of taking extended holiday shutdowns in the fiscal fourth quarter. Finished goods inventory levels were higher at April 30, 2019 than at July 31, 2018 due to the inclusion of finished goods inventory at EHG, which was acquired at the beginning of the third quarter.
North American Towable RVs
• | North American Towable RV sales were $1.24 billion for the third quarter, compared to the record third-quarter sales of $1.61 billion in the prior-year period. This decrease was driven primarily by lower unit volume compared with the record third-quarter unit sales last year, but was partially offset by a shift in product mix toward higher-priced units. |
• | North American Towable gross profit margin fell 30 basis points to 14.5% in the fiscal third quarter, with the increase in the overhead cost percentage from the sales decrease being partially offset by improved material, labor and warranty costs as a percent of sales. |
2
• | North American Towable RV income before tax was $103.7 million, compared to $147.9 million in the third quarter last year. This decrease was driven primarily by lower unit sales, increased relative levels of discounting compared to the unusually low levels the prior year which resulted in a decrease in gross profit, as well as lower absorption of fixed SG&A costs. |
• | North American Towable RV backlog decreased $408.8 million to $896.0 million, compared to $1.30 billion at the end of the third quarter of fiscal 2018, reflecting the positive impact of capacity additions, improved delivery times and independent dealers continuing to rationalize inventory levels. The Company believes the current towable RV backlog is returning to a normalized level and is reflective of dealer trends toward smaller, but more frequent, order patterns. |
North American Motorized RVs
• | North American Motorized RV sales were $459.2 million for the third quarter compared to the record third-quarter sales level of $598.5 million in the prior-year period. The decrease in motorized sales was driven primarily by lower unit sales compared to the record third-quarter unit sales last year, partially offset by a mix shift toward higher-priced product. |
• | North American Motorized RV gross profit margin fell 50 basis points to 10.3% in the fiscal third quarter primarily due to reduced unit sales levels and reduced fixed overhead absorption for the quarter. |
• | North American Motorized RV income before tax was $25.2 million, compared to $38.9 million last year, driven primarily by the lower unit sales levels, the decrease in gross profit and lower absorption of fixed SG&A costs. |
• | North American Motorized RV backlog decreased $184.6 million to $513.7 million from $698.3 million a year earlier, reflecting the positive impact of capacity additions, improved delivery times and independent dealers continuing to rationalize inventory levels. The Company believes the current motorized RV backlog is returning to a normalized level and is reflective of the shift in dealer order patterns to smaller and more frequent orders. |
European RVs
• | European RV sales were $767.5 million for the third quarter, the initial quarter reflecting the results of EHG which was acquired on February 1, 2019. |
• | European RV gross profit was $54.0 million, or 7.0% of net sales in the fiscal third quarter. Segment gross profit was impacted by purchase accounting adjustments related to the step-up in the value of acquired inventory, which was subsequently sold during the quarter, of approximately $61.4 million, or 8.0%, of segment net sales. |
• | European RV loss before tax was $30.9 million, which includes the impact of $61.4 million related to the step-up in assigned value of acquired inventory that was subsequently sold during the period and amortization expense related to acquired intangible assets of $12.8 million. |
• | European RV backlog was $687.4 million as of April 30, 2019, reflecting current levels of demand within the European market. |
3
"With the inclusion of EHG into our operations in the quarter, we continue to focus on integration and the sharing of best practices that will drive long-term improvements in margins and profitability for our overall business,” said Colleen Zuhl, Thor's Senior Vice President and Chief Financial Officer. “As we review our cash priorities, our main focus is to utilize free cash flow to reduce overall debt levels, which were reduced by $40 million during the quarter. Subsequent to the end of the quarter, we fully paid the remaining $60 million outstanding on the ABL facility, and made payments of approximately $155 million on our term loan. To date, we have made total principal payments of approximately $255 million towards our original ABL and Term Loan B debt balances. As we generate future cash flow, we will balance our strategic goal to invest in the continued growth of our business along with the financial goals of reducing our net debt level and returning cash to shareholders."
Outlook
With the completion of the EHG acquisition, Thor’s management team remains focused on creating long-term shareholder value by supporting both the integration of EHG, and the Company's growth in North America. To help drive that growth the Company recently announced the creation of two new senior management positions at Thor Industries in North America to provide incremental support to subsidiary leadership and help achieve key goals on an accelerated basis. The Company has elevated two of its top RV leaders, Matt Zimmerman of Keystone and Chris Hermon of Heartland, to the newly-created roles of RV Group Managers. In their new roles, Matt and Chris will be assisting Thor's North American operating companies in their realization of key strategic initiatives, all of which are designed to improve the Company's offerings to its dealers and retail customers, increase engagement with its employees and improve its operating margins.
"During the remainder of our fiscal 2019, we expect the North American dealer inventory rationalization will continue, but we expect to see a resumption of growth in the North American markets in 2020. In Europe, we believe our dealer inventory levels of EHG products, while elevated in certain locations, are generally appropriate for seasonal consumer demand in Europe and are progressing towards more normalized levels," added Bob Martin. "Currently, our focus is on identifying and realizing the benefits of sharing best practices and operating efficiencies across Europe and North America, and continuing to optimize our working capital management processes.”
“Having completed the EHG acquisition, we are now beginning the hard work of realizing the full value of EHG to our Company,” commented Peter B. Orthwein, Executive Chairman of Thor. “With the strong industry fundamentals and demographic tailwinds, we are confident that our strategic expansion into the European RV market will contribute to Thor's long-term growth, and provide the strong cash flow and returns on investment that our shareholders have come to expect from Thor.”
4
Supplemental Earnings Release Materials
Thor has provided a comprehensive question and answer document, as well as a PowerPoint presentation, relating to its quarterly results and other topics. To view these materials, go to http://ir.thorindustries.com.
About Thor Industries, Inc.
Thor is the sole owner of operating subsidiaries that, combined, represent the world's largest manufacturer of recreational vehicles. For more information on the Company and its products, please go to www.thorindustries.com.
Forward Looking Statements
This release includes certain statements that are “forward looking” statements within the meaning of the U.S. Private Securities Litigation Reform Act of 1995, Section 27A of the Securities Act of 1933, as amended, and Section 21E of the Securities Exchange Act of 1934, as amended. These forward looking statements are made based on management’s current expectations and beliefs regarding future and anticipated developments and their effects upon Thor, and inherently involve uncertainties and risks. These forward looking statements are not a guarantee of future performance. We cannot assure you that actual results will not differ materially from our expectations. Factors which could cause materially different results include, among others, raw material and commodity price fluctuations; raw material, commodity or chassis supply restrictions; the impact of tariffs on material or other input costs; the level and magnitude of warranty claims incurred; legislative, regulatory and tax law and/or policy developments including their potential impact on our dealers and their retail customers or on our suppliers; the costs of compliance with governmental regulation; legal and compliance issues including those that may arise in conjunction with recently completed transactions; lower consumer confidence and the level of discretionary consumer spending; interest rate fluctuations; the potential impact of interest rate fluctuations on the general economy and specifically on our dealers and consumers; restrictive lending practices; management changes; the success of new and existing products and services; consumer preferences; the ability to efficiently utilize production facilities; the pace of acquisitions and the successful closing, integration and financial impact thereof; the potential loss of existing customers of acquisitions; our ability to retain key management personnel of acquired companies; a shortage of necessary personnel for production; the loss or reduction of sales to key dealers; disruption of the delivery of units to dealers; increasing costs for freight and transportation; asset impairment charges; cost structure changes; competition; the impact of potential losses under repurchase or financed receivable agreements; the potential impact of the strength of the U.S. dollar on international demand for products priced in U.S. dollars; general economic, market and political conditions; the impact of changing emissions standards in the various jurisdictions in which our products are sold; and changes to investment and capital allocation strategies or other facets of our strategic plan. Additional risks and uncertainties surrounding the acquisition of Erwin Hymer Group SE ("EHG") include risks regarding the potential benefits of the acquisition and the anticipated operating synergies, the integration of the business, the impact of exchange rate fluctuations and unknown or understated liabilities related to the acquisition and EHG's business. These and other risks and uncertainties are discussed more fully in Item 1A of our Annual Report on Form 10-K for the year ended July 31, 2018 and Part II, Item 1A of our quarterly reports on Form 10-Q for the periods ended January 31, 2019 and April 30, 2019.
We disclaim any obligation or undertaking to disseminate any updates or revisions to any forward looking statements contained in this release or to reflect any change in our expectations after the date hereof or any change in events, conditions or circumstances on which any statement is based, except as required by law.
5
THOR INDUSTRIES, INC.
CONDENSED CONSOLIDATED STATEMENTS OF INCOME FOR THE
THREE AND NINE MONTHS ENDED APRIL 30, 2019 AND 2018
($000's except share and per share data) (Unaudited)
Three Months Ended April 30, | Nine Months Ended April 30, | |||||||||||||||||||||||||||||||
2019 | % Net Sales(1) | 2018 | % Net Sales(1) | 2019 | % Net Sales(1) | 2018 | % Net Sales(1) | |||||||||||||||||||||||||
Net sales | $ | 2,506,583 | $ | 2,251,570 | $ | 5,553,135 | $ | 6,454,798 | ||||||||||||||||||||||||
Gross profit | $ | 292,430 | 11.7 | % | $ | 316,745 | 14.1 | % | $ | 641,282 | 11.5 | % | $ | 920,258 | 14.3 | % | ||||||||||||||||
Selling, general and administrative expenses | 176,983 | 7.1 | % | 119,449 | 5.3 | % | 364,745 | 6.6 | % | 370,800 | 5.7 | % | ||||||||||||||||||||
Amortization of intangible assets | 25,259 | 1.0 | % | 13,882 | 0.6 | % | 50,376 | 0.9 | % | 41,236 | 0.6 | % | ||||||||||||||||||||
Acquisition-related costs | 13,363 | 0.5 | % | — | — | % | 112,511 | 2.0 | % | — | — | % | ||||||||||||||||||||
Interest income (expense), net | (32,962 | ) | (1.3 | )% | (923 | ) | — | % | (31,800 | ) | (0.6 | )% | (2,907 | ) | — | % | ||||||||||||||||
Other income (expense), net | (2,340 | ) | (0.1 | )% | (1,966 | ) | (0.1 | )% | (6,937 | ) | (0.1 | )% | 3,366 | 0.1 | % | |||||||||||||||||
Income before income taxes | 41,523 | 1.7 | % | 180,525 | 8.0 | % | 74,913 | 1.3 | % | 508,681 | 7.9 | % | ||||||||||||||||||||
Income taxes | 10,085 | 0.4 | % | 46,737 | 2.1 | % | 34,939 | 0.6 | % | 166,735 | 2.6 | % | ||||||||||||||||||||
Net income | 31,438 | 1.3 | % | 133,788 | 5.9 | % | 39,974 | 0.7 | % | 341,946 | 5.3 | % | ||||||||||||||||||||
Less: net (loss) attributable to non-controlling interests | (1,246 | ) | — | % | — | — | % | (1,246 | ) | — | % | — | — | % | ||||||||||||||||||
Net income attributable to Thor Industries, Inc. | $ | 32,684 | 1.3 | % | $ | 133,788 | 5.9 | % | $ | 41,220 | 0.7 | % | $ | 341,946 | 5.3 | % | ||||||||||||||||
Earnings (loss) per common share | ||||||||||||||||||||||||||||||||
Basic | $ | 0.59 | $ | 2.54 | $ | 0.77 | $ | 6.49 | ||||||||||||||||||||||||
Diluted | $ | 0.59 | $ | 2.53 | $ | 0.77 | $ | 6.47 | ||||||||||||||||||||||||
Weighted-avg. common shares outstanding - basic | 55,063,473 | 52,695,365 | 53,515,491 | 52,667,016 | ||||||||||||||||||||||||||||
Weighted-avg. common shares outstanding - diluted | 55,166,067 | 52,853,541 | 53,627,627 | 52,844,040 |
(1) Percentages may not add due to rounding differences
SUMMARY CONDENSED CONSOLIDATED BALANCE SHEETS ($000) |
(Unaudited) | (Unaudited) | |||||||||||||||||
April 30, 2019 | July 31, 2018 | April 30, 2019 | July 31, 2018 | |||||||||||||||
Cash and equivalents | $ | 486,913 | $ | 275,249 | Current liabilities | $ | 1,512,128 | $ | 769,330 | |||||||||
Accounts receivable, net | 841,111 | 487,235 | Long-term debt | 2,182,289 | — | |||||||||||||
Inventories, net | 962,588 | 537,909 | Other long-term liabilities | 238,370 | 71,594 | |||||||||||||
Prepaid expenses and other | 43,563 | 11,281 | Stockholders' equity | 2,039,533 | 1,937,741 | |||||||||||||
Total current assets | 2,334,175 | 1,311,674 | ||||||||||||||||
Property, plant & equipment, net | 1,088,130 | 522,054 | ||||||||||||||||
Goodwill | 1,350,187 | 377,693 | ||||||||||||||||
Amortizable intangible assets, net | 999,858 | 388,348 | ||||||||||||||||
Deferred income taxes and other, net | 199,970 | 178,896 | ||||||||||||||||
Total | $ | 5,972,320 | $ | 2,778,665 | $ | 5,972,320 | $ | 2,778,665 |
6
Contact
Investor Relations:
Mark Trinske, Vice President of Investor Relations
mtrinske@thorindustries.com
(574) 970-7912
7
Exhibit 99.2
www.thorindustries.com INVESTOR PRESENTATION JUNE 10, 2019
Forward Looking Statements 2 This presentation includes certain statements that are “forward looking” statements within the meaning of the U . S . Private Securities Litigation Reform Act of 1995 , Section 27 A of the Securities Act of 1933 , as amended, and Section 21 E of the Securities Exchange Act of 1934 , as amended . These forward looking statements are made based on management’s current expectations and beliefs regarding future and anticipated developments and their effects upon Thor, and inherently involve uncertainties and risks . These forward looking statements are not a guarantee of future performance . We cannot assure you that actual results will not differ materially from our expectations . Factors which could cause materially different results include, among others, raw material and commodity price fluctuations ; raw material, commodity or chassis supply restrictions ; the impact of tariffs on material or other input costs ; the level and magnitude of warranty claims incurred ; legislative, regulatory and tax law and/or policy developments including their potential impact on our dealers and their retail customers or on our suppliers ; the costs of compliance with governmental regulation ; legal and compliance issues including those that may arise in conjunction with recently completed transactions ; lower consumer confidence and the level of discretionary consumer spending ; interest rate fluctuations ; the potential impact of interest rate fluctuations on the general economy and specifically on our dealers and consumers ; restrictive lending practices ; management changes ; the success of new and existing products and services ; consumer preferences ; the ability to efficiently utilize production facilities ; the pace of acquisitions and the successful closing, integration and financial impact thereof ; the potential loss of existing customers of acquisitions ; our ability to retain key management personnel of acquired companies ; a shortage of necessary personnel for production ; the loss or reduction of sales to key dealers ; disruption of the delivery of units to dealers ; increasing costs for freight and transportation ; asset impairment charges ; cost structure changes ; competition ; the impact of potential losses under repurchase or financed receivable agreements ; the potential impact of the strength of the U . S . dollar on international demand for products priced in U . S . dollars ; general economic, market and political conditions ; the impact of changing emissions standards in the various jurisdictions in which our products are sold ; and changes to investment and capital allocation strategies or other facets of our strategic plan . Additional risks and uncertainties surrounding the acquisition of Erwin Hymer Group SE ("EHG") include risks regarding the potential benefits of the acquisition and the anticipated operating synergies, the integration of the business, the impact of exchange rate fluctuations and unknown or understated liabilities related to the acquisition and EHG's business . These and other risks and uncertainties are discussed more fully in Item 1 A of our Annual Report on Form 10 - K for the year ended July 31 , 2018 and Part II, Item 1 A of our quarterly reports on Form 10 - Q for the periods ended January 31 , 2019 and April 30 , 2019 . We disclaim any obligation or undertaking to disseminate any updates or revisions to any forward looking statements contained in this presentation or to reflect any change in our expectations after the date hereof or any change in events, conditions or circumstances on which any statement is based, except as required by law .
Third Quarter Update 2019 Overview & Current Industry Conditions Appendix: Financial & Market Data 4 11 19 Table of Contents 3
Third Quarter Update 2019 4
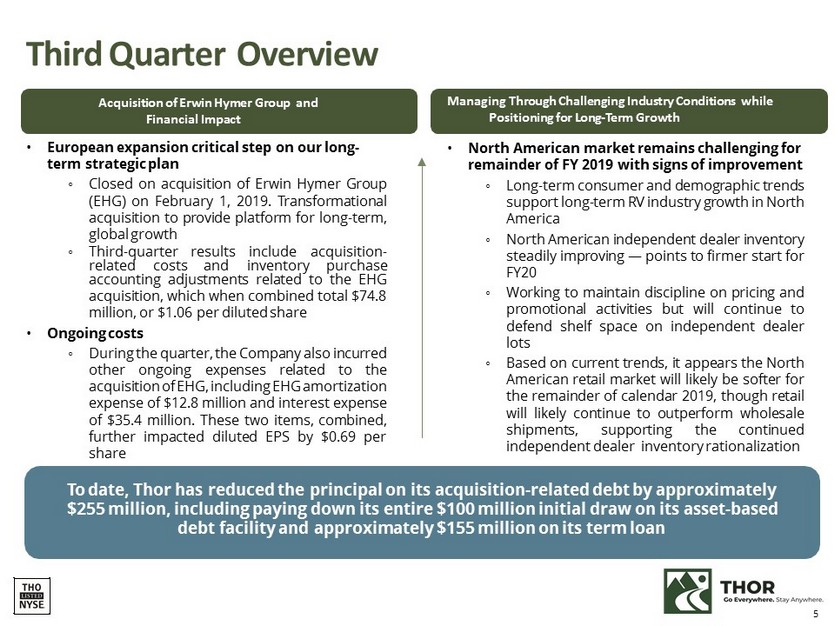
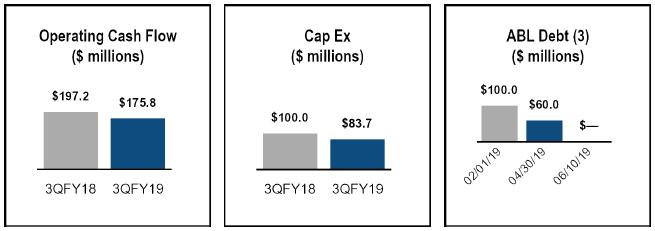
Third Quarter Overview • European expansion critical step on our long - term strategic plan ◦ Closed on acquisition of Erwin Hymer Group (EHG) on February 1 , 2019 . Transformational acquisition to provide platform for long - term, global growth ◦ Thi r d - quarter r esults include acquisition - r elated costs and inventory pu r chase accounting adjustments related to the EHG acquisition, which when combined total $ 74 . 8 million, or $ 1 . 06 per diluted share • Ongoing costs ◦ During the quarter, the Company also incurred other ongoing expenses related to the acquisition of EHG, including EHG amortization expense of $ 12 . 8 million and interest expense of $ 35 . 4 million . These two items, combined, further impacted diluted EPS by $ 0 . 69 per sh are • North American market remains challenging for remainder of FY 2019 with signs of improvement ◦ Long - term consumer and demographic trends support long - term RV industry growth in North America ◦ North American independent dealer inventory steadily improving — points to firmer start for FY 20 ◦ Working to maintain discipline on pricing and promotional activities but will continue to defend shelf space on independent dealer lots ◦ Based on current trends, it appears the North American retail market will likely be softer for the remainder of calendar 2019 , though retail will likely continue to outperform wholesale shipments, supporting the continued independent dealer inventory rationalization Acquisition of Erwin Hymer Group and Financial Impact Managing Through Challenging Industry Conditions while Positioning for Long - Term Growth To date, Thor has reduced the principal on its acquisition - related debt by approximately $255 million, including paying down its entire $100 million initial draw on its asset - based debt facility and approximately $155 million on its term loan 5
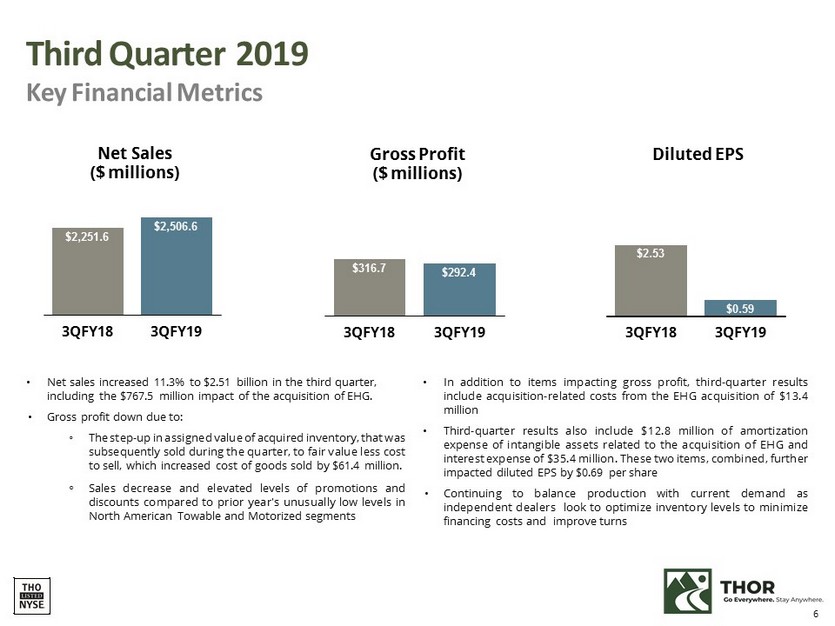
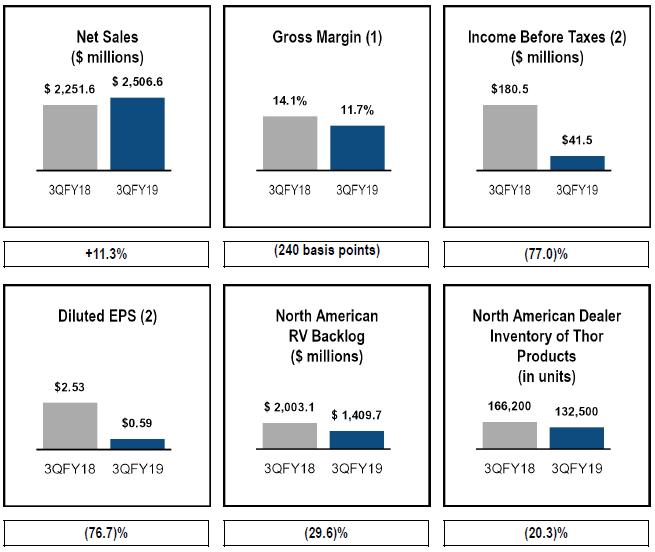
Third Quarter 2019 Key Financial Metrics Net Sales ($ millions) 3QFY18 3QFY19 $2,251.6 $2,506.6 Gross Profit ($ millions) 3QFY18 $316.7 $292.4 Diluted EPS 6 $2.53 $0.59 • Net sales increased 11.3% to $2.51 billion in the third quarter, including the $767.5 million impact of the acquisition of EHG. • Gross profit down due to: ◦ The step - up in assigned value of acquired inventory, that was subsequently sold during the quarter, to fair value less cost to sell, which increased cost of goods sold by $ 61 . 4 million . ◦ Sales decrease and elevated levels of promotions and discounts compared to prior year's unusually low levels in North American Towable and Motorized segments 3QFY19 3QFY18 3QFY19 • In addition to items impacting gross profit, third - quarter results include acquisition - related costs from the EHG acquisition of $ 13 . 4 million • Third - quarter results also include $ 12 . 8 million of amortization expense of intangible assets related to the acquisition of EHG and interest expense of $ 35 . 4 million . These two items, combined, further impacted diluted EPS by $ 0 . 69 per share • Continuing to balance production with current demand as independent dealers look to optimize inventory levels to minimize financing costs and improve turns
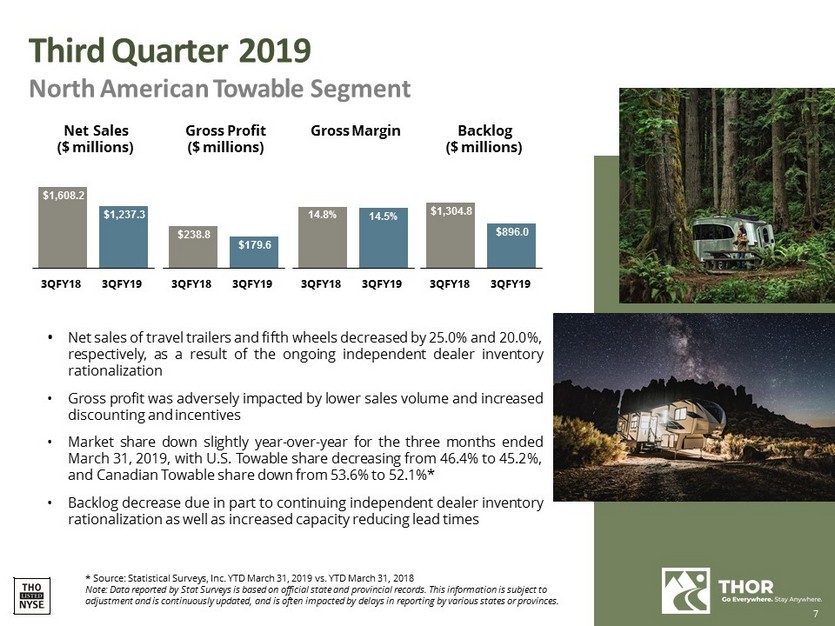
Third Quarter 2019 North American Towable Segment • Net sales of travel trailers and fifth wheels decreased by 25 . 0 % and 20 . 0 % , respectively, as a result of the ongoing independent dealer inventory rationalization • Gross profit was adversely impacted by lower sales volume and increased discounting and incentives • Market share down slightly year - over - year for the three months ended March 31 , 2019 , with U . S . Towable share decreasing from 46 . 4 % to 45 . 2 % , and Canadian Towable share down from 53 . 6 % to 52 . 1 % * • Backlog decrease due in part to continuing independent dealer inventory rationalization as well as increased capacity reducing lead times * Source: Statistical Surveys, Inc. YTD March 31, 2019 vs. YTD March 31, 2018 Note: Data reported by Stat Surveys is based on official state and provincial records. This information is subject to adjustment and is continuously updated, and is often impacted by delays in reporting by various states or provinces. Net Sales ($ millions) 3QFY18 3QFY19 $1,608.2 $1,237.3 3QFY18 3QFY19 14.8% 14.5% Gross Profit Gross Margin ($ millions) 3QFY18 3QFY19 $238.8 $179.6 Backlog ($ millions) 7 3QFY18 3QFY19 $1,304.8 $896.0
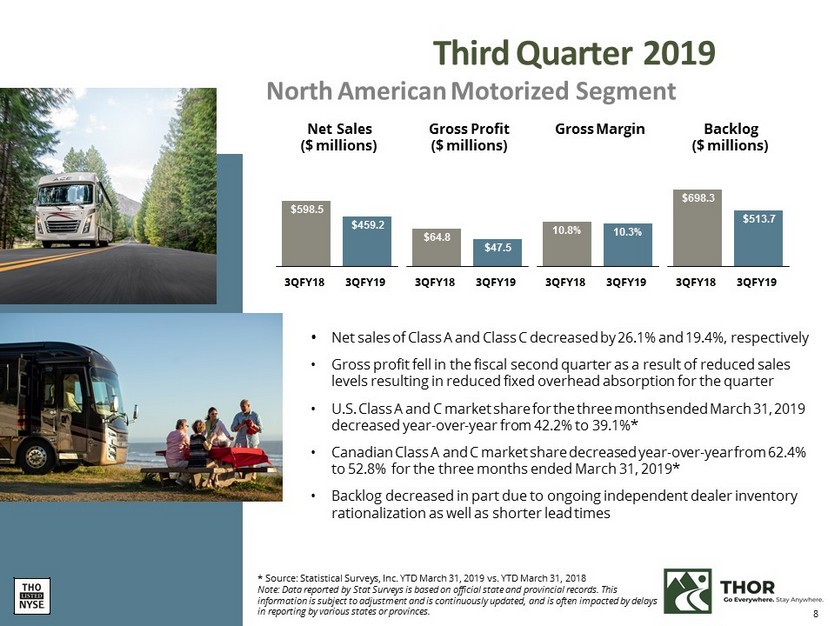
8 • Net sales of Class A and Class C decreased by 26.1% and 19.4%, respectively • Gross profit fell in the fiscal second quarter as a result of reduced sales levels resulting in reduced fixed overhead absorption for the quarter • U.S. Class A and C market share for the three months ended March 31, 2019 decreased year - over - year from 42.2% to 39.1%* • Canadian Class A and C market share decreased year - over - year from 62.4% to 52.8% for the three months ended March 31, 2019* • Backlog decreased in part due to ongoing independent dealer inventory rationalization as well as shorter lead times * Source: Statistical Surveys, Inc. YTD March 31, 2019 vs. YTD March 31, 2018 Note: Data reported by Stat Surveys is based on official state and provincial records. This information is subject to adjustment and is continuously updated, and is often impacted by delays in reporting by various states or provinces. Net Sales ($ millions) 3QFY18 3QFY19 $598.5 $459.2 3QFY19 10.8% 10.3% Gross Profit Gross Margin ($ millions) 3QFY18 3QFY19 3QFY18 $64.8 $47.5 Backlog ($ millions) 3QFY18 3QFY19 $698.3 $513.7 Third Quarter 2019 North American Motorized Segment
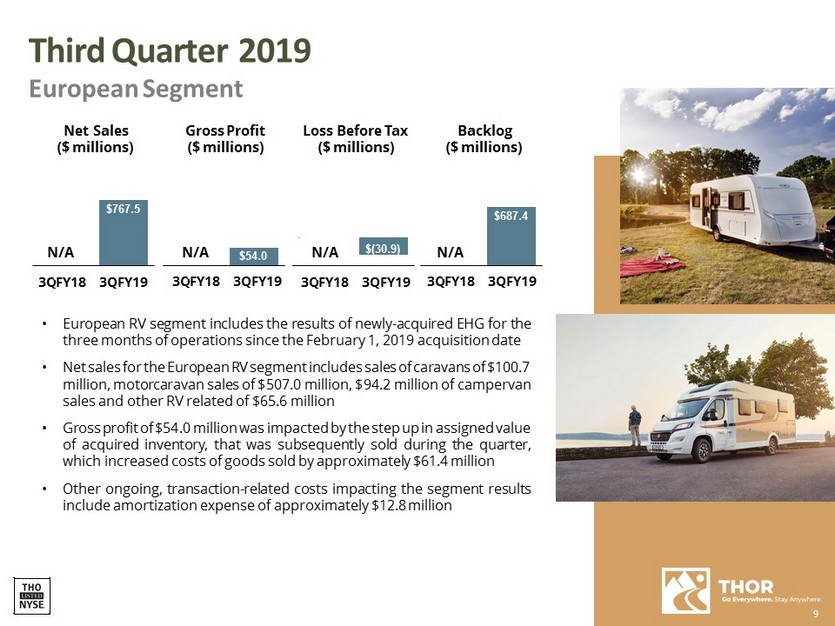
Third Quarter 2019 European Segment • European RV segment includes the results of newly - acquired EHG for the three months of operations since the February 1 , 2019 acquisition date • Net sales for the European RV segment includes sales of caravans of $ 100 . 7 million, motorcaravan sales of $ 507 . 0 million, $ 94 . 2 million of campervan sales and other RV related of $ 65 . 6 million • Gross profit of $ 54 . 0 million was impacted by the step up in assigned value of acquired inventory, that was subsequently sold during the quarter, which increased costs of goods sold by approximately $ 61 . 4 million • Other ongoing, transaction - related costs impacting the segment results include amortization expense of approximately $ 12 . 8 million Net Sales ($ millions) $767.5 Loss Before Tax ($ millions) $(30.9) Gross Profit ($ millions) $54.0 Backlog ($ millions) 9 3 Q $ F — Y18 3QFY19 $687.4 N/A N/A N/A N/A 3 Q $ F — Y18 3QFY19 3 Q $ F — Y18 3QFY19 3 Q $ F — Y18 3QFY19
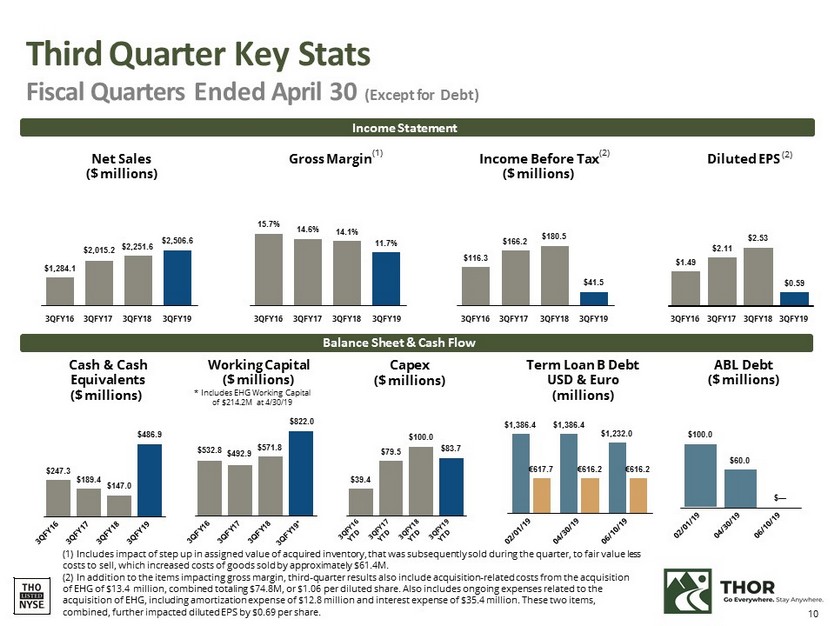
Third Quarter Key Stats Fiscal Quarters Ended April 30 (Except for Debt) Income Statement Net Sales ($ millions) 3QFY16 3QFY17 3QFY18 3QFY19 $1,284.1 $2,015.2 $2,251.6 $2,506.6 3QFY18 3QFY19 $ 11 6.3 $166.2 $180.5 $41.5 3QFY16 3QFY17 3QFY18 3QFY19 3QFY16 3QFY17 15.7% 14.6% 14.1% 11 .7% 3QFY16 3QFY17 3QFY18 3QFY19 $1.49 $2. 1 1 $2.53 $0.59 Cash & Cash Equivalents ( $ millions) $247.3 $189.4 $147.0 $486.9 Balance Sheet & Cash Flow Capex ($ millions) $39.4 $79.5 $100.0 $83.7 $532.8 $492.9 $571.8 (1) Includes impact of step up in assigned value of acquired inventory, that was subsequently sold during the quarter, to fair value less costs to sell, which increased costs of goods sold by approximately $61.4M. (2) In addition to the items impacting gross margin, third - quarter results also include acquisition - related costs from the acquisition of EHG of $13.4 million, combined totaling $74.8M, or $1.06 per diluted share. Also includes ongoing expenses related to the acquisition of EHG, including amortization expense of $12.8 million and interest expense of $35.4 million. These two items, combined, further impacted diluted EPS by $0.69 per share. Working Capital ($ millions) * Includes EHG Working Capital of $214.2M at 4/30/19 $822.0 Gross Margin (1) Income Before Tax (2) ($ millions) Diluted EPS (2) Term Loan B Debt USD & Euro (millions) $1,386.4 $1,386.4 $1,232.0 €617.7 €616.2 €616.2 ABL Debt ($ millions) 10 $100.0 $60.0 $ —
Overview & Current Industry Conditions 11
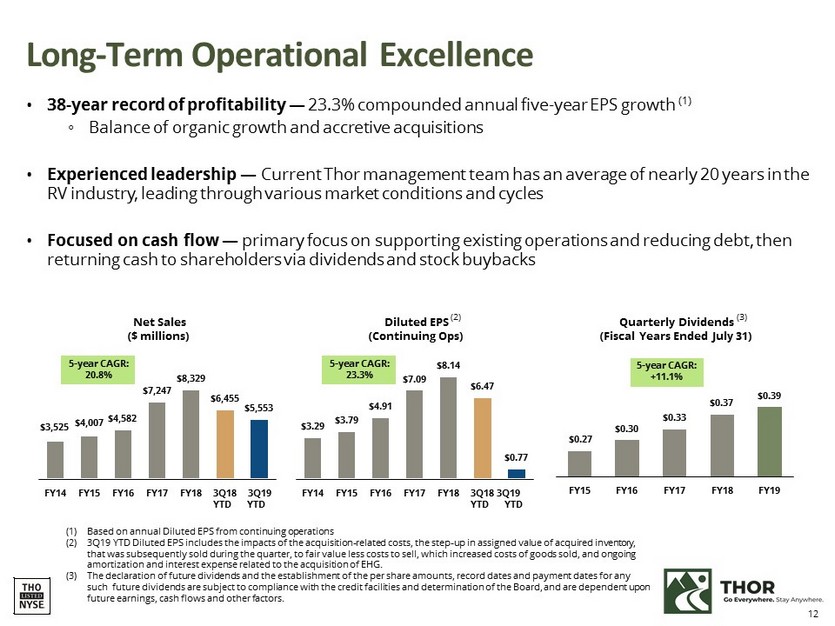
FY15 FY16 FY17 FY18 FY19 $0.30 $0.33 $0.37 $0.39 Long - Term Operational Excellence • 38 - year record of profitability — 23.3% compounded annual five - year EPS growth (1) ◦ Balance of organic growth and accretive acquisitions • Experienced leadership — Current Thor management team has an average of nearly 20 years in the RV industry, leading through various market conditions and cycles • Focused on cash flow — primary focus on supporting existing operations and reducing debt, then returning cash to shareholders via dividends and stock buybacks (1) Based on annual Diluted EPS from continuing operations (2) 3Q19 YTD Diluted EPS includes the impacts of the acquisition - related costs, the step - up in assigned value of acquired inventory, that was subsequently sold during the quarter, to fair value less costs to sell, which increased costs of goods sold, and ongoing amortization and interest expense related to the acquisition of EHG. (3) The declaration of future dividends and the establishment of the per share amounts, record dates and payment dates for any such future dividends are subject to compliance with the credit facilities and determination of the Board, and are dependent upon future earnings, cash flows and other factors. Net Sales ($ millions) FY14 FY15 FY16 $3,525 $4,007 $4,582 $7,247 $8,329 $6,455 $5,553 FY17 FY18 3Q18 3Q19 FY14 FY15 FY16 FY17 FY18 YTD YTD 12 3Q18 3Q19 YTD YTD $3.29 $3.79 $4.91 $7.09 $8.14 $6.47 $0.27 $0.77 5 - year CAGR: 20.8% 5 - year CAGR: 23.3% 5 - year CAGR: +11.1% Diluted EPS (2) (Continuing Ops) Quarterly Dividends (3) (Fiscal Years Ended July 31)
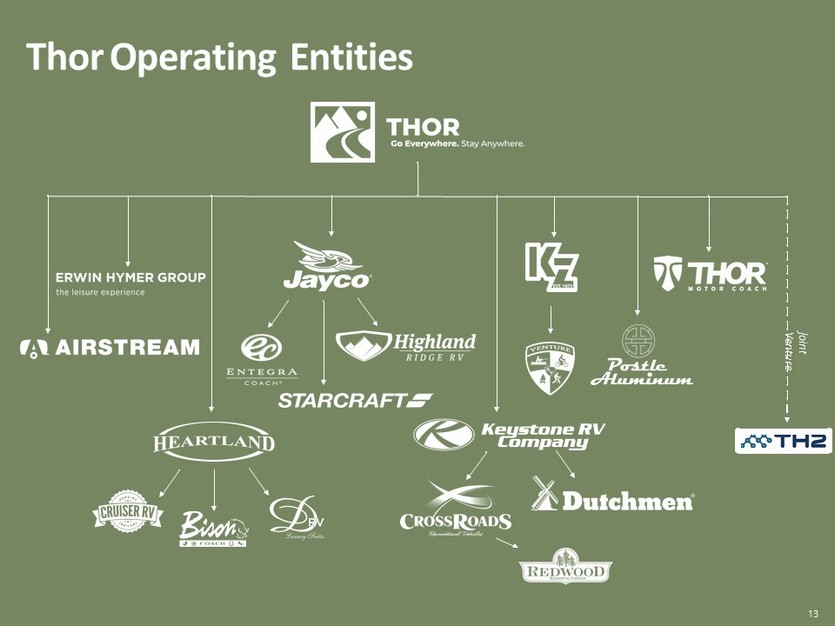
Thor Operating Entities Joint V entu r e 13
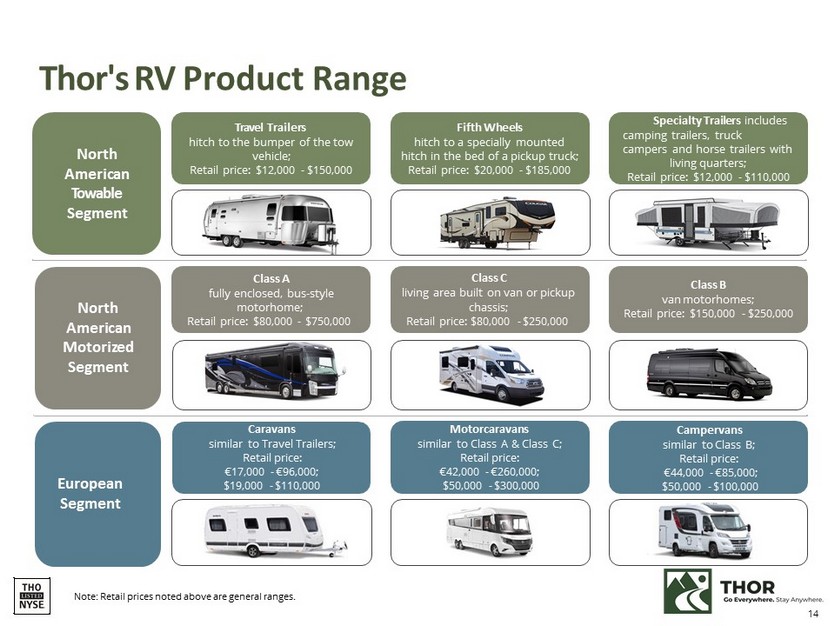
Thor's RV Product Range North Ameri c an Towable Segment North American Mo t ori z ed Segment Note: Retail prices noted above are general ranges. Class A fully enclosed, bus - style Retail price: $80,000 - motorhome; $750,000 Class C living area built on van or pickup Retail price: $80,000 chassis; - $250,000 Class B van motorhomes; Retail price: $150,000 - $250,000 Specialty Trailers includes camping trailers, truck campers and horse trailers with living quarters; Retail price: $12,000 - $110,000 Travel Trailers hitch to the bumper of the tow vehicle; Retail price: $12,000 - $150,000 Fifth Wheels hitch to a specially mounted hitch in the bed of a pickup truck; Retail price: $20,000 - $185,000 European Segment Caravans similar to Travel Trailers; Retail price: €17,000 - €96,000; $19,000 - $110,000 Motorcaravans similar to Class A & Class C; Retail price: €42,000 - €260,000; $50,000 - $300,000 Campervans similar to Class B; Retail price: €44,000 - €85,000; $50,000 - $100,000 14
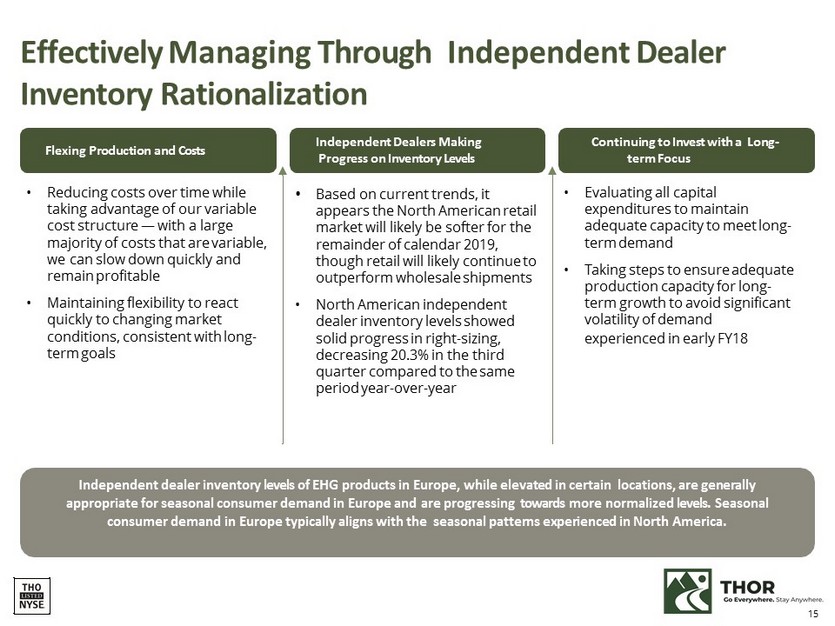
Effectively Managing Through Independent Dealer Inventory Rationalization Flexing Production and Costs Independent Dealers Making Progress on Inventory Levels Continuing to Invest with a Long - term Focus • Based on current trends, it appears the North American retail market will likely be softer for the remainder of calendar 2019, though retail will likely continue to outperform wholesale shipments • North American independent dealer inventory levels showed solid progress in right - sizing, decreasing 20.3% in the third quarter compared to the same period year - over - year • Evaluating all capital expenditures to maintain adequate capacity to meet long - term demand • Taking steps to ensure adequate production capacity for long - term growth to avoid significant volatility of demand experienced in early FY18 • Reducing costs over time while taking advantage of our variable cost structure — with a large majority of costs that are variable, we can slow down quickly and remain profitable • Maintaining flexibility to react quickly to changing market conditions, consistent with long - term goals Independent dealer inventory levels of EHG products in Europe, while elevated in certain locations, are generally appropriate for seasonal consumer demand in Europe and are progressing towards more normalized levels. Seasonal consumer demand in Europe typically aligns with the seasonal patterns experienced in North America. 15
Healthy North American RV Channel 16 Independent Dealer Inventory Approaching Normalized Levels: • Following inventory shortages in FY 17 , independent dealers ordered aggressively in early FY 18 • Although retail demand grew modestly in calendar 2018 , that growth was not sufficient to bring independent dealer inventory levels down • Thor responded by reducing production levels to meet current demand • Average age of RV inventory on independent dealer lots remains healthy • Used inventory levels generally remain low, supporting trade - in values and demand for new RVs Wholesale Financing Prompting Better Inventory Management: • Credit broadly available • Normal seasonal credit line utilization • Lenders remain disciplined with curtailments, which combined with modestly higher interest rates is motivating independent dealers to focus on turning inventory Retail Financing is Supportive of Growth: • Credit broadly available • Lenders remain disciplined on down payments and terms • Minimal sub - prime exposure ; RV loan delinquency rates among the lowest of consumer loans tracked by the American Bankers Association, most recently at 0 . 77 % in the fourth quarter of 2018 1 (1) Source: American Bankers Association ABA Report, April 2019
North 
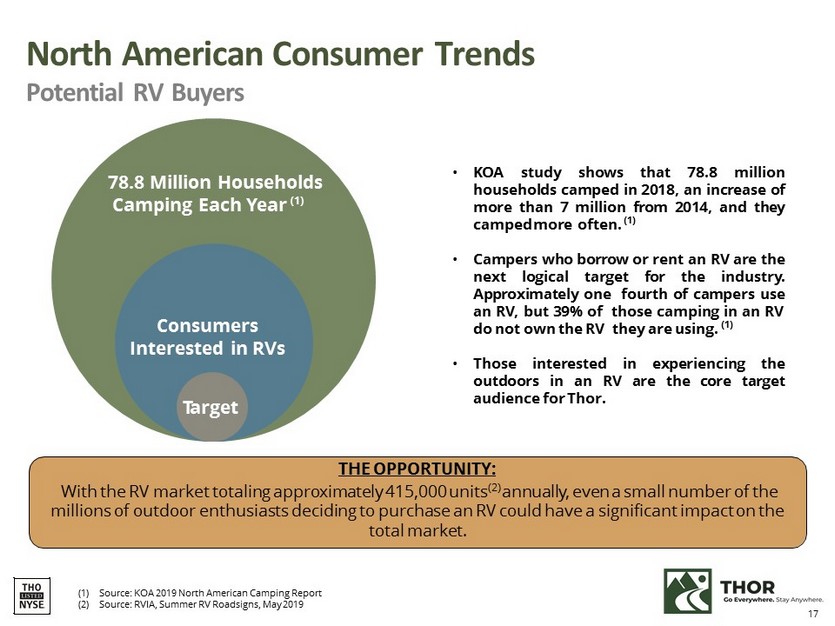
American Consumer Trends Potential RV Buyers 7 8.8 Million Households Camping Each Year (1) Consumers Interested in RVs T a r get ? KOA study shows that 78 . 8 million households camped in 2018 , an increase of more than 7 million from 2014 , and they camped more often . ( 1 ) ? Campers who borrow or rent an RV are the next logical target for the industry . Approximately o ne fourth of campers use an RV, but 39 % of those camping in an RV do not own the RV they are using . ( 1 ) ? Those interested in experiencing the outdoors in an RV are the core target audience for Thor . (1) Source: KOA 2019 North American Camping Report (2) Source: RVIA, Summer RV Roadsigns, May 2019 THE OPPORTUNITY: With the RV market totaling approximately 415,000 units (2) annually, even a small number of the millions of outdoor enthusiasts deciding to purchase an RV could have a significant impact on the total market. 17
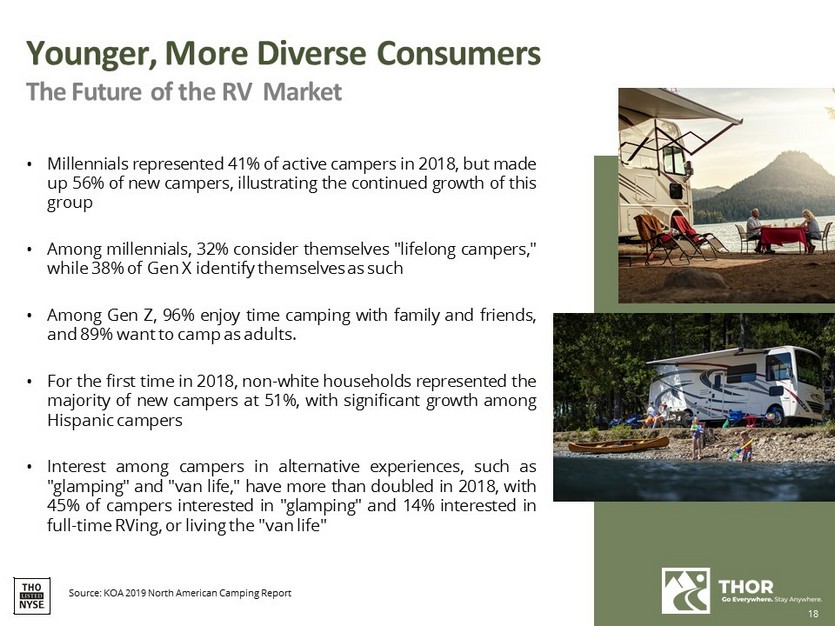
Younger, More Diverse Consumers The Future of the RV Market 18 • Millennials represented 41 % of active campers in 2018 , but made up 56 % of new campers, illustrating the continued growth of this group • Among millennials, 32 % consider themselves "lifelong campers," while 38 % of Gen X identify themselves as such • Among Gen Z, 96 % enjoy time camping with family and friends, and 8 9 % want to camp as adults . • For the first time in 2018 , non - white households represented the majority of new campers at 51 % , with significant growth among Hispanic campers • Interest among campers in alternative experiences, such as "glamping" and "van life," have more than doubled in 2018 , with 45 % of campers interested in "glamping" and 14 % interested in full - time RVing, or living the "van life" Source: KOA 2019 North American Camping Report
Appendix: Financial & Market Data 19
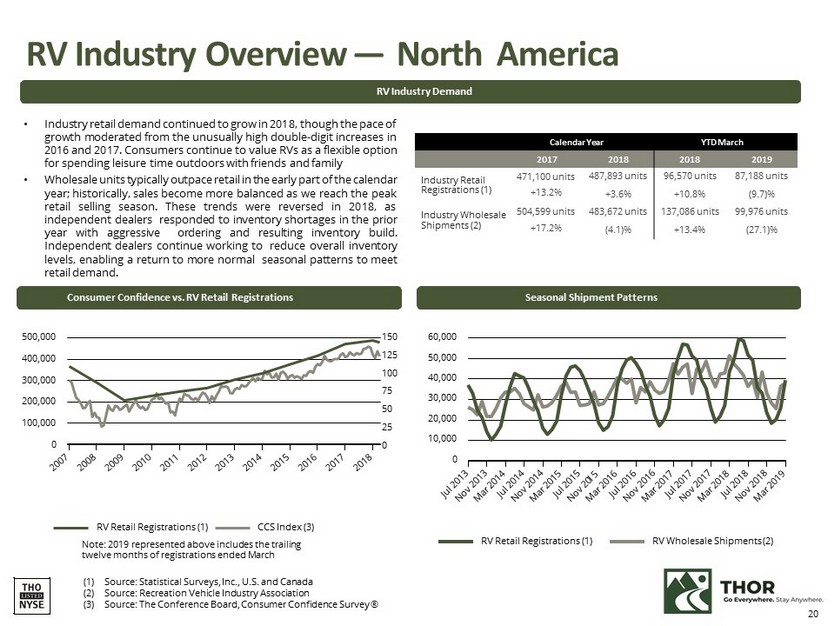
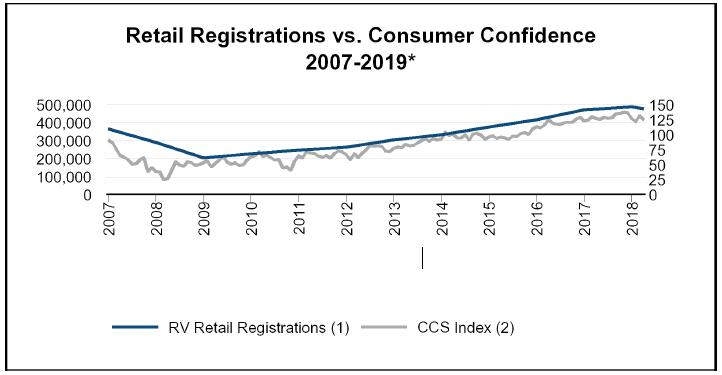
RV Industry Overview — North America Seasonal Shipment Patterns RV Retail Registrations (1) RV Wholesale Shipments (2) 60,000 50,000 40,000 30,000 20,000 10,000 0 RV Industry Demand • Industry retail demand continued to grow in 2018 , though the pace of growth moderated from the unusually high double - digit increases in 2016 and 2017 . Consumers continue to value RVs as a flexible option for spending leisure time outdoors with friends and family • Wholesale units typically outpace retail in the early part of the calendar year ; historically, sales become more balanced as we reach the peak retail selling season . These trends were reversed in 2018 , as independent dealers responded to inventory shortages in the prior year with aggressive ordering and resulting inventory build . Independent d ealers continue working to reduce overall inventory levels, enabling a return to more normal seasonal patterns to meet retail demand . Calendar Year YTD March 2017 2018 2018 2019 Industry Retail 471,100 units 487,893 units 96,570 units 87,188 units Registrations (1) +13.2% +3.6% +10.8% (9.7)% Industry Wholesale 504,599 units 483,672 units 137,086 units 99,976 units Shipments (2) +17.2% (4.1)% +13.4% (27.1)% Consumer Confidence vs. RV Retail Registrations 500,000 400,000 300,000 200,000 100,000 0 20 150 125 100 75 50 25 0 (1) Source: Statistical Surveys, Inc., U.S. and Canada (2) Source: Recreation Vehicle Industry Association (3) Source: The Conference Board, Consumer Confidence Survey ® RV Retail Registrations (1) CCS Index (3) Note: 2019 represented above includes the trailing twelve months of registrations ended March
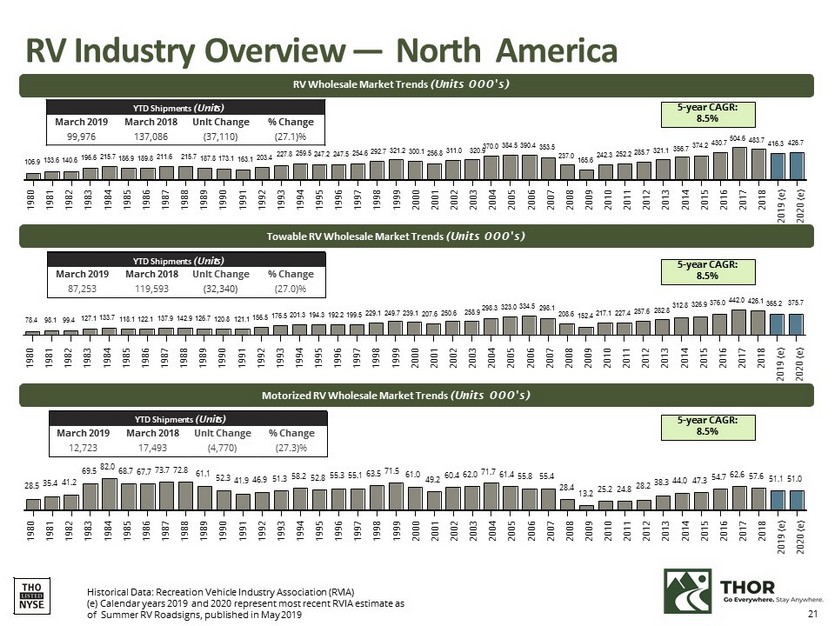
21 RV Industry Overview — North America RV Wholesale Market Trends (Units 000's) 1980 1981 1982 1983 1984 1985 1986 1987 1988 1989 1990 1991 1992 1993 1994 1995 1996 1997 1998 1999 2000 2001 2002 2003 2004 2005 2006 2007 2008 2009 2010 2011 2012 2013 2014 2015 2016 2017 2018 2019 (e) 2020 (e) 106.9 133.6 140.6 196.6 215.7 186.9 189.8 211.6 215.7 187.8 173.1 163.1 203.4 227.8 259.5 247.2 247.5 254.6 292.7 321.2 300.1 256.8 311.0 320.9 370.0 384.5 390.4 353.5 237.0 165.6 242.3 252.2 285.7 321.1 356.7 374.2 430.7 504.6 483.7 416.3 426.7 Towable RV Wholesale Market Trends (Units 000's) YTD Shipments (Units) March 2019 99,976 March 2018 137,086 Unit Change (37,110) % Change (27.1)% 1980 1981 1982 1983 1984 1985 1986 1987 1988 1989 1990 1991 1992 1993 1994 1995 1996 1997 1998 1999 2000 2001 2002 2003 2004 2005 2006 2007 2008 2009 2010 2011 2012 2013 2014 2015 2016 2017 2018 2019 (e) 2020 (e) 78.4 98.1 99.4 127.1 133.7 118.1 122.1 137.9 142.9 126.7 120.8 121.1 156.5 176.5 201.3 194.3 192.2 199.5 229.1 249.7 239.1 207.6 250.6 258.9 298.3 323.0 334.5 298.1 208.6 152.4 217.1 227.4 257.6 282.8 312.8 326.9 376.0 442.0 426.1 365.2 375.7 YTD Shipments (Units) March 2019 87,253 March 2018 119,593 Unit Change (32,340) % Change (27.0)% Motorized RV Wholesale Market Trends (Units 000's) 1980 1981 1982 1983 1984 1985 1986 1987 1988 1989 1990 1991 1992 1993 1994 1995 1996 1997 1998 1999 2000 2001 2002 2003 2004 2005 2006 2007 2008 2009 2010 2011 2012 2013 2014 2015 2016 2017 2018 2019 (e) 2020 (e) 28.5 35.4 41.2 69.5 82.0 68.7 67.7 73.7 72.8 61.1 52.3 41.9 46.9 51.3 58.2 52.8 55.3 55.1 63.5 71.5 61.0 49.2 60.4 62.0 71.7 61.4 55.8 55.4 28.4 13.2 25.2 24.8 28.2 38.3 44.0 47.3 54.7 62.6 57.6 51.1 51.0 YTD Shipments (Units) March 2019 12,723 March 2018 17,493 Unit Change (4,770) % Change (27.3)% Historical Data: Recreation Vehicle Industry Association (RVIA) (e) Calendar years 2019 and 2020 represent most recent RVIA estimate as of Summer RV Roadsigns, published in May 2019 5 - year CAGR: 8.5% 5 - year CAGR: 8.5% 5 - year CAGR: 8.5%
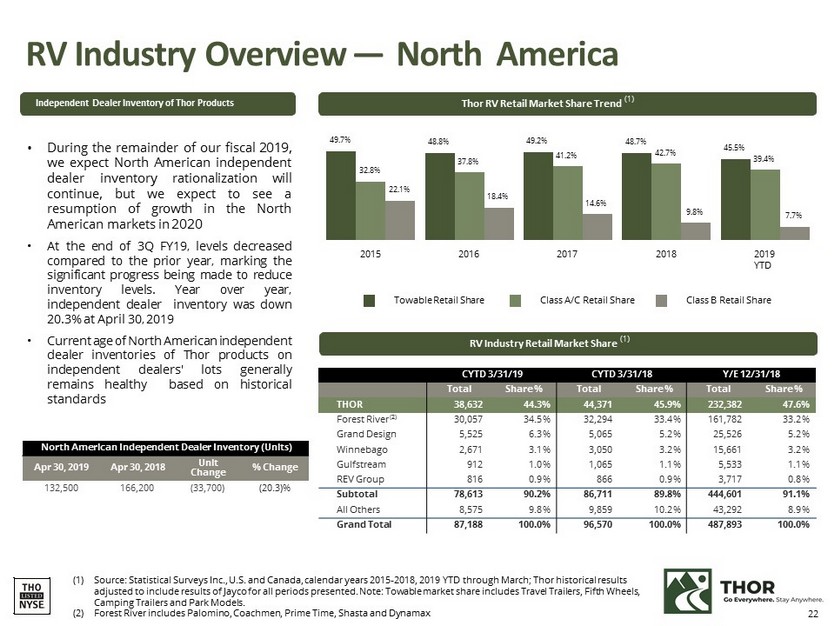
22 RV Industry Overview — North America Thor RV Retail Market Share Trend (1) Independent Dealer Inventory of Thor Products RV Industry Retail Market Share (1) (1) Source: Statistical Surveys Inc., U.S. and Canada, calendar years 2015 - 2018, 2019 YTD through March; Thor historical results adjusted to include results of Jayco for all periods presented. Note: Towable market share includes Travel Trailers, Fifth Wheels, Camping Trailers and Park Models. (2) Forest River includes Palomino, Coachmen, Prime Time, Shasta and Dynamax Towable Retail Share Class A/C Retail Share Class B Retail Share 2015 2016 2017 2018 2019 YTD 49.7% 48.8% 49.2% 48.7% 45.5% 32.8% 37.8% 41.2% 42.7% 39.4% 22.1% 18.4% 14.6% 9.8% 7.7% • During the remainder of our fiscal 2019 , we expect North American independent dealer inventory rationalization will continue, but we expect to see a resumption of growth in the North American markets in 2020 • At the end of 3 Q FY 19 , levels decreased compared to the prior year, marking the significant progress being made to reduce inventory levels . Year over year , independent dealer inventory was down 20 . 3 % at April 30 , 2019 • Current age of North American independent dealer inventories of Thor products on independent dealers' lots generally remains healthy based on historical standards 132,500 166,200 (33,700) (20.3)% North American Independent Dealer Inventory (Units) Apr 30, 2019 Apr 30, 2018 Unit Change % Change CYTD 3/31/19 CYTD 3/31/18 Y/E 12/31/18 Total Share % Total Share % Total Share % THOR 38,632 44.3% 44,371 45.9% 232,382 47.6% Forest River (2) 30,057 34. 5 % 32,294 33. 4 % 161,782 33. 2 % Grand Design 5,525 6. 3 % 5,065 5. 2 % 25,526 5. 2 % Winnebago 2,671 3. 1 % 3,050 3. 2 % 15,661 3. 2 % Gulfstream 912 1. 0 % 1,065 1. 1 % 5,533 1. 1 % REV Group 816 0. 9 % 866 0. 9 % 3,717 0. 8 % Subtotal 78,613 90.2% 86,711 89.8% 444,601 91.1% All Others 8,575 9. 8 % 9,859 10. 2 % 43,292 8. 9 % Grand Total 87,188 100.0% 96,570 100.0% 487,893 100.0%
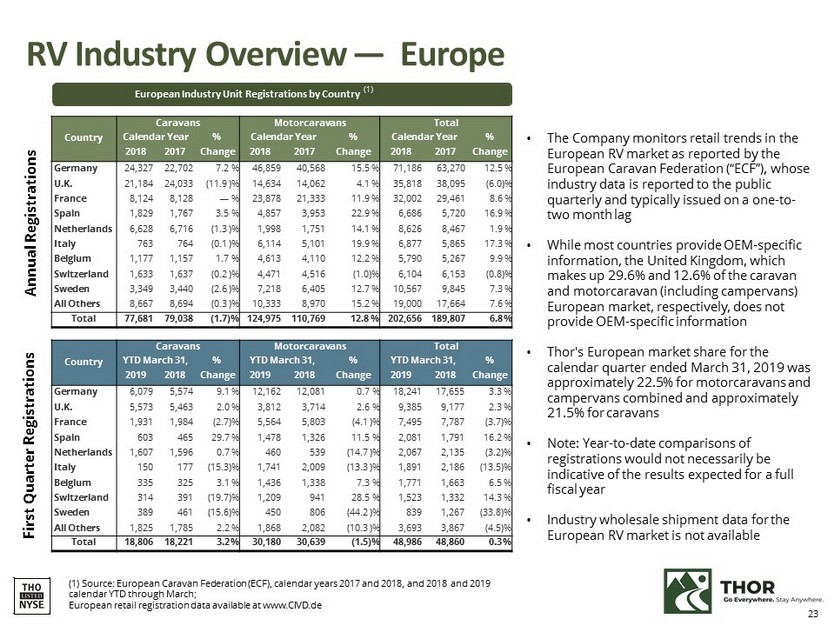
RV Industry Overview — Europe Country Caravans YTD March 31, % 2019 2018 Change Motorcaravans YTD March 31, % 2019 2018 Change Total YTD March 31, % 2019 2018 Change Germany 6,079 5,574 9.1 % 12,162 12,081 0.7 % 18,241 17,655 3.3 % U.K. 5,573 5,463 2.0 % 3,812 3,714 2.6 % 9,385 9,177 2.3 % France 1,931 1,984 (2.7)% 5,564 5,803 (4.1 )% 7,495 7,787 (3.7)% Spain 603 465 29.7 % 1,478 1,326 11.5 % 2,081 1,791 16.2 % Netherlands 1,607 1,596 0.7 % 460 539 (14.7 )% 2,067 2,135 (3.2)% Italy 150 177 (15.3)% 1,741 2,009 (13.3 )% 1,891 2,186 (13.5)% Belgium 335 325 3.1 % 1,436 1,338 7.3 % 1,771 1,663 6.5 % Switzerland 314 391 (19.7)% 1,209 941 28.5 % 1,523 1,332 14.3 % Sweden 389 461 (15.6)% 450 806 (44.2 )% 839 1,267 (33.8)% All Others 1,825 1,785 2.2 % 1,868 2,082 (10.3 )% 3,693 3,867 (4.5)% Total 18,806 18,221 3.2 % 30,180 30,639 (1.5)% 48,986 48,860 0.3 % Country Caravans Calendar Year % 2018 2017 Change Motorcaravans Calendar Year % 2018 2017 Change Total Calendar Year % 2018 2017 Change Germany 24,327 22,702 7.2 % 46,859 40,568 15.5 % 71,186 63,270 12.5 % U.K. 21,184 24,033 (11.9 )% 14,634 14,062 4.1 % 35,818 38,095 (6.0)% France 8,124 8,128 — % 23,878 21,333 11.9 % 32,002 29,461 8.6 % Spain 1,829 1,767 3.5 % 4,857 3,953 22.9 % 6,686 5,720 16.9 % Netherlands 6,628 6,716 (1.3 )% 1,998 1,751 14.1 % 8,626 8,467 1.9 % Italy 763 764 (0.1 )% 6,114 5,101 19.9 % 6,877 5,865 17.3 % Belgium 1,177 1,157 1.7 % 4,613 4,110 12.2 % 5,790 5,267 9.9 % Switzerland 1,633 1,637 (0.2 )% 4,471 4,516 (1.0)% 6,104 6,153 (0.8)% Sweden 3,349 3,440 (2.6 )% 7,218 6,405 12.7 % 10,567 9,845 7.3 % All Others 8,667 8,694 (0.3 )% 10,333 8,970 15.2 % 19,000 17,664 7.6 % Total 77,681 79,038 (1.7)% 124,975 110,769 12.8 % 202,656 189,807 6.8 % Annual Regist r ations 23 European Industry Unit Registrations by Country (1) • The Company monitors retail trends in the European RV market as reported by the European Caravan Federation (“ECF”), whose industry data is reported to the public quarterly and typically issued on a one - to - two month lag • While most countries provide OEM - specific information, the United Kingdom, which makes up 29.6% and 12.6% of the caravan and motorcaravan (including campervans) European market, respectively, does not provide OEM - specific information • Thor's European market share for the calendar quarter ended March 31, 2019 was approximately 22.5% for motorcaravans and campervans combined and approximately 21.5% for caravans • Note: Year - to - date comparisons of registrations would not necessarily be indicative of the results expected for a full fiscal year • Industry wholesale shipment data for the European RV market is not available (1) Source: European Caravan Federation (ECF), calendar years 2017 and 2018, and 2018 and 2019 calendar YTD through March ; European retail registration data available at www.CIVD.de First Quarter Regist r ations
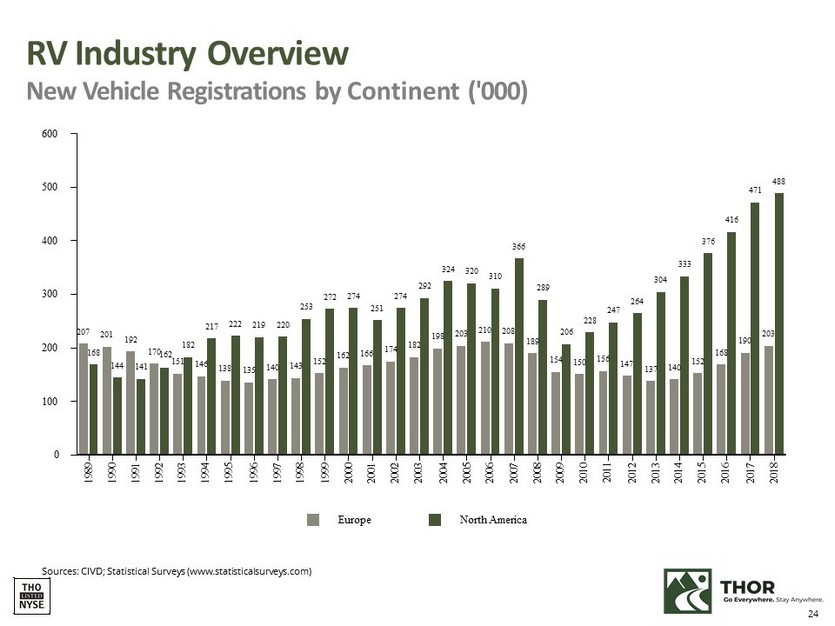
Sources: CIVD; Statistical Surveys (www.statisticalsurveys.com) RV Industry Overview New Vehicle Registrations by Continent ('000) Europe North America 600 24 500 400 300 200 100 0 1989 1990 1991 1992 1993 1994 1995 1996 1997 1998 1999 2000 2001 2002 2003 2004 2005 2006 2007 2008 2009 2010 20 1 1 2012 2013 2014 2015 2016 2017 2018 207 201 192 151 146 138 135 140 143 152 162 166 174 182 198 203 210 208 189 154 150 156 147 137 140 152 168 190 203 168 144 141 17 0 162 182 217 222 219 220 253 272 274 251 274 292 324 320 310 366 289 206 228 247 264 304 333 376 416 471 488
www.thorindustries.com
Exhibit 99.3
601 East Beardsley Avenue, Elkhart, Indiana 46514-3305
Third Quarter 2019 Investor Questions & Answers
Published June 10, 2019
Forward Looking Statements
This document includes certain statements that are “forward looking” statements within the meaning of the U.S. Private Securities Litigation Reform Act of 1995, Section 27A of the Securities Act of 1933, as amended, and Section 21E of the Securities Exchange Act of 1934, as amended. These forward looking statements are made based on management’s current expectations and beliefs regarding future and anticipated developments and their effects upon Thor, and inherently involve uncertainties and risks. These forward looking statements are not a guarantee of future performance. We cannot assure you that actual results will not differ materially from our expectations. Factors which could cause materially different results include, among others, raw material and commodity price fluctuations; raw material, commodity or chassis supply restrictions; the impact of tariffs on material or other input costs; the level and magnitude of warranty claims incurred; legislative, regulatory and tax law and/or policy developments including their potential impact on our dealers and their retail customers or on our suppliers; the costs of compliance with governmental regulation; legal and compliance issues including those that may arise in conjunction with recently completed transactions; lower consumer confidence and the level of discretionary consumer spending; interest rate fluctuations; the potential impact of interest rate fluctuations on the general economy and specifically on our dealers and consumers; restrictive lending practices; management changes; the success of new and existing products and services; consumer preferences; the ability to efficiently utilize production facilities; the pace of acquisitions and the successful closing, integration and financial impact thereof; the potential loss of existing customers of acquisitions; our ability to retain key management personnel of acquired companies; a shortage of necessary personnel for production; the loss or reduction of sales to key dealers; disruption of the delivery of units to dealers; increasing costs for freight and transportation; asset impairment charges; cost structure changes; competition; the impact of potential losses under repurchase or financed receivable agreements; the potential impact of the strength of the U.S. dollar on international demand for products priced in U.S. dollars; general economic, market and political conditions; the impact of changing emissions standards in the various jurisdictions in which our products are sold; and changes to investment and capital allocation strategies or other facets of our strategic plan. Additional risks and uncertainties surrounding the acquisition of Erwin Hymer Group SE ("EHG") include risks regarding the potential benefits of the acquisition and the anticipated operating synergies, the integration of the business, the impact of exchange rate fluctuations and unknown or understated liabilities related to the acquisition and EHG's business. These and other risks and uncertainties are discussed more fully in Item 1A of our Annual Report on Form 10-K for the year ended July 31, 2018 and Part II, Item 1A of our quarterly reports on Form 10-Q for the periods ended January 31, 2019 and April 30, 2019.
We disclaim any obligation or undertaking to disseminate any updates or revisions to any forward looking statements contained in this document or to reflect any change in our expectations after the date hereof or any change in events, conditions or circumstances on which any statement is based, except as required by law.
1
Executive Overview
▪ | Increase in net sales for the third quarter reflects the acquisition of Erwin Hymer Group (EHG) which was completed at the start of the third quarter, with European RV segment contributing $767.5 million in net sales. |
▪ | Financial results for the third quarter include acquisition-related costs and purchase accounting adjustments related to the EHG acquisition. In addition, the Company incurred costs related to the acquisition that will be ongoing, including amortization expense and interest expense. |
▪ | Continued rationalization in North American independent dealer inventory levels supports positive outlook for the North American industry supported by long-term favorable demand trends |
▪ | To date, the Company has paid approximately $255 million of principal on the debt incurred to finance the EHG acquisition, including paying down all $100 million outstanding on its asset-based credit facility (ABL) and approximately $155 million of its term loan. |
For the third quarter fiscal 2019:
▪ | Net sales increased 11.3% to $2.51 billion |
▪ | Gross profit decreased 7.7% to $292.4 million |
▪ | Income before income taxes decreased to $41.5 million |
▪ | Diluted EPS decreased to $0.59 |
▪ | Third-quarter results include acquisition-related costs and purchase accounting adjustments related to the EHG acquisition, which total $74.8 million with a diluted EPS impact of $1.06 per share |
▪ | During the quarter, the Company also incurred other ongoing expenses related to the acquisition of EHG, including amortization expense of $12.8 million and interest expense of $35.4 million. These two items, combined, further impacted diluted EPS by $0.69 per share. |
Outlook:
▪ | Based on current trends, it appears the North American retail market will likely be softer for the remainder of calendar 2019, though retail will likely continue to outperform wholesale shipments, supporting the continued independent dealer inventory rationalization. We expect a resumption of growth in North America in 2020. |
▪ | In Europe, we believe our independent dealer inventory levels of EHG products, while elevated in certain locations, are generally appropriate for seasonal consumer demand in Europe and are progressing towards more normalized levels. Seasonal consumer demand in Europe typically aligns with the seasonal patterns experienced in the North American market. |
Planning assumptions reflect:
▪ | Positive long-term RV industry fundamentals in both North America and Europe. This assumption is supported by favorable demographics, high consumer confidence rates, generally favorable employment and wage trends, adequate availability of credit at historically low rates and a healthy housing market. |
▪ | High long-term independent dealer optimism in both North America and Europe. Independent dealer optimism remains high as demand continues to be driven by favorable demographic and lifestyle growth trends, including the ongoing strength of baby boomer customers, as well as first-time and younger buyers. Many dealers, particularly larger dealers in North America, continue to invest in their business with new or expanded locations. |
▪ | Challenging wholesale conditions in the North American market. Due to unusually strong independent dealer order and wholesale delivery patterns experienced in fiscal 2018 in North America and the continuation of independent dealer inventory rationalization, we experienced tougher year-over-year comparisons in fiscal 2019 related to our North American segments. We also experienced greater gross margin pressure in the first nine months of the year in our North American segments as a result of the lower sales. |
▪ | European RV segment results impacted by various factors in the third quarter. European RV segment gross profit was reduced by purchase accounting adjustments for acquired inventory, that was subsequently sold during the quarter, that reduced gross profit by $61.4 million, or 8.0% of segment net sales. European RV segment income before income taxes was also impacted by amortization expense of $12.8 million related to acquired intangible assets. |
2
▪ | Impact of transaction costs on our diluted EPS in FY 2019. During the third quarter, Thor incurred $13.4 million in net expenses related to the acquisition of EHG, including $16.3 million primarily consisting of bank fees, professional and advisory integration fees and the write off of the remaining unamortized debt fees related to Thor's previous asset-based facility, but partially offset by the $2.9 million favorable change in value of the foreign currency forward contract. Remaining transaction-related costs in the range of $5.0 to $7.0 million are expected to impact fiscal fourth-quarter results. |
▪ | Effective tax rate. Our effective tax rate for the third quarter was 24.3%, compared to an effective tax rate of 25.9% in the same period during the prior year. The Company expects an overall effective income tax rate of between 21% and 23% in its fourth quarter of fiscal 2019, before consideration of any discrete or unusual tax items. |
▪ | Ongoing acquisition-related expenses. In the third quarter, the Company also incurred other ongoing expenses related to the EHG acquisition including the amortization expense of $12.8 million related to acquired intangible assets noted above, and interest expense of $35.4 million. |
3
Quick Reference to Contents
A. | Consolidated Financial Highlights | 5 |
B. | Summary of Key Quarterly Segment Data – North American Towable RVs | 6 |
C. | Summary of Key Quarterly Segment Data – North American Motorized RVs | 7 |
D. | Summary of Key Quarterly Segment Data – European RVs | 8 |
E. | Third Quarter Operating Results | 9 |
F. | Current Hot Topics | 11 |
a. Acquisition of EHG | 11 | |
b. Trade Tariffs | 13 | |
G. | Drivers of Demand | 13 |
a. Key Consumer Trends | 13 | |
H. | Current Market Conditions | 14 |
a. North American Market | 14 | |
b. European Market | 14 | |
c. Competitive Environment | 15 | |
d. Consolidation of Independent Dealer Base | 15 | |
e. Management Changes | 15 | |
I. | Balance Sheet and Cash Flow | 16 |
J. | Key Economic Indicators | 17 |
K. | Outlook | 18 |
4
Consolidated Financial Highlights
3Q data is as of April 30, 2019 and 2018; FY data is as of or for the applicable fiscal year ended July 31; debt as of dates shown
(1) Includes impact of step up in assigned value of acquired inventory, subsequently sold during the quarter, to fair value less costs to sell, which increased costs of goods sold by approximately $61.4M
(2) In addition to the items impacting gross margin, third-quarter results also include acquisition-related costs from the acquisition of EHG of $13.4 million, combined totaling $74.8M, or $1.06 per diluted share. Also includes ongoing expenses related to the acquisition of EHG, including amortization expense of $12.8 million and interest expense of $35.4 million. These two items, combined, further impacted diluted EPS by $0.69 per share.
(3) Also paid down approximately $155 million in principal on the Term Loan B, to date.
5
Summary of Key Quarterly Segment Data – North American Towable RVs
Three Months Ended | Three Months Ended | % | ||||||||||
April 30, 2019 | April 30, 2018 | Change | ||||||||||
NET SALES: | ||||||||||||
North American Towables | ||||||||||||
Travel Trailers and Other | $ | 734,028 | $ | 978,906 | (25.0 | )% | ||||||
Fifth Wheels | 503,227 | 629,308 | (20.0 | )% | ||||||||
Total North American Towables | $ | 1,237,255 | $ | 1,608,214 | (23.1 | )% |
Three Months Ended | Three Months Ended | % | ||||||||||
April 30, 2019 | April 30, 2018 | Change | ||||||||||
# OF UNITS: | ||||||||||||
North American Towables | ||||||||||||
Travel Trailers and Other | 35,226 | 50,164 | (29.8 | )% | ||||||||
Fifth Wheels | 10,619 | 14,502 | (26.8 | )% | ||||||||
Total North American Towables | 45,845 | 64,666 | (29.1 | )% |
As
of April 30, 2019 | As
of April 30, 2018 | % Change | ||||||||||
ORDER BACKLOG: | ||||||||||||
North American Towables | $ | 896,024 | $ | 1,304,836 | (31.3 | )% |
Calendar Quarter Ended March 31, | ||||||||||||
2019 | 2018 | |||||||||||
MARKET SHARE SUMMARY (a) | ||||||||||||
U.S. Market | 45.2 | % | 46.4 | % | ||||||||
Canadian Market | 52.1 | % | 53.6 | % | ||||||||
Combined North American Market | 45.5 | % | 46.8 | % |
(a) | Source: Statistical Surveys, Inc. YTD March 31, 2019 vs. YTD March 31, 2018 |
Note: Data reported by Stat Surveys is based on official state and provincial records. This information is subject to adjustment and is continuously updated, and is often impacted by delays in reporting by various states or provinces.
Thor Unit Shipments versus Industry
Our North American Towable unit shipments for the quarter decreased by 29.1%. According to statistics published by the Recreational Vehicle Industry Association (RVIA), for the three months ended April 30, 2019, combined industry travel trailer and fifth wheel wholesale unit shipments decreased 18.7% compared to the same period last year. According to statistics published by Stat Surveys for the three-month periods ended March 31, 2019 and 2018, our North American market share for travel trailers and fifth wheels combined was 46.4% and 47.8%, respectively. Comparisons of Company shipments to industry shipments on a quarterly basis would not necessarily be indicative of the results expected for a full fiscal year.
6
Summary of Key Quarterly Segment Data – North American Motorized RVs
Three Months Ended | Three Months Ended | % | ||||||||||
April 30, 2019 | April 30, 2018 | Change | ||||||||||
NET SALES: | ||||||||||||
North American Motorized | ||||||||||||
Class A | $ | 201,927 | $ | 273,095 | (26.1 | )% | ||||||
Class C | 242,912 | 301,303 | (19.4 | )% | ||||||||
Class B | 14,399 | 24,061 | (40.2 | )% | ||||||||
Total North American Motorized | $ | 459,238 | $ | 598,459 | (23.3 | )% |
Three Months Ended | Three Months Ended | % | ||||||||||
April 30, 2019 | April 30, 2018 | Change | ||||||||||
# OF UNITS: | ||||||||||||
North American Motorized | ||||||||||||
Class A | 1,657 | 2,471 | (32.9 | )% | ||||||||
Class C | 3,522 | 4,669 | (24.6 | )% | ||||||||
Class B | 98 | 176 | (44.3 | )% | ||||||||
Total North American Motorized | 5,277 | 7,316 | (27.9 | )% |
As
of April 30, 2019 | As
of April 30, 2018 | % Change | ||||||||||
ORDER BACKLOG: | ||||||||||||
North American Motorized | $ | 513,703 | $ | 698,313 | (26.4 | )% |
Calendar Quarter Ended March 31, | ||||||||||||
2019 | 2018 | |||||||||||
MARKET SHARE SUMMARY (a) | ||||||||||||
U.S. Market | 35.4 | % | 39.6 | % | ||||||||
Canadian Market | 39.9 | % | 55.2 | % | ||||||||
Combined North American Market | 35.5 | % | 40.2 | % |
(a) | Source: Statistical Surveys, Inc. YTD March 31, 2019 vs. YTD March 31, 2018 |
Note: Data reported by Stat Surveys is based on official state and provincial records. This information is subject to adjustment and is continuously updated, and is often impacted by delays in reporting by various states or provinces.
Thor Unit Shipments versus Industry
According to statistics published by RVIA, our North American Motorized unit shipments decreased by 27.9% for the quarter, compared to an industry decrease of 24.7% for the three months ended April 30, 2019. According to statistics published by Stat Surveys for the three-month periods ended March 31, 2019 and 2018, our North American market share for motorhomes was 35.5% and 40.2%, respectively. Comparisons of Company shipments to industry shipments on a quarterly basis would not necessarily be indicative of the results expected for a full fiscal year.
7
Summary of Key Quarterly Segment Data – European RVs
Three Months Ended | % of Segment | |||||||
April 30, 2019 | Net Sales | |||||||
NET SALES: | ||||||||
European | ||||||||
Motorcaravan | $ | 506,964 | 66.1 | |||||
Campervan | 94,226 | 12.3 | ||||||
Caravan | 100,741 | 13.1 | ||||||
Other | 65,578 | 8.5 | ||||||
Total European | $ | 767,509 | 100.0 |
Three
Months Ended April 30, 2019 | %
of Segment Net Sales | |||||||
# OF UNITS: | ||||||||
European | ||||||||
Motorcaravan | 9,029 | 51.7 | ||||||
Campervan | 3,218 | 18.4 | ||||||
Caravan | 5,202 | 29.9 | ||||||
Total European | 17,449 | 100.0 |
As
of April 30, 2019 | ||||||||
ORDER BACKLOG: | ||||||||
European | $ | 687,418 |
Calendar Quarter Ended | ||||||||
March 31, 2019 | ||||||||
MARKET SHARE SUMMARY (a) | ||||||||
Motorcaravan and Campervan (1) | 22.5 | % | ||||||
Caravan | 21.5 | % |
(a) | Source: European Caravan Federation (ECF), YTD March 31, 2019 |
Note: Data from the ECF is subject to adjustment and is continuously updated, and is often impacted by delays in reporting by various countries (some countries, including the United Kingdom, do not report OEM-specific data and are thus excluded from the market share calculation).
(1) - The ECF reports motorcaravans and campervans together.
8
Third Quarter Operating Results
1. | Thor reported an increase in consolidated sales of $255.0 million for the third quarter of fiscal 2019 versus the prior year. What factors drove the sales growth? |
A. | The increase in sales for the third quarter was a result of the addition of the revenues of the Erwin Hymer Group which was acquired at the beginning of the third quarter. That acquisition, which is included in the European Recreational Vehicles segment, generated revenues of $767.5 million in the quarter. The increase from the European segment was partially offset by a decrease in sales in the North American Towables and North American Motorized segments which decreased by $371.0 million and $139.2 million, respectively. |
2. | Thor's third quarter gross margin decreased by 240 basis points on a year-over-year basis. What were the main factors causing this result? |
A. | The European RV Segment posted gross margins of 7.0%, which was the main contributor of the decrease in overall gross margin in the third quarter. The gross margin for the European segment included $61.4 million related to the step-up in purchase accounting of acquired inventory that was subsequently sold during the quarter and which was 8.0% of European RV segment sales for the third quarter. North American Towables segment gross margins decreased 30 basis points, from 14.8% in the third quarter of 2018 to 14.5% in the third quarter of 2019, while North American Motorized segment gross margin decreased 50 basis points, from 10.8% to 10.3% during the same period. These decreases were primarily the result of lower fixed cost absorption with the lower segment sales levels, as material, labor and warranty cost as a percent of sales remained generally consistent or slightly better than prior year. |
3. | Can you outline the items that impacted the third quarter results compared to the prior year third quarter? |
A. | For the third quarter, the items to note that impacted the current year results compared to the prior year include: |
▪ | Decrease of gross profit in the European RV segment of $61.4 million related to the step-up in purchase accounting of acquired inventory that was subsequently sold during the period. |
▪ | Transaction expenses totaling $16.3 million which consist primarily of bank fees, professional and advisory integration fees and the write-off of the remaining unamortized debt fees of $3.8 million related to the Company’s previous asset-based facility that was terminated on February 1, 2019. |
▪ | A gain of approximately $2.9 million related to the change in value of the foreign exchange forward contract which settled on February 1, 2019. |
The net impact of all of these items was approximately $74.8 million, or $1.06 per diluted share. All items noted above directly related to the acquisition of EHG on February 1, 2019.
During the quarter, we also incurred other ongoing expenses related to the EHG acquisition:
▪ | Amortization expense of $12.8 million related to acquired intangible assets, and |
▪ | Interest expense of $35.4 million from the debt incurred or acquired in conjunction with the acquisition of EHG. |
4. | On a percentage of sales basis, Thor’s Selling, General and Administrative (SG&A) expenses were up compared to the prior year, at approximately 7.1% compared to 5.3% last year. What were some of the key factors that affected SG&A expenses during the quarter? |
A. | The primary driver of increased SG&A expenses in the third quarter was the addition of the European segment SG&A of approximately $67.8 million for the quarter. Partially offsetting this increase, SG&A expenses for the North American RV Segments decreased by approximately $17.4 million in the quarter primarily due to the lower North American sales. Combined, these factors, plus the lower sales volume from North American operations, drove the higher SG&A costs as a percentage of net sales. |
9
5. | Thor reported a decline in income before income taxes on an increase in sales for the third quarter of fiscal 2019. What caused this result? |
A. | The decrease in income before income taxes of $139.0 million was primarily due to the following factors: |
▪ | Lower sales and slightly lower margins associated with the North American Towables and Motorized segments resulted in a decrease in North American income before income tax of $57.9 million. |
▪ | The European RV segment posted a loss before income taxes of $30.9 million for the quarter, which included a number of expenses related to the acquisition of EHG which closed at the beginning of the third quarter. These expenses included $61.4 million for the impact of purchase accounting on acquired inventory that was subsequently sold in the quarter and $12.8 million in amortization expense related to acquired intangible assets. |
▪ | Corporate loss before income tax increased by $49.2 million in the quarter, which included acquisition related expenses of $16.3 million, partially offset by a $2.9 million gain in the quarter related to the foreign currency forward contract, and interest expense of $32.2 million related to debt incurred to finance the acquisition of EHG. |
6. | What are the Company's reportable segments? |
A. | As a result of the acquisition of EHG, the Company has expanded its reporting segments to include a European RV segment, which consists solely of the operations of the recently acquired EHG business. This new segment complements the Company's North American Towable RV and North American Motorized RV reporting segments. The results of the European RV segment for the quarter are presented in the 10-Q in Footnote 3 - Business Segments as well as in the Management Discussion and Analysis section. |
7. | What is the current status of the North American independent dealer inventory rationalization? |
A. | We believe the North American inventory rationalization is progressing well. North American independent dealer inventory at the end of the third quarter decreased 20.3% from the prior year. |
8. | What was Thor's adjusted EBITDA for the third quarter? |
A. | Although we do not disclose non-GAAP numbers, here are some items within our financial statements that might be helpful in considering this question: |
▪ | Income before income taxes of $41.5 million from our income statement |
▪ | Net interest expense of $33.0 million calculated from our income statement |
▪ | Depreciation and amortization of intangibles totaling $50.9 million from our business segment footnote |
▪ | Related to the acquisition of EHG, the impact on gross profit of the step-up in purchase accounting of acquired inventory, that was subsequently sold in the quarter, of $61.4 million from our acquisition footnote (Note 2 of our third fiscal quarter 10-Q) |
▪ | Net acquisition-related costs of $13.4 million from our income statement |
▪ | Increase in our LIFO reserve of $0.7 million calculated from the Inventories Footnote (Note 2 of our third fiscal quarter 10-Q) Q3 vs. Q2 2019 |
10
Current Hot Topics
1. | Can you provide details on the purchase price and fair value of the net assets that were acquired? |
A. | Detailed information is included in Footnote 2 of our Third Fiscal Quarter 10-Q that summarizes the purchase price and the estimated fair values of the EHG assets acquired and liabilities assumed as of the acquisition date. The Company is in the process of finalizing internal and third-party valuations; therefore, certain values are subject to change as noted in the footnote. We expect to finalize these values as soon as practical, but no later than one year from the acquisition date. |
2. | How do you think about the earnings power of the EHG business? |
A. | EHG has a strong product line-up, a great brand, and a leading market share in Europe. With these assets, along with the growing European market and favorable demographic trends, we believe there is significant potential for long-term earnings growth for EHG. There are also opportunities to drive earnings growth by capturing cost-savings opportunities and sharing best practices from the European RV segment to our North American RV segments, enhancing the combined profitability of our Company. |
3. | How are you thinking about gross margins and the potential to improve margins overall now that EHG is part of Thor? |
A. | We are in the process of identifying quality initiatives, process improvements and product design initiatives that can be leveraged in our North American operations, which we believe could result in lower warranty costs. Also, we are reviewing our supplier base across both markets, identifying common suppliers where we can negotiate better pricing based on our combined volume to help lower the cost of purchased materials across the European and North American segments. |
4. | What specific actions are you taking to reduce EHG’s SG&A expenses |
A. | We see numerous opportunities for SG&A cost savings at EHG. For example, EHG historically has used a higher volume of outside professional services than Thor (as we’ve seen with past private company acquisitions), and we expect to be able to lower these costs, decreasing EHG's SG&A expense over time. |
11
5. | What synergies have you identified from the EHG acquisition? |
A. | As with previous acquisitions, we take a holistic approach to operational improvements based on the sharing of best practices among Thor companies. From a practical standpoint, we are not limiting our efforts to EHG, but rather are looking for ways to improve EHG’s operations and cost structure based on what we are doing at our North American subsidiaries, and also taking lessons from EHG and applying those to improve our North American subsidiaries. As a result, we are looking at numerous areas to improve our overall operations: |
▪ | Process Improvements: We look at the entire product, from design to assembly, to identify areas where we can improve efficiency, enhance quality and reduce costs. |
▪ | Supply Chain: We review our common suppliers of key components and identify areas where we can leverage our combined purchasing to obtain better pricing. |
▪ | Innovation: Thor and EHG both have a long history of product innovation. In addition, EHG has an Innovation Camp that opened in 2018 to provide a platform for innovation and sharing ideas across all of the Erwin Hymer brands. This concept and the ideas it generates create opportunities to enhance innovation at EHG and other Thor companies. Thor team members have toured the Camp and have already seen opportunities that could be leveraged in the future. |
▪ | Working Capital Management: We are looking at EHG’s processes, identifying opportunities to improve working capital management and generate cash by reducing overall working capital needs. |
6. | Are there any emerging issues that could impact EHG? |
A. | There is the potential impact of Brexit and changing emissions standards across the EU, which could have a direct impact on the European RV Segment. These issues are evolving, and we are closely monitoring developments to adjust our operations, products and business practices appropriately. |
7. | How and when are you planning to introduce EHG products to the North American market? |
A. | We are still working on the details to determine which of EHG's numerous products have the best potential for growth and market share gains in North America as well as specifically where we will produce them. We will have four or five Hymer units here in the U.S. to show at our 2019 Open House in September to gauge specific North American independent dealer interest, and to help us determine which models will be best received in North America. |
8. | What are the market growth rates in Europe? What have the market growth rates for the past twelve months been? |
A. | According to the European Caravan Federation (ECF), European caravan registrations in April 2019 grew by 5.9% compared to the same period in the prior year, while German caravan registrations were up 14.7% during the same time period. For the trailing twelve month period ended April 2019, European caravan registrations declined by 0.8% compared to the same period in the prior year, while German caravan registrations were up 8.1% during the same time period. |
Also according to the ECF, European motorcaravans registrations in April 2019 were up 21.5%, and German motorcaravan registrations were up 39.8% for the same time period. For the trailing twelve month period ended April 2019, European motorcaravan registrations were up by 7.9% compared to the same period in the prior year, while German motorcaravan registrations were up 13.6% during the same time period.
12
9. | What is EHG’s expected capex for 2019? For 2020 and beyond? |
A. | We do not disclose capex by segment or subsidiary, however we have disclosed that Thor's consolidated expenditures for capex for the first nine months of fiscal 2019 was $83.7 million, and we expect to invest an additional $45.0 million by the end of the fiscal year. We expect to disclose our fiscal year 2020 estimated capital expenditures in connection with the release of our 10-K report in September. |
It's important to note that our capital expenditures are generally very flexible and can be modified with short notice depending on market conditions.
10. | Can you comment on EHG’s current market share in Europe? |
A. | According to the European Caravan Federation (ECF), as of March 31, 2019, EHG had a market share of approximately 21.5% in Europe for caravans and approximately 22.5% market share in Europe for motorcaravans and campervans combined. Data from the ECF is subject to adjustment and is continuously updated, and is often impacted by delays in reporting by various countries (some countries, including the United Kingdom, do not report OEM-specific data and are thus excluded from the market share calculation). |
11. | Are you concerned that you may have purchased EHG at the top of the cycle and potentially overpaid? |
A. | When considering transformational acquisitions like EHG, we realize these may be opportunities that happen once in a lifetime. As a result, the initial transaction price needs to be considered in light of the long-term benefits and returns that can be generated by expanding our business into a significant, growing market like Europe. |
12. | Will the exclusion of EHG's former North American operations affect your ability to sell Hymer products in North America? |
A. | The acquisition excluded EHG's former North American operations and the Canadian-specific Roadtrek brands. The Canadian-specific trademarks excluded from the transaction were such brands as Roadtrek, Aktiv, American Fastbacks and Fastbacks, and Ecotrek. To be clear, the acquisition does include the trademarks from all European Hymer brands including those formerly licensed to the former North American operations. |
13. | Will potential new tariffs have any impact on EHG’s European business? |
A. | The tariff outlook is changing by the day. At this time, it is still too early to know what the exact impact may be, but if EU implements retaliatory tariffs there could be some impact from the import of U.S. components to Europe as well as U.S. import of European components. |
Drivers of Demand
1. | What trends are you seeing with regard to new consumers entering the RV and camping markets and do you believe that new consumers will continue to support growth in the sector? |
A. | The 2019 North American Camping Report published by Kampgrounds of America (KOA) shows that 78.8 million households are active campers, an increase of 1.4 million from 2018 and an increase of 7.3 million households over the past five years. Of the new campers in 2018, 56% were millennials, suggesting that the recent growth in new campers has potential for long-term growth to the benefit of the outdoor and RV industries. |
13
2. | Do you have statistical data supporting the widely-stated claim that younger buyers are entering the RV market? |
A. | Yes – there are a number of sources that are supportive of this fact. According to research conducted by Nielsen for Go RVing™ in 2016 (the most recently available study), the typical RV owner is 45 years old compared to a similar study from 2015 that indicated the typical owner was 48 years old. This study did not distinguish between owners of new versus used units, but is indicative of the reduction in the age of RV consumers. In addition, using data from Statistical Surveys, Inc., we have analyzed annual retail registrations of new RV units from 2014 through 2018 and noted that by age group, the 25-34 age group has more than doubled as a percentage of total U.S. RV registrations while the 35-44 age group has increased from 15.0% to 20.7% of U.S. RV registrations over the same period. In aggregate, consumers under age 55 have increased from 39.6% of total U.S. retail registrations in 2014 to 51.5% of total U.S. retail registrations in 2018, highlighting the increase in younger buyers entering the market. |
Current Market Conditions
1. | How would you describe the current health of the North American retail RV market? |
A. | Based on current trends, it appears the North American retail market will likely be softer for the remainder of calendar 2019, though retail will likely continue to outperform wholesale shipments, supporting the continued independent dealer inventory rationalization. |
2. | Do you expect North American independent dealers to maintain lower inventory levels from now on? By how much? |
A. | We do expect that coming out of this rationalization independent dealers will remain focused on maximizing inventory turns resulting in them maintaining generally lower inventory levels and submitting smaller, more frequent orders to replenish that inventory. |
3. | After the North American independent dealer inventory has normalized, do you think the industry might have an under-inventory situation? If so, how would you handle it (ramp production, increase pricing, etc.?) |
A. | While this is possible, with our recent capacity expansions, we have the ability to meet emerging demand quickly to satisfy the needs of our independent dealers in a timely fashion. |
4. | What is the current North American industry outlook by RVIA for industry wholesale shipments for calendar year 2019 and 2020? |
A. | For calendar year 2019, RVIA is currently forecasting unit shipments to decrease 13.9% to 416,300 units. For calendar year 2020, RVIA is currently forecasting that wholesale shipments will increase 2.5% to 426,700 units, with a range of a decrease of 2.7% and an increase of 6.0%. This would correspond to a base case of shipments of 426,700 units with a range of 405,100 to 441,400 units for the 2020 calendar year. |
5. | Can you comment on North American independent dealer sentiment? |
A. | North American independent dealers continue to express strong long-term optimism and are demonstrating their optimism by investing in their businesses by expanding their existing facilities, adding additional service facilities and building new dealer locations or by buying other independent dealerships to expand their market footprint. |
6. | What are you seeing in terms of commodity price inflation? |
A. | We are not currently seeing any significant commodity inflation, which is helped by the recent announcement that tariffs on aluminum and steel from Canada and Mexico would be withdrawn. This is an area where we constantly monitor, particularly in light of ongoing tariff/trade negotiations. |
14
7. | We have seen some weak economic data coming from Europe and Germany in particular, what is the current state of the European RV market? |
A. | While there continues to be some uncertainty surrounding Brexit, the overall European market for RVs continues to perform well. Last year, the main areas of weakness in the market was in the U.K., reflecting uncertainties surrounding Brexit and weakness in the U.K. automotive market. In April, Germany posted 14.7% growth in caravan registrations, and 39.8% growth in motorcaravan registrations compared to prior year results, highlighting the continuing strength of the European RV market. |
8. | What drove your North American market share change year-to-date in 2019? |
A. | Much of the change in overall North American market share for the first three months of 2019 has stemmed from changes in the motorized market. We have seen a more significant decrease in our Class B market share given our focus on the high end of that market with the Airstream Interstate and Atlas. To address the larger entry-level Class B market, Thor Motor Coach has recently developed a new Class B motorhome, which was unveiled at the Salt Lake City RVX show, and which will be available in the Fall of 2019. The other shift in motorized market share has been on Class C motorhomes, where we saw some decline in orders by rental fleet customers over the past year. |
9. | Have you been able to raise North American prices in this environment? |
A. | Since products change so much every year it’s not possible to come up with percent price increases or decreases on an apples-to-apples basis. When faced with increasing input prices we take a holistic approach to making changes, with a variety of actions, including negotiating with suppliers, potentially changing suppliers, evaluating design and content decisions to potentially de-content components with increasing costs, implementing cost surcharges if the price change is anticipated to be short lived, or when necessary, adjusting pricing. |
10. | How does consolidation within the independent dealer base impact demand for Thor products? Do you anticipate increased pressure on margins as a result of independent dealer consolidation? |
A. | Competition for dealers is inherent in our industry. Recent independent dealer consolidation has not impacted this reality, nor do we expect this to significantly change in the foreseeable future. Thor’s ability to develop long-standing relationships with the most productive dealers in the market has been, and will always be, crucial to our success, with or without further consolidation. |
While we do not anticipate significant pressure from further consolidation, we remain focused on providing compelling value to independent dealers by being a strong supplier. These efforts help our dealers appreciate the value that Thor offers, with our breadth of products and brands, people and day-to-day support. Larger dealers, in particular, value partnering with a company that has the ability to provide a large volume of units within a reasonable time period throughout the year.
11. | Can you tell us more about the recent management change announcement? |
A. | Subsequent to the quarter end, we announced the creation of two new senior management positions at Thor Industries in North America to provide incremental support to subsidiary leadership, improve focus and help achieve key goals on an accelerated basis. |
We have elevated two of our top RV leaders, Matt Zimmerman of Keystone and Chris Hermon of Heartland, to the newly created roles of RV Group Managers. In their new roles, Matt and Chris will be assisting our US-based operating companies in their realization of key strategic initiatives, all of which are designed to improve our offerings to our independent dealers and retail customers, increase engagement with our employees and improve our operating margins.
15
Balance Sheet and Cash Flow
1. | Have you swapped into a fixed interest rate on your debt? If so, what is your current effective interest rate on the debt? What portion remains under variable rates? |
A. | The Company has entered into interest rate swap agreements to manage certain of its interest rate exposures.$900.0 million of the USD Term Loan is now fixed at an effective interest rate of 6.2160%, and the remaining $486.4 million of the USD Term Loan is subject to floating rates. The Euro Term Loan debt of $691.2 million is also subject to floating rates. Further details on the Company's long-term debt are in Note 14 of the 10Q. |
2. | What was working capital at April 30, 2019 and April 30, 2018? What drove the change in working capital year over year? |
A. | Total working capital increased from $571.8 million at April 30, 2018 to $822.0 million at April 30, 2019, primarily due to the inclusion of the assets and liabilities of EHG which was acquired at the beginning of the quarter. |
3. | Thor has already paid down a significant amount of the debt incurred to acquire EHG. What sort of cadence do you expect to achieve with paying down the debt? |
A. | During and subsequent to the third quarter, we have paid off approximately $255 million related to borrowings incurred in connection with the acquisition of EHG, including completely paying down the initial borrowings under the ABL of $100.0 million. We also note that the fiscal third and fourth quarters are historically our strongest seasonal quarters for cash flow generations. Regarding future payments, we have not disclosed a specific payoff schedule, however, as we've stated before, we are focused on paying down the debt quickly. |
4. | What is your target leverage ratio by the end of FY19? |
A. | Debt reduction is a priority for Thor, and we are not expecting to maintain significant debt levels over the long term. To date, we have paid down approximately $255 million of our outstanding principal balance. We will continue to update shareholders on our progress of paying down principal on our loans. |
16
Key Economic Indicators
Health of North American Economy Supports Expected Continued Market Growth |
Sources: (1) Statistical Surveys, Inc.; (2) The Conference Board, Consumer Confidence Survey® |
* Note: Data beyond 2018 represented above includes the trailing twelve months of registrations ended March |
Sources: (3) Recreation Vehicle Industry Association; (4) U.S. Bureau of Economic Analysis |
* Note: 2019 YTD includes a year-over-year comparison of RV shipments through March per the RVIA, and the most recent estimate of the 1QCY19 annual growth rate from the U.S. BEA, published May 30, 2019. |
17
Outlook
1. | What are the key factors that have been supporting the North American RV market and do you anticipate these factors to continue? |
A. | The RV market resonates with consumers on multiple levels, spanning across generations. Consumers desire to spend time with family and friends enjoying a broad range of activities outdoors. The benefits of RVs providing a home while traveling also resonates with a broad range of consumers that prefer their own home to hotels or motels. RVs are often a more affordable option for consumers, particularly when considering the cost of air travel and hotel accommodations. In addition, generationally, we are seeing an influx of younger consumers seeking innovative and flexible ways to enjoy their free time. We believe these factors will continue to support the North American market for years to come. |
2. | What is your current outlook for the European RV market? |
A. | We view the EU market as having solid growth prospects over the long term as many of the same fundamentals, favorable demographics and other factors are very similar to what we see in North America. In some cases, we see even stronger desire on the part of European consumers to spend vacation time with family and friends and enjoy outdoor activities than we do in North America. While there are some near-term uncertainties in certain markets such as the UK as a result of Brexit, we view the long-term prospects positively. |
3. | What is your outlook for Thor for the remainder of fiscal year 2019? |
A. | During the remainder of our fiscal 2019, we expect the North American independent dealer inventory rationalization will continue, but we expect to see a resumption of growth in the North American markets in 2020. In Europe, we believe our independent dealer inventory levels of EHG products, while elevated in certain locations, are generally appropriate for seasonal consumer demand in Europe and are progressing towards more normalized levels. Currently, our focus is on identifying and realizing the benefits of sharing best practices and operating efficiencies across Europe and North America, and continuing to optimize our working capital management processes. |
18
J;E16IJ5\VV04MV2%*-R"?\2$@ ;FM5K74IFK+K$=6:LOJ=$Z).C*1'D+4K7%6R;G2&TK \:S=6^!CMSF2
MDK4JZ2 %>D*&K>VZBK88$X]A!)C0I+"S-7LQ2ERI;S/9BON.Z'5A+I*TLE(
M;"!Z@!X'M_H,._P"'VI=KJ323VU3I?R;[C,5LI =(0;?4+/FC-8A3I>6FJ2AO=Z3,>^
M8+RCL &$$$;7O?$G/$G+-'BMP9;-6I27$E32H5HG;]UIN;D_\)OMOCFX]1GQ
MY*%6WB)]^Z3:I\"G4J=/=>:S+3W&E6[:G]27-( "0H $7 !L;7&.81[2^IL
MQ)>HU=>C4I2E?+-2JX%.I0"0-1U<^<BE0)3\=R0['A2)+FIF.VE=F_SC8);_ (DJN-MK7P[?B$J5?.77LR5FASEY
M9COK0TGN-M//2+"Q NI1:2?I)MP3M@:RIGO)N;\KTK\'SA+R?(B+"YC3MWGI
M*E;J38@A2=*;$VND\8S:%,H4Y\@LG^GQ-&/KF#V=>F;>6D5;,T5UJ;6'8S$6
MH_AY4A'S"T@N.H2HW"%IN;'[^^!Q*G,Z4=A$!E-5HCS)CS>T=*FB3=+@5[VO
MO>P\@WQL)E/-F4LT54M9D1&JE+J#2F52&'T7::!TV>"/ *0;J((&+C+GPXY+
ME0J=5>G6<6(E-^;4^&JH@/1R+W6@(]*DFQVO?QCI?BP@]_8^T8PW"UFGU:Z7
M0JI1^]1ZFY+<;>4A4)QOUMH(.D*L?400;G[X7=0I-8R^ZLR)"F6HS(1&"%%*
M' 57UC:^@