Media Investors
Ancel Martinez Jim Rowe
415-222-3858 415-396-8216
Wells Fargo Reports February Retail Banking Customer Activity
SAN FRANCISCO, March 20, 2017 – Wells Fargo & Company (NYSE: WFC) today reported
Retail Banking customer activity data for February 2017. Tim Sloan, President and Chief
Executive Officer noted, “Today’s update on Retail Banking trends is part of our ongoing
commitment to transparency. In February, we were pleased to see that in general our existing
customers continued to actively use their accounts and valued their relationships with Wells
Fargo. We remain focused on meeting our customers’ financial needs by providing great service
and quality products, and we’re pleased that our customer experience survey scores increased
for the fourth consecutive month. We will provide our next update on customer activity trends
in April.”
Mary Mack, head of Community Banking, added, “After factoring in day count differences,
February trends were generally similar to January’s and were within our expectations. It will
take time for us to work through the changes we are making in our business, but we remain
focused on strengthening our relationships with existing customers and building new ones with
potential customers.”

Page 2 of 4
Key Takeaways
Linked month (LM) and year-over-year (YoY) trends were impacted by February 2017 having
fewer days than both January 2017 and February 2016
Customer Interactions
Total branch interactions down 1% LM, and down 11% YoY
Deposit Balances and Accounts
Average consumer and small business deposit balances down modestly LM, but up 6% YoY
Consumer checking account opens down 3% LM, and down 0.3 million, or 43%, YoY
Customer-initiated consumer checking account closures down 10% LM and 11% YoY
Primary consumer checking customers of 23.5 million, up modestly LM, and up 1.9% YoY
Debit and Credit Cards
Point-of-sale debit card transactions down 2% LM, but up modestly YoY
Consumer credit card purchase volume down 7% LM, but up 3% YoY
Consumer credit card balances outstanding down 2% LM, but up 8% YoY
New consumer credit card applications down 4% LM, and down 0.2 million, or 55%, YoY
Point-of-sale active consumer credit card accounts of 7.5 million, down 2% LM, but up 4%
YoY
Customer Experience Surveys
Customer loyalty scores up for the fourth consecutive month, but down YoY
Survey results of overall satisfaction with most recent visit of 77.5% in February 2017, up
from 77.2% in January 2017, but down slightly from 77.8% in February 2016

Page 3 of 4
Conference Call
The Company will host a live conference call on Monday, March 20, at 9:30 a.m. PT (12:30 p.m. ET). You
may participate by dialing 866-872-5161 (U.S. and Canada) or 440-424-4922 (International). The call will
also be available online at https://www.wellsfargo.com/about/investor-relations/events/
and https://engage.vevent.com/rt/wells_fargo_ao~83691984.
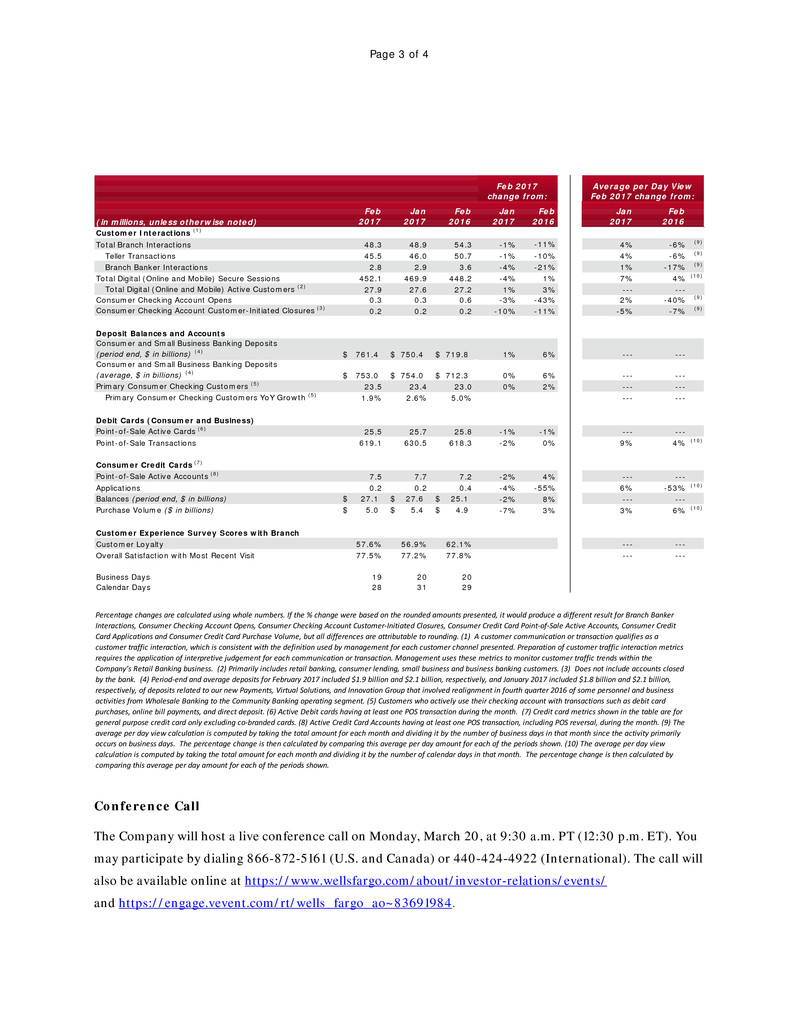
(in millions, unless otherwise noted)
Feb
2017
Jan
2017
Feb
2016
Jan
2017
Feb
2016
Jan
2017
Feb
2016
Customer Interactions (1)
Total Branch Interactions 48.3 48.9 54.3 -1% -11% 4% -6% (9)
Teller Transactions 45.5 46.0 50.7 -1% -10% 4% -6% (9)
Branch Banker Interactions 2.8 2.9 3.6 -4% -21% 1% -17% (9)
Total Digital (Online and Mobile) Secure Sessions 452.1 469.9 448.2 -4% 1% 7% 4% (10)
Total Digital (Online and Mobile) Active Customers (2) 27.9 27.6 27.2 1% 3% --- ---
Consumer Checking Account Opens 0.3 0.3 0.6 -3% -43% 2% -40% (9)
Consumer Checking Account Customer-Initiated Closures (3) 0.2 0.2 0.2 -10% -11% -5% -7% (9)
Deposit Balances and Accounts
Consumer and Small Business Banking Deposits
(period end, $ in billions) (4) 761.4$ 750.4$ 719.8$ 1% 6% --- ---
Consumer and Small Business Banking Deposits
(average, $ in billions) (4) 753.0$ 754.0$ 712.3$ 0% 6% --- ---
Primary Consumer Checking Customers (5) 23.5 23.4 23.0 0% 2% --- ---
Primary Consumer Checking Customers YoY Growth (5) 1.9% 2.6% 5.0% --- ---
Debit Cards (Consumer and Business)
Point-of-Sale Active Cards (6) 25.5 25.7 25.8 -1% -1% --- ---
Point-of-Sale Transactions 619.1 630.5 618.3 -2% 0% 9% 4% (10)
Consumer Credit Cards (7)
Point-of-Sale Active Accounts (8) 7.5 7.7 7.2 -2% 4% --- ---
Applications 0.2 0.2 0.4 -4% -55% 6% -53% (10)
Balances (period end, $ in billions) 27.1$ 27.6$ 25.1$ -2% 8% --- ---
Purchase Volume ($ in billions) 5.0$ 5.4$ 4.9$ -7% 3% 3% 6% (10)
Customer Experience Survey Scores with Branch
Customer Loyalty 57.6% 56.9% 62.1% --- ---
Overall Satisfaction with Most Recent Visit 77.5% 77.2% 77.8% --- ---
Business Days 19 20 20
Calendar Days 28 31 29
Average per Day View
Feb 2017 change from:
Feb 2017
change from:
Percentage changes are calculated using whole numbers. If the % change were based on the rounded amounts presented, it would produce a different result for Branch Banker
Interactions, Consumer Checking Account Opens, Consumer Checking Account Customer-Initiated Closures, Consumer Credit Card Point-of-Sale Active Accounts, Consumer Credit
Card Applications and Consumer Credit Card Purchase Volume, but all differences are attributable to rounding. (1) A customer communication or transaction qualifies as a
customer traffic interaction, which is consistent with the definition used by management for each customer channel presented. Preparation of customer traffic interaction metrics
requires the application of interpretive judgement for each communication or transaction. Management uses these metrics to monitor customer traffic trends within the
Company’s Retail Banking business. (2) Primarily includes retail banking, consumer lending, small business and business banking customers. (3) Does not include accounts closed
by the bank. (4) Period-end and average deposits for February 2017 included $1.9 billion and $2.1 billion, respectively, and January 2017 included $1.8 billion and $2.1 billion,
respectively, of deposits related to our new Payments, Virtual Solutions, and Innovation Group that involved realignment in fourth quarter 2016 of some personnel and business
activities from Wholesale Banking to the Community Banking operating segment. (5) Customers who actively use their checking account with transactions such as debit card
purchases, online bill payments, and direct deposit. (6) Active Debit cards having at least one POS transaction during the month. (7) Credit card metrics shown in the table are for
general purpose credit card only excluding co-branded cards. (8) Active Credit Card Accounts having at least one POS transaction, including POS reversal, during the month. (9) The
average per day view calculation is computed by taking the total amount for each month and dividing it by the number of business days in that month since the activity primarily
occurs on business days. The percentage change is then calculated by comparing this average per day amount for each of the periods shown. (10) The average per day view
calculation is computed by taking the total amount for each month and dividing it by the number of calendar days in that month. The percentage change is then calculated by
comparing this average per day amount for each of the periods shown.

Page 4 of 4
A replay of the conference call will be available beginning at 11:30 a.m. PT (2:30 p.m. ET) on March 20
through Friday, March 31. Please dial 855-859-2056 (U.S. and Canada) or 404-537-3406 (International)
and enter Conference ID 83691984#. The replay will also be available online
at https://www.wellsfargo.com/about/investor-relations/events/
and https://engage.vevent.com/rt/wells_fargo_ao~83691984.
Cautionary Statement About Forward-Looking Statements
This news release contains forward-looking statements about our future financial performance and business. Because
forward-looking statements are based on our current expectations and assumptions regarding the future, they are
subject to inherent risks and uncertainties. Do not unduly rely on forward-looking statements as actual results could
differ materially from expectations. Forward-looking statements speak only as of the date made, and we do not
undertake to update them to reflect changes or events that occur after that date. For information about factors that
could cause actual results to differ materially from our expectations, refer to our reports filed with the Securities and
Exchange Commission, including the discussion under “Risk Factors” in our Annual Report on Form 10-K for the year
ended December 31, 2016 as filed with the Securities and Exchange Commission and available on its website at
www.sec.gov.
About Wells Fargo
Wells Fargo & Company (NYSE: WFC) is a diversified, community-based financial services company with
$1.9 trillion in assets. Founded in 1852 and headquartered in San Francisco, Wells Fargo provides banking,
insurance, investments, mortgage, and consumer and commercial finance through more than 8,600 locations,
13,000 ATMs, the internet (wellsfargo.com) and mobile banking, and has offices in 42 countries and territories to
support customers who conduct business in the global economy. With approximately 269,000 team members,
Wells Fargo serves one in three households in the United States. Wells Fargo & Company was ranked No. 27 on
Fortune’s 2016 rankings of America’s largest corporations. Wells Fargo’s vision is to satisfy our customers’ financial
needs and help them succeed financially.
# # #