Exhibit 99.01

|
414 Nicollet Mall
|
|
|
Minneapolis, MN 55401
|
Oct. 25, 2012
XCEL ENERGY
THIRD QUARTER 2012 EARNINGS REPORT
|
|
·
|
Ongoing 2012 third quarter earnings per share were $0.78 compared with $0.69 per share in 2011.
|
|
|
·
|
GAAP (generally accepted accounting principles) 2012 third quarter earnings per share were $0.81 compared with $0.69 per share in 2011.
|
|
|
·
|
Xcel Energy reaffirms 2012 ongoing earnings guidance of $1.75 to $1.85 per share.
|
|
|
·
|
Xcel Energy expects 2012 GAAP earnings to be in the upper half of the guidance range.
|
|
|
·
|
Xcel Energy initiates 2013 ongoing earnings guidance of $1.85 to $1.95 per share.
|
MINNEAPOLIS — Xcel Energy Inc. (NYSE: XEL) today reported 2012 third quarter GAAP earnings of $398 million, or $0.81 per share compared with 2011 GAAP earnings of $338 million, or $0.69 per share.
Ongoing earnings, which exclude adjustments for certain items, were $0.78 per share for the third quarter of 2012 compared with $0.69 per share in 2011. Third quarter 2012 ongoing earnings increased largely due to increased electric and gas margins driven by various rate increases that went into effect in 2012, partially offset by increased property taxes and interest expense. Third quarter 2012 GAAP earnings also reflect a $0.03 per share positive impact for a tax benefit associated with federal subsidies for prescription drug plans.
“We experienced a solid quarter, with earnings increasing mainly due to both our continued system investments that provide long-term value to our customers and timely cost recovery,” said Ben Fowke, Chairman, President and Chief Executive Officer. “Our third quarter 2012 results also benefited from hot summer weather, although we experienced similar weather in 2011, it was not a variance driver in the period over period quarterly comparison.”
“We had a slow start to the year with unfavorable sales, mild winter weather and certain adverse regulatory decisions. We responded by implementing cost control measures to partially offset the impact of these early headwinds and to position the company to deliver earnings in the lower half of our guidance range. Given the success of our year-to-date cost control measures, combined with hot summer weather, we now expect to deliver 2012 ongoing earnings within our earnings guidance range of $1.75 to $1.85 per share. We also anticipate that our 2012 GAAP earnings will be in the upper half of our guidance range,” said Fowke.
Earnings Adjusted for Certain Items (Ongoing Earnings)
The following table provides a reconciliation of ongoing earnings per share to GAAP earnings per share:
|
Three Months Ended Sept. 30
|
Nine Months Ended Sept. 30
|
|||||||||||||||
|
Diluted Earnings (Loss) Per Share
|
2012
|
2011
|
2012
|
2011
|
||||||||||||
|
Ongoing(a) diluted earnings per share
|
$ | 0.78 | $ | 0.69 | $ | 1.54 | $ | 1.43 | ||||||||
|
Prescription drug tax benefit (a)
|
0.03 | - | 0.03 | - | ||||||||||||
|
GAAP diluted earnings per share
|
$ | 0.81 | $ | 0.69 | $ | 1.57 | $ | 1.43 | ||||||||
|
(a)
|
See Note 6.
|
1
At 9:00 a.m. CDT today, Xcel Energy will host a conference call to review financial results. To participate in the call, please dial in 5 to 10 minutes prior to the start and follow the operator’s instructions.
|
US Dial-In:
|
(866) 225-8754
|
|
International Dial-In:
|
(480) 629-9818
|
|
Conference ID:
|
4567530
|
The conference call also will be simultaneously broadcast and archived on Xcel Energy’s website at www.xcelenergy.com. To access the presentation, click on Investor Relations. If you are unable to participate in the live event, the call will be available for replay from 2:00 p.m. CDT on Oct. 25 through 11:59 p.m. CDT on Oct. 26.
|
Replay Numbers
|
|
|
US Dial-In:
|
(800) 406-7325
|
|
International Dial-In:
|
(303) 590-3030
|
|
Access Code:
|
4567530 #
|
Except for the historical statements contained in this release, the matters discussed herein, are forward-looking statements that are subject to certain risks, uncertainties and assumptions. Such forward-looking statements, including our 2012 and 2013 full year earnings per share guidance and assumptions, are intended to be identified in this document by the words “anticipate,” “believe,” “estimate,” “expect,” “intend,” “may,” “objective,” “outlook,” “plan,” “project,” “possible,” “potential,” “should” and similar expressions. Actual results may vary materially. Forward-looking statements speak only as of the date they are made, and we do not undertake any obligation to update them to reflect changes that occur after that date. Factors that could cause actual results to differ materially include, but are not limited to: general economic conditions, including inflation rates, monetary fluctuations and their impact on capital expenditures and the ability of Xcel Energy Inc. and its subsidiaries (collectively, Xcel Energy) to obtain financing on favorable terms; business conditions in the energy industry, including the risk of a slow down in the U.S. economy or delay in growth recovery; trade, fiscal, taxation and environmental policies in areas where Xcel Energy has a financial interest; customer business conditions; actions of credit rating agencies; competitive factors, including the extent and timing of the entry of additional competition in the markets served by Xcel Energy Inc. and its subsidiaries; unusual weather; effects of geopolitical events, including war and acts of terrorism; state, federal and foreign legislative and regulatory initiatives that affect cost and investment recovery, have an impact on rates or have an impact on asset operation or ownership or impose environmental compliance conditions; structures that affect the speed and degree to which competition enters the electric and natural gas markets; costs and other effects of legal and administrative proceedings, settlements, investigations and claims; actions by regulatory bodies impacting our nuclear operations, including those affecting costs, operations or the approval of requests pending before the Nuclear Regulatory Commission; financial or regulatory accounting policies imposed by regulatory bodies; availability or cost of capital; employee work force factors; and the other risk factors listed from time to time by Xcel Energy in reports filed with the Securities and Exchange Commission (SEC), including Risk Factors in Item 1A and Exhibit 99.01 of Xcel Energy Inc.’s Annual Report on Form 10-K for the year ended Dec. 31, 2011 and Quarterly Reports on Form 10-Q for the quarters ended March 31 and June 30, 2012.
For more information, contact:
|
Paul Johnson, Vice President, Investor Relations and Financial Management
|
(612) 215-4535
|
|
Jack Nielsen, Director, Investor Relations
|
(612) 215-4559
|
|
Cindy Hoffman, Senior Investor Relations Analyst
|
(612) 215-4536
|
|
For news media inquiries only, please call Xcel Energy Media Relations
|
(612) 215-5300
|
|
Xcel Energy internet address: www.xcelenergy.com
|
This information is not given in connection with any
sale, offer for sale or offer to buy any security.
2
XCEL ENERGY INC. AND SUBSIDIARIES
CONSOLIDATED STATEMENTS OF INCOME (Unaudited)
(amounts in thousands, except per share data)
|
Three Months Ended Sept. 30
|
Nine Months Ended Sept. 30
|
|||||||||||||||
|
2012
|
2011
|
2012
|
2011
|
|||||||||||||
|
Operating revenues
|
||||||||||||||||
|
Electric
|
$ | 2,532,709 | $ | 2,619,424 | $ | 6,506,320 | $ | 6,777,793 | ||||||||
|
Natural gas
|
174,513 | 194,930 | 1,016,861 | 1,251,817 | ||||||||||||
|
Other
|
17,119 | 17,244 | 53,907 | 56,750 | ||||||||||||
|
Total operating revenues
|
2,724,341 | 2,831,598 | 7,577,088 | 8,086,360 | ||||||||||||
|
Operating expenses
|
||||||||||||||||
|
Electric fuel and purchased power
|
1,006,830 | 1,150,252 | 2,725,183 | 3,071,493 | ||||||||||||
|
Cost of natural gas sold and transported
|
49,739 | 87,107 | 557,444 | 793,539 | ||||||||||||
|
Cost of sales — other
|
7,251 | 7,154 | 20,499 | 22,100 | ||||||||||||
|
Operating and maintenance expenses
|
531,480 | 532,962 | 1,576,178 | 1,575,159 | ||||||||||||
|
Conservation and demand side management program expenses
|
68,920 | 71,280 | 191,242 | 212,075 | ||||||||||||
|
Depreciation and amortization
|
239,051 | 242,329 | 694,364 | 696,316 | ||||||||||||
|
Taxes (other than income taxes)
|
100,636 | 89,018 | 305,892 | 278,077 | ||||||||||||
|
Total operating expenses
|
2,003,907 | 2,180,102 | 6,070,802 | 6,648,759 | ||||||||||||
|
Operating income
|
720,434 | 651,496 | 1,506,286 | 1,437,601 | ||||||||||||
|
Other income, net
|
488 | 2,550 | 4,953 | 8,295 | ||||||||||||
|
Equity earnings of unconsolidated subsidiaries
|
7,490 | 7,423 | 22,150 | 22,813 | ||||||||||||
|
Allowance for funds used during construction — equity
|
15,860 | 11,840 | 44,504 | 38,690 | ||||||||||||
|
Interest charges and financing costs
|
||||||||||||||||
|
Interest charges — includes other financing costs of $6,010, $6,279, $18,126 and $17,724, respectively
|
153,719 | 148,011 | 457,470 | 438,703 | ||||||||||||
|
Allowance for funds used during construction — debt
|
(10,439 | ) | (6,301 | ) | (24,729 | ) | (21,575 | ) | ||||||||
|
Total interest charges and financing costs
|
143,280 | 141,710 | 432,741 | 417,128 | ||||||||||||
|
Income from continuing operations before income taxes
|
600,992 | 531,599 | 1,145,152 | 1,090,271 | ||||||||||||
|
Income taxes
|
202,845 | 193,304 | 380,161 | 389,838 | ||||||||||||
|
Income from continuing operations
|
398,147 | 338,295 | 764,991 | 700,433 | ||||||||||||
|
(Loss) income from discontinued operations, net of tax
|
(41 | ) | 37 | 68 | 230 | |||||||||||
|
Net income
|
398,106 | 338,332 | 765,059 | 700,663 | ||||||||||||
|
Dividend requirements on preferred stock
|
- | 1,414 | - | 3,534 | ||||||||||||
|
Premium on redemption of preferred stock
|
- | 3,260 | - | 3,260 | ||||||||||||
|
Earnings available to common shareholders
|
$ | 398,106 | $ | 333,658 | $ | 765,059 | $ | 693,869 | ||||||||
|
Weighted average common shares outstanding:
|
||||||||||||||||
|
Basic
|
488,084 | 485,344 | 487,722 | 484,640 | ||||||||||||
|
Diluted
|
488,578 | 485,894 | 488,198 | 485,152 | ||||||||||||
|
Earnings per average common share:
|
||||||||||||||||
|
Basic
|
$ | 0.82 | $ | 0.69 | $ | 1.57 | $ | 1.43 | ||||||||
|
Diluted
|
0.81 | 0.69 | 1.57 | 1.43 | ||||||||||||
|
Cash dividends declared per common share
|
$ | 0.27 | $ | 0.26 | $ | 0.80 | $ | 0.77 | ||||||||
3
XCEL ENERGY INC. AND SUBSIDIARIES
Notes to Investor Relations Earnings Release (Unaudited)
Due to the seasonality of Xcel Energy’s operating results, quarterly financial results are not an appropriate base from which to project annual results.
The only common equity securities that are publicly traded are common shares of Xcel Energy Inc. The earnings and earnings per share (EPS) of each subsidiary discussed below do not represent a direct legal interest in the assets and liabilities allocated to such subsidiary but rather represent a direct interest in our assets and liabilities as a whole. EPS by subsidiary is a financial measure not recognized under GAAP that is calculated by dividing the net income or loss attributable to the controlling interest of each subsidiary by the weighted average fully diluted Xcel Energy Inc. common shares outstanding for the period. We use this non-GAAP financial measure to evaluate and provide details of earnings results. We believe that this measurement is useful to investors to evaluate the actual and projected financial performance and contribution of our subsidiaries. This non-GAAP financial measure should not be considered as an alternative to our consolidated fully diluted EPS determined in accordance with GAAP as an indicator of operating performance.
Note 1. Earnings Per Share Summary
The following table summarizes the diluted earnings per share for Xcel Energy:
|
Three Months Ended Sept. 30
|
Nine Months Ended Sept. 30
|
|||||||||||||||
|
Diluted Earnings (Loss) Per Share
|
2012
|
2011
|
2012
|
2011
|
||||||||||||
|
Public Service Company of Colorado (PSCo)
|
$ | 0.36 | $ | 0.29 | $ | 0.75 | $ | 0.63 | ||||||||
|
NSP-Minnesota
|
0.28 | 0.29 | 0.57 | 0.62 | ||||||||||||
|
Southwestern Public Service Company (SPS)
|
0.12 | 0.10 | 0.20 | 0.17 | ||||||||||||
|
NSP-Wisconsin
|
0.04 | 0.04 | 0.09 | 0.09 | ||||||||||||
|
Equity earnings of unconsolidated subsidiaries
|
0.01 | 0.01 | 0.03 | 0.03 | ||||||||||||
|
Regulated utility — continuing operations (a)
|
0.81 | 0.73 | 1.64 | 1.54 | ||||||||||||
|
Xcel Energy Inc. and other costs
|
(0.03 | ) | (0.04 | ) | (0.10 | ) | (0.11 | ) | ||||||||
|
Ongoing(a) diluted earnings per share
|
0.78 | 0.69 | 1.54 | 1.43 | ||||||||||||
|
Prescription drug tax benefit (b)
|
0.03 | - | 0.03 | - | ||||||||||||
|
GAAP diluted earnings per share
|
$ | 0.81 | $ | 0.69 | $ | 1.57 | $ | 1.43 | ||||||||
|
(a)
|
See Note 2.
|
|
(b)
|
See Note 6.
|
PSCo — PSCo’s ongoing earnings increased $0.07 per share during the third quarter of 2012 and $0.12 per share for the nine months ended Sept. 30, 2012. The increases are primarily due to an electric rate increase, effective in May 2012, lower operating and maintenance (O&M) expenses and the impact of warmer summer weather. The increases were partially offset by decreased wholesale revenue due to the expiration of a long-term wholesale power sales agreement with Black Hills Corp.
NSP-Minnesota — NSP-Minnesota’s ongoing earnings decreased $0.01 per share for the third quarter of 2012 and $0.05 per share for the nine months ended Sept. 30, 2012. The ongoing earnings decline in the third quarter is primarily the result of cooler weather than in 2011, higher property taxes following the Minnesota Public Utility Commission’s denial of our deferred accounting request and higher O&M expenses, which were partially offset by lower depreciation expense.
Year-to-date ongoing earnings decreased primarily due to the unfavorable impact of warmer than normal winter weather, higher property taxes, and higher O&M expenses. These decreases were partially offset by lower depreciation expense and a lower effective tax rate.
SPS — SPS’ ongoing earnings increased $0.02 per share for the third quarter of 2012 and $0.03 per share for the nine months ended Sept. 30, 2012. The increases are the result of rate increases in New Mexico and Texas, effective January 2012, partially offset by the impact of milder weather during the third quarter, higher depreciation expense and higher property taxes.
NSP-Wisconsin — NSP-Wisconsin’s ongoing earnings were flat for the third quarter of 2012 and for the nine months ended Sept. 30, 2012. Year-to-date ongoing earnings were positively impacted by rate increases, effective in January 2012, and the impact of warmer summer weather, offset by warmer winter weather.
4
The following table summarizes significant components contributing to the changes in the 2012 EPS compared with the same periods in 2011, which are discussed in more detail later in the release.
|
Diluted Earnings (Loss) Per Share
|
Three Months
Ended Sept. 30
|
Nine Months
Ended Sept. 30 |
||||||
|
2011 GAAP and ongoing(a) diluted earnings per share
|
$ | 0.69 | $ | 1.43 | ||||
|
Components of change — 2012 vs. 2011
|
||||||||
|
Higher electric margins
|
0.07 | 0.09 | ||||||
|
Higher natural gas margins
|
0.02 | - | ||||||
|
Higher AFUDC - Equity
|
0.01 | 0.01 | ||||||
|
Higher interest charges
|
(0.01 | ) | (0.02 | ) | ||||
|
Higher taxes (other than income taxes)
|
(0.01 | ) | (0.04 | ) | ||||
|
Lower conservation and DSM expenses (generally offset in revenues)
|
- | 0.03 | ||||||
|
Lower effective tax rate
|
- | 0.03 | ||||||
|
Other, net (including interest and premium on redemption of preferred stock)
|
0.01 | 0.01 | ||||||
|
2012 ongoing(a) diluted earnings per share
|
0.78 | 1.54 | ||||||
|
Prescription drug tax benefit (a)
|
0.03 | 0.03 | ||||||
|
2012 GAAP diluted earnings per share
|
$ | 0.81 | $ | 1.57 | ||||
|
(a)
|
See Note 6.
|
Note 2. Regulated Utility Results — Continuing Operations
Estimated Impact of Temperature Changes on Regulated Earnings — Unusually hot summers or cold winters increase electric and natural gas sales while, conversely, mild weather reduces electric and natural gas sales. The estimated impact of weather on earnings is based on the number of customers, temperature variances and the amount of natural gas or electricity the average customer historically uses per degree of temperature. Accordingly, deviations in weather from normal levels can affect Xcel Energy’s financial performance, from both an energy and demand perspective.
Degree-day or Temperature-Humidity Index (THI) data is used to estimate amounts of energy required to maintain comfortable indoor temperature levels based on each day’s average temperature and humidity. Heating degree-days (HDD) is the measure of the variation in the weather based on the extent to which the average daily temperature falls below 65° Fahrenheit, and cooling degree-days (CDD) is the measure of the variation in the weather based on the extent to which the average daily temperature rises above 65° Fahrenheit. Each degree of temperature above 65° Fahrenheit is counted as one cooling degree-day, and each degree of temperature below 65° Fahrenheit is counted as one heating degree-day. In Xcel Energy’s more humid service territories, a THI is used in place of CDD, which adds a humidity factor to CDD. HDD, CDD and THI are most likely to impact the usage of Xcel Energy’s residential and commercial customers. Industrial customers are less weather sensitive.
Normal weather conditions are defined as either the 20-year or 30-year average of actual historical weather conditions. The historical period of time used in the calculation of normal weather differs by jurisdiction based on the time period used by the regulator in establishing estimated volumes in the rate setting process. To calculate the impact of weather on demand, a demand factor is applied to the weather impact on sales as defined above to derive the amount of demand associated with the weather impact.
The percentage increase (decrease) in normal and actual HDD, CDD and THI are provided in the following table:
|
Three Months Ended Sept. 30
|
Nine Months Ended Sept. 30
|
|||||||||||||||||||||||
|
2012 vs.
Normal
|
2011 vs.
Normal
|
2012 vs.
2011
|
2012 vs.
Normal
|
2011 vs.
Normal
|
2012 vs.
2011
|
|||||||||||||||||||
|
HDD
|
(23.3 | ) % | (11.9 | ) % | (13.0 | ) % | (21.4 | ) % | 3.8 | % | (23.9 | ) % | ||||||||||||
|
CDD
|
33.1 | 38.6 | (4.2 | ) | 46.9 | 37.2 | 7.0 | |||||||||||||||||
|
THI
|
34.3 | 50.4 | (8.9 | ) | 37.2 | 36.0 | 2.4 | |||||||||||||||||
5
Weather — The following table summarizes the estimated impact of temperature variations on EPS compared with sales under normal weather conditions:
|
Three Months Ended Sept. 30
|
Nine Months Ended Sept. 30
|
|||||||||||||||||||||||
|
2012 vs.
Normal
|
2011 vs.
Normal
|
2012 vs.
2011
|
2012 vs.
Normal
|
2011 vs.
Normal
|
2012 vs.
2011
|
|||||||||||||||||||
|
Retail electric
|
$ | 0.076 | $ | 0.075 | $ | 0.001 | $ | 0.083 | $ | 0.086 | $ | (0.003 | ) | |||||||||||
|
Firm natural gas
|
(0.001 | ) | 0.000 | (0.001 | ) | (0.030 | ) | 0.008 | (0.038 | ) | ||||||||||||||
|
Total
|
$ | 0.075 | $ | 0.075 | $ | 0.000 | $ | 0.053 | $ | 0.094 | $ | (0.041 | ) | |||||||||||
In 2012, Xcel Energy refined its estimate to incorporate the impact of weather on demand charges. As a result, the estimated weather impact on earnings per share for prior periods has been adjusted for comparison purposes.
Sales Growth (Decline) — The following table summarizes Xcel Energy’s sales growth (decline) for actual and weather-normalized sales in 2012:
|
Three Months Ended Sept. 30
|
||||||||
|
Actual
|
Weather
Normalized
|
|||||||
|
Electric residential
|
(1.2 | ) % | (0.1 | ) % | ||||
|
Electric commercial and industrial
|
(0.9 | ) | (0.7 | ) | ||||
|
Total retail electric sales
|
(1.0 | ) | (0.6 | ) | ||||
|
Firm natural gas sales
|
(1.3 | ) | 0.3 | |||||
|
Nine Months Ended Sept. 30
|
Nine Months Ended Sept. 30
(Without Leap Day) |
|||||||||||||||
|
Actual
|
Weather
Normalized
|
Actual
|
Weather
Normalized
|
|||||||||||||
|
Electric residential
|
(1.4 | ) % | (0.1 | ) % | (1.8 | ) % | (0.5 | ) % | ||||||||
|
Electric commercial and industrial
|
0.2 | 0.1 | (0.1 | ) | (0.2 | ) | ||||||||||
|
Total retail electric sales
|
(0.3 | ) | 0.0 | (0.6 | ) | (0.3 | ) | |||||||||
|
Firm natural gas sales
|
(15.8 | ) | 0.0 | (16.4 | ) | (0.8 | ) | |||||||||
Electric — Electric revenues and fuel and purchased power expenses are largely impacted by the fluctuation in the price of natural gas, coal and uranium used in the generation of electricity, but as a result of the design of fuel recovery mechanisms to recover current expenses, these price fluctuations have little impact on electric margin. The following table details the electric revenues and margin:
|
Three Months Ended Sept. 30
|
Nine Months Ended Sept. 30
|
|||||||||||||||
|
(Millions of Dollars)
|
2012
|
2011
|
2012
|
2011
|
||||||||||||
|
Electric revenues
|
$ | 2,533 | $ | 2,619 | $ | 6,506 | $ | 6,778 | ||||||||
|
Electric fuel and purchased power
|
(1,007 | ) | (1,150 | ) | (2,725 | ) | (3,071 | ) | ||||||||
|
Electric margin
|
$ | 1,526 | $ | 1,469 | $ | 3,781 | $ | 3,707 | ||||||||
6
The following table summarizes the components of the changes in electric margin:
|
(Millions of Dollars)
|
Three Months
Ended Sept. 30
2012 vs. 2011
|
Nine Months
Ended Sept. 30
2012 vs. 2011
|
||||||
|
Retail rate increases (Colorado, Texas, New Mexico, Wisconsin, South Dakota,
|
||||||||
|
North Dakota, Michigan and Minnesota) (a)
|
$ | 46 | $ | 76 | ||||
|
Conservation and DSM incentive
|
13 | 18 | ||||||
|
Transmission revenue, net of costs
|
11 | 20 | ||||||
|
Firm wholesale (b)
|
(13 | ) | (36 | ) | ||||
|
Conservation and DSM revenue (offset by expenses)
|
- | (7 | ) | |||||
|
Estimated impact of weather
|
- | (3 | ) | |||||
|
Other, net
|
- | 6 | ||||||
|
Total increase in electric margin
|
$ | 57 | $ | 74 | ||||
|
(a)
|
NSP-Minnesota reduced depreciation expense and revenues by approximately $8 million in the third quarter of 2012 and $24 million for the nine months ended Sept. 30, 2012 to reflect the settlements in the 2011 Minnesota and South Dakota electric rate cases.
|
|
(b)
|
Decrease is primarily due to the expiration of a long-term wholesale power sales agreement with Black Hills Corp. effective Jan. 1, 2012.
|
Natural Gas — The cost of natural gas tends to vary with changing sales requirements and the cost of natural gas purchases. However, due to the design of purchased natural gas cost recovery mechanisms to recover current expenses for sales to retail customers, fluctuations in the cost of natural gas have little effect on natural gas margin. The following table details natural gas revenues and margin:
|
Three Months Ended Sept. 30
|
Nine Months Ended Sept. 30
|
|||||||||||||||
|
(Millions of Dollars)
|
2012
|
2011
|
2012
|
2011
|
||||||||||||
|
Natural gas revenues
|
$ | 175 | $ | 195 | $ | 1,017 | $ | 1,252 | ||||||||
|
Cost of natural gas sold and transported
|
(50 | ) | (87 | ) | (557 | ) | (794 | ) | ||||||||
|
Natural gas margin
|
$ | 125 | $ | 108 | $ | 460 | $ | 458 | ||||||||
The following table summarizes the components of the changes in natural gas margin:
|
(Millions of Dollars)
|
Three Months
Ended Sept. 30
2012 vs. 2011
|
Nine Months
Ended Sept. 30
2012 vs. 2011
|
||||||
|
Pipeline system integrity adjustment rider (Colorado) offset by expense
|
$ | 11 | $ | 22 | ||||
|
Retail rate increase (Colorado, Wisconsin)
|
7 | 16 | ||||||
|
Return on gas in storage
|
2 | 6 | ||||||
|
Conservation and DSM revenue (offset by expenses)
|
(1 | ) | (13 | ) | ||||
|
Estimated impact of weather
|
- | (28 | ) | |||||
|
Other, net
|
(2 | ) | (1 | ) | ||||
|
Total increase in natural gas margin
|
$ | 17 | $ | 2 | ||||
7
O&M Expenses — O&M expenses decreased $1.5 million, or 0.3 percent, for the third quarter of 2012 and increased $1.0 million, or 0.1 percent, for the nine months ended Sept. 30, 2012, compared with the same periods in 2011. The changes are primarily attributable to management cost savings initiatives, partially offset by higher employee benefit expense.
Conservation and DSM Program Expenses — Conservation and demand side management (DSM) program expenses decreased $2.4 million, or 3.3 percent, for the third quarter of 2012 and $20.8 million, or 9.8 percent, for the nine months ended Sept. 30, 2012, compared with the same periods in 2011. The lower expenses are primarily attributable to lower gas rider rates, as well as the timing of recovery of electric conservation improvement program expenses at NSP-Minnesota. Conservation and DSM program expenses are generally recovered in our major jurisdictions concurrently through riders and base rates.
Depreciation and Amortization — Depreciation and amortization decreased $3.3 million, or 1.4 percent, for the third quarter of 2012 and $2.0 million, or 0.3 percent, for the nine months ended Sept. 30, 2012, compared with the same periods in 2011. The decreases are primarily due to a change in depreciation lives for certain assets to reflect the settlements in the Minnesota and South Dakota electric rate cases, partially offset by normal system expansion across Xcel Energy’s service territories. This change in depreciation lives resulted in a reduction in depreciation expense of approximately $8 million for the third quarter of 2012 and approximately $24 million for the nine months ended Sept. 30, 2012.
Taxes (Other Than Income Taxes) — Taxes (other than income taxes) increased $11.6 million, or 13.1 percent, for the third quarter of 2012 and $27.8 million, or 10.0 percent, for the nine months ended Sept. 30, 2012, compared with the same periods in 2011. The increases are due to an increase in property taxes primarily in Minnesota. Higher property taxes in Colorado related to the electric retail business are being deferred, based on the multi-year rate settlement that was approved by the Colorado Public Utilities Commission (CPUC) in May 2012.
Allowance for Funds Used During Construction, Equity and Debt (AFUDC) — AFUDC increased $8.2 million for the third quarter of 2012 and $9.0 million for the nine months ended Sept. 30, 2012, compared with the same periods in 2011. The increases are primarily due to the expansion of PSCo’s transmission facilities, additional construction related to the Clean Air Clean Jobs Act and normal system expansion.
Interest Charges — Interest charges increased $5.7 million, or 3.9 percent, for the third quarter of 2012 and $18.8 million, or 4.3 percent, for the nine months ended Sept. 30, 2012, compared with the same periods in 2011. The increases are due to higher long-term debt levels to fund investment in utility operations, partially offset by lower interest rates.
Income Taxes — Income tax expense increased $9.5 million for the third quarter of 2012, compared with the same period in 2011. The increase in income tax expense was primarily due to an increase in pretax income in 2012, partially offset by a one time tax benefit related to the restoration of a portion of the tax benefit written off in 2010 associated with federal subsidies for prescription drug plans. The effective tax rate was 33.8 percent for the third quarter of 2012 compared with 36.4 percent for the same period in 2011. The lower effective tax rate for 2012 was primarily due to the adjustment referenced above. The effective tax rate would have been 36.6 percent for the third quarter of 2012 without this tax benefit.
Income tax expense decreased $9.7 million for the first nine months of 2012, compared with the same period in 2011. The decrease in income tax expense was primarily due to one time adjustments for a tax benefit associated with a carryback and a tax benefit related to the restoration of a portion of the tax benefit written off in 2010 associated with federal subsidies for prescription drug plans. As a result, Xcel Energy recognized discrete tax benefits of approximately $14.9 million for the carryback and $17 million for the tax benefit associated with the federal subsidies. These were partially offset by higher pretax income in 2012. The effective tax rate for continuing operations was 33.2 percent for the nine months ended Sept. 30, 2012 compared with 35.8 percent for the same period in 2011. The effective tax rate would have been 36.0 percent for the nine months ended Sept. 30, 2012 without these tax benefits.
8
Note 3. Xcel Energy Capital Structure, Financing and Credit Ratings
Following is the capital structure of Xcel Energy:
|
Percentage
|
||||||||
|
of Total
|
||||||||
|
(Billions of Dollars)
|
Sept. 30, 2012
|
Capitalization
|
||||||
|
Current portion of long-term debt
|
$ | 0.9 | 4 | % | ||||
|
Short-term debt
|
0.3 | 2 | ||||||
|
Long-term debt
|
10.1 | 50 | ||||||
|
Total debt
|
11.3 | 56 | ||||||
|
Common equity
|
8.8 | 44 | ||||||
|
Total capitalization
|
$ | 20.1 | 100 | % | ||||
Credit Facilities — As of Oct. 23, 2012, Xcel Energy Inc. and its utility subsidiaries had the following committed credit facilities available to meet its liquidity needs:
|
(Millions of Dollars)
|
Facility
|
Drawn(a)
|
Available
|
Cash
|
Liquidity
|
Maturity
|
|||||||||||||||
|
Xcel Energy Inc.
|
$ | 800.0 | $ | 216.0 | $ | 584.0 | $ | 0.1 | $ | 584.1 |
July 2017
|
||||||||||
|
PSCo
|
700.0 | 4.0 | 696.0 | 0.3 | 696.3 |
July 2017
|
|||||||||||||||
|
NSP-Minnesota
|
500.0 | 66.7 | 433.3 | 0.5 | 433.8 |
July 2017
|
|||||||||||||||
|
SPS
|
300.0 | - | 300.0 | 0.8 | 300.8 |
July 2017
|
|||||||||||||||
|
NSP-Wisconsin
|
150.0 | 10.0 | 140.0 | 0.2 | 140.2 |
July 2017
|
|||||||||||||||
|
Total
|
$ | 2,450.0 | $ | 296.7 | $ | 2,153.3 | $ | 1.9 | $ | 2,155.2 | |||||||||||
(a) Includes outstanding commercial paper and letters of credit.
Credit Ratings — Access to reasonably priced capital markets is dependent in part on credit and ratings. The following ratings reflect the views of Moody’s Investors Service (Moody’s), Standard & Poor’s Rating Services (Standard & Poor’s), and Fitch Ratings (Fitch).
In 2011, Moody’s placed SPS on negative outlook. On Oct. 8, 2012, Moody's downgraded SPS by one notch, based on the expected moderation of SPS’ credit metrics due to high levels of capital expenditures and regulatory lag. The outlook is now stable.
As of Oct. 23, 2012, the following represents the credit ratings assigned to Xcel Energy Inc. and its utility subsidiaries:
|
Company
|
Credit Type
|
Moody's
|
Standard & Poor's
|
Fitch
|
||||
|
Xcel Energy Inc.
|
Senior Unsecured Debt
|
Baa1
|
BBB+
|
BBB+
|
||||
|
Xcel Energy Inc.
|
Commercial Paper
|
P-2
|
A-2
|
F2
|
||||
|
NSP-Minnesota
|
Senior Unsecured Debt
|
A3
|
A-
|
A
|
||||
|
NSP-Minnesota
|
Senior Secured Debt
|
A1
|
A
|
A+
|
||||
|
NSP-Minnesota
|
Commercial Paper
|
P-2
|
A-2
|
F1
|
||||
|
NSP-Wisconsin
|
Senior Unsecured Debt
|
A3
|
A-
|
A
|
||||
|
NSP-Wisconsin
|
Senior Secured Debt
|
A1
|
A
|
A+
|
||||
|
NSP-Wisconsin
|
Commercial Paper
|
P-2
|
A-2
|
F1
|
||||
|
PSCo
|
Senior Unsecured Debt
|
Baa1
|
A-
|
A-
|
||||
|
PSCo
|
Senior Secured Debt
|
A2
|
A
|
A
|
||||
|
PSCo
|
Commercial Paper
|
P-2
|
A-2
|
F2
|
||||
|
SPS
|
Senior Unsecured Debt
|
Baa2
|
A-
|
BBB+
|
||||
|
SPS
|
Senior Secured Debt
|
A3
|
A-
|
A-
|
||||
|
SPS
|
Commercial Paper
|
P-2
|
A-2
|
F2
|
The highest credit rating for debt is Aaa/AAA and the lowest investment grade rating is Baa3/BBB-. The highest ratings for commercial paper is P-1/A-1/F-1 and the lowest rating is P-3/A-3/F-3. A security rating is not a recommendation to buy, sell or hold securities. Ratings are subject to revision or withdrawal at any time by the credit rating agency and each rating should be evaluated independently of any other rating.
9
Capital Expenditures — The estimated capital expenditure programs of Xcel Energy Inc. and its subsidiaries for the years 2013 through 2017 are shown in the table below.
|
(Millions of Dollars)
|
2013
|
2014
|
2015
|
2016
|
2017
|
|||||||||||||||
|
By Subsidiary
|
||||||||||||||||||||
|
NSP-Minnesota
|
$ | 1,440 | $ | 1,160 | $ | 950 | $ | 970 | $ | 1,130 | ||||||||||
|
PSCo
|
1,075 | 1,000 | 850 | 800 | 840 | |||||||||||||||
|
SPS
|
490 | 400 | 305 | 300 | 345 | |||||||||||||||
|
NSP-Wisconsin
|
180 | 240 | 245 | 230 | 235 | |||||||||||||||
|
WYCO
|
15 | - | - | - | - | |||||||||||||||
|
Total capital expenditures
|
$ | 3,200 | $ | 2,800 | $ | 2,350 | $ | 2,300 | $ | 2,550 | ||||||||||
|
By Function
|
2013
|
2014
|
2015
|
2016
|
2017
|
|||||||||||||||
|
Electric generation
|
$ | 1,070 | $ | 735 | $ | 590 | $ | 510 | $ | 620 | ||||||||||
|
Electric transmission
|
1,010 | 870 | 650 | 635 | 770 | |||||||||||||||
|
Electric distribution
|
515 | 525 | 525 | 535 | 545 | |||||||||||||||
|
Natural gas
|
355 | 365 | 335 | 325 | 320 | |||||||||||||||
|
Nuclear fuel
|
95 | 155 | 100 | 140 | 145 | |||||||||||||||
|
Other
|
155 | 150 | 150 | 155 | 150 | |||||||||||||||
|
Total capital expenditures
|
$ | 3,200 | $ | 2,800 | $ | 2,350 | $ | 2,300 | $ | 2,550 | ||||||||||
|
By Project
|
2013
|
2014
|
2015
|
2016
|
2017
|
|||||||||||||||
|
Other capital expenditures
|
$ | 1,710 | $ | 1,610 | $ | 1,555 | $ | 1,600 | $ | 1,755 | ||||||||||
|
CapX2020 transmission project
|
350 | 295 | 140 | - | - | |||||||||||||||
|
PSCo Clean Air-Clean Jobs Act (CACJA)
|
345 | 235 | 90 | 15 | - | |||||||||||||||
|
Nuclear capacity increases and life extension
|
315 | 75 | 100 | 95 | 100 | |||||||||||||||
|
Other major transmission projects
|
245 | 260 | 175 | 320 | 415 | |||||||||||||||
|
Natural gas pipeline replacement
|
140 | 170 | 190 | 130 | 135 | |||||||||||||||
|
Nuclear fuel
|
95 | 155 | 100 | 140 | 145 | |||||||||||||||
|
Total capital expenditures
|
$ | 3,200 | $ | 2,800 | $ | 2,350 | $ | 2,300 | $ | 2,550 | ||||||||||
The capital expenditure programs of Xcel Energy are subject to continuing review and modification. Actual utility construction expenditures may vary from the estimates due to changes in electric and natural gas projected load growth, regulatory decisions, legislative initiatives, reserve margins, the availability of purchased power, alternative plans for meeting long-term energy needs, compliance with future environmental requirements, renewable portfolio standards, and merger, acquisition and divestiture opportunities to support corporate strategies.
10
Estimated Future Financing Plans — The estimated financing of Xcel Energy Inc. and its subsidiaries for the years 2013 through 2017 are shown in the table below.
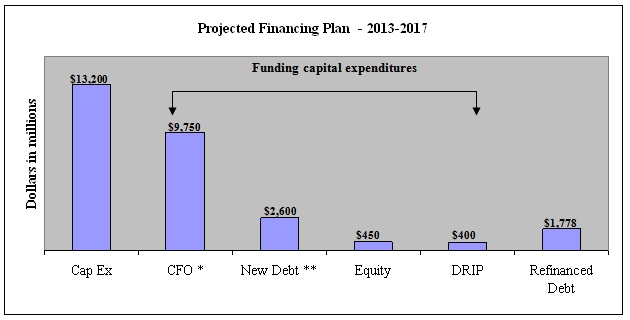
* Cash from operations, net of dividend and pension funding.
** Reflects a combination of short and long-term debt.
Financing plans are subject to change, depending on capital expenditures, internal cash generation, market conditions and other factors.
2012 Financing — Xcel Energy issues debt and equity securities to refinance retiring maturities, reduce short-term debt, fund construction programs, infuse equity in subsidiaries, fund asset acquisitions and for other general corporate purposes.
Xcel Energy Inc. and its utility subsidiaries completed the following financing in 2012:
|
|
·
|
In June, SPS issued $100 million of 30-year first mortgage bonds with a coupon of 4.50 percent.
|
|
|
·
|
In August, NSP-Minnesota issued $300 million of 10-year first mortgage bonds with a coupon of 2.15 percent, and $500 million of 30-year first mortgage bonds with a coupon of 3.40 percent.
|
|
|
·
|
In September, PSCo issued $300 million of 10-year first mortgage bonds with a coupon of 2.25 percent, and $500 million of 30-year first mortgage bonds with a coupon of 3.60 percent.
|
|
|
·
|
In October, NSP-Wisconsin issued $100 million of 30-year first mortgage bonds with a coupon of 3.70 percent.
|
Note 4. Rates and Regulation
NSP-Minnesota – South Dakota 2012 Electric Rate Case — In June 2012, NSP-Minnesota filed a request with the South Dakota Public Utilities Commission (SDPUC) to increase electric rates by $19.4 million annually. The request was based on a 2011 historic test year adjusted for known and measurable changes for 2012 and 2013, a requested return on equity (ROE) of 10.65 percent, an average rate base of $367.5 million and an equity ratio of 52.89 percent. Discovery is being conducted and a procedural schedule has not been established. A SDPUC decision is expected in late 2012 or early 2013.
11
NSP-Wisconsin – 2012 Electric and Gas Rate Case — In June 2012, NSP-Wisconsin filed a request with the Public Service Commission of Wisconsin (PSCW) to increase rates for electric and natural gas service effective Jan. 1, 2013. NSP-Wisconsin requested an overall increase in annual electric rates of $39.1 million, or 6.7 percent, and an increase in natural gas rates of $5.3 million, or 4.9 percent.
The electric rate filing was based on a 2013 forecast test year, an ROE of 10.40 percent, an equity ratio of 52.50 percent and an average 2013 electric rate base of approximately $788.6 million. The natural gas rate request was solely due to a proposal to recover the initial costs associated with the environmental cleanup of a site in Ashland, Wis. (Ashland site).
On Oct. 19, 2012, the PSCW Staff and intervenors filed their direct testimony. The PSCW Staff recommended an electric rate increase of $32.9 million, or 5.6 percent, based on a 10.40 percent ROE and a 52.50 percent equity ratio. The major adjustments recommended by the PSCW Staff were a $2.2 million reduction in employee compensation expense primarily related to disallowance of the annual incentive program, and a net $2.9 million reduction in electric fuel expense and fixed production charges. The PSCW Staff testimony acknowledged the unique issues before the PSCW related to the Ashland site cleanup and presented several alternatives for consideration by the PSCW.
Rebuttal testimony is expected to be filed on Oct. 31, 2012, and the hearing is expected to be held on Nov. 7, 2012. A PSCW decision is anticipated in December 2012.
PSCo – SmartGridCity™ (SGC) Cost Recovery — PSCo requested recovery of the revenue requirements associated with $45 million of capital and $4 million of annual O&M costs incurred to develop and operate SGC as part of its 2010 electric rate case. In February 2011, the CPUC allowed recovery of approximately $28 million of the capital cost and all of the O&M costs.
In December 2011, PSCo requested CPUC approval for the recovery of the remaining capital investment in SGC and also provided the additional information requested. In June 2012, the City of Boulder and the Colorado Office of Consumer Counsel filed testimony and recommended the CPUC deny PSCo’s request for recovery of the remaining portion of the SGC investment. The Administrative Law Judge (ALJ) is expected to recommend a decision in the fourth quarter of 2012. Parties will have an opportunity to appeal the ALJ’s recommended decision by filing exceptions. The CPUC will consider the recommendation from the ALJ as well as the positions of the parties before they render a decision. If no party seeks exceptions, the ALJ’s decision will become final.
Note 5. Xcel Energy Earnings Guidance
Xcel Energy’s 2012 ongoing earnings guidance range is $1.75 to $1.85 per share. Xcel Energy anticipates that 2012 GAAP earnings will be in the upper half of the guidance range of $1.75 to $1.85 per share. Key assumptions related to earnings are detailed below:
|
|
·
|
Constructive outcomes in all remaining rate case and regulatory proceedings.
|
|
|
·
|
Normal weather patterns are experienced for the remainder of the year.
|
|
|
·
|
Weather-adjusted retail electric utility sales are projected to be relatively flat.
|
|
|
·
|
Weather-adjusted retail firm natural gas sales are projected to decline by approximately 1 percent.
|
|
|
·
|
Rider revenue recovery for certain projects have been rolled into base rates, therefore the change is no longer meaningful.
|
|
|
·
|
O&M expenses are projected to increase approximately 2 percent over 2011 levels.
|
|
|
·
|
Depreciation and amortization expense is projected to increase $40 million to $45 million over 2011 levels.
|
|
|
·
|
Property taxes are projected to increase $25 million to $30 million over 2011 levels.
|
|
|
·
|
Interest expense (net of AFUDC — debt) is projected to increase approximately $0 to $10 million.
|
|
|
·
|
AFUDC — equity is projected to increase approximately $15 million to $20 million over 2011 levels.
|
|
|
·
|
The effective tax rate is projected to be approximately 34 percent to 35 percent.
|
|
|
·
|
Average common stock and equivalents are projected to be approximately 488 million shares.
|
12
Xcel Energy’s 2013 ongoing earnings guidance is $1.85 to $1.95 per share. Key assumptions related to 2013 ongoing earnings are detailed below:
|
|
·
|
Constructive outcomes in all rate case and regulatory proceedings.
|
|
|
·
|
Normal weather patterns are experienced for the year.
|
|
|
·
|
Weather-adjusted retail electric utility sales are projected to grow approximately 0.5 percent.
|
|
|
·
|
Weather-adjusted retail firm natural gas sales are projected to decline by approximately 1 percent.
|
|
|
·
|
Rider revenue recovery for certain projects have been rolled into base rates, therefore the change is no longer meaningful.
|
|
|
·
|
O&M expenses are projected to increase approximately 4 percent to 5 percent over 2012 projected levels.
|
|
|
·
|
Depreciation expense is projected to increase $70 million to $80 million over 2012 projected levels.
|
|
|
·
|
Property taxes are projected to increase approximately $35 million over projected 2012 levels.
|
|
|
·
|
Interest expense (net of AFUDC — debt) is projected to decrease $30 million to $35 million from 2012 projected levels.
|
|
|
·
|
AFUDC — equity is projected to increase approximately $15 million to $20 million over 2012 projected levels.
|
|
|
·
|
The effective tax rate is projected to be approximately 34 percent to 36 percent.
|
|
|
·
|
Average common stock and equivalents are projected to be approximately 490 million to 500 million shares.
|
Note 6. Non-GAAP Reconciliation
Xcel Energy’s management believes that ongoing earnings provide a meaningful comparison of earnings results and is representative of Xcel Energy’s fundamental core earnings power. Xcel Energy’s management uses ongoing earnings internally for financial planning and analysis, for reporting of results to the Board of Directors, in determining whether performance targets are met for performance-based compensation, and when communicating its earnings outlook to analysts and investors.
The following table provides a reconciliation of ongoing earnings to GAAP earnings:
|
Three Months Ended Sept. 30
|
Nine Months Ended Sept. 30
|
|||||||||||||||
|
(Thousands of Dollars)
|
2012
|
2011
|
2012
|
2011
|
||||||||||||
|
Ongoing earnings
|
$ | 381,203 | $ | 338,295 | $ | 748,047 | $ | 700,433 | ||||||||
|
Prescription drug tax benefit
|
16,944 | - | 16,944 | - | ||||||||||||
|
Total continuing operations
|
398,147 | 338,295 | 764,991 | 700,433 | ||||||||||||
|
(Loss) income from discontinued operations
|
(41 | ) | 37 | 68 | 230 | |||||||||||
|
GAAP earnings
|
$ | 398,106 | $ | 338,332 | $ | 765,059 | $ | 700,663 | ||||||||
Impact of the Patient Protection and Affordable Care Act — In March 2010, the Patient Protection and Affordable Care Act was signed into law. The law includes provisions to generate tax revenue to help offset the cost of the new legislation. One of these provisions reduces the deductibility of retiree health care costs to the extent of federal subsidies received by plan sponsors that provide retiree prescription drug benefits equivalent to Medicare Part D coverage, beginning in 2013. Xcel Energy expensed approximately $17 million of previously recognized tax benefits relating to the federal subsidies during the first quarter of 2010.
In the third quarter of 2012, Xcel Energy implemented a tax strategy related to the allocation of funding of Xcel Energy’s retiree prescription drug plan. This strategy restored a portion of the tax benefit associated with federal subsidies for prescription drug plans that had been accrued since 2004 and was expensed in 2010. As a result, Xcel Energy recognized approximately $17 million of income tax benefit.
13
XCEL ENERGY INC. AND SUBSIDIARIES
EARNINGS RELEASE SUMMARY (Unaudited)
(amounts in thousands, except per share data)
|
Three Months Ended Sept. 30
|
||||||||
|
2012
|
2011
|
|||||||
|
Operating revenues:
|
||||||||
|
Electric and natural gas revenues
|
$ | 2,707,222 | $ | 2,814,354 | ||||
|
Other
|
17,119 | 17,244 | ||||||
|
Total operating revenues
|
2,724,341 | 2,831,598 | ||||||
|
Income from continuing operations
|
398,147 | 338,295 | ||||||
|
(Loss) income from discontinued operations
|
(41 | ) | 37 | |||||
|
Net income
|
$ | 398,106 | $ | 338,332 | ||||
|
Earnings available to common shareholders
|
$ | 398,106 | $ | 333,658 | ||||
|
Weighted average diluted common shares outstanding
|
488,578 | 485,894 | ||||||
|
Components of Earnings per Share — Diluted
|
||||||||
|
Regulated utility — continuing operations
|
$ | 0.81 | $ | 0.73 | ||||
|
Xcel Energy Inc. and other costs
|
(0.03 | ) | (0.04 | ) | ||||
|
Ongoing(a) diluted earnings per share
|
0.78 | 0.69 | ||||||
|
Prescription drug tax benefit (a)
|
0.03 | - | ||||||
|
GAAP diluted earnings per share
|
$ | 0.81 | $ | 0.69 | ||||
|
Nine Months Ended Sept. 30
|
||||||||
|
2012
|
2011
|
|||||||
|
Operating revenues:
|
||||||||
|
Electric and natural gas revenues
|
$ | 7,523,181 | $ | 8,029,610 | ||||
|
Other
|
53,907 | 56,750 | ||||||
|
Total operating revenues
|
7,577,088 | 8,086,360 | ||||||
|
Income from continuing operations
|
764,991 | 700,433 | ||||||
|
Income from discontinued operations
|
68 | 230 | ||||||
|
Net income
|
$ | 765,059 | $ | 700,663 | ||||
|
Earnings available to common shareholders
|
$ | 765,059 | $ | 693,869 | ||||
|
Weighted average diluted common shares outstanding
|
488,198 | 485,152 | ||||||
|
Components of Earnings per Share — Diluted
|
||||||||
|
Regulated utility — continuing operations
|
$ | 1.64 | $ | 1.54 | ||||
|
Xcel Energy Inc. and other costs
|
(0.10 | ) | (0.11 | ) | ||||
|
Ongoing(a) diluted earnings per share
|
1.54 | 1.43 | ||||||
|
Prescription drug tax benefit (a)
|
0.03 | - | ||||||
|
GAAP diluted earnings per share
|
1.57 | 1.43 | ||||||
|
Book value per share
|
$ | 18.15 | $ | 17.39 | ||||
(a)See Note 6.
14