Exhibit 99.1
 |
News Release
For further information, please contact: |
| 5790 Widewaters Parkway, DeWitt, N.Y. 13214 |
Joseph E.
Sutaris, EVP & Chief Financial Officer
Office: (315) 445-7396 |
Community
Bank System Reports
Third
Quarter 2020 Results and COVID-19 Pandemic Update
SYRACUSE, N.Y. — October 26, 2020 — Community
Bank System, Inc. (NYSE: CBU) reported third quarter 2020 net income of $42.8 million, or $0.79 per fully-diluted share. This
compares to net income of $39.2 million, or $0.75 per share, for the third quarter of 2019 and $35.2 million, or $0.66 per share,
in the second quarter of 2020. The $0.04, or 5.3%, increase in earnings per share year-over-year was driven by a significant decrease
in acquisition-related expenses, as well as increases in both net interest income and noninterest revenues, offset, in part, by
increases in provision for credit losses, non-acquisition related operating expenses, income taxes and fully-diluted shares outstanding,
as well as litigation reserve expense. The $0.13, or 19.7%, increase in earnings per share from the linked second quarter was largely
driven by significantly lower acquisition-related expenses, an increase in net interest income, an increase in noninterest revenues,
and a significant decrease in the provision for credit losses, offset, in part, by increases in non-acquisition related operating
expenses, litigation reserve expense, income taxes and fully-diluted shares outstanding. Operating diluted earnings per share (non-GAAP),
which excludes, on an after-tax basis, acquisition expenses, acquisition related provision for credit losses, litigation reserve
expense and unrealized loss on equity securities, were $0.85 for the third quarter of 2020. This compares to operating diluted
earnings per share (non-GAAP) of $0.84 for the third quarter of 2019 and $0.76 for the second quarter of 2020.
Third Quarter 2020 Highlights:
| v | GAAP EPS of $0.79, up $0.04, or 5.3%, over the third quarter of 2019 |
| v | Operating diluted EPS (non-GAAP) of $0.85, up $0.01 over the third quarter of 2019 and $0.09 over the linked second quarter |
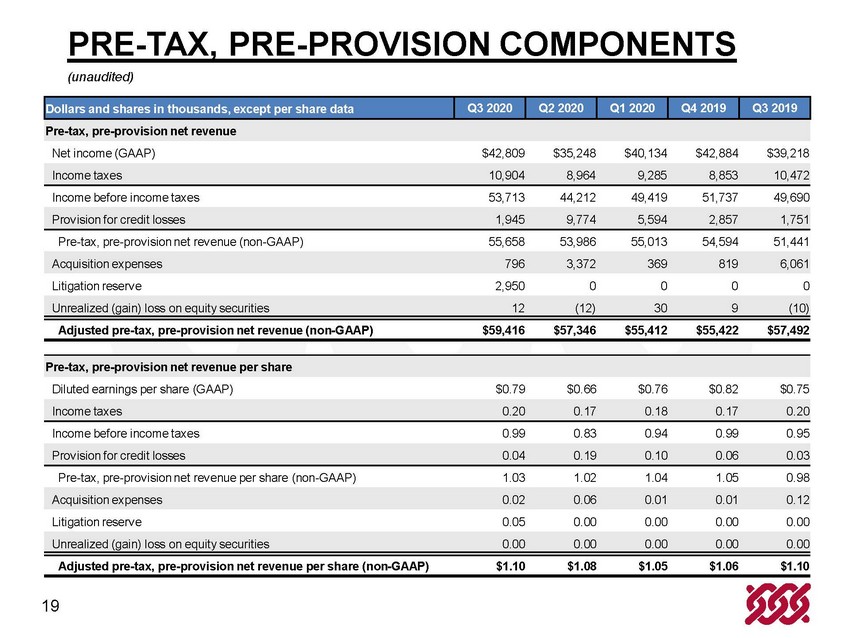
| v | Adjusted pre-tax, pre-provision net revenue per share (non-GAAP) of $1.10, consistent with the third quarter of 2019 and up
$0.02 over the linked second quarter |
| v | Return on equity of 8.13%; Return on tangible equity (non-GAAP) of 13.22% |
| v | Return on assets of 1.26%; Return on assets – adjusted (non-GAAP) of 1.40% |
| v | Deposit funding costs of 0.13% |
| v | Total revenues of $152.6 million increased $7.7 million, or 5.3%, over the second quarter of 2020 |
| v | Noninterest revenues represented 39.2% of operating revenues |
| v | Annualized net charge-offs of 0.07% |
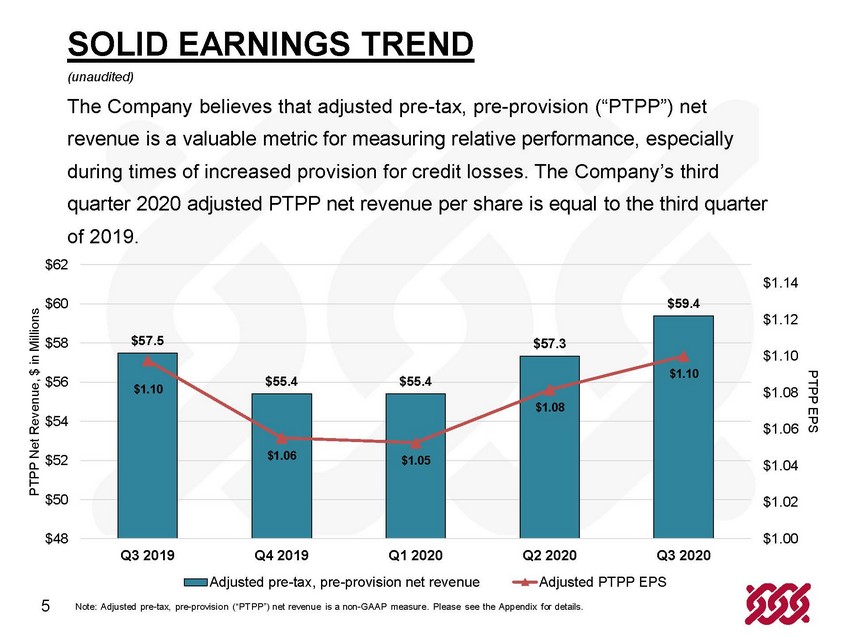
“The Company generated very strong results in the third
quarter despite of the significant challenges posed by the COVID-19 pandemic and related market conditions,” said Mark E.
Tryniski, President and CEO. “Operating earnings per share increased $0.01, or 1.2%, from the prior year’s third quarter
and $0.09, or 11.8%, on a linked quarter basis. The Company’s adjusted pre-tax, pre-provision net revenue per share of $1.10
matched the third quarter 2019 results. Total revenues were up $7.7 million, or 5.3%, over the second quarter of 2020 as we recorded
increases in net interest income, banking noninterest revenues, employee benefit services revenues and wealth management and insurance
services revenues. The strength of our nonbanking businesses is becoming increasingly evident as the pandemic continues to run
its course. On a year-to-date basis, the total revenues from our nonbanking business are up $3.6 million, or 3.1%. From an asset quality perspective, the Company experienced a significant decrease in the number
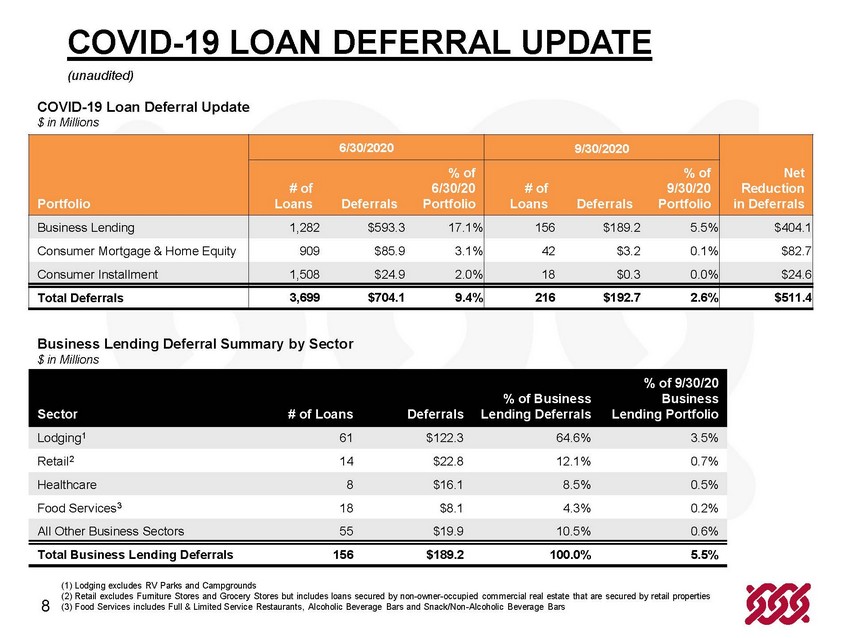
and outstanding balances of loans under COVID-related forbearance. At September 30, 2020, 216 borrowers, representing $193
million of loans outstanding, or 2.6% of total loans, remained under a forbearance agreement, which is down from 3,699 borrowers,
representing $704 million of loans outstanding, or 9.4% of total loans at June 30, 2020. Although we expect to experience
an increase in nonperforming loans, loan delinquency and potentially net-charge offs in future periods, through the end of the
third quarter these credit metrics remained generally consistent with pre-COVID levels. On a year-to-date basis, annualized net
charge-offs to average loans were just seven basis points. Nonperforming loans to total loans outstanding stood at 0.43% and delinquent
loans to total loans outstanding were 0.79%. Loans outstanding at the end of the third quarter decreased $69.4 million, or 0.9%
from the end of the linked second quarter due to weak economic conditions, but deposit levels remain extraordinarily high due primarily
to the retention of a significant portion of Federal stimulus-related funds received by customers.”
Mr. Tryniski added, “Although we expect to continue
to navigate strong industry headwinds, particularly around asset quality, net interest margin, and current and future federal monetary
and fiscal policies, we believe our Company remains well-prepared to withstand their impacts. The Company continues to maintain
very high levels of capital and liquidity, diversified revenue streams through its nonbanking businesses, strong credit performance
and an exceptional core deposit base.”
The Company recorded total revenues of $152.6 million in the
third quarter of 2020, an increase of $4.3 million, or 2.9%, from the prior year’s third quarter. The increase in total
revenues between the periods was driven by a $1.7 million, or 1.9%, increase in net interest income, a $4.0 million increase in
mortgage banking revenues, a $0.8 million, or 3.4%, increase in employee benefit services revenues and a $0.5 million, or 3.6%,
increase in wealth management and insurance services revenues, offset, in part, by a $2.8 million, or 15.7%, decrease in deposit
service and other banking fees. Total revenues were up $7.7 million, or 5.3%, on a linked quarter basis. The Company recorded a
$1.0 million, or 1.1%, increase in net interest income, a $2.3 million, or 17.4% increase in deposit service and other banking
fees, a $2.5 million, or 184%, increase in mortgage banking revenue, a $1.1 million, or 4.5%, increase in employee benefit service
revenues, and a $0.9 million, or 6.0%, increase in wealth management and insurance services revenues on a linked quarter basis.
The Company recorded net interest income of $93.0 million in
the third quarter of 2020. This represents a $1.7 million, or 1.9%, increase over the third quarter of 2019. The increase was driven
by a $2.15 billion, or 21.9%, increase in average earning assets between the periods, offset, in part by a 61 basis point decrease
in the net interest margin. The increase in earning assets was driven by large net inflows of funds from government stimulus programs,
Paycheck Protection Program (“PPP”) loan originations and the acquisition of Steuben Trust Corporation (“Steuben”)
in the second quarter of 2020. The 61 basis point decrease in net interest margin was driven by a 75 basis point decrease in tax-equivalent
earning asset yields between the periods, partially offset by a 16 basis point decrease in the total cost of funds. The large drop
in earning asset yields was due to a significant decrease in market interest rates between the periods and a significant change
in the composition of earning assets, including a $635.1 million increase in average cash equivalents that earned only a 0.10%
yield during the third quarter of 2020. This compares to a yield of 2.19% earned on cash equivalents during the third quarter of
2019.
Interest income and fees on loans decreased $0.3 million, or
0.4%, over the comparable prior year quarter. Although average loans outstanding increased substantially over the comparable prior
year quarter, interest income and fees on loans decreased modestly due to a significant decrease in market interest rates. Average
loans outstanding increased $773.1 million, or 11.5% year-over-year due to the Steuben acquisition and the origination of PPP loans,
while the average yield on loans decreased 49 basis points, from 4.72% in the third quarter of 2019 to 4.23% in the third quarter
of 2020. Interest income on investments, including cash equivalents, decreased $0.9 million, or 4.7%, between the third quarter
of 2019 and the third quarter of 2020. The decrease is reflective of lower market interest rates and a significant increase in
the proportion of low-yield cash equivalents, offset, in part, by a $743.7 million, or 30.9%, increase in the average book value
of investments. The tax-equivalent average yield on investments, including cash equivalents, decreased from 2.52% in the third
quarter of 2019 to 1.67% in the third quarter of 2020. Interest expense was $2.8 million lower than the previous year’s third
quarter, driven by a 20 basis point decrease in the cost on interest-bearing liabilities partially offset by a $1.16 billion, or
17.2%, increase in average interest-bearing liability balances. The average cost of deposits was 0.13% in the third quarter of
2020, as compared to 0.26% in the third quarter of 2019, reflective of market driven rate decreases for deposits between the periods
and significant increases in noninterest bearing deposit balances. By comparison, the average cost of deposits during the second
quarter of 2020 was 0.17%.
The Company recorded $1.9 million in the provision for credit
losses during the third quarter of 2020. This amount is significantly less than the amounts recorded in the prior two quarters
of 2020 and only $0.1 million greater than the amount recorded in the third quarter of 2019. The Company recorded $5.6 million
in the provision for credit losses during the first quarter and $9.8 million in the second quarter. The second quarter provision
for credit losses included $3.2 million of acquisition-related provision for credit losses due to the Company’s acquisition
of Steuben with the remaining $6.6 million largely attributable to COVID-19 related factors. The decrease in the provision for
credit losses during the third quarter, as compared to the prior two quarters, was due to improving economic conditions, modest
levels of delinquent and nonperforming loans, a decrease in loans outstanding, low levels of net charge-offs and a large decrease
in the number and amount of the Company’s loan balances subject to borrower forbearance. During the first two quarters of
2020 during the height of the COVID-19 pandemic, financial conditions deteriorated rapidly as state governments shutdown business
activities in the Company’s markets and unemployment levels spiked. These conditions drove the Company to build its allowance
for credit losses during the first two quarters of 2020 to account for expected life of loan losses in the loan portfolio. It is
expected that improving conditions, including a continued decline in unemployment rates, will have a dampening impact on provision
amounts in the coming quarters. However, this may be offset by the Company’s anticipation that there may be a significant
increase in delinquency and nonperforming loan balances in future quarters due to it being unlikely that all COVID-affected borrowers
will resume full payment of contractual amounts upon expiration of their forbearance agreement. The Company recorded loan net charge-offs
of $1.3 million, or 0.07% annualized, during the third quarter of 2020. Comparatively, loan net-charge offs in the third quarter
of 2019 were $1.6 million, or 0.10% annualized. On a year-to-date basis, the Company recorded net charge-offs of $3.7 million,
or 0.07% annualized. This compares to $5.4 million, or 0.11% annualized, for the nine-month period ended September 30, 2019.
Since the ultimate effect the COVID-19 pandemic will have on the Company’s credit losses is still unknown and highly uncertain,
the decrease in the provision for credit losses during the third quarter should not be interpreted as a trend or utilized to forecast
provision in future quarters. It is possible that the provision will be somewhat uncertain in future quarters as credit loss expectations
change and borrowers’ financial conditions and circumstances become more apparent.
The Company recorded $59.7 million in noninterest revenues in
the third quarter of 2020, as compared to $57.1 million in the third quarter of 2019. This represents a $2.6 million, or 4.5%,
increase in noninterest revenues between the periods, $1.2 million of which is attributable to banking-related noninterest revenues
and $1.4 million is related to nonbanking noninterest revenues. The increase in banking noninterest revenues was due to a $4.0
million increase in mortgage banking revenues, offset, in part, by a $2.8 million decrease in deposit service and other banking
fees. Between the periods, the Company increased its commitment to sell secondary market eligible residential mortgage loans, which
drove an increase in mortgage banking revenue from a $0.1 million loss in the third quarter of 2019 to a $3.9 million net gain
in the third quarter of 2020. The decrease in deposit service and other banking fees was driven by lower overdraft and other deposit
revenues, offset partially by higher debit card interchange revenues. Employee benefit services revenues for the third quarter
of 2020 were $25.2 million. This represents a $0.8 million, or 3.4%, increase over third quarter 2019 and is attributable to increases
in plan administration, recordkeeping and trustee fees. The Company recorded $15.4 million in wealth management and insurance services
revenues during the third quarter of 2020, as compared to $14.9 million during the third quarter of 2019. The $0.5 million, or
3.6%, increase in wealth management and insurance revenues was attributable to organic growth in those businesses. Noninterest
revenues increased $6.7 million, or 12.7%, on a linked quarter basis. This was driven by a $4.8 million, or 33.4%, increase in
banking-related revenues including a $2.3 million, or 17.4%, increase in deposit service and other banking revenues and a $2.5
million, or 184%, increase in mortgage banking revenues. Wealth management and insurance services revenues increased $0.9 million,
or 6.0%, between linked quarters, while employee benefit services revenues increased, $1.1 million, or 4.5%.
The Company recorded $97.0 million in total operating expenses
in the third quarter of 2020. This compares to $96.9 million of total operating expenses recorded in the third quarter of 2019,
and $90.9 million recorded in the linked second quarter of 2020. During the third quarter of 2020, the Company incurred $0.8 million
of acquisition-related expenses and $3.0 million of litigation reserve expense. Exclusive of these items, the Company recorded
$93.2 million of operating expenses in the third quarter of 2020. This compares to $90.9 million in operating expenses recorded
in the third quarter of 2019, exclusive of $6.1 million of acquisition-related expenses, and $87.5 million in operating expenses
in the linked second quarter of 2020, exclusive of $3.4 million of acquisition-related expenses. The acquisition expenses recorded
in the second and third quarters of 2020 were incurred in connection with the Company’s acquisition of Steuben. The acquisition
expenses recorded in the third quarter of 2019 were incurred in connection with the Company’s acquisition of Kinderhook Bank
Corp. The litigation reserve expense recorded in the third quarter of 2020, was due to the accrual of estimated loss from an overdraft
disclosure class action lawsuit brought against the Company. The $2.3 million, or 2.6%, year-over-year increase in operating expenses
between quarters was attributable to a $1.2 million, or 2.2%, increase in salaries and employee benefits, a $1.4 million, or 13.3%,
increase in data processing and communications expenses, a $0.3 million, or 3.4%, increase in occupancy and equipment expense,
offset, in part, by a $0.2 million, or 2.3%, decrease in other expenses and a $0.4 million, or 9.6%, decrease in amortization of
intangible assets. Although the Company continued to experience reduced levels of business activities during the third quarter
of 2020 due to the ongoing COVID-19 pandemic, the resumption of certain marketing and business development activities and incremental
costs associated with operating a larger organization as a result of the acquisition of Steuben, resulted in a $2.3 million, or
2.6%, net increase in operating expenses. The $5.7 million, or 6.5%, increase in operating expenses between the third quarter of
2020 and the linked second quarter was driven by a $2.6 million, or 4.7% increase in salaries and employee benefits, a $1.3 million,
or 11.7%, increase in data processing and communications expenses, a $0.4 million, or 3.9%, increase in occupancy and equipment
expenses and a $1.4 million, or 16.4%, increase in other expenses. The effective tax rate for the third quarter of 2020 was 20.3%,
consistent with the second quarter of 2020, but down from 21.1% in the third quarter of 2019.
The Company also provides supplemental reporting of its results
on an “operating,” “adjusted” or “tangible” basis, from which it excludes the after-tax effect
of amortization of core deposit and other intangible assets (and the related goodwill, core deposit intangible and other intangible
asset balances, net of applicable deferred tax amounts), accretion on non-impaired purchased loans, expenses associated with acquisitions,
acquisition-related provision for credit losses, litigation reserve expense, the unrealized gain (loss) on equity securities and
net gain on sale of investments. In addition, the Company provides supplemental reporting for “adjusted pre-tax, pre-provision
net revenues,” which subtracts the provision for credit losses, acquisition expenses, litigation reserve expense, net gain
on sale of investments and unrealized gain (loss) on equity securities from income before income taxes. The amounts for such items
are presented in the tables that accompany this release. Although these items are non-GAAP measures, the Company’s management
believes this information helps investors understand the effect of acquisition and other non-recurring activity in its reported
results. Diluted adjusted net earnings per share were $0.88 in both the third quarter of 2020 and third quarter of 2019. Similarly,
adjusted pre-tax, pre-provision net revenue per share in both the third quarters of 2020 and 2019 were $1.10, as compared to $1.08
in the second quarter of 2020.
Financial Position
The Company’s total assets increased to $13.85 billion
at September 30, 2020, which represents a $2.25 billion, or 19.4% increase over the last twelve months and a $401.1 million,
or 3.0%, increase over the prior quarter end. The substantial increase in the Company’s total assets over the last twelve
months was largely due to the Steuben acquisition in the second quarter of 2020 and the very large inflows of government stimulus-related
deposit funding between the periods. Similarly, average earning assets increased substantially over the prior year, from $9.81
billion in the third quarter of 2019 to $11.96 billion in the third quarter of 2020, a $2.15 billion, or 21.9% increase. This included
a $773.1 million, or 11.5%, increase in average total loans outstanding, a $743.7 million, or 30.9%, increase in average total
investment securities and a $635.1 million, or 95.4%, increase in average outstanding cash equivalents. On a linked quarter basis,
average earning assets increased $852.5 million, or 7.7%, due largely to net inflows of government stimulus funds, with average
outstanding cash equivalents increasing $478.0 million, or 58.1%. Average loan balances increased $289.4 million, or 4.0%, due
primarily to the Steuben acquisition and higher average PPP loan balances. The average book value of investment securities increased
$85.1 million, or 2.8%, from the linked second quarter due to the Steuben merger and the related acquisition of its investment
securities portfolio. Average deposit balances increased $2.01 billion, or 22.6%, between the third quarter of 2019 and the third
quarter of 2020 and $823.0 million, or 8.1%, on a linked quarter basis.
Ending loans at September 30, 2020 were $7.46 billion.
This was $69.4 million, or 0.9%, lower than linked second quarter ending loans of $7.53 billion, but up $605.5 million, or 8.8%
from one year prior. During the second quarter 2020, the Company acquired $339.7 million of loans in the Steuben transaction and
originated $507.2 million of PPP loans. Exclusive of the loans acquired in the Steuben transaction and PPP, ending loans outstanding
at September 30, 2020 decreased, $241.4 million, or 3.5%, from one year prior due largely to a significant slow-down in consumer
and business activities due the COVID-19 pandemic.
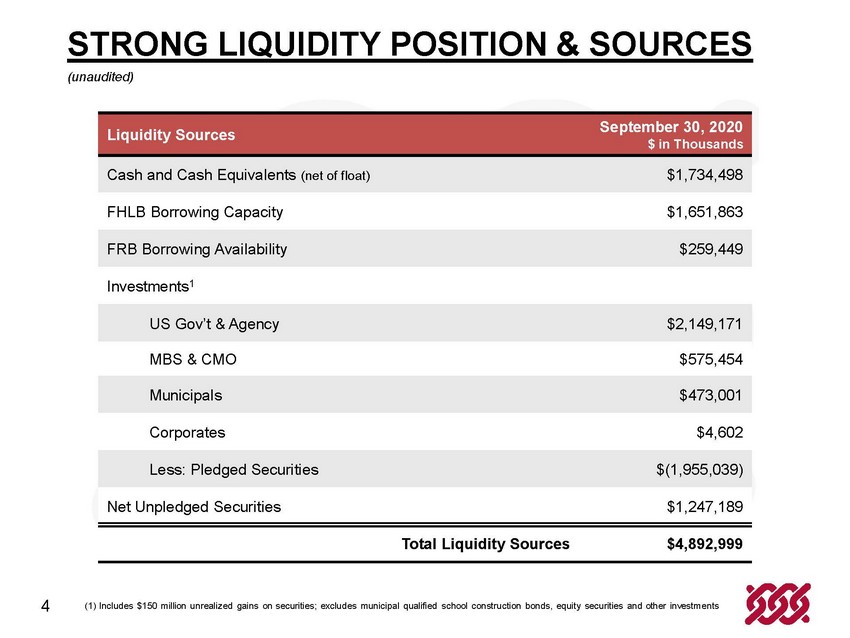
The Company’s liquidity position remains extremely strong.
The Company’s primary Bank subsidiary maintains a funding base largely comprised of core noninterest-bearing demand deposit
accounts and low cost interest-bearing interest checking, savings and money market deposit accounts with customers that operate,
reside or work within its branch footprint. At September 30, 2020, the Company’s cash and cash equivalents balances,
net of float, were $1.73 billion. The Company also maintains an available-for-sale investment securities portfolio, comprised primarily
of highly-liquid U.S. Treasury securities, highly-rated municipal securities and U.S. agency mortgage-backed securities. At September 30,
2020, the Company’s available-for-sale investment securities portfolio totaled $3.22 billion, $1.25 billion of which was
unpledged as collateral. Net unrealized gains on the portfolio at that time were $154.3 million. The Bank’s unused borrowing
capacity at the Federal Home Loan Bank of New York at September 30, 2020 was $1.65 billion and it maintained $259.4 million
of funding availability at the Federal Reserve Bank’s discount window.
Although there remains uncertainty around the magnitude and
duration of the economic impact of the COVID-19 pandemic, the Company’s management believes that its financial position,
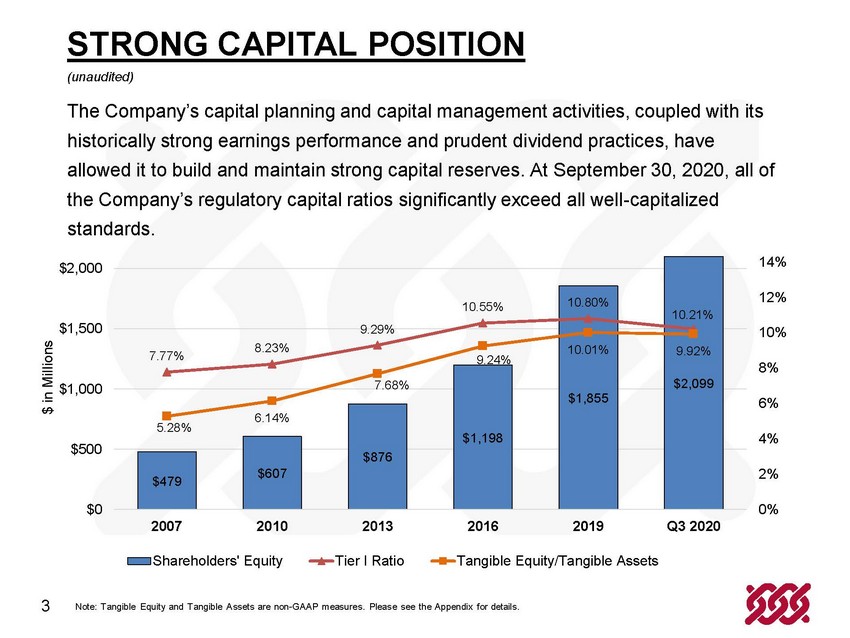
including high levels of capital, will allow it to successfully endure the negative economic impacts of the crisis. The Company’s
capital planning and management activities, coupled with its historically strong earnings performance, diversified streams of revenue
and prudent dividend practices, have allowed it to build and maintain strong capital reserves. Shareholders’ equity of $2.10
billion at September 30, 2020 was $258.2 million, or 14.0%, higher than one year prior and up $17.3 million, or 0.8%, from
the end of the linked second quarter. The increase in shareholders’ equity over the last four quarters was primarily driven
by solid earnings generation and capital retention, as well as the Steuben acquisition and an increase in accumulated other comprehensive
income due primarily to an increase in net unrealized gains on the Company’s available-for-sale investment securities portfolio.
At September 30, 2020, all of the Company’s regulatory capital ratios significantly exceeded well-capitalized standards.
More specifically, the Company’s tier 1 leverage ratio, a common measure to evaluate a financial institutions capital strength,
was 10.21% at September 30, 2020, which represents over two times the regulatory well-capitalized standard of 5.0%. This compares
to 10.76% at the end of the third quarter of 2019 and 10.79% at the end of the second quarter of 2020, with the modest declines
in the ratio primarily being driven by the organic asset growth generated from the significant deposit inflows noted above. The
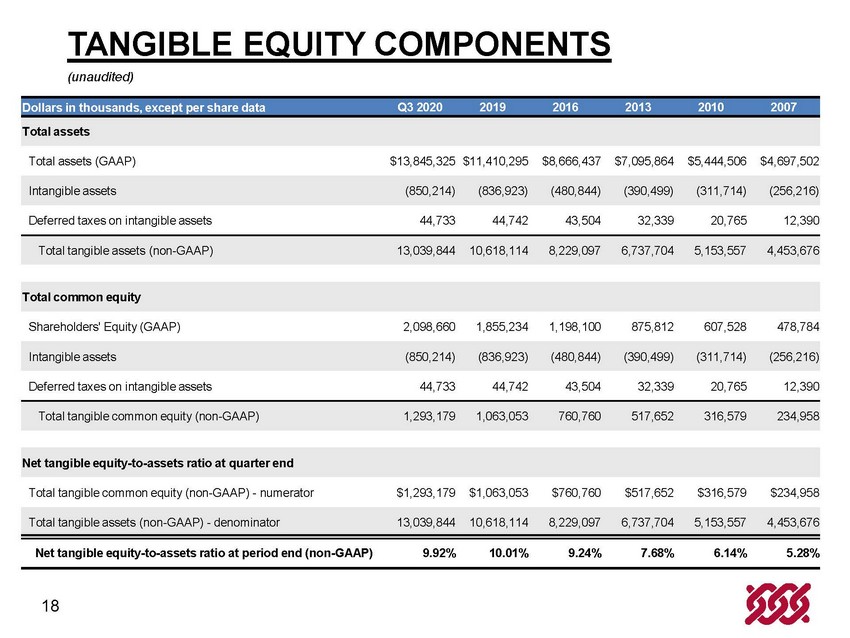
Company’s net tangible equity to net tangible assets ratio was 9.92% at September 30, 2020, up from 9.68% a year earlier
and down from 10.08% at the end of the second quarter of 2020. The decreases in the net tangible equity to net tangible assets
ratio and the tier 1 leverage ratio during the third quarter was due to the significant organic growth in total assets between
the comparable periods as a result of the strong inflow of deposits noted above.
As previously announced in December 2019, the Company’s
Board of Directors approved a stock repurchase program authorizing the repurchase of up to 2.6 million shares of the Company’s
common stock during a twelve-month period starting January 1, 2020. Such repurchases may be made at the discretion of the
Company’s senior management based on market conditions and other relevant factors and will be acquired through open market
or privately negotiated transactions as permitted under Rule 10b-18 of the Securities Exchange Act of 1934 and other applicable
legal requirements. There were no shares repurchased pursuant to the program in the third quarter of 2020. Although the approved
stock repurchase program has not been rescinded, management does not anticipate purchasing shares through this program during the
fourth quarter of 2020.
Allowance for Credit Losses and Asset Quality
During the first quarter of 2020, the Company adopted ASU No. 2016-13,
Financial Instruments – Credit Losses, also known as Current Expected Credit Losses (“CECL”). Upon the
adoption of CECL on January 1, 2020, the Company’s allowance for credit losses increased $1.4 million, from $49.9 million
at December 31, 2019 to $51.3 million. Following the adoption of CECL, the Company’s allowance for credit losses has
increased by $13.7 million, or 26.7%, $3.6 million of which was due to the Steuben acquisition and $10.1 million of which was primarily
due to credit loss expectations associated with COVID-19’s adverse impact on economic and business operating conditions.
The table below illustrates the Company’s changes in the allowance for credit losses prior to CECL adoption through the end
of the third quarter.
| ($ in millions) |
Allowance
for Loan
Losses at
12/31/2019 |
CECL
Adoption
Impact |
First
Quarter
2020
Reserve
Build |
Second
Quarter
2020
Steuben
Acquisition |
Second
Quarter
2020
Reserve
Build |
Third
Quarter
2020
Reserve
Build |
Allowance
for Credit
Losses at
9/30/2020 |
| Balance |
$49.9 |
+$1.4 |
+$4.4 |
+$3.6 |
+$5.1 |
+$0.6 |
$65.0 |
| % Change from 12/31/2019 |
n/a |
+2.7% |
+8.8% |
+7.3% |
+10.3% |
+1.1% |
+30.2% |
At September 30, 2020, nonperforming (90+ days past due
and non-accruing) loans were 0.43% of total loans outstanding. This compares to 0.42% of total loans outstanding at the end of
the third quarter of 2019 and 0.36% at the end of the second quarter of 2020. Total delinquent loans, which includes nonperforming
loans and loans thirty or more days delinquent, to total loans outstanding were 0.79% at the end of the third quarter of 2020.
This compares to 0.85% at the end of the third quarter of 2019 and 0.72% at the end of the second quarter of 2020. The Company
recorded net charge-offs of $1.3 million, or 0.07% annualized, in the third quarter of 2020. This compares to net charge-offs of
$1.6 million, or 0.10% annualized, in the third quarter of 2019 and $0.9 million, or 0.05%, in the linked second quarter of 2020.
The allowance for credit losses to total loans was 0.87% at September 30, 2020, compared to 0.86% at June 30, 2020 and
0.72% at September 30, 2019.
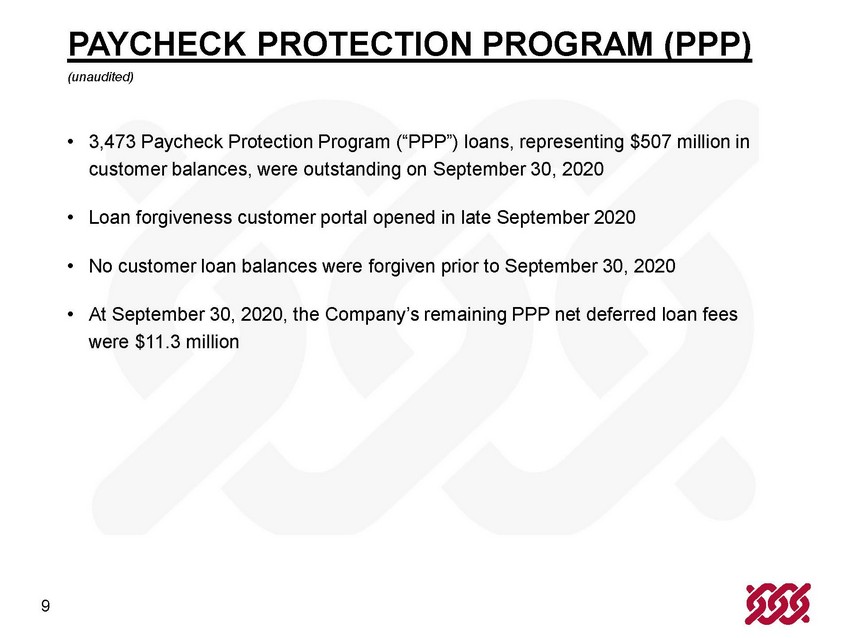
The Company participated in both rounds of the Coronavirus Aid,
Relief, and Security Act (“CARES Act”) PPP, a specialized low-interest loan program funded by the U.S. Treasury Department
and administered by the U.S. Small Business Administration (“SBA”). As of September 30, 2020, the Company’s
business lending portfolio included 3,473 PPP loans with a total balance of $507.2 million. Under the PPP, the SBA may forgive
all or a portion of the loan amount if the borrower meets certain conditions. Through September 30, 2020, the Company has
not received any notifications from the SBA that any of its borrowers’ loans were forgiven.
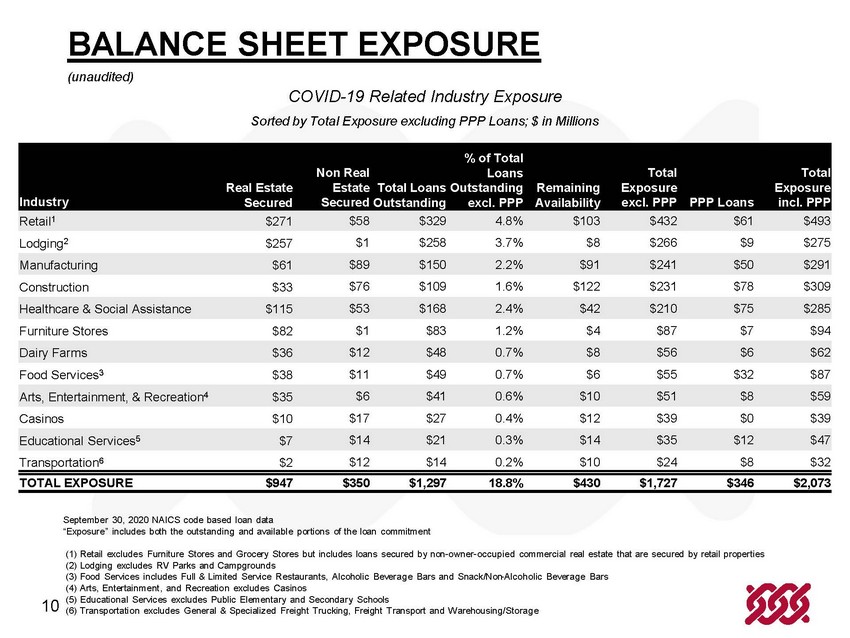
From a credit risk and lending perspective, the Company has
taken actions to identify, assess and monitor its COVID-19 related credit exposures based on asset class and borrower type. No
specific credit impairment has been identified within the Company’s investment securities portfolio, including the Company’s
municipal securities portfolio since the onset of the pandemic. With respect to the Company’s lending activities, the Company
implemented a customer forbearance program to assist both consumer and business borrowers that may be experiencing financial hardship
due to COVID-19 related challenges. As of September 30, 2020, the Company had 216 borrowers in forbearance due to COVID-19
related financial hardship, representing $193 million in outstanding loan balances, or 2.6% of total loans outstanding. This compares
to 3,699 borrowers in forbearance at June 30, 2020, representing $704 million in outstanding loan balances, or 9.4% of total
loans outstanding.
Loans in forbearance status continued to accrue interest during
the forbearance period unless otherwise classified as nonaccrual. Consistent with industry regulatory guidance, borrowers that
were otherwise current on loan payments that were granted COVID-19 related financial hardship payment deferrals were reported as
current loans throughout the agreed upon deferral period. Through the end the third quarter, the payment deferrals granted under
COVID-19 related forbearance were deemed to be an insignificant borrower concession, and therefore, not classified as troubled-debt
restructured loans. Borrowers that were delinquent in their payments to the Bank prior to requesting a COVID-19 related financial
hardship payment deferral were reviewed on a case-by-case basis for troubled debt restructure classification and nonperforming
loan status.
The Company anticipates that the number and amount of COVID-19
financial hardship forbearance agreements will decrease during the fourth quarter of 2020, but also anticipates that delinquent
and nonperforming loans will increase in future periods as borrowers that continue to experience COVID-19 related financial hardship
will be unable to resume loan payments consistent with their contractual obligations.
Dividend Increase
During the third quarter of 2020, the Company declared a quarterly
cash dividend of $0.42 per share on its common stock, up 2.4% from the $0.41 dividend declared in the third quarter of 2019, representing
an annualized yield of 2.9% based upon the $58.92 closing price
of the Company’s stock on October 23, 2020. The one cent increase declared in the third quarter of 2020 marked the 28th
consecutive year of dividend increases for the Company.
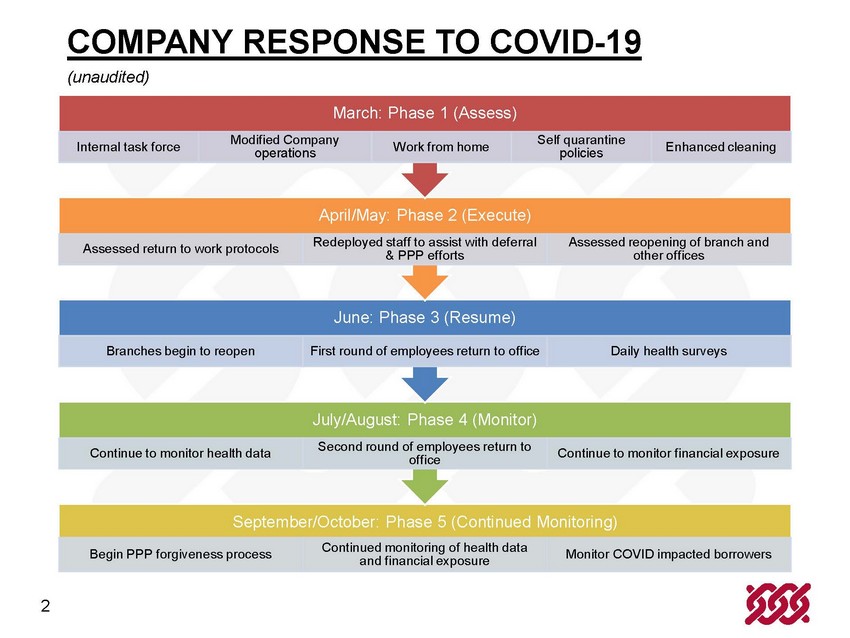
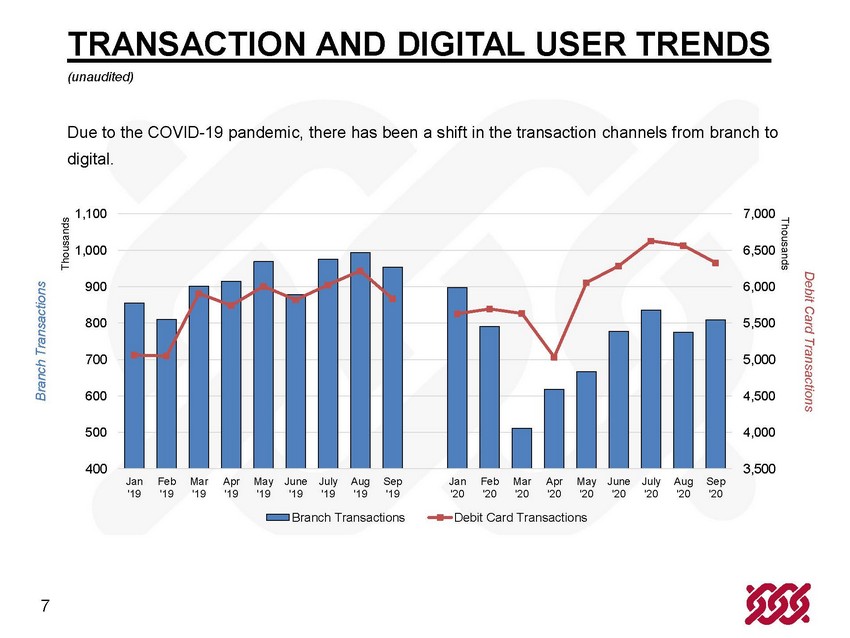
COVID-19 Pandemic
The COVID-19 crisis is expected to continue to impact the Company’s
financial results, as well as demand for its services and products during the remainder of the fourth quarter of 2020 and likely
for a significant portion of 2021. The short and long-term implications of the COVID-19 crisis, and related government monetary
and fiscal stimulus measures, on the Company’s future operations, revenues, earnings, allowance for credit losses, capital
reserves, and liquidity are difficult to fully assess and remain uncertain at this time.
Conference Call Scheduled
Company management will conduct an investor call at 11:00 a.m. (ET)
today, October 26, 2020, to discuss third quarter 2020 results. The conference call can be accessed at 877-317-6789 (1-412-317-6789
if outside United States and Canada). Investors may also listen live via the Internet at: https://www.webcaster4.com/Webcast/Page/995/37701.
This earnings release, including supporting financial tables
and presentation slides, is available within the press releases section of the Company's investor relations website at: https://ir.communitybanksystem.com.
An archived webcast of the earnings call will be available on this site for one full year.
About Us
Community Bank System, Inc. operates more than 240 customer
facilities across Upstate New York, Northeastern Pennsylvania, Vermont, and Western Massachusetts through its banking subsidiary,
Community Bank, N.A. With assets of over $13.8 billion, the DeWitt, N.Y. headquartered company is among the country’s 125
largest banking institutions. In addition to a full range of retail, business, and municipal banking services, the Company offers
comprehensive financial planning, insurance and wealth management services through its Community Bank Wealth Management Group
and OneGroup NY, Inc. operating units. The Company's Benefit Plans Administrative Services, Inc. subsidiary is a leading
provider of employee benefits administration, trust services, collective investment fund administration and actuarial consulting
services to customers on a national scale. Community Bank System, Inc. is listed on the New York Stock Exchange and the Company's
stock trades under the symbol CBU. For more information about Community Bank visit www.cbna.com or https://ir.communitybanksystem.com.
# # #
This press release contains forward-looking statements within
the meaning of the Private Securities Litigation Reform Act of 1995. These statements are based on the current beliefs and expectations
of CBU’s management and are subject to significant risks and uncertainties. Actual results may differ from those set forth
in the forward-looking statements. The following factors, among others, could cause the actual results of CBU’s operations
to differ materially from its expectations: the macroeconomic and other challenges and uncertainties related to the COVID-19 pandemic,
including the negative impacts and disruptions on public health, corporate and consumer customers, the communities CBU serves,
and the domestic and global economy, including various actions taken in response by governments, central banks and others, which
may have an adverse effect on CBU’s business; current and future economic and market conditions, including the effects of
declines in housing prices, high unemployment rates, U.S. fiscal debt, budget and tax matters, geopolitical matters, and any slowdown
in global economic growth; fiscal and monetary policies of the Federal Reserve Board; the effect of changes in the level of checking
or savings account deposits on CBU’s funding costs and net interest margin; future provisions for credit losses on loans
and debt securities; changes in nonperforming assets; the effect of a fall in stock market prices on CBU’s fee income businesses,
including its employee benefit services, wealth management, and insurance businesses; the successful integration of operations
of its acquisitions; competition; changes in legislation or regulatory requirements; and the timing for receiving regulatory approvals
and completing pending transactions. For more information about factors that could cause actual results to differ materially from
CBU’s expectations, refer to its reports filed with the Securities and Exchange Commission, including the discussion under
“Risk Factors” in the Annual Report on Form 10-K for the year ended December 31, 2019 and Quarterly Reports
on Form 10-Q for the quarterly periods ended March 31, 2020 and June 30, 2020, which have been filed with the Securities
and Exchange Commission and available on its website at www.sec.gov. Further, any forward-looking statement speaks only as of the
date on which it is made, and CBU undertakes no obligation to update any forward-looking statement to reflect events or circumstances
after the date on which the statement is made or to reflect the occurrence of unanticipated events.
Summary of Financial Data (unaudited) |
|
|
|
|
| (Dollars in thousands, except per share data) |
|
|
|
|
| |
Quarter Ended |
Year-to-Date |
| |
September 30, 2020 |
September 30, 2019 |
September 30, 2020 |
September 30, 2019 |
| Earnings |
|
|
|
|
| Loan income |
$79,646 |
$79,931 |
$236,931 |
$227,701 |
| Investment income |
17,844 |
18,716 |
54,746 |
57,979 |
| Total interest income |
97,490 |
98,647 |
291,677 |
285,680 |
| Interest expense |
4,525 |
7,371 |
16,707 |
19,245 |
| Net interest income |
92,965 |
91,276 |
274,970 |
266,435 |
| Acquisition-related provision for credit losses |
0 |
0 |
3,201 |
0 |
| Provision for credit losses |
1,945 |
1,751 |
14,112 |
5,573 |
| Net interest income after provision for credit losses |
91,020 |
89,525 |
257,657 |
260,862 |
| Deposit service and other banking fees |
15,184 |
18,003 |
45,296 |
52,132 |
| Mortgage banking |
3,908 |
(138) |
6,199 |
276 |
| Wealth management and insurance services |
15,420 |
14,890 |
45,161 |
44,008 |
| Employee benefit services |
25,159 |
24,329 |
74,593 |
72,170 |
| Gain on sale of investments, net |
0 |
0 |
0 |
4,882 |
| Unrealized (loss) gain on equity securities |
(12) |
10 |
(30) |
28 |
| Total noninterest revenues |
59,659 |
57,094 |
171,219 |
173,496 |
| Salaries and employee benefits |
57,280 |
56,061 |
170,252 |
163,448 |
| Data processing and communications |
12,096 |
10,675 |
33,342 |
30,475 |
| Occupancy and equipment |
10,134 |
9,801 |
30,627 |
29,708 |
| Amortization of intangible assets |
3,581 |
3,960 |
10,772 |
11,994 |
| Litigation reserve |
2,950 |
0 |
2,950 |
0 |
| Acquisition expenses |
796 |
6,061 |
4,537 |
7,789 |
| Other |
10,129 |
10,371 |
29,052 |
33,343 |
| Total operating expenses |
96,966 |
96,929 |
281,532 |
276,757 |
| Income before income taxes |
53,713 |
49,690 |
147,344 |
157,601 |
| Income taxes |
10,904 |
10,472 |
29,153 |
31,422 |
| Net income |
$42,809 |
$39,218 |
$118,191 |
$126,179 |
| Basic earnings per share |
$0.80 |
$0.76 |
$2.23 |
$2.44 |
| Diluted earnings per share |
$0.79 |
$0.75 |
$2.22 |
$2.41 |
| Summary of Financial Data (unaudited) |
|
|
|
|
|
| (Dollars in thousands, except per share data) |
|
|
|
|
|
| |
2020 |
2019 |
| |
3rd Qtr |
2nd Qtr |
1st Qtr |
4th Qtr |
3rd Qtr |
| Earnings |
|
|
|
|
|
| Loan income |
$79,646 |
$78,720 |
$78,565 |
$80,509 |
$79,931 |
| Investment income |
17,844 |
18,472 |
18,430 |
19,538 |
18,716 |
| Total interest income |
97,490 |
97,192 |
96,995 |
100,047 |
98,647 |
| Interest expense |
4,525 |
5,241 |
6,941 |
7,307 |
7,371 |
| Net interest income |
92,965 |
91,951 |
90,054 |
92,740 |
91,276 |
| Acquisition-related provision for credit losses |
0 |
3,201 |
0 |
0 |
0 |
| Provision for credit losses |
1,945 |
6,573 |
5,594 |
2,857 |
1,751 |
| Net interest income after provision for credit losses |
91,020 |
82,177 |
84,460 |
89,883 |
89,525 |
| Deposit service and other banking fees |
15,184 |
12,934 |
17,178 |
17,828 |
18,003 |
| Mortgage banking |
3,908 |
1,375 |
916 |
247 |
(138) |
| Wealth management and insurance services |
15,420 |
14,549 |
15,192 |
14,060 |
14,890 |
| Employee benefit services |
25,159 |
24,068 |
25,366 |
24,997 |
24,329 |
| Unrealized (loss) gain on equity securities |
(12) |
12 |
(30) |
(9) |
10 |
| Total noninterest revenues |
59,659 |
52,938 |
58,622 |
57,123 |
57,094 |
| Salaries and employee benefits |
57,280 |
54,721 |
58,251 |
56,468 |
56,061 |
| Data processing and communications |
12,096 |
10,833 |
10,413 |
10,932 |
10,675 |
| Occupancy and equipment |
10,134 |
9,754 |
10,739 |
10,142 |
9,801 |
| Amortization of intangible assets |
3,581 |
3,524 |
3,667 |
3,962 |
3,960 |
| Litigation reserve |
2,950 |
0 |
0 |
0 |
0 |
| Acquisition expenses |
796 |
3,372 |
369 |
819 |
6,061 |
| Other |
10,129 |
8,699 |
10,224 |
12,946 |
10,371 |
| Total operating expenses |
96,966 |
90,903 |
93,663 |
95,269 |
96,929 |
| Income before income taxes |
53,713 |
44,212 |
49,419 |
51,737 |
49,690 |
| Income taxes |
10,904 |
8,964 |
9,285 |
8,853 |
10,472 |
| Net income |
$42,809 |
$35,248 |
$40,134 |
$42,884 |
$39,218 |
| Basic earnings per share |
$0.80 |
$0.67 |
$0.77 |
$0.82 |
$0.76 |
| Diluted earnings per share |
$0.79 |
$0.66 |
$0.76 |
$0.82 |
$0.75 |
| Profitability |
|
|
|
|
|
| Return on assets |
1.26% |
1.12% |
1.41% |
1.48% |
1.39% |
| Return on equity |
8.13% |
7.05% |
8.49% |
9.19% |
8.53% |
| Return on tangible equity(2) |
13.22% |
11.60% |
14.52% |
16.08% |
14.92% |
| Noninterest revenues/operating revenues (FTE)(1) |
39.2% |
36.6% |
39.6% |
38.3% |
38.6% |
| Efficiency ratio |
58.9% |
58.1% |
60.4% |
60.7% |
58.8% |
| Components of Net Interest Margin (FTE) |
|
|
|
|
|
| Loan yield |
4.23% |
4.40% |
4.61% |
4.67% |
4.72% |
| Cash equivalents yield |
0.10% |
0.10% |
0.90% |
1.68% |
2.19% |
| Investment yield |
2.31% |
2.50% |
2.51% |
2.70% |
2.61% |
| Earning asset yield |
3.28% |
3.56% |
3.93% |
3.99% |
4.03% |
| Interest-bearing deposit rate |
0.19% |
0.23% |
0.34% |
0.36% |
0.36% |
| Borrowing rate |
1.19% |
1.36% |
1.70% |
1.68% |
2.06% |
| Cost of all interest-bearing funds |
0.23% |
0.28% |
0.40% |
0.42% |
0.43% |
| Cost of funds (includes DDA) |
0.16% |
0.20% |
0.30% |
0.31% |
0.32% |
| Net interest margin (FTE) |
3.12% |
3.37% |
3.65% |
3.71% |
3.73% |
| Fully tax-equivalent adjustment |
$963 |
$1,015 |
$1,032 |
$1,026 |
$985 |
Summary of Financial Data (unaudited) |
|
|
|
|
|
| (Dollars in thousands, except per share data) |
|
|
|
|
|
| |
2020 |
2019 |
| |
3rd Qtr |
2nd Qtr |
1st Qtr |
4th Qtr |
3rd Qtr |
| Average Balances |
|
|
|
|
|
| Loans |
$7,508,895 |
$7,219,462 |
$6,876,771 |
$6,857,977 |
$6,735,776 |
| Cash equivalents |
1,300,981 |
822,992 |
114,660 |
504,858 |
665,862 |
| Taxable investment securities |
2,686,120 |
2,608,495 |
2,586,646 |
2,242,471 |
1,990,979 |
| Nontaxable investment securities |
461,963 |
454,511 |
459,340 |
434,020 |
413,437 |
| Total interest-earning assets |
11,957,959 |
11,105,460 |
10,037,417 |
10,039,326 |
9,806,054 |
| Total assets |
13,543,460 |
12,652,200 |
11,487,384 |
11,472,415 |
11,229,919 |
| Interest-bearing deposits |
7,621,206 |
7,146,301 |
6,598,131 |
6,581,979 |
6,462,143 |
| Borrowings |
291,241 |
315,934 |
329,355 |
325,139 |
290,967 |
| Total interest-bearing liabilities |
7,912,447 |
7,462,235 |
6,927,486 |
6,907,118 |
6,753,110 |
| Noninterest-bearing deposits |
3,312,841 |
2,964,717 |
2,458,529 |
2,519,645 |
2,458,831 |
| Shareholders' equity |
2,095,211 |
2,009,996 |
1,902,169 |
1,851,579 |
1,824,869 |
| Balance Sheet Data |
|
|
|
|
|
| Cash and cash equivalents |
$1,836,521 |
$1,319,880 |
$529,336 |
$205,030 |
$1,014,042 |
| Investment securities |
3,270,063 |
3,337,459 |
3,185,381 |
3,088,343 |
2,481,742 |
| Loans: |
|
|
|
|
|
| Business lending |
3,433,565 |
3,455,343 |
2,789,130 |
2,775,876 |
2,779,612 |
| Consumer mortgage |
2,410,249 |
2,428,060 |
2,424,656 |
2,430,902 |
2,405,191 |
| Consumer indirect |
1,039,925 |
1,056,865 |
1,087,879 |
1,113,062 |
1,091,980 |
| Home equity |
413,265 |
418,543 |
386,583 |
386,325 |
389,029 |
| Consumer direct |
161,639 |
169,228 |
177,844 |
184,378 |
187,379 |
| Total loans |
7,458,643 |
7,528,039 |
6,866,092 |
6,890,543 |
6,853,191 |
| Allowance for credit losses |
64,962 |
64,437 |
55,652 |
49,911 |
49,423 |
| Intangible assets, net |
850,214 |
852,761 |
832,919 |
836,923 |
840,685 |
| Other assets |
494,846 |
470,515 |
450,907 |
439,367 |
457,060 |
| Total assets |
13,845,325 |
13,444,217 |
11,808,983 |
11,410,295 |
11,597,297 |
| Deposits: |
|
|
|
|
|
| Noninterest-bearing |
3,326,517 |
3,273,921 |
2,491,720 |
2,465,902 |
2,549,395 |
| Non-maturity interest-bearing |
6,830,893 |
6,600,140 |
5,899,297 |
5,592,936 |
5,672,825 |
| Time |
963,180 |
972,612 |
912,965 |
936,129 |
946,065 |
| Total deposits |
11,120,590 |
10,846,673 |
9,303,982 |
8,994,967 |
9,168,285 |
| Borrowings |
288,448 |
176,195 |
208,718 |
253,758 |
237,661 |
| Subordinated notes payable |
13,735 |
13,755 |
13,775 |
13,795 |
13,814 |
| Subordinated debt held by unconsolidated subsidiary trusts |
77,320 |
79,382 |
77,320 |
77,320 |
77,320 |
| Accrued interest and other liabilities |
246,572 |
246,897 |
228,557 |
215,221 |
259,796 |
| Total liabilities |
11,746,665 |
11,362,902 |
9,832,352 |
9,555,061 |
9,756,876 |
| Shareholders' equity |
2,098,660 |
2,081,315 |
1,976,631 |
1,855,234 |
1,840,421 |
| Total liabilities and shareholders' equity |
13,845,325 |
13,444,217 |
11,808,983 |
11,410,295 |
11,597,297 |
| Capital |
|
|
|
|
|
| Tier 1 leverage ratio |
10.21% |
10.79% |
11.10% |
10.80% |
10.76% |
| Tangible equity/net tangible assets(2) |
9.92% |
10.08% |
10.78% |
10.01% |
9.68% |
| Diluted weighted average common shares O/S |
54,159 |
53,017 |
52,646 |
52,522 |
52,382 |
| Period end common shares outstanding |
53,538 |
53,514 |
52,031 |
51,794 |
51,660 |
| Cash dividends declared per common share |
$0.42 |
$0.41 |
$0.41 |
$0.41 |
$0.41 |
| Book value |
$39.20 |
$38.89 |
$37.99 |
$35.82 |
$35.63 |
| Tangible book value(2) |
$24.15 |
$23.80 |
$22.84 |
$20.52 |
$20.24 |
| Common stock price (end of period) |
$54.46 |
$57.02 |
$58.80 |
$70.94 |
$61.69 |
| Summary of Financial Data (unaudited) |
|
|
|
|
|
| (Dollars in thousands, except per share data) |
|
|
|
|
|
| |
2020 |
2019 |
| |
3rd Qtr |
2nd Qtr |
1st Qtr |
4th Qtr |
3rd Qtr |
| Asset Quality |
|
|
|
|
|
| Nonaccrual loans |
$28,756 |
$20,697 |
$19,046 |
$18,835 |
$23,610 |
| Accruing loans 90+ days delinquent |
3,487 |
6,063 |
12,736 |
5,426 |
5,064 |
| Total nonperforming loans |
32,243 |
26,760 |
31,782 |
24,261 |
28,674 |
| Other real estate owned (OREO) |
1,209 |
3,186 |
1,469 |
1,270 |
1,258 |
| Total nonperforming assets |
33,452 |
29,946 |
33,251 |
25,531 |
29,932 |
| Net charge-offs |
1,257 |
910 |
1,550 |
2,369 |
1,638 |
| Allowance for credit losses/loans outstanding |
0.87% |
0.86% |
0.81% |
0.72% |
0.72% |
| Nonperforming loans/loans outstanding |
0.43% |
0.36% |
0.46% |
0.35% |
0.42% |
| Allowance for credit losses/nonperforming loans |
201% |
241% |
175% |
206% |
172% |
| Net charge-offs/average loans |
0.07% |
0.05% |
0.09% |
0.14% |
0.10% |
| Delinquent loans/ending loans |
0.79% |
0.72% |
1.11% |
0.94% |
0.85% |
| Provision for credit losses/net charge-offs |
155% |
1,074% |
361% |
121% |
107% |
| Nonperforming assets/total assets |
0.24% |
0.22% |
0.28% |
0.22% |
0.26% |
| Quarterly GAAP to Non-GAAP Reconciliations |
|
|
|
|
|
| Income statement data |
|
|
|
|
|
| Pre-tax, pre-provision net revenue |
|
|
|
|
|
| Net income (GAAP) |
$42,809 |
$35,248 |
$40,134 |
$42,884 |
$39,218 |
| Income taxes |
10,904 |
8,964 |
9,285 |
8,853 |
10,472 |
| Income before income taxes |
53,713 |
44,212 |
49,419 |
51,737 |
49,690 |
| Provision for credit losses |
1,945 |
9,774 |
5,594 |
2,857 |
1,751 |
| Pre-tax, pre-provision net revenue (non-GAAP) |
55,658 |
53,986 |
55,013 |
54,594 |
51,441 |
| Acquisition expenses |
796 |
3,372 |
369 |
819 |
6,061 |
| Unrealized loss (gain) on equity securities |
12 |
(12) |
30 |
9 |
(10) |
| Litigation reserve |
2,950 |
0 |
0 |
0 |
0 |
| Adjusted pre-tax, pre-provision net revenue (non-GAAP) |
$59,416 |
$57,346 |
$55,412 |
$55,422 |
$57,492 |
| |
|
|
|
|
|
| Pre-tax, pre-provision net revenue per share |
|
|
|
|
|
| Diluted earnings per share (GAAP) |
$0.79 |
$0.66 |
$0.76 |
$0.82 |
$0.75 |
| Income taxes |
0.20 |
0.17 |
0.18 |
0.17 |
0.20 |
| Income before income taxes |
0.99 |
0.83 |
0.94 |
0.99 |
0.95 |
| Provision for credit losses |
0.04 |
0.19 |
0.10 |
0.06 |
0.03 |
| Pre-tax, pre-provision net revenue per share (non-GAAP) |
1.03 |
1.02 |
1.04 |
1.05 |
0.98 |
| Acquisition expenses |
0.02 |
0.06 |
0.01 |
0.01 |
0.12 |
| Unrealized loss (gain) on equity securities |
0.00 |
0.00 |
0.00 |
0.00 |
0.00 |
| Litigation reserve |
0.05 |
0.00 |
0.00 |
0.00 |
0.00 |
| Adjusted pre-tax, pre-provision net revenue per share (non-GAAP) |
$1.10 |
$1.08 |
$1.05 |
$1.06 |
$1.10 |
| |
|
|
|
|
|
| |
|
|
|
|
|
| Summary of Financial Data (unaudited) |
|
|
|
|
|
| (Dollars in thousands, except per share data) |
|
|
|
|
|
| |
2020 |
2019 |
| |
3rd Qtr |
2nd Qtr |
1st Qtr |
4th Qtr |
3rd Qtr |
| Quarterly GAAP to Non-GAAP Reconciliations |
|
|
|
|
|
| Income statement data (continued) |
|
|
|
|
|
| Net income |
|
|
|
|
|
| Net income (GAAP) |
$42,809 |
$35,248 |
$40,134 |
$42,884 |
$39,218 |
| Acquisition expenses |
796 |
3,372 |
369 |
819 |
6,061 |
| Tax effect of acquisition expenses |
(162) |
(684) |
(69) |
(140) |
(1,277) |
| Subtotal (non-GAAP) |
43,443 |
37,936 |
40,434 |
43,563 |
44,002 |
| Acquisition-related provision for credit losses |
0 |
3,201 |
0 |
0 |
0 |
| Tax effect of acquisition-related provision for credit losses |
0 |
(649) |
0 |
0 |
0 |
| Subtotal (non-GAAP) |
43,443 |
40,488 |
40,434 |
43,563 |
44,002 |
| Unrealized loss (gain) on equity securities |
12 |
(12) |
30 |
9 |
(10) |
| Tax effect of unrealized loss (gain) on equity securities |
(2) |
2 |
(6) |
(2) |
2 |
| Subtotal (non-GAAP) |
43,453 |
40,478 |
40,458 |
43,570 |
43,994 |
| Litigation reserve |
2,950 |
0 |
0 |
0 |
0 |
| Tax effect of litigation reserve |
(599) |
0 |
0 |
0 |
0 |
| Operating net income (non-GAAP) |
45,804 |
40,478 |
40,458 |
43,570 |
43,994 |
| Amortization of intangibles |
3,581 |
3,524 |
3,667 |
3,962 |
3,960 |
| Tax effect of amortization of intangibles |
(727) |
(714) |
(689) |
(678) |
(835) |
| Subtotal (non-GAAP) |
48,658 |
43,288 |
43,436 |
46,854 |
47,119 |
| Acquired non-impaired loan accretion |
(1,326) |
(1,365) |
(1,465) |
(1,898) |
(1,637) |
| Tax effect of acquired non-impaired loan accretion |
269 |
277 |
275 |
325 |
345 |
| Adjusted net income (non-GAAP) |
$47,601 |
$42,200 |
$42,246 |
$45,281 |
$45,827 |
| |
|
|
|
|
|
| Return on average assets |
|
|
|
|
|
| Adjusted net income (non-GAAP) |
$47,601 |
$42,200 |
$42,246 |
$45,281 |
$45,827 |
| Average total assets |
13,543,460 |
12,652,200 |
11,487,384 |
11,472,415 |
11,229,919 |
| Adjusted return on average assets (non-GAAP) |
1.40% |
1.34% |
1.48% |
1.57% |
1.62% |
| |
|
|
|
|
|
| Return on average equity |
|
|
|
|
|
| Adjusted net income (non-GAAP) |
$47,601 |
$42,200 |
$42,246 |
$45,281 |
$45,827 |
| Average total equity |
2,095,211 |
2,009,996 |
1,902,169 |
1,851,579 |
1,824,869 |
| Adjusted return on average equity (non-GAAP) |
9.04% |
8.44% |
8.93% |
9.70% |
9.96% |
| |
|
|
|
|
|
| Summary of Financial Data (unaudited) |
|
|
|
|
|
| (Dollars in thousands, except per share data) |
|
|
|
|
|
| |
2020 |
2019 |
| |
3rd Qtr |
2nd Qtr |
1st Qtr |
4th Qtr |
3rd Qtr |
| Quarterly GAAP to Non-GAAP Reconciliations |
|
|
|
|
|
| Income statement data (continued) |
|
|
|
|
|
| Earnings per common share |
|
|
|
|
|
| Diluted earnings per share (GAAP) |
$0.79 |
$0.66 |
$0.76 |
$0.82 |
$0.75 |
| Acquisition expenses |
0.02 |
0.06 |
0.01 |
0.01 |
0.12 |
| Tax effect of acquisition expenses |
0.00 |
(0.01) |
0.00 |
0.00 |
(0.03) |
| Subtotal (non-GAAP) |
0.81 |
0.71 |
0.77 |
0.83 |
0.84 |
| Acquisition-related provision for credit losses |
0.00 |
0.06 |
0.00 |
0.00 |
0.00 |
| Tax effect of acquisition-related provision for credit losses |
0.00 |
(0.01) |
0.00 |
0.00 |
0.00 |
| Subtotal (non-GAAP) |
0.81 |
0.76 |
0.77 |
0.83 |
0.84 |
| Unrealized loss (gain) on equity securities |
0.00 |
0.00 |
0.00 |
0.00 |
0.00 |
| Tax effect of unrealized loss (gain) on equity securities |
0.00 |
0.00 |
0.00 |
0.00 |
0.00 |
| Subtotal (non-GAAP) |
0.81 |
0.76 |
0.77 |
0.83 |
0.84 |
| Litigation reserve |
0.05 |
0.00 |
0.00 |
0.00 |
0.00 |
| Tax effect of litigation reserve |
(0.01) |
0.00 |
0.00 |
0.00 |
0.00 |
| Operating diluted earnings per share (non-GAAP) |
0.85 |
0.76 |
0.77 |
0.83 |
0.84 |
| Amortization of intangibles |
0.07 |
0.07 |
0.07 |
0.07 |
0.08 |
| Tax effect of amortization of intangibles |
(0.01) |
(0.01) |
(0.01) |
(0.01) |
(0.02) |
| Subtotal (non-GAAP) |
0.91 |
0.82 |
0.83 |
0.89 |
0.90 |
| Acquired non-impaired loan accretion |
(0.03) |
(0.03) |
(0.03) |
(0.04) |
(0.03) |
| Tax effect of acquired non-impaired loan accretion |
0.00 |
0.01 |
0.00 |
0.01 |
0.01 |
| Diluted adjusted net earnings per share (non-GAAP) |
$0.88 |
$0.80 |
$0.80 |
$0.86 |
$0.88 |
| |
|
|
|
|
|
| Noninterest operating expenses |
|
|
|
|
|
| Noninterest expenses (GAAP) |
$96,966 |
$90,903 |
$93,663 |
$95,269 |
$96,929 |
| Amortization of intangibles |
(3,581) |
(3,524) |
(3,667) |
(3,962) |
(3,960) |
| Acquisition expenses |
(796) |
(3,372) |
(369) |
(819) |
(6,061) |
| Litigation reserve |
(2,950) |
0 |
0 |
0 |
0 |
| Total adjusted noninterest expenses (non-GAAP) |
$89,639 |
$84,007 |
$89,627 |
$90,488 |
$86,908 |
| |
|
|
|
|
|
| Efficiency ratio |
|
|
|
|
|
| Adjusted noninterest expenses (non-GAAP) - numerator |
$89,639 |
$84,007 |
$89,627 |
$90,488 |
$86,908 |
| Tax-equivalent net interest income |
93,928 |
92,966 |
91,086 |
93,766 |
92,261 |
| Noninterest revenues |
59,659 |
52,938 |
58,622 |
57,123 |
57,094 |
| Acquired non-impaired loan accretion |
(1,326) |
(1,365) |
(1,465) |
(1,898) |
(1,637) |
| Unrealized loss (gain) on equity securities |
12 |
(12) |
30 |
9 |
(10) |
| Operating revenues (non-GAAP) - denominator |
152,273 |
144,527 |
148,273 |
149,000 |
147,708 |
| Efficiency ratio (non-GAAP) |
58.9% |
58.1% |
60.4% |
60.7% |
58.8% |
| Summary of Financial Data (unaudited) |
|
|
|
|
|
| (Dollars in thousands, except per share data) |
|
|
|
|
|
| |
2020 |
2019 |
| |
3rd Qtr |
2nd Qtr |
1st Qtr |
4th Qtr |
3rd Qtr |
| Quarterly GAAP to Non-GAAP Reconciliations |
|
|
|
|
|
| Balance sheet data |
|
|
|
|
|
| Total assets |
|
|
|
|
|
| Total assets (GAAP) |
$13,845,325 |
$13,444,217 |
$11,808,983 |
$11,410,295 |
$11,597,297 |
| Intangible assets |
(850,214) |
(852,761) |
(832,919) |
(836,923) |
(840,685) |
| Deferred taxes on intangible assets |
44,733 |
45,094 |
44,494 |
44,742 |
46,048 |
| Total tangible assets (non-GAAP) |
13,039,844 |
12,636,550 |
11,020,558 |
10,618,114 |
10,802,660 |
| |
|
|
|
|
|
| Total common equity |
|
|
|
|
|
| Shareholders' Equity (GAAP) |
2,098,660 |
2,081,315 |
1,976,631 |
1,855,234 |
1,840,421 |
| Intangible assets |
(850,214) |
(852,761) |
(832,919) |
(836,923) |
(840,685) |
| Deferred taxes on intangible assets |
44,733 |
45,094 |
44,494 |
44,742 |
46,048 |
| Total tangible common equity (non-GAAP) |
1,293,179 |
1,273,648 |
1,188,206 |
1,063,053 |
1,045,784 |
| |
|
|
|
|
|
| Net tangible equity-to-assets ratio at quarter end |
|
|
|
|
|
| Total tangible common equity (non-GAAP) - numerator |
$1,293,179 |
$1,273,648 |
$1,188,206 |
$1,063,053 |
$1,045,784 |
| Total tangible assets (non-GAAP) - denominator |
13,039,844 |
12,636,550 |
11,020,558 |
10,618,114 |
10,802,660 |
| Net tangible equity-to-assets ratio at quarter end (non-GAAP) |
9.92% |
10.08% |
10.78% |
10.01% |
9.68% |
| |
|
|
|
|
|
| |
| (1) Excludes unrealized gain and loss on equity securities. |
| (2) Includes deferred tax liabilities related to certain intangible assets. |
# # #