UNITED STATES
SECURITIES AND EXCHANGE COMMISSION
Washington, D.C. 20549
FORM N-CSR
CERTIFIED SHAREHOLDER REPORT OF REGISTERED
MANAGEMENT INVESTMENT COMPANIES
Investment Company Act file number 811-3785
Fidelity Advisor Series I
(Exact name of registrant as specified in charter)
245 Summer St., Boston, MA 02210
(Address of principal executive offices) (Zip code)
Marc Bryant, Secretary
245 Summer St.
Boston, Massachusetts 02210
(Name and address of agent for service)
Registrant's telephone number, including area code:
617-563-7000
Date of fiscal year end: | October 31 |
Date of reporting period: | April 30, 2017 |
Item 1.
Reports to Stockholders
|
Fidelity Advisor® High Income Fund Semi-Annual Report April 30, 2017 |
 |
Contents
To view a fund's proxy voting guidelines and proxy voting record for the 12-month period ended June 30, visit http://www.fidelity.com/proxyvotingresults or visit the Securities and Exchange Commission's (SEC) web site at http://www.sec.gov.
You may also call 1-877-208-0098 to request a free copy of the proxy voting guidelines.
Standard & Poor's, S&P and S&P 500 are registered service marks of The McGraw-Hill Companies, Inc. and have been licensed for use by Fidelity Distributors Corporation.
Other third-party marks appearing herein are the property of their respective owners.
All other marks appearing herein are registered or unregistered trademarks or service marks of FMR LLC or an affiliated company. © 2017 FMR LLC. All rights reserved.
This report and the financial statements contained herein are submitted for the general information of the shareholders of the Fund. This report is not authorized for distribution to prospective investors in the Fund unless preceded or accompanied by an effective prospectus.
A fund files its complete schedule of portfolio holdings with the SEC for the first and third quarters of each fiscal year on Form N-Q. Forms N-Q are available on the SEC’s web site at http://www.sec.gov. A fund's Forms N-Q may be reviewed and copied at the SEC’s Public Reference Room in Washington, DC. Information regarding the operation of the SEC's Public Reference Room may be obtained by calling 1-800-SEC-0330.
For a complete list of a fund's portfolio holdings, view the most recent holdings listing, semiannual report, or annual report on Fidelity's web site at http://www.fidelity.com, http://www.institutional.fidelity.com, or http://www.401k.com, as applicable.
NOT FDIC INSURED •MAY LOSE VALUE •NO BANK GUARANTEE
Neither the Fund nor Fidelity Distributors Corporation is a bank.
Investment Summary (Unaudited)
Top Five Holdings as of April 30, 2017
| (by issuer, excluding cash equivalents) | % of fund's net assets | % of fund's net assets 6 months ago |
| APX Group, Inc. | 2.0 | 2.5 |
| CCO Holdings LLC/CCO Holdings Capital Corp. | 2.0 | 1.3 |
| JC Penney Corp., Inc. | 1.8 | 2.1 |
| Icahn Enterprises LP/Icahn Enterprises Finance Corp. | 1.8 | 1.0 |
| Rice Energy, Inc. | 1.3 | 1.3 |
| 8.9 |
Top Five Market Sectors as of April 30, 2017
| % of fund's net assets | % of fund's net assets 6 months ago | |
| Energy | 13.4 | 13.2 |
| Telecommunications | 11.4 | 10.9 |
| Technology | 7.7 | 8.4 |
| Healthcare | 6.4 | 7.8 |
| Cable/Satellite TV | 5.6 | 5.2 |
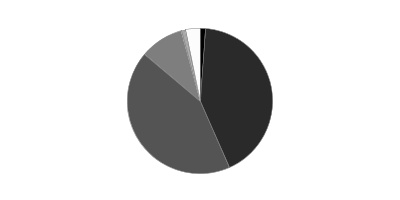
Quality Diversification (% of fund's net assets)
| As of April 30, 2017 | ||
| BBB | 1.3% | |
| BB | 42.1% | |
| B | 42.8% | |
| CCC,CC,C | 9.6% | |
| Not Rated | 0.7% | |
| Equities | 0.4% | |
| Short-Term Investments and Net Other Assets | 3.1% | |
| As of October 31, 2016 | ||
| BBB | 1.0% | |
| BB | 41.4% | |
| B | 41.2% | |
| CCC,CC,C | 12.4% | |
| Not Rated | 0.7% | |
| Equities | 0.3% | |
| Short-Term Investments and Net Other Assets | 3.0% | |
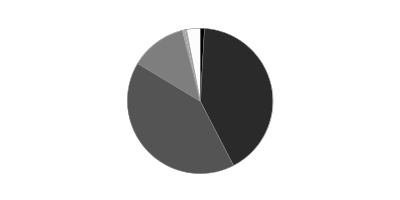
We have used ratings from Moody's Investors Service, Inc. Where Moody's® ratings are not available, we have used S&P® ratings. All ratings are as of the date indicated and do not reflect subsequent changes.
Asset Allocation (% of fund's net assets)
| As of April 30, 2017* | ||
| Nonconvertible Bonds | 81.7% | |
| Convertible Bonds, Preferred Stocks | 0.2% | |
| Common Stocks | 0.2% | |
| Bank Loan Obligations | 10.3% | |
| Other Investments | 4.5% | |
| Short-Term Investments and Net Other Assets (Liabilities) | 3.1% | |

* Foreign investments - 28.9%
| As of October 31, 2016* | ||
| Nonconvertible Bonds | 80.8% | |
| Convertible Bonds, Preferred Stocks | 0.3% | |
| Bank Loan Obligations | 10.4% | |
| Other Investments | 5.5% | |
| Short-Term Investments and Net Other Assets (Liabilities) | 3.0% | |

* Foreign investments - 26.4%
Investments April 30, 2017 (Unaudited)
Showing Percentage of Net Assets
| Nonconvertible Bonds - 81.7% | |||
| Principal Amount | Value | ||
| Aerospace - 0.5% | |||
| TransDigm, Inc.: | |||
| 6% 7/15/22 | $1,140,000 | $1,174,200 | |
| 6.375% 6/15/26 | 800,000 | 806,000 | |
| 6.5% 5/15/25 (a) | 1,185,000 | 1,211,663 | |
| 6.5% 5/15/25 | 705,000 | 720,863 | |
| TOTAL AEROSPACE | 3,912,726 | ||
| Air Transportation - 2.6% | |||
| Air Canada 7.75% 4/15/21 (a) | 615,000 | 694,950 | |
| Air Canada 2013-1 Pass Through 6.625% 5/15/18 (a) | 3,205,000 | 3,317,175 | |
| Air Canada Trust Series 2015-1 equipment trust certificate Class C, 5% 3/15/20 (a) | 1,635,000 | 1,637,371 | |
| Allegiant Travel Co. 5.5% 7/15/19 | 1,610,000 | 1,658,300 | |
| American Airlines Group, Inc.: | |||
| 4.625% 3/1/20 (a) | 840,000 | 854,700 | |
| 5.5% 10/1/19 (a) | 2,775,000 | 2,899,875 | |
| American Airlines, Inc. pass-thru trust certificates 5.625% 1/15/21 (a) | 254,195 | 264,045 | |
| Continental Airlines, Inc.: | |||
| pass-thru trust certificates 9.798% 4/1/21 | 681,723 | 747,339 | |
| 6.25% 4/11/20 | 1,352,690 | 1,423,706 | |
| 9.25% 5/10/17 | 545,566 | 546,248 | |
| Delta Air Lines, Inc. pass-thru trust certificates 8.021% 2/10/24 | 765,011 | 870,200 | |
| U.S. Airways Group, Inc. 6.125% 6/1/18 | 1,180,000 | 1,224,250 | |
| U.S. Airways pass-thru certificates: | |||
| Series 2012-2C, 5.45% 6/3/18 | 2,215,000 | 2,264,838 | |
| Series 2013-1 Class B, 5.375% 11/15/21 | 393,594 | 411,424 | |
| United Air Lines, Inc. pass-thru trust certificates Class B, 7.336% 7/2/19 | 718,108 | 754,014 | |
| United Continental Holdings, Inc. 6% 12/1/20 | 615,000 | 659,588 | |
| TOTAL AIR TRANSPORTATION | 20,228,023 | ||
| Automotive & Auto Parts - 0.5% | |||
| IHO Verwaltungs GmbH 4.125% 9/15/21 pay-in-kind (a)(b) | 635,000 | 643,731 | |
| Tenneco, Inc. 5% 7/15/26 | 1,045,000 | 1,046,170 | |
| ZF North America Capital, Inc. 4.75% 4/29/25 (a) | 1,805,000 | 1,877,326 | |
| TOTAL AUTOMOTIVE & AUTO PARTS | 3,567,227 | ||
| Banks & Thrifts - 0.2% | |||
| Ally Financial, Inc. 4.25% 4/15/21 | 1,440,000 | 1,472,400 | |
| Broadcasting - 0.2% | |||
| AMC Networks, Inc.: | |||
| 4.75% 12/15/22 | 650,000 | 663,000 | |
| 5% 4/1/24 | 1,150,000 | 1,165,123 | |
| TOTAL BROADCASTING | 1,828,123 | ||
| Building Materials - 1.7% | |||
| Building Materials Corp. of America: | |||
| 5% 2/15/27 (a) | 1,625,000 | 1,641,250 | |
| 5.375% 11/15/24 (a) | 1,955,000 | 2,038,088 | |
| 6% 10/15/25 (a) | 1,700,000 | 1,814,750 | |
| CEMEX Finance LLC 6% 4/1/24 (a) | 1,825,000 | 1,929,938 | |
| CEMEX S.A.B. de CV: | |||
| 5.7% 1/11/25 (a) | 770,000 | 804,650 | |
| 7.75% 4/16/26 (a) | 1,330,000 | 1,516,200 | |
| Eagle Materials, Inc. 4.5% 8/1/26 | 1,550,000 | 1,542,250 | |
| HD Supply, Inc. 5.75% 4/15/24 (a) | 990,000 | 1,051,875 | |
| U.S. Concrete, Inc. 6.375% 6/1/24 (a) | 350,000 | 365,750 | |
| TOTAL BUILDING MATERIALS | 12,704,751 | ||
| Cable/Satellite TV - 5.0% | |||
| Altice SA 7.75% 5/15/22 (a) | 8,922,000 | 9,480,785 | |
| Altice U.S. Finance SA 5.5% 5/15/26 (a) | 1,945,000 | 2,010,644 | |
| CCO Holdings LLC/CCO Holdings Capital Corp.: | |||
| 5.125% 2/15/23 | 555,000 | 577,200 | |
| 5.125% 5/1/23 (a) | 2,800,000 | 2,922,500 | |
| 5.125% 5/1/27 (a) | 3,660,000 | 3,733,200 | |
| 5.5% 5/1/26 (a) | 3,445,000 | 3,615,114 | |
| 5.75% 2/15/26 (a) | 1,450,000 | 1,540,161 | |
| 5.875% 4/1/24 (a) | 1,945,000 | 2,083,581 | |
| 5.875% 5/1/27 (a) | 820,000 | 872,275 | |
| CSC Holdings, Inc. 5.5% 4/15/27 (a) | 2,080,000 | 2,150,200 | |
| Unitymedia Hessen GmbH & Co. KG/Unitymedia NRW GmbH 5% 1/15/25 (a) | 1,140,000 | 1,183,480 | |
| Virgin Media Secured Finance PLC: | |||
| 5.5% 1/15/25 (a) | 595,000 | 610,619 | |
| 5.5% 8/15/26 (a) | 2,820,000 | 2,879,925 | |
| Ziggo Bond Finance BV: | |||
| 5.875% 1/15/25 (a) | 1,210,000 | 1,241,763 | |
| 6% 1/15/27 (a) | 2,185,000 | 2,228,700 | |
| Ziggo Secured Finance BV 5.5% 1/15/27 (a) | 1,770,000 | 1,814,303 | |
| TOTAL CABLE/SATELLITE TV | 38,944,450 | ||
| Capital Goods - 0.5% | |||
| Belden, Inc. 5.25% 7/15/24 (a) | 335,000 | 338,350 | |
| J.B. Poindexter & Co., Inc. 9% 4/1/22 (a) | 3,615,000 | 3,786,713 | |
| TOTAL CAPITAL GOODS | 4,125,063 | ||
| Chemicals - 1.6% | |||
| CF Industries Holdings, Inc.: | |||
| 3.4% 12/1/21 (a) | 750,000 | 754,163 | |
| 3.45% 6/1/23 | 745,000 | 694,713 | |
| 4.5% 12/1/26 (a) | 540,000 | 548,905 | |
| Evolution Escrow Issuer LLC 7.5% 3/15/22 (a) | 845,000 | 883,025 | |
| Kraton Polymers LLC/Kraton Polymers Capital Corp. 7% 4/15/25 (a) | 2,045,000 | 2,147,250 | |
| Nufarm Australia Ltd. 6.375% 10/15/19 (a) | 3,910,000 | 4,012,638 | |
| Olin Corp. 5.125% 9/15/27 | 2,240,000 | 2,332,400 | |
| Versum Materials, Inc. 5.5% 9/30/24 (a) | 960,000 | 997,200 | |
| TOTAL CHEMICALS | 12,370,294 | ||
| Consumer Products - 0.1% | |||
| Edgewell Personal Care Co. 5.5% 6/15/25 (a) | 940,000 | 979,950 | |
| Containers - 2.7% | |||
| Ardagh Packaging Finance PLC/Ardagh MP Holdings U.S.A., Inc.: | |||
| 4.25% 9/15/22 (a) | 1,200,000 | 1,223,040 | |
| 4.289% 5/15/21 (a)(b) | 1,475,000 | 1,506,344 | |
| 4.625% 5/15/23 (a) | 2,450,000 | 2,502,063 | |
| 6% 2/15/25 (a) | 3,715,000 | 3,840,381 | |
| 7.25% 5/15/24 (a) | 865,000 | 941,769 | |
| Crown Americas LLC/Crown Americas Capital Corp. V 4.25% 9/30/26 (a) | 2,070,000 | 2,028,600 | |
| Owens-Brockway Glass Container, Inc. 5.375% 1/15/25 (a) | 925,000 | 964,313 | |
| Reynolds Group Issuer, Inc./Reynolds Group Issuer LLC/Reynolds Group Issuer (Luxembourg) SA: | |||
| 4.6584% 7/15/21 (a)(b) | 990,000 | 1,012,275 | |
| 5.125% 7/15/23 (a) | 2,030,000 | 2,116,275 | |
| 5.75% 10/15/20 | 3,455,000 | 3,558,650 | |
| Silgan Holdings, Inc. 4.75% 3/15/25 (a) | 1,085,000 | 1,094,494 | |
| TOTAL CONTAINERS | 20,788,204 | ||
| Diversified Financial Services - 4.6% | |||
| AerCap Ireland Capital Ltd./AerCap Global Aviation Trust 4.625% 7/1/22 | 1,410,000 | 1,500,879 | |
| Aircastle Ltd. 5% 4/1/23 | 490,000 | 523,075 | |
| Chobani LLC/Finance Corp., Inc. 7.5% 4/15/25 (a) | 760,000 | 783,750 | |
| FLY Leasing Ltd.: | |||
| 6.375% 10/15/21 | 785,000 | 816,400 | |
| 6.75% 12/15/20 | 1,790,000 | 1,879,500 | |
| Icahn Enterprises LP/Icahn Enterprises Finance Corp.: | |||
| 4.875% 3/15/19 | 1,090,000 | 1,103,625 | |
| 5.875% 2/1/22 | 3,835,000 | 3,945,256 | |
| 6% 8/1/20 | 4,120,000 | 4,264,200 | |
| 6.25% 2/1/22 (a) | 3,475,000 | 3,614,000 | |
| 6.75% 2/1/24 (a) | 760,000 | 793,250 | |
| ILFC E-Capital Trust I 4.66% 12/21/65 (a)(b) | 2,555,000 | 2,427,250 | |
| ILFC E-Capital Trust II 4.91% 12/21/65 (a)(b) | 4,420,000 | 4,243,200 | |
| MSCI, Inc.: | |||
| 4.75% 8/1/26 (a) | 1,585,000 | 1,628,588 | |
| 5.25% 11/15/24 (a) | 1,855,000 | 1,966,300 | |
| Navient Corp. 5.875% 10/25/24 | 635,000 | 617,538 | |
| Radiate Holdco LLC/Radiate Financial Service Ltd. 6.625% 2/15/25 (a) | 790,000 | 788,025 | |
| SLM Corp.: | |||
| 4.875% 6/17/19 | 2,990,000 | 3,086,876 | |
| 5.5% 1/25/23 | 400,000 | 395,740 | |
| Springleaf Financial Corp. 7.75% 10/1/21 | 985,000 | 1,055,797 | |
| TOTAL DIVERSIFIED FINANCIAL SERVICES | 35,433,249 | ||
| Diversified Media - 0.5% | |||
| Block Communications, Inc. 6.875% 2/15/25 (a) | 660,000 | 711,150 | |
| E.W. Scripps Co. 5.125% 5/15/25 (a) | 210,000 | 215,513 | |
| MDC Partners, Inc. 6.5% 5/1/24 (a) | 2,290,000 | 2,232,750 | |
| National CineMedia LLC 5.75% 8/15/26 | 965,000 | 984,300 | |
| TOTAL DIVERSIFIED MEDIA | 4,143,713 | ||
| Energy - 12.8% | |||
| Antero Resources Corp.: | |||
| 5% 3/1/25 (a) | 1,720,000 | 1,698,500 | |
| 5.125% 12/1/22 | 2,120,000 | 2,151,800 | |
| 5.625% 6/1/23 (Reg. S) | 690,000 | 709,838 | |
| Antero Resources Finance Corp. 5.375% 11/1/21 | 510,000 | 526,575 | |
| Calfrac Holdings LP 7.5% 12/1/20 (a) | 1,340,000 | 1,229,450 | |
| Cheniere Corpus Christi Holdings LLC: | |||
| 5.875% 3/31/25 (a) | 2,265,000 | 2,412,225 | |
| 7% 6/30/24 (a) | 1,035,000 | 1,156,488 | |
| Chesapeake Energy Corp.: | |||
| 4.875% 4/15/22 | 1,455,000 | 1,334,963 | |
| 5.75% 3/15/23 | 1,350,000 | 1,255,500 | |
| 6.125% 2/15/21 | 855,000 | 840,038 | |
| 8% 12/15/22 (a) | 2,835,000 | 2,987,381 | |
| Concho Resources, Inc. 4.375% 1/15/25 | 2,155,000 | 2,181,938 | |
| Continental Resources, Inc.: | |||
| 3.8% 6/1/24 | 505,000 | 474,700 | |
| 4.5% 4/15/23 | 3,250,000 | 3,201,250 | |
| 4.9% 6/1/44 | 510,000 | 442,425 | |
| Covey Park Energy LLC 7.5% 5/15/25 (a) | 630,000 | 640,238 | |
| Crestwood Midstream Partners LP/Crestwood Midstream Finance Corp. 5.75% 4/1/25 (a) | 1,355,000 | 1,405,813 | |
| CVR Refining LLC/Coffeyville Finance, Inc. 6.5% 11/1/22 | 4,085,000 | 4,146,275 | |
| Endeavor Energy Resources LP/EER Finance, Inc. 7% 8/15/21 (a) | 3,960,000 | 4,118,400 | |
| Ensco PLC: | |||
| 4.5% 10/1/24 | 1,150,000 | 948,750 | |
| 5.2% 3/15/25 | 2,970,000 | 2,517,075 | |
| 8% 1/31/24 | 1,541,000 | 1,529,443 | |
| Exterran Energy Solutions LP 8.125% 5/1/25 (a) | 780,000 | 804,863 | |
| Exterran Partners LP/EXLP Finance Corp.: | |||
| 6% 4/1/21 | 2,755,000 | 2,761,888 | |
| 6% 10/1/22 | 965,000 | 962,588 | |
| Forum Energy Technologies, Inc. 6.25% 10/1/21 | 1,525,000 | 1,513,563 | |
| FTS International, Inc.: | |||
| 6.25% 5/1/22 | 680,000 | 588,200 | |
| 8.6312% 6/15/20 (a)(b) | 620,000 | 626,200 | |
| Gibson Energy, Inc. 6.75% 7/15/21 (a) | 1,071,000 | 1,116,518 | |
| Hilcorp Energy I LP/Hilcorp Finance Co.: | |||
| 5% 12/1/24 (a) | 1,730,000 | 1,621,875 | |
| 5.75% 10/1/25 (a) | 1,470,000 | 1,425,900 | |
| Nabors Industries, Inc. 5.5% 1/15/23 (a) | 942,000 | 953,775 | |
| NGL Energy Partners LP/NGL Energy Finance Corp. 6.125% 3/1/25 (a) | 1,015,000 | 943,950 | |
| Noble Holding International Ltd.: | |||
| 4.625% 3/1/21 | 1,362,000 | 1,253,040 | |
| 5.25% 3/15/42 | 765,000 | 501,458 | |
| 7.7% 4/1/25 (b) | 1,125,000 | 1,018,125 | |
| 7.75% 1/15/24 | 3,090,000 | 2,819,625 | |
| NRG Yield Operating LLC 5% 9/15/26 (a) | 1,540,000 | 1,509,200 | |
| NuStar Logistics LP 5.625% 4/28/27 | 405,000 | 417,668 | |
| Parsley Energy LLC/Parsley: | |||
| 5.25% 8/15/25 (a) | 525,000 | 528,938 | |
| 5.375% 1/15/25 (a) | 1,300,000 | 1,313,000 | |
| PBF Holding Co. LLC/PBF Finance Corp. 8.25% 2/15/20 | 155,000 | 158,488 | |
| PBF Logistics LP/PBF Logistics Finance, Inc. 6.875% 5/15/23 | 2,330,000 | 2,388,250 | |
| Range Resources Corp.: | |||
| 4.875% 5/15/25 | 1,190,000 | 1,142,400 | |
| 5% 3/15/23 (a) | 1,200,000 | 1,188,000 | |
| Rice Energy, Inc.: | |||
| 6.25% 5/1/22 | 6,290,000 | 6,577,013 | |
| 7.25% 5/1/23 | 3,595,000 | 3,882,600 | |
| Sabine Pass Liquefaction LLC 5.75% 5/15/24 | 3,025,000 | 3,343,829 | |
| Southwestern Energy Co. 6.7% 1/23/25 (b) | 645,000 | 641,775 | |
| Summit Midstream Holdings LLC 5.75% 4/15/25 | 605,000 | 612,563 | |
| Sunoco LP/Sunoco Finance Corp.: | |||
| 5.5% 8/1/20 | 715,000 | 739,131 | |
| 6.375% 4/1/23 | 1,375,000 | 1,464,375 | |
| Targa Resources Partners LP/Targa Resources Partners Finance Corp.: | |||
| 4.125% 11/15/19 | 1,130,000 | 1,149,063 | |
| 5.125% 2/1/25 (a) | 470,000 | 485,275 | |
| 5.25% 5/1/23 | 265,000 | 272,950 | |
| 5.375% 2/1/27 (a) | 470,000 | 491,150 | |
| 6.75% 3/15/24 | 2,005,000 | 2,185,450 | |
| Teine Energy Ltd. 6.875% 9/30/22 (a) | 1,745,000 | 1,779,900 | |
| TerraForm Power Operating LLC 6.375% 2/1/23 (a)(b) | 1,295,000 | 1,338,706 | |
| The Williams Companies, Inc.: | |||
| 3.7% 1/15/23 | 1,440,000 | 1,418,400 | |
| 4.55% 6/24/24 | 1,920,000 | 1,965,600 | |
| Weatherford International Ltd. 4.5% 4/15/22 | 1,035,000 | 978,075 | |
| Whiting Petroleum Corp. 5% 3/15/19 | 1,010,000 | 1,020,100 | |
| WPX Energy, Inc.: | |||
| 5.25% 9/15/24 | 1,265,000 | 1,233,375 | |
| 6% 1/15/22 | 970,000 | 984,550 | |
| 7.5% 8/1/20 | 1,010,000 | 1,070,600 | |
| TOTAL ENERGY | 99,101,057 | ||
| Entertainment/Film - 0.2% | |||
| New Cotai LLC/New Cotai Capital Corp. 10.625% 5/1/19 pay-in-kind (a)(b) | 1,611,549 | 1,385,932 | |
| Environmental - 0.6% | |||
| ADS Waste Holdings, Inc. 5.625% 11/15/24 (a) | 800,000 | 823,000 | |
| Covanta Holding Corp.: | |||
| 5.875% 3/1/24 | 500,000 | 502,500 | |
| 5.875% 7/1/25 | 220,000 | 220,000 | |
| LBC Tank Terminals Holding Netherlands BV 6.875% 5/15/23 (a) | 2,683,000 | 2,790,320 | |
| TOTAL ENVIRONMENTAL | 4,335,820 | ||
| Food & Drug Retail - 1.2% | |||
| Albertsons Companies LLC/Safeway, Inc./New Albertson's, Inc./Albertson's LLC: | |||
| 5.75% 3/15/25 (a) | 1,700,000 | 1,653,250 | |
| 6.625% 6/15/24 (a) | 865,000 | 884,463 | |
| Albertsons, Inc.: | |||
| 6.625% 6/1/28 | 275,000 | 246,125 | |
| 7.45% 8/1/29 | 250,000 | 235,625 | |
| 7.75% 6/15/26 | 295,000 | 287,625 | |
| 8% 5/1/31 | 1,570,000 | 1,530,750 | |
| 8.7% 5/1/30 | 220,000 | 217,800 | |
| BI-LO LLC/BI-LO Finance Corp. 9.25% 2/15/19 (a) | 590,000 | 516,250 | |
| FAGE International SA/FAGE U.S.A. Dairy Industry, Inc. 5.625% 8/15/26 (a) | 255,000 | 259,463 | |
| Tesco PLC 6.15% 11/15/37 (a) | 2,335,000 | 2,378,723 | |
| Tops Holding LLC/Tops Markets II Corp. 8% 6/15/22 (a) | 1,120,000 | 980,000 | |
| TOTAL FOOD & DRUG RETAIL | 9,190,074 | ||
| Food/Beverage/Tobacco - 3.3% | |||
| B&G Foods, Inc. 5.25% 4/1/25 | 1,140,000 | 1,167,109 | |
| Cott Holdings, Inc. 5.5% 4/1/25 (a) | 1,795,000 | 1,826,413 | |
| ESAL GmbH 6.25% 2/5/23 (a) | 6,955,000 | 7,050,631 | |
| JBS Investments GmbH 7.75% 10/28/20 (a) | 1,295,000 | 1,357,743 | |
| JBS U.S.A. LLC/JBS U.S.A. Finance, Inc.: | |||
| 5.875% 7/15/24 (a) | 970,000 | 1,011,225 | |
| 7.25% 6/1/21 (a) | 1,850,000 | 1,900,875 | |
| 8.25% 2/1/20 (a) | 4,220,000 | 4,323,390 | |
| Lamb Weston Holdings, Inc.: | |||
| 4.625% 11/1/24 (a) | 1,525,000 | 1,574,563 | |
| 4.875% 11/1/26 (a) | 610,000 | 629,063 | |
| Minerva Luxembourg SA 6.5% 9/20/26 (a) | 1,705,000 | 1,692,195 | |
| Post Holdings, Inc. 5.75% 3/1/27 (a) | 365,000 | 379,144 | |
| Vector Group Ltd. 6.125% 2/1/25 (a) | 2,090,000 | 2,163,150 | |
| TOTAL FOOD/BEVERAGE/TOBACCO | 25,075,501 | ||
| Gaming - 3.0% | |||
| GLP Capital LP/GLP Financing II, Inc.: | |||
| 4.375% 4/15/21 | 1,080,000 | 1,131,300 | |
| 5.375% 4/15/26 | 340,000 | 358,700 | |
| MCE Finance Ltd. 5% 2/15/21 (a) | 4,430,000 | 4,527,017 | |
| MGM Growth Properties Operating Partnership LP 4.5% 9/1/26 | 3,135,000 | 3,123,244 | |
| Scientific Games Corp.: | |||
| 6.625% 5/15/21 | 3,635,000 | 3,503,231 | |
| 7% 1/1/22 (a) | 1,080,000 | 1,156,270 | |
| Wynn Macau Ltd. 5.25% 10/15/21 (a) | 8,970,000 | 9,216,675 | |
| TOTAL GAMING | 23,016,437 | ||
| Healthcare - 6.0% | |||
| AMAG Pharmaceuticals, Inc. 7.875% 9/1/23 (a) | 1,175,000 | 1,116,250 | |
| Community Health Systems, Inc.: | |||
| 5.125% 8/1/21 | 1,680,000 | 1,665,300 | |
| 6.25% 3/31/23 | 1,035,000 | 1,053,113 | |
| 6.875% 2/1/22 | 4,710,000 | 3,897,525 | |
| DaVita HealthCare Partners, Inc.: | |||
| 5% 5/1/25 | 1,305,000 | 1,314,788 | |
| 5.75% 8/15/22 | 625,000 | 647,656 | |
| Envision Healthcare Corp. 6.25% 12/1/24 (a) | 2,265,000 | 2,383,913 | |
| HCA Holdings, Inc.: | |||
| 4.5% 2/15/27 | 3,195,000 | 3,225,321 | |
| 5% 3/15/24 | 1,915,000 | 2,032,294 | |
| 5.25% 6/15/26 | 2,175,000 | 2,319,094 | |
| HealthSouth Corp.: | |||
| 5.125% 3/15/23 | 1,535,000 | 1,540,756 | |
| 5.75% 9/15/25 | 3,030,000 | 3,064,088 | |
| IMS Health, Inc. 5% 10/15/26 (a) | 1,060,000 | 1,081,200 | |
| Kindred Healthcare, Inc. 8% 1/15/20 | 1,090,000 | 1,125,425 | |
| Mallinckrodt International Finance SA/Mallinckrodt CB LLC 5.5% 4/15/25 (a) | 1,615,000 | 1,469,650 | |
| MPT Operating Partnership LP/MPT Finance Corp.: | |||
| 5.25% 8/1/26 | 1,840,000 | 1,886,000 | |
| 6.375% 3/1/24 | 895,000 | 968,838 | |
| Sabra Health Care LP/Sabra Capital Corp.: | |||
| 5.375% 6/1/23 | 505,000 | 512,575 | |
| 5.5% 2/1/21 | 815,000 | 845,563 | |
| Teleflex, Inc. 4.875% 6/1/26 | 2,024,000 | 2,054,360 | |
| Tenet Healthcare Corp.: | |||
| 4.375% 10/1/21 | 1,465,000 | 1,463,169 | |
| 6.75% 6/15/23 | 2,360,000 | 2,253,800 | |
| Valeant Pharmaceuticals International, Inc.: | |||
| 5.375% 3/15/20 (a) | 2,640,000 | 2,263,800 | |
| 5.625% 12/1/21 (a) | 820,000 | 630,375 | |
| 5.875% 5/15/23 (a) | 2,015,000 | 1,488,581 | |
| 6.125% 4/15/25 (a) | 2,220,000 | 1,638,915 | |
| 6.5% 3/15/22 (a) | 1,310,000 | 1,341,113 | |
| 6.75% 8/15/18 (a) | 479,000 | 477,803 | |
| Wellcare Health Plans, Inc. 5.25% 4/1/25 | 640,000 | 665,600 | |
| TOTAL HEALTHCARE | 46,426,865 | ||
| Homebuilders/Real Estate - 2.9% | |||
| CalAtlantic Group, Inc.: | |||
| 5.25% 6/1/26 | 2,145,000 | 2,203,988 | |
| 5.875% 11/15/24 | 640,000 | 688,000 | |
| Communications Sales & Leasing, Inc. 7.125% 12/15/24 (a) | 1,170,000 | 1,196,325 | |
| Howard Hughes Corp. 5.375% 3/15/25 (a) | 885,000 | 893,850 | |
| Lennar Corp. 4.125% 1/15/22 | 1,125,000 | 1,147,500 | |
| M/I Homes, Inc. 6.75% 1/15/21 | 1,850,000 | 1,937,875 | |
| Mattamy Group Corp. 6.875% 12/15/23 (a) | 1,760,000 | 1,826,000 | |
| Odebrecht Finance Ltd. 4.375% 4/25/25 (a) | 1,220,000 | 547,475 | |
| PulteGroup, Inc. 5% 1/15/27 | 1,035,000 | 1,047,938 | |
| Shea Homes Ltd. Partnership/Corp. 5.875% 4/1/23 (a) | 640,000 | 646,400 | |
| Starwood Property Trust, Inc. 5% 12/15/21 (a) | 1,565,000 | 1,631,513 | |
| Taylor Morrison Communities, Inc./Monarch Communities, Inc.: | |||
| 5.25% 4/15/21 (a) | 1,075,000 | 1,104,810 | |
| 5.875% 4/15/23 (a) | 760,000 | 809,400 | |
| Toll Brothers Finance Corp. 4.875% 3/15/27 | 2,000,000 | 2,050,000 | |
| VEREIT Operating Partnership LP: | |||
| 4.125% 6/1/21 | 690,000 | 718,031 | |
| 4.875% 6/1/26 | 690,000 | 731,117 | |
| William Lyon Homes, Inc.: | |||
| 5.875% 1/31/25 (a) | 540,000 | 553,500 | |
| 7% 8/15/22 | 2,865,000 | 2,993,925 | |
| TOTAL HOMEBUILDERS/REAL ESTATE | 22,727,647 | ||
| Hotels - 0.5% | |||
| Hilton Escrow Issuer LLC 4.25% 9/1/24 (a) | 2,340,000 | 2,357,550 | |
| Hilton Worldwide Finance LLC/Hilton Worldwide Finance Corp.: | |||
| 4.625% 4/1/25 (a) | 990,000 | 1,017,225 | |
| 4.875% 4/1/27 (a) | 585,000 | 599,625 | |
| TOTAL HOTELS | 3,974,400 | ||
| Insurance - 0.1% | |||
| USIS Merger Sub, Inc. 6.875% 5/1/25 (a) | 960,000 | 976,800 | |
| Leisure - 0.8% | |||
| Carlson Travel, Inc. 9.5% 12/15/24 (a) | 570,000 | 588,525 | |
| Hilton Grand Vacations Borrower LLC/Hilton Grand Vacations Borrower, Inc. 6.125% 12/1/24 (a) | 540,000 | 575,100 | |
| NCL Corp. Ltd. 4.75% 12/15/21 (a) | 2,645,000 | 2,711,125 | |
| Studio City Co. Ltd.: | |||
| 5.875% 11/30/19 (a) | 590,000 | 617,288 | |
| 7.25% 11/30/21 (a) | 1,335,000 | 1,431,120 | |
| TOTAL LEISURE | 5,923,158 | ||
| Metals/Mining - 2.0% | |||
| First Quantum Minerals Ltd.: | |||
| 7% 2/15/21 (a) | 1,485,000 | 1,536,975 | |
| 7.25% 5/15/22 (a) | 809,000 | 833,270 | |
| 7.25% 4/1/23 (a) | 1,395,000 | 1,420,284 | |
| 7.5% 4/1/25 (a) | 1,315,000 | 1,341,300 | |
| Freeport-McMoRan, Inc.: | |||
| 3.55% 3/1/22 | 4,635,000 | 4,356,900 | |
| 3.875% 3/15/23 | 575,000 | 533,313 | |
| 4.55% 11/14/24 | 3,145,000 | 2,954,728 | |
| Lundin Mining Corp. 7.5% 11/1/20 (a) | 390,000 | 413,400 | |
| Murray Energy Corp. 11.25% 4/15/21 (a) | 675,000 | 506,250 | |
| Signode Industrial Group Lux SA/Signode Industrial Group U.S., Inc. 6.375% 5/1/22 (a) | 1,555,000 | 1,601,821 | |
| TOTAL METALS/MINING | 15,498,241 | ||
| Publishing/Printing - 0.7% | |||
| MHGE Parent LLC/MHGE Parent Finance, Inc. 8.5% 8/1/19 pay-in-kind (a)(b) | 5,145,000 | 5,183,588 | |
| Restaurants - 0.1% | |||
| Yum! Brands, Inc. 5.35% 11/1/43 | 650,000 | 570,375 | |
| Services - 2.9% | |||
| Anna Merger Sub, Inc. 7.75% 10/1/22 (a) | 500,000 | 423,750 | |
| APX Group, Inc.: | |||
| 6.375% 12/1/19 | 4,758,000 | 4,924,530 | |
| 7.875% 12/1/22 | 2,755,000 | 3,002,950 | |
| 8.75% 12/1/20 | 7,465,000 | 7,735,606 | |
| Aramark Services, Inc. 4.75% 6/1/26 | 3,135,000 | 3,197,700 | |
| Garda World Security Corp.: | |||
| 7.25% 11/15/21 (a) | 390,000 | 394,349 | |
| 7.25% 11/15/21 (a) | 170,000 | 171,955 | |
| IHS Markit Ltd. 4.75% 2/15/25 (a) | 670,000 | 700,988 | |
| Laureate Education, Inc. 8.25% 5/1/25 (a) | 1,860,000 | 1,911,150 | |
| TOTAL SERVICES | 22,462,978 | ||
| Steel - 0.4% | |||
| Steel Dynamics, Inc. 5.125% 10/1/21 | 3,155,000 | 3,257,538 | |
| Super Retail - 2.4% | |||
| Argos Merger Sub, Inc. 7.125% 3/15/23 (a) | 2,455,000 | 2,243,256 | |
| JC Penney Corp., Inc.: | |||
| 5.65% 6/1/20 | 9,191,000 | 9,145,045 | |
| 7.4% 4/1/37 | 3,940,000 | 3,220,950 | |
| L Brands, Inc.: | |||
| 6.75% 7/1/36 | 1,890,000 | 1,830,938 | |
| 6.875% 11/1/35 | 935,000 | 921,910 | |
| Netflix, Inc. 4.375% 11/15/26 (a) | 1,500,000 | 1,477,500 | |
| TOTAL SUPER RETAIL | 18,839,599 | ||
| Technology - 5.8% | |||
| EMC Corp. 2.65% 6/1/20 | 2,465,000 | 2,412,192 | |
| Gartner, Inc. 5.125% 4/1/25 (a) | 525,000 | 543,375 | |
| Greeneden U.S. Holdings II LLC 10% 11/30/24 (a) | 1,490,000 | 1,650,361 | |
| Inception Merger Sub, Inc./Rackspace Hosting, Inc. 8.625% 11/15/24 (a) | 2,945,000 | 3,118,019 | |
| Micron Technology, Inc.: | |||
| 5.25% 8/1/23 (a) | 540,000 | 558,900 | |
| 5.25% 1/15/24 (a) | 1,045,000 | 1,077,395 | |
| 5.5% 2/1/25 | 735,000 | 768,075 | |
| 5.625% 1/15/26 (a) | 1,140,000 | 1,205,550 | |
| Nuance Communications, Inc. 5.375% 8/15/20 (a) | 1,566,000 | 1,599,278 | |
| NXP BV/NXP Funding LLC: | |||
| 3.875% 9/1/22 (a) | 2,515,000 | 2,611,828 | |
| 4.125% 6/1/21 (a) | 4,930,000 | 5,158,013 | |
| 4.625% 6/1/23 (a) | 2,270,000 | 2,443,088 | |
| Open Text Corp. 5.875% 6/1/26 (a) | 4,285,000 | 4,574,238 | |
| Qorvo, Inc.: | |||
| 6.75% 12/1/23 | 2,735,000 | 2,967,475 | |
| 7% 12/1/25 | 2,315,000 | 2,569,650 | |
| Sensata Technologies BV 5% 10/1/25 (a) | 1,975,000 | 2,016,969 | |
| Sensata Technologies UK Financing Co. PLC 6.25% 2/15/26 (a) | 465,000 | 503,363 | |
| Solera LLC/Solera Finance, Inc. 10.5% 3/1/24 (a) | 2,455,000 | 2,801,769 | |
| Symantec Corp. 5% 4/15/25 (a) | 1,740,000 | 1,798,725 | |
| Tempo Acquisition LLC 6.75% 6/1/25 (a)(c) | 735,000 | 755,213 | |
| VeriSign, Inc. 5.25% 4/1/25 | 1,035,000 | 1,082,869 | |
| WideOpenWest Finance LLC/WideOpenWest Capital Corp. 10.25% 7/15/19 | 2,457,000 | 2,555,280 | |
| TOTAL TECHNOLOGY | 44,771,625 | ||
| Telecommunications - 10.1% | |||
| Altice Financing SA: | |||
| 6.5% 1/15/22 (a) | 390,000 | 409,013 | |
| 6.625% 2/15/23 (a) | 2,410,000 | 2,551,588 | |
| 7.5% 5/15/26 (a) | 4,990,000 | 5,389,200 | |
| Altice Finco SA 7.625% 2/15/25 (a) | 1,380,000 | 1,414,500 | |
| Columbus International, Inc. 7.375% 3/30/21 (a) | 9,550,000 | 10,278,149 | |
| CommScope Technologies Finance LLC 5% 3/15/27 (a) | 880,000 | 887,700 | |
| Equinix, Inc. 5.375% 5/15/27 | 645,000 | 673,890 | |
| Gogo Intermediate Holdings LLC/Gogo Finance Co., Inc. 12.5% 7/1/22 (a) | 845,000 | 967,525 | |
| Neptune Finco Corp.: | |||
| 10.125% 1/15/23 (a) | 1,445,000 | 1,676,200 | |
| 10.875% 10/15/25 (a) | 1,445,000 | 1,735,806 | |
| Sable International Finance Ltd. 6.875% 8/1/22 (a) | 4,550,000 | 4,881,240 | |
| SBA Communications Corp. 4.875% 9/1/24 (a) | 3,960,000 | 3,994,650 | |
| SFR Group SA: | |||
| 6% 5/15/22 (a) | 2,475,000 | 2,580,188 | |
| 6.25% 5/15/24 (a) | 490,000 | 507,150 | |
| Sprint Capital Corp. 6.875% 11/15/28 | 7,530,000 | 8,151,225 | |
| Sprint Communications, Inc. 6% 11/15/22 | 4,030,000 | 4,198,756 | |
| Sprint Corp.: | |||
| 7.25% 9/15/21 | 4,115,000 | 4,500,781 | |
| 7.625% 2/15/25 | 1,525,000 | 1,702,281 | |
| 7.875% 9/15/23 | 2,345,000 | 2,632,263 | |
| T-Mobile U.S.A., Inc.: | |||
| 4% 4/15/22 | 1,955,000 | 2,003,875 | |
| 5.125% 4/15/25 | 1,505,000 | 1,585,894 | |
| 6% 3/1/23 | 1,500,000 | 1,603,125 | |
| 6.375% 3/1/25 | 2,375,000 | 2,595,448 | |
| 6.625% 4/1/23 | 770,000 | 822,938 | |
| Telecom Italia Capital SA: | |||
| 6% 9/30/34 | 1,930,000 | 1,973,425 | |
| 6.375% 11/15/33 | 2,040,000 | 2,137,879 | |
| Telesat Canada/Telesat LLC 8.875% 11/15/24 (a) | 710,000 | 781,000 | |
| Wind Acquisition Finance SA 7.375% 4/23/21 (a) | 1,780,000 | 1,851,200 | |
| Zayo Group LLC/Zayo Capital, Inc.: | |||
| 5.75% 1/15/27 (a) | 1,805,000 | 1,915,556 | |
| 6.375% 5/15/25 | 1,200,000 | 1,297,500 | |
| TOTAL TELECOMMUNICATIONS | 77,699,945 | ||
| Transportation Ex Air/Rail - 0.7% | |||
| Navios Maritime Acquisition Corp./Navios Acquisition Finance U.S., Inc. 8.125% 11/15/21 (a) | 4,115,000 | 3,667,494 | |
| Navios Maritime Holdings, Inc.: | |||
| 7.375% 1/15/22 (a) | 615,000 | 528,900 | |
| 8.125% 2/15/19 | 1,200,000 | 1,080,000 | |
| Teekay Corp. 8.5% 1/15/20 | 410,000 | 405,900 | |
| TOTAL TRANSPORTATION EX AIR/RAIL | 5,682,294 | ||
| Utilities - 4.5% | |||
| Calpine Corp.: | |||
| 5.25% 6/1/26 (a) | 1,910,000 | 1,921,938 | |
| 5.75% 1/15/25 | 1,045,000 | 1,011,038 | |
| Dolphin Subsidiary II, Inc. 7.25% 10/15/21 | 5,080,000 | 5,435,600 | |
| DPL, Inc. 6.75% 10/1/19 | 945,000 | 989,888 | |
| Dynegy, Inc. 7.625% 11/1/24 | 2,465,000 | 2,255,475 | |
| Global Partners LP/GLP Finance Corp.: | |||
| 6.25% 7/15/22 | 2,035,000 | 2,014,650 | |
| 7% 6/15/23 | 4,325,000 | 4,281,750 | |
| NRG Energy, Inc.: | |||
| 6.25% 5/1/24 | 655,000 | 652,708 | |
| 6.625% 1/15/27 | 1,550,000 | 1,534,500 | |
| NSG Holdings II LLC/NSG Holdings, Inc. 7.75% 12/15/25 (a) | 8,120,128 | 8,729,138 | |
| PPL Energy Supply LLC 6.5% 6/1/25 | 615,000 | 488,925 | |
| RJS Power Holdings LLC 4.625% 7/15/19 (a)(b) | 1,026,000 | 1,010,610 | |
| The AES Corp.: | |||
| 4.0546% 6/1/19 (b) | 304,000 | 304,243 | |
| 4.875% 5/15/23 | 2,240,000 | 2,262,400 | |
| 6% 5/15/26 | 1,500,000 | 1,582,500 | |
| TOTAL UTILITIES | 34,475,363 | ||
| TOTAL NONCONVERTIBLE BONDS | |||
| (Cost $605,284,755) | 631,073,410 | ||
| Shares | Value | ||
| Common Stocks - 0.2% | |||
| Energy - 0.2% | |||
| Forbes Energy Services Ltd. (d) | 47,062 | 1,477,276 | |
| Southwestern Energy Co. (d) | 24,201 | 181,750 | |
| TOTAL ENERGY | 1,659,026 | ||
| Healthcare - 0.0% | |||
| HealthSouth Corp. | 19 | 891 | |
| Telecommunications - 0.0% | |||
| CUI Acquisition Corp. Class E, (d) | 1 | 23,749 | |
| TOTAL COMMON STOCKS | |||
| (Cost $3,365,785) | 1,683,666 | ||
| Convertible Preferred Stocks - 0.2% | |||
| Energy - 0.2% | |||
| Southwestern Energy Co. Series B 6.25% (d) | |||
| (Cost $1,817,294) | 102,500 | 1,886,636 | |
| Principal Amount | Value | ||
| Bank Loan Obligations - 10.3% | |||
| Aerospace - 0.6% | |||
| TransDigm, Inc.: | |||
| Tranche D, term loan 4.1367% 6/4/21 (b) | 953,050 | 954,508 | |
| Tranche F, term loan 3.9928% 6/9/23 (b) | 3,473,369 | 3,468,541 | |
| TOTAL AEROSPACE | 4,423,049 | ||
| Air Transportation - 0.6% | |||
| American Airlines, Inc.: | |||
| Tranche B, term loan 3.49% 10/10/21 (b) | 1,672,929 | 1,674,318 | |
| Tranche B, term loan 3.4939% 12/14/23 (b) | 1,685,000 | 1,686,584 | |
| United Air Lines, Inc. Tranche B, term loan 3.4218% 4/1/24 (b) | 1,600,000 | 1,602,576 | |
| TOTAL AIR TRANSPORTATION | 4,963,478 | ||
| Broadcasting - 0.3% | |||
| Nielsen Finance LLC Tranche B 4LN, term loan 2.99% 10/4/23 (b) | 1,997,700 | 2,005,191 | |
| Cable/Satellite TV - 0.6% | |||
| WideOpenWest Finance LLC Tranche B, term loan 4.554% 8/19/23 (b) | 2,099,450 | 2,110,241 | |
| Zayo Group LLC: | |||
| term loan 2.9911% 1/19/21 (b) | 745,000 | 748,263 | |
| Tranche B 1LN, term loan 3.5% 1/19/24 (b) | 132,268 | 133,103 | |
| Ziggo Secured Finance Partnership Tranche E, term loan 3.4939% 4/15/25 (b) | 1,750,000 | 1,750,088 | |
| TOTAL CABLE/SATELLITE TV | 4,741,695 | ||
| Containers - 0.8% | |||
| Anchor Glass Container Corp.: | |||
| Tranche 2LN, term loan 8.75% 12/7/24 (b) | 460,000 | 468,050 | |
| Tranche B 1LN, term loan 4.25% 12/7/23 (b) | 937,650 | 943,979 | |
| Reynolds Group Holdings, Inc. Tranche B, term loan 3.9928% 2/5/23 (b) | 2,701,442 | 2,714,787 | |
| Signode Packaging Systems, Inc. Tranche B, term loan 3.8138% 5/1/21 (b) | 1,912,940 | 1,920,113 | |
| TOTAL CONTAINERS | 6,046,929 | ||
| Diversified Financial Services - 0.3% | |||
| IBC Capital U.S. LLC: | |||
| Tranche 2LN, term loan 8.1196% 9/11/22 (b) | 925,000 | 867,188 | |
| Tranche B 1LN, term loan 4.8696% 9/11/21 (b) | 230,300 | 226,366 | |
| Quest Software U.S. Holdings, Inc. Tranche B, term loan 7% 10/31/22 (b) | 1,164,113 | 1,183,030 | |
| TOTAL DIVERSIFIED FINANCIAL SERVICES | 2,276,584 | ||
| Energy - 0.2% | |||
| Chesapeake Energy Corp. Tranche 1LN, term loan 8.5534% 8/23/21 (b) | 1,160,000 | 1,252,440 | |
| Forbes Energy Services LLC term loan 12% 12/21/20 pay-in-kind (b) | 448,214 | 421,321 | |
| TOTAL ENERGY | 1,673,761 | ||
| Food & Drug Retail - 0.4% | |||
| Albertson's LLC term loan 4.3023% 6/22/23 (b) | 349,600 | 351,058 | |
| JBS USA Lux SA Tranche B, term loan 3.4828% 10/30/22 (b) | 1,615,000 | 1,621,638 | |
| Pizza Hut Holdings LLC Tranche B, term loan 2.9939% 6/16/23 (b) | 1,285,000 | 1,291,425 | |
| TOTAL FOOD & DRUG RETAIL | 3,264,121 | ||
| Gaming - 0.2% | |||
| CityCenter Holdings LLC term loan 3.4939% 4/18/24 (b) | 1,275,000 | 1,276,594 | |
| Station Casinos LLC Tranche B, term loan 3.5% 6/8/23 (b) | 70,000 | 69,936 | |
| TOTAL GAMING | 1,346,530 | ||
| Healthcare - 0.4% | |||
| Envision Healthcare Corp. Tranche B, term loan 4.15% 12/1/23 (b) | 2,344,125 | 2,365,808 | |
| Valeant Pharmaceuticals International, Inc. Tranche B, term loan 5.74% 4/1/22 (b) | 312,880 | 314,673 | |
| TOTAL HEALTHCARE | 2,680,481 | ||
| Insurance - 0.0% | |||
| USI, Inc. term loan 4/5/24 (e) | 220,000 | 219,039 | |
| Metals/Mining - 0.4% | |||
| Fairmount Minerals Ltd. Tranche B 2LN, term loan 4.5% 9/5/19 (b) | 1,465,000 | 1,439,363 | |
| Murray Energy Corp. Tranche B 2LN, term loan 8.3968% 4/16/20 (b) | 1,447,727 | 1,380,567 | |
| TOTAL METALS/MINING | 2,819,930 | ||
| Publishing/Printing - 0.2% | |||
| Springer Science+Business Media Deutschland GmbH Tranche B 9LN, term loan 4.6217% 8/14/20 (b) | 1,805,352 | 1,806,490 | |
| Restaurants - 0.2% | |||
| Burger King Worldwide, Inc. Tranche B, term loan 3.3093% 2/17/24 (b) | 1,831,182 | 1,831,640 | |
| Services - 1.4% | |||
| Acosta, Inc. Tranche B, term loan 4.25% 9/26/21 (b) | 2,323,973 | 2,160,319 | |
| Almonde, Inc.: | |||
| Tranche 2LN, term loan 5/3/25 (e) | 85,000 | 86,629 | |
| Tranche B 1LN, term loan 5/3/24 (e) | 390,000 | 391,583 | |
| Brand Energy & Infrastructure Services, Inc. Tranche B, term loan 4.9172% 11/26/20 (b) | 2,500,987 | 2,507,240 | |
| Garda World Security Corp.: | |||
| term loan 4.0052% 11/8/20 (b) | 2,790,816 | 2,788,025 | |
| Tranche DD, term loan 4.0052% 11/8/20 (b) | 713,930 | 713,216 | |
| Lineage Logistics Holdings, LLC. Tranche B, term loan 4.5% 4/7/21 (b) | 2,381,904 | 2,383,405 | |
| The GEO Group, Inc. Tranche B, term loan 3.2% 3/23/24 (b) | 85,000 | 85,000 | |
| TOTAL SERVICES | 11,115,417 | ||
| Super Retail - 0.4% | |||
| BJ's Wholesale Club, Inc.: | |||
| Tranche 2LN, term loan 8.5% 2/3/25 (b) | 330,000 | 330,482 | |
| Tranche B 1LN, term loan 4.75% 2/3/24 (b) | 345,000 | 343,420 | |
| JC Penney Corp., Inc. Tranche B, term loan 5.304% 6/23/23 (b) | 1,627,610 | 1,624,566 | |
| PetSmart, Inc. term loan 4.02% 3/11/22 (b) | 1,021,965 | 934,985 | |
| TOTAL SUPER RETAIL | 3,233,453 | ||
| Technology - 1.9% | |||
| Ceridian HCM Holding, Inc. Tranche B 2LN, term loan 4.5011% 9/15/20 (b) | 1,560,000 | 1,557,083 | |
| Epicor Software Corp. Tranche B, term loan 4.75% 6/1/22 (b) | 1,299,378 | 1,297,351 | |
| Go Daddy Operating Co. LLC Tranche B, term loan 3.4928% 2/15/24 (b) | 2,120,000 | 2,128,226 | |
| Kronos, Inc. term loan: | |||
| 5.034% 11/1/23 (b) | 2,827,913 | 2,836,396 | |
| 9.284% 11/1/24 (b) | 710,000 | 738,755 | |
| Landesk Group, Inc. term loan: | |||
| 5.25% 1/20/24 (b) | 305,000 | 306,461 | |
| 10% 1/20/25 (b) | 550,000 | 545,600 | |
| Rackspace Hosting, Inc. term loan 4.5346% 11/3/23 (b) | 403,988 | 406,767 | |
| TTM Technologies, Inc. Tranche B 1LN, term loan 5.25% 5/31/21 (b) | 1,353,741 | 1,377,432 | |
| Uber Technologies, Inc. Tranche B, term loan 5% 7/13/23 (b) | 3,223,800 | 3,213,742 | |
| TOTAL TECHNOLOGY | 14,407,813 | ||
| Telecommunications - 1.3% | |||
| Altice Financing SA Tranche B, term loan 5.408% 6/22/25 (b) | 670,000 | 669,498 | |
| Level 3 Financing, Inc. Tranche B, term loan 3.2411% 2/22/24 (b) | 1,570,000 | 1,574,490 | |
| LTS Buyer LLC Tranche B 1LN, term loan 4.3968% 4/11/20 (b) | 659,595 | 661,363 | |
| Polycom, Inc. Tranche B, term loan 6.25% 9/27/23 (b) | 2,292,875 | 2,312,227 | |
| Radiate Holdco LLC Tranche B, term loan 3.9928% 2/1/24 (b) | 2,100,000 | 2,106,195 | |
| SFR Group SA Tranche B 11LN, term loan 3.9441% 7/31/25 (b) | 2,010,000 | 1,999,387 | |
| Sprint Communications, Inc. Tranche B, term loan 3.5% 2/3/24 (b) | 580,000 | 580,365 | |
| Telesat LLC Tranche B 4LN, term loan 4.15% 11/17/23 (b) | 49,875 | 50,224 | |
| TOTAL TELECOMMUNICATIONS | 9,953,749 | ||
| Utilities - 0.1% | |||
| Calpine Corp. Tranche B, term loan 2.75% 11/30/17 (b) | 840,000 | 841,747 | |
| TOTAL BANK LOAN OBLIGATIONS | |||
| (Cost $79,040,592) | 79,651,097 | ||
| Preferred Securities - 4.5% | |||
| Banks & Thrifts - 4.5% | |||
| Bank of America Corp.: | |||
| 6.25% (b)(f) | 1,600,000 | 1,731,665 | |
| 6.5% (b)(f) | 635,000 | 706,546 | |
| Barclays Bank PLC 7.625% 11/21/22 | 5,105,000 | 5,763,097 | |
| Barclays PLC: | |||
| 6.625% (b)(f) | 4,160,000 | 4,273,199 | |
| 8.25% (b)(f) | 4,090,000 | 4,393,833 | |
| Citigroup, Inc.: | |||
| 5.875% (b)(f) | 785,000 | 822,906 | |
| 5.95% (b)(f) | 1,235,000 | 1,331,421 | |
| 5.95% (b)(f) | 1,135,000 | 1,207,558 | |
| Credit Agricole SA: | |||
| 6.625% (a)(b)(f) | 6,360,000 | 6,538,545 | |
| 7.875% (a)(b)(f) | 1,480,000 | 1,595,685 | |
| JPMorgan Chase & Co. 5.3% (b)(f) | 590,000 | 630,740 | |
| Royal Bank of Scotland Group PLC: | |||
| 7.5% (b)(f) | 3,875,000 | 4,038,319 | |
| 8.625% (b)(f) | 1,415,000 | 1,538,105 | |
| TOTAL PREFERRED SECURITIES | |||
| (Cost $32,569,622) | 34,571,619 | ||
| Shares | Value | ||
| Money Market Funds - 3.2% | |||
| Fidelity Cash Central Fund, 0.85% (g) | |||
| (Cost $24,671,759) | 24,667,111 | 24,672,044 | |
| TOTAL INVESTMENT PORTFOLIO - 100.1% | |||
| (Cost $746,749,807) | 773,538,472 | ||
| NET OTHER ASSETS (LIABILITIES) - (0.1)% | (693,369) | ||
| NET ASSETS - 100% | $772,845,103 |
Legend
(a) Security exempt from registration under Rule 144A of the Securities Act of 1933. These securities may be resold in transactions exempt from registration, normally to qualified institutional buyers. At the end of the period, the value of these securities amounted to $348,631,737 or 45.1% of net assets.
(b) Coupon rates for floating and adjustable rate securities reflect the rates in effect at period end.
(c) Security or a portion of the security purchased on a delayed delivery or when-issued basis.
(d) Non-income producing
(e) The coupon rate will be determined upon settlement of the loan after period end.
(f) Security is perpetual in nature with no stated maturity date.
(g) Affiliated fund that is generally available only to investment companies and other accounts managed by Fidelity Investments. The rate quoted is the annualized seven-day yield of the fund at period end. A complete unaudited listing of the fund's holdings as of its most recent quarter end is available upon request. In addition, each Fidelity Central Fund's financial statements are available on the SEC's website or upon request.
Affiliated Central Funds
Information regarding fiscal year to date income earned by the Fund from investments in Fidelity Central Funds is as follows:
| Fund | Income earned |
| Fidelity Cash Central Fund | $74,144 |
| Total | $74,144 |
Investment Valuation
The following is a summary of the inputs used, as of April 30, 2017, involving the Fund's assets and liabilities carried at fair value. The inputs or methodology used for valuing securities may not be an indication of the risk associated with investing in those securities. For more information on valuation inputs, and their aggregation into the levels used below, please refer to the Investment Valuation section in the accompanying Notes to Financial Statements.
| Valuation Inputs at Reporting Date: | ||||
| Description | Total | Level 1 | Level 2 | Level 3 |
| Investments in Securities: | ||||
| Equities: | ||||
| Energy | $3,545,662 | $181,750 | $1,886,636 | $1,477,276 |
| Health Care | 891 | 891 | -- | -- |
| Telecommunication Services | 23,749 | -- | -- | 23,749 |
| Corporate Bonds | 631,073,410 | -- | 631,073,410 | -- |
| Bank Loan Obligations | 79,651,097 | -- | 79,229,776 | 421,321 |
| Preferred Securities | 34,571,619 | -- | 34,571,619 | -- |
| Money Market Funds | 24,672,044 | 24,672,044 | -- | -- |
| Total Investments in Securities: | $773,538,472 | $24,854,685 | $746,761,441 | $1,922,346 |
Other Information
Distribution of investments by country or territory of incorporation, as a percentage of Total Net Assets, is as follows (Unaudited):
| United States of America | 71.1% |
| Canada | 4.8% |
| United Kingdom | 4.1% |
| Luxembourg | 4.1% |
| Cayman Islands | 3.3% |
| Netherlands | 2.9% |
| France | 1.6% |
| Multi-National | 1.6% |
| Ireland | 1.5% |
| Barbados | 1.3% |
| Austria | 1.1% |
| Others (Individually Less Than 1%) | 2.6% |
| 100.0% |
See accompanying notes which are an integral part of the financial statements.
Financial Statements
Statement of Assets and Liabilities
| April 30, 2017 (Unaudited) | ||
| Assets | ||
| Investment in securities, at value — See accompanying schedule: Unaffiliated issuers (cost $722,078,048) | $748,866,428 | |
| Fidelity Central Funds (cost $24,671,759) | 24,672,044 | |
| Total Investments (cost $746,749,807) | $773,538,472 | |
| Cash | 207,719 | |
| Receivable for investments sold | 860,517 | |
| Receivable for fund shares sold | 468,423 | |
| Interest receivable | 10,657,017 | |
| Distributions receivable from Fidelity Central Funds | 18,480 | |
| Prepaid expenses | 552 | |
| Other receivables | 117 | |
| Total assets | 785,751,297 | |
| Liabilities | ||
| Payable for investments purchased | ||
| Regular delivery | $10,008,294 | |
| Delayed delivery | 735,000 | |
| Payable for fund shares redeemed | 1,319,230 | |
| Distributions payable | 176,426 | |
| Accrued management fee | 358,466 | |
| Distribution and service plan fees payable | 134,562 | |
| Other affiliated payables | 134,583 | |
| Other payables and accrued expenses | 39,633 | |
| Total liabilities | 12,906,194 | |
| Net Assets | $772,845,103 | |
| Net Assets consist of: | ||
| Paid in capital | $784,077,207 | |
| Undistributed net investment income | 4,881,153 | |
| Accumulated undistributed net realized gain (loss) on investments | (42,901,922) | |
| Net unrealized appreciation (depreciation) on investments | 26,788,665 | |
| Net Assets | $772,845,103 | |
| Calculation of Maximum Offering Price | ||
| Class A: | ||
| Net Asset Value and redemption price per share ($194,507,731 ÷ 24,554,903 shares) | $7.92 | |
| Maximum offering price per share (100/96.00 of $7.92) | $8.25 | |
| Class M: | ||
| Net Asset Value and redemption price per share ($63,829,303 ÷ 8,074,718 shares) | $7.90 | |
| Maximum offering price per share (100/96.00 of $7.90) | $8.23 | |
| Class C: | ||
| Net Asset Value and offering price per share ($97,387,175 ÷ 12,331,650 shares)(a) | $7.90 | |
| Class I: | ||
| Net Asset Value, offering price and redemption price per share ($417,120,894 ÷ 52,563,257 shares) | $7.94 |
(a) Redemption price per share is equal to net asset value less any applicable contingent deferred sales charge.
See accompanying notes which are an integral part of the financial statements.
Statement of Operations
| Six months ended April 30, 2017 (Unaudited) | ||
| Investment Income | ||
| Dividends | $1,512,295 | |
| Interest | 22,853,729 | |
| Income from Fidelity Central Funds | 74,144 | |
| Total income | 24,440,168 | |
| Expenses | ||
| Management fee | $2,211,448 | |
| Transfer agent fees | 685,856 | |
| Distribution and service plan fees | 833,919 | |
| Accounting fees and expenses | 147,533 | |
| Custodian fees and expenses | 10,040 | |
| Independent trustees' fees and expenses | 1,631 | |
| Registration fees | 38,323 | |
| Audit | 39,010 | |
| Legal | 2,989 | |
| Miscellaneous | 3,197 | |
| Total expenses before reductions | 3,973,946 | |
| Expense reductions | (4,403) | 3,969,543 |
| Net investment income (loss) | 20,470,625 | |
| Realized and Unrealized Gain (Loss) | ||
| Net realized gain (loss) on: | ||
| Investment securities: | ||
| Unaffiliated issuers | 6,121,397 | |
| Fidelity Central Funds | 2,037 | |
| Total net realized gain (loss) | 6,123,434 | |
| Change in net unrealized appreciation (depreciation) on investment securities | 12,101,862 | |
| Net gain (loss) | 18,225,296 | |
| Net increase (decrease) in net assets resulting from operations | $38,695,921 |
See accompanying notes which are an integral part of the financial statements.
Statement of Changes in Net Assets
| Six months ended April 30, 2017 (Unaudited) | Year ended October 31, 2016 | |
| Increase (Decrease) in Net Assets | ||
| Operations | ||
| Net investment income (loss) | $20,470,625 | $44,954,717 |
| Net realized gain (loss) | 6,123,434 | (34,377,068) |
| Change in net unrealized appreciation (depreciation) | 12,101,862 | 46,532,275 |
| Net increase (decrease) in net assets resulting from operations | 38,695,921 | 57,109,924 |
| Distributions to shareholders from net investment income | (19,178,134) | (41,784,482) |
| Share transactions - net increase (decrease) | (71,287,008) | 39,446,842 |
| Redemption fees | 46,759 | 201,553 |
| Total increase (decrease) in net assets | (51,722,462) | 54,973,837 |
| Net Assets | ||
| Beginning of period | 824,567,565 | 769,593,728 |
| End of period | $772,845,103 | $824,567,565 |
| Other Information | ||
| Undistributed net investment income end of period | $4,881,153 | $3,588,662 |
See accompanying notes which are an integral part of the financial statements.
Financial Highlights — Fidelity Advisor High Income Fund Class A
| Six months ended (Unaudited) April 30, | Years ended October 31, | |||||
| 2017 | 2016 | 2015 | 2014 | 2013 | 2012 | |
| Selected Per–Share Data | ||||||
| Net asset value, beginning of period | $7.73 | $7.61 | $8.33 | $8.77 | $8.73 | $8.38 |
| Income from Investment Operations | ||||||
| Net investment income (loss)A | .201 | .421 | .430 | .432 | .473 | .539 |
| Net realized and unrealized gain (loss) | .177 | .089 | (.523) | (.058) | .117 | .411 |
| Total from investment operations | .378 | .510 | (.093) | .374 | .590 | .950 |
| Distributions from net investment income | (.188) | (.392) | (.424) | (.429) | (.457) | (.551) |
| Distributions from net realized gain | – | – | (.204) | (.386) | (.094) | (.050) |
| Total distributions | (.188) | (.392) | (.628) | (.815) | (.551) | (.601) |
| Redemption fees added to paid in capitalA | –B | .002 | .001 | .001 | .001 | .001 |
| Net asset value, end of period | $7.92 | $7.73 | $7.61 | $8.33 | $8.77 | $8.73 |
| Total ReturnC,D,E | 4.95% | 7.09% | (1.13)% | 4.51% | 6.99% | 11.84% |
| Ratios to Average Net AssetsF,G | ||||||
| Expenses before reductions | 1.04%H | 1.04% | 1.03% | 1.03% | 1.03% | 1.03% |
| Expenses net of fee waivers, if any | 1.04%H | 1.04% | 1.03% | 1.03% | 1.03% | 1.03% |
| Expenses net of all reductions | 1.03%H | 1.04% | 1.03% | 1.03% | 1.03% | 1.03% |
| Net investment income (loss) | 5.20%H | 5.68% | 5.45% | 5.09% | 5.40% | 6.35% |
| Supplemental Data | ||||||
| Net assets, end of period (000 omitted) | $194,508 | $223,620 | $227,596 | $243,987 | $280,769 | $331,436 |
| Portfolio turnover rateI | 64%H | 61% | 60% | 79% | 76% | 48% |
A Calculated based on average shares outstanding during the period.
B Amount represents less than $.0005 per share.
C Total returns for periods of less than one year are not annualized.
D Total returns would have been lower if certain expenses had not been reduced during the applicable periods shown.
E Total returns do not include the effect of the sales charges.
F Fees and expenses of any underlying Fidelity Central Funds are not included in the Fund's expense ratio. The Fund indirectly bears its proportionate share of the expenses of any underlying Fidelity Central Funds.
G Expense ratios reflect operating expenses of the class. Expenses before reductions do not reflect amounts reimbursed by the investment adviser or reductions from brokerage service arrangements or reductions from other expense offset arrangements and do not represent the amount paid by the class during periods when reimbursements or reductions occur. Expenses net of fee waivers reflect expenses after reimbursement by the investment adviser but prior to reductions from brokerage service arrangements or other expense offset arrangements. Expenses net of all reductions represent the net expenses paid by the class.
H Annualized
I Amount does not include the portfolio activity of any underlying Fidelity Central Funds.
See accompanying notes which are an integral part of the financial statements.
Financial Highlights — Fidelity Advisor High Income Fund Class M
| Six months ended (Unaudited) April 30, | Years ended October 31, | |||||
| 2017 | 2016 | 2015 | 2014 | 2013 | 2012 | |
| Selected Per–Share Data | ||||||
| Net asset value, beginning of period | $7.71 | $7.59 | $8.31 | $8.76 | $8.72 | $8.37 |
| Income from Investment Operations | ||||||
| Net investment income (loss)A | .199 | .418 | .428 | .429 | .469 | .536 |
| Net realized and unrealized gain (loss) | .177 | .089 | (.524) | (.067) | .119 | .411 |
| Total from investment operations | .376 | .507 | (.096) | .362 | .588 | .947 |
| Distributions from net investment income | (.186) | (.389) | (.421) | (.427) | (.455) | (.548) |
| Distributions from net realized gain | – | – | (.204) | (.386) | (.094) | (.050) |
| Total distributions | (.186) | (.389) | (.625) | (.813) | (.549) | (.598) |
| Redemption fees added to paid in capitalA | –B | .002 | .001 | .001 | .001 | .001 |
| Net asset value, end of period | $7.90 | $7.71 | $7.59 | $8.31 | $8.76 | $8.72 |
| Total ReturnC,D,E | 4.94% | 7.06% | (1.16)% | 4.38% | 6.97% | 11.83% |
| Ratios to Average Net AssetsF,G | ||||||
| Expenses before reductions | 1.07%H | 1.06% | 1.05% | 1.05% | 1.05% | 1.06% |
| Expenses net of fee waivers, if any | 1.07%H | 1.06% | 1.05% | 1.05% | 1.05% | 1.06% |
| Expenses net of all reductions | 1.07%H | 1.06% | 1.05% | 1.05% | 1.05% | 1.06% |
| Net investment income (loss) | 5.17%H | 5.65% | 5.43% | 5.07% | 5.38% | 6.32% |
| Supplemental Data | ||||||
| Net assets, end of period (000 omitted) | $63,829 | $70,205 | $79,379 | $86,166 | $90,901 | $105,518 |
| Portfolio turnover rateI | 64%H | 61% | 60% | 79% | 76% | 48% |
A Calculated based on average shares outstanding during the period.
B Amount represents less than $.0005 per share.
C Total returns for periods of less than one year are not annualized.
D Total returns would have been lower if certain expenses had not been reduced during the applicable periods shown.
E Total returns do not include the effect of the sales charges.
F Fees and expenses of any underlying Fidelity Central Funds are not included in the Fund's expense ratio. The Fund indirectly bears its proportionate share of the expenses of any underlying Fidelity Central Funds.
G Expense ratios reflect operating expenses of the class. Expenses before reductions do not reflect amounts reimbursed by the investment adviser or reductions from brokerage service arrangements or reductions from other expense offset arrangements and do not represent the amount paid by the class during periods when reimbursements or reductions occur. Expenses net of fee waivers reflect expenses after reimbursement by the investment adviser but prior to reductions from brokerage service arrangements or other expense offset arrangements. Expenses net of all reductions represent the net expenses paid by the class.
H Annualized
I Amount does not include the portfolio activity of any underlying Fidelity Central Funds.
See accompanying notes which are an integral part of the financial statements.
Financial Highlights — Fidelity Advisor High Income Fund Class C
| Six months ended (Unaudited) April 30, | Years ended October 31, | |||||
| 2017 | 2016 | 2015 | 2014 | 2013 | 2012 | |
| Selected Per–Share Data | ||||||
| Net asset value, beginning of period | $7.70 | $7.59 | $8.30 | $8.75 | $8.71 | $8.36 |
| Income from Investment Operations | ||||||
| Net investment income (loss)A | .171 | .363 | .370 | .365 | .405 | .474 |
| Net realized and unrealized gain (loss) | .187 | .079 | (.515) | (.066) | .119 | .412 |
| Total from investment operations | .358 | .442 | (.145) | .299 | .524 | .886 |
| Distributions from net investment income | (.158) | (.334) | (.362) | (.364) | (.391) | (.487) |
| Distributions from net realized gain | – | – | (.204) | (.386) | (.094) | (.050) |
| Total distributions | (.158) | (.334) | (.566) | (.750) | (.485) | (.537) |
| Redemption fees added to paid in capitalA | –B | .002 | .001 | .001 | .001 | .001 |
| Net asset value, end of period | $7.90 | $7.70 | $7.59 | $8.30 | $8.75 | $8.71 |
| Total ReturnC,D,E | 4.69% | 6.14% | (1.78)% | 3.60% | 6.20% | 11.03% |
| Ratios to Average Net AssetsF,G | ||||||
| Expenses before reductions | 1.81%H | 1.80% | 1.80% | 1.80% | 1.79% | 1.79% |
| Expenses net of fee waivers, if any | 1.81%H | 1.80% | 1.80% | 1.80% | 1.79% | 1.79% |
| Expenses net of all reductions | 1.81%H | 1.80% | 1.80% | 1.80% | 1.79% | 1.79% |
| Net investment income (loss) | 4.42%H | 4.91% | 4.68% | 4.32% | 4.64% | 5.60% |
| Supplemental Data | ||||||
| Net assets, end of period (000 omitted) | $97,387 | $97,833 | $94,752 | $114,455 | $126,952 | $149,591 |
| Portfolio turnover rateI | 64%H | 61% | 60% | 79% | 76% | 48% |
A Calculated based on average shares outstanding during the period.
B Amount represents less than $.0005 per share.
C Total returns for periods of less than one year are not annualized.
D Total returns would have been lower if certain expenses had not been reduced during the applicable periods shown.
E Total returns do not include the effect of the contingent deferred sales charge.
F Fees and expenses of any underlying Fidelity Central Funds are not included in the Fund's expense ratio. The Fund indirectly bears its proportionate share of the expenses of any underlying Fidelity Central Funds.
G Expense ratios reflect operating expenses of the class. Expenses before reductions do not reflect amounts reimbursed by the investment adviser or reductions from brokerage service arrangements or reductions from other expense offset arrangements and do not represent the amount paid by the class during periods when reimbursements or reductions occur. Expenses net of fee waivers reflect expenses after reimbursement by the investment adviser but prior to reductions from brokerage service arrangements or other expense offset arrangements. Expenses net of all reductions represent the net expenses paid by the class.
H Annualized
I Amount does not include the portfolio activity of any underlying Fidelity Central Funds.
See accompanying notes which are an integral part of the financial statements.
Financial Highlights — Fidelity Advisor High Income Fund Class I
| Six months ended (Unaudited) April 30, | Years ended October 31, | |||||
| 2017 | 2016 | 2015 | 2014 | 2013 | 2012 | |
| Selected Per–Share Data | ||||||
| Net asset value, beginning of period | $7.74 | $7.62 | $8.34 | $8.79 | $8.75 | $8.40 |
| Income from Investment Operations | ||||||
| Net investment income (loss)A | .210 | .438 | .445 | .447 | .489 | .556 |
| Net realized and unrealized gain (loss) | .187 | .089 | (.523) | (.068) | .116 | .409 |
| Total from investment operations | .397 | .527 | (.078) | .379 | .605 | .965 |
| Distributions from net investment income | (.197) | (.409) | (.439) | (.444) | (.472) | (.566) |
| Distributions from net realized gain | – | – | (.204) | (.386) | (.094) | (.050) |
| Total distributions | (.197) | (.409) | (.643) | (.830) | (.566) | (.616) |
| Redemption fees added to paid in capitalA | –B | .002 | .001 | .001 | .001 | .001 |
| Net asset value, end of period | $7.94 | $7.74 | $7.62 | $8.34 | $8.79 | $8.75 |
| Total ReturnC,D | 5.19% | 7.31% | (.94)% | 4.57% | 7.16% | 12.02% |
| Ratios to Average Net AssetsE,F | ||||||
| Expenses before reductions | .81%G | .82% | .87% | .87% | .87% | .88% |
| Expenses net of fee waivers, if any | .81%G | .82% | .85% | .85% | .85% | .85% |
| Expenses net of all reductions | .81%G | .82% | .85% | .85% | .85% | .85% |
| Net investment income (loss) | 5.43%G | 5.89% | 5.63% | 5.27% | 5.58% | 6.54% |
| Supplemental Data | ||||||
| Net assets, end of period (000 omitted) | $417,121 | $432,910 | $361,760 | $337,377 | $358,238 | $423,792 |
| Portfolio turnover rateH | 64%G | 61% | 60% | 79% | 76% | 48% |
A Calculated based on average shares outstanding during the period.
B Amount represents less than $.0005 per share.
C Total returns for periods of less than one year are not annualized.
D Total returns would have been lower if certain expenses had not been reduced during the applicable periods shown.
E Fees and expenses of any underlying Fidelity Central Funds are not included in the Fund's expense ratio. The Fund indirectly bears its proportionate share of the expenses of any underlying Fidelity Central Funds.
F Expense ratios reflect operating expenses of the class. Expenses before reductions do not reflect amounts reimbursed by the investment adviser or reductions from brokerage service arrangements or reductions from other expense offset arrangements and do not represent the amount paid by the class during periods when reimbursements or reductions occur. Expenses net of fee waivers reflect expenses after reimbursement by the investment adviser but prior to reductions from brokerage service arrangements or other expense offset arrangements. Expenses net of all reductions represent the net expenses paid by the class.
G Annualized
H Amount does not include the portfolio activity of any underlying Fidelity Central Funds.
See accompanying notes which are an integral part of the financial statements.
Notes to Financial Statements (Unaudited)
For the period ended April 30, 2017
1. Organization.
Fidelity Advisor High Income Fund (the Fund) is a fund of Fidelity Advisor Series I (the Trust) and is authorized to issue an unlimited number of shares. The Trust is registered under the Investment Company Act of 1940, as amended (the 1940 Act), as an open-end management investment company organized as a Massachusetts business trust. The Fund offers Class A, Class M (formerly Class T), Class C and Class I shares, each of which has equal rights as to assets and voting privileges. Each class has exclusive voting rights with respect to matters that affect that class.
After the close of business on June 24, 2016, all outstanding Class B shares were converted to Class A shares. All prior fiscal period dollar and share amounts for Class B presented in the Notes to Financial Statements are for the period November 1, 2015 through June 24, 2016.
2. Investments in Fidelity Central Funds.
The Fund invests in Fidelity Central Funds, which are open-end investment companies generally available only to other investment companies and accounts managed by the investment adviser and its affiliates. The Fund's Schedule of Investments lists each of the Fidelity Central Funds held as of period end, if any, as an investment of the Fund, but does not include the underlying holdings of each Fidelity Central Fund. As an Investing Fund, the Fund indirectly bears its proportionate share of the expenses of the underlying Fidelity Central Funds.
The Money Market Central Funds seek preservation of capital and current income and are managed by Fidelity Investments Money Management, Inc. (FIMM), an affiliate of the investment adviser. Annualized expenses of the Money Market Central Funds as of their most recent shareholder report date are less than .005%.
A complete unaudited list of holdings for each Fidelity Central Fund is available upon request or at the Securities and Exchange Commission (the SEC) website at www.sec.gov. In addition, the financial statements of the Fidelity Central Funds are available on the SEC website or upon request.
3. Significant Accounting Policies.
The Fund is an investment company and applies the accounting and reporting guidance of the Financial Accounting Standards Board (FASB) Accounting Standards Codification Topic 946 Financial Services – Investments Companies. The financial statements have been prepared in conformity with accounting principles generally accepted in the United States of America (GAAP), which require management to make certain estimates and assumptions at the date of the financial statements. Actual results could differ from those estimates. Subsequent events, if any, through the date that the financial statements were issued have been evaluated in the preparation of the financial statements. The following summarizes the significant accounting policies of the Fund:
Investment Valuation. Investments are valued as of 4:00 p.m. Eastern time on the last calendar day of the period. The Board of Trustees (the Board) has delegated the day to day responsibility for the valuation of the Fund's investments to the Fair Value Committee (the Committee) established by the Fund's investment adviser. In accordance with valuation policies and procedures approved by the Board, the Fund attempts to obtain prices from one or more third party pricing vendors or brokers to value its investments. When current market prices, quotations or currency exchange rates are not readily available or reliable, investments will be fair valued in good faith by the Committee, in accordance with procedures adopted by the Board. Factors used in determining fair value vary by investment type and may include market or investment specific events, changes in interest rates and credit quality. The frequency with which these procedures are used cannot be predicted and they may be utilized to a significant extent. The Committee oversees the Fund's valuation policies and procedures and reports to the Board on the Committee's activities and fair value determinations. The Board monitors the appropriateness of the procedures used in valuing the Fund's investments and ratifies the fair value determinations of the Committee.
The Fund categorizes the inputs to valuation techniques used to value its investments into a disclosure hierarchy consisting of three levels as shown below:
- Level 1 – quoted prices in active markets for identical investments
- Level 2 – other significant observable inputs (including quoted prices for similar investments, interest rates, prepayment speeds, etc.)
- Level 3 – unobservable inputs (including the Fund's own assumptions based on the best information available)
Valuation techniques used to value the Fund's investments by major category are as follows:
Debt securities, including restricted securities, are valued based on evaluated prices received from third party pricing vendors or from brokers who make markets in such securities. Corporate bonds, bank loan obligations and preferred securities are valued by pricing vendors who utilize matrix pricing which considers yield or price of bonds of comparable quality, coupon, maturity and type or by broker-supplied prices. When independent prices are unavailable or unreliable, debt securities may be valued utilizing pricing methodologies which consider similar factors that would be used by third party pricing vendors. Debt securities are generally categorized as Level 2 in the hierarchy but may be Level 3 depending on the circumstances. The Fund invests a significant portion of its assets in below investment grade securities. The value of these securities can be more volatile due to changes in the credit quality of the issuer and is sensitive to changes in economic, market and regulatory conditions.
Equity securities, including restricted securities, for which market quotations are readily available, are valued at the last reported sale price or official closing price as reported by a third party pricing vendor on the primary market or exchange on which they are traded and are categorized as Level 1 in the hierarchy. In the event there were no sales during the day or closing prices are not available, securities are valued at the last quoted bid price or may be valued using the last available price and are generally categorized as Level 2 in the hierarchy. For equity securities, including restricted securities, where observable inputs are limited, assumptions about market activity and risk are used and these securities may be categorized as Level 3 in the hierarchy.
Investments in open-end mutual funds, including the Fidelity Central Funds, are valued at their closing net asset value (NAV) each business day and are categorized as Level 1 in the hierarchy.
Changes in valuation techniques may result in transfers in or out of an assigned level within the disclosure hierarchy. The aggregate value of investments by input level as of April 30, 2017 is included at the end of the Fund's Schedule of Investments.
Investment Transactions and Income. For financial reporting purposes, the Fund's investment holdings and NAV include trades executed through the end of the last business day of the period. The NAV per share for processing shareholder transactions is calculated as of the close of business of the New York Stock Exchange (NYSE), normally 4:00 p.m. Eastern time and includes trades executed through the end of the prior business day. Gains and losses on securities sold are determined on the basis of identified cost and may include proceeds received from litigation. Dividend income is recorded on the ex-dividend date, except for certain dividends from foreign securities where the ex-dividend date may have passed, which are recorded as soon as the Fund is informed of the ex-dividend date. Non-cash dividends included in dividend income, if any, are recorded at the fair market value of the securities received. Income and capital gain distributions from Fidelity Central Funds, if any, are recorded on the ex-dividend date. Interest income is accrued as earned and includes coupon interest and amortization of premium and accretion of discount on debt securities as applicable. Debt obligations may be placed on non-accrual status and related interest income may be reduced by ceasing current accruals and writing off interest receivables when the collection of all or a portion of interest has become doubtful based on consistently applied procedures. A debt obligation is removed from non-accrual status when the issuer resumes interest payments or when collectability of interest is reasonably assured.
Class Allocations and Expenses. Investment income, realized and unrealized capital gains and losses, common expenses of the Fund, and certain fund-level expense reductions, if any, are allocated daily on a pro-rata basis to each class based on the relative net assets of each class to the total net assets of the Fund. Each class differs with respect to transfer agent and distribution and service plan fees incurred. Certain expense reductions may also differ by class. For the reporting period, the allocated portion of income and expenses to each class as a percent of its average net assets may vary due to the timing of recording these transactions in relation to fluctuating net assets of the classes. Expenses directly attributable to a fund are charged to that fund. Expenses attributable to more than one fund are allocated among the respective funds on the basis of relative net assets or other appropriate methods. Expense estimates are accrued in the period to which they relate and adjustments are made when actual amounts are known.
Income Tax Information and Distributions to Shareholders. Each year, the Fund intends to qualify as a regulated investment company under Subchapter M of the Internal Revenue Code, including distributing substantially all of its taxable income and realized gains. As a result, no provision for U.S. Federal income taxes is required. The Fund files a U.S. federal tax return, in addition to state and local tax returns as required. The Fund's federal income tax returns are subject to examination by the Internal Revenue Service (IRS) for a period of three fiscal years after they are filed. State and local tax returns may be subject to examination for an additional fiscal year depending on the jurisdiction.
Dividends are declared and recorded daily and paid monthly from net investment income. Distributions from realized gains, if any, are declared and recorded on the ex-dividend date. Income dividends and capital gain distributions are declared separately for each class. Income and capital gain distributions are determined in accordance with income tax regulations, which may differ from GAAP.
Capital accounts within the financial statements are adjusted for permanent book-tax differences. These adjustments have no impact on net assets or the results of operations. Capital accounts are not adjusted for temporary book-tax differences which will reverse in a subsequent period.
Book-tax differences are primarily due to market discount, capital loss carryforwards and losses deferred due to wash sales.
The federal tax cost of investment securities and unrealized appreciation (depreciation) as of period end were as follows:
| Gross unrealized appreciation | $34,419,258 |
| Gross unrealized depreciation | (5,147,194) |
| Net unrealized appreciation (depreciation) on securities | $29,272,064 |
| Tax cost | $744,266,408 |
Capital loss carryforwards are only available to offset future capital gains of the Fund to the extent provided by regulations and may be limited. Under the Regulated Investment Company Modernization Act of 2010 (the Act), the Fund is permitted to carry forward capital losses incurred in taxable years beginning after December 22, 2010 for an unlimited period and such capital losses are required to be used prior to any losses that expire. The capital loss carryforward information presented below, including any applicable limitation, is estimated as of prior fiscal period end and is subject to adjustment.
| No expiration | |
| Short-term | $(21,340,864) |
| Long-term | (26,644,062) |
| Total capital loss carryforward | $(47,984,926) |
Short-Term Trading (Redemption) Fees. Shares held by investors in the Fund less than 90 days may have been subject to a redemption fee equal to 1.00% of the NAV of shares redeemed. All redemption fees, which reduce the proceeds of the shareholder redemption, are retained by the Fund and accounted for as an addition to paid in capital.
Delayed Delivery Transactions and When-Issued Securities. During the period, the transacted in securities on a delayed delivery or when-issued basis. Payment and delivery may take place after the customary settlement period for that security. The price of the underlying securities and the date when the securities will be delivered and paid for are fixed at the time the transaction is negotiated. The securities purchased on a delayed delivery or when-issued basis are identified as such in the Fund's Schedule of Investments. The Fund may receive compensation for interest forgone in the purchase of a delayed delivery or when-issued security. With respect to purchase commitments, the Fund identifies securities as segregated in its records with a value at least equal to the amount of the commitment. Losses may arise due to changes in the value of the underlying securities or if the counterparty does not perform under the contract's terms, or if the issuer does not issue the securities due to political, economic, or other factors.
Restricted Securities. The Fund may invest in securities that are subject to legal or contractual restrictions on resale. These securities generally may be resold in transactions exempt from registration or to the public if the securities are registered. Disposal of these securities may involve time-consuming negotiations and expense, and prompt sale at an acceptable price may be difficult. Information regarding restricted securities is included at the end of the Fund's Schedule of Investments.
Loans and Other Direct Debt Instruments. The Fund invests in direct debt instruments which are interests in amounts owed to lenders by corporate or other borrowers. These instruments may be in the form of loans, trade claims or other receivables and may include standby financing commitments such as revolving credit facilities that obligate the Fund to supply additional cash to the borrower on demand. Loans may be acquired through assignment or participation. The Fund did not have any unfunded loan commitments, which are contractual obligations for future funding, at period end.
New Accounting Pronouncement. In March 2017, the Financial Accounting Standards Board (FASB) issued an Accounting Standards Update (ASU), ASU 2017-08, which amends the amortization period for certain callable debt securities that are held at a premium. The amendment requires the premium to be amortized to the earliest call date. The amendments do not require an accounting change for securities held at a discount. The ASU is effective for annual periods beginning after December 15, 2019. Management is currently evaluating the potential impact of these changes to the financial statements.
4. Purchases and Sales of Investments.
Purchases and sales of securities, other than short-term securities, aggregated $243,316,488 and $313,129,397, respectively.
5. Fees and Other Transactions with Affiliates.
Management Fee. Fidelity Management & Research Company (the investment adviser) and its affiliates provide the Fund with investment management related services for which the Fund pays a monthly management fee. The management fee is the sum of an individual fund fee rate that is based on an annual rate of .45% of the Fund's average net assets and an annualized group fee rate that averaged .11% during the period. The group fee rate is based upon the average net assets of all the mutual funds advised by the investment adviser, including any mutual funds previously advised by the investment adviser that are currently advised by Fidelity SelectCo, LLC, an affiliate of the investment adviser. The group fee rate decreases as assets under management increase and increases as assets under management decrease. For the reporting period, the total annualized management fee rate was .56% of the Fund's average net assets.
Distribution and Service Plan Fees. In accordance with Rule 12b-1 of the 1940 Act, the Fund has adopted separate Distribution and Service Plans for each class of shares. Certain classes pay Fidelity Distributors Corporation (FDC), an affiliate of the investment adviser, separate Distribution and Service Fees, each of which is based on an annual percentage of each class' average net assets. In addition, FDC may pay financial intermediaries for selling shares of the Fund and providing shareholder support services. For the period, the Distribution and Service Fee rates, total fees and amounts retained by FDC were as follows:
| Distribution Fee | Service Fee | Total Fees | Retained by FDC |
|
| Class A | -% | .25% | $266,877 | $8,516 |
| Class M | -% | .25% | 80,466 | 924 |
| Class C | .75% | .25% | 486,576 | 44,928 |
| $833,919 | $54,368 |
Sales Load. FDC may receive a front-end sales charge of up to 4.00% for selling Class A shares and Class M shares, some of which is paid to financial intermediaries for selling shares of the Fund. Depending on the holding period, FDC may receive contingent deferred sales charges levied on Class A, Class M and Class C redemptions. The deferred sales charges are 1.00% for Class C shares, 1.00% for certain purchases of Class A shares and .25% for certain purchases of Class M shares.
For the period, sales charge amounts retained by FDC were as follows:
| Retained by FDC |
|
| Class A | $12,623 |
| Class M | 2,175 |
| Class C(a) | 2,498 |
| $17,296 |
(a) When Class C shares are initially sold, FDC pays commissions from its own resources to financial intermediaries through which the sales are made.
Transfer Agent Fees. Fidelity Investments Institutional Operations Company, Inc., (FIIOC), an affiliate of the investment adviser, is the transfer, dividend disbursing and shareholder servicing agent for each class of the Fund. FIIOC receives account fees and asset-based fees that vary according to the account size and type of account of the shareholders of the respective classes of the Fund. FIIOC pays for typesetting, printing and mailing of shareholder reports, except proxy statements.
For the period, transfer agent fees for each class were as follows:
| Amount | % of Class-Level Average Net Assets(a) |
|
| Class A | $167,624 | .16 |
| Class M | 60,300 | .19 |
| Class C | 84,323 | .17 |
| Class I | 373,609 | .18 |
| $685,856 |
(a) Annualized
Accounting Fees. Fidelity Service Company, Inc. (FSC), an affiliate of the investment adviser, maintains the Fund's accounting records. The fee is based on the level of average net assets for each month.
Interfund Trades. The Fund may purchase from or sell securities to other Fidelity Funds under procedures adopted by the Board. The procedures have been designed to ensure these interfund trades are executed in accordance with Rule 17a-7 of the 1940 Act. Interfund trades are included within the respective purchases and sales amounts shown in the Purchases and Sales of Investments note.
6. Committed Line of Credit.
The Fund participates with other funds managed by the investment adviser or an affiliate in a $4.25 billion credit facility (the "line of credit") to be utilized for temporary or emergency purposes to fund shareholder redemptions or for other short-term liquidity purposes. The Fund has agreed to pay commitment fees on its pro-rata portion of the line of credit, which amounted to $1,372 and is reflected in Miscellaneous expenses on the Statement of Operations. During the period, the Fund did not borrow on this line of credit.
7. Expense Reductions.
Through arrangements with the Fund's custodian, credits realized as a result of certain uninvested cash balances were used to reduce the Fund's expenses. During the period, these credits reduced the Fund's custody expenses by $1,997.
In addition, during the period the investment adviser reimbursed and/or waived a portion of fund-level operating expenses in the amount of $2,406.
8. Distributions to Shareholders.
Distributions to shareholders of each class were as follows:
| Six months ended April 30, 2017 | Year ended October 31, 2016 | |
| From net investment income | ||
| Class A | $5,159,799 | $11,526,565 |
| Class M | 1,544,664 | 3,698,146 |
| Class B | – | 142,572 |
| Class C | 1,973,862 | 4,154,279 |
| Class I | 10,499,809 | 22,262,920 |
| Total | $19,178,134 | $41,784,482 |
9. Share Transactions.
Share transactions for each class were as follows and may contain automatic conversions between classes or exchanges between affiliated funds:
| Shares | Shares | Dollars | Dollars | |
| Six months ended April 30, 2017 | Year ended October 31, 2016 | Six months ended April 30, 2017 | Year ended October 31, 2016 | |
| Class A | ||||
| Shares sold | 2,645,241 | 7,433,911 | $20,609,955 | $54,677,237 |
| Reinvestment of distributions | 584,212 | 1,372,430 | 4,566,665 | 10,168,527 |
| Shares redeemed | (7,617,844) | (9,769,225) | (59,738,955) | (71,672,557) |
| Net increase (decrease) | (4,388,391) | (962,884) | $(34,562,335) | $(6,826,793) |
| Class M | ||||
| Shares sold | 582,960 | 1,617,554 | $4,522,439 | $11,757,682 |
| Reinvestment of distributions | 172,098 | 414,444 | 1,343,262 | 3,061,824 |
| Shares redeemed | (1,786,074) | (3,378,059) | (13,780,224) | (24,216,552) |
| Net increase (decrease) | (1,031,016) | (1,346,061) | $(7,914,523) | $(9,397,046) |
| Class B | ||||
| Shares sold | – | 43,498 | $– | $304,960 |
| Reinvestment of distributions | – | 16,125 | – | 116,505 |
| Shares redeemed | – | (864,824) | – | (6,323,785) |
| Net increase (decrease) | – | (805,201) | $– | $(5,902,320) |
| Class C | ||||
| Shares sold | 922,071 | 2,763,335 | $7,158,355 | $20,357,542 |
| Reinvestment of distributions | 226,305 | 486,464 | 1,764,879 | 3,595,140 |
| Shares redeemed | (1,517,834) | (3,037,093) | (11,780,587) | (22,336,625) |
| Net increase (decrease) | (369,458) | 212,706 | $(2,857,353) | $1,616,057 |
| Class I | ||||
| Shares sold | 11,379,244 | 27,101,846 | $89,236,761 | $200,470,955 |
| Reinvestment of distributions | 1,296,333 | 2,716,962 | 10,152,719 | 20,215,304 |
| Shares redeemed | (16,043,744) | (21,336,862) | (125,342,277) | (160,729,315) |
| Net increase (decrease) | (3,368,167) | 8,481,946 | $(25,952,797) | $59,956,944 |
10. Other.
The Fund's organizational documents provide former and current trustees and officers with a limited indemnification against liabilities arising in connection with the performance of their duties to the Fund. In the normal course of business, the Fund may also enter into contracts that provide general indemnifications. The Fund's maximum exposure under these arrangements is unknown as this would be dependent on future claims that may be made against the Fund. The risk of material loss from such claims is considered remote.
Shareholder Expense Example
As a shareholder of the Fund, you incur two types of costs: (1) transaction costs, including sales charges (loads) on purchase payments or redemption proceeds, redemption fees and (2) ongoing costs, including management fees, distribution and/or service (12b-1) fees and other Fund expenses. This Example is intended to help you understand your ongoing costs (in dollars) of investing in the Fund and to compare these costs with the ongoing costs of investing in other mutual funds.
The Example is based on an investment of $1,000 invested at the beginning of the period and held for the entire period (November 1, 2016 to April 30, 2017).
Actual Expenses
The first line of the accompanying table for each class of the Fund provides information about actual account values and actual expenses. You may use the information in this line, together with the amount you invested, to estimate the expenses that you paid over the period. Simply divide your account value by $1,000.00 (for example, an $8,600 account value divided by $1,000.00 = 8.6), then multiply the result by the number in the first line for a class of the Fund under the heading entitled "Expenses Paid During Period" to estimate the expenses you paid on your account during this period. In addition, the Fund, as a shareholder in the underlying Fidelity Central Funds, will indirectly bear its pro-rata share of the fees and expenses incurred by the underlying Fidelity Central Funds. These fees and expenses are not included in the Fund's annualized expense ratio used to calculate the expense estimate in the table below.
Hypothetical Example for Comparison Purposes
The second line of the accompanying table for each class of the Fund provides information about hypothetical account values and hypothetical expenses based on a Class' actual expense ratio and an assumed rate of return of 5% per year before expenses, which is not the Class' actual return. The hypothetical account values and expenses may not be used to estimate the actual ending account balance or expenses you paid for the period. You may use this information to compare the ongoing costs of investing in the Fund and other funds. To do so, compare this 5% hypothetical example with the 5% hypothetical examples that appear in the shareholder reports of the other funds. In addition, the Fund, as a shareholder in the underlying Fidelity Central Funds, will indirectly bear its pro-rata share of the fees and expenses incurred by the underlying Fidelity Central Funds. These fees and expenses are not included in the Fund's annualized expense ratio used to calculate the expense estimate in the table below.
Please note that the expenses shown in the table are meant to highlight your ongoing costs only and do not reflect any transaction costs. Therefore, the second line of the table is useful in comparing ongoing costs only, and will not help you determine the relative total costs of owning different funds. In addition, if these transactional costs were included, your costs would have been higher.
| Annualized Expense Ratio-A | Beginning Account Value November 1, 2016 | Ending Account Value April 30, 2017 | Expenses Paid During Period-B November 1, 2016 to April 30, 2017 |
|
| Class A | 1.04% | |||
| Actual | $1,000.00 | $1,049.50 | $5.28 | |
| Hypothetical-C | $1,000.00 | $1,019.64 | $5.21 | |
| Class M | 1.07% | |||
| Actual | $1,000.00 | $1,049.40 | $5.44 | |
| Hypothetical-C | $1,000.00 | $1,019.49 | $5.36 | |
| Class C | 1.81% | |||
| Actual | $1,000.00 | $1,046.90 | $9.19 | |
| Hypothetical-C | $1,000.00 | $1,015.82 | $9.05 | |
| Class I | .81% | |||
| Actual | $1,000.00 | $1,051.90 | $4.12 | |
| Hypothetical-C | $1,000.00 | $1,020.78 | $4.06 |
A Annualized expense ratio reflects expenses net of applicable fee waivers.
B Expenses are equal to each Class' annualized expense ratio, multiplied by the average account value over the period, multiplied by 181/365 (to reflect the one-half year period).
C 5% return per year before expenses
![]()
AHI-SANN-0617
1.741814.117
|
Fidelity Advisor® High Income Advantage Fund Semi-Annual Report April 30, 2017 |
|
|
Contents
To view a fund's proxy voting guidelines and proxy voting record for the 12-month period ended June 30, visit http://www.fidelity.com/proxyvotingresults or visit the Securities and Exchange Commission's (SEC) web site at http://www.sec.gov.
You may also call 1-877-208-0098 to request a free copy of the proxy voting guidelines.
Standard & Poor's, S&P and S&P 500 are registered service marks of The McGraw-Hill Companies, Inc. and have been licensed for use by Fidelity Distributors Corporation.
Other third-party marks appearing herein are the property of their respective owners.
All other marks appearing herein are registered or unregistered trademarks or service marks of FMR LLC or an affiliated company. © 2017 FMR LLC. All rights reserved.
This report and the financial statements contained herein are submitted for the general information of the shareholders of the Fund. This report is not authorized for distribution to prospective investors in the Fund unless preceded or accompanied by an effective prospectus.
A fund files its complete schedule of portfolio holdings with the SEC for the first and third quarters of each fiscal year on Form N-Q. Forms N-Q are available on the SEC’s web site at http://www.sec.gov. A fund's Forms N-Q may be reviewed and copied at the SEC’s Public Reference Room in Washington, DC. Information regarding the operation of the SEC's Public Reference Room may be obtained by calling 1-800-SEC-0330.
For a complete list of a fund's portfolio holdings, view the most recent holdings listing, semiannual report, or annual report on Fidelity's web site at http://www.fidelity.com, http://www.institutional.fidelity.com, or http://www.401k.com, as applicable.
NOT FDIC INSURED •MAY LOSE VALUE •NO BANK GUARANTEE
Neither the Fund nor Fidelity Distributors Corporation is a bank.
Investment Summary (Unaudited)
Top Five Holdings as of April 30, 2017
| (by issuer, excluding cash equivalents) | % of fund's net assets | % of fund's net assets 6 months ago |
| APX Group, Inc. | 2.6 | 2.3 |
| Energy Future Intermediate Holding Co. LLC/Energy Future Intermediate Holding Finance, Inc. | 2.3 | 2.3 |
| Ally Financial, Inc. | 2.2 | 3.1 |
| Valeant Pharmaceuticals International, Inc. | 2.1 | 2.0 |
| Tenet Healthcare Corp. | 2.1 | 1.0 |
| 11.3 |
Top Five Market Sectors as of April 30, 2017
| % of fund's net assets | % of fund's net assets 6 months ago | |
| Energy | 11.8 | 13.1 |
| Telecommunications | 10.1 | 10.4 |
| Technology | 8.9 | 8.0 |
| Healthcare | 8.4 | 9.0 |
| Cable/Satellite TV | 7.3 | 6.4 |
Quality Diversification (% of fund's net assets)
| As of April 30, 2017 | ||
| BB | 18.7% | |
| B | 29.0% | |
| CCC,CC,C | 24.2% | |
| Not Rated | 3.2% | |
| Equities | 20.5% | |
| Short-Term Investments and Net Other Assets | 4.4% | |
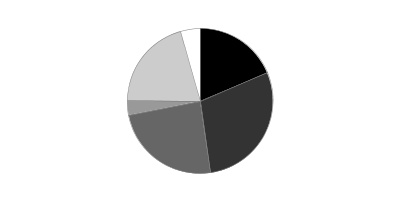
| As of October 31, 2016 | ||
| AAA,AA,A | 0.1% | |
| BBB | 0.6% | |
| BB | 22.3% | |
| B | 30.2% | |
| CCC,CC,C | 20.8% | |
| Not Rated | 3.1% | |
| Equities | 19.9% | |
| Short-Term Investments and Net Other Assets | 3.0% | |
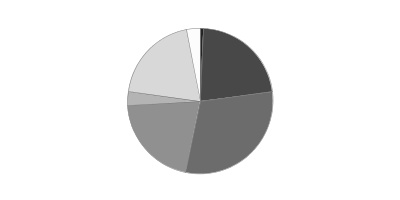
We have used ratings from Moody's Investors Service, Inc. Where Moody's® ratings are not available, we have used S&P® ratings. All ratings are as of the date indicated and do not reflect subsequent changes.
Asset Allocation (% of fund's net assets)
| As of April 30, 2017* | ||
| Nonconvertible Bonds | 69.4% | |
| Convertible Bonds, Preferred Stocks | 1.0% | |
| Common Stocks | 19.5% | |
| Bank Loan Obligations | 2.9% | |
| Other Investments | 2.8% | |
| Short-Term Investments and Net Other Assets (Liabilities) | 4.4% | |

* Foreign investments - 19.9%
| As of October 31, 2016* | ||
| Nonconvertible Bonds | 69.8% | |
| Convertible Bonds, Preferred Stocks | 1.4% | |
| Common Stocks | 18.5% | |
| Bank Loan Obligations | 4.2% | |
| Other Investments | 3.1% | |
| Short-Term Investments and Net Other Assets (Liabilities) | 3.0% | |

* Foreign investments - 18.4%
Investments April 30, 2017 (Unaudited)
Showing Percentage of Net Assets
| Corporate Bonds - 69.4% | |||
| Principal Amount (000s)(a) | Value (000s) | ||
| Convertible Bonds - 0.0% | |||
| Telecommunications - 0.0% | |||
| Clearwire Communications LLC/Clearwire Finance, Inc. 8.25% 12/1/40 (b) | $180 | $185 | |
| Nonconvertible Bonds - 69.4% | |||
| Aerospace - 0.1% | |||
| TransDigm, Inc. 6.375% 6/15/26 | 2,030 | 2,045 | |
| Air Transportation - 0.1% | |||
| Continental Airlines, Inc.: | |||
| pass-thru trust certificates 6.903% 4/19/22 | 422 | 439 | |
| 6.125% 4/29/18 | 670 | 694 | |
| 9.25% 5/10/17 | 497 | 497 | |
| 1,630 | |||
| Automotive & Auto Parts - 0.2% | |||
| American Tire Distributors, Inc. 10.25% 3/1/22 (b) | 4,450 | 4,567 | |
| Banks & Thrifts - 3.0% | |||
| Ally Financial, Inc.: | |||
| 5.75% 11/20/25 | 2,310 | 2,365 | |
| 8% 12/31/18 | 15,604 | 16,891 | |
| 8% 11/1/31 | 18,362 | 21,851 | |
| General Motors Acceptance Corp. 8% 11/1/31 | 3,105 | 3,695 | |
| Royal Bank of Scotland Group PLC: | |||
| 5.125% 5/28/24 | 6,775 | 6,965 | |
| 6% 12/19/23 | 3,605 | 3,889 | |
| Washington Mutual Bank 5.5% 1/15/13 (c) | 10,000 | 1 | |
| 55,657 | |||
| Building Materials - 0.6% | |||
| BMC East LLC 5.5% 10/1/24 (b) | 1,440 | 1,499 | |
| Builders FirstSource, Inc. 5.625% 9/1/24 (b) | 3,560 | 3,694 | |
| GCP Applied Technologies, Inc. 9.5% 2/1/23 (b) | 1,995 | 2,274 | |
| HD Supply, Inc. 5.25% 12/15/21 (b) | 2,040 | 2,160 | |
| HMAN Finance Sub Corp. 6.375% 7/15/22 (b) | 900 | 857 | |
| USG Corp. 8.25% 1/15/18 (d) | 1,585 | 1,662 | |
| 12,146 | |||
| Cable/Satellite TV - 6.4% | |||
| Altice SA: | |||
| 7.625% 2/15/25 (b) | 12,590 | 13,440 | |
| 7.75% 5/15/22 (b) | 10,575 | 11,237 | |
| Altice U.S. Finance SA 7.75% 7/15/25 (b) | 4,905 | 5,469 | |
| Cable One, Inc. 5.75% 6/15/22 (b) | 1,390 | 1,456 | |
| CCO Holdings LLC/CCO Holdings Capital Corp.: | |||
| 5.125% 2/15/23 | 2,550 | 2,652 | |
| 5.125% 5/1/27 (b) | 16,845 | 17,182 | |
| 5.5% 5/1/26 (b) | 2,940 | 3,085 | |
| 5.75% 1/15/24 | 5,335 | 5,615 | |
| 5.75% 2/15/26 (b) | 1,770 | 1,880 | |
| 5.875% 5/1/27 (b) | 5,245 | 5,579 | |
| Cequel Communications Escrow I LLC/Cequel Communications Escrow Capital Corp. 6.375% 9/15/20 (b) | 381 | 393 | |
| Cequel Communications Holdings I LLC/Cequel Capital Corp. 5.125% 12/15/21 (b) | 5,495 | 5,619 | |
| CSC Holdings, Inc. 5.5% 4/15/27 (b) | 9,215 | 9,526 | |
| DISH DBS Corp.: | |||
| 5% 3/15/23 | 4,695 | 4,707 | |
| 5.875% 7/15/22 | 4,240 | 4,491 | |
| Unitymedia Hessen GmbH & Co. KG/Unitymedia NRW GmbH 5.5% 1/15/23 (b) | 2,145 | 2,233 | |
| Wave Holdco LLC/Wave Holdco Corp. 8.25% 7/15/19 pay-in-kind (b)(d) | 10,920 | 10,975 | |
| WaveDivision Escrow LLC/WaveDivision Escrow Corp. 8.125% 9/1/20 (b) | 1,645 | 1,694 | |
| Ziggo Bond Finance BV: | |||
| 5.875% 1/15/25 (b) | 1,705 | 1,750 | |
| 6% 1/15/27 (b) | 3,575 | 3,647 | |
| Ziggo Secured Finance BV 5.5% 1/15/27 (b) | 7,375 | 7,560 | |
| 120,190 | |||
| Chemicals - 1.3% | |||
| Evolution Escrow Issuer LLC 7.5% 3/15/22 (b) | 7,510 | 7,848 | |
| Momentive Performance Materials, Inc. 3.88% 10/24/21 | 5,545 | 5,510 | |
| MPM Escrow LLC/MPM Finance Escrow Corp. 8.875% 10/15/20 (c) | 4,120 | 0 | |
| Platform Specialty Products Corp. 6.5% 2/1/22 (b) | 5,550 | 5,689 | |
| The Chemours Co. LLC: | |||
| 6.625% 5/15/23 | 1,495 | 1,600 | |
| 7% 5/15/25 | 975 | 1,071 | |
| Tronox Finance LLC 6.375% 8/15/20 | 3,160 | 3,211 | |
| 24,929 | |||
| Containers - 0.9% | |||
| ARD Finance SA 7.125% 9/15/23 pay-in-kind (b) | 1,690 | 1,753 | |
| Ardagh Packaging Finance PLC/Ardagh MP Holdings U.S.A., Inc.: | |||
| 6% 2/15/25 (b) | 3,430 | 3,546 | |
| 7.25% 5/15/24 (b) | 3,785 | 4,121 | |
| Consolidated Container Co. LLC/Consolidated Container Capital, Inc. 10.125% 7/15/20 (b) | 3,910 | 4,061 | |
| Reynolds Group Issuer, Inc./Reynolds Group Issuer LLC/Reynolds Group Issuer (Luxembourg) SA: | |||
| 5.75% 10/15/20 | 2,460 | 2,534 | |
| 7% 7/15/24 (b) | 1,025 | 1,103 | |
| 17,118 | |||
| Diversified Financial Services - 3.4% | |||
| Aircastle Ltd. 4.625% 12/15/18 | 1,625 | 1,684 | |
| Blueline Rental Finance Corp./Blueline Rental LLC 9.25% 3/15/24 (b) | 1,350 | 1,411 | |
| Chobani LLC/Finance Corp., Inc. 7.5% 4/15/25 (b) | 2,980 | 3,073 | |
| CIT Group, Inc. 5.375% 5/15/20 | 4,400 | 4,736 | |
| Eagle Holding Co. II LLC 7.625% 5/15/22 pay-in-kind (b)(d)(e) | 930 | 947 | |
| Grinding Media, Inc./MC Grinding Media Canada, Inc. 7.375% 12/15/23 (b) | 1,315 | 1,403 | |
| Icahn Enterprises LP/Icahn Enterprises Finance Corp.: | |||
| 5.875% 2/1/22 | 5,683 | 5,846 | |
| 6.25% 2/1/22 (b) | 1,000 | 1,040 | |
| 6.75% 2/1/24 (b) | 1,810 | 1,889 | |
| MSCI, Inc. 5.75% 8/15/25 (b) | 1,345 | 1,449 | |
| Navient Corp.: | |||
| 5.875% 10/25/24 | 3,375 | 3,282 | |
| 6.5% 6/15/22 | 1,990 | 2,057 | |
| 7.25% 9/25/23 | 1,775 | 1,855 | |
| Park Aerospace Holdings Ltd.: | |||
| 5.25% 8/15/22 (b) | 1,780 | 1,880 | |
| 5.5% 2/15/24 (b) | 1,780 | 1,882 | |
| Prime Securities Services Borrower LLC/Prime Finance, Inc. 9.25% 5/15/23 (b) | 11,755 | 12,842 | |
| Radiate Holdco LLC/Radiate Financial Service Ltd. 6.625% 2/15/25 (b) | 1,835 | 1,830 | |
| SLM Corp.: | |||
| 5.5% 1/25/23 | 5,330 | 5,273 | |
| 6.125% 3/25/24 | 4,270 | 4,227 | |
| 8% 3/25/20 | 4,700 | 5,158 | |
| 63,764 | |||
| Diversified Media - 0.8% | |||
| Clear Channel Worldwide Holdings, Inc.: | |||
| Series A, 7.625% 3/15/20 | 900 | 893 | |
| 7.625% 3/15/20 | 2,060 | 2,083 | |
| E.W. Scripps Co. 5.125% 5/15/25 (b) | 510 | 523 | |
| Liberty Media Corp.: | |||
| 8.25% 2/1/30 | 469 | 503 | |
| 8.5% 7/15/29 | 529 | 589 | |
| MDC Partners, Inc. 6.5% 5/1/24 (b) | 5,848 | 5,702 | |
| National CineMedia LLC 6% 4/15/22 | 4,035 | 4,146 | |
| Nielsen Finance LLC/Nielsen Finance Co. 5% 4/15/22 (b) | 1,220 | 1,255 | |
| 15,694 | |||
| Energy - 9.8% | |||
| Antero Midstream Partners LP/Antero Midstream Finance Corp. 5.375% 9/15/24 (b) | 820 | 838 | |
| Antero Resources Corp.: | |||
| 5.125% 12/1/22 | 1,935 | 1,964 | |
| 5.625% 6/1/23 (Reg. S) | 2,580 | 2,654 | |
| Antero Resources Finance Corp. 5.375% 11/1/21 | 4,500 | 4,646 | |
| Calfrac Holdings LP 7.5% 12/1/20 (b) | 4,460 | 4,092 | |
| Carrizo Oil & Gas, Inc. 6.25% 4/15/23 | 440 | 443 | |
| Cheniere Corpus Christi Holdings LLC 5.875% 3/31/25 (b) | 2,610 | 2,780 | |
| Chesapeake Energy Corp.: | |||
| 4.4084% 4/15/19 (d) | 2,250 | 2,239 | |
| 4.875% 4/15/22 | 5,580 | 5,120 | |
| 5.75% 3/15/23 | 1,890 | 1,758 | |
| 8% 12/15/22 (b) | 10,037 | 10,576 | |
| 8% 1/15/25 (b) | 10,435 | 10,318 | |
| Citgo Holding, Inc. 10.75% 2/15/20 (b) | 3,525 | 3,781 | |
| Concho Resources, Inc.: | |||
| 5.5% 10/1/22 | 1,265 | 1,313 | |
| 5.5% 4/1/23 | 825 | 855 | |
| Covey Park Energy LLC 7.5% 5/15/25 (b) | 1,540 | 1,565 | |
| Crestwood Midstream Partners LP/Crestwood Midstream Finance Corp. 6.25% 4/1/23 | 1,775 | 1,853 | |
| Denbury Resources, Inc. 4.625% 7/15/23 | 4,395 | 3,011 | |
| Ensco PLC: | |||
| 4.5% 10/1/24 | 1,800 | 1,485 | |
| 5.2% 3/15/25 | 80 | 68 | |
| EP Energy LLC/Everest Acquisition Finance, Inc. 8% 11/29/24 (b) | 1,170 | 1,224 | |
| Exterran Partners LP/EXLP Finance Corp.: | |||
| 6% 4/1/21 | 495 | 496 | |
| 6% 10/1/22 | 3,870 | 3,860 | |
| FTS International, Inc. 6.25% 5/1/22 | 5,060 | 4,377 | |
| Gibson Energy, Inc. 6.75% 7/15/21 (b) | 93 | 97 | |
| Gulfmark Offshore, Inc. 6.375% 3/15/22 (c) | 2,200 | 1,150 | |
| Hilcorp Energy I LP/Hilcorp Finance Co.: | |||
| 5% 12/1/24 (b) | 2,085 | 1,955 | |
| 5.75% 10/1/25 (b) | 10,085 | 9,782 | |
| Hornbeck Offshore Services, Inc.: | |||
| 5% 3/1/21 | 35 | 22 | |
| 5.875% 4/1/20 | 3,306 | 2,132 | |
| Jupiter Resources, Inc. 8.5% 10/1/22 (b) | 1,570 | 1,280 | |
| Murphy Oil Corp. 6.875% 8/15/24 | 570 | 607 | |
| Noble Holding International Ltd.: | |||
| 4.625% 3/1/21 | 318 | 293 | |
| 6.05% 3/1/41 | 95 | 67 | |
| 6.2% 8/1/40 | 955 | 673 | |
| 7.75% 1/15/24 | 4,730 | 4,316 | |
| NuStar Logistics LP 5.625% 4/28/27 | 985 | 1,016 | |
| Oasis Petroleum, Inc. 6.875% 3/15/22 | 905 | 916 | |
| Pacific Drilling V Ltd. 7.25% 12/1/17 (b) | 3,755 | 1,915 | |
| Parsley Energy LLC/Parsley 6.25% 6/1/24 (b) | 4,520 | 4,780 | |
| PBF Holding Co. LLC/PBF Finance Corp. 7% 11/15/23 | 3,520 | 3,573 | |
| Peabody Securities Finance Corp.: | |||
| 6% 3/31/22 (b) | 610 | 622 | |
| 6.375% 3/31/25 (b) | 755 | 766 | |
| Pride International, Inc. 7.875% 8/15/40 | 2,715 | 2,484 | |
| Rice Energy, Inc.: | |||
| 6.25% 5/1/22 | 3,095 | 3,236 | |
| 7.25% 5/1/23 | 1,545 | 1,669 | |
| Rose Rock Midstream LP/Rose Rock Finance Corp. 5.625% 7/15/22 | 1,125 | 1,122 | |
| Sabine Pass Liquefaction LLC 5.625% 3/1/25 | 2,735 | 2,990 | |
| SM Energy Co.: | |||
| 5% 1/15/24 | 1,730 | 1,631 | |
| 5.625% 6/1/25 | 2,565 | 2,450 | |
| 6.125% 11/15/22 | 4,420 | 4,497 | |
| 6.5% 11/15/21 | 800 | 818 | |
| 6.5% 1/1/23 | 95 | 96 | |
| 6.75% 9/15/26 | 845 | 851 | |
| Summit Midstream Holdings LLC: | |||
| 5.5% 8/15/22 | 1,520 | 1,524 | |
| 5.75% 4/15/25 | 1,435 | 1,453 | |
| Sunoco LP/Sunoco Finance Corp.: | |||
| 6.25% 4/15/21 | 3,000 | 3,169 | |
| 6.375% 4/1/23 | 1,490 | 1,587 | |
| Targa Resources Partners LP/Targa Resources Partners Finance Corp.: | |||
| 5.125% 2/1/25 (b) | 1,070 | 1,105 | |
| 5.375% 2/1/27 (b) | 1,070 | 1,118 | |
| 6.375% 8/1/22 | 908 | 936 | |
| Teine Energy Ltd. 6.875% 9/30/22 (b) | 4,916 | 5,014 | |
| TerraForm Power Operating LLC: | |||
| 6.375% 2/1/23 (b)(d) | 11,525 | 11,914 | |
| 6.625% 6/15/25 (b)(d) | 1,480 | 1,565 | |
| Tesoro Logistics LP/Tesoro Logistics Finance Corp.: | |||
| 5.875% 10/1/20 | 270 | 277 | |
| 6.125% 10/15/21 | 785 | 819 | |
| 6.25% 10/15/22 | 3,100 | 3,325 | |
| 6.375% 5/1/24 | 1,310 | 1,431 | |
| Trinidad Drilling Ltd. 6.625% 2/15/25 (b) | 830 | 836 | |
| Ultra Resources, Inc.: | |||
| 6.875% 4/15/22 (b) | 1,725 | 1,744 | |
| 7.125% 4/15/25 (b) | 1,295 | 1,283 | |
| Weatherford International Ltd. 9.875% 2/15/24 (b) | 3,630 | 4,229 | |
| Western Refining Logistics LP/WNRL Finance Co. 7.5% 2/15/23 | 890 | 961 | |
| Western Refining, Inc. 6.25% 4/1/21 | 905 | 934 | |
| WPX Energy, Inc.: | |||
| 5.25% 9/15/24 | 2,080 | 2,028 | |
| 6% 1/15/22 | 2,680 | 2,720 | |
| 7.5% 8/1/20 | 1,760 | 1,866 | |
| 8.25% 8/1/23 | 2,640 | 2,944 | |
| 183,904 | |||
| Entertainment/Film - 0.5% | |||
| AMC Entertainment Holdings, Inc. 6.125% 5/15/27 (b) | 1,405 | 1,435 | |
| CBS Outdoor Americas Capital LLC/CBS Outdoor Americas Capital Corp. 5.625% 2/15/24 | 580 | 609 | |
| Livent, Inc. yankee 9.375% 10/15/04 (c) | 11,100 | 0 | |
| NAI Entertainment Holdings LLC/NAI Entertainment Finance Corp. 5% 8/1/18 (b) | 1,425 | 1,436 | |
| New Cotai LLC/New Cotai Capital Corp. 10.625% 5/1/19 pay-in-kind (b)(d) | 6,432 | 5,531 | |
| 9,011 | |||
| Environmental - 0.5% | |||
| Covanta Holding Corp.: | |||
| 5.875% 3/1/24 | 4,680 | 4,703 | |
| 6.375% 10/1/22 | 4,000 | 4,115 | |
| LBC Tank Terminals Holding Netherlands BV 6.875% 5/15/23 (b) | 1,455 | 1,513 | |
| 10,331 | |||
| Food & Drug Retail - 1.5% | |||
| Albertsons Companies LLC/Safeway, Inc./New Albertson's, Inc./Albertson's LLC: | |||
| 5.75% 3/15/25 (b) | 5,345 | 5,198 | |
| 6.625% 6/15/24 (b) | 2,740 | 2,802 | |
| Albertsons, Inc.: | |||
| 6.625% 6/1/28 | 2,415 | 2,161 | |
| 7.45% 8/1/29 | 220 | 207 | |
| BI-LO LLC/BI-LO Finance Corp.: | |||
| 9.25% 2/15/19 (b) | 2,606 | 2,280 | |
| 9.375% 9/15/18 pay-in-kind (b)(d) | 2,750 | 1,403 | |
| Cumberland Farms, Inc. 6.75% 5/1/25 (b) | 775 | 804 | |
| FAGE International SA/FAGE U.S.A. Dairy Industry, Inc. 5.625% 8/15/26 (b) | 805 | 819 | |
| Rite Aid Corp.: | |||
| 6.875% 12/15/28 (b)(d) | 5,785 | 6,016 | |
| 7.7% 2/15/27 | 2,715 | 2,932 | |
| Tops Holding LLC/Tops Markets II Corp. 8% 6/15/22 (b) | 4,395 | 3,846 | |
| 28,468 | |||
| Food/Beverage/Tobacco - 2.2% | |||
| C&S Group Enterprises LLC 5.375% 7/15/22 (b) | 2,445 | 2,414 | |
| Darling International, Inc. 5.375% 1/15/22 | 1,280 | 1,326 | |
| ESAL GmbH 6.25% 2/5/23 (b) | 8,600 | 8,718 | |
| JBS Investments GmbH 7.25% 4/3/24 (b) | 1,990 | 2,082 | |
| JBS U.S.A. LLC/JBS U.S.A. Finance, Inc.: | |||
| 5.75% 6/15/25 (b) | 3,585 | 3,702 | |
| 5.875% 7/15/24 (b) | 2,585 | 2,695 | |
| Lamb Weston Holdings, Inc.: | |||
| 4.625% 11/1/24 (b) | 1,415 | 1,461 | |
| 4.875% 11/1/26 (b) | 1,430 | 1,475 | |
| Minerva Luxembourg SA 6.5% 9/20/26 (b) | 2,215 | 2,198 | |
| Post Holdings, Inc.: | |||
| 5.5% 3/1/25 (b) | 2,410 | 2,518 | |
| 5.75% 3/1/27 (b) | 1,870 | 1,942 | |
| 7.75% 3/15/24 (b) | 1,720 | 1,911 | |
| 8% 7/15/25 (b) | 860 | 978 | |
| U.S. Foods, Inc. 5.875% 6/15/24 (b) | 1,970 | 2,059 | |
| Vector Group Ltd. 6.125% 2/1/25 (b) | 4,850 | 5,020 | |
| 40,499 | |||
| Gaming - 2.0% | |||
| Caesars Growth Properties Holdings LLC/Caesars Growth Properties Finance, Inc. 9.375% 5/1/22 | 7,900 | 8,502 | |
| Eagle II Acquisition Co. LLC 6% 4/1/25 (b) | 515 | 532 | |
| Golden Nugget Escrow, Inc. 8.5% 12/1/21 (b) | 5,795 | 6,186 | |
| Jacobs Entertainment, Inc. 7.875% 2/1/24 (b) | 495 | 517 | |
| MGM Mirage, Inc. 8.625% 2/1/19 | 5,000 | 5,525 | |
| Paris Las Vegas Holding LLC/Harrah's Las Vegas LLC/Flamingo Las Vegas Holdings, Inc. 11% 10/1/21(d) | 7,110 | 7,705 | |
| Penn National Gaming, Inc. 5.625% 1/15/27 (b) | 415 | 418 | |
| Scientific Games Corp.: | |||
| 7% 1/1/22 (b) | 1,445 | 1,547 | |
| 10% 12/1/22 | 5,980 | 6,488 | |
| 37,420 | |||
| Healthcare - 6.2% | |||
| AMAG Pharmaceuticals, Inc. 7.875% 9/1/23 (b) | 1,810 | 1,720 | |
| Community Health Systems, Inc.: | |||
| 6.25% 3/31/23 | 2,540 | 2,584 | |
| 6.875% 2/1/22 | 9,725 | 8,047 | |
| CTR Partnership LP/CareTrust Capital Corp. 5.875% 6/1/21 | 355 | 365 | |
| DaVita HealthCare Partners, Inc. 5% 5/1/25 | 3,590 | 3,617 | |
| HCA Holdings, Inc.: | |||
| 5.375% 2/1/25 | 4,375 | 4,555 | |
| 5.875% 2/15/26 | 2,290 | 2,433 | |
| 7.5% 2/15/22 | 5,095 | 5,861 | |
| HealthSouth Corp.: | |||
| 5.125% 3/15/23 | 1,235 | 1,240 | |
| 5.75% 11/1/24 | 1,570 | 1,599 | |
| 5.75% 9/15/25 | 400 | 405 | |
| IMS Health, Inc. 5% 10/15/26 (b) | 2,205 | 2,249 | |
| Tenet Healthcare Corp.: | |||
| 4.375% 10/1/21 | 3,350 | 3,346 | |
| 5% 3/1/19 (d) | 2,540 | 2,545 | |
| 6.75% 2/1/20 | 1,800 | 1,818 | |
| 6.75% 6/15/23 | 17,610 | 16,818 | |
| 7.5% 1/1/22 (b) | 1,220 | 1,305 | |
| 8.125% 4/1/22 | 12,990 | 13,185 | |
| Valeant Pharmaceuticals International, Inc.: | |||
| 5.375% 3/15/20 (b) | 9,510 | 8,155 | |
| 5.5% 3/1/23 (b) | 4,720 | 3,457 | |
| 5.875% 5/15/23 (b) | 11,245 | 8,307 | |
| 6.125% 4/15/25 (b) | 7,645 | 5,644 | |
| 6.5% 3/15/22 (b) | 2,490 | 2,549 | |
| 7% 3/15/24 (b) | 4,955 | 5,054 | |
| 7.25% 7/15/22 (b) | 315 | 254 | |
| 7.5% 7/15/21 (b) | 7,360 | 6,090 | |
| Vizient, Inc. 10.375% 3/1/24 (b) | 2,275 | 2,605 | |
| Wellcare Health Plans, Inc. 5.25% 4/1/25 | 1,570 | 1,633 | |
| 117,440 | |||
| Homebuilders/Real Estate - 0.9% | |||
| Brookfield Residential Properties, Inc./Brookfield Residential U.S. Corp. 6.125% 7/1/22 (b) | 1,290 | 1,345 | |
| Brookfield Residential Properties, Inc.: | |||
| 6.375% 5/15/25 (b) | 470 | 490 | |
| 6.5% 12/15/20 (b) | 1,840 | 1,909 | |
| Howard Hughes Corp. 5.375% 3/15/25 (b) | 2,170 | 2,192 | |
| Odebrecht Finance Ltd.: | |||
| 4.375% 4/25/25 (b) | 350 | 157 | |
| 5.25% 6/27/29 (b) | 2,320 | 1,014 | |
| 7.125% 6/26/42 (b) | 2,755 | 1,240 | |
| Shea Homes Ltd. Partnership/Corp.: | |||
| 5.875% 4/1/23 (b) | 1,570 | 1,586 | |
| 6.125% 4/1/25 (b) | 1,150 | 1,162 | |
| Taylor Morrison Communities, Inc./Monarch Communities, Inc. 5.875% 4/15/23 (b) | 2,150 | 2,290 | |
| William Lyon Homes, Inc. 5.875% 1/31/25 (b) | 1,260 | 1,292 | |
| Woodside Homes Co. LLC/Woodside Homes Finance, Inc. 6.75% 12/15/21 (b) | 2,215 | 2,327 | |
| 17,004 | |||
| Hotels - 0.2% | |||
| Hilton Worldwide Finance LLC/Hilton Worldwide Finance Corp.: | |||
| 4.625% 4/1/25 (b) | 2,170 | 2,230 | |
| 4.875% 4/1/27 (b) | 1,305 | 1,338 | |
| Playa Resorts Holding BV 8% 8/15/20 (b) | 674 | 709 | |
| 4,277 | |||
| Insurance - 0.5% | |||
| Alliant Holdings Co.-Issuer, Inc./Wayne Merger Sub LLC 8.25% 8/1/23 (b) | 3,390 | 3,619 | |
| Hockey Merger Sub 2, Inc. 7.875% 10/1/21 (b) | 2,765 | 2,897 | |
| Hub Holdings LLC/Hub Holdings Finance, Inc. 8.125% 7/15/19 pay-in-kind (b)(d) | 1,220 | 1,226 | |
| USIS Merger Sub, Inc. 6.875% 5/1/25 (b) | 2,355 | 2,396 | |
| 10,138 | |||
| Leisure - 0.3% | |||
| Studio City Co. Ltd.: | |||
| 5.875% 11/30/19 (b) | 1,400 | 1,465 | |
| 7.25% 11/30/21 (b) | 3,645 | 3,907 | |
| 5,372 | |||
| Metals/Mining - 1.5% | |||
| Bluescope Steel Ltd./Bluescope Steel Finance 6.5% 5/15/21 (b) | 650 | 689 | |
| First Quantum Minerals Ltd.: | |||
| 7% 2/15/21 (b) | 2,665 | 2,758 | |
| 7.25% 5/15/22 (b) | 1,130 | 1,164 | |
| 7.25% 4/1/23 (b) | 1,930 | 1,965 | |
| 7.5% 4/1/25 (b) | 3,220 | 3,284 | |
| Freeport-McMoRan, Inc.: | |||
| 6.5% 11/15/20 (b) | 435 | 447 | |
| 6.625% 5/1/21 (b) | 435 | 446 | |
| 6.75% 2/1/22 (b) | 3,407 | 3,556 | |
| 6.875% 2/15/23 (b) | 7,290 | 7,673 | |
| Joseph T Ryerson & Son, Inc. 11% 5/15/22 (b) | 1,200 | 1,355 | |
| Murray Energy Corp. 11.25% 4/15/21 (b) | 5,750 | 4,313 | |
| Walter Energy, Inc. 9.5% 10/15/19 (b)(c) | 2,360 | 0 | |
| 27,650 | |||
| Paper - 0.1% | |||
| Flex Acquisition Co., Inc. 6.875% 1/15/25 (b) | 940 | 968 | |
| Publishing/Printing - 1.7% | |||
| Cengage Learning, Inc. 9.5% 6/15/24 (b) | 4,000 | 3,610 | |
| Cenveo Corp. 6% 8/1/19 (b) | 1,290 | 1,051 | |
| Harland Clarke Holdings Corp. 8.375% 8/15/22 (b) | 1,355 | 1,396 | |
| McGraw-Hill Global Education Holdings LLC/McGraw-Hill Global Education Finance 7.875% 5/15/24 (b) | 6,945 | 6,763 | |
| MHGE Parent LLC/MHGE Parent Finance, Inc. 8.5% 8/1/19 pay-in-kind (b)(d) | 18,124 | 18,260 | |
| 31,080 | |||
| Restaurants - 0.2% | |||
| KFC Holding Co./Pizza Hut Holding LLC 5% 6/1/24 (b) | 2,680 | 2,767 | |
| Landry's Acquisition Co. 6.75% 10/15/24 (b) | 1,710 | 1,791 | |
| 4,558 | |||
| Services - 5.2% | |||
| Anna Merger Sub, Inc. 7.75% 10/1/22 (b) | 7,115 | 6,030 | |
| APX Group, Inc.: | |||
| 6.375% 12/1/19 | 3,646 | 3,774 | |
| 7.875% 12/1/22 | 10,865 | 11,843 | |
| 7.875% 12/1/22 (b) | 4,670 | 5,090 | |
| 8.75% 12/1/20 | 27,443 | 28,440 | |
| Ashtead Capital, Inc. 5.625% 10/1/24 (b) | 3,195 | 3,414 | |
| FTI Consulting, Inc. 6% 11/15/22 | 2,450 | 2,560 | |
| Garda World Security Corp.: | |||
| 7.25% 11/15/21 (b) | 6,820 | 6,898 | |
| 7.25% 11/15/21 (b) | 920 | 930 | |
| Herc Rentals, Inc.: | |||
| 7.5% 6/1/22 (b) | 1,177 | 1,280 | |
| 7.75% 6/1/24 (b) | 1,209 | 1,319 | |
| Jurassic Holdings III, Inc. 6.875% 2/15/21 (Reg. S) (b) | 2,095 | 1,739 | |
| Laureate Education, Inc.: | |||
| 8.25% 5/1/25 (b) | 5,650 | 5,805 | |
| 10% 9/1/19 (b)(d) | 16,420 | 17,241 | |
| TMS International Corp. 7.625% 10/15/21 (b) | 420 | 423 | |
| United Rentals North America, Inc. 5.5% 5/15/27 | 1,355 | 1,394 | |
| 98,180 | |||
| Super Retail - 0.2% | |||
| JC Penney Corp., Inc. 5.75% 2/15/18 | 703 | 720 | |
| Netflix, Inc. 4.375% 11/15/26 (b) | 3,540 | 3,487 | |
| 4,207 | |||
| Technology - 3.9% | |||
| Balboa Merger Sub, Inc. 11.375% 12/1/21 (b) | 10,620 | 11,762 | |
| Booz Allen Hamilton, Inc. 5.125% 5/1/25 (b) | 1,305 | 1,328 | |
| Brocade Communications Systems, Inc. 4.625% 1/15/23 | 160 | 164 | |
| CDW LLC/CDW Finance Corp. 5% 9/1/25 | 1,090 | 1,117 | |
| Diamond 1 Finance Corp./Diamond 2 Finance Corp.: | |||
| 5.875% 6/15/21 (b) | 1,930 | 2,046 | |
| 7.125% 6/15/24 (b) | 1,880 | 2,078 | |
| EIG Investors Corp. 10.875% 2/1/24 | 3,405 | 3,626 | |
| Gartner, Inc. 5.125% 4/1/25 (b) | 1,290 | 1,335 | |
| Greeneden U.S. Holdings II LLC 10% 11/30/24 (b) | 2,950 | 3,267 | |
| Inception Merger Sub, Inc./Rackspace Hosting, Inc. 8.625% 11/15/24 (b) | 2,575 | 2,726 | |
| JDA Escrow LLC/JDA Bond Finance, Inc. 7.375% 10/15/24 (b) | 755 | 789 | |
| Lucent Technologies, Inc.: | |||
| 6.45% 3/15/29 | 6,539 | 7,356 | |
| 6.5% 1/15/28 | 5,415 | 5,984 | |
| Micron Technology, Inc.: | |||
| 5.25% 1/15/24 (b) | 3,480 | 3,588 | |
| 5.5% 2/1/25 | 2,310 | 2,414 | |
| Parametric Technology Corp. 6% 5/15/24 | 650 | 696 | |
| Solera LLC/Solera Finance, Inc. 10.5% 3/1/24 (b) | 3,365 | 3,840 | |
| Tempo Acquisition LLC 6.75% 6/1/25 (b)(e) | 1,790 | 1,839 | |
| VeriSign, Inc. 4.625% 5/1/23 | 910 | 931 | |
| Veritas U.S., Inc./Veritas Bermuda Ltd. 10.5% 2/1/24 (b) | 7,300 | 7,775 | |
| Western Digital Corp. 10.5% 4/1/24 | 3,040 | 3,580 | |
| WideOpenWest Finance LLC/WideOpenWest Capital Corp. 10.25% 7/15/19 | 4,722 | 4,911 | |
| 73,152 | |||
| Telecommunications - 9.8% | |||
| Altice Financing SA: | |||
| 6.5% 1/15/22 (b) | 895 | 939 | |
| 7.5% 5/15/26 (b) | 4,005 | 4,325 | |
| Altice Finco SA: | |||
| 7.625% 2/15/25 (b) | 4,995 | 5,120 | |
| 8.125% 1/15/24 (b) | 810 | 875 | |
| Broadview Networks Holdings, Inc. 10.5% 11/15/17 | 2,915 | 2,908 | |
| Columbus International, Inc. 7.375% 3/30/21 (b) | 6,245 | 6,721 | |
| CyrusOne LP/CyrusOne Finance Corp.: | |||
| 5% 3/15/24 (b) | 545 | 560 | |
| 5.375% 3/15/27 (b) | 465 | 479 | |
| Equinix, Inc. 5.375% 5/15/27 | 1,575 | 1,646 | |
| FairPoint Communications, Inc. 8.75% 8/15/19 (b) | 2,375 | 2,437 | |
| GCI, Inc. 6.875% 4/15/25 | 2,080 | 2,236 | |
| Intelsat Jackson Holdings SA: | |||
| 5.5% 8/1/23 | 8,840 | 7,547 | |
| 7.5% 4/1/21 | 5,730 | 5,243 | |
| 8% 2/15/24 (b) | 8,435 | 9,068 | |
| Intelsat Luxembourg SA: | |||
| 7.75% 6/1/21 | 1,240 | 718 | |
| 8.125% 6/1/23 | 1,870 | 1,066 | |
| Level 3 Financing, Inc. 6.125% 1/15/21 | 2,395 | 2,476 | |
| Neptune Finco Corp.: | |||
| 6.625% 10/15/25 (b) | 1,990 | 2,177 | |
| 10.125% 1/15/23 (b) | 9,815 | 11,385 | |
| 10.875% 10/15/25 (b) | 6,045 | 7,262 | |
| Sable International Finance Ltd. 6.875% 8/1/22 (b) | 3,985 | 4,275 | |
| SFR Group SA: | |||
| 6% 5/15/22 (b) | 5,733 | 5,977 | |
| 6.25% 5/15/24 (b) | 1,150 | 1,190 | |
| 7.375% 5/1/26 (b) | 6,560 | 6,896 | |
| Sprint Capital Corp.: | |||
| 6.875% 11/15/28 | 5,490 | 5,943 | |
| 6.9% 5/1/19 | 4,761 | 5,088 | |
| 8.75% 3/15/32 | 12,210 | 15,026 | |
| Sprint Communications, Inc.: | |||
| 6% 11/15/22 | 13,834 | 14,413 | |
| 9% 11/15/18 (b) | 5,500 | 6,016 | |
| Sprint Corp.: | |||
| 7.125% 6/15/24 | 8,830 | 9,630 | |
| 7.25% 9/15/21 | 270 | 295 | |
| 7.625% 2/15/25 | 825 | 921 | |
| 7.875% 9/15/23 | 8,400 | 9,429 | |
| T-Mobile U.S.A., Inc.: | |||
| 6% 4/15/24 | 3,290 | 3,565 | |
| 6.5% 1/15/24 | 2,500 | 2,709 | |
| 6.5% 1/15/26 | 3,290 | 3,648 | |
| 6.625% 4/1/23 | 4,925 | 5,264 | |
| 6.836% 4/28/23 | 480 | 515 | |
| Zayo Group LLC/Zayo Capital, Inc.: | |||
| 5.75% 1/15/27 (b) | 4,400 | 4,670 | |
| 6% 4/1/23 | 3,795 | 4,046 | |
| 184,704 | |||
| Transportation Ex Air/Rail - 0.8% | |||
| Navios Maritime Acquisition Corp./Navios Acquisition Finance U.S., Inc. 8.125% 11/15/21 (b) | 3,470 | 3,093 | |
| Navios Maritime Holdings, Inc.: | |||
| 7.375% 1/15/22 (b) | 5,250 | 4,515 | |
| 8.125% 2/15/19 | 1,404 | 1,264 | |
| Navios South American Logistics, Inc./Navios Logistics Finance U.S., Inc. 7.25% 5/1/22 (b) | 1,215 | 1,200 | |
| Teekay Corp. 8.5% 1/15/20 | 5,305 | 5,252 | |
| TRAC Intermodal LLC/TRAC Intermodal Corp. 11% 8/15/19 | 97 | 103 | |
| 15,427 | |||
| Utilities - 4.6% | |||
| Calpine Corp.: | |||
| 5.375% 1/15/23 | 2,615 | 2,576 | |
| 5.75% 1/15/25 | 1,120 | 1,084 | |
| Dynegy, Inc.: | |||
| 5.875% 6/1/23 | 705 | 622 | |
| 7.375% 11/1/22 | 7,415 | 7,100 | |
| 7.625% 11/1/24 | 7,900 | 7,229 | |
| 8% 1/15/25 (b) | 1,335 | 1,225 | |
| Energy Future Intermediate Holding Co. LLC/Energy Future Intermediate Holding Finance, Inc.: | |||
| 11% 10/1/21 (c) | 11,804 | 14,401 | |
| 12.25% 3/1/22 (b)(c)(d) | 21,847 | 27,910 | |
| Global Partners LP/GLP Finance Corp. 7% 6/15/23 | 880 | 871 | |
| InterGen NV 7% 6/30/23 (b) | 12,534 | 11,688 | |
| NRG Energy, Inc. 6.625% 3/15/23 | 6,290 | 6,384 | |
| Pattern Energy Group, Inc. 5.875% 2/1/24 (b) | 965 | 990 | |
| PPL Energy Supply LLC 6.5% 6/1/25 | 1,700 | 1,352 | |
| RJS Power Holdings LLC 4.625% 7/15/19 (b)(d) | 676 | 666 | |
| TXU Corp.: | |||
| 5.55% 11/15/14 (c) | 7,757 | 853 | |
| 6.5% 11/15/24 (c) | 4,961 | 546 | |
| 6.55% 11/15/34 (c) | 4,295 | 472 | |
| 85,969 | |||
| TOTAL NONCONVERTIBLE BONDS | 1,307,499 | ||
| TOTAL CORPORATE BONDS | |||
| (Cost $1,281,384) | 1,307,684 | ||
| Shares | Value (000s) | ||
| Common Stocks - 19.5% | |||
| Air Transportation - 0.4% | |||
| Air Canada (f) | 293,100 | 2,789 | |
| Delta Air Lines, Inc. | 100,000 | 4,544 | |
| TOTAL AIR TRANSPORTATION | 7,333 | ||
| Automotive & Auto Parts - 1.0% | |||
| Allison Transmission Holdings, Inc. | 217,100 | 8,397 | |
| Chassix Holdings, Inc. (f) | 29,835 | 931 | |
| General Motors Co. | 92,561 | 3,206 | |
| General Motors Co. warrants 7/10/19 (f) | 11,706 | 199 | |
| Motors Liquidation Co. GUC Trust (f) | 39,254 | 337 | |
| Tenneco, Inc. | 100,000 | 6,303 | |
| TOTAL AUTOMOTIVE & AUTO PARTS | 19,373 | ||
| Banks & Thrifts - 1.2% | |||
| Bank of America Corp. | 389,800 | 9,098 | |
| CIT Group, Inc. | 241,818 | 11,199 | |
| Citigroup, Inc. | 1,764 | 104 | |
| Washington Mutual, Inc. (f) | 505,500 | 0 | |
| Wells Fargo & Co. | 51,500 | 2,773 | |
| WMI Holdings Corp. (f) | 17,605 | 26 | |
| TOTAL BANKS & THRIFTS | 23,200 | ||
| Broadcasting - 1.8% | |||
| AMC Networks, Inc. Class A (f) | 99,600 | 5,944 | |
| DISH Network Corp. Class A (f) | 100,000 | 6,444 | |
| Gray Television, Inc. (f) | 594,070 | 8,703 | |
| Nexstar Broadcasting Group, Inc. Class A | 122,000 | 8,418 | |
| Sinclair Broadcast Group, Inc. Class A | 100,000 | 3,945 | |
| TOTAL BROADCASTING | 33,454 | ||
| Cable/Satellite TV - 0.4% | |||
| Charter Communications, Inc. Class A (f) | 20,048 | 6,920 | |
| Chemicals - 1.0% | |||
| LyondellBasell Industries NV Class A | 86,895 | 7,365 | |
| Platform Specialty Products Corp. (f) | 487,430 | 6,907 | |
| The Chemours Co. LLC | 135,500 | 5,459 | |
| TOTAL CHEMICALS | 19,731 | ||
| Consumer Products - 1.0% | |||
| Newell Brands, Inc. | 136,100 | 6,497 | |
| Spectrum Brands Holdings, Inc. (g) | 81,100 | 11,657 | |
| TOTAL CONSUMER PRODUCTS | 18,154 | ||
| Containers - 0.4% | |||
| Graphic Packaging Holding Co. | 617,874 | 8,391 | |
| Diversified Financial Services - 0.8% | |||
| AerCap Holdings NV (f) | 143,500 | 6,602 | |
| The Blackstone Group LP | 250,000 | 7,710 | |
| TOTAL DIVERSIFIED FINANCIAL SERVICES | 14,312 | ||
| Energy - 1.0% | |||
| Baker Hughes, Inc. | 140,300 | 8,330 | |
| Contura Energy, Inc. | 198 | 14 | |
| Contura Energy, Inc. warrants 7/26/23 (f) | 322 | 9 | |
| Extraction Oil & Gas, Inc. (g) | 313,025 | 4,899 | |
| Forbes Energy Services Ltd. (f) | 65,062 | 2,042 | |
| Ovation Acquisition I LLC (f)(h) | 583,372 | 0 | |
| SM Energy Co. | 150,700 | 3,404 | |
| Southwestern Energy Co. (f) | 47,026 | 353 | |
| TOTAL ENERGY | 19,051 | ||
| Food/Beverage/Tobacco - 0.6% | |||
| U.S. Foods Holding Corp. | 415,900 | 11,728 | |
| Gaming - 1.7% | |||
| Eldorado Resorts, Inc. (f) | 389,100 | 7,442 | |
| Gaming & Leisure Properties | 126,400 | 4,399 | |
| Melco Crown Entertainment Ltd. sponsored ADR | 544,600 | 11,954 | |
| Red Rock Resorts, Inc. (b) | 357,285 | 8,353 | |
| TOTAL GAMING | 32,148 | ||
| Healthcare - 1.2% | |||
| Boston Scientific Corp. (f) | 246,400 | 6,500 | |
| HCA Holdings, Inc. (f) | 93,700 | 7,890 | |
| Jazz Pharmaceuticals PLC (f) | 42,500 | 6,769 | |
| Legend Acquisition, Inc. (f) | 18,796 | 320 | |
| Legend Acquisition, Inc.: | |||
| Class A warrants (f) | 28,063 | 0 | |
| Class B warrants(f) | 37,006 | 0 | |
| Teva Pharmaceutical Industries Ltd. sponsored ADR | 64,500 | 2,037 | |
| TOTAL HEALTHCARE | 23,516 | ||
| Homebuilders/Real Estate - 0.7% | |||
| CalAtlantic Group, Inc. | 198,100 | 7,175 | |
| Lennar Corp. Class A | 120,787 | 6,100 | |
| TOTAL HOMEBUILDERS/REAL ESTATE | 13,275 | ||
| Hotels - 0.1% | |||
| Extended Stay America, Inc. unit | 134,200 | 2,340 | |
| Metals/Mining - 0.4% | |||
| Alcoa Corp. | 195,800 | 6,604 | |
| Alpha Natural Resources Holdings, Inc. (f) | 2,784 | 14 | |
| ANR, Inc. (f) | 2,784 | 56 | |
| Warrior Met Coal, Inc. (f) | 17,041 | 277 | |
| TOTAL METALS/MINING | 6,951 | ||
| Services - 0.7% | |||
| HD Supply Holdings, Inc. (f) | 150,000 | 6,045 | |
| United Rentals, Inc. (f) | 57,500 | 6,305 | |
| WP Rocket Holdings, Inc. (f)(h) | 8,700,771 | 522 | |
| TOTAL SERVICES | 12,872 | ||
| Super Retail - 0.0% | |||
| Arena Brands Holding Corp. Class B (f)(h) | 42,253 | 55 | |
| Technology - 4.3% | |||
| Alphabet, Inc. Class A (f) | 11,000 | 10,170 | |
| CDW Corp. | 129,800 | 7,670 | |
| Dell Technologies, Inc. (f) | 93,600 | 6,281 | |
| Facebook, Inc. Class A (f) | 37,894 | 5,694 | |
| MSC Industrial Direct Co., Inc. Class A | 46,600 | 4,172 | |
| NXP Semiconductors NV (f) | 95,422 | 10,091 | |
| ON Semiconductor Corp. (f) | 321,300 | 4,556 | |
| Presidio, Inc. | 140,400 | 2,071 | |
| Qorvo, Inc. (f) | 220,400 | 14,994 | |
| Skyworks Solutions, Inc. | 99,300 | 9,904 | |
| VeriSign, Inc. (f)(g) | 52,900 | 4,704 | |
| TOTAL TECHNOLOGY | 80,307 | ||
| Telecommunications - 0.3% | |||
| Alibaba Group Holding Ltd. sponsored ADR (f) | 32,200 | 3,719 | |
| Broadview Networks Holdings, Inc. (f) | 189,475 | 1,152 | |
| Pendrell Corp. (f) | 3,747 | 23 | |
| TOTAL TELECOMMUNICATIONS | 4,894 | ||
| Utilities - 0.5% | |||
| Calpine Corp. (f) | 559,800 | 5,710 | |
| Dynegy, Inc. (f) | 178,500 | 1,146 | |
| The AES Corp. | 198,300 | 2,243 | |
| TOTAL UTILITIES | 9,099 | ||
| TOTAL COMMON STOCKS | |||
| (Cost $313,707) | 367,104 | ||
| Convertible Preferred Stocks - 1.0% | |||
| Energy - 0.2% | |||
| Southwestern Energy Co. Series B 6.25% (f) | 211,700 | 3,897 | |
| Healthcare - 0.7% | |||
| Allergan PLC 5.50% | 10,200 | 8,810 | |
| Teva Pharmaceutical Industries Ltd. 7% | 6,650 | 3,783 | |
| TOTAL HEALTHCARE | 12,593 | ||
| Utilities - 0.1% | |||
| Dynegy, Inc. 7.00% | 45,600 | 2,323 | |
| TOTAL CONVERTIBLE PREFERRED STOCKS | |||
| (Cost $26,825) | 18,813 | ||
| Principal Amount (000s)(a) | Value (000s) | ||
| Bank Loan Obligations - 2.9% | |||
| Automotive & Auto Parts - 0.0% | |||
| Chassix, Inc. term loan 12% 7/29/19 | 339 | 339 | |
| Cable/Satellite TV - 0.5% | |||
| WideOpenWest Finance LLC Tranche B, term loan 4.554% 8/19/23 (d) | 9,517 | 9,566 | |
| Diversified Financial Services - 0.0% | |||
| Cypress Intermediate Holdings, Inc. Tranche 2LN, term loan 3/30/25 (i) | 645 | 657 | |
| Energy - 0.8% | |||
| American Energy-Marcellus LLC Tranche B 1LN, term loan 5.284% 8/4/20 (d) | 1,521 | 1,058 | |
| California Resources Corp. Tranche 1LN, term loan 11.375% 12/31/21 (d) | 1,885 | 2,071 | |
| Chesapeake Energy Corp. Tranche 1LN, term loan 8.5534% 8/23/21 (d) | 2,645 | 2,856 | |
| Chief Exploration & Development, LLC. Tranche 2LN, term loan 7.9324% 5/16/21 (d) | 2,295 | 2,203 | |
| Citgo Holding, Inc. Tranche B, term loan 9.6468% 5/12/18 (d) | 802 | 812 | |
| Forbes Energy Services LLC term loan 12% 12/21/20 pay-in-kind (d) | 620 | 582 | |
| FTS International, Inc. Tranche B, term loan 5.75% 4/16/21 (d) | 585 | 507 | |
| Gavilan Resources LLC Tranche 2LN, term loan 7% 3/1/24 (d) | 1,800 | 1,782 | |
| Pacific Drilling SA Tranche B, term loan 4.625% 6/3/18 (d) | 567 | 261 | |
| Seadrill Operating LP Tranche B, term loan 4.1468% 2/21/21 (d) | 3,033 | 2,039 | |
| TOTAL ENERGY | 14,171 | ||
| Entertainment/Film - 0.0% | |||
| Livent, Inc. Tranche A, term loan 18% 1/15/49 pay-in-kind | CAD | 983 | 360 |
| Healthcare - 0.3% | |||
| U.S. Renal Care, Inc.: | |||
| Tranche 2LN, term loan 9.1468% 12/31/23 (d) | 2,935 | 2,664 | |
| Tranche B 1LN, term loan 5.3968% 12/31/22 (d) | 3,551 | 3,365 | |
| TOTAL HEALTHCARE | 6,029 | ||
| Homebuilders/Real Estate - 0.0% | |||
| DTZ U.S. Borrower LLC Tranche 2LN, term loan 9.4218% 11/4/22 (d) | 77 | 77 | |
| Insurance - 0.1% | |||
| AmWINS Group, Inc. Tranche B 1LN, term loan 3.75% 1/25/24 (d) | 728 | 727 | |
| Leisure - 0.0% | |||
| Equinox Holdings, Inc.: | |||
| Tranche 2LN, term loan 8% 9/8/24 (d) | 130 | 132 | |
| Tranche B 1LN, term loan 4.25% 3/8/24 (d) | 360 | 363 | |
| TOTAL LEISURE | 495 | ||
| Metals/Mining - 0.1% | |||
| Murray Energy Corp. Tranche B 2LN, term loan 8.3968% 4/16/20 (d) | 1,368 | 1,305 | |
| Paper - 0.0% | |||
| Caraustar Industries, Inc. Tranche B, term loan 6.6468% 3/14/22 (d) | 285 | 288 | |
| Services - 0.2% | |||
| Laureate Education, Inc. Tranche B 1LN, term loan 4/21/24 (i) | 3,235 | 3,228 | |
| Thomson Reuters IP&S Tranche B 1LN, term loan 4.5% 10/3/23 (d) | 562 | 565 | |
| TOTAL SERVICES | 3,793 | ||
| Super Retail - 0.2% | |||
| Bass Pro Shops LLC. Tranche B, term loan 6.1468% 12/16/23 (d) | 4,415 | 4,296 | |
| Technology - 0.7% | |||
| Compuware Corp. term loan 9.25% 12/15/22 (d) | 4,739 | 4,751 | |
| Kronos, Inc. term loan 9.284% 11/1/24 (d) | 3,650 | 3,798 | |
| Renaissance Learning, Inc.: | |||
| Tranche 1LN, term loan 4.8968% 4/9/21 (d) | 994 | 999 | |
| Tranche 2LN, term loan 8.1468% 4/9/22 (d) | 4,065 | 4,041 | |
| TOTAL TECHNOLOGY | 13,589 | ||
| TOTAL BANK LOAN OBLIGATIONS | |||
| (Cost $55,988) | 55,692 | ||
| Preferred Securities - 2.8% | |||
| Banks & Thrifts - 2.8% | |||
| Bank of America Corp. 6.1% (d)(j) | 2,590 | 2,794 | |
| Barclays Bank PLC 7.625% 11/21/22 | 10,205 | 11,521 | |
| Citigroup, Inc. 5.35% (d)(j) | 12,655 | 13,110 | |
| Credit Agricole SA: | |||
| 6.625% (b)(d)(j) | 9,035 | 9,289 | |
| 7.875% (b)(d)(j) | 2,365 | 2,550 | |
| 8.125% (b)(d)(j) | 6,230 | 6,929 | |
| Goldman Sachs Group, Inc. 5.375% (d)(j) | 4,045 | 4,297 | |
| Royal Bank of Scotland Group PLC 8% (d)(j) | 1,515 | 1,582 | |
| TOTAL BANKS & THRIFTS | 52,072 | ||
| Homebuilders/Real Estate - 0.0% | |||
| Odebrecht Finance Ltd. 7.5% (b)(j) | 180 | 84 | |
| TOTAL PREFERRED SECURITIES | |||
| (Cost $50,290) | 52,156 | ||
| Shares | Value (000s) | ||
| Money Market Funds - 3.1% | |||
| Fidelity Cash Central Fund, 0.85% (k) | 54,118,331 | 54,129 | |
| Fidelity Securities Lending Cash Central Fund 0.86% (k)(l) | 5,195,793 | 5,196 | |
| TOTAL MONEY MARKET FUNDS | |||
| (Cost $59,327) | 59,325 | ||
| TOTAL INVESTMENT PORTFOLIO - 98.7% | |||
| (Cost $1,787,521) | 1,860,774 | ||
| NET OTHER ASSETS (LIABILITIES) - 1.3% | 24,412 | ||
| NET ASSETS - 100% | $1,885,186 |
Currency Abbreviations
CAD – Canadian dollar
Values shown as $0 may reflect amounts less than $500.
Legend
(a) Amount is stated in United States dollars unless otherwise noted.
(b) Security exempt from registration under Rule 144A of the Securities Act of 1933. These securities may be resold in transactions exempt from registration, normally to qualified institutional buyers. At the end of the period, the value of these securities amounted to $753,172,000 or 40.0% of net assets.
(c) Non-income producing - Security is in default.
(d) Coupon rates for floating and adjustable rate securities reflect the rates in effect at period end.
(e) Security or a portion of the security purchased on a delayed delivery or when-issued basis.
(f) Non-income producing
(g) Security or a portion of the security is on loan at period end.
(h) Restricted securities - Investment in securities not registered under the Securities Act of 1933 (excluding 144A issues). At the end of the period, the value of restricted securities (excluding 144A issues) amounted to $577,000 or 0.0% of net assets.
(i) The coupon rate will be determined upon settlement of the loan after period end.
(j) Security is perpetual in nature with no stated maturity date.
(k) Affiliated fund that is generally available only to investment companies and other accounts managed by Fidelity Investments. The rate quoted is the annualized seven-day yield of the fund at period end. A complete unaudited listing of the fund's holdings as of its most recent quarter end is available upon request. In addition, each Fidelity Central Fund's financial statements are available on the SEC's website or upon request.
(l) Investment made with cash collateral received from securities on loan.
Additional information on each restricted holding is as follows:
| Security | Acquisition Date | Acquisition Cost (000s) |
| Arena Brands Holding Corp. Class B | 6/18/97 - 7/13/98 | $1,538 |
| Ovation Acquisition I LLC | 12/23/15 | $6 |
| WP Rocket Holdings, Inc. | 6/24/11 - 2/2/15 | $4,521 |
Affiliated Central Funds
Information regarding fiscal year to date income earned by the Fund from investments in Fidelity Central Funds is as follows:
| Fund | Income earned |
| (Amounts in thousands) | |
| Fidelity Cash Central Fund | $173 |
| Fidelity Securities Lending Cash Central Fund | 11 |
| Total | $184 |
Investment Valuation
The following is a summary of the inputs used, as of April 30, 2017, involving the Fund's assets and liabilities carried at fair value. The inputs or methodology used for valuing securities may not be an indication of the risk associated with investing in those securities. For more information on valuation inputs, and their aggregation into the levels used below, please refer to the Investment Valuation section in the accompanying Notes to Financial Statements.
| Valuation Inputs at Reporting Date: | ||||
| Description | Total | Level 1 | Level 2 | Level 3 |
| (Amounts in thousands) | ||||
| Investments in Securities: | ||||
| Equities: | ||||
| Consumer Discretionary | $112,657 | $111,671 | $-- | $986 |
| Consumer Staples | 11,657 | 11,657 | -- | -- |
| Energy | 23,295 | 17,079 | 4,174 | 2,042 |
| Financials | 31,247 | 31,247 | -- | -- |
| Health Care | 36,109 | 23,196 | 12,593 | 320 |
| Industrials | 39,399 | 38,877 | -- | 522 |
| Information Technology | 79,854 | 79,854 | -- | -- |
| Materials | 34,726 | 34,726 | -- | -- |
| Real Estate | 4,399 | 4,399 | -- | -- |
| Telecommunication Services | 1,152 | 1,152 | -- | -- |
| Utilities | 11,422 | 11,422 | -- | -- |
| Corporate Bonds | 1,307,684 | -- | 1,307,683 | 1 |
| Bank Loan Obligations | 55,692 | -- | 54,411 | 1,281 |
| Preferred Securities | 52,156 | -- | 52,156 | -- |
| Money Market Funds | 59,325 | 59,325 | -- | -- |
| Total Investments in Securities: | $1,860,774 | $424,605 | $1,431,017 | $5,152 |
Other Information
Distribution of investments by country or territory of incorporation, as a percentage of Total Net Assets, is as follows (Unaudited):
| United States of America | 80.1% |
| Canada | 4.2% |
| Luxembourg | 3.4% |
| Netherlands | 2.7% |
| France | 1.8% |
| Cayman Islands | 1.5% |
| United Kingdom | 1.4% |
| Ireland | 1.3% |
| Others (Individually Less Than 1%) | 3.6% |
| 100.0% |
See accompanying notes which are an integral part of the financial statements.
Financial Statements
Statement of Assets and Liabilities
| Amounts in thousands (except per-share amounts) | April 30, 2017 (Unaudited) | |
| Assets | ||
| Investment in securities, at value (including securities loaned of $5,087) — See accompanying schedule: Unaffiliated issuers (cost $1,728,194) | $1,801,449 | |
| Fidelity Central Funds (cost $59,327) | 59,325 | |
| Total Investments (cost $1,787,521) | $1,860,774 | |
| Cash | 7 | |
| Receivable for investments sold | ||
| Regular delivery | 18,660 | |
| Delayed delivery | 1,247 | |
| Receivable for fund shares sold | 1,270 | |
| Dividends receivable | 335 | |
| Interest receivable | 25,270 | |
| Distributions receivable from Fidelity Central Funds | 41 | |
| Prepaid expenses | 1 | |
| Other receivables | 63 | |
| Total assets | 1,907,668 | |
| Liabilities | ||
| Payable for investments purchased | ||
| Regular delivery | $8,716 | |
| Delayed delivery | 2,720 | |
| Payable for fund shares redeemed | 3,603 | |
| Distributions payable | 645 | |
| Accrued management fee | 875 | |
| Distribution and service plan fees payable | 330 | |
| Other affiliated payables | 297 | |
| Other payables and accrued expenses | 100 | |
| Collateral on securities loaned | 5,196 | |
| Total liabilities | 22,482 | |
| Net Assets | $1,885,186 | |
| Net Assets consist of: | ||
| Paid in capital | $2,249,629 | |
| Undistributed net investment income | 15,035 | |
| Accumulated undistributed net realized gain (loss) on investments and foreign currency transactions | (452,730) | |
| Net unrealized appreciation (depreciation) on investments and assets and liabilities in foreign currencies | 73,252 | |
| Net Assets | $1,885,186 | |
| Calculation of Maximum Offering Price | ||
| Class A: | ||
| Net Asset Value and redemption price per share ($537,069 ÷ 48,313 shares) | $11.12 | |
| Maximum offering price per share (100/96.00 of $11.12) | $11.58 | |
| Class M: | ||
| Net Asset Value and redemption price per share ($401,285 ÷ 35,899 shares) | $11.18 | |
| Maximum offering price per share (100/96.00 of $11.18) | $11.65 | |
| Class C: | ||
| Net Asset Value and offering price per share ($163,490 ÷ 14,733 shares)(a) | $11.10 | |
| Class I: | ||
| Net Asset Value, offering price and redemption price per share ($783,342 ÷ 75,127 shares) | $10.43 |
(a) Redemption price per share is equal to net asset value less any applicable contingent deferred sales charge.
See accompanying notes which are an integral part of the financial statements.
Statement of Operations
| Amounts in thousands | Six months ended April 30, 2017 (Unaudited) | |
| Investment Income | ||
| Dividends | $5,650 | |
| Interest | 48,836 | |
| Income from Fidelity Central Funds | 184 | |
| Total income | 54,670 | |
| Expenses | ||
| Management fee | $5,295 | |
| Transfer agent fees | 1,490 | |
| Distribution and service plan fees | 2,050 | |
| Accounting and security lending fees | 314 | |
| Custodian fees and expenses | 20 | |
| Independent trustees' fees and expenses | 4 | |
| Registration fees | 55 | |
| Audit | 46 | |
| Legal | 77 | |
| Miscellaneous | 8 | |
| Total expenses before reductions | 9,359 | |
| Expense reductions | (32) | 9,327 |
| Net investment income (loss) | 45,343 | |
| Realized and Unrealized Gain (Loss) | ||
| Net realized gain (loss) on: | ||
| Investment securities: | ||
| Unaffiliated issuers | 3,043 | |
| Fidelity Central Funds | (4) | |
| Total net realized gain (loss) | 3,039 | |
| Change in net unrealized appreciation (depreciation) on: Investment securities | 93,680 | |
| Assets and liabilities in foreign currencies | (1) | |
| Total change in net unrealized appreciation (depreciation) | 93,679 | |
| Net gain (loss) | 96,718 | |
| Net increase (decrease) in net assets resulting from operations | $142,061 |
See accompanying notes which are an integral part of the financial statements.
Statement of Changes in Net Assets
| Amounts in thousands | Six months ended April 30, 2017 (Unaudited) | Year ended October 31, 2016 |
| Increase (Decrease) in Net Assets | ||
| Operations | ||
| Net investment income (loss) | $45,343 | $93,756 |
| Net realized gain (loss) | 3,039 | 3,667 |
| Change in net unrealized appreciation (depreciation) | 93,679 | 14,257 |
| Net increase (decrease) in net assets resulting from operations | 142,061 | 111,680 |
| Distributions to shareholders from net investment income | (46,057) | (90,997) |
| Total distributions | (46,057) | (90,997) |
| Share transactions - net increase (decrease) | (131,094) | (118,006) |
| Redemption fees | 88 | 208 |
| Total increase (decrease) in net assets | (35,002) | (97,115) |
| Net Assets | ||
| Beginning of period | 1,920,188 | 2,017,303 |
| End of period | $1,885,186 | $1,920,188 |
| Other Information | ||
| Undistributed net investment income end of period | $15,035 | $15,749 |
See accompanying notes which are an integral part of the financial statements.
Financial Highlights — Fidelity Advisor High Income Advantage Fund Class A
| Six months ended (Unaudited) April 30, | Years ended October 31, | |||||
| 2017 | 2016 | 2015 | 2014 | 2013 | 2012 | |
| Selected Per–Share Data | ||||||
| Net asset value, beginning of period | $10.57 | $10.43 | $10.88 | $10.73 | $10.21 | $9.59 |
| Income from Investment Operations | ||||||
| Net investment income (loss)A | .258 | .501 | .498 | .480 | .569 | .607 |
| Net realized and unrealized gain (loss) | .552 | .123 | (.489) | .236 | .558 | .658 |
| Total from investment operations | .810 | .624 | .009 | .716 | 1.127 | 1.265 |
| Distributions from net investment income | (.261) | (.485) | (.451) | (.449) | (.482) | (.647) |
| Distributions from net realized gain | – | – | (.010) | (.118) | (.127) | – |
| Total distributions | (.261) | (.485) | (.461) | (.567) | (.609) | (.647) |
| Redemption fees added to paid in capitalA | .001 | .001 | .002 | .001 | .002 | .002 |
| Net asset value, end of period | $11.12 | $10.57 | $10.43 | $10.88 | $10.73 | $10.21 |
| Total ReturnB,C,D | 7.76% | 6.30% | .06% | 6.84% | 11.39% | 13.78% |
| Ratios to Average Net AssetsE,F | ||||||
| Expenses before reductions | 1.03%G | 1.04% | 1.02% | 1.02% | 1.02% | 1.03% |
| Expenses net of fee waivers, if any | 1.03%G | 1.03% | 1.02% | 1.02% | 1.02% | 1.03% |
| Expenses net of all reductions | 1.03%G | 1.03% | 1.02% | 1.02% | 1.02% | 1.03% |
| Net investment income (loss) | 4.80%G | 4.94% | 4.62% | 4.42% | 5.42% | 6.18% |
| Supplemental Data | ||||||
| Net assets, end of period (in millions) | $537 | $593 | $636 | $682 | $698 | $705 |
| Portfolio turnover rateH | 52%G | 46% | 42% | 41% | 66% | 66% |
A Calculated based on average shares outstanding during the period.
B Total returns for periods of less than one year are not annualized.
C Total returns would have been lower if certain expenses had not been reduced during the applicable periods shown.
D Total returns do not include the effect of the sales charges.
E Fees and expenses of any underlying Fidelity Central Funds are not included in the Fund's expense ratio. The Fund indirectly bears its proportionate share of the expenses of any underlying Fidelity Central Funds.
F Expense ratios reflect operating expenses of the class. Expenses before reductions do not reflect amounts reimbursed by the investment adviser or reductions from brokerage service arrangements or reductions from other expense offset arrangements and do not represent the amount paid by the class during periods when reimbursements or reductions occur. Expenses net of fee waivers reflect expenses after reimbursement by the investment adviser but prior to reductions from brokerage service arrangements or other expense offset arrangements. Expenses net of all reductions represent the net expenses paid by the class.
G Annualized
H Amount does not include the portfolio activity of any underlying Fidelity Central Funds.
See accompanying notes which are an integral part of the financial statements.
Financial Highlights — Fidelity Advisor High Income Advantage Fund Class M
| Six months ended (Unaudited) April 30, | Years ended October 31, | |||||
| 2017 | 2016 | 2015 | 2014 | 2013 | 2012 | |
| Selected Per–Share Data | ||||||
| Net asset value, beginning of period | $10.63 | $10.49 | $10.93 | $10.78 | $10.26 | $9.64 |
| Income from Investment Operations | ||||||
| Net investment income (loss)A | .260 | .505 | .501 | .484 | .573 | .610 |
| Net realized and unrealized gain (loss) | .552 | .123 | (.479) | .233 | .555 | .656 |
| Total from investment operations | .812 | .628 | .022 | .717 | 1.128 | 1.266 |
| Distributions from net investment income | (.263) | (.489) | (.454) | (.450) | (.483) | (.648) |
| Distributions from net realized gain | – | – | (.010) | (.118) | (.127) | – |
| Total distributions | (.263) | (.489) | (.464) | (.568) | (.610) | (.648) |
| Redemption fees added to paid in capitalA | .001 | .001 | .002 | .001 | .002 | .002 |
| Net asset value, end of period | $11.18 | $10.63 | $10.49 | $10.93 | $10.78 | $10.26 |
| Total ReturnB,C,D | 7.73% | 6.30% | .18% | 6.81% | 11.34% | 13.72% |
| Ratios to Average Net AssetsE,F | ||||||
| Expenses before reductions | 1.02%G | 1.03% | 1.02% | 1.01% | 1.01% | 1.02% |
| Expenses net of fee waivers, if any | 1.02%G | 1.03% | 1.02% | 1.01% | 1.01% | 1.02% |
| Expenses net of all reductions | 1.02%G | 1.03% | 1.02% | 1.01% | 1.01% | 1.02% |
| Net investment income (loss) | 4.80%G | 4.95% | 4.63% | 4.43% | 5.43% | 6.19% |
| Supplemental Data | ||||||
| Net assets, end of period (in millions) | $401 | $409 | $445 | $504 | $528 | $547 |
| Portfolio turnover rateH | 52%G | 46% | 42% | 41% | 66% | 66% |
A Calculated based on average shares outstanding during the period.
B Total returns for periods of less than one year are not annualized.
C Total returns would have been lower if certain expenses had not been reduced during the applicable periods shown.
D Total returns do not include the effect of the sales charges.
E Fees and expenses of any underlying Fidelity Central Funds are not included in the Fund's expense ratio. The Fund indirectly bears its proportionate share of the expenses of any underlying Fidelity Central Funds.
F Expense ratios reflect operating expenses of the class. Expenses before reductions do not reflect amounts reimbursed by the investment adviser or reductions from brokerage service arrangements or reductions from other expense offset arrangements and do not represent the amount paid by the class during periods when reimbursements or reductions occur. Expenses net of fee waivers reflect expenses after reimbursement by the investment adviser but prior to reductions from brokerage service arrangements or other expense offset arrangements. Expenses net of all reductions represent the net expenses paid by the class.
G Annualized
H Amount does not include the portfolio activity of any underlying Fidelity Central Funds.
See accompanying notes which are an integral part of the financial statements.
Financial Highlights — Fidelity Advisor High Income Advantage Fund Class C
| Six months ended (Unaudited) April 30, | Years ended October 31, | |||||
| 2017 | 2016 | 2015 | 2014 | 2013 | 2012 | |
| Selected Per–Share Data | ||||||
| Net asset value, beginning of period | $10.55 | $10.41 | $10.86 | $10.71 | $10.19 | $9.58 |
| Income from Investment Operations | ||||||
| Net investment income (loss)A | .217 | .424 | .415 | .398 | .489 | .533 |
| Net realized and unrealized gain (loss) | .552 | .122 | (.488) | .237 | .560 | .649 |
| Total from investment operations | .769 | .546 | (.073) | .635 | 1.049 | 1.182 |
| Distributions from net investment income | (.220) | (.407) | (.369) | (.368) | (.404) | (.574) |
| Distributions from net realized gain | – | – | (.010) | (.118) | (.127) | – |
| Total distributions | (.220) | (.407) | (.379) | (.486) | (.531) | (.574) |
| Redemption fees added to paid in capitalA | .001 | .001 | .002 | .001 | .002 | .002 |
| Net asset value, end of period | $11.10 | $10.55 | $10.41 | $10.86 | $10.71 | $10.19 |
| Total ReturnB,C,D | 7.36% | 5.51% | (.70)% | 6.05% | 10.58% | 12.85% |
| Ratios to Average Net AssetsE,F | ||||||
| Expenses before reductions | 1.80%G | 1.79% | 1.78% | 1.77% | 1.77% | 1.78% |
| Expenses net of fee waivers, if any | 1.79%G | 1.79% | 1.78% | 1.77% | 1.77% | 1.78% |
| Expenses net of all reductions | 1.79%G | 1.79% | 1.78% | 1.77% | 1.77% | 1.77% |
| Net investment income (loss) | 4.03%G | 4.18% | 3.86% | 3.67% | 4.67% | 5.44% |
| Supplemental Data | ||||||
| Net assets, end of period (in millions) | $163 | $163 | $171 | $182 | $183 | $180 |
| Portfolio turnover rateH | 52%G | 46% | 42% | 41% | 66% | 66% |
A Calculated based on average shares outstanding during the period.
B Total returns for periods of less than one year are not annualized.
C Total returns would have been lower if certain expenses had not been reduced during the applicable periods shown.
D Total returns do not include the effect of the contingent deferred sales charge.
E Fees and expenses of any underlying Fidelity Central Funds are not included in the Fund's expense ratio. The Fund indirectly bears its proportionate share of the expenses of any underlying Fidelity Central Funds.
F Expense ratios reflect operating expenses of the class. Expenses before reductions do not reflect amounts reimbursed by the investment adviser or reductions from brokerage service arrangements or reductions from other expense offset arrangements and do not represent the amount paid by the class during periods when reimbursements or reductions occur. Expenses net of fee waivers reflect expenses after reimbursement by the investment adviser but prior to reductions from brokerage service arrangements or other expense offset arrangements. Expenses net of all reductions represent the net expenses paid by the class.
G Annualized
H Amount does not include the portfolio activity of any underlying Fidelity Central Funds.
See accompanying notes which are an integral part of the financial statements.
Financial Highlights — Fidelity Advisor High Income Advantage Fund Class I
| Six months ended (Unaudited) April 30, | Years ended October 31, | |||||
| 2017 | 2016 | 2015 | 2014 | 2013 | 2012 | |
| Selected Per–Share Data | ||||||
| Net asset value, beginning of period | $9.91 | $9.78 | $10.20 | $10.10 | $9.65 | $9.10 |
| Income from Investment Operations | ||||||
| Net investment income (loss)A | .254 | .493 | .488 | .474 | .561 | .598 |
| Net realized and unrealized gain (loss) | .524 | .113 | (.455) | .216 | .524 | .623 |
| Total from investment operations | .778 | .606 | .033 | .690 | 1.085 | 1.221 |
| Distributions from net investment income | (.258) | (.477) | (.445) | (.473) | (.510) | (.673) |
| Distributions from net realized gain | – | – | (.010) | (.118) | (.127) | – |
| Total distributions | (.258) | (.477) | (.455) | (.591) | (.637) | (.673) |
| Redemption fees added to paid in capitalA | –B | .001 | .002 | .001 | .002 | .002 |
| Net asset value, end of period | $10.43 | $9.91 | $9.78 | $10.20 | $10.10 | $9.65 |
| Total ReturnC,D | 7.94% | 6.54% | .31% | 7.02% | 11.63% | 14.07% |
| Ratios to Average Net AssetsE,F | ||||||
| Expenses before reductions | .78%G | .80% | .80% | .78% | .77% | .78% |
| Expenses net of fee waivers, if any | .78%G | .80% | .80% | .78% | .77% | .78% |
| Expenses net of all reductions | .78%G | .80% | .80% | .78% | .77% | .78% |
| Net investment income (loss) | 5.04%G | 5.17% | 4.84% | 4.66% | 5.68% | 6.44% |
| Supplemental Data | ||||||
| Net assets, end of period (in millions) | $783 | $755 | $760 | $658 | $497 | $495 |
| Portfolio turnover rateH | 52%G | 46% | 42% | 41% | 66% | 66% |
A Calculated based on average shares outstanding during the period.
B Amount represents less than $.0005 per share.
C Total returns for periods of less than one year are not annualized.
D Total returns would have been lower if certain expenses had not been reduced during the applicable periods shown.
E Fees and expenses of any underlying Fidelity Central Funds are not included in the Fund's expense ratio. The Fund indirectly bears its proportionate share of the expenses of any underlying Fidelity Central Funds.
F Expense ratios reflect operating expenses of the class. Expenses before reductions do not reflect amounts reimbursed by the investment adviser or reductions from brokerage service arrangements or reductions from other expense offset arrangements and do not represent the amount paid by the class during periods when reimbursements or reductions occur. Expenses net of fee waivers reflect expenses after reimbursement by the investment adviser but prior to reductions from brokerage service arrangements or other expense offset arrangements. Expenses net of all reductions represent the net expenses paid by the class.
G Annualized
H Amount does not include the portfolio activity of any underlying Fidelity Central Funds.
See accompanying notes which are an integral part of the financial statements.
Notes to Financial Statements (Unaudited)
For the period ended April 30, 2017
(Amounts in thousands except percentages)
1. Organization.
Fidelity Advisor High Income Advantage Fund (the Fund) is a fund of Fidelity Advisor Series I (the Trust) and is authorized to issue an unlimited number of shares. The Trust is registered under the Investment Company Act of 1940, as amended (the 1940 Act), as an open-end management investment company organized as a Massachusetts business trust. The Fund offers Class A, Class M (formerly Class T), Class C, and Class I shares, each of which has equal rights as to assets and voting privileges. Each class has exclusive voting rights with respect to matters that affect that class.
After the close of business on June 24, 2016, all outstanding Class B shares were converted to Class A shares. All prior fiscal period dollar and share amounts for Class B presented in the Notes to Financial Statements are for the period November 1, 2015 through June 24, 2016.
2. Investments in Fidelity Central Funds.
The Fund invests in Fidelity Central Funds, which are open-end investment companies generally available only to other investment companies and accounts managed by the investment adviser and its affiliates. The Fund's Schedule of Investments lists each of the Fidelity Central Funds held as of period end, if any, as an investment of the Fund, but does not include the underlying holdings of each Fidelity Central Fund. As an Investing Fund, the Fund indirectly bears its proportionate share of the expenses of the underlying Fidelity Central Funds.
The Money Market Central Funds seek preservation of capital and current income and are managed by Fidelity Investments Money Management, Inc. (FIMM), an affiliate of the investment adviser. Annualized expenses of the Money Market Central Funds as of their most recent shareholder report date are less than .005%.
A complete unaudited list of holdings for each Fidelity Central Fund is available upon request or at the Securities and Exchange Commission (the SEC) website at www.sec.gov. In addition, the financial statements of the Fidelity Central Funds are available on the SEC website or upon request.
3. Significant Accounting Policies.
The Fund is an investment company and applies the accounting and reporting guidance of the Financial Accounting Standards Board (FASB) Accounting Standards Codification Topic 946 Financial Services – Investments Companies. The financial statements have been prepared in conformity with accounting principles generally accepted in the United States of America (GAAP), which require management to make certain estimates and assumptions at the date of the financial statements. Actual results could differ from those estimates. Subsequent events, if any, through the date that the financial statements were issued have been evaluated in the preparation of the financial statements. The following summarizes the significant accounting policies of the Fund:
Investment Valuation. Investments are valued as of 4:00 p.m. Eastern time on the last calendar day of the period. The Board of Trustees (the Board) has delegated the day to day responsibility for the valuation of the Fund's investments to the Fair Value Committee (the Committee) established by the Fund's investment adviser. In accordance with valuation policies and procedures approved by the Board, the Fund attempts to obtain prices from one or more third party pricing vendors or brokers to value its investments. When current market prices, quotations or currency exchange rates are not readily available or reliable, investments will be fair valued in good faith by the Committee, in accordance with procedures adopted by the Board. Factors used in determining fair value vary by investment type and may include market or investment specific events, changes in interest rates and credit quality. The frequency with which these procedures are used cannot be predicted and they may be utilized to a significant extent. The Committee oversees the Fund's valuation policies and procedures and reports to the Board on the Committee's activities and fair value determinations. The Board monitors the appropriateness of the procedures used in valuing the Fund's investments and ratifies the fair value determinations of the Committee.
The Fund categorizes the inputs to valuation techniques used to value its investments into a disclosure hierarchy consisting of three levels as shown below:
- Level 1 – quoted prices in active markets for identical investments
- Level 2 – other significant observable inputs (including quoted prices for similar investments, interest rates, prepayment speeds, etc.)
- Level 3 – unobservable inputs (including the Fund's own assumptions based on the best information available)
Valuation techniques used to value the Fund's investments by major category are as follows:
Debt securities, including restricted securities, are valued based on evaluated prices received from third party pricing vendors or from brokers who make markets in such securities. Corporate bonds, bank loan obligations and preferred securities are valued by pricing vendors who utilize matrix pricing which considers yield or price of bonds of comparable quality, coupon, maturity and type or by broker-supplied prices. When independent prices are unavailable or unreliable, debt securities may be valued utilizing pricing methodologies which consider similar factors that would be used by third party pricing vendors. Debt securities are generally categorized as Level 2 in the hierarchy but may be Level 3 depending on the circumstances. The Fund invests a significant portion of its assets in below investment grade securities. The value of these securities can be more volatile due to changes in the credit quality of the issuer and is sensitive to changes in economic, market and regulatory conditions.
Equity securities, including restricted securities, for which market quotations are readily available, are valued at the last reported sale price or official closing price as reported by a third party pricing vendor on the primary market or exchange on which they are traded and are categorized as Level 1 in the hierarchy. In the event there were no sales during the day or closing prices are not available, securities are valued at the last quoted bid price or may be valued using the last available price and are generally categorized as Level 2 in the hierarchy. For foreign equity securities, when market or security specific events arise, comparisons to the valuation of American Depositary Receipts (ADRs), futures contracts, Exchange-Traded Funds (ETFs) and certain indexes as well as quoted prices for similar securities may be used and would be categorized as Level 2 in the hierarchy. Utilizing these techniques may result in transfers between Level 1 and Level 2. For equity securities, including restricted securities, where observable inputs are limited, assumptions about market activity and risk are used and these securities may be categorized as Level 3 in the hierarchy.
Investments in open-end mutual funds, including the Fidelity Central Funds, are valued at their closing net asset value (NAV) each business day and are categorized as Level 1 in the hierarchy.
Changes in valuation techniques may result in transfers in or out of an assigned level within the disclosure hierarchy. The aggregate value of investments by input level as of April 30, 2017 is included at the end of the Fund's Schedule of Investments.
Foreign Currency. The Fund may use foreign currency contracts to facilitate transactions in foreign-denominated securities. Gains and losses from these transactions may arise from changes in the value of the foreign currency or if the counterparties do not perform under the contracts' terms.
Foreign-denominated assets, including investment securities, and liabilities are translated into U.S. dollars at the exchange rates at period end. Purchases and sales of investment securities, income and dividends received and expenses denominated in foreign currencies are translated into U.S. dollars at the exchange rate in effect on the transaction date.
The effects of exchange rate fluctuations on investments are included with the net realized and unrealized gain (loss) on investment securities. Other foreign currency transactions resulting in realized and unrealized gain (loss) are disclosed separately.
Investment Transactions and Income. For financial reporting purposes, the Fund's investment holdings and NAV include trades executed through the end of the last business day of the period. The NAV per share for processing shareholder transactions is calculated as of the close of business of the New York Stock Exchange (NYSE), normally 4:00 p.m. Eastern time and includes trades executed through the end of the prior business day. Gains and losses on securities sold are determined on the basis of identified cost and may include proceeds received from litigation. Dividend income is recorded on the ex-dividend date, except for certain dividends from foreign securities where the ex-dividend date may have passed, which are recorded as soon as the Fund is informed of the ex-dividend date. Non-cash dividends included in dividend income, if any, are recorded at the fair market value of the securities received. Income and capital gain distributions from Fidelity Central Funds, if any, are recorded on the ex-dividend date. Certain distributions received by the Fund represent a return of capital or capital gain. The Fund determines the components of these distributions subsequent to the ex-dividend date, based upon receipt of tax filings or other correspondence relating to the underlying investment. These distributions are recorded as a reduction of cost of investments and/or as a realized gain. Interest income is accrued as earned and includes coupon interest and amortization of premium and accretion of discount on debt securities as applicable. Investment income is recorded net of foreign taxes withheld where recovery of such taxes is uncertain. Debt obligations may be placed on non-accrual status and related interest income may be reduced by ceasing current accruals and writing off interest receivables when the collection of all or a portion of interest has become doubtful based on consistently applied procedures. A debt obligation is removed from non-accrual status when the issuer resumes interest payments or when collectability of interest is reasonably assured.
Class Allocations and Expenses. Investment income, realized and unrealized capital gains and losses, common expenses of the Fund, and certain fund-level expense reductions, if any, are allocated daily on a pro-rata basis to each class based on the relative net assets of each class to the total net assets of the Fund. Each class differs with respect to transfer agent and distribution and service plan fees incurred. Certain expense reductions may also differ by class. For the reporting period, the allocated portion of income and expenses to each class as a percent of its average net assets may vary due to the timing of recording these transactions in relation to fluctuating net assets of the classes. Expenses directly attributable to a fund are charged to that fund. Expenses attributable to more than one fund are allocated among the respective funds on the basis of relative net assets or other appropriate methods. Expense estimates are accrued in the period to which they relate and adjustments are made when actual amounts are known.
Deferred Trustee Compensation. Under a Deferred Compensation Plan (the Plan), independent Trustees may elect to defer receipt of a portion of their annual compensation. Deferred amounts are invested in a cross-section of Fidelity funds, are marked-to-market and remain in the Fund until distributed in accordance with the Plan. The investment of deferred amounts and the offsetting payable to the Trustees are included in the accompanying Statement of Assets and Liabilities.
Income Tax Information and Distributions to Shareholders. Each year, the Fund intends to qualify as a regulated investment company under Subchapter M of the Internal Revenue Code, including distributing substantially all of its taxable income and realized gains. As a result, no provision for U.S. Federal income taxes is required. The Fund files a U.S. federal tax return, in addition to state and local tax returns as required. The Fund's federal income tax returns are subject to examination by the Internal Revenue Service (IRS) for a period of three fiscal years after they are filed. State and local tax returns may be subject to examination for an additional fiscal year depending on the jurisdiction. Foreign taxes are provided for based on the Fund's understanding of the tax rules and rates that exist in the foreign markets in which it invests.
Dividends are declared and recorded daily and paid monthly from net investment income. Distributions from realized gains, if any, are declared and recorded on the ex-dividend date. Income dividends and capital gain distributions are declared separately for each class. Income and capital gain distributions are determined in accordance with income tax regulations, which may differ from GAAP.
Capital accounts within the financial statements are adjusted for permanent book-tax differences. These adjustments have no impact on net assets or the results of operations. Capital accounts are not adjusted for temporary book-tax differences which will reverse in a subsequent period.
Book-tax differences are primarily due to equity-debt classifications, market discount, partnerships, deferred trustees compensation, capital loss carryforwards and losses deferred due to wash sales.
The federal tax cost of investment securities and unrealized appreciation (depreciation) as of period end were as follows:
| Gross unrealized appreciation | $171,311 |
| Gross unrealized depreciation | (88,988) |
| Net unrealized appreciation (depreciation) on securities | $82,323 |
| Tax cost | $1,778,451 |
Capital loss carryforwards are only available to offset future capital gains of the Fund to the extent provided by regulations and may be limited. Under the Regulated Investment Company Modernization Act of 2010 (the Act), the Fund is permitted to carry forward capital losses incurred in taxable years beginning after December 22, 2010 for an unlimited period and such capital losses are required to be used prior to any losses that expire. The capital loss carryforward information presented below, including any applicable limitation, is estimated as of prior fiscal period end and is subject to adjustment.
| Fiscal year of expiration | |
| 2017 | $(455,851) |
Short-Term Trading (Redemption) Fees. Shares held by investors in the Fund less than 90 days may have been subject to a redemption fee equal to 1.00% of the NAV of shares redeemed. All redemption fees, which reduce the proceeds of the shareholder redemption, are retained by the Fund and accounted for as an addition to paid in capital.
Delayed Delivery Transactions and When-Issued Securities. During the period, the Fund transacted in securities on a delayed delivery or when-issued basis. Payment and delivery may take place after the customary settlement period for that security. The price of the underlying securities and the date when the securities will be delivered and paid for are fixed at the time the transaction is negotiated. The securities purchased on a delayed delivery or when-issued basis are identified as such in the Fund's Schedule of Investments. The Fund may receive compensation for interest forgone in the purchase of a delayed delivery or when-issued security. With respect to purchase commitments, the Fund identifies securities as segregated in its records with a value at least equal to the amount of the commitment. Losses may arise due to changes in the value of the underlying securities or if the counterparty does not perform under the contract's terms, or if the issuer does not issue the securities due to political, economic, or other factors.
Restricted Securities. The Fund may invest in securities that are subject to legal or contractual restrictions on resale. These securities generally may be resold in transactions exempt from registration or to the public if the securities are registered. Disposal of these securities may involve time-consuming negotiations and expense, and prompt sale at an acceptable price may be difficult. Information regarding restricted securities is included at the end of the Fund's Schedule of Investments.
Loans and Other Direct Debt Instruments. The Fund invests in direct debt instruments which are interests in amounts owed to lenders by corporate or other borrowers. These instruments may be in the form of loans, trade claims or other receivables and may include standby financing commitments such as revolving credit facilities that obligate the Fund to supply additional cash to the borrower on demand. Loans may be acquired through assignment or participation, or may be made directly to a borrower. The Fund did not have any unfunded loan commitments, which are contractual obligations for future funding, at period end.
New Accounting Pronouncement. In March 2017, the Financial Accounting Standards Board (FASB) issued an Accounting Standards Update (ASU), ASU 2017-08, which amends the amortization period for certain callable debt securities that are held at a premium. The amendment requires the premium to be amortized to the earliest call date. The amendments do not require an accounting change for securities held at a discount. The ASU is effective for annual periods beginning after December 15, 2019. Management is currently evaluating the potential impact of these changes to the financial statements.
4. Purchases and Sales of Investments.
Purchases and sales of securities, other than short-term securities, aggregated $469,291 and $628,259, respectively.
5. Fees and Other Transactions with Affiliates.
Management Fee. Fidelity Management & Research Company (the investment adviser) and its affiliates provide the Fund with investment management related services for which the Fund pays a monthly management fee. The management fee is the sum of an individual fund fee rate that is based on an annual rate of .45% of the Fund's average net assets and an annualized group fee rate that averaged .11% during the period. The group fee rate is based upon the average net assets of all the mutual funds advised by the investment adviser, including any mutual funds previously advised by the investment adviser that are currently advised by Fidelity SelectCo, LLC, an affiliate of the investment adviser. The group fee rate decreases as assets under management increase and increases as assets under management decrease. For the reporting period, the total annualized management fee rate was .56% of the Fund's average net assets.
Distribution and Service Plan Fees. In accordance with Rule 12b-1 of the 1940 Act, the Fund has adopted separate Distribution and Service Plans for each class of shares. Certain classes pay Fidelity Distributors Corporation (FDC), an affiliate of the investment adviser, separate Distribution and Service Fees, each of which is based on an annual percentage of each class' average net assets. In addition, FDC may pay financial intermediaries for selling shares of the Fund and providing shareholder support services. For the period, the Distribution and Service Fee rates, total fees and amounts retained by FDC were as follows:
| Distribution Fee | Service Fee | Total Fees | Retained by FDC |
|
| Class A | -% | .25% | $722 | $4 |
| Class M | -% | .25% | 508 | –(a) |
| Class C | .75% | .25% | 820 | 66 |
| $2,050 | $70 |
(a) In the amount of less than five hundred dollars.
Sales Load. FDC may receive a front-end sales charge of up to 4.00% for selling Class A shares and Class M shares, some of which is paid to financial intermediaries for selling shares of the Fund. Depending on the holding period, FDC may receive contingent deferred sales charges levied on Class A, Class M, and Class C redemptions. The deferred sales charges are 1.00% for Class C shares, 1.00% for certain purchases of Class A shares and .25% for certain purchases of Class M shares.
For the period, sales charge amounts retained by FDC were as follows:
| Retained by FDC |
|
| Class A | $18 |
| Class M | 5 |
| Class C(a) | 4 |
| $27 |
(a) When Class C shares are initially sold, FDC pays commissions from its own resources to financial intermediaries through which the sales are made.
Transfer Agent Fees. Fidelity Investments Institutional Operations Company, Inc., (FIIOC), an affiliate of the investment adviser, is the transfer, dividend disbursing and shareholder servicing agent for each class of the Fund. FIIOC receives account fees and asset-based fees that vary according to the account size and type of account of the shareholders of the respective classes of the Fund. FIIOC pays for typesetting, printing and mailing of shareholder reports, except proxy statements.
For the period, transfer agent fees for each class were as follows:
| Amount | % of Class-Level Average Net Assets(a) |
|
| Class A | $452 | .16 |
| Class M | 304 | .15 |
| Class C | 136 | .17 |
| Class I | 598 | .16 |
| $1,490 |
(a) Annualized
Accounting and Security Lending Fees. Fidelity Service Company, Inc. (FSC), an affiliate of the investment adviser, maintains the Fund's accounting records. The accounting fee is based on the level of average net assets for each month. Under a separate contract, FSC administers the security lending program. The security lending fee is based on the number and duration of lending transactions.
Brokerage Commissions. The Fund placed a portion of its portfolio transactions with brokerage firms which are affiliates of the investment adviser. Brokerage commissions are included in net realized gain (loss) and change in net unrealized appreciation (depreciation) in the Statement of Operations. The commissions paid to these affiliated firms were $6 for the period.
Interfund Trades. The Fund may purchase from or sell securities to other Fidelity Funds under procedures adopted by the Board. The procedures have been designed to ensure these interfund trades are executed in accordance with Rule 17a-7 of the 1940 Act. Interfund trades are included within the respective purchases and sales amounts shown in the Purchases and Sales of Investments note.
6. Committed Line of Credit.
The Fund participates with other funds managed by the investment adviser or an affiliate in a $4.25 billion credit facility (the "line of credit") to be utilized for temporary or emergency purposes to fund shareholder redemptions or for other short-term liquidity purposes. The Fund has agreed to pay commitment fees on its pro-rata portion of the line of credit, which amounted to $3 and is reflected in Miscellaneous expenses on the Statement of Operations. During the period, the Fund did not borrow on this line of credit.
7. Security Lending.
The Fund lends portfolio securities through a lending agent from time to time in order to earn additional income. For equity securities, a lending agent is used and may loan securities to certain qualified borrowers, including Fidelity Capital Markets (FCM), a broker-dealer affiliated with the Fund. On the settlement date of the loan, the Fund receives collateral (in the form of U.S. Treasury obligations, letters of credit and/or cash) against the loaned securities and maintains collateral in an amount not less than 100% of the market value of the loaned securities during the period of the loan. The market value of the loaned securities is determined at the close of business of the Fund and any additional required collateral is delivered to the Fund on the next business day. The Fund or borrower may terminate the loan at any time, and if the borrower defaults on its obligation to return the securities loaned because of insolvency or other reasons, the Fund may apply collateral received from the borrower against the obligation. The Fund may experience delays and costs in recovering the securities loaned. Any cash collateral received is invested in the Fidelity Securities Lending Cash Central Fund. The value of loaned securities and cash collateral at period end are disclosed on the Fund's Statement of Assets and Liabilities. Security lending income represents the income earned on investing cash collateral, less rebates paid to borrowers and any lending agent fees associated with the loan, plus any premium payments received for lending certain types of securities. Security lending income is presented in the Statement of Operations as a component of income from Fidelity Central Funds. Total security lending income during the period amounted to $11. During the period, there were no securities loaned to FCM.
8. Expense Reductions.
Commissions paid to certain brokers with whom the investment adviser, or its affiliates, places trades on behalf of the Fund include an amount in addition to trade execution, which may be rebated back to the Fund to offset certain expenses. This amount totaled $25 for the period.
In addition, through arrangements with the Fund's custodian, credits realized as a result of certain uninvested cash balances were used to reduce the Fund's expenses. During the period, these credits reduced the Fund's custody expenses by $1.
In addition, during the period the investment adviser reimbursed and/or waived a portion of fund-level operating expenses in the amount of $6.
9. Distributions to Shareholders.
Distributions to shareholders of each class were as follows:
| Six months ended April 30, 2017 | Year ended October 31, 2016 | |
| From net investment income | ||
| Class A | $14,001 | $28,391 |
| Class M | 9,828 | 19,580 |
| Class B | – | 118 |
| Class C | 3,332 | 6,453 |
| Class I | 18,896 | 36,455 |
| Total | $46,057 | $90,997 |
10. Share Transactions.
Share transactions for each class were as follows and may contain automatic conversions between classes or exchanges between affiliated funds:
| Shares | Shares | Dollars | Dollars | |
| Six months ended April 30, 2017 | Year ended October 31, 2016 | Six months ended April 30, 2017 | Year ended October 31, 2016 | |
| Class A | ||||
| Shares sold | 4,392 | 9,360 | $47,687 | $94,401 |
| Reinvestment of distributions | 1,173 | 2,518 | 12,737 | 25,499 |
| Shares redeemed | (13,400) | (16,751) | (147,019) | (168,555) |
| Net increase (decrease) | (7,835) | (4,873) | $(86,595) | $(48,655) |
| Class M | ||||
| Shares sold | 1,931 | 3,913 | $21,101 | $39,586 |
| Reinvestment of distributions | 827 | 1,744 | 9,037 | 17,764 |
| Shares redeemed | (5,316) | (9,602) | (58,251) | (97,166) |
| Net increase (decrease) | (2,558) | (3,945) | $(28,113) | $(39,816) |
| Class B | ||||
| Shares sold | – | 19 | $– | $187 |
| Reinvestment of distributions | – | 10 | – | 96 |
| Shares redeemed | – | (540) | – | (5,385) |
| Net increase (decrease) | – | (511) | $– | $(5,102) |
| Class C | ||||
| Shares sold | 1,020 | 2,518 | $11,028 | $25,316 |
| Reinvestment of distributions | 261 | 522 | 2,831 | 5,276 |
| Shares redeemed | (2,037) | (3,959) | (22,071) | (39,782) |
| Net increase (decrease) | (756) | (919) | $(8,212) | $(9,190) |
| Class I | ||||
| Shares sold | 17,460 | 23,291 | $180,003 | $220,365 |
| Reinvestment of distributions | 1,599 | 3,361 | 16,289 | 31,960 |
| Shares redeemed | (20,055) | (28,260) | (204,466) | (267,568) |
| Net increase (decrease) | (996) | (1,608) | $(8,174) | $(15,243) |
11. Other.
The Fund's organizational documents provide former and current trustees and officers with a limited indemnification against liabilities arising in connection with the performance of their duties to the Fund. In the normal course of business, the Fund may also enter into contracts that provide general indemnifications. The Fund's maximum exposure under these arrangements is unknown as this would be dependent on future claims that may be made against the Fund. The risk of material loss from such claims is considered remote.
12. Litigation.
The Fund, and other entities managed by FMR or its affiliates were named as defendants in a lawsuit filed in the United States Bankruptcy Court for the Southern District of New York in 2009. The lawsuit was brought by creditors of Motors Liquidation Company (f/k/a General Motors), which went through Chapter 11 bankruptcy proceedings in 2009, and is captioned Official Committee of Unsecured Creditors of Motors Liquidation Company v. JPMorgan Chase Bank, N.A., et al., Adversary No. 09-00504 (REG). The plaintiffs are seeking an order that the Fund and other defendants return proceeds received in 2009 in full payment of the principal and interest on General Motors secured debt. The plaintiffs contend that the Fund and the other defendants were not secured creditors at the time of the 2009 payments and, thus, were not entitled to payment in full. In January 2015, the Court of Appeals ruled that JPMorgan, as administrative agent for all of the debtholders, released the security interest on certain collateral securing the debt prior to the 2009 payments. A decision is pending in a trial intended to help determine the value of any remaining, unreleased collateral. At this time, Management cannot determine the amount of loss that may be realized, but expects the amount to be less than the $5,769 received in 2009. The Fund is also incurring legal costs in defending the case.
Shareholder Expense Example
As a shareholder of the Fund, you incur two types of costs: (1) transaction costs, including sales charges (loads) on purchase payments or redemption proceeds, redemption fees and (2) ongoing costs, including management fees, distribution and/or service (12b-1) fees and other Fund expenses. This Example is intended to help you understand your ongoing costs (in dollars) of investing in the Fund and to compare these costs with the ongoing costs of investing in other mutual funds.
The Example is based on an investment of $1,000 invested at the beginning of the period and held for the entire period (November 1, 2016 to April 30, 2017).
Actual Expenses
The first line of the accompanying table for each class of the Fund provides information about actual account values and actual expenses. You may use the information in this line, together with the amount you invested, to estimate the expenses that you paid over the period. Simply divide your account value by $1,000.00 (for example, an $8,600 account value divided by $1,000.00 = 8.6), then multiply the result by the number in the first line for a class of the Fund under the heading entitled "Expenses Paid During Period" to estimate the expenses you paid on your account during this period. In addition, the Fund, as a shareholder in the underlying Fidelity Central Funds, will indirectly bear its pro-rata share of the fees and expenses incurred by the underlying Fidelity Central Funds. These fees and expenses are not included in the Fund's annualized expense ratio used to calculate the expense estimate in the table below.
Hypothetical Example for Comparison Purposes
The second line of the accompanying table for each class of the Fund provides information about hypothetical account values and hypothetical expenses based on a Class' actual expense ratio and an assumed rate of return of 5% per year before expenses, which is not the Class' actual return. The hypothetical account values and expenses may not be used to estimate the actual ending account balance or expenses you paid for the period. You may use this information to compare the ongoing costs of investing in the Fund and other funds. To do so, compare this 5% hypothetical example with the 5% hypothetical examples that appear in the shareholder reports of the other funds. In addition, the Fund, as a shareholder in the underlying Fidelity Central Funds, will indirectly bear its pro-rata share of the fees and expenses incurred by the underlying Fidelity Central Funds. These fees and expenses are not included in the Fund's annualized expense ratio used to calculate the expense estimate in the table below.
Please note that the expenses shown in the table are meant to highlight your ongoing costs only and do not reflect any transaction costs. Therefore, the second line of the table is useful in comparing ongoing costs only, and will not help you determine the relative total costs of owning different funds. In addition, if these transactional costs were included, your costs would have been higher.
| Annualized Expense Ratio-A | Beginning Account Value November 1, 2016 | Ending Account Value April 30, 2017 | Expenses Paid During Period-B November 1, 2016 to April 30, 2017 |
|
| Class A | 1.03% | |||
| Actual | $1,000.00 | $1,077.60 | $5.31 | |
| Hypothetical-C | $1,000.00 | $1,019.69 | $5.16 | |
| Class M | 1.02% | |||
| Actual | $1,000.00 | $1,077.30 | $5.25 | |
| Hypothetical-C | $1,000.00 | $1,019.74 | $5.11 | |
| Class C | 1.79% | |||
| Actual | $1,000.00 | $1,073.60 | $9.20 | |
| Hypothetical-C | $1,000.00 | $1,015.92 | $8.95 | |
| Class I | .78% | |||
| Actual | $1,000.00 | $1,079.40 | $4.02 | |
| Hypothetical-C | $1,000.00 | $1,020.93 | $3.91 |
A Annualized expense ratio reflects expenses net of applicable fee waivers.
B Expenses are equal to each Class' annualized expense ratio, multiplied by the average account value over the period, multiplied by 181/365 (to reflect the one-half year period).
C 5% return per year before expenses
![]()
HY-SANN-0617
1.703458.119
|
Fidelity Advisor® Floating Rate High Income Fund Semi-Annual Report April 30, 2017 |
|
|
Contents
To view a fund's proxy voting guidelines and proxy voting record for the 12-month period ended June 30, visit http://www.fidelity.com/proxyvotingresults or visit the Securities and Exchange Commission's (SEC) web site at http://www.sec.gov.
You may also call 1-877-208-0098 to request a free copy of the proxy voting guidelines.
Standard & Poor's, S&P and S&P 500 are registered service marks of The McGraw-Hill Companies, Inc. and have been licensed for use by Fidelity Distributors Corporation.
Other third-party marks appearing herein are the property of their respective owners.
All other marks appearing herein are registered or unregistered trademarks or service marks of FMR LLC or an affiliated company. © 2017 FMR LLC. All rights reserved.
This report and the financial statements contained herein are submitted for the general information of the shareholders of the Fund. This report is not authorized for distribution to prospective investors in the Fund unless preceded or accompanied by an effective prospectus.
A fund files its complete schedule of portfolio holdings with the SEC for the first and third quarters of each fiscal year on Form N-Q. Forms N-Q are available on the SEC’s web site at http://www.sec.gov. A fund's Forms N-Q may be reviewed and copied at the SEC’s Public Reference Room in Washington, DC. Information regarding the operation of the SEC's Public Reference Room may be obtained by calling 1-800-SEC-0330.
For a complete list of a fund's portfolio holdings, view the most recent holdings listing, semiannual report, or annual report on Fidelity's web site at http://www.fidelity.com, http://www.institutional.fidelity.com, or http://www.401k.com, as applicable.
NOT FDIC INSURED •MAY LOSE VALUE •NO BANK GUARANTEE
Neither the Fund nor Fidelity Distributors Corporation is a bank.
Investment Summary (Unaudited)
Top Five Holdings as of April 30, 2017
| (by issuer, excluding cash equivalents) | % of fund's net assets | % of fund's net assets 6 months ago |
| Albertson's LLC | 2.0 | 2.3 |
| Community Health Systems, Inc. | 1.7 | 2.1 |
| Laureate Education, Inc. | 1.7 | 1.3 |
| Charter Communication Operating LLC | 1.6 | 0.6 |
| Caesars Growth Properties Holdings, LLC | 1.5 | 1.7 |
| 8.5 |
Top Five Market Sectors as of April 30, 2017
| % of fund's net assets | % of fund's net assets 6 months ago | |
| Technology | 11.3 | 10.8 |
| Services | 9.2 | 7.4 |
| Telecommunications | 8.9 | 7.1 |
| Healthcare | 8.2 | 10.4 |
| Gaming | 6.0 | 6.5 |
Quality Diversification (% of fund's net assets)
| As of April 30, 2017 | ||
| BBB | 3.4% | |
| BB | 37.1% | |
| B | 41.0% | |
| CCC,CC,C | 4.8% | |
| Not Rated | 6.5% | |
| Equities | 0.3% | |
| Short-Term Investments and Net Other Assets | 6.9% | |

| As of October 31, 2016 | ||
| BBB | 2.9% | |
| BB | 38.9% | |
| B | 40.1% | |
| CCC,CC,C | 6.0% | |
| Not Rated | 4.6% | |
| Equities | 0.4% | |
| Short-Term Investments and Net Other Assets | 7.1% | |

We have used ratings from Moody's Investors Service, Inc. Where Moody's® ratings are not available, we have used S&P® ratings. All ratings are as of the date indicated and do not reflect subsequent changes.
Asset Allocation (% of fund's net assets)
| As of April 30, 2017* | ||
| Bank Loan Obligations | 86.5% | |
| Nonconvertible Bonds | 6.3% | |
| Common Stocks | 0.3% | |
| Short-Term Investments and Net Other Assets (Liabilities) | 6.9% | |

* Foreign investments - 10.0%
| As of October 31, 2016* | ||
| Bank Loan Obligations | 84.7% | |
| Nonconvertible Bonds | 7.8% | |
| Common Stocks | 0.4% | |
| Short-Term Investments and Net Other Assets (Liabilities) | 7.1% | |

* Foreign investments - 7.9%
Investments April 30, 2017
Showing Percentage of Net Assets
| Bank Loan Obligations - 86.5%(a) | |||
| Principal Amount (000s) | Value (000s) | ||
| Aerospace - 1.0% | |||
| DAE Aviation Holdings, Inc. term loan 7/7/22(b) | $6,250 | $6,261 | |
| Gemini HDPE LLC Tranche B, term loan 4.1718% 8/7/21 (c) | 4,556 | 4,591 | |
| TransDigm, Inc.: | |||
| Tranche C, term loan 4.1188% 2/28/20 (c) | 61,318 | 61,441 | |
| Tranche F, term loan 3.9928% 6/9/23 (c) | 29,775 | 29,734 | |
| TOTAL AEROSPACE | 102,027 | ||
| Automotive & Auto Parts - 0.7% | |||
| Caliber Holdings Corp.: | |||
| Tranche 1LN, term loan 4% 2/1/24 (c) | 9,045 | 9,102 | |
| Tranche 2LN, term loan: | |||
| 3% 2/1/24 (c)(d) | 905 | 910 | |
| 8.25% 2/1/25 (c) | 2,710 | 2,757 | |
| Chrysler Group LLC term loan 2.99% 12/31/18 (c) | 7,147 | 7,167 | |
| North American Lifting Holdings, Inc.: | |||
| Tranche 1LN, term loan 5.6468% 11/27/20 (c) | 16,454 | 15,412 | |
| Tranche 2LN, term loan 10.1468% 11/27/21 (c) | 24,370 | 19,009 | |
| The Gates Corp. Tranche B 1LN, term loan 4.4076% 3/31/24 (c) | 13,335 | 13,395 | |
| UOS LLC term loan 6.5333% 4/18/23 (c) | 8,670 | 8,800 | |
| TOTAL AUTOMOTIVE & AUTO PARTS | 76,552 | ||
| Broadcasting - 1.6% | |||
| CBS Radio, Inc.: | |||
| term loan 4.5% 10/17/23 (c) | 18,966 | 19,093 | |
| Tranche B 1LN, term loan 3/2/24 (b) | 12,500 | 12,583 | |
| Clear Channel Communications, Inc. Tranche D, term loan 7.7428% 1/30/19 (c) | 64,710 | 55,049 | |
| Entercom Radio, LLC Tranche B, term loan 4.55% 11/1/23 (c) | 5,725 | 5,758 | |
| ION Media Networks, Inc. Tranche B, term loan 4.5% 12/18/20 (c) | 19,752 | 19,937 | |
| Nielsen Finance LLC Tranche B 4LN, term loan 2.99% 10/4/23 (c) | 11,940 | 11,985 | |
| Univision Communications, Inc. Tranche C 5LN, term loan 3.75% 3/15/24 (c) | 41,207 | 40,917 | |
| TOTAL BROADCASTING | 165,322 | ||
| Building Materials - 0.3% | |||
| HD Supply, Inc. Tranche B, term loan 3.8968% 10/17/23 (c) | 8,209 | 8,265 | |
| Jeld-Wen, Inc. Tranche B 3LN, term loan 4.1468% 7/1/22 (c) | 17,639 | 17,815 | |
| Unifrax I LLC Tranche B, term loan 4.8996% 4/4/24 (c) | 8,505 | 8,519 | |
| TOTAL BUILDING MATERIALS | 34,599 | ||
| Cable/Satellite TV - 3.0% | |||
| Altice U.S. Finance SA Tranche B, term loan 7/28/25 (b) | 30,424 | 30,392 | |
| Cable One, Inc. Tranche B, term loan 4/12/24 (b) | 7,970 | 8,020 | |
| Charter Communication Operating LLC: | |||
| term loan: | |||
| 2.99% 7/1/20 (c) | 47,483 | 47,720 | |
| 2.99% 1/3/21 (c) | 75,200 | 75,511 | |
| Tranche I, term loan 3.2322% 1/15/24 (c) | 55,788 | 56,053 | |
| Liberty Cablevision of Puerto Rico Tranche 1LN, term loan 4.6584% 1/7/22 (c) | 27,125 | 27,066 | |
| Virgin Media Bristol LLC Tranche 1LN, term loan 3.7439% 1/31/25 (c) | 35,000 | 35,123 | |
| WideOpenWest Finance LLC Tranche B, term loan 4.554% 8/19/23 (c) | 22,000 | 22,113 | |
| Zayo Group LLC Tranche B 1LN, term loan 3.5% 1/19/24 (c) | 16,473 | 16,577 | |
| TOTAL CABLE/SATELLITE TV | 318,575 | ||
| Capital Goods - 0.6% | |||
| Onex Wizard U.S. Acquisition, Inc. Tranche B, term loan 4% 3/13/22 (c) | 30,308 | 30,489 | |
| SRAM LLC. Tranche B, term loan 4.536% 3/15/24 (c) | 13,912 | 13,878 | |
| Wireco Worldgroup, Inc. Tranche B 1LN, term loan 6.5% 9/30/23 (c) | 6,468 | 6,521 | |
| Zodiac Pool Solutions LLC: | |||
| Tranche 2LN, term loan 10.1468% 12/20/24 (c) | 3,000 | 2,972 | |
| Tranche B 1LN, term loan 5.6468% 12/20/23 (c) | 12,968 | 13,038 | |
| TOTAL CAPITAL GOODS | 66,898 | ||
| Chemicals - 1.4% | |||
| Ineos Styrolution U.S. Holding LLC Tranche B, term loan 3.9022% 3/30/24 (c) | 10,239 | 10,252 | |
| Kraton Polymers LLC term loan 5% 1/6/22 (c) | 19,425 | 19,694 | |
| MacDermid, Inc.: | |||
| Tranche B 5LN, term loan 4.5% 6/7/20 (c) | 13,073 | 13,132 | |
| Tranche B 6LN, term loan 4% 6/7/23 (c) | 25,576 | 25,671 | |
| Royal Holdings, Inc.: | |||
| Tranche B 1LN, term loan 4.3968% 6/19/22 (c) | 13,790 | 13,898 | |
| Tranche B 2LN, term loan 8.6468% 6/19/23 (c) | 1,175 | 1,176 | |
| The Chemours Co. LLC Tranche B, term loan 3.49% 5/12/22 (c) | 21,503 | 21,651 | |
| Trinseo Materials Operating SCA/Trinseo Materials Finance, Inc. Tranche B 1LN, term loan 4.25% 11/5/21 (c) | 16,480 | 16,599 | |
| Tronox Pigments (Netherlands) B.V. Tranche B, term loan 4.6468% 3/19/20 (c) | 11,585 | 11,641 | |
| Univar, Inc. term loan 3.7428% 7/1/22 (c) | 13,933 | 13,968 | |
| TOTAL CHEMICALS | 147,682 | ||
| Consumer Products - 1.0% | |||
| CSM Bakery Supplies Tranche B 1LN, term loan 5.15% 7/3/20 (c) | 18,047 | 16,883 | |
| Hercules Achievement, Inc. Tranche B, term loan 5% 12/11/21 (c) | 6,000 | 6,030 | |
| Prestige Brands, Inc. term loan 3.7428% 1/26/24 (c) | 15,402 | 15,540 | |
| Weight Watchers International, Inc. Tranche B 2LN, term loan 4.3392% 4/2/20 (c) | 51,009 | 48,379 | |
| Wilsonart LLC Tranche B, term loan 4.65% 12/19/23 (c) | 20,449 | 20,568 | |
| TOTAL CONSUMER PRODUCTS | 107,400 | ||
| Consumer Services - 0.2% | |||
| Optiv Security, Inc.: | |||
| Tranche 2LN, term loan 8.25% 2/1/25 (c) | 3,280 | 3,325 | |
| Tranche B 1LN, term loan 4.25% 2/1/24 (c) | 16,590 | 16,562 | |
| TOTAL CONSUMER SERVICES | 19,887 | ||
| Containers - 1.7% | |||
| Berry Plastics Corp.: | |||
| term loan: | |||
| 3.5068% 10/1/22 (c) | 21,378 | 21,512 | |
| 3.5244% 1/19/23 (c) | 10,000 | 10,053 | |
| Tranche K, term loan 3.2394% 2/8/20 (c) | 64,000 | 64,357 | |
| Tranche L, term loan 3.2394% 1/6/21 (c) | 8,592 | 8,637 | |
| BWAY Holding Co. Tranche B, term loan 4.2328% 4/3/24 (c) | 8,250 | 8,195 | |
| Consolidated Container Co. Tranche B, term loan 5% 7/3/19 (c) | 27,503 | 27,503 | |
| Hostess Brands LLC Tranche B 1LN, term loan 4% 8/3/22 (c) | 11,969 | 12,066 | |
| Reynolds Group Holdings, Inc. Tranche B, term loan 3.9928% 2/5/23 (c) | 26,845 | 26,978 | |
| Signode Packaging Systems, Inc. Tranche B, term loan 3.8138% 5/1/21 (c) | 7,053 | 7,080 | |
| TOTAL CONTAINERS | 186,381 | ||
| Diversified Financial Services - 3.5% | |||
| AlixPartners LLP Tranche B, term loan 4.1496% 4/4/24 (c) | 26,240 | 26,455 | |
| ASP Chromaflo Intermediate Hol Tranche B 1LN, term loan 5% 11/18/23 (c) | 11,940 | 11,992 | |
| Avolon TLB Borrower 1 (U.S.) LLC Tranche B 2LN, term loan 3.7428% 3/20/22 (c) | 70,000 | 71,019 | |
| Cypress Intermediate Holdings, Inc. Tranche B 1LN, term loan 4.0406% 3/30/24 (c) | 18,750 | 18,661 | |
| Delos Finance SARL term loan 3.3968% 10/6/23 (c) | 33,095 | 33,476 | |
| Fly Funding II SARL: | |||
| Tranche B, term loan 2/9/23 (b) | 10,000 | 10,003 | |
| Tranche B, term loan 3.79% 2/9/22 (c) | 12,642 | 12,646 | |
| Flying Fortress Holdings, Inc. Tranche B, term loan 3.3968% 10/30/22 (c) | 67,865 | 68,422 | |
| HarbourVest Partners LLC Tranche B, term loan 3.6551% 2/4/21 (c) | 10,864 | 10,891 | |
| IBC Capital U.S. LLC Tranche B 1LN, term loan 4.8696% 9/11/21 (c) | 24,500 | 24,082 | |
| Quest Software U.S. Holdings, Inc. Tranche B, term loan 7% 10/31/22 (c) | 20,894 | 21,234 | |
| Rep Wwex Acquisition Parent LLC Tranche B 1LN, term loan 5.53% 2/3/24 (c) | 3,760 | 3,773 | |
| TransUnion LLC Tranche B 2LN, term loan 3.4928% 4/9/23 (c) | 37,168 | 37,466 | |
| UFC Holdings LLC Tranche B 1LN, term loan 4.25% 8/18/23 (c) | 19,278 | 19,380 | |
| TOTAL DIVERSIFIED FINANCIAL SERVICES | 369,500 | ||
| Energy - 3.4% | |||
| Alon U.S.A. Partners LP term loan 9.25% 11/26/18 (c) | 8,511 | 8,511 | |
| Arctic LNG Carriers Ltd. Tranche B 1LN, term loan 4/20/23 (b) | 20,000 | 19,900 | |
| California Resources Corp. Tranche 1LN, term loan 11.375% 12/31/21 (c) | 19,330 | 21,239 | |
| Chesapeake Energy Corp. Tranche 1LN, term loan 8.5534% 8/23/21 (c) | 15,000 | 16,195 | |
| Chief Exploration & Development, LLC. Tranche 2LN, term loan 7.9324% 5/16/21 (c) | 3,000 | 2,880 | |
| Citgo Holding, Inc. Tranche B, term loan 9.6468% 5/12/18 (c) | 13,577 | 13,734 | |
| Crestwood Holdings Partners LLC Tranche B, term loan 9.0418% 6/19/19 (c) | 24,944 | 24,679 | |
| Empire Generating Co. LLC: | |||
| Tranche B, term loan 5.43% 3/14/21 (c) | 17,765 | 17,676 | |
| Tranche C, term loan 5.43% 3/14/21 (c) | 1,756 | 1,747 | |
| Energy Transfer Equity LP Tranche B, term loan 3.7328% 2/2/24 (c) | 10,000 | 10,021 | |
| ExGen Renewables I, LLC Tranche B term loan 5.41% 2/6/21 (c) | 11,345 | 11,388 | |
| Expro Finservices SARL Tranche B, term loan 5.75% 9/2/21 (c) | 49,931 | 35,951 | |
| Foresight Energy LLC Tranche B 1LN, term loan 6.75% 3/28/22 (c) | 15,250 | 14,721 | |
| FTS International, Inc. Tranche B, term loan 5.75% 4/16/21 (c) | 13,555 | 11,759 | |
| Gavilan Resources LLC Tranche 2LN, term loan 7% 3/1/24 (c) | 11,000 | 10,890 | |
| Gulf Finance LLC Tranche B 1LN, term loan 6.25% 8/25/23 (c) | 46,268 | 46,152 | |
| International Seaways, Inc. Tranche B, term loan 5.79% 8/5/19 (c) | 23,620 | 23,547 | |
| MRP Generation Holdings LLC Tranche B, term loan 8.1468% 10/18/22 (c) | 7,806 | 7,689 | |
| Overseas Shipholding Group, Inc. Tranche B, term loan 5.29% 8/5/19 (c) | 12,565 | 12,282 | |
| Pacific Drilling SA Tranche B, term loan 4.625% 6/3/18 (c) | 13,738 | 6,320 | |
| Panda Temple Power, LLC term loan 7.25% 4/3/19 (c) | 10,863 | 9,052 | |
| Seadrill Operating LP Tranche B, term loan 4.1468% 2/21/21 (c) | 43,397 | 29,184 | |
| Western Refining, Inc. Tranche B, term loan 5.25% 11/12/20 (c) | 7,364 | 7,373 | |
| TOTAL ENERGY | 362,890 | ||
| Entertainment/Film - 0.6% | |||
| AMC Entertainment Holdings, Inc. Tranche B, term loan 3.7422% 12/15/23 (c) | 7,671 | 7,701 | |
| AMC Entertainment, Inc. Tranche B, term loan 3.7439% 12/15/22 (c) | 4,975 | 4,996 | |
| CDS U.S. Intermediate Holdings, Inc.: | |||
| Tranche B 1LN, term loan 5.1468% 7/8/22 (c) | 11,395 | 11,480 | |
| Tranche B 2LN, term loan 9.3968% 7/8/23 (c) | 5,305 | 5,265 | |
| Digital Cinema Implementation Partners,LLC Tranche B, term loan 3.632% 5/17/21 (c) | 11,172 | 11,242 | |
| Lions Gate Entertainment Corp. term loan 3.9822% 12/8/23 (c) | 18,400 | 18,492 | |
| TOTAL ENTERTAINMENT/FILM | 59,176 | ||
| Environmental - 0.3% | |||
| The Brickman Group, Ltd. Tranche B 1LN, term loan 4.142% 12/18/20 (c) | 18,578 | 18,640 | |
| WTG Holdings III Corp. Tranche B 1LN, term loan 4.8968% 1/15/21 (c) | 13,776 | 13,845 | |
| TOTAL ENVIRONMENTAL | 32,485 | ||
| Food & Drug Retail - 3.2% | |||
| Albertson's LLC: | |||
| term loan 4.3023% 6/22/23 (c) | 32,594 | 32,730 | |
| Tranche B 4LN, term loan 3.9928% 8/25/21 (c) | 179,987 | 180,569 | |
| GOBP Holdings, Inc. Tranche B 1LN, term loan 5.1468% 10/21/21 (c) | 3,960 | 3,968 | |
| JBS USA Lux SA Tranche B, term loan 3.4828% 10/30/22 (c) | 25,500 | 25,605 | |
| Pizza Hut Holdings LLC Tranche B, term loan 2.9939% 6/16/23 (c) | 24,875 | 24,999 | |
| RPI Finance Trust Tranche B 6LN, term loan: | |||
| 3/27/23 (b) | 25,723 | 25,804 | |
| 3.1529% 3/27/23 (c) | 23,042 | 23,114 | |
| Smart & Final, Inc. Tranche B, term loan 4.582% 11/15/22 (c) | 19,845 | 19,382 | |
| TOTAL FOOD & DRUG RETAIL | 336,171 | ||
| Food/Beverage/Tobacco - 0.6% | |||
| Arctic Glacier Group Holdings, Inc. Tranche B, term loan 5.25% 3/20/24 (c) | 6,345 | 6,420 | |
| Chobani LLC Tranche B, term loan 5.25% 10/7/23 (c) | 22,615 | 22,954 | |
| Pinnacle Foods Finance LLC Tranche B, term loan 2.9828% 2/3/24 (c) | 9,975 | 10,031 | |
| Shearer's Foods, Inc. Tranche 2LN, term loan 7.8968% 6/30/22 (c) | 2,000 | 1,960 | |
| U.S. Foods, Inc. Tranche B, term loan 3.7428% 6/27/23 (c) | 27,046 | 27,280 | |
| TOTAL FOOD/BEVERAGE/TOBACCO | 68,645 | ||
| Gaming - 5.8% | |||
| Aristocrat Technologies, Inc. Tranche B 2LN, term loan 3.4062% 10/20/21 (c) | 25,707 | 25,908 | |
| Boyd Gaming Corp. Tranche B 1LN, term loan 3.4456% 9/15/23 (c) | 23,980 | 24,072 | |
| Caesars Entertainment Resort Properties LLC Tranche B 1LN, term loan 7% 10/11/20 (c) | 100,567 | 100,756 | |
| Caesars Growth Properties Holdings, LLC term loan 4% 5/8/21(c) | 160,302 | 161,103 | |
| Eldorado Resorts, Inc. Tranche B, term loan 5.25% 4/17/24 (c) | 32,120 | 32,040 | |
| Golden Nugget, Inc. Tranche B, term loan: | |||
| 4.5% 11/21/19 (c) | 34,156 | 34,625 | |
| 4.5% 11/21/19 (c) | 14,638 | 14,839 | |
| Las Vegas Sands LLC Tranche B, term loan 2.98% 3/29/24 (c) | 25,990 | 26,011 | |
| MGM Mirage, Inc. Tranche A, term loan 3.4822% 4/25/21 (c) | 14,225 | 14,216 | |
| Mohegan Tribal Gaming Authority Tranche B, term loan 5% 10/14/23 (c) | 14,963 | 15,050 | |
| Penn National Gaming, Inc. Tranche B, term loan 3.5244% 1/19/24 (c) | 5,260 | 5,289 | |
| Scientific Games Corp. Tranche B 3LN, term loan 4.9939% 10/1/21 (c) | 98,331 | 99,760 | |
| Station Casinos LLC Tranche B, term loan 3.5% 6/8/23 (c) | 54,741 | 54,691 | |
| Yonkers Racing Corp. Tranche B 1LN, term loan 4.25% 8/20/19 (c) | 13,308 | 13,324 | |
| TOTAL GAMING | 621,684 | ||
| Healthcare - 7.4% | |||
| Alere, Inc. Tranche B, term loan 4.25% 6/18/22 (c) | 13,062 | 13,122 | |
| Cologix Holdings, Inc. Tranche B 1LN, term loan 3/20/24 (b) | 4,500 | 4,500 | |
| Community Health Systems, Inc.: | |||
| Tranche G, term loan 3.7976% 12/31/19 (c) | 64,453 | 64,186 | |
| Tranche H, term loan 4.0477% 1/27/21 (c) | 107,285 | 106,569 | |
| DaVita HealthCare Partners, Inc. Tranche B, term loan 3.7428% 6/24/21 (c) | 46,863 | 47,308 | |
| Envision Healthcare Corp. Tranche B, term loan 4.15% 12/1/23 (c) | 29,925 | 30,202 | |
| HCA Holdings, Inc.: | |||
| Tranche B 8LN, term loan 3.2428% 2/15/24 (c) | 19,950 | 20,138 | |
| Tranche B 9LN, term loan 2.9928% 3/18/23 (c) | 60,081 | 60,276 | |
| HLF Financing U.S. LLC Tranche B, term loan 6.4928% 2/15/23 (c) | 13,600 | 13,593 | |
| IMS Health, Inc. Tranche B, term loan 3/7/24 (b) | 9,975 | 10,069 | |
| InVentiv Health, Inc. Tranche B, term loan 4.804% 11/9/23 (c) | 20,948 | 21,055 | |
| JLL/Delta Dutch Newco BV Tranche B 1LN, term loan 4.406% 4/20/24 (c) | 14,000 | 14,025 | |
| Kindred Healthcare, Inc. Tranche B, term loan 4.6875% 4/9/21 (c) | 4,949 | 4,965 | |
| Milk Specialties Co. Tranche B, term loan 5.1468% 8/16/23 (c) | 12,104 | 12,203 | |
| MPH Acquisition Holdings LLC Tranche B, term loan 4.8968% 6/7/23 (c) | 18,242 | 18,473 | |
| Onex Schumacher Finance LP Tranche B 1LN, term loan 5% 7/31/22 (c) | 3,465 | 3,471 | |
| Ortho-Clinical Diagnostics, Inc. Tranche B, term loan 4.75% 6/30/21 (c) | 72,277 | 71,886 | |
| Precyse Acquisition Corp. Tranche B, term loan 5.5% 10/20/22 (c) | 9,925 | 10,024 | |
| Press Ganey Holdings, Inc.: | |||
| Tranche 2LN, term loan 8.25% 10/21/24 (c) | 5,000 | 5,088 | |
| Tranche B 1LN, term loan 4.25% 10/21/23 (c) | 15,461 | 15,461 | |
| Project Ruby Ultimate Parent Corp. Tranche B, term loan 4.75% 2/9/24 (c) | 3,990 | 4,010 | |
| Select Medical Corp. Tranche B, term loan 4.6497% 3/6/24 (c) | 10,000 | 10,113 | |
| U.S. Renal Care, Inc.: | |||
| Tranche 2LN, term loan 9.1468% 12/31/23 (c) | 5,000 | 4,538 | |
| Tranche B 1LN, term loan 5.3968% 12/31/22 (c) | 65,809 | 62,354 | |
| Valeant Pharmaceuticals International, Inc. Tranche B, term loan 5.74% 4/1/22 (c) | 129,803 | 130,547 | |
| Vizient, Inc. term loan 5% 2/11/23 (c) | 26,396 | 26,478 | |
| TOTAL HEALTHCARE | 784,654 | ||
| Homebuilders/Real Estate - 1.6% | |||
| Americold Realty Operating Partnership LP Tranche B, term loan 4.75% 12/1/22 (c) | 17,156 | 17,317 | |
| Communications Sales & Leasing, Inc. Tranche B, term loan 4% 10/24/22 (c) | 35,842 | 35,707 | |
| DTZ U.S. Borrower LLC Tranche B 1LN, term loan 4.3431% 11/4/21 (c) | 27,039 | 27,137 | |
| Lightstone Holdco LLC: | |||
| Tranche B, term loan 5.5% 1/30/24 (c) | 17,241 | 17,319 | |
| Tranche C, term loan 5.5% 1/30/24 (c) | 1,064 | 1,068 | |
| MGM Growth Properties Operating Partner LP Tranche B, term loan 3.4822% 4/25/23 (c) | 30,032 | 30,086 | |
| Realogy Group LLC term loan 3.2422% 7/20/22 (c) | 42,744 | 43,065 | |
| TOTAL HOMEBUILDERS/REAL ESTATE | 171,699 | ||
| Hotels - 1.9% | |||
| ESH Hospitality, Inc. Tranche B, term loan 3.4928% 8/30/23 (c) | 16,915 | 16,993 | |
| Four Seasons Holdings, Inc. Tranche B, term loan 4.1468% 11/30/23 (c) | 58,354 | 58,989 | |
| Hilton Worldwide Finance LLC Tranche B 2LN, term loan 2.9906% 10/25/23 (c) | 71,239 | 71,822 | |
| La Quinta Intermediate Holdings LLC Tranche B LN, term loan 3.9084% 4/14/21 (c) | 19,349 | 19,499 | |
| Playa Resorts Holding BV Tranche B, term loan 4/7/24 (b) | 26,500 | 26,524 | |
| Ryman Hospitality Properties, Inc. Tranche B, term loan 4/18/24 (b) | 10,000 | 10,025 | |
| TOTAL HOTELS | 203,852 | ||
| Insurance - 2.4% | |||
| Acrisure LLC Tranche B 1LN, term loan 5.8968% 11/22/23 (c) | 28,000 | 28,070 | |
| Alliant Holdings Intermediate LLC Tranche B, term loan 4.3873% 8/14/22 (c) | 27,368 | 27,435 | |
| AmWINS Group, Inc.: | |||
| Tranche 2LN, term loan 7.75% 1/25/25 (c) | 1,925 | 1,959 | |
| Tranche B 1LN, term loan 3.75% 1/25/24 (c) | 13,965 | 13,951 | |
| Asurion LLC: | |||
| term loan 4.25% 8/4/22 (c) | 38,258 | 38,490 | |
| Tranche B 2LN, term loan: | |||
| 4.2428% 7/8/20 (c) | 12,335 | 12,414 | |
| 8.5% 3/3/21 (c) | 28,303 | 28,715 | |
| Tranche B 5LN, term loan: | |||
| 11/3/23 (b) | 4,000 | 4,030 | |
| 4.75% 11/3/23 (c) | 17,484 | 17,615 | |
| HUB International Ltd. Tranche B 1LN, term loan 4.034% 10/2/20 (c) | 25,243 | 25,362 | |
| Lonestar Intermediate Super Holdings LLC term loan 10% 8/31/21 pay-in-kind (c) | 15,960 | 16,578 | |
| USI, Inc. term loan 4/5/24 (b) | 30,110 | 29,978 | |
| VF Holdings Corp. term loan 4.25% 6/30/23 (c) | 14,925 | 14,965 | |
| TOTAL INSURANCE | 259,562 | ||
| Leisure - 1.7% | |||
| 24 Hour Fitness Worldwide, Inc. Tranche B, term loan 4.8968% 5/30/21 (c) | 26,443 | 26,300 | |
| Cedar Fair LP Tranche B, term loan 3.2422% 4/13/24 (c) | 3,320 | 3,343 | |
| ClubCorp Club Operations, Inc. Tranche B, term loan 4% 12/15/22 (c) | 9,644 | 9,693 | |
| Delta 2 SARL Tranche B, term loan 4.5677% 2/1/24 (c) | 61,400 | 61,461 | |
| Equinox Holdings, Inc.: | |||
| Tranche 2LN, term loan 8% 9/8/24 (c) | 7,325 | 7,417 | |
| Tranche B 1LN, term loan 4.25% 3/8/24 (c) | 19,995 | 20,137 | |
| Fitness International LLC Tranche B, term loan 5.3968% 7/1/20 (c) | 9,512 | 9,635 | |
| LTF Merger Sub, Inc. Tranche B, term loan 4% 6/10/22 (c) | 31,767 | 31,824 | |
| SeaWorld Parks & Entertainment, Inc. Tranche B 5LN, term loan 4.1468% 3/31/24 (c) | 5,000 | 4,988 | |
| SMG Tranche B 1LN, term loan 4.8137% 2/27/20 (c) | 1,699 | 1,703 | |
| TOTAL LEISURE | 176,501 | ||
| Metals/Mining - 1.2% | |||
| American Rock Salt Co. LLC Tranche B 1LN, term loan 4.8968% 5/20/21 (c) | 8,648 | 8,648 | |
| Fortescue Metals Group Ltd. Tranche B, term loan 3.75% 6/30/19 (c) | 5,026 | 5,059 | |
| Murray Energy Corp. Tranche B 2LN, term loan 8.3968% 4/16/20 (c) | 89,589 | 85,433 | |
| Peabody Energy Corp. term loan 5.5% 3/31/22 (c) | 30,405 | 30,481 | |
| Walter Energy, Inc. Tranche B, term loan 0% 4/1/18 (e) | 32,780 | 0 | |
| TOTAL METALS/MINING | 129,621 | ||
| Paper - 0.5% | |||
| Caraustar Industries, Inc. Tranche B, term loan 6.6468% 3/14/22 (c) | 27,405 | 27,705 | |
| Flex Acquisition Co., Inc. Tranche B 1LN, term loan 4.3976% 12/29/23 (c) | 30,870 | 31,005 | |
| TOTAL PAPER | 58,710 | ||
| Publishing/Printing - 2.7% | |||
| Cengage Learning, Inc. Tranche B, term loan 5.25% 6/7/23 (c) | 56,488 | 54,269 | |
| Getty Images, Inc. Tranche B, term loan 4.75% 10/18/19 (c) | 51,654 | 45,627 | |
| Harland Clarke Holdings Corp.: | |||
| Tranche B 5LN, term loan 7.1468% 12/31/21 (c) | 13,332 | 13,365 | |
| Tranche B 6LN, term loan 6.6468% 2/9/22 (c) | 19,528 | 19,552 | |
| Houghton Mifflin Harcourt Publishing, Inc. Tranche B, term loan 4% 5/29/21 (c) | 31,120 | 28,650 | |
| JD Power & Associates Tranche B 1LN, term loan 5.25% 9/7/23 (c) | 4,837 | 4,862 | |
| McGraw-Hill Global Education Holdings, LLC term loan 5% 5/4/22 (c) | 54,470 | 53,915 | |
| Merrill Communications LLC Tranche B, term loan 6.4218% 6/1/22 (c) | 16,314 | 16,287 | |
| Montreign Operating Co. LLC Tranche B 1LN, term loan 9.25% 1/19/23 (c) | 20,050 | 20,401 | |
| Proquest LLC Tranche B, term loan 5.25% 10/24/21 (c) | 6,894 | 6,989 | |
| Springer Science+Business Media Deutschland GmbH Tranche B 9LN, term loan 4.6217% 8/14/20 (c) | 26,585 | 26,602 | |
| TOTAL PUBLISHING/PRINTING | 290,519 | ||
| Restaurants - 1.2% | |||
| Burger King Worldwide, Inc. Tranche B, term loan 3.3093% 2/17/24 (c) | 33,894 | 33,903 | |
| CEC Entertainment, Inc. Tranche B, term loan 4% 2/14/21 (c) | 29,314 | 29,116 | |
| Landry's Acquisition Co. Tranche B 1LN, term loan 3.7325% 10/4/23 (c) | 51,360 | 51,406 | |
| Red Lobster Hospitality LLC Tranche B, term loan 6.25% 7/28/21 (c) | 18,208 | 18,299 | |
| TOTAL RESTAURANTS | 132,724 | ||
| Services - 8.9% | |||
| Abacus Innovations Corp. Tranche B, term loan 3.25% 8/16/23 (c) | 13,912 | 14,030 | |
| Acosta, Inc. Tranche B, term loan 4.25% 9/26/21 (c) | 55,216 | 51,328 | |
| Almonde, Inc.: | |||
| Tranche 2LN, term loan 5/3/25 (b) | 11,675 | 11,899 | |
| Tranche B 1LN, term loan 5/3/24 (b) | 54,090 | 54,310 | |
| Ancestry.Com Operations, Inc.: | |||
| Tranch B 1LN, term loan 4.25% 10/19/23 (c) | 32,175 | 32,426 | |
| Tranche 2LN, term loan 9.27% 10/19/24 (c) | 8,500 | 8,691 | |
| Aramark Services, Inc. Tranche B, term loan 2.9928% 3/28/24 (c) | 40,000 | 40,312 | |
| Brand Energy & Infrastructure Services, Inc. Tranche B, term loan 4.9172% 11/26/20 (c) | 35,126 | 35,214 | |
| Bright Horizons Family Solutions Tranche B, term loan 3.7428% 11/7/23 (c) | 9,887 | 9,962 | |
| Cactus Wellhead LLC Tranche B, term loan 7.1468% 7/31/20 (c) | 21,878 | 20,784 | |
| Coinmach Service Corp. Tranche B, term loan 4.2689% 11/14/19 (c) | 42,494 | 42,529 | |
| Creative Artists Agency LLC Tranche B, term loan 4.5% 2/15/24 (c) | 11,970 | 12,110 | |
| Garda World Security Corp.: | |||
| term loan 4.0052% 11/8/20 (c) | 11,751 | 11,740 | |
| Tranche B 1LN, term loan 4.005% 11/8/20 (c) | 9,456 | 9,447 | |
| Tranche DD, term loan 4.0052% 11/8/20 (c) | 1,522 | 1,520 | |
| GCA Services Group, Inc. Tranche B 1LN, term loan 5.9128% 3/1/23 (c) | 9,820 | 9,863 | |
| KAR Auction Services, Inc. Tranche B 3LN, term loan 4.5% 3/9/23 (c) | 16,043 | 16,163 | |
| Karman Buyer Corp.: | |||
| Tranche 1LN, term loan 4.25% 7/25/21 (c) | 19,374 | 18,898 | |
| Tranche 2LN, term loan 7.5% 7/25/22 (c) | 6,895 | 6,561 | |
| KUEHG Corp. Tranche B 1LN, term loan 4.9165% 8/13/22 | 21,259 | 21,344 | |
| Laureate Education, Inc. Tranche B 1LN, term loan 4/26/24(b) | 183,545 | 183,159 | |
| Lineage Logistics Holdings, LLC. Tranche B, term loan 4.5% 4/7/21 (c) | 62,398 | 62,437 | |
| Nord Anglia Education Tranche B, term loan 4.554% 3/31/21 (c) | 34,311 | 34,311 | |
| Outerwall, Inc.: | |||
| Tranche 2LN, term loan 9.75% 9/27/24 (c) | 2,500 | 2,541 | |
| Tranche B 1LN, term loan 5.25% 9/27/23 (c) | 6,965 | 6,980 | |
| Prime Security Services Borrower LLC Tranche B 1LN, term loan 4.25% 5/2/22 (c) | 92,284 | 93,192 | |
| SAI Global GP Tranche B, term loan 5.6634% 12/8/23 (c) | 13,716 | 13,887 | |
| Science Applications International Corp. Tranche B, term loan 3.5625% 5/4/22 (c) | 6,226 | 6,253 | |
| SESAC Holdco II LLC Tranche B 1LN, term loan 4.2591% 2/23/24 (c) | 9,115 | 9,111 | |
| The GEO Group, Inc. Tranche B, term loan 3.2% 3/23/24 (c) | 11,565 | 11,565 | |
| The ServiceMaster Co. Tranche B, term loan 3.4822% 11/8/23 (c) | 25,933 | 26,208 | |
| Thomson Reuters IP&S Tranche B 1LN, term loan 4.5% 10/3/23 (c) | 26,830 | 26,951 | |
| Wash Multifamily Acquisition, Inc. Tranche B 1LN, term loan 4.25% 5/14/22 (c) | 8,406 | 8,417 | |
| Xerox Business Services LLC: | |||
| term loan 3.2428% 12/7/21 (c) | 11,364 | 11,250 | |
| Tranche B, term loan 4.9856% 12/7/23 (c) | 21,022 | 21,373 | |
| TOTAL SERVICES | 946,766 | ||
| Steel - 0.2% | |||
| JMC Steel Group, Inc. Tranche B, term loan 4.9062% 6/14/21 (c) | 20,472 | 20,696 | |
| Super Retail - 4.6% | |||
| Academy Ltd. Tranche B, term loan 5.0555% 7/2/22 (c) | 30,502 | 20,970 | |
| Bass Pro Group LLC: | |||
| term loan 5.8968% 6/9/18 (c) | 16,871 | 16,955 | |
| Tranche B, term loan 4.2394% 6/5/20 (c) | 24,871 | 24,820 | |
| Bass Pro Shops LLC. Tranche B, term loan 6.1468% 12/16/23 (c) | 110,760 | 107,776 | |
| BJ's Wholesale Club, Inc.: | |||
| Tranche 2LN, term loan 8.5% 2/3/25 (c) | 14,000 | 14,020 | |
| Tranche B 1LN, term loan 4.75% 2/3/24 (c) | 48,325 | 48,104 | |
| Davids Bridal, Inc. Tranche B, term loan 5.25% 10/11/19 (c) | 9,532 | 8,066 | |
| Harbor Freight Tools U.S.A., Inc. Tranche B, term loan 4.2428% 8/19/23 (c) | 22,828 | 22,756 | |
| JC Penney Corp., Inc. Tranche B, term loan 5.304% 6/23/23 (c) | 78,246 | 78,100 | |
| Party City Holdings, Inc. term loan 4.1696% 8/19/22 (c) | 28,429 | 28,397 | |
| PETCO Animal Supplies, Inc. Tranche B 1LN, term loan 4.1718% 1/26/23 (c) | 37,206 | 33,613 | |
| PetSmart, Inc. term loan 4.02% 3/11/22 (c) | 59,801 | 54,711 | |
| Sears Holdings Corp. Tranche ABL, term loan 5.4997% 6/30/18 (c) | 27,678 | 27,220 | |
| Sports Authority, Inc. Tranche B, term loan 0% 11/16/17 (e) | 4,555 | 273 | |
| TOTAL SUPER RETAIL | 485,781 | ||
| Technology - 10.8% | |||
| Applied Systems, Inc. Tranche B 1LN, term loan 4.3968% 1/23/21 (c) | 7,294 | 7,344 | |
| Aptean, Inc.: | |||
| Tranche 2LN, term loan 10.54% 12/20/23 (c) | 2,500 | 2,494 | |
| Tranche B 1LN, term loan 6.04% 12/20/22 (c) | 13,055 | 13,259 | |
| Bright Bidco BV Tranche B, term loan 3/17/24 (b) | 16,000 | 16,180 | |
| Cavium, Inc. Tranche B 1LN, term loan 3.2383% 8/16/22 (c) | 11,200 | 11,214 | |
| Ceridian HCM Holding, Inc. Tranche B 2LN, term loan 4.5011% 9/15/20 (c) | 24,059 | 24,014 | |
| Computer Discount Warehouse (CDW) LLC Tranche B, term loan 3.15% 8/17/23 (c) | 31,386 | 31,575 | |
| Compuware Corp.: | |||
| term loan 9.25% 12/15/22 (c) | 17,829 | 17,874 | |
| Tranche B 3LN, term loan 5.25% 12/15/21 (c) | 44,236 | 44,402 | |
| Datapipe, Inc. Tranche B 1LN, term loan 5.79% 3/15/19 (c) | 10,608 | 10,626 | |
| Dell International LLC: | |||
| Tranche A 1LN, term loan 3% 12/31/18 (c) | 6,205 | 6,209 | |
| Tranche B, term loan 3.5% 9/7/23 (c) | 35,323 | 35,447 | |
| EIG Investors Corp.: | |||
| Tranche 1LN, term loan 6.5323% 11/9/19 (c) | 986 | 989 | |
| Tranche B 1LN, term loan 6.0418% 2/9/23 (c) | 44,875 | 45,174 | |
| Electro Rent Corp. Tranche B 1LN, term loan 6% 1/31/24 (c) | 14,963 | 15,025 | |
| Epicor Software Corp. Tranche B, term loan 4.75% 6/1/22 (c) | 29,388 | 29,342 | |
| First Data Corp.: | |||
| Tranche B 1LN, term loan 3.4911% 4/26/24 (c) | 12,000 | 12,000 | |
| Tranche B, term loan 3.9883% 7/10/22 (c) | 79,301 | 79,717 | |
| Gartner, Inc. Tranche B, term loan 2.9928% 4/5/24 (c) | 10,000 | 10,069 | |
| Genesys Telecommunications Laboratories, Inc. term loan 5.1584% 12/1/23 (c) | 40,818 | 41,114 | |
| Global Payments, Inc. Tranche B, term loan 3.4928% 4/22/23 (c) | 19,892 | 19,957 | |
| Go Daddy Operating Co. LLC Tranche B, term loan 3.4928% 2/15/24 (c) | 26,500 | 26,603 | |
| Infor U.S., Inc. Tranche B 6LN, term loan 3.8968% 2/1/22 (c) | 22,344 | 22,292 | |
| Information Resources, Inc.: | |||
| Tranche 2LN, term loan 9.25% 1/18/25 (c) | 7,500 | 7,477 | |
| Tranche B 1LN, term loan 5.25% 1/18/24 (c) | 21,160 | 21,365 | |
| Inmar, Inc.: | |||
| Tranche 2LN, term loan 4/16/25 (b) | 2,280 | 2,246 | |
| Tranche B 1LN, term loan 4/16/24 (b) | 7,985 | 7,930 | |
| Kronos, Inc. term loan: | |||
| 5.034% 11/1/23 (c) | 39,900 | 40,020 | |
| 9.284% 11/1/24 (c) | 30,000 | 31,215 | |
| Landesk Group, Inc. term loan: | |||
| 5.25% 1/20/24 (c) | 29,865 | 30,008 | |
| 10% 1/20/25 (c) | 5,000 | 4,960 | |
| Lux FinCo U.S. SPV: | |||
| Tranche 2LN, term loan 9.5% 10/16/23 (c) | 4,875 | 4,826 | |
| Tranche B 3LN, term loan 4.5% 10/16/22 (c) | 10,758 | 10,799 | |
| MA FinanceCo. LLC: | |||
| term loan 4/18/24 (b) | 38,439 | 38,547 | |
| Tranche B 3LN, term loan 4/18/24 (b) | 6,061 | 6,078 | |
| Microsemi Corp. Tranche B, term loan 3.2411% 1/15/23 (c) | 10,319 | 10,359 | |
| Rackspace Hosting, Inc. term loan 4.5346% 11/3/23 (c) | 45,631 | 45,945 | |
| Renaissance Learning, Inc.: | |||
| Tranche 1LN, term loan 4.8968% 4/9/21 (c) | 19,508 | 19,594 | |
| Tranche 2LN, term loan 8.1468% 4/9/22 (c) | 19,080 | 18,969 | |
| Sabre GLBL, Inc. Tranche B, term loan 3.7428% 2/22/24 (c) | 13,835 | 13,968 | |
| SolarWinds Holdings, Inc. Tranche B, term loan 4.5% 2/5/23 (c) | 10,421 | 10,471 | |
| Solera LLC Tranche B, term loan 4.25% 3/3/23 (c) | 32,808 | 33,031 | |
| Sophia L.P. term loan 4.3968% 9/30/22 (c) | 26,564 | 26,517 | |
| SS&C Technologies, Inc.: | |||
| Tranche B 1LN, term loan 3.2428% 7/8/22 (c) | 16,249 | 16,360 | |
| Tranche B 2LN, term loan 3.2428% 7/8/22 (c) | 1,349 | 1,359 | |
| Sybil Software LLC. Tranche B, term loan 4.3968% 9/30/23 (c) | 37,207 | 37,549 | |
| Syniverse Holdings, Inc. Tranche B, term loan: | |||
| 4.1468% 4/23/19 (c) | 16,107 | 14,778 | |
| 4.1718% 4/23/19 (c) | 9,368 | 8,563 | |
| Tempo Acquisition LLC Tranche B, term loan 4/20/24 (b) | 41,890 | 41,859 | |
| TIBCO Software, Inc. Tranche 1LN, term loan 5.5% 12/5/20 (c) | 8,063 | 8,134 | |
| TTM Technologies, Inc. Tranche B 1LN, term loan 5.25% 5/31/21 (c) | 27,446 | 27,926 | |
| Uber Technologies, Inc. Tranche B, term loan 5% 7/13/23 (c) | 30,348 | 30,253 | |
| Vantiv LLC Tranche B, term loan 3.49% 10/14/23 (c) | 12,784 | 12,876 | |
| Veritas U.S., Inc. Tranche B 1LN, term loan 6.7718% 1/27/23 (c) | 29,856 | 29,682 | |
| WEX, Inc. Tranche B, term loan 4.4928% 7/1/23 (c) | 18,395 | 18,573 | |
| TOTAL TECHNOLOGY | 1,155,157 | ||
| Telecommunications - 7.5% | |||
| Altice Financing SA Tranche B, term loan 3.908% 6/22/25(c) | 11,000 | 10,992 | |
| Blucora, Inc. Tranche B, term loan 4/20/24 (b) | 5,500 | 5,500 | |
| Consolidated Communications, Inc. Tranche B 2LN, term loan 10/5/23 (b) | 20,500 | 20,603 | |
| Digicel International Finance Ltd. Tranche D 2LN, term loan 4.6468% 3/31/19 (c) | 31,560 | 31,166 | |
| DigitalGlobe, Inc. Tranche B, term loan 3.7428% 1/15/24 (c) | 11,192 | 11,234 | |
| Evo Payments International LLC Tranche B 1LN, term loan 6% 12/20/23 (c) | 17,995 | 18,186 | |
| FairPoint Communications, Inc. Tranche B, term loan 7.5% 2/14/19 (c) | 9,890 | 9,923 | |
| Frontier Communications Corp. Tranche A, term loan 3.75% 3/31/21 (c) | 2,468 | 2,396 | |
| GTT Communications, Inc. Tranche B, term loan 5% 1/9/24 (c) | 7,002 | 7,068 | |
| Intelsat Jackson Holdings SA Tranche B 2LN, term loan 3.8873% 6/30/19 (c) | 126,675 | 124,904 | |
| Level 3 Financing, Inc. Tranche B, term loan 3.2411% 2/22/24 (c) | 79,500 | 79,727 | |
| LTS Buyer LLC Tranche B 1LN, term loan 4.3968% 4/11/20 (c) | 50,149 | 50,284 | |
| Neptune Finco Corp.: | |||
| Tranche B, term loan 3.2439% 7/17/25 (c) | 25,038 | 25,016 | |
| Tranche DD 1LN, term loan 3.2439% 7/17/25 (c) | 1,243 | 1,240 | |
| Neustar, Inc.: | |||
| Tranche 2LN, term loan 2/28/25 (b) | 5,460 | 5,508 | |
| Tranche B1 1LN, term loan 8/31/19 (b) | 4,000 | 4,068 | |
| Tranche B2 1LN, term loan 2/29/24 (b) | 18,995 | 19,240 | |
| Onvoy LLC Tranche B 1LN, term loan 5.6468% 2/10/24 (c) | 20,065 | 20,065 | |
| Polycom, Inc. Tranche B, term loan 6.25% 9/27/23 (c) | 18,417 | 18,572 | |
| RP Crown Parent, LLC Tranche B, term loan 4.5% 10/12/23 (c) | 28,429 | 28,636 | |
| Sable International Finance Ltd. Tranche B 1LN, term loan 5.7322% 12/31/22 (c) | 13,895 | 13,958 | |
| SBA Senior Finance II, LLC term loan 3.25% 3/24/21 (c) | 31,146 | 31,326 | |
| Securus Technologies Holdings, Inc.: | |||
| Tranche 2LN, term loan 9% 4/30/21 (c) | 7,775 | 7,752 | |
| Tranche B 1LN, term loan 4.75% 4/30/20 (c) | 38,553 | 38,469 | |
| Securus Technologies, Inc. Tranche B2 1LN, term loan 5.3968% 4/30/20 (c) | 4,497 | 4,487 | |
| SFR Group SA Tranche B 11LN, term loan 3.9441% 7/31/25 (c) | 34,500 | 34,318 | |
| Sprint Communications, Inc. Tranche B, term loan 3.5% 2/3/24 (c) | 79,960 | 80,010 | |
| TCH-2 Holdings, LLC. Tranche B 1LN, term loan 5.5% 5/12/21 (c) | 7,759 | 7,818 | |
| Telenet Financing USD LLC Tranche B, term loan 3.9655% 1/31/25 (c) | 10,500 | 10,515 | |
| Telesat LLC Tranche B 4LN, term loan 4.15% 11/17/23 (c) | 53,065 | 53,436 | |
| Windstream Services LLC Tranche B 7LN, term loan 4.25% 2/17/24 (c) | 14,733 | 14,715 | |
| Xplornet Communications, Inc. Tranche B, term loan 7.1468% 9/9/21 (c) | 2,985 | 3,011 | |
| TOTAL TELECOMMUNICATIONS | 794,143 | ||
| Textiles/Apparel - 0.1% | |||
| ABB Optical Group LLC Tranche B, term loan 6.1161% 6/15/23 (c) | 8,783 | 8,860 | |
| Transportation Ex Air/Rail - 0.2% | |||
| American Commercial Barge Line Tranche B 1LN, term loan 9.75% 11/12/20 (c) | 17,358 | 15,753 | |
| Navios Maritime Partners LP Tranche B, term loan 6.13% 9/14/20 (c) | 9,600 | 9,504 | |
| TOTAL TRANSPORTATION EX AIR/RAIL | 25,257 | ||
| Utilities - 4.7% | |||
| APLP Holdings LP Tranche B, term loan 5.9928% 4/13/23 (c) | 21,960 | 22,015 | |
| Calpine Construction Finance Co. LP: | |||
| Tranche B 1LN, term loan 3.24% 5/3/20 (c) | 50,866 | 50,882 | |
| Tranche B 2LN, term loan 3.49% 1/31/22 (c) | 7,027 | 7,025 | |
| Calpine Corp.: | |||
| Tranche B 5LN, term loan 3.9% 1/15/24 (c) | 32,128 | 32,211 | |
| Tranche B, term loan 2.75% 11/30/17 (c) | 11,273 | 11,296 | |
| Cortes NP Acquisition Corp. Tranche B, term loan 5.0302% 11/30/23 (c) | 21,930 | 22,058 | |
| Dynegy, Inc. Tranche C, term loan 4.25% 2/7/24 (c) | 56,000 | 55,956 | |
| Energy Future Holdings Corp. term loan 4.304% 6/30/17 (c) | 84,714 | 85,122 | |
| Essential Power LLC Tranche B, term loan 4.75% 8/8/19 (c) | 12,733 | 12,737 | |
| Exgen Texas Power LLC Tranche B, term loan 5.8968% 9/18/21 (c) | 26,316 | 14,158 | |
| Houston Fuel Oil Terminal Co. Tranche B, term loan 4.4% 8/19/21 (c) | 28,950 | 28,823 | |
| InterGen NV Tranche B, term loan 5.65% 6/13/20 (c) | 32,645 | 32,523 | |
| Limetree Bay Terminals LLC term loan 6.04% 2/15/24 (c) | 21,040 | 21,277 | |
| Moxie Patriot LLC Tranche B, term loan 6.8968% 12/19/20 (c) | 17,796 | 16,728 | |
| Southcross Energy Partners LP Tranche B, term loan 5.3968% 8/4/21 (c) | 5,740 | 5,072 | |
| Southcross Holdings Borrower LP Tranche B, term loan 9% 4/13/23 | 2,736 | 2,421 | |
| Tex Operations Co. LLC: | |||
| Tranche B, term loan 3.7526% 8/4/23 (c) | 41,019 | 40,929 | |
| Tranche C, term loan 3.7428% 8/4/23 (c) | 9,379 | 9,358 | |
| USIC Holdings, Inc. Tranche 1LN, term loan 5.1699% 12/9/23 (c) | 5,985 | 6,022 | |
| Vistra Operations Co. LLC Tranche B 2LN, term loan 4.2537% 12/14/23 (c) | 22,693 | 22,764 | |
| TOTAL UTILITIES | 499,377 | ||
| TOTAL BANK LOAN OBLIGATIONS | |||
| (Cost $9,228,085) | 9,219,753 | ||
| Nonconvertible Bonds - 6.3% | |||
| Broadcasting - 0.1% | |||
| AMC Networks, Inc. 4.75% 12/15/22 | 6,600 | 6,732 | |
| Univision Communications, Inc. 6.75% 9/15/22 (f) | 5,368 | 5,623 | |
| TOTAL BROADCASTING | 12,355 | ||
| Building Materials - 0.1% | |||
| CEMEX S.A.B. de CV 5.9084% 10/15/18 (c)(f) | 10,000 | 10,407 | |
| Cable/Satellite TV - 0.4% | |||
| CCO Holdings LLC/CCO Holdings Capital Corp.: | |||
| 5.125% 2/15/23 | 17,065 | 17,748 | |
| 5.25% 3/15/21 | 13,070 | 13,462 | |
| Cequel Communications Escrow I LLC/Cequel Communications Escrow Capital Corp. 6.375% 9/15/20 (f) | 7,507 | 7,737 | |
| Virgin Media Finance PLC 4.875% 2/15/22 | 2,000 | 1,795 | |
| TOTAL CABLE/SATELLITE TV | 40,742 | ||
| Chemicals - 0.0% | |||
| Nufarm Australia Ltd. 6.375% 10/15/19 (f) | 5,000 | 5,131 | |
| Containers - 0.7% | |||
| Ardagh Packaging Finance PLC/Ardagh MP Holdings U.S.A., Inc.: | |||
| 4.25% 9/15/22 (f) | 15,000 | 15,288 | |
| 4.289% 5/15/21 (c)(f) | 7,000 | 7,149 | |
| 6% 2/15/25 (f) | 10,000 | 10,338 | |
| Reynolds Group Issuer, Inc./Reynolds Group Issuer LLC/Reynolds Group Issuer (Luxembourg) SA: | |||
| 4.6584% 7/15/21 (c)(f) | 11,130 | 11,380 | |
| 5.75% 10/15/20 | 33,325 | 34,325 | |
| TOTAL CONTAINERS | 78,480 | ||
| Diversified Financial Services - 0.5% | |||
| CIT Group, Inc. 5% 5/15/18 (f) | 7,000 | 7,041 | |
| Icahn Enterprises LP/Icahn Enterprises Finance Corp.: | |||
| 4.875% 3/15/19 | 15,000 | 15,188 | |
| 6.25% 2/1/22 (f) | 5,200 | 5,408 | |
| International Lease Finance Corp.: | |||
| 3.875% 4/15/18 | 7,000 | 7,129 | |
| 6.25% 5/15/19 | 10,000 | 10,779 | |
| Prime Securities Services Borrower LLC/Prime Finance, Inc. 9.25% 5/15/23 (f) | 10,000 | 10,925 | |
| TOTAL DIVERSIFIED FINANCIAL SERVICES | 56,470 | ||
| Energy - 0.5% | |||
| Cheniere Corpus Christi Holdings LLC 7% 6/30/24 (f) | 7,000 | 7,822 | |
| Chesapeake Energy Corp. 8% 12/15/22 (f) | 17,832 | 18,790 | |
| Citgo Petroleum Corp. 6.25% 8/15/22 (f) | 10,000 | 10,200 | |
| Peabody Securities Finance Corp. 6% 3/31/22 (f) | 3,335 | 3,402 | |
| Targa Resources Partners LP/Targa Resources Partners Finance Corp. 6.375% 8/1/22 | 4,492 | 4,629 | |
| Western Refining, Inc. 6.25% 4/1/21 | 5,305 | 5,477 | |
| TOTAL ENERGY | 50,320 | ||
| Entertainment/Film - 0.0% | |||
| Cinemark U.S.A., Inc. 5.125% 12/15/22 | 3,185 | 3,281 | |
| Food/Beverage/Tobacco - 0.0% | |||
| ESAL GmbH 6.25% 2/5/23 (f) | 4,000 | 4,055 | |
| Gaming - 0.2% | |||
| Gateway Casinos & Entertainment Ltd. 8.25% 3/1/24 (f) | 5,000 | 5,113 | |
| MCE Finance Ltd. 5% 2/15/21 (f) | 10,000 | 10,219 | |
| Scientific Games Corp. 7% 1/1/22 (f) | 7,800 | 8,351 | |
| TOTAL GAMING | 23,683 | ||
| Healthcare - 0.8% | |||
| Community Health Systems, Inc. 6.25% 3/31/23 | 14,175 | 14,423 | |
| DaVita HealthCare Partners, Inc. 5.75% 8/15/22 | 8,235 | 8,534 | |
| HCA Holdings, Inc. 3.75% 3/15/19 | 25,000 | 25,531 | |
| MPT Operating Partnership LP/MPT Finance Corp. 5.25% 8/1/26 | 3,570 | 3,659 | |
| Tenet Healthcare Corp.: | |||
| 4.6312% 6/15/20 (c) | 17,895 | 17,984 | |
| 4.75% 6/1/20 | 8,680 | 8,810 | |
| 7.5% 1/1/22 (f) | 5,085 | 5,441 | |
| TOTAL HEALTHCARE | 84,382 | ||
| Homebuilders/Real Estate - 0.2% | |||
| CBRE Group, Inc. 5% 3/15/23 | 17,990 | 18,800 | |
| Leisure - 0.2% | |||
| Studio City Co. Ltd.: | |||
| 5.875% 11/30/19 (f) | 6,860 | 7,177 | |
| 7.25% 11/30/21 (f) | 10,000 | 10,720 | |
| TOTAL LEISURE | 17,897 | ||
| Paper - 0.1% | |||
| Xerium Technologies, Inc. 9.5% 8/15/21 | 9,500 | 9,856 | |
| Publishing/Printing - 0.1% | |||
| Cenveo Corp. 6% 8/1/19 (f) | 9,850 | 8,028 | |
| Services - 0.3% | |||
| APX Group, Inc.: | |||
| 7.875% 12/1/22 (f) | 5,000 | 5,450 | |
| 7.875% 12/1/22 | 8,975 | 9,783 | |
| Avis Budget Car Rental LLC/Avis Budget Finance, Inc. 3.8046% 12/1/17 (c) | 14,410 | 14,417 | |
| TOTAL SERVICES | 29,650 | ||
| Super Retail - 0.1% | |||
| JC Penney Corp., Inc. 5.875% 7/1/23 (f) | 6,385 | 6,449 | |
| Technology - 0.5% | |||
| Brocade Communications Systems, Inc. 4.625% 1/15/23 | 10,770 | 11,012 | |
| Diamond 1 Finance Corp./Diamond 2 Finance Corp.: | |||
| 3.48% 6/1/19 (f) | 6,199 | 6,341 | |
| 4.42% 6/15/21 (f) | 16,685 | 17,512 | |
| NXP BV/NXP Funding LLC: | |||
| 4.125% 6/1/21 (f) | 16,440 | 17,200 | |
| 5.75% 3/15/23 (f) | 5,000 | 5,275 | |
| TOTAL TECHNOLOGY | 57,340 | ||
| Telecommunications - 1.4% | |||
| Altice Financing SA: | |||
| 6.5% 1/15/22 (f) | 7,240 | 7,593 | |
| 7.5% 5/15/26 (f) | 19,200 | 20,736 | |
| Columbus International, Inc. 7.375% 3/30/21 (f) | 14,535 | 15,643 | |
| Intelsat Jackson Holdings SA 8% 2/15/24 (f) | 14,100 | 15,158 | |
| Level 3 Financing, Inc. 4.7621% 1/15/18 (c) | 15,000 | 15,038 | |
| SFR Group SA: | |||
| 6% 5/15/22 (f) | 2,550 | 2,658 | |
| 6.25% 5/15/24 (f) | 10,905 | 11,287 | |
| 7.375% 5/1/26 (f) | 18,755 | 19,716 | |
| Sprint Capital Corp.: | |||
| 6.875% 11/15/28 | 4,000 | 4,330 | |
| 6.9% 5/1/19 | 5,000 | 5,344 | |
| Sprint Communications, Inc.: | |||
| 6% 11/15/22 | 30,000 | 31,256 | |
| 9% 11/15/18 (f) | 3,000 | 3,281 | |
| TOTAL TELECOMMUNICATIONS | 152,040 | ||
| Utilities - 0.1% | |||
| NRG Energy, Inc. 6.625% 3/15/23 | 4,000 | 4,060 | |
| The AES Corp. 4.0546% 6/1/19 (c) | 1,433 | 1,434 | |
| TOTAL UTILITIES | 5,494 | ||
| TOTAL NONCONVERTIBLE BONDS | |||
| (Cost $661,548) | 674,860 | ||
| Shares | Value (000s) | ||
| Common Stocks - 0.3% | |||
| Broadcasting - 0.0% | |||
| Cumulus Media, Inc. Class A (g) | 28,882 | 8 | |
| ION Media Networks, Inc. | 2,842 | 1,455 | |
| TOTAL BROADCASTING | 1,463 | ||
| Chemicals - 0.2% | |||
| LyondellBasell Industries NV Class A | 245,943 | 20,846 | |
| Homebuilders/Real Estate - 0.0% | |||
| Five Point Holdings LLC Class A (g) | 45,793 | 641 | |
| Metals/Mining - 0.1% | |||
| Warrior Met Coal, Inc. (g) | 496,683 | 8,082 | |
| Paper - 0.0% | |||
| White Birch Cayman Holdings Ltd. (g) | 12,570 | 0 | |
| Telecommunications - 0.0% | |||
| FairPoint Communications, Inc. (g) | 34,287 | 585 | |
| Utilities - 0.0% | |||
| Calpine Corp. (g) | 20,715 | 211 | |
| Southcross Holdings Borrower LP | 2,927 | 1,365 | |
| TOTAL UTILITIES | 1,576 | ||
| TOTAL COMMON STOCKS | |||
| (Cost $85,130) | 33,193 | ||
| Money Market Funds - 11.5% | |||
| Fidelity Cash Central Fund, 0.85% (h) | |||
| (Cost $1,223,646) | 1,223,570,804 | 1,223,816 | |
| TOTAL INVESTMENT PORTFOLIO - 104.6% | |||
| (Cost $11,198,409) | 11,151,622 | ||
| NET OTHER ASSETS (LIABILITIES) - (4.6)% | (495,226) | ||
| NET ASSETS - 100% | $10,656,396 |
Values shown as $0 may reflect amounts less than $500.
Legend
(a) Remaining maturities of bank loan obligations may be less than the stated maturities shown as a result of contractual or optional prepayments by the borrower. Such prepayments cannot be predicted with certainty.
(b) The coupon rate will be determined upon settlement of the loan after period end.
(c) Coupon rates for floating and adjustable rate securities reflect the rates in effect at period end.
(d) Position represents an unfunded loan commitment. At period end, the total principal amount and market value of unfunded commitments totaled $905,000 and $910,000, respectively.
(e) Non-income producing - Security is in default.
(f) Security exempt from registration under Rule 144A of the Securities Act of 1933. These securities may be resold in transactions exempt from registration, normally to qualified institutional buyers. At the end of the period, the value of these securities amounted to $350,044,000 or 3.3% of net assets.
(g) Non-income producing
(h) Affiliated fund that is generally available only to investment companies and other accounts managed by Fidelity Investments. The rate quoted is the annualized seven-day yield of the fund at period end. A complete unaudited listing of the fund's holdings as of its most recent quarter end is available upon request. In addition, each Fidelity Central Fund's financial statements, which are not covered by the Fund's Report of Independent Registered Public Accounting Firm, are available on the SEC's website or upon request.
Affiliated Central Funds
Information regarding fiscal year to date income earned by the Fund from investments in Fidelity Central Funds is as follows:
| Fund | Income earned |
| (Amounts in thousands) | |
| Fidelity Cash Central Fund | $3,589 |
| Total | $3,589 |
Investment Valuation
The following is a summary of the inputs used, as of April 30, 2017, involving the Fund's assets and liabilities carried at fair value. The inputs or methodology used for valuing securities may not be an indication of the risk associated with investing in those securities. For more information on valuation inputs, and their aggregation into the levels used below, please refer to the Investment Valuation section in the accompanying Notes to Financial Statements.
| Valuation Inputs at Reporting Date: | ||||
| Description | Total | Level 1 | Level 2 | Level 3 |
| (Amounts in thousands) | ||||
| Investments in Securities: | ||||
| Equities: | ||||
| Consumer Discretionary | $1,463 | $8 | $-- | $1,455 |
| Energy | 8,082 | -- | 8,082 | -- |
| Materials | 20,846 | 20,846 | -- | -- |
| Real Estate | 641 | -- | 641 | -- |
| Telecommunication Services | 585 | 585 | -- | -- |
| Utilities | 1,576 | 211 | -- | 1,365 |
| Bank Loan Obligations | 9,219,753 | -- | 9,166,680 | 53,073 |
| Corporate Bonds | 674,860 | -- | 674,860 | -- |
| Money Market Funds | 1,223,816 | 1,223,816 | -- | -- |
| Total Investments in Securities: | $11,151,622 | $1,245,466 | $9,850,263 | $55,893 |
Other Information
Distribution of investments by country or territory of incorporation, as a percentage of Total Net Assets, is as follows (Unaudited):
| United States of America | 90.0% |
| Luxembourg | 4.4% |
| Canada | 1.4% |
| Netherlands | 1.3% |
| Others (Individually Less Than 1%) | 2.9% |
| 100.0% |
See accompanying notes which are an integral part of the financial statements.
Financial Statements
Statement of Assets and Liabilities
| Amounts in thousands (except per-share amounts) | April 30, 2017 | |
| Assets | ||
| Investment in securities, at value — See accompanying schedule: Unaffiliated issuers (cost $9,974,763) | $9,927,806 | |
| Fidelity Central Funds (cost $1,223,646) | 1,223,816 | |
| Total Investments (cost $11,198,409) | $11,151,622 | |
| Cash | 92,928 | |
| Receivable for investments sold | ||
| Regular delivery | 173,620 | |
| Delayed delivery | 2,247 | |
| Receivable for fund shares sold | 11,734 | |
| Dividends receivable | 1,764 | |
| Interest receivable | 51,487 | |
| Distributions receivable from Fidelity Central Funds | 819 | |
| Prepaid expenses | 6 | |
| Total assets | 11,486,227 | |
| Liabilities | ||
| Payable for investments purchased | $805,624 | |
| Payable for fund shares redeemed | 11,195 | |
| Distributions payable | 6,046 | |
| Accrued management fee | 4,938 | |
| Distribution and service plan fees payable | 644 | |
| Other affiliated payables | 1,287 | |
| Other payables and accrued expenses | 97 | |
| Total liabilities | 829,831 | |
| Net Assets | $10,656,396 | |
| Net Assets consist of: | ||
| Paid in capital | $11,033,422 | |
| Undistributed net investment income | 33,821 | |
| Accumulated undistributed net realized gain (loss) on investments | (364,060) | |
| Net unrealized appreciation (depreciation) on investments | (46,787) | |
| Net Assets | $10,656,396 | |
| Calculation of Maximum Offering Price | ||
| Class A: | ||
| Net Asset Value and redemption price per share ($628,832 ÷ 65,026 shares) | $9.67 | |
| Maximum offering price per share (100/97.25 of $9.67) | $9.94 | |
| Class M: | ||
| Net Asset Value and redemption price per share ($146,872 ÷ 15,210 shares) | $9.66 | |
| Maximum offering price per share (100/97.25 of $9.66) | $9.93 | |
| Class C: | ||
| Net Asset Value and offering price per share ($576,089 ÷ 59,585 shares)(a) | $9.67 | |
| Fidelity Floating Rate High Income Fund: | ||
| Net Asset Value, offering price and redemption price per share ($7,185,632 ÷ 744,051 shares) | $9.66 | |
| Class I: | ||
| Net Asset Value, offering price and redemption price per share ($2,118,971 ÷ 219,589 shares) | $9.65 |
(a) Redemption price per share is equal to net asset value less any applicable contingent deferred sales charge.
See accompanying notes which are an integral part of the financial statements.
Statement of Operations
| Amounts in thousands | Six months ended April 30, 2017 | |
| Investment Income | ||
| Dividends | $2,942 | |
| Interest | 230,638 | |
| Income from Fidelity Central Funds | 3,589 | |
| Total income | 237,169 | |
| Expenses | ||
| Management fee | $28,286 | |
| Transfer agent fees | 6,694 | |
| Distribution and service plan fees | 4,011 | |
| Accounting fees and expenses | 788 | |
| Custodian fees and expenses | 48 | |
| Independent trustees' fees and expenses | 20 | |
| Registration fees | 194 | |
| Audit | 92 | |
| Legal | 34 | |
| Miscellaneous | 36 | |
| Total expenses before reductions | 40,203 | |
| Expense reductions | (76) | 40,127 |
| Net investment income (loss) | 197,042 | |
| Realized and Unrealized Gain (Loss) | ||
| Net realized gain (loss) on: | ||
| Investment securities: | ||
| Unaffiliated issuers | 18,195 | |
| Fidelity Central Funds | 1 | |
| Total net realized gain (loss) | 18,196 | |
| Change in net unrealized appreciation (depreciation) on investment securities | 50,010 | |
| Net gain (loss) | 68,206 | |
| Net increase (decrease) in net assets resulting from operations | $265,248 |
See accompanying notes which are an integral part of the financial statements.
Statement of Changes in Net Assets
| Amounts in thousands | Six months ended April 30, 2017 | Year ended October 31, 2016 |
| Increase (Decrease) in Net Assets | ||
| Operations | ||
| Net investment income (loss) | $197,042 | $349,986 |
| Net realized gain (loss) | 18,196 | (225,620) |
| Change in net unrealized appreciation (depreciation) | 50,010 | 386,147 |
| Net increase (decrease) in net assets resulting from operations | 265,248 | 510,513 |
| Distributions to shareholders from net investment income | (190,918) | (383,140) |
| Share transactions - net increase (decrease) | 1,243,239 | (1,573,710) |
| Redemption fees | 251 | 413 |
| Total increase (decrease) in net assets | 1,317,820 | (1,445,924) |
| Net Assets | ||
| Beginning of period | 9,338,576 | 10,784,500 |
| End of period | $10,656,396 | $9,338,576 |
| Other Information | ||
| Undistributed net investment income end of period | $33,821 | $27,697 |
See accompanying notes which are an integral part of the financial statements.
Financial Highlights — Fidelity Advisor Floating Rate High Income Fund Class A
| Six months ended April 30, | Years ended October 31, | |||||
| 2017 | 2016 | 2015 | 2014 | 2013 | 2012 | |
| Selected Per–Share Data | ||||||
| Net asset value, beginning of period | $9.60 | $9.42 | $9.85 | $9.99 | $9.94 | $9.73 |
| Income from Investment Operations | ||||||
| Net investment income (loss)A | .179 | .334 | .375 | .317 | .310 | .340 |
| Net realized and unrealized gain (loss) | .064 | .211 | (.425) | (.114) | .070 | .195 |
| Total from investment operations | .243 | .545 | (.050) | .203 | .380 | .535 |
| Distributions from net investment income | (.173) | (.365) | (.341) | (.307) | (.282) | (.325) |
| Distributions from net realized gain | – | – | (.040) | (.036) | (.049) | – |
| Total distributions | (.173) | (.365) | (.381) | (.343) | (.331) | (.325) |
| Redemption fees added to paid in capitalA | –B | –B | .001 | –B | .001 | –B |
| Net asset value, end of period | $9.67 | $9.60 | $9.42 | $9.85 | $9.99 | $9.94 |
| Total ReturnC,D,E | 2.55% | 5.98% | (.53)% | 2.05% | 3.89% | 5.60% |
| Ratios to Average Net AssetsF,G | ||||||
| Expenses before reductions | .99%H | .99% | .98% | .98% | .99% | .99% |
| Expenses net of fee waivers, if any | .99%H | .99% | .98% | .98% | .99% | .99% |
| Expenses net of all reductions | .99%H | .98% | .98% | .98% | .99% | .99% |
| Net investment income (loss) | 3.74%H | 3.58% | 3.86% | 3.17% | 3.11% | 3.47% |
| Supplemental Data | ||||||
| Net assets, end of period (in millions) | $629 | $707 | $863 | $1,185 | $1,681 | $1,305 |
| Portfolio turnover rateI | 85%H | 46% | 26% | 54% | 62% | 49% |
A Calculated based on average shares outstanding during the period.
B Amount represents less than $.0005 per share.
C Total returns for periods of less than one year are not annualized.
D Total returns would have been lower if certain expenses had not been reduced during the applicable periods shown.
E Total returns do not include the effect of the sales charges.
F Fees and expenses of any underlying Fidelity Central Funds are not included in the Fund's expense ratio. The Fund indirectly bears its proportionate share of the expenses of any underlying Fidelity Central Funds.
G Expense ratios reflect operating expenses of the class. Expenses before reductions do not reflect amounts reimbursed by the investment adviser or reductions from brokerage service arrangements or reductions from other expense offset arrangements and do not represent the amount paid by the class during periods when reimbursements or reductions occur. Expenses net of fee waivers reflect expenses after reimbursement by the investment adviser but prior to reductions from brokerage service arrangements or other expense offset arrangements. Expenses net of all reductions represent the net expenses paid by the class.
H Annualized
I Amount does not include the portfolio activity of any underlying Fidelity Central Funds.
See accompanying notes which are an integral part of the financial statements.
Financial Highlights — Fidelity Advisor Floating Rate High Income Fund Class M
| Six months ended April 30, | Years ended October 31, | |||||
| 2017 | 2016 | 2015 | 2014 | 2013 | 2012 | |
| Selected Per–Share Data | ||||||
| Net asset value, beginning of period | $9.58 | $9.40 | $9.84 | $9.98 | $9.93 | $9.72 |
| Income from Investment Operations | ||||||
| Net investment income (loss)A | .176 | .324 | .365 | .306 | .299 | .330 |
| Net realized and unrealized gain (loss) | .075 | .212 | (.434) | (.112) | .071 | .195 |
| Total from investment operations | .251 | .536 | (.069) | .194 | .370 | .525 |
| Distributions from net investment income | (.171) | (.356) | (.332) | (.298) | (.272) | (.315) |
| Distributions from net realized gain | – | – | (.040) | (.036) | (.049) | – |
| Total distributions | (.171) | (.356) | (.372) | (.334) | (.321) | (.315) |
| Redemption fees added to paid in capitalA | –B | –B | .001 | –B | .001 | –B |
| Net asset value, end of period | $9.66 | $9.58 | $9.40 | $9.84 | $9.98 | $9.93 |
| Total ReturnC,D,E | 2.63% | 5.89% | (.72)% | 1.96% | 3.79% | 5.50% |
| Ratios to Average Net AssetsF,G | ||||||
| Expenses before reductions | 1.04%H | 1.08% | 1.07% | 1.07% | 1.09% | 1.09% |
| Expenses net of fee waivers, if any | 1.04%H | 1.08% | 1.07% | 1.07% | 1.09% | 1.09% |
| Expenses net of all reductions | 1.04%H | 1.08% | 1.07% | 1.07% | 1.09% | 1.09% |
| Net investment income (loss) | 3.69%H | 3.48% | 3.77% | 3.08% | 3.01% | 3.37% |
| Supplemental Data | ||||||
| Net assets, end of period (in millions) | $147 | $171 | $195 | $240 | $272 | $241 |
| Portfolio turnover rateI | 85%H | 46% | 26% | 54% | 62% | 49% |
A Calculated based on average shares outstanding during the period.
B Amount represents less than $.0005 per share.
C Total returns for periods of less than one year are not annualized.
D Total returns would have been lower if certain expenses had not been reduced during the applicable periods shown.
E Total returns do not include the effect of the sales charges.
F Fees and expenses of any underlying Fidelity Central Funds are not included in the Fund's expense ratio. The Fund indirectly bears its proportionate share of the expenses of any underlying Fidelity Central Funds.
G Expense ratios reflect operating expenses of the class. Expenses before reductions do not reflect amounts reimbursed by the investment adviser or reductions from brokerage service arrangements or reductions from other expense offset arrangements and do not represent the amount paid by the class during periods when reimbursements or reductions occur. Expenses net of fee waivers reflect expenses after reimbursement by the investment adviser but prior to reductions from brokerage service arrangements or other expense offset arrangements. Expenses net of all reductions represent the net expenses paid by the class.
H Annualized
I Amount does not include the portfolio activity of any underlying Fidelity Central Funds.
See accompanying notes which are an integral part of the financial statements.
Financial Highlights — Fidelity Advisor Floating Rate High Income Fund Class C
| Six months ended April 30, | Years ended October 31, | |||||
| 2017 | 2016 | 2015 | 2014 | 2013 | 2012 | |
| Selected Per–Share Data | ||||||
| Net asset value, beginning of period | $9.59 | $9.41 | $9.85 | $9.99 | $9.94 | $9.73 |
| Income from Investment Operations | ||||||
| Net investment income (loss)A | .142 | .263 | .301 | .241 | .235 | .267 |
| Net realized and unrealized gain (loss) | .075 | .212 | (.434) | (.113) | .070 | .195 |
| Total from investment operations | .217 | .475 | (.133) | .128 | .305 | .462 |
| Distributions from net investment income | (.137) | (.295) | (.268) | (.232) | (.207) | (.252) |
| Distributions from net realized gain | – | – | (.040) | (.036) | (.049) | – |
| Total distributions | (.137) | (.295) | (.308) | (.268) | (.256) | (.252) |
| Redemption fees added to paid in capitalA | –B | –B | .001 | –B | .001 | –B |
| Net asset value, end of period | $9.67 | $9.59 | $9.41 | $9.85 | $9.99 | $9.94 |
| Total ReturnC,D,E | 2.27% | 5.19% | (1.38)% | 1.29% | 3.11% | 4.81% |
| Ratios to Average Net AssetsF,G | ||||||
| Expenses before reductions | 1.75%H | 1.74% | 1.73% | 1.73% | 1.74% | 1.74% |
| Expenses net of fee waivers, if any | 1.75%H | 1.74% | 1.73% | 1.73% | 1.74% | 1.74% |
| Expenses net of all reductions | 1.75%H | 1.74% | 1.73% | 1.73% | 1.74% | 1.74% |
| Net investment income (loss) | 2.98%H | 2.82% | 3.10% | 2.41% | 2.35% | 2.72% |
| Supplemental Data | ||||||
| Net assets, end of period (in millions) | $576 | $582 | $671 | $835 | $960 | $806 |
| Portfolio turnover rateI | 85%H | 46% | 26% | 54% | 62% | 49% |
A Calculated based on average shares outstanding during the period.
B Amount represents less than $.0005 per share.
C Total returns for periods of less than one year are not annualized.
D Total returns would have been lower if certain expenses had not been reduced during the applicable periods shown.
E Total returns do not include the effect of the contingent deferred sales charge.
F Fees and expenses of any underlying Fidelity Central Funds are not included in the Fund's expense ratio. The Fund indirectly bears its proportionate share of the expenses of any underlying Fidelity Central Funds.
G Expense ratios reflect operating expenses of the class. Expenses before reductions do not reflect amounts reimbursed by the investment adviser or reductions from brokerage service arrangements or reductions from other expense offset arrangements and do not represent the amount paid by the class during periods when reimbursements or reductions occur. Expenses net of fee waivers reflect expenses after reimbursement by the investment adviser but prior to reductions from brokerage service arrangements or other expense offset arrangements. Expenses net of all reductions represent the net expenses paid by the class.
H Annualized
I Amount does not include the portfolio activity of any underlying Fidelity Central Funds.
See accompanying notes which are an integral part of the financial statements.
Financial Highlights — Fidelity Advisor Floating Rate High Income Fund
| Six months ended April 30, | Years ended October 31, | |||||
| 2017 | 2016 | 2015 | 2014 | 2013 | 2012 | |
| Selected Per–Share Data | ||||||
| Net asset value, beginning of period | $9.58 | $9.40 | $9.84 | $9.98 | $9.93 | $9.72 |
| Income from Investment Operations | ||||||
| Net investment income (loss)A | .192 | .359 | .401 | .344 | .337 | .368 |
| Net realized and unrealized gain (loss) | .075 | .212 | (.435) | (.113) | .071 | .195 |
| Total from investment operations | .267 | .571 | (.034) | .231 | .408 | .563 |
| Distributions from net investment income | (.187) | (.391) | (.367) | (.335) | (.310) | (.353) |
| Distributions from net realized gain | – | – | (.040) | (.036) | (.049) | – |
| Total distributions | (.187) | (.391) | (.407) | (.371) | (.359) | (.353) |
| Redemption fees added to paid in capitalA | –B | –B | .001 | –B | .001 | –B |
| Net asset value, end of period | $9.66 | $9.58 | $9.40 | $9.84 | $9.98 | $9.93 |
| Total ReturnC,D | 2.80% | 6.28% | (.36)% | 2.34% | 4.19% | 5.91% |
| Ratios to Average Net AssetsE,F | ||||||
| Expenses before reductions | .70%G | .71% | .70% | .69% | .70% | .71% |
| Expenses net of fee waivers, if any | .70%G | .71% | .70% | .69% | .70% | .71% |
| Expenses net of all reductions | .70%G | .71% | .70% | .69% | .70% | .71% |
| Net investment income (loss) | 4.03%G | 3.86% | 4.14% | 3.45% | 3.39% | 3.75% |
| Supplemental Data | ||||||
| Net assets, end of period (in millions) | $7,186 | $6,131 | $6,615 | $9,032 | $8,882 | $5,720 |
| Portfolio turnover rateH | 85%G | 46% | 26% | 54% | 62% | 49% |
A Calculated based on average shares outstanding during the period.
B Amount represents less than $.0005 per share.
C Total returns for periods of less than one year are not annualized.
D Total returns would have been lower if certain expenses had not been reduced during the applicable periods shown.
E Fees and expenses of any underlying Fidelity Central Funds are not included in the Fund's expense ratio. The Fund indirectly bears its proportionate share of the expenses of any underlying Fidelity Central Funds.
F Expense ratios reflect operating expenses of the class. Expenses before reductions do not reflect amounts reimbursed by the investment adviser or reductions from brokerage service arrangements or reductions from other expense offset arrangements and do not represent the amount paid by the class during periods when reimbursements or reductions occur. Expenses net of fee waivers reflect expenses after reimbursement by the investment adviser but prior to reductions from brokerage service arrangements or other expense offset arrangements. Expenses net of all reductions represent the net expenses paid by the class.
G Annualized
H Amount does not include the portfolio activity of any underlying Fidelity Central Funds.
See accompanying notes which are an integral part of the financial statements.
Financial Highlights — Fidelity Advisor Floating Rate High Income Fund Class I
| Six months ended April 30, | Years ended October 31, | |||||
| 2017 | 2016 | 2015 | 2014 | 2013 | 2012 | |
| Selected Per–Share Data | ||||||
| Net asset value, beginning of period | $9.58 | $9.40 | $9.83 | $9.97 | $9.92 | $9.71 |
| Income from Investment Operations | ||||||
| Net investment income (loss)A | .189 | .355 | .396 | .339 | .332 | .363 |
| Net realized and unrealized gain (loss) | .065 | .211 | (.424) | (.113) | .071 | .196 |
| Total from investment operations | .254 | .566 | (.028) | .226 | .403 | .559 |
| Distributions from net investment income | (.184) | (.386) | (.363) | (.330) | (.305) | (.349) |
| Distributions from net realized gain | – | – | (.040) | (.036) | (.049) | – |
| Total distributions | (.184) | (.386) | (.403) | (.366) | (.354) | (.349) |
| Redemption fees added to paid in capitalA | –B | –B | .001 | –B | .001 | –B |
| Net asset value, end of period | $9.65 | $9.58 | $9.40 | $9.83 | $9.97 | $9.92 |
| Total ReturnC,D | 2.67% | 6.23% | (.30)% | 2.29% | 4.15% | 5.87% |
| Ratios to Average Net AssetsE,F | ||||||
| Expenses before reductions | .76%G | .75% | .74% | .74% | .75% | .75% |
| Expenses net of fee waivers, if any | .76%G | .75% | .74% | .74% | .75% | .75% |
| Expenses net of all reductions | .76%G | .75% | .74% | .74% | .75% | .75% |
| Net investment income (loss) | 3.97%G | 3.81% | 4.10% | 3.40% | 3.34% | 3.71% |
| Supplemental Data | ||||||
| Net assets, end of period (in millions) | $2,119 | $1,748 | $2,429 | $3,317 | $3,646 | $2,510 |
| Portfolio turnover rateH | 85%G | 46% | 26% | 54% | 62% | 49% |
A Calculated based on average shares outstanding during the period.
B Amount represents less than $.0005 per share.
C Total returns for periods of less than one year are not annualized.
D Total returns would have been lower if certain expenses had not been reduced during the applicable periods shown.
E Fees and expenses of any underlying Fidelity Central Funds are not included in the Fund's expense ratio. The Fund indirectly bears its proportionate share of the expenses of any underlying Fidelity Central Funds.
F Expense ratios reflect operating expenses of the class. Expenses before reductions do not reflect amounts reimbursed by the investment adviser or reductions from brokerage service arrangements or reductions from other expense offset arrangements and do not represent the amount paid by the class during periods when reimbursements or reductions occur. Expenses net of fee waivers reflect expenses after reimbursement by the investment adviser but prior to reductions from brokerage service arrangements or other expense offset arrangements. Expenses net of all reductions represent the net expenses paid by the class.
G Annualized
H Amount does not include the portfolio activity of any underlying Fidelity Central Funds.
See accompanying notes which are an integral part of the financial statements.
Notes to Financial Statements
For the period ended April 30, 2017
(Amounts in thousands except percentages)
1. Organization.
Fidelity Advisor Floating Rate High Income Fund (the Fund) is a fund of Fidelity Advisor Series I (the Trust) and is authorized to issue an unlimited number of shares. The Trust is registered under the Investment Company Act of 1940, as amended (the 1940 Act), as an open-end management investment company organized as a Massachusetts business trust. The Fund offers Class A, Class M (formerly Class T), Class C, Fidelity Floating Rate High Income Fund and Class I shares, each of which has equal rights as to assets and voting privileges. Each class has exclusive voting rights with respect to matters that affect that class.
After the close of business on June 24, 2016, all outstanding Class B shares were converted to Class A shares. All prior fiscal period dollar and share amounts for Class B presented in the Notes to Financial Statements are for the period November 1, 2015 through June 24, 2016.
2. Investments in Fidelity Central Funds.
The Fund invests in Fidelity Central Funds, which are open-end investment companies generally available only to other investment companies and accounts managed by the investment adviser and its affiliates. The Fund's Schedule of Investments lists each of the Fidelity Central Funds held as of period end, if any, as an investment of the Fund, but does not include the underlying holdings of each Fidelity Central Fund. As an Investing Fund, the Fund indirectly bears its proportionate share of the expenses of the underlying Fidelity Central Funds.
The Money Market Central Funds seek preservation of capital and current income and are managed by Fidelity Investments Money Management, Inc. (FIMM), an affiliate of the investment adviser. Annualized expenses of the Money Market Central Funds as of their most recent shareholder report date are less than .005%.
A complete unaudited list of holdings for each Fidelity Central Fund is available upon request or at the Securities and Exchange Commission (the SEC) website at www.sec.gov. In addition, the financial statements of the Fidelity Central Funds, which are not covered by the Fund's Report of Independent Registered Public Accounting Firm, are available on the SEC website or upon request.
3. Significant Accounting Policies.
The Fund is an investment company and applies the accounting and reporting guidance of the Financial Accounting Standards Board (FASB) Accounting Standards Codification Topic 946 Financial Services – Investments Companies. The financial statements have been prepared in conformity with accounting principles generally accepted in the United States of America (GAAP), which require management to make certain estimates and assumptions at the date of the financial statements. Actual results could differ from those estimates. Subsequent events, if any, through the date that the financial statements were issued have been evaluated in the preparation of the financial statements. The following summarizes the significant accounting policies of the Fund:
Investment Valuation. Investments are valued as of 4:00 p.m. Eastern time on the last calendar day of the period. The Board of Trustees (the Board) has delegated the day to day responsibility for the valuation of the Fund's investments to the Fair Value Committee (the Committee) established by the Fund's investment adviser. In accordance with valuation policies and procedures approved by the Board, the Fund attempts to obtain prices from one or more third party pricing vendors or brokers to value its investments. When current market prices, quotations or currency exchange rates are not readily available or reliable, investments will be fair valued in good faith by the Committee, in accordance with procedures adopted by the Board. Factors used in determining fair value vary by investment type and may include market or investment specific events, changes in interest rates and credit quality. The frequency with which these procedures are used cannot be predicted and they may be utilized to a significant extent. The Committee oversees the Fund's valuation policies and procedures and reports to the Board on the Committee's activities and fair value determinations. The Board monitors the appropriateness of the procedures used in valuing the Fund's investments and ratifies the fair value determinations of the Committee.
The Fund categorizes the inputs to valuation techniques used to value its investments into a disclosure hierarchy consisting of three levels as shown below:
- Level 1 – quoted prices in active markets for identical investments
- Level 2 – other significant observable inputs (including quoted prices for similar investments, interest rates, prepayment speeds, etc.)
- Level 3 – unobservable inputs (including the Fund's own assumptions based on the best information available)
Valuation techniques used to value the Fund's investments by major category are as follows:
Debt securities, including restricted securities, are valued based on evaluated prices received from third party pricing vendors or from brokers who make markets in such securities. Corporate bonds and bank loan obligations are valued by pricing vendors who utilize matrix pricing which considers yield or price of bonds of comparable quality, coupon, maturity and type or by broker-supplied prices. When independent prices are unavailable or unreliable, debt securities may be valued utilizing pricing methodologies which consider similar factors that would be used by third party pricing vendors. Debt securities are generally categorized as Level 2 in the hierarchy but may be Level 3 depending on the circumstances. The Fund invests a significant portion of its assets in below investment grade securities. The value of these securities can be more volatile due to changes in the credit quality of the issuer and is sensitive to changes in economic, market and regulatory conditions.
Equity securities, including restricted securities, for which market quotations are readily available, are valued at the last reported sale price or official closing price as reported by a third party pricing vendor on the primary market or exchange on which they are traded and are categorized as Level 1 in the hierarchy. In the event there were no sales during the day or closing prices are not available, securities are valued at the last quoted bid price or may be valued using the last available price and are generally categorized as Level 2 in the hierarchy. For foreign equity securities, when market or security specific events arise, comparisons to the valuation of American Depositary Receipts (ADRs), futures contracts, Exchange-Traded Funds (ETFs) and certain indexes as well as quoted prices for similar securities may be used and would be categorized as Level 2 in the hierarchy. Utilizing these techniques may result in transfers between Level 1 and Level 2. For equity securities, including restricted securities, where observable inputs are limited, assumptions about market activity and risk are used and these securities may be categorized as Level 3 in the hierarchy.
Investments in open-end mutual funds, including the Fidelity Central Funds, are valued at their closing net asset value (NAV) each business day and are categorized as Level 1 in the hierarchy.
Changes in valuation techniques may result in transfers in or out of an assigned level within the disclosure hierarchy. The aggregate value of investments by input level as of April 30, 2017, is included at the end of the Fund's Schedule of Investments.
Investment Transactions and Income. For financial reporting purposes, the Fund's investment holdings and NAV include trades executed through the end of the last business day of the period. The NAV per share for processing shareholder transactions is calculated as of the close of business of the New York Stock Exchange (NYSE), normally 4:00 p.m. Eastern time and includes trades executed through the end of the prior business day. Gains and losses on securities sold are determined on the basis of identified cost. Dividend income is recorded on the ex-dividend date, except for certain dividends from foreign securities where the ex-dividend date may have passed, which are recorded as soon as the Fund is informed of the ex-dividend date. Non-cash dividends included in dividend income, if any, are recorded at the fair market value of the securities received. Income and capital gain distributions from Fidelity Central Funds, if any, are recorded on the ex-dividend date. Certain distributions received by the Fund represent a return of capital or capital gain. The Fund determines the components of these distributions subsequent to the ex-dividend date, based upon receipt of tax filings or other correspondence relating to the underlying investment. These distributions are recorded as a reduction of cost of investments and/or as a realized gain. Interest income is accrued as earned and includes coupon interest and amortization of premium and accretion of discount on debt securities as applicable. Debt obligations may be placed on non-accrual status and related interest income may be reduced by ceasing current accruals and writing off interest receivables when the collection of all or a portion of interest has become doubtful based on consistently applied procedures. A debt obligation is removed from non-accrual status when the issuer resumes interest payments or when collectability of interest is reasonably assured. The Fund earns certain fees in connection with its floating rate loan purchasing activities. These fees are in addition to interest payments earned and may include amendment fees, consent fees and prepayment fees. These fees are recorded as Interest in the accompanying financial statements.
Class Allocations and Expenses. Investment income, realized and unrealized capital gains and losses, common expenses of the Fund, and certain fund-level expense reductions, if any, are allocated daily on a pro-rata basis to each class based on the relative net assets of each class to the total net assets of the Fund. Each class differs with respect to transfer agent and distribution and service plan fees incurred. Certain expense reductions may also differ by class. For the reporting period, the allocated portion of income and expenses to each class as a percent of its average net assets may vary due to the timing of recording these transactions in relation to fluctuating net assets of the classes. Expenses directly attributable to a fund are charged to that fund. Expenses attributable to more than one fund are allocated among the respective funds on the basis of relative net assets or other appropriate methods. Expense estimates are accrued in the period to which they relate and adjustments are made when actual amounts are known.
Income Tax Information and Distributions to Shareholders. Each year, the Fund intends to qualify as a regulated investment company under Subchapter M of the Internal Revenue Code, including distributing substantially all of its taxable income and realized gains. As a result, no provision for U.S. Federal income taxes is required. The Fund files a U.S. federal tax return, in addition to state and local tax returns as required. The Fund's federal income tax returns are subject to examination by the Internal Revenue Service (IRS) for a period of three fiscal years after they are filed. State and local tax returns may be subject to examination for an additional fiscal year depending on the jurisdiction.
Dividends are declared and recorded daily and paid monthly from net investment income. Distributions from realized gains, if any, are declared and recorded on the ex-dividend date. Income dividends and capital gain distributions are declared separately for each class. Income and capital gain distributions are determined in accordance with income tax regulations, which may differ from GAAP.
Capital accounts within the financial statements are adjusted for permanent book-tax differences. These adjustments have no impact on net assets or the results of operations. Capital accounts are not adjusted for temporary book-tax differences which will reverse in a subsequent period.
Book-tax differences are primarily due to market discount, capital loss carryforwards and losses deferred due to wash sales.
The federal tax cost of investment securities and unrealized appreciation (depreciation) as of period end were as follows:
| Gross unrealized appreciation | $165,167 |
| Gross unrealized depreciation | (199,421) |
| Net unrealized appreciation (depreciation) on securities | $(34,254) |
| Tax cost | $11,185,876 |
Capital loss carryforwards are only available to offset future capital gains of the Fund to the extent provided by regulations and may be limited. Under the Regulated Investment Company Modernization Act of 2010 (the Act), the Fund is permitted to carry forward capital losses incurred in taxable years beginning after December 22, 2010 for an unlimited period and such capital losses are required to be used prior to any losses that expire. The capital loss carryforward information presented below, including any applicable limitation, is estimated as of prior fiscal period end and is subject to adjustment.
| No expiration | |
| Short-term | $(30,793) |
| Long-term | (343,092) |
| Total capital loss carryforward | $(373,885) |
Short-Term Trading (Redemption) Fees. Shares held by investors in the Fund less than 60 days may have been subject to a redemption fee equal to 1.00% of the NAV of shares redeemed. All redemption fees, which reduce the proceeds of the shareholder redemption, are retained by the Fund and accounted for as an addition to paid in capital.
Delayed Delivery Transactions and When-Issued Securities. During the period, the Fund transacted in securities on a delayed delivery or when-issued basis. Payment and delivery may take place after the customary settlement period for that security. The price of the underlying securities and the date when the securities will be delivered and paid for are fixed at the time the transaction is negotiated. The Fund may receive compensation for interest forgone in the purchase of a delayed delivery or when-issued security. With respect to purchase commitments, the Fund identifies securities as segregated in its records with a value at least equal to the amount of the commitment. Losses may arise due to changes in the value of the underlying securities or if the counterparty does not perform under the contract's terms, or if the issuer does not issue the securities due to political, economic, or other factors.
Restricted Securities. The Fund may invest in securities that are subject to legal or contractual restrictions on resale. These securities generally may be resold in transactions exempt from registration or to the public if the securities are registered. Disposal of these securities may involve time-consuming negotiations and expense, and prompt sale at an acceptable price may be difficult. Information regarding restricted securities is included at the end of the Fund's Schedule of Investments.
Loans and Other Direct Debt Instruments. The Fund invests in direct debt instruments which are interests in amounts owed to lenders by corporate or other borrowers. These instruments may be in the form of loans, trade claims or other receivables and may include standby financing commitments such as revolving credit facilities that obligate the Fund to supply additional cash to the borrower on demand. Loans may be acquired through assignment or participation. The Fund also invests in unfunded loan commitments, which are contractual obligations for future funding. Information regarding unfunded commitments is included at the end of the Fund's Schedule of Investments.
New Accounting Pronouncement. In March 2017, the Financial Accounting Standards Board (FASB) issued an Accounting Standards Update (ASU), ASU 2017-08, which amends the amortization period for certain callable debt securities that are held at a premium. The amendment requires the premium to be amortized to the earliest call date. The amendments do not require an accounting change for securities held at a discount. The ASU is effective for annual periods beginning after December 15, 2019. Management is currently evaluating the potential impact of these changes to the financial statements.
4. Purchase and Sales of Investments.
Purchases and sales of securities (including principal repayments of bank loan obligations), other than short-term securities, aggregated $5,092,928 and $3,947,745, respectively.
5. Fees and Other Transactions with Affiliates.
Management Fee. Fidelity Management & Research Company (the investment adviser) and its affiliates provide the Fund with investment management related services for which the Fund pays a monthly management fee. The management fee is the sum of an individual fund fee rate that is based on an annual rate of .45% of the Fund's average net assets and an annualized group fee rate that averaged .11% during the period. The group fee rate is based upon the average net assets of all the mutual funds advised by the investment adviser, including any mutual funds previously advised by the investment adviser that are currently advised by Fidelity SelectCo, LLC, an affiliate of the investment adviser. The group fee rate decreases as assets under management increase and increases as assets under management decrease. For the reporting period, the total annualized management fee rate was .56% of the Fund's average net assets.
Distribution and Service Plan Fees. In accordance with Rule 12b-1 of the 1940 Act, the Fund has adopted separate Distribution and Service Plans for each class of shares. Certain classes pay Fidelity Distributors Corporation (FDC), an affiliate of the investment adviser, separate Distribution and Service Fees, each of which is based on an annual percentage of each class' average net assets. In addition, FDC may pay financial intermediaries for selling shares of the Fund and providing shareholder support services. For the period, the Distribution and Service Fee rates, total fees and amounts retained by FDC were as follows:
| Distribution Fee | Service Fee | Total Fees | Retained by FDC |
|
| Class A | -% | .25% | $893 | $37 |
| Class M | -% | .25% | 207 | 4 |
| Class C | .75% | .25% | 2,911 | 190 |
| $4,011 | $231 |
Sales Load. FDC may receive a front-end sales charge of up to 2.75% for selling Class A shares and Class M shares, some of which is paid to financial intermediaries for selling shares of the Fund. Depending on the holding period, FDC may receive contingent deferred sales charges levied on Class A, Class M and Class C redemptions. The deferred sales charges are 1.00% for Class C shares, 1.00% or .50% for certain purchases of Class A shares and .25% for certain purchases of Class M shares.
For the period, sales charge amounts retained by FDC were as follows:
| Retained by FDC |
|
| Class A | $26 |
| Class M | 5 |
| Class C(a) | 12 |
| $43 |
(a) When Class C shares are initially sold, FDC pays commissions from its own resources to financial intermediaries through which the sales are made.
Transfer Agent Fees. Fidelity Investments Institutional Operations Company, Inc., (FIIOC), an affiliate of the investment adviser, is the transfer, dividend disbursing and shareholder servicing agent for each class of the Fund. FIIOC receives account fees and asset-based fees that vary according to the account size and type of account of the shareholders of the respective classes of the Fund. FIIOC pays for typesetting, printing and mailing of shareholder reports, except proxy statements.
For the period, transfer agent fees for each class were as follows:
| Amount | % of Class-Level Average Net Assets(a) |
|
| Class A | $545 | .15 |
| Class M | 167 | .20 |
| Class C | 453 | .16 |
| Fidelity Floating Rate High Income Fund | 3,860 | .12 |
| Class I | 1,669 | .17 |
| $ 6,694 |
(a) Annualized
Accounting Fees. Fidelity Service Company, Inc. (FSC), an affiliate of the investment adviser, maintains the Fund's accounting records. The fee is based on the level of average net assets for each month.
Interfund Trades. The Fund may purchase from or sell securities to other Fidelity Funds under procedures adopted by the Board. The procedures have been designed to ensure these interfund trades are executed in accordance with Rule 17a-7 of the 1940 Act. Interfund trades are included within the respective purchases and sales amounts shown in the Purchases and Sales of Investments note.
6. Committed Line of Credit.
The Fund participates with other funds managed by the investment adviser or an affiliate in a $4.25 billion credit facility (the "line of credit") to be utilized for temporary or emergency purposes to fund shareholder redemptions or for other short-term liquidity purposes. The Fund has agreed to pay commitment fees on its pro-rata portion of the line of credit, which amounted to $17 and is reflected in Miscellaneous expenses on the Statement of Operations. During the period, the Fund did not borrow on this line of credit.
7. Expense Reductions.
Through arrangements with the Fund's custodian, credits realized as a result of certain uninvested cash balances were used to reduce the Fund's expenses. During the period, these credits reduced the Fund's custody expenses by $47.
In addition, during the period the investment adviser reimbursed and/or waived a portion of fund-level operating expenses in the amount of $29.
8. Distributions to Shareholders.
Distributions to shareholders of each class were as follows:
| Six months ended April 30, 2017 | Year ended October 31, 2016 | |
| From net investment income | ||
| Class A | $12,838 | $28,998 |
| Class M | 2,937 | 6,712 |
| Class B | – | 210 |
| Class C | 8,263 | 19,076 |
| Fidelity Floating Rate High Income Fund | 130,027 | 244,237 |
| Class I | 36,853 | 83,907 |
| Total | $190,918 | $383,140 |
9. Share Transactions.
Share transactions for each class were as follows and may contain automatic conversions between classes or exchanges between affiliated funds:
| Shares | Shares | Dollars | Dollars | |
| Six months ended April 30, 2017 | Year ended October 31, 2016 | Six months ended April 30, 2017 | Year ended October 31, 2016 | |
| Class A | ||||
| Shares sold | 17,013 | 13,632 | $164,067 | $127,187 |
| Reinvestment of distributions | 1,221 | 2,814 | 11,787 | 26,169 |
| Shares redeemed | (26,879) | (34,450) | (260,210) | (318,820) |
| Net increase (decrease) | (8,645) | (18,004) | $(84,356) | $(165,464) |
| Class M | ||||
| Shares sold | 1,376 | 1,326 | $13,263 | $12,365 |
| Reinvestment of distributions | 291 | 671 | 2,804 | 6,235 |
| Shares redeemed | (4,276) | (4,884) | (41,258) | (45,244) |
| Net increase (decrease) | (2,609) | (2,887) | $(25,191) | $(26,644) |
| Class B | ||||
| Shares sold | – | 10 | $– | $96 |
| Reinvestment of distributions | – | 19 | – | 177 |
| Shares redeemed | – | (1,219) | – | (11,330) |
| Net increase (decrease) | – | (1,190) | $– | $(11,057) |
| Class C | ||||
| Shares sold | 5,372 | 5,299 | $51,797 | $49,451 |
| Reinvestment of distributions | 708 | 1,645 | 6,835 | 15,298 |
| Shares redeemed | (7,164) | (17,529) | (69,090) | (162,349) |
| Net increase (decrease) | (1,084) | (10,585) | $(10,458) | $(97,600) |
| Fidelity Floating Rate High Income Fund | ||||
| Shares sold | 159,107 | 152,772 | $1,533,146 | $1,428,276 |
| Reinvestment of distributions | 11,004 | 21,133 | 106,088 | 196,548 |
| Shares redeemed | (65,840) | (237,658) | (633,989) | (2,193,671) |
| Net increase (decrease) | 104,271 | (63,753) | $1,005,245 | $(568,847) |
| Class I | ||||
| Shares sold | 74,437 | 58,131 | $717,823 | $539,868 |
| Reinvestment of distributions | 2,829 | 5,808 | 27,250 | 53,924 |
| Shares redeemed | (40,186) | (139,996) | (387,074) | (1,297,890) |
| Net increase (decrease) | 37,080 | (76,057) | $357,999 | $(704,098) |
10. Other.
The Fund's organizational documents provide former and current trustees and officers with a limited indemnification against liabilities arising in connection with the performance of their duties to the Fund. In the normal course of business, the Fund may also enter into contracts that provide general indemnifications. The Fund's maximum exposure under these arrangements is unknown as this would be dependent on future claims that may be made against the Fund. The risk of material loss from such claims is considered remote.
Report of Independent Registered Public Accounting Firm
To the Trustees of Fidelity Advisor Series I and Shareholders of Fidelity Advisor Floating Rate High Income Fund:
We have audited the accompanying statement of assets and liabilities of Fidelity Advisor Floating Rate High Income Fund (the Fund), a fund of Fidelity Advisor Series I, including the schedule of investments, as of April 30, 2017, and the related statement of operations for the six months then ended, the statement of changes in net assets for the six months ended April 30, 2017 and for the year ended October 30, 2016, and the financial highlights for the six months ended April 30, 2017 and for each of the five years in the period ended October 30, 2016. These financial statements and financial highlights are the responsibility of the Fund's management. Our responsibility is to express an opinion on these financial statements and financial highlights based on our audits.
We conducted our audits in accordance with the standards of the Public Company Accounting Oversight Board (United States). Those standards require that we plan and perform the audit to obtain reasonable assurance about whether the financial statements and financial highlights are free of material misstatement. The Fund is not required to have, nor were we engaged to perform, an audit of its internal control over financial reporting. Our audits included consideration of internal control over financial reporting as a basis for designing audit procedures that are appropriate in the circumstances, but not for the purpose of expressing an opinion on the effectiveness of the Fund's internal control over financial reporting. Accordingly, we express no such opinion. An audit also includes examining, on a test basis, evidence supporting the amounts and disclosures in the financial statements, assessing the accounting principles used and significant estimates made by management, as well as evaluating the overall financial statement presentation. Our procedures included confirmation of securities owned as of April 30, 2017, by correspondence with the custodians and brokers; when replies were not received from brokers, we performed other auditing procedures. We believe that our audits provide a reasonable basis for our opinion.
In our opinion, such financial statements and financial highlights referred to above present fairly, in all material respects, the financial position of Fidelity Advisor Floating Rate High Income Fund as of April 30, 2017, the results of its operations for the six-months then ended, the changes in its net assets for the six months ended April 30, 2017 and for the year ended October 30, 2016, and the financial highlights for the six months ended April 30, 2017 and for each of the five years in the period ended October 30, 2016, in conformity with accounting principles generally accepted in the United States of America.
DELOITTE & TOUCHE LLP
Boston, Massachusetts
June 19, 2017
Shareholder Expense Example
As a shareholder of the Fund, you incur two types of costs: (1) transaction costs, including sales charges (loads) on purchase payments or redemption proceeds, redemption fees and (2) ongoing costs, including management fees, distribution and/or service (12b-1) fees and other Fund expenses. This Example is intended to help you understand your ongoing costs (in dollars) of investing in the Fund and to compare these costs with the ongoing costs of investing in other mutual funds.
The Example is based on an investment of $1,000 invested at the beginning of the period and held for the entire period (November 1, 2016 to April 30, 2017).
Actual Expenses
The first line of the accompanying table for each class of the Fund provides information about actual account values and actual expenses. You may use the information in this line, together with the amount you invested, to estimate the expenses that you paid over the period. Simply divide your account value by $1,000.00 (for example, an $8,600 account value divided by $1,000.00 = 8.6), then multiply the result by the number in the first line for a class of the Fund under the heading entitled "Expenses Paid During Period" to estimate the expenses you paid on your account during this period. A small balance maintenance fee of $12.00 that is charged once a year may apply for certain accounts with a value of less than $2,000. This fee is not included in the table below. If it was, the estimate of expenses you paid during the period would be higher, and your ending account value lower, by this amount. In addition, the Fund, as a shareholder in the underlying Fidelity Central Funds, will indirectly bear its pro-rata share of the fees and expenses incurred by the underlying Fidelity Central Funds. These fees and expenses are not included in the Fund's annualized expense ratio used to calculate the expense estimate in the table below.
Hypothetical Example for Comparison Purposes
The second line of the accompanying table for each class of the Fund provides information about hypothetical account values and hypothetical expenses based on a Class' actual expense ratio and an assumed rate of return of 5% per year before expenses, which is not the Class' actual return. The hypothetical account values and expenses may not be used to estimate the actual ending account balance or expenses you paid for the period. You may use this information to compare the ongoing costs of investing in the Fund and other funds. To do so, compare this 5% hypothetical example with the 5% hypothetical examples that appear in the shareholder reports of the other funds. A small balance maintenance fee of $12.00 that is charged once a year may apply for certain accounts with a value of less than $2,000. This fee is not included in the table below. If it was, the estimate of expenses you paid during the period would be higher, and your ending account value lower, by this amount. In addition, the Fund, as a shareholder in the underlying Fidelity Central Funds, will indirectly bear its pro-rata share of the fees and expenses incurred by the underlying Fidelity Central Funds. These fees and expenses are not included in the Fund's annualized expense ratio used to calculate the expense estimate in the table below.
Please note that the expenses shown in the table are meant to highlight your ongoing costs only and do not reflect any transaction costs. Therefore, the second line of the table is useful in comparing ongoing costs only, and will not help you determine the relative total costs of owning different funds. In addition, if these transactional costs were included, your costs would have been higher.
| Annualized Expense Ratio-A | Beginning Account Value November 1, 2016 | Ending Account Value April 30, 2017 | Expenses Paid During Period-B November 1, 2016 to April 30, 2017 |
|
| Class A | .99% | |||
| Actual | $1,000.00 | $1,025.50 | $4.97 | |
| Hypothetical-C | $1,000.00 | $1,019.89 | $4.96 | |
| Class M | 1.04% | |||
| Actual | $1,000.00 | $1,026.30 | $5.23 | |
| Hypothetical-C | $1,000.00 | $1,019.64 | $5.21 | |
| Class C | 1.75% | |||
| Actual | $1,000.00 | $1,022.70 | $8.78 | |
| Hypothetical-C | $1,000.00 | $1,016.12 | $8.75 | |
| Fidelity Floating Rate High Income Fund | .70% | |||
| Actual | $1,000.00 | $1,028.00 | $3.52 | |
| Hypothetical-C | $1,000.00 | $1,021.32 | $3.51 | |
| Class I | .76% | |||
| Actual | $1,000.00 | $1,026.70 | $3.82 | |
| Hypothetical-C | $1,000.00 | $1,021.03 | $3.81 |
A Annualized expense ratio reflects expenses net of applicable fee waivers.
B Expenses are equal to each Class' annualized expense ratio, multiplied by the average account value over the period, multiplied by 181/365 (to reflect the one-half year period).
C 5% return per year before expenses
![]()
AFR-SANN-0617
1.757235.116
|
Fidelity® Floating Rate High Income Fund Semi-Annual Report April 30, 2017 Fidelity® Floating Rate High Income Fund is a class of Fidelity Advisor® Floating Rate High Income Fund |
|
|
Contents
To view a fund's proxy voting guidelines and proxy voting record for the 12-month period ended June 30, visit http://www.fidelity.com/proxyvotingresults or visit the Securities and Exchange Commission's (SEC) web site at http://www.sec.gov.
You may also call 1-800-544-8544 to request a free copy of the proxy voting guidelines.
Standard & Poor's, S&P and S&P 500 are registered service marks of The McGraw-Hill Companies, Inc. and have been licensed for use by Fidelity Distributors Corporation.
Other third-party marks appearing herein are the property of their respective owners.
All other marks appearing herein are registered or unregistered trademarks or service marks of FMR LLC or an affiliated company. © 2017 FMR LLC. All rights reserved.
This report and the financial statements contained herein are submitted for the general information of the shareholders of the Fund. This report is not authorized for distribution to prospective investors in the Fund unless preceded or accompanied by an effective prospectus.
A fund files its complete schedule of portfolio holdings with the SEC for the first and third quarters of each fiscal year on Form N-Q. Forms N-Q are available on the SEC’s web site at http://www.sec.gov. A fund's Forms N-Q may be reviewed and copied at the SEC’s Public Reference Room in Washington, DC. Information regarding the operation of the SEC's Public Reference Room may be obtained by calling 1-800-SEC-0330.
For a complete list of a fund's portfolio holdings, view the most recent holdings listing, semiannual report, or annual report on Fidelity's web site at http://www.fidelity.com, http://www.institutional.fidelity.com, or http://www.401k.com, as applicable.
NOT FDIC INSURED •MAY LOSE VALUE •NO BANK GUARANTEE
Neither the Fund nor Fidelity Distributors Corporation is a bank.
Investment Summary (Unaudited)
Top Five Holdings as of April 30, 2017
| (by issuer, excluding cash equivalents) | % of fund's net assets | % of fund's net assets 6 months ago |
| Albertson's LLC | 2.0 | 2.3 |
| Community Health Systems, Inc. | 1.7 | 2.1 |
| Laureate Education, Inc. | 1.7 | 1.3 |
| Charter Communication Operating LLC | 1.6 | 0.6 |
| Caesars Growth Properties Holdings, LLC | 1.5 | 1.7 |
| 8.5 |
Top Five Market Sectors as of April 30, 2017
| % of fund's net assets | % of fund's net assets 6 months ago | |
| Technology | 11.3 | 10.8 |
| Services | 9.2 | 7.4 |
| Telecommunications | 8.9 | 7.1 |
| Healthcare | 8.2 | 10.4 |
| Gaming | 6.0 | 6.5 |
Quality Diversification (% of fund's net assets)
| As of April 30, 2017 | ||
| BBB | 3.4% | |
| BB | 37.1% | |
| B | 41.0% | |
| CCC,CC,C | 4.8% | |
| Not Rated | 6.5% | |
| Equities | 0.3% | |
| Short-Term Investments and Net Other Assets | 6.9% | |

| As of October 31, 2016 | ||
| BBB | 2.9% | |
| BB | 38.9% | |
| B | 40.1% | |
| CCC,CC,C | 6.0% | |
| Not Rated | 4.6% | |
| Equities | 0.4% | |
| Short-Term Investments and Net Other Assets | 7.1% | |
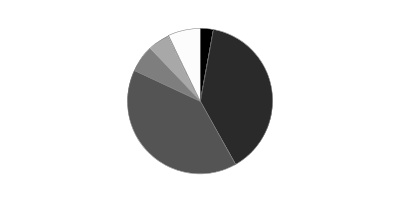
We have used ratings from Moody's Investors Service, Inc. Where Moody's® ratings are not available, we have used S&P® ratings. All ratings are as of the date indicated and do not reflect subsequent changes.
Asset Allocation (% of fund's net assets)
| As of April 30, 2017* | ||
| Bank Loan Obligations | 86.5% | |
| Nonconvertible Bonds | 6.3% | |
| Common Stocks | 0.3% | |
| Short-Term Investments and Net Other Assets (Liabilities) | 6.9% | |

* Foreign investments - 10.0%
| As of October 31, 2016* | ||
| Bank Loan Obligations | 84.7% | |
| Nonconvertible Bonds | 7.8% | |
| Common Stocks | 0.4% | |
| Short-Term Investments and Net Other Assets (Liabilities) | 7.1% | |

* Foreign investments - 7.9%
Investments April 30, 2017
Showing Percentage of Net Assets
| Bank Loan Obligations - 86.5%(a) | |||
| Principal Amount (000s) | Value (000s) | ||
| Aerospace - 1.0% | |||
| DAE Aviation Holdings, Inc. term loan 7/7/22(b) | $6,250 | $6,261 | |
| Gemini HDPE LLC Tranche B, term loan 4.1718% 8/7/21 (c) | 4,556 | 4,591 | |
| TransDigm, Inc.: | |||
| Tranche C, term loan 4.1188% 2/28/20 (c) | 61,318 | 61,441 | |
| Tranche F, term loan 3.9928% 6/9/23 (c) | 29,775 | 29,734 | |
| TOTAL AEROSPACE | 102,027 | ||
| Automotive & Auto Parts - 0.7% | |||
| Caliber Holdings Corp.: | |||
| Tranche 1LN, term loan 4% 2/1/24 (c) | 9,045 | 9,102 | |
| Tranche 2LN, term loan: | |||
| 3% 2/1/24 (c)(d) | 905 | 910 | |
| 8.25% 2/1/25 (c) | 2,710 | 2,757 | |
| Chrysler Group LLC term loan 2.99% 12/31/18 (c) | 7,147 | 7,167 | |
| North American Lifting Holdings, Inc.: | |||
| Tranche 1LN, term loan 5.6468% 11/27/20 (c) | 16,454 | 15,412 | |
| Tranche 2LN, term loan 10.1468% 11/27/21 (c) | 24,370 | 19,009 | |
| The Gates Corp. Tranche B 1LN, term loan 4.4076% 3/31/24 (c) | 13,335 | 13,395 | |
| UOS LLC term loan 6.5333% 4/18/23 (c) | 8,670 | 8,800 | |
| TOTAL AUTOMOTIVE & AUTO PARTS | 76,552 | ||
| Broadcasting - 1.6% | |||
| CBS Radio, Inc.: | |||
| term loan 4.5% 10/17/23 (c) | 18,966 | 19,093 | |
| Tranche B 1LN, term loan 3/2/24 (b) | 12,500 | 12,583 | |
| Clear Channel Communications, Inc. Tranche D, term loan 7.7428% 1/30/19 (c) | 64,710 | 55,049 | |
| Entercom Radio, LLC Tranche B, term loan 4.55% 11/1/23 (c) | 5,725 | 5,758 | |
| ION Media Networks, Inc. Tranche B, term loan 4.5% 12/18/20 (c) | 19,752 | 19,937 | |
| Nielsen Finance LLC Tranche B 4LN, term loan 2.99% 10/4/23 (c) | 11,940 | 11,985 | |
| Univision Communications, Inc. Tranche C 5LN, term loan 3.75% 3/15/24 (c) | 41,207 | 40,917 | |
| TOTAL BROADCASTING | 165,322 | ||
| Building Materials - 0.3% | |||
| HD Supply, Inc. Tranche B, term loan 3.8968% 10/17/23 (c) | 8,209 | 8,265 | |
| Jeld-Wen, Inc. Tranche B 3LN, term loan 4.1468% 7/1/22 (c) | 17,639 | 17,815 | |
| Unifrax I LLC Tranche B, term loan 4.8996% 4/4/24 (c) | 8,505 | 8,519 | |
| TOTAL BUILDING MATERIALS | 34,599 | ||
| Cable/Satellite TV - 3.0% | |||
| Altice U.S. Finance SA Tranche B, term loan 7/28/25 (b) | 30,424 | 30,392 | |
| Cable One, Inc. Tranche B, term loan 4/12/24 (b) | 7,970 | 8,020 | |
| Charter Communication Operating LLC: | |||
| term loan: | |||
| 2.99% 7/1/20 (c) | 47,483 | 47,720 | |
| 2.99% 1/3/21 (c) | 75,200 | 75,511 | |
| Tranche I, term loan 3.2322% 1/15/24 (c) | 55,788 | 56,053 | |
| Liberty Cablevision of Puerto Rico Tranche 1LN, term loan 4.6584% 1/7/22 (c) | 27,125 | 27,066 | |
| Virgin Media Bristol LLC Tranche 1LN, term loan 3.7439% 1/31/25 (c) | 35,000 | 35,123 | |
| WideOpenWest Finance LLC Tranche B, term loan 4.554% 8/19/23 (c) | 22,000 | 22,113 | |
| Zayo Group LLC Tranche B 1LN, term loan 3.5% 1/19/24 (c) | 16,473 | 16,577 | |
| TOTAL CABLE/SATELLITE TV | 318,575 | ||
| Capital Goods - 0.6% | |||
| Onex Wizard U.S. Acquisition, Inc. Tranche B, term loan 4% 3/13/22 (c) | 30,308 | 30,489 | |
| SRAM LLC. Tranche B, term loan 4.536% 3/15/24 (c) | 13,912 | 13,878 | |
| Wireco Worldgroup, Inc. Tranche B 1LN, term loan 6.5% 9/30/23 (c) | 6,468 | 6,521 | |
| Zodiac Pool Solutions LLC: | |||
| Tranche 2LN, term loan 10.1468% 12/20/24 (c) | 3,000 | 2,972 | |
| Tranche B 1LN, term loan 5.6468% 12/20/23 (c) | 12,968 | 13,038 | |
| TOTAL CAPITAL GOODS | 66,898 | ||
| Chemicals - 1.4% | |||
| Ineos Styrolution U.S. Holding LLC Tranche B, term loan 3.9022% 3/30/24 (c) | 10,239 | 10,252 | |
| Kraton Polymers LLC term loan 5% 1/6/22 (c) | 19,425 | 19,694 | |
| MacDermid, Inc.: | |||
| Tranche B 5LN, term loan 4.5% 6/7/20 (c) | 13,073 | 13,132 | |
| Tranche B 6LN, term loan 4% 6/7/23 (c) | 25,576 | 25,671 | |
| Royal Holdings, Inc.: | |||
| Tranche B 1LN, term loan 4.3968% 6/19/22 (c) | 13,790 | 13,898 | |
| Tranche B 2LN, term loan 8.6468% 6/19/23 (c) | 1,175 | 1,176 | |
| The Chemours Co. LLC Tranche B, term loan 3.49% 5/12/22 (c) | 21,503 | 21,651 | |
| Trinseo Materials Operating SCA/Trinseo Materials Finance, Inc. Tranche B 1LN, term loan 4.25% 11/5/21 (c) | 16,480 | 16,599 | |
| Tronox Pigments (Netherlands) B.V. Tranche B, term loan 4.6468% 3/19/20 (c) | 11,585 | 11,641 | |
| Univar, Inc. term loan 3.7428% 7/1/22 (c) | 13,933 | 13,968 | |
| TOTAL CHEMICALS | 147,682 | ||
| Consumer Products - 1.0% | |||
| CSM Bakery Supplies Tranche B 1LN, term loan 5.15% 7/3/20 (c) | 18,047 | 16,883 | |
| Hercules Achievement, Inc. Tranche B, term loan 5% 12/11/21 (c) | 6,000 | 6,030 | |
| Prestige Brands, Inc. term loan 3.7428% 1/26/24 (c) | 15,402 | 15,540 | |
| Weight Watchers International, Inc. Tranche B 2LN, term loan 4.3392% 4/2/20 (c) | 51,009 | 48,379 | |
| Wilsonart LLC Tranche B, term loan 4.65% 12/19/23 (c) | 20,449 | 20,568 | |
| TOTAL CONSUMER PRODUCTS | 107,400 | ||
| Consumer Services - 0.2% | |||
| Optiv Security, Inc.: | |||
| Tranche 2LN, term loan 8.25% 2/1/25 (c) | 3,280 | 3,325 | |
| Tranche B 1LN, term loan 4.25% 2/1/24 (c) | 16,590 | 16,562 | |
| TOTAL CONSUMER SERVICES | 19,887 | ||
| Containers - 1.7% | |||
| Berry Plastics Corp.: | |||
| term loan: | |||
| 3.5068% 10/1/22 (c) | 21,378 | 21,512 | |
| 3.5244% 1/19/23 (c) | 10,000 | 10,053 | |
| Tranche K, term loan 3.2394% 2/8/20 (c) | 64,000 | 64,357 | |
| Tranche L, term loan 3.2394% 1/6/21 (c) | 8,592 | 8,637 | |
| BWAY Holding Co. Tranche B, term loan 4.2328% 4/3/24 (c) | 8,250 | 8,195 | |
| Consolidated Container Co. Tranche B, term loan 5% 7/3/19 (c) | 27,503 | 27,503 | |
| Hostess Brands LLC Tranche B 1LN, term loan 4% 8/3/22 (c) | 11,969 | 12,066 | |
| Reynolds Group Holdings, Inc. Tranche B, term loan 3.9928% 2/5/23 (c) | 26,845 | 26,978 | |
| Signode Packaging Systems, Inc. Tranche B, term loan 3.8138% 5/1/21 (c) | 7,053 | 7,080 | |
| TOTAL CONTAINERS | 186,381 | ||
| Diversified Financial Services - 3.5% | |||
| AlixPartners LLP Tranche B, term loan 4.1496% 4/4/24 (c) | 26,240 | 26,455 | |
| ASP Chromaflo Intermediate Hol Tranche B 1LN, term loan 5% 11/18/23 (c) | 11,940 | 11,992 | |
| Avolon TLB Borrower 1 (U.S.) LLC Tranche B 2LN, term loan 3.7428% 3/20/22 (c) | 70,000 | 71,019 | |
| Cypress Intermediate Holdings, Inc. Tranche B 1LN, term loan 4.0406% 3/30/24 (c) | 18,750 | 18,661 | |
| Delos Finance SARL term loan 3.3968% 10/6/23 (c) | 33,095 | 33,476 | |
| Fly Funding II SARL: | |||
| Tranche B, term loan 2/9/23 (b) | 10,000 | 10,003 | |
| Tranche B, term loan 3.79% 2/9/22 (c) | 12,642 | 12,646 | |
| Flying Fortress Holdings, Inc. Tranche B, term loan 3.3968% 10/30/22 (c) | 67,865 | 68,422 | |
| HarbourVest Partners LLC Tranche B, term loan 3.6551% 2/4/21 (c) | 10,864 | 10,891 | |
| IBC Capital U.S. LLC Tranche B 1LN, term loan 4.8696% 9/11/21 (c) | 24,500 | 24,082 | |
| Quest Software U.S. Holdings, Inc. Tranche B, term loan 7% 10/31/22 (c) | 20,894 | 21,234 | |
| Rep Wwex Acquisition Parent LLC Tranche B 1LN, term loan 5.53% 2/3/24 (c) | 3,760 | 3,773 | |
| TransUnion LLC Tranche B 2LN, term loan 3.4928% 4/9/23 (c) | 37,168 | 37,466 | |
| UFC Holdings LLC Tranche B 1LN, term loan 4.25% 8/18/23 (c) | 19,278 | 19,380 | |
| TOTAL DIVERSIFIED FINANCIAL SERVICES | 369,500 | ||
| Energy - 3.4% | |||
| Alon U.S.A. Partners LP term loan 9.25% 11/26/18 (c) | 8,511 | 8,511 | |
| Arctic LNG Carriers Ltd. Tranche B 1LN, term loan 4/20/23 (b) | 20,000 | 19,900 | |
| California Resources Corp. Tranche 1LN, term loan 11.375% 12/31/21 (c) | 19,330 | 21,239 | |
| Chesapeake Energy Corp. Tranche 1LN, term loan 8.5534% 8/23/21 (c) | 15,000 | 16,195 | |
| Chief Exploration & Development, LLC. Tranche 2LN, term loan 7.9324% 5/16/21 (c) | 3,000 | 2,880 | |
| Citgo Holding, Inc. Tranche B, term loan 9.6468% 5/12/18 (c) | 13,577 | 13,734 | |
| Crestwood Holdings Partners LLC Tranche B, term loan 9.0418% 6/19/19 (c) | 24,944 | 24,679 | |
| Empire Generating Co. LLC: | |||
| Tranche B, term loan 5.43% 3/14/21 (c) | 17,765 | 17,676 | |
| Tranche C, term loan 5.43% 3/14/21 (c) | 1,756 | 1,747 | |
| Energy Transfer Equity LP Tranche B, term loan 3.7328% 2/2/24 (c) | 10,000 | 10,021 | |
| ExGen Renewables I, LLC Tranche B term loan 5.41% 2/6/21 (c) | 11,345 | 11,388 | |
| Expro Finservices SARL Tranche B, term loan 5.75% 9/2/21 (c) | 49,931 | 35,951 | |
| Foresight Energy LLC Tranche B 1LN, term loan 6.75% 3/28/22 (c) | 15,250 | 14,721 | |
| FTS International, Inc. Tranche B, term loan 5.75% 4/16/21 (c) | 13,555 | 11,759 | |
| Gavilan Resources LLC Tranche 2LN, term loan 7% 3/1/24 (c) | 11,000 | 10,890 | |
| Gulf Finance LLC Tranche B 1LN, term loan 6.25% 8/25/23 (c) | 46,268 | 46,152 | |
| International Seaways, Inc. Tranche B, term loan 5.79% 8/5/19 (c) | 23,620 | 23,547 | |
| MRP Generation Holdings LLC Tranche B, term loan 8.1468% 10/18/22 (c) | 7,806 | 7,689 | |
| Overseas Shipholding Group, Inc. Tranche B, term loan 5.29% 8/5/19 (c) | 12,565 | 12,282 | |
| Pacific Drilling SA Tranche B, term loan 4.625% 6/3/18 (c) | 13,738 | 6,320 | |
| Panda Temple Power, LLC term loan 7.25% 4/3/19 (c) | 10,863 | 9,052 | |
| Seadrill Operating LP Tranche B, term loan 4.1468% 2/21/21 (c) | 43,397 | 29,184 | |
| Western Refining, Inc. Tranche B, term loan 5.25% 11/12/20 (c) | 7,364 | 7,373 | |
| TOTAL ENERGY | 362,890 | ||
| Entertainment/Film - 0.6% | |||
| AMC Entertainment Holdings, Inc. Tranche B, term loan 3.7422% 12/15/23 (c) | 7,671 | 7,701 | |
| AMC Entertainment, Inc. Tranche B, term loan 3.7439% 12/15/22 (c) | 4,975 | 4,996 | |
| CDS U.S. Intermediate Holdings, Inc.: | |||
| Tranche B 1LN, term loan 5.1468% 7/8/22 (c) | 11,395 | 11,480 | |
| Tranche B 2LN, term loan 9.3968% 7/8/23 (c) | 5,305 | 5,265 | |
| Digital Cinema Implementation Partners,LLC Tranche B, term loan 3.632% 5/17/21 (c) | 11,172 | 11,242 | |
| Lions Gate Entertainment Corp. term loan 3.9822% 12/8/23 (c) | 18,400 | 18,492 | |
| TOTAL ENTERTAINMENT/FILM | 59,176 | ||
| Environmental - 0.3% | |||
| The Brickman Group, Ltd. Tranche B 1LN, term loan 4.142% 12/18/20 (c) | 18,578 | 18,640 | |
| WTG Holdings III Corp. Tranche B 1LN, term loan 4.8968% 1/15/21 (c) | 13,776 | 13,845 | |
| TOTAL ENVIRONMENTAL | 32,485 | ||
| Food & Drug Retail - 3.2% | |||
| Albertson's LLC: | |||
| term loan 4.3023% 6/22/23 (c) | 32,594 | 32,730 | |
| Tranche B 4LN, term loan 3.9928% 8/25/21 (c) | 179,987 | 180,569 | |
| GOBP Holdings, Inc. Tranche B 1LN, term loan 5.1468% 10/21/21 (c) | 3,960 | 3,968 | |
| JBS USA Lux SA Tranche B, term loan 3.4828% 10/30/22 (c) | 25,500 | 25,605 | |
| Pizza Hut Holdings LLC Tranche B, term loan 2.9939% 6/16/23 (c) | 24,875 | 24,999 | |
| RPI Finance Trust Tranche B 6LN, term loan: | |||
| 3/27/23 (b) | 25,723 | 25,804 | |
| 3.1529% 3/27/23 (c) | 23,042 | 23,114 | |
| Smart & Final, Inc. Tranche B, term loan 4.582% 11/15/22 (c) | 19,845 | 19,382 | |
| TOTAL FOOD & DRUG RETAIL | 336,171 | ||
| Food/Beverage/Tobacco - 0.6% | |||
| Arctic Glacier Group Holdings, Inc. Tranche B, term loan 5.25% 3/20/24 (c) | 6,345 | 6,420 | |
| Chobani LLC Tranche B, term loan 5.25% 10/7/23 (c) | 22,615 | 22,954 | |
| Pinnacle Foods Finance LLC Tranche B, term loan 2.9828% 2/3/24 (c) | 9,975 | 10,031 | |
| Shearer's Foods, Inc. Tranche 2LN, term loan 7.8968% 6/30/22 (c) | 2,000 | 1,960 | |
| U.S. Foods, Inc. Tranche B, term loan 3.7428% 6/27/23 (c) | 27,046 | 27,280 | |
| TOTAL FOOD/BEVERAGE/TOBACCO | 68,645 | ||
| Gaming - 5.8% | |||
| Aristocrat Technologies, Inc. Tranche B 2LN, term loan 3.4062% 10/20/21 (c) | 25,707 | 25,908 | |
| Boyd Gaming Corp. Tranche B 1LN, term loan 3.4456% 9/15/23 (c) | 23,980 | 24,072 | |
| Caesars Entertainment Resort Properties LLC Tranche B 1LN, term loan 7% 10/11/20 (c) | 100,567 | 100,756 | |
| Caesars Growth Properties Holdings, LLC term loan 4% 5/8/21(c) | 160,302 | 161,103 | |
| Eldorado Resorts, Inc. Tranche B, term loan 5.25% 4/17/24 (c) | 32,120 | 32,040 | |
| Golden Nugget, Inc. Tranche B, term loan: | |||
| 4.5% 11/21/19 (c) | 34,156 | 34,625 | |
| 4.5% 11/21/19 (c) | 14,638 | 14,839 | |
| Las Vegas Sands LLC Tranche B, term loan 2.98% 3/29/24 (c) | 25,990 | 26,011 | |
| MGM Mirage, Inc. Tranche A, term loan 3.4822% 4/25/21 (c) | 14,225 | 14,216 | |
| Mohegan Tribal Gaming Authority Tranche B, term loan 5% 10/14/23 (c) | 14,963 | 15,050 | |
| Penn National Gaming, Inc. Tranche B, term loan 3.5244% 1/19/24 (c) | 5,260 | 5,289 | |
| Scientific Games Corp. Tranche B 3LN, term loan 4.9939% 10/1/21 (c) | 98,331 | 99,760 | |
| Station Casinos LLC Tranche B, term loan 3.5% 6/8/23 (c) | 54,741 | 54,691 | |
| Yonkers Racing Corp. Tranche B 1LN, term loan 4.25% 8/20/19 (c) | 13,308 | 13,324 | |
| TOTAL GAMING | 621,684 | ||
| Healthcare - 7.4% | |||
| Alere, Inc. Tranche B, term loan 4.25% 6/18/22 (c) | 13,062 | 13,122 | |
| Cologix Holdings, Inc. Tranche B 1LN, term loan 3/20/24 (b) | 4,500 | 4,500 | |
| Community Health Systems, Inc.: | |||
| Tranche G, term loan 3.7976% 12/31/19 (c) | 64,453 | 64,186 | |
| Tranche H, term loan 4.0477% 1/27/21 (c) | 107,285 | 106,569 | |
| DaVita HealthCare Partners, Inc. Tranche B, term loan 3.7428% 6/24/21 (c) | 46,863 | 47,308 | |
| Envision Healthcare Corp. Tranche B, term loan 4.15% 12/1/23 (c) | 29,925 | 30,202 | |
| HCA Holdings, Inc.: | |||
| Tranche B 8LN, term loan 3.2428% 2/15/24 (c) | 19,950 | 20,138 | |
| Tranche B 9LN, term loan 2.9928% 3/18/23 (c) | 60,081 | 60,276 | |
| HLF Financing U.S. LLC Tranche B, term loan 6.4928% 2/15/23 (c) | 13,600 | 13,593 | |
| IMS Health, Inc. Tranche B, term loan 3/7/24 (b) | 9,975 | 10,069 | |
| InVentiv Health, Inc. Tranche B, term loan 4.804% 11/9/23 (c) | 20,948 | 21,055 | |
| JLL/Delta Dutch Newco BV Tranche B 1LN, term loan 4.406% 4/20/24 (c) | 14,000 | 14,025 | |
| Kindred Healthcare, Inc. Tranche B, term loan 4.6875% 4/9/21 (c) | 4,949 | 4,965 | |
| Milk Specialties Co. Tranche B, term loan 5.1468% 8/16/23 (c) | 12,104 | 12,203 | |
| MPH Acquisition Holdings LLC Tranche B, term loan 4.8968% 6/7/23 (c) | 18,242 | 18,473 | |
| Onex Schumacher Finance LP Tranche B 1LN, term loan 5% 7/31/22 (c) | 3,465 | 3,471 | |
| Ortho-Clinical Diagnostics, Inc. Tranche B, term loan 4.75% 6/30/21 (c) | 72,277 | 71,886 | |
| Precyse Acquisition Corp. Tranche B, term loan 5.5% 10/20/22 (c) | 9,925 | 10,024 | |
| Press Ganey Holdings, Inc.: | |||
| Tranche 2LN, term loan 8.25% 10/21/24 (c) | 5,000 | 5,088 | |
| Tranche B 1LN, term loan 4.25% 10/21/23 (c) | 15,461 | 15,461 | |
| Project Ruby Ultimate Parent Corp. Tranche B, term loan 4.75% 2/9/24 (c) | 3,990 | 4,010 | |
| Select Medical Corp. Tranche B, term loan 4.6497% 3/6/24 (c) | 10,000 | 10,113 | |
| U.S. Renal Care, Inc.: | |||
| Tranche 2LN, term loan 9.1468% 12/31/23 (c) | 5,000 | 4,538 | |
| Tranche B 1LN, term loan 5.3968% 12/31/22 (c) | 65,809 | 62,354 | |
| Valeant Pharmaceuticals International, Inc. Tranche B, term loan 5.74% 4/1/22 (c) | 129,803 | 130,547 | |
| Vizient, Inc. term loan 5% 2/11/23 (c) | 26,396 | 26,478 | |
| TOTAL HEALTHCARE | 784,654 | ||
| Homebuilders/Real Estate - 1.6% | |||
| Americold Realty Operating Partnership LP Tranche B, term loan 4.75% 12/1/22 (c) | 17,156 | 17,317 | |
| Communications Sales & Leasing, Inc. Tranche B, term loan 4% 10/24/22 (c) | 35,842 | 35,707 | |
| DTZ U.S. Borrower LLC Tranche B 1LN, term loan 4.3431% 11/4/21 (c) | 27,039 | 27,137 | |
| Lightstone Holdco LLC: | |||
| Tranche B, term loan 5.5% 1/30/24 (c) | 17,241 | 17,319 | |
| Tranche C, term loan 5.5% 1/30/24 (c) | 1,064 | 1,068 | |
| MGM Growth Properties Operating Partner LP Tranche B, term loan 3.4822% 4/25/23 (c) | 30,032 | 30,086 | |
| Realogy Group LLC term loan 3.2422% 7/20/22 (c) | 42,744 | 43,065 | |
| TOTAL HOMEBUILDERS/REAL ESTATE | 171,699 | ||
| Hotels - 1.9% | |||
| ESH Hospitality, Inc. Tranche B, term loan 3.4928% 8/30/23 (c) | 16,915 | 16,993 | |
| Four Seasons Holdings, Inc. Tranche B, term loan 4.1468% 11/30/23 (c) | 58,354 | 58,989 | |
| Hilton Worldwide Finance LLC Tranche B 2LN, term loan 2.9906% 10/25/23 (c) | 71,239 | 71,822 | |
| La Quinta Intermediate Holdings LLC Tranche B LN, term loan 3.9084% 4/14/21 (c) | 19,349 | 19,499 | |
| Playa Resorts Holding BV Tranche B, term loan 4/7/24 (b) | 26,500 | 26,524 | |
| Ryman Hospitality Properties, Inc. Tranche B, term loan 4/18/24 (b) | 10,000 | 10,025 | |
| TOTAL HOTELS | 203,852 | ||
| Insurance - 2.4% | |||
| Acrisure LLC Tranche B 1LN, term loan 5.8968% 11/22/23 (c) | 28,000 | 28,070 | |
| Alliant Holdings Intermediate LLC Tranche B, term loan 4.3873% 8/14/22 (c) | 27,368 | 27,435 | |
| AmWINS Group, Inc.: | |||
| Tranche 2LN, term loan 7.75% 1/25/25 (c) | 1,925 | 1,959 | |
| Tranche B 1LN, term loan 3.75% 1/25/24 (c) | 13,965 | 13,951 | |
| Asurion LLC: | |||
| term loan 4.25% 8/4/22 (c) | 38,258 | 38,490 | |
| Tranche B 2LN, term loan: | |||
| 4.2428% 7/8/20 (c) | 12,335 | 12,414 | |
| 8.5% 3/3/21 (c) | 28,303 | 28,715 | |
| Tranche B 5LN, term loan: | |||
| 11/3/23 (b) | 4,000 | 4,030 | |
| 4.75% 11/3/23 (c) | 17,484 | 17,615 | |
| HUB International Ltd. Tranche B 1LN, term loan 4.034% 10/2/20 (c) | 25,243 | 25,362 | |
| Lonestar Intermediate Super Holdings LLC term loan 10% 8/31/21 pay-in-kind (c) | 15,960 | 16,578 | |
| USI, Inc. term loan 4/5/24 (b) | 30,110 | 29,978 | |
| VF Holdings Corp. term loan 4.25% 6/30/23 (c) | 14,925 | 14,965 | |
| TOTAL INSURANCE | 259,562 | ||
| Leisure - 1.7% | |||
| 24 Hour Fitness Worldwide, Inc. Tranche B, term loan 4.8968% 5/30/21 (c) | 26,443 | 26,300 | |
| Cedar Fair LP Tranche B, term loan 3.2422% 4/13/24 (c) | 3,320 | 3,343 | |
| ClubCorp Club Operations, Inc. Tranche B, term loan 4% 12/15/22 (c) | 9,644 | 9,693 | |
| Delta 2 SARL Tranche B, term loan 4.5677% 2/1/24 (c) | 61,400 | 61,461 | |
| Equinox Holdings, Inc.: | |||
| Tranche 2LN, term loan 8% 9/8/24 (c) | 7,325 | 7,417 | |
| Tranche B 1LN, term loan 4.25% 3/8/24 (c) | 19,995 | 20,137 | |
| Fitness International LLC Tranche B, term loan 5.3968% 7/1/20 (c) | 9,512 | 9,635 | |
| LTF Merger Sub, Inc. Tranche B, term loan 4% 6/10/22 (c) | 31,767 | 31,824 | |
| SeaWorld Parks & Entertainment, Inc. Tranche B 5LN, term loan 4.1468% 3/31/24 (c) | 5,000 | 4,988 | |
| SMG Tranche B 1LN, term loan 4.8137% 2/27/20 (c) | 1,699 | 1,703 | |
| TOTAL LEISURE | 176,501 | ||
| Metals/Mining - 1.2% | |||
| American Rock Salt Co. LLC Tranche B 1LN, term loan 4.8968% 5/20/21 (c) | 8,648 | 8,648 | |
| Fortescue Metals Group Ltd. Tranche B, term loan 3.75% 6/30/19 (c) | 5,026 | 5,059 | |
| Murray Energy Corp. Tranche B 2LN, term loan 8.3968% 4/16/20 (c) | 89,589 | 85,433 | |
| Peabody Energy Corp. term loan 5.5% 3/31/22 (c) | 30,405 | 30,481 | |
| Walter Energy, Inc. Tranche B, term loan 0% 4/1/18 (e) | 32,780 | 0 | |
| TOTAL METALS/MINING | 129,621 | ||
| Paper - 0.5% | |||
| Caraustar Industries, Inc. Tranche B, term loan 6.6468% 3/14/22 (c) | 27,405 | 27,705 | |
| Flex Acquisition Co., Inc. Tranche B 1LN, term loan 4.3976% 12/29/23 (c) | 30,870 | 31,005 | |
| TOTAL PAPER | 58,710 | ||
| Publishing/Printing - 2.7% | |||
| Cengage Learning, Inc. Tranche B, term loan 5.25% 6/7/23 (c) | 56,488 | 54,269 | |
| Getty Images, Inc. Tranche B, term loan 4.75% 10/18/19 (c) | 51,654 | 45,627 | |
| Harland Clarke Holdings Corp.: | |||
| Tranche B 5LN, term loan 7.1468% 12/31/21 (c) | 13,332 | 13,365 | |
| Tranche B 6LN, term loan 6.6468% 2/9/22 (c) | 19,528 | 19,552 | |
| Houghton Mifflin Harcourt Publishing, Inc. Tranche B, term loan 4% 5/29/21 (c) | 31,120 | 28,650 | |
| JD Power & Associates Tranche B 1LN, term loan 5.25% 9/7/23 (c) | 4,837 | 4,862 | |
| McGraw-Hill Global Education Holdings, LLC term loan 5% 5/4/22 (c) | 54,470 | 53,915 | |
| Merrill Communications LLC Tranche B, term loan 6.4218% 6/1/22 (c) | 16,314 | 16,287 | |
| Montreign Operating Co. LLC Tranche B 1LN, term loan 9.25% 1/19/23 (c) | 20,050 | 20,401 | |
| Proquest LLC Tranche B, term loan 5.25% 10/24/21 (c) | 6,894 | 6,989 | |
| Springer Science+Business Media Deutschland GmbH Tranche B 9LN, term loan 4.6217% 8/14/20 (c) | 26,585 | 26,602 | |
| TOTAL PUBLISHING/PRINTING | 290,519 | ||
| Restaurants - 1.2% | |||
| Burger King Worldwide, Inc. Tranche B, term loan 3.3093% 2/17/24 (c) | 33,894 | 33,903 | |
| CEC Entertainment, Inc. Tranche B, term loan 4% 2/14/21 (c) | 29,314 | 29,116 | |
| Landry's Acquisition Co. Tranche B 1LN, term loan 3.7325% 10/4/23 (c) | 51,360 | 51,406 | |
| Red Lobster Hospitality LLC Tranche B, term loan 6.25% 7/28/21 (c) | 18,208 | 18,299 | |
| TOTAL RESTAURANTS | 132,724 | ||
| Services - 8.9% | |||
| Abacus Innovations Corp. Tranche B, term loan 3.25% 8/16/23 (c) | 13,912 | 14,030 | |
| Acosta, Inc. Tranche B, term loan 4.25% 9/26/21 (c) | 55,216 | 51,328 | |
| Almonde, Inc.: | |||
| Tranche 2LN, term loan 5/3/25 (b) | 11,675 | 11,899 | |
| Tranche B 1LN, term loan 5/3/24 (b) | 54,090 | 54,310 | |
| Ancestry.Com Operations, Inc.: | |||
| Tranch B 1LN, term loan 4.25% 10/19/23 (c) | 32,175 | 32,426 | |
| Tranche 2LN, term loan 9.27% 10/19/24 (c) | 8,500 | 8,691 | |
| Aramark Services, Inc. Tranche B, term loan 2.9928% 3/28/24 (c) | 40,000 | 40,312 | |
| Brand Energy & Infrastructure Services, Inc. Tranche B, term loan 4.9172% 11/26/20 (c) | 35,126 | 35,214 | |
| Bright Horizons Family Solutions Tranche B, term loan 3.7428% 11/7/23 (c) | 9,887 | 9,962 | |
| Cactus Wellhead LLC Tranche B, term loan 7.1468% 7/31/20 (c) | 21,878 | 20,784 | |
| Coinmach Service Corp. Tranche B, term loan 4.2689% 11/14/19 (c) | 42,494 | 42,529 | |
| Creative Artists Agency LLC Tranche B, term loan 4.5% 2/15/24 (c) | 11,970 | 12,110 | |
| Garda World Security Corp.: | |||
| term loan 4.0052% 11/8/20 (c) | 11,751 | 11,740 | |
| Tranche B 1LN, term loan 4.005% 11/8/20 (c) | 9,456 | 9,447 | |
| Tranche DD, term loan 4.0052% 11/8/20 (c) | 1,522 | 1,520 | |
| GCA Services Group, Inc. Tranche B 1LN, term loan 5.9128% 3/1/23 (c) | 9,820 | 9,863 | |
| KAR Auction Services, Inc. Tranche B 3LN, term loan 4.5% 3/9/23 (c) | 16,043 | 16,163 | |
| Karman Buyer Corp.: | |||
| Tranche 1LN, term loan 4.25% 7/25/21 (c) | 19,374 | 18,898 | |
| Tranche 2LN, term loan 7.5% 7/25/22 (c) | 6,895 | 6,561 | |
| KUEHG Corp. Tranche B 1LN, term loan 4.9165% 8/13/22 | 21,259 | 21,344 | |
| Laureate Education, Inc. Tranche B 1LN, term loan 4/26/24(b) | 183,545 | 183,159 | |
| Lineage Logistics Holdings, LLC. Tranche B, term loan 4.5% 4/7/21 (c) | 62,398 | 62,437 | |
| Nord Anglia Education Tranche B, term loan 4.554% 3/31/21 (c) | 34,311 | 34,311 | |
| Outerwall, Inc.: | |||
| Tranche 2LN, term loan 9.75% 9/27/24 (c) | 2,500 | 2,541 | |
| Tranche B 1LN, term loan 5.25% 9/27/23 (c) | 6,965 | 6,980 | |
| Prime Security Services Borrower LLC Tranche B 1LN, term loan 4.25% 5/2/22 (c) | 92,284 | 93,192 | |
| SAI Global GP Tranche B, term loan 5.6634% 12/8/23 (c) | 13,716 | 13,887 | |
| Science Applications International Corp. Tranche B, term loan 3.5625% 5/4/22 (c) | 6,226 | 6,253 | |
| SESAC Holdco II LLC Tranche B 1LN, term loan 4.2591% 2/23/24 (c) | 9,115 | 9,111 | |
| The GEO Group, Inc. Tranche B, term loan 3.2% 3/23/24 (c) | 11,565 | 11,565 | |
| The ServiceMaster Co. Tranche B, term loan 3.4822% 11/8/23 (c) | 25,933 | 26,208 | |
| Thomson Reuters IP&S Tranche B 1LN, term loan 4.5% 10/3/23 (c) | 26,830 | 26,951 | |
| Wash Multifamily Acquisition, Inc. Tranche B 1LN, term loan 4.25% 5/14/22 (c) | 8,406 | 8,417 | |
| Xerox Business Services LLC: | |||
| term loan 3.2428% 12/7/21 (c) | 11,364 | 11,250 | |
| Tranche B, term loan 4.9856% 12/7/23 (c) | 21,022 | 21,373 | |
| TOTAL SERVICES | 946,766 | ||
| Steel - 0.2% | |||
| JMC Steel Group, Inc. Tranche B, term loan 4.9062% 6/14/21 (c) | 20,472 | 20,696 | |
| Super Retail - 4.6% | |||
| Academy Ltd. Tranche B, term loan 5.0555% 7/2/22 (c) | 30,502 | 20,970 | |
| Bass Pro Group LLC: | |||
| term loan 5.8968% 6/9/18 (c) | 16,871 | 16,955 | |
| Tranche B, term loan 4.2394% 6/5/20 (c) | 24,871 | 24,820 | |
| Bass Pro Shops LLC. Tranche B, term loan 6.1468% 12/16/23 (c) | 110,760 | 107,776 | |
| BJ's Wholesale Club, Inc.: | |||
| Tranche 2LN, term loan 8.5% 2/3/25 (c) | 14,000 | 14,020 | |
| Tranche B 1LN, term loan 4.75% 2/3/24 (c) | 48,325 | 48,104 | |
| Davids Bridal, Inc. Tranche B, term loan 5.25% 10/11/19 (c) | 9,532 | 8,066 | |
| Harbor Freight Tools U.S.A., Inc. Tranche B, term loan 4.2428% 8/19/23 (c) | 22,828 | 22,756 | |
| JC Penney Corp., Inc. Tranche B, term loan 5.304% 6/23/23 (c) | 78,246 | 78,100 | |
| Party City Holdings, Inc. term loan 4.1696% 8/19/22 (c) | 28,429 | 28,397 | |
| PETCO Animal Supplies, Inc. Tranche B 1LN, term loan 4.1718% 1/26/23 (c) | 37,206 | 33,613 | |
| PetSmart, Inc. term loan 4.02% 3/11/22 (c) | 59,801 | 54,711 | |
| Sears Holdings Corp. Tranche ABL, term loan 5.4997% 6/30/18 (c) | 27,678 | 27,220 | |
| Sports Authority, Inc. Tranche B, term loan 0% 11/16/17 (e) | 4,555 | 273 | |
| TOTAL SUPER RETAIL | 485,781 | ||
| Technology - 10.8% | |||
| Applied Systems, Inc. Tranche B 1LN, term loan 4.3968% 1/23/21 (c) | 7,294 | 7,344 | |
| Aptean, Inc.: | |||
| Tranche 2LN, term loan 10.54% 12/20/23 (c) | 2,500 | 2,494 | |
| Tranche B 1LN, term loan 6.04% 12/20/22 (c) | 13,055 | 13,259 | |
| Bright Bidco BV Tranche B, term loan 3/17/24 (b) | 16,000 | 16,180 | |
| Cavium, Inc. Tranche B 1LN, term loan 3.2383% 8/16/22 (c) | 11,200 | 11,214 | |
| Ceridian HCM Holding, Inc. Tranche B 2LN, term loan 4.5011% 9/15/20 (c) | 24,059 | 24,014 | |
| Computer Discount Warehouse (CDW) LLC Tranche B, term loan 3.15% 8/17/23 (c) | 31,386 | 31,575 | |
| Compuware Corp.: | |||
| term loan 9.25% 12/15/22 (c) | 17,829 | 17,874 | |
| Tranche B 3LN, term loan 5.25% 12/15/21 (c) | 44,236 | 44,402 | |
| Datapipe, Inc. Tranche B 1LN, term loan 5.79% 3/15/19 (c) | 10,608 | 10,626 | |
| Dell International LLC: | |||
| Tranche A 1LN, term loan 3% 12/31/18 (c) | 6,205 | 6,209 | |
| Tranche B, term loan 3.5% 9/7/23 (c) | 35,323 | 35,447 | |
| EIG Investors Corp.: | |||
| Tranche 1LN, term loan 6.5323% 11/9/19 (c) | 986 | 989 | |
| Tranche B 1LN, term loan 6.0418% 2/9/23 (c) | 44,875 | 45,174 | |
| Electro Rent Corp. Tranche B 1LN, term loan 6% 1/31/24 (c) | 14,963 | 15,025 | |
| Epicor Software Corp. Tranche B, term loan 4.75% 6/1/22 (c) | 29,388 | 29,342 | |
| First Data Corp.: | |||
| Tranche B 1LN, term loan 3.4911% 4/26/24 (c) | 12,000 | 12,000 | |
| Tranche B, term loan 3.9883% 7/10/22 (c) | 79,301 | 79,717 | |
| Gartner, Inc. Tranche B, term loan 2.9928% 4/5/24 (c) | 10,000 | 10,069 | |
| Genesys Telecommunications Laboratories, Inc. term loan 5.1584% 12/1/23 (c) | 40,818 | 41,114 | |
| Global Payments, Inc. Tranche B, term loan 3.4928% 4/22/23 (c) | 19,892 | 19,957 | |
| Go Daddy Operating Co. LLC Tranche B, term loan 3.4928% 2/15/24 (c) | 26,500 | 26,603 | |
| Infor U.S., Inc. Tranche B 6LN, term loan 3.8968% 2/1/22 (c) | 22,344 | 22,292 | |
| Information Resources, Inc.: | |||
| Tranche 2LN, term loan 9.25% 1/18/25 (c) | 7,500 | 7,477 | |
| Tranche B 1LN, term loan 5.25% 1/18/24 (c) | 21,160 | 21,365 | |
| Inmar, Inc.: | |||
| Tranche 2LN, term loan 4/16/25 (b) | 2,280 | 2,246 | |
| Tranche B 1LN, term loan 4/16/24 (b) | 7,985 | 7,930 | |
| Kronos, Inc. term loan: | |||
| 5.034% 11/1/23 (c) | 39,900 | 40,020 | |
| 9.284% 11/1/24 (c) | 30,000 | 31,215 | |
| Landesk Group, Inc. term loan: | |||
| 5.25% 1/20/24 (c) | 29,865 | 30,008 | |
| 10% 1/20/25 (c) | 5,000 | 4,960 | |
| Lux FinCo U.S. SPV: | |||
| Tranche 2LN, term loan 9.5% 10/16/23 (c) | 4,875 | 4,826 | |
| Tranche B 3LN, term loan 4.5% 10/16/22 (c) | 10,758 | 10,799 | |
| MA FinanceCo. LLC: | |||
| term loan 4/18/24 (b) | 38,439 | 38,547 | |
| Tranche B 3LN, term loan 4/18/24 (b) | 6,061 | 6,078 | |
| Microsemi Corp. Tranche B, term loan 3.2411% 1/15/23 (c) | 10,319 | 10,359 | |
| Rackspace Hosting, Inc. term loan 4.5346% 11/3/23 (c) | 45,631 | 45,945 | |
| Renaissance Learning, Inc.: | |||
| Tranche 1LN, term loan 4.8968% 4/9/21 (c) | 19,508 | 19,594 | |
| Tranche 2LN, term loan 8.1468% 4/9/22 (c) | 19,080 | 18,969 | |
| Sabre GLBL, Inc. Tranche B, term loan 3.7428% 2/22/24 (c) | 13,835 | 13,968 | |
| SolarWinds Holdings, Inc. Tranche B, term loan 4.5% 2/5/23 (c) | 10,421 | 10,471 | |
| Solera LLC Tranche B, term loan 4.25% 3/3/23 (c) | 32,808 | 33,031 | |
| Sophia L.P. term loan 4.3968% 9/30/22 (c) | 26,564 | 26,517 | |
| SS&C Technologies, Inc.: | |||
| Tranche B 1LN, term loan 3.2428% 7/8/22 (c) | 16,249 | 16,360 | |
| Tranche B 2LN, term loan 3.2428% 7/8/22 (c) | 1,349 | 1,359 | |
| Sybil Software LLC. Tranche B, term loan 4.3968% 9/30/23 (c) | 37,207 | 37,549 | |
| Syniverse Holdings, Inc. Tranche B, term loan: | |||
| 4.1468% 4/23/19 (c) | 16,107 | 14,778 | |
| 4.1718% 4/23/19 (c) | 9,368 | 8,563 | |
| Tempo Acquisition LLC Tranche B, term loan 4/20/24 (b) | 41,890 | 41,859 | |
| TIBCO Software, Inc. Tranche 1LN, term loan 5.5% 12/5/20 (c) | 8,063 | 8,134 | |
| TTM Technologies, Inc. Tranche B 1LN, term loan 5.25% 5/31/21 (c) | 27,446 | 27,926 | |
| Uber Technologies, Inc. Tranche B, term loan 5% 7/13/23 (c) | 30,348 | 30,253 | |
| Vantiv LLC Tranche B, term loan 3.49% 10/14/23 (c) | 12,784 | 12,876 | |
| Veritas U.S., Inc. Tranche B 1LN, term loan 6.7718% 1/27/23 (c) | 29,856 | 29,682 | |
| WEX, Inc. Tranche B, term loan 4.4928% 7/1/23 (c) | 18,395 | 18,573 | |
| TOTAL TECHNOLOGY | 1,155,157 | ||
| Telecommunications - 7.5% | |||
| Altice Financing SA Tranche B, term loan 3.908% 6/22/25(c) | 11,000 | 10,992 | |
| Blucora, Inc. Tranche B, term loan 4/20/24 (b) | 5,500 | 5,500 | |
| Consolidated Communications, Inc. Tranche B 2LN, term loan 10/5/23 (b) | 20,500 | 20,603 | |
| Digicel International Finance Ltd. Tranche D 2LN, term loan 4.6468% 3/31/19 (c) | 31,560 | 31,166 | |
| DigitalGlobe, Inc. Tranche B, term loan 3.7428% 1/15/24 (c) | 11,192 | 11,234 | |
| Evo Payments International LLC Tranche B 1LN, term loan 6% 12/20/23 (c) | 17,995 | 18,186 | |
| FairPoint Communications, Inc. Tranche B, term loan 7.5% 2/14/19 (c) | 9,890 | 9,923 | |
| Frontier Communications Corp. Tranche A, term loan 3.75% 3/31/21 (c) | 2,468 | 2,396 | |
| GTT Communications, Inc. Tranche B, term loan 5% 1/9/24 (c) | 7,002 | 7,068 | |
| Intelsat Jackson Holdings SA Tranche B 2LN, term loan 3.8873% 6/30/19 (c) | 126,675 | 124,904 | |
| Level 3 Financing, Inc. Tranche B, term loan 3.2411% 2/22/24 (c) | 79,500 | 79,727 | |
| LTS Buyer LLC Tranche B 1LN, term loan 4.3968% 4/11/20 (c) | 50,149 | 50,284 | |
| Neptune Finco Corp.: | |||
| Tranche B, term loan 3.2439% 7/17/25 (c) | 25,038 | 25,016 | |
| Tranche DD 1LN, term loan 3.2439% 7/17/25 (c) | 1,243 | 1,240 | |
| Neustar, Inc.: | |||
| Tranche 2LN, term loan 2/28/25 (b) | 5,460 | 5,508 | |
| Tranche B1 1LN, term loan 8/31/19 (b) | 4,000 | 4,068 | |
| Tranche B2 1LN, term loan 2/29/24 (b) | 18,995 | 19,240 | |
| Onvoy LLC Tranche B 1LN, term loan 5.6468% 2/10/24 (c) | 20,065 | 20,065 | |
| Polycom, Inc. Tranche B, term loan 6.25% 9/27/23 (c) | 18,417 | 18,572 | |
| RP Crown Parent, LLC Tranche B, term loan 4.5% 10/12/23 (c) | 28,429 | 28,636 | |
| Sable International Finance Ltd. Tranche B 1LN, term loan 5.7322% 12/31/22 (c) | 13,895 | 13,958 | |
| SBA Senior Finance II, LLC term loan 3.25% 3/24/21 (c) | 31,146 | 31,326 | |
| Securus Technologies Holdings, Inc.: | |||
| Tranche 2LN, term loan 9% 4/30/21 (c) | 7,775 | 7,752 | |
| Tranche B 1LN, term loan 4.75% 4/30/20 (c) | 38,553 | 38,469 | |
| Securus Technologies, Inc. Tranche B2 1LN, term loan 5.3968% 4/30/20 (c) | 4,497 | 4,487 | |
| SFR Group SA Tranche B 11LN, term loan 3.9441% 7/31/25 (c) | 34,500 | 34,318 | |
| Sprint Communications, Inc. Tranche B, term loan 3.5% 2/3/24 (c) | 79,960 | 80,010 | |
| TCH-2 Holdings, LLC. Tranche B 1LN, term loan 5.5% 5/12/21 (c) | 7,759 | 7,818 | |
| Telenet Financing USD LLC Tranche B, term loan 3.9655% 1/31/25 (c) | 10,500 | 10,515 | |
| Telesat LLC Tranche B 4LN, term loan 4.15% 11/17/23 (c) | 53,065 | 53,436 | |
| Windstream Services LLC Tranche B 7LN, term loan 4.25% 2/17/24 (c) | 14,733 | 14,715 | |
| Xplornet Communications, Inc. Tranche B, term loan 7.1468% 9/9/21 (c) | 2,985 | 3,011 | |
| TOTAL TELECOMMUNICATIONS | 794,143 | ||
| Textiles/Apparel - 0.1% | |||
| ABB Optical Group LLC Tranche B, term loan 6.1161% 6/15/23 (c) | 8,783 | 8,860 | |
| Transportation Ex Air/Rail - 0.2% | |||
| American Commercial Barge Line Tranche B 1LN, term loan 9.75% 11/12/20 (c) | 17,358 | 15,753 | |
| Navios Maritime Partners LP Tranche B, term loan 6.13% 9/14/20 (c) | 9,600 | 9,504 | |
| TOTAL TRANSPORTATION EX AIR/RAIL | 25,257 | ||
| Utilities - 4.7% | |||
| APLP Holdings LP Tranche B, term loan 5.9928% 4/13/23 (c) | 21,960 | 22,015 | |
| Calpine Construction Finance Co. LP: | |||
| Tranche B 1LN, term loan 3.24% 5/3/20 (c) | 50,866 | 50,882 | |
| Tranche B 2LN, term loan 3.49% 1/31/22 (c) | 7,027 | 7,025 | |
| Calpine Corp.: | |||
| Tranche B 5LN, term loan 3.9% 1/15/24 (c) | 32,128 | 32,211 | |
| Tranche B, term loan 2.75% 11/30/17 (c) | 11,273 | 11,296 | |
| Cortes NP Acquisition Corp. Tranche B, term loan 5.0302% 11/30/23 (c) | 21,930 | 22,058 | |
| Dynegy, Inc. Tranche C, term loan 4.25% 2/7/24 (c) | 56,000 | 55,956 | |
| Energy Future Holdings Corp. term loan 4.304% 6/30/17 (c) | 84,714 | 85,122 | |
| Essential Power LLC Tranche B, term loan 4.75% 8/8/19 (c) | 12,733 | 12,737 | |
| Exgen Texas Power LLC Tranche B, term loan 5.8968% 9/18/21 (c) | 26,316 | 14,158 | |
| Houston Fuel Oil Terminal Co. Tranche B, term loan 4.4% 8/19/21 (c) | 28,950 | 28,823 | |
| InterGen NV Tranche B, term loan 5.65% 6/13/20 (c) | 32,645 | 32,523 | |
| Limetree Bay Terminals LLC term loan 6.04% 2/15/24 (c) | 21,040 | 21,277 | |
| Moxie Patriot LLC Tranche B, term loan 6.8968% 12/19/20 (c) | 17,796 | 16,728 | |
| Southcross Energy Partners LP Tranche B, term loan 5.3968% 8/4/21 (c) | 5,740 | 5,072 | |
| Southcross Holdings Borrower LP Tranche B, term loan 9% 4/13/23 | 2,736 | 2,421 | |
| Tex Operations Co. LLC: | |||
| Tranche B, term loan 3.7526% 8/4/23 (c) | 41,019 | 40,929 | |
| Tranche C, term loan 3.7428% 8/4/23 (c) | 9,379 | 9,358 | |
| USIC Holdings, Inc. Tranche 1LN, term loan 5.1699% 12/9/23 (c) | 5,985 | 6,022 | |
| Vistra Operations Co. LLC Tranche B 2LN, term loan 4.2537% 12/14/23 (c) | 22,693 | 22,764 | |
| TOTAL UTILITIES | 499,377 | ||
| TOTAL BANK LOAN OBLIGATIONS | |||
| (Cost $9,228,085) | 9,219,753 | ||
| Nonconvertible Bonds - 6.3% | |||
| Broadcasting - 0.1% | |||
| AMC Networks, Inc. 4.75% 12/15/22 | 6,600 | 6,732 | |
| Univision Communications, Inc. 6.75% 9/15/22 (f) | 5,368 | 5,623 | |
| TOTAL BROADCASTING | 12,355 | ||
| Building Materials - 0.1% | |||
| CEMEX S.A.B. de CV 5.9084% 10/15/18 (c)(f) | 10,000 | 10,407 | |
| Cable/Satellite TV - 0.4% | |||
| CCO Holdings LLC/CCO Holdings Capital Corp.: | |||
| 5.125% 2/15/23 | 17,065 | 17,748 | |
| 5.25% 3/15/21 | 13,070 | 13,462 | |
| Cequel Communications Escrow I LLC/Cequel Communications Escrow Capital Corp. 6.375% 9/15/20 (f) | 7,507 | 7,737 | |
| Virgin Media Finance PLC 4.875% 2/15/22 | 2,000 | 1,795 | |
| TOTAL CABLE/SATELLITE TV | 40,742 | ||
| Chemicals - 0.0% | |||
| Nufarm Australia Ltd. 6.375% 10/15/19 (f) | 5,000 | 5,131 | |
| Containers - 0.7% | |||
| Ardagh Packaging Finance PLC/Ardagh MP Holdings U.S.A., Inc.: | |||
| 4.25% 9/15/22 (f) | 15,000 | 15,288 | |
| 4.289% 5/15/21 (c)(f) | 7,000 | 7,149 | |
| 6% 2/15/25 (f) | 10,000 | 10,338 | |
| Reynolds Group Issuer, Inc./Reynolds Group Issuer LLC/Reynolds Group Issuer (Luxembourg) SA: | |||
| 4.6584% 7/15/21 (c)(f) | 11,130 | 11,380 | |
| 5.75% 10/15/20 | 33,325 | 34,325 | |
| TOTAL CONTAINERS | 78,480 | ||
| Diversified Financial Services - 0.5% | |||
| CIT Group, Inc. 5% 5/15/18 (f) | 7,000 | 7,041 | |
| Icahn Enterprises LP/Icahn Enterprises Finance Corp.: | |||
| 4.875% 3/15/19 | 15,000 | 15,188 | |
| 6.25% 2/1/22 (f) | 5,200 | 5,408 | |
| International Lease Finance Corp.: | |||
| 3.875% 4/15/18 | 7,000 | 7,129 | |
| 6.25% 5/15/19 | 10,000 | 10,779 | |
| Prime Securities Services Borrower LLC/Prime Finance, Inc. 9.25% 5/15/23 (f) | 10,000 | 10,925 | |
| TOTAL DIVERSIFIED FINANCIAL SERVICES | 56,470 | ||
| Energy - 0.5% | |||
| Cheniere Corpus Christi Holdings LLC 7% 6/30/24 (f) | 7,000 | 7,822 | |
| Chesapeake Energy Corp. 8% 12/15/22 (f) | 17,832 | 18,790 | |
| Citgo Petroleum Corp. 6.25% 8/15/22 (f) | 10,000 | 10,200 | |
| Peabody Securities Finance Corp. 6% 3/31/22 (f) | 3,335 | 3,402 | |
| Targa Resources Partners LP/Targa Resources Partners Finance Corp. 6.375% 8/1/22 | 4,492 | 4,629 | |
| Western Refining, Inc. 6.25% 4/1/21 | 5,305 | 5,477 | |
| TOTAL ENERGY | 50,320 | ||
| Entertainment/Film - 0.0% | |||
| Cinemark U.S.A., Inc. 5.125% 12/15/22 | 3,185 | 3,281 | |
| Food/Beverage/Tobacco - 0.0% | |||
| ESAL GmbH 6.25% 2/5/23 (f) | 4,000 | 4,055 | |
| Gaming - 0.2% | |||
| Gateway Casinos & Entertainment Ltd. 8.25% 3/1/24 (f) | 5,000 | 5,113 | |
| MCE Finance Ltd. 5% 2/15/21 (f) | 10,000 | 10,219 | |
| Scientific Games Corp. 7% 1/1/22 (f) | 7,800 | 8,351 | |
| TOTAL GAMING | 23,683 | ||
| Healthcare - 0.8% | |||
| Community Health Systems, Inc. 6.25% 3/31/23 | 14,175 | 14,423 | |
| DaVita HealthCare Partners, Inc. 5.75% 8/15/22 | 8,235 | 8,534 | |
| HCA Holdings, Inc. 3.75% 3/15/19 | 25,000 | 25,531 | |
| MPT Operating Partnership LP/MPT Finance Corp. 5.25% 8/1/26 | 3,570 | 3,659 | |
| Tenet Healthcare Corp.: | |||
| 4.6312% 6/15/20 (c) | 17,895 | 17,984 | |
| 4.75% 6/1/20 | 8,680 | 8,810 | |
| 7.5% 1/1/22 (f) | 5,085 | 5,441 | |
| TOTAL HEALTHCARE | 84,382 | ||
| Homebuilders/Real Estate - 0.2% | |||
| CBRE Group, Inc. 5% 3/15/23 | 17,990 | 18,800 | |
| Leisure - 0.2% | |||
| Studio City Co. Ltd.: | |||
| 5.875% 11/30/19 (f) | 6,860 | 7,177 | |
| 7.25% 11/30/21 (f) | 10,000 | 10,720 | |
| TOTAL LEISURE | 17,897 | ||
| Paper - 0.1% | |||
| Xerium Technologies, Inc. 9.5% 8/15/21 | 9,500 | 9,856 | |
| Publishing/Printing - 0.1% | |||
| Cenveo Corp. 6% 8/1/19 (f) | 9,850 | 8,028 | |
| Services - 0.3% | |||
| APX Group, Inc.: | |||
| 7.875% 12/1/22 (f) | 5,000 | 5,450 | |
| 7.875% 12/1/22 | 8,975 | 9,783 | |
| Avis Budget Car Rental LLC/Avis Budget Finance, Inc. 3.8046% 12/1/17 (c) | 14,410 | 14,417 | |
| TOTAL SERVICES | 29,650 | ||
| Super Retail - 0.1% | |||
| JC Penney Corp., Inc. 5.875% 7/1/23 (f) | 6,385 | 6,449 | |
| Technology - 0.5% | |||
| Brocade Communications Systems, Inc. 4.625% 1/15/23 | 10,770 | 11,012 | |
| Diamond 1 Finance Corp./Diamond 2 Finance Corp.: | |||
| 3.48% 6/1/19 (f) | 6,199 | 6,341 | |
| 4.42% 6/15/21 (f) | 16,685 | 17,512 | |
| NXP BV/NXP Funding LLC: | |||
| 4.125% 6/1/21 (f) | 16,440 | 17,200 | |
| 5.75% 3/15/23 (f) | 5,000 | 5,275 | |
| TOTAL TECHNOLOGY | 57,340 | ||
| Telecommunications - 1.4% | |||
| Altice Financing SA: | |||
| 6.5% 1/15/22 (f) | 7,240 | 7,593 | |
| 7.5% 5/15/26 (f) | 19,200 | 20,736 | |
| Columbus International, Inc. 7.375% 3/30/21 (f) | 14,535 | 15,643 | |
| Intelsat Jackson Holdings SA 8% 2/15/24 (f) | 14,100 | 15,158 | |
| Level 3 Financing, Inc. 4.7621% 1/15/18 (c) | 15,000 | 15,038 | |
| SFR Group SA: | |||
| 6% 5/15/22 (f) | 2,550 | 2,658 | |
| 6.25% 5/15/24 (f) | 10,905 | 11,287 | |
| 7.375% 5/1/26 (f) | 18,755 | 19,716 | |
| Sprint Capital Corp.: | |||
| 6.875% 11/15/28 | 4,000 | 4,330 | |
| 6.9% 5/1/19 | 5,000 | 5,344 | |
| Sprint Communications, Inc.: | |||
| 6% 11/15/22 | 30,000 | 31,256 | |
| 9% 11/15/18 (f) | 3,000 | 3,281 | |
| TOTAL TELECOMMUNICATIONS | 152,040 | ||
| Utilities - 0.1% | |||
| NRG Energy, Inc. 6.625% 3/15/23 | 4,000 | 4,060 | |
| The AES Corp. 4.0546% 6/1/19 (c) | 1,433 | 1,434 | |
| TOTAL UTILITIES | 5,494 | ||
| TOTAL NONCONVERTIBLE BONDS | |||
| (Cost $661,548) | 674,860 | ||
| Shares | Value (000s) | ||
| Common Stocks - 0.3% | |||
| Broadcasting - 0.0% | |||
| Cumulus Media, Inc. Class A (g) | 28,882 | 8 | |
| ION Media Networks, Inc. | 2,842 | 1,455 | |
| TOTAL BROADCASTING | 1,463 | ||
| Chemicals - 0.2% | |||
| LyondellBasell Industries NV Class A | 245,943 | 20,846 | |
| Homebuilders/Real Estate - 0.0% | |||
| Five Point Holdings LLC Class A (g) | 45,793 | 641 | |
| Metals/Mining - 0.1% | |||
| Warrior Met Coal, Inc. (g) | 496,683 | 8,082 | |
| Paper - 0.0% | |||
| White Birch Cayman Holdings Ltd. (g) | 12,570 | 0 | |
| Telecommunications - 0.0% | |||
| FairPoint Communications, Inc. (g) | 34,287 | 585 | |
| Utilities - 0.0% | |||
| Calpine Corp. (g) | 20,715 | 211 | |
| Southcross Holdings Borrower LP | 2,927 | 1,365 | |
| TOTAL UTILITIES | 1,576 | ||
| TOTAL COMMON STOCKS | |||
| (Cost $85,130) | 33,193 | ||
| Money Market Funds - 11.5% | |||
| Fidelity Cash Central Fund, 0.85% (h) | |||
| (Cost $1,223,646) | 1,223,570,804 | 1,223,816 | |
| TOTAL INVESTMENT PORTFOLIO - 104.6% | |||
| (Cost $11,198,409) | 11,151,622 | ||
| NET OTHER ASSETS (LIABILITIES) - (4.6)% | (495,226) | ||
| NET ASSETS - 100% | $10,656,396 |
Values shown as $0 may reflect amounts less than $500.
Legend
(a) Remaining maturities of bank loan obligations may be less than the stated maturities shown as a result of contractual or optional prepayments by the borrower. Such prepayments cannot be predicted with certainty.
(b) The coupon rate will be determined upon settlement of the loan after period end.
(c) Coupon rates for floating and adjustable rate securities reflect the rates in effect at period end.
(d) Position represents an unfunded loan commitment. At period end, the total principal amount and market value of unfunded commitments totaled $905,000 and $910,000, respectively.
(e) Non-income producing - Security is in default.
(f) Security exempt from registration under Rule 144A of the Securities Act of 1933. These securities may be resold in transactions exempt from registration, normally to qualified institutional buyers. At the end of the period, the value of these securities amounted to $350,044,000 or 3.3% of net assets.
(g) Non-income producing
(h) Affiliated fund that is generally available only to investment companies and other accounts managed by Fidelity Investments. The rate quoted is the annualized seven-day yield of the fund at period end. A complete unaudited listing of the fund's holdings as of its most recent quarter end is available upon request. In addition, each Fidelity Central Fund's financial statements, which are not covered by the Fund's Report of Independent Registered Public Accounting Firm, are available on the SEC's website or upon request.
Affiliated Central Funds
Information regarding fiscal year to date income earned by the Fund from investments in Fidelity Central Funds is as follows:
| Fund | Income earned |
| (Amounts in thousands) | |
| Fidelity Cash Central Fund | $3,589 |
| Total | $3,589 |
Investment Valuation
The following is a summary of the inputs used, as of April 30, 2017, involving the Fund's assets and liabilities carried at fair value. The inputs or methodology used for valuing securities may not be an indication of the risk associated with investing in those securities. For more information on valuation inputs, and their aggregation into the levels used below, please refer to the Investment Valuation section in the accompanying Notes to Financial Statements.
| Valuation Inputs at Reporting Date: | ||||
| Description | Total | Level 1 | Level 2 | Level 3 |
| (Amounts in thousands) | ||||
| Investments in Securities: | ||||
| Equities: | ||||
| Consumer Discretionary | $1,463 | $8 | $-- | $1,455 |
| Energy | 8,082 | -- | 8,082 | -- |
| Materials | 20,846 | 20,846 | -- | -- |
| Real Estate | 641 | -- | 641 | -- |
| Telecommunication Services | 585 | 585 | -- | -- |
| Utilities | 1,576 | 211 | -- | 1,365 |
| Bank Loan Obligations | 9,219,753 | -- | 9,166,680 | 53,073 |
| Corporate Bonds | 674,860 | -- | 674,860 | -- |
| Money Market Funds | 1,223,816 | 1,223,816 | -- | -- |
| Total Investments in Securities: | $11,151,622 | $1,245,466 | $9,850,263 | $55,893 |
Other Information
Distribution of investments by country or territory of incorporation, as a percentage of Total Net Assets, is as follows (Unaudited):
| United States of America | 90.0% |
| Luxembourg | 4.4% |
| Canada | 1.4% |
| Netherlands | 1.3% |
| Others (Individually Less Than 1%) | 2.9% |
| 100.0% |
See accompanying notes which are an integral part of the financial statements.
Financial Statements
Statement of Assets and Liabilities
| Amounts in thousands (except per-share amounts) | April 30, 2017 | |
| Assets | ||
| Investment in securities, at value — See accompanying schedule: Unaffiliated issuers (cost $9,974,763) | $9,927,806 | |
| Fidelity Central Funds (cost $1,223,646) | 1,223,816 | |
| Total Investments (cost $11,198,409) | $11,151,622 | |
| Cash | 92,928 | |
| Receivable for investments sold | ||
| Regular delivery | 173,620 | |
| Delayed delivery | 2,247 | |
| Receivable for fund shares sold | 11,734 | |
| Dividends receivable | 1,764 | |
| Interest receivable | 51,487 | |
| Distributions receivable from Fidelity Central Funds | 819 | |
| Prepaid expenses | 6 | |
| Total assets | 11,486,227 | |
| Liabilities | ||
| Payable for investments purchased | $805,624 | |
| Payable for fund shares redeemed | 11,195 | |
| Distributions payable | 6,046 | |
| Accrued management fee | 4,938 | |
| Distribution and service plan fees payable | 644 | |
| Other affiliated payables | 1,287 | |
| Other payables and accrued expenses | 97 | |
| Total liabilities | 829,831 | |
| Net Assets | $10,656,396 | |
| Net Assets consist of: | ||
| Paid in capital | $11,033,422 | |
| Undistributed net investment income | 33,821 | |
| Accumulated undistributed net realized gain (loss) on investments | (364,060) | |
| Net unrealized appreciation (depreciation) on investments | (46,787) | |
| Net Assets | $10,656,396 | |
| Calculation of Maximum Offering Price | ||
| Class A: | ||
| Net Asset Value and redemption price per share ($628,832 ÷ 65,026 shares) | $9.67 | |
| Maximum offering price per share (100/97.25 of $9.67) | $9.94 | |
| Class M: | ||
| Net Asset Value and redemption price per share ($146,872 ÷ 15,210 shares) | $9.66 | |
| Maximum offering price per share (100/97.25 of $9.66) | $9.93 | |
| Class C: | ||
| Net Asset Value and offering price per share ($576,089 ÷ 59,585 shares)(a) | $9.67 | |
| Fidelity Floating Rate High Income Fund: | ||
| Net Asset Value, offering price and redemption price per share ($7,185,632 ÷ 744,051 shares) | $9.66 | |
| Class I: | ||
| Net Asset Value, offering price and redemption price per share ($2,118,971 ÷ 219,589 shares) | $9.65 |
(a) Redemption price per share is equal to net asset value less any applicable contingent deferred sales charge.
See accompanying notes which are an integral part of the financial statements.
Statement of Operations
| Amounts in thousands | Six months ended April 30, 2017 | |
| Investment Income | ||
| Dividends | $2,942 | |
| Interest | 230,638 | |
| Income from Fidelity Central Funds | 3,589 | |
| Total income | 237,169 | |
| Expenses | ||
| Management fee | $28,286 | |
| Transfer agent fees | 6,694 | |
| Distribution and service plan fees | 4,011 | |
| Accounting fees and expenses | 788 | |
| Custodian fees and expenses | 48 | |
| Independent trustees' fees and expenses | 20 | |
| Registration fees | 194 | |
| Audit | 92 | |
| Legal | 34 | |
| Miscellaneous | 36 | |
| Total expenses before reductions | 40,203 | |
| Expense reductions | (76) | 40,127 |
| Net investment income (loss) | 197,042 | |
| Realized and Unrealized Gain (Loss) | ||
| Net realized gain (loss) on: | ||
| Investment securities: | ||
| Unaffiliated issuers | 18,195 | |
| Fidelity Central Funds | 1 | |
| Total net realized gain (loss) | 18,196 | |
| Change in net unrealized appreciation (depreciation) on investment securities | 50,010 | |
| Net gain (loss) | 68,206 | |
| Net increase (decrease) in net assets resulting from operations | $265,248 |
See accompanying notes which are an integral part of the financial statements.
Statement of Changes in Net Assets
| Amounts in thousands | Six months ended April 30, 2017 | Year ended October 31, 2016 |
| Increase (Decrease) in Net Assets | ||
| Operations | ||
| Net investment income (loss) | $197,042 | $349,986 |
| Net realized gain (loss) | 18,196 | (225,620) |
| Change in net unrealized appreciation (depreciation) | 50,010 | 386,147 |
| Net increase (decrease) in net assets resulting from operations | 265,248 | 510,513 |
| Distributions to shareholders from net investment income | (190,918) | (383,140) |
| Share transactions - net increase (decrease) | 1,243,239 | (1,573,710) |
| Redemption fees | 251 | 413 |
| Total increase (decrease) in net assets | 1,317,820 | (1,445,924) |
| Net Assets | ||
| Beginning of period | 9,338,576 | 10,784,500 |
| End of period | $10,656,396 | $9,338,576 |
| Other Information | ||
| Undistributed net investment income end of period | $33,821 | $27,697 |
See accompanying notes which are an integral part of the financial statements.
Financial Highlights — Fidelity Advisor Floating Rate High Income Fund Class A
| Six months ended April 30, | Years ended October 31, | |||||
| 2017 | 2016 | 2015 | 2014 | 2013 | 2012 | |
| Selected Per–Share Data | ||||||
| Net asset value, beginning of period | $9.60 | $9.42 | $9.85 | $9.99 | $9.94 | $9.73 |
| Income from Investment Operations | ||||||
| Net investment income (loss)A | .179 | .334 | .375 | .317 | .310 | .340 |
| Net realized and unrealized gain (loss) | .064 | .211 | (.425) | (.114) | .070 | .195 |
| Total from investment operations | .243 | .545 | (.050) | .203 | .380 | .535 |
| Distributions from net investment income | (.173) | (.365) | (.341) | (.307) | (.282) | (.325) |
| Distributions from net realized gain | – | – | (.040) | (.036) | (.049) | – |
| Total distributions | (.173) | (.365) | (.381) | (.343) | (.331) | (.325) |
| Redemption fees added to paid in capitalA | –B | –B | .001 | –B | .001 | –B |
| Net asset value, end of period | $9.67 | $9.60 | $9.42 | $9.85 | $9.99 | $9.94 |
| Total ReturnC,D,E | 2.55% | 5.98% | (.53)% | 2.05% | 3.89% | 5.60% |
| Ratios to Average Net AssetsF,G | ||||||
| Expenses before reductions | .99%H | .99% | .98% | .98% | .99% | .99% |
| Expenses net of fee waivers, if any | .99%H | .99% | .98% | .98% | .99% | .99% |
| Expenses net of all reductions | .99%H | .98% | .98% | .98% | .99% | .99% |
| Net investment income (loss) | 3.74%H | 3.58% | 3.86% | 3.17% | 3.11% | 3.47% |
| Supplemental Data | ||||||
| Net assets, end of period (in millions) | $629 | $707 | $863 | $1,185 | $1,681 | $1,305 |
| Portfolio turnover rateI | 85%H | 46% | 26% | 54% | 62% | 49% |
A Calculated based on average shares outstanding during the period.
B Amount represents less than $.0005 per share.
C Total returns for periods of less than one year are not annualized.
D Total returns would have been lower if certain expenses had not been reduced during the applicable periods shown.
E Total returns do not include the effect of the sales charges.
F Fees and expenses of any underlying Fidelity Central Funds are not included in the Fund's expense ratio. The Fund indirectly bears its proportionate share of the expenses of any underlying Fidelity Central Funds.
G Expense ratios reflect operating expenses of the class. Expenses before reductions do not reflect amounts reimbursed by the investment adviser or reductions from brokerage service arrangements or reductions from other expense offset arrangements and do not represent the amount paid by the class during periods when reimbursements or reductions occur. Expenses net of fee waivers reflect expenses after reimbursement by the investment adviser but prior to reductions from brokerage service arrangements or other expense offset arrangements. Expenses net of all reductions represent the net expenses paid by the class.
H Annualized
I Amount does not include the portfolio activity of any underlying Fidelity Central Funds.
See accompanying notes which are an integral part of the financial statements.
Financial Highlights — Fidelity Advisor Floating Rate High Income Fund Class M
| Six months ended April 30, | Years ended October 31, | |||||
| 2017 | 2016 | 2015 | 2014 | 2013 | 2012 | |
| Selected Per–Share Data | ||||||
| Net asset value, beginning of period | $9.58 | $9.40 | $9.84 | $9.98 | $9.93 | $9.72 |
| Income from Investment Operations | ||||||
| Net investment income (loss)A | .176 | .324 | .365 | .306 | .299 | .330 |
| Net realized and unrealized gain (loss) | .075 | .212 | (.434) | (.112) | .071 | .195 |
| Total from investment operations | .251 | .536 | (.069) | .194 | .370 | .525 |
| Distributions from net investment income | (.171) | (.356) | (.332) | (.298) | (.272) | (.315) |
| Distributions from net realized gain | – | – | (.040) | (.036) | (.049) | – |
| Total distributions | (.171) | (.356) | (.372) | (.334) | (.321) | (.315) |
| Redemption fees added to paid in capitalA | –B | –B | .001 | –B | .001 | –B |
| Net asset value, end of period | $9.66 | $9.58 | $9.40 | $9.84 | $9.98 | $9.93 |
| Total ReturnC,D,E | 2.63% | 5.89% | (.72)% | 1.96% | 3.79% | 5.50% |
| Ratios to Average Net AssetsF,G | ||||||
| Expenses before reductions | 1.04%H | 1.08% | 1.07% | 1.07% | 1.09% | 1.09% |
| Expenses net of fee waivers, if any | 1.04%H | 1.08% | 1.07% | 1.07% | 1.09% | 1.09% |
| Expenses net of all reductions | 1.04%H | 1.08% | 1.07% | 1.07% | 1.09% | 1.09% |
| Net investment income (loss) | 3.69%H | 3.48% | 3.77% | 3.08% | 3.01% | 3.37% |
| Supplemental Data | ||||||
| Net assets, end of period (in millions) | $147 | $171 | $195 | $240 | $272 | $241 |
| Portfolio turnover rateI | 85%H | 46% | 26% | 54% | 62% | 49% |
A Calculated based on average shares outstanding during the period.
B Amount represents less than $.0005 per share.
C Total returns for periods of less than one year are not annualized.
D Total returns would have been lower if certain expenses had not been reduced during the applicable periods shown.
E Total returns do not include the effect of the sales charges.
F Fees and expenses of any underlying Fidelity Central Funds are not included in the Fund's expense ratio. The Fund indirectly bears its proportionate share of the expenses of any underlying Fidelity Central Funds.
G Expense ratios reflect operating expenses of the class. Expenses before reductions do not reflect amounts reimbursed by the investment adviser or reductions from brokerage service arrangements or reductions from other expense offset arrangements and do not represent the amount paid by the class during periods when reimbursements or reductions occur. Expenses net of fee waivers reflect expenses after reimbursement by the investment adviser but prior to reductions from brokerage service arrangements or other expense offset arrangements. Expenses net of all reductions represent the net expenses paid by the class.
H Annualized
I Amount does not include the portfolio activity of any underlying Fidelity Central Funds.
See accompanying notes which are an integral part of the financial statements.
Financial Highlights — Fidelity Advisor Floating Rate High Income Fund Class C
| Six months ended April 30, | Years ended October 31, | |||||
| 2017 | 2016 | 2015 | 2014 | 2013 | 2012 | |
| Selected Per–Share Data | ||||||
| Net asset value, beginning of period | $9.59 | $9.41 | $9.85 | $9.99 | $9.94 | $9.73 |
| Income from Investment Operations | ||||||
| Net investment income (loss)A | .142 | .263 | .301 | .241 | .235 | .267 |
| Net realized and unrealized gain (loss) | .075 | .212 | (.434) | (.113) | .070 | .195 |
| Total from investment operations | .217 | .475 | (.133) | .128 | .305 | .462 |
| Distributions from net investment income | (.137) | (.295) | (.268) | (.232) | (.207) | (.252) |
| Distributions from net realized gain | – | – | (.040) | (.036) | (.049) | – |
| Total distributions | (.137) | (.295) | (.308) | (.268) | (.256) | (.252) |
| Redemption fees added to paid in capitalA | –B | –B | .001 | –B | .001 | –B |
| Net asset value, end of period | $9.67 | $9.59 | $9.41 | $9.85 | $9.99 | $9.94 |
| Total ReturnC,D,E | 2.27% | 5.19% | (1.38)% | 1.29% | 3.11% | 4.81% |
| Ratios to Average Net AssetsF,G | ||||||
| Expenses before reductions | 1.75%H | 1.74% | 1.73% | 1.73% | 1.74% | 1.74% |
| Expenses net of fee waivers, if any | 1.75%H | 1.74% | 1.73% | 1.73% | 1.74% | 1.74% |
| Expenses net of all reductions | 1.75%H | 1.74% | 1.73% | 1.73% | 1.74% | 1.74% |
| Net investment income (loss) | 2.98%H | 2.82% | 3.10% | 2.41% | 2.35% | 2.72% |
| Supplemental Data | ||||||
| Net assets, end of period (in millions) | $576 | $582 | $671 | $835 | $960 | $806 |
| Portfolio turnover rateI | 85%H | 46% | 26% | 54% | 62% | 49% |
A Calculated based on average shares outstanding during the period.
B Amount represents less than $.0005 per share.
C Total returns for periods of less than one year are not annualized.
D Total returns would have been lower if certain expenses had not been reduced during the applicable periods shown.
E Total returns do not include the effect of the contingent deferred sales charge.
F Fees and expenses of any underlying Fidelity Central Funds are not included in the Fund's expense ratio. The Fund indirectly bears its proportionate share of the expenses of any underlying Fidelity Central Funds.
G Expense ratios reflect operating expenses of the class. Expenses before reductions do not reflect amounts reimbursed by the investment adviser or reductions from brokerage service arrangements or reductions from other expense offset arrangements and do not represent the amount paid by the class during periods when reimbursements or reductions occur. Expenses net of fee waivers reflect expenses after reimbursement by the investment adviser but prior to reductions from brokerage service arrangements or other expense offset arrangements. Expenses net of all reductions represent the net expenses paid by the class.
H Annualized
I Amount does not include the portfolio activity of any underlying Fidelity Central Funds.
See accompanying notes which are an integral part of the financial statements.
Financial Highlights — Fidelity Advisor Floating Rate High Income Fund
| Six months ended April 30, | Years ended October 31, | |||||
| 2017 | 2016 | 2015 | 2014 | 2013 | 2012 | |
| Selected Per–Share Data | ||||||
| Net asset value, beginning of period | $9.58 | $9.40 | $9.84 | $9.98 | $9.93 | $9.72 |
| Income from Investment Operations | ||||||
| Net investment income (loss)A | .192 | .359 | .401 | .344 | .337 | .368 |
| Net realized and unrealized gain (loss) | .075 | .212 | (.435) | (.113) | .071 | .195 |
| Total from investment operations | .267 | .571 | (.034) | .231 | .408 | .563 |
| Distributions from net investment income | (.187) | (.391) | (.367) | (.335) | (.310) | (.353) |
| Distributions from net realized gain | – | – | (.040) | (.036) | (.049) | – |
| Total distributions | (.187) | (.391) | (.407) | (.371) | (.359) | (.353) |
| Redemption fees added to paid in capitalA | –B | –B | .001 | –B | .001 | –B |
| Net asset value, end of period | $9.66 | $9.58 | $9.40 | $9.84 | $9.98 | $9.93 |
| Total ReturnC,D | 2.80% | 6.28% | (.36)% | 2.34% | 4.19% | 5.91% |
| Ratios to Average Net AssetsE,F | ||||||
| Expenses before reductions | .70%G | .71% | .70% | .69% | .70% | .71% |
| Expenses net of fee waivers, if any | .70%G | .71% | .70% | .69% | .70% | .71% |
| Expenses net of all reductions | .70%G | .71% | .70% | .69% | .70% | .71% |
| Net investment income (loss) | 4.03%G | 3.86% | 4.14% | 3.45% | 3.39% | 3.75% |
| Supplemental Data | ||||||
| Net assets, end of period (in millions) | $7,186 | $6,131 | $6,615 | $9,032 | $8,882 | $5,720 |
| Portfolio turnover rateH | 85%G | 46% | 26% | 54% | 62% | 49% |
A Calculated based on average shares outstanding during the period.
B Amount represents less than $.0005 per share.
C Total returns for periods of less than one year are not annualized.
D Total returns would have been lower if certain expenses had not been reduced during the applicable periods shown.
E Fees and expenses of any underlying Fidelity Central Funds are not included in the Fund's expense ratio. The Fund indirectly bears its proportionate share of the expenses of any underlying Fidelity Central Funds.
F Expense ratios reflect operating expenses of the class. Expenses before reductions do not reflect amounts reimbursed by the investment adviser or reductions from brokerage service arrangements or reductions from other expense offset arrangements and do not represent the amount paid by the class during periods when reimbursements or reductions occur. Expenses net of fee waivers reflect expenses after reimbursement by the investment adviser but prior to reductions from brokerage service arrangements or other expense offset arrangements. Expenses net of all reductions represent the net expenses paid by the class.
G Annualized
H Amount does not include the portfolio activity of any underlying Fidelity Central Funds.
See accompanying notes which are an integral part of the financial statements.
Financial Highlights — Fidelity Advisor Floating Rate High Income Fund Class I
| Six months ended April 30, | Years ended October 31, | |||||
| 2017 | 2016 | 2015 | 2014 | 2013 | 2012 | |
| Selected Per–Share Data | ||||||
| Net asset value, beginning of period | $9.58 | $9.40 | $9.83 | $9.97 | $9.92 | $9.71 |
| Income from Investment Operations | ||||||
| Net investment income (loss)A | .189 | .355 | .396 | .339 | .332 | .363 |
| Net realized and unrealized gain (loss) | .065 | .211 | (.424) | (.113) | .071 | .196 |
| Total from investment operations | .254 | .566 | (.028) | .226 | .403 | .559 |
| Distributions from net investment income | (.184) | (.386) | (.363) | (.330) | (.305) | (.349) |
| Distributions from net realized gain | – | – | (.040) | (.036) | (.049) | – |
| Total distributions | (.184) | (.386) | (.403) | (.366) | (.354) | (.349) |
| Redemption fees added to paid in capitalA | –B | –B | .001 | –B | .001 | –B |
| Net asset value, end of period | $9.65 | $9.58 | $9.40 | $9.83 | $9.97 | $9.92 |
| Total ReturnC,D | 2.67% | 6.23% | (.30)% | 2.29% | 4.15% | 5.87% |
| Ratios to Average Net AssetsE,F | ||||||
| Expenses before reductions | .76%G | .75% | .74% | .74% | .75% | .75% |
| Expenses net of fee waivers, if any | .76%G | .75% | .74% | .74% | .75% | .75% |
| Expenses net of all reductions | .76%G | .75% | .74% | .74% | .75% | .75% |
| Net investment income (loss) | 3.97%G | 3.81% | 4.10% | 3.40% | 3.34% | 3.71% |
| Supplemental Data | ||||||
| Net assets, end of period (in millions) | $2,119 | $1,748 | $2,429 | $3,317 | $3,646 | $2,510 |
| Portfolio turnover rateH | 85%G | 46% | 26% | 54% | 62% | 49% |
A Calculated based on average shares outstanding during the period.
B Amount represents less than $.0005 per share.
C Total returns for periods of less than one year are not annualized.
D Total returns would have been lower if certain expenses had not been reduced during the applicable periods shown.
E Fees and expenses of any underlying Fidelity Central Funds are not included in the Fund's expense ratio. The Fund indirectly bears its proportionate share of the expenses of any underlying Fidelity Central Funds.
F Expense ratios reflect operating expenses of the class. Expenses before reductions do not reflect amounts reimbursed by the investment adviser or reductions from brokerage service arrangements or reductions from other expense offset arrangements and do not represent the amount paid by the class during periods when reimbursements or reductions occur. Expenses net of fee waivers reflect expenses after reimbursement by the investment adviser but prior to reductions from brokerage service arrangements or other expense offset arrangements. Expenses net of all reductions represent the net expenses paid by the class.
G Annualized
H Amount does not include the portfolio activity of any underlying Fidelity Central Funds.
See accompanying notes which are an integral part of the financial statements.
Notes to Financial Statements
For the period ended April 30, 2017
(Amounts in thousands except percentages)
1. Organization.
Fidelity Advisor Floating Rate High Income Fund (the Fund) is a fund of Fidelity Advisor Series I (the Trust) and is authorized to issue an unlimited number of shares. The Trust is registered under the Investment Company Act of 1940, as amended (the 1940 Act), as an open-end management investment company organized as a Massachusetts business trust. The Fund offers Class A, Class M (formerly Class T), Class C, Fidelity Floating Rate High Income Fund and Class I shares, each of which has equal rights as to assets and voting privileges. Each class has exclusive voting rights with respect to matters that affect that class.
After the close of business on June 24, 2016, all outstanding Class B shares were converted to Class A shares. All prior fiscal period dollar and share amounts for Class B presented in the Notes to Financial Statements are for the period November 1, 2015 through June 24, 2016.
2. Investments in Fidelity Central Funds.
The Fund invests in Fidelity Central Funds, which are open-end investment companies generally available only to other investment companies and accounts managed by the investment adviser and its affiliates. The Fund's Schedule of Investments lists each of the Fidelity Central Funds held as of period end, if any, as an investment of the Fund, but does not include the underlying holdings of each Fidelity Central Fund. As an Investing Fund, the Fund indirectly bears its proportionate share of the expenses of the underlying Fidelity Central Funds.
The Money Market Central Funds seek preservation of capital and current income and are managed by Fidelity Investments Money Management, Inc. (FIMM), an affiliate of the investment adviser. Annualized expenses of the Money Market Central Funds as of their most recent shareholder report date are less than .005%.
A complete unaudited list of holdings for each Fidelity Central Fund is available upon request or at the Securities and Exchange Commission (the SEC) website at www.sec.gov. In addition, the financial statements of the Fidelity Central Funds, which are not covered by the Fund's Report of Independent Registered Public Accounting Firm, are available on the SEC website or upon request.
3. Significant Accounting Policies.
The Fund is an investment company and applies the accounting and reporting guidance of the Financial Accounting Standards Board (FASB) Accounting Standards Codification Topic 946 Financial Services – Investments Companies. The financial statements have been prepared in conformity with accounting principles generally accepted in the United States of America (GAAP), which require management to make certain estimates and assumptions at the date of the financial statements. Actual results could differ from those estimates. Subsequent events, if any, through the date that the financial statements were issued have been evaluated in the preparation of the financial statements. The following summarizes the significant accounting policies of the Fund:
Investment Valuation. Investments are valued as of 4:00 p.m. Eastern time on the last calendar day of the period. The Board of Trustees (the Board) has delegated the day to day responsibility for the valuation of the Fund's investments to the Fair Value Committee (the Committee) established by the Fund's investment adviser. In accordance with valuation policies and procedures approved by the Board, the Fund attempts to obtain prices from one or more third party pricing vendors or brokers to value its investments. When current market prices, quotations or currency exchange rates are not readily available or reliable, investments will be fair valued in good faith by the Committee, in accordance with procedures adopted by the Board. Factors used in determining fair value vary by investment type and may include market or investment specific events, changes in interest rates and credit quality. The frequency with which these procedures are used cannot be predicted and they may be utilized to a significant extent. The Committee oversees the Fund's valuation policies and procedures and reports to the Board on the Committee's activities and fair value determinations. The Board monitors the appropriateness of the procedures used in valuing the Fund's investments and ratifies the fair value determinations of the Committee.
The Fund categorizes the inputs to valuation techniques used to value its investments into a disclosure hierarchy consisting of three levels as shown below:
- Level 1 – quoted prices in active markets for identical investments
- Level 2 – other significant observable inputs (including quoted prices for similar investments, interest rates, prepayment speeds, etc.)
- Level 3 – unobservable inputs (including the Fund's own assumptions based on the best information available)
Valuation techniques used to value the Fund's investments by major category are as follows:
Debt securities, including restricted securities, are valued based on evaluated prices received from third party pricing vendors or from brokers who make markets in such securities. Corporate bonds and bank loan obligations are valued by pricing vendors who utilize matrix pricing which considers yield or price of bonds of comparable quality, coupon, maturity and type or by broker-supplied prices. When independent prices are unavailable or unreliable, debt securities may be valued utilizing pricing methodologies which consider similar factors that would be used by third party pricing vendors. Debt securities are generally categorized as Level 2 in the hierarchy but may be Level 3 depending on the circumstances. The Fund invests a significant portion of its assets in below investment grade securities. The value of these securities can be more volatile due to changes in the credit quality of the issuer and is sensitive to changes in economic, market and regulatory conditions.
Equity securities, including restricted securities, for which market quotations are readily available, are valued at the last reported sale price or official closing price as reported by a third party pricing vendor on the primary market or exchange on which they are traded and are categorized as Level 1 in the hierarchy. In the event there were no sales during the day or closing prices are not available, securities are valued at the last quoted bid price or may be valued using the last available price and are generally categorized as Level 2 in the hierarchy. For foreign equity securities, when market or security specific events arise, comparisons to the valuation of American Depositary Receipts (ADRs), futures contracts, Exchange-Traded Funds (ETFs) and certain indexes as well as quoted prices for similar securities may be used and would be categorized as Level 2 in the hierarchy. Utilizing these techniques may result in transfers between Level 1 and Level 2. For equity securities, including restricted securities, where observable inputs are limited, assumptions about market activity and risk are used and these securities may be categorized as Level 3 in the hierarchy.
Investments in open-end mutual funds, including the Fidelity Central Funds, are valued at their closing net asset value (NAV) each business day and are categorized as Level 1 in the hierarchy.
Changes in valuation techniques may result in transfers in or out of an assigned level within the disclosure hierarchy. The aggregate value of investments by input level as of April 30, 2017, is included at the end of the Fund's Schedule of Investments.
Investment Transactions and Income. For financial reporting purposes, the Fund's investment holdings and NAV include trades executed through the end of the last business day of the period. The NAV per share for processing shareholder transactions is calculated as of the close of business of the New York Stock Exchange (NYSE), normally 4:00 p.m. Eastern time and includes trades executed through the end of the prior business day. Gains and losses on securities sold are determined on the basis of identified cost. Dividend income is recorded on the ex-dividend date, except for certain dividends from foreign securities where the ex-dividend date may have passed, which are recorded as soon as the Fund is informed of the ex-dividend date. Non-cash dividends included in dividend income, if any, are recorded at the fair market value of the securities received. Income and capital gain distributions from Fidelity Central Funds, if any, are recorded on the ex-dividend date. Certain distributions received by the Fund represent a return of capital or capital gain. The Fund determines the components of these distributions subsequent to the ex-dividend date, based upon receipt of tax filings or other correspondence relating to the underlying investment. These distributions are recorded as a reduction of cost of investments and/or as a realized gain. Interest income is accrued as earned and includes coupon interest and amortization of premium and accretion of discount on debt securities as applicable. Debt obligations may be placed on non-accrual status and related interest income may be reduced by ceasing current accruals and writing off interest receivables when the collection of all or a portion of interest has become doubtful based on consistently applied procedures. A debt obligation is removed from non-accrual status when the issuer resumes interest payments or when collectability of interest is reasonably assured. The Fund earns certain fees in connection with its floating rate loan purchasing activities. These fees are in addition to interest payments earned and may include amendment fees, consent fees and prepayment fees. These fees are recorded as Interest in the accompanying financial statements.
Class Allocations and Expenses. Investment income, realized and unrealized capital gains and losses, common expenses of the Fund, and certain fund-level expense reductions, if any, are allocated daily on a pro-rata basis to each class based on the relative net assets of each class to the total net assets of the Fund. Each class differs with respect to transfer agent and distribution and service plan fees incurred. Certain expense reductions may also differ by class. For the reporting period, the allocated portion of income and expenses to each class as a percent of its average net assets may vary due to the timing of recording these transactions in relation to fluctuating net assets of the classes. Expenses directly attributable to a fund are charged to that fund. Expenses attributable to more than one fund are allocated among the respective funds on the basis of relative net assets or other appropriate methods. Expense estimates are accrued in the period to which they relate and adjustments are made when actual amounts are known.
Income Tax Information and Distributions to Shareholders. Each year, the Fund intends to qualify as a regulated investment company under Subchapter M of the Internal Revenue Code, including distributing substantially all of its taxable income and realized gains. As a result, no provision for U.S. Federal income taxes is required. The Fund files a U.S. federal tax return, in addition to state and local tax returns as required. The Fund's federal income tax returns are subject to examination by the Internal Revenue Service (IRS) for a period of three fiscal years after they are filed. State and local tax returns may be subject to examination for an additional fiscal year depending on the jurisdiction.
Dividends are declared and recorded daily and paid monthly from net investment income. Distributions from realized gains, if any, are declared and recorded on the ex-dividend date. Income dividends and capital gain distributions are declared separately for each class. Income and capital gain distributions are determined in accordance with income tax regulations, which may differ from GAAP.
Capital accounts within the financial statements are adjusted for permanent book-tax differences. These adjustments have no impact on net assets or the results of operations. Capital accounts are not adjusted for temporary book-tax differences which will reverse in a subsequent period.
Book-tax differences are primarily due to market discount, capital loss carryforwards and losses deferred due to wash sales.
The federal tax cost of investment securities and unrealized appreciation (depreciation) as of period end were as follows:
| Gross unrealized appreciation | $165,167 |
| Gross unrealized depreciation | (199,421) |
| Net unrealized appreciation (depreciation) on securities | $(34,254) |
| Tax cost | $11,185,876 |
Capital loss carryforwards are only available to offset future capital gains of the Fund to the extent provided by regulations and may be limited. Under the Regulated Investment Company Modernization Act of 2010 (the Act), the Fund is permitted to carry forward capital losses incurred in taxable years beginning after December 22, 2010 for an unlimited period and such capital losses are required to be used prior to any losses that expire. The capital loss carryforward information presented below, including any applicable limitation, is estimated as of prior fiscal period end and is subject to adjustment.
| No expiration | |
| Short-term | $(30,793) |
| Long-term | (343,092) |
| Total capital loss carryforward | $(373,885) |
Short-Term Trading (Redemption) Fees. Shares held by investors in the Fund less than 60 days may have been subject to a redemption fee equal to 1.00% of the NAV of shares redeemed. All redemption fees, which reduce the proceeds of the shareholder redemption, are retained by the Fund and accounted for as an addition to paid in capital.
Delayed Delivery Transactions and When-Issued Securities. During the period, the Fund transacted in securities on a delayed delivery or when-issued basis. Payment and delivery may take place after the customary settlement period for that security. The price of the underlying securities and the date when the securities will be delivered and paid for are fixed at the time the transaction is negotiated. The Fund may receive compensation for interest forgone in the purchase of a delayed delivery or when-issued security. With respect to purchase commitments, the Fund identifies securities as segregated in its records with a value at least equal to the amount of the commitment. Losses may arise due to changes in the value of the underlying securities or if the counterparty does not perform under the contract's terms, or if the issuer does not issue the securities due to political, economic, or other factors.
Restricted Securities. The Fund may invest in securities that are subject to legal or contractual restrictions on resale. These securities generally may be resold in transactions exempt from registration or to the public if the securities are registered. Disposal of these securities may involve time-consuming negotiations and expense, and prompt sale at an acceptable price may be difficult. Information regarding restricted securities is included at the end of the Fund's Schedule of Investments.
Loans and Other Direct Debt Instruments. The Fund invests in direct debt instruments which are interests in amounts owed to lenders by corporate or other borrowers. These instruments may be in the form of loans, trade claims or other receivables and may include standby financing commitments such as revolving credit facilities that obligate the Fund to supply additional cash to the borrower on demand. Loans may be acquired through assignment or participation. The Fund also invests in unfunded loan commitments, which are contractual obligations for future funding. Information regarding unfunded commitments is included at the end of the Fund's Schedule of Investments.
New Accounting Pronouncement. In March 2017, the Financial Accounting Standards Board (FASB) issued an Accounting Standards Update (ASU), ASU 2017-08, which amends the amortization period for certain callable debt securities that are held at a premium. The amendment requires the premium to be amortized to the earliest call date. The amendments do not require an accounting change for securities held at a discount. The ASU is effective for annual periods beginning after December 15, 2019. Management is currently evaluating the potential impact of these changes to the financial statements.
4. Purchase and Sales of Investments.
Purchases and sales of securities (including principal repayments of bank loan obligations), other than short-term securities, aggregated $5,092,928 and $3,947,745, respectively.
5. Fees and Other Transactions with Affiliates.
Management Fee. Fidelity Management & Research Company (the investment adviser) and its affiliates provide the Fund with investment management related services for which the Fund pays a monthly management fee. The management fee is the sum of an individual fund fee rate that is based on an annual rate of .45% of the Fund's average net assets and an annualized group fee rate that averaged .11% during the period. The group fee rate is based upon the average net assets of all the mutual funds advised by the investment adviser, including any mutual funds previously advised by the investment adviser that are currently advised by Fidelity SelectCo, LLC, an affiliate of the investment adviser. The group fee rate decreases as assets under management increase and increases as assets under management decrease. For the reporting period, the total annualized management fee rate was .56% of the Fund's average net assets.
Distribution and Service Plan Fees. In accordance with Rule 12b-1 of the 1940 Act, the Fund has adopted separate Distribution and Service Plans for each class of shares. Certain classes pay Fidelity Distributors Corporation (FDC), an affiliate of the investment adviser, separate Distribution and Service Fees, each of which is based on an annual percentage of each class' average net assets. In addition, FDC may pay financial intermediaries for selling shares of the Fund and providing shareholder support services. For the period, the Distribution and Service Fee rates, total fees and amounts retained by FDC were as follows:
| Distribution Fee | Service Fee | Total Fees | Retained by FDC |
|
| Class A | -% | .25% | $893 | $37 |
| Class M | -% | .25% | 207 | 4 |
| Class C | .75% | .25% | 2,911 | 190 |
| $4,011 | $231 |
Sales Load. FDC may receive a front-end sales charge of up to 2.75% for selling Class A shares and Class M shares, some of which is paid to financial intermediaries for selling shares of the Fund. Depending on the holding period, FDC may receive contingent deferred sales charges levied on Class A, Class M and Class C redemptions. The deferred sales charges are 1.00% for Class C shares, 1.00% or .50% for certain purchases of Class A shares and .25% for certain purchases of Class M shares.
For the period, sales charge amounts retained by FDC were as follows:
| Retained by FDC |
|
| Class A | $26 |
| Class M | 5 |
| Class C(a) | 12 |
| $43 |
(a) When Class C shares are initially sold, FDC pays commissions from its own resources to financial intermediaries through which the sales are made.
Transfer Agent Fees. Fidelity Investments Institutional Operations Company, Inc., (FIIOC), an affiliate of the investment adviser, is the transfer, dividend disbursing and shareholder servicing agent for each class of the Fund. FIIOC receives account fees and asset-based fees that vary according to the account size and type of account of the shareholders of the respective classes of the Fund. FIIOC pays for typesetting, printing and mailing of shareholder reports, except proxy statements.
For the period, transfer agent fees for each class were as follows:
| Amount | % of Class-Level Average Net Assets(a) |
|
| Class A | $545 | .15 |
| Class M | 167 | .20 |
| Class C | 453 | .16 |
| Fidelity Floating Rate High Income Fund | 3,860 | .12 |
| Class I | 1,669 | .17 |
| $ 6,694 |
(a) Annualized
Accounting Fees. Fidelity Service Company, Inc. (FSC), an affiliate of the investment adviser, maintains the Fund's accounting records. The fee is based on the level of average net assets for each month.
Interfund Trades. The Fund may purchase from or sell securities to other Fidelity Funds under procedures adopted by the Board. The procedures have been designed to ensure these interfund trades are executed in accordance with Rule 17a-7 of the 1940 Act. Interfund trades are included within the respective purchases and sales amounts shown in the Purchases and Sales of Investments note.
6. Committed Line of Credit.
The Fund participates with other funds managed by the investment adviser or an affiliate in a $4.25 billion credit facility (the "line of credit") to be utilized for temporary or emergency purposes to fund shareholder redemptions or for other short-term liquidity purposes. The Fund has agreed to pay commitment fees on its pro-rata portion of the line of credit, which amounted to $17 and is reflected in Miscellaneous expenses on the Statement of Operations. During the period, the Fund did not borrow on this line of credit.
7. Expense Reductions.
Through arrangements with the Fund's custodian, credits realized as a result of certain uninvested cash balances were used to reduce the Fund's expenses. During the period, these credits reduced the Fund's custody expenses by $47.
In addition, during the period the investment adviser reimbursed and/or waived a portion of fund-level operating expenses in the amount of $29.
8. Distributions to Shareholders.
Distributions to shareholders of each class were as follows:
| Six months ended April 30, 2017 | Year ended October 31, 2016 | |
| From net investment income | ||
| Class A | $12,838 | $28,998 |
| Class M | 2,937 | 6,712 |
| Class B | – | 210 |
| Class C | 8,263 | 19,076 |
| Fidelity Floating Rate High Income Fund | 130,027 | 244,237 |
| Class I | 36,853 | 83,907 |
| Total | $190,918 | $383,140 |
9. Share Transactions.
Share transactions for each class were as follows and may contain automatic conversions between classes or exchanges between affiliated funds:
| Shares | Shares | Dollars | Dollars | |
| Six months ended April 30, 2017 | Year ended October 31, 2016 | Six months ended April 30, 2017 | Year ended October 31, 2016 | |
| Class A | ||||
| Shares sold | 17,013 | 13,632 | $164,067 | $127,187 |
| Reinvestment of distributions | 1,221 | 2,814 | 11,787 | 26,169 |
| Shares redeemed | (26,879) | (34,450) | (260,210) | (318,820) |
| Net increase (decrease) | (8,645) | (18,004) | $(84,356) | $(165,464) |
| Class M | ||||
| Shares sold | 1,376 | 1,326 | $13,263 | $12,365 |
| Reinvestment of distributions | 291 | 671 | 2,804 | 6,235 |
| Shares redeemed | (4,276) | (4,884) | (41,258) | (45,244) |
| Net increase (decrease) | (2,609) | (2,887) | $(25,191) | $(26,644) |
| Class B | ||||
| Shares sold | – | 10 | $– | $96 |
| Reinvestment of distributions | – | 19 | – | 177 |
| Shares redeemed | – | (1,219) | – | (11,330) |
| Net increase (decrease) | – | (1,190) | $– | $(11,057) |
| Class C | ||||
| Shares sold | 5,372 | 5,299 | $51,797 | $49,451 |
| Reinvestment of distributions | 708 | 1,645 | 6,835 | 15,298 |
| Shares redeemed | (7,164) | (17,529) | (69,090) | (162,349) |
| Net increase (decrease) | (1,084) | (10,585) | $(10,458) | $(97,600) |
| Fidelity Floating Rate High Income Fund | ||||
| Shares sold | 159,107 | 152,772 | $1,533,146 | $1,428,276 |
| Reinvestment of distributions | 11,004 | 21,133 | 106,088 | 196,548 |
| Shares redeemed | (65,840) | (237,658) | (633,989) | (2,193,671) |
| Net increase (decrease) | 104,271 | (63,753) | $1,005,245 | $(568,847) |
| Class I | ||||
| Shares sold | 74,437 | 58,131 | $717,823 | $539,868 |
| Reinvestment of distributions | 2,829 | 5,808 | 27,250 | 53,924 |
| Shares redeemed | (40,186) | (139,996) | (387,074) | (1,297,890) |
| Net increase (decrease) | 37,080 | (76,057) | $357,999 | $(704,098) |
10. Other.
The Fund's organizational documents provide former and current trustees and officers with a limited indemnification against liabilities arising in connection with the performance of their duties to the Fund. In the normal course of business, the Fund may also enter into contracts that provide general indemnifications. The Fund's maximum exposure under these arrangements is unknown as this would be dependent on future claims that may be made against the Fund. The risk of material loss from such claims is considered remote.
Report of Independent Registered Public Accounting Firm
To the Trustees of Fidelity Advisor Series I and Shareholders of Fidelity Advisor Floating Rate High Income Fund:
We have audited the accompanying statement of assets and liabilities of Fidelity Advisor Floating Rate High Income Fund (the Fund), a fund of Fidelity Advisor Series I, including the schedule of investments, as of April 30, 2017, and the related statement of operations for the six months then ended, the statement of changes in net assets for the six months ended April 30, 2017 and for the year ended October 30, 2016, and the financial highlights for the six months ended April 30, 2017 and for each of the five years in the period ended October 30, 2016. These financial statements and financial highlights are the responsibility of the Fund's management. Our responsibility is to express an opinion on these financial statements and financial highlights based on our audits.
We conducted our audits in accordance with the standards of the Public Company Accounting Oversight Board (United States). Those standards require that we plan and perform the audit to obtain reasonable assurance about whether the financial statements and financial highlights are free of material misstatement. The Fund is not required to have, nor were we engaged to perform, an audit of its internal control over financial reporting. Our audits included consideration of internal control over financial reporting as a basis for designing audit procedures that are appropriate in the circumstances, but not for the purpose of expressing an opinion on the effectiveness of the Fund's internal control over financial reporting. Accordingly, we express no such opinion. An audit also includes examining, on a test basis, evidence supporting the amounts and disclosures in the financial statements, assessing the accounting principles used and significant estimates made by management, as well as evaluating the overall financial statement presentation. Our procedures included confirmation of securities owned as of April 30, 2017, by correspondence with the custodians and brokers; when replies were not received from brokers, we performed other auditing procedures. We believe that our audits provide a reasonable basis for our opinion.
In our opinion, such financial statements and financial highlights referred to above present fairly, in all material respects, the financial position of Fidelity Advisor Floating Rate High Income Fund as of April 30, 2017, the results of its operations for the six-months then ended, the changes in its net assets for the six months ended April 30, 2017 and for the year ended October 30, 2016, and the financial highlights for the six months ended April 30, 2017 and for each of the five years in the period ended October 30, 2016, in conformity with accounting principles generally accepted in the United States of America.
DELOITTE & TOUCHE LLP
Boston, Massachusetts
June 19, 2017
Shareholder Expense Example
As a shareholder of the Fund, you incur two types of costs: (1) transaction costs, including sales charges (loads) on purchase payments or redemption proceeds, redemption fees and (2) ongoing costs, including management fees, distribution and/or service (12b-1) fees and other Fund expenses. This Example is intended to help you understand your ongoing costs (in dollars) of investing in the Fund and to compare these costs with the ongoing costs of investing in other mutual funds.
The Example is based on an investment of $1,000 invested at the beginning of the period and held for the entire period (November 1, 2016 to April 30, 2017).
Actual Expenses
The first line of the accompanying table for each class of the Fund provides information about actual account values and actual expenses. You may use the information in this line, together with the amount you invested, to estimate the expenses that you paid over the period. Simply divide your account value by $1,000.00 (for example, an $8,600 account value divided by $1,000.00 = 8.6), then multiply the result by the number in the first line for a class of the Fund under the heading entitled "Expenses Paid During Period" to estimate the expenses you paid on your account during this period. A small balance maintenance fee of $12.00 that is charged once a year may apply for certain accounts with a value of less than $2,000. This fee is not included in the table below. If it was, the estimate of expenses you paid during the period would be higher, and your ending account value lower, by this amount. In addition, the Fund, as a shareholder in the underlying Fidelity Central Funds, will indirectly bear its pro-rata share of the fees and expenses incurred by the underlying Fidelity Central Funds. These fees and expenses are not included in the Fund's annualized expense ratio used to calculate the expense estimate in the table below.
Hypothetical Example for Comparison Purposes
The second line of the accompanying table for each class of the Fund provides information about hypothetical account values and hypothetical expenses based on a Class' actual expense ratio and an assumed rate of return of 5% per year before expenses, which is not the Class' actual return. The hypothetical account values and expenses may not be used to estimate the actual ending account balance or expenses you paid for the period. You may use this information to compare the ongoing costs of investing in the Fund and other funds. To do so, compare this 5% hypothetical example with the 5% hypothetical examples that appear in the shareholder reports of the other funds. A small balance maintenance fee of $12.00 that is charged once a year may apply for certain accounts with a value of less than $2,000. This fee is not included in the table below. If it was, the estimate of expenses you paid during the period would be higher, and your ending account value lower, by this amount. In addition, the Fund, as a shareholder in the underlying Fidelity Central Funds, will indirectly bear its pro-rata share of the fees and expenses incurred by the underlying Fidelity Central Funds. These fees and expenses are not included in the Fund's annualized expense ratio used to calculate the expense estimate in the table below.
Please note that the expenses shown in the table are meant to highlight your ongoing costs only and do not reflect any transaction costs. Therefore, the second line of the table is useful in comparing ongoing costs only, and will not help you determine the relative total costs of owning different funds. In addition, if these transactional costs were included, your costs would have been higher.
| Annualized Expense Ratio-A | Beginning Account Value November 1, 2016 | Ending Account Value April 30, 2017 | Expenses Paid During Period-B November 1, 2016 to April 30, 2017 |
|
| Class A | .99% | |||
| Actual | $1,000.00 | $1,025.50 | $4.97 | |
| Hypothetical-C | $1,000.00 | $1,019.89 | $4.96 | |
| Class M | 1.04% | |||
| Actual | $1,000.00 | $1,026.30 | $5.23 | |
| Hypothetical-C | $1,000.00 | $1,019.64 | $5.21 | |
| Class C | 1.75% | |||
| Actual | $1,000.00 | $1,022.70 | $8.78 | |
| Hypothetical-C | $1,000.00 | $1,016.12 | $8.75 | |
| Fidelity Floating Rate High Income Fund | .70% | |||
| Actual | $1,000.00 | $1,028.00 | $3.52 | |
| Hypothetical-C | $1,000.00 | $1,021.32 | $3.51 | |
| Class I | .76% | |||
| Actual | $1,000.00 | $1,026.70 | $3.82 | |
| Hypothetical-C | $1,000.00 | $1,021.03 | $3.81 |
A Annualized expense ratio reflects expenses net of applicable fee waivers.
B Expenses are equal to each Class' annualized expense ratio, multiplied by the average account value over the period, multiplied by 181/365 (to reflect the one-half year period).
C 5% return per year before expenses
![]()
Corporate Headquarters
245 Summer St.
Boston, MA 02210
www.fidelity.com
FHI-SANN-0617
1.784920.114
|
Fidelity Advisor® Value Fund Semi-Annual Report April 30, 2017 |
|
|
Contents
To view a fund's proxy voting guidelines and proxy voting record for the 12-month period ended June 30, visit http://www.fidelity.com/proxyvotingresults or visit the Securities and Exchange Commission's (SEC) web site at http://www.sec.gov.
You may also call 1-877-208-0098 to request a free copy of the proxy voting guidelines.
Standard & Poor's, S&P and S&P 500 are registered service marks of The McGraw-Hill Companies, Inc. and have been licensed for use by Fidelity Distributors Corporation.
Other third-party marks appearing herein are the property of their respective owners.
All other marks appearing herein are registered or unregistered trademarks or service marks of FMR LLC or an affiliated company. © 2017 FMR LLC. All rights reserved.
This report and the financial statements contained herein are submitted for the general information of the shareholders of the Fund. This report is not authorized for distribution to prospective investors in the Fund unless preceded or accompanied by an effective prospectus.
A fund files its complete schedule of portfolio holdings with the SEC for the first and third quarters of each fiscal year on Form N-Q. Forms N-Q are available on the SEC’s web site at http://www.sec.gov. A fund's Forms N-Q may be reviewed and copied at the SEC’s Public Reference Room in Washington, DC. Information regarding the operation of the SEC's Public Reference Room may be obtained by calling 1-800-SEC-0330.
For a complete list of a fund's portfolio holdings, view the most recent holdings listing, semiannual report, or annual report on Fidelity's web site at http://www.fidelity.com, http://www.institutional.fidelity.com, or http://www.401k.com, as applicable.
NOT FDIC INSURED •MAY LOSE VALUE •NO BANK GUARANTEE
Neither the Fund nor Fidelity Distributors Corporation is a bank.
Investment Summary (Unaudited)
Top Ten Stocks as of April 30, 2017
| % of fund's net assets | % of fund's net assets 6 months ago | |
| Sempra Energy | 2.1 | 2.4 |
| Xcel Energy, Inc. | 1.8 | 2.0 |
| Edison International | 1.7 | 1.9 |
| American Tower Corp. | 1.5 | 1.0 |
| AECOM | 1.2 | 1.2 |
| CIT Group, Inc. | 1.2 | 1.1 |
| Discover Financial Services | 1.2 | 1.2 |
| U.S. Bancorp | 1.2 | 1.1 |
| Baker Hughes, Inc. | 1.1 | 1.1 |
| Berkshire Hathaway, Inc. Class B | 1.1 | 1.0 |
| 14.1 |
Top Five Market Sectors as of April 30, 2017
| % of fund's net assets | % of fund's net assets 6 months ago | |
| Financials | 17.5 | 17.3 |
| Industrials | 12.0 | 10.1 |
| Real Estate | 11.8 | 11.1 |
| Consumer Discretionary | 11.5 | 12.6 |
| Information Technology | 10.0 | 9.7 |
Asset Allocation (% of fund's net assets)
| As of April 30, 2017* | ||
| Stocks and Equity Futures | 99.4% | |
| Convertible Securities | 0.2% | |
| Short-Term Investments and Net Other Assets (Liabilities) | 0.4% | |

* Foreign investments - 17.0%
| As of October 31, 2016* | ||
| Stocks and Equity Futures | 97.3% | |
| Convertible Securities | 0.3% | |
| Short-Term Investments and Net Other Assets (Liabilities) | 2.4% | |

* Foreign investments - 15.9%
Investments April 30, 2017 (Unaudited)
Showing Percentage of Net Assets
| Common Stocks - 98.2% | |||
| Shares | Value | ||
| CONSUMER DISCRETIONARY - 11.5% | |||
| Auto Components - 1.3% | |||
| Delphi Automotive PLC | 8,714 | $700,606 | |
| Tenneco, Inc. | 2,911 | 183,480 | |
| The Goodyear Tire & Rubber Co. | 9,500 | 344,185 | |
| Visteon Corp. (a) | 2,242 | 230,814 | |
| 1,459,085 | |||
| Diversified Consumer Services - 1.7% | |||
| H&R Block, Inc. | 17,541 | 434,841 | |
| Houghton Mifflin Harcourt Co. (a) | 64,595 | 742,843 | |
| Service Corp. International | 14,628 | 471,314 | |
| ServiceMaster Global Holdings, Inc. (a) | 8,621 | 328,460 | |
| 1,977,458 | |||
| Hotels, Restaurants & Leisure - 1.6% | |||
| DineEquity, Inc. | 4,300 | 243,122 | |
| Extended Stay America, Inc. unit | 15,934 | 277,889 | |
| Ilg, Inc. | 9,500 | 229,045 | |
| U.S. Foods Holding Corp. | 7,400 | 208,680 | |
| Wyndham Worldwide Corp. | 8,397 | 800,318 | |
| 1,759,054 | |||
| Household Durables - 0.8% | |||
| PulteGroup, Inc. | 6,420 | 145,541 | |
| Techtronic Industries Co. Ltd. | 62,000 | 266,226 | |
| Whirlpool Corp. | 2,659 | 493,723 | |
| 905,490 | |||
| Internet & Direct Marketing Retail - 1.0% | |||
| Liberty Interactive Corp.: | |||
| (Venture Group) Series A (a) | 7,900 | 425,415 | |
| QVC Group Series A (a) | 34,159 | 723,488 | |
| 1,148,903 | |||
| Leisure Products - 0.7% | |||
| Mattel, Inc. | 20,165 | 452,099 | |
| Vista Outdoor, Inc. (a) | 17,300 | 338,388 | |
| 790,487 | |||
| Media - 3.4% | |||
| Altice NV Class A (a) | 9,503 | 236,069 | |
| DISH Network Corp. Class A (a) | 3,800 | 244,872 | |
| Liberty Broadband Corp. Class C (a) | 5,813 | 529,913 | |
| Liberty Global PLC Class C (a) | 15,000 | 519,150 | |
| Live Nation Entertainment, Inc. (a) | 12,955 | 416,633 | |
| Omnicom Group, Inc. | 2,811 | 230,839 | |
| Sinclair Broadcast Group, Inc. Class A | 11,866 | 468,114 | |
| Tegna, Inc. | 11,700 | 298,116 | |
| Twenty-First Century Fox, Inc.: | |||
| Class A | 11,483 | 350,691 | |
| Class B | 10,732 | 320,458 | |
| Viacom, Inc. Class B (non-vtg.) | 5,300 | 225,568 | |
| 3,840,423 | |||
| Specialty Retail - 0.7% | |||
| GameStop Corp. Class A | 13,700 | 310,853 | |
| Michaels Companies, Inc. (a) | 6,600 | 154,176 | |
| Sally Beauty Holdings, Inc. (a) | 7,487 | 142,403 | |
| Signet Jewelers Ltd. | 3,400 | 223,856 | |
| 831,288 | |||
| Textiles, Apparel & Luxury Goods - 0.3% | |||
| Gildan Activewear, Inc. | 13,500 | 378,481 | |
| TOTAL CONSUMER DISCRETIONARY | 13,090,669 | ||
| CONSUMER STAPLES - 3.9% | |||
| Beverages - 0.9% | |||
| C&C Group PLC | 12,564 | 51,829 | |
| Cott Corp. | 63,761 | 838,905 | |
| Molson Coors Brewing Co. Class B | 1,199 | 114,972 | |
| 1,005,706 | |||
| Food & Staples Retailing - 1.0% | |||
| AdvancePierre Foods Holdings, Inc. | 1,843 | 74,863 | |
| Kroger Co. | 13,900 | 412,135 | |
| Walgreens Boots Alliance, Inc. | 1,563 | 135,262 | |
| Whole Foods Market, Inc. | 13,228 | 481,102 | |
| 1,103,362 | |||
| Food Products - 1.6% | |||
| Bunge Ltd. | 2,125 | 167,939 | |
| Darling International, Inc. (a) | 26,929 | 407,436 | |
| Lamb Weston Holdings, Inc. | 11,821 | 493,527 | |
| Mead Johnson Nutrition Co. Class A | 958 | 84,994 | |
| Nomad Foods Ltd. (a) | 32,866 | 387,819 | |
| The J.M. Smucker Co. | 2,404 | 304,635 | |
| 1,846,350 | |||
| Household Products - 0.3% | |||
| Svenska Cellulosa AB (SCA) (B Shares) | 11,400 | 377,627 | |
| Personal Products - 0.1% | |||
| Coty, Inc. Class A | 8,889 | 158,669 | |
| TOTAL CONSUMER STAPLES | 4,491,714 | ||
| ENERGY - 7.7% | |||
| Energy Equipment & Services - 2.0% | |||
| Baker Hughes, Inc. | 21,909 | 1,300,737 | |
| Dril-Quip, Inc. (a) | 8,920 | 459,826 | |
| Halliburton Co. | 4,734 | 217,196 | |
| Odfjell Drilling A/S (a) | 28,635 | 60,031 | |
| TechnipFMC PLC (a) | 7,797 | 234,924 | |
| 2,272,714 | |||
| Oil, Gas & Consumable Fuels - 5.7% | |||
| Anadarko Petroleum Corp. | 8,377 | 477,657 | |
| Boardwalk Pipeline Partners, LP | 36,754 | 666,718 | |
| Cabot Oil & Gas Corp. | 14,200 | 330,008 | |
| Cenovus Energy, Inc. | 38,469 | 383,549 | |
| Cheniere Energy, Inc. (a) | 1,900 | 86,165 | |
| Devon Energy Corp. | 8,218 | 324,529 | |
| Diamondback Energy, Inc. (a) | 3,104 | 309,903 | |
| Energen Corp. (a) | 4,657 | 242,117 | |
| EQT Corp. | 5,144 | 299,072 | |
| GasLog Ltd. | 27,015 | 378,210 | |
| Golar LNG Ltd. | 9,500 | 242,345 | |
| Lundin Petroleum AB | 20,900 | 399,014 | |
| Marathon Petroleum Corp. | 9,567 | 487,343 | |
| Newfield Exploration Co. (a) | 9,811 | 339,657 | |
| Teekay Corp. | 43,200 | 374,976 | |
| Teekay LNG Partners LP | 25,100 | 419,170 | |
| Teekay Offshore Partners LP | 83,000 | 440,730 | |
| WPX Energy, Inc. (a) | 22,798 | 271,980 | |
| 6,473,143 | |||
| TOTAL ENERGY | 8,745,857 | ||
| FINANCIALS - 17.5% | |||
| Banks - 4.7% | |||
| Bank of Ireland (a) | 212,097 | 53,716 | |
| CIT Group, Inc. (b) | 29,664 | 1,373,740 | |
| EFG Eurobank Ergasias SA (a) | 78,416 | 63,209 | |
| First Citizen Bancshares, Inc. | 1,289 | 448,649 | |
| First Citizen Bancshares, Inc. Class A | 1,408 | 490,068 | |
| Lloyds Banking Group PLC | 196,300 | 176,381 | |
| PNC Financial Services Group, Inc. | 2,371 | 283,927 | |
| U.S. Bancorp | 25,609 | 1,313,230 | |
| Wells Fargo & Co. | 21,849 | 1,176,350 | |
| 5,379,270 | |||
| Capital Markets - 3.1% | |||
| Apollo Global Management LLC Class A | 25,908 | 693,557 | |
| Ares Capital Corp. | 27,224 | 479,142 | |
| Brookfield Asset Management, Inc. Class A | 5,850 | 216,249 | |
| Franklin Resources, Inc. | 11,820 | 509,560 | |
| KKR & Co. LP | 23,812 | 451,952 | |
| Legg Mason, Inc. | 18,435 | 689,100 | |
| The Blackstone Group LP | 15,088 | 465,314 | |
| 3,504,874 | |||
| Consumer Finance - 3.8% | |||
| Ally Financial, Inc. | 6,600 | 130,680 | |
| Capital One Financial Corp. | 13,020 | 1,046,548 | |
| Discover Financial Services | 21,212 | 1,327,659 | |
| OneMain Holdings, Inc. (a) | 17,643 | 411,435 | |
| SLM Corp. (a) | 34,000 | 426,360 | |
| Synchrony Financial | 38,639 | 1,074,164 | |
| 4,416,846 | |||
| Diversified Financial Services - 1.5% | |||
| Berkshire Hathaway, Inc. Class B (a) | 7,372 | 1,217,928 | |
| Bioverativ, Inc. | 300 | 17,643 | |
| Leucadia National Corp. | 18,740 | 475,809 | |
| 1,711,380 | |||
| Insurance - 4.2% | |||
| AFLAC, Inc. | 5,968 | 446,884 | |
| AMBAC Financial Group, Inc. (a) | 19,801 | 384,733 | |
| Chubb Ltd. | 8,374 | 1,149,332 | |
| FNF Group | 23,800 | 974,610 | |
| Greenlight Capital Re, Ltd. (a) | 8,387 | 180,740 | |
| Reinsurance Group of America, Inc. | 5,447 | 681,093 | |
| Torchmark Corp. | 6,888 | 528,378 | |
| Willis Group Holdings PLC | 3,500 | 464,170 | |
| 4,809,940 | |||
| Mortgage Real Estate Investment Trusts - 0.2% | |||
| MFA Financial, Inc. | 26,310 | 218,636 | |
| TOTAL FINANCIALS | 20,040,946 | ||
| HEALTH CARE - 6.2% | |||
| Biotechnology - 0.9% | |||
| Amgen, Inc. | 3,000 | 489,960 | |
| United Therapeutics Corp. (a) | 4,356 | 547,549 | |
| 1,037,509 | |||
| Health Care Equipment & Supplies - 0.7% | |||
| Alere, Inc. (a) | 7,600 | 373,692 | |
| Dentsply Sirona, Inc. | 2,600 | 164,424 | |
| Steris PLC | 300 | 22,140 | |
| Teleflex, Inc. | 100 | 20,689 | |
| The Cooper Companies, Inc. | 100 | 20,033 | |
| Zimmer Biomet Holdings, Inc. | 1,285 | 153,750 | |
| 754,728 | |||
| Health Care Providers & Services - 2.3% | |||
| Anthem, Inc. | 2,100 | 373,569 | |
| Centene Corp. (a) | 800 | 59,520 | |
| Cigna Corp. | 1,968 | 307,736 | |
| DaVita HealthCare Partners, Inc. (a) | 900 | 62,109 | |
| Envision Healthcare Corp. (a) | 10,379 | 581,535 | |
| Laboratory Corp. of America Holdings (a) | 4,456 | 624,508 | |
| McKesson Corp. | 2,000 | 276,580 | |
| R1 RCM, Inc. (a) | 57,427 | 223,391 | |
| Universal Health Services, Inc. Class B | 1,432 | 172,928 | |
| 2,681,876 | |||
| Life Sciences Tools & Services - 0.4% | |||
| Agilent Technologies, Inc. | 3,174 | 174,729 | |
| Bio-Rad Laboratories, Inc. Class A (a) | 400 | 87,304 | |
| ICON PLC (a) | 800 | 67,592 | |
| PerkinElmer, Inc. | 800 | 47,528 | |
| QIAGEN NV | 2,118 | 63,731 | |
| 440,884 | |||
| Pharmaceuticals - 1.9% | |||
| Endo International PLC (a) | 26,831 | 305,068 | |
| Jazz Pharmaceuticals PLC (a) | 7,246 | 1,154,143 | |
| Mallinckrodt PLC (a) | 1,211 | 56,820 | |
| Perrigo Co. PLC | 1,698 | 125,550 | |
| Teva Pharmaceutical Industries Ltd. sponsored ADR | 12,125 | 382,908 | |
| The Medicines Company (a) | 3,500 | 172,620 | |
| 2,197,109 | |||
| TOTAL HEALTH CARE | 7,112,106 | ||
| INDUSTRIALS - 12.0% | |||
| Aerospace & Defense - 1.5% | |||
| Aerojet Rocketdyne Holdings, Inc. (a) | 32,126 | 719,944 | |
| KLX, Inc. (a) | 11,600 | 548,680 | |
| Rockwell Collins, Inc. | 2,900 | 301,861 | |
| Rolls-Royce Holdings PLC | 14,430 | 151,761 | |
| 1,722,246 | |||
| Airlines - 1.5% | |||
| Air Canada (a) | 36,800 | 350,194 | |
| American Airlines Group, Inc. | 16,730 | 713,033 | |
| Delta Air Lines, Inc. | 7,972 | 362,248 | |
| Southwest Airlines Co. | 2,785 | 156,573 | |
| United Continental Holdings, Inc. (a) | 1,466 | 102,928 | |
| 1,684,976 | |||
| Building Products - 0.2% | |||
| Allegion PLC | 2,829 | 222,473 | |
| Commercial Services & Supplies - 1.2% | |||
| IWG PLC | 124,200 | 522,647 | |
| KAR Auction Services, Inc. | 9,800 | 427,476 | |
| Team, Inc. (a) | 1,977 | 53,181 | |
| West Corp. | 16,184 | 431,951 | |
| 1,435,255 | |||
| Construction & Engineering - 2.2% | |||
| AECOM (a) | 40,667 | 1,391,218 | |
| Arcadis NV (b) | 23,195 | 401,861 | |
| Astaldi SpA | 45,938 | 301,242 | |
| C&J Energy Services, Inc. (a) | 4,432 | 129,459 | |
| Chicago Bridge & Iron Co. NV | 7,525 | 226,352 | |
| KBR, Inc. | 5,189 | 72,905 | |
| 2,523,037 | |||
| Electrical Equipment - 1.1% | |||
| AMETEK, Inc. | 6,301 | 360,417 | |
| Fortive Corp. | 3,388 | 214,325 | |
| Regal Beloit Corp. | 5,662 | 446,449 | |
| Sensata Technologies Holding BV (a) | 4,976 | 204,912 | |
| 1,226,103 | |||
| Machinery - 1.7% | |||
| Allison Transmission Holdings, Inc. | 24,546 | 949,439 | |
| Ingersoll-Rand PLC | 6,500 | 576,875 | |
| SPX Flow, Inc. (a) | 11,100 | 401,154 | |
| 1,927,468 | |||
| Road & Rail - 0.6% | |||
| Avis Budget Group, Inc. (a) | 3,600 | 109,800 | |
| CSX Corp. | 4,104 | 208,647 | |
| Swift Transporation Co. (a) | 15,058 | 370,126 | |
| 688,573 | |||
| Trading Companies & Distributors - 2.0% | |||
| AerCap Holdings NV (a) | 15,118 | 695,579 | |
| Ashtead Group PLC | 12,600 | 266,171 | |
| HD Supply Holdings, Inc. (a) | 7,800 | 314,340 | |
| MRC Global, Inc. (a) | 19,763 | 360,279 | |
| Nexeo Solutions, Inc. (a) | 12,800 | 116,608 | |
| Nexeo Solutions, Inc. (c) | 14,400 | 131,184 | |
| WESCO International, Inc. (a) | 6,941 | 423,054 | |
| 2,307,215 | |||
| TOTAL INDUSTRIALS | 13,737,346 | ||
| INFORMATION TECHNOLOGY - 10.0% | |||
| Communications Equipment - 0.6% | |||
| CommScope Holding Co., Inc. (a) | 16,872 | 709,299 | |
| Electronic Equipment & Components - 2.0% | |||
| Dell Technologies, Inc. (a) | 7,727 | 518,559 | |
| Jabil Circuit, Inc. | 38,634 | 1,121,159 | |
| TE Connectivity Ltd. | 7,412 | 573,466 | |
| 2,213,184 | |||
| Internet Software & Services - 0.1% | |||
| Alphabet, Inc. Class A (a) | 162 | 149,772 | |
| IT Services - 5.3% | |||
| Alliance Data Systems Corp. | 2,298 | 573,650 | |
| Amdocs Ltd. | 12,533 | 767,521 | |
| Cognizant Technology Solutions Corp. Class A (a) | 15,357 | 924,952 | |
| DXC Technology Co. (a) | 15,762 | 1,187,509 | |
| EVERTEC, Inc. | 26,652 | 422,434 | |
| Fidelity National Information Services, Inc. | 2,087 | 175,705 | |
| First Data Corp. Class A (a) | 26,700 | 417,054 | |
| Leidos Holdings, Inc. | 4,506 | 237,286 | |
| Total System Services, Inc. | 16,429 | 941,546 | |
| Travelport Worldwide Ltd. | 9,200 | 121,164 | |
| Unisys Corp. (a)(b) | 26,048 | 294,342 | |
| 6,063,163 | |||
| Semiconductors & Semiconductor Equipment - 1.6% | |||
| NXP Semiconductors NV (a) | 3,844 | 406,503 | |
| Qorvo, Inc. (a) | 11,227 | 763,773 | |
| Qualcomm, Inc. | 11,532 | 619,730 | |
| 1,790,006 | |||
| Technology Hardware, Storage & Peripherals - 0.4% | |||
| Apple, Inc. | 1,900 | 272,935 | |
| Hewlett Packard Enterprise Co. | 9,600 | 178,848 | |
| 451,783 | |||
| TOTAL INFORMATION TECHNOLOGY | 11,377,207 | ||
| MATERIALS - 8.3% | |||
| Chemicals - 4.9% | |||
| Agrium, Inc. | 1,703 | 159,839 | |
| Axalta Coating Systems (a) | 15,914 | 499,222 | |
| Celanese Corp. Class A | 3,623 | 315,346 | |
| CF Industries Holdings, Inc. | 19,005 | 508,194 | |
| E.I. du Pont de Nemours & Co. | 10,754 | 857,632 | |
| Eastman Chemical Co. | 9,066 | 723,014 | |
| LyondellBasell Industries NV Class A | 9,214 | 780,979 | |
| PPG Industries, Inc. | 3,600 | 395,424 | |
| Syngenta AG sponsored ADR | 4,400 | 409,332 | |
| The Chemours Co. LLC | 9,800 | 394,842 | |
| Westlake Chemical Corp. | 8,470 | 527,258 | |
| 5,571,082 | |||
| Construction Materials - 0.4% | |||
| Eagle Materials, Inc. | 4,500 | 431,865 | |
| Containers & Packaging - 2.2% | |||
| Avery Dennison Corp. | 2,575 | 214,266 | |
| Ball Corp. | 7,300 | 561,297 | |
| Berry Global Group, Inc. (a) | 10,028 | 501,400 | |
| Graphic Packaging Holding Co. | 57,153 | 776,138 | |
| Sealed Air Corp. | 11,400 | 501,828 | |
| 2,554,929 | |||
| Metals & Mining - 0.8% | |||
| Alcoa Corp. | 4,166 | 140,519 | |
| Freeport-McMoRan, Inc. (a) | 17,126 | 218,357 | |
| Randgold Resources Ltd. sponsored ADR | 2,140 | 188,299 | |
| Steel Dynamics, Inc. | 10,003 | 361,508 | |
| 908,683 | |||
| TOTAL MATERIALS | 9,466,559 | ||
| REAL ESTATE - 11.8% | |||
| Equity Real Estate Investment Trusts (REITs) - 10.5% | |||
| American Tower Corp. | 13,719 | 1,727,771 | |
| AvalonBay Communities, Inc. | 2,200 | 417,648 | |
| Boston Properties, Inc. | 2,580 | 326,628 | |
| Colony NorthStar, Inc. | 84,610 | 1,105,853 | |
| Corporate Office Properties Trust (SBI) | 14,600 | 478,004 | |
| DDR Corp. | 21,800 | 235,658 | |
| Douglas Emmett, Inc. | 12,500 | 470,875 | |
| Equinix, Inc. | 1,200 | 501,240 | |
| Equity Commonwealth (a) | 900 | 28,791 | |
| Equity Lifestyle Properties, Inc. | 13,566 | 1,097,625 | |
| Equity Residential (SBI) | 6,100 | 393,938 | |
| Essex Property Trust, Inc. | 3,270 | 799,417 | |
| Extra Space Storage, Inc. | 8,775 | 662,776 | |
| First Potomac Realty Trust | 3,660 | 40,260 | |
| Forest City Realty Trust, Inc. Class A | 13,640 | 308,264 | |
| Grivalia Properties REIC | 50,742 | 472,034 | |
| iStar Financial, Inc. (a) | 68,666 | 839,785 | |
| Lamar Advertising Co. Class A | 4,642 | 334,549 | |
| NorthStar Realty Europe Corp. | 2,424 | 28,191 | |
| Outfront Media, Inc. | 28,024 | 733,108 | |
| Public Storage | 700 | 146,566 | |
| SBA Communications Corp. Class A (a) | 930 | 117,636 | |
| Simon Property Group, Inc. | 500 | 82,630 | |
| VEREIT, Inc. | 24,280 | 203,224 | |
| Welltower, Inc. | 3,000 | 214,320 | |
| WP Glimcher, Inc. | 27,670 | 243,496 | |
| 12,010,287 | |||
| Real Estate Management & Development - 1.3% | |||
| CBRE Group, Inc. (a) | 18,797 | 673,121 | |
| Kennedy Wilson Europe Real Estate PLC | 4,191 | 56,399 | |
| Kennedy-Wilson Holdings, Inc.(a) | 12,086 | 246,554 | |
| Realogy Holdings Corp. | 15,544 | 474,869 | |
| 1,450,943 | |||
| TOTAL REAL ESTATE | 13,461,230 | ||
| TELECOMMUNICATION SERVICES - 0.4% | |||
| Diversified Telecommunication Services - 0.4% | |||
| Iridium Communications, Inc. (a)(b) | 17,404 | 184,482 | |
| Level 3 Communications, Inc. (a) | 5,040 | 306,230 | |
| 490,712 | |||
| UTILITIES - 8.9% | |||
| Electric Utilities - 5.4% | |||
| Alliant Energy Corp. | 9,010 | 354,273 | |
| American Electric Power Co., Inc. | 16,231 | 1,100,949 | |
| Edison International | 24,272 | 1,941,032 | |
| NextEra Energy, Inc. | 2,898 | 387,057 | |
| PG&E Corp. | 5,410 | 362,741 | |
| Xcel Energy, Inc. | 45,401 | 2,045,315 | |
| 6,191,367 | |||
| Independent Power and Renewable Electricity Producers - 0.6% | |||
| The AES Corp. | 56,130 | 634,830 | |
| Multi-Utilities - 2.9% | |||
| CMS Energy Corp. | 10,083 | 457,768 | |
| DTE Energy Co. | 4,599 | 481,009 | |
| Sempra Energy | 21,392 | 2,417,719 | |
| 3,356,496 | |||
| TOTAL UTILITIES | 10,182,693 | ||
| TOTAL COMMON STOCKS | |||
| (Cost $97,478,713) | 112,197,039 | ||
| Nonconvertible Preferred Stocks - 0.0% | |||
| INDUSTRIALS - 0.0% | |||
| Aerospace & Defense - 0.0% | |||
| Rolls-Royce Holdings PLC: | |||
| (C Shares) | 617,780 | 800 | |
| (C Shares) | 1,024,530 | 1,327 | |
| (Cost $2,079) | 2,127 | ||
| Principal Amount | Value | ||
| Convertible Bonds - 0.2% | |||
| ENERGY - 0.2% | |||
| Oil, Gas & Consumable Fuels - 0.2% | |||
| Cobalt International Energy, Inc. 2.625% 12/1/19 | |||
| (Cost $375,168) | 650,000 | 239,524 | |
| U.S. Treasury Obligations - 0.0% | |||
| U.S. Treasury Bills, yield at date of purchase 0.72% 6/15/17(d) | |||
| (Cost $69,937) | 70,000 | 69,942 | |
| Shares | Value | ||
| Money Market Funds - 2.6% | |||
| Fidelity Cash Central Fund, 0.85% (e) | 1,210,743 | $1,210,985 | |
| Fidelity Securities Lending Cash Central Fund 0.86% (e)(f) | 1,762,997 | 1,763,174 | |
| TOTAL MONEY MARKET FUNDS | |||
| (Cost $2,973,908) | 2,974,159 | ||
| TOTAL INVESTMENT PORTFOLIO - 101.0% | |||
| (Cost $100,899,805) | 115,482,791 | ||
| NET OTHER ASSETS (LIABILITIES) - (1.0)% | (1,186,795) | ||
| NET ASSETS - 100% | $114,295,996 |
| Futures Contracts | |||
| Expiration Date | Underlying Face Amount at Value | Unrealized Appreciation/(Depreciation) | |
| Purchased | |||
| Equity Index Contracts | |||
| 8 CME E-mini S&P MidCap 400 Index Contracts (United States) | June 2017 | 1,384,000 | $(5,396) |
The face value of futures purchased as a percentage of Net Assets is 1.2%
Legend
(a) Non-income producing
(b) Security or a portion of the security is on loan at period end.
(c) Restricted securities - Investment in securities not registered under the Securities Act of 1933 (excluding 144A issues). At the end of the period, the value of restricted securities (excluding 144A issues) amounted to $131,184 or 0.1% of net assets.
(d) Security or a portion of the security was pledged to cover margin requirements for futures contracts. At period end, the value of securities pledged amounted to $69,942.
(e) Affiliated fund that is generally available only to investment companies and other accounts managed by Fidelity Investments. The rate quoted is the annualized seven-day yield of the fund at period end. A complete unaudited listing of the fund's holdings as of its most recent quarter end is available upon request. In addition, each Fidelity Central Fund's financial statements are available on the SEC's website or upon request.
(f) Investment made with cash collateral received from securities on loan.
Additional information on each restricted holding is as follows:
| Security | Acquisition Date | Acquisition Cost |
| Nexeo Solutions, Inc. | 6/9/16 | $144,000 |
Affiliated Central Funds
Information regarding fiscal year to date income earned by the Fund from investments in Fidelity Central Funds is as follows:
| Fund | Income earned |
| Fidelity Cash Central Fund | $10,788 |
| Fidelity Securities Lending Cash Central Fund | 1,961 |
| Total | $12,749 |
Investment Valuation
The following is a summary of the inputs used, as of April 30, 2017, involving the Fund's assets and liabilities carried at fair value. The inputs or methodology used for valuing securities may not be an indication of the risk associated with investing in those securities. For more information on valuation inputs, and their aggregation into the levels used below, please refer to the Investment Valuation section in the accompanying Notes to Financial Statements.
| Valuation Inputs at Reporting Date: | ||||
| Description | Total | Level 1 | Level 2 | Level 3 |
| Investments in Securities: | ||||
| Equities: | ||||
| Consumer Discretionary | $13,090,669 | $13,090,669 | $-- | $-- |
| Consumer Staples | 4,491,714 | 4,491,714 | -- | -- |
| Energy | 8,745,857 | 8,745,857 | -- | -- |
| Financials | 20,040,946 | 19,801,356 | 239,590 | -- |
| Health Care | 7,112,106 | 7,112,106 | -- | -- |
| Industrials | 13,739,473 | 13,739,473 | -- | -- |
| Information Technology | 11,377,207 | 11,377,207 | -- | -- |
| Materials | 9,466,559 | 9,466,559 | -- | -- |
| Real Estate | 13,461,230 | 13,461,230 | -- | -- |
| Telecommunication Services | 490,712 | 490,712 | -- | -- |
| Utilities | 10,182,693 | 10,182,693 | -- | -- |
| Corporate Bonds | 239,524 | -- | 239,524 | -- |
| U.S. Government and Government Agency Obligations | 69,942 | -- | 69,942 | -- |
| Money Market Funds | 2,974,159 | 2,974,159 | -- | -- |
| Total Investments in Securities: | $115,482,791 | $114,933,735 | $549,056 | $-- |
| Derivative Instruments: | ||||
| Liabilities | ||||
| Futures Contracts | $(5,396) | $(5,396) | $-- | $-- |
| Total Liabilities | $(5,396) | $(5,396) | $-- | $-- |
| Total Derivative Instruments: | $(5,396) | $(5,396) | $-- | $-- |
Value of Derivative Instruments
The following table is a summary of the Fund's value of derivative instruments by primary risk exposure as of April 30, 2017. For additional information on derivative instruments, please refer to the Derivative Instruments section in the accompanying Notes to Financial Statements.
| Primary Risk Exposure / Derivative Type | Value | |
| Asset | Liability | |
| Equity Risk | ||
| Futures Contracts(a) | $0 | $(5,396) |
| Total Equity Risk | 0 | (5,396) |
| Total Value of Derivatives | $0 | $(5,396) |
(a) Reflects gross cumulative appreciation (depreciation) on futures contracts as presented in the Schedule of Investments. In the Statement of Assets and Liabilities, the period end daily variation margin is included in receivable or payable for daily variation margin for derivative instruments, and the net cumulative appreciation (depreciation) is included in net unrealized appreciation (depreciation).
Other Information
Distribution of investments by country or territory of incorporation, as a percentage of Total Net Assets, is as follows (Unaudited):
| United States of America | 83.0% |
| Netherlands | 2.7% |
| Ireland | 2.3% |
| Canada | 1.9% |
| Switzerland | 1.9% |
| Bailiwick of Jersey | 1.3% |
| United Kingdom | 1.1% |
| Marshall Islands | 1.1% |
| Others (Individually Less Than 1%) | 4.7% |
| 100.0% |
See accompanying notes which are an integral part of the financial statements.
Financial Statements
Statement of Assets and Liabilities
| April 30, 2017 (Unaudited) | ||
| Assets | ||
| Investment in securities, at value (including securities loaned of $1,713,371) — See accompanying schedule: Unaffiliated issuers (cost $97,925,897) | $112,508,632 | |
| Fidelity Central Funds (cost $2,973,908) | 2,974,159 | |
| Total Investments (cost $100,899,805) | $115,482,791 | |
| Foreign currency held at value (cost $11,068) | 11,163 | |
| Receivable for investments sold | 4,546,868 | |
| Receivable for fund shares sold | 119,254 | |
| Dividends receivable | 83,655 | |
| Interest receivable | 7,078 | |
| Distributions receivable from Fidelity Central Funds | 1,632 | |
| Prepaid expenses | 67 | |
| Other receivables | 14,954 | |
| Total assets | 120,267,462 | |
| Liabilities | ||
| Payable to custodian bank | $2,821,075 | |
| Payable for investments purchased | 762,113 | |
| Payable for fund shares redeemed | 463,172 | |
| Accrued management fee | 44,857 | |
| Distribution and service plan fees payable | 36,907 | |
| Payable for daily variation margin for derivative instruments | 5,396 | |
| Other affiliated payables | 25,625 | |
| Other payables and accrued expenses | 49,321 | |
| Collateral on securities loaned | 1,763,000 | |
| Total liabilities | 5,971,466 | |
| Net Assets | $114,295,996 | |
| Net Assets consist of: | ||
| Paid in capital | $101,077,746 | |
| Undistributed net investment income | 180,707 | |
| Accumulated undistributed net realized gain (loss) on investments and foreign currency transactions | (1,540,013) | |
| Net unrealized appreciation (depreciation) on investments and assets and liabilities in foreign currencies | 14,577,556 | |
| Net Assets | $114,295,996 | |
| Calculation of Maximum Offering Price | ||
| Class A: | ||
| Net Asset Value and redemption price per share ($59,764,046 ÷ 2,467,771 shares) | $24.22 | |
| Maximum offering price per share (100/94.25 of $24.22) | $25.70 | |
| Class M: | ||
| Net Asset Value and redemption price per share ($20,228,952 ÷ 843,118 shares) | $23.99 | |
| Maximum offering price per share (100/96.50 of $23.99) | $24.86 | |
| Class C: | ||
| Net Asset Value and offering price per share ($19,441,791 ÷ 844,675 shares)(a) | $23.02 | |
| Class I: | ||
| Net Asset Value, offering price and redemption price per share ($14,757,468 ÷ 603,802 shares) | $24.44 | |
| Class Z: | ||
| Net Asset Value, offering price and redemption price per share ($103,739 ÷ 4,243 shares) | $24.45 |
(a) Redemption price per share is equal to net asset value less any applicable contingent deferred sales charge.
See accompanying notes which are an integral part of the financial statements.
Statement of Operations
| Six months ended April 30, 2017 (Unaudited) | ||
| Investment Income | ||
| Dividends | $998,432 | |
| Interest | 43,083 | |
| Income from Fidelity Central Funds | 12,749 | |
| Total income | 1,054,264 | |
| Expenses | ||
| Management fee | ||
| Basic fee | $317,214 | |
| Performance adjustment | (84,050) | |
| Transfer agent fees | 130,252 | |
| Distribution and service plan fees | 215,801 | |
| Accounting and security lending fees | 22,602 | |
| Custodian fees and expenses | 26,571 | |
| Independent trustees' fees and expenses | 232 | |
| Registration fees | 50,586 | |
| Audit | 33,883 | |
| Legal | 3,774 | |
| Miscellaneous | 591 | |
| Total expenses before reductions | 717,456 | |
| Expense reductions | (1,173) | 716,283 |
| Net investment income (loss) | 337,981 | |
| Realized and Unrealized Gain (Loss) | ||
| Net realized gain (loss) on: | ||
| Investment securities: | ||
| Unaffiliated issuers | 2,657,304 | |
| Fidelity Central Funds | 307 | |
| Foreign currency transactions | 437 | |
| Futures contracts | 41,406 | |
| Total net realized gain (loss) | 2,699,454 | |
| Change in net unrealized appreciation (depreciation) on: Investment securities | 11,387,535 | |
| Assets and liabilities in foreign currencies | 158 | |
| Futures contracts | 369 | |
| Total change in net unrealized appreciation (depreciation) | 11,388,062 | |
| Net gain (loss) | 14,087,516 | |
| Net increase (decrease) in net assets resulting from operations | $14,425,497 |
See accompanying notes which are an integral part of the financial statements.
Statement of Changes in Net Assets
| Six months ended April 30, 2017 (Unaudited) | Year ended October 31, 2016 | |
| Increase (Decrease) in Net Assets | ||
| Operations | ||
| Net investment income (loss) | $337,981 | $904,182 |
| Net realized gain (loss) | 2,699,454 | (4,125,577) |
| Change in net unrealized appreciation (depreciation) | 11,388,062 | 5,667,371 |
| Net increase (decrease) in net assets resulting from operations | 14,425,497 | 2,445,976 |
| Distributions to shareholders from net investment income | (582,646) | (403,934) |
| Distributions to shareholders from net realized gain | (29,178) | (1,698,817) |
| Total distributions | (611,824) | (2,102,751) |
| Share transactions - net increase (decrease) | (3,618,808) | 7,623,081 |
| Total increase (decrease) in net assets | 10,194,865 | 7,966,306 |
| Net Assets | ||
| Beginning of period | 104,101,131 | 96,134,825 |
| End of period | $114,295,996 | $104,101,131 |
| Other Information | ||
| Undistributed net investment income end of period | $180,707 | $425,372 |
See accompanying notes which are an integral part of the financial statements.
Financial Highlights — Fidelity Advisor Value Fund Class A
| Six months ended (Unaudited) April 30, | Years ended October 31, | |||||
| 2017 | 2016 | 2015 | 2014 | 2013 | 2012 | |
| Selected Per–Share Data | ||||||
| Net asset value, beginning of period | $21.43 | $21.39 | $21.48 | $18.90 | $14.08 | $12.25 |
| Income from Investment Operations | ||||||
| Net investment income (loss)A | .08 | .22 | .12 | .09 | .11 | .07 |
| Net realized and unrealized gain (loss) | 2.86 | .30 | (.14)B | 2.58 | 4.82 | 1.79 |
| Total from investment operations | 2.94 | .52 | (.02) | 2.67 | 4.93 | 1.86 |
| Distributions from net investment income | (.14) | (.11) | (.05) | (.04) | (.11) | (.03) |
| Distributions from net realized gain | (.01) | (.37) | (.02) | (.04) | – | – |
| Total distributions | (.15) | (.48) | (.07) | (.09)C | (.11) | (.03) |
| Net asset value, end of period | $24.22 | $21.43 | $21.39 | $21.48 | $18.90 | $14.08 |
| Total ReturnD,E,F | 13.72% | 2.53% | (.12)%B | 14.15% | 35.30% | 15.22% |
| Ratios to Average Net AssetsG,H | ||||||
| Expenses before reductions | 1.11%I | 1.19% | 1.31% | 1.29% | 1.31% | 1.35% |
| Expenses net of fee waivers, if any | 1.11%I | 1.19% | 1.25% | 1.25% | 1.25% | 1.25% |
| Expenses net of all reductions | 1.11%I | 1.18% | 1.24% | 1.25% | 1.23% | 1.25% |
| Net investment income (loss) | .71%I | 1.06% | .53% | .42% | .69% | .51% |
| Supplemental Data | ||||||
| Net assets, end of period (000 omitted) | $59,764 | $54,196 | $50,858 | $45,759 | $38,397 | $27,817 |
| Portfolio turnover rateJ | 72%I | 77% | 82% | 78% | 103% | 77% |
A Calculated based on average shares outstanding during the period.
B Net realized and unrealized gain (loss) per share reflects proceeds received from litigation which amounted to $.01 per share. Excluding these litigation proceeds, the total return would have been (.17)%
C Total distributions of $.09 per share is comprised of distributions from net investment income of $.041 and distributions from net realized gain of $.044 per share.
D Total returns for periods of less than one year are not annualized.
E Total returns would have been lower if certain expenses had not been reduced during the applicable periods shown.
F Total returns do not include the effect of the sales charges.
G Fees and expenses of any underlying Fidelity Central Funds are not included in the Fund's expense ratio. The Fund indirectly bears its proportionate share of the expenses of any underlying Fidelity Central Funds.
H Expense ratios reflect operating expenses of the class. Expenses before reductions do not reflect amounts reimbursed by the investment adviser or reductions from brokerage service arrangements or reductions from other expense offset arrangements and do not represent the amount paid by the class during periods when reimbursements or reductions occur. Expenses net of fee waivers reflect expenses after reimbursement by the investment adviser but prior to reductions from brokerage service arrangements or other expense offset arrangements. Expenses net of all reductions represent the net expenses paid by the class.
I Annualized
J Amount does not include the portfolio activity of any underlying Fidelity Central Funds.
See accompanying notes which are an integral part of the financial statements.
Financial Highlights — Fidelity Advisor Value Fund Class M
| Six months ended (Unaudited) April 30, | Years ended October 31, | |||||
| 2017 | 2016 | 2015 | 2014 | 2013 | 2012 | |
| Selected Per–Share Data | ||||||
| Net asset value, beginning of period | $21.22 | $21.17 | $21.27 | $18.72 | $13.95 | $12.15 |
| Income from Investment Operations | ||||||
| Net investment income (loss)A | .05 | .16 | .06 | .03 | .07 | .03 |
| Net realized and unrealized gain (loss) | 2.82 | .31 | (.15)B | 2.56 | 4.78 | 1.80 |
| Total from investment operations | 2.87 | .47 | (.09) | 2.59 | 4.85 | 1.83 |
| Distributions from net investment income | (.09) | (.05) | – | – | (.08) | (.03) |
| Distributions from net realized gain | (.01) | (.37) | (.01) | (.04) | – | – |
| Total distributions | (.10) | (.42) | (.01) | (.04) | (.08) | (.03) |
| Net asset value, end of period | $23.99 | $21.22 | $21.17 | $21.27 | $18.72 | $13.95 |
| Total ReturnC,D,E | 13.53% | 2.28% | (.43)%B | 13.88% | 34.94% | 15.05% |
| Ratios to Average Net AssetsF,G | ||||||
| Expenses before reductions | 1.38%H | 1.47% | 1.58% | 1.57% | 1.58% | 1.61% |
| Expenses net of fee waivers, if any | 1.38%H | 1.46% | 1.50% | 1.50% | 1.50% | 1.50% |
| Expenses net of all reductions | 1.38%H | 1.46% | 1.49% | 1.50% | 1.48% | 1.50% |
| Net investment income (loss) | .44%H | .78% | .28% | .17% | .44% | .26% |
| Supplemental Data | ||||||
| Net assets, end of period (000 omitted) | $20,229 | $18,098 | $17,300 | $18,558 | $17,319 | $12,727 |
| Portfolio turnover rateI | 72%H | 77% | 82% | 78% | 103% | 77% |
A Calculated based on average shares outstanding during the period.
B Net realized and unrealized gain (loss) per share reflects proceeds received from litigation which amounted to $.01 per share. Excluding these litigation proceeds, the total return would have been (.48)%
C Total returns for periods of less than one year are not annualized.
D Total returns would have been lower if certain expenses had not been reduced during the applicable periods shown.
E Total returns do not include the effect of the sales charges.
F Fees and expenses of any underlying Fidelity Central Funds are not included in the Fund's expense ratio. The Fund indirectly bears its proportionate share of the expenses of any underlying Fidelity Central Funds.
G Expense ratios reflect operating expenses of the class. Expenses before reductions do not reflect amounts reimbursed by the investment adviser or reductions from brokerage service arrangements or reductions from other expense offset arrangements and do not represent the amount paid by the class during periods when reimbursements or reductions occur. Expenses net of fee waivers reflect expenses after reimbursement by the investment adviser but prior to reductions from brokerage service arrangements or other expense offset arrangements. Expenses net of all reductions represent the net expenses paid by the class.
H Annualized
I Amount does not include the portfolio activity of any underlying Fidelity Central Funds.
See accompanying notes which are an integral part of the financial statements.
Financial Highlights — Fidelity Advisor Value Fund Class C
| Six months ended (Unaudited) April 30, | Years ended October 31, | |||||
| 2017 | 2016 | 2015 | 2014 | 2013 | 2012 | |
| Selected Per–Share Data | ||||||
| Net asset value, beginning of period | $20.32 | $20.35 | $20.54 | $18.13 | $13.51 | $11.83 |
| Income from Investment Operations | ||||||
| Net investment income (loss)A | (.01) | .05 | (.05) | (.07) | (.01) | (.03) |
| Net realized and unrealized gain (loss) | 2.71 | .29 | (.13)B | 2.48 | 4.64 | 1.73 |
| Total from investment operations | 2.70 | .34 | (.18) | 2.41 | 4.63 | 1.70 |
| Distributions from net investment income | – | – | – | – | (.01) | (.02) |
| Distributions from net realized gain | – | (.37) | (.01) | – | – | – |
| Total distributions | – | (.37) | (.01) | – | (.01) | (.02) |
| Net asset value, end of period | $23.02 | $20.32 | $20.35 | $20.54 | $18.13 | $13.51 |
| Total ReturnC,D,E | 13.29% | 1.72% | (.89)%B | 13.29% | 34.32% | 14.36% |
| Ratios to Average Net AssetsF,G | ||||||
| Expenses before reductions | 1.90%H | 1.98% | 2.09% | 2.06% | 2.08% | 2.10% |
| Expenses net of fee waivers, if any | 1.90%H | 1.97% | 2.00% | 2.00% | 2.00% | 2.00% |
| Expenses net of all reductions | 1.90%H | 1.97% | 1.99% | 2.00% | 1.98% | 1.99% |
| Net investment income (loss) | (.08)%H | .27% | (.22)% | (.33)% | (.06)% | (.24)% |
| Supplemental Data | ||||||
| Net assets, end of period (000 omitted) | $19,442 | $15,589 | $16,670 | $17,390 | $14,354 | $9,283 |
| Portfolio turnover rateI | 72%H | 77% | 82% | 78% | 103% | 77% |
A Calculated based on average shares outstanding during the period.
B Net realized and unrealized gain (loss) per share reflects proceeds received from litigation which amounted to $.01 per share. Excluding these litigation proceeds, the total return would have been (.94)%
C Total returns for periods of less than one year are not annualized.
D Total returns would have been lower if certain expenses had not been reduced during the applicable periods shown.
E Total returns do not include the effect of the contingent deferred sales charge.
F Fees and expenses of any underlying Fidelity Central Funds are not included in the Fund's expense ratio. The Fund indirectly bears its proportionate share of the expenses of any underlying Fidelity Central Funds.
G Expense ratios reflect operating expenses of the class. Expenses before reductions do not reflect amounts reimbursed by the investment adviser or reductions from brokerage service arrangements or reductions from other expense offset arrangements and do not represent the amount paid by the class during periods when reimbursements or reductions occur. Expenses net of fee waivers reflect expenses after reimbursement by the investment adviser but prior to reductions from brokerage service arrangements or other expense offset arrangements. Expenses net of all reductions represent the net expenses paid by the class.
H Annualized
I Amount does not include the portfolio activity of any underlying Fidelity Central Funds.
See accompanying notes which are an integral part of the financial statements.
Financial Highlights — Fidelity Advisor Value Fund Class I
| Six months ended (Unaudited) April 30, | Years ended October 31, | |||||
| 2017 | 2016 | 2015 | 2014 | 2013 | 2012 | |
| Selected Per–Share Data | ||||||
| Net asset value, beginning of period | $21.65 | $21.60 | $21.70 | $19.09 | $14.22 | $12.34 |
| Income from Investment Operations | ||||||
| Net investment income (loss)A | .12 | .28 | .17 | .14 | .16 | .10 |
| Net realized and unrealized gain (loss) | 2.88 | .31 | (.14)B | 2.60 | 4.86 | 1.81 |
| Total from investment operations | 3.00 | .59 | .03 | 2.74 | 5.02 | 1.91 |
| Distributions from net investment income | (.20) | (.17) | (.11) | (.09) | (.15) | (.03) |
| Distributions from net realized gain | (.01) | (.37) | (.02) | (.04) | – | – |
| Total distributions | (.21) | (.54) | (.13) | (.13) | (.15) | (.03) |
| Net asset value, end of period | $24.44 | $21.65 | $21.60 | $21.70 | $19.09 | $14.22 |
| Total ReturnC,D | 13.90% | 2.82% | .13%B | 14.46% | 35.65% | 15.56% |
| Ratios to Average Net AssetsE,F | ||||||
| Expenses before reductions | .83%G | .89% | 1.00% | .97% | .96% | .99% |
| Expenses net of fee waivers, if any | .82%G | .89% | 1.00% | .97% | .96% | .99% |
| Expenses net of all reductions | .82%G | .89% | .99% | .97% | .94% | .99% |
| Net investment income (loss) | .99%G | 1.36% | .78% | .69% | .98% | .76% |
| Supplemental Data | ||||||
| Net assets, end of period (000 omitted) | $14,757 | $16,218 | $10,391 | $10,011 | $6,405 | $4,080 |
| Portfolio turnover rateH | 72%G | 77% | 82% | 78% | 103% | 77% |
A Calculated based on average shares outstanding during the period.
B Net realized and unrealized gain (loss) per share reflects proceeds received from litigation which amounted to $.01 per share. Excluding these litigation proceeds, the total return would have been .08%
C Total returns for periods of less than one year are not annualized.
D Total returns would have been lower if certain expenses had not been reduced during the applicable periods shown.
E Fees and expenses of any underlying Fidelity Central Funds are not included in the Fund's expense ratio. The Fund indirectly bears its proportionate share of the expenses of any underlying Fidelity Central Funds.
F Expense ratios reflect operating expenses of the class. Expenses before reductions do not reflect amounts reimbursed by the investment adviser or reductions from brokerage service arrangements or reductions from other expense offset arrangements and do not represent the amount paid by the class during periods when reimbursements or reductions occur. Expenses net of fee waivers reflect expenses after reimbursement by the investment adviser but prior to reductions from brokerage service arrangements or other expense offset arrangements. Expenses net of all reductions represent the net expenses paid by the class.
G Annualized
H Amount does not include the portfolio activity of any underlying Fidelity Central Funds.
See accompanying notes which are an integral part of the financial statements.
Financial Highlights — Fidelity Advisor Value Fund Class Z
| Six months ended (Unaudited) April 30, | |
| 2017 A | |
| Selected Per–Share Data | |
| Net asset value, beginning of period | $23.57 |
| Income from Investment Operations | |
| Net investment income (loss)B | .06 |
| Net realized and unrealized gain (loss) | .82 |
| Total from investment operations | .88 |
| Distributions from net investment income | – |
| Distributions from net realized gain | – |
| Total distributions | – |
| Net asset value, end of period | $24.45 |
| Total ReturnC,D | 3.73% |
| Ratios to Average Net AssetsE,F | |
| Expenses before reductions | .68%G |
| Expenses net of fee waivers, if any | .68%G |
| Expenses net of all reductions | .68%G |
| Net investment income (loss) | .95%G |
| Supplemental Data | |
| Net assets, end of period (000 omitted) | $104 |
| Portfolio turnover rateH | 72%G |
A For the period February 1, 2017 (commencement of sale of shares) to April 30, 2017.
B Calculated based on average shares outstanding during the period.
C Total returns for periods of less than one year are not annualized.
D Total returns would have been lower if certain expenses had not been reduced during the applicable periods shown.
E Fees and expenses of any underlying Fidelity Central Funds are not included in the Fund's expense ratio. The Fund indirectly bears its proportionate share of the expenses of any underlying Fidelity Central Funds.
F Expense ratios reflect operating expenses of the class. Expenses before reductions do not reflect amounts reimbursed by the investment adviser or reductions from brokerage service arrangements or reductions from other expense offset arrangements and do not represent the amount paid by the class during periods when reimbursements or reductions occur. Expense ratios before reductions for start-up periods may not be representative of longer-term operating periods. Expenses net of fee waivers reflect expenses after reimbursement by the investment adviser but prior to reductions from brokerage service arrangements or other expense offset arrangements. Expenses net of all reductions represent the net expenses paid by the class.
G Annualized
H Amount does not include the portfolio activity of any underlying Fidelity Central Funds.
See accompanying notes which are an integral part of the financial statements.
Notes to Financial Statements (Unaudited)
For the period ended April 30, 2017
1. Organization.
Fidelity Advisor Value Fund (the Fund) is a fund of Fidelity Advisor Series I (the Trust) and is authorized to issue an unlimited number of shares. The Trust is registered under the Investment Company Act of 1940, as amended (the 1940 Act), as an open-end management investment company organized as a Massachusetts business trust. The Fund commenced sale of Class Z shares on February 01, 2017. The Fund offers Class A, Class M (formerly Class T), Class C, Class I and Class Z shares, each of which has equal rights as to assets and voting privileges. Each class has exclusive voting rights with respect to matters that affect that class.
After the close of business on June 24, 2016, all outstanding Class B shares were converted to Class A shares. All prior fiscal period dollar and share amounts for Class B presented in the Notes to Financial Statements are for the period November 1, 2015 through June 24, 2016.
2. Investments in Fidelity Central Funds.
The Fund invests in Fidelity Central Funds, which are open-end investment companies generally available only to other investment companies and accounts managed by the investment adviser and its affiliates. The Fund's Schedule of Investments lists each of the Fidelity Central Funds held as of period end, if any, as an investment of the Fund, but does not include the underlying holdings of each Fidelity Central Fund. As an Investing Fund, the Fund indirectly bears its proportionate share of the expenses of the underlying Fidelity Central Funds.
The Money Market Central Funds seek preservation of capital and current income and are managed by Fidelity Investments Money Management, Inc. (FIMM), an affiliate of the investment adviser. Annualized expenses of the Money Market Central Funds as of their most recent shareholder report date are less than .005%.
A complete unaudited list of holdings for each Fidelity Central Fund is available upon request or at the Securities and Exchange Commission (the SEC) website at www.sec.gov. In addition, the financial statements of the Fidelity Central Funds are available on the SEC website or upon request.
3. Significant Accounting Policies.
The Fund is an investment company and applies the accounting and reporting guidance of the Financial Accounting Standards Board (FASB) Accounting Standards Codification Topic 946 Financial Services – Investments Companies. The financial statements have been prepared in conformity with accounting principles generally accepted in the United States of America (GAAP), which require management to make certain estimates and assumptions at the date of the financial statements. Actual results could differ from those estimates. Subsequent events, if any, through the date that the financial statements were issued have been evaluated in the preparation of the financial statements. The following summarizes the significant accounting policies of the Fund:
Investment Valuation. Investments are valued as of 4:00 p.m. Eastern time on the last calendar day of the period. The Board of Trustees (the Board) has delegated the day to day responsibility for the valuation of the Fund's investments to the Fair Value Committee (the Committee) established by the Fund's investment adviser. In accordance with valuation policies and procedures approved by the Board, the Fund attempts to obtain prices from one or more third party pricing vendors or brokers to value its investments. When current market prices, quotations or currency exchange rates are not readily available or reliable, investments will be fair valued in good faith by the Committee, in accordance with procedures adopted by the Board. Factors used in determining fair value vary by investment type and may include market or investment specific events, changes in interest rates and credit quality. The frequency with which these procedures are used cannot be predicted and they may be utilized to a significant extent. The Committee oversees the Fund's valuation policies and procedures and reports to the Board on the Committee's activities and fair value determinations. The Board monitors the appropriateness of the procedures used in valuing the Fund's investments and ratifies the fair value determinations of the Committee.
The Fund categorizes the inputs to valuation techniques used to value its investments into a disclosure hierarchy consisting of three levels as shown below:
- Level 1 – quoted prices in active markets for identical investments
- Level 2 – other significant observable inputs (including quoted prices for similar investments, interest rates, prepayment speeds, etc.)
- Level 3 – unobservable inputs (including the Fund's own assumptions based on the best information available)
Valuation techniques used to value the Fund's investments by major category are as follows:
Equity securities, including restricted securities, for which market quotations are readily available, are valued at the last reported sale price or official closing price as reported by a third party pricing vendor on the primary market or exchange on which they are traded and are categorized as Level 1 in the hierarchy. In the event there were no sales during the day or closing prices are not available, securities are valued at the last quoted bid price or may be valued using the last available price and are generally categorized as Level 2 in the hierarchy. For foreign equity securities, when market or security specific events arise, comparisons to the valuation of American Depositary Receipts (ADRs), futures contracts, Exchange-Traded Funds (ETFs) and certain indexes as well as quoted prices for similar securities may be used and would be categorized as Level 2 in the hierarchy. Utilizing these techniques may result in transfers between Level 1 and Level 2. For equity securities, including restricted securities, where observable inputs are limited, assumptions about market activity and risk are used and these securities may be categorized as Level 3 in the hierarchy.
Debt securities, including restricted securities, are valued based on evaluated prices received from third party pricing vendors or from brokers who make markets in such securities. Corporate bonds and U.S. government and government agency obligations are valued by pricing vendors who utilize matrix pricing which considers yield or price of bonds of comparable quality, coupon, maturity and type or by broker-supplied prices. When independent prices are unavailable or unreliable, debt securities may be valued utilizing pricing methodologies which consider similar factors that would be used by third party pricing vendors. Debt securities are generally categorized as Level 2 in the hierarchy but may be Level 3 depending on the circumstances.
Futures contracts are valued at the settlement price established each day by the board of trade or exchange on which they are traded and are categorized as Level 1 in the hierarchy. Investments in open-end mutual funds, including the Fidelity Central Funds, are valued at their closing net asset value (NAV) each business day and are categorized as Level 1 in the hierarchy.
Changes in valuation techniques may result in transfers in or out of an assigned level within the disclosure hierarchy. The aggregate value of investments by input level as of April 30, 2017 is included at the end of the Fund's Schedule of Investments.
Foreign Currency. The Fund may use foreign currency contracts to facilitate transactions in foreign-denominated securities. Gains and losses from these transactions may arise from changes in the value of the foreign currency or if the counterparties do not perform under the contracts' terms.
Foreign-denominated assets, including investment securities, and liabilities are translated into U.S. dollars at the exchange rates at period end. Purchases and sales of investment securities, income and dividends received and expenses denominated in foreign currencies are translated into U.S. dollars at the exchange rate in effect on the transaction date.
The effects of exchange rate fluctuations on investments are included with the net realized and unrealized gain (loss) on investment securities. Other foreign currency transactions resulting in realized and unrealized gain (loss) are disclosed separately.
Investment Transactions and Income. For financial reporting purposes, the Fund's investment holdings and NAV include trades executed through the end of the last business day of the period. The NAV per share for processing shareholder transactions is calculated as of the close of business of the New York Stock Exchange (NYSE), normally 4:00 p.m. Eastern time and includes trades executed through the end of the prior business day. Gains and losses on securities sold are determined on the basis of identified cost and may include proceeds received from litigation. Dividend income is recorded on the ex-dividend date, except for certain dividends from foreign securities where the ex-dividend date may have passed, which are recorded as soon as the Fund is informed of the ex-dividend date. Non-cash dividends included in dividend income, if any, are recorded at the fair market value of the securities received. Income and capital gain distributions from Fidelity Central Funds, if any, are recorded on the ex-dividend date. Certain distributions received by the Fund represent a return of capital or capital gain. The Fund determines the components of these distributions subsequent to the ex-dividend date, based upon receipt of tax filings or other correspondence relating to the underlying investment. These distributions are recorded as a reduction of cost of investments and/or as a realized gain. Interest income is accrued as earned and includes coupon interest and amortization of premium and accretion of discount on debt securities as applicable. Investment income is recorded net of foreign taxes withheld where recovery of such taxes is uncertain.
Class Allocations and Expenses. Investment income, realized and unrealized capital gains and losses, common expenses of the Fund, and certain fund-level expense reductions, if any, are allocated daily on a pro-rata basis to each class based on the relative net assets of each class to the total net assets of the Fund. Each class differs with respect to transfer agent and distribution and service plan fees incurred. Certain expense reductions may also differ by class. For the reporting period, the allocated portion of income and expenses to each class as a percent of its average net assets may vary due to the timing of recording these transactions in relation to fluctuating net assets of the classes. Expenses directly attributable to a fund are charged to that fund. Expenses attributable to more than one fund are allocated among the respective funds on the basis of relative net assets or other appropriate methods. Expense estimates are accrued in the period to which they relate and adjustments are made when actual amounts are known.
Income Tax Information and Distributions to Shareholders. Each year, the Fund intends to qualify as a regulated investment company under Subchapter M of the Internal Revenue Code, including distributing substantially all of its taxable income and realized gains. As a result, no provision for U.S. Federal income taxes is required. The Fund files a U.S. federal tax return, in addition to state and local tax returns as required. The Fund's federal income tax returns are subject to examination by the Internal Revenue Service (IRS) for a period of three fiscal years after they are filed. State and local tax returns may be subject to examination for an additional fiscal year depending on the jurisdiction. Foreign taxes are provided for based on the Fund's understanding of the tax rules and rates that exist in the foreign markets in which it invests.
Distributions are declared and recorded on the ex-dividend date. Income dividends and capital gain distributions are declared separately for each class. Income and capital gain distributions are determined in accordance with income tax regulations, which may differ from GAAP.
Capital accounts within the financial statements are adjusted for permanent book-tax differences. These adjustments have no impact on net assets or the results of operations. Capital accounts are not adjusted for temporary book-tax differences which will reverse in a subsequent period.
Book-tax differences are primarily due to futures contracts, foreign currency transactions, passive foreign investment companies (PFIC), partnerships, capital loss carryforwards and losses deferred due to wash sales.
The federal tax cost of investment securities and unrealized appreciation (depreciation) as of period end were as follows:
| Gross unrealized appreciation | $18,633,333 |
| Gross unrealized depreciation | (4,410,972) |
| Net unrealized appreciation (depreciation) on securities | $14,222,361 |
| Tax cost | $101,260,430 |
Capital loss carryforwards are only available to offset future capital gains of the Fund to the extent provided by regulations and may be limited. Under the Regulated Investment Company Modernization Act of 2010 (the Act), the Fund is permitted to carry forward capital losses incurred in taxable years beginning after December 22, 2010 for an unlimited period and such capital losses are required to be used prior to any losses that expire. The capital loss carryforward information presented below, including any applicable limitation, is estimated as of prior fiscal period end and is subject to adjustment.
| No expiration | |
| Short-term | $(125,047) |
| Long-term | (3,195,803) |
| Total capital loss carryforward | $(3,320,850) |
Restricted Securities. The Fund may invest in securities that are subject to legal or contractual restrictions on resale. These securities generally may be resold in transactions exempt from registration or to the public if the securities are registered. Disposal of these securities may involve time-consuming negotiations and expense, and prompt sale at an acceptable price may be difficult. Information regarding restricted securities is included at the end of the Fund's Schedule of Investments.
4. Derivative Instruments.
Risk Exposures and the Use of Derivative Instruments. The Fund's investment objective allows the Fund to enter into various types of derivative contracts, including futures contracts. Derivatives are investments whose value is primarily derived from underlying assets, indices or reference rates and may be transacted on an exchange or over-the-counter (OTC). Derivatives may involve a future commitment to buy or sell a specified asset based on specified terms, to exchange future cash flows at periodic intervals based on a notional principal amount, or for one party to make one or more payments upon the occurrence of specified events in exchange for periodic payments from the other party.
The Fund used derivatives to increase returns and to manage exposure to certain risks as defined below. The success of any strategy involving derivatives depends on analysis of numerous economic factors, and if the strategies for investment do not work as intended, the Fund may not achieve its objectives.
The Fund's use of derivatives increased or decreased its exposure to the following risk:
| Equity Risk | Equity risk relates to the fluctuations in the value of financial instruments as a result of changes in market prices (other than those arising from interest rate risk or foreign exchange risk), whether caused by factors specific to an individual investment, its issuer, or all factors affecting all instruments traded in a market or market segment. |
The Fund is also exposed to additional risks from investing in derivatives, such as liquidity risk and counterparty credit risk. Liquidity risk is the risk that the Fund will be unable to close out the derivative in the open market in a timely manner. Counterparty credit risk is the risk that the counterparty will not be able to fulfill its obligation to the Fund. Counterparty credit risk related to exchange-traded futures contracts may be mitigated by the protection provided by the exchange on which they trade.
Investing in derivatives may involve greater risks than investing in the underlying assets directly and, to varying degrees, may involve risk of loss in excess of any initial investment and collateral received and amounts recognized in the Statement of Assets and Liabilities. In addition, there may be the risk that the change in value of the derivative contract does not correspond to the change in value of the underlying instrument.
Futures Contracts. A futures contract is an agreement between two parties to buy or sell a specified underlying instrument for a fixed price at a specified future date. The Fund used futures contracts to manage its exposure to the stock market.
Upon entering into a futures contract, a fund is required to deposit either cash or securities (initial margin) with a clearing broker in an amount equal to a certain percentage of the face value of the contract. Futures contracts are marked-to-market daily and subsequent daily payments (variation margin) are made or received by a fund depending on the daily fluctuations in the value of the futures contracts and are recorded as unrealized appreciation or (depreciation). This receivable and/or payable, if any, is included in daily variation margin for derivative instruments in the Statement of Assets and Liabilities. Realized gain or (loss) is recorded upon the expiration or closing of a futures contract.
Any open futures contracts at period end are presented in the Schedule of Investments under the caption "Futures Contracts". The underlying face amount at value reflects each contract's exposure to the underlying instrument or index at period end and is representative of volume of activity during the period. Securities deposited to meet initial margin requirements are identified in the Schedule of Investments.
During the period the Fund recognized net realized gain (loss) of $41,406 and a change in net unrealized appreciation (depreciation) of $369 related to its investment in futures contracts. These amounts are included in the Statement of Operations.
5. Purchases and Sales of Investments.
Purchases and sales of securities, other than short-term securities, aggregated $39,908,613 and $42,592,200, respectively.
6. Fees and Other Transactions with Affiliates.
Management Fee. Fidelity Management & Research Company (the investment adviser) and its affiliates provide the Fund with investment management related services for which the Fund pays a monthly management fee. The management fee is the sum of an individual fund fee rate that is based on an annual rate of .30% of the Fund's average net assets and an annualized group fee rate that averaged .25% during the period. The group fee rate is based upon the average net assets of all the mutual funds advised by the investment adviser, including any mutual funds previously advised by the investment adviser that are currently advised by Fidelity SelectCo, LLC, an affiliate of the investment adviser. The group fee rate decreases as assets under management increase and increases as assets under management decrease. In addition, the management fee is subject to a performance adjustment (up to a maximum of +/- .20% of the Fund's average net assets over a 36 month performance period). The upward or downward adjustment to the management fee is based on the relative investment performance of Class I of the Fund as compared to its benchmark index, the Russell Midcap Value Index, over the same 36 month performance period. For the reporting period, the total annualized management fee rate, including the performance adjustment, was .40% of the Fund's average net assets. The performance adjustment included in the management fee rate may be higher or lower than the maximum performance adjustment rate due to the difference between the average net assets for the reporting and performance periods.
Distribution and Service Plan Fees. In accordance with Rule 12b-1 of the 1940 Act, the Fund has adopted separate Distribution and Service Plans for each class of shares. Certain classes pay Fidelity Distributors Corporation (FDC), an affiliate of the investment adviser, separate Distribution and Service Fees, each of which is based on an annual percentage of each class' average net assets. In addition, FDC may pay financial intermediaries for selling shares of the Fund and providing shareholder support services. For the period, the Distribution and Service Fee rates, total fees and amounts retained by FDC were as follows:
| Distribution Fee | Service Fee | Total Fees | Retained by FDC |
|
| Class A | -% | .25% | $74,940 | $1,902 |
| Class M | .25% | .25% | 49,796 | 272 |
| Class C | .75% | .25% | 91,065 | 10,797 |
| $215,801 | $12,971 |
Sales Load. FDC may receive a front-end sales charge of up to 5.75% for selling Class A shares and 3.50% for selling Class M shares, some of which is paid to financial intermediaries for selling shares of the Fund. Depending on the holding period, FDC may receive contingent deferred sales charges levied on Class A, Class M, and Class C redemptions. The deferred sales charges are from 1.00% for Class C shares, 1.00% for certain purchases of Class A shares and .25% for certain purchases of Class M shares. For the period, sales charge amounts retained by FDC were as follows:
| Retained by FDC |
|
| Class A | $9,153 |
| Class M | 1,561 |
| Class C(a) | 785 |
| $11,499 |
(a) When Class C shares are initially sold, FDC pays commissions from its own resources to financial intermediaries through which the sales are made.
Transfer Agent Fees. Fidelity Investments Institutional Operations Company, Inc., (FIIOC), an affiliate of the investment adviser, is the transfer, dividend disbursing and shareholder servicing agent for each class of the Fund. FIIOC receives account fees and asset-based fees that vary according to the account size and type of account of the shareholders of the respective classes of the Fund, except for Class Z. FIIOC receives an asset-based fee of Class Z's average net assets. FIIOC pays for typesetting, printing and mailing of shareholder reports, except proxy statements.
For the period, transfer agent fees for each class were as follows:
| Amount | % of Class-Level Average Net Assets(a) |
|
| Class A | $66,002 | .22 |
| Class M | 23,772 | .24 |
| Class C | 23,907 | .26 |
| Class I | 16,559 | .18 |
| Class Z | 12 | .05 |
| $130,252 |
(a) Annualized
Accounting and Security Lending Fees. Fidelity Service Company, Inc. (FSC), an affiliate of the investment adviser, maintains the Fund's accounting records. The accounting fee is based on the level of average net assets for each month. Under a separate contract, FSC administers the security lending program. The security lending fee is based on the number and duration of lending transactions.
Brokerage Commissions. The Fund placed a portion of its portfolio transactions with brokerage firms which are affiliates of the investment adviser. Brokerage commissions are included in net realized gain (loss) and change in net unrealized appreciation (depreciation) in the Statement of Operations. The commissions paid to these affiliated firms were $1,402 for the period.
Interfund Trades. The Fund may purchase from or sell securities to other Fidelity Funds under procedures adopted by the Board. The procedures have been designed to ensure these interfund trades are executed in accordance with Rule 17a-7 of the 1940 Act. Interfund trades are included within the respective purchases and sales amounts shown in the Purchases and Sales of Investments note.
Other. During the period, the investment adviser reimbursed the Fund for certain losses in the amount of $4,935.
7. Committed Line of Credit.
The Fund participates with other funds managed by the investment adviser or an affiliate in a $4.25 billion credit facility (the "line of credit") to be utilized for temporary or emergency purposes to fund shareholder redemptions or for other short-term liquidity purposes. The Fund has agreed to pay commitment fees on its pro-rata portion of the line of credit, which amounted to $195 and is reflected in Miscellaneous expenses on the Statement of Operations. During the period, the Fund did not borrow on this line of credit.
8. Security Lending.
The Fund lends portfolio securities through a lending agent from time to time in order to earn additional income. For equity securities, a lending agent is used and may loan securities to certain qualified borrowers, including Fidelity Capital Markets (FCM), a broker-dealer affiliated with the Fund. On the settlement date of the loan, the Fund receives collateral (in the form of U.S. Treasury obligations, letters of credit and/or cash) against the loaned securities and maintains collateral in an amount not less than 100% of the market value of the loaned securities during the period of the loan. The market value of the loaned securities is determined at the close of business of the Fund and any additional required collateral is delivered to the Fund on the next business day. The Fund or borrower may terminate the loan at any time, and if the borrower defaults on its obligation to return the securities loaned because of insolvency or other reasons, the Fund may apply collateral received from the borrower against the obligation. The Fund may experience delays and costs in recovering the securities loaned. Any cash collateral received is invested in the Fidelity Securities Lending Cash Central Fund. The value of loaned securities and cash collateral at period end are disclosed on the Fund's Statement of Assets and Liabilities. At period end, there were no security loans outstanding with FCM. Security lending income represents the income earned on investing cash collateral, less rebates paid to borrowers and any lending agent fees associated with the loan, plus any premium payments received for lending certain types of securities. Security lending income is presented in the Statement of Operations as a component of income from Fidelity Central Funds. Total security lending income during the period amounted to $1,961, including $2 from securities loaned to FCM.
9. Expense Reductions.
Commissions paid to certain brokers with whom the investment adviser, or its affiliates, places trades on behalf of the Fund include an amount in addition to trade execution, which may be rebated back to the Fund to offset certain expenses. This amount totaled $654 for the period.
In addition, during the period the investment adviser reimbursed and/or waived a portion of fund-level operating expenses in the amount of $519.
10. Distributions to Shareholders.
Distributions to shareholders of each class were as follows:
| Six months ended April 30, 2017 | Year ended October 31, 2016 | |
| From net investment income | ||
| Class A | $349,953 | $271,815 |
| Class M | 78,611 | 40,168 |
| Class I | 154,082 | 91,951 |
| Total | $582,646 | $403,934 |
| From net realized gain | ||
| Class A | $17,751 | $882,206 |
| Class M | 6,114 | 297,241 |
| Class B | – | 16,135 |
| Class C | – | 301,923 |
| Class I | 5,313 | 201,312 |
| Total | $29,178 | $1,698,817 |
11. Share Transactions.
Share transactions for each class were as follows and may contain automatic conversions between classes or exchanges between affiliated funds:
| Shares(a) | Shares | Dollars(a) | Dollars | |
| Six months ended April 30, 2017 | Year ended October 31, 2016 | Six months ended April 30, 2017 | Year ended October 31, 2016 | |
| Class A | ||||
| Shares sold | 441,943 | 824,070 | $10,296,976 | $16,976,958 |
| Reinvestment of distributions | 15,497 | 54,608 | 360,453 | 1,132,015 |
| Shares redeemed | (518,735) | (727,383) | (12,187,903) | (14,850,569) |
| Net increase (decrease) | (61,295) | 151,295 | $(1,530,474) | $3,258,404 |
| Class M | ||||
| Shares sold | 84,253 | 192,081 | $1,932,869 | $4,011,968 |
| Reinvestment of distributions | 3,578 | 16,080 | 82,555 | 330,767 |
| Shares redeemed | (97,743) | (172,188) | (2,270,858) | (3,484,722) |
| Net increase (decrease) | (9,912) | 35,973 | $(255,434) | $858,013 |
| Class B | ||||
| Shares sold | – | 995 | $– | $19,938 |
| Reinvestment of distributions | – | 769 | $– | $15,282 |
| Shares redeemed | – | (46,605) | – | (903,723) |
| Net increase (decrease) | – | (44,841) | $– | $(868,503) |
| Class C | ||||
| Shares sold | 221,637 | 175,956 | $4,898,745 | $3,455,624 |
| Reinvestment of distributions | – | 14,372 | – | 284,567 |
| Shares redeemed | (144,093) | (242,360) | (3,196,582) | (4,738,320) |
| Net increase (decrease) | 77,544 | (52,032) | $1,702,163 | $(998,129) |
| Class I | ||||
| Shares sold | 214,573 | 475,169 | $5,111,001 | $9,727,941 |
| Reinvestment of distributions | 5,728 | 12,080 | 134,330 | 252,359 |
| Shares redeemed | (365,445) | (219,416) | (8,880,394) | (4,607,004) |
| Net increase (decrease) | (145,144) | 267,833 | $(3,635,063) | $5,373,296 |
| Class Z | ||||
| Shares sold | 4,243 | – | $100,000 | $– |
| Net increase (decrease) | 4,243 | – | $100,000 | $– |
(a) Share transactions for Class Z are for the period February 01, 2017 (commencement of sale of shares) to April 30, 2017
12. Other.
The Fund's organizational documents provide former and current trustees and officers with a limited indemnification against liabilities arising in connection with the performance of their duties to the Fund. In the normal course of business, the Fund may also enter into contracts that provide general indemnifications. The Fund's maximum exposure under these arrangements is unknown as this would be dependent on future claims that may be made against the Fund. The risk of material loss from such claims is considered remote.
Shareholder Expense Example
As a shareholder of the Fund, you incur two types of costs: (1) transaction costs, including sales charges (loads) on purchase payments or redemption proceeds, and (2) ongoing costs, including management fees, distribution and/or service (12b-1) fees and other Fund expenses. This Example is intended to help you understand your ongoing costs (in dollars) of investing in the Fund and to compare these costs with the ongoing costs of investing in other mutual funds.
The actual expense Example is based on an investment of $1,000 invested at the beginning of the period and held for the entire period (November 1, 2016 to April 30, 2017) for Class A, Class M, Class C, and Class I and for the period (February 1, 2017 to April 30,2017) for Class Z. The hypothetical expense Example is based on an investment of $1,000 invested for the one-half year period(November 1, 2016 to April 30, 2017).
Actual Expenses
The first line of the accompanying table for each class of the Fund provides information about actual account values and actual expenses. You may use the information in this line, together with the amount you invested, to estimate the expenses that you paid over the period. Simply divide your account value by $1,000.00 (for example, an $8,600 account value divided by $1,000.00 = 8.6), then multiply the result by the number in the first line for a class of the Fund under the heading entitled "Expenses Paid During Period" to estimate the expenses you paid on your account during this period. In addition, the Fund, as a shareholder in the underlying Fidelity Central Funds, will indirectly bear its pro-rata share of the fees and expenses incurred by the underlying Fidelity Central Funds. These fees and expenses are not included in the Fund's annualized expense ratio used to calculate the expense estimate in the table below.
Hypothetical Example for Comparison Purposes
The second line of the accompanying table for each class of the Fund provides information about hypothetical account values and hypothetical expenses based on a Class' actual expense ratio and an assumed rate of return of 5% per year before expenses, which is not the Class' actual return. The hypothetical account values and expenses may not be used to estimate the actual ending account balance or expenses you paid for the period. You may use this information to compare the ongoing costs of investing in the Fund and other funds. To do so, compare this 5% hypothetical example with the 5% hypothetical examples that appear in the shareholder reports of the other funds. In addition, the Fund, as a shareholder in the underlying Fidelity Central Funds, will indirectly bear its pro-rata share of the fees and expenses incurred by the underlying Fidelity Central Funds. These fees and expenses are not included in the Fund's annualized expense ratio used to calculate the expense estimate in the table below.
Please note that the expenses shown in the table are meant to highlight your ongoing costs only and do not reflect any transaction costs. Therefore, the second line of the table is useful in comparing ongoing costs only, and will not help you determine the relative total costs of owning different funds. In addition, if these transactional costs were included, your costs would have been higher.
| Annualized Expense Ratio-A | Beginning Account Value November 1, 2016 | Ending Account Value April 30, 2017 | Expenses Paid During Period- November 1, 2016 to April 30, 2017 |
|
| Class A | 1.11% | |||
| Actual | $1,000.00 | $1,137.20 | $5.88-B | |
| Hypothetical-C | $1,000.00 | $1,019.29 | $5.56-D | |
| Class M | 1.38% | |||
| Actual | $1,000.00 | $1,135.30 | $7.31-B | |
| Hypothetical-C | $1,000.00 | $1,017.95 | $6.90-D | |
| Class C | 1.90% | |||
| Actual | $1,000.00 | $1,132.90 | $10.05-B | |
| Hypothetical-C | $1,000.00 | $1,015.37 | $9.49-D | |
| Class I | .82% | |||
| Actual | $1,000.00 | $1,139.00 | $4.35-B | |
| Hypothetical-C | $1,000.00 | $1,020.73 | $4.11-D | |
| Class Z | .68% | |||
| Actual | $1,000.00 | $1,037.30 | $1.69-B | |
| Hypothetical-C | $1,000.00 | $1,021.42 | $3.41-D |
A Annualized expense ratio reflects expenses net of applicable fee waivers.
B Actual expenses are equal to each Class' annualized expense ratio; multiplied by the average account value over the period, multiplied by 181/365 (to reflect the one-half year period) for Class A, Class M, Class C, and Class I and multiplied by 89/365 (to reflect the period February 01, 2017 to April 30, 2017) for Class Z.
C 5% return per year before expenses
D Hypothetical expenses are equal to each Class' annualized expense ratio, multiplied by the average account value over the period, multiplied by 181/365 (to reflect the one-half year period).
![]()
FAV-SANN-0617
1.800650.113
Item 2.
Code of Ethics
Not applicable.
Item 3.
Audit Committee Financial Expert
Not applicable.
Item 4.
Principal Accountant Fees and Services
Not applicable.
Item 5.
Audit Committee of Listed Registrants
Not applicable.
Item 6.
Investments
(a)
Not applicable.
(b)
Not applicable
Item 7.
Disclosure of Proxy Voting Policies and Procedures for Closed-End Management Investment Companies
Not applicable.
Item 8.
Portfolio Managers of Closed-End Management Investment Companies
Not applicable.
Item 9.
Purchase of Equity Securities by Closed-End Management Investment Company and Affiliated Purchasers
Not applicable.
Item 10.
Submission of Matters to a Vote of Security Holders
There were no material changes to the procedures by which shareholders may recommend nominees to the Fidelity Advisor Series I’s Board of Trustees.
Item 11.
Controls and Procedures
(a)(i) The President and Treasurer and the Chief Financial Officer have concluded that the Fidelity Advisor Series I’s (the “Trust”) disclosure controls and procedures (as
defined in Rule 30a-3(c) under the Investment Company Act) provide reasonable assurances that material information relating to the Trust is made known to them by the appropriate persons, based on their evaluation of these controls and procedures as of a date within 90 days of the filing date of this report.
(a)(ii) There was no change in the Trust’s internal control over financial reporting (as defined in Rule 30a-3(d) under the Investment Company Act) that occurred during the second fiscal quarter of the period covered by this report that has materially affected, or is reasonably likely to materially affect, the Trust’s internal control over financial reporting.
Item 12.
Exhibits
(a) | (1) | Not applicable. |
(a) | (2) | Certification pursuant to Rule 30a-2(a) under the Investment Company Act of 1940 (17 CFR 270.30a-2(a)) is filed and attached hereto as Exhibit 99.CERT. |
(a) | (3) | Not applicable. |
(b) | Certification pursuant to Rule 30a-2(b) under the Investment Company Act of 1940 (17 CFR 270.30a-2(b)) is furnished and attached hereto as Exhibit 99.906CERT. |
SIGNATURES
Pursuant to the requirements of the Securities Exchange Act of 1934 and the Investment Company Act of 1940, the registrant has duly caused this report to be signed on its behalf by the undersigned, thereunto duly authorized.
Fidelity Advisor Series I
By: | /s/Stacie M. Smith |
Stacie M. Smith | |
President and Treasurer | |
Date: | June 26, 2017 |
Pursuant to the requirements of the Securities Exchange Act of 1934 and the Investment Company Act of 1940, this report has been signed below by the following persons on behalf of the registrant and in the capacities and on the dates indicated.
By: | /s/Stacie M. Smith |
Stacie M. Smith | |
President and Treasurer | |
Date: | June 26, 2017 |
By: | /s/Howard J. Galligan III |
Howard J. Galligan III | |
Chief Financial Officer | |
Date: | June 26, 2017 |