UNITED STATES
SECURITIES AND EXCHANGE COMMISSION
Washington, D.C. 20549
FORM N-CSR
CERTIFIED SHAREHOLDER REPORT OF REGISTERED
MANAGEMENT INVESTMENT COMPANIES
Investment Company Act file number 811-3785
Fidelity Advisor Series I
(Exact name of registrant as specified in charter)
245 Summer St., Boston, Massachusetts 02210
(Address of principal executive offices) (Zip code)
Marc Bryant, Secretary
245 Summer St.
Boston, Massachusetts 02210
(Name and address of agent for service)
Registrant's telephone number, including area code:
617-563-7000
Date of fiscal year end: | October 31 |
|
|
Date of reporting period: | October 31, 2016 |
Item 1.
Reports to Stockholders
|
Fidelity Advisor® Floating Rate High Income Fund Class A, Class T, Class C and Class I Annual Report October 31, 2016 |
 |
Contents
|
Board Approval of Investment Advisory Contracts and Management Fees |
To view a fund's proxy voting guidelines and proxy voting record for the 12-month period ended June 30, visit http://www.fidelity.com/proxyvotingresults or visit the Securities and Exchange Commission's (SEC) web site at http://www.sec.gov.
You may also call 1-877-208-0098 to request a free copy of the proxy voting guidelines.
Standard & Poor's, S&P and S&P 500 are registered service marks of The McGraw-Hill Companies, Inc. and have been licensed for use by Fidelity Distributors Corporation.
Other third-party marks appearing herein are the property of their respective owners.
All other marks appearing herein are registered or unregistered trademarks or service marks of FMR LLC or an affiliated company. © 2016 FMR LLC. All rights reserved.
This report and the financial statements contained herein are submitted for the general information of the shareholders of the Fund. This report is not authorized for distribution to prospective investors in the Fund unless preceded or accompanied by an effective prospectus.
A fund files its complete schedule of portfolio holdings with the SEC for the first and third quarters of each fiscal year on Form N-Q. Forms N-Q are available on the SEC’s web site at http://www.sec.gov. A fund's Forms N-Q may be reviewed and copied at the SEC’s Public Reference Room in Washington, DC. Information regarding the operation of the SEC's Public Reference Room may be obtained by calling 1-800-SEC-0330.
For a complete list of a fund's portfolio holdings, view the most recent holdings listing, semiannual report, or annual report on Fidelity's web site at http://www.fidelity.com, http://www.institutional.fidelity.com, or http://www.401k.com, as applicable.
NOT FDIC INSURED •MAY LOSE VALUE •NO BANK GUARANTEE
Neither the Fund nor Fidelity Distributors Corporation is a bank.
Performance: The Bottom Line
Average annual total return reflects the change in the value of an investment, assuming reinvestment of distributions from dividend income and capital gains (the profits earned upon the sale of securities that have grown in value, if any) and assuming a constant rate of performance each year. The hypothetical investment and the average annual total returns do not reflect the deduction of taxes that a shareholder would pay on fund distributions or the redemption of fund shares. During periods of reimbursement by Fidelity, a fund’s total return will be greater than it would be had the reimbursement not occurred. How a fund did yesterday is no guarantee of how it will do tomorrow.
Average Annual Total Returns
| For the periods ended October 31, 2016 | Past 1 year | Past 5 years | Past 10 years |
| Class A (incl. 2.75% sales charge) | 3.07% | 2.80% | 3.32% |
| Class T (incl. 2.75% sales charge) | 2.97% | 2.68% | 3.26% |
| Class C (incl. contingent deferred sales charge) | 4.19% | 2.58% | 2.84% |
| Class I | 6.23% | 3.62% | 3.87% |
Class C shares' contingent deferred sales charges included in the past one year, past five years and past ten years total return figures are 1%, 0% and 0%, respectively.
$10,000 Over 10 Years
Let's say hypothetically that $10,000 was invested in Fidelity Advisor® Floating Rate High Income Fund - Class A on October 31, 2006, and the current 2.75% sales charge was paid.
The chart shows how the value of your investment would have changed, and also shows how the S&P®/LSTA Leveraged Performing Loan Index performed over the same period.
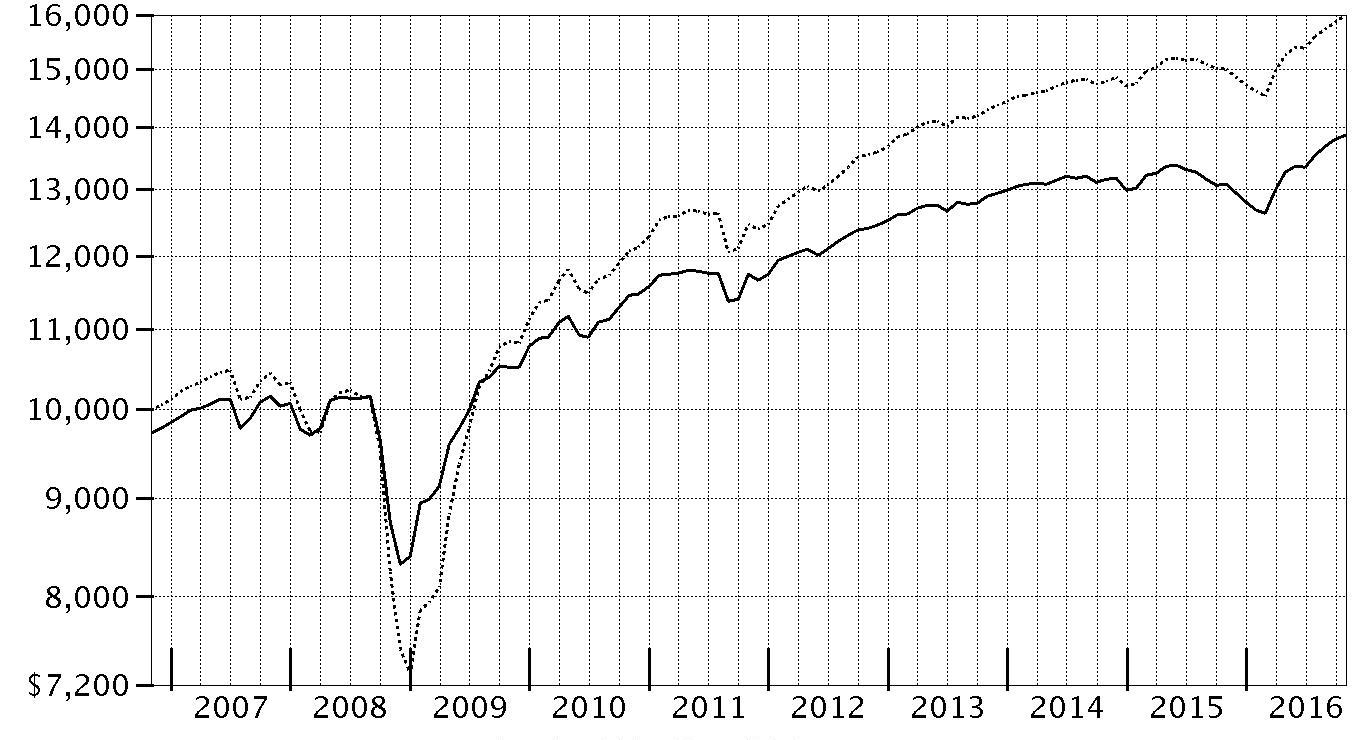
| Period Ending Values | ||
|
| $13,863 | Fidelity Advisor® Floating Rate High Income Fund - Class A |
|
| $15,996 | S&P®/LSTA Leveraged Performing Loan Index |
Management's Discussion of Fund Performance
Market Recap: Floating-rate bank loans posted a solid gain for the fiscal year ending October 31, 2016, sharply reversing course in March to end seven months of negative returns. The S&P/LSTA® Leveraged Performing Loan Index gained 6.62% the past year, lagging high-yield bonds but outpacing the broad investment-grade fixed-income market. Sharply falling oil prices, global economic uncertainty and investor risk aversion weighed on the asset class into mid-February. As February progressed, loans began to benefit from improvement across a range of global issues. Oil prices shifted into an uptrend, China’s central bank eased concern about its economy by implementing additional stimulus measures and improving U.S. economic data helped allay fears that global developments would stall U.S. expansion. The loan market extended its rally through May, bolstered by fading fears of a U.S. recession, robust stimulus from the European Central Bank and modestly increased demand for collateralized loan obligations. Following a brief, late-June disruption related to the U.K.’s vote to exit the European Union, or Brexit, loans advanced through October 31. Gains were broad-based across industries, led by steel, which rallied in step with recovering commodity prices. From a credit-quality perspective, lower-quality loans delivered the best performance, reflecting improved risk sentiment. Comments from Portfolio Manager Eric Mollenhauer: For the year, the fund’s share classes (excluding sales charges, if applicable) gained about 6%, modestly trailing the benchmark S&P/LSTA® Leveraged Performing Loan Index. A cash stake of roughly 7%, on average, was the primary factor hampering relative performance. During the period, a combination of loan repayments and investment sales pushed the fund’s cash allocation above my 5% target. Despite the fund’s conservative overall positioning, positive security selection among loans rated B and CCC helped performance stay relatively close to that of the benchmark in a rally led by lower-quality areas of the market. At the sector/industry level, security selection in health care was a modest drag on relative results. On the plus side, selections in lodging & casinos, leisure goods/activities/movies and nonferrous metals/minerals notably aided relative performance. The biggest individual detractors were an underweighting in oil & gas exploration & production company Fieldwood Energy and an out-of-benchmark position in coal mine operator Walter Energy. The loans of both of these firms were no longer in the fund as of period end, although we held an equity stake in Walter Energy. The top contributors were overweightings in coal producer Murray Energy and resort and casino operator Caesars Entertainment.The views expressed above reflect those of the portfolio manager(s) only through the end of the period as stated on the cover of this report and do not necessarily represent the views of Fidelity or any other person in the Fidelity organization. Any such views are subject to change at any time based upon market or other conditions and Fidelity disclaims any responsibility to update such views. These views may not be relied on as investment advice and, because investment decisions for a Fidelity fund are based on numerous factors, may not be relied on as an indication of trading intent on behalf of any Fidelity fund.
Investment Summary (Unaudited)
Top Five Holdings as of October 31, 2016
| (by issuer, excluding cash equivalents) | % of fund's net assets | % of fund's net assets 6 months ago |
| Albertson's LLC | 2.3 | 2.6 |
| Community Health Systems, Inc. | 2.1 | 2.8 |
| Caesars Growth Properties Holdings, LLC | 1.7 | 1.7 |
| Valeant Pharmaceuticals International, Inc. | 1.5 | 1.5 |
| Kronos, Inc. | 1.3 | 0.6 |
| 8.9 |
Top Five Market Sectors as of October 31, 2016
| % of fund's net assets | % of fund's net assets 6 months ago | |
| Technology | 10.8 | 10.8 |
| Healthcare | 10.4 | 10.3 |
| Services | 7.4 | 6.4 |
| Telecommunications | 7.1 | 8.4 |
| Gaming | 6.5 | 6.5 |
Quality Diversification (% of fund's net assets)
| As of October 31, 2016 | ||
| BBB | 2.9% | |
| BB | 38.9% | |
| B | 40.1% | |
| CCC,CC,C | 6.0% | |
| Not Rated | 4.6% | |
| Equities | 0.4% | |
| Short-Term Investments and Net Other Assets | 7.1% | |

| As of April 30, 2016 | ||
| BBB | 4.8% | |
| BB | 41.1% | |
| B | 39.5% | |
| CCC,CC,C | 4.5% | |
| D | 0.8% | |
| Not Rated | 2.4% | |
| Equities | 0.4% | |
| Short-Term Investments and Net Other Assets | 6.5% | |

We have used ratings from Moody's Investors Service, Inc. Where Moody's® ratings are not available, we have used S&P® ratings. All ratings are as of the date indicated and do not reflect subsequent changes.
Asset Allocation (% of fund's net assets)
| As of October 31, 2016* | ||
| Bank Loan Obligations | 84.7% | |
| Nonconvertible Bonds | 7.8% | |
| Common Stocks | 0.4% | |
| Short-Term Investments and Net Other Assets (Liabilities) | 7.1% | |

* Foreign investments - 7.9%
| As of April 30, 2016* | ||
| Bank Loan Obligations | 84.3% | |
| Nonconvertible Bonds | 8.8% | |
| Common Stocks | 0.4% | |
| Short-Term Investments and Net Other Assets (Liabilities) | 6.5% | |

* Foreign investments - 10.9%
Investments October 31, 2016
Showing Percentage of Net Assets
| Bank Loan Obligations - 84.7%(a) | |||
| Principal Amount (000s) | Value (000s) | ||
| Aerospace - 1.0% | |||
| Gemini HDPE LLC Tranche B, term loan 4.75% 8/7/21 (b) | $9,227 | $9,296 | |
| TransDigm, Inc.: | |||
| Tranche C, term loan 3.8214% 2/28/20(b) | 56,625 | 56,537 | |
| Tranche F, term loan 3.75% 6/9/23 (b) | 29,925 | 29,794 | |
| TOTAL AEROSPACE | 95,627 | ||
| Automotive & Auto Parts - 0.6% | |||
| Chrysler Group LLC term loan 3.25% 12/31/18 (b) | 7,147 | 7,150 | |
| North American Lifting Holdings, Inc.: | |||
| Tranche 1LN, term loan 5.5% 11/27/20 (b) | 16,539 | 13,893 | |
| Tranche 2LN, term loan 10% 11/27/21 (b) | 24,370 | 15,109 | |
| Tower Automotive Holdings U.S.A. LLC term loan 4% 4/23/20 (b) | 17,272 | 17,228 | |
| TOTAL AUTOMOTIVE & AUTO PARTS | 53,380 | ||
| Broadcasting - 1.4% | |||
| CBS Radio, Inc. term loan 4.5% 10/17/23 (b) | 21,000 | 21,105 | |
| Clear Channel Communications, Inc. Tranche D, term loan 7.2843% 1/30/19 (b) | 51,970 | 39,261 | |
| Entercom Radio, LLC Tranche B, term loan 11/1/23 (c) | 6,000 | 6,030 | |
| ION Media Networks, Inc. Tranche B, term loan 4.75% 12/18/20 (b) | 14,337 | 14,391 | |
| Nielsen Finance LLC Tranche B 3LN, term loan 3.0311% 10/4/23 (b) | 12,000 | 12,047 | |
| Univision Communications, Inc. Tranche C 4LN, term loan 4% 3/1/20 (b) | 41,429 | 41,493 | |
| TOTAL BROADCASTING | 134,327 | ||
| Building Materials - 0.7% | |||
| GCP Applied Technologies, Inc. Tranche B, term loan 4.0877% 2/3/22 (b) | 1,990 | 2,001 | |
| HD Supply, Inc. Tranche B, term loan 3.63% 10/17/23 (b) | 8,250 | 8,255 | |
| HNC Holdings, Inc. Tranche B, term loan 5.5% 10/5/23 (b) | 9,725 | 9,733 | |
| Jeld-Wen, Inc. Tranche B, term loan 4.75% 7/1/22 (b) | 23,045 | 23,179 | |
| LBM Borrower LLC Tranche B 1LN, term loan 6.25% 8/20/22 (b) | 18,317 | 18,304 | |
| TOTAL BUILDING MATERIALS | 61,472 | ||
| Cable/Satellite TV - 3.9% | |||
| Altice U.S. Finance SA term loan 3.8818% 1/15/25 (b) | 30,500 | 30,584 | |
| Charter Communication Operating LLC Tranche I, term loan 3.5% 1/24/23 (b) | 54,695 | 55,006 | |
| Charter Communications Operating LLC: | |||
| Tranche E, term loan 3% 7/1/20 (b) | 47,729 | 47,807 | |
| Tranche F, term loan 3% 1/3/21 (b) | 75,591 | 75,685 | |
| CSC Holdings LLC Tranche B, term loan 3.8761% 10/11/24 (b) | 18,883 | 18,943 | |
| Liberty Cablevision of Puerto Rico Tranche 1LN, term loan 4.5% 1/7/22 (b) | 14,000 | 13,767 | |
| Numericable LLC: | |||
| Tranche B 1LN, term loan 4.5625% 7/20/22 (b) | 9,900 | 9,904 | |
| Tranche B 6LN, term loan 4.75% 2/10/23 (b) | 14,888 | 14,888 | |
| Tranche B, term loan 5.1373% 1/15/24 (b) | 34,228 | 34,510 | |
| Virgin Media Investment Holdings Ltd. Tranche B, term loan 3.5% 6/30/23 (b) | 8,863 | 8,897 | |
| WideOpenWest Finance LLC Tranche B, term loan 4.5% 8/19/23 (b) | 28,000 | 27,924 | |
| Ziggo B.V.: | |||
| Tranche B 1LN, term loan 3.5% 1/15/22 (b) | 14,405 | 14,393 | |
| Tranche B 2LN, term loan 3.5% 1/15/22 (b) | 8,537 | 8,530 | |
| Tranche B 3LN, term loan 3.7014% 1/15/22 (b) | 2,653 | 2,650 | |
| TOTAL CABLE/SATELLITE TV | 363,488 | ||
| Capital Goods - 0.7% | |||
| Doncasters PLC Tranche B 2LN, term loan 9.5% 10/9/20 (b) | 4,516 | 4,245 | |
| Onex Wizard U.S. Acquisition, Inc. Tranche B, term loan 4% 3/13/22 (b) | 31,377 | 31,391 | |
| SRAM LLC. Tranche B, term loan 4.0146% 4/10/20 (b) | 20,552 | 20,038 | |
| Wireco Worldgroup, Inc. Tranche B 1LN, term loan 6.5% 9/30/23 (b) | 6,500 | 6,533 | |
| TOTAL CAPITAL GOODS | 62,207 | ||
| Chemicals - 2.0% | |||
| Hilex Poly Co. LLC Tranche B 1LN, term loan 6% 12/5/21 (b) | 7,930 | 7,994 | |
| Ineos Styrolution U.S. Holding LLC Tranche B, term loan 4.75% 9/30/21 (b) | 10,265 | 10,342 | |
| Kraton Polymers LLC Tranche B, term loan 6% 1/6/22 (b) | 21,195 | 21,312 | |
| MacDermid, Inc.: | |||
| term loan 5% 6/7/23 (b) | 30,645 | 30,875 | |
| Tranche B 3LN, term loan 5.5% 6/7/20 (b) | 22,284 | 22,451 | |
| Royal Holdings, Inc.: | |||
| Tranche B 1LN, term loan 4.5% 6/19/22 (b) | 13,825 | 13,881 | |
| Tranche B 2LN, term loan 8.5% 6/19/23 (b) | 2,130 | 2,087 | |
| The Chemours Co. LLC Tranche B, term loan 3.75% 5/12/22 (b) | 15,606 | 15,403 | |
| Trinseo Materials Operating SCA/Trinseo Materials Finance, Inc. Tranche B 1LN, term loan 4.25% 11/5/21 (b) | 18,323 | 18,428 | |
| Tronox Pigments (Netherlands) B.V. Tranche B, term loan 4.5% 3/19/20 (b) | 11,645 | 11,584 | |
| U.S. Coatings Acquisition, Inc. Tranche B, term loan 3.75% 2/1/20 (b) | 14,467 | 14,567 | |
| Univar, Inc. Tranche B, term loan 4.25% 7/1/22 (b) | 14,004 | 14,021 | |
| TOTAL CHEMICALS | 182,945 | ||
| Consumer Products - 0.5% | |||
| Weight Watchers International, Inc. Tranche B 2LN, term loan 4.074% 4/2/20 (b) | 32,779 | 24,879 | |
| Wilsonart LLC Tranche B, term loan 4% 10/31/19 (b) | 17,746 | 17,740 | |
| TOTAL CONSUMER PRODUCTS | 42,619 | ||
| Containers - 2.3% | |||
| Anchor Glass Container Corp. Tranche B, term loan 4.75% 7/1/22 (b) | 2,746 | 2,771 | |
| Ardagh Holdings U.S.A., Inc. Tranche B, term loan 4% 12/17/21 (b) | 42,335 | 42,719 | |
| Berry Plastics Corp.: | |||
| Tranche G, term loan 3.5% 1/6/21 (b) | 8,592 | 8,595 | |
| Tranche H, term loan 3.75% 10/1/22 (b) | 17,569 | 17,623 | |
| Berry Plastics Group, Inc. term loan 3.5% 2/8/20 (b) | 75,350 | 75,433 | |
| BWAY Holding Co. Tranche B, term loan 5.5% 8/14/20 (b) | 13,897 | 13,981 | |
| Consolidated Container Co. Tranche B, term loan 5% 7/3/19 (b) | 13,034 | 12,947 | |
| Hostess Brands LLC Tranche B 1LN, term loan 4.5% 8/3/22 (b) | 11,999 | 12,078 | |
| Reynolds Group Holdings, Inc. Tranche B, term loan 4.25% 2/5/23 (b) | 26,980 | 27,040 | |
| TOTAL CONTAINERS | 213,187 | ||
| Diversified Financial Services - 2.9% | |||
| AlixPartners LLP term loan 4% 7/28/22 (b) | 23,923 | 23,961 | |
| Assuredpartners, Inc. Tranche B 1LN, term loan 5.75% 10/22/22 (b) | 31,393 | 31,519 | |
| Delos Finance SARL Tranche B LN, term loan 3.5877% 3/6/21 (b) | 33,095 | 33,281 | |
| Energy & Minerals Group Tranche B, term loan 4.75% 3/27/20 (b) | 5,254 | 5,162 | |
| Fly Funding II SARL Tranche B, term loan 3.54% 8/9/19 (b) | 13,019 | 13,044 | |
| Flying Fortress Holdings, Inc. Tranche B, term loan 3.5877% 4/30/20 (b) | 66,390 | 66,788 | |
| Fort Dearborn Holding Co., Inc. Tranche B, term loan 5% 10/19/23 (b) | 4,000 | 4,018 | |
| HarbourVest Partners LLC Tranche B, term loan 3.3811% 2/4/21 (b) | 11,377 | 11,377 | |
| IBC Capital U.S. LLC Tranche B 1LN, term loan 4.9847% 9/11/21 (b) | 24,625 | 24,215 | |
| TransUnion LLC Tranche B 2LN, term loan 3.5% 4/9/21 (b) | 37,360 | 37,453 | |
| UFC Holdings LLC: | |||
| Tranche 2LN, term loan 8.5% 8/18/24 (b) | 4,275 | 4,339 | |
| Tranche B 1LN, term loan 5% 8/18/23 (b) | 19,375 | 19,523 | |
| TOTAL DIVERSIFIED FINANCIAL SERVICES | 274,680 | ||
| Energy - 3.2% | |||
| Alon U.S.A. Partners LP term loan 9.25% 11/26/18 (b) | 8,556 | 8,534 | |
| California Resources Corp. Tranche 1LN, term loan 11.375% 12/31/21 (b) | 12,500 | 13,422 | |
| Chesapeake Energy Corp. Tranche 1LN, term loan 8.5% 8/23/21 (b) | 15,000 | 16,022 | |
| Chief Exploration & Development, LLC. Tranche 2LN, term loan 7.7528% 5/16/21 (b) | 3,000 | 2,867 | |
| Citgo Holding, Inc. Tranche B, term loan 9.5% 5/12/18 (b) | 13,647 | 13,793 | |
| Crestwood Holdings Partners LLC Tranche B, term loan 9% 6/19/19 (b) | 25,181 | 23,670 | |
| Drillships Ocean Ventures, Inc. Tranche B, term loan 5.5% 7/25/21 (b) | 16,089 | 11,406 | |
| Empire Generating Co. LLC: | |||
| Tranche B, term loan 5.25% 3/14/21 (b) | 32,039 | 29,315 | |
| Tranche C, term loan 5.25% 3/14/21 (b) | 2,549 | 2,332 | |
| Energy Transfer Equity LP Tranche C, term loan 4.0424% 12/2/19 (b) | 20,993 | 20,997 | |
| ExGen Renewables I, LLC Tranche B term loan 5.25% 2/6/21 (b) | 11,367 | 11,452 | |
| Expro Finservices SARL Tranche B, term loan 5.75% 9/2/21 (b) | 27,886 | 24,198 | |
| Gulf Finance LLC Tranche B 1LN, term loan 6.25% 8/25/23 (b) | 46,500 | 45,396 | |
| MRP Generation Holdings LLC Tranche B, term loan 8% 9/29/22 (b) | 15,000 | 14,231 | |
| Overseas Shipholding Group, Inc. Tranche B, term loan 5.25% 8/5/19 (b) | 13,089 | 12,975 | |
| Pacific Drilling SA Tranche B, term loan 4.5% 6/3/18 (b) | 13,810 | 3,884 | |
| Panda Temple Power, LLC term loan 7.25% 4/3/19 (b) | 10,918 | 9,990 | |
| Seadrill Operating LP Tranche B, term loan 4% 2/21/21 (b) | 43,636 | 24,245 | |
| Targa Resources Corp. term loan 5.75% 2/27/22 (b) | 5,581 | 5,588 | |
| Western Refining, Inc. Tranche B, term loan 5.25% 11/12/20 (b) | 7,402 | 7,383 | |
| TOTAL ENERGY | 301,700 | ||
| Entertainment/Film - 0.7% | |||
| AMC Entertainment Holdings, Inc. Tranche B, term loan 12/15/23 (c) | 7,690 | 7,709 | |
| AMC Entertainment, Inc. Tranche B, term loan 4% 12/15/22 (b) | 5,000 | 5,017 | |
| CDS U.S. Intermediate Holdings, Inc.: | |||
| Tranche B 1LN, term loan 5% 7/8/22 (b) | 11,453 | 11,460 | |
| Tranche B 2LN, term loan 9.25% 7/8/23 (b) | 5,305 | 5,119 | |
| Digital Cinema Implementation Partners, LLC Tranche B, term loan 3.3349% 5/17/21(b) | 13,034 | 13,058 | |
| Lions Gate Entertainment Corp. term loan 10/13/23 (c) | 23,000 | 22,962 | |
| TOTAL ENTERTAINMENT/FILM | 65,325 | ||
| Environmental - 0.7% | |||
| ADS Waste Holdings, Inc. Tranche B 2LN, term loan 3.75% 10/9/19 (b) | 15,470 | 15,474 | |
| The Brickman Group, Ltd.: | |||
| Tranche 2LN, term loan 7.5% 12/18/21 (b) | 5,690 | 5,670 | |
| Tranche B 1LN, term loan 4% 12/18/20 (b) | 29,569 | 29,504 | |
| WTG Holdings III Corp. Tranche B 1LN, term loan 4.75% 1/15/21 (b) | 13,848 | 13,882 | |
| TOTAL ENVIRONMENTAL | 64,530 | ||
| Food & Drug Retail - 3.2% | |||
| Albertson's LLC: | |||
| Tranche B 4LN, term loan 4.5% 8/25/21 (b) | 180,438 | 181,707 | |
| Tranche B 6LN, term loan 4.75% 6/22/23 (b) | 32,676 | 33,016 | |
| Candy Intermediate Holdings, Inc. Tranche B 1LN, term loan 5.5% 6/15/23 (b) | 9,975 | 10,044 | |
| GOBP Holdings, Inc. Tranche B 1LN, term loan 5% 10/21/21 (b) | 3,980 | 3,973 | |
| Petco Holdings, Inc. Tranche B 1LN, term loan 5% 1/26/23 (b) | 27,810 | 28,032 | |
| Pizza Hut Holdings LLC Tranche B, term loan 3.2857% 6/16/23 (b) | 24,938 | 25,187 | |
| RPI Finance Trust term loan 3.0346% 10/14/22 (b) | 10,305 | 10,393 | |
| Smart & Final, Inc. Tranche B, term loan 4.3046% 11/15/22 (b) | 5,500 | 5,483 | |
| SUPERVALU, Inc. Tranche B, term loan 5.5% 3/21/19 (b) | 3,343 | 3,350 | |
| TOTAL FOOD & DRUG RETAIL | 301,185 | ||
| Food/Beverage/Tobacco - 0.8% | |||
| AdvancePierre Foods, Inc. Tranche B 1LN, term loan 4.5% 6/2/23 (b) | 11,618 | 11,699 | |
| Chobani LLC Tranche B, term loan 5.25% 10/7/23 (b) | 16,000 | 16,170 | |
| Keurig Green Mountain, Inc. Tranche B, term loan 5.25% 3/3/23 (b) | 19,621 | 19,862 | |
| U.S. Foods, Inc. Tranche B, term loan 4% 6/27/23 (b) | 27,182 | 27,342 | |
| TOTAL FOOD/BEVERAGE/TOBACCO | 75,073 | ||
| Gaming - 6.4% | |||
| Aristocrat International Pty Ltd. Tranche B 1LN, term loan 3.6312% 10/20/21 (b) | 27,060 | 27,155 | |
| Boyd Gaming Corp.: | |||
| Tranche B 2LN, term loan 3.534% 9/15/23 (b) | 15,915 | 16,025 | |
| Tranche B, term loan 4% 8/14/20 (b) | 8,220 | 8,282 | |
| Caesars Entertainment Resort Properties LLC Tranche B 1LN, term loan 7% 10/11/20 (b) | 101,087 | 101,592 | |
| Caesars Growth Properties Holdings, LLC Tranche 1LN, term loan 6.25% 5/8/21 (b) | 161,126 | 160,857 | |
| CityCenter Holdings LLC Tranche B, term loan 4.25% 10/16/20 (b) | 15,337 | 15,417 | |
| Golden Nugget, Inc. Tranche B, term loan: | |||
| 4.5% 11/21/19 (b) | 35,129 | 35,502 | |
| 4.5% 11/21/19 (b) | 15,055 | 15,215 | |
| Las Vegas Sands LLC Tranche B, term loan 3.25% 12/19/20 (b) | 23,980 | 24,119 | |
| MGM Mirage, Inc. Tranche A, term loan 3.2843% 4/25/21 (b) | 14,405 | 14,333 | |
| Mohegan Tribal Gaming Authority Tranche B, term loan 5.5% 10/14/23 (b) | 15,000 | 14,939 | |
| Scientific Games Corp.: | |||
| Tranche B 2LN, term loan 6% 10/1/21 (b) | 40,617 | 40,770 | |
| Tranche B, term loan 6% 10/18/20 (b) | 73,665 | 74,057 | |
| Station Casinos LLC Tranche B, term loan 3.75% 6/8/23 (b) | 40,922 | 41,098 | |
| Yonkers Racing Corp. Tranche B 1LN, term loan 4.25% 8/20/19 (b) | 12,715 | 12,699 | |
| TOTAL GAMING | 602,060 | ||
| Healthcare - 9.6% | |||
| Alere, Inc. Tranche B, term loan 4.25% 6/18/22 (b) | 11,128 | 11,080 | |
| Alvogen Pharma U.S., Inc. Tranche B 1LN, term loan 6% 4/2/22 (b) | 15,804 | 15,804 | |
| AmSurg Corp. Tranche B, term loan 3.5% 7/16/21 (b) | 15,858 | 15,851 | |
| Avantor Performance Materials Holdings, Inc. Tranche B 1LN, term loan 6% 6/21/22 (b) | 19,930 | 20,055 | |
| Community Health Systems, Inc.: | |||
| Tranche F, term loan 4.0834% 12/31/18 (b) | 40,399 | 39,389 | |
| Tranche G, term loan 3.75% 12/31/19 (b) | 56,322 | 53,207 | |
| Tranche H, term loan 4% 1/27/21 (b) | 98,426 | 92,840 | |
| DaVita HealthCare Partners, Inc. Tranche B, term loan 3.5% 6/24/21 (b) | 47,104 | 47,059 | |
| DJO Finance LLC Tranche B 1LN, term loan 4.25% 6/7/20 (b) | 19,721 | 19,499 | |
| Drumm Investors LLC Tranche B, term loan 9.5% 5/4/18 (b) | 12,621 | 12,582 | |
| Emergency Medical Services Corp. Tranche B, term loan 4.25% 5/25/18 (b) | 21,049 | 21,068 | |
| Endo Pharmaceuticals, Inc. Tranche B, term loan 3.75% 9/25/22 (b) | 32,708 | 32,655 | |
| Gold Merger Co., Inc. Tranche B, term loan 4.75% 7/27/23 (b) | 6,735 | 6,774 | |
| Grifols, S.A. Tranche B, term loan 3.4559% 2/27/21 (b) | 31,962 | 32,216 | |
| HCA Holdings, Inc.: | |||
| Tranche B 6LN, term loan 3.7843% 3/18/23 (b) | 60,232 | 60,842 | |
| Tranche B 7LN, term loan 3.5877% 2/15/24 (b) | 20,000 | 20,169 | |
| HCR Healthcare LLC Tranche B, term loan 5% 4/6/18 (b) | 7,329 | 6,425 | |
| Horizon Pharmaceuticals, Inc. term loan 5/7/21 (c) | 13,500 | 13,517 | |
| InVentiv Health, Inc. Tranche B, term loan 9/29/23 (c) | 21,000 | 20,989 | |
| Jaguar Holding Co. II/Pharmaceutical Product Development LLC Tranche B, term loan 4.25% 8/18/22 (b) | 6,101 | 6,091 | |
| Kindred Healthcare, Inc. Tranche B, term loan 4.25% 4/9/21 (b) | 4,975 | 4,970 | |
| Milk Specialties Co. Tranche B, term loan 6% 8/16/23 (b) | 12,165 | 12,256 | |
| MPH Acquisition Holdings LLC Tranche B, term loan 5% 6/7/23 (b) | 19,135 | 19,333 | |
| Onex Schumacher Finance LP Tranche B 1LN, term loan 5% 7/31/22 (b) | 3,482 | 3,494 | |
| Ortho-Clinical Diagnostics, Inc. Tranche B, term loan 4.75% 6/30/21 (b) | 42,013 | 40,997 | |
| Patheon, Inc. Tranche B, term loan 4.25% 3/11/21 (b) | 13,764 | 13,769 | |
| Precyse Acquisition Corp. Tranche B, term loan 6.5% 10/20/22 (b) | 9,975 | 10,037 | |
| Press Ganey Holdings, Inc.: | |||
| Tranche 2LN, term loan 10/21/24 (c) | 5,000 | 5,063 | |
| Tranche B 1LN, term loan 4.25% 10/21/23 (b) | 15,500 | 15,500 | |
| U.S. Renal Care, Inc.: | |||
| Tranche 2LN, term loan 9% 12/31/23 (b) | 5,000 | 4,775 | |
| Tranche B 1LN, term loan 5.25% 12/31/22 (b) | 46,651 | 44,625 | |
| Valeant Pharmaceuticals International, Inc.: | |||
| Tranche A 3LN, term loan 4.29% 10/20/18 (b) | 3,008 | 2,999 | |
| Tranche B, term loan 5.5% 4/1/22 (b) | 66,430 | 66,181 | |
| Tranche BC 2LN, term loan 5.25% 12/11/19 (b) | 25,638 | 25,579 | |
| Tranche BD 2LN, term loan 5% 2/13/19 (b) | 36,462 | 36,345 | |
| Tranche E, term loan 5.25% 8/5/20 (b) | 13,577 | 13,521 | |
| Vizient, Inc. term loan 5% 2/11/23 (b) | 26,396 | 26,668 | |
| TOTAL HEALTHCARE | 894,224 | ||
| Homebuilders/Real Estate - 1.5% | |||
| Americold Realty Operating Partnership LP Tranche B, term loan 5.75% 12/1/22 (b) | 12,464 | 12,594 | |
| Communications Sales & Leasing, Inc. Tranche B, term loan 4.5% 10/24/22 (b) | 21,619 | 21,689 | |
| DTZ U.S. Borrower LLC Tranche B 1LN, term loan 4.25% 11/4/21 (b) | 29,700 | 29,613 | |
| MGM Growth Properties Operating Partner LP Tranche B, term loan 3.5% 4/25/23 (b) | 30,184 | 30,241 | |
| Realogy Group LLC Tranche B, term loan 3.75% 7/20/22 (b) | 42,959 | 43,290 | |
| TOTAL HOMEBUILDERS/REAL ESTATE | 137,427 | ||
| Hotels - 2.0% | |||
| ESH Hospitality, Inc. Tranche B, term loan 8/30/23 (c) | 17,000 | 17,087 | |
| Four Seasons Holdings, Inc.: | |||
| Tranche 2LN, term loan 6.25% 12/27/20 (b) | 16,755 | 16,870 | |
| Tranche B 1LN, term loan 3.5877% 6/27/20 (b) | 50,417 | 50,621 | |
| Hilton Worldwide Finance LLC: | |||
| Tranche B 2LN, term loan 3.034% 10/25/23 (b) | 31,809 | 31,957 | |
| Tranche B, term loan 3.5% 10/25/20 (b) | 39,374 | 39,522 | |
| La Quinta Intermediate Holdings LLC Tranche B LN, term loan 3.75% 4/14/21 (b) | 19,447 | 19,393 | |
| Playa Resorts Holding BV Tranche B, term loan 4% 8/9/19 (b) | 13,558 | 13,524 | |
| TOTAL HOTELS | 188,974 | ||
| Insurance - 1.8% | |||
| Alliant Holdings Intermediate LLC Tranche B, term loan 4.7528% 8/14/22 (b) | 23,095 | 23,081 | |
| Asurion LLC: | |||
| Tranche B 1LN, term loan 5% 5/24/19 (b) | 23,207 | 23,211 | |
| Tranche B 2LN, term loan 4.3377% 7/8/20 (b) | 7,422 | 7,425 | |
| Tranche B 2LN, term loan 8.5% 3/3/21 (b) | 13,303 | 13,397 | |
| Tranche B 4LN, term loan 5% 8/4/22 (b) | 39,040 | 39,211 | |
| Tranche B 5LN, term loan 11/3/23 (c) | 17,840 | 17,840 | |
| HUB International Ltd. Tranche B 1LN, term loan 4% 10/2/20 (b) | 17,634 | 17,622 | |
| Lonestar Intermediate Super Holdings LLC term loan 10% 8/31/21 pay-in-kind (b) | 13,500 | 13,590 | |
| VF Holdings Corp. Tranche B 1LN, term loan 4.75% 6/30/23 (b) | 15,000 | 15,045 | |
| TOTAL INSURANCE | 170,422 | ||
| Leisure - 0.9% | |||
| 24 Hour Fitness Worldwide, Inc. Tranche B, term loan 4.75% 5/30/21 (b) | 28,076 | 27,409 | |
| ClubCorp Club Operations, Inc. Tranche B, term loan 4% 12/15/22 (b) | 10,000 | 10,046 | |
| Fitness International LLC Tranche B, term loan 6% 7/1/20 (b) | 11,000 | 11,008 | |
| LTF Merger Sub, Inc. Tranche B, term loan 4.25% 6/10/22 (b) | 31,927 | 31,902 | |
| Planet Fitness Holdings, LLC. Tranche B, term loan 4.5% 3/31/21 (b) | 2,296 | 2,296 | |
| TOTAL LEISURE | 82,661 | ||
| Metals/Mining - 1.8% | |||
| American Rock Salt Co. LLC Tranche B 1LN, term loan 4.75% 5/20/21 (b) | 8,701 | 8,412 | |
| Ameriforge Group, Inc.: | |||
| Tranche B 1LN, term loan 5% 12/19/19 (b) | 7,368 | 3,850 | |
| Tranche B 2LN, term loan 8.75% 12/19/20 (b) | 3,000 | 400 | |
| Doncasters Group, LLC Tranche B 1LN, term loan 4.5% 4/9/20 (b) | 19,634 | 19,438 | |
| Fortescue Metals Group Ltd. Tranche B, term loan 3.75% 6/30/19 (b) | 19,148 | 19,130 | |
| Murray Energy Corp. Tranche B 2LN, term loan 8.25% 4/16/20 (b) | 90,349 | 82,584 | |
| Oxbow Carbon LLC: | |||
| Tranche 2LN, term loan 8% 1/19/20 (b) | 19,130 | 18,652 | |
| Tranche B 1LN, term loan 4.25% 7/19/19 (b) | 1,359 | 1,361 | |
| Peabody Energy Corp. Tranche B, term loan 0% 9/24/20 (d) | 19,086 | 16,803 | |
| Walter Energy, Inc. Tranche B, term loan 0% 4/1/18 (d) | 32,780 | 0 | |
| TOTAL METALS/MINING | 170,630 | ||
| Publishing/Printing - 2.5% | |||
| Cengage Learning, Inc. Tranche B, term loan 5.25% 6/7/23 (b) | 48,753 | 47,605 | |
| Getty Images, Inc. Tranche B, term loan 4.75% 10/18/19 (b) | 51,923 | 43,989 | |
| Harland Clarke Holdings Corp.: | |||
| Tranche B 4LN, term loan 6.993% 8/4/19 (b) | 5,270 | 5,227 | |
| Tranche B 5LN, term loan 7% 12/31/19 (b) | 14,192 | 14,091 | |
| Houghton Mifflin Harcourt Publishing, Inc. Tranche B, term loan 4% 5/29/21 (b) | 26,266 | 25,954 | |
| JD Power & Associates Tranche B 1LN, term loan 5.25% 9/7/23 (b) | 6,180 | 6,219 | |
| McGraw-Hill Global Education Holdings, LLC term loan 5% 5/4/22 (b) | 49,381 | 49,247 | |
| Merrill Communications LLC Tranche B, term loan 6.25% 6/1/22 (b) | 16,397 | 15,413 | |
| Proquest LLC Tranche B, term loan 5.75% 10/24/21 (b) | 6,929 | 6,921 | |
| Springer Science+Business Media Deutschland GmbH Tranche B 9LN, term loan 4.75% 8/14/20 (b) | 14,427 | 14,084 | |
| TOTAL PUBLISHING/PRINTING | 228,750 | ||
| Restaurants - 1.1% | |||
| Burger King Worldwide, Inc. Tranche B, term loan 3.75% 12/12/21 (b) | 18,736 | 18,814 | |
| CEC Entertainment, Inc. Tranche B, term loan 4% 2/14/21 (b) | 3,760 | 3,709 | |
| Focus Brands, Inc. term loan 5% 10/5/23 (b) | 10,500 | 10,609 | |
| Landry's Acquisition Co. Tranche B 1LN, term loan 4% 10/4/23 (b) | 52,000 | 52,282 | |
| Red Lobster Hospitality LLC Tranche B, term loan 6.25% 7/28/21 (b) | 20,312 | 20,388 | |
| TOTAL RESTAURANTS | 105,802 | ||
| Services - 7.1% | |||
| Abacus Innovations Corp. Tranche B, term loan 3.2843% 8/16/23 (b) | 15,250 | 15,354 | |
| Acosta, Inc. Tranche B, term loan 4.25% 9/26/21 (b) | 27,038 | 25,984 | |
| Ancestry.Com Operations, Inc.: | |||
| Tranche 2LN, term loan 9.25% 10/19/24 (b) | 8,500 | 8,606 | |
| Tranche B 1LN, term loan 5.25% 10/19/23 (b) | 32,500 | 32,551 | |
| Apollo Security Service Borrower LLC Tranche B 1LN, term loan 4.75% 5/2/22 (b) | 77,720 | 78,261 | |
| ARAMARK Corp. Tranche F, term loan 3.3377% 2/24/21 (b) | 48,449 | 48,692 | |
| Avis Budget Group, Inc. Tranche B, term loan 3.09% 3/15/19 (b) | 3,563 | 3,560 | |
| Brand Energy & Infrastructure Services, Inc. Tranche B, term loan 4.75% 11/26/20 (b) | 25,621 | 25,264 | |
| Bright Horizons Family Solutions, Inc. Tranche B, term loan 5.25% 1/30/20 (b) | 9,620 | 9,655 | |
| Cactus Wellhead LLC Tranche B, term loan 7% 7/31/20 (b) | 22,995 | 20,293 | |
| Coinmach Service Corp. Tranche B, term loan 4.25% 11/14/19 (b) | 36,456 | 36,237 | |
| Garda World Security Corp.: | |||
| term loan 4% 11/8/20 (b) | 2,583 | 2,550 | |
| Tranche DD, term loan 4.0039% 11/8/20 (b) | 449 | 443 | |
| GCA Services Group, Inc. Tranche B 1LN, term loan 5.8721% 3/1/23 (b) | 9,950 | 10,028 | |
| KAR Auction Services, Inc. Tranche B 3LN, term loan 4.375% 3/9/23 (b) | 16,124 | 16,290 | |
| Karman Buyer Corp.: | |||
| Tranche 1LN, term loan 4.25% 7/25/21 (b) | 21,388 | 21,165 | |
| Tranche 2LN, term loan 7.5% 7/25/22 (b) | 7,490 | 7,064 | |
| KC Mergersub, Inc. Tranche L 2LN, term loan 10.25% 8/13/23 (b) | 3,000 | 2,925 | |
| Kuehg Corp. Tranche B 1LN, term loan 5.25% 8/13/22 (b) | 14,850 | 14,850 | |
| Laureate Education, Inc. Tranche B, term loan 8.8679% 3/17/21 (b) | 118,274 | 117,239 | |
| Lineage Logistics Holdings, LLC. Tranche B, term loan 4.5% 4/7/21 (b) | 42,440 | 41,591 | |
| Nexeo Solutions LLC Tranche B, term loan 5.25% 6/9/23 (b) | 6,673 | 6,715 | |
| Nord Anglia Education Tranche B, term loan 5% 3/31/21 (b) | 34,487 | 34,595 | |
| Outerwall, Inc.: | |||
| Tranche 2LN, term loan 9.75% 9/27/24 (b) | 2,500 | 2,481 | |
| Tranche B 1LN, term loan 5.25% 9/27/23 (b) | 7,000 | 7,064 | |
| Science Applications International Corp. Tranche B, term loan 3.25% 5/4/22 (b) | 6,226 | 6,265 | |
| The ServiceMaster Co. Tranche B, term loan 4.25% 7/1/21 (b) | 34,812 | 34,834 | |
| Thomson Reuters IP&S Tranche B 1LN, term loan 4.75% 10/3/23 (b) | 26,965 | 26,987 | |
| Wash Multifamily Acquisition, Inc. Tranche B 1LN, term loan 4.25% 5/14/22 (b) | 3,449 | 3,444 | |
| TOTAL SERVICES | 660,987 | ||
| Steel - 0.2% | |||
| JMC Steel Group, Inc. Tranche B, term loan 6% 6/14/21 (b) | 17,478 | 17,587 | |
| Super Retail - 4.3% | |||
| Academy Ltd. Tranche B, term loan 5% 7/2/22 (b) | 30,666 | 29,717 | |
| Bass Pro Group LLC Tranche B, term loan 4% 6/5/20 (b) | 3,960 | 3,957 | |
| BJ's Wholesale Club, Inc.: | |||
| Tranche 2LN, term loan 8.5% 3/31/20 (b) | 12,218 | 12,249 | |
| Tranche B 1LN, term loan 4.5% 9/26/19 (b) | 32,906 | 32,937 | |
| Davids Bridal, Inc. Tranche B, term loan 5% 10/11/19 (b) | 9,547 | 8,879 | |
| Dollar Tree, Inc. Tranche B 3LN, term loan 3.0625% 7/6/22 (b) | 5,971 | 6,023 | |
| General Nutrition Centers, Inc. Tranche B, term loan 3.25% 3/4/19 (b) | 27,104 | 26,460 | |
| Harbor Freight Tools U.S.A., Inc. Tranche B, term loan 4.1373% 8/19/23 (b) | 22,943 | 23,093 | |
| J. Crew Group, Inc. Tranche B, term loan 4% 3/5/21 (b) | 36,034 | 27,426 | |
| JC Penney Corp., Inc. Tranche B, term loan 5.25% 6/23/23 (b) | 90,550 | 91,071 | |
| Party City Holdings, Inc. term loan 4.2037% 8/19/22 (b) | 28,572 | 28,647 | |
| PetSmart, Inc. term loan 4% 3/11/22 (b) | 55,294 | 55,402 | |
| Sears Holdings Corp. Tranche ABL, term loan 5.5% 6/30/18 (b) | 58,540 | 57,252 | |
| Sports Authority, Inc. Tranche B, term loan 0% 11/16/17 (b)(d) | 5,664 | 1,152 | |
| TOTAL SUPER RETAIL | 404,265 | ||
| Technology - 9.8% | |||
| Applied Systems, Inc.: | |||
| Tranche B 1LN, term loan 4% 1/23/21 (b) | 9,078 | 9,091 | |
| Tranche B 2LN, term loan 7.5% 1/23/22 (b) | 3,590 | 3,612 | |
| Avago Technologies Cayman Finance Ltd. Tranche B 3LN, term loan 3.5346% 2/1/23 (b) | 27,358 | 27,628 | |
| BMC Software Finance, Inc. Tranche B, term loan: | |||
| 5% 9/10/20 (b) | 6,125 | 6,040 | |
| 5% 9/10/20 (b) | 10,306 | 10,142 | |
| Cavium, Inc. Tranche B, term loan 3.75% 8/16/22 (b) | 12,805 | 12,837 | |
| Ceridian HCM Holding, Inc. Tranche B 2LN, term loan 4.5% 9/15/20 (b) | 14,059 | 13,778 | |
| Computer Discount Warehouse (CDW) LLC Tranche B, term loan 3% 8/17/23 (b) | 31,544 | 31,673 | |
| Compuware Corp.: | |||
| term loan 9.25% 12/12/22 (b) | 7,270 | 7,034 | |
| Tranche B 2LN, term loan 6.25% 12/15/21 (b) | 14,737 | 14,730 | |
| Dell International LLC Tranche B, term loan 4% 9/7/23 (b) | 35,500 | 35,742 | |
| EIG Investors Corp. Tranche B 1LN, term loan 6% 2/9/23 (b) | 38,088 | 35,708 | |
| Epicor Software Corp. Tranche B, term loan 4.75% 6/1/22 (b) | 29,890 | 29,526 | |
| First Data Corp.: | |||
| term loan 3.524% 3/24/21 (b) | 1,954 | 1,962 | |
| Tranche B, term loan 4.274% 7/10/22 (b) | 85,000 | 85,585 | |
| Generac Power Systems, Inc. Tranche B, term loan 3.5956% 5/31/20 (b) | 25,401 | 25,417 | |
| Global Payments, Inc. Tranche B, term loan 3.0244% 4/22/23 | 9,942 | 9,979 | |
| Infor U.S., Inc.: | |||
| Tranche B 3LN, term loan 3.75% 6/3/20 (b) | 7,317 | 7,298 | |
| Tranche B 5LN, term loan 3.75% 6/3/20 (b) | 22,305 | 22,234 | |
| Kronos, Inc.: | |||
| term loan: | |||
| 10/20/23 (c) | 40,000 | 40,159 | |
| 10/20/24 (c) | 30,000 | 30,896 | |
| Tranche 2LN, term loan 9.75% 4/30/20 (b) | 28,837 | 29,170 | |
| Tranche B 1LN, term loan 4.5% 10/30/19 (b) | 31,559 | 31,678 | |
| Lux FinCo U.S. SPV: | |||
| Tranche 2LN, term loan 9.5% 10/16/23 (b) | 6,000 | 5,985 | |
| Tranche B 1LN, term loan 5% 10/16/22 (b) | 9,925 | 9,925 | |
| Micron Technology, Inc. Tranche B, term loan 4.29% 4/26/22 (b) | 10,224 | 10,282 | |
| Microsemi Corp. Tranche B, term loan 3.75% 1/15/23 (b) | 11,113 | 11,202 | |
| NXP BV/NXP Funding LLC Tranche F, term loan 3.4052% 12/7/20 (b) | 18,662 | 18,719 | |
| Quest Software U.S. Holdings, Inc. Tranche B, term loan 9/27/22 (c) | 21,000 | 20,984 | |
| Rackspace Hosting, Inc. term loan 10/26/23 (c) | 45,745 | 45,988 | |
| Renaissance Learning, Inc.: | |||
| Tranche 1LN, term loan 4.5% 4/9/21 (b) | 15,599 | 15,547 | |
| Tranche 2LN, term loan 8% 4/9/22 (b) | 19,080 | 18,714 | |
| SolarWinds Holdings, Inc. Tranche B, term loan 5.5% 2/5/23 (b) | 10,474 | 10,521 | |
| Solera LLC Tranche B, term loan 5.75% 3/3/23 (b) | 20,442 | 20,656 | |
| Sophia L.P. Tranche B, term loan 4.75% 9/30/22 (b) | 26,698 | 26,723 | |
| SS&C Technologies, Inc.: | |||
| Tranche B 1LN, term loan 4% 7/8/22 (b) | 16,386 | 16,504 | |
| Tranche B 2LN, term loan 4% 7/8/22 (b) | 1,994 | 2,009 | |
| Sybil Software LLC. Tranche B, term loan 5% 9/30/22 (b) | 33,720 | 34,023 | |
| Syniverse Holdings, Inc. Tranche B, term loan: | |||
| 4% 4/23/19 (b) | 16,127 | 14,827 | |
| 4% 4/23/19 (b) | 9,380 | 8,629 | |
| TTM Technologies, Inc. Tranche B 1LN, term loan 5.25% 5/31/21 (b) | 32,724 | 32,806 | |
| Uber Technologies, Inc. Tranche B, term loan 5% 7/13/23 (b) | 30,500 | 30,710 | |
| Vantiv LLC Tranche B, term loan 3.25% 10/14/23 (b) | 12,816 | 12,893 | |
| Western Digital Corp. Tranche B 1LN, term loan 4.5% 4/29/23 (b) | 7,411 | 7,491 | |
| WEX, Inc. Tranche B, term loan 4.25% 7/1/23 (b) | 19,950 | 20,162 | |
| TOTAL TECHNOLOGY | 917,219 | ||
| Telecommunications - 5.5% | |||
| Digicel International Finance Ltd.: | |||
| Tranche D 1LN, term loan 4.375% 3/31/17 (b) | 1,499 | 1,424 | |
| Tranche D 2LN, term loan 4.3377% 3/31/19 (b) | 30,062 | 28,558 | |
| DigitalGlobe, Inc. Tranche B, term loan 4.75% 1/31/20 (b) | 7,183 | 7,237 | |
| FairPoint Communications, Inc. Tranche B, term loan 7.5% 2/14/19 (b) | 9,942 | 9,956 | |
| FPL FiberNet, LLC. Tranche A, term loan 4.1003% 7/22/19 (b) | 12,179 | 12,088 | |
| Integra Telecom Holdings, Inc. Tranche B 1LN, term loan 5.25% 8/14/20 (b) | 24,625 | 24,487 | |
| Intelsat Jackson Holdings SA Tranche B 2LN, term loan 3.75% 6/30/19 (b) | 113,055 | 107,980 | |
| Level 3 Financing, Inc.: | |||
| Tranche B 2LN, term loan 3.5% 5/31/22 (b) | 18,400 | 18,469 | |
| Tranche B 4LN, term loan 4% 1/15/20 (b) | 54,000 | 54,243 | |
| LTS Buyer LLC: | |||
| Tranche 2LN, term loan 8% 4/12/21 (b) | 3,868 | 3,870 | |
| Tranche B 1LN, term loan 4.0877% 4/11/20 (b) | 43,910 | 43,954 | |
| Mitel U.S. Holdings, Inc. Tranche B, term loan 5.5% 4/29/22 (b) | 16,674 | 16,806 | |
| Polycom, Inc. Tranche B, term loan 7.5% 9/27/23 (b) | 20,000 | 19,475 | |
| RP Crown Parent, LLC Tranche B, term loan 4.5% 10/12/23 (b) | 28,500 | 28,480 | |
| Sable International Finance Ltd.: | |||
| Tranche B 1LN, term loan 5.5877% 12/31/22 (b) | 3,575 | 3,608 | |
| Tranche B 2LN, term loan 5.83% 12/31/22 (b) | 2,925 | 2,952 | |
| SBA Senior Finance II, LLC term loan 3.34% 3/24/21 (b) | 26,294 | 26,313 | |
| Securus Technologies Holdings, Inc.: | |||
| Tranche 2LN, term loan 9% 4/30/21 (b) | 7,775 | 7,462 | |
| Tranche B 1LN, term loan 4.75% 4/30/20 (b) | 33,753 | 33,078 | |
| Securus Technologies, Inc. Tranche B2 1LN, term loan 5.25% 4/30/20 (b) | 4,520 | 4,429 | |
| T-Mobile U.S.A., Inc. Tranche B, term loan 3.5% 11/9/22 (b) | 17,257 | 17,380 | |
| TCH-2 Holdings, LLC. Tranche B 1LN, term loan 5.5% 5/12/21 (b) | 7,798 | 7,798 | |
| Telenet Financing USD LLC term loan 4.3566% 6/30/24 (b) | 9,915 | 9,917 | |
| Telesat Holding, Inc. Tranche B, term loan 3.5% 3/28/19 (b) | 16,243 | 16,243 | |
| Xplornet Communications, Inc. Tranche B, term loan 7% 9/9/21 (b) | 3,000 | 3,023 | |
| Zayo Group LLC/Zayo Capital, Inc. Tranche B, term loan 3.75% 5/6/21 (b) | 6,030 | 6,058 | |
| TOTAL TELECOMMUNICATIONS | 515,288 | ||
| Textiles/Apparel - 0.1% | |||
| ABB Optical Group LLC Tranche B, term loan 6.0041% 6/15/23 (b) | 10,335 | 10,361 | |
| Transportation Ex Air/Rail - 0.2% | |||
| American Commercial Barge Line Tranche B 1LN, term loan 9.75% 11/12/20 (b) | 19,729 | 19,063 | |
| YRC Worldwide, Inc. Tranche B, term loan 8% 2/13/19 (b) | 4,408 | 4,151 | |
| TOTAL TRANSPORTATION EX AIR/RAIL | 23,214 | ||
| Utilities - 5.3% | |||
| Alinta Energy Finance Pty. Ltd. Tranche B, term loan: | |||
| 6.375% 8/13/18 (b) | 2,127 | 2,120 | |
| 6.375% 8/13/19 (b) | 31,997 | 31,901 | |
| APLP Holdings LP Tranche B, term loan 6% 4/13/23 (b) | 23,388 | 23,739 | |
| Calpine Construction Finance Co. LP: | |||
| Tranche B 1LN, term loan 3.09% 5/3/20 (b) | 61,182 | 60,723 | |
| Tranche B 2LN, term loan 3.34% 1/31/22 (b) | 7,064 | 7,024 | |
| Calpine Corp. Tranche B 5LN, term loan 3.59% 5/28/22 (b) | 32,291 | 32,328 | |
| Cortes NP Acquisition Corp. Tranche B, term loan 9/30/23 (c) | 30,305 | 30,116 | |
| Dynegy Finance IV, Inc. Tranche C, term loan 5% 6/27/23 (b) | 56,000 | 56,140 | |
| Dynegy, Inc. Tranche B 2LN, term loan 4% 4/23/20 (b) | 13,484 | 13,486 | |
| Energy Future Holdings Corp. term loan 4.25% 6/30/17 (b) | 65,924 | 66,295 | |
| Essential Power LLC Tranche B, term loan 4.75% 8/8/19 (b) | 12,931 | 12,963 | |
| Exgen Texas Power LLC Tranche B, term loan 5.75% 9/18/21 (b) | 26,451 | 21,178 | |
| Houston Fuel Oil Terminal Co. Tranche B, term loan 4.25% 8/19/21 (b) | 27,098 | 26,624 | |
| InterGen NV Tranche B, term loan 5.5% 6/13/20 (b) | 32,815 | 31,010 | |
| Moxie Patriot LLC Tranche B, term loan 6.75% 12/19/20 (b) | 18,856 | 18,408 | |
| Southcross Energy Partners LP Tranche B, term loan 5.25% 8/4/21 (b) | 5,784 | 4,656 | |
| Southcross Holdings Borrower LP Tranche B, term loan 9% 4/13/23 | 2,650 | 2,213 | |
| Tex Operations Co. LLC: | |||
| Tranche B, term loan 5% 8/4/23 (b) | 41,121 | 41,481 | |
| Tranche C, term loan 5% 8/4/23 (b) | 9,379 | 9,461 | |
| TOTAL UTILITIES | 491,866 | ||
| TOTAL BANK LOAN OBLIGATIONS | |||
| (Cost $7,959,921) | 7,913,482 | ||
| Nonconvertible Bonds - 7.8% | |||
| Broadcasting - 0.3% | |||
| AMC Networks, Inc. 4.75% 12/15/22 | 6,600 | 6,732 | |
| Clear Channel Communications, Inc. 9% 12/15/19 | 8,677 | 6,584 | |
| Starz LLC/Starz Finance Corp. 5% 9/15/19 | 9,000 | 9,113 | |
| Univision Communications, Inc. 6.75% 9/15/22 (e) | 5,368 | 5,657 | |
| TOTAL BROADCASTING | 28,086 | ||
| Building Materials - 0.1% | |||
| CEMEX S.A.B. de CV 5.63% 10/15/18 (b)(e) | 10,000 | 10,400 | |
| Cable/Satellite TV - 0.5% | |||
| CCO Holdings LLC/CCO Holdings Capital Corp.: | |||
| 5.125% 2/15/23 | 17,065 | 17,662 | |
| 5.25% 3/15/21 | 13,070 | 13,593 | |
| Cequel Communications Escrow I LLC/Cequel Communications Escrow Capital Corp. 6.375% 9/15/20 (e) | 10,815 | 11,139 | |
| Lynx I Corp. 5.375% 4/15/21 (e) | 4,500 | 4,646 | |
| Virgin Media Finance PLC 4.875% 2/15/22 | 2,000 | 1,721 | |
| TOTAL CABLE/SATELLITE TV | 48,761 | ||
| Capital Goods - 0.0% | |||
| Shale-Inland Holdings LLC/Shale-Inland Finance Corp. 8.75% 11/15/19 (e) | 3,000 | 1,793 | |
| Chemicals - 0.1% | |||
| Nufarm Australia Ltd. 6.375% 10/15/19 (e) | 5,000 | 5,100 | |
| Containers - 1.0% | |||
| Ardagh Packaging Finance PLC/Ardagh MP Holdings U.S.A., Inc.: | |||
| 3.8503% 12/15/19 (b)(e) | 42,330 | 43,018 | |
| 4.067% 5/15/21 (b)(e) | 7,000 | 7,140 | |
| Reynolds Group Issuer, Inc./Reynolds Group Issuer LLC/Reynolds Group Issuer (Luxembourg) SA: | |||
| 4.38% 7/15/21 (b)(e) | 11,130 | 11,353 | |
| 5.75% 10/15/20 | 33,325 | 34,201 | |
| TOTAL CONTAINERS | 95,712 | ||
| Diversified Financial Services - 0.7% | |||
| CIT Group, Inc. 5% 5/15/17 | 7,000 | 7,088 | |
| Icahn Enterprises LP/Icahn Enterprises Finance Corp.: | |||
| 3.5% 3/15/17 | 18,720 | 18,720 | |
| 4.875% 3/15/19 | 15,000 | 14,905 | |
| International Lease Finance Corp.: | |||
| 3.875% 4/15/18 | 7,000 | 7,158 | |
| 6.25% 5/15/19 | 10,000 | 10,813 | |
| Prime Securities Services Borrower LLC/Prime Finance, Inc. 9.25% 5/15/23 (e) | 10,000 | 10,625 | |
| TOTAL DIVERSIFIED FINANCIAL SERVICES | 69,309 | ||
| Energy - 0.6% | |||
| American Energy-Permian Basin LLC/AEPB Finance Corp. 7.2591% 8/1/19 (b)(e) | 7,340 | 5,377 | |
| Cheniere Corpus Christi Holdings LLC 7% 6/30/24 (e) | 7,000 | 7,420 | |
| Chesapeake Energy Corp. 8% 12/15/22 (e) | 17,832 | 18,088 | |
| Citgo Petroleum Corp. 6.25% 8/15/22 (e) | 10,000 | 10,225 | |
| Targa Resources Partners LP/Targa Resources Partners Finance Corp. 6.375% 8/1/22 | 4,492 | 4,627 | |
| Western Refining, Inc. 6.25% 4/1/21 | 5,305 | 5,345 | |
| TOTAL ENERGY | 51,082 | ||
| Entertainment/Film - 0.0% | |||
| Cinemark U.S.A., Inc. 5.125% 12/15/22 | 3,185 | 3,273 | |
| Food/Beverage/Tobacco - 0.0% | |||
| ESAL GmbH 6.25% 2/5/23 (e) | 4,000 | 3,850 | |
| Gaming - 0.1% | |||
| MCE Finance Ltd. 5% 2/15/21 (e) | 10,000 | 9,999 | |
| Healthcare - 0.8% | |||
| Community Health Systems, Inc. 5.125% 8/15/18 | 10,755 | 10,661 | |
| DaVita HealthCare Partners, Inc. 5.75% 8/15/22 | 8,235 | 8,441 | |
| HCA Holdings, Inc. 3.75% 3/15/19 | 25,000 | 25,563 | |
| MPT Operating Partnership LP/MPT Finance Corp. 5.25% 8/1/26 | 3,570 | 3,641 | |
| Tenet Healthcare Corp.: | |||
| 4.3503% 6/15/20 (b) | 17,895 | 18,029 | |
| 4.75% 6/1/20 | 8,680 | 8,875 | |
| TOTAL HEALTHCARE | 75,210 | ||
| Homebuilders/Real Estate - 0.2% | |||
| CBRE Group, Inc. 5% 3/15/23 | 17,990 | 18,890 | |
| Paper - 0.1% | |||
| Xerium Technologies, Inc. 9.5% 8/15/21 (e) | 9,500 | 9,643 | |
| Publishing/Printing - 0.1% | |||
| Cenveo Corp. 6% 8/1/19 (e) | 9,850 | 8,668 | |
| Services - 0.3% | |||
| APX Group, Inc. 7.875% 12/1/22 | 8,975 | 9,446 | |
| Avis Budget Car Rental LLC/Avis Budget Finance, Inc. 3.5921% 12/1/17 (b) | 14,410 | 14,422 | |
| TOTAL SERVICES | 23,868 | ||
| Super Retail - 0.1% | |||
| JC Penney Corp., Inc. 5.875% 7/1/23 (e) | 6,385 | 6,578 | |
| Technology - 1.0% | |||
| Brocade Communications Systems, Inc. 4.625% 1/15/23 | 7,235 | 7,126 | |
| Diamond 1 Finance Corp./Diamond 2 Finance Corp.: | |||
| 3.48% 6/1/19 (e) | 6,199 | 6,361 | |
| 4.42% 6/15/21 (e) | 16,685 | 17,445 | |
| First Data Corp. 6.75% 11/1/20 (e) | 25,460 | 26,351 | |
| NXP BV/NXP Funding LLC: | |||
| 4.125% 6/1/21 (e) | 16,440 | 17,550 | |
| 5.75% 2/15/21 (e) | 14,760 | 15,350 | |
| 5.75% 3/15/23 (e) | 5,000 | 5,325 | |
| TOTAL TECHNOLOGY | 95,508 | ||
| Telecommunications - 1.6% | |||
| Altice Financing SA: | |||
| 6.5% 1/15/22 (e) | 7,240 | 7,568 | |
| 7.5% 5/15/26 (e) | 19,200 | 19,776 | |
| Columbus International, Inc. 7.375% 3/30/21 (e) | 14,535 | 15,552 | |
| DigitalGlobe, Inc. 5.25% 2/1/21 (e) | 3,905 | 3,934 | |
| Intelsat Jackson Holdings SA 8% 2/15/24 (e) | 14,100 | 14,171 | |
| Level 3 Financing, Inc. 4.4067% 1/15/18 (b) | 15,000 | 15,019 | |
| SFR Group SA: | |||
| 6% 5/15/22 (e) | 2,550 | 2,615 | |
| 6.25% 5/15/24 (e) | 10,905 | 10,898 | |
| 7.375% 5/1/26 (e) | 18,755 | 18,943 | |
| Sprint Capital Corp.: | |||
| 6.875% 11/15/28 | 4,000 | 3,680 | |
| 6.9% 5/1/19 | 5,000 | 5,263 | |
| Sprint Communications, Inc.: | |||
| 6% 11/15/22 | 30,000 | 27,956 | |
| 9% 11/15/18 (e) | 3,000 | 3,300 | |
| TOTAL TELECOMMUNICATIONS | 148,675 | ||
| Utilities - 0.2% | |||
| Energy Future Intermediate Holding Co. LLC/Energy Future Intermediate Holding Finance, Inc. 12.25% 3/1/22 (d)(e) | 8,728 | 11,237 | |
| NRG Energy, Inc. 6.625% 3/15/23 | 4,000 | 3,990 | |
| The AES Corp. 3.8421% 6/1/19 (b) | 1,433 | 1,431 | |
| TOTAL UTILITIES | 16,658 | ||
| TOTAL NONCONVERTIBLE BONDS | |||
| (Cost $730,376) | 731,063 | ||
| Shares | Value (000s) | ||
| Common Stocks - 0.4% | |||
| Broadcasting - 0.1% | |||
| Cumulus Media, Inc. Class A (f) | 28,882 | 40 | |
| ION Media Networks, Inc. (f) | 2,842 | 1,825 | |
| TOTAL BROADCASTING | 1,865 | ||
| Chemicals - 0.2% | |||
| LyondellBasell Industries NV Class A | 245,943 | 19,565 | |
| Homebuilders/Real Estate - 0.0% | |||
| Five Point Holdings LLC Class A(f) | 289,870 | 974 | |
| Metals/Mining - 0.1% | |||
| Warrior Met Coal LLC Class A (g) | 35,615 | 9,195 | |
| Paper - 0.0% | |||
| White Birch Cayman Holdings Ltd. (f) | 12,570 | 0 | |
| Telecommunications - 0.0% | |||
| FairPoint Communications, Inc. (f) | 34,287 | 535 | |
| Utilities - 0.0% | |||
| Calpine Corp. (f) | 20,715 | 247 | |
| Southcross Holdings Borrower LP | 2,927 | 1,446 | |
| TOTAL UTILITIES | 1,693 | ||
| TOTAL COMMON STOCKS | |||
| (Cost $85,130) | 33,827 | ||
| Money Market Funds - 9.8% | |||
| Fidelity Cash Central Fund, 0.41% (h) | |||
| (Cost $909,817) | 909,802,234 | 910,075 | |
| TOTAL INVESTMENT PORTFOLIO - 102.7% | |||
| (Cost $9,685,244) | 9,588,447 | ||
| NET OTHER ASSETS (LIABILITIES) - (2.7)% | (249,871) | ||
| NET ASSETS - 100% | $9,338,576 |
Values shown as $0 may reflect amounts less than $500.
Legend
(a) Remaining maturities of bank loan obligations may be less than the stated maturities shown as a result of contractual or optional prepayments by the borrower. Such prepayments cannot be predicted with certainty.
(b) Coupon rates for floating and adjustable rate securities reflect the rates in effect at period end.
(c) The coupon rate will be determined upon settlement of the loan after period end.
(d) Non-income producing - Security is in default.
(e) Security exempt from registration under Rule 144A of the Securities Act of 1933. These securities may be resold in transactions exempt from registration, normally to qualified institutional buyers. At the end of the period, the value of these securities amounted to $387,095,000 or 4.1% of net assets.
(f) Non-income producing
(g) Restricted securities - Investment in securities not registered under the Securities Act of 1933 (excluding 144A issues). At the end of the period, the value of restricted securities (excluding 144A issues) amounted to $9,195,000 or 0.1% of net assets.
(h) Affiliated fund that is generally available only to investment companies and other accounts managed by Fidelity Investments. The rate quoted is the annualized seven-day yield of the fund at period end. A complete unaudited listing of the fund's holdings as of its most recent quarter end is available upon request. In addition, each Fidelity Central Fund's financial statements, which are not covered by the Fund's Report of Independent Registered Public Accounting Firm, are available on the SEC's website or upon request.
Additional information on each restricted holding is as follows:
| Security | Acquisition Date | Acquisition Cost (000s) |
| Warrior Met Coal LLC Class A | 3/9/11 - 7/11/14 | $72,703 |
Affiliated Central Funds
Information regarding fiscal year to date income earned by the Fund from investments in Fidelity Central Funds is as follows:
| Fund | Income earned |
| (Amounts in thousands) | |
| Fidelity Cash Central Fund | $2,945 |
| Total | $2,945 |
Investment Valuation
The following is a summary of the inputs used, as of October 31, 2016, involving the Fund's assets and liabilities carried at fair value. The inputs or methodology used for valuing securities may not be an indication of the risk associated with investing in those securities. For more information on valuation inputs, and their aggregation into the levels used below, please refer to the Investment Valuation section in the accompanying Notes to Financial Statements.
| Valuation Inputs at Reporting Date: | ||||
| Description | Total | Level 1 | Level 2 | Level 3 |
| (Amounts in thousands) | ||||
| Investments in Securities: | ||||
| Equities: | ||||
| Consumer Discretionary | $1,865 | $40 | $-- | $1,825 |
| Energy | 9,195 | -- | -- | 9,195 |
| Materials | 19,565 | 19,565 | -- | -- |
| Real Estate | 974 | -- | -- | 974 |
| Telecommunication Services | 535 | 535 | -- | -- |
| Utilities | 1,693 | 247 | -- | 1,446 |
| Bank Loan Obligations | 7,913,482 | -- | 7,871,412 | 42,070 |
| Corporate Bonds | 731,063 | -- | 731,063 | -- |
| Money Market Funds | 910,075 | 910,075 | -- | -- |
| Total Investments in Securities: | $9,588,447 | $930,462 | $8,602,475 | $55,510 |
See accompanying notes which are an integral part of the financial statements.
Financial Statements
Statement of Assets and Liabilities
| Amounts in thousands (except per-share amounts) | October 31, 2016 | |
| Assets | ||
| Investment in securities, at value — See accompanying schedule: Unaffiliated issuers (cost $8,775,427) | $8,678,372 | |
| Fidelity Central Funds (cost $909,817) | 910,075 | |
| Total Investments (cost $9,685,244) | $9,588,447 | |
| Cash | 45,645 | |
| Receivable for investments sold | 78,897 | |
| Receivable for fund shares sold | 8,074 | |
| Interest receivable | 48,793 | |
| Distributions receivable from Fidelity Central Funds | 338 | |
| Prepaid expenses | 24 | |
| Total assets | 9,770,218 | |
| Liabilities | ||
| Payable for investments purchased | $375,366 | |
| Payable for fund shares redeemed | 44,237 | |
| Distributions payable | 5,748 | |
| Accrued management fee | 4,346 | |
| Distribution and service plan fees payable | 668 | |
| Other affiliated payables | 1,162 | |
| Other payables and accrued expenses | 115 | |
| Total liabilities | 431,642 | |
| Net Assets | $9,338,576 | |
| Net Assets consist of: | ||
| Paid in capital | $9,789,932 | |
| Undistributed net investment income | 27,697 | |
| Accumulated undistributed net realized gain (loss) on investments | (382,256) | |
| Net unrealized appreciation (depreciation) on investments | (96,797) | |
| Net Assets | $9,338,576 | |
| Calculation of Maximum Offering Price | ||
| Class A: | ||
| Net Asset Value and redemption price per share ($706,963 ÷ 73,671 shares) | $9.60 | |
| Maximum offering price per share (100/97.25 of $9.60) | $9.87 | |
| Class T: | ||
| Net Asset Value and redemption price per share ($170,741 ÷ 17,819 shares) | $9.58 | |
| Maximum offering price per share (100/97.25 of $9.58) | $9.85 | |
| Class C: | ||
| Net Asset Value and offering price per share ($582,061 ÷ 60,669 shares)(a) | $9.59 | |
| Fidelity Floating Rate High Income Fund: | ||
| Net Asset Value, offering price and redemption price per share ($6,131,215 ÷ 639,780 shares) | $9.58 | |
| Class I: | ||
| Net Asset Value, offering price and redemption price per share ($1,747,596 ÷ 182,509 shares) | $9.58 |
(a) Redemption price per share is equal to net asset value less any applicable contingent deferred sales charge.
See accompanying notes which are an integral part of the financial statements.
Statement of Operations
| Amounts in thousands | Year ended October 31, 2016 | |
| Investment Income | ||
| Dividends | $802 | |
| Interest | 421,902 | |
| Income from Fidelity Central Funds | 2,945 | |
| Total income | 425,649 | |
| Expenses | ||
| Management fee | $52,254 | |
| Transfer agent fees | 12,872 | |
| Distribution and service plan fees | 8,300 | |
| Accounting fees and expenses | 1,544 | |
| Custodian fees and expenses | 105 | |
| Independent trustees' fees and expenses | 41 | |
| Registration fees | 220 | |
| Audit | 181 | |
| Legal | 139 | |
| Miscellaneous | 84 | |
| Total expenses before reductions | 75,740 | |
| Expense reductions | (77) | 75,663 |
| Net investment income (loss) | 349,986 | |
| Realized and Unrealized Gain (Loss) | ||
| Net realized gain (loss) on: | ||
| Investment securities: | ||
| Unaffiliated issuers | (225,630) | |
| Fidelity Central Funds | 10 | |
| Total net realized gain (loss) | (225,620) | |
| Change in net unrealized appreciation (depreciation) on investment securities | 386,147 | |
| Net gain (loss) | 160,527 | |
| Net increase (decrease) in net assets resulting from operations | $510,513 |
See accompanying notes which are an integral part of the financial statements.
Statement of Changes in Net Assets
| Amounts in thousands | Year ended October 31, 2016 | Year ended October 31, 2015 |
| Increase (Decrease) in Net Assets | ||
| Operations | ||
| Net investment income (loss) | $349,986 | $489,822 |
| Net realized gain (loss) | (225,620) | (176,848) |
| Change in net unrealized appreciation (depreciation) | 386,147 | (378,925) |
| Net increase (decrease) in net assets resulting from operations | 510,513 | (65,951) |
| Distributions to shareholders from net investment income | (383,140) | (448,829) |
| Distributions to shareholders from net realized gain | – | (58,045) |
| Total distributions | (383,140) | (506,874) |
| Share transactions - net increase (decrease) | (1,573,710) | (3,268,839) |
| Redemption fees | 413 | 858 |
| Total increase (decrease) in net assets | (1,445,924) | (3,840,806) |
| Net Assets | ||
| Beginning of period | 10,784,500 | 14,625,306 |
| End of period | $9,338,576 | $10,784,500 |
| Other Information | ||
| Undistributed net investment income end of period | $27,697 | $38,133 |
See accompanying notes which are an integral part of the financial statements.
Financial Highlights — Fidelity Advisor Floating Rate High Income Fund Class A
| Years ended October 31, | 2016 | 2015 | 2014 | 2013 | 2012 |
| Selected Per–Share Data | |||||
| Net asset value, beginning of period | $9.42 | $9.85 | $9.99 | $9.94 | $9.73 |
| Income from Investment Operations | |||||
| Net investment income (loss)A | .334 | .375 | .317 | .310 | .340 |
| Net realized and unrealized gain (loss) | .211 | (.425) | (.114) | .070 | .195 |
| Total from investment operations | .545 | (.050) | .203 | .380 | .535 |
| Distributions from net investment income | (.365) | (.341) | (.307) | (.282) | (.325) |
| Distributions from net realized gain | – | (.040) | (.036) | (.049) | – |
| Total distributions | (.365) | (.381) | (.343) | (.331) | (.325) |
| Redemption fees added to paid in capitalA | –B | .001 | –B | .001 | –B |
| Net asset value, end of period | $9.60 | $9.42 | $9.85 | $9.99 | $9.94 |
| Total ReturnC,D | 5.98% | (.53)% | 2.05% | 3.89% | 5.60% |
| Ratios to Average Net AssetsE,F | |||||
| Expenses before reductions | .99% | .98% | .98% | .99% | .99% |
| Expenses net of fee waivers, if any | .99% | .98% | .98% | .99% | .99% |
| Expenses net of all reductions | .98% | .98% | .98% | .99% | .99% |
| Net investment income (loss) | 3.58% | 3.86% | 3.17% | 3.11% | 3.47% |
| Supplemental Data | |||||
| Net assets, end of period (in millions) | $707 | $863 | $1,185 | $1,681 | $1,305 |
| Portfolio turnover rateG | 46% | 26% | 54% | 62% | 49% |
A Calculated based on average shares outstanding during the period.
B Amount represents less than $.0005 per share.
C Total returns would have been lower if certain expenses had not been reduced during the applicable periods shown.
D Total returns do not include the effect of the sales charges.
E Fees and expenses of any underlying Fidelity Central Funds are not included in the Fund's expense ratio. The Fund indirectly bears its proportionate share of the expenses of any underlying Fidelity Central Funds.
F Expense ratios reflect operating expenses of the class. Expenses before reductions do not reflect amounts reimbursed by the investment adviser or reductions from brokerage service arrangements or reductions from other expense offset arrangements and do not represent the amount paid by the class during periods when reimbursements or reductions occur. Expenses net of fee waivers reflect expenses after reimbursement by the investment adviser but prior to reductions from brokerage service arrangements or other expense offset arrangements. Expenses net of all reductions represent the net expenses paid by the class.
G Amount does not include the portfolio activity of any underlying Fidelity Central Funds.
See accompanying notes which are an integral part of the financial statements.
Financial Highlights — Fidelity Advisor Floating Rate High Income Fund Class T
| Years ended October 31, | 2016 | 2015 | 2014 | 2013 | 2012 |
| Selected Per–Share Data | |||||
| Net asset value, beginning of period | $9.40 | $9.84 | $9.98 | $9.93 | $9.72 |
| Income from Investment Operations | |||||
| Net investment income (loss)A | .324 | .365 | .306 | .299 | .330 |
| Net realized and unrealized gain (loss) | .212 | (.434) | (.112) | .071 | .195 |
| Total from investment operations | .536 | (.069) | .194 | .370 | .525 |
| Distributions from net investment income | (.356) | (.332) | (.298) | (.272) | (.315) |
| Distributions from net realized gain | – | (.040) | (.036) | (.049) | – |
| Total distributions | (.356) | (.372) | (.334) | (.321) | (.315) |
| Redemption fees added to paid in capitalA | –B | .001 | –B | .001 | –B |
| Net asset value, end of period | $9.58 | $9.40 | $9.84 | $9.98 | $9.93 |
| Total ReturnC,D | 5.89% | (.72)% | 1.96% | 3.79% | 5.50% |
| Ratios to Average Net AssetsE,F | |||||
| Expenses before reductions | 1.08% | 1.07% | 1.07% | 1.09% | 1.09% |
| Expenses net of fee waivers, if any | 1.08% | 1.07% | 1.07% | 1.09% | 1.09% |
| Expenses net of all reductions | 1.08% | 1.07% | 1.07% | 1.09% | 1.09% |
| Net investment income (loss) | 3.48% | 3.77% | 3.08% | 3.01% | 3.37% |
| Supplemental Data | |||||
| Net assets, end of period (in millions) | $171 | $195 | $240 | $272 | $241 |
| Portfolio turnover rateG | 46% | 26% | 54% | 62% | 49% |
A Calculated based on average shares outstanding during the period.
B Amount represents less than $.0005 per share.
C Total returns would have been lower if certain expenses had not been reduced during the applicable periods shown.
D Total returns do not include the effect of the sales charges.
E Fees and expenses of any underlying Fidelity Central Funds are not included in the Fund's expense ratio. The Fund indirectly bears its proportionate share of the expenses of any underlying Fidelity Central Funds.
F Expense ratios reflect operating expenses of the class. Expenses before reductions do not reflect amounts reimbursed by the investment adviser or reductions from brokerage service arrangements or reductions from other expense offset arrangements and do not represent the amount paid by the class during periods when reimbursements or reductions occur. Expenses net of fee waivers reflect expenses after reimbursement by the investment adviser but prior to reductions from brokerage service arrangements or other expense offset arrangements. Expenses net of all reductions represent the net expenses paid by the class.
G Amount does not include the portfolio activity of any underlying Fidelity Central Funds.
See accompanying notes which are an integral part of the financial statements.
Financial Highlights — Fidelity Advisor Floating Rate High Income Fund Class C
| Years ended October 31, | 2016 | 2015 | 2014 | 2013 | 2012 |
| Selected Per–Share Data | |||||
| Net asset value, beginning of period | $9.41 | $9.85 | $9.99 | $9.94 | $9.73 |
| Income from Investment Operations | |||||
| Net investment income (loss)A | .263 | .301 | .241 | .235 | .267 |
| Net realized and unrealized gain (loss) | .212 | (.434) | (.113) | .070 | .195 |
| Total from investment operations | .475 | (.133) | .128 | .305 | .462 |
| Distributions from net investment income | (.295) | (.268) | (.232) | (.207) | (.252) |
| Distributions from net realized gain | – | (.040) | (.036) | (.049) | – |
| Total distributions | (.295) | (.308) | (.268) | (.256) | (.252) |
| Redemption fees added to paid in capitalA | –B | .001 | –B | .001 | –B |
| Net asset value, end of period | $9.59 | $9.41 | $9.85 | $9.99 | $9.94 |
| Total ReturnC,D | 5.19% | (1.38)% | 1.29% | 3.11% | 4.81% |
| Ratios to Average Net AssetsE,F | |||||
| Expenses before reductions | 1.74% | 1.73% | 1.73% | 1.74% | 1.74% |
| Expenses net of fee waivers, if any | 1.74% | 1.73% | 1.73% | 1.74% | 1.74% |
| Expenses net of all reductions | 1.74% | 1.73% | 1.73% | 1.74% | 1.74% |
| Net investment income (loss) | 2.82% | 3.10% | 2.41% | 2.35% | 2.72% |
| Supplemental Data | |||||
| Net assets, end of period (in millions) | $582 | $671 | $835 | $960 | $806 |
| Portfolio turnover rateG | 46% | 26% | 54% | 62% | 49% |
A Calculated based on average shares outstanding during the period.
B Amount represents less than $.0005 per share.
C Total returns would have been lower if certain expenses had not been reduced during the applicable periods shown.
D Total returns do not include the effect of the contingent deferred sales charge.
E Fees and expenses of any underlying Fidelity Central Funds are not included in the Fund's expense ratio. The Fund indirectly bears its proportionate share of the expenses of any underlying Fidelity Central Funds.
F Expense ratios reflect operating expenses of the class. Expenses before reductions do not reflect amounts reimbursed by the investment adviser or reductions from brokerage service arrangements or reductions from other expense offset arrangements and do not represent the amount paid by the class during periods when reimbursements or reductions occur. Expenses net of fee waivers reflect expenses after reimbursement by the investment adviser but prior to reductions from brokerage service arrangements or other expense offset arrangements. Expenses net of all reductions represent the net expenses paid by the class.
G Amount does not include the portfolio activity of any underlying Fidelity Central Funds.
See accompanying notes which are an integral part of the financial statements.
Financial Highlights — Fidelity Floating Rate High Income Fund
| Years ended October 31, | 2016 | 2015 | 2014 | 2013 | 2012 |
| Selected Per–Share Data | |||||
| Net asset value, beginning of period | $9.40 | $9.84 | $9.98 | $9.93 | $9.72 |
| Income from Investment Operations | |||||
| Net investment income (loss)A | .359 | .401 | .344 | .337 | .368 |
| Net realized and unrealized gain (loss) | .212 | (.435) | (.113) | .071 | .195 |
| Total from investment operations | .571 | (.034) | .231 | .408 | .563 |
| Distributions from net investment income | (.391) | (.367) | (.335) | (.310) | (.353) |
| Distributions from net realized gain | – | (.040) | (.036) | (.049) | – |
| Total distributions | (.391) | (.407) | (.371) | (.359) | (.353) |
| Redemption fees added to paid in capitalA | –B | .001 | –B | .001 | –B |
| Net asset value, end of period | $9.58 | $9.40 | $9.84 | $9.98 | $9.93 |
| Total ReturnC | 6.28% | (.36)% | 2.34% | 4.19% | 5.91% |
| Ratios to Average Net AssetsD,E | |||||
| Expenses before reductions | .71% | .70% | .69% | .70% | .71% |
| Expenses net of fee waivers, if any | .71% | .70% | .69% | .70% | .71% |
| Expenses net of all reductions | .71% | .70% | .69% | .70% | .71% |
| Net investment income (loss) | 3.86% | 4.14% | 3.45% | 3.39% | 3.75% |
| Supplemental Data | |||||
| Net assets, end of period (in millions) | $6,131 | $6,615 | $9,032 | $8,882 | $5,720 |
| Portfolio turnover rateF | 46% | 26% | 54% | 62% | 49% |
A Calculated based on average shares outstanding during the period.
B Amount represents less than $.0005 per share.
C Total returns would have been lower if certain expenses had not been reduced during the applicable periods shown.
D Fees and expenses of any underlying Fidelity Central Funds are not included in the Fund's expense ratio. The Fund indirectly bears its proportionate share of the expenses of any underlying Fidelity Central Funds.
E Expense ratios reflect operating expenses of the class. Expenses before reductions do not reflect amounts reimbursed by the investment adviser or reductions from brokerage service arrangements or reductions from other expense offset arrangements and do not represent the amount paid by the class during periods when reimbursements or reductions occur. Expenses net of fee waivers reflect expenses after reimbursement by the investment adviser but prior to reductions from brokerage service arrangements or other expense offset arrangements. Expenses net of all reductions represent the net expenses paid by the class.
F Amount does not include the portfolio activity of any underlying Fidelity Central Funds.
See accompanying notes which are an integral part of the financial statements.
Financial Highlights — Fidelity Advisor Floating Rate High Income Fund Class I
| Years ended October 31, | 2016 | 2015 | 2014 | 2013 | 2012 |
| Selected Per–Share Data | |||||
| Net asset value, beginning of period | $9.40 | $9.83 | $9.97 | $9.92 | $9.71 |
| Income from Investment Operations | |||||
| Net investment income (loss)A | .355 | .396 | .339 | .332 | .363 |
| Net realized and unrealized gain (loss) | .211 | (.424) | (.113) | .071 | .196 |
| Total from investment operations | .566 | (.028) | .226 | .403 | .559 |
| Distributions from net investment income | (.386) | (.363) | (.330) | (.305) | (.349) |
| Distributions from net realized gain | – | (.040) | (.036) | (.049) | – |
| Total distributions | (.386) | (.403) | (.366) | (.354) | (.349) |
| Redemption fees added to paid in capitalA | –B | .001 | –B | .001 | –B |
| Net asset value, end of period | $9.58 | $9.40 | $9.83 | $9.97 | $9.92 |
| Total ReturnC | 6.23% | (.30)% | 2.29% | 4.15% | 5.87% |
| Ratios to Average Net AssetsD,E | |||||
| Expenses before reductions | .75% | .74% | .74% | .75% | .75% |
| Expenses net of fee waivers, if any | .75% | .74% | .74% | .75% | .75% |
| Expenses net of all reductions | .75% | .74% | .74% | .75% | .75% |
| Net investment income (loss) | 3.81% | 4.10% | 3.40% | 3.34% | 3.71% |
| Supplemental Data | |||||
| Net assets, end of period (in millions) | $1,748 | $2,429 | $3,317 | $3,646 | $2,510 |
| Portfolio turnover rateF | 46% | 26% | 54% | 62% | 49% |
A Calculated based on average shares outstanding during the period.
B Amount represents less than $.0005 per share.
C Total returns would have been lower if certain expenses had not been reduced during the applicable periods shown.
D Fees and expenses of any underlying Fidelity Central Funds are not included in the Fund's expense ratio. The Fund indirectly bears its proportionate share of the expenses of any underlying Fidelity Central Funds.
E Expense ratios reflect operating expenses of the class. Expenses before reductions do not reflect amounts reimbursed by the investment adviser or reductions from brokerage service arrangements or reductions from other expense offset arrangements and do not represent the amount paid by the class during periods when reimbursements or reductions occur. Expenses net of fee waivers reflect expenses after reimbursement by the investment adviser but prior to reductions from brokerage service arrangements or other expense offset arrangements. Expenses net of all reductions represent the net expenses paid by the class.
F Amount does not include the portfolio activity of any underlying Fidelity Central Funds.
See accompanying notes which are an integral part of the financial statements.
Notes to Financial Statements
For the period ended October 31, 2016
(Amounts in thousands except percentages)
1. Organization.
Fidelity Advisor Floating Rate High Income Fund (the Fund) is a fund of Fidelity Advisor Series I (the Trust) and is authorized to issue an unlimited number of shares. The Trust is registered under the Investment Company Act of 1940, as amended (the 1940 Act), as an open-end management investment company organized as a Massachusetts business trust. The Fund offers Class A, Class T, Class C, Fidelity Floating Rate High Income Fund and Class I shares, each of which has equal rights as to assets and voting privileges. Each class has exclusive voting rights with respect to matters that affect that class.
After the close of business on June 24, 2016, all outstanding Class B shares were converted to Class A shares. All current fiscal period dollar and share amounts for Class B presented in the Notes to Financial Statements are for the period November 1, 2015 through June 24, 2016.
2. Investments in Fidelity Central Funds.
The Fund invests in Fidelity Central Funds, which are open-end investment companies generally available only to other investment companies and accounts managed by the investment adviser and its affiliates. The Fund's Schedule of Investments lists each of the Fidelity Central Funds held as of period end, if any, as an investment of the Fund, but does not include the underlying holdings of each Fidelity Central Fund. As an Investing Fund, the Fund indirectly bears its proportionate share of the expenses of the underlying Fidelity Central Funds.
The Money Market Central Funds seek preservation of capital and current income and are managed by Fidelity Investments Money Management, Inc. (FIMM), an affiliate of the investment adviser. Annualized expenses of the Money Market Central Funds as of their most recent shareholder report date are less than .005%.
A complete unaudited list of holdings for each Fidelity Central Fund is available upon request or at the Securities and Exchange Commission (the SEC) website at www.sec.gov. In addition, the financial statements of the Fidelity Central Funds, which are not covered by the Fund's Report of Independent Registered Public Accounting Firm, are available on the SEC website or upon request.
3. Significant Accounting Policies.
The financial statements have been prepared in conformity with accounting principles generally accepted in the United States of America (GAAP), which require management to make certain estimates and assumptions at the date of the financial statements. Actual results could differ from those estimates. Subsequent events, if any, through the date that the financial statements were issued have been evaluated in the preparation of the financial statements. The following summarizes the significant accounting policies of the Fund:
Investment Valuation. Investments are valued as of 4:00 p.m. Eastern time on the last calendar day of the period. The Board of Trustees (the Board) has delegated the day to day responsibility for the valuation of the Fund's investments to the Fair Value Committee (the Committee) established by the Fund's investment adviser. In accordance with valuation policies and procedures approved by the Board, the Fund attempts to obtain prices from one or more third party pricing vendors or brokers to value its investments. When current market prices, quotations or currency exchange rates are not readily available or reliable, investments will be fair valued in good faith by the Committee, in accordance with procedures adopted by the Board. Factors used in determining fair value vary by investment type and may include market or investment specific events, changes in interest rates and credit quality. The frequency with which these procedures are used cannot be predicted and they may be utilized to a significant extent. The Committee oversees the Fund's valuation policies and procedures and reports to the Board on the Committee's activities and fair value determinations. The Board monitors the appropriateness of the procedures used in valuing the Fund's investments and ratifies the fair value determinations of the Committee.
The Fund categorizes the inputs to valuation techniques used to value its investments into a disclosure hierarchy consisting of three levels as shown below:
- Level 1 – quoted prices in active markets for identical investments
- Level 2 – other significant observable inputs (including quoted prices for similar investments, interest rates, prepayment speeds, etc.)
- Level 3 – unobservable inputs (including the Fund's own assumptions based on the best information available)
Valuation techniques used to value the Fund's investments by major category are as follows:
Debt securities, including restricted securities, are valued based on evaluated prices received from third party pricing vendors or from brokers who make markets in such securities. Corporate bonds and bank loan obligations are valued by pricing vendors who utilize matrix pricing which considers yield or price of bonds of comparable quality, coupon, maturity and type or by broker-supplied prices. When independent prices are unavailable or unreliable, debt securities may be valued utilizing pricing methodologies which consider similar factors that would be used by third party pricing vendors. Debt securities are generally categorized as Level 2 in the hierarchy but may be Level 3 depending on the circumstances. The Fund invests a significant portion of its assets in below investment grade securities. The value of these securities can be more volatile due to changes in the credit quality of the issuer and is sensitive to changes in economic, market and regulatory conditions.
Equity securities, including restricted securities, for which market quotations are readily available, are valued at the last reported sale price or official closing price as reported by a third party pricing vendor on the primary market or exchange on which they are traded and are categorized as Level 1 in the hierarchy. In the event there were no sales during the day or closing prices are not available, securities are valued at the last quoted bid price or may be valued using the last available price and are generally categorized as Level 2 in the hierarchy. For foreign equity securities, when market or security specific events arise, comparisons to the valuation of American Depositary Receipts (ADRs), futures contracts, Exchange-Traded Funds (ETFs) and certain indexes as well as quoted prices for similar securities may be used and would be categorized as Level 2 in the hierarchy. Utilizing these techniques may result in transfers between Level 1 and Level 2. For equity securities, including restricted securities, where observable inputs are limited, assumptions about market activity and risk are used and these securities may be categorized as Level 3 in the hierarchy.
Investments in open-end mutual funds, including the Fidelity Central Funds, are valued at their closing net asset value (NAV) each business day and are categorized as Level 1 in the hierarchy.
Changes in valuation techniques may result in transfers in or out of an assigned level within the disclosure hierarchy. The aggregate value of investments by input level as of October 31, 2016 is included at the end of the Fund's Schedule of Investments.
Investment Transactions and Income. For financial reporting purposes, the Fund's investment holdings and NAV include trades executed through the end of the last business day of the period. The NAV per share for processing shareholder transactions is calculated as of the close of business of the New York Stock Exchange (NYSE), normally 4:00 p.m. Eastern time and includes trades executed through the end of the prior business day. Gains and losses on securities sold are determined on the basis of identified cost. Dividend income is recorded on the ex-dividend date, except for certain dividends from foreign securities where the ex-dividend date may have passed, which are recorded as soon as the Fund is informed of the ex-dividend date. Non-cash dividends included in dividend income, if any, are recorded at the fair market value of the securities received. Income and capital gain distributions from Fidelity Central Funds, if any, are recorded on the ex-dividend date. Distributions received on securities that represent a return of capital or capital gain are recorded as a reduction of cost of investments and/or as a realized gain. Subsequent to ex-dividend date the Fund determines the components of these distributions, based upon receipt of tax filings or other correspondence relating to the underlying investment. Interest income is accrued as earned and includes coupon interest and amortization of premium and accretion of discount on debt securities as applicable. Debt obligations may be placed on non-accrual status and related interest income may be reduced by ceasing current accruals and writing off interest receivables when the collection of all or a portion of interest has become doubtful based on consistently applied procedures. A debt obligation is removed from non-accrual status when the issuer resumes interest payments or when collectability of interest is reasonably assured. The Fund earns certain fees in connection with its floating rate loan purchasing activities. These fees are in addition to interest payments earned and may include amendment fees, consent fees and prepayment fees. These fees are recorded as Interest in the accompanying financial statements.
Class Allocations and Expenses. Investment income, realized and unrealized capital gains and losses, common expenses of the Fund, and certain fund-level expense reductions, if any, are allocated daily on a pro-rata basis to each class based on the relative net assets of each class to the total net assets of the Fund. Each class differs with respect to transfer agent and distribution and service plan fees incurred. Certain expense reductions may also differ by class. For the reporting period, the allocated portion of income and expenses to each class as a percent of its average net assets may vary due to the timing of recording these transactions in relation to fluctuating net assets of the classes. Expenses directly attributable to a fund are charged to that fund. Expenses attributable to more than one fund are allocated among the respective funds on the basis of relative net assets or other appropriate methods. Expense estimates are accrued in the period to which they relate and adjustments are made when actual amounts are known.
Income Tax Information and Distributions to Shareholders. Each year, the Fund intends to qualify as a regulated investment company under Subchapter M of the Internal Revenue Code, including distributing substantially all of its taxable income and realized gains. As a result, no provision for U.S. Federal income taxes is required. As of October 31, 2016, the Fund did not have any unrecognized tax benefits in the financial statements; nor is the Fund aware of any tax positions for which it is reasonably possible that the total amounts of unrecognized tax benefits will significantly change in the next twelve months. The Fund files a U.S. federal tax return, in addition to state and local tax returns as required. The Fund's federal income tax returns are subject to examination by the Internal Revenue Service (IRS) for a period of three fiscal years after they are filed. State and local tax returns may be subject to examination for an additional fiscal year depending on the jurisdiction.
Dividends are declared and recorded daily and paid monthly from net investment income. Distributions from realized gains, if any, are declared and recorded on the ex-dividend date. Income dividends and capital gain distributions are declared separately for each class. Income and capital gain distributions are determined in accordance with income tax regulations, which may differ from GAAP.
Capital accounts within the financial statements are adjusted for permanent book-tax differences. These adjustments have no impact on net assets or the results of operations. Capital accounts are not adjusted for temporary book-tax differences which will reverse in a subsequent period.
Book-tax differences are primarily due to market discount, capital loss carryforwards and losses deferred due to wash sales.
The federal tax cost of investment securities and unrealized appreciation (depreciation) as of period end were as follows:
| Gross unrealized appreciation | $129,688 |
| Gross unrealized depreciation | (212,395) |
| Net unrealized appreciation (depreciation) on securities | $(82,707) |
| Tax Cost | $9,671,154 |
The tax-based components of distributable earnings as of period end were as follows:
| Undistributed ordinary income | $5,235 |
| Capital loss carryforward | $( 373,885) |
| Net unrealized appreciation (depreciation) on securities and other investments | $(82,707) |
Capital loss carryforwards are only available to offset future capital gains of the Fund to the extent provided by regulations and may be limited. Under the Regulated Investment Company Modernization Act of 2010 (the Act), the Fund is permitted to carry forward capital losses incurred in taxable years beginning after December 22, 2010 for an unlimited period and such capital losses are required to be used prior to any losses that expire. The capital loss carryforward information presented below, including any applicable limitation, is estimated as of fiscal period end and is subject to adjustment.
| No expiration | |
| Short-term | $(30,793) |
| Long-term | (343,092) |
| Total capital loss carryforward | $(373,885) |
The tax character of distributions paid was as follows:
| October 31, 2016 | October 31, 2015 | |
| Ordinary Income | $383,140 | $ 474,949 |
| Long-term Capital Gains | – | 31,925 |
| Total | $383,140 | $ 506,874 |
Short-Term Trading (Redemption) Fees. Shares held by investors in the Fund less than 60 days may have been subject to a redemption fee equal to 1.00% of the NAV of shares redeemed. All redemption fees, which reduce the proceeds of the shareholder redemption, are retained by the Fund and accounted for as an addition to paid in capital.
Restricted Securities. The Fund may invest in securities that are subject to legal or contractual restrictions on resale. These securities generally may be resold in transactions exempt from registration or to the public if the securities are registered. Disposal of these securities may involve time-consuming negotiations and expense, and prompt sale at an acceptable price may be difficult. Information regarding restricted securities is included at the end of the Fund's Schedule of Investments.
Loans and Other Direct Debt Instruments. The Fund invests in direct debt instruments which are interests in amounts owed to lenders by corporate or other borrowers. These instruments may be in the form of loans, trade claims or other receivables and may include standby financing commitments such as revolving credit facilities that obligate the Fund to supply additional cash to the borrower on demand. Loans may be acquired through assignment or participation. The Fund did not have any unfunded loan commitments, which are contractual obligations for future funding, at period end.
4. Purchase and Sales of Investments.
Purchases and sales of securities (including principal repayments of bank loan obligations), other than short-term securities, aggregated $4,046,299 and $5,721,506, respectively.
5. Fees and Other Transactions with Affiliates.
Management Fee. Fidelity Management & Research Company (the investment adviser) and its affiliates provide the Fund with investment management related services for which the Fund pays a monthly management fee. The management fee is the sum of an individual fund fee rate that is based on an annual rate of .45% of the Fund's average net assets and an annualized group fee rate that averaged .11% during the period. The group fee rate is based upon the average net assets of all the mutual funds advised by the investment adviser, including any mutual funds previously advised by the investment adviser that are currently advised by Fidelity SelectCo, LLC, an affiliate of the investment adviser. The group fee rate decreases as assets under management increase and increases as assets under management decrease. For the reporting period, the total annual management fee rate was .56% of the Fund's average net assets.
Distribution and Service Plan Fees. In accordance with Rule 12b-1 of the 1940 Act, the Fund has adopted separate Distribution and Service Plans for each class of shares. Certain classes pay Fidelity Distributors Corporation (FDC), an affiliate of the investment adviser, separate Distribution and Service Fees, each of which is based on an annual percentage of each class' average net assets. In addition, FDC may pay financial intermediaries for selling shares of the Fund and providing shareholder support services. For the period, the Distribution and Service Fee rates, total fees and amounts retained by FDC were as follows:
| Distribution Fee | Service Fee | Total Fees | Retained by FDC |
|
| Class A | -% | .25% | $1,837 | $– |
| Class T | -% | .25% | 437 | – |
| Class B | .55% | .15% | 41 | 32 |
| Class C | .75% | .25% | 5,985 | 370 |
| $8,300 | $402 |
Sales Load. FDC may receive a front-end sales charge of up to 2.75% for selling Class A shares and Class T shares, some of which is paid to financial intermediaries for selling shares of the Fund. Depending on the holding period, FDC may receive contingent deferred sales charges levied on Class A, Class T, Class B, and Class C redemptions. The deferred sales charges range from 3.50% to 1.00% for Class B shares, 1.00% for Class C shares, 1.00% or .50% for certain purchases of Class A shares and .25% for certain purchases of Class T shares.
For the period, sales charge amounts retained by FDC were as follows:
| Retained by FDC |
|
| Class A | $24 |
| Class T | 6 |
| Class B(a) | 5 |
| Class C(a) | 30 |
| $65 |
(a) When Class B and Class C shares are initially sold, FDC pays commissions from its own resources to financial intermediaries through which the sales are made.
Transfer Agent Fees. Fidelity Investments Institutional Operations Company, Inc., (FIIOC), an affiliate of the investment adviser, is the transfer, dividend disbursing and shareholder servicing agent for each class of the Fund. FIIOC receives account fees and asset-based fees that vary according to the account size and type of account of the shareholders of the respective classes of the Fund. FIIOC pays for typesetting, printing and mailing of shareholder reports, except proxy statements.
For the period, transfer agent fees for each class were as follows:
| Amount | % of Class-Level Average Net Assets |
|
| Class A | $1,106 | .15 |
| Class T | 431 | .25 |
| Class B | 10 | .18 |
| Class C | 929 | .16 |
| Fidelity Floating Rate High Income Fund | 7,004 | .12 |
| Class I | 3,392 | .17 |
| $ 12,872 |
Accounting Fees. Fidelity Service Company, Inc. (FSC), an affiliate of the investment adviser, maintains the Fund's accounting records. The fee is based on the level of average net assets for each month.
Interfund Trades. The Fund may purchase from or sell securities to other Fidelity Funds under procedures adopted by the Board. The procedures have been designed to ensure these interfund trades are executed in accordance with Rule 17a-7 of the 1940 Act. Interfund trades are included within the respective purchases and sales amounts shown in the Purchases and Sales of Investments note.
6. Committed Line of Credit.
The Fund participates with other funds managed by the investment adviser or an affiliate in a $4.25 billion credit facility (the "line of credit") to be utilized for temporary or emergency purposes to fund shareholder redemptions or for other short-term liquidity purposes. The Fund has agreed to pay commitment fees on its pro-rata portion of the line of credit, which amounted to $24 and is reflected in Miscellaneous expenses on the Statement of Operations. During the period, the Fund did not borrow on this line of credit.
7. Expense Reductions.
Through arrangements with the Fund's custodian, credits realized as a result of certain uninvested cash balances were used to reduce the Fund's expenses. During the period, these credits reduced the Fund's custody expenses by $37.
In addition, during the period the investment adviser reimbursed and/or waived a portion of fund-level operating expenses in the amount of $40.
8. Distributions to Shareholders.
Distributions to shareholders of each class were as follows:
| Year ended October 31, 2016 | Year ended October 31, 2015 | |
| From net investment income | ||
| Class A | $28,998 | $33,971 |
| Class T | 6,712 | 7,344 |
| Class B | 210 | 423 |
| Class C | 19,076 | 20,389 |
| Fidelity Floating Rate High Income Fund | 244,237 | 280,321 |
| Class I | 83,907 | 106,381 |
| Total | $383,140 | $448,829 |
| From net realized gain | ||
| Class A | $– | $4,660 |
| Class T | – | 949 |
| Class B | – | 67 |
| Class C | – | 3,316 |
| Fidelity Floating Rate High Income Fund | – | 35,966 |
| Class I | – | 13,087 |
| Total | $– | $58,045 |
9. Share Transactions.
Share transactions for each class were as follows and may contain automatic conversions between classes or exchanges between affiliated funds:
| Shares | Shares | Dollars | Dollars | |
| Year ended October 31, 2016 | Year ended October 31, 2015 | Year ended October 31, 2016 | Year ended October 31, 2015 | |
| Class A | ||||
| Shares sold | 13,632 | 14,549 | $127,187 | $140,420 |
| Reinvestment of distributions | 2,814 | 3,585 | 26,169 | 34,673 |
| Shares redeemed | (34,450) | (46,740) | (318,820) | (452,094) |
| Net increase (decrease) | (18,004) | (28,606) | $(165,464) | $(277,001) |
| Class T | ||||
| Shares sold | 1,326 | 2,073 | $12,365 | $20,042 |
| Reinvestment of distributions | 671 | 799 | 6,235 | 7,716 |
| Shares redeemed | (4,884) | (6,523) | (45,244) | (63,018) |
| Net increase (decrease) | (2,887) | (3,651) | $(26,644) | $(35,260) |
| Class B | ||||
| Shares sold | 10 | 106 | $96 | $1,023 |
| Reinvestment of distributions | 19 | 44 | 177 | 429 |
| Shares redeemed | (1,219) | (682) | (11,330) | (6,588) |
| Net increase (decrease) | (1,190) | (532) | $(11,057) | $(5,136) |
| Class C | ||||
| Shares sold | 5,299 | 7,045 | $49,451 | $68,101 |
| Reinvestment of distributions | 1,645 | 1,955 | 15,298 | 18,899 |
| Shares redeemed | (17,529) | (22,521) | (162,349) | (217,845) |
| Net increase (decrease) | (10,585) | (13,521) | $(97,600) | $(130,845) |
| Fidelity Floating Rate High Income Fund | ||||
| Shares sold | 152,772 | 148,966 | $1,428,276 | $1,441,402 |
| Reinvestment of distributions | 21,133 | 26,586 | 196,548 | 256,678 |
| Shares redeemed | (237,658) | (390,276) | (2,193,671) | (3,761,603) |
| Net increase (decrease) | (63,753) | (214,724) | $(568,847) | $(2,063,523) |
| Class I | ||||
| Shares sold | 58,131 | 66,570 | $539,868 | $643,823 |
| Reinvestment of distributions | 5,808 | 7,469 | 53,924 | 72,034 |
| Shares redeemed | (139,996) | (152,936) | (1,297,890) | (1,472,931) |
| Net increase (decrease) | (76,057) | (78,897) | $(704,098) | $(757,074) |
10. Other.
The Fund's organizational documents provide former and current trustees and officers with a limited indemnification against liabilities arising in connection with the performance of their duties to the Fund. In the normal course of business, the Fund may also enter into contracts that provide general indemnifications. The Fund's maximum exposure under these arrangements is unknown as this would be dependent on future claims that may be made against the Fund. The risk of material loss from such claims is considered remote.
Report of Independent Registered Public Accounting Firm
To the Trustees of Fidelity Advisor Series I and Shareholders of Fidelity Advisor Floating Rate High Income Fund:
We have audited the accompanying statement of assets and liabilities of Fidelity Advisor Floating Rate High Income Fund (the Fund), a fund of Fidelity Advisor Series I, including the schedule of investments, as of October 31, 2016, and the related statement of operations for the year then ended, the statement of changes in net assets for each of the two years in the period then ended, and the financial highlights for each of the five years in the period then ended. These financial statements and financial highlights are the responsibility of the Fund's management. Our responsibility is to express an opinion on these financial statements and financial highlights based on our audits.
We conducted our audits in accordance with the standards of the Public Company Accounting Oversight Board (United States). Those standards require that we plan and perform the audit to obtain reasonable assurance about whether the financial statements and financial highlights are free of material misstatement. The Fund is not required to have, nor were we engaged to perform, an audit of its internal control over financial reporting. Our audits included consideration of internal control over financial reporting as a basis for designing audit procedures that are appropriate in the circumstances, but not for the purpose of expressing an opinion on the effectiveness of the Fund's internal control over financial reporting. Accordingly, we express no such opinion. An audit also includes examining, on a test basis, evidence supporting the amounts and disclosures in the financial statements, assessing the accounting principles used and significant estimates made by management, as well as evaluating the overall financial statement presentation. Our procedures included confirmation of securities owned as of October 31, 2016, by correspondence with the custodians, brokers, and agent banks; when replies were not received from brokers or agent banks, we performed other auditing procedures. We believe that our audits provide a reasonable basis for our opinion.
In our opinion, such financial statements and financial highlights referred to above present fairly, in all material respects, the financial position of Fidelity Advisor Floating Rate High Income Fund as of October 31, 2016, the results of its operations for the year then ended, the changes in its net assets for each of the two years in the period then ended, and the financial highlights for each of the five years in the period then ended, in conformity with accounting principles generally accepted in the United States of America.
DELOITTE & TOUCHE LLP
Boston, Massachusetts
December 16, 2016
Trustees and Officers
The Trustees, Members of the Advisory Board (if any), and officers of the trust and fund, as applicable, are listed below. The Board of Trustees governs the fund and is responsible for protecting the interests of shareholders. The Trustees are experienced executives who meet periodically throughout the year to oversee the fund's activities, review contractual arrangements with companies that provide services to the fund, oversee management of the risks associated with such activities and contractual arrangements, and review the fund's performance. Each of the Trustees oversees 170 funds.
The Trustees hold office without limit in time except that (a) any Trustee may resign; (b) any Trustee may be removed by written instrument, signed by at least two-thirds of the number of Trustees prior to such removal; (c) any Trustee who requests to be retired or who has become incapacitated by illness or injury may be retired by written instrument signed by a majority of the other Trustees; and (d) any Trustee may be removed at any special meeting of shareholders by a two-thirds vote of the outstanding voting securities of the trust. Each Trustee who is not an interested person (as defined in the 1940 Act) of the trust and the fund is referred to herein as an Independent Trustee. Each Independent Trustee shall retire not later than the last day of the calendar year in which his or her 75th birthday occurs. The Independent Trustees may waive this mandatory retirement age policy with respect to individual Trustees. Officers and Advisory Board Members hold office without limit in time, except that any officer or Advisory Board Member may resign or may be removed by a vote of a majority of the Trustees at any regular meeting or any special meeting of the Trustees. Except as indicated, each individual has held the office shown or other offices in the same company for the past five years.
The fund’s Statement of Additional Information (SAI) includes more information about the Trustees. To request a free copy, call Fidelity at 1-877-208-0098.
Experience, Skills, Attributes, and Qualifications of the Trustees. The Governance and Nominating Committee has adopted a statement of policy that describes the experience, qualifications, attributes, and skills that are necessary and desirable for potential Independent Trustee candidates (Statement of Policy). The Board believes that each Trustee satisfied at the time he or she was initially elected or appointed a Trustee, and continues to satisfy, the standards contemplated by the Statement of Policy. The Governance and Nominating Committee also engages professional search firms to help identify potential Independent Trustee candidates who have the experience, qualifications, attributes, and skills consistent with the Statement of Policy. From time to time, additional criteria based on the composition and skills of the current Independent Trustees, as well as experience or skills that may be appropriate in light of future changes to board composition, business conditions, and regulatory or other developments, have also been considered by the professional search firms and the Governance and Nominating Committee. In addition, the Board takes into account the Trustees' commitment and participation in Board and committee meetings, as well as their leadership of standing and ad hoc committees throughout their tenure.
In determining that a particular Trustee was and continues to be qualified to serve as a Trustee, the Board has considered a variety of criteria, none of which, in isolation, was controlling. The Board believes that, collectively, the Trustees have balanced and diverse experience, qualifications, attributes, and skills, which allow the Board to operate effectively in governing the fund and protecting the interests of shareholders. Information about the specific experience, skills, attributes, and qualifications of each Trustee, which in each case led to the Board's conclusion that the Trustee should serve (or continue to serve) as a trustee of the fund, is provided below.
Board Structure and Oversight Function. James C. Curvey is an interested person and currently serves as Chairman. The Trustees have determined that an interested Chairman is appropriate and benefits shareholders because an interested Chairman has a personal and professional stake in the quality and continuity of services provided to the fund. Independent Trustees exercise their informed business judgment to appoint an individual of their choosing to serve as Chairman, regardless of whether the Trustee happens to be independent or a member of management. The Independent Trustees have determined that they can act independently and effectively without having an Independent Trustee serve as Chairman and that a key structural component for assuring that they are in a position to do so is for the Independent Trustees to constitute a substantial majority for the Board. The Independent Trustees also regularly meet in executive session. Ned C. Lautenbach serves as Chairman of the Independent Trustees and as such (i) acts as a liaison between the Independent Trustees and management with respect to matters important to the Independent Trustees and (ii) with management prepares agendas for Board meetings.
Fidelity® funds are overseen by different Boards of Trustees. The fund's Board oversees Fidelity's high income and certain equity funds, and other Boards oversee Fidelity's investment-grade bond, money market, asset allocation, and sector funds. The asset allocation funds may invest in Fidelity® funds overseen by the fund's Board. The use of separate Boards, each with its own committee structure, allows the Trustees of each group of Fidelity® funds to focus on the unique issues of the funds they oversee, including common research, investment, and operational issues. On occasion, the separate Boards establish joint committees to address issues of overlapping consequences for the Fidelity® funds overseen by each Board.
The Trustees operate using a system of committees to facilitate the timely and efficient consideration of all matters of importance to the Trustees, the fund, and fund shareholders and to facilitate compliance with legal and regulatory requirements and oversight of the fund's activities and associated risks. The Board, acting through its committees, has charged FMR and its affiliates with (i) identifying events or circumstances the occurrence of which could have demonstrably adverse effects on the fund's business and/or reputation; (ii) implementing processes and controls to lessen the possibility that such events or circumstances occur or to mitigate the effects of such events or circumstances if they do occur; and (iii) creating and maintaining a system designed to evaluate continuously business and market conditions in order to facilitate the identification and implementation processes described in (i) and (ii) above. Because the day-to-day operations and activities of the fund are carried out by or through FMR, its affiliates, and other service providers, the fund's exposure to risks is mitigated but not eliminated by the processes overseen by the Trustees. While each of the Board's committees has responsibility for overseeing different aspects of the fund's activities, oversight is exercised primarily through the Operations, Audit, and Compliance Committees. In addition, the Independent Trustees have worked with FMR to enhance the Board's oversight of investment and financial risks, legal and regulatory risks, technology risks, and operational risks, including the development of additional risk reporting to the Board. For example, a working group comprised of Independent Trustees and FMR has worked and continues to work to review the Fidelity® funds' valuation-related activities, reporting and risk management. Appropriate personnel, including but not limited to the fund's Chief Compliance Officer (CCO), FMR's internal auditor, the independent accountants, the fund's Treasurer and portfolio management personnel, make periodic reports to the Board's committees, as appropriate, including an annual review of Fidelity's risk management program for the Fidelity® funds. The responsibilities of each standing committee, including their oversight responsibilities, are described further under "Standing Committees of the Trustees."
Interested Trustees*:
Correspondence intended for a Trustee who is an interested person may be sent to Fidelity Investments, 245 Summer Street, Boston, Massachusetts 02210.
Name, Year of Birth; Principal Occupations and Other Relevant Experience+
James C. Curvey (1935)
Year of Election or Appointment: 2007
Trustee
Chairman of the Board of Trustees
Mr. Curvey also serves as Trustee of other Fidelity® funds. Mr. Curvey is a Director of Fidelity Research & Analysis Co. (investment adviser firm, 2009-present), and Vice Chairman (2007-present) and Director of FMR LLC (diversified financial services company). In addition, Mr. Curvey serves as an Overseer for the Boston Symphony Orchestra and a member of the board of Artis-Naples, Naples, Florida, and as a Trustee for Brewster Academy, Wolfeboro, New Hampshire. Previously, Mr. Curvey served as a Director of Fidelity Investments Money Management, Inc. (investment adviser firm, 2009-2014) and a Director of FMR and FMR Co., Inc. (investment adviser firms, 2007-2014).
Charles S. Morrison (1960)
Year of Election or Appointment: 2014
Trustee
Mr. Morrison also serves as Trustee of other funds. He serves as President of Fidelity Management & Research Company (FMR) (investment adviser firm, 2016-present), a Director of Fidelity Investments Money Management, Inc. (FIMM) (investment adviser firm, 2014-present), Director of Fidelity SelectCo, LLC (investment adviser firm, 2014-present), President, Asset Management (2014-present), and is an employee of Fidelity Investments. Previously, Mr. Morrison served as Vice President of Fidelity's Fixed Income and Asset Allocation Funds (2012-2014), President, Fixed Income (2011-2014), Vice President of Fidelity's Money Market Funds (2005-2009), President, Money Market Group Leader of FMR (investment adviser firm, 2009), and Senior Vice President, Money Market Group of FMR (2004-2009). Mr. Morrison also served as Vice President of Fidelity's Bond Funds (2002-2005), certain Balanced Funds (2002-2005), and certain Asset Allocation Funds (2002-2007), and as Senior Vice President (2002-2005) of Fidelity's Bond Division.
* Determined to be an “Interested Trustee” by virtue of, among other things, his or her affiliation with the trust or various entities under common control with FMR.
+ The information includes the Trustee's principal occupation during the last five years and other information relating to the experience, attributes, and skills relevant to the Trustee's qualifications to serve as a Trustee, which led to the conclusion that the Trustee should serve as a Trustee for the fund.
Independent Trustees:
Correspondence intended for an Independent Trustee may be sent to Fidelity Investments, P.O. Box 55235, Boston, Massachusetts 02205-5235.
Name, Year of Birth; Principal Occupations and Other Relevant Experience+
Dennis J. Dirks (1948)
Year of Election or Appointment: 2005
Trustee
Mr. Dirks also serves as Trustee of other Fidelity® funds. Prior to his retirement in May 2003, Mr. Dirks was Chief Operating Officer and a member of the Board of The Depository Trust & Clearing Corporation (DTCC). He also served as President, Chief Operating Officer, and Board member of The Depository Trust Company (DTC) and President and Board member of the National Securities Clearing Corporation (NSCC). In addition, Mr. Dirks served as Chief Executive Officer and Board member of the Government Securities Clearing Corporation, Chief Executive Officer and Board member of the Mortgage-Backed Securities Clearing Corporation, as a Trustee and a member of the Finance Committee of Manhattan College (2005-2008), as a Trustee and a member of the Finance Committee of AHRC of Nassau County (2006-2008), and as a member of the Independent Directors Council (IDC) Governing Council (2010-2015). Mr. Dirks is a member of the Board of Directors for The Brookville Center for Children's Services, Inc. (2009-present).
Alan J. Lacy (1953)
Year of Election or Appointment: 2008
Trustee
Mr. Lacy also serves as Trustee of other Fidelity® funds. Mr. Lacy serves as Chairman (2014-present) and a member (2010-present) of the Board of Directors of Dave & Buster's Entertainment, Inc. (restaurant and entertainment complexes) and a Director of Bristol-Myers Squibb Company (global pharmaceuticals, 2008-present). He is a Trustee of the California Chapter of The Nature Conservancy (2015-present) and a Director of the Center for Advanced Study in the Behavioral Sciences at Stanford University (2015-present). In addition, Mr. Lacy served as Senior Adviser (2007-2014) of Oak Hill Capital Partners, L.P. (private equity) and also served as Chief Executive Officer (2005) and Vice Chairman (2005-2006) of Sears Holdings Corporation (retail) and Chief Executive Officer and Chairman of the Board of Sears, Roebuck and Co. (retail, 2000-2005). Previously, Mr. Lacy served as Chairman (2008-2011) and a member (2006-2015) of the Board of Trustees of the National Parks Conservation Association and as a member of the Board of Directors for The Western Union Company (global money transfer, 2006-2011), The Hillman Companies, Inc. (hardware wholesalers, 2010-2014), and Earth Fare, Inc. (retail grocery, 2010-2014).
Ned C. Lautenbach (1944)
Year of Election or Appointment: 2000
Trustee
Chairman of the Independent Trustees
Mr. Lautenbach also serves as Trustee of other Fidelity® funds. Mr. Lautenbach currently serves as the Lead Director of the Eaton Corporation Board of Directors (diversified industrial, 1997-present). Mr. Lautenbach is Chairman of the Board of Directors of Artis-Naples in Naples, Florida (2012-present), a member of the Council on Foreign Relations (1994-present), and a member of the Board of Governors, State University System of Florida (2013-present). Previously, Mr. Lautenbach was a Partner/Advisory Partner at Clayton, Dubilier & Rice, LLC (private equity investment, 1998-2010), as well as a Director of Sony Corporation (2006-2007).
Joseph Mauriello (1944)
Year of Election or Appointment: 2008
Trustee
Mr. Mauriello also serves as Trustee of other Fidelity® funds. Prior to his retirement in January 2006, Mr. Mauriello served in numerous senior management positions including Deputy Chairman and Chief Operating Officer (2004-2005), and Vice Chairman of Financial Services (2002-2004) of KPMG LLP US (professional services, 1965-2005). Mr. Mauriello currently serves as a member of the Board of Directors of XL Group plc. (global insurance and re-insurance, 2006-present) and the Independent Directors Council (IDC) Governing Council (2015-present). Previously, Mr. Mauriello served as a Director of the Hamilton Funds of the Bank of New York (2006-2007) and of Arcadia Resources Inc. (health care services and products, 2007-2012).
Robert W. Selander (1950)
Year of Election or Appointment: 2011
Trustee
Mr. Selander also serves as Trustee of other Fidelity® funds. Mr. Selander serves as a Director of The Western Union Company (global money transfer, 2014-present) and a non-executive Chairman of Health Equity, Inc. (health savings custodian, 2015-present). Previously, Mr. Selander served as a Member of the Advisory Board of certain Fidelity® funds (2011), and Executive Vice Chairman (2010), Chief Executive Officer (2009-2010), and President and Chief Executive Officer (1997-2009) of Mastercard, Inc.
Cornelia M. Small (1944)
Year of Election or Appointment: 2005
Trustee
Ms. Small also serves as Trustee of other Fidelity® funds. Ms. Small is a member of the Board of Directors (2009-present) and Chair of the Investment Committee (2010-present) of the Teagle Foundation. Ms. Small also serves on the Investment Committee of the Berkshire Taconic Community Foundation (2008-present). Previously, Ms. Small served as Chairperson (2002-2008) and a member of the Investment Committee and Chairperson (2008-2012) and a member of the Board of Trustees of Smith College. In addition, Ms. Small served as Chief Investment Officer, Director of Global Equity Investments, and a member of the Board of Directors of Scudder, Stevens & Clark and Scudder Kemper Investments.
William S. Stavropoulos (1939)
Year of Election or Appointment: 2002
Trustee
Vice Chairman of the Independent Trustees
Mr. Stavropoulos also serves as Trustee of other Fidelity® funds. Mr. Stavropoulos serves as President and Founder of the Michigan Baseball Foundation, the Great Lakes Loons (2007-present). Mr. Stavropoulos is Chairman Emeritus of the Board of Directors of The Dow Chemical Company, where he previously served in numerous senior management positions, including President, CEO (1995-2000; 2002-2004), Chairman of the Executive Committee (2000-2006), and as a member of the Board of Directors (1990-2006). Currently, Mr. Stavropoulos is Chairman of the Board of Directors of Univar Inc. (global distributor of commodity and specialty chemicals), a Director of Teradata Corporation (data warehousing and technology solutions), and Maersk Inc. (industrial conglomerate), and a member of the Advisory Board for Metalmark Capital LLC (private equity investment, 2005-present). Mr. Stavropoulos is an operating advisor to Clayton, Dubilier & Rice, LLC (private equity investment). In addition, Mr. Stavropoulos is a member of the University of Notre Dame Advisory Council for the College of Science, a Trustee of the Rollin L. Gerstacker Foundation, and a Director of the Naples Philharmonic Center for the Arts. Previously, Mr. Stavropoulos served as a Director of Chemical Financial Corporation (bank holding company, 1993-2012) and Tyco International, Ltd. (multinational manufacturing and services, 2007-2012).
David M. Thomas (1949)
Year of Election or Appointment: 2008
Trustee
Mr. Thomas also serves as Trustee of other Fidelity® funds. Mr. Thomas serves as Non-Executive Chairman of the Board of Directors of Fortune Brands Home and Security (home and security products, 2011-present), as a member of the Board of Directors (2004-present) and Presiding Director (2013-present) of Interpublic Group of Companies, Inc. (marketing communication), and as a member of the Board of Trustees of the University of Florida (2013-present). Previously, Mr. Thomas served as Executive Chairman (2005-2006) and Chairman and Chief Executive Officer (2000-2005) of IMS Health, Inc. (pharmaceutical and healthcare information solutions), and a Director of Fortune Brands, Inc. (consumer products, 2000-2011).
+ The information includes the Trustee's principal occupation during the last five years and other information relating to the experience, attributes, and skills relevant to the Trustee's qualifications to serve as a Trustee, which led to the conclusion that the Trustee should serve as a Trustee for the fund.
Advisory Board Members and Officers:
Correspondence intended for an officer or Peter S. Lynch may be sent to Fidelity Investments, 245 Summer Street, Boston, Massachusetts 02210. Officers appear below in alphabetical order.
Name, Year of Birth; Principal Occupation
Peter S. Lynch (1944)
Year of Election or Appointment: 2003
Member of the Advisory Board
Mr. Lynch also serves as Member of the Advisory Board of other Fidelity® funds. Mr. Lynch is Vice Chairman and a Director of FMR (investment adviser firm) and FMR Co., Inc. (investment adviser firm). In addition, Mr. Lynch serves as a Trustee of Boston College and as the Chairman of the Inner-City Scholarship Fund. Previously, Mr. Lynch served on the Special Olympics International Board of Directors (1997-2006).
Marc R. Bryant (1966)
Year of Election or Appointment: 2015
Secretary and Chief Legal Officer (CLO)
Mr. Bryant also serves as Secretary and CLO of other funds. Mr. Bryant serves as CLO, Secretary, and Senior Vice President of Fidelity Management & Research Company (investment adviser firm, 2015-present) and FMR Co., Inc. (investment adviser firm, 2015-present); Secretary of Fidelity SelectCo, LLC (investment adviser firm, 2015-present) and Fidelity Investments Money Management, Inc. (investment adviser firm, 2015-present); and CLO of Fidelity Management & Research (Hong Kong) Limited and FMR Investment Management (UK) Limited (investment adviser firms, 2015-present) and Fidelity Management & Research (Japan) Limited (investment adviser firm, 2016-present). He is Senior Vice President and Deputy General Counsel of FMR LLC (diversified financial services company). Previously, Mr. Bryant served as Secretary and CLO of Fidelity Rutland Square Trust II (2010-2014) and Assistant Secretary of Fidelity's Fixed Income and Asset Allocation Funds (2013-2015). Prior to joining Fidelity Investments, Mr. Bryant served as a Senior Vice President and the Head of Global Retail Legal for AllianceBernstein L.P. (2006-2010), and as the General Counsel for ProFund Advisors LLC (2001-2006).
Jeffrey S. Christian (1961)
Year of Election or Appointment: 2016
Assistant Treasurer
Mr. Christian also serves as Assistant Treasurer of other funds. Mr. Christian is an employee of Fidelity Investments (2003-present).
William C. Coffey (1969)
Year of Election or Appointment: 2009
Assistant Secretary
Mr. Coffey also serves as Assistant Secretary of other funds. He is Senior Vice President and Deputy General Counsel of FMR LLC (diversified financial services company, 2010-present), and is an employee of Fidelity Investments. Previously, Mr. Coffey served as Vice President and Associate General Counsel of FMR LLC (2005-2009).
Jonathan Davis (1968)
Year of Election or Appointment: 2010
Assistant Treasurer
Mr. Davis also serves as Assistant Treasurer of other funds, and is an employee of Fidelity Investments. Previously, Mr. Davis served as Vice President and Associate General Counsel of FMR LLC (diversified financial services company, 2003-2010).
Adrien E. Deberghes (1967)
Year of Election or Appointment: 2016
Assistant Treasurer
Mr. Deberghes also serves as an officer of other funds. He serves as Executive Vice President of Fidelity Investments Money Management, Inc. (FIMM) (investment adviser firm, 2016-present) and is an employee of Fidelity Investments (2008-present). Prior to joining Fidelity Investments, Mr. Deberghes was Senior Vice President of Mutual Fund Administration at State Street Corporation (2007-2008), Senior Director of Mutual Fund Administration at Investors Bank & Trust (2005-2007), and Director of Finance for Dunkin' Brands (2000-2005). Previously, Mr. Deberghes served in other fund officer roles.
Stephanie J. Dorsey (1969)
Year of Election or Appointment: 2010
Assistant Treasurer
Ms. Dorsey also serves as an officer of other funds. She is an employee of Fidelity Investments (2008-present) and has served in other fund officer roles. Prior to joining Fidelity Investments, Ms. Dorsey served as Treasurer (2004-2008) of the JPMorgan Mutual Funds and Vice President (2004-2008) of JPMorgan Chase Bank.
Howard J. Galligan III (1966)
Year of Election or Appointment: 2014
Chief Financial Officer
Mr. Galligan also serves as Chief Financial Officer of other funds. Mr. Galligan serves as President of Fidelity Pricing and Cash Management Services (FPCMS) (2014-present) and as a Director of Strategic Advisers, Inc. (investment adviser firm, 2008-present). Previously, Mr. Galligan served as Chief Administrative Officer of Asset Management (2011-2014) and Chief Operating Officer and Senior Vice President of Investment Support for Strategic Advisers, Inc. (2003-2011).
Scott C. Goebel (1968)
Year of Election or Appointment: 2015
Vice President
Mr. Goebel serves as Vice President of other funds and is an employee of Fidelity Investments (2001-present). Previously, Mr. Goebel served as Senior Vice President of Fidelity Management & Research Company (FMR) (investment adviser firm, 2016), Secretary of Fidelity SelectCo, LLC (investment adviser firm, 2013-2015), Fidelity Investments Money Management, Inc. (FIMM) (investment adviser firm, 2010-2015), and Fidelity Research and Analysis Company (FRAC) (investment adviser firm, 2010-2015); General Counsel, Secretary, and Senior Vice President of FMR (investment adviser firm, 2008-2015) and FMR Co., Inc. (investment adviser firm, 2008-2015); Assistant Secretary of Fidelity Management & Research (Japan) Limited (investment adviser firm, 2008-2015) and Fidelity Management & Research (U.K.) Inc. (investment adviser firm, 2008-2015); Chief Legal Officer (CLO) of Fidelity Management & Research (Hong Kong) Limited (investment adviser firm, 2008-2015); Secretary and CLO of certain Fidelity® funds (2008-2015); Assistant Secretary of FIMM (2008-2010), FRAC (2008-2010), and certain funds (2007-2008); and as Vice President and Secretary of Fidelity Distributors Corporation (FDC) (2005-2007).
Thomas C. Hense (1964)
Year of Election or Appointment: 2008, 2010, or 2015
Vice President
Mr. Hense serves as Vice President of Fidelity Advisor® Multi-Asset Income Fund (2015) and other funds (High Income (2008), Small Cap (2008), and Value (2010) funds), and is an employee of Fidelity Investments (1993-present). Previously, Mr. Hense served as a portfolio manager for Fidelity's Institutional Money Management Group (Pyramis) (2003-2008).
Brian B. Hogan (1964)
Year of Election or Appointment: 2009
Vice President
Mr. Hogan also serves as Trustee or Vice President of other funds. Mr. Hogan serves as a Director of FMR Investment Management (UK) Limited (investment adviser firm, 2015-present) and Fidelity SelectCo, LLC (investment adviser firm, 2014-present) and President of the Equity Division of FMR (investment adviser firm, 2009-present). Previously, Mr. Hogan served as Senior Vice President, Equity Research of FMR (2006-2009) and as a portfolio manager. Mr. Brian B. Hogan is not related to Mr. Colm A. Hogan.
Colm A. Hogan (1973)
Year of Election or Appointment: 2016
Deputy Treasurer
Mr. Hogan also serves as an officer of other funds. Mr. Hogan is an employee of Fidelity Investments (2005-present). Mr. Colm A. Hogan is not related to Mr. Brian B. Hogan.
Chris Maher (1972)
Year of Election or Appointment: 2013
Assistant Treasurer
Mr. Maher serves as Assistant Treasurer of other funds. Mr. Maher is Vice President of Valuation Oversight and is an employee of Fidelity Investments. Previously, Mr. Maher served as Vice President of Asset Management Compliance (2013), Vice President of the Program Management Group of FMR (investment adviser firm, 2010-2013), and Vice President of Valuation Oversight (2008-2010).
John F. Papandrea (1972)
Year of Election or Appointment: 2016
Anti-Money Laundering (AML) Officer
Mr. Papandrea also serves as AML Officer of other funds. Mr. Papandrea is Vice President of FMR LLC (diversified financial services company, 2008-present) and is an employee of Fidelity Investments (2005-present).
Kenneth B. Robins (1969)
Year of Election or Appointment: 2016
Chief Compliance Officer
Mr. Robins also serves as an officer of other funds. Mr. Robins serves as Compliance Officer of Fidelity Management & Research Company and FMR Co., Inc. (investment adviser firms, 2016-present) and is an employee of Fidelity Investments (2004-present). Previously, Mr. Robins served as Executive Vice President of Fidelity Investments Money Management, Inc. (investment adviser firm, 2013-2016) and served in other fund officer roles.
Stacie M. Smith (1974)
Year of Election or Appointment: 2016
President and Treasurer
Ms. Smith also serves as an officer of other funds. She is an employee of Fidelity Investments (2009-present) and has served in other fund officer roles. Prior to joining Fidelity Investments, Ms. Smith served as Senior Audit Manager of Ernst & Young LLP (accounting firm, 1996-2009). Previously, Ms. Smith served as Deputy Treasurer of certain Fidelity® funds (2013-2016).
Marc L. Spector (1972)
Year of Election or Appointment: 2016
Assistant Treasurer
Mr. Spector also serves as an officer of other funds. Mr. Spector is an employee of Fidelity Investments (2016-present). Prior to joining Fidelity Investments, Mr. Spector served as Director at the Siegfried Group (accounting firm, 2013-2016), and prior to Siegfried Group as audit senior manager at Deloitte & Touche (accounting firm, 2005-2013).
Renee Stagnone (1975)
Year of Election or Appointment: 2016
Assistant Treasurer
Ms. Stagnone also serves as an officer of other funds. Ms. Stagnone is an employee of Fidelity Investments (1997-present). Previously, Ms. Stagnone served as Deputy Treasurer of certain Fidelity® funds (2013-2016).
Shareholder Expense Example
As a shareholder of the Fund, you incur two types of costs: (1) transaction costs, including sales charges (loads) on purchase payments or redemption proceeds, redemption fees and (2) ongoing costs, including management fees, distribution and/or service (12b-1) fees and other Fund expenses. This Example is intended to help you understand your ongoing costs (in dollars) of investing in the Fund and to compare these costs with the ongoing costs of investing in other mutual funds.
The Example is based on an investment of $1,000 invested at the beginning of the period and held for the entire period (May 1, 2016 to October 31, 2016).
Actual Expenses
The first line of the accompanying table for each class of the Fund provides information about actual account values and actual expenses. You may use the information in this line, together with the amount you invested, to estimate the expenses that you paid over the period. Simply divide your account value by $1,000.00 (for example, an $8,600 account value divided by $1,000.00 = 8.6), then multiply the result by the number in the first line for a class of the Fund under the heading entitled "Expenses Paid During Period" to estimate the expenses you paid on your account during this period. A small balance maintenance fee of $12.00 that is charged once a year may apply for certain accounts with a value of less than $2,000. This fee is not included in the table below. If it was, the estimate of expenses you paid during the period would be higher, and your ending account value lower, by this amount. In addition, the Fund, as a shareholder in the underlying Fidelity Central Funds, will indirectly bear its pro-rata share of the fees and expenses incurred by the underlying Fidelity Central Funds. These fees and expenses are not included in the Fund's annualized expense ratio used to calculate the expense estimate in the table below.
Hypothetical Example for Comparison Purposes
The second line of the accompanying table for each class of the Fund provides information about hypothetical account values and hypothetical expenses based on a Class' actual expense ratio and an assumed rate of return of 5% per year before expenses, which is not the Class' actual return. The hypothetical account values and expenses may not be used to estimate the actual ending account balance or expenses you paid for the period. You may use this information to compare the ongoing costs of investing in the Fund and other funds. To do so, compare this 5% hypothetical example with the 5% hypothetical examples that appear in the shareholder reports of the other funds. A small balance maintenance fee of $12.00 that is charged once a year may apply for certain accounts with a value of less than $2,000. This fee is not included in the table below. If it was, the estimate of expenses you paid during the period would be higher, and your ending account value lower, by this amount. In addition, the Fund, as a shareholder in the underlying Fidelity Central Funds, will indirectly bear its pro-rata share of the fees and expenses incurred by the underlying Fidelity Central Funds. These fees and expenses are not included in the Fund's annualized expense ratio used to calculate the expense estimate in the table below.
Please note that the expenses shown in the table are meant to highlight your ongoing costs only and do not reflect any transaction costs. Therefore, the second line of the table is useful in comparing ongoing costs only, and will not help you determine the relative total costs of owning different funds. In addition, if these transactional costs were included, your costs would have been higher.
| Annualized Expense Ratio-A | Beginning Account Value May 1, 2016 | Ending Account Value October 31, 2016 | Expenses Paid During Period-B May 1, 2016 to October 31, 2016 |
|
| Class A | .98% | |||
| Actual | $1,000.00 | $1,044.50 | $5.04 | |
| Hypothetical-C | $1,000.00 | $1,020.21 | $4.98 | |
| Class T | 1.07% | |||
| Actual | $1,000.00 | $1,044.00 | $5.50 | |
| Hypothetical-C | $1,000.00 | $1,019.76 | $5.43 | |
| Class C | 1.73% | |||
| Actual | $1,000.00 | $1,039.50 | $8.87 | |
| Hypothetical-C | $1,000.00 | $1,016.44 | $8.77 | |
| Fidelity Floating Rate High Income Fund | .70% | |||
| Actual | $1,000.00 | $1,044.90 | $3.60 | |
| Hypothetical-C | $1,000.00 | $1,021.62 | $3.56 | |
| Class I | .75% | |||
| Actual | $1,000.00 | $1,045.70 | $3.86 | |
| Hypothetical-C | $1,000.00 | $1,021.37 | $3.81 |
A Annualized expense ratio reflects expenses net of applicable fee waivers.
B Expenses are equal to each Class' annualized expense ratio, multiplied by the average account value over the period, multiplied by 184/366 (to reflect the one-half year period).
C 5% return per year before expenses
Distributions (Unaudited)
A total of 0.21% of the dividends distributed during the fiscal year was derived from interest on U.S. Government securities which is generally exempt from state income tax.
The fund designates $268,085,063 of distributions paid during the period January 1, 2016 to October 31, 2016 as qualifying to be taxed as interest-related dividends for nonresident alien shareholders.
The fund will notify shareholders in January 2017 of amounts for use in preparing 2016 income tax returns.
Board Approval of Investment Advisory Contracts and Management Fees
Fidelity Advisor Floating Rate High Income Fund
Each year, the Board of Trustees, including the Independent Trustees (together, the Board), votes on the renewal of the management contract with Fidelity Management & Research Company (FMR) and the sub-advisory agreements (together, the Advisory Contracts) for the fund. The Board, assisted by the advice of fund counsel and Independent Trustees' counsel, requests and considers a broad range of information relevant to the renewal of the Advisory Contracts throughout the year.
The Board meets regularly and, at each of its meetings, covers an extensive agenda of topics and materials and considers factors that are relevant to its annual consideration of the renewal of the fund's Advisory Contracts, including the services and support provided to the fund and its shareholders. The Board has established various standing committees (Committees), each composed of and chaired by Independent Trustees with varying backgrounds, to which the Board has assigned specific subject matter responsibilities in order to enhance effective decision-making by the Board. The Board, acting directly and through its Committees, requests and receives information concerning the annual consideration of the renewal of the fund's Advisory Contracts. The Board also meets as needed to consider matters specifically related to the Board's annual consideration of the renewal of the Advisory Contracts. Members of the Board may also meet with trustees of other Fidelity funds through ad hoc joint committees to discuss certain matters relevant to all of the Fidelity funds.
At its July 2016 meeting, the Board unanimously determined to renew the fund's Advisory Contracts. In reaching its determination, the Board considered all factors it believed relevant, including (i) the nature, extent, and quality of the services to be provided to the fund and its shareholders (including the investment performance of the fund); (ii) the competitiveness of the fund's management fee and total expense ratio relative to peer funds; (iii) the total costs of the services to be provided by and the profits to be realized by Fidelity from its relationships with the fund; and (iv) the extent to which, if any, economies of scale exist and would be realized as the fund grows, and whether any economies of scale are appropriately shared with fund shareholders.
In considering whether to renew the Advisory Contracts for the fund, the Board reached a determination, with the assistance of fund counsel and Independent Trustees' counsel and through the exercise of its business judgment, that the renewal of the Advisory Contracts was in the best interests of the fund and its shareholders and that the compensation payable under the Advisory Contracts was fair and reasonable. The Board's decision to renew the Advisory Contracts was not based on any single factor, but rather was based on a comprehensive consideration of all the information provided to the Board at its meetings throughout the year. The Board, in reaching its determination to renew the Advisory Contracts, was aware that shareholders of the fund have a broad range of investment choices available to them, including a wide choice among funds offered by Fidelity's competitors, and that the fund's shareholders, who have the opportunity to review and weigh the disclosure provided by the fund in its prospectus and other public disclosures, have chosen to invest in this fund, which is part of the Fidelity family of funds.
Nature, Extent, and Quality of Services Provided. The Board considered Fidelity's staffing as it relates to the fund, including the backgrounds of investment personnel of Fidelity, and also considered the fund's investment objective, strategies, and related investment philosophy. The Independent Trustees also had discussions with senior management of Fidelity's investment operations and investment groups. The Board considered the structure of the investment personnel compensation program and whether this structure provides appropriate incentives to act in the best interests of the fund. Additionally, the Board considered the portfolio managers' investments, if any, in the funds that they manage. Resources Dedicated to Investment Management and Support Services. The Board and the Fund Oversight and Research Committees reviewed the general qualifications and capabilities of Fidelity's investment staff, including its size, education, experience, and resources, as well as Fidelity's approach to recruiting, training, managing, and compensating investment personnel. The Board noted that Fidelity has continued to increase the resources devoted to non-U.S. offices, including expansion of Fidelity's global investment organization. The Board also noted that Fidelity's analysts have extensive resources, tools and capabilities that allow them to conduct sophisticated quantitative and fundamental analysis, as well as credit analysis of issuers, counterparties and guarantors. Further, the Board considered that Fidelity's investment professionals have sufficient access to global information and data so as to provide competitive investment results over time, and that those professionals also have access to sophisticated tools that permit them to assess portfolio construction and risk and performance attribution characteristics continuously, as well as to transmit new information and research conclusions rapidly around the world. Additionally, in its deliberations, the Board considered Fidelity's trading, risk management, compliance, and technology and operations capabilities and resources, which are integral parts of the investment management process. Shareholder and Administrative Services. The Board considered (i) the nature, extent, quality, and cost of advisory, administrative, and shareholder services performed by FMR, the sub-advisers (together with FMR, the Investment Advisers), and their affiliates under the Advisory Contracts and under separate agreements covering transfer agency, pricing and bookkeeping, and securities lending services for the fund; (ii) the nature and extent of the supervision of third party service providers, principally custodians, subcustodians, and pricing vendors; and (iii) the resources devoted to, and the record of compliance with, the fund's compliance policies and procedures. The Board also reviewed the allocation of fund brokerage, including allocations to brokers affiliated with the Investment Advisers, the use of brokerage commissions to pay fund expenses, and the use of "soft" commission dollars to pay for research services.The Board noted that the growth of fund assets over time across the complex allows Fidelity to reinvest in the development of services designed to enhance the value or convenience of the Fidelity funds as investment vehicles. These services include 24-hour access to account information and market information through telephone representatives and over the Internet, investor education materials and asset allocation tools, and the expanded availability of Fidelity Investor Centers.In 2014, the Board formed an ad hoc Committee on Transfer Agency Fees to review the variety of transfer agency fee structures throughout the industry and Fidelity's competitive positioning with respect to industry participants. Investment in a Large Fund Family. The Board considered the benefits to shareholders of investing in a Fidelity fund, including the benefits of investing in a fund that is part of a large family of funds offering a variety of investment disciplines and providing a large variety of mutual fund investor services. The Board noted that Fidelity had taken, or had made recommendations that resulted in the Fidelity funds taking, a number of actions over the previous year that benefited particular funds, including: (i) continuing to dedicate additional resources to investment research and to the support of the senior management team that oversees asset management; (ii) continuing efforts to enhance Fidelity's global research capabilities; (iii) launching new funds and making other enhancements to meet client needs; (iv) broadening eligibility requirements for certain lower-priced share classes of, and streamlining the fee structure for, certain existing equity index funds; (v) lowering expense caps for certain existing funds and classes to reduce expenses paid by shareholders; (vi) eliminating redemption fees for certain variable insurance product funds and classes; (vii) continuing to launch dedicated lower cost underlying funds to meet portfolio construction needs related to expanding underlying fund options for Fidelity funds of funds, specifically for the Freedom Fund product lines; (viii) launching a lower cost share class for use by the Freedom Index Fund product line; (ix) rationalizing product lines and gaining increased efficiencies through fund mergers and share class consolidations; (x) continuing to develop, acquire and implement systems and technology to improve services to the funds and shareholders, strengthen information security, and increase efficiency; (xi) implementing investment enhancements to further strengthen Fidelity's target date product line to increase investors' probability of success in achieving their goals; (xii) accelerating the conversion of all remaining Class B shares to Class A shares, which have a lower expense structure; and (xiii) implementing changes to Fidelity's money market fund product line in response to recent regulatory reforms. Investment Performance. The Board considered whether the fund has operated in accordance with its investment objective, as well as its record of compliance with its investment restrictions and its performance history.The Board took into account discussions with representatives of the Investment Advisers about fund investment performance that occur at Board meetings throughout the year. In this regard the Board noted that as part of regularly scheduled fund reviews and other reports to the Board on fund performance, the Board considers annualized return information for the fund, for different time periods, measured against a securities market index ("benchmark index") and a peer group of funds with similar objectives ("peer group"), if any. In its evaluation of fund investment performance, the Board gave particular attention to information indicating changes in performance of certain Fidelity funds for specific time periods and discussed with the Investment Advisers the reasons for any overperformance or underperformance.In addition to reviewing absolute and relative fund performance, the Independent Trustees periodically consider the appropriateness of fund performance metrics in evaluating the results achieved. In general, the Independent Trustees believe that fund performance should be evaluated based on net performance (after fees and expenses) of both the highest performing and lowest performing fund share classes, where applicable, compared to appropriate benchmark indices, over appropriate time periods that may include full market cycles, and compared to peer groups, as applicable, over the same periods, taking into account relevant factors including the following: general market conditions; issuer-specific information; and fund cash flows and other factors.The Independent Trustees recognize that shareholders evaluate performance on a net basis over their own holding periods, for which one-, three-, and five-year periods are often used as a proxy. For this reason, the performance information reviewed by the Board also included net cumulative calendar year total return information for the fund and an appropriate benchmark index and peer group for the most recent one-, three-, and five-year periods, as shown below. Returns are shown compared to the 25th percentile (top of box, 75% beaten) and 75th percentile (bottom of box, 25% beaten) of the peer universe.Fidelity Advisor Floating Rate High Income Fund

Fidelity Advisor Floating Rate High Income Fund
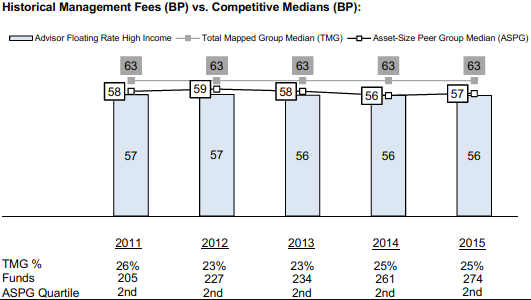
![]()
AFR-ANN-1216
1.750077.116
|
Fidelity® Floating Rate High Income Fund Annual Report October 31, 2016 |
|
|
Contents
|
Board Approval of Investment Advisory Contracts and Management Fees |
To view a fund's proxy voting guidelines and proxy voting record for the 12-month period ended June 30, visit http://www.fidelity.com/proxyvotingresults or visit the Securities and Exchange Commission's (SEC) web site at http://www.sec.gov.
You may also call 1-800-544-8544 to request a free copy of the proxy voting guidelines.
Standard & Poor's, S&P and S&P 500 are registered service marks of The McGraw-Hill Companies, Inc. and have been licensed for use by Fidelity Distributors Corporation.
Other third-party marks appearing herein are the property of their respective owners.
All other marks appearing herein are registered or unregistered trademarks or service marks of FMR LLC or an affiliated company. © 2016 FMR LLC. All rights reserved.
This report and the financial statements contained herein are submitted for the general information of the shareholders of the Fund. This report is not authorized for distribution to prospective investors in the Fund unless preceded or accompanied by an effective prospectus.
A fund files its complete schedule of portfolio holdings with the SEC for the first and third quarters of each fiscal year on Form N-Q. Forms N-Q are available on the SEC’s web site at http://www.sec.gov. A fund's Forms N-Q may be reviewed and copied at the SEC’s Public Reference Room in Washington, DC. Information regarding the operation of the SEC's Public Reference Room may be obtained by calling 1-800-SEC-0330.
For a complete list of a fund's portfolio holdings, view the most recent holdings listing, semiannual report, or annual report on Fidelity's web site at http://www.fidelity.com, http://www.institutional.fidelity.com, or http://www.401k.com, as applicable.
NOT FDIC INSURED •MAY LOSE VALUE •NO BANK GUARANTEE
Neither the Fund nor Fidelity Distributors Corporation is a bank.
Performance: The Bottom Line
Average annual total return reflects the change in the value of an investment, assuming reinvestment of distributions from dividend income and capital gains (the profits earned upon the sale of securities that have grown in value, if any) and assuming a constant rate of performance each year. The hypothetical investment and the average annual total returns do not reflect the deduction of taxes that a shareholder would pay on fund distributions or the redemption of fund shares. During periods of reimbursement by Fidelity, a fund’s total return will be greater than it would be had the reimbursement not occurred. How a fund did yesterday is no guarantee of how it will do tomorrow.
Average Annual Total Returns
| For the periods ended October 31, 2016 | Past 1 year | Past 5 years | Past 10 years |
| Fidelity® Floating Rate High Income Fund | 6.28% | 3.64% | 3.90% |
$10,000 Over 10 Years
Let's say hypothetically that $10,000 was invested in Fidelity® Floating Rate High Income Fund, a class of the fund, on October 31, 2006.
The chart shows how the value of your investment would have changed, and also shows how the S&P®/LSTA Leveraged Performing Loan Index performed over the same period.
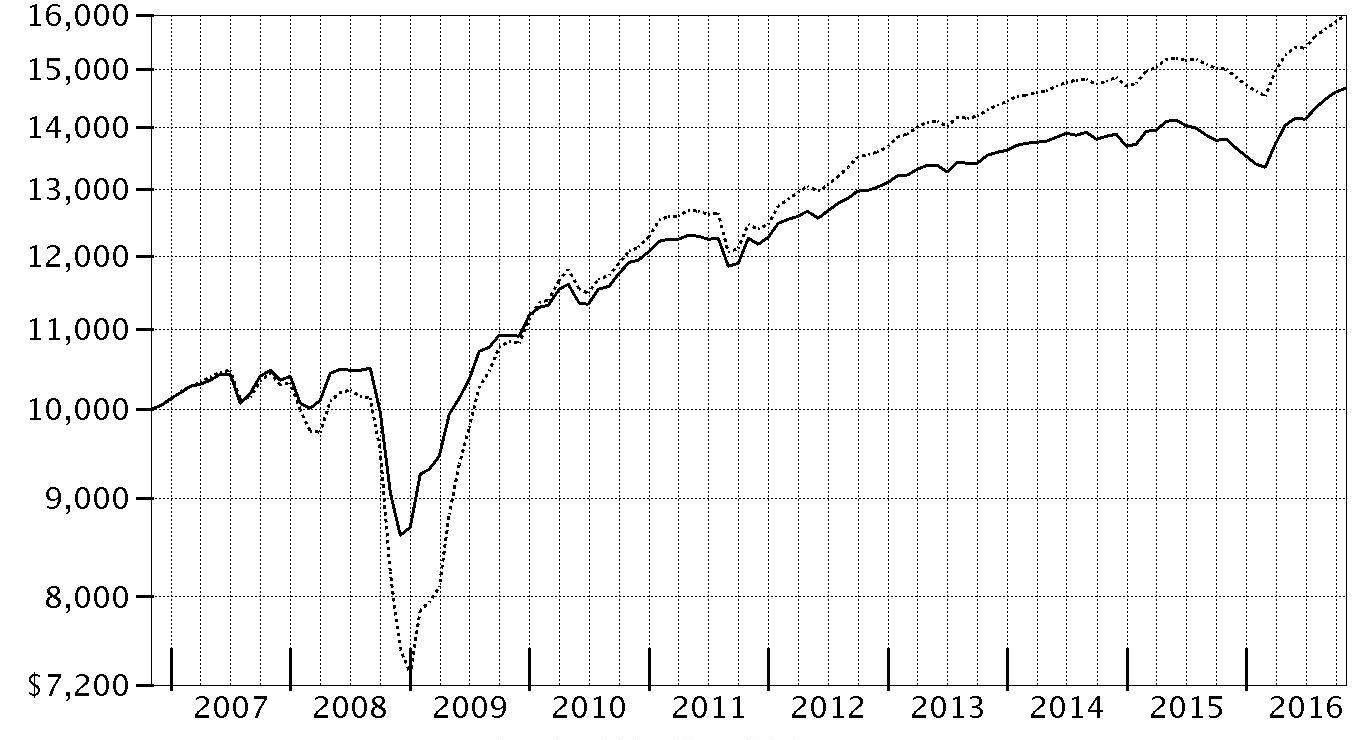
| Period Ending Values | ||
|
| $14,666 | Fidelity® Floating Rate High Income Fund |
|
| $15,996 | S&P®/LSTA Leveraged Performing Loan Index |
Management's Discussion of Fund Performance
Market Recap: Floating-rate bank loans posted a solid gain for the fiscal year ending October 31, 2016, sharply reversing course in March to end seven months of negative returns. The S&P/LSTA® Leveraged Performing Loan Index gained 6.62% the past year, lagging high-yield bonds but outpacing the broad investment-grade fixed-income market. Sharply falling oil prices, global economic uncertainty and investor risk aversion weighed on the asset class into mid-February. As February progressed, loans began to benefit from improvement across a range of global issues. Oil prices shifted into an uptrend, China’s central bank eased concern about its economy by implementing additional stimulus measures and improving U.S. economic data helped allay fears that global developments would stall U.S. expansion. The loan market extended its rally through May, bolstered by fading fears of a U.S. recession, robust stimulus from the European Central Bank and modestly increased demand for collateralized loan obligations. Following a brief, late-June disruption related to the U.K.’s vote to exit the European Union, or Brexit, loans advanced through October 31. Gains were broad-based across industries, led by steel, which rallied in step with recovering commodity prices. From a credit-quality perspective, lower-quality loans delivered the best performance, reflecting improved risk sentiment. Comments from Portfolio Manager Eric Mollenhauer: For the year, the fund’s share classes (excluding sales charges, if applicable) gained about 6%, modestly trailing the benchmark S&P/LSTA® Leveraged Performing Loan Index. A cash stake of roughly 7%, on average, was the primary factor hampering relative performance. During the period, a combination of loan repayments and investment sales pushed the fund’s cash allocation above my 5% target. Despite the fund’s conservative overall positioning, positive security selection among loans rated B and CCC helped performance stay relatively close to that of the benchmark in a rally led by lower-quality areas of the market. At the sector/industry level, security selection in health care was a modest drag on relative results. On the plus side, selections in lodging & casinos, leisure goods/activities/movies and nonferrous metals/minerals notably aided relative performance. The biggest individual detractors were an underweighting in oil & gas exploration & production company Fieldwood Energy and an out-of-benchmark position in coal mine operator Walter Energy. The loans of both of these firms were no longer in the fund as of period end, although we held an equity stake in Walter Energy. The top contributors were overweightings in coal producer Murray Energy and resort and casino operator Caesars Entertainment.The views expressed above reflect those of the portfolio manager(s) only through the end of the period as stated on the cover of this report and do not necessarily represent the views of Fidelity or any other person in the Fidelity organization. Any such views are subject to change at any time based upon market or other conditions and Fidelity disclaims any responsibility to update such views. These views may not be relied on as investment advice and, because investment decisions for a Fidelity fund are based on numerous factors, may not be relied on as an indication of trading intent on behalf of any Fidelity fund.
Investment Summary (Unaudited)
Top Five Holdings as of October 31, 2016
| (by issuer, excluding cash equivalents) | % of fund's net assets | % of fund's net assets 6 months ago |
| Albertson's LLC | 2.3 | 2.6 |
| Community Health Systems, Inc. | 2.1 | 2.8 |
| Caesars Growth Properties Holdings, LLC | 1.7 | 1.7 |
| Valeant Pharmaceuticals International, Inc. | 1.5 | 1.5 |
| Kronos, Inc. | 1.3 | 0.6 |
| 8.9 |
Top Five Market Sectors as of October 31, 2016
| % of fund's net assets | % of fund's net assets 6 months ago | |
| Technology | 10.8 | 10.8 |
| Healthcare | 10.4 | 10.3 |
| Services | 7.4 | 6.4 |
| Telecommunications | 7.1 | 8.4 |
| Gaming | 6.5 | 6.5 |
Quality Diversification (% of fund's net assets)
| As of October 31, 2016 | ||
| BBB | 2.9% | |
| BB | 38.9% | |
| B | 40.1% | |
| CCC,CC,C | 6.0% | |
| Not Rated | 4.6% | |
| Equities | 0.4% | |
| Short-Term Investments and Net Other Assets | 7.1% | |

| As of April 30, 2016 | ||
| BBB | 4.8% | |
| BB | 41.1% | |
| B | 39.5% | |
| CCC,CC,C | 4.5% | |
| D | 0.8% | |
| Not Rated | 2.4% | |
| Equities | 0.4% | |
| Short-Term Investments and Net Other Assets | 6.5% | |

We have used ratings from Moody's Investors Service, Inc. Where Moody's® ratings are not available, we have used S&P® ratings. All ratings are as of the date indicated and do not reflect subsequent changes.
Asset Allocation (% of fund's net assets)
| As of October 31, 2016* | ||
| Bank Loan Obligations | 84.7% | |
| Nonconvertible Bonds | 7.8% | |
| Common Stocks | 0.4% | |
| Short-Term Investments and Net Other Assets (Liabilities) | 7.1% | |

* Foreign investments - 7.9%
| As of April 30, 2016* | ||
| Bank Loan Obligations | 84.3% | |
| Nonconvertible Bonds | 8.8% | |
| Common Stocks | 0.4% | |
| Short-Term Investments and Net Other Assets (Liabilities) | 6.5% | |

* Foreign investments - 10.9%
Investments October 31, 2016
Showing Percentage of Net Assets
| Bank Loan Obligations - 84.7%(a) | |||
| Principal Amount (000s) | Value (000s) | ||
| Aerospace - 1.0% | |||
| Gemini HDPE LLC Tranche B, term loan 4.75% 8/7/21 (b) | $9,227 | $9,296 | |
| TransDigm, Inc.: | |||
| Tranche C, term loan 3.8214% 2/28/20(b) | 56,625 | 56,537 | |
| Tranche F, term loan 3.75% 6/9/23 (b) | 29,925 | 29,794 | |
| TOTAL AEROSPACE | 95,627 | ||
| Automotive & Auto Parts - 0.6% | |||
| Chrysler Group LLC term loan 3.25% 12/31/18 (b) | 7,147 | 7,150 | |
| North American Lifting Holdings, Inc.: | |||
| Tranche 1LN, term loan 5.5% 11/27/20 (b) | 16,539 | 13,893 | |
| Tranche 2LN, term loan 10% 11/27/21 (b) | 24,370 | 15,109 | |
| Tower Automotive Holdings U.S.A. LLC term loan 4% 4/23/20 (b) | 17,272 | 17,228 | |
| TOTAL AUTOMOTIVE & AUTO PARTS | 53,380 | ||
| Broadcasting - 1.4% | |||
| CBS Radio, Inc. term loan 4.5% 10/17/23 (b) | 21,000 | 21,105 | |
| Clear Channel Communications, Inc. Tranche D, term loan 7.2843% 1/30/19 (b) | 51,970 | 39,261 | |
| Entercom Radio, LLC Tranche B, term loan 11/1/23 (c) | 6,000 | 6,030 | |
| ION Media Networks, Inc. Tranche B, term loan 4.75% 12/18/20 (b) | 14,337 | 14,391 | |
| Nielsen Finance LLC Tranche B 3LN, term loan 3.0311% 10/4/23 (b) | 12,000 | 12,047 | |
| Univision Communications, Inc. Tranche C 4LN, term loan 4% 3/1/20 (b) | 41,429 | 41,493 | |
| TOTAL BROADCASTING | 134,327 | ||
| Building Materials - 0.7% | |||
| GCP Applied Technologies, Inc. Tranche B, term loan 4.0877% 2/3/22 (b) | 1,990 | 2,001 | |
| HD Supply, Inc. Tranche B, term loan 3.63% 10/17/23 (b) | 8,250 | 8,255 | |
| HNC Holdings, Inc. Tranche B, term loan 5.5% 10/5/23 (b) | 9,725 | 9,733 | |
| Jeld-Wen, Inc. Tranche B, term loan 4.75% 7/1/22 (b) | 23,045 | 23,179 | |
| LBM Borrower LLC Tranche B 1LN, term loan 6.25% 8/20/22 (b) | 18,317 | 18,304 | |
| TOTAL BUILDING MATERIALS | 61,472 | ||
| Cable/Satellite TV - 3.9% | |||
| Altice U.S. Finance SA term loan 3.8818% 1/15/25 (b) | 30,500 | 30,584 | |
| Charter Communication Operating LLC Tranche I, term loan 3.5% 1/24/23 (b) | 54,695 | 55,006 | |
| Charter Communications Operating LLC: | |||
| Tranche E, term loan 3% 7/1/20 (b) | 47,729 | 47,807 | |
| Tranche F, term loan 3% 1/3/21 (b) | 75,591 | 75,685 | |
| CSC Holdings LLC Tranche B, term loan 3.8761% 10/11/24 (b) | 18,883 | 18,943 | |
| Liberty Cablevision of Puerto Rico Tranche 1LN, term loan 4.5% 1/7/22 (b) | 14,000 | 13,767 | |
| Numericable LLC: | |||
| Tranche B 1LN, term loan 4.5625% 7/20/22 (b) | 9,900 | 9,904 | |
| Tranche B 6LN, term loan 4.75% 2/10/23 (b) | 14,888 | 14,888 | |
| Tranche B, term loan 5.1373% 1/15/24 (b) | 34,228 | 34,510 | |
| Virgin Media Investment Holdings Ltd. Tranche B, term loan 3.5% 6/30/23 (b) | 8,863 | 8,897 | |
| WideOpenWest Finance LLC Tranche B, term loan 4.5% 8/19/23 (b) | 28,000 | 27,924 | |
| Ziggo B.V.: | |||
| Tranche B 1LN, term loan 3.5% 1/15/22 (b) | 14,405 | 14,393 | |
| Tranche B 2LN, term loan 3.5% 1/15/22 (b) | 8,537 | 8,530 | |
| Tranche B 3LN, term loan 3.7014% 1/15/22 (b) | 2,653 | 2,650 | |
| TOTAL CABLE/SATELLITE TV | 363,488 | ||
| Capital Goods - 0.7% | |||
| Doncasters PLC Tranche B 2LN, term loan 9.5% 10/9/20 (b) | 4,516 | 4,245 | |
| Onex Wizard U.S. Acquisition, Inc. Tranche B, term loan 4% 3/13/22 (b) | 31,377 | 31,391 | |
| SRAM LLC. Tranche B, term loan 4.0146% 4/10/20 (b) | 20,552 | 20,038 | |
| Wireco Worldgroup, Inc. Tranche B 1LN, term loan 6.5% 9/30/23 (b) | 6,500 | 6,533 | |
| TOTAL CAPITAL GOODS | 62,207 | ||
| Chemicals - 2.0% | |||
| Hilex Poly Co. LLC Tranche B 1LN, term loan 6% 12/5/21 (b) | 7,930 | 7,994 | |
| Ineos Styrolution U.S. Holding LLC Tranche B, term loan 4.75% 9/30/21 (b) | 10,265 | 10,342 | |
| Kraton Polymers LLC Tranche B, term loan 6% 1/6/22 (b) | 21,195 | 21,312 | |
| MacDermid, Inc.: | |||
| term loan 5% 6/7/23 (b) | 30,645 | 30,875 | |
| Tranche B 3LN, term loan 5.5% 6/7/20 (b) | 22,284 | 22,451 | |
| Royal Holdings, Inc.: | |||
| Tranche B 1LN, term loan 4.5% 6/19/22 (b) | 13,825 | 13,881 | |
| Tranche B 2LN, term loan 8.5% 6/19/23 (b) | 2,130 | 2,087 | |
| The Chemours Co. LLC Tranche B, term loan 3.75% 5/12/22 (b) | 15,606 | 15,403 | |
| Trinseo Materials Operating SCA/Trinseo Materials Finance, Inc. Tranche B 1LN, term loan 4.25% 11/5/21 (b) | 18,323 | 18,428 | |
| Tronox Pigments (Netherlands) B.V. Tranche B, term loan 4.5% 3/19/20 (b) | 11,645 | 11,584 | |
| U.S. Coatings Acquisition, Inc. Tranche B, term loan 3.75% 2/1/20 (b) | 14,467 | 14,567 | |
| Univar, Inc. Tranche B, term loan 4.25% 7/1/22 (b) | 14,004 | 14,021 | |
| TOTAL CHEMICALS | 182,945 | ||
| Consumer Products - 0.5% | |||
| Weight Watchers International, Inc. Tranche B 2LN, term loan 4.074% 4/2/20 (b) | 32,779 | 24,879 | |
| Wilsonart LLC Tranche B, term loan 4% 10/31/19 (b) | 17,746 | 17,740 | |
| TOTAL CONSUMER PRODUCTS | 42,619 | ||
| Containers - 2.3% | |||
| Anchor Glass Container Corp. Tranche B, term loan 4.75% 7/1/22 (b) | 2,746 | 2,771 | |
| Ardagh Holdings U.S.A., Inc. Tranche B, term loan 4% 12/17/21 (b) | 42,335 | 42,719 | |
| Berry Plastics Corp.: | |||
| Tranche G, term loan 3.5% 1/6/21 (b) | 8,592 | 8,595 | |
| Tranche H, term loan 3.75% 10/1/22 (b) | 17,569 | 17,623 | |
| Berry Plastics Group, Inc. term loan 3.5% 2/8/20 (b) | 75,350 | 75,433 | |
| BWAY Holding Co. Tranche B, term loan 5.5% 8/14/20 (b) | 13,897 | 13,981 | |
| Consolidated Container Co. Tranche B, term loan 5% 7/3/19 (b) | 13,034 | 12,947 | |
| Hostess Brands LLC Tranche B 1LN, term loan 4.5% 8/3/22 (b) | 11,999 | 12,078 | |
| Reynolds Group Holdings, Inc. Tranche B, term loan 4.25% 2/5/23 (b) | 26,980 | 27,040 | |
| TOTAL CONTAINERS | 213,187 | ||
| Diversified Financial Services - 2.9% | |||
| AlixPartners LLP term loan 4% 7/28/22 (b) | 23,923 | 23,961 | |
| Assuredpartners, Inc. Tranche B 1LN, term loan 5.75% 10/22/22 (b) | 31,393 | 31,519 | |
| Delos Finance SARL Tranche B LN, term loan 3.5877% 3/6/21 (b) | 33,095 | 33,281 | |
| Energy & Minerals Group Tranche B, term loan 4.75% 3/27/20 (b) | 5,254 | 5,162 | |
| Fly Funding II SARL Tranche B, term loan 3.54% 8/9/19 (b) | 13,019 | 13,044 | |
| Flying Fortress Holdings, Inc. Tranche B, term loan 3.5877% 4/30/20 (b) | 66,390 | 66,788 | |
| Fort Dearborn Holding Co., Inc. Tranche B, term loan 5% 10/19/23 (b) | 4,000 | 4,018 | |
| HarbourVest Partners LLC Tranche B, term loan 3.3811% 2/4/21 (b) | 11,377 | 11,377 | |
| IBC Capital U.S. LLC Tranche B 1LN, term loan 4.9847% 9/11/21 (b) | 24,625 | 24,215 | |
| TransUnion LLC Tranche B 2LN, term loan 3.5% 4/9/21 (b) | 37,360 | 37,453 | |
| UFC Holdings LLC: | |||
| Tranche 2LN, term loan 8.5% 8/18/24 (b) | 4,275 | 4,339 | |
| Tranche B 1LN, term loan 5% 8/18/23 (b) | 19,375 | 19,523 | |
| TOTAL DIVERSIFIED FINANCIAL SERVICES | 274,680 | ||
| Energy - 3.2% | |||
| Alon U.S.A. Partners LP term loan 9.25% 11/26/18 (b) | 8,556 | 8,534 | |
| California Resources Corp. Tranche 1LN, term loan 11.375% 12/31/21 (b) | 12,500 | 13,422 | |
| Chesapeake Energy Corp. Tranche 1LN, term loan 8.5% 8/23/21 (b) | 15,000 | 16,022 | |
| Chief Exploration & Development, LLC. Tranche 2LN, term loan 7.7528% 5/16/21 (b) | 3,000 | 2,867 | |
| Citgo Holding, Inc. Tranche B, term loan 9.5% 5/12/18 (b) | 13,647 | 13,793 | |
| Crestwood Holdings Partners LLC Tranche B, term loan 9% 6/19/19 (b) | 25,181 | 23,670 | |
| Drillships Ocean Ventures, Inc. Tranche B, term loan 5.5% 7/25/21 (b) | 16,089 | 11,406 | |
| Empire Generating Co. LLC: | |||
| Tranche B, term loan 5.25% 3/14/21 (b) | 32,039 | 29,315 | |
| Tranche C, term loan 5.25% 3/14/21 (b) | 2,549 | 2,332 | |
| Energy Transfer Equity LP Tranche C, term loan 4.0424% 12/2/19 (b) | 20,993 | 20,997 | |
| ExGen Renewables I, LLC Tranche B term loan 5.25% 2/6/21 (b) | 11,367 | 11,452 | |
| Expro Finservices SARL Tranche B, term loan 5.75% 9/2/21 (b) | 27,886 | 24,198 | |
| Gulf Finance LLC Tranche B 1LN, term loan 6.25% 8/25/23 (b) | 46,500 | 45,396 | |
| MRP Generation Holdings LLC Tranche B, term loan 8% 9/29/22 (b) | 15,000 | 14,231 | |
| Overseas Shipholding Group, Inc. Tranche B, term loan 5.25% 8/5/19 (b) | 13,089 | 12,975 | |
| Pacific Drilling SA Tranche B, term loan 4.5% 6/3/18 (b) | 13,810 | 3,884 | |
| Panda Temple Power, LLC term loan 7.25% 4/3/19 (b) | 10,918 | 9,990 | |
| Seadrill Operating LP Tranche B, term loan 4% 2/21/21 (b) | 43,636 | 24,245 | |
| Targa Resources Corp. term loan 5.75% 2/27/22 (b) | 5,581 | 5,588 | |
| Western Refining, Inc. Tranche B, term loan 5.25% 11/12/20 (b) | 7,402 | 7,383 | |
| TOTAL ENERGY | 301,700 | ||
| Entertainment/Film - 0.7% | |||
| AMC Entertainment Holdings, Inc. Tranche B, term loan 12/15/23 (c) | 7,690 | 7,709 | |
| AMC Entertainment, Inc. Tranche B, term loan 4% 12/15/22 (b) | 5,000 | 5,017 | |
| CDS U.S. Intermediate Holdings, Inc.: | |||
| Tranche B 1LN, term loan 5% 7/8/22 (b) | 11,453 | 11,460 | |
| Tranche B 2LN, term loan 9.25% 7/8/23 (b) | 5,305 | 5,119 | |
| Digital Cinema Implementation Partners, LLC Tranche B, term loan 3.3349% 5/17/21(b) | 13,034 | 13,058 | |
| Lions Gate Entertainment Corp. term loan 10/13/23 (c) | 23,000 | 22,962 | |
| TOTAL ENTERTAINMENT/FILM | 65,325 | ||
| Environmental - 0.7% | |||
| ADS Waste Holdings, Inc. Tranche B 2LN, term loan 3.75% 10/9/19 (b) | 15,470 | 15,474 | |
| The Brickman Group, Ltd.: | |||
| Tranche 2LN, term loan 7.5% 12/18/21 (b) | 5,690 | 5,670 | |
| Tranche B 1LN, term loan 4% 12/18/20 (b) | 29,569 | 29,504 | |
| WTG Holdings III Corp. Tranche B 1LN, term loan 4.75% 1/15/21 (b) | 13,848 | 13,882 | |
| TOTAL ENVIRONMENTAL | 64,530 | ||
| Food & Drug Retail - 3.2% | |||
| Albertson's LLC: | |||
| Tranche B 4LN, term loan 4.5% 8/25/21 (b) | 180,438 | 181,707 | |
| Tranche B 6LN, term loan 4.75% 6/22/23 (b) | 32,676 | 33,016 | |
| Candy Intermediate Holdings, Inc. Tranche B 1LN, term loan 5.5% 6/15/23 (b) | 9,975 | 10,044 | |
| GOBP Holdings, Inc. Tranche B 1LN, term loan 5% 10/21/21 (b) | 3,980 | 3,973 | |
| Petco Holdings, Inc. Tranche B 1LN, term loan 5% 1/26/23 (b) | 27,810 | 28,032 | |
| Pizza Hut Holdings LLC Tranche B, term loan 3.2857% 6/16/23 (b) | 24,938 | 25,187 | |
| RPI Finance Trust term loan 3.0346% 10/14/22 (b) | 10,305 | 10,393 | |
| Smart & Final, Inc. Tranche B, term loan 4.3046% 11/15/22 (b) | 5,500 | 5,483 | |
| SUPERVALU, Inc. Tranche B, term loan 5.5% 3/21/19 (b) | 3,343 | 3,350 | |
| TOTAL FOOD & DRUG RETAIL | 301,185 | ||
| Food/Beverage/Tobacco - 0.8% | |||
| AdvancePierre Foods, Inc. Tranche B 1LN, term loan 4.5% 6/2/23 (b) | 11,618 | 11,699 | |
| Chobani LLC Tranche B, term loan 5.25% 10/7/23 (b) | 16,000 | 16,170 | |
| Keurig Green Mountain, Inc. Tranche B, term loan 5.25% 3/3/23 (b) | 19,621 | 19,862 | |
| U.S. Foods, Inc. Tranche B, term loan 4% 6/27/23 (b) | 27,182 | 27,342 | |
| TOTAL FOOD/BEVERAGE/TOBACCO | 75,073 | ||
| Gaming - 6.4% | |||
| Aristocrat International Pty Ltd. Tranche B 1LN, term loan 3.6312% 10/20/21 (b) | 27,060 | 27,155 | |
| Boyd Gaming Corp.: | |||
| Tranche B 2LN, term loan 3.534% 9/15/23 (b) | 15,915 | 16,025 | |
| Tranche B, term loan 4% 8/14/20 (b) | 8,220 | 8,282 | |
| Caesars Entertainment Resort Properties LLC Tranche B 1LN, term loan 7% 10/11/20 (b) | 101,087 | 101,592 | |
| Caesars Growth Properties Holdings, LLC Tranche 1LN, term loan 6.25% 5/8/21 (b) | 161,126 | 160,857 | |
| CityCenter Holdings LLC Tranche B, term loan 4.25% 10/16/20 (b) | 15,337 | 15,417 | |
| Golden Nugget, Inc. Tranche B, term loan: | |||
| 4.5% 11/21/19 (b) | 35,129 | 35,502 | |
| 4.5% 11/21/19 (b) | 15,055 | 15,215 | |
| Las Vegas Sands LLC Tranche B, term loan 3.25% 12/19/20 (b) | 23,980 | 24,119 | |
| MGM Mirage, Inc. Tranche A, term loan 3.2843% 4/25/21 (b) | 14,405 | 14,333 | |
| Mohegan Tribal Gaming Authority Tranche B, term loan 5.5% 10/14/23 (b) | 15,000 | 14,939 | |
| Scientific Games Corp.: | |||
| Tranche B 2LN, term loan 6% 10/1/21 (b) | 40,617 | 40,770 | |
| Tranche B, term loan 6% 10/18/20 (b) | 73,665 | 74,057 | |
| Station Casinos LLC Tranche B, term loan 3.75% 6/8/23 (b) | 40,922 | 41,098 | |
| Yonkers Racing Corp. Tranche B 1LN, term loan 4.25% 8/20/19 (b) | 12,715 | 12,699 | |
| TOTAL GAMING | 602,060 | ||
| Healthcare - 9.6% | |||
| Alere, Inc. Tranche B, term loan 4.25% 6/18/22 (b) | 11,128 | 11,080 | |
| Alvogen Pharma U.S., Inc. Tranche B 1LN, term loan 6% 4/2/22 (b) | 15,804 | 15,804 | |
| AmSurg Corp. Tranche B, term loan 3.5% 7/16/21 (b) | 15,858 | 15,851 | |
| Avantor Performance Materials Holdings, Inc. Tranche B 1LN, term loan 6% 6/21/22 (b) | 19,930 | 20,055 | |
| Community Health Systems, Inc.: | |||
| Tranche F, term loan 4.0834% 12/31/18 (b) | 40,399 | 39,389 | |
| Tranche G, term loan 3.75% 12/31/19 (b) | 56,322 | 53,207 | |
| Tranche H, term loan 4% 1/27/21 (b) | 98,426 | 92,840 | |
| DaVita HealthCare Partners, Inc. Tranche B, term loan 3.5% 6/24/21 (b) | 47,104 | 47,059 | |
| DJO Finance LLC Tranche B 1LN, term loan 4.25% 6/7/20 (b) | 19,721 | 19,499 | |
| Drumm Investors LLC Tranche B, term loan 9.5% 5/4/18 (b) | 12,621 | 12,582 | |
| Emergency Medical Services Corp. Tranche B, term loan 4.25% 5/25/18 (b) | 21,049 | 21,068 | |
| Endo Pharmaceuticals, Inc. Tranche B, term loan 3.75% 9/25/22 (b) | 32,708 | 32,655 | |
| Gold Merger Co., Inc. Tranche B, term loan 4.75% 7/27/23 (b) | 6,735 | 6,774 | |
| Grifols, S.A. Tranche B, term loan 3.4559% 2/27/21 (b) | 31,962 | 32,216 | |
| HCA Holdings, Inc.: | |||
| Tranche B 6LN, term loan 3.7843% 3/18/23 (b) | 60,232 | 60,842 | |
| Tranche B 7LN, term loan 3.5877% 2/15/24 (b) | 20,000 | 20,169 | |
| HCR Healthcare LLC Tranche B, term loan 5% 4/6/18 (b) | 7,329 | 6,425 | |
| Horizon Pharmaceuticals, Inc. term loan 5/7/21 (c) | 13,500 | 13,517 | |
| InVentiv Health, Inc. Tranche B, term loan 9/29/23 (c) | 21,000 | 20,989 | |
| Jaguar Holding Co. II/Pharmaceutical Product Development LLC Tranche B, term loan 4.25% 8/18/22 (b) | 6,101 | 6,091 | |
| Kindred Healthcare, Inc. Tranche B, term loan 4.25% 4/9/21 (b) | 4,975 | 4,970 | |
| Milk Specialties Co. Tranche B, term loan 6% 8/16/23 (b) | 12,165 | 12,256 | |
| MPH Acquisition Holdings LLC Tranche B, term loan 5% 6/7/23 (b) | 19,135 | 19,333 | |
| Onex Schumacher Finance LP Tranche B 1LN, term loan 5% 7/31/22 (b) | 3,482 | 3,494 | |
| Ortho-Clinical Diagnostics, Inc. Tranche B, term loan 4.75% 6/30/21 (b) | 42,013 | 40,997 | |
| Patheon, Inc. Tranche B, term loan 4.25% 3/11/21 (b) | 13,764 | 13,769 | |
| Precyse Acquisition Corp. Tranche B, term loan 6.5% 10/20/22 (b) | 9,975 | 10,037 | |
| Press Ganey Holdings, Inc.: | |||
| Tranche 2LN, term loan 10/21/24 (c) | 5,000 | 5,063 | |
| Tranche B 1LN, term loan 4.25% 10/21/23 (b) | 15,500 | 15,500 | |
| U.S. Renal Care, Inc.: | |||
| Tranche 2LN, term loan 9% 12/31/23 (b) | 5,000 | 4,775 | |
| Tranche B 1LN, term loan 5.25% 12/31/22 (b) | 46,651 | 44,625 | |
| Valeant Pharmaceuticals International, Inc.: | |||
| Tranche A 3LN, term loan 4.29% 10/20/18 (b) | 3,008 | 2,999 | |
| Tranche B, term loan 5.5% 4/1/22 (b) | 66,430 | 66,181 | |
| Tranche BC 2LN, term loan 5.25% 12/11/19 (b) | 25,638 | 25,579 | |
| Tranche BD 2LN, term loan 5% 2/13/19 (b) | 36,462 | 36,345 | |
| Tranche E, term loan 5.25% 8/5/20 (b) | 13,577 | 13,521 | |
| Vizient, Inc. term loan 5% 2/11/23 (b) | 26,396 | 26,668 | |
| TOTAL HEALTHCARE | 894,224 | ||
| Homebuilders/Real Estate - 1.5% | |||
| Americold Realty Operating Partnership LP Tranche B, term loan 5.75% 12/1/22 (b) | 12,464 | 12,594 | |
| Communications Sales & Leasing, Inc. Tranche B, term loan 4.5% 10/24/22 (b) | 21,619 | 21,689 | |
| DTZ U.S. Borrower LLC Tranche B 1LN, term loan 4.25% 11/4/21 (b) | 29,700 | 29,613 | |
| MGM Growth Properties Operating Partner LP Tranche B, term loan 3.5% 4/25/23 (b) | 30,184 | 30,241 | |
| Realogy Group LLC Tranche B, term loan 3.75% 7/20/22 (b) | 42,959 | 43,290 | |
| TOTAL HOMEBUILDERS/REAL ESTATE | 137,427 | ||
| Hotels - 2.0% | |||
| ESH Hospitality, Inc. Tranche B, term loan 8/30/23 (c) | 17,000 | 17,087 | |
| Four Seasons Holdings, Inc.: | |||
| Tranche 2LN, term loan 6.25% 12/27/20 (b) | 16,755 | 16,870 | |
| Tranche B 1LN, term loan 3.5877% 6/27/20 (b) | 50,417 | 50,621 | |
| Hilton Worldwide Finance LLC: | |||
| Tranche B 2LN, term loan 3.034% 10/25/23 (b) | 31,809 | 31,957 | |
| Tranche B, term loan 3.5% 10/25/20 (b) | 39,374 | 39,522 | |
| La Quinta Intermediate Holdings LLC Tranche B LN, term loan 3.75% 4/14/21 (b) | 19,447 | 19,393 | |
| Playa Resorts Holding BV Tranche B, term loan 4% 8/9/19 (b) | 13,558 | 13,524 | |
| TOTAL HOTELS | 188,974 | ||
| Insurance - 1.8% | |||
| Alliant Holdings Intermediate LLC Tranche B, term loan 4.7528% 8/14/22 (b) | 23,095 | 23,081 | |
| Asurion LLC: | |||
| Tranche B 1LN, term loan 5% 5/24/19 (b) | 23,207 | 23,211 | |
| Tranche B 2LN, term loan 4.3377% 7/8/20 (b) | 7,422 | 7,425 | |
| Tranche B 2LN, term loan 8.5% 3/3/21 (b) | 13,303 | 13,397 | |
| Tranche B 4LN, term loan 5% 8/4/22 (b) | 39,040 | 39,211 | |
| Tranche B 5LN, term loan 11/3/23 (c) | 17,840 | 17,840 | |
| HUB International Ltd. Tranche B 1LN, term loan 4% 10/2/20 (b) | 17,634 | 17,622 | |
| Lonestar Intermediate Super Holdings LLC term loan 10% 8/31/21 pay-in-kind (b) | 13,500 | 13,590 | |
| VF Holdings Corp. Tranche B 1LN, term loan 4.75% 6/30/23 (b) | 15,000 | 15,045 | |
| TOTAL INSURANCE | 170,422 | ||
| Leisure - 0.9% | |||
| 24 Hour Fitness Worldwide, Inc. Tranche B, term loan 4.75% 5/30/21 (b) | 28,076 | 27,409 | |
| ClubCorp Club Operations, Inc. Tranche B, term loan 4% 12/15/22 (b) | 10,000 | 10,046 | |
| Fitness International LLC Tranche B, term loan 6% 7/1/20 (b) | 11,000 | 11,008 | |
| LTF Merger Sub, Inc. Tranche B, term loan 4.25% 6/10/22 (b) | 31,927 | 31,902 | |
| Planet Fitness Holdings, LLC. Tranche B, term loan 4.5% 3/31/21 (b) | 2,296 | 2,296 | |
| TOTAL LEISURE | 82,661 | ||
| Metals/Mining - 1.8% | |||
| American Rock Salt Co. LLC Tranche B 1LN, term loan 4.75% 5/20/21 (b) | 8,701 | 8,412 | |
| Ameriforge Group, Inc.: | |||
| Tranche B 1LN, term loan 5% 12/19/19 (b) | 7,368 | 3,850 | |
| Tranche B 2LN, term loan 8.75% 12/19/20 (b) | 3,000 | 400 | |
| Doncasters Group, LLC Tranche B 1LN, term loan 4.5% 4/9/20 (b) | 19,634 | 19,438 | |
| Fortescue Metals Group Ltd. Tranche B, term loan 3.75% 6/30/19 (b) | 19,148 | 19,130 | |
| Murray Energy Corp. Tranche B 2LN, term loan 8.25% 4/16/20 (b) | 90,349 | 82,584 | |
| Oxbow Carbon LLC: | |||
| Tranche 2LN, term loan 8% 1/19/20 (b) | 19,130 | 18,652 | |
| Tranche B 1LN, term loan 4.25% 7/19/19 (b) | 1,359 | 1,361 | |
| Peabody Energy Corp. Tranche B, term loan 0% 9/24/20 (d) | 19,086 | 16,803 | |
| Walter Energy, Inc. Tranche B, term loan 0% 4/1/18 (d) | 32,780 | 0 | |
| TOTAL METALS/MINING | 170,630 | ||
| Publishing/Printing - 2.5% | |||
| Cengage Learning, Inc. Tranche B, term loan 5.25% 6/7/23 (b) | 48,753 | 47,605 | |
| Getty Images, Inc. Tranche B, term loan 4.75% 10/18/19 (b) | 51,923 | 43,989 | |
| Harland Clarke Holdings Corp.: | |||
| Tranche B 4LN, term loan 6.993% 8/4/19 (b) | 5,270 | 5,227 | |
| Tranche B 5LN, term loan 7% 12/31/19 (b) | 14,192 | 14,091 | |
| Houghton Mifflin Harcourt Publishing, Inc. Tranche B, term loan 4% 5/29/21 (b) | 26,266 | 25,954 | |
| JD Power & Associates Tranche B 1LN, term loan 5.25% 9/7/23 (b) | 6,180 | 6,219 | |
| McGraw-Hill Global Education Holdings, LLC term loan 5% 5/4/22 (b) | 49,381 | 49,247 | |
| Merrill Communications LLC Tranche B, term loan 6.25% 6/1/22 (b) | 16,397 | 15,413 | |
| Proquest LLC Tranche B, term loan 5.75% 10/24/21 (b) | 6,929 | 6,921 | |
| Springer Science+Business Media Deutschland GmbH Tranche B 9LN, term loan 4.75% 8/14/20 (b) | 14,427 | 14,084 | |
| TOTAL PUBLISHING/PRINTING | 228,750 | ||
| Restaurants - 1.1% | |||
| Burger King Worldwide, Inc. Tranche B, term loan 3.75% 12/12/21 (b) | 18,736 | 18,814 | |
| CEC Entertainment, Inc. Tranche B, term loan 4% 2/14/21 (b) | 3,760 | 3,709 | |
| Focus Brands, Inc. term loan 5% 10/5/23 (b) | 10,500 | 10,609 | |
| Landry's Acquisition Co. Tranche B 1LN, term loan 4% 10/4/23 (b) | 52,000 | 52,282 | |
| Red Lobster Hospitality LLC Tranche B, term loan 6.25% 7/28/21 (b) | 20,312 | 20,388 | |
| TOTAL RESTAURANTS | 105,802 | ||
| Services - 7.1% | |||
| Abacus Innovations Corp. Tranche B, term loan 3.2843% 8/16/23 (b) | 15,250 | 15,354 | |
| Acosta, Inc. Tranche B, term loan 4.25% 9/26/21 (b) | 27,038 | 25,984 | |
| Ancestry.Com Operations, Inc.: | |||
| Tranche 2LN, term loan 9.25% 10/19/24 (b) | 8,500 | 8,606 | |
| Tranche B 1LN, term loan 5.25% 10/19/23 (b) | 32,500 | 32,551 | |
| Apollo Security Service Borrower LLC Tranche B 1LN, term loan 4.75% 5/2/22 (b) | 77,720 | 78,261 | |
| ARAMARK Corp. Tranche F, term loan 3.3377% 2/24/21 (b) | 48,449 | 48,692 | |
| Avis Budget Group, Inc. Tranche B, term loan 3.09% 3/15/19 (b) | 3,563 | 3,560 | |
| Brand Energy & Infrastructure Services, Inc. Tranche B, term loan 4.75% 11/26/20 (b) | 25,621 | 25,264 | |
| Bright Horizons Family Solutions, Inc. Tranche B, term loan 5.25% 1/30/20 (b) | 9,620 | 9,655 | |
| Cactus Wellhead LLC Tranche B, term loan 7% 7/31/20 (b) | 22,995 | 20,293 | |
| Coinmach Service Corp. Tranche B, term loan 4.25% 11/14/19 (b) | 36,456 | 36,237 | |
| Garda World Security Corp.: | |||
| term loan 4% 11/8/20 (b) | 2,583 | 2,550 | |
| Tranche DD, term loan 4.0039% 11/8/20 (b) | 449 | 443 | |
| GCA Services Group, Inc. Tranche B 1LN, term loan 5.8721% 3/1/23 (b) | 9,950 | 10,028 | |
| KAR Auction Services, Inc. Tranche B 3LN, term loan 4.375% 3/9/23 (b) | 16,124 | 16,290 | |
| Karman Buyer Corp.: | |||
| Tranche 1LN, term loan 4.25% 7/25/21 (b) | 21,388 | 21,165 | |
| Tranche 2LN, term loan 7.5% 7/25/22 (b) | 7,490 | 7,064 | |
| KC Mergersub, Inc. Tranche L 2LN, term loan 10.25% 8/13/23 (b) | 3,000 | 2,925 | |
| Kuehg Corp. Tranche B 1LN, term loan 5.25% 8/13/22 (b) | 14,850 | 14,850 | |
| Laureate Education, Inc. Tranche B, term loan 8.8679% 3/17/21 (b) | 118,274 | 117,239 | |
| Lineage Logistics Holdings, LLC. Tranche B, term loan 4.5% 4/7/21 (b) | 42,440 | 41,591 | |
| Nexeo Solutions LLC Tranche B, term loan 5.25% 6/9/23 (b) | 6,673 | 6,715 | |
| Nord Anglia Education Tranche B, term loan 5% 3/31/21 (b) | 34,487 | 34,595 | |
| Outerwall, Inc.: | |||
| Tranche 2LN, term loan 9.75% 9/27/24 (b) | 2,500 | 2,481 | |
| Tranche B 1LN, term loan 5.25% 9/27/23 (b) | 7,000 | 7,064 | |
| Science Applications International Corp. Tranche B, term loan 3.25% 5/4/22 (b) | 6,226 | 6,265 | |
| The ServiceMaster Co. Tranche B, term loan 4.25% 7/1/21 (b) | 34,812 | 34,834 | |
| Thomson Reuters IP&S Tranche B 1LN, term loan 4.75% 10/3/23 (b) | 26,965 | 26,987 | |
| Wash Multifamily Acquisition, Inc. Tranche B 1LN, term loan 4.25% 5/14/22 (b) | 3,449 | 3,444 | |
| TOTAL SERVICES | 660,987 | ||
| Steel - 0.2% | |||
| JMC Steel Group, Inc. Tranche B, term loan 6% 6/14/21 (b) | 17,478 | 17,587 | |
| Super Retail - 4.3% | |||
| Academy Ltd. Tranche B, term loan 5% 7/2/22 (b) | 30,666 | 29,717 | |
| Bass Pro Group LLC Tranche B, term loan 4% 6/5/20 (b) | 3,960 | 3,957 | |
| BJ's Wholesale Club, Inc.: | |||
| Tranche 2LN, term loan 8.5% 3/31/20 (b) | 12,218 | 12,249 | |
| Tranche B 1LN, term loan 4.5% 9/26/19 (b) | 32,906 | 32,937 | |
| Davids Bridal, Inc. Tranche B, term loan 5% 10/11/19 (b) | 9,547 | 8,879 | |
| Dollar Tree, Inc. Tranche B 3LN, term loan 3.0625% 7/6/22 (b) | 5,971 | 6,023 | |
| General Nutrition Centers, Inc. Tranche B, term loan 3.25% 3/4/19 (b) | 27,104 | 26,460 | |
| Harbor Freight Tools U.S.A., Inc. Tranche B, term loan 4.1373% 8/19/23 (b) | 22,943 | 23,093 | |
| J. Crew Group, Inc. Tranche B, term loan 4% 3/5/21 (b) | 36,034 | 27,426 | |
| JC Penney Corp., Inc. Tranche B, term loan 5.25% 6/23/23 (b) | 90,550 | 91,071 | |
| Party City Holdings, Inc. term loan 4.2037% 8/19/22 (b) | 28,572 | 28,647 | |
| PetSmart, Inc. term loan 4% 3/11/22 (b) | 55,294 | 55,402 | |
| Sears Holdings Corp. Tranche ABL, term loan 5.5% 6/30/18 (b) | 58,540 | 57,252 | |
| Sports Authority, Inc. Tranche B, term loan 0% 11/16/17 (b)(d) | 5,664 | 1,152 | |
| TOTAL SUPER RETAIL | 404,265 | ||
| Technology - 9.8% | |||
| Applied Systems, Inc.: | |||
| Tranche B 1LN, term loan 4% 1/23/21 (b) | 9,078 | 9,091 | |
| Tranche B 2LN, term loan 7.5% 1/23/22 (b) | 3,590 | 3,612 | |
| Avago Technologies Cayman Finance Ltd. Tranche B 3LN, term loan 3.5346% 2/1/23 (b) | 27,358 | 27,628 | |
| BMC Software Finance, Inc. Tranche B, term loan: | |||
| 5% 9/10/20 (b) | 6,125 | 6,040 | |
| 5% 9/10/20 (b) | 10,306 | 10,142 | |
| Cavium, Inc. Tranche B, term loan 3.75% 8/16/22 (b) | 12,805 | 12,837 | |
| Ceridian HCM Holding, Inc. Tranche B 2LN, term loan 4.5% 9/15/20 (b) | 14,059 | 13,778 | |
| Computer Discount Warehouse (CDW) LLC Tranche B, term loan 3% 8/17/23 (b) | 31,544 | 31,673 | |
| Compuware Corp.: | |||
| term loan 9.25% 12/12/22 (b) | 7,270 | 7,034 | |
| Tranche B 2LN, term loan 6.25% 12/15/21 (b) | 14,737 | 14,730 | |
| Dell International LLC Tranche B, term loan 4% 9/7/23 (b) | 35,500 | 35,742 | |
| EIG Investors Corp. Tranche B 1LN, term loan 6% 2/9/23 (b) | 38,088 | 35,708 | |
| Epicor Software Corp. Tranche B, term loan 4.75% 6/1/22 (b) | 29,890 | 29,526 | |
| First Data Corp.: | |||
| term loan 3.524% 3/24/21 (b) | 1,954 | 1,962 | |
| Tranche B, term loan 4.274% 7/10/22 (b) | 85,000 | 85,585 | |
| Generac Power Systems, Inc. Tranche B, term loan 3.5956% 5/31/20 (b) | 25,401 | 25,417 | |
| Global Payments, Inc. Tranche B, term loan 3.0244% 4/22/23 | 9,942 | 9,979 | |
| Infor U.S., Inc.: | |||
| Tranche B 3LN, term loan 3.75% 6/3/20 (b) | 7,317 | 7,298 | |
| Tranche B 5LN, term loan 3.75% 6/3/20 (b) | 22,305 | 22,234 | |
| Kronos, Inc.: | |||
| term loan: | |||
| 10/20/23 (c) | 40,000 | 40,159 | |
| 10/20/24 (c) | 30,000 | 30,896 | |
| Tranche 2LN, term loan 9.75% 4/30/20 (b) | 28,837 | 29,170 | |
| Tranche B 1LN, term loan 4.5% 10/30/19 (b) | 31,559 | 31,678 | |
| Lux FinCo U.S. SPV: | |||
| Tranche 2LN, term loan 9.5% 10/16/23 (b) | 6,000 | 5,985 | |
| Tranche B 1LN, term loan 5% 10/16/22 (b) | 9,925 | 9,925 | |
| Micron Technology, Inc. Tranche B, term loan 4.29% 4/26/22 (b) | 10,224 | 10,282 | |
| Microsemi Corp. Tranche B, term loan 3.75% 1/15/23 (b) | 11,113 | 11,202 | |
| NXP BV/NXP Funding LLC Tranche F, term loan 3.4052% 12/7/20 (b) | 18,662 | 18,719 | |
| Quest Software U.S. Holdings, Inc. Tranche B, term loan 9/27/22 (c) | 21,000 | 20,984 | |
| Rackspace Hosting, Inc. term loan 10/26/23 (c) | 45,745 | 45,988 | |
| Renaissance Learning, Inc.: | |||
| Tranche 1LN, term loan 4.5% 4/9/21 (b) | 15,599 | 15,547 | |
| Tranche 2LN, term loan 8% 4/9/22 (b) | 19,080 | 18,714 | |
| SolarWinds Holdings, Inc. Tranche B, term loan 5.5% 2/5/23 (b) | 10,474 | 10,521 | |
| Solera LLC Tranche B, term loan 5.75% 3/3/23 (b) | 20,442 | 20,656 | |
| Sophia L.P. Tranche B, term loan 4.75% 9/30/22 (b) | 26,698 | 26,723 | |
| SS&C Technologies, Inc.: | |||
| Tranche B 1LN, term loan 4% 7/8/22 (b) | 16,386 | 16,504 | |
| Tranche B 2LN, term loan 4% 7/8/22 (b) | 1,994 | 2,009 | |
| Sybil Software LLC. Tranche B, term loan 5% 9/30/22 (b) | 33,720 | 34,023 | |
| Syniverse Holdings, Inc. Tranche B, term loan: | |||
| 4% 4/23/19 (b) | 16,127 | 14,827 | |
| 4% 4/23/19 (b) | 9,380 | 8,629 | |
| TTM Technologies, Inc. Tranche B 1LN, term loan 5.25% 5/31/21 (b) | 32,724 | 32,806 | |
| Uber Technologies, Inc. Tranche B, term loan 5% 7/13/23 (b) | 30,500 | 30,710 | |
| Vantiv LLC Tranche B, term loan 3.25% 10/14/23 (b) | 12,816 | 12,893 | |
| Western Digital Corp. Tranche B 1LN, term loan 4.5% 4/29/23 (b) | 7,411 | 7,491 | |
| WEX, Inc. Tranche B, term loan 4.25% 7/1/23 (b) | 19,950 | 20,162 | |
| TOTAL TECHNOLOGY | 917,219 | ||
| Telecommunications - 5.5% | |||
| Digicel International Finance Ltd.: | |||
| Tranche D 1LN, term loan 4.375% 3/31/17 (b) | 1,499 | 1,424 | |
| Tranche D 2LN, term loan 4.3377% 3/31/19 (b) | 30,062 | 28,558 | |
| DigitalGlobe, Inc. Tranche B, term loan 4.75% 1/31/20 (b) | 7,183 | 7,237 | |
| FairPoint Communications, Inc. Tranche B, term loan 7.5% 2/14/19 (b) | 9,942 | 9,956 | |
| FPL FiberNet, LLC. Tranche A, term loan 4.1003% 7/22/19 (b) | 12,179 | 12,088 | |
| Integra Telecom Holdings, Inc. Tranche B 1LN, term loan 5.25% 8/14/20 (b) | 24,625 | 24,487 | |
| Intelsat Jackson Holdings SA Tranche B 2LN, term loan 3.75% 6/30/19 (b) | 113,055 | 107,980 | |
| Level 3 Financing, Inc.: | |||
| Tranche B 2LN, term loan 3.5% 5/31/22 (b) | 18,400 | 18,469 | |
| Tranche B 4LN, term loan 4% 1/15/20 (b) | 54,000 | 54,243 | |
| LTS Buyer LLC: | |||
| Tranche 2LN, term loan 8% 4/12/21 (b) | 3,868 | 3,870 | |
| Tranche B 1LN, term loan 4.0877% 4/11/20 (b) | 43,910 | 43,954 | |
| Mitel U.S. Holdings, Inc. Tranche B, term loan 5.5% 4/29/22 (b) | 16,674 | 16,806 | |
| Polycom, Inc. Tranche B, term loan 7.5% 9/27/23 (b) | 20,000 | 19,475 | |
| RP Crown Parent, LLC Tranche B, term loan 4.5% 10/12/23 (b) | 28,500 | 28,480 | |
| Sable International Finance Ltd.: | |||
| Tranche B 1LN, term loan 5.5877% 12/31/22 (b) | 3,575 | 3,608 | |
| Tranche B 2LN, term loan 5.83% 12/31/22 (b) | 2,925 | 2,952 | |
| SBA Senior Finance II, LLC term loan 3.34% 3/24/21 (b) | 26,294 | 26,313 | |
| Securus Technologies Holdings, Inc.: | |||
| Tranche 2LN, term loan 9% 4/30/21 (b) | 7,775 | 7,462 | |
| Tranche B 1LN, term loan 4.75% 4/30/20 (b) | 33,753 | 33,078 | |
| Securus Technologies, Inc. Tranche B2 1LN, term loan 5.25% 4/30/20 (b) | 4,520 | 4,429 | |
| T-Mobile U.S.A., Inc. Tranche B, term loan 3.5% 11/9/22 (b) | 17,257 | 17,380 | |
| TCH-2 Holdings, LLC. Tranche B 1LN, term loan 5.5% 5/12/21 (b) | 7,798 | 7,798 | |
| Telenet Financing USD LLC term loan 4.3566% 6/30/24 (b) | 9,915 | 9,917 | |
| Telesat Holding, Inc. Tranche B, term loan 3.5% 3/28/19 (b) | 16,243 | 16,243 | |
| Xplornet Communications, Inc. Tranche B, term loan 7% 9/9/21 (b) | 3,000 | 3,023 | |
| Zayo Group LLC/Zayo Capital, Inc. Tranche B, term loan 3.75% 5/6/21 (b) | 6,030 | 6,058 | |
| TOTAL TELECOMMUNICATIONS | 515,288 | ||
| Textiles/Apparel - 0.1% | |||
| ABB Optical Group LLC Tranche B, term loan 6.0041% 6/15/23 (b) | 10,335 | 10,361 | |
| Transportation Ex Air/Rail - 0.2% | |||
| American Commercial Barge Line Tranche B 1LN, term loan 9.75% 11/12/20 (b) | 19,729 | 19,063 | |
| YRC Worldwide, Inc. Tranche B, term loan 8% 2/13/19 (b) | 4,408 | 4,151 | |
| TOTAL TRANSPORTATION EX AIR/RAIL | 23,214 | ||
| Utilities - 5.3% | |||
| Alinta Energy Finance Pty. Ltd. Tranche B, term loan: | |||
| 6.375% 8/13/18 (b) | 2,127 | 2,120 | |
| 6.375% 8/13/19 (b) | 31,997 | 31,901 | |
| APLP Holdings LP Tranche B, term loan 6% 4/13/23 (b) | 23,388 | 23,739 | |
| Calpine Construction Finance Co. LP: | |||
| Tranche B 1LN, term loan 3.09% 5/3/20 (b) | 61,182 | 60,723 | |
| Tranche B 2LN, term loan 3.34% 1/31/22 (b) | 7,064 | 7,024 | |
| Calpine Corp. Tranche B 5LN, term loan 3.59% 5/28/22 (b) | 32,291 | 32,328 | |
| Cortes NP Acquisition Corp. Tranche B, term loan 9/30/23 (c) | 30,305 | 30,116 | |
| Dynegy Finance IV, Inc. Tranche C, term loan 5% 6/27/23 (b) | 56,000 | 56,140 | |
| Dynegy, Inc. Tranche B 2LN, term loan 4% 4/23/20 (b) | 13,484 | 13,486 | |
| Energy Future Holdings Corp. term loan 4.25% 6/30/17 (b) | 65,924 | 66,295 | |
| Essential Power LLC Tranche B, term loan 4.75% 8/8/19 (b) | 12,931 | 12,963 | |
| Exgen Texas Power LLC Tranche B, term loan 5.75% 9/18/21 (b) | 26,451 | 21,178 | |
| Houston Fuel Oil Terminal Co. Tranche B, term loan 4.25% 8/19/21 (b) | 27,098 | 26,624 | |
| InterGen NV Tranche B, term loan 5.5% 6/13/20 (b) | 32,815 | 31,010 | |
| Moxie Patriot LLC Tranche B, term loan 6.75% 12/19/20 (b) | 18,856 | 18,408 | |
| Southcross Energy Partners LP Tranche B, term loan 5.25% 8/4/21 (b) | 5,784 | 4,656 | |
| Southcross Holdings Borrower LP Tranche B, term loan 9% 4/13/23 | 2,650 | 2,213 | |
| Tex Operations Co. LLC: | |||
| Tranche B, term loan 5% 8/4/23 (b) | 41,121 | 41,481 | |
| Tranche C, term loan 5% 8/4/23 (b) | 9,379 | 9,461 | |
| TOTAL UTILITIES | 491,866 | ||
| TOTAL BANK LOAN OBLIGATIONS | |||
| (Cost $7,959,921) | 7,913,482 | ||
| Nonconvertible Bonds - 7.8% | |||
| Broadcasting - 0.3% | |||
| AMC Networks, Inc. 4.75% 12/15/22 | 6,600 | 6,732 | |
| Clear Channel Communications, Inc. 9% 12/15/19 | 8,677 | 6,584 | |
| Starz LLC/Starz Finance Corp. 5% 9/15/19 | 9,000 | 9,113 | |
| Univision Communications, Inc. 6.75% 9/15/22 (e) | 5,368 | 5,657 | |
| TOTAL BROADCASTING | 28,086 | ||
| Building Materials - 0.1% | |||
| CEMEX S.A.B. de CV 5.63% 10/15/18 (b)(e) | 10,000 | 10,400 | |
| Cable/Satellite TV - 0.5% | |||
| CCO Holdings LLC/CCO Holdings Capital Corp.: | |||
| 5.125% 2/15/23 | 17,065 | 17,662 | |
| 5.25% 3/15/21 | 13,070 | 13,593 | |
| Cequel Communications Escrow I LLC/Cequel Communications Escrow Capital Corp. 6.375% 9/15/20 (e) | 10,815 | 11,139 | |
| Lynx I Corp. 5.375% 4/15/21 (e) | 4,500 | 4,646 | |
| Virgin Media Finance PLC 4.875% 2/15/22 | 2,000 | 1,721 | |
| TOTAL CABLE/SATELLITE TV | 48,761 | ||
| Capital Goods - 0.0% | |||
| Shale-Inland Holdings LLC/Shale-Inland Finance Corp. 8.75% 11/15/19 (e) | 3,000 | 1,793 | |
| Chemicals - 0.1% | |||
| Nufarm Australia Ltd. 6.375% 10/15/19 (e) | 5,000 | 5,100 | |
| Containers - 1.0% | |||
| Ardagh Packaging Finance PLC/Ardagh MP Holdings U.S.A., Inc.: | |||
| 3.8503% 12/15/19 (b)(e) | 42,330 | 43,018 | |
| 4.067% 5/15/21 (b)(e) | 7,000 | 7,140 | |
| Reynolds Group Issuer, Inc./Reynolds Group Issuer LLC/Reynolds Group Issuer (Luxembourg) SA: | |||
| 4.38% 7/15/21 (b)(e) | 11,130 | 11,353 | |
| 5.75% 10/15/20 | 33,325 | 34,201 | |
| TOTAL CONTAINERS | 95,712 | ||
| Diversified Financial Services - 0.7% | |||
| CIT Group, Inc. 5% 5/15/17 | 7,000 | 7,088 | |
| Icahn Enterprises LP/Icahn Enterprises Finance Corp.: | |||
| 3.5% 3/15/17 | 18,720 | 18,720 | |
| 4.875% 3/15/19 | 15,000 | 14,905 | |
| International Lease Finance Corp.: | |||
| 3.875% 4/15/18 | 7,000 | 7,158 | |
| 6.25% 5/15/19 | 10,000 | 10,813 | |
| Prime Securities Services Borrower LLC/Prime Finance, Inc. 9.25% 5/15/23 (e) | 10,000 | 10,625 | |
| TOTAL DIVERSIFIED FINANCIAL SERVICES | 69,309 | ||
| Energy - 0.6% | |||
| American Energy-Permian Basin LLC/AEPB Finance Corp. 7.2591% 8/1/19 (b)(e) | 7,340 | 5,377 | |
| Cheniere Corpus Christi Holdings LLC 7% 6/30/24 (e) | 7,000 | 7,420 | |
| Chesapeake Energy Corp. 8% 12/15/22 (e) | 17,832 | 18,088 | |
| Citgo Petroleum Corp. 6.25% 8/15/22 (e) | 10,000 | 10,225 | |
| Targa Resources Partners LP/Targa Resources Partners Finance Corp. 6.375% 8/1/22 | 4,492 | 4,627 | |
| Western Refining, Inc. 6.25% 4/1/21 | 5,305 | 5,345 | |
| TOTAL ENERGY | 51,082 | ||
| Entertainment/Film - 0.0% | |||
| Cinemark U.S.A., Inc. 5.125% 12/15/22 | 3,185 | 3,273 | |
| Food/Beverage/Tobacco - 0.0% | |||
| ESAL GmbH 6.25% 2/5/23 (e) | 4,000 | 3,850 | |
| Gaming - 0.1% | |||
| MCE Finance Ltd. 5% 2/15/21 (e) | 10,000 | 9,999 | |
| Healthcare - 0.8% | |||
| Community Health Systems, Inc. 5.125% 8/15/18 | 10,755 | 10,661 | |
| DaVita HealthCare Partners, Inc. 5.75% 8/15/22 | 8,235 | 8,441 | |
| HCA Holdings, Inc. 3.75% 3/15/19 | 25,000 | 25,563 | |
| MPT Operating Partnership LP/MPT Finance Corp. 5.25% 8/1/26 | 3,570 | 3,641 | |
| Tenet Healthcare Corp.: | |||
| 4.3503% 6/15/20 (b) | 17,895 | 18,029 | |
| 4.75% 6/1/20 | 8,680 | 8,875 | |
| TOTAL HEALTHCARE | 75,210 | ||
| Homebuilders/Real Estate - 0.2% | |||
| CBRE Group, Inc. 5% 3/15/23 | 17,990 | 18,890 | |
| Paper - 0.1% | |||
| Xerium Technologies, Inc. 9.5% 8/15/21 (e) | 9,500 | 9,643 | |
| Publishing/Printing - 0.1% | |||
| Cenveo Corp. 6% 8/1/19 (e) | 9,850 | 8,668 | |
| Services - 0.3% | |||
| APX Group, Inc. 7.875% 12/1/22 | 8,975 | 9,446 | |
| Avis Budget Car Rental LLC/Avis Budget Finance, Inc. 3.5921% 12/1/17 (b) | 14,410 | 14,422 | |
| TOTAL SERVICES | 23,868 | ||
| Super Retail - 0.1% | |||
| JC Penney Corp., Inc. 5.875% 7/1/23 (e) | 6,385 | 6,578 | |
| Technology - 1.0% | |||
| Brocade Communications Systems, Inc. 4.625% 1/15/23 | 7,235 | 7,126 | |
| Diamond 1 Finance Corp./Diamond 2 Finance Corp.: | |||
| 3.48% 6/1/19 (e) | 6,199 | 6,361 | |
| 4.42% 6/15/21 (e) | 16,685 | 17,445 | |
| First Data Corp. 6.75% 11/1/20 (e) | 25,460 | 26,351 | |
| NXP BV/NXP Funding LLC: | |||
| 4.125% 6/1/21 (e) | 16,440 | 17,550 | |
| 5.75% 2/15/21 (e) | 14,760 | 15,350 | |
| 5.75% 3/15/23 (e) | 5,000 | 5,325 | |
| TOTAL TECHNOLOGY | 95,508 | ||
| Telecommunications - 1.6% | |||
| Altice Financing SA: | |||
| 6.5% 1/15/22 (e) | 7,240 | 7,568 | |
| 7.5% 5/15/26 (e) | 19,200 | 19,776 | |
| Columbus International, Inc. 7.375% 3/30/21 (e) | 14,535 | 15,552 | |
| DigitalGlobe, Inc. 5.25% 2/1/21 (e) | 3,905 | 3,934 | |
| Intelsat Jackson Holdings SA 8% 2/15/24 (e) | 14,100 | 14,171 | |
| Level 3 Financing, Inc. 4.4067% 1/15/18 (b) | 15,000 | 15,019 | |
| SFR Group SA: | |||
| 6% 5/15/22 (e) | 2,550 | 2,615 | |
| 6.25% 5/15/24 (e) | 10,905 | 10,898 | |
| 7.375% 5/1/26 (e) | 18,755 | 18,943 | |
| Sprint Capital Corp.: | |||
| 6.875% 11/15/28 | 4,000 | 3,680 | |
| 6.9% 5/1/19 | 5,000 | 5,263 | |
| Sprint Communications, Inc.: | |||
| 6% 11/15/22 | 30,000 | 27,956 | |
| 9% 11/15/18 (e) | 3,000 | 3,300 | |
| TOTAL TELECOMMUNICATIONS | 148,675 | ||
| Utilities - 0.2% | |||
| Energy Future Intermediate Holding Co. LLC/Energy Future Intermediate Holding Finance, Inc. 12.25% 3/1/22 (d)(e) | 8,728 | 11,237 | |
| NRG Energy, Inc. 6.625% 3/15/23 | 4,000 | 3,990 | |
| The AES Corp. 3.8421% 6/1/19 (b) | 1,433 | 1,431 | |
| TOTAL UTILITIES | 16,658 | ||
| TOTAL NONCONVERTIBLE BONDS | |||
| (Cost $730,376) | 731,063 | ||
| Shares | Value (000s) | ||
| Common Stocks - 0.4% | |||
| Broadcasting - 0.1% | |||
| Cumulus Media, Inc. Class A (f) | 28,882 | 40 | |
| ION Media Networks, Inc. (f) | 2,842 | 1,825 | |
| TOTAL BROADCASTING | 1,865 | ||
| Chemicals - 0.2% | |||
| LyondellBasell Industries NV Class A | 245,943 | 19,565 | |
| Homebuilders/Real Estate - 0.0% | |||
| Five Point Holdings LLC Class A(f) | 289,870 | 974 | |
| Metals/Mining - 0.1% | |||
| Warrior Met Coal LLC Class A (g) | 35,615 | 9,195 | |
| Paper - 0.0% | |||
| White Birch Cayman Holdings Ltd. (f) | 12,570 | 0 | |
| Telecommunications - 0.0% | |||
| FairPoint Communications, Inc. (f) | 34,287 | 535 | |
| Utilities - 0.0% | |||
| Calpine Corp. (f) | 20,715 | 247 | |
| Southcross Holdings Borrower LP | 2,927 | 1,446 | |
| TOTAL UTILITIES | 1,693 | ||
| TOTAL COMMON STOCKS | |||
| (Cost $85,130) | 33,827 | ||
| Money Market Funds - 9.8% | |||
| Fidelity Cash Central Fund, 0.41% (h) | |||
| (Cost $909,817) | 909,802,234 | 910,075 | |
| TOTAL INVESTMENT PORTFOLIO - 102.7% | |||
| (Cost $9,685,244) | 9,588,447 | ||
| NET OTHER ASSETS (LIABILITIES) - (2.7)% | (249,871) | ||
| NET ASSETS - 100% | $9,338,576 |
Values shown as $0 may reflect amounts less than $500.
Legend
(a) Remaining maturities of bank loan obligations may be less than the stated maturities shown as a result of contractual or optional prepayments by the borrower. Such prepayments cannot be predicted with certainty.
(b) Coupon rates for floating and adjustable rate securities reflect the rates in effect at period end.
(c) The coupon rate will be determined upon settlement of the loan after period end.
(d) Non-income producing - Security is in default.
(e) Security exempt from registration under Rule 144A of the Securities Act of 1933. These securities may be resold in transactions exempt from registration, normally to qualified institutional buyers. At the end of the period, the value of these securities amounted to $387,095,000 or 4.1% of net assets.
(f) Non-income producing
(g) Restricted securities - Investment in securities not registered under the Securities Act of 1933 (excluding 144A issues). At the end of the period, the value of restricted securities (excluding 144A issues) amounted to $9,195,000 or 0.1% of net assets.
(h) Affiliated fund that is generally available only to investment companies and other accounts managed by Fidelity Investments. The rate quoted is the annualized seven-day yield of the fund at period end. A complete unaudited listing of the fund's holdings as of its most recent quarter end is available upon request. In addition, each Fidelity Central Fund's financial statements, which are not covered by the Fund's Report of Independent Registered Public Accounting Firm, are available on the SEC's website or upon request.
Additional information on each restricted holding is as follows:
| Security | Acquisition Date | Acquisition Cost (000s) |
| Warrior Met Coal LLC Class A | 3/9/11 - 7/11/14 | $72,703 |
Affiliated Central Funds
Information regarding fiscal year to date income earned by the Fund from investments in Fidelity Central Funds is as follows:
| Fund | Income earned |
| (Amounts in thousands) | |
| Fidelity Cash Central Fund | $2,945 |
| Total | $2,945 |
Investment Valuation
The following is a summary of the inputs used, as of October 31, 2016, involving the Fund's assets and liabilities carried at fair value. The inputs or methodology used for valuing securities may not be an indication of the risk associated with investing in those securities. For more information on valuation inputs, and their aggregation into the levels used below, please refer to the Investment Valuation section in the accompanying Notes to Financial Statements.
| Valuation Inputs at Reporting Date: | ||||
| Description | Total | Level 1 | Level 2 | Level 3 |
| (Amounts in thousands) | ||||
| Investments in Securities: | ||||
| Equities: | ||||
| Consumer Discretionary | $1,865 | $40 | $-- | $1,825 |
| Energy | 9,195 | -- | -- | 9,195 |
| Materials | 19,565 | 19,565 | -- | -- |
| Real Estate | 974 | -- | -- | 974 |
| Telecommunication Services | 535 | 535 | -- | -- |
| Utilities | 1,693 | 247 | -- | 1,446 |
| Bank Loan Obligations | 7,913,482 | -- | 7,871,412 | 42,070 |
| Corporate Bonds | 731,063 | -- | 731,063 | -- |
| Money Market Funds | 910,075 | 910,075 | -- | -- |
| Total Investments in Securities: | $9,588,447 | $930,462 | $8,602,475 | $55,510 |
See accompanying notes which are an integral part of the financial statements.
Financial Statements
Statement of Assets and Liabilities
| Amounts in thousands (except per-share amounts) | October 31, 2016 | |
| Assets | ||
| Investment in securities, at value — See accompanying schedule: Unaffiliated issuers (cost $8,775,427) | $8,678,372 | |
| Fidelity Central Funds (cost $909,817) | 910,075 | |
| Total Investments (cost $9,685,244) | $9,588,447 | |
| Cash | 45,645 | |
| Receivable for investments sold | 78,897 | |
| Receivable for fund shares sold | 8,074 | |
| Interest receivable | 48,793 | |
| Distributions receivable from Fidelity Central Funds | 338 | |
| Prepaid expenses | 24 | |
| Total assets | 9,770,218 | |
| Liabilities | ||
| Payable for investments purchased | $375,366 | |
| Payable for fund shares redeemed | 44,237 | |
| Distributions payable | 5,748 | |
| Accrued management fee | 4,346 | |
| Distribution and service plan fees payable | 668 | |
| Other affiliated payables | 1,162 | |
| Other payables and accrued expenses | 115 | |
| Total liabilities | 431,642 | |
| Net Assets | $9,338,576 | |
| Net Assets consist of: | ||
| Paid in capital | $9,789,932 | |
| Undistributed net investment income | 27,697 | |
| Accumulated undistributed net realized gain (loss) on investments | (382,256) | |
| Net unrealized appreciation (depreciation) on investments | (96,797) | |
| Net Assets | $9,338,576 | |
| Calculation of Maximum Offering Price | ||
| Class A: | ||
| Net Asset Value and redemption price per share ($706,963 ÷ 73,671 shares) | $9.60 | |
| Maximum offering price per share (100/97.25 of $9.60) | $9.87 | |
| Class T: | ||
| Net Asset Value and redemption price per share ($170,741 ÷ 17,819 shares) | $9.58 | |
| Maximum offering price per share (100/97.25 of $9.58) | $9.85 | |
| Class C: | ||
| Net Asset Value and offering price per share ($582,061 ÷ 60,669 shares)(a) | $9.59 | |
| Fidelity Floating Rate High Income Fund: | ||
| Net Asset Value, offering price and redemption price per share ($6,131,215 ÷ 639,780 shares) | $9.58 | |
| Class I: | ||
| Net Asset Value, offering price and redemption price per share ($1,747,596 ÷ 182,509 shares) | $9.58 |
(a) Redemption price per share is equal to net asset value less any applicable contingent deferred sales charge.
See accompanying notes which are an integral part of the financial statements.
Statement of Operations
| Amounts in thousands | Year ended October 31, 2016 | |
| Investment Income | ||
| Dividends | $802 | |
| Interest | 421,902 | |
| Income from Fidelity Central Funds | 2,945 | |
| Total income | 425,649 | |
| Expenses | ||
| Management fee | $52,254 | |
| Transfer agent fees | 12,872 | |
| Distribution and service plan fees | 8,300 | |
| Accounting fees and expenses | 1,544 | |
| Custodian fees and expenses | 105 | |
| Independent trustees' fees and expenses | 41 | |
| Registration fees | 220 | |
| Audit | 181 | |
| Legal | 139 | |
| Miscellaneous | 84 | |
| Total expenses before reductions | 75,740 | |
| Expense reductions | (77) | 75,663 |
| Net investment income (loss) | 349,986 | |
| Realized and Unrealized Gain (Loss) | ||
| Net realized gain (loss) on: | ||
| Investment securities: | ||
| Unaffiliated issuers | (225,630) | |
| Fidelity Central Funds | 10 | |
| Total net realized gain (loss) | (225,620) | |
| Change in net unrealized appreciation (depreciation) on investment securities | 386,147 | |
| Net gain (loss) | 160,527 | |
| Net increase (decrease) in net assets resulting from operations | $510,513 |
See accompanying notes which are an integral part of the financial statements.
Statement of Changes in Net Assets
| Amounts in thousands | Year ended October 31, 2016 | Year ended October 31, 2015 |
| Increase (Decrease) in Net Assets | ||
| Operations | ||
| Net investment income (loss) | $349,986 | $489,822 |
| Net realized gain (loss) | (225,620) | (176,848) |
| Change in net unrealized appreciation (depreciation) | 386,147 | (378,925) |
| Net increase (decrease) in net assets resulting from operations | 510,513 | (65,951) |
| Distributions to shareholders from net investment income | (383,140) | (448,829) |
| Distributions to shareholders from net realized gain | – | (58,045) |
| Total distributions | (383,140) | (506,874) |
| Share transactions - net increase (decrease) | (1,573,710) | (3,268,839) |
| Redemption fees | 413 | 858 |
| Total increase (decrease) in net assets | (1,445,924) | (3,840,806) |
| Net Assets | ||
| Beginning of period | 10,784,500 | 14,625,306 |
| End of period | $9,338,576 | $10,784,500 |
| Other Information | ||
| Undistributed net investment income end of period | $27,697 | $38,133 |
See accompanying notes which are an integral part of the financial statements.
Financial Highlights — Fidelity Advisor Floating Rate High Income Fund Class A
| Years ended October 31, | 2016 | 2015 | 2014 | 2013 | 2012 |
| Selected Per–Share Data | |||||
| Net asset value, beginning of period | $9.42 | $9.85 | $9.99 | $9.94 | $9.73 |
| Income from Investment Operations | |||||
| Net investment income (loss)A | .334 | .375 | .317 | .310 | .340 |
| Net realized and unrealized gain (loss) | .211 | (.425) | (.114) | .070 | .195 |
| Total from investment operations | .545 | (.050) | .203 | .380 | .535 |
| Distributions from net investment income | (.365) | (.341) | (.307) | (.282) | (.325) |
| Distributions from net realized gain | – | (.040) | (.036) | (.049) | – |
| Total distributions | (.365) | (.381) | (.343) | (.331) | (.325) |
| Redemption fees added to paid in capitalA | –B | .001 | –B | .001 | –B |
| Net asset value, end of period | $9.60 | $9.42 | $9.85 | $9.99 | $9.94 |
| Total ReturnC,D | 5.98% | (.53)% | 2.05% | 3.89% | 5.60% |
| Ratios to Average Net AssetsE,F | |||||
| Expenses before reductions | .99% | .98% | .98% | .99% | .99% |
| Expenses net of fee waivers, if any | .99% | .98% | .98% | .99% | .99% |
| Expenses net of all reductions | .98% | .98% | .98% | .99% | .99% |
| Net investment income (loss) | 3.58% | 3.86% | 3.17% | 3.11% | 3.47% |
| Supplemental Data | |||||
| Net assets, end of period (in millions) | $707 | $863 | $1,185 | $1,681 | $1,305 |
| Portfolio turnover rateG | 46% | 26% | 54% | 62% | 49% |
A Calculated based on average shares outstanding during the period.
B Amount represents less than $.0005 per share.
C Total returns would have been lower if certain expenses had not been reduced during the applicable periods shown.
D Total returns do not include the effect of the sales charges.
E Fees and expenses of any underlying Fidelity Central Funds are not included in the Fund's expense ratio. The Fund indirectly bears its proportionate share of the expenses of any underlying Fidelity Central Funds.
F Expense ratios reflect operating expenses of the class. Expenses before reductions do not reflect amounts reimbursed by the investment adviser or reductions from brokerage service arrangements or reductions from other expense offset arrangements and do not represent the amount paid by the class during periods when reimbursements or reductions occur. Expenses net of fee waivers reflect expenses after reimbursement by the investment adviser but prior to reductions from brokerage service arrangements or other expense offset arrangements. Expenses net of all reductions represent the net expenses paid by the class.
G Amount does not include the portfolio activity of any underlying Fidelity Central Funds.
See accompanying notes which are an integral part of the financial statements.
Financial Highlights — Fidelity Advisor Floating Rate High Income Fund Class T
| Years ended October 31, | 2016 | 2015 | 2014 | 2013 | 2012 |
| Selected Per–Share Data | |||||
| Net asset value, beginning of period | $9.40 | $9.84 | $9.98 | $9.93 | $9.72 |
| Income from Investment Operations | |||||
| Net investment income (loss)A | .324 | .365 | .306 | .299 | .330 |
| Net realized and unrealized gain (loss) | .212 | (.434) | (.112) | .071 | .195 |
| Total from investment operations | .536 | (.069) | .194 | .370 | .525 |
| Distributions from net investment income | (.356) | (.332) | (.298) | (.272) | (.315) |
| Distributions from net realized gain | – | (.040) | (.036) | (.049) | – |
| Total distributions | (.356) | (.372) | (.334) | (.321) | (.315) |
| Redemption fees added to paid in capitalA | –B | .001 | –B | .001 | –B |
| Net asset value, end of period | $9.58 | $9.40 | $9.84 | $9.98 | $9.93 |
| Total ReturnC,D | 5.89% | (.72)% | 1.96% | 3.79% | 5.50% |
| Ratios to Average Net AssetsE,F | |||||
| Expenses before reductions | 1.08% | 1.07% | 1.07% | 1.09% | 1.09% |
| Expenses net of fee waivers, if any | 1.08% | 1.07% | 1.07% | 1.09% | 1.09% |
| Expenses net of all reductions | 1.08% | 1.07% | 1.07% | 1.09% | 1.09% |
| Net investment income (loss) | 3.48% | 3.77% | 3.08% | 3.01% | 3.37% |
| Supplemental Data | |||||
| Net assets, end of period (in millions) | $171 | $195 | $240 | $272 | $241 |
| Portfolio turnover rateG | 46% | 26% | 54% | 62% | 49% |
A Calculated based on average shares outstanding during the period.
B Amount represents less than $.0005 per share.
C Total returns would have been lower if certain expenses had not been reduced during the applicable periods shown.
D Total returns do not include the effect of the sales charges.
E Fees and expenses of any underlying Fidelity Central Funds are not included in the Fund's expense ratio. The Fund indirectly bears its proportionate share of the expenses of any underlying Fidelity Central Funds.
F Expense ratios reflect operating expenses of the class. Expenses before reductions do not reflect amounts reimbursed by the investment adviser or reductions from brokerage service arrangements or reductions from other expense offset arrangements and do not represent the amount paid by the class during periods when reimbursements or reductions occur. Expenses net of fee waivers reflect expenses after reimbursement by the investment adviser but prior to reductions from brokerage service arrangements or other expense offset arrangements. Expenses net of all reductions represent the net expenses paid by the class.
G Amount does not include the portfolio activity of any underlying Fidelity Central Funds.
See accompanying notes which are an integral part of the financial statements.
Financial Highlights — Fidelity Advisor Floating Rate High Income Fund Class C
| Years ended October 31, | 2016 | 2015 | 2014 | 2013 | 2012 |
| Selected Per–Share Data | |||||
| Net asset value, beginning of period | $9.41 | $9.85 | $9.99 | $9.94 | $9.73 |
| Income from Investment Operations | |||||
| Net investment income (loss)A | .263 | .301 | .241 | .235 | .267 |
| Net realized and unrealized gain (loss) | .212 | (.434) | (.113) | .070 | .195 |
| Total from investment operations | .475 | (.133) | .128 | .305 | .462 |
| Distributions from net investment income | (.295) | (.268) | (.232) | (.207) | (.252) |
| Distributions from net realized gain | – | (.040) | (.036) | (.049) | – |
| Total distributions | (.295) | (.308) | (.268) | (.256) | (.252) |
| Redemption fees added to paid in capitalA | –B | .001 | –B | .001 | –B |
| Net asset value, end of period | $9.59 | $9.41 | $9.85 | $9.99 | $9.94 |
| Total ReturnC,D | 5.19% | (1.38)% | 1.29% | 3.11% | 4.81% |
| Ratios to Average Net AssetsE,F | |||||
| Expenses before reductions | 1.74% | 1.73% | 1.73% | 1.74% | 1.74% |
| Expenses net of fee waivers, if any | 1.74% | 1.73% | 1.73% | 1.74% | 1.74% |
| Expenses net of all reductions | 1.74% | 1.73% | 1.73% | 1.74% | 1.74% |
| Net investment income (loss) | 2.82% | 3.10% | 2.41% | 2.35% | 2.72% |
| Supplemental Data | |||||
| Net assets, end of period (in millions) | $582 | $671 | $835 | $960 | $806 |
| Portfolio turnover rateG | 46% | 26% | 54% | 62% | 49% |
A Calculated based on average shares outstanding during the period.
B Amount represents less than $.0005 per share.
C Total returns would have been lower if certain expenses had not been reduced during the applicable periods shown.
D Total returns do not include the effect of the contingent deferred sales charge.
E Fees and expenses of any underlying Fidelity Central Funds are not included in the Fund's expense ratio. The Fund indirectly bears its proportionate share of the expenses of any underlying Fidelity Central Funds.
F Expense ratios reflect operating expenses of the class. Expenses before reductions do not reflect amounts reimbursed by the investment adviser or reductions from brokerage service arrangements or reductions from other expense offset arrangements and do not represent the amount paid by the class during periods when reimbursements or reductions occur. Expenses net of fee waivers reflect expenses after reimbursement by the investment adviser but prior to reductions from brokerage service arrangements or other expense offset arrangements. Expenses net of all reductions represent the net expenses paid by the class.
G Amount does not include the portfolio activity of any underlying Fidelity Central Funds.
See accompanying notes which are an integral part of the financial statements.
Financial Highlights — Fidelity Floating Rate High Income Fund
| Years ended October 31, | 2016 | 2015 | 2014 | 2013 | 2012 |
| Selected Per–Share Data | |||||
| Net asset value, beginning of period | $9.40 | $9.84 | $9.98 | $9.93 | $9.72 |
| Income from Investment Operations | |||||
| Net investment income (loss)A | .359 | .401 | .344 | .337 | .368 |
| Net realized and unrealized gain (loss) | .212 | (.435) | (.113) | .071 | .195 |
| Total from investment operations | .571 | (.034) | .231 | .408 | .563 |
| Distributions from net investment income | (.391) | (.367) | (.335) | (.310) | (.353) |
| Distributions from net realized gain | – | (.040) | (.036) | (.049) | – |
| Total distributions | (.391) | (.407) | (.371) | (.359) | (.353) |
| Redemption fees added to paid in capitalA | –B | .001 | –B | .001 | –B |
| Net asset value, end of period | $9.58 | $9.40 | $9.84 | $9.98 | $9.93 |
| Total ReturnC | 6.28% | (.36)% | 2.34% | 4.19% | 5.91% |
| Ratios to Average Net AssetsD,E | |||||
| Expenses before reductions | .71% | .70% | .69% | .70% | .71% |
| Expenses net of fee waivers, if any | .71% | .70% | .69% | .70% | .71% |
| Expenses net of all reductions | .71% | .70% | .69% | .70% | .71% |
| Net investment income (loss) | 3.86% | 4.14% | 3.45% | 3.39% | 3.75% |
| Supplemental Data | |||||
| Net assets, end of period (in millions) | $6,131 | $6,615 | $9,032 | $8,882 | $5,720 |
| Portfolio turnover rateF | 46% | 26% | 54% | 62% | 49% |
A Calculated based on average shares outstanding during the period.
B Amount represents less than $.0005 per share.
C Total returns would have been lower if certain expenses had not been reduced during the applicable periods shown.
D Fees and expenses of any underlying Fidelity Central Funds are not included in the Fund's expense ratio. The Fund indirectly bears its proportionate share of the expenses of any underlying Fidelity Central Funds.
E Expense ratios reflect operating expenses of the class. Expenses before reductions do not reflect amounts reimbursed by the investment adviser or reductions from brokerage service arrangements or reductions from other expense offset arrangements and do not represent the amount paid by the class during periods when reimbursements or reductions occur. Expenses net of fee waivers reflect expenses after reimbursement by the investment adviser but prior to reductions from brokerage service arrangements or other expense offset arrangements. Expenses net of all reductions represent the net expenses paid by the class.
F Amount does not include the portfolio activity of any underlying Fidelity Central Funds.
See accompanying notes which are an integral part of the financial statements.
Financial Highlights — Fidelity Advisor Floating Rate High Income Fund Class I
| Years ended October 31, | 2016 | 2015 | 2014 | 2013 | 2012 |
| Selected Per–Share Data | |||||
| Net asset value, beginning of period | $9.40 | $9.83 | $9.97 | $9.92 | $9.71 |
| Income from Investment Operations | |||||
| Net investment income (loss)A | .355 | .396 | .339 | .332 | .363 |
| Net realized and unrealized gain (loss) | .211 | (.424) | (.113) | .071 | .196 |
| Total from investment operations | .566 | (.028) | .226 | .403 | .559 |
| Distributions from net investment income | (.386) | (.363) | (.330) | (.305) | (.349) |
| Distributions from net realized gain | – | (.040) | (.036) | (.049) | – |
| Total distributions | (.386) | (.403) | (.366) | (.354) | (.349) |
| Redemption fees added to paid in capitalA | –B | .001 | –B | .001 | –B |
| Net asset value, end of period | $9.58 | $9.40 | $9.83 | $9.97 | $9.92 |
| Total ReturnC | 6.23% | (.30)% | 2.29% | 4.15% | 5.87% |
| Ratios to Average Net AssetsD,E | |||||
| Expenses before reductions | .75% | .74% | .74% | .75% | .75% |
| Expenses net of fee waivers, if any | .75% | .74% | .74% | .75% | .75% |
| Expenses net of all reductions | .75% | .74% | .74% | .75% | .75% |
| Net investment income (loss) | 3.81% | 4.10% | 3.40% | 3.34% | 3.71% |
| Supplemental Data | |||||
| Net assets, end of period (in millions) | $1,748 | $2,429 | $3,317 | $3,646 | $2,510 |
| Portfolio turnover rateF | 46% | 26% | 54% | 62% | 49% |
A Calculated based on average shares outstanding during the period.
B Amount represents less than $.0005 per share.
C Total returns would have been lower if certain expenses had not been reduced during the applicable periods shown.
D Fees and expenses of any underlying Fidelity Central Funds are not included in the Fund's expense ratio. The Fund indirectly bears its proportionate share of the expenses of any underlying Fidelity Central Funds.
E Expense ratios reflect operating expenses of the class. Expenses before reductions do not reflect amounts reimbursed by the investment adviser or reductions from brokerage service arrangements or reductions from other expense offset arrangements and do not represent the amount paid by the class during periods when reimbursements or reductions occur. Expenses net of fee waivers reflect expenses after reimbursement by the investment adviser but prior to reductions from brokerage service arrangements or other expense offset arrangements. Expenses net of all reductions represent the net expenses paid by the class.
F Amount does not include the portfolio activity of any underlying Fidelity Central Funds.
See accompanying notes which are an integral part of the financial statements.
Notes to Financial Statements
For the period ended October 31, 2016
(Amounts in thousands except percentages)
1. Organization.
Fidelity Advisor Floating Rate High Income Fund (the Fund) is a fund of Fidelity Advisor Series I (the Trust) and is authorized to issue an unlimited number of shares. The Trust is registered under the Investment Company Act of 1940, as amended (the 1940 Act), as an open-end management investment company organized as a Massachusetts business trust. The Fund offers Class A, Class T, Class C, Fidelity Floating Rate High Income Fund and Class I shares, each of which has equal rights as to assets and voting privileges. Each class has exclusive voting rights with respect to matters that affect that class.
After the close of business on June 24, 2016, all outstanding Class B shares were converted to Class A shares. All current fiscal period dollar and share amounts for Class B presented in the Notes to Financial Statements are for the period November 1, 2015 through June 24, 2016.
2. Investments in Fidelity Central Funds.
The Fund invests in Fidelity Central Funds, which are open-end investment companies generally available only to other investment companies and accounts managed by the investment adviser and its affiliates. The Fund's Schedule of Investments lists each of the Fidelity Central Funds held as of period end, if any, as an investment of the Fund, but does not include the underlying holdings of each Fidelity Central Fund. As an Investing Fund, the Fund indirectly bears its proportionate share of the expenses of the underlying Fidelity Central Funds.
The Money Market Central Funds seek preservation of capital and current income and are managed by Fidelity Investments Money Management, Inc. (FIMM), an affiliate of the investment adviser. Annualized expenses of the Money Market Central Funds as of their most recent shareholder report date are less than .005%.
A complete unaudited list of holdings for each Fidelity Central Fund is available upon request or at the Securities and Exchange Commission (the SEC) website at www.sec.gov. In addition, the financial statements of the Fidelity Central Funds, which are not covered by the Fund's Report of Independent Registered Public Accounting Firm, are available on the SEC website or upon request.
3. Significant Accounting Policies.
The financial statements have been prepared in conformity with accounting principles generally accepted in the United States of America (GAAP), which require management to make certain estimates and assumptions at the date of the financial statements. Actual results could differ from those estimates. Subsequent events, if any, through the date that the financial statements were issued have been evaluated in the preparation of the financial statements. The following summarizes the significant accounting policies of the Fund:
Investment Valuation. Investments are valued as of 4:00 p.m. Eastern time on the last calendar day of the period. The Board of Trustees (the Board) has delegated the day to day responsibility for the valuation of the Fund's investments to the Fair Value Committee (the Committee) established by the Fund's investment adviser. In accordance with valuation policies and procedures approved by the Board, the Fund attempts to obtain prices from one or more third party pricing vendors or brokers to value its investments. When current market prices, quotations or currency exchange rates are not readily available or reliable, investments will be fair valued in good faith by the Committee, in accordance with procedures adopted by the Board. Factors used in determining fair value vary by investment type and may include market or investment specific events, changes in interest rates and credit quality. The frequency with which these procedures are used cannot be predicted and they may be utilized to a significant extent. The Committee oversees the Fund's valuation policies and procedures and reports to the Board on the Committee's activities and fair value determinations. The Board monitors the appropriateness of the procedures used in valuing the Fund's investments and ratifies the fair value determinations of the Committee.
The Fund categorizes the inputs to valuation techniques used to value its investments into a disclosure hierarchy consisting of three levels as shown below:
- Level 1 – quoted prices in active markets for identical investments
- Level 2 – other significant observable inputs (including quoted prices for similar investments, interest rates, prepayment speeds, etc.)
- Level 3 – unobservable inputs (including the Fund's own assumptions based on the best information available)
Valuation techniques used to value the Fund's investments by major category are as follows:
Debt securities, including restricted securities, are valued based on evaluated prices received from third party pricing vendors or from brokers who make markets in such securities. Corporate bonds and bank loan obligations are valued by pricing vendors who utilize matrix pricing which considers yield or price of bonds of comparable quality, coupon, maturity and type or by broker-supplied prices. When independent prices are unavailable or unreliable, debt securities may be valued utilizing pricing methodologies which consider similar factors that would be used by third party pricing vendors. Debt securities are generally categorized as Level 2 in the hierarchy but may be Level 3 depending on the circumstances. The Fund invests a significant portion of its assets in below investment grade securities. The value of these securities can be more volatile due to changes in the credit quality of the issuer and is sensitive to changes in economic, market and regulatory conditions.
Equity securities, including restricted securities, for which market quotations are readily available, are valued at the last reported sale price or official closing price as reported by a third party pricing vendor on the primary market or exchange on which they are traded and are categorized as Level 1 in the hierarchy. In the event there were no sales during the day or closing prices are not available, securities are valued at the last quoted bid price or may be valued using the last available price and are generally categorized as Level 2 in the hierarchy. For foreign equity securities, when market or security specific events arise, comparisons to the valuation of American Depositary Receipts (ADRs), futures contracts, Exchange-Traded Funds (ETFs) and certain indexes as well as quoted prices for similar securities may be used and would be categorized as Level 2 in the hierarchy. Utilizing these techniques may result in transfers between Level 1 and Level 2. For equity securities, including restricted securities, where observable inputs are limited, assumptions about market activity and risk are used and these securities may be categorized as Level 3 in the hierarchy.
Investments in open-end mutual funds, including the Fidelity Central Funds, are valued at their closing net asset value (NAV) each business day and are categorized as Level 1 in the hierarchy.
Changes in valuation techniques may result in transfers in or out of an assigned level within the disclosure hierarchy. The aggregate value of investments by input level as of October 31, 2016 is included at the end of the Fund's Schedule of Investments.
Investment Transactions and Income. For financial reporting purposes, the Fund's investment holdings and NAV include trades executed through the end of the last business day of the period. The NAV per share for processing shareholder transactions is calculated as of the close of business of the New York Stock Exchange (NYSE), normally 4:00 p.m. Eastern time and includes trades executed through the end of the prior business day. Gains and losses on securities sold are determined on the basis of identified cost. Dividend income is recorded on the ex-dividend date, except for certain dividends from foreign securities where the ex-dividend date may have passed, which are recorded as soon as the Fund is informed of the ex-dividend date. Non-cash dividends included in dividend income, if any, are recorded at the fair market value of the securities received. Income and capital gain distributions from Fidelity Central Funds, if any, are recorded on the ex-dividend date. Distributions received on securities that represent a return of capital or capital gain are recorded as a reduction of cost of investments and/or as a realized gain. Subsequent to ex-dividend date the Fund determines the components of these distributions, based upon receipt of tax filings or other correspondence relating to the underlying investment. Interest income is accrued as earned and includes coupon interest and amortization of premium and accretion of discount on debt securities as applicable. Debt obligations may be placed on non-accrual status and related interest income may be reduced by ceasing current accruals and writing off interest receivables when the collection of all or a portion of interest has become doubtful based on consistently applied procedures. A debt obligation is removed from non-accrual status when the issuer resumes interest payments or when collectability of interest is reasonably assured. The Fund earns certain fees in connection with its floating rate loan purchasing activities. These fees are in addition to interest payments earned and may include amendment fees, consent fees and prepayment fees. These fees are recorded as Interest in the accompanying financial statements.
Class Allocations and Expenses. Investment income, realized and unrealized capital gains and losses, common expenses of the Fund, and certain fund-level expense reductions, if any, are allocated daily on a pro-rata basis to each class based on the relative net assets of each class to the total net assets of the Fund. Each class differs with respect to transfer agent and distribution and service plan fees incurred. Certain expense reductions may also differ by class. For the reporting period, the allocated portion of income and expenses to each class as a percent of its average net assets may vary due to the timing of recording these transactions in relation to fluctuating net assets of the classes. Expenses directly attributable to a fund are charged to that fund. Expenses attributable to more than one fund are allocated among the respective funds on the basis of relative net assets or other appropriate methods. Expense estimates are accrued in the period to which they relate and adjustments are made when actual amounts are known.
Income Tax Information and Distributions to Shareholders. Each year, the Fund intends to qualify as a regulated investment company under Subchapter M of the Internal Revenue Code, including distributing substantially all of its taxable income and realized gains. As a result, no provision for U.S. Federal income taxes is required. As of October 31, 2016, the Fund did not have any unrecognized tax benefits in the financial statements; nor is the Fund aware of any tax positions for which it is reasonably possible that the total amounts of unrecognized tax benefits will significantly change in the next twelve months. The Fund files a U.S. federal tax return, in addition to state and local tax returns as required. The Fund's federal income tax returns are subject to examination by the Internal Revenue Service (IRS) for a period of three fiscal years after they are filed. State and local tax returns may be subject to examination for an additional fiscal year depending on the jurisdiction.
Dividends are declared and recorded daily and paid monthly from net investment income. Distributions from realized gains, if any, are declared and recorded on the ex-dividend date. Income dividends and capital gain distributions are declared separately for each class. Income and capital gain distributions are determined in accordance with income tax regulations, which may differ from GAAP.
Capital accounts within the financial statements are adjusted for permanent book-tax differences. These adjustments have no impact on net assets or the results of operations. Capital accounts are not adjusted for temporary book-tax differences which will reverse in a subsequent period.
Book-tax differences are primarily due to market discount, capital loss carryforwards and losses deferred due to wash sales.
The federal tax cost of investment securities and unrealized appreciation (depreciation) as of period end were as follows:
| Gross unrealized appreciation | $129,688 |
| Gross unrealized depreciation | (212,395) |
| Net unrealized appreciation (depreciation) on securities | $(82,707) |
| Tax Cost | $9,671,154 |
The tax-based components of distributable earnings as of period end were as follows:
| Undistributed ordinary income | $5,235 |
| Capital loss carryforward | $( 373,885) |
| Net unrealized appreciation (depreciation) on securities and other investments | $(82,707) |
Capital loss carryforwards are only available to offset future capital gains of the Fund to the extent provided by regulations and may be limited. Under the Regulated Investment Company Modernization Act of 2010 (the Act), the Fund is permitted to carry forward capital losses incurred in taxable years beginning after December 22, 2010 for an unlimited period and such capital losses are required to be used prior to any losses that expire. The capital loss carryforward information presented below, including any applicable limitation, is estimated as of fiscal period end and is subject to adjustment.
| No expiration | |
| Short-term | $(30,793) |
| Long-term | (343,092) |
| Total capital loss carryforward | $(373,885) |
The tax character of distributions paid was as follows:
| October 31, 2016 | October 31, 2015 | |
| Ordinary Income | $383,140 | $ 474,949 |
| Long-term Capital Gains | – | 31,925 |
| Total | $383,140 | $ 506,874 |
Short-Term Trading (Redemption) Fees. Shares held by investors in the Fund less than 60 days may have been subject to a redemption fee equal to 1.00% of the NAV of shares redeemed. All redemption fees, which reduce the proceeds of the shareholder redemption, are retained by the Fund and accounted for as an addition to paid in capital.
Restricted Securities. The Fund may invest in securities that are subject to legal or contractual restrictions on resale. These securities generally may be resold in transactions exempt from registration or to the public if the securities are registered. Disposal of these securities may involve time-consuming negotiations and expense, and prompt sale at an acceptable price may be difficult. Information regarding restricted securities is included at the end of the Fund's Schedule of Investments.
Loans and Other Direct Debt Instruments. The Fund invests in direct debt instruments which are interests in amounts owed to lenders by corporate or other borrowers. These instruments may be in the form of loans, trade claims or other receivables and may include standby financing commitments such as revolving credit facilities that obligate the Fund to supply additional cash to the borrower on demand. Loans may be acquired through assignment or participation. The Fund did not have any unfunded loan commitments, which are contractual obligations for future funding, at period end.
4. Purchase and Sales of Investments.
Purchases and sales of securities (including principal repayments of bank loan obligations), other than short-term securities, aggregated $4,046,299 and $5,721,506, respectively.
5. Fees and Other Transactions with Affiliates.
Management Fee. Fidelity Management & Research Company (the investment adviser) and its affiliates provide the Fund with investment management related services for which the Fund pays a monthly management fee. The management fee is the sum of an individual fund fee rate that is based on an annual rate of .45% of the Fund's average net assets and an annualized group fee rate that averaged .11% during the period. The group fee rate is based upon the average net assets of all the mutual funds advised by the investment adviser, including any mutual funds previously advised by the investment adviser that are currently advised by Fidelity SelectCo, LLC, an affiliate of the investment adviser. The group fee rate decreases as assets under management increase and increases as assets under management decrease. For the reporting period, the total annual management fee rate was .56% of the Fund's average net assets.
Distribution and Service Plan Fees. In accordance with Rule 12b-1 of the 1940 Act, the Fund has adopted separate Distribution and Service Plans for each class of shares. Certain classes pay Fidelity Distributors Corporation (FDC), an affiliate of the investment adviser, separate Distribution and Service Fees, each of which is based on an annual percentage of each class' average net assets. In addition, FDC may pay financial intermediaries for selling shares of the Fund and providing shareholder support services. For the period, the Distribution and Service Fee rates, total fees and amounts retained by FDC were as follows:
| Distribution Fee | Service Fee | Total Fees | Retained by FDC |
|
| Class A | -% | .25% | $1,837 | $– |
| Class T | -% | .25% | 437 | – |
| Class B | .55% | .15% | 41 | 32 |
| Class C | .75% | .25% | 5,985 | 370 |
| $8,300 | $402 |
Sales Load. FDC may receive a front-end sales charge of up to 2.75% for selling Class A shares and Class T shares, some of which is paid to financial intermediaries for selling shares of the Fund. Depending on the holding period, FDC may receive contingent deferred sales charges levied on Class A, Class T, Class B, and Class C redemptions. The deferred sales charges range from 3.50% to 1.00% for Class B shares, 1.00% for Class C shares, 1.00% or .50% for certain purchases of Class A shares and .25% for certain purchases of Class T shares.
For the period, sales charge amounts retained by FDC were as follows:
| Retained by FDC |
|
| Class A | $24 |
| Class T | 6 |
| Class B(a) | 5 |
| Class C(a) | 30 |
| $65 |
(a) When Class B and Class C shares are initially sold, FDC pays commissions from its own resources to financial intermediaries through which the sales are made.
Transfer Agent Fees. Fidelity Investments Institutional Operations Company, Inc., (FIIOC), an affiliate of the investment adviser, is the transfer, dividend disbursing and shareholder servicing agent for each class of the Fund. FIIOC receives account fees and asset-based fees that vary according to the account size and type of account of the shareholders of the respective classes of the Fund. FIIOC pays for typesetting, printing and mailing of shareholder reports, except proxy statements.
For the period, transfer agent fees for each class were as follows:
| Amount | % of Class-Level Average Net Assets |
|
| Class A | $1,106 | .15 |
| Class T | 431 | .25 |
| Class B | 10 | .18 |
| Class C | 929 | .16 |
| Fidelity Floating Rate High Income Fund | 7,004 | .12 |
| Class I | 3,392 | .17 |
| $ 12,872 |
Accounting Fees. Fidelity Service Company, Inc. (FSC), an affiliate of the investment adviser, maintains the Fund's accounting records. The fee is based on the level of average net assets for each month.
Interfund Trades. The Fund may purchase from or sell securities to other Fidelity Funds under procedures adopted by the Board. The procedures have been designed to ensure these interfund trades are executed in accordance with Rule 17a-7 of the 1940 Act. Interfund trades are included within the respective purchases and sales amounts shown in the Purchases and Sales of Investments note.
6. Committed Line of Credit.
The Fund participates with other funds managed by the investment adviser or an affiliate in a $4.25 billion credit facility (the "line of credit") to be utilized for temporary or emergency purposes to fund shareholder redemptions or for other short-term liquidity purposes. The Fund has agreed to pay commitment fees on its pro-rata portion of the line of credit, which amounted to $24 and is reflected in Miscellaneous expenses on the Statement of Operations. During the period, the Fund did not borrow on this line of credit.
7. Expense Reductions.
Through arrangements with the Fund's custodian, credits realized as a result of certain uninvested cash balances were used to reduce the Fund's expenses. During the period, these credits reduced the Fund's custody expenses by $37.
In addition, during the period the investment adviser reimbursed and/or waived a portion of fund-level operating expenses in the amount of $40.
8. Distributions to Shareholders.
Distributions to shareholders of each class were as follows:
| Year ended October 31, 2016 | Year ended October 31, 2015 | |
| From net investment income | ||
| Class A | $28,998 | $33,971 |
| Class T | 6,712 | 7,344 |
| Class B | 210 | 423 |
| Class C | 19,076 | 20,389 |
| Fidelity Floating Rate High Income Fund | 244,237 | 280,321 |
| Class I | 83,907 | 106,381 |
| Total | $383,140 | $448,829 |
| From net realized gain | ||
| Class A | $– | $4,660 |
| Class T | – | 949 |
| Class B | – | 67 |
| Class C | – | 3,316 |
| Fidelity Floating Rate High Income Fund | – | 35,966 |
| Class I | – | 13,087 |
| Total | $– | $58,045 |
9. Share Transactions.
Share transactions for each class were as follows and may contain automatic conversions between classes or exchanges between affiliated funds:
| Shares | Shares | Dollars | Dollars | |
| Year ended October 31, 2016 | Year ended October 31, 2015 | Year ended October 31, 2016 | Year ended October 31, 2015 | |
| Class A | ||||
| Shares sold | 13,632 | 14,549 | $127,187 | $140,420 |
| Reinvestment of distributions | 2,814 | 3,585 | 26,169 | 34,673 |
| Shares redeemed | (34,450) | (46,740) | (318,820) | (452,094) |
| Net increase (decrease) | (18,004) | (28,606) | $(165,464) | $(277,001) |
| Class T | ||||
| Shares sold | 1,326 | 2,073 | $12,365 | $20,042 |
| Reinvestment of distributions | 671 | 799 | 6,235 | 7,716 |
| Shares redeemed | (4,884) | (6,523) | (45,244) | (63,018) |
| Net increase (decrease) | (2,887) | (3,651) | $(26,644) | $(35,260) |
| Class B | ||||
| Shares sold | 10 | 106 | $96 | $1,023 |
| Reinvestment of distributions | 19 | 44 | 177 | 429 |
| Shares redeemed | (1,219) | (682) | (11,330) | (6,588) |
| Net increase (decrease) | (1,190) | (532) | $(11,057) | $(5,136) |
| Class C | ||||
| Shares sold | 5,299 | 7,045 | $49,451 | $68,101 |
| Reinvestment of distributions | 1,645 | 1,955 | 15,298 | 18,899 |
| Shares redeemed | (17,529) | (22,521) | (162,349) | (217,845) |
| Net increase (decrease) | (10,585) | (13,521) | $(97,600) | $(130,845) |
| Fidelity Floating Rate High Income Fund | ||||
| Shares sold | 152,772 | 148,966 | $1,428,276 | $1,441,402 |
| Reinvestment of distributions | 21,133 | 26,586 | 196,548 | 256,678 |
| Shares redeemed | (237,658) | (390,276) | (2,193,671) | (3,761,603) |
| Net increase (decrease) | (63,753) | (214,724) | $(568,847) | $(2,063,523) |
| Class I | ||||
| Shares sold | 58,131 | 66,570 | $539,868 | $643,823 |
| Reinvestment of distributions | 5,808 | 7,469 | 53,924 | 72,034 |
| Shares redeemed | (139,996) | (152,936) | (1,297,890) | (1,472,931) |
| Net increase (decrease) | (76,057) | (78,897) | $(704,098) | $(757,074) |
10. Other.
The Fund's organizational documents provide former and current trustees and officers with a limited indemnification against liabilities arising in connection with the performance of their duties to the Fund. In the normal course of business, the Fund may also enter into contracts that provide general indemnifications. The Fund's maximum exposure under these arrangements is unknown as this would be dependent on future claims that may be made against the Fund. The risk of material loss from such claims is considered remote.
Report of Independent Registered Public Accounting Firm
To the Trustees of Fidelity Advisor Series I and Shareholders of Fidelity Advisor Floating Rate High Income Fund:
We have audited the accompanying statement of assets and liabilities of Fidelity Advisor Floating Rate High Income Fund (the Fund), a fund of Fidelity Advisor Series I, including the schedule of investments, as of October 31, 2016, and the related statement of operations for the year then ended, the statement of changes in net assets for each of the two years in the period then ended, and the financial highlights for each of the five years in the period then ended. These financial statements and financial highlights are the responsibility of the Fund's management. Our responsibility is to express an opinion on these financial statements and financial highlights based on our audits.
We conducted our audits in accordance with the standards of the Public Company Accounting Oversight Board (United States). Those standards require that we plan and perform the audit to obtain reasonable assurance about whether the financial statements and financial highlights are free of material misstatement. The Fund is not required to have, nor were we engaged to perform, an audit of its internal control over financial reporting. Our audits included consideration of internal control over financial reporting as a basis for designing audit procedures that are appropriate in the circumstances, but not for the purpose of expressing an opinion on the effectiveness of the Fund's internal control over financial reporting. Accordingly, we express no such opinion. An audit also includes examining, on a test basis, evidence supporting the amounts and disclosures in the financial statements, assessing the accounting principles used and significant estimates made by management, as well as evaluating the overall financial statement presentation. Our procedures included confirmation of securities owned as of October 31, 2016, by correspondence with the custodians, brokers, and agent banks; when replies were not received from brokers or agent banks, we performed other auditing procedures. We believe that our audits provide a reasonable basis for our opinion.
In our opinion, such financial statements and financial highlights referred to above present fairly, in all material respects, the financial position of Fidelity Advisor Floating Rate High Income Fund as of October 31, 2016, the results of its operations for the year then ended, the changes in its net assets for each of the two years in the period then ended, and the financial highlights for each of the five years in the period then ended, in conformity with accounting principles generally accepted in the United States of America.
DELOITTE & TOUCHE LLP
Boston, Massachusetts
December 16, 2016
Trustees and Officers
The Trustees, Members of the Advisory Board (if any), and officers of the trust and fund, as applicable, are listed below. The Board of Trustees governs the fund and is responsible for protecting the interests of shareholders. The Trustees are experienced executives who meet periodically throughout the year to oversee the fund's activities, review contractual arrangements with companies that provide services to the fund, oversee management of the risks associated with such activities and contractual arrangements, and review the fund's performance. Each of the Trustees oversees 170 funds.
The Trustees hold office without limit in time except that (a) any Trustee may resign; (b) any Trustee may be removed by written instrument, signed by at least two-thirds of the number of Trustees prior to such removal; (c) any Trustee who requests to be retired or who has become incapacitated by illness or injury may be retired by written instrument signed by a majority of the other Trustees; and (d) any Trustee may be removed at any special meeting of shareholders by a two-thirds vote of the outstanding voting securities of the trust. Each Trustee who is not an interested person (as defined in the 1940 Act) of the trust and the fund is referred to herein as an Independent Trustee. Each Independent Trustee shall retire not later than the last day of the calendar year in which his or her 75th birthday occurs. The Independent Trustees may waive this mandatory retirement age policy with respect to individual Trustees. Officers and Advisory Board Members hold office without limit in time, except that any officer or Advisory Board Member may resign or may be removed by a vote of a majority of the Trustees at any regular meeting or any special meeting of the Trustees. Except as indicated, each individual has held the office shown or other offices in the same company for the past five years.
The fund’s Statement of Additional Information (SAI) includes more information about the Trustees. To request a free copy, call Fidelity at 1-800-544-8544.
Experience, Skills, Attributes, and Qualifications of the Trustees. The Governance and Nominating Committee has adopted a statement of policy that describes the experience, qualifications, attributes, and skills that are necessary and desirable for potential Independent Trustee candidates (Statement of Policy). The Board believes that each Trustee satisfied at the time he or she was initially elected or appointed a Trustee, and continues to satisfy, the standards contemplated by the Statement of Policy. The Governance and Nominating Committee also engages professional search firms to help identify potential Independent Trustee candidates who have the experience, qualifications, attributes, and skills consistent with the Statement of Policy. From time to time, additional criteria based on the composition and skills of the current Independent Trustees, as well as experience or skills that may be appropriate in light of future changes to board composition, business conditions, and regulatory or other developments, have also been considered by the professional search firms and the Governance and Nominating Committee. In addition, the Board takes into account the Trustees' commitment and participation in Board and committee meetings, as well as their leadership of standing and ad hoc committees throughout their tenure.
In determining that a particular Trustee was and continues to be qualified to serve as a Trustee, the Board has considered a variety of criteria, none of which, in isolation, was controlling. The Board believes that, collectively, the Trustees have balanced and diverse experience, qualifications, attributes, and skills, which allow the Board to operate effectively in governing the fund and protecting the interests of shareholders. Information about the specific experience, skills, attributes, and qualifications of each Trustee, which in each case led to the Board's conclusion that the Trustee should serve (or continue to serve) as a trustee of the fund, is provided below.
Board Structure and Oversight Function. James C. Curvey is an interested person and currently serves as Chairman. The Trustees have determined that an interested Chairman is appropriate and benefits shareholders because an interested Chairman has a personal and professional stake in the quality and continuity of services provided to the fund. Independent Trustees exercise their informed business judgment to appoint an individual of their choosing to serve as Chairman, regardless of whether the Trustee happens to be independent or a member of management. The Independent Trustees have determined that they can act independently and effectively without having an Independent Trustee serve as Chairman and that a key structural component for assuring that they are in a position to do so is for the Independent Trustees to constitute a substantial majority for the Board. The Independent Trustees also regularly meet in executive session. Ned C. Lautenbach serves as Chairman of the Independent Trustees and as such (i) acts as a liaison between the Independent Trustees and management with respect to matters important to the Independent Trustees and (ii) with management prepares agendas for Board meetings.
Fidelity® funds are overseen by different Boards of Trustees. The fund's Board oversees Fidelity's high income and certain equity funds, and other Boards oversee Fidelity's investment-grade bond, money market, asset allocation, and sector funds. The asset allocation funds may invest in Fidelity® funds overseen by the fund's Board. The use of separate Boards, each with its own committee structure, allows the Trustees of each group of Fidelity® funds to focus on the unique issues of the funds they oversee, including common research, investment, and operational issues. On occasion, the separate Boards establish joint committees to address issues of overlapping consequences for the Fidelity® funds overseen by each Board.
The Trustees operate using a system of committees to facilitate the timely and efficient consideration of all matters of importance to the Trustees, the fund, and fund shareholders and to facilitate compliance with legal and regulatory requirements and oversight of the fund's activities and associated risks. The Board, acting through its committees, has charged FMR and its affiliates with (i) identifying events or circumstances the occurrence of which could have demonstrably adverse effects on the fund's business and/or reputation; (ii) implementing processes and controls to lessen the possibility that such events or circumstances occur or to mitigate the effects of such events or circumstances if they do occur; and (iii) creating and maintaining a system designed to evaluate continuously business and market conditions in order to facilitate the identification and implementation processes described in (i) and (ii) above. Because the day-to-day operations and activities of the fund are carried out by or through FMR, its affiliates, and other service providers, the fund's exposure to risks is mitigated but not eliminated by the processes overseen by the Trustees. While each of the Board's committees has responsibility for overseeing different aspects of the fund's activities, oversight is exercised primarily through the Operations, Audit, and Compliance Committees. In addition, the Independent Trustees have worked with FMR to enhance the Board's oversight of investment and financial risks, legal and regulatory risks, technology risks, and operational risks, including the development of additional risk reporting to the Board. For example, a working group comprised of Independent Trustees and FMR has worked and continues to work to review the Fidelity® funds' valuation-related activities, reporting and risk management. Appropriate personnel, including but not limited to the fund's Chief Compliance Officer (CCO), FMR's internal auditor, the independent accountants, the fund's Treasurer and portfolio management personnel, make periodic reports to the Board's committees, as appropriate, including an annual review of Fidelity's risk management program for the Fidelity® funds. The responsibilities of each standing committee, including their oversight responsibilities, are described further under "Standing Committees of the Trustees."
Interested Trustees*:
Correspondence intended for a Trustee who is an interested person may be sent to Fidelity Investments, 245 Summer Street, Boston, Massachusetts 02210.
Name, Year of Birth; Principal Occupations and Other Relevant Experience+
James C. Curvey (1935)
Year of Election or Appointment: 2007
Trustee
Chairman of the Board of Trustees
Mr. Curvey also serves as Trustee of other Fidelity® funds. Mr. Curvey is a Director of Fidelity Research & Analysis Co. (investment adviser firm, 2009-present), and Vice Chairman (2007-present) and Director of FMR LLC (diversified financial services company). In addition, Mr. Curvey serves as an Overseer for the Boston Symphony Orchestra and a member of the board of Artis-Naples, Naples, Florida, and as a Trustee for Brewster Academy, Wolfeboro, New Hampshire. Previously, Mr. Curvey served as a Director of Fidelity Investments Money Management, Inc. (investment adviser firm, 2009-2014) and a Director of FMR and FMR Co., Inc. (investment adviser firms, 2007-2014).
Charles S. Morrison (1960)
Year of Election or Appointment: 2014
Trustee
Mr. Morrison also serves as Trustee of other funds. He serves as President of Fidelity Management & Research Company (FMR) (investment adviser firm, 2016-present), a Director of Fidelity Investments Money Management, Inc. (FIMM) (investment adviser firm, 2014-present), Director of Fidelity SelectCo, LLC (investment adviser firm, 2014-present), President, Asset Management (2014-present), and is an employee of Fidelity Investments. Previously, Mr. Morrison served as Vice President of Fidelity's Fixed Income and Asset Allocation Funds (2012-2014), President, Fixed Income (2011-2014), Vice President of Fidelity's Money Market Funds (2005-2009), President, Money Market Group Leader of FMR (investment adviser firm, 2009), and Senior Vice President, Money Market Group of FMR (2004-2009). Mr. Morrison also served as Vice President of Fidelity's Bond Funds (2002-2005), certain Balanced Funds (2002-2005), and certain Asset Allocation Funds (2002-2007), and as Senior Vice President (2002-2005) of Fidelity's Bond Division.
* Determined to be an “Interested Trustee” by virtue of, among other things, his or her affiliation with the trust or various entities under common control with FMR.
+ The information includes the Trustee's principal occupation during the last five years and other information relating to the experience, attributes, and skills relevant to the Trustee's qualifications to serve as a Trustee, which led to the conclusion that the Trustee should serve as a Trustee for the fund.
Independent Trustees:
Correspondence intended for an Independent Trustee may be sent to Fidelity Investments, P.O. Box 55235, Boston, Massachusetts 02205-5235.
Name, Year of Birth; Principal Occupations and Other Relevant Experience+
Dennis J. Dirks (1948)
Year of Election or Appointment: 2005
Trustee
Mr. Dirks also serves as Trustee of other Fidelity® funds. Prior to his retirement in May 2003, Mr. Dirks was Chief Operating Officer and a member of the Board of The Depository Trust & Clearing Corporation (DTCC). He also served as President, Chief Operating Officer, and Board member of The Depository Trust Company (DTC) and President and Board member of the National Securities Clearing Corporation (NSCC). In addition, Mr. Dirks served as Chief Executive Officer and Board member of the Government Securities Clearing Corporation, Chief Executive Officer and Board member of the Mortgage-Backed Securities Clearing Corporation, as a Trustee and a member of the Finance Committee of Manhattan College (2005-2008), as a Trustee and a member of the Finance Committee of AHRC of Nassau County (2006-2008), and as a member of the Independent Directors Council (IDC) Governing Council (2010-2015). Mr. Dirks is a member of the Board of Directors for The Brookville Center for Children's Services, Inc. (2009-present).
Alan J. Lacy (1953)
Year of Election or Appointment: 2008
Trustee
Mr. Lacy also serves as Trustee of other Fidelity® funds. Mr. Lacy serves as Chairman (2014-present) and a member (2010-present) of the Board of Directors of Dave & Buster's Entertainment, Inc. (restaurant and entertainment complexes) and a Director of Bristol-Myers Squibb Company (global pharmaceuticals, 2008-present). He is a Trustee of the California Chapter of The Nature Conservancy (2015-present) and a Director of the Center for Advanced Study in the Behavioral Sciences at Stanford University (2015-present). In addition, Mr. Lacy served as Senior Adviser (2007-2014) of Oak Hill Capital Partners, L.P. (private equity) and also served as Chief Executive Officer (2005) and Vice Chairman (2005-2006) of Sears Holdings Corporation (retail) and Chief Executive Officer and Chairman of the Board of Sears, Roebuck and Co. (retail, 2000-2005). Previously, Mr. Lacy served as Chairman (2008-2011) and a member (2006-2015) of the Board of Trustees of the National Parks Conservation Association and as a member of the Board of Directors for The Western Union Company (global money transfer, 2006-2011), The Hillman Companies, Inc. (hardware wholesalers, 2010-2014), and Earth Fare, Inc. (retail grocery, 2010-2014).
Ned C. Lautenbach (1944)
Year of Election or Appointment: 2000
Trustee
Chairman of the Independent Trustees
Mr. Lautenbach also serves as Trustee of other Fidelity® funds. Mr. Lautenbach currently serves as the Lead Director of the Eaton Corporation Board of Directors (diversified industrial, 1997-present). Mr. Lautenbach is Chairman of the Board of Directors of Artis-Naples in Naples, Florida (2012-present), a member of the Council on Foreign Relations (1994-present), and a member of the Board of Governors, State University System of Florida (2013-present). Previously, Mr. Lautenbach was a Partner/Advisory Partner at Clayton, Dubilier & Rice, LLC (private equity investment, 1998-2010), as well as a Director of Sony Corporation (2006-2007).
Joseph Mauriello (1944)
Year of Election or Appointment: 2008
Trustee
Mr. Mauriello also serves as Trustee of other Fidelity® funds. Prior to his retirement in January 2006, Mr. Mauriello served in numerous senior management positions including Deputy Chairman and Chief Operating Officer (2004-2005), and Vice Chairman of Financial Services (2002-2004) of KPMG LLP US (professional services, 1965-2005). Mr. Mauriello currently serves as a member of the Board of Directors of XL Group plc. (global insurance and re-insurance, 2006-present) and the Independent Directors Council (IDC) Governing Council (2015-present). Previously, Mr. Mauriello served as a Director of the Hamilton Funds of the Bank of New York (2006-2007) and of Arcadia Resources Inc. (health care services and products, 2007-2012).
Robert W. Selander (1950)
Year of Election or Appointment: 2011
Trustee
Mr. Selander also serves as Trustee of other Fidelity® funds. Mr. Selander serves as a Director of The Western Union Company (global money transfer, 2014-present) and a non-executive Chairman of Health Equity, Inc. (health savings custodian, 2015-present). Previously, Mr. Selander served as a Member of the Advisory Board of certain Fidelity® funds (2011), and Executive Vice Chairman (2010), Chief Executive Officer (2009-2010), and President and Chief Executive Officer (1997-2009) of Mastercard, Inc.
Cornelia M. Small (1944)
Year of Election or Appointment: 2005
Trustee
Ms. Small also serves as Trustee of other Fidelity® funds. Ms. Small is a member of the Board of Directors (2009-present) and Chair of the Investment Committee (2010-present) of the Teagle Foundation. Ms. Small also serves on the Investment Committee of the Berkshire Taconic Community Foundation (2008-present). Previously, Ms. Small served as Chairperson (2002-2008) and a member of the Investment Committee and Chairperson (2008-2012) and a member of the Board of Trustees of Smith College. In addition, Ms. Small served as Chief Investment Officer, Director of Global Equity Investments, and a member of the Board of Directors of Scudder, Stevens & Clark and Scudder Kemper Investments.
William S. Stavropoulos (1939)
Year of Election or Appointment: 2002
Trustee
Vice Chairman of the Independent Trustees
Mr. Stavropoulos also serves as Trustee of other Fidelity® funds. Mr. Stavropoulos serves as President and Founder of the Michigan Baseball Foundation, the Great Lakes Loons (2007-present). Mr. Stavropoulos is Chairman Emeritus of the Board of Directors of The Dow Chemical Company, where he previously served in numerous senior management positions, including President, CEO (1995-2000; 2002-2004), Chairman of the Executive Committee (2000-2006), and as a member of the Board of Directors (1990-2006). Currently, Mr. Stavropoulos is Chairman of the Board of Directors of Univar Inc. (global distributor of commodity and specialty chemicals), a Director of Teradata Corporation (data warehousing and technology solutions), and Maersk Inc. (industrial conglomerate), and a member of the Advisory Board for Metalmark Capital LLC (private equity investment, 2005-present). Mr. Stavropoulos is an operating advisor to Clayton, Dubilier & Rice, LLC (private equity investment). In addition, Mr. Stavropoulos is a member of the University of Notre Dame Advisory Council for the College of Science, a Trustee of the Rollin L. Gerstacker Foundation, and a Director of the Naples Philharmonic Center for the Arts. Previously, Mr. Stavropoulos served as a Director of Chemical Financial Corporation (bank holding company, 1993-2012) and Tyco International, Ltd. (multinational manufacturing and services, 2007-2012).
David M. Thomas (1949)
Year of Election or Appointment: 2008
Trustee
Mr. Thomas also serves as Trustee of other Fidelity® funds. Mr. Thomas serves as Non-Executive Chairman of the Board of Directors of Fortune Brands Home and Security (home and security products, 2011-present), as a member of the Board of Directors (2004-present) and Presiding Director (2013-present) of Interpublic Group of Companies, Inc. (marketing communication), and as a member of the Board of Trustees of the University of Florida (2013-present). Previously, Mr. Thomas served as Executive Chairman (2005-2006) and Chairman and Chief Executive Officer (2000-2005) of IMS Health, Inc. (pharmaceutical and healthcare information solutions), and a Director of Fortune Brands, Inc. (consumer products, 2000-2011).
+ The information includes the Trustee's principal occupation during the last five years and other information relating to the experience, attributes, and skills relevant to the Trustee's qualifications to serve as a Trustee, which led to the conclusion that the Trustee should serve as a Trustee for the fund.
Advisory Board Members and Officers:
Correspondence intended for an officer or Peter S. Lynch may be sent to Fidelity Investments, 245 Summer Street, Boston, Massachusetts 02210. Officers appear below in alphabetical order.
Name, Year of Birth; Principal Occupation
Peter S. Lynch (1944)
Year of Election or Appointment: 2003
Member of the Advisory Board
Mr. Lynch also serves as Member of the Advisory Board of other Fidelity® funds. Mr. Lynch is Vice Chairman and a Director of FMR (investment adviser firm) and FMR Co., Inc. (investment adviser firm). In addition, Mr. Lynch serves as a Trustee of Boston College and as the Chairman of the Inner-City Scholarship Fund. Previously, Mr. Lynch served on the Special Olympics International Board of Directors (1997-2006).
Marc R. Bryant (1966)
Year of Election or Appointment: 2015
Secretary and Chief Legal Officer (CLO)
Mr. Bryant also serves as Secretary and CLO of other funds. Mr. Bryant serves as CLO, Secretary, and Senior Vice President of Fidelity Management & Research Company (investment adviser firm, 2015-present) and FMR Co., Inc. (investment adviser firm, 2015-present); Secretary of Fidelity SelectCo, LLC (investment adviser firm, 2015-present) and Fidelity Investments Money Management, Inc. (investment adviser firm, 2015-present); and CLO of Fidelity Management & Research (Hong Kong) Limited and FMR Investment Management (UK) Limited (investment adviser firms, 2015-present) and Fidelity Management & Research (Japan) Limited (investment adviser firm, 2016-present). He is Senior Vice President and Deputy General Counsel of FMR LLC (diversified financial services company). Previously, Mr. Bryant served as Secretary and CLO of Fidelity Rutland Square Trust II (2010-2014) and Assistant Secretary of Fidelity's Fixed Income and Asset Allocation Funds (2013-2015). Prior to joining Fidelity Investments, Mr. Bryant served as a Senior Vice President and the Head of Global Retail Legal for AllianceBernstein L.P. (2006-2010), and as the General Counsel for ProFund Advisors LLC (2001-2006).
Jeffrey S. Christian (1961)
Year of Election or Appointment: 2016
Assistant Treasurer
Mr. Christian also serves as Assistant Treasurer of other funds. Mr. Christian is an employee of Fidelity Investments (2003-present).
William C. Coffey (1969)
Year of Election or Appointment: 2009
Assistant Secretary
Mr. Coffey also serves as Assistant Secretary of other funds. He is Senior Vice President and Deputy General Counsel of FMR LLC (diversified financial services company, 2010-present), and is an employee of Fidelity Investments. Previously, Mr. Coffey served as Vice President and Associate General Counsel of FMR LLC (2005-2009).
Jonathan Davis (1968)
Year of Election or Appointment: 2010
Assistant Treasurer
Mr. Davis also serves as Assistant Treasurer of other funds, and is an employee of Fidelity Investments. Previously, Mr. Davis served as Vice President and Associate General Counsel of FMR LLC (diversified financial services company, 2003-2010).
Adrien E. Deberghes (1967)
Year of Election or Appointment: 2016
Assistant Treasurer
Mr. Deberghes also serves as an officer of other funds. He serves as Executive Vice President of Fidelity Investments Money Management, Inc. (FIMM) (investment adviser firm, 2016-present) and is an employee of Fidelity Investments (2008-present). Prior to joining Fidelity Investments, Mr. Deberghes was Senior Vice President of Mutual Fund Administration at State Street Corporation (2007-2008), Senior Director of Mutual Fund Administration at Investors Bank & Trust (2005-2007), and Director of Finance for Dunkin' Brands (2000-2005). Previously, Mr. Deberghes served in other fund officer roles.
Stephanie J. Dorsey (1969)
Year of Election or Appointment: 2010
Assistant Treasurer
Ms. Dorsey also serves as an officer of other funds. She is an employee of Fidelity Investments (2008-present) and has served in other fund officer roles. Prior to joining Fidelity Investments, Ms. Dorsey served as Treasurer (2004-2008) of the JPMorgan Mutual Funds and Vice President (2004-2008) of JPMorgan Chase Bank.
Howard J. Galligan III (1966)
Year of Election or Appointment: 2014
Chief Financial Officer
Mr. Galligan also serves as Chief Financial Officer of other funds. Mr. Galligan serves as President of Fidelity Pricing and Cash Management Services (FPCMS) (2014-present) and as a Director of Strategic Advisers, Inc. (investment adviser firm, 2008-present). Previously, Mr. Galligan served as Chief Administrative Officer of Asset Management (2011-2014) and Chief Operating Officer and Senior Vice President of Investment Support for Strategic Advisers, Inc. (2003-2011).
Scott C. Goebel (1968)
Year of Election or Appointment: 2015
Vice President
Mr. Goebel serves as Vice President of other funds and is an employee of Fidelity Investments (2001-present). Previously, Mr. Goebel served as Senior Vice President of Fidelity Management & Research Company (FMR) (investment adviser firm, 2016), Secretary of Fidelity SelectCo, LLC (investment adviser firm, 2013-2015), Fidelity Investments Money Management, Inc. (FIMM) (investment adviser firm, 2010-2015), and Fidelity Research and Analysis Company (FRAC) (investment adviser firm, 2010-2015); General Counsel, Secretary, and Senior Vice President of FMR (investment adviser firm, 2008-2015) and FMR Co., Inc. (investment adviser firm, 2008-2015); Assistant Secretary of Fidelity Management & Research (Japan) Limited (investment adviser firm, 2008-2015) and Fidelity Management & Research (U.K.) Inc. (investment adviser firm, 2008-2015); Chief Legal Officer (CLO) of Fidelity Management & Research (Hong Kong) Limited (investment adviser firm, 2008-2015); Secretary and CLO of certain Fidelity® funds (2008-2015); Assistant Secretary of FIMM (2008-2010), FRAC (2008-2010), and certain funds (2007-2008); and as Vice President and Secretary of Fidelity Distributors Corporation (FDC) (2005-2007).
Thomas C. Hense (1964)
Year of Election or Appointment: 2008, 2010, or 2015
Vice President
Mr. Hense serves as Vice President of Fidelity Advisor® Multi-Asset Income Fund (2015) and other funds (High Income (2008), Small Cap (2008), and Value (2010) funds), and is an employee of Fidelity Investments (1993-present). Previously, Mr. Hense served as a portfolio manager for Fidelity's Institutional Money Management Group (Pyramis) (2003-2008).
Brian B. Hogan (1964)
Year of Election or Appointment: 2009
Vice President
Mr. Hogan also serves as Trustee or Vice President of other funds. Mr. Hogan serves as a Director of FMR Investment Management (UK) Limited (investment adviser firm, 2015-present) and Fidelity SelectCo, LLC (investment adviser firm, 2014-present) and President of the Equity Division of FMR (investment adviser firm, 2009-present). Previously, Mr. Hogan served as Senior Vice President, Equity Research of FMR (2006-2009) and as a portfolio manager. Mr. Brian B. Hogan is not related to Mr. Colm A. Hogan.
Colm A. Hogan (1973)
Year of Election or Appointment: 2016
Deputy Treasurer
Mr. Hogan also serves as an officer of other funds. Mr. Hogan is an employee of Fidelity Investments (2005-present). Mr. Colm A. Hogan is not related to Mr. Brian B. Hogan.
Chris Maher (1972)
Year of Election or Appointment: 2013
Assistant Treasurer
Mr. Maher serves as Assistant Treasurer of other funds. Mr. Maher is Vice President of Valuation Oversight and is an employee of Fidelity Investments. Previously, Mr. Maher served as Vice President of Asset Management Compliance (2013), Vice President of the Program Management Group of FMR (investment adviser firm, 2010-2013), and Vice President of Valuation Oversight (2008-2010).
John F. Papandrea (1972)
Year of Election or Appointment: 2016
Anti-Money Laundering (AML) Officer
Mr. Papandrea also serves as AML Officer of other funds. Mr. Papandrea is Vice President of FMR LLC (diversified financial services company, 2008-present) and is an employee of Fidelity Investments (2005-present).
Kenneth B. Robins (1969)
Year of Election or Appointment: 2016
Chief Compliance Officer
Mr. Robins also serves as an officer of other funds. Mr. Robins serves as Compliance Officer of Fidelity Management & Research Company and FMR Co., Inc. (investment adviser firms, 2016-present) and is an employee of Fidelity Investments (2004-present). Previously, Mr. Robins served as Executive Vice President of Fidelity Investments Money Management, Inc. (investment adviser firm, 2013-2016) and served in other fund officer roles.
Stacie M. Smith (1974)
Year of Election or Appointment: 2016
President and Treasurer
Ms. Smith also serves as an officer of other funds. She is an employee of Fidelity Investments (2009-present) and has served in other fund officer roles. Prior to joining Fidelity Investments, Ms. Smith served as Senior Audit Manager of Ernst & Young LLP (accounting firm, 1996-2009). Previously, Ms. Smith served as Deputy Treasurer of certain Fidelity® funds (2013-2016).
Marc L. Spector (1972)
Year of Election or Appointment: 2016
Assistant Treasurer
Mr. Spector also serves as an officer of other funds. Mr. Spector is an employee of Fidelity Investments (2016-present). Prior to joining Fidelity Investments, Mr. Spector served as Director at the Siegfried Group (accounting firm, 2013-2016), and prior to Siegfried Group as audit senior manager at Deloitte & Touche (accounting firm, 2005-2013).
Renee Stagnone (1975)
Year of Election or Appointment: 2016
Assistant Treasurer
Ms. Stagnone also serves as an officer of other funds. Ms. Stagnone is an employee of Fidelity Investments (1997-present). Previously, Ms. Stagnone served as Deputy Treasurer of certain Fidelity® funds (2013-2016).
Shareholder Expense Example
As a shareholder of the Fund, you incur two types of costs: (1) transaction costs, including sales charges (loads) on purchase payments or redemption proceeds, redemption fees and (2) ongoing costs, including management fees, distribution and/or service (12b-1) fees and other Fund expenses. This Example is intended to help you understand your ongoing costs (in dollars) of investing in the Fund and to compare these costs with the ongoing costs of investing in other mutual funds.
The Example is based on an investment of $1,000 invested at the beginning of the period and held for the entire period (May 1, 2016 to October 31, 2016).
Actual Expenses
The first line of the accompanying table for each class of the Fund provides information about actual account values and actual expenses. You may use the information in this line, together with the amount you invested, to estimate the expenses that you paid over the period. Simply divide your account value by $1,000.00 (for example, an $8,600 account value divided by $1,000.00 = 8.6), then multiply the result by the number in the first line for a class of the Fund under the heading entitled "Expenses Paid During Period" to estimate the expenses you paid on your account during this period. A small balance maintenance fee of $12.00 that is charged once a year may apply for certain accounts with a value of less than $2,000. This fee is not included in the table below. If it was, the estimate of expenses you paid during the period would be higher, and your ending account value lower, by this amount. In addition, the Fund, as a shareholder in the underlying Fidelity Central Funds, will indirectly bear its pro-rata share of the fees and expenses incurred by the underlying Fidelity Central Funds. These fees and expenses are not included in the Fund's annualized expense ratio used to calculate the expense estimate in the table below.
Hypothetical Example for Comparison Purposes
The second line of the accompanying table for each class of the Fund provides information about hypothetical account values and hypothetical expenses based on a Class' actual expense ratio and an assumed rate of return of 5% per year before expenses, which is not the Class' actual return. The hypothetical account values and expenses may not be used to estimate the actual ending account balance or expenses you paid for the period. You may use this information to compare the ongoing costs of investing in the Fund and other funds. To do so, compare this 5% hypothetical example with the 5% hypothetical examples that appear in the shareholder reports of the other funds. A small balance maintenance fee of $12.00 that is charged once a year may apply for certain accounts with a value of less than $2,000. This fee is not included in the table below. If it was, the estimate of expenses you paid during the period would be higher, and your ending account value lower, by this amount. In addition, the Fund, as a shareholder in the underlying Fidelity Central Funds, will indirectly bear its pro-rata share of the fees and expenses incurred by the underlying Fidelity Central Funds. These fees and expenses are not included in the Fund's annualized expense ratio used to calculate the expense estimate in the table below.
Please note that the expenses shown in the table are meant to highlight your ongoing costs only and do not reflect any transaction costs. Therefore, the second line of the table is useful in comparing ongoing costs only, and will not help you determine the relative total costs of owning different funds. In addition, if these transactional costs were included, your costs would have been higher.
| Annualized Expense Ratio-A | Beginning Account Value May 1, 2016 | Ending Account Value October 31, 2016 | Expenses Paid During Period-B May 1, 2016 to October 31, 2016 |
|
| Class A | .98% | |||
| Actual | $1,000.00 | $1,044.50 | $5.04 | |
| Hypothetical-C | $1,000.00 | $1,020.21 | $4.98 | |
| Class T | 1.07% | |||
| Actual | $1,000.00 | $1,044.00 | $5.50 | |
| Hypothetical-C | $1,000.00 | $1,019.76 | $5.43 | |
| Class C | 1.73% | |||
| Actual | $1,000.00 | $1,039.50 | $8.87 | |
| Hypothetical-C | $1,000.00 | $1,016.44 | $8.77 | |
| Fidelity Floating Rate High Income Fund | .70% | |||
| Actual | $1,000.00 | $1,044.90 | $3.60 | |
| Hypothetical-C | $1,000.00 | $1,021.62 | $3.56 | |
| Class I | .75% | |||
| Actual | $1,000.00 | $1,045.70 | $3.86 | |
| Hypothetical-C | $1,000.00 | $1,021.37 | $3.81 |
A Annualized expense ratio reflects expenses net of applicable fee waivers.
B Expenses are equal to each Class' annualized expense ratio, multiplied by the average account value over the period, multiplied by 184/366 (to reflect the one-half year period).
C 5% return per year before expenses
Distributions (Unaudited)
A total of 0.21% of the dividends distributed during the fiscal year was derived from interest on U.S. Government securities which is generally exempt from state income tax.
The fund designates $268,085,063 of distributions paid during the period January 1, 2016 to October 31, 2016 as qualifying to be taxed as interest-related dividends for nonresident alien shareholders.
The fund will notify shareholders in January 2017 of amounts for use in preparing 2016 income tax returns.
Board Approval of Investment Advisory Contracts and Management Fees
Fidelity Advisor Floating Rate High Income Fund
Each year, the Board of Trustees, including the Independent Trustees (together, the Board), votes on the renewal of the management contract with Fidelity Management & Research Company (FMR) and the sub-advisory agreements (together, the Advisory Contracts) for the fund. The Board, assisted by the advice of fund counsel and Independent Trustees' counsel, requests and considers a broad range of information relevant to the renewal of the Advisory Contracts throughout the year.
The Board meets regularly and, at each of its meetings, covers an extensive agenda of topics and materials and considers factors that are relevant to its annual consideration of the renewal of the fund's Advisory Contracts, including the services and support provided to the fund and its shareholders. The Board has established various standing committees (Committees), each composed of and chaired by Independent Trustees with varying backgrounds, to which the Board has assigned specific subject matter responsibilities in order to enhance effective decision-making by the Board. The Board, acting directly and through its Committees, requests and receives information concerning the annual consideration of the renewal of the fund's Advisory Contracts. The Board also meets as needed to consider matters specifically related to the Board's annual consideration of the renewal of the Advisory Contracts. Members of the Board may also meet with trustees of other Fidelity funds through ad hoc joint committees to discuss certain matters relevant to all of the Fidelity funds.
At its July 2016 meeting, the Board unanimously determined to renew the fund's Advisory Contracts. In reaching its determination, the Board considered all factors it believed relevant, including (i) the nature, extent, and quality of the services to be provided to the fund and its shareholders (including the investment performance of the fund); (ii) the competitiveness of the fund's management fee and total expense ratio relative to peer funds; (iii) the total costs of the services to be provided by and the profits to be realized by Fidelity from its relationships with the fund; and (iv) the extent to which, if any, economies of scale exist and would be realized as the fund grows, and whether any economies of scale are appropriately shared with fund shareholders.
In considering whether to renew the Advisory Contracts for the fund, the Board reached a determination, with the assistance of fund counsel and Independent Trustees' counsel and through the exercise of its business judgment, that the renewal of the Advisory Contracts was in the best interests of the fund and its shareholders and that the compensation payable under the Advisory Contracts was fair and reasonable. The Board's decision to renew the Advisory Contracts was not based on any single factor, but rather was based on a comprehensive consideration of all the information provided to the Board at its meetings throughout the year. The Board, in reaching its determination to renew the Advisory Contracts, was aware that shareholders of the fund have a broad range of investment choices available to them, including a wide choice among funds offered by Fidelity's competitors, and that the fund's shareholders, who have the opportunity to review and weigh the disclosure provided by the fund in its prospectus and other public disclosures, have chosen to invest in this fund, which is part of the Fidelity family of funds.
Nature, Extent, and Quality of Services Provided. The Board considered Fidelity's staffing as it relates to the fund, including the backgrounds of investment personnel of Fidelity, and also considered the fund's investment objective, strategies, and related investment philosophy. The Independent Trustees also had discussions with senior management of Fidelity's investment operations and investment groups. The Board considered the structure of the investment personnel compensation program and whether this structure provides appropriate incentives to act in the best interests of the fund. Additionally, the Board considered the portfolio managers' investments, if any, in the funds that they manage. Resources Dedicated to Investment Management and Support Services. The Board and the Fund Oversight and Research Committees reviewed the general qualifications and capabilities of Fidelity's investment staff, including its size, education, experience, and resources, as well as Fidelity's approach to recruiting, training, managing, and compensating investment personnel. The Board noted that Fidelity has continued to increase the resources devoted to non-U.S. offices, including expansion of Fidelity's global investment organization. The Board also noted that Fidelity's analysts have extensive resources, tools and capabilities that allow them to conduct sophisticated quantitative and fundamental analysis, as well as credit analysis of issuers, counterparties and guarantors. Further, the Board considered that Fidelity's investment professionals have sufficient access to global information and data so as to provide competitive investment results over time, and that those professionals also have access to sophisticated tools that permit them to assess portfolio construction and risk and performance attribution characteristics continuously, as well as to transmit new information and research conclusions rapidly around the world. Additionally, in its deliberations, the Board considered Fidelity's trading, risk management, compliance, and technology and operations capabilities and resources, which are integral parts of the investment management process. Shareholder and Administrative Services. The Board considered (i) the nature, extent, quality, and cost of advisory, administrative, and shareholder services performed by FMR, the sub-advisers (together with FMR, the Investment Advisers), and their affiliates under the Advisory Contracts and under separate agreements covering transfer agency, pricing and bookkeeping, and securities lending services for the fund; (ii) the nature and extent of the supervision of third party service providers, principally custodians, subcustodians, and pricing vendors; and (iii) the resources devoted to, and the record of compliance with, the fund's compliance policies and procedures. The Board also reviewed the allocation of fund brokerage, including allocations to brokers affiliated with the Investment Advisers, the use of brokerage commissions to pay fund expenses, and the use of "soft" commission dollars to pay for research services.The Board noted that the growth of fund assets over time across the complex allows Fidelity to reinvest in the development of services designed to enhance the value or convenience of the Fidelity funds as investment vehicles. These services include 24-hour access to account information and market information through telephone representatives and over the Internet, investor education materials and asset allocation tools, and the expanded availability of Fidelity Investor Centers.In 2014, the Board formed an ad hoc Committee on Transfer Agency Fees to review the variety of transfer agency fee structures throughout the industry and Fidelity's competitive positioning with respect to industry participants. Investment in a Large Fund Family. The Board considered the benefits to shareholders of investing in a Fidelity fund, including the benefits of investing in a fund that is part of a large family of funds offering a variety of investment disciplines and providing a large variety of mutual fund investor services. The Board noted that Fidelity had taken, or had made recommendations that resulted in the Fidelity funds taking, a number of actions over the previous year that benefited particular funds, including: (i) continuing to dedicate additional resources to investment research and to the support of the senior management team that oversees asset management; (ii) continuing efforts to enhance Fidelity's global research capabilities; (iii) launching new funds and making other enhancements to meet client needs; (iv) broadening eligibility requirements for certain lower-priced share classes of, and streamlining the fee structure for, certain existing equity index funds; (v) lowering expense caps for certain existing funds and classes to reduce expenses paid by shareholders; (vi) eliminating redemption fees for certain variable insurance product funds and classes; (vii) continuing to launch dedicated lower cost underlying funds to meet portfolio construction needs related to expanding underlying fund options for Fidelity funds of funds, specifically for the Freedom Fund product lines; (viii) launching a lower cost share class for use by the Freedom Index Fund product line; (ix) rationalizing product lines and gaining increased efficiencies through fund mergers and share class consolidations; (x) continuing to develop, acquire and implement systems and technology to improve services to the funds and shareholders, strengthen information security, and increase efficiency; (xi) implementing investment enhancements to further strengthen Fidelity's target date product line to increase investors' probability of success in achieving their goals; (xii) accelerating the conversion of all remaining Class B shares to Class A shares, which have a lower expense structure; and (xiii) implementing changes to Fidelity's money market fund product line in response to recent regulatory reforms. Investment Performance. The Board considered whether the fund has operated in accordance with its investment objective, as well as its record of compliance with its investment restrictions and its performance history.The Board took into account discussions with representatives of the Investment Advisers about fund investment performance that occur at Board meetings throughout the year. In this regard the Board noted that as part of regularly scheduled fund reviews and other reports to the Board on fund performance, the Board considers annualized return information for the fund, for different time periods, measured against a securities market index ("benchmark index") and a peer group of funds with similar objectives ("peer group"), if any. In its evaluation of fund investment performance, the Board gave particular attention to information indicating changes in performance of certain Fidelity funds for specific time periods and discussed with the Investment Advisers the reasons for any overperformance or underperformance.In addition to reviewing absolute and relative fund performance, the Independent Trustees periodically consider the appropriateness of fund performance metrics in evaluating the results achieved. In general, the Independent Trustees believe that fund performance should be evaluated based on net performance (after fees and expenses) of both the highest performing and lowest performing fund share classes, where applicable, compared to appropriate benchmark indices, over appropriate time periods that may include full market cycles, and compared to peer groups, as applicable, over the same periods, taking into account relevant factors including the following: general market conditions; issuer-specific information; and fund cash flows and other factors.The Independent Trustees recognize that shareholders evaluate performance on a net basis over their own holding periods, for which one-, three-, and five-year periods are often used as a proxy. For this reason, the performance information reviewed by the Board also included net cumulative calendar year total return information for the fund and an appropriate benchmark index and peer group for the most recent one-, three-, and five-year periods, as shown below. Returns are shown compared to the 25th percentile (top of box, 75% beaten) and 75th percentile (bottom of box, 25% beaten) of the peer universe.Fidelity Advisor Floating Rate High Income Fund
Fidelity Advisor Floating Rate High Income Fund
![]()
Corporate Headquarters
245 Summer St.
Boston, MA 02210
www.fidelity.com
FHI-ANN-1216
1.779592.114
|
Fidelity Advisor® High Income Advantage Fund Class A, Class T, Class C and Class I Annual Report October 31, 2016 |
|
|
Contents
|
Board Approval of Investment Advisory Contracts and Management Fees |
To view a fund's proxy voting guidelines and proxy voting record for the 12-month period ended June 30, visit http://www.fidelity.com/proxyvotingresults or visit the Securities and Exchange Commission's (SEC) web site at http://www.sec.gov.
You may also call 1-877-208-0098 to request a free copy of the proxy voting guidelines.
Standard & Poor's, S&P and S&P 500 are registered service marks of The McGraw-Hill Companies, Inc. and have been licensed for use by Fidelity Distributors Corporation.
Other third-party marks appearing herein are the property of their respective owners.
All other marks appearing herein are registered or unregistered trademarks or service marks of FMR LLC or an affiliated company. © 2016 FMR LLC. All rights reserved.
This report and the financial statements contained herein are submitted for the general information of the shareholders of the Fund. This report is not authorized for distribution to prospective investors in the Fund unless preceded or accompanied by an effective prospectus.
A fund files its complete schedule of portfolio holdings with the SEC for the first and third quarters of each fiscal year on Form N-Q. Forms N-Q are available on the SEC’s web site at http://www.sec.gov. A fund's Forms N-Q may be reviewed and copied at the SEC’s Public Reference Room in Washington, DC. Information regarding the operation of the SEC's Public Reference Room may be obtained by calling 1-800-SEC-0330.
For a complete list of a fund's portfolio holdings, view the most recent holdings listing, semiannual report, or annual report on Fidelity's web site at http://www.fidelity.com, http://www.institutional.fidelity.com, or http://www.401k.com, as applicable.
NOT FDIC INSURED •MAY LOSE VALUE •NO BANK GUARANTEE
Neither the Fund nor Fidelity Distributors Corporation is a bank.
Performance: The Bottom Line
Average annual total return reflects the change in the value of an investment, assuming reinvestment of distributions from dividend income and capital gains (the profits earned upon the sale of securities that have grown in value, if any) and assuming a constant rate of performance each year. The hypothetical investment and the average annual total returns do not reflect the deduction of taxes that a shareholder would pay on fund distributions or the redemption of fund shares. During periods of reimbursement by Fidelity, a fund’s total return will be greater than it would be had the reimbursement not occurred. How a fund did yesterday is no guarantee of how it will do tomorrow.
Average Annual Total Returns
| For the periods ended October 31, 2016 | Past 1 year | Past 5 years | Past 10 years |
| Class A (incl. 4.00% sales charge) | 2.05% | 6.69% | 6.25% |
| Class T (incl. 4.00% sales charge) | 2.05% | 6.69% | 6.26% |
| Class C (incl. contingent deferred sales charge) | 4.51% | 6.75% | 5.89% |
| Class I | 6.54% | 7.81% | 6.94% |
Class C shares' contingent deferred sales charges included in the past one year, past five years and past ten years total return figures are 1%, 0% and 0%, respectively.
$10,000 Over 10 Years
Let's say hypothetically that $10,000 was invested in Fidelity Advisor® High Income Advantage Fund - Class A on October 31, 2006, and the current 4.00% sales charge was paid.
The chart shows how the value of your investment would have changed, and also shows how The BofA Merrill Lynch℠ US High Yield Constrained Index performed over the same period.
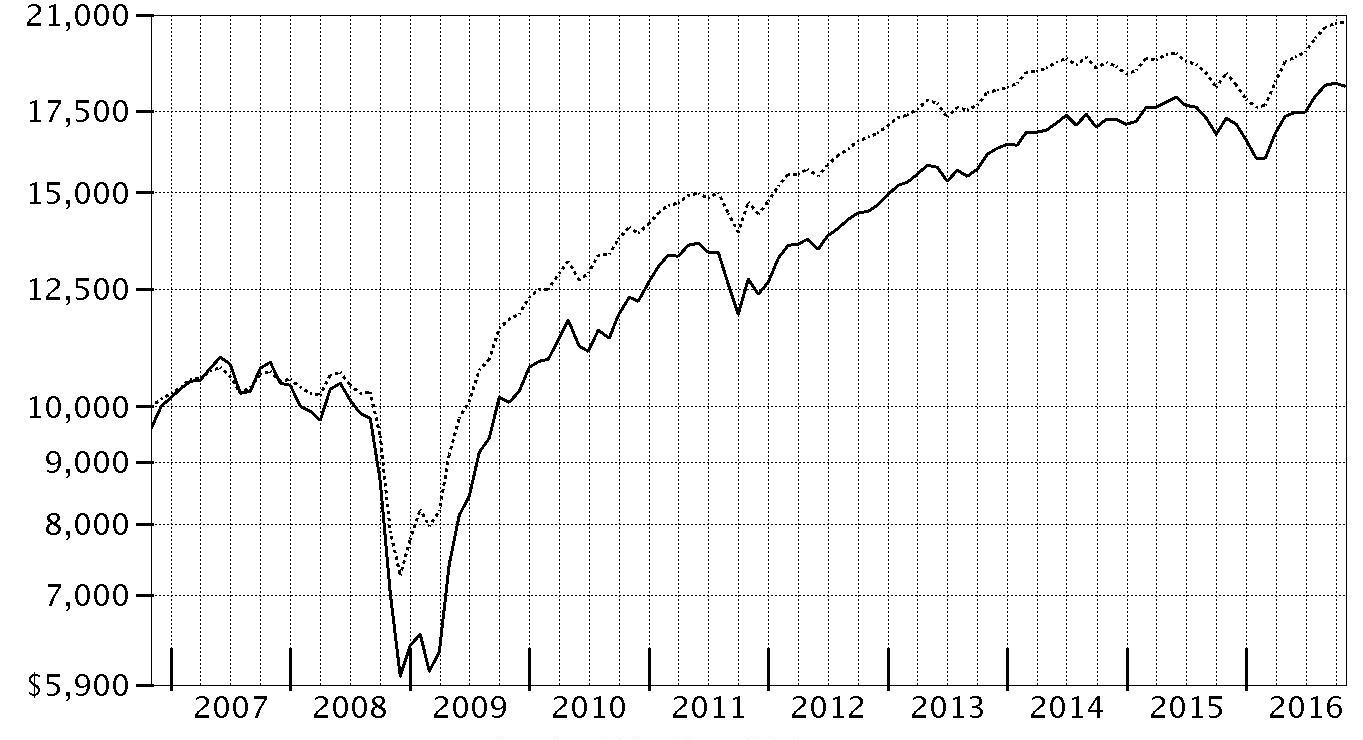
| Period Ending Values | ||
|
| $18,341 | Fidelity Advisor® High Income Advantage Fund - Class A |
|
| $20,722 | The BofA Merrill Lynch℠ US High Yield Constrained Index |
Management's Discussion of Fund Performance
Market Recap: U.S. corporate high-yield bonds staged a dramatic rebound during the year ending October 31, 2016, with The BofA Merrill Lynch US High Yield Constrained Index sharply reversing course in February and gaining 10.18% for the full 12 months. The first three months of the period were volatile, as another leg down in energy prices and mounting fears of an economic slowdown in China weighed on high-yield bonds. Market turbulence reached a peak on February 11, after which high yield began to benefit from improvement across a broad range of global issues, including a revival in oil markets. The recovery accelerated in the spring, as strengthening macro tailwinds stoked demand for riskier assets and further credit-spread tightening. The high-yield rally was briefly disrupted in June, as the U.K.’s vote to exit the European Union, dubbed “Brexit,” surprised investors and reverberated throughout global markets. However, as investors reassessed the broader impact of Brexit in the days following the vote, credit-sensitive securities rose once again and remained on an uptrend through October. Reflecting a more favorable environment for riskier assets during the period’s second half, lower-quality bonds within the index fared best. Gains were broad-based across industries, with steel and metals/mining leading the way amid firming commodities prices. Comments from Portfolio Manager Harley Lank: For the year, the fund’s share classes (excluding sales charges, if applicable) gained roughly 6%, significantly trailing The BofA Merrill Lynch US High Yield Constrained Index. The fund’s underperformance of the benchmark was primarily due to its non-index allocation to stocks – about 19% of assets – as these holdings trailed high-yield bonds by a considerable margin the past 12 months. Among high-yield investments, poor security selection in utilities and health care, along with adverse overall positioning in energy, were the main factors hampering relative performance. A roughly 3% average cash stake was a further dampener on performance amid a rallying market. The biggest individual relative detractor was an out-of-benchmark position in bankrupt electric utility Energy Future Holdings. Performance also was hurt by exposure to several pharmaceutical companies, most notably Ireland’s Endo International. On the plus side, JMC Steel, a maker of steel pipe and tube, was the top relative contributor. Sizable overweightings in for-profit education provider Laureate Education and APX Group, parent of home security company Vivint, also aided relative results. In light of a changing political backdrop, at period end, I was considering increasing the fund’s equity allocation up to the maximum of the fund's target range.The views expressed above reflect those of the portfolio manager(s) only through the end of the period as stated on the cover of this report and do not necessarily represent the views of Fidelity or any other person in the Fidelity organization. Any such views are subject to change at any time based upon market or other conditions and Fidelity disclaims any responsibility to update such views. These views may not be relied on as investment advice and, because investment decisions for a Fidelity fund are based on numerous factors, may not be relied on as an indication of trading intent on behalf of any Fidelity fund.
Investment Summary (Unaudited)
Top Five Holdings as of October 31, 2016
| (by issuer, excluding cash equivalents) | % of fund's net assets | % of fund's net assets 6 months ago |
| Ally Financial, Inc. | 3.1 | 3.1 |
| APX Group, Inc. | 2.3 | 1.8 |
| Energy Future Intermediate Holding Co. LLC/Energy Future Intermediate Holding Finance, Inc. | 2.3 | 1.6 |
| Valeant Pharmaceuticals International, Inc. | 2.0 | 1.8 |
| SLM Corp. | 1.8 | 2.0 |
| 11.5 |
Top Five Market Sectors as of October 31, 2016
| % of fund's net assets | % of fund's net assets 6 months ago | |
| Energy | 13.1 | 9.6 |
| Telecommunications | 10.4 | 10.8 |
| Healthcare | 9.0 | 9.6 |
| Technology | 8.0 | 7.1 |
| Banks & Thrifts | 7.9 | 8.5 |
Quality Diversification (% of fund's net assets)
| As of October 31, 2016 | ||
| AAA,AA,A | 0.1% | |
| BBB | 0.6% | |
| BB | 22.3% | |
| B | 30.2% | |
| CCC,CC,C | 20.8% | |
| Not Rated | 3.1% | |
| Equities | 19.9% | |
| Short-Term Investments and Net Other Assets | 3.0% | |

| As of April 30, 2016 | ||
| AAA,AA,A | 0.1% | |
| BBB | 1.6% | |
| BB | 24.0% | |
| B | 29.8% | |
| CCC,CC,C | 19.4% | |
| Not Rated | 3.0% | |
| Equities | 17.6% | |
| Short-Term Investments and Net Other Assets | 4.5% | |

We have used ratings from Moody's Investors Service, Inc. Where Moody's® ratings are not available, we have used S&P® ratings. All ratings are as of the date indicated and do not reflect subsequent changes.
Asset Allocation (% of fund's net assets)
| As of October 31, 2016* | ||
| Nonconvertible Bonds | 69.8% | |
| Convertible Bonds, Preferred Stocks | 1.4% | |
| Common Stocks | 18.5% | |
| Bank Loan Obligations | 4.2% | |
| Other Investments | 3.1% | |
| Short-Term Investments and Net Other Assets (Liabilities) | 3.0% | |

* Foreign investments - 18.4%
| As of April 30, 2016* | ||
| Nonconvertible Bonds | 69.3% | |
| Convertible Bonds, Preferred Stocks | 0.9% | |
| Common Stocks | 16.7% | |
| Bank Loan Obligations | 5.0% | |
| Other Investments | 3.6% | |
| Short-Term Investments and Net Other Assets (Liabilities) | 4.5% | |

* Foreign investments - 19.9%
Investments October 31, 2016
Showing Percentage of Net Assets
| Corporate Bonds - 69.8% | |||
| Principal Amount (000s)(a) | Value (000s) | ||
| Convertible Bonds - 0.0% | |||
| Telecommunications - 0.0% | |||
| Clearwire Communications LLC/Clearwire Finance, Inc. 8.25% 12/1/40 (b) | $180 | $188 | |
| Nonconvertible Bonds - 69.8% | |||
| Aerospace - 0.2% | |||
| TransDigm, Inc.: | |||
| 6% 7/15/22 | 2,030 | 2,116 | |
| 6.375% 6/15/26 (b) | 2,030 | 2,076 | |
| 4,192 | |||
| Air Transportation - 0.1% | |||
| Continental Airlines, Inc.: | |||
| pass-thru trust certificates 6.903% 4/19/22 | 514 | 546 | |
| 6.125% 4/29/18 | 670 | 704 | |
| 9.25% 5/10/17 | 612 | 618 | |
| United Air Lines, Inc. pass-thru trust certificates 9.75% 1/15/17 | 823 | 837 | |
| 2,705 | |||
| Automotive & Auto Parts - 0.2% | |||
| American Tire Distributors, Inc. 10.25% 3/1/22 (b) | 3,525 | 3,241 | |
| LKQ Corp. 4.75% 5/15/23 | 430 | 441 | |
| 3,682 | |||
| Banks & Thrifts - 3.8% | |||
| Ally Financial, Inc.: | |||
| 3.5% 1/27/19 | 3,485 | 3,485 | |
| 5.75% 11/20/25 | 2,310 | 2,365 | |
| 8% 12/31/18 | 25,604 | 28,100 | |
| 8% 11/1/31 | 20,882 | 24,954 | |
| General Motors Acceptance Corp. 8% 11/1/31 | 3,105 | 3,718 | |
| Royal Bank of Scotland Group PLC: | |||
| 5.125% 5/28/24 | 6,775 | 6,710 | |
| 6% 12/19/23 | 3,605 | 3,724 | |
| Washington Mutual Bank 5.5% 1/15/13 (c) | 10,000 | 1 | |
| 73,057 | |||
| Broadcasting - 0.4% | |||
| Clear Channel Communications, Inc. 5.5% 12/15/16 | 7,188 | 7,080 | |
| Building Materials - 1.0% | |||
| BMC East LLC 5.5% 10/1/24 (b) | 1,440 | 1,462 | |
| Builders FirstSource, Inc. 5.625% 9/1/24 (b) | 1,705 | 1,722 | |
| GCP Applied Technologies, Inc. 9.5% 2/1/23 (b) | 1,995 | 2,259 | |
| HD Supply, Inc.: | |||
| 5.25% 12/15/21 (b) | 3,430 | 3,644 | |
| 5.75% 4/15/24 (b) | 3,410 | 3,581 | |
| Herc Rentals, Inc.: | |||
| 7.5% 6/1/22 (b) | 1,345 | 1,345 | |
| 7.75% 6/1/24 (b) | 1,345 | 1,352 | |
| HMAN Finance Sub Corp. 6.375% 7/15/22 (b) | 900 | 835 | |
| USG Corp.: | |||
| 6.3% 11/15/16 | 275 | 275 | |
| 9.5% 1/15/18 (d) | 1,585 | 1,708 | |
| 18,183 | |||
| Cable/Satellite TV - 5.8% | |||
| Altice SA: | |||
| 7.625% 2/15/25 (b) | 12,590 | 13,094 | |
| 7.75% 5/15/22 (b) | 14,575 | 15,222 | |
| Altice U.S. Finance SA 7.75% 7/15/25 (b) | 4,905 | 5,248 | |
| Cable One, Inc. 5.75% 6/15/22 (b) | 1,390 | 1,466 | |
| CCO Holdings LLC/CCO Holdings Capital Corp.: | |||
| 5.125% 2/15/23 | 2,550 | 2,639 | |
| 5.5% 5/1/26 (b) | 2,940 | 3,012 | |
| 5.75% 1/15/24 | 5,335 | 5,642 | |
| 5.75% 2/15/26 (b) | 1,770 | 1,844 | |
| 5.875% 5/1/27 (b) | 5,245 | 5,494 | |
| Cequel Communications Escrow I LLC/Cequel Communications Escrow Capital Corp. 6.375% 9/15/20 (b) | 535 | 551 | |
| Cequel Communications Holdings I LLC/Cequel Capital Corp. 5.125% 12/15/21 (b) | 5,495 | 5,413 | |
| CSC Holdings, Inc. 5.5% 4/15/27 (b) | 9,215 | 9,347 | |
| DISH DBS Corp.: | |||
| 5% 3/15/23 | 4,695 | 4,625 | |
| 5.875% 7/15/22 | 4,240 | 4,378 | |
| RCN Telecom Services LLC/RCN Capital Corp. 8.5% 8/15/20 (b) | 4,621 | 4,924 | |
| Unitymedia Hessen GmbH & Co. KG/Unitymedia NRW GmbH 5.5% 1/15/23 (b) | 2,145 | 2,223 | |
| Wave Holdco LLC/Wave Holdco Corp. 8.25% 7/15/19 pay-in-kind (b)(d) | 10,920 | 11,002 | |
| WaveDivision Escrow LLC/WaveDivision Escrow Corp. 8.125% 9/1/20 (b) | 1,645 | 1,715 | |
| Ziggo Bond Finance BV: | |||
| 5.875% 1/15/25 (b) | 1,705 | 1,692 | |
| 6% 1/15/27 (b) | 4,965 | 4,875 | |
| Ziggo Secured Finance BV 5.5% 1/15/27 (b) | 7,375 | 7,283 | |
| 111,689 | |||
| Capital Goods - 0.1% | |||
| Shale-Inland Holdings LLC/Shale-Inland Finance Corp. 8.75% 11/15/19 (b) | 1,665 | 995 | |
| Chemicals - 1.2% | |||
| Blue Cube Spinco, Inc. 10% 10/15/25 | 1,310 | 1,572 | |
| Evolution Escrow Issuer LLC 7.5% 3/15/22 (b) | 6,935 | 6,207 | |
| LSB Industries, Inc. 8.5% 8/1/19 | 551 | 512 | |
| Momentive Performance Materials, Inc. 3.88% 10/24/21 | 5,545 | 4,935 | |
| MPM Escrow LLC/MPM Finance Escrow Corp. 8.875% 10/15/20 (c) | 4,120 | 0 | |
| Platform Specialty Products Corp.: | |||
| 6.5% 2/1/22 (b) | 5,550 | 5,384 | |
| 10.375% 5/1/21 (b) | 650 | 702 | |
| Tronox Finance LLC 6.375% 8/15/20 | 4,010 | 3,599 | |
| 22,911 | |||
| Containers - 1.6% | |||
| ARD Finance SA 7.125% 9/15/23 pay-in-kind (b) | 1,690 | 1,673 | |
| Ardagh Packaging Finance PLC/Ardagh MP Holdings U.S.A., Inc.: | |||
| 6.25% 1/31/19 (b) | 1,165 | 1,187 | |
| 6.75% 1/31/21 (b) | 1,350 | 1,391 | |
| 7% 11/15/20 (b) | 697 | 718 | |
| 7.25% 5/15/24 (b) | 3,785 | 3,993 | |
| Consolidated Container Co. LLC/Consolidated Container Capital, Inc. 10.125% 7/15/20 (b) | 3,910 | 3,949 | |
| Reynolds Group Issuer, Inc./Reynolds Group Issuer LLC/Reynolds Group Issuer (Luxembourg) SA: | |||
| 5.75% 10/15/20 | 2,460 | 2,525 | |
| 6.875% 2/15/21 (d) | 7,339 | 7,596 | |
| 7% 7/15/24 (b) | 1,025 | 1,095 | |
| 8.25% 2/15/21 (d) | 6,144 | 6,419 | |
| 30,546 | |||
| Diversified Financial Services - 4.6% | |||
| AerCap Ireland Capital Ltd./AerCap Global Aviation Trust 5% 10/1/21 | 2,715 | 2,885 | |
| Aircastle Ltd. 4.625% 12/15/18 | 1,625 | 1,694 | |
| CIT Group, Inc.: | |||
| 5% 8/15/22 | 3,195 | 3,407 | |
| 5% 8/1/23 | 2,195 | 2,338 | |
| 5.375% 5/15/20 | 4,400 | 4,703 | |
| Icahn Enterprises LP/Icahn Enterprises Finance Corp.: | |||
| 4.875% 3/15/19 | 3,930 | 3,905 | |
| 5.875% 2/1/22 | 5,683 | 5,406 | |
| Inception Merger Sub, Inc./Rackspace Hosting, Inc. 8.625% 11/15/24 (b) | 1,705 | 1,705 | |
| International Lease Finance Corp. 8.625% 1/15/22 | 6,855 | 8,406 | |
| MSCI, Inc. 5.75% 8/15/25 (b) | 1,345 | 1,430 | |
| Navient Corp.: | |||
| 5.875% 10/25/24 | 3,375 | 3,012 | |
| 6.625% 7/26/21 | 2,100 | 2,101 | |
| 7.25% 9/25/23 | 1,045 | 1,029 | |
| Prime Securities Services Borrower LLC/Prime Finance, Inc. 9.25% 5/15/23 (b) | 11,755 | 12,490 | |
| SLM Corp.: | |||
| 4.875% 6/17/19 | 10,000 | 10,088 | |
| 5.5% 1/25/23 | 5,330 | 4,837 | |
| 6.125% 3/25/24 | 7,565 | 6,922 | |
| 8% 3/25/20 | 9,700 | 10,525 | |
| 8.45% 6/15/18 | 1,475 | 1,595 | |
| 88,478 | |||
| Diversified Media - 0.6% | |||
| Clear Channel Worldwide Holdings, Inc.: | |||
| Series A, 7.625% 3/15/20 | 900 | 851 | |
| 7.625% 3/15/20 | 2,635 | 2,549 | |
| Liberty Media Corp.: | |||
| 8.25% 2/1/30 | 469 | 502 | |
| 8.5% 7/15/29 | 529 | 587 | |
| MDC Partners, Inc. 6.5% 5/1/24 (b) | 2,595 | 2,212 | |
| National CineMedia LLC 6% 4/15/22 | 4,035 | 4,196 | |
| Nielsen Finance LLC/Nielsen Finance Co. 5% 4/15/22 (b) | 1,220 | 1,244 | |
| 12,141 | |||
| Energy - 11.0% | |||
| Access Midstream Partners LP/ACMP Finance Corp.: | |||
| 4.875% 5/15/23 | 2,720 | 2,755 | |
| 4.875% 3/15/24 | 1,300 | 1,333 | |
| Antero Midstream Partners LP/Antero Midstream Finance Corp. 5.375% 9/15/24 (b) | 820 | 826 | |
| Antero Resources Corp.: | |||
| 5.125% 12/1/22 | 3,765 | 3,793 | |
| 5.625% 6/1/23 (Reg. S) | 2,580 | 2,632 | |
| Antero Resources Finance Corp.: | |||
| 5.375% 11/1/21 | 4,500 | 4,568 | |
| 6% 12/1/20 | 850 | 874 | |
| Callon Petroleum Co. 6.125% 10/1/24 (b) | 760 | 783 | |
| Carrizo Oil & Gas, Inc. 6.25% 4/15/23 | 1,415 | 1,454 | |
| Chesapeake Energy Corp.: | |||
| 4.13% 4/15/19 (d) | 2,250 | 2,076 | |
| 4.875% 4/15/22 | 5,580 | 4,743 | |
| 5.75% 3/15/23 | 1,890 | 1,635 | |
| 8% 12/15/22 (b) | 10,037 | 10,181 | |
| Citgo Holding, Inc. 10.75% 2/15/20 (b) | 3,525 | 3,599 | |
| Concho Resources, Inc.: | |||
| 5.5% 10/1/22 | 1,265 | 1,300 | |
| 5.5% 4/1/23 | 825 | 844 | |
| Crestwood Midstream Partners LP/Crestwood Midstream Finance Corp. 6.25% 4/1/23 | 1,775 | 1,797 | |
| Denbury Resources, Inc. 4.625% 7/15/23 | 4,395 | 3,197 | |
| Ensco PLC: | |||
| 4.5% 10/1/24 | 1,800 | 1,440 | |
| 5.2% 3/15/25 | 80 | 65 | |
| Exterran Partners LP/EXLP Finance Corp. 6% 10/1/22 | 2,280 | 2,149 | |
| Forbes Energy Services Ltd. 9% 6/15/19 (c) | 3,470 | 868 | |
| Gibson Energy, Inc. 6.75% 7/15/21 (b) | 280 | 288 | |
| Gulfmark Offshore, Inc. 6.375% 3/15/22 | 2,275 | 1,115 | |
| Halcon Resources Corp. 8.625% 2/1/20 (b) | 875 | 893 | |
| Hilcorp Energy I LP/Hilcorp Finance Co.: | |||
| 5% 12/1/24 (b) | 2,085 | 2,033 | |
| 5.75% 10/1/25 (b) | 10,085 | 10,110 | |
| 7.625% 4/15/21 (b) | 1,820 | 1,866 | |
| Hornbeck Offshore Services, Inc.: | |||
| 5% 3/1/21 | 35 | 21 | |
| 5.875% 4/1/20 | 3,306 | 2,132 | |
| Jupiter Resources, Inc. 8.5% 10/1/22 (b) | 4,640 | 3,805 | |
| LINN Energy LLC/LINN Energy Finance Corp.: | |||
| 6.5% 5/15/19 (c) | 2,545 | 846 | |
| 6.5% 9/15/21 (c) | 910 | 296 | |
| 7.75% 2/1/21 (c) | 25 | 8 | |
| MPLX LP 4.875% 12/1/24 | 5,000 | 5,231 | |
| Murphy Oil Corp. 6.875% 8/15/24 | 570 | 593 | |
| Noble Holding International Ltd.: | |||
| 3.95% 3/15/22 | 245 | 188 | |
| 4.625% 3/1/21 | 810 | 684 | |
| 7.2% 4/1/25 (d) | 525 | 428 | |
| Oasis Petroleum, Inc. 6.875% 3/15/22 | 905 | 896 | |
| Pacific Drilling V Ltd. 7.25% 12/1/17 (b) | 3,755 | 1,483 | |
| Parsley Energy LLC/Parsley 6.25% 6/1/24 (b) | 4,520 | 4,746 | |
| PBF Holding Co. LLC/PBF Finance Corp. 7% 11/15/23 (b) | 3,520 | 3,256 | |
| Plains Exploration & Production Co.: | |||
| 6.5% 11/15/20 | 435 | 444 | |
| 6.625% 5/1/21 | 435 | 444 | |
| 6.75% 2/1/22 | 3,407 | 3,484 | |
| 6.875% 2/15/23 | 7,290 | 7,563 | |
| Pride International, Inc. 7.875% 8/15/40 | 2,715 | 2,172 | |
| Rice Energy, Inc.: | |||
| 6.25% 5/1/22 | 3,095 | 3,149 | |
| 7.25% 5/1/23 | 1,545 | 1,638 | |
| Rose Rock Midstream LP/Rose Rock Finance Corp. 5.625% 7/15/22 | 1,125 | 1,074 | |
| Sabine Pass Liquefaction LLC: | |||
| 5% 3/15/27 (b) | 2,685 | 2,732 | |
| 5.625% 3/1/25 | 14,320 | 15,153 | |
| 5.75% 5/15/24 | 3,215 | 3,400 | |
| 5.875% 6/30/26 (b) | 4,080 | 4,397 | |
| SemGroup Corp. 7.5% 6/15/21 | 4,100 | 4,192 | |
| SM Energy Co.: | |||
| 5% 1/15/24 | 1,730 | 1,609 | |
| 5.625% 6/1/25 | 2,565 | 2,443 | |
| 6.125% 11/15/22 | 4,420 | 4,442 | |
| 6.5% 11/15/21 | 800 | 812 | |
| 6.5% 1/1/23 | 95 | 95 | |
| 6.75% 9/15/26 | 845 | 866 | |
| Summit Midstream Holdings LLC: | |||
| 5.5% 8/15/22 | 1,520 | 1,474 | |
| 7.5% 7/1/21 | 810 | 842 | |
| Sunoco LP/Sunoco Finance Corp.: | |||
| 6.25% 4/15/21 | 3,000 | 3,075 | |
| 6.375% 4/1/23 | 1,490 | 1,524 | |
| Targa Resources Partners LP/Targa Resources Partners Finance Corp.: | |||
| 5.125% 2/1/25 (b) | 1,070 | 1,067 | |
| 5.375% 2/1/27 (b) | 1,070 | 1,070 | |
| 6.375% 8/1/22 | 908 | 935 | |
| Teine Energy Ltd. 6.875% 9/30/22 (b) | 8,386 | 8,533 | |
| TerraForm Power Operating LLC: | |||
| 9.375% 2/1/23 (b)(d) | 11,525 | 11,554 | |
| 9.625% 6/15/25 (b)(d) | 1,480 | 1,528 | |
| Tesoro Logistics LP/Tesoro Logistics Finance Corp.: | |||
| 5.5% 10/15/19 | 1,120 | 1,196 | |
| 5.875% 10/1/20 | 270 | 278 | |
| 6.125% 10/15/21 | 785 | 821 | |
| 6.25% 10/15/22 | 3,100 | 3,286 | |
| 6.375% 5/1/24 | 1,310 | 1,412 | |
| Weatherford International Ltd.: | |||
| 4.5% 4/15/22 | 2,020 | 1,818 | |
| 7.75% 6/15/21 | 2,615 | 2,641 | |
| 8.25% 6/15/23 | 3,175 | 3,286 | |
| Western Refining Logistics LP/WNRL Finance Co. 7.5% 2/15/23 | 890 | 930 | |
| Western Refining, Inc. 6.25% 4/1/21 | 905 | 912 | |
| WPX Energy, Inc.: | |||
| 5.25% 9/15/24 | 2,080 | 1,976 | |
| 6% 1/15/22 | 2,680 | 2,673 | |
| 7.5% 8/1/20 | 1,760 | 1,855 | |
| 8.25% 8/1/23 | 2,640 | 2,851 | |
| 211,476 | |||
| Entertainment/Film - 0.2% | |||
| CBS Outdoor Americas Capital LLC/CBS Outdoor Americas Capital Corp.: | |||
| 5.25% 2/15/22 | 470 | 486 | |
| 5.625% 2/15/24 | 580 | 603 | |
| Livent, Inc. yankee 9.375% 10/15/04 (c) | 11,100 | 0 | |
| NAI Entertainment Holdings LLC/NAI Entertainment Finance Corp. 5% 8/1/18 (b) | 1,425 | 1,439 | |
| New Cotai LLC/New Cotai Capital Corp. 10.625% 5/1/19 pay-in-kind (b)(d) | 2,365 | 1,270 | |
| 3,798 | |||
| Environmental - 0.6% | |||
| Covanta Holding Corp.: | |||
| 5.875% 3/1/24 | 4,680 | 4,616 | |
| 6.375% 10/1/22 | 4,000 | 4,070 | |
| 7.25% 12/1/20 | 1,094 | 1,123 | |
| LBC Tank Terminals Holding Netherlands BV 6.875% 5/15/23 (b) | 1,455 | 1,459 | |
| 11,268 | |||
| Food & Drug Retail - 1.1% | |||
| Albertsons Companies LLC/Safeway, Inc./New Albertson's, Inc./Albertson's LLC: | |||
| 5.75% 3/15/25 (b) | 3,940 | 3,890 | |
| 6.625% 6/15/24 (b) | 2,740 | 2,843 | |
| FAGE International SA/FAGE U.S.A. Dairy Industry, Inc. 5.625% 8/15/26 (b) | 805 | 831 | |
| Rite Aid Corp.: | |||
| 6.875% 12/15/28 (b)(d) | 5,785 | 6,985 | |
| 7.7% 2/15/27 | 2,715 | 3,367 | |
| Tops Holding LLC/Tops Markets II Corp. 8% 6/15/22 (b) | 4,395 | 3,868 | |
| 21,784 | |||
| Food/Beverage/Tobacco - 1.8% | |||
| C&S Group Enterprises LLC 5.375% 7/15/22 (b) | 3,080 | 2,988 | |
| Darling International, Inc. 5.375% 1/15/22 | 1,280 | 1,334 | |
| ESAL GmbH 6.25% 2/5/23 (b) | 8,600 | 8,278 | |
| JBS Investments GmbH 7.25% 4/3/24 (b) | 2,955 | 2,985 | |
| JBS U.S.A. LLC/JBS U.S.A. Finance, Inc.: | |||
| 5.75% 6/15/25 (b) | 1,660 | 1,627 | |
| 5.875% 7/15/24 (b) | 2,435 | 2,447 | |
| Minerva Luxembourg SA 6.5% 9/20/26 (b) | 2,215 | 2,169 | |
| Post Holdings, Inc.: | |||
| 6.75% 12/1/21 (b) | 4,200 | 4,494 | |
| 7.75% 3/15/24 (b) | 1,720 | 1,901 | |
| 8% 7/15/25 (b) | 860 | 980 | |
| TreeHouse Foods, Inc. 6% 2/15/24 (b) | 1,185 | 1,273 | |
| U.S. Foods, Inc. 5.875% 6/15/24 (b) | 2,155 | 2,241 | |
| Vector Group Ltd. 7.75% 2/15/21 | 1,425 | 1,493 | |
| 34,210 | |||
| Gaming - 1.9% | |||
| Caesars Growth Properties Holdings LLC/Caesars Growth Properties Finance, Inc. 9.375% 5/1/22 | 7,900 | 8,394 | |
| Golden Nugget Escrow, Inc. 8.5% 12/1/21 (b) | 5,795 | 6,085 | |
| MGM Mirage, Inc.: | |||
| 6% 3/15/23 | 2,810 | 3,042 | |
| 8.625% 2/1/19 | 5,000 | 5,609 | |
| Paris Las Vegas Holding LLC/Harrah's Las Vegas LLC/Flamingo Las Vegas Holdings, Inc. 11% 10/1/21 (d) | 7,110 | 7,670 | |
| Scientific Games Corp. 10% 12/1/22 | 5,980 | 5,532 | |
| 36,332 | |||
| Healthcare - 6.0% | |||
| Acadia Healthcare Co., Inc. 5.625% 2/15/23 | 1,035 | 1,036 | |
| AMAG Pharmaceuticals, Inc. 7.875% 9/1/23 (b) | 1,810 | 1,697 | |
| Community Health Systems, Inc. 6.875% 2/1/22 | 9,725 | 7,415 | |
| CTR Partnership LP/CareTrust Capital Corp. 5.875% 6/1/21 | 355 | 366 | |
| DaVita HealthCare Partners, Inc. 5% 5/1/25 | 3,590 | 3,464 | |
| Endo Finance LLC 5.375% 1/15/23 (b)(d) | 535 | 455 | |
| Endo Finance LLC/Endo Ltd./Endo Finco, Inc.: | |||
| 6% 7/15/23 (b) | 5,375 | 4,676 | |
| 6.5% 2/1/25 (b)(d) | 2,352 | 1,982 | |
| HCA Holdings, Inc.: | |||
| 5.375% 2/1/25 | 4,375 | 4,466 | |
| 5.875% 3/15/22 | 8,635 | 9,499 | |
| 5.875% 2/15/26 | 2,290 | 2,405 | |
| 7.5% 2/15/22 | 5,095 | 5,798 | |
| HealthSouth Corp.: | |||
| 5.125% 3/15/23 | 1,235 | 1,247 | |
| 5.75% 11/1/24 | 1,570 | 1,619 | |
| 5.75% 9/15/25 | 400 | 414 | |
| Horizon Pharma PLC 6.625% 5/1/23 | 200 | 189 | |
| IMS Health, Inc. 5% 10/15/26 (b) | 2,205 | 2,279 | |
| RegionalCare Hospital Partners Holdings, Inc. 8.25% 5/1/23 (b) | 1,825 | 1,850 | |
| Service Corp. International 5.375% 1/15/22 | 815 | 846 | |
| Team Health, Inc. 7.25% 12/15/23 (b) | 1,740 | 1,968 | |
| Tenet Healthcare Corp.: | |||
| 4.375% 10/1/21 | 3,350 | 3,333 | |
| 5% 3/1/19 (d) | 2,540 | 2,463 | |
| 6.75% 2/1/20 | 1,800 | 1,764 | |
| 6.75% 6/15/23 | 3,665 | 3,367 | |
| 8.125% 4/1/22 | 7,570 | 7,400 | |
| Valeant Pharmaceuticals International, Inc.: | |||
| 5.375% 3/15/20 (b) | 9,510 | 8,226 | |
| 5.5% 3/1/23 (b) | 4,720 | 3,705 | |
| 5.625% 12/1/21 (b) | 1,395 | 1,144 | |
| 5.875% 5/15/23 (b) | 14,395 | 11,336 | |
| 6.125% 4/15/25 (b) | 7,645 | 6,040 | |
| 7.25% 7/15/22 (b) | 315 | 274 | |
| 7.5% 7/15/21 (b) | 8,420 | 7,494 | |
| Vizient, Inc. 10.375% 3/1/24 (b) | 2,275 | 2,537 | |
| VPI Escrow Corp. 6.375% 10/15/20 (b) | 3,400 | 2,933 | |
| 115,687 | |||
| Homebuilders/Real Estate - 0.7% | |||
| Beazer Homes U.S.A., Inc. 7.25% 2/1/23 (d) | 1,260 | 1,266 | |
| Brookfield Residential Properties, Inc./Brookfield Residential U.S. Corp. 6.125% 7/1/22 (b) | 1,290 | 1,309 | |
| Brookfield Residential Properties, Inc.: | |||
| 6.375% 5/15/25 (b) | 470 | 469 | |
| 6.5% 12/15/20 (b) | 1,840 | 1,895 | |
| Shea Homes Ltd. Partnership/Corp.: | |||
| 5.875% 4/1/23 (b) | 680 | 668 | |
| 6.125% 4/1/25 (b) | 680 | 670 | |
| Taylor Morrison Communities, Inc./Monarch Communities, Inc. 5.875% 4/15/23 (b) | 2,150 | 2,268 | |
| William Lyon Homes, Inc. 7% 8/15/22 | 1,860 | 1,934 | |
| Woodside Homes Co. LLC/Woodside Homes Finance, Inc. 6.75% 12/15/21 (b) | 2,215 | 2,149 | |
| 12,628 | |||
| Hotels - 0.1% | |||
| Playa Resorts Holding BV 8% 8/15/20 (b) | 825 | 850 | |
| Insurance - 0.4% | |||
| Alliant Holdings Co.-Issuer, Inc./Wayne Merger Sub LLC 8.25% 8/1/23 (b) | 3,390 | 3,449 | |
| Hockey Merger Sub 2, Inc. 7.875% 10/1/21 (b) | 2,765 | 2,826 | |
| Hub Holdings LLC/Hub Holdings Finance, Inc. 8.125% 7/15/19 pay-in-kind (b)(d) | 1,220 | 1,190 | |
| 7,465 | |||
| Leisure - 0.0% | |||
| 24 Hour Holdings III LLC 8% 6/1/22 (b) | 895 | 743 | |
| Metals/Mining - 1.0% | |||
| Alpha Natural Resources, Inc. 9.75% 4/15/18 (c) | 1,770 | 9 | |
| Bluescope Steel Ltd./Bluescope Steel Finance: | |||
| 6.5% 5/15/21 (b) | 650 | 686 | |
| 7.125% 5/1/18 (b) | 179 | 183 | |
| CONSOL Energy, Inc. 8% 4/1/23 | 7,000 | 6,930 | |
| Joseph T Ryerson & Son, Inc. 11% 5/15/22 (b) | 1,200 | 1,311 | |
| Novelis Corp. 5.875% 9/30/26 (b) | 2,250 | 2,278 | |
| Peabody Energy Corp. 10% 3/15/22 (b)(c) | 2,120 | 1,532 | |
| Prince Mineral Holding Corp. 11.5% 12/15/19 (b)(d) | 655 | 616 | |
| Teck Resources Ltd.: | |||
| 8% 6/1/21 (b) | 1,350 | 1,475 | |
| 8.5% 6/1/24 (b) | 3,675 | 4,254 | |
| Walter Energy, Inc. 9.5% 10/15/19 (b)(c) | 2,360 | 0 | |
| 19,274 | |||
| Paper - 0.1% | |||
| Xerium Technologies, Inc. 9.5% 8/15/21 (b) | 2,710 | 2,751 | |
| Publishing/Printing - 1.6% | |||
| Cengage Learning, Inc. 9.5% 6/15/24 (b) | 4,000 | 3,770 | |
| Cenveo Corp. 6% 8/1/19 (b) | 1,290 | 1,135 | |
| McGraw-Hill Global Education Holdings LLC/McGraw-Hill Global Education Finance 7.875% 5/15/24 (b) | 6,945 | 7,518 | |
| MHGE Parent LLC/MHGE Parent Finance, Inc. 8.5% 8/1/19 pay-in-kind (b)(d) | 18,124 | 18,328 | |
| 30,751 | |||
| Restaurants - 0.7% | |||
| 1011778 BC Unlimited Liability Co./New Red Finance, Inc. 4.625% 1/15/22 (b) | 1,820 | 1,879 | |
| KFC Holding Co./Pizza Hut Holding LLC: | |||
| 5% 6/1/24 (b) | 5,680 | 5,907 | |
| 5.25% 6/1/26 (b) | 3,075 | 3,206 | |
| Landry's Acquisition Co. 6.75% 10/15/24 (b) | 1,710 | 1,744 | |
| 12,736 | |||
| Services - 4.4% | |||
| Anna Merger Sub, Inc. 7.75% 10/1/22 (b) | 6,170 | 5,291 | |
| APX Group, Inc.: | |||
| 6.375% 12/1/19 | 5,990 | 6,177 | |
| 7.875% 12/1/22 | 10,865 | 11,436 | |
| 8.75% 12/1/20 | 27,443 | 26,551 | |
| Ashtead Capital, Inc. 5.625% 10/1/24 (b) | 3,195 | 3,363 | |
| Blueline Rent Finance Corp./Volvo 7% 2/1/19 (b) | 815 | 711 | |
| Everi Payments, Inc. 10% 1/15/22 | 870 | 830 | |
| FTI Consulting, Inc. 6% 11/15/22 | 2,450 | 2,573 | |
| Garda World Security Corp.: | |||
| 7.25% 11/15/21 (b) | 6,820 | 6,513 | |
| 7.25% 11/15/21 (b) | 920 | 879 | |
| Jurassic Holdings III, Inc. 6.875% 2/15/21 (Reg. S) (b) | 2,095 | 1,666 | |
| Laureate Education, Inc. 10% 9/1/19 (b)(d) | 16,420 | 15,189 | |
| NES Rentals Holdings, Inc. 7.875% 5/1/18 (b) | 600 | 588 | |
| TMS International Corp. 7.625% 10/15/21 (b) | 420 | 347 | |
| United Rentals North America, Inc.: | |||
| 5.5% 7/15/25 | 1,500 | 1,519 | |
| 5.5% 5/15/27 (e) | 1,355 | 1,348 | |
| 84,981 | |||
| Super Retail - 0.7% | |||
| JC Penney Corp., Inc.: | |||
| 5.65% 6/1/20 | 2,375 | 2,351 | |
| 5.75% 2/15/18 | 703 | 723 | |
| 7.4% 4/1/37 | 775 | 709 | |
| 8.125% 10/1/19 | 3,785 | 4,121 | |
| Netflix, Inc. 4.375% 11/15/26 (b) | 3,540 | 3,482 | |
| Sonic Automotive, Inc.: | |||
| 5% 5/15/23 | 315 | 308 | |
| 7% 7/15/22 | 1,390 | 1,460 | |
| 13,154 | |||
| Technology - 2.5% | |||
| Activision Blizzard, Inc. 6.125% 9/15/23 (b) | 950 | 1,046 | |
| ADT Corp. 6.25% 10/15/21 | 1,895 | 2,073 | |
| CDW LLC/CDW Finance Corp. 6% 8/15/22 | 1,190 | 1,261 | |
| Diamond 1 Finance Corp./Diamond 2 Finance Corp.: | |||
| 5.875% 6/15/21 (b) | 1,930 | 2,034 | |
| 7.125% 6/15/24 (b) | 1,880 | 2,059 | |
| EIG Investors Corp. 10.875% 2/1/24 (b) | 1,750 | 1,610 | |
| JDA Escrow LLC/JDA Bond Finance, Inc. 7.375% 10/15/24 (b) | 755 | 780 | |
| Lucent Technologies, Inc.: | |||
| 6.45% 3/15/29 | 6,539 | 7,209 | |
| 6.5% 1/15/28 | 5,415 | 5,767 | |
| Micron Technology, Inc.: | |||
| 5.25% 1/15/24 (b) | 3,480 | 3,393 | |
| 5.5% 2/1/25 | 2,310 | 2,265 | |
| 5.875% 2/15/22 | 1,520 | 1,570 | |
| Parametric Technology Corp. 6% 5/15/24 | 650 | 687 | |
| Rackspace Hosting, Inc. 6.5% 1/15/24 (b) | 2,090 | 2,390 | |
| Solera LLC/Solera Finance, Inc. 10.5% 3/1/24 (b) | 3,365 | 3,761 | |
| VeriSign, Inc. 4.625% 5/1/23 | 910 | 937 | |
| Western Digital Corp. 10.5% 4/1/24 (b) | 3,040 | 3,511 | |
| WideOpenWest Finance LLC/WideOpenWest Capital Corp.: | |||
| 10.25% 7/15/19 | 5,300 | 5,565 | |
| 13.375% 10/15/19 | 389 | 416 | |
| 48,334 | |||
| Telecommunications - 9.8% | |||
| Altice Financing SA: | |||
| 6.5% 1/15/22 (b) | 895 | 935 | |
| 6.625% 2/15/23 (b) | 3,965 | 4,084 | |
| 7.5% 5/15/26 (b) | 4,005 | 4,125 | |
| Altice Finco SA: | |||
| 7.625% 2/15/25 (b) | 4,995 | 4,945 | |
| 8.125% 1/15/24 (b) | 810 | 830 | |
| Broadview Networks Holdings, Inc. 10.5% 11/15/17 | 2,915 | 2,740 | |
| Citizens Communications Co. 7.875% 1/15/27 | 4,949 | 4,343 | |
| Clearwire Communications LLC/Clearwire Finance, Inc. 14.75% 12/1/16 (b) | 2,790 | 2,811 | |
| Columbus International, Inc. 7.375% 3/30/21 (b) | 6,245 | 6,682 | |
| DigitalGlobe, Inc. 5.25% 2/1/21 (b) | 3,815 | 3,844 | |
| FairPoint Communications, Inc. 8.75% 8/15/19 (b) | 2,375 | 2,417 | |
| Frontier Communications Corp.: | |||
| 8.875% 9/15/20 | 1,165 | 1,238 | |
| 10.5% 9/15/22 | 1,915 | 1,992 | |
| GCI, Inc. 6.875% 4/15/25 | 2,080 | 2,111 | |
| Intelsat Jackson Holdings SA: | |||
| 5.5% 8/1/23 | 3,840 | 2,544 | |
| 7.5% 4/1/21 | 5,730 | 4,212 | |
| 8% 2/15/24 (b) | 8,435 | 8,477 | |
| Intelsat Luxembourg SA: | |||
| 7.75% 6/1/21 | 6,204 | 2,016 | |
| 8.125% 6/1/23 | 3,585 | 1,183 | |
| Level 3 Financing, Inc. 6.125% 1/15/21 | 2,395 | 2,473 | |
| Neptune Finco Corp.: | |||
| 6.625% 10/15/25 (b) | 1,990 | 2,157 | |
| 10.125% 1/15/23 (b) | 9,815 | 11,066 | |
| 10.875% 10/15/25 (b) | 6,045 | 6,952 | |
| Sable International Finance Ltd. 6.875% 8/1/22 (b) | 3,985 | 4,124 | |
| SFR Group SA: | |||
| 6% 5/15/22 (b) | 10,358 | 10,620 | |
| 6.25% 5/15/24 (b) | 1,150 | 1,149 | |
| 7.375% 5/1/26 (b) | 6,930 | 6,999 | |
| Sprint Capital Corp.: | |||
| 6.875% 11/15/28 | 5,490 | 5,051 | |
| 6.9% 5/1/19 | 4,761 | 5,011 | |
| 8.75% 3/15/32 | 3,310 | 3,360 | |
| Sprint Communications, Inc.: | |||
| 6% 12/1/16 | 3,939 | 3,944 | |
| 6% 11/15/22 | 13,834 | 12,892 | |
| 9% 11/15/18 (b) | 5,500 | 6,050 | |
| Sprint Corp.: | |||
| 7.125% 6/15/24 | 7,345 | 6,904 | |
| 7.25% 9/15/21 | 270 | 276 | |
| 7.625% 2/15/25 | 825 | 798 | |
| 7.875% 9/15/23 | 8,400 | 8,316 | |
| T-Mobile U.S.A., Inc.: | |||
| 6% 4/15/24 | 3,290 | 3,500 | |
| 6.25% 4/1/21 | 1,335 | 1,390 | |
| 6.464% 4/28/19 | 705 | 716 | |
| 6.5% 1/15/24 | 2,500 | 2,675 | |
| 6.5% 1/15/26 | 3,290 | 3,606 | |
| 6.542% 4/28/20 | 2,465 | 2,545 | |
| 6.625% 4/1/23 | 4,925 | 5,234 | |
| 6.633% 4/28/21 | 2,225 | 2,333 | |
| 6.731% 4/28/22 | 1,645 | 1,719 | |
| 6.836% 4/28/23 | 480 | 513 | |
| Zayo Group LLC/Zayo Capital, Inc. 6% 4/1/23 | 3,795 | 3,994 | |
| 187,896 | |||
| Transportation Ex Air/Rail - 0.4% | |||
| Navios Maritime Acquisition Corp./Navios Acquisition Finance U.S., Inc. 8.125% 11/15/21 (b) | 1,425 | 1,076 | |
| Navios Maritime Holdings, Inc.: | |||
| 7.375% 1/15/22 (b) | 5,250 | 2,730 | |
| 8.125% 2/15/19 | 1,404 | 814 | |
| Navios South American Logistics, Inc./Navios Logistics Finance U.S., Inc. 7.25% 5/1/22 (b) | 1,215 | 960 | |
| Teekay Corp. 8.5% 1/15/20 | 2,585 | 2,352 | |
| TRAC Intermodal LLC/TRAC Intermodal Corp. 11% 8/15/19 | 337 | 356 | |
| Ultrapetrol (Bahamas) Ltd. 8.875% 6/15/21 (c) | 1,240 | 236 | |
| 8,524 | |||
| Utilities - 5.2% | |||
| Calpine Corp.: | |||
| 5.375% 1/15/23 | 2,615 | 2,589 | |
| 5.75% 1/15/25 | 1,120 | 1,089 | |
| 7.875% 1/15/23 (b) | 3,021 | 3,168 | |
| Dynegy, Inc.: | |||
| 5.875% 6/1/23 | 705 | 631 | |
| 6.75% 11/1/19 | 1,855 | 1,877 | |
| 7.375% 11/1/22 | 7,415 | 7,151 | |
| 7.625% 11/1/24 | 8,885 | 8,507 | |
| 8% 1/15/25 (b) | 1,335 | 1,288 | |
| Energy Future Intermediate Holding Co. LLC/Energy Future Intermediate Holding Finance, Inc.: | |||
| 11% 10/1/21 (c) | 11,804 | 14,991 | |
| 12.25% 3/1/22 (b)(c) | 21,847 | 28,120 | |
| Global Partners LP/GLP Finance Corp.: | |||
| 6.25% 7/15/22 | 535 | 511 | |
| 7% 6/15/23 | 2,200 | 2,101 | |
| InterGen NV 7% 6/30/23 (b) | 12,534 | 10,623 | |
| NRG Energy, Inc. 6.625% 3/15/23 | 6,290 | 6,274 | |
| PPL Energy Supply LLC 6.5% 6/1/25 | 1,700 | 1,420 | |
| RJS Power Holdings LLC 4.625% 7/15/19 (b)(d) | 3,830 | 3,639 | |
| TXU Corp.: | |||
| 5.55% 11/15/14 (c) | 7,757 | 2,327 | |
| 6.5% 11/15/24 (c) | 4,961 | 1,488 | |
| 6.55% 11/15/34 (c) | 4,295 | 1,289 | |
| 99,083 | |||
| TOTAL NONCONVERTIBLE BONDS | 1,339,384 | ||
| TOTAL CORPORATE BONDS | |||
| (Cost $1,350,196) | 1,339,572 | ||
| Shares | Value (000s) | ||
| Common Stocks - 18.5% | |||
| Air Transportation - 0.2% | |||
| Delta Air Lines, Inc. | 100,000 | 4,177 | |
| Automotive & Auto Parts - 0.7% | |||
| Chassix Holdings, Inc. (f) | 29,835 | 937 | |
| General Motors Co. | 179,161 | 5,661 | |
| General Motors Co. warrants 7/10/19 (f) | 11,706 | 160 | |
| Motors Liquidation Co. GUC Trust (f) | 39,254 | 412 | |
| Tenneco, Inc. (f) | 100,000 | 5,507 | |
| TOTAL AUTOMOTIVE & AUTO PARTS | 12,677 | ||
| Banks & Thrifts - 1.0% | |||
| Bank of America Corp. | 389,800 | 6,432 | |
| CIT Group, Inc. | 218,300 | 7,931 | |
| Citigroup, Inc. | 91,564 | 4,500 | |
| Washington Mutual, Inc. (f) | 505,500 | 0 | |
| WMI Holdings Corp. (f) | 17,605 | 37 | |
| TOTAL BANKS & THRIFTS | 18,900 | ||
| Broadcasting - 0.9% | |||
| AMC Networks, Inc. Class A (f) | 76,200 | 3,728 | |
| Cumulus Media, Inc. Class A (f) | 68,825 | 95 | |
| DISH Network Corp. Class A (f) | 125,000 | 7,320 | |
| Gray Television, Inc. (f) | 494,070 | 4,397 | |
| Sinclair Broadcast Group, Inc. Class A | 100,000 | 2,510 | |
| TOTAL BROADCASTING | 18,050 | ||
| Cable/Satellite TV - 0.1% | |||
| Charter Communications, Inc. Class A (f) | 10,848 | 2,711 | |
| Chemicals - 0.6% | |||
| LyondellBasell Industries NV Class A | 95,795 | 7,620 | |
| Platform Specialty Products Corp. (f)(g) | 416,944 | 3,040 | |
| TOTAL CHEMICALS | 10,660 | ||
| Consumer Products - 0.4% | |||
| Spectrum Brands Holdings, Inc. | 43,000 | 5,815 | |
| Whirlpool Corp. | 15,000 | 2,247 | |
| TOTAL CONSUMER PRODUCTS | 8,062 | ||
| Containers - 0.4% | |||
| Graphic Packaging Holding Co. | 617,874 | 7,723 | |
| Diversified Financial Services - 0.7% | |||
| AerCap Holdings NV (f) | 164,200 | 6,750 | |
| The Blackstone Group LP | 250,000 | 6,258 | |
| TOTAL DIVERSIFIED FINANCIAL SERVICES | 13,008 | ||
| Diversified Media - 0.1% | |||
| MDC Partners, Inc. Class A | 205,126 | 1,733 | |
| Energy - 1.3% | |||
| Baker Hughes, Inc. | 198,900 | 11,019 | |
| Cheniere Energy, Inc. (f) | 229,000 | 8,633 | |
| Dril-Quip, Inc. (f) | 91,700 | 4,356 | |
| Extraction Oil & Gas, Inc. | 19,646 | 420 | |
| Ovation Acquisition I LLC (h) | 583,372 | 0 | |
| Southwestern Energy Co. (f) | 9,581 | 100 | |
| The Williams Companies, Inc. | 48,200 | 1,407 | |
| TOTAL ENERGY | 25,935 | ||
| Food/Beverage/Tobacco - 0.8% | |||
| Darling International, Inc. (f) | 450,000 | 6,120 | |
| U.S. Foods Holding Corp. | 415,900 | 9,399 | |
| TOTAL FOOD/BEVERAGE/TOBACCO | 15,519 | ||
| Gaming - 0.7% | |||
| Gaming & Leisure Properties | 181,000 | 5,942 | |
| Red Rock Resorts, Inc. (b) | 357,285 | 7,825 | |
| TOTAL GAMING | 13,767 | ||
| Healthcare - 1.9% | |||
| Boston Scientific Corp. (f) | 319,900 | 7,038 | |
| Endo International PLC (f) | 141,100 | 2,646 | |
| HCA Holdings, Inc. (f) | 143,200 | 10,959 | |
| Jazz Pharmaceuticals PLC (f) | 42,500 | 4,652 | |
| Legend Acquisition, Inc. (f) | 18,796 | 263 | |
| Legend Acquisition, Inc.: | |||
| Class A warrants (f) | 28,063 | 0 | |
| Class B warrants (f) | 37,006 | 0 | |
| Teva Pharmaceutical Industries Ltd. sponsored ADR | 64,500 | 2,757 | |
| Universal Health Services, Inc. Class B | 30,840 | 3,723 | |
| Zimmer Biomet Holdings, Inc. | 43,900 | 4,627 | |
| TOTAL HEALTHCARE | 36,665 | ||
| Homebuilders/Real Estate - 0.4% | |||
| Lennar Corp. Class A | 189,587 | 7,904 | |
| Hotels - 0.1% | |||
| Extended Stay America, Inc. unit | 194,400 | 2,780 | |
| Metals/Mining - 0.1% | |||
| AngloGold Ashanti Ltd. sponsored ADR (f) | 87,174 | 1,198 | |
| Warrior Met Coal LLC Class A (h) | 1,222 | 315 | |
| TOTAL METALS/MINING | 1,513 | ||
| Services - 1.3% | |||
| ARAMARK Holdings Corp. | 93,700 | 3,488 | |
| Avis Budget Group, Inc. (f) | 136,600 | 4,420 | |
| HD Supply Holdings, Inc. (f) | 150,000 | 4,950 | |
| KAR Auction Services, Inc. | 122,600 | 5,220 | |
| United Rentals, Inc. (f) | 80,000 | 6,053 | |
| WP Rocket Holdings, Inc. (f)(h) | 8,700,771 | 522 | |
| TOTAL SERVICES | 24,653 | ||
| Super Retail - 1.5% | |||
| Arena Brands Holding Corp. Class B (f)(h) | 42,253 | 85 | |
| AutoZone, Inc. (f) | 12,800 | 9,500 | |
| L Brands, Inc. | 132,400 | 9,558 | |
| Liberty Interactive Corp. QVC Group Series A (f) | 519,500 | 9,606 | |
| TOTAL SUPER RETAIL | 28,749 | ||
| Technology - 4.0% | |||
| Alphabet, Inc. Class A | 15,000 | 12,149 | |
| CDW Corp. | 300,000 | 13,473 | |
| Cypress Semiconductor Corp. | 27,565 | 275 | |
| Dell Technologies, Inc. (f) | 122,900 | 6,033 | |
| Facebook, Inc. Class A (f) | 34,294 | 4,492 | |
| NXP Semiconductors NV (f) | 113,322 | 11,332 | |
| Qorvo, Inc. (f) | 248,600 | 13,835 | |
| Skyworks Solutions, Inc. | 125,000 | 9,618 | |
| VeriSign, Inc. (f) | 63,600 | 5,344 | |
| TOTAL TECHNOLOGY | 76,551 | ||
| Telecommunications - 0.6% | |||
| Alibaba Group Holding Ltd. sponsored ADR (f) | 32,200 | 3,274 | |
| Broadview Networks Holdings, Inc. (f) | 189,475 | 237 | |
| Pendrell Corp. (f) | 3,747 | 25 | |
| SBA Communications Corp. Class A (f) | 66,400 | 7,522 | |
| TOTAL TELECOMMUNICATIONS | 11,058 | ||
| Utilities - 0.7% | |||
| Calpine Corp. (f) | 727,400 | 8,656 | |
| Dynegy, Inc. (f) | 178,500 | 1,901 | |
| NRG Yield, Inc. Class C | 187,100 | 2,881 | |
| TOTAL UTILITIES | 13,438 | ||
| TOTAL COMMON STOCKS | |||
| (Cost $352,853) | 356,233 | ||
| Preferred Stocks - 1.4% | |||
| Convertible Preferred Stocks - 1.1% | |||
| Energy - 0.1% | |||
| Southwestern Energy Co. Series B 6.25% | 46,100 | 1,156 | |
| Healthcare - 0.8% | |||
| Allergan PLC 5.50% | 13,500 | 10,382 | |
| Teva Pharmaceutical Industries Ltd. 7% | 6,650 | 5,045 | |
| 15,427 | |||
| Utilities - 0.2% | |||
| Dynegy, Inc. 7.00% (f) | 45,600 | 3,409 | |
| TOTAL CONVERTIBLE PREFERRED STOCKS | 19,992 | ||
| Nonconvertible Preferred Stocks - 0.3% | |||
| Diversified Financial Services - 0.3% | |||
| GMAC Capital Trust I Series 2, 8.125% | 249,413 | 6,368 | |
| TOTAL PREFERRED STOCKS | |||
| (Cost $31,625) | 26,360 | ||
| Principal Amount (000s)(a) | Value (000s) | ||
| Bank Loan Obligations - 4.2% | |||
| Automotive & Auto Parts - 0.0% | |||
| Chassix, Inc. term loan 12% 7/29/19 | 379 | 389 | |
| Broadcasting - 0.1% | |||
| Cumulus Media Holdings, Inc. Tranch B 1LN, term loan 4.25% 12/23/20 (d) | 1,563 | 1,075 | |
| Cable/Satellite TV - 0.5% | |||
| WideOpenWest Finance LLC Tranche B, term loan 4.5% 8/19/23 (d) | 9,565 | 9,539 | |
| Energy - 0.7% | |||
| American Energy-Marcellus LLC Tranche B 1LN, term loan 5.25% 8/4/20 (d) | 1,610 | 907 | |
| California Resources Corp. Tranche 1LN, term loan 11.375% 12/31/21 (d) | 1,885 | 2,024 | |
| Chesapeake Energy Corp. Tranche 1LN, term loan 8.5% 8/23/21 (d) | 2,645 | 2,825 | |
| Chief Exploration & Development, LLC. Tranche 2LN, term loan 7.7528% 5/16/21 (d) | 2,295 | 2,193 | |
| Citgo Holding, Inc. Tranche B, term loan 9.5% 5/12/18 (d) | 807 | 815 | |
| Drillships Ocean Ventures, Inc. Tranche B, term loan 5.5% 7/25/21 (d) | 4,526 | 3,209 | |
| Pacific Drilling SA Tranche B, term loan 4.5% 6/3/18 (d) | 570 | 160 | |
| Seadrill Operating LP Tranche B, term loan 4% 2/21/21 (d) | 1,745 | 970 | |
| TOTAL ENERGY | 13,103 | ||
| Entertainment/Film - 0.0% | |||
| Livent, Inc. Tranche A, term loan 18% 1/15/49 pay-in-kind (f) | CAD | 465 | 346 |
| Food & Drug Retail - 0.0% | |||
| Albertson's LLC Tranche B 6LN, term loan 4.75% 6/22/23 (d) | 823 | 831 | |
| Gaming - 0.7% | |||
| Caesars Entertainment Resort Properties LLC Tranche B 1LN, term loan 7% 10/11/20 (d) | 6,271 | 6,303 | |
| Caesars Growth Properties Holdings, LLC Tranche 1LN, term loan 6.25% 5/8/21 (d) | 7,830 | 7,817 | |
| TOTAL GAMING | 14,120 | ||
| Healthcare - 0.3% | |||
| U.S. Renal Care, Inc.: | |||
| Tranche 2LN, term loan 9% 12/31/23 (d) | 2,935 | 2,803 | |
| Tranche B 1LN, term loan 5.25% 12/31/22 (d) | 3,569 | 3,414 | |
| TOTAL HEALTHCARE | 6,217 | ||
| Homebuilders/Real Estate - 0.1% | |||
| DTZ U.S. Borrower LLC Tranche 2LN, term loan 9.25% 11/4/22 (d) | 905 | 906 | |
| Paper - 0.0% | |||
| White Birch Paper Co. Tranche 2LN, term loan 12/31/49 (c)(d) | 8,620 | 0 | |
| Services - 0.3% | |||
| Ancestry.Com Operations, Inc. Tranche 2LN, term loan 9.25% 10/19/24 (d) | 4,115 | 4,166 | |
| Thomson Reuters IP&S Tranche B 1LN, term loan 4.75% 10/3/23 (d) | 565 | 565 | |
| TOTAL SERVICES | 4,731 | ||
| Super Retail - 0.0% | |||
| BJ's Wholesale Club, Inc. Tranche B 1LN, term loan 4.5% 9/26/19 (d) | 742 | 743 | |
| Technology - 1.5% | |||
| Compuware Corp. term loan 9.25% 12/12/22 (d) | 3,855 | 3,730 | |
| Kronos, Inc.: | |||
| term loan: | |||
| 10/20/23 (i) | 9,410 | 9,447 | |
| 10/20/24 (i) | 3,650 | 3,759 | |
| Tranche 2LN, term loan 9.75% 4/30/20 (d) | 934 | 945 | |
| Renaissance Learning, Inc.: | |||
| Tranche 1LN, term loan 4.5% 4/9/21 (d) | 999 | 996 | |
| Tranche 2LN, term loan 8% 4/9/22 (d) | 9,065 | 8,891 | |
| TOTAL TECHNOLOGY | 27,768 | ||
| Telecommunications - 0.0% | |||
| LTS Buyer LLC Tranche 2LN, term loan 8% 4/12/21 (d) | 63 | 63 | |
| TOTAL BANK LOAN OBLIGATIONS | |||
| (Cost $88,594) | 79,831 | ||
| Preferred Securities - 3.1% | |||
| Banks & Thrifts - 3.1% | |||
| Bank of America Corp. 6.1% (d)(j) | 2,590 | 2,726 | |
| Barclays Bank PLC 7.625% 11/21/22 | 11,090 | 12,756 | |
| Citigroup, Inc. 5.35% (d)(j) | 21,130 | 21,362 | |
| Credit Agricole SA: | |||
| 6.625% (b)(d)(j) | 9,035 | 8,851 | |
| 7.875% (b)(d)(j) | 2,365 | 2,416 | |
| 8.125% (b)(d)(j) | 6,230 | 6,744 | |
| Goldman Sachs Group, Inc. 5.375% (d)(j) | 4,045 | 4,169 | |
| Royal Bank of Scotland Group PLC 8% (d)(j) | 1,515 | 1,450 | |
| TOTAL PREFERRED SECURITIES | |||
| (Cost $59,629) | 60,474 | ||
| Shares | Value (000s) | ||
| Money Market Funds - 2.9% | |||
| Fidelity Cash Central Fund, 0.41% (k) | 55,146,566 | 55,163 | |
| Fidelity Securities Lending Cash Central Fund 0.48% (k)(l) | 1,535,027 | 1,535 | |
| TOTAL MONEY MARKET FUNDS | |||
| (Cost $56,698) | 56,698 | ||
| TOTAL INVESTMENT PORTFOLIO - 99.9% | |||
| (Cost $1,939,595) | 1,919,168 | ||
| NET OTHER ASSETS (LIABILITIES) - 0.1% | 1,020 | ||
| NET ASSETS - 100% | $1,920,188 |
Currency Abbreviations
CAD – Canadian dollar
Values shown as $0 may reflect amounts less than $500.
Legend
(a) Amount is stated in United States dollars unless otherwise noted.
(b) Security exempt from registration under Rule 144A of the Securities Act of 1933. These securities may be resold in transactions exempt from registration, normally to qualified institutional buyers. At the end of the period, the value of these securities amounted to $657,263,000 or 34.2% of net assets.
(c) Non-income producing - Security is in default.
(d) Coupon rates for floating and adjustable rate securities reflect the rates in effect at period end.
(e) Security or a portion of the security purchased on a delayed delivery or when-issued basis.
(f) Non-income producing
(g) Security or a portion of the security is on loan at period end.
(h) Restricted securities - Investment in securities not registered under the Securities Act of 1933 (excluding 144A issues). At the end of the period, the value of restricted securities (excluding 144A issues) amounted to $923,000 or 0.0% of net assets.
(i) The coupon rate will be determined upon settlement of the loan after period end.
(j) Security is perpetual in nature with no stated maturity date.
(k) Affiliated fund that is generally available only to investment companies and other accounts managed by Fidelity Investments. The rate quoted is the annualized seven-day yield of the fund at period end. A complete unaudited listing of the fund's holdings as of its most recent quarter end is available upon request. In addition, each Fidelity Central Fund's financial statements, which are not covered by the Fund's Report of Independent Registered Public Accounting Firm, are available on the SEC's website or upon request.
(l) Investment made with cash collateral received from securities on loan.
Additional information on each restricted holding is as follows:
| Security | Acquisition Date | Acquisition Cost (000s) |
| Arena Brands Holding Corp. Class B | 6/18/97 - 7/13/98 | $1,538 |
| Ovation Acquisition I LLC | 12/23/15 | $6 |
| Warrior Met Coal LLC Class A | 9/19/13 - 5/28/14 | $2,401 |
| WP Rocket Holdings, Inc. | 6/24/11 - 2/2/15 | $4,521 |
Affiliated Central Funds
Information regarding fiscal year to date income earned by the Fund from investments in Fidelity Central Funds is as follows:
| Fund | Income earned |
| (Amounts in thousands) | |
| Fidelity Cash Central Fund | $225 |
| Fidelity Securities Lending Cash Central Fund | 60 |
| Total | $285 |
Investment Valuation
The following is a summary of the inputs used, as of October 31, 2016, involving the Fund's assets and liabilities carried at fair value. The inputs or methodology used for valuing securities may not be an indication of the risk associated with investing in those securities. For more information on valuation inputs, and their aggregation into the levels used below, please refer to the Investment Valuation section in the accompanying Notes to Financial Statements.
| Valuation Inputs at Reporting Date: | ||||
| Description | Total | Level 1 | Level 2 | Level 3 |
| (Amounts in thousands) | ||||
| Investments in Securities: | ||||
| Equities: | ||||
| Consumer Discretionary | $97,151 | $96,129 | $-- | $1,022 |
| Consumer Staples | 11,935 | 11,935 | -- | -- |
| Energy | 26,986 | 26,671 | -- | 315 |
| Financials | 32,358 | 32,358 | -- | -- |
| Health Care | 52,092 | 46,784 | 5,045 | 263 |
| Industrials | 32,117 | 31,595 | -- | 522 |
| Information Technology | 79,825 | 79,825 | -- | -- |
| Materials | 19,581 | 19,581 | -- | -- |
| Real Estate | 5,942 | 5,942 | -- | -- |
| Telecommunication Services | 7,759 | 7,759 | -- | -- |
| Utilities | 16,847 | 16,847 | -- | -- |
| Corporate Bonds | 1,339,572 | -- | 1,339,562 | 10 |
| Bank Loan Obligations | 79,831 | -- | 79,096 | 735 |
| Preferred Securities | 60,474 | -- | 60,474 | -- |
| Money Market Funds | 56,698 | 56,698 | -- | -- |
| Total Investments in Securities: | $1,919,168 | $432,124 | $1,484,177 | $2,867 |
Other Information
Distribution of investments by country or territory of incorporation, as a percentage of Total Net Assets, is as follows (Unaudited):
| United States of America | 81.6% |
| Canada | 3.8% |
| Luxembourg | 3.4% |
| Netherlands | 2.8% |
| France | 2.0% |
| Ireland | 1.9% |
| United Kingdom | 1.4% |
| Others (Individually Less Than 1%) | 3.1% |
| 100.0% |
See accompanying notes which are an integral part of the financial statements.
Financial Statements
Statement of Assets and Liabilities
| Amounts in thousands (except per-share amounts) | October 31, 2016 | |
| Assets | ||
| Investment in securities, at value (including securities loaned of $1,492) — See accompanying schedule: Unaffiliated issuers (cost $1,882,897) | $1,862,470 | |
| Fidelity Central Funds (cost $56,698) | 56,698 | |
| Total Investments (cost $1,939,595) | $1,919,168 | |
| Cash | 1,212 | |
| Receivable for investments sold | 3,187 | |
| Receivable for fund shares sold | 1,797 | |
| Interest receivable | 25,854 | |
| Distributions receivable from Fidelity Central Funds | 16 | |
| Prepaid expenses | 5 | |
| Other receivables | 43 | |
| Total assets | 1,951,282 | |
| Liabilities | ||
| Payable for investments purchased | ||
| Regular delivery | $21,085 | |
| Delayed delivery | 1,355 | |
| Payable for fund shares redeemed | 4,688 | |
| Distributions payable | 755 | |
| Accrued management fee | 904 | |
| Distribution and service plan fees payable | 350 | |
| Other affiliated payables | 310 | |
| Other payables and accrued expenses | 124 | |
| Collateral on securities loaned, at value | 1,523 | |
| Total liabilities | 31,094 | |
| Net Assets | $1,920,188 | |
| Net Assets consist of: | ||
| Paid in capital | $2,380,635 | |
| Undistributed net investment income | 15,749 | |
| Accumulated undistributed net realized gain (loss) on investments | (455,769) | |
| Net unrealized appreciation (depreciation) on investments | (20,427) | |
| Net Assets | $1,920,188 | |
| Calculation of Maximum Offering Price | ||
| Class A: | ||
| Net Asset Value and redemption price per share ($593,438 ÷ 56,148 shares) | $10.57 | |
| Maximum offering price per share (100/96.00 of $10.57) | $11.01 | |
| Class T: | ||
| Net Asset Value and redemption price per share ($408,709 ÷ 38,457 shares) | $10.63 | |
| Maximum offering price per share (100/96.00 of $10.63) | $11.07 | |
| Class C: | ||
| Net Asset Value and offering price per share ($163,409 ÷ 15,489 shares)(a) | $10.55 | |
| Class I: | ||
| Net Asset Value, offering price and redemption price per share ($754,632 ÷ 76,123 shares) | $9.91 |
(a) Redemption price per share is equal to net asset value less any applicable contingent deferred sales charge.
See accompanying notes which are an integral part of the financial statements.
Statement of Operations
| Amounts in thousands | Year ended October 31, 2016 | |
| Investment Income | ||
| Dividends | $9,342 | |
| Interest | 103,142 | |
| Income from Fidelity Central Funds | 285 | |
| Total income | 112,769 | |
| Expenses | ||
| Management fee | $10,579 | |
| Transfer agent fees | 3,085 | |
| Distribution and service plan fees | 4,120 | |
| Accounting and security lending fees | 627 | |
| Custodian fees and expenses | 30 | |
| Independent trustees' fees and expenses | 8 | |
| Registration fees | 110 | |
| Audit | 88 | |
| Legal | 285 | |
| Miscellaneous | 99 | |
| Total expenses before reductions | 19,031 | |
| Expense reductions | (18) | 19,013 |
| Net investment income (loss) | 93,756 | |
| Realized and Unrealized Gain (Loss) | ||
| Net realized gain (loss) on: | ||
| Investment securities: | ||
| Unaffiliated issuers | 3,643 | |
| Fidelity Central Funds | 24 | |
| Total net realized gain (loss) | 3,667 | |
| Change in net unrealized appreciation (depreciation) on investment securities | 14,257 | |
| Net gain (loss) | 17,924 | |
| Net increase (decrease) in net assets resulting from operations | $111,680 |
See accompanying notes which are an integral part of the financial statements.
Statement of Changes in Net Assets
| Amounts in thousands | Year ended October 31, 2016 | Year ended October 31, 2015 |
| Increase (Decrease) in Net Assets | ||
| Operations | ||
| Net investment income (loss) | $93,756 | $95,506 |
| Net realized gain (loss) | 3,667 | 15,865 |
| Change in net unrealized appreciation (depreciation) | 14,257 | (110,355) |
| Net increase (decrease) in net assets resulting from operations | 111,680 | 1,016 |
| Distributions to shareholders from net investment income | (90,997) | (86,700) |
| Distributions to shareholders from net realized gain | – | (1,926) |
| Total distributions | (90,997) | (88,626) |
| Share transactions - net increase (decrease) | (118,006) | 68,469 |
| Redemption fees | 208 | 343 |
| Total increase (decrease) in net assets | (97,115) | (18,798) |
| Net Assets | ||
| Beginning of period | 2,017,303 | 2,036,101 |
| End of period | $1,920,188 | $2,017,303 |
| Other Information | ||
| Undistributed net investment income end of period | $15,749 | $13,842 |
See accompanying notes which are an integral part of the financial statements.
Financial Highlights — Fidelity Advisor High Income Advantage Fund Class A
| Years ended October 31, | 2016 | 2015 | 2014 | 2013 | 2012 |
| Selected Per–Share Data | |||||
| Net asset value, beginning of period | $10.43 | $10.88 | $10.73 | $10.21 | $9.59 |
| Income from Investment Operations | |||||
| Net investment income (loss)A | .501 | .498 | .480 | .569 | .607 |
| Net realized and unrealized gain (loss) | .123 | (.489) | .236 | .558 | .658 |
| Total from investment operations | .624 | .009 | .716 | 1.127 | 1.265 |
| Distributions from net investment income | (.485) | (.451) | (.449) | (.482) | (.647) |
| Distributions from net realized gain | – | (.010) | (.118) | (.127) | – |
| Total distributions | (.485) | (.461) | (.567) | (.609) | (.647) |
| Redemption fees added to paid in capitalA | .001 | .002 | .001 | .002 | .002 |
| Net asset value, end of period | $10.57 | $10.43 | $10.88 | $10.73 | $10.21 |
| Total ReturnB,C | 6.30% | .06% | 6.84% | 11.39% | 13.78% |
| Ratios to Average Net AssetsD,E | |||||
| Expenses before reductions | 1.04% | 1.02% | 1.02% | 1.02% | 1.03% |
| Expenses net of fee waivers, if any | 1.03% | 1.02% | 1.02% | 1.02% | 1.03% |
| Expenses net of all reductions | 1.03% | 1.02% | 1.02% | 1.02% | 1.03% |
| Net investment income (loss) | 4.94% | 4.62% | 4.42% | 5.42% | 6.18% |
| Supplemental Data | |||||
| Net assets, end of period (in millions) | $593 | $636 | $682 | $698 | $705 |
| Portfolio turnover rateF | 46% | 42% | 41% | 66% | 66% |
A Calculated based on average shares outstanding during the period.
B Total returns would have been lower if certain expenses had not been reduced during the applicable periods shown.
C Total returns do not include the effect of the sales charges.
D Fees and expenses of any underlying Fidelity Central Funds are not included in the Fund's expense ratio. The Fund indirectly bears its proportionate share of the expenses of any underlying Fidelity Central Funds.
E Expense ratios reflect operating expenses of the class. Expenses before reductions do not reflect amounts reimbursed by the investment adviser or reductions from brokerage service arrangements or reductions from other expense offset arrangements and do not represent the amount paid by the class during periods when reimbursements or reductions occur. Expenses net of fee waivers reflect expenses after reimbursement by the investment adviser but prior to reductions from brokerage service arrangements or other expense offset arrangements. Expenses net of all reductions represent the net expenses paid by the class.
F Amount does not include the portfolio activity of any underlying Fidelity Central Funds.
See accompanying notes which are an integral part of the financial statements.
Financial Highlights — Fidelity Advisor High Income Advantage Fund Class T
| Years ended October 31, | 2016 | 2015 | 2014 | 2013 | 2012 |
| Selected Per–Share Data | |||||
| Net asset value, beginning of period | $10.49 | $10.93 | $10.78 | $10.26 | $9.64 |
| Income from Investment Operations | |||||
| Net investment income (loss)A | .505 | .501 | .484 | .573 | .610 |
| Net realized and unrealized gain (loss) | .123 | (.479) | .233 | .555 | .656 |
| Total from investment operations | .628 | .022 | .717 | 1.128 | 1.266 |
| Distributions from net investment income | (.489) | (.454) | (.450) | (.483) | (.648) |
| Distributions from net realized gain | – | (.010) | (.118) | (.127) | – |
| Total distributions | (.489) | (.464) | (.568) | (.610) | (.648) |
| Redemption fees added to paid in capitalA | .001 | .002 | .001 | .002 | .002 |
| Net asset value, end of period | $10.63 | $10.49 | $10.93 | $10.78 | $10.26 |
| Total ReturnB,C | 6.30% | .18% | 6.81% | 11.34% | 13.72% |
| Ratios to Average Net AssetsD,E | |||||
| Expenses before reductions | 1.03% | 1.02% | 1.01% | 1.01% | 1.02% |
| Expenses net of fee waivers, if any | 1.03% | 1.02% | 1.01% | 1.01% | 1.02% |
| Expenses net of all reductions | 1.03% | 1.02% | 1.01% | 1.01% | 1.02% |
| Net investment income (loss) | 4.95% | 4.63% | 4.43% | 5.43% | 6.19% |
| Supplemental Data | |||||
| Net assets, end of period (in millions) | $409 | $445 | $504 | $528 | $547 |
| Portfolio turnover rateF | 46% | 42% | 41% | 66% | 66% |
A Calculated based on average shares outstanding during the period.
B Total returns would have been lower if certain expenses had not been reduced during the applicable periods shown.
C Total returns do not include the effect of the sales charges.
D Fees and expenses of any underlying Fidelity Central Funds are not included in the Fund's expense ratio. The Fund indirectly bears its proportionate share of the expenses of any underlying Fidelity Central Funds.
E Expense ratios reflect operating expenses of the class. Expenses before reductions do not reflect amounts reimbursed by the investment adviser or reductions from brokerage service arrangements or reductions from other expense offset arrangements and do not represent the amount paid by the class during periods when reimbursements or reductions occur. Expenses net of fee waivers reflect expenses after reimbursement by the investment adviser but prior to reductions from brokerage service arrangements or other expense offset arrangements. Expenses net of all reductions represent the net expenses paid by the class.
F Amount does not include the portfolio activity of any underlying Fidelity Central Funds.
See accompanying notes which are an integral part of the financial statements.
Financial Highlights — Fidelity Advisor High Income Advantage Fund Class C
| Years ended October 31, | 2016 | 2015 | 2014 | 2013 | 2012 |
| Selected Per–Share Data | |||||
| Net asset value, beginning of period | $10.41 | $10.86 | $10.71 | $10.19 | $9.58 |
| Income from Investment Operations | |||||
| Net investment income (loss)A | .424 | .415 | .398 | .489 | .533 |
| Net realized and unrealized gain (loss) | .122 | (.488) | .237 | .560 | .649 |
| Total from investment operations | .546 | (.073) | .635 | 1.049 | 1.182 |
| Distributions from net investment income | (.407) | (.369) | (.368) | (.404) | (.574) |
| Distributions from net realized gain | – | (.010) | (.118) | (.127) | – |
| Total distributions | (.407) | (.379) | (.486) | (.531) | (.574) |
| Redemption fees added to paid in capitalA | .001 | .002 | .001 | .002 | .002 |
| Net asset value, end of period | $10.55 | $10.41 | $10.86 | $10.71 | $10.19 |
| Total ReturnB,C | 5.51% | (.70)% | 6.05% | 10.58% | 12.85% |
| Ratios to Average Net AssetsD,E | |||||
| Expenses before reductions | 1.79% | 1.78% | 1.77% | 1.77% | 1.78% |
| Expenses net of fee waivers, if any | 1.79% | 1.78% | 1.77% | 1.77% | 1.78% |
| Expenses net of all reductions | 1.79% | 1.78% | 1.77% | 1.77% | 1.77% |
| Net investment income (loss) | 4.18% | 3.86% | 3.67% | 4.67% | 5.44% |
| Supplemental Data | |||||
| Net assets, end of period (in millions) | $163 | $171 | $182 | $183 | $180 |
| Portfolio turnover rateF | 46% | 42% | 41% | 66% | 66% |
A Calculated based on average shares outstanding during the period.
B Total returns would have been lower if certain expenses had not been reduced during the applicable periods shown.
C Total returns do not include the effect of the contingent deferred sales charge.
D Fees and expenses of any underlying Fidelity Central Funds are not included in the Fund's expense ratio. The Fund indirectly bears its proportionate share of the expenses of any underlying Fidelity Central Funds.
E Expense ratios reflect operating expenses of the class. Expenses before reductions do not reflect amounts reimbursed by the investment adviser or reductions from brokerage service arrangements or reductions from other expense offset arrangements and do not represent the amount paid by the class during periods when reimbursements or reductions occur. Expenses net of fee waivers reflect expenses after reimbursement by the investment adviser but prior to reductions from brokerage service arrangements or other expense offset arrangements. Expenses net of all reductions represent the net expenses paid by the class.
F Amount does not include the portfolio activity of any underlying Fidelity Central Funds.
See accompanying notes which are an integral part of the financial statements.
Financial Highlights — Fidelity Advisor High Income Advantage Fund Class I
| Years ended October 31, | 2016 | 2015 | 2014 | 2013 | 2012 |
| Selected Per–Share Data | |||||
| Net asset value, beginning of period | $9.78 | $10.20 | $10.10 | $9.65 | $9.10 |
| Income from Investment Operations | |||||
| Net investment income (loss)A | .493 | .488 | .474 | .561 | .598 |
| Net realized and unrealized gain (loss) | .113 | (.455) | .216 | .524 | .623 |
| Total from investment operations | .606 | .033 | .690 | 1.085 | 1.221 |
| Distributions from net investment income | (.477) | (.445) | (.473) | (.510) | (.673) |
| Distributions from net realized gain | – | (.010) | (.118) | (.127) | – |
| Total distributions | (.477) | (.455) | (.591) | (.637) | (.673) |
| Redemption fees added to paid in capitalA | .001 | .002 | .001 | .002 | .002 |
| Net asset value, end of period | $9.91 | $9.78 | $10.20 | $10.10 | $9.65 |
| Total ReturnB | 6.54% | .31% | 7.02% | 11.63% | 14.07% |
| Ratios to Average Net AssetsC,D | |||||
| Expenses before reductions | .80% | .80% | .78% | .77% | .78% |
| Expenses net of fee waivers, if any | .80% | .80% | .78% | .77% | .78% |
| Expenses net of all reductions | .80% | .80% | .78% | .77% | .78% |
| Net investment income (loss) | 5.17% | 4.84% | 4.66% | 5.68% | 6.44% |
| Supplemental Data | |||||
| Net assets, end of period (in millions) | $755 | $760 | $658 | $497 | $495 |
| Portfolio turnover rateE | 46% | 42% | 41% | 66% | 66% |
A Calculated based on average shares outstanding during the period.
B Total returns would have been lower if certain expenses had not been reduced during the applicable periods shown.
C Fees and expenses of any underlying Fidelity Central Funds are not included in the Fund's expense ratio. The Fund indirectly bears its proportionate share of the expenses of any underlying Fidelity Central Funds.
D Expense ratios reflect operating expenses of the class. Expenses before reductions do not reflect amounts reimbursed by the investment adviser or reductions from brokerage service arrangements or reductions from other expense offset arrangements and do not represent the amount paid by the class during periods when reimbursements or reductions occur. Expenses net of fee waivers reflect expenses after reimbursement by the investment adviser but prior to reductions from brokerage service arrangements or other expense offset arrangements. Expenses net of all reductions represent the net expenses paid by the class.
E Amount does not include the portfolio activity of any underlying Fidelity Central Funds.
See accompanying notes which are an integral part of the financial statements.
Notes to Financial Statements
For the period ended October 31, 2016
(Amounts in thousands except percentages)
1. Organization.
Fidelity Advisor High Income Advantage Fund (the Fund) is a fund of Fidelity Advisor Series I (the Trust) and is authorized to issue an unlimited number of shares. The Trust is registered under the Investment Company Act of 1940, as amended (the 1940 Act), as an open-end management investment company organized as a Massachusetts business trust. The Fund offers Class A, Class T, Class C and Class I shares, each of which has equal rights as to assets and voting privileges. Each class has exclusive voting rights with respect to matters that affect that class.
After the close of business on June 24, 2016, all outstanding Class B shares were converted to Class A shares. All current fiscal period dollar and share amounts for Class B presented in the Notes to Financial Statements are for the period November 1, 2015 through June 24, 2016.
2. Investments in Fidelity Central Funds.
The Fund invests in Fidelity Central Funds, which are open-end investment companies generally available only to other investment companies and accounts managed by the investment adviser and its affiliates. The Fund's Schedule of Investments lists each of the Fidelity Central Funds held as of period end, if any, as an investment of the Fund, but does not include the underlying holdings of each Fidelity Central Fund. As an Investing Fund, the Fund indirectly bears its proportionate share of the expenses of the underlying Fidelity Central Funds.
The Money Market Central Funds seek preservation of capital and current income and are managed by Fidelity Investments Money Management, Inc. (FIMM), an affiliate of the investment adviser. Annualized expenses of the Money Market Central Funds as of their most recent shareholder report date are less than .005%.
A complete unaudited list of holdings for each Fidelity Central Fund is available upon request or at the Securities and Exchange Commission (the SEC) website at www.sec.gov. In addition, the financial statements of the Fidelity Central Funds, which are not covered by the Fund's Report of Independent Registered Public Accounting Firm, are available on the SEC website or upon request.
3. Significant Accounting Policies.
The financial statements have been prepared in conformity with accounting principles generally accepted in the United States of America (GAAP), which require management to make certain estimates and assumptions at the date of the financial statements. Actual results could differ from those estimates. Subsequent events, if any, through the date that the financial statements were issued have been evaluated in the preparation of the financial statements. The following summarizes the significant accounting policies of the Fund:
Investment Valuation. Investments are valued as of 4:00 p.m. Eastern time on the last calendar day of the period. The Board of Trustees (the Board) has delegated the day to day responsibility for the valuation of the Fund's investments to the Fair Value Committee (the Committee) established by the Fund's investment adviser. In accordance with valuation policies and procedures approved by the Board, the Fund attempts to obtain prices from one or more third party pricing vendors or brokers to value its investments. When current market prices, quotations or currency exchange rates are not readily available or reliable, investments will be fair valued in good faith by the Committee, in accordance with procedures adopted by the Board. Factors used in determining fair value vary by investment type and may include market or investment specific events, changes in interest rates and credit quality. The frequency with which these procedures are used cannot be predicted and they may be utilized to a significant extent. The Committee oversees the Fund's valuation policies and procedures and reports to the Board on the Committee's activities and fair value determinations. The Board monitors the appropriateness of the procedures used in valuing the Fund's investments and ratifies the fair value determinations of the Committee.
The Fund categorizes the inputs to valuation techniques used to value its investments into a disclosure hierarchy consisting of three levels as shown below:
- Level 1 – quoted prices in active markets for identical investments
- Level 2 – other significant observable inputs (including quoted prices for similar investments, interest rates, prepayment speeds, etc.)
- Level 3 – unobservable inputs (including the Fund's own assumptions based on the best information available)
Valuation techniques used to value the Fund's investments by major category are as follows:
Debt securities, including restricted securities, are valued based on evaluated prices received from third party pricing vendors or from brokers who make markets in such securities. Corporate bonds, bank loan obligations and preferred securities are valued by pricing vendors who utilize matrix pricing which considers yield or price of bonds of comparable quality, coupon, maturity and type or by broker-supplied prices. When independent prices are unavailable or unreliable, debt securities may be valued utilizing pricing methodologies which consider similar factors that would be used by third party pricing vendors. Debt securities are generally categorized as Level 2 in the hierarchy but may be Level 3 depending on the circumstances. The Fund invests a significant portion of its assets in below investment grade securities. The value of these securities can be more volatile due to changes in the credit quality of the issuer and is sensitive to changes in economic, market and regulatory conditions.
Equity securities, including restricted securities, for which market quotations are readily available, are valued at the last reported sale price or official closing price as reported by a third party pricing vendor on the primary market or exchange on which they are traded and are categorized as Level 1 in the hierarchy. In the event there were no sales during the day or closing prices are not available, securities are valued at the last quoted bid price or may be valued using the last available price and are generally categorized as Level 2 in the hierarchy. For foreign equity securities, when market or security specific events arise, comparisons to the valuation of American Depositary Receipts (ADRs), futures contracts, Exchange-Traded Funds (ETFs) and certain indexes as well as quoted prices for similar securities may be used and would be categorized as Level 2 in the hierarchy. Utilizing these techniques may result in transfers between Level 1 and Level 2. For equity securities, including restricted securities, where observable inputs are limited, assumptions about market activity and risk are used and these securities may be categorized as Level 3 in the hierarchy. The Fund invests a significant portion of its assets in below investment grade securities.
Investments in open-end mutual funds, including the Fidelity Central Funds, are valued at their closing net asset value (NAV) each business day and are categorized as Level 1 in the hierarchy.
Changes in valuation techniques may result in transfers in or out of an assigned level within the disclosure hierarchy. The aggregate value of investments by input level as of October 31, 2016 is included at the end of the Fund's Schedule of Investments.
Investment Transactions and Income. For financial reporting purposes, the Fund's investment holdings and NAV include trades executed through the end of the last business day of the period. The NAV per share for processing shareholder transactions is calculated as of the close of business of the New York Stock Exchange (NYSE), normally 4:00 p.m. Eastern time and includes trades executed through the end of the prior business day. Gains and losses on securities sold are determined on the basis of identified cost. Dividend income is recorded on the ex-dividend date, except for certain dividends from foreign securities where the ex-dividend date may have passed, which are recorded as soon as the Fund is informed of the ex-dividend date. Non-cash dividends included in dividend income, if any, are recorded at the fair market value of the securities received. Income and capital gain distributions from Fidelity Central Funds, if any, are recorded on the ex-dividend date. Distributions received on securities that represent a return of capital or capital gain are recorded as a reduction of cost of investments and/or as a realized gain. Subsequent to ex-dividend date the Fund determines the components of these distributions, based upon receipt of tax filings or other correspondence relating to the underlying investment. Interest income is accrued as earned and includes coupon interest and amortization of premium and accretion of discount on debt securities as applicable. Debt obligations may be placed on non-accrual status and related interest income may be reduced by ceasing current accruals and writing off interest receivables when the collection of all or a portion of interest has become doubtful based on consistently applied procedures. A debt obligation is removed from non-accrual status when the issuer resumes interest payments or when collectability of interest is reasonably assured.
Class Allocations and Expenses. Investment income, realized and unrealized capital gains and losses, common expenses of the Fund, and certain fund-level expense reductions, if any, are allocated daily on a pro-rata basis to each class based on the relative net assets of each class to the total net assets of the Fund. Each class differs with respect to transfer agent and distribution and service plan fees incurred. Certain expense reductions may also differ by class. For the reporting period, the allocated portion of income and expenses to each class as a percent of its average net assets may vary due to the timing of recording these transactions in relation to fluctuating net assets of the classes. Expenses directly attributable to a fund are charged to that fund. Expenses attributable to more than one fund are allocated among the respective funds on the basis of relative net assets or other appropriate methods. Expense estimates are accrued in the period to which they relate and adjustments are made when actual amounts are known.
Deferred Trustee Compensation. Under a Deferred Compensation Plan (the Plan), independent Trustees may elect to defer receipt of a portion of their annual compensation. Deferred amounts are invested in a cross-section of Fidelity funds, are marked-to-market and remain in the Fund until distributed in accordance with the Plan. The investment of deferred amounts and the offsetting payable to the Trustees are included in the accompanying Statement of Assets and Liabilities.
Income Tax Information and Distributions to Shareholders. Each year, the Fund intends to qualify as a regulated investment company under Subchapter M of the Internal Revenue Code, including distributing substantially all of its taxable income and realized gains. As a result, no provision for U.S. Federal income taxes is required. As of October 31, 2016, the Fund did not have any unrecognized tax benefits in the financial statements; nor is the Fund aware of any tax positions for which it is reasonably possible that the total amounts of unrecognized tax benefits will significantly change in the next twelve months. The Fund files a U.S. federal tax return, in addition to state and local tax returns as required. The Fund's federal income tax returns are subject to examination by the Internal Revenue Service (IRS) for a period of three fiscal years after they are filed. State and local tax returns may be subject to examination for an additional fiscal year depending on the jurisdiction.
Dividends are declared and recorded daily and paid monthly from net investment income. Distributions from realized gains, if any, are declared and recorded on the ex-dividend date. Income dividends and capital gain distributions are declared separately for each class. Income and capital gain distributions are determined in accordance with income tax regulations, which may differ from GAAP.
Capital accounts within the financial statements are adjusted for permanent book-tax differences. These adjustments have no impact on net assets or the results of operations. Capital accounts are not adjusted for temporary book-tax differences which will reverse in a subsequent period.
Book-tax differences are primarily due to equity-debt classifications, market discount, partnerships, deferred trustees compensation, capital loss carryforwards and losses deferred due to wash sales.
The federal tax cost of investment securities and unrealized appreciation (depreciation) as of period end were as follows:
| Gross unrealized appreciation | $130,833 |
| Gross unrealized depreciation | (141,112) |
| Net unrealized appreciation (depreciation) on securities | $(10,279) |
| Tax Cost | $1,929,447 |
The tax-based components of distributable earnings as of period end were as follows:
| Undistributed ordinary income | $5,850 |
| Capital loss carryforward | $(455,851) |
| Net unrealized appreciation (depreciation) on securities and other investments | $(10,279) |
Capital loss carryforwards are only available to offset future capital gains of the Fund to the extent provided by regulations and may be limited. Under the Regulated Investment Company Modernization Act of 2010 (the Act), the Fund is permitted to carry forward capital losses incurred in taxable years beginning after December 22, 2010 for an unlimited period and such capital losses are required to be used prior to any losses that expire. The capital loss carryforward information presented below, including any applicable limitation, is estimated as of fiscal period end and is subject to adjustment.
| Fiscal year of expiration | |
| 2017 | $(455,851) |
The tax character of distributions paid was as follows:
| October 31, 2016 | October 31, 2015 | |
| Ordinary Income | $90,997 | $ 88,626 |
Short-Term Trading (Redemption) Fees. Shares held by investors in the Fund less than 90 days may have been subject to a redemption fee equal to 1.00% of the NAV of shares redeemed. All redemption fees, which reduce the proceeds of the shareholder redemption, are retained by the Fund and accounted for as an addition to paid in capital.
Delayed Delivery Transactions and When-Issued Securities. During the period, the Fund transacted in securities on a delayed delivery or when-issued basis. Payment and delivery may take place after the customary settlement period for that security. The price of the underlying securities and the date when the securities will be delivered and paid for are fixed at the time the transaction is negotiated. The securities purchased on a delayed delivery or when-issued basis are identified as such in the Fund's Schedule of Investments. The Fund may receive compensation for interest forgone in the purchase of a delayed delivery or when-issued security. With respect to purchase commitments, the Fund identifies securities as segregated in its records with a value at least equal to the amount of the commitment. Losses may arise due to changes in the value of the underlying securities or if the counterparty does not perform under the contract's terms, or if the issuer does not issue the securities due to political, economic, or other factors.
Restricted Securities. The Fund may invest in securities that are subject to legal or contractual restrictions on resale. These securities generally may be resold in transactions exempt from registration or to the public if the securities are registered. Disposal of these securities may involve time-consuming negotiations and expense, and prompt sale at an acceptable price may be difficult. Information regarding restricted securities is included at the end of the Fund's Schedule of Investments.
Loans and Other Direct Debt Instruments. The Fund invests in direct debt instruments which are interests in amounts owed to lenders by corporate or other borrowers. These instruments may be in the form of loans, trade claims or other receivables and may include standby financing commitments such as revolving credit facilities that obligate the Fund to supply additional cash to the borrower on demand. Loans may be acquired through assignment or participation, or may be made directly to a borrower. The Fund did not have any unfunded loan commitments, which are contractual obligations for future funding, at period end.
4. Purchases and Sales of Investments.
Purchases and sales of securities, other than short-term securities, aggregated $834,424 and $893,648, respectively.
5. Fees and Other Transactions with Affiliates.
Management Fee. Fidelity Management & Research Company (the investment adviser) and its affiliates provide the Fund with investment management related services for which the Fund pays a monthly management fee. The management fee is the sum of an individual fund fee rate that is based on an annual rate of .45% of the Fund's average net assets and an annualized group fee rate that averaged .11% during the period. The group fee rate is based upon the average net assets of all the mutual funds advised by the investment adviser, including any mutual funds previously advised by the investment adviser that are currently advised by Fidelity SelectCo, LLC, an affiliate of the investment adviser. The group fee rate decreases as assets under management increase and increases as assets under management decrease. For the reporting period, the total annual management fee rate was .56% of the Fund's average net assets.
Distribution and Service Plan Fees. In accordance with Rule 12b-1 of the 1940 Act, the Fund has adopted separate Distribution and Service Plans for each class of shares. Certain classes pay Fidelity Distributors Corporation (FDC), an affiliate of the investment adviser, separate Distribution and Service Fees, each of which is based on an annual percentage of each class' average net assets. In addition, FDC may pay financial intermediaries for selling shares of the Fund and providing shareholder support services. For the period, the Distribution and Service Fee rates, total fees and amounts retained by FDC were as follows:
| Distribution Fee | Service Fee | Total Fees | Retained by FDC |
|
| Class A | -% | .25% | $1,477 | $12 |
| Class T | -% | .25% | 1,018 | – |
| Class B | .65% | .25% | 23 | 17 |
| Class C | .75% | .25% | 1,602 | 170 |
| $4,120 | $199 |
Sales Load. FDC may receive a front-end sales charge of up to 4.00% for selling Class A shares and Class T shares, some of which is paid to financial intermediaries for selling shares of the Fund. Depending on the holding period, FDC may receive contingent deferred sales charges levied on Class A, Class T, Class B, and Class C redemptions. The deferred sales charges range from 5.00% to 1.00% for Class B shares, 1.00% for Class C shares, 1.00% for certain purchases of Class A shares and .25% for certain purchases of Class T shares.
For the period, sales charge amounts retained by FDC were as follows:
| Retained by FDC |
|
| Class A | $36 |
| Class T | 12 |
| Class B(a) | 1 |
| Class C(a) | 15 |
| $64 |
(a) When Class B and Class C shares are initially sold, FDC pays commissions from its own resources to financial intermediaries through which the sales are made.
Transfer Agent Fees. Fidelity Investments Institutional Operations Company, Inc., (FIIOC), an affiliate of the investment adviser, is the transfer, dividend disbursing and shareholder servicing agent for each class of the Fund. FIIOC receives account fees and asset-based fees that vary according to the account size and type of account of the shareholders of the respective classes of the Fund. FIIOC pays for typesetting, printing and mailing of shareholder reports, except proxy statements.
For the period, transfer agent fees for each class were as follows:
| Amount | % of Class-Level Average Net Assets |
|
| Class A | $939 | .16 |
| Class T | 617 | .15 |
| Class B | 6 | .22 |
| Class C | 268 | .17 |
| Class I | 1,255 | .17 |
| $3,085 |
Accounting and Security Lending Fees. Fidelity Service Company, Inc. (FSC), an affiliate of the investment adviser, maintains the Fund's accounting records. The accounting fee is based on the level of average net assets for each month. Under a separate contract, FSC administers the security lending program. The security lending fee is based on the number and duration of lending transactions.
Brokerage Commissions. The Fund placed a portion of its portfolio transactions with brokerage firms which are affiliates of the investment adviser. Brokerage commissions are included in net realized gain (loss) and change in net unrealized appreciation (depreciation) in the Statement of Operations. The commissions paid to these affiliated firms were $6 for the period.
Interfund Trades. The Fund may purchase from or sell securities to other Fidelity Funds under procedures adopted by the Board. The procedures have been designed to ensure these interfund trades are executed in accordance with Rule 17a-7 of the 1940 Act. Interfund trades are included within the respective purchases and sales amounts shown in the Purchases and Sales of Investments note.
Other. During the period, the investment adviser reimbursed the Fund for certain losses in the amount of $2.
6. Committed Line of Credit.
The Fund participates with other funds managed by the investment adviser or an affiliate in a $4.25 billion credit facility (the "line of credit") to be utilized for temporary or emergency purposes to fund shareholder redemptions or for other short-term liquidity purposes. The Fund has agreed to pay commitment fees on its pro-rata portion of the line of credit, which amounted to $5 and is reflected in Miscellaneous expenses on the Statement of Operations. During the period, the Fund did not borrow on this line of credit.
7. Security Lending.
The Fund lends portfolio securities through a lending agent from time to time in order to earn additional income. For equity securities, a lending agent is used and may loan securities to certain qualified borrowers, including Fidelity Capital Markets (FCM), a broker-dealer affiliated with the Fund. On the settlement date of the loan, the Fund receives collateral (in the form of U.S. Treasury obligations, letters of credit and/or cash) against the loaned securities and maintains collateral in an amount not less than 100% of the market value of the loaned securities during the period of the loan. The market value of the loaned securities is determined at the close of business of the Fund and any additional required collateral is delivered to the Fund on the next business day. The Fund or borrower may terminate the loan at any time, and if the borrower defaults on its obligation to return the securities loaned because of insolvency or other reasons, the Fund may apply collateral received from the borrower against the obligation. The Fund may experience delays and costs in recovering the securities loaned. Any cash collateral received is invested in the Fidelity Securities Lending Cash Central Fund. The value of loaned securities and cash collateral at period end are disclosed on the Fund's Statement of Assets and Liabilities. At period end, there were no security loans outstanding with FCM. Security lending income represents the income earned on investing cash collateral, less rebates paid to borrowers and any lending agent fees associated with the loan, plus any premium payments received for lending certain types of securities. Security lending income is presented in the Statement of Operations as a component of income from Fidelity Central Funds. Total security lending income during the period amounted to $60, including $8 from securities loaned to FCM.
8. Expense Reductions.
Commissions paid to certain brokers with whom the investment adviser, or its affiliates, places trades on behalf of the Fund include an amount in addition to trade execution, which may be rebated back to the Fund to offset certain expenses. This amount totaled $9 for the period.
In addition, through arrangements with the Fund's custodian, credits realized as a result of certain uninvested cash balances were used to reduce the Fund's expenses. During the period, these credits reduced the Fund's custody expenses by $1.
In addition, during the period the investment adviser reimbursed and/or waived a portion of fund-level operating expenses in the amount of $8.
9. Distributions to Shareholders.
Distributions to shareholders of each class were as follows:
| Year ended October 31, 2016 | Year ended October 31, 2015 | |
| From net investment income | ||
| Class A | $28,391 | $27,809 |
| Class T | 19,580 | 20,007 |
| Class B | 118 | 265 |
| Class C | 6,453 | 6,079 |
| Class I | 36,455 | 32,540 |
| Total | $90,997 | $86,700 |
| From net realized gain | ||
| Class A | $– | $630 |
| Class T | – | 458 |
| Class B | – | 9 |
| Class C | – | 167 |
| Class I | – | 662 |
| Total | $– | $1,926 |
10. Share Transactions.
Share transactions for each class were as follows and may contain automatic conversions between classes or exchanges between affiliated funds:
| Shares | Shares | Dollars | Dollars | |
| Year ended October 31, 2016 | Year ended October 31, 2015 | Year ended October 31, 2016 | Year ended October 31, 2015 | |
| Class A | ||||
| Shares sold | 9,360 | 13,637 | $94,401 | $146,591 |
| Reinvestment of distributions | 2,518 | 2,345 | 25,499 | 25,207 |
| Shares redeemed | (16,751) | (17,660) | (168,555) | (189,628) |
| Net increase (decrease) | (4,873) | (1,678) | $(48,655) | $(17,830) |
| Class T | ||||
| Shares sold | 3,913 | 4,987 | $39,586 | $54,065 |
| Reinvestment of distributions | 1,744 | 1,726 | 17,764 | 18,651 |
| Shares redeemed | (9,602) | (10,408) | (97,166) | (112,520) |
| Net increase (decrease) | (3,945) | (3,695) | $(39,816) | $(39,804) |
| Class B | ||||
| Shares sold | 19 | 18 | $187 | $200 |
| Reinvestment of distributions | 10 | 22 | 96 | 234 |
| Shares redeemed | (540) | (488) | (5,385) | (5,254) |
| Net increase (decrease) | (511) | (448) | $(5,102) | $(4,820) |
| Class C | ||||
| Shares sold | 2,518 | 2,655 | $25,316 | $28,533 |
| Reinvestment of distributions | 522 | 472 | 5,276 | 5,065 |
| Shares redeemed | (3,959) | (3,512) | (39,782) | (37,654) |
| Net increase (decrease) | (919) | (385) | $(9,190) | $(4,056) |
| Class I | ||||
| Shares sold | 23,291 | 25,240 | $220,365 | $255,522 |
| Reinvestment of distributions | 3,361 | 2,884 | 31,960 | 29,047 |
| Shares redeemed | (28,260) | (14,854) | (267,568) | (149,590) |
| Net increase (decrease) | (1,608) | 13,270 | $(15,243) | $134,979 |
11. Other.
The Fund's organizational documents provide former and current trustees and officers with a limited indemnification against liabilities arising in connection with the performance of their duties to the Fund. In the normal course of business, the Fund may also enter into contracts that provide general indemnifications. The Fund's maximum exposure under these arrangements is unknown as this would be dependent on future claims that may be made against the Fund. The risk of material loss from such claims is considered remote.
At the end of the period, Strategic Advisers Income Opportunities Fund was the owner of record of approximately 15% of the total outstanding shares of the Fund.
12. Litigation.
The Fund, and other entities managed by FMR or its affiliates, became aware in March 2015 that they were named as defendants in a lawsuit originally filed in the United States Bankruptcy Court for the Southern District of New York in 2009. The lawsuit was brought by creditors of Motors Liquidation Company (f/k/a General Motors), which went through Chapter 11 bankruptcy proceedings in 2009, and is captioned Official Committee of Unsecured Creditors of Motors Liquidation Company v. JPMorgan Chase Bank, N.A., et al., Adversary No. 09-00504 (REG). The plaintiffs are seeking an order that the Fund and other defendants return proceeds received in 2009 in full payment of the principal and interest on General Motors secured debt. The plaintiffs contend that the Fund and the other defendants were not secured creditors at the time of the 2009 payments and, thus, were not entitled to payment in full. In January 2015, the Court of Appeals ruled that JPMorgan, as administrative agent for all of the debtholders, released the security interest on certain collateral securing the debt prior to the 2009 payments. The parties to the dispute have commenced discovery on the value of remaining, unreleased collateral. At this time, Management cannot determine the amount of loss that may be realized, but expects the amount to be less than the $5,769 received in 2009. The Fund was not previously aware that it had been named as a defendant in this case because, in 2009, the Bankruptcy Court allowed the plaintiffs to refrain from serving any of the defendants other than JPMorgan with notice of the filing of the lawsuit. The Fund will explore all available options for minimizing any loss to the Fund. The Fund will also incur legal costs in defending the case.
Report of Independent Registered Public Accounting Firm
To the Trustees of Fidelity Advisor Series I and Shareholders of Fidelity Advisor High Income Advantage Fund:
We have audited the accompanying statement of assets and liabilities of Fidelity Advisor High Income Advantage Fund (the Fund), a fund of Fidelity Advisor Series I, including the schedule of investments, as of October 31, 2016, and the related statement of operations for the year then ended, the statement of changes in net assets for each of the two years in the period then ended, and the financial highlights for each of the five years in the period then ended. These financial statements and financial highlights are the responsibility of the Fund's management. Our responsibility is to express an opinion on these financial statements and financial highlights based on our audits.
We conducted our audits in accordance with the standards of the Public Company Accounting Oversight Board (United States). Those standards require that we plan and perform the audit to obtain reasonable assurance about whether the financial statements and financial highlights are free of material misstatement. The Fund is not required to have, nor were we engaged to perform, an audit of its internal control over financial reporting. Our audits included consideration of internal control over financial reporting as a basis for designing audit procedures that are appropriate in the circumstances, but not for the purpose of expressing an opinion on the effectiveness of the Fund's internal control over financial reporting. Accordingly, we express no such opinion. An audit also includes examining, on a test basis, evidence supporting the amounts and disclosures in the financial statements, assessing the accounting principles used and significant estimates made by management, as well as evaluating the overall financial statement presentation. Our procedures included confirmation of securities owned as of October 31, 2016, by correspondence with the custodians, brokers, and agent banks; when replies were not received from brokers or agent banks, we performed other auditing procedures. We believe that our audits provide a reasonable basis for our opinion.
In our opinion, such financial statements and financial highlights referred to above present fairly, in all material respects, the financial position of Fidelity Advisor High Income Advantage Fund as of October 31, 2016, the results of its operations for the year then ended, the changes in its net assets for each of the two years in the period then ended, and the financial highlights for each of the five years in the period then ended, in conformity with accounting principles generally accepted in the United States of America.
DELOITTE & TOUCHE LLP
Boston, Massachusetts
December 15, 2016
Trustees and Officers
The Trustees, Members of the Advisory Board (if any), and officers of the trust and fund, as applicable, are listed below. The Board of Trustees governs the fund and is responsible for protecting the interests of shareholders. The Trustees are experienced executives who meet periodically throughout the year to oversee the fund's activities, review contractual arrangements with companies that provide services to the fund, oversee management of the risks associated with such activities and contractual arrangements, and review the fund's performance. Each of the Trustees oversees 170 funds.
The Trustees hold office without limit in time except that (a) any Trustee may resign; (b) any Trustee may be removed by written instrument, signed by at least two-thirds of the number of Trustees prior to such removal; (c) any Trustee who requests to be retired or who has become incapacitated by illness or injury may be retired by written instrument signed by a majority of the other Trustees; and (d) any Trustee may be removed at any special meeting of shareholders by a two-thirds vote of the outstanding voting securities of the trust. Each Trustee who is not an interested person (as defined in the 1940 Act) of the trust and the fund is referred to herein as an Independent Trustee. Each Independent Trustee shall retire not later than the last day of the calendar year in which his or her 75th birthday occurs. The Independent Trustees may waive this mandatory retirement age policy with respect to individual Trustees. Officers and Advisory Board Members hold office without limit in time, except that any officer or Advisory Board Member may resign or may be removed by a vote of a majority of the Trustees at any regular meeting or any special meeting of the Trustees. Except as indicated, each individual has held the office shown or other offices in the same company for the past five years.
The fund’s Statement of Additional Information (SAI) includes more information about the Trustees. To request a free copy, call Fidelity at 1-877-208-0098.
Experience, Skills, Attributes, and Qualifications of the Trustees. The Governance and Nominating Committee has adopted a statement of policy that describes the experience, qualifications, attributes, and skills that are necessary and desirable for potential Independent Trustee candidates (Statement of Policy). The Board believes that each Trustee satisfied at the time he or she was initially elected or appointed a Trustee, and continues to satisfy, the standards contemplated by the Statement of Policy. The Governance and Nominating Committee also engages professional search firms to help identify potential Independent Trustee candidates who have the experience, qualifications, attributes, and skills consistent with the Statement of Policy. From time to time, additional criteria based on the composition and skills of the current Independent Trustees, as well as experience or skills that may be appropriate in light of future changes to board composition, business conditions, and regulatory or other developments, have also been considered by the professional search firms and the Governance and Nominating Committee. In addition, the Board takes into account the Trustees' commitment and participation in Board and committee meetings, as well as their leadership of standing and ad hoc committees throughout their tenure.
In determining that a particular Trustee was and continues to be qualified to serve as a Trustee, the Board has considered a variety of criteria, none of which, in isolation, was controlling. The Board believes that, collectively, the Trustees have balanced and diverse experience, qualifications, attributes, and skills, which allow the Board to operate effectively in governing the fund and protecting the interests of shareholders. Information about the specific experience, skills, attributes, and qualifications of each Trustee, which in each case led to the Board's conclusion that the Trustee should serve (or continue to serve) as a trustee of the fund, is provided below.
Board Structure and Oversight Function. James C. Curvey is an interested person and currently serves as Chairman. The Trustees have determined that an interested Chairman is appropriate and benefits shareholders because an interested Chairman has a personal and professional stake in the quality and continuity of services provided to the fund. Independent Trustees exercise their informed business judgment to appoint an individual of their choosing to serve as Chairman, regardless of whether the Trustee happens to be independent or a member of management. The Independent Trustees have determined that they can act independently and effectively without having an Independent Trustee serve as Chairman and that a key structural component for assuring that they are in a position to do so is for the Independent Trustees to constitute a substantial majority for the Board. The Independent Trustees also regularly meet in executive session. Ned C. Lautenbach serves as Chairman of the Independent Trustees and as such (i) acts as a liaison between the Independent Trustees and management with respect to matters important to the Independent Trustees and (ii) with management prepares agendas for Board meetings.
Fidelity® funds are overseen by different Boards of Trustees. The fund's Board oversees Fidelity's high income and certain equity funds, and other Boards oversee Fidelity's investment-grade bond, money market, asset allocation, and sector funds. The asset allocation funds may invest in Fidelity® funds overseen by the fund's Board. The use of separate Boards, each with its own committee structure, allows the Trustees of each group of Fidelity® funds to focus on the unique issues of the funds they oversee, including common research, investment, and operational issues. On occasion, the separate Boards establish joint committees to address issues of overlapping consequences for the Fidelity® funds overseen by each Board.
The Trustees operate using a system of committees to facilitate the timely and efficient consideration of all matters of importance to the Trustees, the fund, and fund shareholders and to facilitate compliance with legal and regulatory requirements and oversight of the fund's activities and associated risks. The Board, acting through its committees, has charged FMR and its affiliates with (i) identifying events or circumstances the occurrence of which could have demonstrably adverse effects on the fund's business and/or reputation; (ii) implementing processes and controls to lessen the possibility that such events or circumstances occur or to mitigate the effects of such events or circumstances if they do occur; and (iii) creating and maintaining a system designed to evaluate continuously business and market conditions in order to facilitate the identification and implementation processes described in (i) and (ii) above. Because the day-to-day operations and activities of the fund are carried out by or through FMR, its affiliates, and other service providers, the fund's exposure to risks is mitigated but not eliminated by the processes overseen by the Trustees. While each of the Board's committees has responsibility for overseeing different aspects of the fund's activities, oversight is exercised primarily through the Operations, Audit, and Compliance Committees. In addition, the Independent Trustees have worked with FMR to enhance the Board's oversight of investment and financial risks, legal and regulatory risks, technology risks, and operational risks, including the development of additional risk reporting to the Board. For example, a working group comprised of Independent Trustees and FMR has worked and continues to work to review the Fidelity® funds' valuation-related activities, reporting and risk management. Appropriate personnel, including but not limited to the fund's Chief Compliance Officer (CCO), FMR's internal auditor, the independent accountants, the fund's Treasurer and portfolio management personnel, make periodic reports to the Board's committees, as appropriate, including an annual review of Fidelity's risk management program for the Fidelity® funds. The responsibilities of each standing committee, including their oversight responsibilities, are described further under "Standing Committees of the Trustees."
Interested Trustees*:
Correspondence intended for a Trustee who is an interested person may be sent to Fidelity Investments, 245 Summer Street, Boston, Massachusetts 02210.
Name, Year of Birth; Principal Occupations and Other Relevant Experience+
James C. Curvey (1935)
Year of Election or Appointment: 2007
Trustee
Chairman of the Board of Trustees
Mr. Curvey also serves as Trustee of other Fidelity® funds. Mr. Curvey is a Director of Fidelity Research & Analysis Co. (investment adviser firm, 2009-present), and Vice Chairman (2007-present) and Director of FMR LLC (diversified financial services company). In addition, Mr. Curvey serves as an Overseer for the Boston Symphony Orchestra and a member of the board of Artis-Naples, Naples, Florida, and as a Trustee for Brewster Academy, Wolfeboro, New Hampshire. Previously, Mr. Curvey served as a Director of Fidelity Investments Money Management, Inc. (investment adviser firm, 2009-2014) and a Director of FMR and FMR Co., Inc. (investment adviser firms, 2007-2014).
Charles S. Morrison (1960)
Year of Election or Appointment: 2014
Trustee
Mr. Morrison also serves as Trustee of other funds. He serves as President of Fidelity Management & Research Company (FMR) (investment adviser firm, 2016-present), a Director of Fidelity Investments Money Management, Inc. (FIMM) (investment adviser firm, 2014-present), Director of Fidelity SelectCo, LLC (investment adviser firm, 2014-present), President, Asset Management (2014-present), and is an employee of Fidelity Investments. Previously, Mr. Morrison served as Vice President of Fidelity's Fixed Income and Asset Allocation Funds (2012-2014), President, Fixed Income (2011-2014), Vice President of Fidelity's Money Market Funds (2005-2009), President, Money Market Group Leader of FMR (investment adviser firm, 2009), and Senior Vice President, Money Market Group of FMR (2004-2009). Mr. Morrison also served as Vice President of Fidelity's Bond Funds (2002-2005), certain Balanced Funds (2002-2005), and certain Asset Allocation Funds (2002-2007), and as Senior Vice President (2002-2005) of Fidelity's Bond Division.
* Determined to be an “Interested Trustee” by virtue of, among other things, his or her affiliation with the trust or various entities under common control with FMR.
+ The information includes the Trustee's principal occupation during the last five years and other information relating to the experience, attributes, and skills relevant to the Trustee's qualifications to serve as a Trustee, which led to the conclusion that the Trustee should serve as a Trustee for the fund.
Independent Trustees:
Correspondence intended for an Independent Trustee may be sent to Fidelity Investments, P.O. Box 55235, Boston, Massachusetts 02205-5235.
Name, Year of Birth; Principal Occupations and Other Relevant Experience+
Dennis J. Dirks (1948)
Year of Election or Appointment: 2005
Trustee
Mr. Dirks also serves as Trustee of other Fidelity® funds. Prior to his retirement in May 2003, Mr. Dirks was Chief Operating Officer and a member of the Board of The Depository Trust & Clearing Corporation (DTCC). He also served as President, Chief Operating Officer, and Board member of The Depository Trust Company (DTC) and President and Board member of the National Securities Clearing Corporation (NSCC). In addition, Mr. Dirks served as Chief Executive Officer and Board member of the Government Securities Clearing Corporation, Chief Executive Officer and Board member of the Mortgage-Backed Securities Clearing Corporation, as a Trustee and a member of the Finance Committee of Manhattan College (2005-2008), as a Trustee and a member of the Finance Committee of AHRC of Nassau County (2006-2008), and as a member of the Independent Directors Council (IDC) Governing Council (2010-2015). Mr. Dirks is a member of the Board of Directors for The Brookville Center for Children's Services, Inc. (2009-present).
Alan J. Lacy (1953)
Year of Election or Appointment: 2008
Trustee
Mr. Lacy also serves as Trustee of other Fidelity® funds. Mr. Lacy serves as Chairman (2014-present) and a member (2010-present) of the Board of Directors of Dave & Buster's Entertainment, Inc. (restaurant and entertainment complexes) and a Director of Bristol-Myers Squibb Company (global pharmaceuticals, 2008-present). He is a Trustee of the California Chapter of The Nature Conservancy (2015-present) and a Director of the Center for Advanced Study in the Behavioral Sciences at Stanford University (2015-present). In addition, Mr. Lacy served as Senior Adviser (2007-2014) of Oak Hill Capital Partners, L.P. (private equity) and also served as Chief Executive Officer (2005) and Vice Chairman (2005-2006) of Sears Holdings Corporation (retail) and Chief Executive Officer and Chairman of the Board of Sears, Roebuck and Co. (retail, 2000-2005). Previously, Mr. Lacy served as Chairman (2008-2011) and a member (2006-2015) of the Board of Trustees of the National Parks Conservation Association and as a member of the Board of Directors for The Western Union Company (global money transfer, 2006-2011), The Hillman Companies, Inc. (hardware wholesalers, 2010-2014), and Earth Fare, Inc. (retail grocery, 2010-2014).
Ned C. Lautenbach (1944)
Year of Election or Appointment: 2000
Trustee
Chairman of the Independent Trustees
Mr. Lautenbach also serves as Trustee of other Fidelity® funds. Mr. Lautenbach currently serves as the Lead Director of the Eaton Corporation Board of Directors (diversified industrial, 1997-present). Mr. Lautenbach is Chairman of the Board of Directors of Artis-Naples in Naples, Florida (2012-present), a member of the Council on Foreign Relations (1994-present), and a member of the Board of Governors, State University System of Florida (2013-present). Previously, Mr. Lautenbach was a Partner/Advisory Partner at Clayton, Dubilier & Rice, LLC (private equity investment, 1998-2010), as well as a Director of Sony Corporation (2006-2007).
Joseph Mauriello (1944)
Year of Election or Appointment: 2008
Trustee
Mr. Mauriello also serves as Trustee of other Fidelity® funds. Prior to his retirement in January 2006, Mr. Mauriello served in numerous senior management positions including Deputy Chairman and Chief Operating Officer (2004-2005), and Vice Chairman of Financial Services (2002-2004) of KPMG LLP US (professional services, 1965-2005). Mr. Mauriello currently serves as a member of the Board of Directors of XL Group plc. (global insurance and re-insurance, 2006-present) and the Independent Directors Council (IDC) Governing Council (2015-present). Previously, Mr. Mauriello served as a Director of the Hamilton Funds of the Bank of New York (2006-2007) and of Arcadia Resources Inc. (health care services and products, 2007-2012).
Robert W. Selander (1950)
Year of Election or Appointment: 2011
Trustee
Mr. Selander also serves as Trustee of other Fidelity® funds. Mr. Selander serves as a Director of The Western Union Company (global money transfer, 2014-present) and a non-executive Chairman of Health Equity, Inc. (health savings custodian, 2015-present). Previously, Mr. Selander served as a Member of the Advisory Board of certain Fidelity® funds (2011), and Executive Vice Chairman (2010), Chief Executive Officer (2009-2010), and President and Chief Executive Officer (1997-2009) of Mastercard, Inc.
Cornelia M. Small (1944)
Year of Election or Appointment: 2005
Trustee
Ms. Small also serves as Trustee of other Fidelity® funds. Ms. Small is a member of the Board of Directors (2009-present) and Chair of the Investment Committee (2010-present) of the Teagle Foundation. Ms. Small also serves on the Investment Committee of the Berkshire Taconic Community Foundation (2008-present). Previously, Ms. Small served as Chairperson (2002-2008) and a member of the Investment Committee and Chairperson (2008-2012) and a member of the Board of Trustees of Smith College. In addition, Ms. Small served as Chief Investment Officer, Director of Global Equity Investments, and a member of the Board of Directors of Scudder, Stevens & Clark and Scudder Kemper Investments.
William S. Stavropoulos (1939)
Year of Election or Appointment: 2002
Trustee
Vice Chairman of the Independent Trustees
Mr. Stavropoulos also serves as Trustee of other Fidelity® funds. Mr. Stavropoulos serves as President and Founder of the Michigan Baseball Foundation, the Great Lakes Loons (2007-present). Mr. Stavropoulos is Chairman Emeritus of the Board of Directors of The Dow Chemical Company, where he previously served in numerous senior management positions, including President, CEO (1995-2000; 2002-2004), Chairman of the Executive Committee (2000-2006), and as a member of the Board of Directors (1990-2006). Currently, Mr. Stavropoulos is Chairman of the Board of Directors of Univar Inc. (global distributor of commodity and specialty chemicals), a Director of Teradata Corporation (data warehousing and technology solutions), and Maersk Inc. (industrial conglomerate), and a member of the Advisory Board for Metalmark Capital LLC (private equity investment, 2005-present). Mr. Stavropoulos is an operating advisor to Clayton, Dubilier & Rice, LLC (private equity investment). In addition, Mr. Stavropoulos is a member of the University of Notre Dame Advisory Council for the College of Science, a Trustee of the Rollin L. Gerstacker Foundation, and a Director of the Naples Philharmonic Center for the Arts. Previously, Mr. Stavropoulos served as a Director of Chemical Financial Corporation (bank holding company, 1993-2012) and Tyco International, Ltd. (multinational manufacturing and services, 2007-2012).
David M. Thomas (1949)
Year of Election or Appointment: 2008
Trustee
Mr. Thomas also serves as Trustee of other Fidelity® funds. Mr. Thomas serves as Non-Executive Chairman of the Board of Directors of Fortune Brands Home and Security (home and security products, 2011-present), as a member of the Board of Directors (2004-present) and Presiding Director (2013-present) of Interpublic Group of Companies, Inc. (marketing communication), and as a member of the Board of Trustees of the University of Florida (2013-present). Previously, Mr. Thomas served as Executive Chairman (2005-2006) and Chairman and Chief Executive Officer (2000-2005) of IMS Health, Inc. (pharmaceutical and healthcare information solutions), and a Director of Fortune Brands, Inc. (consumer products, 2000-2011).
+ The information includes the Trustee's principal occupation during the last five years and other information relating to the experience, attributes, and skills relevant to the Trustee's qualifications to serve as a Trustee, which led to the conclusion that the Trustee should serve as a Trustee for the fund.
Advisory Board Members and Officers:
Correspondence intended for an officer or Peter S. Lynch may be sent to Fidelity Investments, 245 Summer Street, Boston, Massachusetts 02210. Officers appear below in alphabetical order.
Name, Year of Birth; Principal Occupation
Peter S. Lynch (1944)
Year of Election or Appointment: 2003
Member of the Advisory Board
Mr. Lynch also serves as Member of the Advisory Board of other Fidelity® funds. Mr. Lynch is Vice Chairman and a Director of FMR (investment adviser firm) and FMR Co., Inc. (investment adviser firm). In addition, Mr. Lynch serves as a Trustee of Boston College and as the Chairman of the Inner-City Scholarship Fund. Previously, Mr. Lynch served on the Special Olympics International Board of Directors (1997-2006).
Marc R. Bryant (1966)
Year of Election or Appointment: 2015
Secretary and Chief Legal Officer (CLO)
Mr. Bryant also serves as Secretary and CLO of other funds. Mr. Bryant serves as CLO, Secretary, and Senior Vice President of Fidelity Management & Research Company (investment adviser firm, 2015-present) and FMR Co., Inc. (investment adviser firm, 2015-present); Secretary of Fidelity SelectCo, LLC (investment adviser firm, 2015-present) and Fidelity Investments Money Management, Inc. (investment adviser firm, 2015-present); and CLO of Fidelity Management & Research (Hong Kong) Limited and FMR Investment Management (UK) Limited (investment adviser firms, 2015-present) and Fidelity Management & Research (Japan) Limited (investment adviser firm, 2016-present). He is Senior Vice President and Deputy General Counsel of FMR LLC (diversified financial services company). Previously, Mr. Bryant served as Secretary and CLO of Fidelity Rutland Square Trust II (2010-2014) and Assistant Secretary of Fidelity's Fixed Income and Asset Allocation Funds (2013-2015). Prior to joining Fidelity Investments, Mr. Bryant served as a Senior Vice President and the Head of Global Retail Legal for AllianceBernstein L.P. (2006-2010), and as the General Counsel for ProFund Advisors LLC (2001-2006).
Jeffrey S. Christian (1961)
Year of Election or Appointment: 2016
Assistant Treasurer
Mr. Christian also serves as Assistant Treasurer of other funds. Mr. Christian is an employee of Fidelity Investments (2003-present).
William C. Coffey (1969)
Year of Election or Appointment: 2009
Assistant Secretary
Mr. Coffey also serves as Assistant Secretary of other funds. He is Senior Vice President and Deputy General Counsel of FMR LLC (diversified financial services company, 2010-present), and is an employee of Fidelity Investments. Previously, Mr. Coffey served as Vice President and Associate General Counsel of FMR LLC (2005-2009).
Jonathan Davis (1968)
Year of Election or Appointment: 2010
Assistant Treasurer
Mr. Davis also serves as Assistant Treasurer of other funds, and is an employee of Fidelity Investments. Previously, Mr. Davis served as Vice President and Associate General Counsel of FMR LLC (diversified financial services company, 2003-2010).
Adrien E. Deberghes (1967)
Year of Election or Appointment: 2016
Assistant Treasurer
Mr. Deberghes also serves as an officer of other funds. He serves as Executive Vice President of Fidelity Investments Money Management, Inc. (FIMM) (investment adviser firm, 2016-present) and is an employee of Fidelity Investments (2008-present). Prior to joining Fidelity Investments, Mr. Deberghes was Senior Vice President of Mutual Fund Administration at State Street Corporation (2007-2008), Senior Director of Mutual Fund Administration at Investors Bank & Trust (2005-2007), and Director of Finance for Dunkin' Brands (2000-2005). Previously, Mr. Deberghes served in other fund officer roles.
Stephanie J. Dorsey (1969)
Year of Election or Appointment: 2010
Assistant Treasurer
Ms. Dorsey also serves as an officer of other funds. She is an employee of Fidelity Investments (2008-present) and has served in other fund officer roles. Prior to joining Fidelity Investments, Ms. Dorsey served as Treasurer (2004-2008) of the JPMorgan Mutual Funds and Vice President (2004-2008) of JPMorgan Chase Bank.
Howard J. Galligan III (1966)
Year of Election or Appointment: 2014
Chief Financial Officer
Mr. Galligan also serves as Chief Financial Officer of other funds. Mr. Galligan serves as President of Fidelity Pricing and Cash Management Services (FPCMS) (2014-present) and as a Director of Strategic Advisers, Inc. (investment adviser firm, 2008-present). Previously, Mr. Galligan served as Chief Administrative Officer of Asset Management (2011-2014) and Chief Operating Officer and Senior Vice President of Investment Support for Strategic Advisers, Inc. (2003-2011).
Scott C. Goebel (1968)
Year of Election or Appointment: 2015
Vice President
Mr. Goebel serves as Vice President of other funds and is an employee of Fidelity Investments (2001-present). Previously, Mr. Goebel served as Senior Vice President of Fidelity Management & Research Company (FMR) (investment adviser firm, 2016), Secretary of Fidelity SelectCo, LLC (investment adviser firm, 2013-2015), Fidelity Investments Money Management, Inc. (FIMM) (investment adviser firm, 2010-2015), and Fidelity Research and Analysis Company (FRAC) (investment adviser firm, 2010-2015); General Counsel, Secretary, and Senior Vice President of FMR (investment adviser firm, 2008-2015) and FMR Co., Inc. (investment adviser firm, 2008-2015); Assistant Secretary of Fidelity Management & Research (Japan) Limited (investment adviser firm, 2008-2015) and Fidelity Management & Research (U.K.) Inc. (investment adviser firm, 2008-2015); Chief Legal Officer (CLO) of Fidelity Management & Research (Hong Kong) Limited (investment adviser firm, 2008-2015); Secretary and CLO of certain Fidelity® funds (2008-2015); Assistant Secretary of FIMM (2008-2010), FRAC (2008-2010), and certain funds (2007-2008); and as Vice President and Secretary of Fidelity Distributors Corporation (FDC) (2005-2007).
Thomas C. Hense (1964)
Year of Election or Appointment: 2008, 2010, or 2015
Vice President
Mr. Hense serves as Vice President of Fidelity Advisor® Multi-Asset Income Fund (2015) and other funds (High Income (2008), Small Cap (2008), and Value (2010) funds), and is an employee of Fidelity Investments (1993-present). Previously, Mr. Hense served as a portfolio manager for Fidelity's Institutional Money Management Group (Pyramis) (2003-2008).
Brian B. Hogan (1964)
Year of Election or Appointment: 2009
Vice President
Mr. Hogan also serves as Trustee or Vice President of other funds. Mr. Hogan serves as a Director of FMR Investment Management (UK) Limited (investment adviser firm, 2015-present) and Fidelity SelectCo, LLC (investment adviser firm, 2014-present) and President of the Equity Division of FMR (investment adviser firm, 2009-present). Previously, Mr. Hogan served as Senior Vice President, Equity Research of FMR (2006-2009) and as a portfolio manager. Mr. Brian B. Hogan is not related to Mr. Colm A. Hogan.
Colm A. Hogan (1973)
Year of Election or Appointment: 2016
Deputy Treasurer
Mr. Hogan also serves as an officer of other funds. Mr. Hogan is an employee of Fidelity Investments (2005-present). Mr. Colm A. Hogan is not related to Mr. Brian B. Hogan.
Chris Maher (1972)
Year of Election or Appointment: 2013
Assistant Treasurer
Mr. Maher serves as Assistant Treasurer of other funds. Mr. Maher is Vice President of Valuation Oversight and is an employee of Fidelity Investments. Previously, Mr. Maher served as Vice President of Asset Management Compliance (2013), Vice President of the Program Management Group of FMR (investment adviser firm, 2010-2013), and Vice President of Valuation Oversight (2008-2010).
John F. Papandrea (1972)
Year of Election or Appointment: 2016
Anti-Money Laundering (AML) Officer
Mr. Papandrea also serves as AML Officer of other funds. Mr. Papandrea is Vice President of FMR LLC (diversified financial services company, 2008-present) and is an employee of Fidelity Investments (2005-present).
Kenneth B. Robins (1969)
Year of Election or Appointment: 2016
Chief Compliance Officer
Mr. Robins also serves as an officer of other funds. Mr. Robins serves as Compliance Officer of Fidelity Management & Research Company and FMR Co., Inc. (investment adviser firms, 2016-present) and is an employee of Fidelity Investments (2004-present). Previously, Mr. Robins served as Executive Vice President of Fidelity Investments Money Management, Inc. (investment adviser firm, 2013-2016) and served in other fund officer roles.
Stacie M. Smith (1974)
Year of Election or Appointment: 2016
President and Treasurer
Ms. Smith also serves as an officer of other funds. She is an employee of Fidelity Investments (2009-present) and has served in other fund officer roles. Prior to joining Fidelity Investments, Ms. Smith served as Senior Audit Manager of Ernst & Young LLP (accounting firm, 1996-2009). Previously, Ms. Smith served as Deputy Treasurer of certain Fidelity® funds (2013-2016).
Marc L. Spector (1972)
Year of Election or Appointment: 2016
Assistant Treasurer
Mr. Spector also serves as an officer of other funds. Mr. Spector is an employee of Fidelity Investments (2016-present). Prior to joining Fidelity Investments, Mr. Spector served as Director at the Siegfried Group (accounting firm, 2013-2016), and prior to Siegfried Group as audit senior manager at Deloitte & Touche (accounting firm, 2005-2013).
Renee Stagnone (1975)
Year of Election or Appointment: 2016
Assistant Treasurer
Ms. Stagnone also serves as an officer of other funds. Ms. Stagnone is an employee of Fidelity Investments (1997-present). Previously, Ms. Stagnone served as Deputy Treasurer of certain Fidelity® funds (2013-2016).
Shareholder Expense Example
As a shareholder of the Fund, you incur two types of costs: (1) transaction costs, including sales charges (loads) on purchase payments or redemption proceeds, redemption fees and (2) ongoing costs, including management fees, distribution and/or service (12b-1) fees and other Fund expenses. This Example is intended to help you understand your ongoing costs (in dollars) of investing in the Fund and to compare these costs with the ongoing costs of investing in other mutual funds.
The Example is based on an investment of $1,000 invested at the beginning of the period and held for the entire period (May 1, 2016 to October 31, 2016).
Actual Expenses
The first line of the accompanying table for each class of the Fund provides information about actual account values and actual expenses. You may use the information in this line, together with the amount you invested, to estimate the expenses that you paid over the period. Simply divide your account value by $1,000.00 (for example, an $8,600 account value divided by $1,000.00 = 8.6), then multiply the result by the number in the first line for a class of the Fund under the heading entitled "Expenses Paid During Period" to estimate the expenses you paid on your account during this period. In addition, the Fund, as a shareholder in the underlying Fidelity Central Funds, will indirectly bear its pro-rata share of the fees and expenses incurred by the underlying Fidelity Central Funds. These fees and expenses are not included in the Fund's annualized expense ratio used to calculate the expense estimate in the table below.
Hypothetical Example for Comparison Purposes
The second line of the accompanying table for each class of the Fund provides information about hypothetical account values and hypothetical expenses based on a Class' actual expense ratio and an assumed rate of return of 5% per year before expenses, which is not the Class' actual return. The hypothetical account values and expenses may not be used to estimate the actual ending account balance or expenses you paid for the period. You may use this information to compare the ongoing costs of investing in the Fund and other funds. To do so, compare this 5% hypothetical example with the 5% hypothetical examples that appear in the shareholder reports of the other funds. In addition, the Fund, as a shareholder in the underlying Fidelity Central Funds, will indirectly bear its pro-rata share of the fees and expenses incurred by the underlying Fidelity Central Funds. These fees and expenses are not included in the Fund's annualized expense ratio used to calculate the expense estimate in the table below.
Please note that the expenses shown in the table are meant to highlight your ongoing costs only and do not reflect any transaction costs. Therefore, the second line of the table is useful in comparing ongoing costs only, and will not help you determine the relative total costs of owning different funds. In addition, if these transactional costs were included, your costs would have been higher.
| Annualized Expense Ratio-A | Beginning Account Value May 1, 2016 | Ending Account Value October 31, 2016 | Expenses Paid During Period-B May 1, 2016 to October 31, 2016 |
|
| Class A | 1.02% | |||
| Actual | $1,000.00 | $1,058.10 | $5.28 | |
| Hypothetical-C | $1,000.00 | $1,020.01 | $5.18 | |
| Class T | 1.01% | |||
| Actual | $1,000.00 | $1,057.90 | $5.22 | |
| Hypothetical-C | $1,000.00 | $1,020.06 | $5.13 | |
| Class C | 1.77% | |||
| Actual | $1,000.00 | $1,053.10 | $9.13 | |
| Hypothetical-C | $1,000.00 | $1,016.24 | $8.97 | |
| Class I | .78% | |||
| Actual | $1,000.00 | $1,058.60 | $4.04 | |
| Hypothetical-C | $1,000.00 | $1,021.22 | $3.96 |
A Annualized expense ratio reflects expenses net of applicable fee waivers.
B Expenses are equal to each Class' annualized expense ratio, multiplied by the average account value over the period, multiplied by 184/366 (to reflect the one-half year period).
C 5% return per year before expenses
Distributions (Unaudited)
A total of 0.06% of the dividends distributed during the fiscal year was derived from interest on U.S. Government securities which is generally exempt from state income tax.
The fund designates $ 55,226,419 of distributions paid during the period January 1, 2016 to October 31, 2016 as qualifying to be taxed as interest-related dividends for nonresident alien shareholders.
The fund will notify shareholders in January 2017 of amounts for use in preparing 2016 income tax returns.
Board Approval of Investment Advisory Contracts and Management Fees
Fidelity Advisor High Income Advantage Fund
Each year, the Board of Trustees, including the Independent Trustees (together, the Board), votes on the renewal of the management contract with Fidelity Management & Research Company (FMR) and the sub-advisory agreements (together, the Advisory Contracts) for the fund. The Board, assisted by the advice of fund counsel and Independent Trustees' counsel, requests and considers a broad range of information relevant to the renewal of the Advisory Contracts throughout the year.
The Board meets regularly and, at each of its meetings, covers an extensive agenda of topics and materials and considers factors that are relevant to its annual consideration of the renewal of the fund's Advisory Contracts, including the services and support provided to the fund and its shareholders. The Board has established various standing committees (Committees), each composed of and chaired by Independent Trustees with varying backgrounds, to which the Board has assigned specific subject matter responsibilities in order to enhance effective decision-making by the Board. The Board, acting directly and through its Committees, requests and receives information concerning the annual consideration of the renewal of the fund's Advisory Contracts. The Board also meets as needed to consider matters specifically related to the Board's annual consideration of the renewal of the Advisory Contracts. Members of the Board may also meet with trustees of other Fidelity funds through ad hoc joint committees to discuss certain matters relevant to all of the Fidelity funds.
At its July 2016 meeting, the Board unanimously determined to renew the fund's Advisory Contracts. In reaching its determination, the Board considered all factors it believed relevant, including (i) the nature, extent, and quality of the services to be provided to the fund and its shareholders (including the investment performance of the fund); (ii) the competitiveness of the fund's management fee and total expense ratio relative to peer funds; (iii) the total costs of the services to be provided by and the profits to be realized by Fidelity from its relationships with the fund; and (iv) the extent to which, if any, economies of scale exist and would be realized as the fund grows, and whether any economies of scale are appropriately shared with fund shareholders.
In considering whether to renew the Advisory Contracts for the fund, the Board reached a determination, with the assistance of fund counsel and Independent Trustees' counsel and through the exercise of its business judgment, that the renewal of the Advisory Contracts was in the best interests of the fund and its shareholders and that the compensation payable under the Advisory Contracts was fair and reasonable. The Board's decision to renew the Advisory Contracts was not based on any single factor, but rather was based on a comprehensive consideration of all the information provided to the Board at its meetings throughout the year. The Board, in reaching its determination to renew the Advisory Contracts, was aware that shareholders of the fund have a broad range of investment choices available to them, including a wide choice among funds offered by Fidelity's competitors, and that the fund's shareholders, who have the opportunity to review and weigh the disclosure provided by the fund in its prospectus and other public disclosures, have chosen to invest in this fund, which is part of the Fidelity family of funds.
Nature, Extent, and Quality of Services Provided. The Board considered Fidelity's staffing as it relates to the fund, including the backgrounds of investment personnel of Fidelity, and also considered the fund's investment objective, strategies, and related investment philosophy. The Independent Trustees also had discussions with senior management of Fidelity's investment operations and investment groups. The Board considered the structure of the investment personnel compensation program and whether this structure provides appropriate incentives to act in the best interests of the fund. Additionally, the Board considered the portfolio managers' investments, if any, in the funds that they manage. Resources Dedicated to Investment Management and Support Services. The Board and the Fund Oversight and Research Committees reviewed the general qualifications and capabilities of Fidelity's investment staff, including its size, education, experience, and resources, as well as Fidelity's approach to recruiting, training, managing, and compensating investment personnel. The Board noted that Fidelity has continued to increase the resources devoted to non-U.S. offices, including expansion of Fidelity's global investment organization. The Board also noted that Fidelity's analysts have extensive resources, tools and capabilities that allow them to conduct sophisticated quantitative and fundamental analysis, as well as credit analysis of issuers, counterparties and guarantors. Further, the Board considered that Fidelity's investment professionals have sufficient access to global information and data so as to provide competitive investment results over time, and that those professionals also have access to sophisticated tools that permit them to assess portfolio construction and risk and performance attribution characteristics continuously, as well as to transmit new information and research conclusions rapidly around the world. Additionally, in its deliberations, the Board considered Fidelity's trading, risk management, compliance, and technology and operations capabilities and resources, which are integral parts of the investment management process. Shareholder and Administrative Services. The Board considered (i) the nature, extent, quality, and cost of advisory, administrative, and shareholder services performed by FMR, the sub-advisers (together with FMR, the Investment Advisers), and their affiliates under the Advisory Contracts and under separate agreements covering transfer agency, pricing and bookkeeping, and securities lending services for the fund; (ii) the nature and extent of the supervision of third party service providers, principally custodians, subcustodians, and pricing vendors; and (iii) the resources devoted to, and the record of compliance with, the fund's compliance policies and procedures. The Board also reviewed the allocation of fund brokerage, including allocations to brokers affiliated with the Investment Advisers, the use of brokerage commissions to pay fund expenses, and the use of "soft" commission dollars to pay for research services.The Board noted that the growth of fund assets over time across the complex allows Fidelity to reinvest in the development of services designed to enhance the value or convenience of the Fidelity funds as investment vehicles. These services include 24-hour access to account information and market information through telephone representatives and over the Internet, investor education materials and asset allocation tools, and the expanded availability of Fidelity Investor Centers.In 2014, the Board formed an ad hoc Committee on Transfer Agency Fees to review the variety of transfer agency fee structures throughout the industry and Fidelity's competitive positioning with respect to industry participants. Investment in a Large Fund Family. The Board considered the benefits to shareholders of investing in a Fidelity fund, including the benefits of investing in a fund that is part of a large family of funds offering a variety of investment disciplines and providing a large variety of mutual fund investor services. The Board noted that Fidelity had taken, or had made recommendations that resulted in the Fidelity funds taking, a number of actions over the previous year that benefited particular funds, including: (i) continuing to dedicate additional resources to investment research and to the support of the senior management team that oversees asset management; (ii) continuing efforts to enhance Fidelity's global research capabilities; (iii) launching new funds and making other enhancements to meet client needs; (iv) broadening eligibility requirements for certain lower-priced share classes of, and streamlining the fee structure for, certain existing equity index funds; (v) lowering expense caps for certain existing funds and classes to reduce expenses paid by shareholders; (vi) eliminating redemption fees for certain variable insurance product funds and classes; (vii) continuing to launch dedicated lower cost underlying funds to meet portfolio construction needs related to expanding underlying fund options for Fidelity funds of funds, specifically for the Freedom Fund product lines; (viii) launching a lower cost share class for use by the Freedom Index Fund product line; (ix) rationalizing product lines and gaining increased efficiencies through fund mergers and share class consolidations; (x) continuing to develop, acquire and implement systems and technology to improve services to the funds and shareholders, strengthen information security, and increase efficiency; (xi) implementing investment enhancements to further strengthen Fidelity's target date product line to increase investors' probability of success in achieving their goals; (xii) accelerating the conversion of all remaining Class B shares to Class A shares, which have a lower expense structure; and (xiii) implementing changes to Fidelity's money market fund product line in response to recent regulatory reforms. Investment Performance. The Board considered whether the fund has operated in accordance with its investment objective, as well as its record of compliance with its investment restrictions and its performance history.The Board took into account discussions with representatives of the Investment Advisers about fund investment performance that occur at Board meetings throughout the year. In this regard the Board noted that as part of regularly scheduled fund reviews and other reports to the Board on fund performance, the Board considers annualized return information for the fund, for different time periods, measured against a securities market index ("benchmark index") and a peer group of funds with similar objectives ("peer group"), if any. In its evaluation of fund investment performance, the Board gave particular attention to information indicating changes in performance of certain Fidelity funds for specific time periods and discussed with the Investment Advisers the reasons for any overperformance or underperformance.In addition to reviewing absolute and relative fund performance, the Independent Trustees periodically consider the appropriateness of fund performance metrics in evaluating the results achieved. In general, the Independent Trustees believe that fund performance should be evaluated based on net performance (after fees and expenses) of both the highest performing and lowest performing fund share classes, where applicable, compared to appropriate benchmark indices, over appropriate time periods that may include full market cycles, and compared to peer groups, as applicable, over the same periods, taking into account relevant factors including the following: general market conditions; issuer-specific information; and fund cash flows and other factors.The Independent Trustees recognize that shareholders evaluate performance on a net basis over their own holding periods, for which one-, three-, and five-year periods are often used as a proxy. For this reason, the performance information reviewed by the Board also included net cumulative calendar year total return information for the fund and an appropriate benchmark index and peer group for the most recent one-, three-, and five-year periods, as shown below. Returns are shown compared to the 25th percentile (top of box, 75% beaten) and 75th percentile (bottom of box, 25% beaten) of the peer universe.Fidelity Advisor High Income Advantage Fund

Fidelity Advisor High Income Advantage Fund
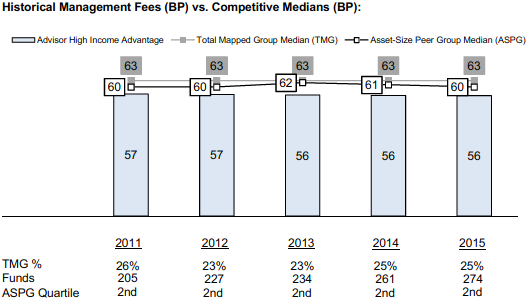
![]()
HY-ANN-1216
1.538463.119
|
Fidelity Advisor® High Income Fund Class A, Class T, Class C and Class I Annual Report October 31, 2016 |
|
|
Contents
|
Board Approval of Investment Advisory Contracts and Management Fees |
To view a fund's proxy voting guidelines and proxy voting record for the 12-month period ended June 30, visit http://www.fidelity.com/proxyvotingresults or visit the Securities and Exchange Commission's (SEC) web site at http://www.sec.gov.
You may also call 1-877-208-0098 to request a free copy of the proxy voting guidelines.
Standard & Poor's, S&P and S&P 500 are registered service marks of The McGraw-Hill Companies, Inc. and have been licensed for use by Fidelity Distributors Corporation.
Other third-party marks appearing herein are the property of their respective owners.
All other marks appearing herein are registered or unregistered trademarks or service marks of FMR LLC or an affiliated company. © 2016 FMR LLC. All rights reserved.
This report and the financial statements contained herein are submitted for the general information of the shareholders of the Fund. This report is not authorized for distribution to prospective investors in the Fund unless preceded or accompanied by an effective prospectus.
A fund files its complete schedule of portfolio holdings with the SEC for the first and third quarters of each fiscal year on Form N-Q. Forms N-Q are available on the SEC’s web site at http://www.sec.gov. A fund's Forms N-Q may be reviewed and copied at the SEC’s Public Reference Room in Washington, DC. Information regarding the operation of the SEC's Public Reference Room may be obtained by calling 1-800-SEC-0330.
For a complete list of a fund's portfolio holdings, view the most recent holdings listing, semiannual report, or annual report on Fidelity's web site at http://www.fidelity.com, http://www.institutional.fidelity.com, or http://www.401k.com, as applicable.
NOT FDIC INSURED •MAY LOSE VALUE •NO BANK GUARANTEE
Neither the Fund nor Fidelity Distributors Corporation is a bank.
Performance: The Bottom Line
Average annual total return reflects the change in the value of an investment, assuming reinvestment of distributions from dividend income and capital gains (the profits earned upon the sale of securities that have grown in value, if any) and assuming a constant rate of performance each year. The hypothetical investment and the average annual total returns do not reflect the deduction of taxes that a shareholder would pay on fund distributions or the redemption of fund shares. During periods of reimbursement by Fidelity, a fund’s total return will be greater than it would be had the reimbursement not occurred. How a fund did yesterday is no guarantee of how it will do tomorrow.
Average Annual Total Returns
| For the periods ended October 31, 2016 | Past 1 year | Past 5 years | Past 10 years |
| Class A (incl. 4.00% sales charge) | 2.80% | 4.91% | 5.34% |
| Class T (incl. 4.00% sales charge) | 2.78% | 4.87% | 5.31% |
| Class C (incl. contingent deferred sales charge) | 5.14% | 4.96% | 4.96% |
| Class I | 7.31% | 5.94% | 5.97% |
Class C shares' contingent deferred sales charges included in the past one year, past five years and past ten years total return figures are 1%, 0% and 0%, respectively.
$10,000 Over 10 Years
Let's say hypothetically that $10,000 was invested in Fidelity Advisor® High Income Fund - Class A on October 31, 2006, and the current 4.00% sales charge was paid.
The chart shows how the value of your investment would have changed, and also shows how The BofA Merrill Lynch℠ US High Yield Constrained Index performed over the same period.
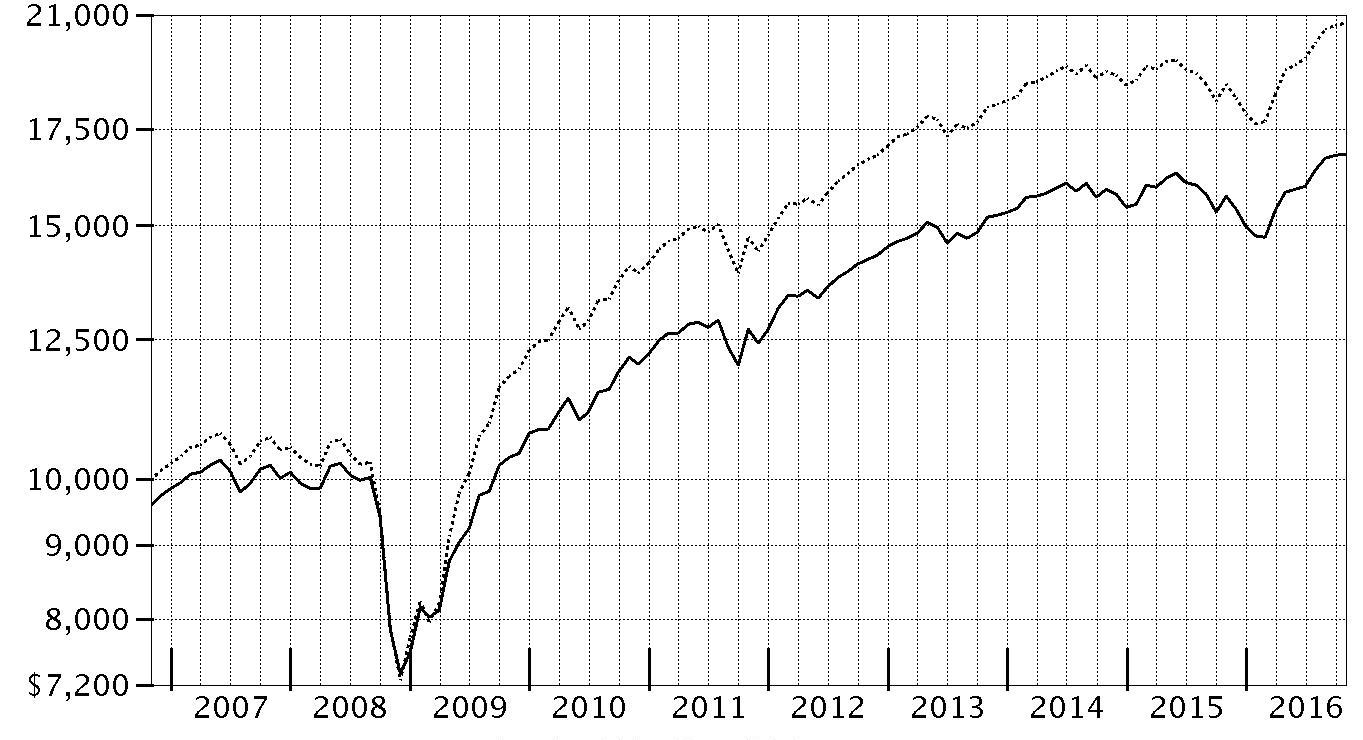
| Period Ending Values | ||
|
| $16,822 | Fidelity Advisor® High Income Fund - Class A |
|
| $20,722 | The BofA Merrill Lynch℠ US High Yield Constrained Index |
Management's Discussion of Fund Performance
Market Recap: U.S. corporate high-yield bonds staged a dramatic rebound during the year ending October 31, 2016, with The BofA Merrill Lynch US High Yield Constrained Index sharply reversing course in February and gaining 10.18% for the full 12 months. The first three months of the period were volatile, as another leg down in energy prices and mounting fears of an economic slowdown in China weighed on high-yield bonds. Market turbulence reached a peak on February 11, after which high yield began to benefit from improvement across a broad range of global issues, including a revival in oil markets. The recovery accelerated in the spring, as strengthening macro tailwinds stoked demand for riskier assets and further credit-spread tightening. The high-yield rally was briefly disrupted in June, as the U.K.’s vote to exit the European Union, dubbed “Brexit,” surprised investors and reverberated throughout global markets. However, as investors reassessed the broader impact of Brexit in the days following the vote, credit-sensitive securities rose once again and remained on an uptrend through October. Reflecting a more favorable environment for riskier assets during the period’s second half, lower-quality bonds within the index fared best. Gains were broad-based across industries, with steel and metals/mining leading the way amid firming commodities prices. Comments from Portfolio Manager Matthew Conti: For the year, the fund’s share classes (excluding sales charges, if applicable) posted gains of about 6% to 7%, significantly trailing The BofA Merrill Lynch US High Yield Constrained Index. Relative to the benchmark, the fund’s core high-yield bond portfolio underperformed, primarily due to adverse security selection among B-rated bonds. Selections and an underweighting in bonds rated CCC and below also hampered relative results. An allocation to bank loans –reflective of my conservative approach – lagged the benchmark and was a further detractor. Additionally, a 3% cash stake, on average, hurt performance amid a rallying market. From a sector/industry perspective, unfavorable positioning in energy and an underweighting in the strong-performing metals/mining group had the greatest negative impact versus the benchmark. The primary individual relative detractors were dry bulk commodities shipper Navios Maritime and oil & gas exploration & production (E&P) company EP Energy. On the plus side, selections in telecommunications and services aided performance versus the benchmark. The top individual relative contributors were APX Group – parent of home security provider Vivint – and natural gas E&P firm Rice Energy. I increased the fund's allocation to energy and reduced its exposure to metals/mining during the period.The views expressed above reflect those of the portfolio manager(s) only through the end of the period as stated on the cover of this report and do not necessarily represent the views of Fidelity or any other person in the Fidelity organization. Any such views are subject to change at any time based upon market or other conditions and Fidelity disclaims any responsibility to update such views. These views may not be relied on as investment advice and, because investment decisions for a Fidelity fund are based on numerous factors, may not be relied on as an indication of trading intent on behalf of any Fidelity fund.
Investment Summary (Unaudited)
Top Five Holdings as of October 31, 2016
| (by issuer, excluding cash equivalents) | % of fund's net assets | % of fund's net assets 6 months ago |
| APX Group, Inc. | 2.5 | 2.5 |
| Valeant Pharmaceuticals International, Inc. | 2.1 | 1.2 |
| JC Penney Corp., Inc. | 2.1 | 2.1 |
| Lucent Technologies, Inc | 1.8 | 1.8 |
| Sabine Pass Liquefaction LLC | 1.6 | 1.2 |
| 10.1 |
Top Five Market Sectors as of October 31, 2016
| % of fund's net assets | % of fund's net assets 6 months ago | |
| Energy | 13.2 | 10.4 |
| Telecommunications | 10.9 | 11.3 |
| Technology | 8.4 | 6.5 |
| Healthcare | 7.8 | 7.7 |
| Utilities | 6.5 | 5.7 |
Quality Diversification (% of fund's net assets)
| As of October 31, 2016 | ||
| BBB | 1.0% | |
| BB | 41.4% | |
| B | 41.2% | |
| CCC,CC,C | 12.4% | |
| Not Rated | 0.7% | |
| Equities | 0.3% | |
| Short-Term Investments and Net Other Assets | 3.0% | |

| As of April 30, 2016 | ||
| AAA,AA,A | 0.1% | |
| BBB | 1.6% | |
| BB | 38.2% | |
| B | 38.3% | |
| CCC,CC,C | 16.5% | |
| Not Rated | 0.6% | |
| Equities | 0.4% | |
| Short-Term Investments and Net Other Assets | 4.3% | |

We have used ratings from Moody's Investors Service, Inc. Where Moody's® ratings are not available, we have used S&P® ratings. All ratings are as of the date indicated and do not reflect subsequent changes.
Asset Allocation (% of fund's net assets)
| As of October 31, 2016* | ||
| Nonconvertible Bonds | 80.8% | |
| Convertible Bonds, Preferred Stocks | 0.3% | |
| Bank Loan Obligations | 10.4% | |
| Other Investments | 5.5% | |
| Short-Term Investments and Net Other Assets (Liabilities) | 3.0% | |

* Foreign investments - 26.4%
| As of April 30, 2016 * | ||
| Nonconvertible Bonds | 81.4% | |
| Convertible Bonds, Preferred Stocks | 0.4% | |
| Bank Loan Obligations | 7.6% | |
| Other Investments | 6.3% | |
| Short-Term Investments and Net Other Assets (Liabilities) | 4.3% | |

* Foreign investments - 24.9%
Investments October 31, 2016
Showing Percentage of Net Assets
| Nonconvertible Bonds - 80.8% | |||
| Principal Amount | Value | ||
| Aerospace - 0.2% | |||
| TransDigm, Inc.: | |||
| 6% 7/15/22 | $270,000 | $281,475 | |
| 6.375% 6/15/26 (a) | 865,000 | 884,549 | |
| 6.5% 5/15/25 | 705,000 | 734,963 | |
| TOTAL AEROSPACE | 1,900,987 | ||
| Air Transportation - 2.8% | |||
| Air Canada: | |||
| 6.625% 5/15/18 (a) | 3,205,000 | 3,332,880 | |
| 7.75% 4/15/21 (a) | 615,000 | 674,963 | |
| Air Canada Trust Series 2015-1 equipment trust certificate Class C, 5% 3/15/20 (a) | 1,635,000 | 1,639,415 | |
| Allegiant Travel Co. 5.5% 7/15/19 | 905,000 | 940,069 | |
| American Airlines Group, Inc.: | |||
| 4.625% 3/1/20 (a) | 1,355,000 | 1,363,469 | |
| 5.5% 10/1/19 (a) | 2,775,000 | 2,865,188 | |
| American Airlines, Inc. pass-thru trust certificates 5.625% 1/15/21 (a) | 261,502 | 271,962 | |
| Continental Airlines, Inc.: | |||
| pass-thru trust certificates 9.798% 4/1/21 | 768,492 | 847,263 | |
| 6.25% 10/11/21 | 1,467,979 | 1,556,058 | |
| 9.25% 5/10/17 | 672,231 | 678,954 | |
| Delta Air Lines, Inc. pass-thru trust certificates 8.021% 8/10/22 | 831,856 | 948,316 | |
| U.S. Airways Group, Inc. 6.125% 6/1/18 | 1,180,000 | 1,225,725 | |
| U.S. Airways pass-thru certificates: | |||
| Series 2012-2C, 5.45% 6/3/18 | 2,215,000 | 2,275,913 | |
| Series 2013-1 Class B, 5.375% 5/15/23 | 407,996 | 421,256 | |
| United Air Lines, Inc. pass-thru trust certificates: | |||
| Class B, 7.336% 7/2/19 | 755,539 | 800,871 | |
| 9.75% 1/15/17 | 391,708 | 398,297 | |
| United Continental Holdings, Inc.: | |||
| 6% 12/1/20 | 2,635,000 | 2,835,919 | |
| 6.375% 6/1/18 | 185,000 | 194,481 | |
| TOTAL AIR TRANSPORTATION | 23,270,999 | ||
| Automotive & Auto Parts - 1.0% | |||
| Allison Transmission, Inc. 5% 10/1/24 (a) | 1,550,000 | 1,581,000 | |
| American Tire Distributors, Inc. 10.25% 3/1/22 (a) | 1,175,000 | 1,080,272 | |
| IHO Verwaltungs GmbH: | |||
| 4.125% 9/15/21 pay-in-kind (a)(b) | 635,000 | 650,081 | |
| 4.5% 9/15/23 pay-in-kind (a)(b) | 435,000 | 440,438 | |
| 4.75% 9/15/26 pay-in-kind (a)(b) | 525,000 | 523,688 | |
| The Goodyear Tire & Rubber Co. 5% 5/31/26 | 1,960,000 | 1,977,150 | |
| ZF North America Capital, Inc. 4.75% 4/29/25 (a) | 1,805,000 | 1,904,275 | |
| TOTAL AUTOMOTIVE & AUTO PARTS | 8,156,904 | ||
| Banks & Thrifts - 0.2% | |||
| Ally Financial, Inc. 4.25% 4/15/21 | 1,440,000 | 1,454,400 | |
| Broadcasting - 1.4% | |||
| AMC Networks, Inc. 5% 4/1/24 | 1,150,000 | 1,164,375 | |
| Clear Channel Communications, Inc.: | |||
| 5.5% 12/15/16 | 8,335,000 | 8,209,975 | |
| 9% 12/15/19 | 175,000 | 132,781 | |
| Sirius XM Radio, Inc. 5.375% 7/15/26 (a) | 900,000 | 914,067 | |
| Univision Communications, Inc. 5.125% 2/15/25 (a) | 1,425,000 | 1,428,563 | |
| TOTAL BROADCASTING | 11,849,761 | ||
| Building Materials - 1.0% | |||
| Building Materials Corp. of America: | |||
| 5.375% 11/15/24 (a) | 1,955,000 | 2,020,981 | |
| 6% 10/15/25 (a) | 1,700,000 | 1,814,665 | |
| CEMEX Finance LLC 6% 4/1/24 (a) | 1,145,000 | 1,185,075 | |
| CEMEX S.A.B. de CV 7.75% 4/16/26 (a) | 1,330,000 | 1,490,398 | |
| Eagle Materials, Inc. 4.5% 8/1/26 | 1,010,000 | 1,018,398 | |
| Masco Corp. 3.5% 4/1/21 | 745,000 | 762,880 | |
| TOTAL BUILDING MATERIALS | 8,292,397 | ||
| Cable/Satellite TV - 4.2% | |||
| Altice SA 7.75% 5/15/22 (a) | 8,922,000 | 9,317,914 | |
| Altice U.S. Finance SA 5.5% 5/15/26 (a) | 1,945,000 | 1,983,900 | |
| CCO Holdings LLC/CCO Holdings Capital Corp.: | |||
| 5.125% 2/15/23 | 555,000 | 574,425 | |
| 5.125% 5/1/23 (a) | 2,800,000 | 2,891,000 | |
| 5.5% 5/1/26 (a) | 2,385,000 | 2,443,146 | |
| 5.75% 2/15/26 (a) | 1,450,000 | 1,510,719 | |
| 5.875% 4/1/24 (a) | 1,945,000 | 2,056,838 | |
| 5.875% 5/1/27 (a) | 820,000 | 858,950 | |
| CSC Holdings, Inc. 5.5% 4/15/27 (a) | 2,080,000 | 2,109,900 | |
| RCN Telecom Services LLC/RCN Capital Corp. 8.5% 8/15/20 (a) | 1,465,000 | 1,561,141 | |
| Unitymedia Hessen GmbH & Co. KG/Unitymedia NRW GmbH 5% 1/15/25 (a) | 1,140,000 | 1,155,675 | |
| Virgin Media Secured Finance PLC: | |||
| 5.5% 1/15/25 (a) | 595,000 | 609,875 | |
| 5.5% 8/15/26 (a) | 2,095,000 | 2,113,331 | |
| Ziggo Bond Finance BV: | |||
| 5.875% 1/15/25 (a) | 1,210,000 | 1,200,925 | |
| 6% 1/15/27 (a) | 2,185,000 | 2,145,397 | |
| Ziggo Secured Finance BV 5.5% 1/15/27 (a) | 1,770,000 | 1,747,875 | |
| TOTAL CABLE/SATELLITE TV | 34,281,011 | ||
| Capital Goods - 0.7% | |||
| Belden, Inc. 5.25% 7/15/24 (a) | 335,000 | 337,513 | |
| General Cable Corp. 5.75% 10/1/22 (b) | 1,555,000 | 1,469,475 | |
| J.B. Poindexter & Co., Inc. 9% 4/1/22 (a) | 3,615,000 | 3,797,558 | |
| TOTAL CAPITAL GOODS | 5,604,546 | ||
| Chemicals - 0.9% | |||
| Evolution Escrow Issuer LLC 7.5% 3/15/22 (a) | 2,100,000 | 1,879,500 | |
| LSB Industries, Inc. 8.5% 8/1/19 | 856,000 | 796,080 | |
| Nufarm Australia Ltd. 6.375% 10/15/19 (a) | 3,910,000 | 3,988,200 | |
| Versum Materials, Inc. 5.5% 9/30/24 (a) | 485,000 | 495,913 | |
| TOTAL CHEMICALS | 7,159,693 | ||
| Consumer Products - 0.2% | |||
| Edgewell Personal Care Co. 5.5% 6/15/25 (a) | 1,645,000 | 1,665,563 | |
| Containers - 2.0% | |||
| Ardagh Packaging Finance PLC/Ardagh MP Holdings U.S.A., Inc.: | |||
| 3.8503% 12/15/19 (a)(b) | 2,450,000 | 2,489,813 | |
| 4.067% 5/15/21 (a)(b) | 1,475,000 | 1,504,500 | |
| 4.625% 5/15/23 (a) | 2,450,000 | 2,474,500 | |
| 7% 11/15/20 (a) | 903,529 | 930,635 | |
| 7.25% 5/15/24 (a) | 515,000 | 543,325 | |
| Crown Americas LLC/Crown Americas Capital Corp. V 4.25% 9/30/26 (a) | 1,550,000 | 1,520,938 | |
| Reynolds Group Issuer, Inc./Reynolds Group Issuer LLC/Reynolds Group Issuer (Luxembourg) SA: | |||
| 4.38% 7/15/21 (a)(b) | 990,000 | 1,009,800 | |
| 5.125% 7/15/23 (a) | 2,030,000 | 2,083,917 | |
| 5.75% 10/15/20 | 3,455,000 | 3,545,797 | |
| TOTAL CONTAINERS | 16,103,225 | ||
| Diversified Financial Services - 4.2% | |||
| AerCap Ireland Capital Ltd./AerCap Global Aviation Trust: | |||
| 3.95% 2/1/22 | 1,925,000 | 1,961,999 | |
| 4.625% 7/1/22 | 1,410,000 | 1,471,688 | |
| Aircastle Ltd. 5% 4/1/23 | 490,000 | 507,150 | |
| FLY Leasing Ltd.: | |||
| 6.375% 10/15/21 | 785,000 | 802,663 | |
| 6.75% 12/15/20 | 2,710,000 | 2,825,175 | |
| Icahn Enterprises LP/Icahn Enterprises Finance Corp.: | |||
| 4.875% 3/15/19 | 1,090,000 | 1,083,089 | |
| 5.875% 2/1/22 | 3,835,000 | 3,648,044 | |
| 6% 8/1/20 | 4,120,000 | 4,047,900 | |
| ILFC E-Capital Trust I 4% 12/21/65 (a)(b) | 2,555,000 | 2,037,613 | |
| ILFC E-Capital Trust II 4.25% 12/21/65 (a)(b) | 4,420,000 | 3,591,250 | |
| Inception Merger Sub, Inc./Rackspace Hosting, Inc. 8.625% 11/15/24 (a) | 725,000 | 725,000 | |
| MSCI, Inc.: | |||
| 4.75% 8/1/26 (a) | 870,000 | 876,525 | |
| 5.25% 11/15/24 (a) | 1,855,000 | 1,947,750 | |
| Navient Corp.: | |||
| 5% 10/26/20 | 190,000 | 187,625 | |
| 5.875% 3/25/21 | 650,000 | 650,813 | |
| 5.875% 10/25/24 | 635,000 | 566,738 | |
| SLM Corp.: | |||
| 4.875% 6/17/19 | 4,765,000 | 4,806,694 | |
| 5.5% 1/15/19 | 1,100,000 | 1,122,000 | |
| 5.5% 1/25/23 | 550,000 | 499,125 | |
| Springleaf Financial Corp. 7.75% 10/1/21 | 1,270,000 | 1,323,213 | |
| TOTAL DIVERSIFIED FINANCIAL SERVICES | 34,682,054 | ||
| Diversified Media - 0.5% | |||
| MDC Partners, Inc. 6.5% 5/1/24 (a) | 2,290,000 | 1,952,225 | |
| National CineMedia LLC 5.75% 8/15/26 (a) | 965,000 | 993,950 | |
| WMG Acquisition Corp. 6.75% 4/15/22 (a) | 1,407,000 | 1,486,144 | |
| TOTAL DIVERSIFIED MEDIA | 4,432,319 | ||
| Energy - 12.6% | |||
| Antero Resources Corp.: | |||
| 5.125% 12/1/22 | 2,685,000 | 2,705,138 | |
| 5.625% 6/1/23 (Reg. S) | 690,000 | 703,800 | |
| Antero Resources Finance Corp. 5.375% 11/1/21 | 510,000 | 517,650 | |
| Cheniere Corpus Christi Holdings LLC 7% 6/30/24 (a) | 1,035,000 | 1,097,100 | |
| Chesapeake Energy Corp.: | |||
| 4.875% 4/15/22 | 1,455,000 | 1,236,750 | |
| 5.75% 3/15/23 | 735,000 | 635,775 | |
| 6.125% 2/15/21 | 855,000 | 782,325 | |
| 8% 12/15/22 (a) | 2,835,000 | 2,875,753 | |
| Citgo Holding, Inc. 10.75% 2/15/20 (a) | 320,000 | 326,720 | |
| Citgo Petroleum Corp. 6.25% 8/15/22 (a) | 1,035,000 | 1,058,288 | |
| Concho Resources, Inc. 5.5% 4/1/23 | 615,000 | 629,145 | |
| CVR Refining LLC/Coffeyville Finance, Inc. 6.5% 11/1/22 | 2,440,000 | 2,257,000 | |
| Denbury Resources, Inc.: | |||
| 4.625% 7/15/23 | 1,760,000 | 1,280,400 | |
| 6.375% 8/15/21 | 1,555,000 | 1,286,763 | |
| Endeavor Energy Resources LP/EER Finance, Inc. 7% 8/15/21 (a) | 3,960,000 | 4,029,300 | |
| Ensco PLC: | |||
| 4.5% 10/1/24 | 1,150,000 | 920,000 | |
| 4.7% 3/15/21 | 1,305,000 | 1,205,168 | |
| 5.2% 3/15/25 | 2,970,000 | 2,415,917 | |
| EP Energy LLC/Everest Acquisition Finance, Inc. 9.375% 5/1/20 | 1,765,000 | 1,385,525 | |
| Exterran Partners LP/EXLP Finance Corp.: | |||
| 6% 4/1/21 | 2,755,000 | 2,624,138 | |
| 6% 10/1/22 | 965,000 | 909,513 | |
| Ferrellgas LP/Ferrellgas Finance Corp.: | |||
| 6.75% 1/15/22 | 35,000 | 32,813 | |
| 6.75% 6/15/23 (b) | 680,000 | 634,100 | |
| Forbes Energy Services Ltd. 9% 6/15/19 (c) | 2,510,000 | 627,500 | |
| Forum Energy Technologies, Inc. 6.25% 10/1/21 | 1,525,000 | 1,509,750 | |
| Gibson Energy, Inc. 6.75% 7/15/21 (a) | 2,425,000 | 2,491,688 | |
| Halcon Resources Corp. 8.625% 2/1/20 (a) | 2,570,000 | 2,621,400 | |
| Hilcorp Energy I LP/Hilcorp Finance Co.: | |||
| 5% 12/1/24 (a) | 925,000 | 901,875 | |
| 5.75% 10/1/25 (a) | 1,110,000 | 1,112,775 | |
| Noble Holding International Ltd. 4.625% 3/1/21 | 3,470,000 | 2,930,297 | |
| NRG Yield Operating LLC 5% 9/15/26 (a) | 1,540,000 | 1,493,800 | |
| PBF Holding Co. LLC/PBF Finance Corp. 8.25% 2/15/20 | 155,000 | 158,100 | |
| PBF Logistics LP/PBF Logistics Finance, Inc. 6.875% 5/15/23 | 2,330,000 | 2,260,100 | |
| Pride International, Inc. 6.875% 8/15/20 | 1,700,000 | 1,729,750 | |
| Rice Energy, Inc.: | |||
| 6.25% 5/1/22 | 6,290,000 | 6,400,075 | |
| 7.25% 5/1/23 | 3,595,000 | 3,810,700 | |
| Sabine Pass Liquefaction LLC: | |||
| 5% 3/15/27 (a) | 1,745,000 | 1,775,538 | |
| 5.625% 2/1/21 (b) | 1,265,000 | 1,331,413 | |
| 5.625% 3/1/25 | 4,285,000 | 4,534,173 | |
| 5.75% 5/15/24 | 3,025,000 | 3,198,938 | |
| 5.875% 6/30/26 (a) | 1,490,000 | 1,605,773 | |
| 6.25% 3/15/22 | 1,060,000 | 1,160,700 | |
| Southwestern Energy Co.: | |||
| 5.8% 1/23/20 (b) | 1,145,000 | 1,139,275 | |
| 6.7% 1/23/25 (b) | 645,000 | 614,363 | |
| Sunoco LP/Sunoco Finance Corp.: | |||
| 5.5% 8/1/20 | 1,680,000 | 1,705,200 | |
| 6.25% 4/15/21 | 1,255,000 | 1,286,375 | |
| Targa Resources Partners LP/Targa Resources Partners Finance Corp.: | |||
| 4.125% 11/15/19 | 1,130,000 | 1,139,888 | |
| 5.125% 2/1/25 (a) | 470,000 | 468,825 | |
| 5.25% 5/1/23 | 265,000 | 263,039 | |
| 5.375% 2/1/27 (a) | 470,000 | 470,000 | |
| 6.75% 3/15/24 | 2,005,000 | 2,145,350 | |
| Teine Energy Ltd. 6.875% 9/30/22 (a) | 2,745,000 | 2,793,038 | |
| TerraForm Power Operating LLC 9.375% 2/1/23 (a)(b) | 1,295,000 | 1,298,238 | |
| Tesoro Logistics LP/Tesoro Logistics Finance Corp.: | |||
| 6.125% 10/15/21 | 545,000 | 570,206 | |
| 6.25% 10/15/22 | 3,205,000 | 3,397,300 | |
| The Williams Companies, Inc.: | |||
| 3.7% 1/15/23 | 1,440,000 | 1,393,200 | |
| 4.55% 6/24/24 | 1,920,000 | 1,953,600 | |
| Transocean, Inc. 6.8% 3/15/38 | 875,000 | 575,313 | |
| Weatherford International Ltd.: | |||
| 4.5% 4/15/22 | 1,035,000 | 931,500 | |
| 7.75% 6/15/21 | 1,110,000 | 1,121,100 | |
| 8.25% 6/15/23 | 1,725,000 | 1,785,375 | |
| Whiting Petroleum Corp.: | |||
| 5% 3/15/19 | 225,000 | 213,750 | |
| 6.5% 10/1/18 | 1,910,000 | 1,881,350 | |
| WPX Energy, Inc.: | |||
| 5.25% 9/15/24 | 1,265,000 | 1,201,750 | |
| 6% 1/15/22 | 970,000 | 967,575 | |
| 7.5% 8/1/20 | 1,010,000 | 1,064,288 | |
| TOTAL ENERGY | 103,583,324 | ||
| Entertainment/Film - 0.1% | |||
| New Cotai LLC/New Cotai Capital Corp. 10.625% 5/1/19 pay-in-kind (a)(b) | 1,530,255 | 821,556 | |
| Environmental - 0.5% | |||
| ADS Waste Holdings, Inc. 5.625% 11/15/24 (a)(d) | 800,000 | 804,000 | |
| LBC Tank Terminals Holding Netherlands BV 6.875% 5/15/23 (a) | 3,403,000 | 3,411,508 | |
| TOTAL ENVIRONMENTAL | 4,215,508 | ||
| Food & Drug Retail - 1.2% | |||
| Albertsons Companies LLC/Safeway, Inc./New Albertson's, Inc./Albertson's LLC: | |||
| 5.75% 3/15/25 (a) | 1,700,000 | 1,678,223 | |
| 6.625% 6/15/24 (a) | 865,000 | 897,438 | |
| Albertsons, Inc.: | |||
| 6.625% 6/1/28 | 275,000 | 242,963 | |
| 7.45% 8/1/29 | 250,000 | 240,625 | |
| 7.75% 6/15/26 | 295,000 | 292,788 | |
| 8% 5/1/31 | 1,570,000 | 1,526,825 | |
| 8.7% 5/1/30 | 220,000 | 223,300 | |
| BI-LO LLC/BI-LO Finance Corp. 9.25% 2/15/19 (a) | 1,315,000 | 1,140,763 | |
| Tesco PLC 6.15% 11/15/37 (a) | 2,335,000 | 2,328,936 | |
| Tops Holding LLC/Tops Markets II Corp. 8% 6/15/22 (a) | 1,120,000 | 985,600 | |
| TOTAL FOOD & DRUG RETAIL | 9,557,461 | ||
| Food/Beverage/Tobacco - 3.1% | |||
| C&S Group Enterprises LLC 5.375% 7/15/22 (a) | 325,000 | 315,250 | |
| ESAL GmbH 6.25% 2/5/23 (a) | 8,775,000 | 8,445,938 | |
| JBS Investments GmbH: | |||
| 7.25% 4/3/24 (a) | 530,000 | 535,300 | |
| 7.75% 10/28/20 (a) | 2,200,000 | 2,293,500 | |
| JBS U.S.A. LLC/JBS U.S.A. Finance, Inc.: | |||
| 5.875% 7/15/24 (a) | 1,530,000 | 1,537,650 | |
| 7.25% 6/1/21 (a) | 1,850,000 | 1,896,250 | |
| 8.25% 2/1/20 (a) | 4,220,000 | 4,336,050 | |
| Minerva Luxembourg SA 6.5% 9/20/26 (a) | 1,705,000 | 1,669,877 | |
| Vector Group Ltd. 7.75% 2/15/21 | 4,415,000 | 4,624,713 | |
| TOTAL FOOD/BEVERAGE/TOBACCO | 25,654,528 | ||
| Gaming - 2.7% | |||
| GLP Capital LP/GLP Financing II, Inc.: | |||
| 4.375% 4/15/21 | 1,080,000 | 1,136,700 | |
| 5.375% 4/15/26 | 340,000 | 361,250 | |
| MCE Finance Ltd. 5% 2/15/21 (a) | 5,375,000 | 5,374,592 | |
| MGM Growth Properties Operating Partnership LP 4.5% 9/1/26 (a) | 1,090,000 | 1,070,925 | |
| Scientific Games Corp.: | |||
| 6.625% 5/15/21 | 4,995,000 | 4,108,388 | |
| 7% 1/1/22 (a) | 720,000 | 765,792 | |
| 10% 12/1/22 | 715,000 | 661,375 | |
| Wynn Macau Ltd. 5.25% 10/15/21 (a) | 8,970,000 | 9,001,305 | |
| TOTAL GAMING | 22,480,327 | ||
| Healthcare - 7.2% | |||
| AMAG Pharmaceuticals, Inc. 7.875% 9/1/23 (a) | 1,175,000 | 1,101,563 | |
| Centene Corp. 4.75% 1/15/25 (d) | 1,585,000 | 1,578,066 | |
| Community Health Systems, Inc.: | |||
| 6.875% 2/1/22 | 1,510,000 | 1,151,375 | |
| 7.125% 7/15/20 | 2,340,000 | 1,889,550 | |
| DaVita HealthCare Partners, Inc.: | |||
| 5% 5/1/25 | 1,305,000 | 1,259,325 | |
| 5.75% 8/15/22 | 625,000 | 640,638 | |
| Endo Finance LLC/Endo Ltd./Endo Finco, Inc. 6% 7/15/23 (a) | 1,950,000 | 1,696,500 | |
| HCA Holdings, Inc.: | |||
| 4.5% 2/15/27 | 2,015,000 | 1,989,813 | |
| 5% 3/15/24 | 1,375,000 | 1,432,063 | |
| 5.25% 6/15/26 | 2,175,000 | 2,272,875 | |
| 5.875% 2/15/26 | 2,730,000 | 2,866,500 | |
| HealthSouth Corp.: | |||
| 5.125% 3/15/23 | 1,535,000 | 1,550,350 | |
| 5.75% 9/15/25 | 3,030,000 | 3,136,050 | |
| Horizon Pharma PLC 6.625% 5/1/23 | 1,455,000 | 1,373,156 | |
| Horizon Pharma, Inc. 8.75% 11/1/24 (a) | 635,000 | 644,525 | |
| IMS Health, Inc. 5% 10/15/26 (a) | 1,060,000 | 1,095,775 | |
| Kindred Healthcare, Inc.: | |||
| 8% 1/15/20 | 2,845,000 | 2,873,450 | |
| 8.75% 1/15/23 | 500,000 | 485,000 | |
| Mallinckrodt International Finance SA/Mallinckrodt CB LLC 5.5% 4/15/25 (a) | 1,615,000 | 1,493,875 | |
| MPT Operating Partnership LP/MPT Finance Corp.: | |||
| 5.25% 8/1/26 | 330,000 | 336,600 | |
| 6.375% 3/1/24 | 895,000 | 964,363 | |
| RegionalCare Hospital Partners Holdings, Inc. 8.25% 5/1/23 (a) | 765,000 | 775,519 | |
| Sabra Health Care LP/Sabra Capital Corp. 5.5% 2/1/21 | 815,000 | 849,638 | |
| Teleflex, Inc. 4.875% 6/1/26 | 625,000 | 640,625 | |
| Tenet Healthcare Corp.: | |||
| 5% 3/1/19 (b) | 1,245,000 | 1,207,264 | |
| 6.75% 6/15/23 | 2,940,000 | 2,701,125 | |
| 8.125% 4/1/22 | 3,200,000 | 3,128,000 | |
| Universal Health Services, Inc. 4.75% 8/1/22 (a) | 1,280,000 | 1,314,560 | |
| Valeant Pharmaceuticals International, Inc.: | |||
| 5.375% 3/15/20 (a) | 5,510,000 | 4,766,150 | |
| 5.625% 12/1/21 (a) | 2,370,000 | 1,943,400 | |
| 5.875% 5/15/23 (a) | 5,000,000 | 3,937,500 | |
| 6.125% 4/15/25 (a) | 3,330,000 | 2,630,700 | |
| 6.75% 8/15/18 (a) | 1,645,000 | 1,605,520 | |
| VPI Escrow Corp. 6.375% 10/15/20 (a) | 2,645,000 | 2,281,313 | |
| TOTAL HEALTHCARE | 59,612,726 | ||
| Homebuilders/Real Estate - 2.3% | |||
| Beazer Homes U.S.A., Inc. 8.75% 3/15/22 (a) | 2,260,000 | 2,401,250 | |
| CalAtlantic Group, Inc.: | |||
| 5.25% 6/1/26 | 1,810,000 | 1,791,900 | |
| 5.875% 11/15/24 | 640,000 | 683,200 | |
| Lennar Corp. 4.75% 4/1/21 | 1,910,000 | 2,023,416 | |
| M/I Homes, Inc. 6.75% 1/15/21 | 1,850,000 | 1,947,125 | |
| PulteGroup, Inc.: | |||
| 4.25% 3/1/21 | 1,545,000 | 1,622,250 | |
| 5% 1/15/27 | 1,035,000 | 1,027,238 | |
| Shea Homes Ltd. Partnership/Corp. 5.875% 4/1/23 (a) | 640,000 | 628,800 | |
| Taylor Morrison Communities, Inc./Monarch Communities, Inc.: | |||
| 5.25% 4/15/21 (a) | 1,075,000 | 1,101,875 | |
| 5.875% 4/15/23 (a) | 760,000 | 801,800 | |
| TRI Pointe Homes, Inc. 5.875% 6/15/24 | 400,000 | 414,500 | |
| VEREIT Operating Partnership LP: | |||
| 4.125% 6/1/21 | 690,000 | 717,600 | |
| 4.875% 6/1/26 | 690,000 | 725,238 | |
| William Lyon Homes, Inc. 7% 8/15/22 | 2,865,000 | 2,979,600 | |
| TOTAL HOMEBUILDERS/REAL ESTATE | 18,865,792 | ||
| Hotels - 0.4% | |||
| ESH Hospitality, Inc. 5.25% 5/1/25 (a) | 1,560,000 | 1,544,400 | |
| Hilton Escrow Issuer LLC 4.25% 9/1/24 (a) | 1,835,000 | 1,839,588 | |
| TOTAL HOTELS | 3,383,988 | ||
| Leisure - 0.5% | |||
| 24 Hour Holdings III LLC 8% 6/1/22 (a) | 2,740,000 | 2,274,200 | |
| NCL Corp. Ltd. 4.625% 11/15/20 (a) | 2,115,000 | 2,141,438 | |
| TOTAL LEISURE | 4,415,638 | ||
| Metals/Mining - 0.7% | |||
| Freeport-McMoRan, Inc.: | |||
| 3.55% 3/1/22 | 2,475,000 | 2,270,813 | |
| 3.875% 3/15/23 | 2,130,000 | 1,922,325 | |
| Lundin Mining Corp. 7.5% 11/1/20 (a) | 390,000 | 414,375 | |
| Signode Industrial Group Lux SA/Signode Industrial Group U.S., Inc. 6.375% 5/1/22 (a) | 1,555,000 | 1,570,550 | |
| TOTAL METALS/MINING | 6,178,063 | ||
| Paper - 0.1% | |||
| Xerium Technologies, Inc. 9.5% 8/15/21 (a) | 1,010,000 | 1,025,150 | |
| Publishing/Printing - 0.8% | |||
| McGraw-Hill Global Education Holdings LLC/McGraw-Hill Global Education Finance 7.875% 5/15/24 (a) | 680,000 | 736,100 | |
| MHGE Parent LLC/MHGE Parent Finance, Inc. 8.5% 8/1/19 pay-in-kind (a)(b) | 5,985,000 | 6,052,331 | |
| TOTAL PUBLISHING/PRINTING | 6,788,431 | ||
| Services - 2.9% | |||
| Anna Merger Sub, Inc. 7.75% 10/1/22 (a) | 500,000 | 428,750 | |
| APX Group, Inc.: | |||
| 6.375% 12/1/19 | 8,925,000 | 9,203,906 | |
| 7.875% 12/1/22 | 2,030,000 | 2,136,595 | |
| 8.75% 12/1/20 | 9,085,000 | 8,789,738 | |
| Aramark Services, Inc. 4.75% 6/1/26 (a) | 1,115,000 | 1,115,000 | |
| Garda World Security Corp.: | |||
| 7.25% 11/15/21 (a) | 170,000 | 162,350 | |
| 7.25% 11/15/21 (a) | 390,000 | 372,450 | |
| United Rentals North America, Inc. 4.625% 7/15/23 | 1,910,000 | 1,972,075 | |
| TOTAL SERVICES | 24,180,864 | ||
| Steel - 0.4% | |||
| Steel Dynamics, Inc. 5.125% 10/1/21 | 3,155,000 | 3,289,088 | |
| Super Retail - 2.7% | |||
| Argos Merger Sub, Inc. 7.125% 3/15/23 (a) | 3,575,000 | 3,740,344 | |
| JC Penney Corp., Inc.: | |||
| 5.65% 6/1/20 | 10,141,000 | 10,039,590 | |
| 5.875% 7/1/23 (a) | 1,210,000 | 1,246,542 | |
| 7.4% 4/1/37 | 3,940,000 | 3,605,100 | |
| 8.125% 10/1/19 | 590,000 | 642,363 | |
| L Brands, Inc.: | |||
| 6.75% 7/1/36 | 1,500,000 | 1,592,250 | |
| 6.875% 11/1/35 | 935,000 | 991,100 | |
| TOTAL SUPER RETAIL | 21,857,289 | ||
| Technology - 6.7% | |||
| Lucent Technologies, Inc.: | |||
| 6.45% 3/15/29 | 10,190,000 | 11,234,430 | |
| 6.5% 1/15/28 | 3,290,000 | 3,503,850 | |
| Micron Technology, Inc.: | |||
| 5.25% 8/1/23 (a) | 540,000 | 529,200 | |
| 5.25% 1/15/24 (a) | 355,000 | 346,125 | |
| 5.5% 2/1/25 | 735,000 | 720,528 | |
| 5.625% 1/15/26 (a) | 1,140,000 | 1,105,800 | |
| NCR Corp.: | |||
| 4.625% 2/15/21 | 580,000 | 587,250 | |
| 5% 7/15/22 | 2,070,000 | 2,102,333 | |
| Nuance Communications, Inc.: | |||
| 5.375% 8/15/20 (a) | 3,550,000 | 3,647,625 | |
| 6% 7/1/24 (a) | 1,995,000 | 2,094,750 | |
| NXP BV/NXP Funding LLC: | |||
| 3.875% 9/1/22 (a) | 2,515,000 | 2,650,181 | |
| 4.125% 6/1/21 (a) | 4,930,000 | 5,262,775 | |
| 4.625% 6/1/23 (a) | 965,000 | 1,056,675 | |
| Open Text Corp. 5.875% 6/1/26 (a) | 3,260,000 | 3,471,900 | |
| Qorvo, Inc.: | |||
| 6.75% 12/1/23 | 2,735,000 | 2,994,825 | |
| 7% 12/1/25 | 3,105,000 | 3,399,975 | |
| Rackspace Hosting, Inc. 6.5% 1/15/24 (a) | 1,150,000 | 1,315,313 | |
| Sensata Technologies BV 5% 10/1/25 (a) | 1,385,000 | 1,419,625 | |
| Sensata Technologies UK Financing Co. PLC 6.25% 2/15/26 (a) | 465,000 | 503,363 | |
| Solera LLC/Solera Finance, Inc. 10.5% 3/1/24 (a) | 2,455,000 | 2,744,248 | |
| Sungard Availability Services Capital, Inc. 8.75% 4/1/22 (a) | 1,055,000 | 727,950 | |
| WideOpenWest Finance LLC/WideOpenWest Capital Corp.: | |||
| 10.25% 7/15/19 | 3,250,000 | 3,412,500 | |
| 13.375% 10/15/19 | 120,000 | 128,400 | |
| TOTAL TECHNOLOGY | 54,959,621 | ||
| Telecommunications - 10.3% | |||
| Altice Financing SA: | |||
| 6.5% 1/15/22 (a) | 390,000 | 407,648 | |
| 6.625% 2/15/23 (a) | 2,410,000 | 2,482,300 | |
| 7.5% 5/15/26 (a) | 4,045,000 | 4,166,350 | |
| Altice Finco SA: | |||
| 7.625% 2/15/25 (a) | 1,380,000 | 1,366,200 | |
| 9.875% 12/15/20 (a) | 6,195,000 | 6,558,956 | |
| Columbus International, Inc. 7.375% 3/30/21 (a) | 9,550,000 | 10,218,500 | |
| DigitalGlobe, Inc. 5.25% 2/1/21 (a) | 5,545,000 | 5,586,588 | |
| Millicom International Cellular SA 6% 3/15/25 (a) | 5,270,000 | 5,319,802 | |
| Neptune Finco Corp.: | |||
| 10.125% 1/15/23 (a) | 1,445,000 | 1,629,238 | |
| 10.875% 10/15/25 (a) | 1,445,000 | 1,661,750 | |
| Sable International Finance Ltd. 6.875% 8/1/22 (a) | 4,550,000 | 4,709,250 | |
| SBA Communications Corp. 4.875% 9/1/24 (a) | 3,960,000 | 3,960,000 | |
| SFR Group SA: | |||
| 6% 5/15/22 (a) | 2,475,000 | 2,537,667 | |
| 6.25% 5/15/24 (a) | 490,000 | 489,691 | |
| Sprint Capital Corp. 6.875% 11/15/28 | 8,625,000 | 7,935,000 | |
| Sprint Communications, Inc.: | |||
| 6% 11/15/22 | 2,860,000 | 2,665,177 | |
| 7% 3/1/20 (a) | 1,115,000 | 1,212,563 | |
| Sprint Corp.: | |||
| 7.25% 9/15/21 | 4,115,000 | 4,212,731 | |
| 7.625% 2/15/25 | 3,170,000 | 3,066,975 | |
| 7.875% 9/15/23 | 2,345,000 | 2,321,550 | |
| T-Mobile U.S.A., Inc.: | |||
| 6% 3/1/23 | 1,500,000 | 1,578,750 | |
| 6.375% 3/1/25 | 2,375,000 | 2,545,715 | |
| 6.625% 4/1/23 | 770,000 | 818,264 | |
| 6.731% 4/28/22 | 1,640,000 | 1,713,800 | |
| Telecom Italia Capital SA: | |||
| 6% 9/30/34 | 1,930,000 | 1,920,350 | |
| 6.375% 11/15/33 | 1,030,000 | 1,055,235 | |
| Wind Acquisition Finance SA 7.375% 4/23/21 (a) | 1,780,000 | 1,828,950 | |
| Zayo Group LLC/Zayo Capital, Inc. 6.375% 5/15/25 | 535,000 | 563,259 | |
| TOTAL TELECOMMUNICATIONS | 84,532,259 | ||
| Transportation Ex Air/Rail - 0.2% | |||
| Navios Maritime Acquisition Corp./Navios Acquisition Finance U.S., Inc. 8.125% 11/15/21 (a) | 1,985,000 | 1,498,675 | |
| Navios South American Logistics, Inc./Navios Logistics Finance U.S., Inc. 7.25% 5/1/22 (a) | 125,000 | 98,750 | |
| TOTAL TRANSPORTATION EX AIR/RAIL | 1,597,425 | ||
| Utilities - 6.1% | |||
| Calpine Corp. 5.25% 6/1/26 (a) | 1,910,000 | 1,938,650 | |
| Dolphin Subsidiary II, Inc. 7.25% 10/15/21 | 5,080,000 | 5,302,250 | |
| DPL, Inc. 6.75% 10/1/19 | 945,000 | 980,438 | |
| Dynegy, Inc.: | |||
| 6.75% 11/1/19 | 2,605,000 | 2,636,494 | |
| 7.375% 11/1/22 | 4,580,000 | 4,416,838 | |
| 7.625% 11/1/24 | 5,435,000 | 5,204,013 | |
| 8% 1/15/25 (a) | 1,295,000 | 1,249,675 | |
| Global Partners LP/GLP Finance Corp.: | |||
| 6.25% 7/15/22 | 2,035,000 | 1,943,425 | |
| 7% 6/15/23 | 4,325,000 | 4,130,375 | |
| NRG Energy, Inc. 6.625% 1/15/27 (a) | 1,550,000 | 1,451,668 | |
| NSG Holdings II LLC/NSG Holdings, Inc. 7.75% 12/15/25 (a) | 8,349,819 | 8,976,055 | |
| PPL Energy Supply LLC 6.5% 6/1/25 | 615,000 | 513,525 | |
| RJS Power Holdings LLC 4.625% 7/15/19 (a)(b) | 5,810,000 | 5,519,500 | |
| The AES Corp.: | |||
| 3.8421% 6/1/19 (b) | 304,000 | 303,620 | |
| 4.875% 5/15/23 | 240,000 | 238,126 | |
| 6% 5/15/26 | 1,500,000 | 1,545,000 | |
| 7.375% 7/1/21 | 3,445,000 | 3,884,238 | |
| TOTAL UTILITIES | 50,233,890 | ||
| TOTAL NONCONVERTIBLE BONDS | |||
| (Cost $652,755,878) | 666,086,787 | ||
| Shares | Value | ||
| Common Stocks - 0.0% | |||
| Energy - 0.0% | |||
| Southwestern Energy Co. (e) | 6,072 | 63,088 | |
| Healthcare - 0.0% | |||
| HealthSouth Corp. warrants 1/17/17 (e) | 2,325 | 3,488 | |
| Telecommunications - 0.0% | |||
| CUI Acquisition Corp. Class E, (e) | 1 | 23,749 | |
| TOTAL COMMON STOCKS | |||
| (Cost $879,038) | 90,325 | ||
| Convertible Preferred Stocks - 0.3% | |||
| Energy - 0.3% | |||
| Southwestern Energy Co. Series B 6.25% | |||
| (Cost $1,817,294) | 102,500 | 2,569,675 | |
| Principal Amount | Value | ||
| Bank Loan Obligations - 10.4% | |||
| Aerospace - 0.5% | |||
| TransDigm, Inc.: | |||
| Tranche D, term loan 3.8316% 6/4/21 (b) | 957,950 | 955,795 | |
| Tranche F, term loan 3.75% 6/9/23 (b) | 3,145,000 | 3,131,256 | |
| TOTAL AEROSPACE | 4,087,051 | ||
| Air Transportation - 0.4% | |||
| Air Canada Tranche B, term loan 3.6143% 10/6/23 (b) | 1,625,000 | 1,627,031 | |
| American Airlines, Inc. Tranche B, term loan 3.25% 10/10/21 (b) | 1,672,929 | 1,673,164 | |
| TOTAL AIR TRANSPORTATION | 3,300,195 | ||
| Broadcasting - 0.5% | |||
| Clear Channel Communications, Inc. Tranche D, term loan 7.2843% 1/30/19 (b) | 2,980,000 | 2,251,241 | |
| Nielsen Finance LLC Tranche B 3LN, term loan 3.0311% 10/4/23 (b) | 1,460,000 | 1,465,709 | |
| TOTAL BROADCASTING | 3,716,950 | ||
| Building Materials - 0.9% | |||
| GYP Holdings III Corp. Tranche B, term loan 4.5% 4/1/21 (b) | 2,994,021 | 2,990,279 | |
| HD Supply, Inc. Tranche B, term loan 3.63% 10/17/23 (b) | 2,495,000 | 2,496,572 | |
| LBM Borrower LLC Tranche B 1LN, term loan 6.25% 8/20/22 (b) | 2,133,450 | 2,131,893 | |
| TOTAL BUILDING MATERIALS | 7,618,744 | ||
| Cable/Satellite TV - 1.0% | |||
| CSC Holdings LLC Tranche B, term loan 3.8761% 10/11/24 (b) | 1,480,263 | 1,484,896 | |
| Numericable LLC: | |||
| Tranche B 6LN, term loan 4.75% 2/10/23 (b) | 2,645,013 | 2,645,013 | |
| Tranche B, term loan 5.1373% 1/15/24 (b) | 293,525 | 295,947 | |
| WideOpenWest Finance LLC Tranche B, term loan 4.5% 8/19/23 (b) | 2,110,000 | 2,104,240 | |
| Ziggo Secured Finance Partnership Tranche D, term loan 3.5346% 8/31/24 (b) | 1,675,000 | 1,674,246 | |
| TOTAL CABLE/SATELLITE TV | 8,204,342 | ||
| Chemicals - 0.0% | |||
| MacDermid, Inc. term loan 5% 6/7/23 (b) | 275,000 | 277,063 | |
| Containers - 0.7% | |||
| Ardagh Holdings U.S.A., Inc. Tranche B, term loan 4% 12/17/21 (b) | 1,138,978 | 1,149,298 | |
| Reynolds Group Holdings, Inc. Tranche B, term loan 4.25% 2/5/23 (b) | 2,715,000 | 2,721,054 | |
| Signode Packaging Systems, Inc. Tranche B, term loan 3.75% 5/1/21 (b) | 1,961,926 | 1,957,021 | |
| TOTAL CONTAINERS | 5,827,373 | ||
| Diversified Financial Services - 0.1% | |||
| IBC Capital U.S. LLC: | |||
| Tranche 2LN, term loan 8% 9/11/22 (b) | 925,000 | 839,438 | |
| Tranche B 1LN, term loan 4.9847% 9/11/21 (b) | 231,475 | 227,616 | |
| TOTAL DIVERSIFIED FINANCIAL SERVICES | 1,067,054 | ||
| Energy - 0.3% | |||
| Chesapeake Energy Corp. Tranche 1LN, term loan 8.5% 8/23/21 (b) | 1,160,000 | 1,239,031 | |
| Crestwood Holdings Partners LLC Tranche B, term loan 9% 6/19/19 (b) | 1,302,507 | 1,224,356 | |
| TOTAL ENERGY | 2,463,387 | ||
| Food & Drug Retail - 0.0% | |||
| Albertson's LLC Tranche B 6LN, term loan 4.75% 6/22/23 (b) | 350,476 | 354,128 | |
| Food/Beverage/Tobacco - 0.1% | |||
| Chobani LLC Tranche B, term loan 5.25% 10/7/23 (b) | 940,000 | 949,992 | |
| Gaming - 0.3% | |||
| Scientific Games Corp. Tranche B 2LN, term loan 6% 10/1/21 (b) | 2,161,500 | 2,169,606 | |
| Healthcare - 0.6% | |||
| Horizon Pharmaceuticals, Inc. term loan 5/7/21 (f) | 140,000 | 140,175 | |
| InVentiv Health, Inc. Tranche B, term loan 9/29/23 (f) | 2,460,000 | 2,458,672 | |
| Valeant Pharmaceuticals International, Inc.: | |||
| Tranche A 3LN, term loan 4.29% 10/20/18 (b) | 947,627 | 944,585 | |
| Tranche BD 2LN, term loan 5% 2/13/19 (b) | 1,454,705 | 1,450,036 | |
| TOTAL HEALTHCARE | 4,993,468 | ||
| Leisure - 0.0% | |||
| 24 Hour Fitness Worldwide, Inc. Tranche B, term loan 4.75% 5/30/21 (b) | 175,950 | 171,771 | |
| Metals/Mining - 0.2% | |||
| Murray Energy Corp. Tranche B 2LN, term loan 8.25% 4/16/20 (b) | 1,460,000 | 1,334,528 | |
| Publishing/Printing - 0.3% | |||
| McGraw-Hill Global Education Holdings, LLC term loan 5% 5/4/22 (b) | 408,975 | 407,867 | |
| Springer Science+Business Media Deutschland GmbH Tranche B 9LN, term loan 4.75% 8/14/20 (b) | 2,000,911 | 1,953,390 | |
| TOTAL PUBLISHING/PRINTING | 2,361,257 | ||
| Services - 1.5% | |||
| Acosta, Inc. Tranche B, term loan 4.25% 9/26/21 (b) | 2,348,081 | 2,256,506 | |
| Brand Energy & Infrastructure Services, Inc. Tranche B, term loan 4.75% 11/26/20 (b) | 2,513,913 | 2,478,894 | |
| Garda World Security Corp.: | |||
| term loan 4% 11/8/20 (b) | 2,798,027 | 2,761,877 | |
| Tranche DD, term loan 4.0039% 11/8/20 (b) | 715,774 | 706,527 | |
| Laureate Education, Inc. Tranche B, term loan 8.8679% 3/17/21 (b) | 2,116,873 | 2,098,351 | |
| Lineage Logistics Holdings, LLC. Tranche B, term loan 4.5% 4/7/21 (b) | 2,394,182 | 2,346,299 | |
| TOTAL SERVICES | 12,648,454 | ||
| Super Retail - 0.3% | |||
| JC Penney Corp., Inc. Tranche B, term loan 5.25% 6/23/23 (b) | 1,648,344 | 1,657,822 | |
| PetSmart, Inc. term loan 4% 3/11/22 (b) | 1,027,179 | 1,029,192 | |
| TOTAL SUPER RETAIL | 2,687,014 | ||
| Technology - 1.7% | |||
| Ceridian HCM Holding, Inc. Tranche B 2LN, term loan 4.5% 9/15/20 (b) | 725,000 | 710,500 | |
| Epicor Software Corp. Tranche B, term loan 4.75% 6/1/22 (b) | 1,321,617 | 1,305,506 | |
| Kronos, Inc. term loan: | |||
| 10/20/23 (f) | 2,835,000 | 2,846,283 | |
| 10/20/24 (f) | 710,000 | 731,201 | |
| ON Semiconductor Corp. term loan 3.7772% 3/31/23 (b) | 1,920,000 | 1,930,560 | |
| Quest Software U.S. Holdings, Inc. Tranche B, term loan 9/27/22 (f) | 1,170,000 | 1,169,123 | |
| Rackspace Hosting, Inc. term loan 10/26/23 (f) | 405,000 | 407,151 | |
| TTM Technologies, Inc. Tranche B 1LN, term loan 5.25% 5/31/21 (b) | 1,614,076 | 1,618,111 | |
| Uber Technologies, Inc. Tranche B, term loan 5% 7/13/23 (b) | 3,240,000 | 3,262,291 | |
| TOTAL TECHNOLOGY | 13,980,726 | ||
| Telecommunications - 0.6% | |||
| LTS Buyer LLC Tranche B 1LN, term loan 4.0877% 4/11/20 (b) | 2,147,258 | 2,149,405 | |
| Polycom, Inc. Tranche B, term loan 7.5% 9/27/23 (b) | 2,490,000 | 2,424,638 | |
| TOTAL TELECOMMUNICATIONS | 4,574,043 | ||
| Utilities - 0.4% | |||
| Moxie Patriot LLC Tranche B, term loan 6.75% 12/19/20 (b) | 3,061,635 | 2,988,921 | |
| TOTAL BANK LOAN OBLIGATIONS | |||
| (Cost $85,245,646) | 85,776,067 | ||
| Preferred Securities - 5.5% | |||
| Banks & Thrifts - 5.2% | |||
| Bank of America Corp.: | |||
| 6.1% (b)(g) | 2,485,000 | 2,615,072 | |
| 6.25% (b)(g) | 1,600,000 | 1,691,746 | |
| 6.5% (b)(g) | 635,000 | 689,996 | |
| Barclays Bank PLC 7.625% 11/21/22 | 5,105,000 | 5,871,929 | |
| Barclays PLC: | |||
| 6.625% (b)(g) | 4,160,000 | 3,852,386 | |
| 8.25% (b)(g) | 5,905,000 | 6,041,715 | |
| BNP Paribas SA 7.375% (a)(b)(g) | 1,905,000 | 1,983,258 | |
| Citigroup, Inc.: | |||
| 5.875% (b)(g) | 785,000 | 801,626 | |
| 5.95% (b)(g) | 1,235,000 | 1,296,733 | |
| 5.95% (b)(g) | 1,135,000 | 1,178,398 | |
| 6.125% (b)(g) | 2,645,000 | 2,839,923 | |
| Credit Agricole SA: | |||
| 6.625% (a)(b)(g) | 6,360,000 | 6,230,245 | |
| 7.875% (a)(b)(g) | 1,480,000 | 1,512,142 | |
| JPMorgan Chase & Co.: | |||
| 6% (b)(g) | 1,280,000 | 1,353,600 | |
| 6.75% (b)(g) | 975,000 | 1,098,703 | |
| Royal Bank of Scotland Group PLC: | |||
| 7.5% (b)(g) | 2,785,000 | 2,573,600 | |
| 8.625% (b)(g) | 1,415,000 | 1,422,064 | |
| TOTAL BANKS & THRIFTS | 43,053,136 | ||
| Diversified Financial Services - 0.3% | |||
| American Express Co. 4.9% (b)(g) | 2,060,000 | 2,034,995 | |
| TOTAL PREFERRED SECURITIES | |||
| (Cost $44,231,874) | 45,088,131 | ||
| Shares | Value | ||
| Money Market Funds - 4.0% | |||
| Fidelity Cash Central Fund, 0.41% (h) | |||
| (Cost $33,239,130) | 33,234,707 | 33,244,678 | |
| TOTAL INVESTMENT PORTFOLIO - 101.0% | |||
| (Cost $818,168,860) | 832,855,663 | ||
| NET OTHER ASSETS (LIABILITIES) - (1.0)% | (8,288,098) | ||
| NET ASSETS - 100% | $824,567,565 |
Legend
(a) Security exempt from registration under Rule 144A of the Securities Act of 1933. These securities may be resold in transactions exempt from registration, normally to qualified institutional buyers. At the end of the period, the value of these securities amounted to $340,189,005 or 41.3% of net assets.
(b) Coupon rates for floating and adjustable rate securities reflect the rates in effect at period end.
(c) Non-income producing - Security is in default.
(d) Security or a portion of the security purchased on a delayed delivery or when-issued basis.
(e) Non-income producing
(f) The coupon rate will be determined upon settlement of the loan after period end.
(g) Security is perpetual in nature with no stated maturity date.
(h) Affiliated fund that is generally available only to investment companies and other accounts managed by Fidelity Investments. The rate quoted is the annualized seven-day yield of the fund at period end. A complete unaudited listing of the fund's holdings as of its most recent quarter end is available upon request. In addition, each Fidelity Central Fund's financial statements, which are not covered by the Fund's Report of Independent Registered Public Accounting Firm, are available on the SEC's website or upon request.
Affiliated Central Funds
Information regarding fiscal year to date income earned by the Fund from investments in Fidelity Central Funds is as follows:
| Fund | Income earned |
| Fidelity Cash Central Fund | $122,777 |
| Total | $122,777 |
Investment Valuation
The following is a summary of the inputs used, as of October 31, 2016, involving the Fund's assets and liabilities carried at fair value. The inputs or methodology used for valuing securities may not be an indication of the risk associated with investing in those securities. For more information on valuation inputs, and their aggregation into the levels used below, please refer to the Investment Valuation section in the accompanying Notes to Financial Statements.
| Valuation Inputs at Reporting Date: | ||||
| Description | Total | Level 1 | Level 2 | Level 3 |
| Investments in Securities: | ||||
| Equities: | ||||
| Energy | $2,632,763 | $2,632,763 | $-- | $-- |
| Health Care | 3,488 | 3,488 | -- | -- |
| Telecommunication Services | 23,749 | -- | -- | 23,749 |
| Corporate Bonds | 666,086,787 | -- | 666,086,787 | -- |
| Bank Loan Obligations | 85,776,067 | -- | 85,776,067 | -- |
| Preferred Securities | 45,088,131 | -- | 45,088,131 | -- |
| Money Market Funds | 33,244,678 | 33,244,678 | -- | -- |
| Total Investments in Securities: | $832,855,663 | $35,880,929 | $796,950,985 | $23,749 |
Other Information
Distribution of investments by country or territory of incorporation, as a percentage of Total Net Assets, is as follows (Unaudited):
| United States of America | 73.6% |
| Luxembourg | 4.5% |
| Canada | 4.3% |
| United Kingdom | 3.7% |
| Cayman Islands | 2.9% |
| Netherlands | 2.4% |
| Ireland | 2.1% |
| France | 1.6% |
| Austria | 1.4% |
| Barbados | 1.2% |
| Others (Individually Less Than 1%) | 2.3% |
| 100.0% |
See accompanying notes which are an integral part of the financial statements.
Financial Statements
Statement of Assets and Liabilities
| October 31, 2016 | ||
| Assets | ||
| Investment in securities, at value — See accompanying schedule: Unaffiliated issuers (cost $784,929,730) | $799,610,985 | |
| Fidelity Central Funds (cost $33,239,130) | 33,244,678 | |
| Total Investments (cost $818,168,860) | $832,855,663 | |
| Cash | 583,775 | |
| Receivable for investments sold | 3,738,484 | |
| Receivable for fund shares sold | 1,045,051 | |
| Interest receivable | 11,818,285 | |
| Distributions receivable from Fidelity Central Funds | 11,252 | |
| Prepaid expenses | 2,208 | |
| Other receivables | 13 | |
| Total assets | 850,054,731 | |
| Liabilities | ||
| Payable for investments purchased | ||
| Regular delivery | $20,814,931 | |
| Delayed delivery | 2,385,000 | |
| Payable for fund shares redeemed | 1,200,012 | |
| Distributions payable | 343,175 | |
| Accrued management fee | 390,709 | |
| Distribution and service plan fees payable | 143,789 | |
| Other affiliated payables | 148,931 | |
| Other payables and accrued expenses | 60,619 | |
| Total liabilities | 25,487,166 | |
| Net Assets | $824,567,565 | |
| Net Assets consist of: | ||
| Paid in capital | $855,317,456 | |
| Undistributed net investment income | 3,588,662 | |
| Accumulated undistributed net realized gain (loss) on investments | (49,025,356) | |
| Net unrealized appreciation (depreciation) on investments | 14,686,803 | |
| Net Assets | $824,567,565 | |
| Calculation of Maximum Offering Price | ||
| Class A: | ||
| Net Asset Value and redemption price per share ($223,619,762 ÷ 28,943,294 shares) | $7.73 | |
| Maximum offering price per share (100/96.00 of $7.73) | $8.05 | |
| Class T: | ||
| Net Asset Value and redemption price per share ($70,205,309 ÷ 9,105,734 shares) | $7.71 | |
| Maximum offering price per share (100/96.00 of $7.71) | $8.03 | |
| Class C: | ||
| Net Asset Value and offering price per share ($97,832,773 ÷ 12,701,108 shares)(a) | $7.70 | |
| Class I: | ||
| Net Asset Value, offering price and redemption price per share ($432,909,721 ÷ 55,931,424 shares) | $7.74 |
(a) Redemption price per share is equal to net asset value less any applicable contingent deferred sales charge.
See accompanying notes which are an integral part of the financial statements.
Statement of Operations
| Year ended October 31, 2016 | ||
| Investment Income | ||
| Dividends | $3,554,734 | |
| Interest | 49,329,045 | |
| Income from Fidelity Central Funds | 122,777 | |
| Total income | 53,006,556 | |
| Expenses | ||
| Management fee | $4,420,587 | |
| Transfer agent fees | 1,453,929 | |
| Distribution and service plan fees | 1,665,085 | |
| Accounting fees and expenses | 294,494 | |
| Custodian fees and expenses | 15,921 | |
| Independent trustees' fees and expenses | 3,370 | |
| Registration fees | 112,823 | |
| Audit | 76,036 | |
| Legal | 7,361 | |
| Miscellaneous | 6,346 | |
| Total expenses before reductions | 8,055,952 | |
| Expense reductions | (4,113) | 8,051,839 |
| Net investment income (loss) | 44,954,717 | |
| Realized and Unrealized Gain (Loss) | ||
| Net realized gain (loss) on: | ||
| Investment securities: | ||
| Unaffiliated issuers | (34,382,025) | |
| Fidelity Central Funds | 4,957 | |
| Total net realized gain (loss) | (34,377,068) | |
| Change in net unrealized appreciation (depreciation) on investment securities | 46,532,275 | |
| Net gain (loss) | 12,155,207 | |
| Net increase (decrease) in net assets resulting from operations | $57,109,924 |
See accompanying notes which are an integral part of the financial statements.
Statement of Changes in Net Assets
| Year ended October 31, 2016 | Year ended October 31, 2015 | |
| Increase (Decrease) in Net Assets | ||
| Operations | ||
| Net investment income (loss) | $44,954,717 | $40,937,328 |
| Net realized gain (loss) | (34,377,068) | (15,332,048) |
| Change in net unrealized appreciation (depreciation) | 46,532,275 | (36,538,640) |
| Net increase (decrease) in net assets resulting from operations | 57,109,924 | (10,933,360) |
| Distributions to shareholders from net investment income | (41,784,482) | (40,319,540) |
| Distributions to shareholders from net realized gain | – | (19,111,871) |
| Total distributions | (41,784,482) | (59,431,411) |
| Share transactions - net increase (decrease) | 39,446,842 | 48,705,392 |
| Redemption fees | 201,553 | 50,007 |
| Total increase (decrease) in net assets | 54,973,837 | (21,609,372) |
| Net Assets | ||
| Beginning of period | 769,593,728 | 791,203,100 |
| End of period | $824,567,565 | $769,593,728 |
| Other Information | ||
| Undistributed net investment income end of period | $3,588,662 | $968,618 |
See accompanying notes which are an integral part of the financial statements.
Financial Highlights — Fidelity Advisor High Income Fund Class A
| Years ended October 31, | 2016 | 2015 | 2014 | 2013 | 2012 |
| Selected Per–Share Data | |||||
| Net asset value, beginning of period | $7.61 | $8.33 | $8.77 | $8.73 | $8.38 |
| Income from Investment Operations | |||||
| Net investment income (loss)A | .421 | .430 | .432 | .473 | .539 |
| Net realized and unrealized gain (loss) | .089 | (.523) | (.058) | .117 | .411 |
| Total from investment operations | .510 | (.093) | .374 | .590 | .950 |
| Distributions from net investment income | (.392) | (.424) | (.429) | (.457) | (.551) |
| Distributions from net realized gain | – | (.204) | (.386) | (.094) | (.050) |
| Total distributions | (.392) | (.628) | (.815) | (.551) | (.601) |
| Redemption fees added to paid in capitalA | .002 | .001 | .001 | .001 | .001 |
| Net asset value, end of period | $7.73 | $7.61 | $8.33 | $8.77 | $8.73 |
| Total ReturnB,C | 7.09% | (1.13)% | 4.51% | 6.99% | 11.84% |
| Ratios to Average Net AssetsD,E | |||||
| Expenses before reductions | 1.04% | 1.03% | 1.03% | 1.03% | 1.03% |
| Expenses net of fee waivers, if any | 1.04% | 1.03% | 1.03% | 1.03% | 1.03% |
| Expenses net of all reductions | 1.04% | 1.03% | 1.03% | 1.03% | 1.03% |
| Net investment income (loss) | 5.68% | 5.45% | 5.09% | 5.40% | 6.35% |
| Supplemental Data | |||||
| Net assets, end of period (000 omitted) | $223,620 | $227,596 | $243,987 | $280,769 | $331,436 |
| Portfolio turnover rateF | 61% | 60% | 79% | 76% | 48% |
A Calculated based on average shares outstanding during the period.
B Total returns would have been lower if certain expenses had not been reduced during the applicable periods shown.
C Total returns do not include the effect of the sales charges.
D Fees and expenses of any underlying Fidelity Central Funds are not included in the Fund's expense ratio. The Fund indirectly bears its proportionate share of the expenses of any underlying Fidelity Central Funds.
E Expense ratios reflect operating expenses of the class. Expenses before reductions do not reflect amounts reimbursed by the investment adviser or reductions from brokerage service arrangements or reductions from other expense offset arrangements and do not represent the amount paid by the class during periods when reimbursements or reductions occur. Expenses net of fee waivers reflect expenses after reimbursement by the investment adviser but prior to reductions from brokerage service arrangements or other expense offset arrangements. Expenses net of all reductions represent the net expenses paid by the class.
F Amount does not include the portfolio activity of any underlying Fidelity Central Funds.
See accompanying notes which are an integral part of the financial statements.
Financial Highlights — Fidelity Advisor High Income Fund Class T
| Years ended October 31, | 2016 | 2015 | 2014 | 2013 | 2012 |
| Selected Per–Share Data | |||||
| Net asset value, beginning of period | $7.59 | $8.31 | $8.76 | $8.72 | $8.37 |
| Income from Investment Operations | |||||
| Net investment income (loss)A | .418 | .428 | .429 | .469 | .536 |
| Net realized and unrealized gain (loss) | .089 | (.524) | (.067) | .119 | .411 |
| Total from investment operations | .507 | (.096) | .362 | .588 | .947 |
| Distributions from net investment income | (.389) | (.421) | (.427) | (.455) | (.548) |
| Distributions from net realized gain | – | (.204) | (.386) | (.094) | (.050) |
| Total distributions | (.389) | (.625) | (.813) | (.549) | (.598) |
| Redemption fees added to paid in capitalA | .002 | .001 | .001 | .001 | .001 |
| Net asset value, end of period | $7.71 | $7.59 | $8.31 | $8.76 | $8.72 |
| Total ReturnB,C | 7.06% | (1.16)% | 4.38% | 6.97% | 11.83% |
| Ratios to Average Net AssetsD,E | |||||
| Expenses before reductions | 1.06% | 1.05% | 1.05% | 1.05% | 1.06% |
| Expenses net of fee waivers, if any | 1.06% | 1.05% | 1.05% | 1.05% | 1.06% |
| Expenses net of all reductions | 1.06% | 1.05% | 1.05% | 1.05% | 1.06% |
| Net investment income (loss) | 5.65% | 5.43% | 5.07% | 5.38% | 6.32% |
| Supplemental Data | |||||
| Net assets, end of period (000 omitted) | $70,205 | $79,379 | $86,166 | $90,901 | $105,518 |
| Portfolio turnover rateF | 61% | 60% | 79% | 76% | 48% |
A Calculated based on average shares outstanding during the period.
B Total returns would have been lower if certain expenses had not been reduced during the applicable periods shown.
C Total returns do not include the effect of the sales charges.
D Fees and expenses of any underlying Fidelity Central Funds are not included in the Fund's expense ratio. The Fund indirectly bears its proportionate share of the expenses of any underlying Fidelity Central Funds.
E Expense ratios reflect operating expenses of the class. Expenses before reductions do not reflect amounts reimbursed by the investment adviser or reductions from brokerage service arrangements or reductions from other expense offset arrangements and do not represent the amount paid by the class during periods when reimbursements or reductions occur. Expenses net of fee waivers reflect expenses after reimbursement by the investment adviser but prior to reductions from brokerage service arrangements or other expense offset arrangements. Expenses net of all reductions represent the net expenses paid by the class.
F Amount does not include the portfolio activity of any underlying Fidelity Central Funds.
See accompanying notes which are an integral part of the financial statements.
Financial Highlights — Fidelity Advisor High Income Fund Class C
| Years ended October 31, | 2016 | 2015 | 2014 | 2013 | 2012 |
| Selected Per–Share Data | |||||
| Net asset value, beginning of period | $7.59 | $8.30 | $8.75 | $8.71 | $8.36 |
| Income from Investment Operations | |||||
| Net investment income (loss)A | .363 | .370 | .365 | .405 | .474 |
| Net realized and unrealized gain (loss) | .079 | (.515) | (.066) | .119 | .412 |
| Total from investment operations | .442 | (.145) | .299 | .524 | .886 |
| Distributions from net investment income | (.334) | (.362) | (.364) | (.391) | (.487) |
| Distributions from net realized gain | – | (.204) | (.386) | (.094) | (.050) |
| Total distributions | (.334) | (.566) | (.750) | (.485) | (.537) |
| Redemption fees added to paid in capitalA | .002 | .001 | .001 | .001 | .001 |
| Net asset value, end of period | $7.70 | $7.59 | $8.30 | $8.75 | $8.71 |
| Total ReturnB,C | 6.14% | (1.78)% | 3.60% | 6.20% | 11.03% |
| Ratios to Average Net AssetsD,E | |||||
| Expenses before reductions | 1.80% | 1.80% | 1.80% | 1.79% | 1.79% |
| Expenses net of fee waivers, if any | 1.80% | 1.80% | 1.80% | 1.79% | 1.79% |
| Expenses net of all reductions | 1.80% | 1.80% | 1.80% | 1.79% | 1.79% |
| Net investment income (loss) | 4.91% | 4.68% | 4.32% | 4.64% | 5.60% |
| Supplemental Data | |||||
| Net assets, end of period (000 omitted) | $97,833 | $94,752 | $114,455 | $126,952 | $149,591 |
| Portfolio turnover rateF | 61% | 60% | 79% | 76% | 48% |
A Calculated based on average shares outstanding during the period.
B Total returns would have been lower if certain expenses had not been reduced during the applicable periods shown.
C Total returns do not include the effect of the contingent deferred sales charge.
D Fees and expenses of any underlying Fidelity Central Funds are not included in the Fund's expense ratio. The Fund indirectly bears its proportionate share of the expenses of any underlying Fidelity Central Funds.
E Expense ratios reflect operating expenses of the class. Expenses before reductions do not reflect amounts reimbursed by the investment adviser or reductions from brokerage service arrangements or reductions from other expense offset arrangements and do not represent the amount paid by the class during periods when reimbursements or reductions occur. Expenses net of fee waivers reflect expenses after reimbursement by the investment adviser but prior to reductions from brokerage service arrangements or other expense offset arrangements. Expenses net of all reductions represent the net expenses paid by the class.
F Amount does not include the portfolio activity of any underlying Fidelity Central Funds.
See accompanying notes which are an integral part of the financial statements.
Financial Highlights — Fidelity Advisor High Income Fund Class I
| Years ended October 31, | 2016 | 2015 | 2014 | 2013 | 2012 |
| Selected Per–Share Data | |||||
| Net asset value, beginning of period | $7.62 | $8.34 | $8.79 | $8.75 | $8.40 |
| Income from Investment Operations | |||||
| Net investment income (loss)A | .438 | .445 | .447 | .489 | .556 |
| Net realized and unrealized gain (loss) | .089 | (.523) | (.068) | .116 | .409 |
| Total from investment operations | .527 | (.078) | .379 | .605 | .965 |
| Distributions from net investment income | (.409) | (.439) | (.444) | (.472) | (.566) |
| Distributions from net realized gain | – | (.204) | (.386) | (.094) | (.050) |
| Total distributions | (.409) | (.643) | (.830) | (.566) | (.616) |
| Redemption fees added to paid in capitalA | .002 | .001 | .001 | .001 | .001 |
| Net asset value, end of period | $7.74 | $7.62 | $8.34 | $8.79 | $8.75 |
| Total ReturnB | 7.31% | (.94)% | 4.57% | 7.16% | 12.02% |
| Ratios to Average Net AssetsC,D | |||||
| Expenses before reductions | .82% | .87% | .87% | .87% | .88% |
| Expenses net of fee waivers, if any | .82% | .85% | .85% | .85% | .85% |
| Expenses net of all reductions | .82% | .85% | .85% | .85% | .85% |
| Net investment income (loss) | 5.89% | 5.63% | 5.27% | 5.58% | 6.54% |
| Supplemental Data | |||||
| Net assets, end of period (000 omitted) | $432,910 | $361,760 | $337,377 | $358,238 | $423,792 |
| Portfolio turnover rateE | 61% | 60% | 79% | 76% | 48% |
A Calculated based on average shares outstanding during the period.
B Total returns would have been lower if certain expenses had not been reduced during the applicable periods shown.
C Fees and expenses of any underlying Fidelity Central Funds are not included in the Fund's expense ratio. The Fund indirectly bears its proportionate share of the expenses of any underlying Fidelity Central Funds.
D Expense ratios reflect operating expenses of the class. Expenses before reductions do not reflect amounts reimbursed by the investment adviser or reductions from brokerage service arrangements or reductions from other expense offset arrangements and do not represent the amount paid by the class during periods when reimbursements or reductions occur. Expenses net of fee waivers reflect expenses after reimbursement by the investment adviser but prior to reductions from brokerage service arrangements or other expense offset arrangements. Expenses net of all reductions represent the net expenses paid by the class.
E Amount does not include the portfolio activity of any underlying Fidelity Central Funds.
See accompanying notes which are an integral part of the financial statements.
Notes to Financial Statements
For the period ended October 31, 2016
1. Organization.
Fidelity Advisor High Income Fund (the Fund) is a fund of Fidelity Advisor Series I (the Trust) and is authorized to issue an unlimited number of shares. The Trust is registered under the Investment Company Act of 1940, as amended (the 1940 Act), as an open-end management investment company organized as a Massachusetts business trust. The Fund offers Class A, Class T, Class C and Class I shares, each of which has equal rights as to assets and voting privileges. Each class has exclusive voting rights with respect to matters that affect that class.
After the close of business on June 24, 2016, all outstanding Class B shares were converted to Class A shares. All current fiscal period dollar and share amounts for Class B presented in the Notes to Financial Statements are for the period November 1, 2015 through June 24, 2016.
2. Investments in Fidelity Central Funds.
The Fund invests in Fidelity Central Funds, which are open-end investment companies generally available only to other investment companies and accounts managed by the investment adviser and its affiliates. The Fund's Schedule of Investments lists each of the Fidelity Central Funds held as of period end, if any, as an investment of the Fund, but does not include the underlying holdings of each Fidelity Central Fund. As an Investing Fund, the Fund indirectly bears its proportionate share of the expenses of the underlying Fidelity Central Funds.
The Money Market Central Funds seek preservation of capital and current income and are managed by Fidelity Investments Money Management, Inc. (FIMM), an affiliate of the investment adviser. Annualized expenses of the Money Market Central Funds as of their most recent shareholder report date are less than .005%.
A complete unaudited list of holdings for each Fidelity Central Fund is available upon request or at the Securities and Exchange Commission (the SEC) website at www.sec.gov. In addition, the financial statements of the Fidelity Central Funds, which are not covered by the Fund's Report of Independent Registered Public Accounting Firm, are available on the SEC website or upon request.
3. Significant Accounting Policies.
The financial statements have been prepared in conformity with accounting principles generally accepted in the United States of America (GAAP), which require management to make certain estimates and assumptions at the date of the financial statements. Actual results could differ from those estimates. Subsequent events, if any, through the date that the financial statements were issued have been evaluated in the preparation of the financial statements. The following summarizes the significant accounting policies of the Fund:
Investment Valuation. Investments are valued as of 4:00 p.m. Eastern time on the last calendar day of the period. The Board of Trustees (the Board) has delegated the day to day responsibility for the valuation of the Fund's investments to the Fair Value Committee (the Committee) established by the Fund's investment adviser. In accordance with valuation policies and procedures approved by the Board, the Fund attempts to obtain prices from one or more third party pricing vendors or brokers to value its investments. When current market prices, quotations or currency exchange rates are not readily available or reliable, investments will be fair valued in good faith by the Committee, in accordance with procedures adopted by the Board. Factors used in determining fair value vary by investment type and may include market or investment specific events, changes in interest rates and credit quality. The frequency with which these procedures are used cannot be predicted and they may be utilized to a significant extent. The Committee oversees the Fund's valuation policies and procedures and reports to the Board on the Committee's activities and fair value determinations. The Board monitors the appropriateness of the procedures used in valuing the Fund's investments and ratifies the fair value determinations of the Committee.
The Fund categorizes the inputs to valuation techniques used to value its investments into a disclosure hierarchy consisting of three levels as shown below:
- Level 1 – quoted prices in active markets for identical investments
- Level 2 – other significant observable inputs (including quoted prices for similar investments, interest rates, prepayment speeds, etc.)
- Level 3 – unobservable inputs (including the Fund's own assumptions based on the best information available)
Valuation techniques used to value the Fund's investments by major category are as follows:
Debt securities, including restricted securities, are valued based on evaluated prices received from third party pricing vendors or from brokers who make markets in such securities. Corporate bonds, bank loan obligations and preferred securities are valued by pricing vendors who utilize matrix pricing which considers yield or price of bonds of comparable quality, coupon, maturity and type or by broker-supplied prices. When independent prices are unavailable or unreliable, debt securities may be valued utilizing pricing methodologies which consider similar factors that would be used by third party pricing vendors. Debt securities are generally categorized as Level 2 in the hierarchy but may be Level 3 depending on the circumstances. The Fund invests a significant portion of its assets in below investment grade securities. The value of these securities can be more volatile due to changes in the credit quality of the issuer and is sensitive to changes in economic, market and regulatory conditions.
Equity securities, including restricted securities, for which market quotations are readily available, are valued at the last reported sale price or official closing price as reported by a third party pricing vendor on the primary market or exchange on which they are traded and are categorized as Level 1 in the hierarchy. In the event there were no sales during the day or closing prices are not available, securities are valued at the last quoted bid price or may be valued using the last available price and are generally categorized as Level 2 in the hierarchy. For equity securities, including restricted securities, where observable inputs are limited, assumptions about market activity and risk are used and these securities may be categorized as Level 3 in the hierarchy.
Investments in open-end mutual funds, including the Fidelity Central Funds, are valued at their closing net asset value (NAV) each business day and are categorized as Level 1 in the hierarchy.
Changes in valuation techniques may result in transfers in or out of an assigned level within the disclosure hierarchy. The aggregate value of investments by input level as of October 31, 2016 is included at the end of the Fund's Schedule of Investments.
Investment Transactions and Income. For financial reporting purposes, the Fund's investment holdings and NAV include trades executed through the end of the last business day of the period. The NAV per share for processing shareholder transactions is calculated as of the close of business of the New York Stock Exchange (NYSE), normally 4:00 p.m. Eastern time and includes trades executed through the end of the prior business day. Gains and losses on securities sold are determined on the basis of identified cost and may include proceeds received from litigation. Dividend income is recorded on the ex-dividend date, except for certain dividends from foreign securities where the ex-dividend date may have passed, which are recorded as soon as the Fund is informed of the ex-dividend date. Non-cash dividends included in dividend income, if any, are recorded at the fair market value of the securities received. Income and capital gain distributions from Fidelity Central Funds, if any, are recorded on the ex-dividend date. Interest income is accrued as earned and includes coupon interest and amortization of premium and accretion of discount on debt securities as applicable. Debt obligations may be placed on non-accrual status and related interest income may be reduced by ceasing current accruals and writing off interest receivables when the collection of all or a portion of interest has become doubtful based on consistently applied procedures. A debt obligation is removed from non-accrual status when the issuer resumes interest payments or when collectability of interest is reasonably assured.
Class Allocations and Expenses. Investment income, realized and unrealized capital gains and losses, common expenses of the Fund, and certain fund-level expense reductions, if any, are allocated daily on a pro-rata basis to each class based on the relative net assets of each class to the total net assets of the Fund. Each class differs with respect to transfer agent and distribution and service plan fees incurred. Certain expense reductions may also differ by class. For the reporting period, the allocated portion of income and expenses to each class as a percent of its average net assets may vary due to the timing of recording these transactions in relation to fluctuating net assets of the classes. Expenses directly attributable to a fund are charged to that fund. Expenses attributable to more than one fund are allocated among the respective funds on the basis of relative net assets or other appropriate methods. Expense estimates are accrued in the period to which they relate and adjustments are made when actual amounts are known.
Income Tax Information and Distributions to Shareholders. Each year, the Fund intends to qualify as a regulated investment company under Subchapter M of the Internal Revenue Code, including distributing substantially all of its taxable income and realized gains. As a result, no provision for U.S. Federal income taxes is required. As of October 31, 2016, the Fund did not have any unrecognized tax benefits in the financial statements; nor is the Fund aware of any tax positions for which it is reasonably possible that the total amounts of unrecognized tax benefits will significantly change in the next twelve months. The Fund files a U.S. federal tax return, in addition to state and local tax returns as required. The Fund's federal income tax returns are subject to examination by the Internal Revenue Service (IRS) for a period of three fiscal years after they are filed. State and local tax returns may be subject to examination for an additional fiscal year depending on the jurisdiction.
Dividends are declared and recorded daily and paid monthly from net investment income. Distributions from realized gains, if any, are declared and recorded on the ex-dividend date. Income dividends and capital gain distributions are declared separately for each class. Income and capital gain distributions are determined in accordance with income tax regulations, which may differ from GAAP.
Capital accounts within the financial statements are adjusted for permanent book-tax differences. These adjustments have no impact on net assets or the results of operations. Capital accounts are not adjusted for temporary book-tax differences which will reverse in a subsequent period.
Book-tax differences are primarily due to market discount, capital loss carryforwards and losses deferred due to wash sales.
The federal tax cost of investment securities and unrealized appreciation (depreciation) as of period end were as follows:
| Gross unrealized appreciation | $31,083,463 |
| Gross unrealized depreciation | (14,179,819) |
| Net unrealized appreciation (depreciation) on securities | $16,903,644 |
| Tax Cost | $815,952,019 |
The tax-based components of distributable earnings as of period end were as follows:
| Undistributed tax-exempt income | $– |
| Undistributed ordinary income | $334,856 |
| Capital loss carryforward | $(47,984,926) |
| Net unrealized appreciation (depreciation) on securities and other investments | $16,903,644 |
Capital loss carryforwards are only available to offset future capital gains of the Fund to the extent provided by regulations and may be limited. Under the Regulated Investment Company Modernization Act of 2010 (the Act), the Fund is permitted to carry forward capital losses incurred in taxable years beginning after December 22, 2010 for an unlimited period and such capital losses are required to be used prior to any losses that expire. The capital loss carryforward information presented below, including any applicable limitation, is estimated as of fiscal period end and is subject to adjustment.
| No expiration | |
| Short-term | $(21,340,864) |
| Long-term | (26,644,062) |
| Total capital loss carryforward | $(47,984,926) |
The tax character of distributions paid was as follows:
| October 31, 2016 | October 31, 2015 | |
| Ordinary Income | $41,784,482 | $ 43,036,424 |
| Long-term Capital Gains | – | 16,394,987 |
| Total | $41,784,482 | $ 59,431,411 |
Short-Term Trading (Redemption) Fees. Shares held by investors in the Fund less than 90 days may have been subject to a redemption fee equal to 1.00% of the NAV of shares redeemed. All redemption fees, which reduce the proceeds of the shareholder redemption, are retained by the Fund and accounted for as an addition to paid in capital.
Delayed Delivery Transactions and When-Issued Securities. During the period, the Fund transacted in securities on a delayed delivery or when-issued basis. Payment and delivery may take place after the customary settlement period for that security. The price of the underlying securities and the date when the securities will be delivered and paid for are fixed at the time the transaction is negotiated. The securities purchased on a delayed delivery or when-issued basis are identified as such in the Fund's Schedule of Investments. The Fund may receive compensation for interest forgone in the purchase of a delayed delivery or when-issued security. With respect to purchase commitments, the Fund identifies securities as segregated in its records with a value at least equal to the amount of the commitment. Losses may arise due to changes in the value of the underlying securities or if the counterparty does not perform under the contract's terms, or if the issuer does not issue the securities due to political, economic, or other factors.
Restricted Securities. The Fund may invest in securities that are subject to legal or contractual restrictions on resale. These securities generally may be resold in transactions exempt from registration or to the public if the securities are registered. Disposal of these securities may involve time-consuming negotiations and expense, and prompt sale at an acceptable price may be difficult. Information regarding restricted securities is included at the end of the Fund's Schedule of Investments.
Loans and Other Direct Debt Instruments. The Fund invests in direct debt instruments which are interests in amounts owed to lenders by corporate or other borrowers. These instruments may be in the form of loans, trade claims or other receivables and may include standby financing commitments such as revolving credit facilities that obligate the Fund to supply additional cash to the borrower on demand. Loans may be acquired through assignment or participation. The Fund did not have any unfunded loan commitments, which are contractual obligations for future funding, at period end.
4. Purchases and Sales of Investments.
Purchases and sales of securities, other than short-term securities, aggregated $498,597,865 and $458,217,198, respectively.
5. Fees and Other Transactions with Affiliates.
Management Fee. Fidelity Management & Research Company (the investment adviser) and its affiliates provide the Fund with investment management related services for which the Fund pays a monthly management fee. The management fee is the sum of an individual fund fee rate that is based on an annual rate of .45% of the Fund's average net assets and an annualized group fee rate that averaged .11% during the period. The group fee rate is based upon the average net assets of all the mutual funds advised by the investment adviser, including any mutual funds previously advised by the investment adviser that are currently advised by Fidelity SelectCo, LLC, an affiliate of the investment adviser. The group fee rate decreases as assets under management increase and increases as assets under management decrease. For the reporting period, the total annual management fee rate was .56% of the Fund's average net assets.
Distribution and Service Plan Fees. In accordance with Rule 12b-1 of the 1940 Act, the Fund has adopted separate Distribution and Service Plans for each class of shares. Certain classes pay Fidelity Distributors Corporation (FDC), an affiliate of the investment adviser, separate Distribution and Service Fees, each of which is based on an annual percentage of each class' average net assets. In addition, FDC may pay financial intermediaries for selling shares of the Fund and providing shareholder support services. For the period, the Distribution and Service Fee rates, total fees and amounts retained by FDC were as follows:
| Distribution Fee | Service Fee | Total Fees | Retained by FDC |
|
| Class A | -% | .25% | $544,133 | $12,103 |
| Class T | -% | .25% | 174,904 | – |
| Class B | .65% | .25% | 26,132 | 18,873 |
| Class C | .75% | .25% | 919,916 | 93,976 |
| $1,665,085 | $124,952 |
Sales Load. FDC may receive a front-end sales charge of up to 4.00% for selling Class A shares and Class T shares, some of which is paid to financial intermediaries for selling shares of the Fund. Depending on the holding period, FDC may receive contingent deferred sales charges levied on Class A, Class T, Class B and Class C redemptions. The deferred sales charges range from 5.00% to 1.00% for Class B shares, 1.00% for Class C shares, 1.00% for certain purchases of Class A shares and .25% for certain purchases of Class T shares.
For the period, sales charge amounts retained by FDC were as follows:
| Retained by FDC |
|
| Class A | $25,389 |
| Class T | 6,538 |
| Class B(a) | 1,511 |
| Class C(a) | 8,681 |
| $42,119 |
(a) When Class B and Class C shares are initially sold, FDC pays commissions from its own resources to financial intermediaries through which the sales are made.
Transfer Agent Fees. Fidelity Investments Institutional Operations Company, Inc., (FIIOC), an affiliate of the investment adviser, is the transfer, dividend disbursing and shareholder servicing agent for each class of the Fund. FIIOC receives account fees and asset-based fees that vary according to the account size and type of account of the shareholders of the respective classes of the Fund. FIIOC pays for typesetting, printing and mailing of shareholder reports, except proxy statements.
For the period, transfer agent fees for each class were as follows:
| Amount | % of Class-Level Average Net Assets |
|
| Class A | $349,534 | .16 |
| Class T | 132,323 | .19 |
| Class B | 5,633 | .20 |
| Class C | 164,548 | .18 |
| Class I | 801,891 | .20 |
| $ 1,453,929 |
Accounting Fees. Fidelity Service Company, Inc. (FSC), an affiliate of the investment adviser, maintains the Fund's accounting records. The fee is based on the level of average net assets for each month.
Brokerage Commissions. The Fund placed a portion of its portfolio transactions with brokerage firms which are affiliates of the investment adviser. Brokerage commissions are included in net realized gain (loss) and change in net unrealized appreciation (depreciation) in the Statement of Operations. The commissions paid to these affiliated firms were $3 for the period.
Interfund Trades. The Fund may purchase from or sell securities to other Fidelity Funds under procedures adopted by the Board. The procedures have been designed to ensure these interfund trades are executed in accordance with Rule 17a-7 of the 1940 Act. Interfund trades are included within the respective purchases and sales amounts shown in the Purchases and Sales of Investments note.
6. Committed Line of Credit.
The Fund participates with other funds managed by the investment adviser or an affiliate in a $4.25 billion credit facility (the "line of credit") to be utilized for temporary or emergency purposes to fund shareholder redemptions or for other short-term liquidity purposes. The Fund has agreed to pay commitment fees on its pro-rata portion of the line of credit, which amounted to $2,023 and is reflected in Miscellaneous expenses on the Statement of Operations. During the period, the Fund did not borrow on this line of credit.
7. Expense Reductions.
Commissions paid to certain brokers with whom the investment adviser, or its affiliates, places trades on behalf of the Fund include an amount in addition to trade execution, which may be rebated back to the Fund to offset certain expenses. This amount totaled $38 for the period. In addition, through arrangements with the Fund's custodian, credits realized as a result of certain uninvested cash balances were used to reduce the Fund's expenses. During the period, these credits reduced the Fund's custody expense by $1,058.
In addition, during the period the investment adviser reimbursed and/or waived a portion of fund-level operating expenses in the amount of $3,017.
8. Distributions to Shareholders.
Distributions to shareholders of each class were as follows:
| Year ended October 31, 2016 | Year ended October 31, 2015 |
|
| From net investment income | ||
| Class A | $11,526,565 | $12,376,871 |
| Class T | 3,698,146 | 4,323,463 |
| Class B | 142,572 | 351,994 |
| Class C | 4,154,279 | 4,709,295 |
| Class I | 22,262,920 | 18,557,917 |
| Total | $41,784,482 | $40,319,540 |
| From net realized gain | ||
| Class A | $– | $5,903,417 |
| Class T | – | 2,099,390 |
| Class B | – | 214,551 |
| Class C | – | 2,781,779 |
| Class I | – | 8,112,734 |
| Total | $– | $19,111,871 |
9. Share Transactions.
Share transactions for each class were as follows and may contain automatic conversions between classes or exchanges between affiliated funds:
| Shares | Shares | Dollars | Dollars | |
| Year ended October 31, 2016 | Year ended October 31, 2015 | Year ended October 31, 2016 | Year ended October 31, 2015 |
|
| Class A | ||||
| Shares sold | 7,433,911 | 7,395,806 | $54,677,237 | $58,490,758 |
| Reinvestment of distributions | 1,372,430 | 2,100,062 | 10,168,527 | 16,584,491 |
| Shares redeemed | (9,769,225) | (8,886,709) | (71,672,557) | (69,878,626) |
| Net increase (decrease) | (962,884) | 609,159 | $(6,826,793) | $5,196,623 |
| Class T | ||||
| Shares sold | 1,617,554 | 2,223,776 | $11,757,682 | $17,651,040 |
| Reinvestment of distributions | 414,444 | 697,558 | 3,061,824 | 5,497,671 |
| Shares redeemed | (3,378,059) | (2,835,342) | (24,216,552) | (22,258,077) |
| Net increase (decrease) | (1,346,061) | 85,992 | $(9,397,046) | $890,634 |
| Class B | ||||
| Shares sold | 43,498 | 83,526 | $304,960 | $662,447 |
| Reinvestment of distributions | 16,125 | 63,434 | 116,505 | 500,029 |
| Shares redeemed | (864,825) | (452,168) | (6,323,785) | (3,571,342) |
| Net increase (decrease) | (805,202) | (305,208) | $(5,902,320) | $(2,408,866) |
| Class C | ||||
| Shares sold | 2,763,335 | 1,829,247 | $20,357,542 | $14,452,719 |
| Reinvestment of distributions | 486,464 | 825,771 | 3,595,140 | 6,508,315 |
| Shares redeemed | (3,037,093) | (3,949,888) | (22,336,625) | (31,040,010) |
| Net increase (decrease) | 212,706 | (1,294,870) | $1,616,057 | $(10,078,976) |
| Class I | ||||
| Shares sold | 27,101,846 | 16,049,250 | $200,470,955 | $126,004,572 |
| Reinvestment of distributions | 2,716,962 | 2,759,777 | 20,215,304 | 21,814,798 |
| Shares redeemed | (21,336,862) | (11,797,192) | (160,729,315) | (92,713,393) |
| Net increase (decrease) | 8,481,946 | 7,011,835 | $59,956,944 | $55,105,977 |
10. Other.
The Fund's organizational documents provide former and current trustees and officers with a limited indemnification against liabilities arising in connection with the performance of their duties to the Fund. In the normal course of business, the Fund may also enter into contracts that provide general indemnifications. The Fund's maximum exposure under these arrangements is unknown as this would be dependent on future claims that may be made against the Fund. The risk of material loss from such claims is considered remote.
Report of Independent Registered Public Accounting Firm
To the Trustees of Fidelity Advisor Series I and Shareholders of Fidelity Advisor High Income Fund:
We have audited the accompanying statement of assets and liabilities of Fidelity Advisor High Income Fund (the Fund), a fund of Fidelity Advisor Series I, including the schedule of investments, as of October 31, 2016, and the related statement of operations for the year then ended, the statement of changes in net assets for each of the two years in the period then ended, and the financial highlights for each of the five years in the period then ended. These financial statements and financial highlights are the responsibility of the Fund's management. Our responsibility is to express an opinion on these financial statements and financial highlights based on our audits.
We conducted our audits in accordance with the standards of the Public Company Accounting Oversight Board (United States). Those standards require that we plan and perform the audit to obtain reasonable assurance about whether the financial statements and financial highlights are free of material misstatement. The Fund is not required to have, nor were we engaged to perform, an audit of its internal control over financial reporting. Our audits included consideration of internal control over financial reporting as a basis for designing audit procedures that are appropriate in the circumstances, but not for the purpose of expressing an opinion on the effectiveness of the Fund's internal control over financial reporting. Accordingly, we express no such opinion. An audit also includes examining, on a test basis, evidence supporting the amounts and disclosures in the financial statements, assessing the accounting principles used and significant estimates made by management, as well as evaluating the overall financial statement presentation. Our procedures included confirmation of securities owned as of October 31, 2016, by correspondence with the custodians, brokers, and agent banks; when replies were not received from brokers or agent banks, we performed other auditing procedures. We believe that our audits provide a reasonable basis for our opinion.
In our opinion, such financial statements and financial highlights referred to above present fairly, in all material respects, the financial position of Fidelity Advisor High Income Fund as of October 31, 2016, the results of its operations for the year then ended, the changes in its net assets for each of the two years in the period then ended, and the financial highlights for each of the five years in the period then ended, in conformity with accounting principles generally accepted in the United States of America.
DELOITTE & TOUCHE LLP
Boston, Massachusetts
December 15, 2016
Trustees and Officers
The Trustees, Members of the Advisory Board (if any), and officers of the trust and fund, as applicable, are listed below. The Board of Trustees governs the fund and is responsible for protecting the interests of shareholders. The Trustees are experienced executives who meet periodically throughout the year to oversee the fund's activities, review contractual arrangements with companies that provide services to the fund, oversee management of the risks associated with such activities and contractual arrangements, and review the fund's performance. Each of the Trustees oversees 170 funds.
The Trustees hold office without limit in time except that (a) any Trustee may resign; (b) any Trustee may be removed by written instrument, signed by at least two-thirds of the number of Trustees prior to such removal; (c) any Trustee who requests to be retired or who has become incapacitated by illness or injury may be retired by written instrument signed by a majority of the other Trustees; and (d) any Trustee may be removed at any special meeting of shareholders by a two-thirds vote of the outstanding voting securities of the trust. Each Trustee who is not an interested person (as defined in the 1940 Act) of the trust and the fund is referred to herein as an Independent Trustee. Each Independent Trustee shall retire not later than the last day of the calendar year in which his or her 75th birthday occurs. The Independent Trustees may waive this mandatory retirement age policy with respect to individual Trustees. Officers and Advisory Board Members hold office without limit in time, except that any officer or Advisory Board Member may resign or may be removed by a vote of a majority of the Trustees at any regular meeting or any special meeting of the Trustees. Except as indicated, each individual has held the office shown or other offices in the same company for the past five years.
The fund’s Statement of Additional Information (SAI) includes more information about the Trustees. To request a free copy, call Fidelity at 1-877-208-0098.
Experience, Skills, Attributes, and Qualifications of the Trustees. The Governance and Nominating Committee has adopted a statement of policy that describes the experience, qualifications, attributes, and skills that are necessary and desirable for potential Independent Trustee candidates (Statement of Policy). The Board believes that each Trustee satisfied at the time he or she was initially elected or appointed a Trustee, and continues to satisfy, the standards contemplated by the Statement of Policy. The Governance and Nominating Committee also engages professional search firms to help identify potential Independent Trustee candidates who have the experience, qualifications, attributes, and skills consistent with the Statement of Policy. From time to time, additional criteria based on the composition and skills of the current Independent Trustees, as well as experience or skills that may be appropriate in light of future changes to board composition, business conditions, and regulatory or other developments, have also been considered by the professional search firms and the Governance and Nominating Committee. In addition, the Board takes into account the Trustees' commitment and participation in Board and committee meetings, as well as their leadership of standing and ad hoc committees throughout their tenure.
In determining that a particular Trustee was and continues to be qualified to serve as a Trustee, the Board has considered a variety of criteria, none of which, in isolation, was controlling. The Board believes that, collectively, the Trustees have balanced and diverse experience, qualifications, attributes, and skills, which allow the Board to operate effectively in governing the fund and protecting the interests of shareholders. Information about the specific experience, skills, attributes, and qualifications of each Trustee, which in each case led to the Board's conclusion that the Trustee should serve (or continue to serve) as a trustee of the fund, is provided below.
Board Structure and Oversight Function. James C. Curvey is an interested person and currently serves as Chairman. The Trustees have determined that an interested Chairman is appropriate and benefits shareholders because an interested Chairman has a personal and professional stake in the quality and continuity of services provided to the fund. Independent Trustees exercise their informed business judgment to appoint an individual of their choosing to serve as Chairman, regardless of whether the Trustee happens to be independent or a member of management. The Independent Trustees have determined that they can act independently and effectively without having an Independent Trustee serve as Chairman and that a key structural component for assuring that they are in a position to do so is for the Independent Trustees to constitute a substantial majority for the Board. The Independent Trustees also regularly meet in executive session. Ned C. Lautenbach serves as Chairman of the Independent Trustees and as such (i) acts as a liaison between the Independent Trustees and management with respect to matters important to the Independent Trustees and (ii) with management prepares agendas for Board meetings.
Fidelity® funds are overseen by different Boards of Trustees. The fund's Board oversees Fidelity's high income and certain equity funds, and other Boards oversee Fidelity's investment-grade bond, money market, asset allocation, and sector funds. The asset allocation funds may invest in Fidelity® funds overseen by the fund's Board. The use of separate Boards, each with its own committee structure, allows the Trustees of each group of Fidelity® funds to focus on the unique issues of the funds they oversee, including common research, investment, and operational issues. On occasion, the separate Boards establish joint committees to address issues of overlapping consequences for the Fidelity® funds overseen by each Board.
The Trustees operate using a system of committees to facilitate the timely and efficient consideration of all matters of importance to the Trustees, the fund, and fund shareholders and to facilitate compliance with legal and regulatory requirements and oversight of the fund's activities and associated risks. The Board, acting through its committees, has charged FMR and its affiliates with (i) identifying events or circumstances the occurrence of which could have demonstrably adverse effects on the fund's business and/or reputation; (ii) implementing processes and controls to lessen the possibility that such events or circumstances occur or to mitigate the effects of such events or circumstances if they do occur; and (iii) creating and maintaining a system designed to evaluate continuously business and market conditions in order to facilitate the identification and implementation processes described in (i) and (ii) above. Because the day-to-day operations and activities of the fund are carried out by or through FMR, its affiliates, and other service providers, the fund's exposure to risks is mitigated but not eliminated by the processes overseen by the Trustees. While each of the Board's committees has responsibility for overseeing different aspects of the fund's activities, oversight is exercised primarily through the Operations, Audit, and Compliance Committees. In addition, the Independent Trustees have worked with FMR to enhance the Board's oversight of investment and financial risks, legal and regulatory risks, technology risks, and operational risks, including the development of additional risk reporting to the Board. For example, a working group comprised of Independent Trustees and FMR has worked and continues to work to review the Fidelity® funds' valuation-related activities, reporting and risk management. Appropriate personnel, including but not limited to the fund's Chief Compliance Officer (CCO), FMR's internal auditor, the independent accountants, the fund's Treasurer and portfolio management personnel, make periodic reports to the Board's committees, as appropriate, including an annual review of Fidelity's risk management program for the Fidelity® funds. The responsibilities of each standing committee, including their oversight responsibilities, are described further under "Standing Committees of the Trustees."
Interested Trustees*:
Correspondence intended for a Trustee who is an interested person may be sent to Fidelity Investments, 245 Summer Street, Boston, Massachusetts 02210.
Name, Year of Birth; Principal Occupations and Other Relevant Experience+
James C. Curvey (1935)
Year of Election or Appointment: 2007
Trustee
Chairman of the Board of Trustees
Mr. Curvey also serves as Trustee of other Fidelity® funds. Mr. Curvey is a Director of Fidelity Research & Analysis Co. (investment adviser firm, 2009-present), and Vice Chairman (2007-present) and Director of FMR LLC (diversified financial services company). In addition, Mr. Curvey serves as an Overseer for the Boston Symphony Orchestra and a member of the board of Artis-Naples, Naples, Florida, and as a Trustee for Brewster Academy, Wolfeboro, New Hampshire. Previously, Mr. Curvey served as a Director of Fidelity Investments Money Management, Inc. (investment adviser firm, 2009-2014) and a Director of FMR and FMR Co., Inc. (investment adviser firms, 2007-2014).
Charles S. Morrison (1960)
Year of Election or Appointment: 2014
Trustee
Mr. Morrison also serves as Trustee of other funds. He serves as President of Fidelity Management & Research Company (FMR) (investment adviser firm, 2016-present), a Director of Fidelity Investments Money Management, Inc. (FIMM) (investment adviser firm, 2014-present), Director of Fidelity SelectCo, LLC (investment adviser firm, 2014-present), President, Asset Management (2014-present), and is an employee of Fidelity Investments. Previously, Mr. Morrison served as Vice President of Fidelity's Fixed Income and Asset Allocation Funds (2012-2014), President, Fixed Income (2011-2014), Vice President of Fidelity's Money Market Funds (2005-2009), President, Money Market Group Leader of FMR (investment adviser firm, 2009), and Senior Vice President, Money Market Group of FMR (2004-2009). Mr. Morrison also served as Vice President of Fidelity's Bond Funds (2002-2005), certain Balanced Funds (2002-2005), and certain Asset Allocation Funds (2002-2007), and as Senior Vice President (2002-2005) of Fidelity's Bond Division.
* Determined to be an “Interested Trustee” by virtue of, among other things, his or her affiliation with the trust or various entities under common control with FMR.
+ The information includes the Trustee's principal occupation during the last five years and other information relating to the experience, attributes, and skills relevant to the Trustee's qualifications to serve as a Trustee, which led to the conclusion that the Trustee should serve as a Trustee for the fund.
Independent Trustees:
Correspondence intended for an Independent Trustee may be sent to Fidelity Investments, P.O. Box 55235, Boston, Massachusetts 02205-5235.
Name, Year of Birth; Principal Occupations and Other Relevant Experience+
Dennis J. Dirks (1948)
Year of Election or Appointment: 2005
Trustee
Mr. Dirks also serves as Trustee of other Fidelity® funds. Prior to his retirement in May 2003, Mr. Dirks was Chief Operating Officer and a member of the Board of The Depository Trust & Clearing Corporation (DTCC). He also served as President, Chief Operating Officer, and Board member of The Depository Trust Company (DTC) and President and Board member of the National Securities Clearing Corporation (NSCC). In addition, Mr. Dirks served as Chief Executive Officer and Board member of the Government Securities Clearing Corporation, Chief Executive Officer and Board member of the Mortgage-Backed Securities Clearing Corporation, as a Trustee and a member of the Finance Committee of Manhattan College (2005-2008), as a Trustee and a member of the Finance Committee of AHRC of Nassau County (2006-2008), and as a member of the Independent Directors Council (IDC) Governing Council (2010-2015). Mr. Dirks is a member of the Board of Directors for The Brookville Center for Children's Services, Inc. (2009-present).
Alan J. Lacy (1953)
Year of Election or Appointment: 2008
Trustee
Mr. Lacy also serves as Trustee of other Fidelity® funds. Mr. Lacy serves as Chairman (2014-present) and a member (2010-present) of the Board of Directors of Dave & Buster's Entertainment, Inc. (restaurant and entertainment complexes) and a Director of Bristol-Myers Squibb Company (global pharmaceuticals, 2008-present). He is a Trustee of the California Chapter of The Nature Conservancy (2015-present) and a Director of the Center for Advanced Study in the Behavioral Sciences at Stanford University (2015-present). In addition, Mr. Lacy served as Senior Adviser (2007-2014) of Oak Hill Capital Partners, L.P. (private equity) and also served as Chief Executive Officer (2005) and Vice Chairman (2005-2006) of Sears Holdings Corporation (retail) and Chief Executive Officer and Chairman of the Board of Sears, Roebuck and Co. (retail, 2000-2005). Previously, Mr. Lacy served as Chairman (2008-2011) and a member (2006-2015) of the Board of Trustees of the National Parks Conservation Association and as a member of the Board of Directors for The Western Union Company (global money transfer, 2006-2011), The Hillman Companies, Inc. (hardware wholesalers, 2010-2014), and Earth Fare, Inc. (retail grocery, 2010-2014).
Ned C. Lautenbach (1944)
Year of Election or Appointment: 2000
Trustee
Chairman of the Independent Trustees
Mr. Lautenbach also serves as Trustee of other Fidelity® funds. Mr. Lautenbach currently serves as the Lead Director of the Eaton Corporation Board of Directors (diversified industrial, 1997-present). Mr. Lautenbach is Chairman of the Board of Directors of Artis-Naples in Naples, Florida (2012-present), a member of the Council on Foreign Relations (1994-present), and a member of the Board of Governors, State University System of Florida (2013-present). Previously, Mr. Lautenbach was a Partner/Advisory Partner at Clayton, Dubilier & Rice, LLC (private equity investment, 1998-2010), as well as a Director of Sony Corporation (2006-2007).
Joseph Mauriello (1944)
Year of Election or Appointment: 2008
Trustee
Mr. Mauriello also serves as Trustee of other Fidelity® funds. Prior to his retirement in January 2006, Mr. Mauriello served in numerous senior management positions including Deputy Chairman and Chief Operating Officer (2004-2005), and Vice Chairman of Financial Services (2002-2004) of KPMG LLP US (professional services, 1965-2005). Mr. Mauriello currently serves as a member of the Board of Directors of XL Group plc. (global insurance and re-insurance, 2006-present) and the Independent Directors Council (IDC) Governing Council (2015-present). Previously, Mr. Mauriello served as a Director of the Hamilton Funds of the Bank of New York (2006-2007) and of Arcadia Resources Inc. (health care services and products, 2007-2012).
Robert W. Selander (1950)
Year of Election or Appointment: 2011
Trustee
Mr. Selander also serves as Trustee of other Fidelity® funds. Mr. Selander serves as a Director of The Western Union Company (global money transfer, 2014-present) and a non-executive Chairman of Health Equity, Inc. (health savings custodian, 2015-present). Previously, Mr. Selander served as a Member of the Advisory Board of certain Fidelity® funds (2011), and Executive Vice Chairman (2010), Chief Executive Officer (2009-2010), and President and Chief Executive Officer (1997-2009) of Mastercard, Inc.
Cornelia M. Small (1944)
Year of Election or Appointment: 2005
Trustee
Ms. Small also serves as Trustee of other Fidelity® funds. Ms. Small is a member of the Board of Directors (2009-present) and Chair of the Investment Committee (2010-present) of the Teagle Foundation. Ms. Small also serves on the Investment Committee of the Berkshire Taconic Community Foundation (2008-present). Previously, Ms. Small served as Chairperson (2002-2008) and a member of the Investment Committee and Chairperson (2008-2012) and a member of the Board of Trustees of Smith College. In addition, Ms. Small served as Chief Investment Officer, Director of Global Equity Investments, and a member of the Board of Directors of Scudder, Stevens & Clark and Scudder Kemper Investments.
William S. Stavropoulos (1939)
Year of Election or Appointment: 2002
Trustee
Vice Chairman of the Independent Trustees
Mr. Stavropoulos also serves as Trustee of other Fidelity® funds. Mr. Stavropoulos serves as President and Founder of the Michigan Baseball Foundation, the Great Lakes Loons (2007-present). Mr. Stavropoulos is Chairman Emeritus of the Board of Directors of The Dow Chemical Company, where he previously served in numerous senior management positions, including President, CEO (1995-2000; 2002-2004), Chairman of the Executive Committee (2000-2006), and as a member of the Board of Directors (1990-2006). Currently, Mr. Stavropoulos is Chairman of the Board of Directors of Univar Inc. (global distributor of commodity and specialty chemicals), a Director of Teradata Corporation (data warehousing and technology solutions), and Maersk Inc. (industrial conglomerate), and a member of the Advisory Board for Metalmark Capital LLC (private equity investment, 2005-present). Mr. Stavropoulos is an operating advisor to Clayton, Dubilier & Rice, LLC (private equity investment). In addition, Mr. Stavropoulos is a member of the University of Notre Dame Advisory Council for the College of Science, a Trustee of the Rollin L. Gerstacker Foundation, and a Director of the Naples Philharmonic Center for the Arts. Previously, Mr. Stavropoulos served as a Director of Chemical Financial Corporation (bank holding company, 1993-2012) and Tyco International, Ltd. (multinational manufacturing and services, 2007-2012).
David M. Thomas (1949)
Year of Election or Appointment: 2008
Trustee
Mr. Thomas also serves as Trustee of other Fidelity® funds. Mr. Thomas serves as Non-Executive Chairman of the Board of Directors of Fortune Brands Home and Security (home and security products, 2011-present), as a member of the Board of Directors (2004-present) and Presiding Director (2013-present) of Interpublic Group of Companies, Inc. (marketing communication), and as a member of the Board of Trustees of the University of Florida (2013-present). Previously, Mr. Thomas served as Executive Chairman (2005-2006) and Chairman and Chief Executive Officer (2000-2005) of IMS Health, Inc. (pharmaceutical and healthcare information solutions), and a Director of Fortune Brands, Inc. (consumer products, 2000-2011).
+ The information includes the Trustee's principal occupation during the last five years and other information relating to the experience, attributes, and skills relevant to the Trustee's qualifications to serve as a Trustee, which led to the conclusion that the Trustee should serve as a Trustee for the fund.
Advisory Board Members and Officers:
Correspondence intended for an officer or Peter S. Lynch may be sent to Fidelity Investments, 245 Summer Street, Boston, Massachusetts 02210. Officers appear below in alphabetical order.
Name, Year of Birth; Principal Occupation
Peter S. Lynch (1944)
Year of Election or Appointment: 2003
Member of the Advisory Board
Mr. Lynch also serves as Member of the Advisory Board of other Fidelity® funds. Mr. Lynch is Vice Chairman and a Director of FMR (investment adviser firm) and FMR Co., Inc. (investment adviser firm). In addition, Mr. Lynch serves as a Trustee of Boston College and as the Chairman of the Inner-City Scholarship Fund. Previously, Mr. Lynch served on the Special Olympics International Board of Directors (1997-2006).
Marc R. Bryant (1966)
Year of Election or Appointment: 2015
Secretary and Chief Legal Officer (CLO)
Mr. Bryant also serves as Secretary and CLO of other funds. Mr. Bryant serves as CLO, Secretary, and Senior Vice President of Fidelity Management & Research Company (investment adviser firm, 2015-present) and FMR Co., Inc. (investment adviser firm, 2015-present); Secretary of Fidelity SelectCo, LLC (investment adviser firm, 2015-present) and Fidelity Investments Money Management, Inc. (investment adviser firm, 2015-present); and CLO of Fidelity Management & Research (Hong Kong) Limited and FMR Investment Management (UK) Limited (investment adviser firms, 2015-present) and Fidelity Management & Research (Japan) Limited (investment adviser firm, 2016-present). He is Senior Vice President and Deputy General Counsel of FMR LLC (diversified financial services company). Previously, Mr. Bryant served as Secretary and CLO of Fidelity Rutland Square Trust II (2010-2014) and Assistant Secretary of Fidelity's Fixed Income and Asset Allocation Funds (2013-2015). Prior to joining Fidelity Investments, Mr. Bryant served as a Senior Vice President and the Head of Global Retail Legal for AllianceBernstein L.P. (2006-2010), and as the General Counsel for ProFund Advisors LLC (2001-2006).
Jeffrey S. Christian (1961)
Year of Election or Appointment: 2016
Assistant Treasurer
Mr. Christian also serves as Assistant Treasurer of other funds. Mr. Christian is an employee of Fidelity Investments (2003-present).
William C. Coffey (1969)
Year of Election or Appointment: 2009
Assistant Secretary
Mr. Coffey also serves as Assistant Secretary of other funds. He is Senior Vice President and Deputy General Counsel of FMR LLC (diversified financial services company, 2010-present), and is an employee of Fidelity Investments. Previously, Mr. Coffey served as Vice President and Associate General Counsel of FMR LLC (2005-2009).
Jonathan Davis (1968)
Year of Election or Appointment: 2010
Assistant Treasurer
Mr. Davis also serves as Assistant Treasurer of other funds, and is an employee of Fidelity Investments. Previously, Mr. Davis served as Vice President and Associate General Counsel of FMR LLC (diversified financial services company, 2003-2010).
Adrien E. Deberghes (1967)
Year of Election or Appointment: 2016
Assistant Treasurer
Mr. Deberghes also serves as an officer of other funds. He serves as Executive Vice President of Fidelity Investments Money Management, Inc. (FIMM) (investment adviser firm, 2016-present) and is an employee of Fidelity Investments (2008-present). Prior to joining Fidelity Investments, Mr. Deberghes was Senior Vice President of Mutual Fund Administration at State Street Corporation (2007-2008), Senior Director of Mutual Fund Administration at Investors Bank & Trust (2005-2007), and Director of Finance for Dunkin' Brands (2000-2005). Previously, Mr. Deberghes served in other fund officer roles.
Stephanie J. Dorsey (1969)
Year of Election or Appointment: 2010
Assistant Treasurer
Ms. Dorsey also serves as an officer of other funds. She is an employee of Fidelity Investments (2008-present) and has served in other fund officer roles. Prior to joining Fidelity Investments, Ms. Dorsey served as Treasurer (2004-2008) of the JPMorgan Mutual Funds and Vice President (2004-2008) of JPMorgan Chase Bank.
Howard J. Galligan III (1966)
Year of Election or Appointment: 2014
Chief Financial Officer
Mr. Galligan also serves as Chief Financial Officer of other funds. Mr. Galligan serves as President of Fidelity Pricing and Cash Management Services (FPCMS) (2014-present) and as a Director of Strategic Advisers, Inc. (investment adviser firm, 2008-present). Previously, Mr. Galligan served as Chief Administrative Officer of Asset Management (2011-2014) and Chief Operating Officer and Senior Vice President of Investment Support for Strategic Advisers, Inc. (2003-2011).
Scott C. Goebel (1968)
Year of Election or Appointment: 2015
Vice President
Mr. Goebel serves as Vice President of other funds and is an employee of Fidelity Investments (2001-present). Previously, Mr. Goebel served as Senior Vice President of Fidelity Management & Research Company (FMR) (investment adviser firm, 2016), Secretary of Fidelity SelectCo, LLC (investment adviser firm, 2013-2015), Fidelity Investments Money Management, Inc. (FIMM) (investment adviser firm, 2010-2015), and Fidelity Research and Analysis Company (FRAC) (investment adviser firm, 2010-2015); General Counsel, Secretary, and Senior Vice President of FMR (investment adviser firm, 2008-2015) and FMR Co., Inc. (investment adviser firm, 2008-2015); Assistant Secretary of Fidelity Management & Research (Japan) Limited (investment adviser firm, 2008-2015) and Fidelity Management & Research (U.K.) Inc. (investment adviser firm, 2008-2015); Chief Legal Officer (CLO) of Fidelity Management & Research (Hong Kong) Limited (investment adviser firm, 2008-2015); Secretary and CLO of certain Fidelity® funds (2008-2015); Assistant Secretary of FIMM (2008-2010), FRAC (2008-2010), and certain funds (2007-2008); and as Vice President and Secretary of Fidelity Distributors Corporation (FDC) (2005-2007).
Thomas C. Hense (1964)
Year of Election or Appointment: 2008, 2010, or 2015
Vice President
Mr. Hense serves as Vice President of Fidelity Advisor® Multi-Asset Income Fund (2015) and other funds (High Income (2008), Small Cap (2008), and Value (2010) funds), and is an employee of Fidelity Investments (1993-present). Previously, Mr. Hense served as a portfolio manager for Fidelity's Institutional Money Management Group (Pyramis) (2003-2008).
Brian B. Hogan (1964)
Year of Election or Appointment: 2009
Vice President
Mr. Hogan also serves as Trustee or Vice President of other funds. Mr. Hogan serves as a Director of FMR Investment Management (UK) Limited (investment adviser firm, 2015-present) and Fidelity SelectCo, LLC (investment adviser firm, 2014-present) and President of the Equity Division of FMR (investment adviser firm, 2009-present). Previously, Mr. Hogan served as Senior Vice President, Equity Research of FMR (2006-2009) and as a portfolio manager. Mr. Brian B. Hogan is not related to Mr. Colm A. Hogan.
Colm A. Hogan (1973)
Year of Election or Appointment: 2016
Deputy Treasurer
Mr. Hogan also serves as an officer of other funds. Mr. Hogan is an employee of Fidelity Investments (2005-present). Mr. Colm A. Hogan is not related to Mr. Brian B. Hogan.
Chris Maher (1972)
Year of Election or Appointment: 2013
Assistant Treasurer
Mr. Maher serves as Assistant Treasurer of other funds. Mr. Maher is Vice President of Valuation Oversight and is an employee of Fidelity Investments. Previously, Mr. Maher served as Vice President of Asset Management Compliance (2013), Vice President of the Program Management Group of FMR (investment adviser firm, 2010-2013), and Vice President of Valuation Oversight (2008-2010).
John F. Papandrea (1972)
Year of Election or Appointment: 2016
Anti-Money Laundering (AML) Officer
Mr. Papandrea also serves as AML Officer of other funds. Mr. Papandrea is Vice President of FMR LLC (diversified financial services company, 2008-present) and is an employee of Fidelity Investments (2005-present).
Kenneth B. Robins (1969)
Year of Election or Appointment: 2016
Chief Compliance Officer
Mr. Robins also serves as an officer of other funds. Mr. Robins serves as Compliance Officer of Fidelity Management & Research Company and FMR Co., Inc. (investment adviser firms, 2016-present) and is an employee of Fidelity Investments (2004-present). Previously, Mr. Robins served as Executive Vice President of Fidelity Investments Money Management, Inc. (investment adviser firm, 2013-2016) and served in other fund officer roles.
Stacie M. Smith (1974)
Year of Election or Appointment: 2016
President and Treasurer
Ms. Smith also serves as an officer of other funds. She is an employee of Fidelity Investments (2009-present) and has served in other fund officer roles. Prior to joining Fidelity Investments, Ms. Smith served as Senior Audit Manager of Ernst & Young LLP (accounting firm, 1996-2009). Previously, Ms. Smith served as Deputy Treasurer of certain Fidelity® funds (2013-2016).
Marc L. Spector (1972)
Year of Election or Appointment: 2016
Assistant Treasurer
Mr. Spector also serves as an officer of other funds. Mr. Spector is an employee of Fidelity Investments (2016-present). Prior to joining Fidelity Investments, Mr. Spector served as Director at the Siegfried Group (accounting firm, 2013-2016), and prior to Siegfried Group as audit senior manager at Deloitte & Touche (accounting firm, 2005-2013).
Renee Stagnone (1975)
Year of Election or Appointment: 2016
Assistant Treasurer
Ms. Stagnone also serves as an officer of other funds. Ms. Stagnone is an employee of Fidelity Investments (1997-present). Previously, Ms. Stagnone served as Deputy Treasurer of certain Fidelity® funds (2013-2016).
Shareholder Expense Example
As a shareholder of the Fund, you incur two types of costs: (1) transaction costs, including sales charges (loads) on purchase payments or redemption proceeds, redemption fees and (2) ongoing costs, including management fees, distribution and/or service (12b-1) fees and other Fund expenses. This Example is intended to help you understand your ongoing costs (in dollars) of investing in the Fund and to compare these costs with the ongoing costs of investing in other mutual funds.
The Example is based on an investment of $1,000 invested at the beginning of the period and held for the entire period (May 1, 2016 to October 31, 2016).
Actual Expenses
The first line of the accompanying table for each class of the Fund provides information about actual account values and actual expenses. You may use the information in this line, together with the amount you invested, to estimate the expenses that you paid over the period. Simply divide your account value by $1,000.00 (for example, an $8,600 account value divided by $1,000.00 = 8.6), then multiply the result by the number in the first line for a class of the Fund under the heading entitled "Expenses Paid During Period" to estimate the expenses you paid on your account during this period. In addition, the Fund, as a shareholder in the underlying Fidelity Central Funds, will indirectly bear its pro-rata share of the fees and expenses incurred by the underlying Fidelity Central Funds. These fees and expenses are not included in the Fund's annualized expense ratio used to calculate the expense estimate in the table below.
Hypothetical Example for Comparison Purposes
The second line of the accompanying table for each class of the Fund provides information about hypothetical account values and hypothetical expenses based on a Class' actual expense ratio and an assumed rate of return of 5% per year before expenses, which is not the Class' actual return. The hypothetical account values and expenses may not be used to estimate the actual ending account balance or expenses you paid for the period. You may use this information to compare the ongoing costs of investing in the Fund and other funds. To do so, compare this 5% hypothetical example with the 5% hypothetical examples that appear in the shareholder reports of the other funds. In addition, the Fund, as a shareholder in the underlying Fidelity Central Funds, will indirectly bear its pro-rata share of the fees and expenses incurred by the underlying Fidelity Central Funds. These fees and expenses are not included in the Fund's annualized expense ratio used to calculate the expense estimate in the table below.
Please note that the expenses shown in the table are meant to highlight your ongoing costs only and do not reflect any transaction costs. Therefore, the second line of the table is useful in comparing ongoing costs only, and will not help you determine the relative total costs of owning different funds. In addition, if these transactional costs were included, your costs would have been higher.
| Annualized Expense Ratio-A | Beginning Account Value May 1, 2016 | Ending Account Value October 31, 2016 | Expenses Paid During Period-B May 1, 2016 to October 31, 2016 |
|
| Class A | 1.03% | |||
| Actual | $1,000.00 | $1,063.50 | $5.34 | |
| Hypothetical-C | $1,000.00 | $1,019.96 | $5.23 | |
| Class T | 1.05% | |||
| Actual | $1,000.00 | $1,062.00 | $5.44 | |
| Hypothetical-C | $1,000.00 | $1,019.86 | $5.33 | |
| Class C | 1.79% | |||
| Actual | $1,000.00 | $1,058.20 | $9.26 | |
| Hypothetical-C | $1,000.00 | $1,016.14 | $9.07 | |
| Class I | .80% | |||
| Actual | $1,000.00 | $1,063.20 | $4.15 | |
| Hypothetical-C | $1,000.00 | $1,021.11 | $4.06 |
A Annualized expense ratio reflects expenses net of applicable fee waivers.
B Expenses are equal to each Class' annualized expense ratio, multiplied by the average account value over the period, multiplied by 184/366 (to reflect the one-half year period).
C 5% return per year before expenses
Distributions (Unaudited)
A total of 0.07% of the dividends distributed during the fiscal year was derived from interest on U.S. Government securities which is generally exempt from state income tax.
The fund designates $25,960,082 of distributions paid during the period January 1, 2016 to October 31, 2015 as qualifying to be taxed as interest-related dividends for nonresident alien shareholders.
The fund will notify shareholders in January 2017 of amounts for use in preparing 2016 income tax returns.
Board Approval of Investment Advisory Contracts and Management Fees
Fidelity Advisor High Income Fund
Each year, the Board of Trustees, including the Independent Trustees (together, the Board), votes on the renewal of the management contract with Fidelity Management & Research Company (FMR) and the sub-advisory agreements (together, the Advisory Contracts) for the fund. The Board, assisted by the advice of fund counsel and Independent Trustees' counsel, requests and considers a broad range of information relevant to the renewal of the Advisory Contracts throughout the year.
The Board meets regularly and, at each of its meetings, covers an extensive agenda of topics and materials and considers factors that are relevant to its annual consideration of the renewal of the fund's Advisory Contracts, including the services and support provided to the fund and its shareholders. The Board has established various standing committees (Committees), each composed of and chaired by Independent Trustees with varying backgrounds, to which the Board has assigned specific subject matter responsibilities in order to enhance effective decision-making by the Board. The Board, acting directly and through its Committees, requests and receives information concerning the annual consideration of the renewal of the fund's Advisory Contracts. The Board also meets as needed to consider matters specifically related to the Board's annual consideration of the renewal of the Advisory Contracts. Members of the Board may also meet with trustees of other Fidelity funds through ad hoc joint committees to discuss certain matters relevant to all of the Fidelity funds.
At its July 2016 meeting, the Board unanimously determined to renew the fund's Advisory Contracts. In reaching its determination, the Board considered all factors it believed relevant, including (i) the nature, extent, and quality of the services to be provided to the fund and its shareholders (including the investment performance of the fund); (ii) the competitiveness of the fund's management fee and total expense ratio relative to peer funds; (iii) the total costs of the services to be provided by and the profits to be realized by Fidelity from its relationships with the fund; and (iv) the extent to which, if any, economies of scale exist and would be realized as the fund grows, and whether any economies of scale are appropriately shared with fund shareholders.
In considering whether to renew the Advisory Contracts for the fund, the Board reached a determination, with the assistance of fund counsel and Independent Trustees' counsel and through the exercise of its business judgment, that the renewal of the Advisory Contracts was in the best interests of the fund and its shareholders and that the compensation payable under the Advisory Contracts was fair and reasonable. The Board's decision to renew the Advisory Contracts was not based on any single factor, but rather was based on a comprehensive consideration of all the information provided to the Board at its meetings throughout the year. The Board, in reaching its determination to renew the Advisory Contracts, was aware that shareholders of the fund have a broad range of investment choices available to them, including a wide choice among funds offered by Fidelity's competitors, and that the fund's shareholders, who have the opportunity to review and weigh the disclosure provided by the fund in its prospectus and other public disclosures, have chosen to invest in this fund, which is part of the Fidelity family of funds.
Nature, Extent, and Quality of Services Provided. The Board considered Fidelity's staffing as it relates to the fund, including the backgrounds of investment personnel of Fidelity, and also considered the fund's investment objective, strategies, and related investment philosophy. The Independent Trustees also had discussions with senior management of Fidelity's investment operations and investment groups. The Board considered the structure of the investment personnel compensation program and whether this structure provides appropriate incentives to act in the best interests of the fund. Additionally, the Board considered the portfolio managers' investments, if any, in the funds that they manage. Resources Dedicated to Investment Management and Support Services. The Board and the Fund Oversight and Research Committees reviewed the general qualifications and capabilities of Fidelity's investment staff, including its size, education, experience, and resources, as well as Fidelity's approach to recruiting, training, managing, and compensating investment personnel. The Board noted that Fidelity has continued to increase the resources devoted to non-U.S. offices, including expansion of Fidelity's global investment organization. The Board also noted that Fidelity's analysts have extensive resources, tools and capabilities that allow them to conduct sophisticated quantitative and fundamental analysis, as well as credit analysis of issuers, counterparties and guarantors. Further, the Board considered that Fidelity's investment professionals have sufficient access to global information and data so as to provide competitive investment results over time, and that those professionals also have access to sophisticated tools that permit them to assess portfolio construction and risk and performance attribution characteristics continuously, as well as to transmit new information and research conclusions rapidly around the world. Additionally, in its deliberations, the Board considered Fidelity's trading, risk management, compliance, and technology and operations capabilities and resources, which are integral parts of the investment management process. Shareholder and Administrative Services. The Board considered (i) the nature, extent, quality, and cost of advisory, administrative, and shareholder services performed by FMR, the sub-advisers (together with FMR, the Investment Advisers), and their affiliates under the Advisory Contracts and under separate agreements covering transfer agency, pricing and bookkeeping, and securities lending services for the fund; (ii) the nature and extent of the supervision of third party service providers, principally custodians, subcustodians, and pricing vendors; and (iii) the resources devoted to, and the record of compliance with, the fund's compliance policies and procedures. The Board also reviewed the allocation of fund brokerage, including allocations to brokers affiliated with the Investment Advisers, the use of brokerage commissions to pay fund expenses, and the use of "soft" commission dollars to pay for research services.The Board noted that the growth of fund assets over time across the complex allows Fidelity to reinvest in the development of services designed to enhance the value or convenience of the Fidelity funds as investment vehicles. These services include 24-hour access to account information and market information through telephone representatives and over the Internet, investor education materials and asset allocation tools, and the expanded availability of Fidelity Investor Centers.In 2014, the Board formed an ad hoc Committee on Transfer Agency Fees to review the variety of transfer agency fee structures throughout the industry and Fidelity's competitive positioning with respect to industry participants. Investment in a Large Fund Family. The Board considered the benefits to shareholders of investing in a Fidelity fund, including the benefits of investing in a fund that is part of a large family of funds offering a variety of investment disciplines and providing a large variety of mutual fund investor services. The Board noted that Fidelity had taken, or had made recommendations that resulted in the Fidelity funds taking, a number of actions over the previous year that benefited particular funds, including: (i) continuing to dedicate additional resources to investment research and to the support of the senior management team that oversees asset management; (ii) continuing efforts to enhance Fidelity's global research capabilities; (iii) launching new funds and making other enhancements to meet client needs; (iv) broadening eligibility requirements for certain lower-priced share classes of, and streamlining the fee structure for, certain existing equity index funds; (v) lowering expense caps for certain existing funds and classes to reduce expenses paid by shareholders; (vi) eliminating redemption fees for certain variable insurance product funds and classes; (vii) continuing to launch dedicated lower cost underlying funds to meet portfolio construction needs related to expanding underlying fund options for Fidelity funds of funds, specifically for the Freedom Fund product lines; (viii) launching a lower cost share class for use by the Freedom Index Fund product line; (ix) rationalizing product lines and gaining increased efficiencies through fund mergers and share class consolidations; (x) continuing to develop, acquire and implement systems and technology to improve services to the funds and shareholders, strengthen information security, and increase efficiency; (xi) implementing investment enhancements to further strengthen Fidelity's target date product line to increase investors' probability of success in achieving their goals; (xii) accelerating the conversion of all remaining Class B shares to Class A shares, which have a lower expense structure; and (xiii) implementing changes to Fidelity's money market fund product line in response to recent regulatory reforms. Investment Performance. The Board considered whether the fund has operated in accordance with its investment objective, as well as its record of compliance with its investment restrictions and its performance history.The Board took into account discussions with representatives of the Investment Advisers about fund investment performance that occur at Board meetings throughout the year. In this regard the Board noted that as part of regularly scheduled fund reviews and other reports to the Board on fund performance, the Board considers annualized return information for the fund, for different time periods, measured against a securities market index ("benchmark index") and a peer group of funds with similar objectives ("peer group"), if any. In its evaluation of fund investment performance, the Board gave particular attention to information indicating changes in performance of certain Fidelity funds for specific time periods and discussed with the Investment Advisers the reasons for any overperformance or underperformance.In addition to reviewing absolute and relative fund performance, the Independent Trustees periodically consider the appropriateness of fund performance metrics in evaluating the results achieved. In general, the Independent Trustees believe that fund performance should be evaluated based on net performance (after fees and expenses) of both the highest performing and lowest performing fund share classes, where applicable, compared to appropriate benchmark indices, over appropriate time periods that may include full market cycles, and compared to peer groups, as applicable, over the same periods, taking into account relevant factors including the following: general market conditions; issuer-specific information; and fund cash flows and other factors.The Independent Trustees recognize that shareholders evaluate performance on a net basis over their own holding periods, for which one-, three-, and five-year periods are often used as a proxy. For this reason, the performance information reviewed by the Board also included net cumulative calendar year total return information for the fund and an appropriate benchmark index and peer group for the most recent one-, three-, and five-year periods, as shown below. Returns are shown compared to the 25th percentile (top of box, 75% beaten) and 75th percentile (bottom of box, 25% beaten) of the peer universe.Fidelity Advisor High Income Fund
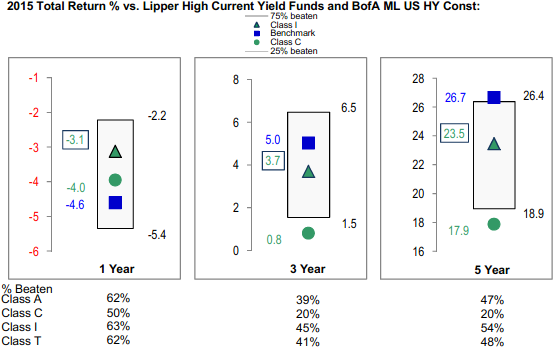
Fidelity Advisor High Income Fund
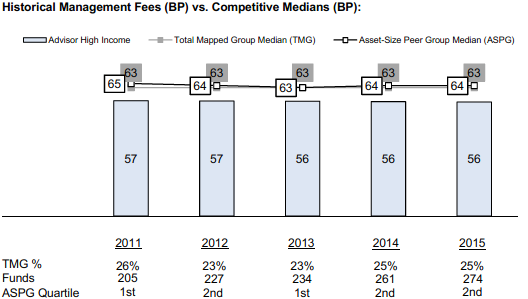
![]()
AHI-ANN-1216
1.728715.119
|
Fidelity Advisor® Value Fund Class A, Class T, Class C and Class I Annual Report October 31, 2016 |
|
|
Contents
|
Board Approval of Investment Advisory Contracts and Management Fees |
To view a fund's proxy voting guidelines and proxy voting record for the 12-month period ended June 30, visit http://www.fidelity.com/proxyvotingresults or visit the Securities and Exchange Commission's (SEC) web site at http://www.sec.gov.
You may also call 1-877-208-0098 to request a free copy of the proxy voting guidelines.
Standard & Poor's, S&P and S&P 500 are registered service marks of The McGraw-Hill Companies, Inc. and have been licensed for use by Fidelity Distributors Corporation.
Other third-party marks appearing herein are the property of their respective owners.
All other marks appearing herein are registered or unregistered trademarks or service marks of FMR LLC or an affiliated company. © 2016 FMR LLC. All rights reserved.
This report and the financial statements contained herein are submitted for the general information of the shareholders of the Fund. This report is not authorized for distribution to prospective investors in the Fund unless preceded or accompanied by an effective prospectus.
A fund files its complete schedule of portfolio holdings with the SEC for the first and third quarters of each fiscal year on Form N-Q. Forms N-Q are available on the SEC’s web site at http://www.sec.gov. A fund's Forms N-Q may be reviewed and copied at the SEC’s Public Reference Room in Washington, DC. Information regarding the operation of the SEC's Public Reference Room may be obtained by calling 1-800-SEC-0330.
For a complete list of a fund's portfolio holdings, view the most recent holdings listing, semiannual report, or annual report on Fidelity's web site at http://www.fidelity.com, http://www.institutional.fidelity.com, or http://www.401k.com, as applicable.
NOT FDIC INSURED •MAY LOSE VALUE •NO BANK GUARANTEE
Neither the Fund nor Fidelity Distributors Corporation is a bank.
Performance: The Bottom Line
Average annual total return reflects the change in the value of an investment, assuming reinvestment of distributions from dividend income and capital gains (the profits earned upon the sale of securities that have grown in value, if any) and assuming a constant rate of performance each year. The hypothetical investment and the average annual total returns do not reflect the deduction of taxes that a shareholder would pay on fund distributions or the redemption of fund shares. During periods of reimbursement by Fidelity, a fund’s total return will be greater than it would be had the reimbursement not occurred. How a fund did yesterday is no guarantee of how it will do tomorrow.
Average Annual Total Returns
| For the periods ended October 31, 2016 | Past 1 year | Past 5 years | Past 10 years |
| Class A (incl. 5.75% sales charge) | (3.37)% | 11.43% | 4.71% |
| Class T (incl. 3.50% sales charge) | (1.30)% | 11.68% | 4.70% |
| Class C (incl. contingent deferred sales charge) | 0.72% | 11.90% | 4.54% |
| Class I | 2.82% | 13.06% | 5.61% |
Class C shares' contingent deferred sales charges included in the past one year, past five years and past ten years total return figures are 1%, 0% and 0%, respectively.
$10,000 Over 10 Years
Let's say hypothetically that $10,000 was invested in Fidelity Advisor® Value Fund - Class A on October 31, 2006, and the current 5.75% sales charge was paid.
The chart shows how the value of your investment would have changed, and also shows how the Russell Midcap® Value Index performed over the same period.
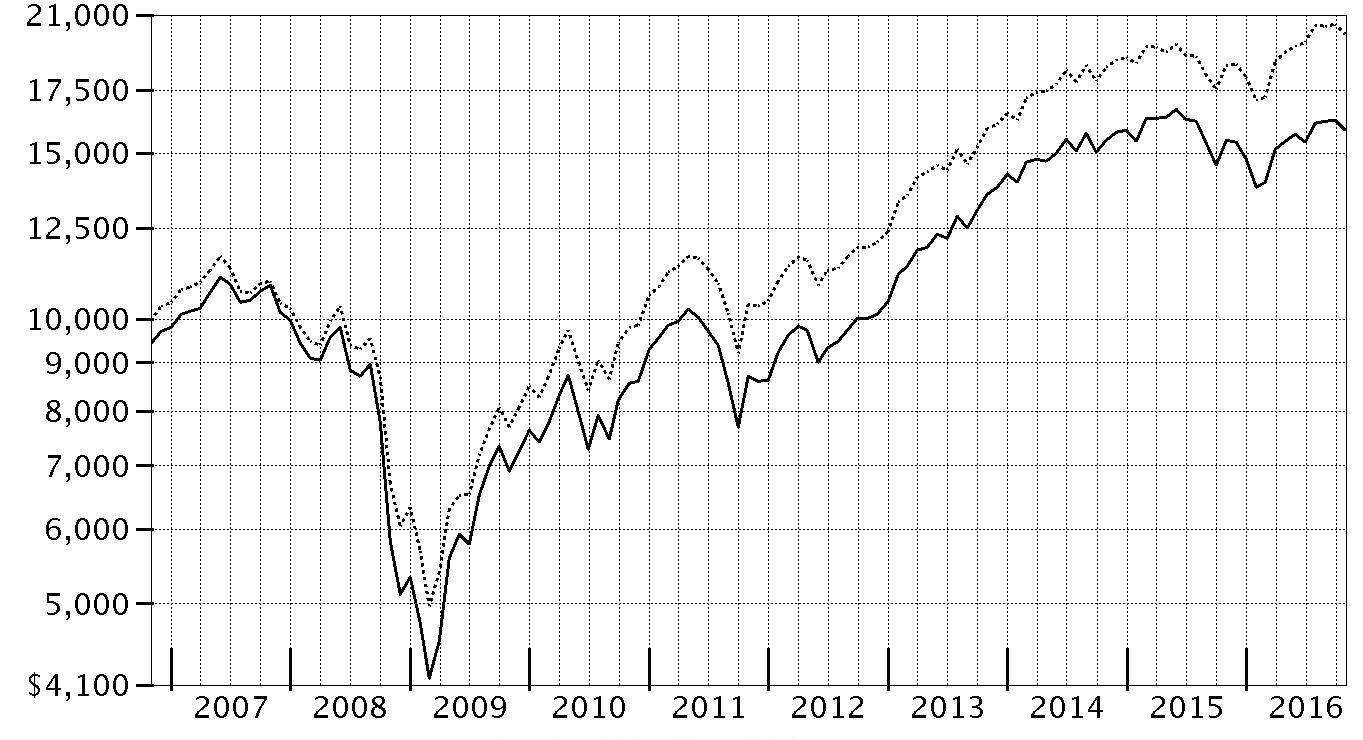
| Period Ending Values | ||
|
| $15,847 | Fidelity Advisor® Value Fund - Class A |
|
| $20,033 | Russell Midcap® Value Index |
Management's Discussion of Fund Performance
Market Recap: The S&P 500®index rose 4.51% for the fiscal year ending October 31, 2016, held back by uncertainty about U.S. Federal Reserve monetary policy and the presidential election, as well as the pointed decline markets experienced in the wake of the U.K.’s late-June vote to leave the European Union (Brexit). Overall, volatility was high at the beginning of the period, with continued oil-price weakness and U.S.-dollar strength pushing the S&P 500® to its worst January since 2009. Markets regained positive momentum in February amid U.S. job gains, a rally in energy and other stimuli. However, the June 23 Brexit vote surprised investors, and sent markets tumbling for two days. Sentiment rebounded rapidly and stayed largely positive through August, but September was choppy and October was the first down month for the index since February, as the looming uncertainty of the presidential election weighed on the markets. Among S&P 500 sectors, dividend-rich utilities (+17%) led amid strong demand for yield early in the period. Telecommunication services and information technology both gained about 11%, the latter helped by strong results from some of the largest tech names. Consumer staples (+9%) and industrials (+7%) also performed well. Real estate (+4%) and financials (+2%) were held back by low interest rates. Health care (-4%) suffered most amid an unclear political outlook. Comments from Co-Portfolio Manager Matthew Friedman: For the fiscal year, the fund’s share classes (excluding sales charges, if applicable) gained from about 2% to 3%, lagging the 7.84% return of the benchmark Russell Midcap® Value Index. Security selection overall was the main factor behind the fund’s relative underperformance. Industry positioning also detracted, but to a much lesser extent. Specifically, picks among consumer discretionary, materials and financials stocks dragged on relative performance the most. Among individual names, the fund’s largest relative detractor was Houghton Mifflin Harcourt, a publisher of educational materials for the K-12 market. The company missed its earnings projections repeatedly during the period due to lower-than-expected market growth, as well as unanticipated market share losses. A stake in fertilizer manufacturer CF Industries Holdings also hurt, as did avoiding gold producer and benchmark member Newmont Mining. Conversely, choices in the information technology sector helped markedly. Electric utility Exelon was the largest relative contributor. Shares were lifted by the market's recognition that half of the company's earnings came from stable, regulated businesses. Also, in late March, the Chicago-based company finalized its $6.8 billion merger with Pepco Holdings to create the largest U.S. power distributor. We sold our stake in Exelon by period end.The views expressed above reflect those of the portfolio manager(s) only through the end of the period as stated on the cover of this report and do not necessarily represent the views of Fidelity or any other person in the Fidelity organization. Any such views are subject to change at any time based upon market or other conditions and Fidelity disclaims any responsibility to update such views. These views may not be relied on as investment advice and, because investment decisions for a Fidelity fund are based on numerous factors, may not be relied on as an indication of trading intent on behalf of any Fidelity fund.
Investment Summary (Unaudited)
Top Ten Stocks as of October 31, 2016
| % of fund's net assets | % of fund's net assets 6 months ago | |
| Sempra Energy | 2.4 | 2.3 |
| Xcel Energy, Inc. | 2.0 | 1.6 |
| Edison International | 1.9 | 2.0 |
| Discover Financial Services | 1.2 | 1.1 |
| AECOM | 1.2 | 1.0 |
| American Electric Power Co., Inc. | 1.2 | 0.0 |
| Equity Lifestyle Properties, Inc. | 1.1 | 1.0 |
| Baker Hughes, Inc. | 1.1 | 0.6 |
| U.S. Bancorp | 1.1 | 1.1 |
| CIT Group, Inc. | 1.1 | 0.8 |
| 14.3 |
Top Five Market Sectors as of October 31, 2016
| % of fund's net assets | % of fund's net assets 6 months ago | |
| Financials | 17.3 | 28.7 |
| Consumer Discretionary | 12.6 | 9.5 |
| Real Estate | 11.1 | 0.0 |
| Industrials | 10.1 | 10.5 |
| Information Technology | 9.7 | 8.9 |
Prior period industry classifications reflect the categories in place as of the date indicated and have not been adjusted to reflect current industry classifications.
Asset Allocation (% of fund's net assets)
| As of October 31, 2016* | ||
| Stocks and Equity Futures | 97.3% | |
| Convertible Securities | 0.3% | |
| Short-Term Investments and Net Other Assets (Liabilities) | 2.4% | |

* Foreign investments - 15.9%
| As of April 30, 2016* | ||
| Stocks and Equity Futures | 95.2% | |
| Convertible Securities | 0.2% | |
| Short-Term Investments and Net Other Assets (Liabilities) | 4.6% | |

* Foreign investments - 15.3%
Percentages shown as 0.0% may reflect amounts less than 0.05%.
Investments October 31, 2016
Showing Percentage of Net Assets
| Common Stocks - 97.0% | |||
| Shares | Value | ||
| CONSUMER DISCRETIONARY - 12.6% | |||
| Auto Components - 1.2% | |||
| Delphi Automotive PLC | 5,214 | $339,275 | |
| Hertz Global Holdings, Inc. (a) | 10,358 | 343,368 | |
| Tenneco, Inc. (a) | 6,811 | 375,082 | |
| Visteon Corp. | 2,852 | 201,380 | |
| 1,259,105 | |||
| Diversified Consumer Services - 1.9% | |||
| H&R Block, Inc. | 21,141 | 485,609 | |
| Houghton Mifflin Harcourt Co. (a) | 57,395 | 726,047 | |
| Service Corp. International | 14,428 | 369,357 | |
| ServiceMaster Global Holdings, Inc. (a) | 10,054 | 359,833 | |
| 1,940,846 | |||
| Hotels, Restaurants & Leisure - 1.2% | |||
| Extended Stay America, Inc. unit | 22,234 | 317,946 | |
| Royal Caribbean Cruises Ltd. | 6,700 | 515,029 | |
| Wyndham Worldwide Corp. | 7,067 | 465,291 | |
| 1,298,266 | |||
| Household Durables - 0.8% | |||
| PulteGroup, Inc. | 5,300 | 98,580 | |
| Tupperware Brands Corp. | 4,549 | 270,756 | |
| Whirlpool Corp. | 2,769 | 414,852 | |
| 784,188 | |||
| Internet & Direct Marketing Retail - 0.8% | |||
| Liberty Interactive Corp. QVC Group Series A (a) | 46,999 | 869,012 | |
| Leisure Products - 0.4% | |||
| Mattel, Inc. | 6,685 | 210,778 | |
| Polaris Industries, Inc. (b) | 2,465 | 188,844 | |
| 399,622 | |||
| Media - 4.3% | |||
| Altice NV Class A (a) | 9,285 | 171,236 | |
| AMC Networks, Inc. Class A (a) | 4,300 | 210,399 | |
| CBS Corp. Class B | 4,500 | 254,790 | |
| Charter Communications, Inc. Class A (a) | 1,825 | 456,049 | |
| DISH Network Corp. Class A (a) | 5,100 | 298,656 | |
| John Wiley & Sons, Inc. Class A | 3,200 | 165,120 | |
| Liberty Broadband Corp. Class C (a) | 6,803 | 453,420 | |
| Liberty Global PLC Class C (a) | 9,200 | 292,560 | |
| Live Nation Entertainment, Inc. (a) | 15,585 | 431,237 | |
| Omnicom Group, Inc. | 6,238 | 497,917 | |
| Sinclair Broadcast Group, Inc. Class A | 15,866 | 398,237 | |
| Time, Inc. | 9,696 | 126,048 | |
| Tribune Media Co. Class A | 6,925 | 225,755 | |
| Twenty-First Century Fox, Inc.: | |||
| Class A | 8,893 | 233,619 | |
| Class B | 10,932 | 288,495 | |
| 4,503,538 | |||
| Multiline Retail - 0.4% | |||
| Dillard's, Inc. Class A | 3,280 | 201,064 | |
| Kohl's Corp. | 4,803 | 210,131 | |
| 411,195 | |||
| Specialty Retail - 1.4% | |||
| GameStop Corp. Class A | 14,100 | 339,105 | |
| GNC Holdings, Inc. | 10,100 | 135,643 | |
| Michaels Companies, Inc. (a) | 14,300 | 332,475 | |
| Office Depot, Inc. | 45,183 | 142,326 | |
| Sally Beauty Holdings, Inc. (a) | 8,817 | 228,713 | |
| Signet Jewelers Ltd. | 3,500 | 284,410 | |
| 1,462,672 | |||
| Textiles, Apparel & Luxury Goods - 0.2% | |||
| Gildan Activewear, Inc. | 8,400 | 215,746 | |
| TOTAL CONSUMER DISCRETIONARY | 13,144,190 | ||
| CONSUMER STAPLES - 3.0% | |||
| Beverages - 0.7% | |||
| C&C Group PLC | 20,364 | 78,241 | |
| Cott Corp. | 37,061 | 486,023 | |
| Molson Coors Brewing Co. Class B | 1,370 | 142,220 | |
| 706,484 | |||
| Food & Staples Retailing - 0.6% | |||
| AdvancePierre Foods Holdings, Inc. | 1,311 | 36,656 | |
| Walgreens Boots Alliance, Inc. | 1,813 | 149,989 | |
| Whole Foods Market, Inc. | 17,828 | 504,354 | |
| 690,999 | |||
| Food Products - 1.4% | |||
| Bunge Ltd. | 2,482 | 153,909 | |
| ConAgra Foods, Inc. | 4,189 | 201,826 | |
| Darling International, Inc. (a) | 25,229 | 343,114 | |
| Mead Johnson Nutrition Co. Class A | 1,442 | 107,818 | |
| Nomad Foods Ltd. (a) | 27,024 | 332,125 | |
| The J.M. Smucker Co. | 2,429 | 318,952 | |
| 1,457,744 | |||
| Household Products - 0.1% | |||
| Svenska Cellulosa AB (SCA) (B Shares) | 3,300 | 93,496 | |
| Personal Products - 0.2% | |||
| Coty, Inc. Class A | 7,700 | 177,023 | |
| TOTAL CONSUMER STAPLES | 3,125,746 | ||
| ENERGY - 8.2% | |||
| Energy Equipment & Services - 2.6% | |||
| Baker Hughes, Inc. | 20,412 | 1,130,825 | |
| BW Offshore Ltd. (a) | 3,357,431 | 138,160 | |
| Dril-Quip, Inc. (a) | 6,720 | 319,200 | |
| FMC Technologies, Inc. (a) | 7,557 | 243,864 | |
| Halliburton Co. | 6,855 | 315,330 | |
| Odfjell Drilling A/S (a) | 28,635 | 38,123 | |
| SBM Offshore NV | 19,400 | 278,663 | |
| Schlumberger Ltd. | 2,591 | 202,694 | |
| 2,666,859 | |||
| Oil, Gas & Consumable Fuels - 5.6% | |||
| Anadarko Petroleum Corp. | 8,577 | 509,817 | |
| Boardwalk Pipeline Partners, LP | 26,523 | 456,461 | |
| Cenovus Energy, Inc. | 22,569 | 325,587 | |
| Cheniere Energy, Inc. (a) | 6,000 | 226,200 | |
| Diamondback Energy, Inc. (a) | 3,396 | 310,021 | |
| Energen Corp. | 5,086 | 254,961 | |
| EQT Corp. | 6,679 | 440,814 | |
| GasLog Ltd. | 25,315 | 388,585 | |
| Golar LNG Ltd. | 9,500 | 207,955 | |
| Hess Corp. | 7,054 | 338,380 | |
| Lundin Petroleum AB (a) | 14,000 | 251,878 | |
| Marathon Petroleum Corp. | 10,278 | 448,018 | |
| Newfield Exploration Co. (a) | 11,416 | 463,375 | |
| Teekay Corp. | 40,800 | 266,424 | |
| Teekay LNG Partners LP | 25,100 | 371,480 | |
| Teekay Offshore Partners LP | 62,400 | 373,152 | |
| WPX Energy, Inc. (a) | 20,730 | 225,128 | |
| 5,858,236 | |||
| TOTAL ENERGY | 8,525,095 | ||
| FINANCIALS - 17.3% | |||
| Banks - 4.7% | |||
| Bank of Ireland (a) | 212,097 | 45,984 | |
| Barclays PLC sponsored ADR | 33,405 | 307,994 | |
| CIT Group, Inc. | 30,554 | 1,110,027 | |
| Citigroup, Inc. | 3,862 | 189,817 | |
| Cullen/Frost Bankers, Inc. | 760 | 57,752 | |
| EFG Eurobank Ergasias SA (a) | 81,516 | 47,964 | |
| First Citizen Bancshares, Inc. | 1,379 | 401,289 | |
| First Citizen Bancshares, Inc. Class A (a) | 1,408 | 409,728 | |
| Lloyds Banking Group PLC | 181,500 | 126,746 | |
| PNC Financial Services Group, Inc. | 2,531 | 241,964 | |
| U.S. Bancorp | 24,999 | 1,118,955 | |
| Wells Fargo & Co. | 17,149 | 789,025 | |
| 4,847,245 | |||
| Capital Markets - 3.8% | |||
| American Capital Ltd. (a) | 13,030 | 221,380 | |
| Apollo Global Management LLC Class A | 27,648 | 505,405 | |
| Ares Capital Corp. (b) | 22,570 | 345,321 | |
| Brookfield Asset Management, Inc. Class A | 6,250 | 218,864 | |
| Fortress Investment Group LLC | 45,511 | 229,831 | |
| Franklin Resources, Inc. | 12,640 | 425,462 | |
| KKR & Co. LP | 23,812 | 337,892 | |
| Legg Mason, Inc. | 17,035 | 489,245 | |
| NorthStar Asset Management Group, Inc. | 63,775 | 873,718 | |
| The Blackstone Group LP | 12,288 | 307,569 | |
| 3,954,687 | |||
| Consumer Finance - 3.6% | |||
| Capital One Financial Corp. | 10,880 | 805,555 | |
| Discover Financial Services | 22,152 | 1,247,822 | |
| Navient Corp. | 7,510 | 95,978 | |
| OneMain Holdings, Inc. (a) | 14,343 | 406,481 | |
| SLM Corp. (a) | 39,500 | 278,475 | |
| Synchrony Financial | 33,839 | 967,457 | |
| 3,801,768 | |||
| Diversified Financial Services - 1.4% | |||
| Berkshire Hathaway, Inc. Class B (a) | 7,252 | 1,046,464 | |
| Leucadia National Corp. | 20,040 | 374,147 | |
| 1,420,611 | |||
| Insurance - 3.6% | |||
| AFLAC, Inc. | 6,388 | 439,942 | |
| AMBAC Financial Group, Inc. (a) | 19,801 | 365,328 | |
| Brown & Brown, Inc. | 9,245 | 340,771 | |
| Chubb Ltd. | 6,764 | 859,028 | |
| FNF Group | 14,200 | 509,922 | |
| Greenlight Capital Re, Ltd. (a) | 8,977 | 178,642 | |
| Reinsurance Group of America, Inc. | 5,827 | 628,500 | |
| Torchmark Corp. | 7,368 | 467,205 | |
| 3,789,338 | |||
| Mortgage Real Estate Investment Trusts - 0.2% | |||
| MFA Financial, Inc. | 28,130 | 205,630 | |
| TOTAL FINANCIALS | 18,019,279 | ||
| HEALTH CARE - 7.0% | |||
| Biotechnology - 0.8% | |||
| Gilead Sciences, Inc. | 4,692 | 345,472 | |
| United Therapeutics Corp. (a) | 4,356 | 523,025 | |
| 868,497 | |||
| Health Care Equipment & Supplies - 1.0% | |||
| Alere, Inc. (a) | 8,700 | 388,716 | |
| Dentsply Sirona, Inc. | 2,300 | 132,411 | |
| Hill-Rom Holdings, Inc. | 1,265 | 70,094 | |
| St. Jude Medical, Inc. | 3,274 | 254,848 | |
| Zimmer Biomet Holdings, Inc. | 1,285 | 135,439 | |
| 981,508 | |||
| Health Care Providers & Services - 2.4% | |||
| Accretive Health, Inc. (a) | 73,627 | 175,969 | |
| Anthem, Inc. | 2,800 | 341,208 | |
| Cigna Corp. | 2,368 | 281,389 | |
| Envision Healthcare Holdings, Inc. (a) | 18,800 | 371,864 | |
| Laboratory Corp. of America Holdings (a) | 5,856 | 733,991 | |
| McKesson Corp. | 900 | 114,453 | |
| MEDNAX, Inc. (a) | 6,000 | 367,500 | |
| Universal Health Services, Inc. Class B | 1,032 | 124,573 | |
| 2,510,947 | |||
| Health Care Technology - 0.6% | |||
| CompuGroup Medical AG | 14,605 | 646,596 | |
| Life Sciences Tools & Services - 0.2% | |||
| Agilent Technologies, Inc. | 3,674 | 160,076 | |
| QIAGEN NV (a) | 2,200 | 53,636 | |
| 213,712 | |||
| Pharmaceuticals - 2.0% | |||
| Endo International PLC (a) | 26,331 | 493,706 | |
| Jazz Pharmaceuticals PLC (a) | 6,946 | 760,379 | |
| Mallinckrodt PLC (a) | 1,211 | 71,764 | |
| Perrigo Co. PLC | 1,698 | 141,257 | |
| Teva Pharmaceutical Industries Ltd. sponsored ADR | 10,325 | 441,291 | |
| The Medicines Company (a) | 2,400 | 79,080 | |
| Valeant Pharmaceuticals International, Inc. (Canada) (a) | 7,000 | 124,880 | |
| 2,112,357 | |||
| TOTAL HEALTH CARE | 7,333,617 | ||
| INDUSTRIALS - 10.1% | |||
| Aerospace& Defense - 1.9% | |||
| Aerojet Rocketdyne Holdings, Inc. (a) | 45,561 | 801,874 | |
| General Dynamics Corp. | 3,295 | 496,688 | |
| KLX, Inc. (a) | 10,500 | 361,410 | |
| L-3 Communications Holdings, Inc. | 1,021 | 139,816 | |
| Rolls-Royce Holdings PLC | 13,430 | 119,213 | |
| Textron, Inc. | 127 | 5,090 | |
| 1,924,091 | |||
| Airlines - 0.5% | |||
| American Airlines Group, Inc. | 6,987 | 283,672 | |
| Delta Air Lines, Inc. | 5,972 | 249,450 | |
| 533,122 | |||
| Building Products - 0.2% | |||
| Allegion PLC | 3,129 | 199,755 | |
| Commercial Services & Supplies - 0.5% | |||
| Regus PLC | 71,800 | 218,741 | |
| Team, Inc. (a) | 6,082 | 187,022 | |
| West Corp. | 5,064 | 99,862 | |
| 505,625 | |||
| Construction & Engineering - 1.6% | |||
| AECOM (a) | 43,419 | 1,209,219 | |
| Arcadis NV | 16,495 | 217,289 | |
| Astaldi SpA | 46,138 | 186,283 | |
| 1,612,791 | |||
| Electrical Equipment - 0.5% | |||
| Fortive Corp. | 4,693 | 239,578 | |
| Regal Beloit Corp. | 5,562 | 328,714 | |
| 568,292 | |||
| Industrial Conglomerates - 0.2% | |||
| Honeywell International, Inc. | 2,300 | 252,264 | |
| Machinery - 2.1% | |||
| Allison Transmission Holdings, Inc. | 32,889 | 963,319 | |
| Deere & Co. | 3,412 | 301,280 | |
| Flowserve Corp. | 8,628 | 365,396 | |
| Ingersoll-Rand PLC | 5,400 | 363,366 | |
| TriMas Corp. (a) | 8,076 | 144,964 | |
| 2,138,325 | |||
| Professional Services - 0.1% | |||
| Robert Half International, Inc. | 3,950 | 147,809 | |
| Road & Rail - 0.6% | |||
| CSX Corp. | 9,415 | 287,252 | |
| Swift Transporation Co. (a) | 14,058 | 314,618 | |
| 601,870 | |||
| Trading Companies & Distributors - 1.9% | |||
| AerCap Holdings NV (a) | 15,718 | 646,167 | |
| Ashtead Group PLC | 10,200 | 159,556 | |
| MRC Global, Inc. (a) | 13,066 | 192,593 | |
| Nexeo Solutions, Inc. (a) | 4,100 | 30,832 | |
| Nexeo Solutions, Inc. (c) | 14,400 | 108,288 | |
| Univar, Inc. (a) | 14,238 | 316,796 | |
| WESCO International, Inc. (a) | 9,841 | 533,382 | |
| 1,987,614 | |||
| TOTAL INDUSTRIALS | 10,471,558 | ||
| INFORMATION TECHNOLOGY - 9.7% | |||
| Communications Equipment - 0.7% | |||
| CommScope Holding Co., Inc. (a) | 10,697 | 326,793 | |
| Harris Corp. | 4,717 | 420,804 | |
| 747,597 | |||
| Electronic Equipment & Components - 1.8% | |||
| Avnet, Inc. | 6,300 | 264,285 | |
| Dell Technologies, Inc. (a) | 3,008 | 147,663 | |
| Flextronics International Ltd. (a) | 17,900 | 254,001 | |
| Jabil Circuit, Inc. | 44,207 | 943,377 | |
| TE Connectivity Ltd. | 4,704 | 295,740 | |
| 1,905,066 | |||
| Internet Software & Services - 0.2% | |||
| Web.com Group, Inc. (a) | 9,012 | 145,093 | |
| IT Services - 2.9% | |||
| Alliance Data Systems Corp. | 1,300 | 265,811 | |
| Cognizant Technology Solutions Corp. Class A (a) | 5,900 | 302,965 | |
| Computer Sciences Corp. | 11,014 | 599,712 | |
| EVERTEC, Inc. | 30,125 | 456,394 | |
| First Data Corp. Class A (a) | 25,400 | 355,346 | |
| Science Applications International Corp. | 6,311 | 434,891 | |
| Total System Services, Inc. | 6,100 | 304,268 | |
| Unisys Corp. (a) | 26,048 | 272,202 | |
| 2,991,589 | |||
| Semiconductors & Semiconductor Equipment - 3.0% | |||
| Cree, Inc. (a) | 14,000 | 312,200 | |
| Marvell Technology Group Ltd. | 55,385 | 721,667 | |
| Maxim Integrated Products, Inc. | 2,030 | 80,449 | |
| Micron Technology, Inc. (a) | 14,000 | 240,240 | |
| NXP Semiconductors NV (a) | 2,834 | 283,400 | |
| ON Semiconductor Corp. (a) | 24,423 | 285,016 | |
| Qorvo, Inc. (a) | 3,700 | 205,905 | |
| Qualcomm, Inc. | 12,107 | 831,993 | |
| Semtech Corp. (a) | 6,440 | 155,848 | |
| 3,116,718 | |||
| Software - 0.2% | |||
| RealPage, Inc. (a) | 9,100 | 247,520 | |
| Technology Hardware, Storage & Peripherals - 0.9% | |||
| Hewlett Packard Enterprise Co. | 11,199 | 251,642 | |
| HP, Inc. | 18,123 | 262,602 | |
| Western Digital Corp. | 7,888 | 460,975 | |
| 975,219 | |||
| TOTAL INFORMATION TECHNOLOGY | 10,128,802 | ||
| MATERIALS - 7.6% | |||
| Chemicals - 4.1% | |||
| Agrium, Inc. | 1,777 | 163,127 | |
| Ashland Global Holdings, Inc. | 3,100 | 346,363 | |
| Axalta Coating Systems (a) | 9,090 | 228,341 | |
| CF Industries Holdings, Inc. | 17,505 | 420,295 | |
| E.I. du Pont de Nemours & Co. | 11,984 | 824,379 | |
| Eastman Chemical Co. | 9,266 | 666,318 | |
| LyondellBasell Industries NV Class A | 8,218 | 653,742 | |
| Olin Corp. | 12,600 | 276,318 | |
| PPG Industries, Inc. | 2,500 | 232,825 | |
| Syngenta AG sponsored ADR | 2,800 | 225,176 | |
| Westlake Chemical Corp. | 4,070 | 210,785 | |
| 4,247,669 | |||
| Containers & Packaging - 2.1% | |||
| Avery Dennison Corp. | 3,898 | 272,041 | |
| Ball Corp. | 6,300 | 485,541 | |
| Berry Plastics Group, Inc. (a) | 11,428 | 499,975 | |
| Graphic Packaging Holding Co. | 62,706 | 783,825 | |
| Owens-Illinois, Inc. (a) | 8,700 | 167,910 | |
| 2,209,292 | |||
| Metals & Mining - 1.4% | |||
| Compass Minerals International, Inc. | 9,517 | 683,796 | |
| Freeport-McMoRan, Inc. | 17,088 | 191,044 | |
| Randgold Resources Ltd. sponsored ADR | 2,670 | 236,909 | |
| Steel Dynamics, Inc. | 10,675 | 293,136 | |
| 1,404,885 | |||
| TOTAL MATERIALS | 7,861,846 | ||
| REAL ESTATE - 11.1% | |||
| Equity Real Estate Investment Trusts (REITs) - 9.7% | |||
| American Tower Corp. | 8,819 | 1,033,499 | |
| AvalonBay Communities, Inc. | 2,200 | 376,596 | |
| Boston Properties, Inc. | 2,580 | 310,838 | |
| Douglas Emmett, Inc. | 13,100 | 478,150 | |
| Equity Commonwealth (a) | 900 | 27,189 | |
| Equity Lifestyle Properties, Inc. | 15,166 | 1,150,189 | |
| Equity Residential (SBI) | 6,100 | 376,675 | |
| Essex Property Trust, Inc. | 2,970 | 635,847 | |
| Extra Space Storage, Inc. | 7,575 | 554,111 | |
| First Potomac Realty Trust | 3,660 | 32,647 | |
| Forest City Realty Trust, Inc. | 30,818 | 665,361 | |
| Grivalia Properties REIC | 50,742 | 391,028 | |
| iStar Financial, Inc. (a) | 56,966 | 634,032 | |
| Lamar Advertising Co. Class A | 6,642 | 421,435 | |
| Mack-Cali Realty Corp. | 10,200 | 261,936 | |
| NorthStar Realty Europe Corp. | 2,424 | 23,973 | |
| NorthStar Realty Finance Corp. | 27,042 | 392,650 | |
| Outfront Media, Inc. | 30,924 | 665,175 | |
| Public Storage | 700 | 149,604 | |
| Simon Property Group, Inc. | 500 | 92,980 | |
| VEREIT, Inc. | 72,224 | 678,906 | |
| Welltower, Inc. | 3,000 | 205,590 | |
| WP Glimcher, Inc. | 58,319 | 611,766 | |
| 10,170,177 | |||
| Real Estate Management & Development - 1.4% | |||
| CBRE Group, Inc. (a) | 25,397 | 654,227 | |
| Kennedy Wilson Europe Real Estate PLC | 4,191 | 52,067 | |
| Kennedy-Wilson Holdings, Inc. (a) | 12,086 | 248,972 | |
| Realogy Holdings Corp. | 19,644 | 449,651 | |
| 1,404,917 | |||
| TOTAL REAL ESTATE | 11,575,094 | ||
| TELECOMMUNICATION SERVICES - 0.7% | |||
| Diversified Telecommunication Services - 0.7% | |||
| CenturyLink, Inc. | 10,149 | 269,760 | |
| Frontier Communications Corp. (b) | 45,522 | 182,998 | |
| Iridium Communications, Inc. (a)(b) | 27,704 | 225,788 | |
| 678,546 | |||
| UTILITIES - 9.7% | |||
| Electric Utilities - 6.3% | |||
| American Electric Power Co., Inc. | 18,611 | 1,206,737 | |
| Edison International | 26,572 | 1,952,511 | |
| NextEra Energy, Inc. | 4,128 | 528,384 | |
| OGE Energy Corp. | 11,556 | 358,698 | |
| PG&E Corp. | 6,720 | 417,446 | |
| Xcel Energy, Inc. | 49,831 | 2,070,478 | |
| 6,534,254 | |||
| Multi-Utilities - 3.4% | |||
| CMS Energy Corp. | 12,763 | 537,960 | |
| DTE Energy Co. | 5,679 | 545,241 | |
| Sempra Energy | 23,122 | 2,476,365 | |
| 3,559,566 | |||
| TOTAL UTILITIES | 10,093,820 | ||
| TOTAL COMMON STOCKS | |||
| (Cost $97,717,228) | 100,957,593 | ||
| Nonconvertible Preferred Stocks - 0.0% | |||
| INDUSTRIALS - 0.0% | |||
| Aerospace & Defense - 0.0% | |||
| Rolls-Royce Holdings PLC | |||
| (Cost $757) | 617,780 | 756 | |
| Principal Amount | Value | ||
| Convertible Bonds - 0.3% | |||
| ENERGY - 0.3% | |||
| Oil, Gas & Consumable Fuels - 0.3% | |||
| Cobalt International Energy, Inc. 2.625% 12/1/19 (Cost $320,758) | 600,000 | 274,977 | |
| U.S. Treasury Obligations - 0.1% | |||
| U.S. Treasury Bills, yield at date of purchase 0.26% to 0.36% 11/3/16 to 12/15/16 (d) | |||
| (Cost $119,963) | 120,000 | 119,982 | |
| Shares | Value | ||
| Money Market Funds - 3.3% | |||
| Fidelity Cash Central Fund, 0.41% (e) | 2,715,718 | $2,716,532 | |
| Fidelity Securities Lending Cash Central Fund 0.48% (e)(f) | 784,502 | 784,659 | |
| TOTAL MONEY MARKET FUNDS | |||
| (Cost $3,500,342) | 3,501,191 | ||
| TOTAL INVESTMENT PORTFOLIO - 100.7% | |||
| (Cost $101,659,048) | 104,854,499 | ||
| NET OTHER ASSETS (LIABILITIES) - (0.7)% | (753,368) | ||
| NET ASSETS - 100% | $104,101,131 |
| Futures Contracts | |||
| Expiration Date | Underlying Face Amount at Value | Unrealized Appreciation/(Depreciation) | |
| Purchased | |||
| Equity Index Contracts | |||
| 2 CME E-mini S&P MidCap 400 Index Contracts (United States) | Dec. 2016 | 301,360 | $(5,765) |
The face value of futures purchased as a percentage of Net Assets is 0.3%
Legend
(a) Non-income producing
(b) Security or a portion of the security is on loan at period end.
(c) Restricted securities - Investment in securities not registered under the Securities Act of 1933 (excluding 144A issues). At the end of the period, the value of restricted securities (excluding 144A issues) amounted to $108,288 or 0.1% of net assets.
(d) Security or a portion of the security was pledged to cover margin requirements for futures contracts. At period end, the value of securities pledged amounted to $119,982.
(e) Affiliated fund that is generally available only to investment companies and other accounts managed by Fidelity Investments. The rate quoted is the annualized seven-day yield of the fund at period end. A complete unaudited listing of the fund's holdings as of its most recent quarter end is available upon request. In addition, each Fidelity Central Fund's financial statements, which are not covered by the Fund's Report of Independent Registered Public Accounting Firm, are available on the SEC's website or upon request.
(f) Investment made with cash collateral received from securities on loan.
Additional information on each restricted holding is as follows:
| Security | Acquisition Date | Acquisition Cost |
| Nexeo Solutions, Inc. | 6/9/16 | $144,000 |
Affiliated Central Funds
Information regarding fiscal year to date income earned by the Fund from investments in Fidelity Central Funds is as follows:
| Fund | Income earned |
| Fidelity Cash Central Fund | $15,695 |
| Fidelity Securities Lending Cash Central Fund | 5,038 |
| Total | $20,733 |
Investment Valuation
The following is a summary of the inputs used, as of October 31, 2016, involving the Fund's assets and liabilities carried at fair value. The inputs or methodology used for valuing securities may not be an indication of the risk associated with investing in those securities. For more information on valuation inputs, and their aggregation into the levels used below, please refer to the Investment Valuation section in the accompanying Notes to Financial Statements.
| Valuation Inputs at Reporting Date: | ||||
| Description | Total | Level 1 | Level 2 | Level 3 |
| Investments in Securities: | ||||
| Equities: | ||||
| Consumer Discretionary | $13,144,190 | $13,144,190 | $-- | $-- |
| Consumer Staples | 3,125,746 | 3,125,746 | -- | -- |
| Energy | 8,525,095 | 8,525,095 | -- | -- |
| Financials | 18,019,279 | 17,892,533 | 126,746 | -- |
| Health Care | 7,333,617 | 7,333,617 | -- | -- |
| Industrials | 10,472,314 | 10,353,101 | 119,213 | -- |
| Information Technology | 10,128,802 | 10,128,802 | -- | -- |
| Materials | 7,861,846 | 7,861,846 | -- | -- |
| Real Estate | 11,575,094 | 11,575,094 | -- | -- |
| Telecommunication Services | 678,546 | 678,546 | -- | -- |
| Utilities | 10,093,820 | 10,093,820 | -- | -- |
| Corporate Bonds | 274,977 | -- | 274,977 | -- |
| U.S. Government and Government Agency Obligations | 119,982 | -- | 119,982 | -- |
| Money Market Funds | 3,501,191 | 3,501,191 | -- | -- |
| Total Investments in Securities: | $104,854,499 | $104,213,581 | $640,918 | $-- |
| Derivative Instruments: | ||||
| Liabilities | ||||
| Futures Contracts | $(5,765) | $(5,765) | $-- | $-- |
| Total Liabilities | $(5,765) | $(5,765) | $-- | $-- |
| Total Derivative Instruments: | $(5,765) | $(5,765) | $-- | $-- |
Value of Derivative Instruments
The following table is a summary of the Fund's value of derivative instruments by primary risk exposure as of October 31, 2016. For additional information on derivative instruments, please refer to the Derivative Instruments section in the accompanying Notes to Financial Statements.
| Primary Risk Exposure / Derivative Type | Value | |
| Asset | Liability | |
| Equity Risk | ||
| Futures Contracts(a) | $0 | $(5,765) |
| Total Equity Risk | 0 | (5,765) |
| Total Value of Derivatives | $0 | $(5,765) |
(a) Reflects gross cumulative appreciation (depreciation) on futures contracts as presented in the Schedule of Investments. In the Statement of Assets and Liabilities, the period end daily variation margin is included in receivable or payable for daily variation margin for derivative instruments, and the net cumulative appreciation (depreciation) is included in net unrealized appreciation (depreciation).
Other Information
Distribution of investments by country or territory of incorporation, as a percentage of Total Net Assets, is as follows (Unaudited):
| United States of America | 84.1% |
| Netherlands | 2.2% |
| Bermuda | 2.2% |
| Ireland | 2.1% |
| Canada | 1.5% |
| Switzerland | 1.3% |
| Marshall Islands | 1.1% |
| United Kingdom | 1.0% |
| Others (Individually Less Than 1%) | 4.5% |
| 100.0% |
See accompanying notes which are an integral part of the financial statements.
Financial Statements
Statement of Assets and Liabilities
| October 31, 2016 | ||
| Assets | ||
| Investment in securities, at value (including securities loaned of $754,440) — See accompanying schedule: Unaffiliated issuers (cost $98,158,706) | $101,353,308 | |
| Fidelity Central Funds (cost $3,500,342) | 3,501,191 | |
| Total Investments (cost $101,659,048) | $104,854,499 | |
| Receivable for investments sold | 1,079,866 | |
| Receivable for fund shares sold | 89,173 | |
| Dividends receivable | 24,438 | |
| Interest receivable | 6,584 | |
| Distributions receivable from Fidelity Central Funds | 1,777 | |
| Receivable for daily variation margin for derivative instruments | 1,678 | |
| Prepaid expenses | 268 | |
| Other receivables | 3,891 | |
| Total assets | 106,062,174 | |
| Liabilities | ||
| Payable to custodian bank | $96,301 | |
| Payable for investments purchased | 789,137 | |
| Payable for fund shares redeemed | 127,095 | |
| Accrued management fee | 36,081 | |
| Distribution and service plan fees payable | 32,194 | |
| Other affiliated payables | 23,197 | |
| Other payables and accrued expenses | 72,538 | |
| Collateral on securities loaned, at value | 784,500 | |
| Total liabilities | 1,961,043 | |
| Net Assets | $104,101,131 | |
| Net Assets consist of: | ||
| Paid in capital | $104,696,554 | |
| Undistributed net investment income | 425,372 | |
| Accumulated undistributed net realized gain (loss) on investments and foreign currency transactions | (4,210,289) | |
| Net unrealized appreciation (depreciation) on investments and assets and liabilities in foreign currencies | 3,189,494 | |
| Net Assets | $104,101,131 | |
| Calculation of Maximum Offering Price | ||
| Class A: | ||
| Net Asset Value and redemption price per share ($54,196,416 ÷ 2,529,066 shares) | $21.43 | |
| Maximum offering price per share (100/94.25 of $21.43) | $22.74 | |
| Class T: | ||
| Net Asset Value and redemption price per share ($18,098,005 ÷ 853,030 shares) | $21.22 | |
| Maximum offering price per share (100/96.50 of $21.22) | $21.99 | |
| Class C: | ||
| Net Asset Value and offering price per share ($15,588,777 ÷ 767,131 shares)(a) | $20.32 | |
| Class I: | ||
| Net Asset Value, offering price and redemption price per share ($16,217,933 ÷ 748,946 shares) | $21.65 |
(a) Redemption price per share is equal to net asset value less any applicable contingent deferred sales charge.
See accompanying notes which are an integral part of the financial statements.
Statement of Operations
| Year ended October 31, 2016 | ||
| Investment Income | ||
| Dividends | $2,127,728 | |
| Interest | 44,021 | |
| Income from Fidelity Central Funds | 20,733 | |
| Total income | 2,192,482 | |
| Expenses | ||
| Management fee | ||
| Basic fee | $535,247 | |
| Performance adjustment | (102,472) | |
| Transfer agent fees | 231,745 | |
| Distribution and service plan fees | 372,862 | |
| Accounting and security lending fees | 38,101 | |
| Custodian fees and expenses | 75,093 | |
| Independent trustees' fees and expenses | 417 | |
| Registration fees | 66,360 | |
| Audit | 66,275 | |
| Legal | 10,544 | |
| Miscellaneous | 815 | |
| Total expenses before reductions | 1,294,987 | |
| Expense reductions | (6,687) | 1,288,300 |
| Net investment income (loss) | 904,182 | |
| Realized and Unrealized Gain (Loss) | ||
| Net realized gain (loss) on: | ||
| Investment securities: | ||
| Unaffiliated issuers | (4,094,069) | |
| Fidelity Central Funds | 1,000 | |
| Foreign currency transactions | (1,493) | |
| Futures contracts | (31,015) | |
| Total net realized gain (loss) | (4,125,577) | |
| Change in net unrealized appreciation (depreciation) on: Investment securities | 5,682,303 | |
| Assets and liabilities in foreign currencies | 63 | |
| Futures contracts | (14,995) | |
| Total change in net unrealized appreciation (depreciation) | 5,667,371 | |
| Net gain (loss) | 1,541,794 | |
| Net increase (decrease) in net assets resulting from operations | $2,445,976 |
See accompanying notes which are an integral part of the financial statements.
Statement of Changes in Net Assets
| Year ended October 31, 2016 | Year ended October 31, 2015 | |
| Increase (Decrease) in Net Assets | ||
| Operations | ||
| Net investment income (loss) | $904,182 | $360,683 |
| Net realized gain (loss) | (4,125,577) | 11,769,234 |
| Change in net unrealized appreciation (depreciation) | 5,667,371 | (12,630,256) |
| Net increase (decrease) in net assets resulting from operations | 2,445,976 | (500,339) |
| Distributions to shareholders from net investment income | (403,934) | (153,278) |
| Distributions to shareholders from net realized gain | (1,698,817) | (63,887) |
| Total distributions | (2,102,751) | (217,165) |
| Share transactions - net increase (decrease) | 7,623,081 | 3,716,442 |
| Total increase (decrease) in net assets | 7,966,306 | 2,998,938 |
| Net Assets | ||
| Beginning of period | 96,134,825 | 93,135,887 |
| End of period | $104,101,131 | $96,134,825 |
| Other Information | ||
| Undistributed net investment income end of period | $425,372 | $83,452 |
See accompanying notes which are an integral part of the financial statements.
Financial Highlights — Fidelity Advisor Value Fund Class A
| Years ended October 31, | 2016 | 2015 | 2014 | 2013 | 2012 |
| Selected Per–Share Data | |||||
| Net asset value, beginning of period | $21.39 | $21.48 | $18.90 | $14.08 | $12.25 |
| Income from Investment Operations | |||||
| Net investment income (loss)A | .22 | .12 | .09 | .11 | .07 |
| Net realized and unrealized gain (loss) | .30 | (.14)B | 2.58 | 4.82 | 1.79 |
| Total from investment operations | .52 | (.02) | 2.67 | 4.93 | 1.86 |
| Distributions from net investment income | (.11) | (.05) | (.04) | (.11) | (.03) |
| Distributions from net realized gain | (.37) | (.02) | (.04) | – | – |
| Total distributions | (.48) | (.07) | (.09)C | (.11) | (.03) |
| Net asset value, end of period | $21.43 | $21.39 | $21.48 | $18.90 | $14.08 |
| Total ReturnD,E | 2.53% | (.12)%B | 14.15% | 35.30% | 15.22% |
| Ratios to Average Net AssetsF,G | |||||
| Expenses before reductions | 1.19% | 1.31% | 1.29% | 1.31% | 1.35% |
| Expenses net of fee waivers, if any | 1.19% | 1.25% | 1.25% | 1.25% | 1.25% |
| Expenses net of all reductions | 1.18% | 1.24% | 1.25% | 1.23% | 1.25% |
| Net investment income (loss) | 1.06% | .53% | .42% | .69% | .51% |
| Supplemental Data | |||||
| Net assets, end of period (000 omitted) | $54,196 | $50,858 | $45,759 | $38,397 | $27,817 |
| Portfolio turnover rateH | 77% | 82% | 78% | 103% | 77% |
A Calculated based on average shares outstanding during the period.
B Net realized and unrealized gain (loss) per share reflects proceeds received from litigation which amounted to $.01 per share. Excluding these litigation proceeds, the total return would have been (.17)%
C Total distributions of $.09 per share is comprised of distributions from net investment income of $.041 and distributions from net realized gain of $.044 per share.
D Total returns would have been lower if certain expenses had not been reduced during the applicable periods shown.
E Total returns do not include the effect of the sales charges.
F Fees and expenses of any underlying Fidelity Central Funds are not included in the Fund's expense ratio. The Fund indirectly bears its proportionate share of the expenses of any underlying Fidelity Central Funds.
G Expense ratios reflect operating expenses of the class. Expenses before reductions do not reflect amounts reimbursed by the investment adviser or reductions from brokerage service arrangements or reductions from other expense offset arrangements and do not represent the amount paid by the class during periods when reimbursements or reductions occur. Expenses net of fee waivers reflect expenses after reimbursement by the investment adviser but prior to reductions from brokerage service arrangements or other expense offset arrangements. Expenses net of all reductions represent the net expenses paid by the class.
H Amount does not include the portfolio activity of any underlying Fidelity Central Funds.
See accompanying notes which are an integral part of the financial statements.
Financial Highlights — Fidelity Advisor Value Fund Class T
| Years ended October 31, | 2016 | 2015 | 2014 | 2013 | 2012 |
| Selected Per–Share Data | |||||
| Net asset value, beginning of period | $21.17 | $21.27 | $18.72 | $13.95 | $12.15 |
| Income from Investment Operations | |||||
| Net investment income (loss)A | .16 | .06 | .03 | .07 | .03 |
| Net realized and unrealized gain (loss) | .31 | (.15)B | 2.56 | 4.78 | 1.80 |
| Total from investment operations | .47 | (.09) | 2.59 | 4.85 | 1.83 |
| Distributions from net investment income | (.05) | – | – | (.08) | (.03) |
| Distributions from net realized gain | (.37) | (.01) | (.04) | – | – |
| Total distributions | (.42) | (.01) | (.04) | (.08) | (.03) |
| Net asset value, end of period | $21.22 | $21.17 | $21.27 | $18.72 | $13.95 |
| Total ReturnC,D | 2.28% | (.43)%B | 13.88% | 34.94% | 15.05% |
| Ratios to Average Net AssetsE,F | |||||
| Expenses before reductions | 1.47% | 1.58% | 1.57% | 1.58% | 1.61% |
| Expenses net of fee waivers, if any | 1.46% | 1.50% | 1.50% | 1.50% | 1.50% |
| Expenses net of all reductions | 1.46% | 1.49% | 1.50% | 1.48% | 1.50% |
| Net investment income (loss) | .78% | .28% | .17% | .44% | .26% |
| Supplemental Data | |||||
| Net assets, end of period (000 omitted) | $18,098 | $17,300 | $18,558 | $17,319 | $12,727 |
| Portfolio turnover rateG | 77% | 82% | 78% | 103% | 77% |
A Calculated based on average shares outstanding during the period.
B Net realized and unrealized gain (loss) per share reflects proceeds received from litigation which amounted to $.01 per share. Excluding these litigation proceeds, the total return would have been (.48)%
C Total returns would have been lower if certain expenses had not been reduced during the applicable periods shown.
D Total returns do not include the effect of the sales charges.
E Fees and expenses of any underlying Fidelity Central Funds are not included in the Fund's expense ratio. The Fund indirectly bears its proportionate share of the expenses of any underlying Fidelity Central Funds.
F Expense ratios reflect operating expenses of the class. Expenses before reductions do not reflect amounts reimbursed by the investment adviser or reductions from brokerage service arrangements or reductions from other expense offset arrangements and do not represent the amount paid by the class during periods when reimbursements or reductions occur. Expenses net of fee waivers reflect expenses after reimbursement by the investment adviser but prior to reductions from brokerage service arrangements or other expense offset arrangements. Expenses net of all reductions represent the net expenses paid by the class.
G Amount does not include the portfolio activity of any underlying Fidelity Central Funds.
See accompanying notes which are an integral part of the financial statements.
Financial Highlights — Fidelity Advisor Value Fund Class C
| Years ended October 31, | 2016 | 2015 | 2014 | 2013 | 2012 |
| Selected Per–Share Data | |||||
| Net asset value, beginning of period | $20.35 | $20.54 | $18.13 | $13.51 | $11.83 |
| Income from Investment Operations | |||||
| Net investment income (loss)A | .05 | (.05) | (.07) | (.01) | (.03) |
| Net realized and unrealized gain (loss) | .29 | (.13)B | 2.48 | 4.64 | 1.73 |
| Total from investment operations | .34 | (.18) | 2.41 | 4.63 | 1.70 |
| Distributions from net investment income | – | – | – | (.01) | (.02) |
| Distributions from net realized gain | (.37) | (.01) | – | – | – |
| Total distributions | (.37) | (.01) | – | (.01) | (.02) |
| Net asset value, end of period | $20.32 | $20.35 | $20.54 | $18.13 | $13.51 |
| Total ReturnC,D | 1.72% | (.89)%B | 13.29% | 34.32% | 14.36% |
| Ratios to Average Net AssetsE,F | |||||
| Expenses before reductions | 1.98% | 2.09% | 2.06% | 2.08% | 2.10% |
| Expenses net of fee waivers, if any | 1.97% | 2.00% | 2.00% | 2.00% | 2.00% |
| Expenses net of all reductions | 1.97% | 1.99% | 2.00% | 1.98% | 1.99% |
| Net investment income (loss) | .27% | (.22)% | (.33)% | (.06)% | (.24)% |
| Supplemental Data | |||||
| Net assets, end of period (000 omitted) | $15,589 | $16,670 | $17,390 | $14,354 | $9,283 |
| Portfolio turnover rateG | 77% | 82% | 78% | 103% | 77% |
A Calculated based on average shares outstanding during the period.
B Net realized and unrealized gain (loss) per share reflects proceeds received from litigation which amounted to $.01 per share. Excluding these litigation proceeds, the total return would have been (.94)%
C Total returns would have been lower if certain expenses had not been reduced during the applicable periods shown.
D Total returns do not include the effect of the contingent deferred sales charge.
E Fees and expenses of any underlying Fidelity Central Funds are not included in the Fund's expense ratio. The Fund indirectly bears its proportionate share of the expenses of any underlying Fidelity Central Funds.
F Expense ratios reflect operating expenses of the class. Expenses before reductions do not reflect amounts reimbursed by the investment adviser or reductions from brokerage service arrangements or reductions from other expense offset arrangements and do not represent the amount paid by the class during periods when reimbursements or reductions occur. Expenses net of fee waivers reflect expenses after reimbursement by the investment adviser but prior to reductions from brokerage service arrangements or other expense offset arrangements. Expenses net of all reductions represent the net expenses paid by the class.
G Amount does not include the portfolio activity of any underlying Fidelity Central Funds.
See accompanying notes which are an integral part of the financial statements.
Financial Highlights — Fidelity Advisor Value Fund Class I
| Years ended October 31, | 2016 | 2015 | 2014 | 2013 | 2012 |
| Selected Per–Share Data | |||||
| Net asset value, beginning of period | $21.60 | $21.70 | $19.09 | $14.22 | $12.34 |
| Income from Investment Operations | |||||
| Net investment income (loss)A | .28 | .17 | .14 | .16 | .10 |
| Net realized and unrealized gain (loss) | .31 | (.14)B | 2.60 | 4.86 | 1.81 |
| Total from investment operations | .59 | .03 | 2.74 | 5.02 | 1.91 |
| Distributions from net investment income | (.17) | (.11) | (.09) | (.15) | (.03) |
| Distributions from net realized gain | (.37) | (.02) | (.04) | – | – |
| Total distributions | (.54) | (.13) | (.13) | (.15) | (.03) |
| Net asset value, end of period | $21.65 | $21.60 | $21.70 | $19.09 | $14.22 |
| Total ReturnC | 2.82% | .13%B | 14.46% | 35.65% | 15.56% |
| Ratios to Average Net AssetsD,E | |||||
| Expenses before reductions | .89% | 1.00% | .97% | .96% | .99% |
| Expenses net of fee waivers, if any | .89% | 1.00% | .97% | .96% | .99% |
| Expenses net of all reductions | .89% | .99% | .97% | .94% | .99% |
| Net investment income (loss) | 1.36% | .78% | .69% | .98% | .76% |
| Supplemental Data | |||||
| Net assets, end of period (000 omitted) | $16,218 | $10,391 | $10,011 | $6,405 | $4,080 |
| Portfolio turnover rateF | 77% | 82% | 78% | 103% | 77% |
A Calculated based on average shares outstanding during the period.
B Net realized and unrealized gain (loss) per share reflects proceeds received from litigation which amounted to $.01 per share. Excluding these litigation proceeds, the total return would have been .08%
C Total returns would have been lower if certain expenses had not been reduced during the applicable periods shown.
D Fees and expenses of any underlying Fidelity Central Funds are not included in the Fund's expense ratio. The Fund indirectly bears its proportionate share of the expenses of any underlying Fidelity Central Funds.
E Expense ratios reflect operating expenses of the class. Expenses before reductions do not reflect amounts reimbursed by the investment adviser or reductions from brokerage service arrangements or reductions from other expense offset arrangements and do not represent the amount paid by the class during periods when reimbursements or reductions occur. Expenses net of fee waivers reflect expenses after reimbursement by the investment adviser but prior to reductions from brokerage service arrangements or other expense offset arrangements. Expenses net of all reductions represent the net expenses paid by the class.
F Amount does not include the portfolio activity of any underlying Fidelity Central Funds.
See accompanying notes which are an integral part of the financial statements.
Notes to Financial Statements
For the period ended October 31, 2016
1. Organization.
Fidelity Advisor Value Fund (the Fund) is a fund of Fidelity Advisor Series I (the Trust) and is authorized to issue an unlimited number of shares. The Trust is registered under the Investment Company Act of 1940, as amended (the 1940 Act), as an open-end management investment company organized as a Massachusetts business trust. The Fund offers Class A, Class T, Class C, and Class I shares, each of which has equal rights as to assets and voting privileges. Each class has exclusive voting rights with respect to matters that affect that class.
After the close of business on June 24, 2016, all outstanding Class B shares were converted to Class A shares. All current fiscal period dollar and share amounts for Class B presented in the Notes to Financial Statements are for the period November 1, 2015 through June 24, 2016.
2. Investments in Fidelity Central Funds.
The Fund invests in Fidelity Central Funds, which are open-end investment companies generally available only to other investment companies and accounts managed by the investment adviser and its affiliates. The Fund's Schedule of Investments lists each of the Fidelity Central Funds held as of period end, if any, as an investment of the Fund, but does not include the underlying holdings of each Fidelity Central Fund. As an Investing Fund, the Fund indirectly bears its proportionate share of the expenses of the underlying Fidelity Central Funds.
The Money Market Central Funds seek preservation of capital and current income and are managed by Fidelity Investments Money Management, Inc. (FIMM), an affiliate of the investment adviser. Annualized expenses of the Money Market Central Funds as of their most recent shareholder report date are less than .005%.
A complete unaudited list of holdings for each Fidelity Central Fund is available upon request or at the Securities and Exchange Commission (the SEC) website at www.sec.gov. In addition, the financial statements of the Fidelity Central Funds, which are not covered by the Fund's Report of Independent Registered Public Accounting Firm, are available on the SEC website or upon request.
3. Significant Accounting Policies.
The financial statements have been prepared in conformity with accounting principles generally accepted in the United States of America (GAAP), which require management to make certain estimates and assumptions at the date of the financial statements. Actual results could differ from those estimates. Subsequent events, if any, through the date that the financial statements were issued have been evaluated in the preparation of the financial statements. The following summarizes the significant accounting policies of the Fund:
Investment Valuation. Investments are valued as of 4:00 p.m. Eastern time on the last calendar day of the period. The Board of Trustees (the Board) has delegated the day to day responsibility for the valuation of the Fund's investments to the Fair Value Committee (the Committee) established by the Fund's investment adviser. In accordance with valuation policies and procedures approved by the Board, the Fund attempts to obtain prices from one or more third party pricing vendors or brokers to value its investments. When current market prices, quotations or currency exchange rates are not readily available or reliable, investments will be fair valued in good faith by the Committee, in accordance with procedures adopted by the Board. Factors used in determining fair value vary by investment type and may include market or investment specific events, changes in interest rates and credit quality. The frequency with which these procedures are used cannot be predicted and they may be utilized to a significant extent. The Committee oversees the Fund's valuation policies and procedures and reports to the Board on the Committee's activities and fair value determinations. The Board monitors the appropriateness of the procedures used in valuing the Fund's investments and ratifies the fair value determinations of the Committee.
The Fund categorizes the inputs to valuation techniques used to value its investments into a disclosure hierarchy consisting of three levels as shown below:
- Level 1 – quoted prices in active markets for identical investments
- Level 2 – other significant observable inputs (including quoted prices for similar investments, interest rates, prepayment speeds, etc.)
- Level 3 – unobservable inputs (including the Fund's own assumptions based on the best information available)
Valuation techniques used to value the Fund's investments by major category are as follows:
Equity securities, including restricted securities, for which market quotations are readily available, are valued at the last reported sale price or official closing price as reported by a third party pricing vendor on the primary market or exchange on which they are traded and are categorized as Level 1 in the hierarchy. In the event there were no sales during the day or closing prices are not available, securities are valued at the last quoted bid price or may be valued using the last available price and are generally categorized as Level 2 in the hierarchy. For foreign equity securities, when market or security specific events arise, comparisons to the valuation of American Depositary Receipts (ADRs), futures contracts, Exchange-Traded Funds (ETFs) and certain indexes as well as quoted prices for similar securities may be used and would be categorized as Level 2 in the hierarchy. Utilizing these techniques may result in transfers between Level 1 and Level 2. For equity securities, including restricted securities, where observable inputs are limited, assumptions about market activity and risk are used and these securities may be categorized as Level 3 in the hierarchy.
Debt securities, including restricted securities, are valued based on evaluated prices received from third party pricing vendors or from brokers who make markets in such securities. Corporate bonds and U.S. government and government agency obligations are valued by pricing vendors who utilize matrix pricing which considers yield or price of bonds of comparable quality, coupon, maturity and type or by broker-supplied prices. When independent prices are unavailable or unreliable, debt securities may be valued utilizing pricing methodologies which consider similar factors that would be used by third party pricing vendors. Debt securities are generally categorized as Level 2 in the hierarchy but may be Level 3 depending on the circumstances.
Futures contracts are valued at the settlement price established each day by the board of trade or exchange on which they are traded and are categorized as Level 1 in the hierarchy. Investments in open-end mutual funds, including the Fidelity Central Funds, are valued at their closing net asset value (NAV) each business day and are categorized as Level 1 in the hierarchy.
Changes in valuation techniques may result in transfers in or out of an assigned level within the disclosure hierarchy. The aggregate value of investments by input level as of October 31, 2016 is included at the end of the Fund's Schedule of Investments.
Foreign Currency. The Fund may use foreign currency contracts to facilitate transactions in foreign-denominated securities. Gains and losses from these transactions may arise from changes in the value of the foreign currency or if the counterparties do not perform under the contracts' terms.
Foreign-denominated assets, including investment securities, and liabilities are translated into U.S. dollars at the exchange rates at period end. Purchases and sales of investment securities, income and dividends received and expenses denominated in foreign currencies are translated into U.S. dollars at the exchange rate in effect on the transaction date.
The effects of exchange rate fluctuations on investments are included with the net realized and unrealized gain (loss) on investment securities. Other foreign currency transactions resulting in realized and unrealized gain (loss) are disclosed separately.
Investment Transactions and Income. For financial reporting purposes, the Fund's investment holdings and NAV include trades executed through the end of the last business day of the period. The NAV per share for processing shareholder transactions is calculated as of the close of business of the New York Stock Exchange (NYSE), normally 4:00 p.m. Eastern time and includes trades executed through the end of the prior business day. Gains and losses on securities sold are determined on the basis of identified cost and may include proceeds received from litigation. Dividend income is recorded on the ex-dividend date, except for certain dividends from foreign securities where the ex-dividend date may have passed, which are recorded as soon as the Fund is informed of the ex-dividend date. Non-cash dividends included in dividend income, if any, are recorded at the fair market value of the securities received. Income and capital gain distributions from Fidelity Central Funds, if any, are recorded on the ex-dividend date. Distributions received on securities that represent a return of capital or capital gain are recorded as a reduction of cost of investments and/or as a realized gain. Subsequent to ex-dividend date the Fund determines the components of these distributions, based upon receipt of tax filings or other correspondence relating to the underlying investment. Interest income is accrued as earned and includes coupon interest and amortization of premium and accretion of discount on debt securities as applicable. Investment income is recorded net of foreign taxes withheld where recovery of such taxes is uncertain.
Class Allocations and Expenses. Investment income, realized and unrealized capital gains and losses, common expenses of the Fund, and certain fund-level expense reductions, if any, are allocated daily on a pro-rata basis to each class based on the relative net assets of each class to the total net assets of the Fund. Each class differs with respect to transfer agent and distribution and service plan fees incurred. Certain expense reductions may also differ by class. For the reporting period, the allocated portion of income and expenses to each class as a percent of its average net assets may vary due to the timing of recording these transactions in relation to fluctuating net assets of the classes. Expenses directly attributable to a fund are charged to that fund. Expenses attributable to more than one fund are allocated among the respective funds on the basis of relative net assets or other appropriate methods. Expense estimates are accrued in the period to which they relate and adjustments are made when actual amounts are known.
Income Tax Information and Distributions to Shareholders. Each year, the Fund intends to qualify as a regulated investment company under Subchapter M of the Internal Revenue Code, including distributing substantially all of its taxable income and realized gains. As a result, no provision for U.S. Federal income taxes is required. As of October 31, 2016, the Fund did not have any unrecognized tax benefits in the financial statements; nor is the Fund aware of any tax positions for which it is reasonably possible that the total amounts of unrecognized tax benefits will significantly change in the next twelve months. The Fund files a U.S. federal tax return, in addition to state and local tax returns as required. The Fund's federal income tax returns are subject to examination by the Internal Revenue Service (IRS) for a period of three fiscal years after they are filed. State and local tax returns may be subject to examination for an additional fiscal year depending on the jurisdiction. Foreign taxes are provided for based on the Fund's understanding of the tax rules and rates that exist in the foreign markets in which it invests.
Distributions are declared and recorded on the ex-dividend date. Income dividends and capital gain distributions are declared separately for each class. Income and capital gain distributions are determined in accordance with income tax regulations, which may differ from GAAP. In addition, the Fund claimed a portion of the payment made to redeeming shareholders as a distribution for income tax purposes.
Capital accounts within the financial statements are adjusted for permanent book-tax differences. These adjustments have no impact on net assets or the results of operations. Capital accounts are not adjusted for temporary book-tax differences which will reverse in a subsequent period.
Book-tax differences are primarily due to futures contracts, foreign currency transactions, passive foreign investment companies (PFIC), partnerships, capital loss carryforwards and losses deferred due to wash sales.
The federal tax cost of investment securities and unrealized appreciation (depreciation) as of period end were as follows:
| Gross unrealized appreciation | $10,859,139 |
| Gross unrealized depreciation | (8,525,386) |
| Net unrealized appreciation (depreciation) on securities | $2,333,753 |
| Tax Cost | $102,520,746 |
The tax-based components of distributable earnings as of period end were as follows:
| Undistributed ordinary income | $391,901 |
| Capital loss carryforward | $(3,320,850) |
| Net unrealized appreciation (depreciation) on securities and other investments | $2,333,561 |
Capital loss carryforwards are only available to offset future capital gains of the Fund to the extent provided by regulations and may be limited. Under the Regulated Investment Company Modernization Act of 2010 (the Act), the Fund is permitted to carry forward capital losses incurred in taxable years beginning after December 22, 2010 for an unlimited period and such capital losses are required to be used prior to any losses that expire. The capital loss carryforward information presented below, including any applicable limitation, is estimated as of fiscal period end and is subject to adjustment.
| No expiration | |
| Short-term | $(125,047) |
| Long-term | (3,195,803) |
| Total capital loss carryforward | $(3,320,850) |
The tax character of distributions paid was as follows:
| October 31, 2016 | October 31, 2015 | |
| Ordinary Income | $ 403,933 | $ 217,165 |
| Long-term Capital Gains | 1,698,818 | – |
| Total | $2,102,751 | $ 217,165 |
Restricted Securities. The Fund may invest in securities that are subject to legal or contractual restrictions on resale. These securities generally may be resold in transactions exempt from registration or to the public if the securities are registered. Disposal of these securities may involve time-consuming negotiations and expense, and prompt sale at an acceptable price may be difficult. Information regarding restricted securities is included at the end of the Fund's Schedule of Investments.
4. Derivative Instruments.
Risk Exposures and the Use of Derivative Instruments. The Fund's investment objective allows the Fund to enter into various types of derivative contracts, including futures contracts. Derivatives are investments whose value is primarily derived from underlying assets, indices or reference rates and may be transacted on an exchange or over-the-counter (OTC). Derivatives may involve a future commitment to buy or sell a specified asset based on specified terms, to exchange future cash flows at periodic intervals based on a notional principal amount, or for one party to make one or more payments upon the occurrence of specified events in exchange for periodic payments from the other party.
The Fund used derivatives to increase returns and to manage exposure to certain risks as defined below. The success of any strategy involving derivatives depends on analysis of numerous economic factors, and if the strategies for investment do not work as intended, the Fund may not achieve its objectives.
The Fund's use of derivatives increased or decreased its exposure to the following risk:
| Equity Risk | Equity risk relates to the fluctuations in the value of financial instruments as a result of changes in market prices (other than those arising from interest rate risk or foreign exchange risk), whether caused by factors specific to an individual investment, its issuer, or all factors affecting all instruments traded in a market or market segment. |
The Fund is also exposed to additional risks from investing in derivatives, such as liquidity risk and counterparty credit risk. Liquidity risk is the risk that the Fund will be unable to close out the derivative in the open market in a timely manner. Counterparty credit risk is the risk that the counterparty will not be able to fulfill its obligation to the Fund. Counterparty credit risk related to exchange-traded futures contracts may be mitigated by the protection provided by the exchange on which they trade.
Investing in derivatives may involve greater risks than investing in the underlying assets directly and, to varying degrees, may involve risk of loss in excess of any initial investment and collateral received and amounts recognized in the Statement of Assets and Liabilities. In addition, there may be the risk that the change in value of the derivative contract does not correspond to the change in value of the underlying instrument.
Futures Contracts. A futures contract is an agreement between two parties to buy or sell a specified underlying instrument for a fixed price at a specified future date. The Fund used futures contracts to manage its exposure to the stock market.
Upon entering into a futures contract, a fund is required to deposit either cash or securities (initial margin) with a clearing broker in an amount equal to a certain percentage of the face value of the contract. Futures contracts are marked-to-market daily and subsequent daily payments (variation margin) are made or received by a fund depending on the daily fluctuations in the value of the futures contracts and are recorded as unrealized appreciation or (depreciation). This receivable and/or payable, if any, is included in daily variation margin for derivative instruments in the Statement of Assets and Liabilities. Realized gain or (loss) is recorded upon the expiration or closing of a futures contract.
Any open futures contracts at period end are presented in the Schedule of Investments under the caption "Futures Contracts". The underlying face amount at value reflects each contract's exposure to the underlying instrument or index at period end and is representative of volume of activity during the period. Securities deposited to meet initial margin requirements are identified in the Schedule of Investments.
During the period the Fund recognized net realized gain (loss) of $(31,015) and a change in net unrealized appreciation (depreciation) of $(14,995) related to its investment in futures contracts. These amounts are included in the Statement of Operations.
5. Purchases and Sales of Investments.
Purchases and sales of securities, other than short-term securities, aggregated $79,463,901 and $72,698,350, respectively.
6. Fees and Other Transactions with Affiliates.
Management Fee. Fidelity Management & Research Company (the investment adviser) and its affiliates provide the Fund with investment management related services for which the Fund pays a monthly management fee. The management fee is the sum of an individual fund fee rate that is based on an annual rate of .30% of the Fund's average net assets and an annualized group fee rate that averaged .25% during the period. The group fee rate is based upon the average net assets of all the mutual funds advised by the investment adviser, including any mutual funds previously advised by the investment adviser that are currently advised by Fidelity SelectCo, LLC, an affiliate of the investment adviser. The group fee rate decreases as assets under management increase and increases as assets under management decrease. In addition, the management fee is subject to a performance adjustment (up to a maximum of +/- .20% of the Fund's average net assets over a 36 month performance period). The upward or downward adjustment to the management fee is based on the relative investment performance of Class I of the Fund as compared to its benchmark index, the Russell Midcap Value Index, over the same 36 month performance period. For the reporting period, the total annual management fee rate, including the performance adjustment, was .44% of the Fund's average net assets. The performance adjustment included in the management fee rate may be higher or lower than the maximum performance adjustment rate due to the difference between the average net assets for the reporting and performance periods.
Distribution and Service Plan Fees. In accordance with Rule 12b-1 of the 1940 Act, the Fund has adopted separate Distribution and Service Plans for each class of shares. Certain classes pay Fidelity Distributors Corporation (FDC), an affiliate of the investment adviser, separate Distribution and Service Fees, each of which is based on an annual percentage of each class' average net assets. In addition, FDC may pay financial intermediaries for selling shares of the Fund and providing shareholder support services. For the period, the Distribution and Service Fee rates, total fees and amounts retained by FDC were as follows:
| Distribution Fee | Service Fee | Total Fees | Retained by FDC |
|
| Class A | -% | .25% | $125,726 | $2,897 |
| Class T | .25% | .25% | 82,948 | – |
| Class B | .75% | .25% | 4,552 | 3,467 |
| Class C | .75% | .25% | 159,636 | 10,538 |
| $372,862 | $16,902 |
Sales Load. FDC may receive a front-end sales charge of up to 5.75% for selling Class A shares and 3.50% for selling Class T shares, some of which is paid to financial intermediaries for selling shares of the Fund. Depending on the holding period, FDC may receive contingent deferred sales charges levied on Class A, Class T, Class B and Class C redemptions. The deferred sales charges range from 5.00% to 1.00% for Class B shares, 1.00% for Class C shares, 1.00% for certain purchases of Class A shares and .25% for certain purchases of Class T shares.
For the period, sales charge amounts retained by FDC were as follows:
| Retained by FDC |
|
| Class A | $14,762 |
| Class T | 2,254 |
| Class B(a) | 17 |
| Class C(a) | 1,439 |
| $18,472 |
(a) When Class B and Class C shares are initially sold, FDC pays commissions from its own resources to financial intermediaries through which the sales are made.
Transfer Agent Fees. Fidelity Investments Institutional Operations Company, Inc., (FIIOC), an affiliate of the investment adviser, is the transfer, dividend disbursing and shareholder servicing agent for each class of the Fund. FIIOC receives account fees and asset-based fees that vary according to the account size and type of account of the shareholders of the respective classes of the Fund. FIIOC pays for typesetting, printing and mailing of shareholder reports, except proxy statements.
For the period, transfer agent fees for each class were as follows:
| Amount | % of Class-Level Average Net Assets |
|
| Class A | $117,218 | .23 |
| Class T | 43,230 | .26 |
| Class B | 1,307 | .29 |
| Class C | 43,289 | .27 |
| Class I | 26,701 | .19 |
| $231,745 |
Accounting and Security Lending Fees. Fidelity Service Company, Inc. (FSC), an affiliate of the investment adviser, maintains the Fund's accounting records. The accounting fee is based on the level of average net assets for each month. Under a separate contract, FSC administers the security lending program. The security lending fee is based on the number and duration of lending transactions.
Brokerage Commissions. The Fund placed a portion of its portfolio transactions with brokerage firms which are affiliates of the investment adviser. Brokerage commissions are included in net realized gain (loss) and change in net unrealized appreciation (depreciation) in the Statement of Operations. The commissions paid to these affiliated firms were $3,378 for the period.
Interfund Trades. The Fund may purchase from or sell securities to other Fidelity Funds under procedures adopted by the Board. The procedures have been designed to ensure these interfund trades are executed in accordance with Rule 17a-7 of the 1940 Act. Interfund trades are included within the respective purchases and sales amounts shown in the Purchases and Sales of Investments note.
7. Committed Line of Credit.
The Fund participates with other funds managed by the investment adviser or an affiliate in a $4.25 billion credit facility (the "line of credit") to be utilized for temporary or emergency purposes to fund shareholder redemptions or for other short-term liquidity purposes. The Fund has agreed to pay commitment fees on its pro-rata portion of the line of credit, which amounted to $249 and is reflected in Miscellaneous expenses on the Statement of Operations. During the period, the Fund did not borrow on this line of credit.
8. Security Lending.
The Fund lends portfolio securities through a lending agent from time to time in order to earn additional income. For equity securities, a lending agent is used and may loan securities to certain qualified borrowers, including Fidelity Capital Markets (FCM), a broker-dealer affiliated with the Fund. On the settlement date of the loan, the Fund receives collateral (in the form of U.S. Treasury obligations, letters of credit and/or cash) against the loaned securities and maintains collateral in an amount not less than 100% of the market value of the loaned securities during the period of the loan. The market value of the loaned securities is determined at the close of business of the Fund and any additional required collateral is delivered to the Fund on the next business day. The Fund or borrower may terminate the loan at any time, and if the borrower defaults on its obligation to return the securities loaned because of insolvency or other reasons, the Fund may apply collateral received from the borrower against the obligation. The Fund may experience delays and costs in recovering the securities loaned. Any cash collateral received is invested in the Fidelity Securities Lending Cash Central Fund. The value of loaned securities and cash collateral at period end are disclosed on the Fund's Statement of Assets and Liabilities. At period end, there were no security loans outstanding with FCM. Security lending income represents the income earned on investing cash collateral, less rebates paid to borrowers and any lending agent fees associated with the loan, plus any premium payments received for lending certain types of securities. Security lending income is presented in the Statement of Operations as a component of income from Fidelity Central Funds. Total security lending income during the period amounted to $5,038, including $1 from securities loaned to FCM.
9. Expense Reductions.
The investment adviser voluntarily agreed to reimburse each class to the extent annual operating expenses exceeded certain levels of average net assets as noted in the table below. Some expenses, for example interest expense, including commitment fees, are excluded from this reimbursement.
The following classes were in reimbursement during the period:
| Expense Limitations | Reimbursement | |
| Class B | 2.00% | $402 |
Commissions paid to certain brokers with whom the investment adviser, or its affiliates, places trades on behalf of the Fund include an amount in addition to trade execution, which may be rebated back to the Fund to offset certain expenses. This amount totaled $5,619 for the period.
In addition, during the period the investment adviser reimbursed and/or waived a portion of fund-level operating expenses in the amount of $666.
10. Distributions to Shareholders.
Distributions to shareholders of each class were as follows:
| Year ended October 31, 2016 | Year ended October 31, 2015 | |
| From net investment income | ||
| Class A | $271,815 | $101,012 |
| Class T | 40,168 | – |
| Class I | 91,951 | 52,266 |
| Total | $403,934 | $153,278 |
| From net realized gain | ||
| Class A | $882,206 | $40,780 |
| Class T | 297,241 | 6,850 |
| Class B | 16,135 | 509 |
| Class C | 301,923 | 6,869 |
| Class I | 201,312 | 8,879 |
| Total | $1,698,817 | $63,887 |
11. Share Transactions.
Share transactions for each class were as follows and may contain automatic conversions between classes or exchanges between affiliated funds:
| Shares | Shares | Dollars | Dollars | |
| Year ended October 31, 2016 | Year ended October 31, 2015 | Year ended October 31, 2016 | Year ended October 31, 2015 |
|
| Class A | ||||
| Shares sold | 824,070 | 960,039 | $16,976,958 | $21,148,738 |
| Reinvestment of distributions | 54,608 | 6,016 | 1,132,015 | 131,655 |
| Shares redeemed | (727,383) | (718,151) | (14,850,569) | (15,770,534) |
| Net increase (decrease) | 151,295 | 247,904 | $3,258,404 | $5,509,859 |
| Class T | ||||
| Shares sold | 192,081 | 111,689 | $4,011,968 | $2,464,811 |
| Reinvestment of distributions | 16,080 | 306 | 330,767 | 6,711 |
| Shares redeemed | (172,188) | (167,609) | (3,484,722) | (3,658,902) |
| Net increase (decrease) | 35,973 | (55,614) | $858,013 | $(1,187,380) |
| Class B | ||||
| Shares sold | 995 | 251 | $19,938 | $5,457 |
| Reinvestment of distributions | 769 | 23 | 15,282 | 484 |
| Shares redeemed | (46,605) | (24,225) | (903,723) | (513,169) |
| Net increase (decrease) | (44,841) | (23,951) | $(868,503) | $(507,228) |
| Class C | ||||
| Shares sold | 175,956 | 129,309 | $3,455,624 | $2,727,630 |
| Reinvestment of distributions | 14,372 | 305 | 284,567 | 6,463 |
| Shares redeemed | (242,360) | (157,096) | (4,738,320) | (3,304,608) |
| Net increase (decrease) | (52,032) | (27,482) | $(998,129) | $(570,515) |
| Class I | ||||
| Shares sold | 475,169 | 126,524 | $9,727,941 | $2,825,818 |
| Reinvestment of distributions | 12,080 | 2,352 | 252,359 | 51,833 |
| Shares redeemed | (219,416) | (109,030) | (4,607,004) | (2,405,945) |
| Net increase (decrease) | 267,833 | 19,846 | $5,373,296 | $471,706 |
12. Other.
The Fund's organizational documents provide former and current trustees and officers with a limited indemnification against liabilities arising in connection with the performance of their duties to the Fund. In the normal course of business, the Fund may also enter into contracts that provide general indemnifications. The Fund's maximum exposure under these arrangements is unknown as this would be dependent on future claims that may be made against the Fund. The risk of material loss from such claims is considered remote.
Report of Independent Registered Public Accounting Firm
To the Trustees of Fidelity Advisor Series I and Shareholders of Fidelity Advisor Value Fund:
We have audited the accompanying statement of assets and liabilities of Fidelity Advisor Value Fund (the Fund), a fund of Fidelity Advisor Series I, including the schedule of investments, as of October 31, 2016, and the related statement of operations for the year then ended, the statement of changes in net assets for each of the two years in the period then ended, and the financial highlights for each of the five years in the period then ended. These financial statements and financial highlights are the responsibility of the Fund's management. Our responsibility is to express an opinion on these financial statements and financial highlights based on our audits.
We conducted our audits in accordance with the standards of the Public Company Accounting Oversight Board (United States). Those standards require that we plan and perform the audit to obtain reasonable assurance about whether the financial statements and financial highlights are free of material misstatement. The Fund is not required to have, nor were we engaged to perform, an audit of its internal control over financial reporting. Our audits included consideration of internal control over financial reporting as a basis for designing audit procedures that are appropriate in the circumstances, but not for the purpose of expressing an opinion on the effectiveness of the Fund's internal control over financial reporting. Accordingly, we express no such opinion. An audit also includes examining, on a test basis, evidence supporting the amounts and disclosures in the financial statements, assessing the accounting principles used and significant estimates made by management, as well as evaluating the overall financial statement presentation. Our procedures included confirmation of securities owned as of October 31, 2016, by correspondence with the custodians and brokers; when replies were not received from brokers, we performed other auditing procedures. We believe that our audits provide a reasonable basis for our opinion.
In our opinion, such financial statements and financial highlights referred to above present fairly, in all material respects, the financial position of Fidelity Advisor Value Fund as of October 31, 2016, the results of its operations for the year then ended, the changes in its net assets for each of the two years in the period then ended, and the financial highlights for each of the five years in the period then ended, in conformity with accounting principles generally accepted in the United States of America.
DELOITTE & TOUCHE LLP
Boston, Massachusetts
December 12, 2016
Trustees and Officers
The Trustees, Members of the Advisory Board (if any), and officers of the trust and fund, as applicable, are listed below. The Board of Trustees governs the fund and is responsible for protecting the interests of shareholders. The Trustees are experienced executives who meet periodically throughout the year to oversee the fund's activities, review contractual arrangements with companies that provide services to the fund, oversee management of the risks associated with such activities and contractual arrangements, and review the fund's performance. Each of the Trustees oversees 170 funds.
The Trustees hold office without limit in time except that (a) any Trustee may resign; (b) any Trustee may be removed by written instrument, signed by at least two-thirds of the number of Trustees prior to such removal; (c) any Trustee who requests to be retired or who has become incapacitated by illness or injury may be retired by written instrument signed by a majority of the other Trustees; and (d) any Trustee may be removed at any special meeting of shareholders by a two-thirds vote of the outstanding voting securities of the trust. Each Trustee who is not an interested person (as defined in the 1940 Act) of the trust and the fund is referred to herein as an Independent Trustee. Each Independent Trustee shall retire not later than the last day of the calendar year in which his or her 75th birthday occurs. The Independent Trustees may waive this mandatory retirement age policy with respect to individual Trustees. Officers and Advisory Board Members hold office without limit in time, except that any officer or Advisory Board Member may resign or may be removed by a vote of a majority of the Trustees at any regular meeting or any special meeting of the Trustees. Except as indicated, each individual has held the office shown or other offices in the same company for the past five years.
The fund’s Statement of Additional Information (SAI) includes more information about the Trustees. To request a free copy, call Fidelity at 1-877-208-0098.
Experience, Skills, Attributes, and Qualifications of the Trustees. The Governance and Nominating Committee has adopted a statement of policy that describes the experience, qualifications, attributes, and skills that are necessary and desirable for potential Independent Trustee candidates (Statement of Policy). The Board believes that each Trustee satisfied at the time he or she was initially elected or appointed a Trustee, and continues to satisfy, the standards contemplated by the Statement of Policy. The Governance and Nominating Committee also engages professional search firms to help identify potential Independent Trustee candidates who have the experience, qualifications, attributes, and skills consistent with the Statement of Policy. From time to time, additional criteria based on the composition and skills of the current Independent Trustees, as well as experience or skills that may be appropriate in light of future changes to board composition, business conditions, and regulatory or other developments, have also been considered by the professional search firms and the Governance and Nominating Committee. In addition, the Board takes into account the Trustees' commitment and participation in Board and committee meetings, as well as their leadership of standing and ad hoc committees throughout their tenure.
In determining that a particular Trustee was and continues to be qualified to serve as a Trustee, the Board has considered a variety of criteria, none of which, in isolation, was controlling. The Board believes that, collectively, the Trustees have balanced and diverse experience, qualifications, attributes, and skills, which allow the Board to operate effectively in governing the fund and protecting the interests of shareholders. Information about the specific experience, skills, attributes, and qualifications of each Trustee, which in each case led to the Board's conclusion that the Trustee should serve (or continue to serve) as a trustee of the fund, is provided below.
Board Structure and Oversight Function. James C. Curvey is an interested person and currently serves as Chairman. The Trustees have determined that an interested Chairman is appropriate and benefits shareholders because an interested Chairman has a personal and professional stake in the quality and continuity of services provided to the fund. Independent Trustees exercise their informed business judgment to appoint an individual of their choosing to serve as Chairman, regardless of whether the Trustee happens to be independent or a member of management. The Independent Trustees have determined that they can act independently and effectively without having an Independent Trustee serve as Chairman and that a key structural component for assuring that they are in a position to do so is for the Independent Trustees to constitute a substantial majority for the Board. The Independent Trustees also regularly meet in executive session. Ned C. Lautenbach serves as Chairman of the Independent Trustees and as such (i) acts as a liaison between the Independent Trustees and management with respect to matters important to the Independent Trustees and (ii) with management prepares agendas for Board meetings.
Fidelity® funds are overseen by different Boards of Trustees. The fund's Board oversees Fidelity's high income and certain equity funds, and other Boards oversee Fidelity's investment-grade bond, money market, asset allocation, and sector funds. The asset allocation funds may invest in Fidelity® funds overseen by the fund's Board. The use of separate Boards, each with its own committee structure, allows the Trustees of each group of Fidelity® funds to focus on the unique issues of the funds they oversee, including common research, investment, and operational issues. On occasion, the separate Boards establish joint committees to address issues of overlapping consequences for the Fidelity® funds overseen by each Board.
The Trustees operate using a system of committees to facilitate the timely and efficient consideration of all matters of importance to the Trustees, the fund, and fund shareholders and to facilitate compliance with legal and regulatory requirements and oversight of the fund's activities and associated risks. The Board, acting through its committees, has charged FMR and its affiliates with (i) identifying events or circumstances the occurrence of which could have demonstrably adverse effects on the fund's business and/or reputation; (ii) implementing processes and controls to lessen the possibility that such events or circumstances occur or to mitigate the effects of such events or circumstances if they do occur; and (iii) creating and maintaining a system designed to evaluate continuously business and market conditions in order to facilitate the identification and implementation processes described in (i) and (ii) above. Because the day-to-day operations and activities of the fund are carried out by or through FMR, its affiliates, and other service providers, the fund's exposure to risks is mitigated but not eliminated by the processes overseen by the Trustees. While each of the Board's committees has responsibility for overseeing different aspects of the fund's activities, oversight is exercised primarily through the Operations, Audit, and Compliance Committees. In addition, the Independent Trustees have worked with FMR to enhance the Board's oversight of investment and financial risks, legal and regulatory risks, technology risks, and operational risks, including the development of additional risk reporting to the Board. For example, a working group comprised of Independent Trustees and FMR has worked and continues to work to review the Fidelity® funds' valuation-related activities, reporting and risk management. Appropriate personnel, including but not limited to the fund's Chief Compliance Officer (CCO), FMR's internal auditor, the independent accountants, the fund's Treasurer and portfolio management personnel, make periodic reports to the Board's committees, as appropriate, including an annual review of Fidelity's risk management program for the Fidelity® funds. The responsibilities of each standing committee, including their oversight responsibilities, are described further under "Standing Committees of the Trustees."
Interested Trustees*:
Correspondence intended for a Trustee who is an interested person may be sent to Fidelity Investments, 245 Summer Street, Boston, Massachusetts 02210.
Name, Year of Birth; Principal Occupations and Other Relevant Experience+
James C. Curvey (1935)
Year of Election or Appointment: 2007
Trustee
Chairman of the Board of Trustees
Mr. Curvey also serves as Trustee of other Fidelity® funds. Mr. Curvey is a Director of Fidelity Research & Analysis Co. (investment adviser firm, 2009-present), and Vice Chairman (2007-present) and Director of FMR LLC (diversified financial services company). In addition, Mr. Curvey serves as an Overseer for the Boston Symphony Orchestra and a member of the board of Artis-Naples, Naples, Florida, and as a Trustee for Brewster Academy, Wolfeboro, New Hampshire. Previously, Mr. Curvey served as a Director of Fidelity Investments Money Management, Inc. (investment adviser firm, 2009-2014) and a Director of FMR and FMR Co., Inc. (investment adviser firms, 2007-2014).
Charles S. Morrison (1960)
Year of Election or Appointment: 2014
Trustee
Mr. Morrison also serves as Trustee of other funds. He serves as President of Fidelity Management & Research Company (FMR) (investment adviser firm, 2016-present), a Director of Fidelity Investments Money Management, Inc. (FIMM) (investment adviser firm, 2014-present), Director of Fidelity SelectCo, LLC (investment adviser firm, 2014-present), President, Asset Management (2014-present), and is an employee of Fidelity Investments. Previously, Mr. Morrison served as Vice President of Fidelity's Fixed Income and Asset Allocation Funds (2012-2014), President, Fixed Income (2011-2014), Vice President of Fidelity's Money Market Funds (2005-2009), President, Money Market Group Leader of FMR (investment adviser firm, 2009), and Senior Vice President, Money Market Group of FMR (2004-2009). Mr. Morrison also served as Vice President of Fidelity's Bond Funds (2002-2005), certain Balanced Funds (2002-2005), and certain Asset Allocation Funds (2002-2007), and as Senior Vice President (2002-2005) of Fidelity's Bond Division.
* Determined to be an “Interested Trustee” by virtue of, among other things, his or her affiliation with the trust or various entities under common control with FMR.
+ The information includes the Trustee's principal occupation during the last five years and other information relating to the experience, attributes, and skills relevant to the Trustee's qualifications to serve as a Trustee, which led to the conclusion that the Trustee should serve as a Trustee for the fund.
Independent Trustees:
Correspondence intended for an Independent Trustee may be sent to Fidelity Investments, P.O. Box 55235, Boston, Massachusetts 02205-5235.
Name, Year of Birth; Principal Occupations and Other Relevant Experience+
Dennis J. Dirks (1948)
Year of Election or Appointment: 2005
Trustee
Mr. Dirks also serves as Trustee of other Fidelity® funds. Prior to his retirement in May 2003, Mr. Dirks was Chief Operating Officer and a member of the Board of The Depository Trust & Clearing Corporation (DTCC). He also served as President, Chief Operating Officer, and Board member of The Depository Trust Company (DTC) and President and Board member of the National Securities Clearing Corporation (NSCC). In addition, Mr. Dirks served as Chief Executive Officer and Board member of the Government Securities Clearing Corporation, Chief Executive Officer and Board member of the Mortgage-Backed Securities Clearing Corporation, as a Trustee and a member of the Finance Committee of Manhattan College (2005-2008), as a Trustee and a member of the Finance Committee of AHRC of Nassau County (2006-2008), and as a member of the Independent Directors Council (IDC) Governing Council (2010-2015). Mr. Dirks is a member of the Board of Directors for The Brookville Center for Children's Services, Inc. (2009-present).
Alan J. Lacy (1953)
Year of Election or Appointment: 2008
Trustee
Mr. Lacy also serves as Trustee of other Fidelity® funds. Mr. Lacy serves as Chairman (2014-present) and a member (2010-present) of the Board of Directors of Dave & Buster's Entertainment, Inc. (restaurant and entertainment complexes) and a Director of Bristol-Myers Squibb Company (global pharmaceuticals, 2008-present). He is a Trustee of the California Chapter of The Nature Conservancy (2015-present) and a Director of the Center for Advanced Study in the Behavioral Sciences at Stanford University (2015-present). In addition, Mr. Lacy served as Senior Adviser (2007-2014) of Oak Hill Capital Partners, L.P. (private equity) and also served as Chief Executive Officer (2005) and Vice Chairman (2005-2006) of Sears Holdings Corporation (retail) and Chief Executive Officer and Chairman of the Board of Sears, Roebuck and Co. (retail, 2000-2005). Previously, Mr. Lacy served as Chairman (2008-2011) and a member (2006-2015) of the Board of Trustees of the National Parks Conservation Association and as a member of the Board of Directors for The Western Union Company (global money transfer, 2006-2011), The Hillman Companies, Inc. (hardware wholesalers, 2010-2014), and Earth Fare, Inc. (retail grocery, 2010-2014).
Ned C. Lautenbach (1944)
Year of Election or Appointment: 2000
Trustee
Chairman of the Independent Trustees
Mr. Lautenbach also serves as Trustee of other Fidelity® funds. Mr. Lautenbach currently serves as the Lead Director of the Eaton Corporation Board of Directors (diversified industrial, 1997-present). Mr. Lautenbach is Chairman of the Board of Directors of Artis-Naples in Naples, Florida (2012-present), a member of the Council on Foreign Relations (1994-present), and a member of the Board of Governors, State University System of Florida (2013-present). Previously, Mr. Lautenbach was a Partner/Advisory Partner at Clayton, Dubilier & Rice, LLC (private equity investment, 1998-2010), as well as a Director of Sony Corporation (2006-2007).
Joseph Mauriello (1944)
Year of Election or Appointment: 2008
Trustee
Mr. Mauriello also serves as Trustee of other Fidelity® funds. Prior to his retirement in January 2006, Mr. Mauriello served in numerous senior management positions including Deputy Chairman and Chief Operating Officer (2004-2005), and Vice Chairman of Financial Services (2002-2004) of KPMG LLP US (professional services, 1965-2005). Mr. Mauriello currently serves as a member of the Board of Directors of XL Group plc. (global insurance and re-insurance, 2006-present) and the Independent Directors Council (IDC) Governing Council (2015-present). Previously, Mr. Mauriello served as a Director of the Hamilton Funds of the Bank of New York (2006-2007) and of Arcadia Resources Inc. (health care services and products, 2007-2012).
Robert W. Selander (1950)
Year of Election or Appointment: 2011
Trustee
Mr. Selander also serves as Trustee of other Fidelity® funds. Mr. Selander serves as a Director of The Western Union Company (global money transfer, 2014-present) and a non-executive Chairman of Health Equity, Inc. (health savings custodian, 2015-present). Previously, Mr. Selander served as a Member of the Advisory Board of certain Fidelity® funds (2011), and Executive Vice Chairman (2010), Chief Executive Officer (2009-2010), and President and Chief Executive Officer (1997-2009) of Mastercard, Inc.
Cornelia M. Small (1944)
Year of Election or Appointment: 2005
Trustee
Ms. Small also serves as Trustee of other Fidelity® funds. Ms. Small is a member of the Board of Directors (2009-present) and Chair of the Investment Committee (2010-present) of the Teagle Foundation. Ms. Small also serves on the Investment Committee of the Berkshire Taconic Community Foundation (2008-present). Previously, Ms. Small served as Chairperson (2002-2008) and a member of the Investment Committee and Chairperson (2008-2012) and a member of the Board of Trustees of Smith College. In addition, Ms. Small served as Chief Investment Officer, Director of Global Equity Investments, and a member of the Board of Directors of Scudder, Stevens & Clark and Scudder Kemper Investments.
William S. Stavropoulos (1939)
Year of Election or Appointment: 2002
Trustee
Vice Chairman of the Independent Trustees
Mr. Stavropoulos also serves as Trustee of other Fidelity® funds. Mr. Stavropoulos serves as President and Founder of the Michigan Baseball Foundation, the Great Lakes Loons (2007-present). Mr. Stavropoulos is Chairman Emeritus of the Board of Directors of The Dow Chemical Company, where he previously served in numerous senior management positions, including President, CEO (1995-2000; 2002-2004), Chairman of the Executive Committee (2000-2006), and as a member of the Board of Directors (1990-2006). Currently, Mr. Stavropoulos is Chairman of the Board of Directors of Univar Inc. (global distributor of commodity and specialty chemicals), a Director of Teradata Corporation (data warehousing and technology solutions), and Maersk Inc. (industrial conglomerate), and a member of the Advisory Board for Metalmark Capital LLC (private equity investment, 2005-present). Mr. Stavropoulos is an operating advisor to Clayton, Dubilier & Rice, LLC (private equity investment). In addition, Mr. Stavropoulos is a member of the University of Notre Dame Advisory Council for the College of Science, a Trustee of the Rollin L. Gerstacker Foundation, and a Director of the Naples Philharmonic Center for the Arts. Previously, Mr. Stavropoulos served as a Director of Chemical Financial Corporation (bank holding company, 1993-2012) and Tyco International, Ltd. (multinational manufacturing and services, 2007-2012).
David M. Thomas (1949)
Year of Election or Appointment: 2008
Trustee
Mr. Thomas also serves as Trustee of other Fidelity® funds. Mr. Thomas serves as Non-Executive Chairman of the Board of Directors of Fortune Brands Home and Security (home and security products, 2011-present), as a member of the Board of Directors (2004-present) and Presiding Director (2013-present) of Interpublic Group of Companies, Inc. (marketing communication), and as a member of the Board of Trustees of the University of Florida (2013-present). Previously, Mr. Thomas served as Executive Chairman (2005-2006) and Chairman and Chief Executive Officer (2000-2005) of IMS Health, Inc. (pharmaceutical and healthcare information solutions), and a Director of Fortune Brands, Inc. (consumer products, 2000-2011).
+ The information includes the Trustee's principal occupation during the last five years and other information relating to the experience, attributes, and skills relevant to the Trustee's qualifications to serve as a Trustee, which led to the conclusion that the Trustee should serve as a Trustee for the fund.
Advisory Board Members and Officers:
Correspondence intended for an officer or Peter S. Lynch may be sent to Fidelity Investments, 245 Summer Street, Boston, Massachusetts 02210. Officers appear below in alphabetical order.
Name, Year of Birth; Principal Occupation
Peter S. Lynch (1944)
Year of Election or Appointment: 2003
Member of the Advisory Board
Mr. Lynch also serves as Member of the Advisory Board of other Fidelity® funds. Mr. Lynch is Vice Chairman and a Director of FMR (investment adviser firm) and FMR Co., Inc. (investment adviser firm). In addition, Mr. Lynch serves as a Trustee of Boston College and as the Chairman of the Inner-City Scholarship Fund. Previously, Mr. Lynch served on the Special Olympics International Board of Directors (1997-2006).
Marc R. Bryant (1966)
Year of Election or Appointment: 2015
Secretary and Chief Legal Officer (CLO)
Mr. Bryant also serves as Secretary and CLO of other funds. Mr. Bryant serves as CLO, Secretary, and Senior Vice President of Fidelity Management & Research Company (investment adviser firm, 2015-present) and FMR Co., Inc. (investment adviser firm, 2015-present); Secretary of Fidelity SelectCo, LLC (investment adviser firm, 2015-present) and Fidelity Investments Money Management, Inc. (investment adviser firm, 2015-present); and CLO of Fidelity Management & Research (Hong Kong) Limited and FMR Investment Management (UK) Limited (investment adviser firms, 2015-present) and Fidelity Management & Research (Japan) Limited (investment adviser firm, 2016-present). He is Senior Vice President and Deputy General Counsel of FMR LLC (diversified financial services company). Previously, Mr. Bryant served as Secretary and CLO of Fidelity Rutland Square Trust II (2010-2014) and Assistant Secretary of Fidelity's Fixed Income and Asset Allocation Funds (2013-2015). Prior to joining Fidelity Investments, Mr. Bryant served as a Senior Vice President and the Head of Global Retail Legal for AllianceBernstein L.P. (2006-2010), and as the General Counsel for ProFund Advisors LLC (2001-2006).
Jeffrey S. Christian (1961)
Year of Election or Appointment: 2016
Assistant Treasurer
Mr. Christian also serves as Assistant Treasurer of other funds. Mr. Christian is an employee of Fidelity Investments (2003-present).
William C. Coffey (1969)
Year of Election or Appointment: 2009
Assistant Secretary
Mr. Coffey also serves as Assistant Secretary of other funds. He is Senior Vice President and Deputy General Counsel of FMR LLC (diversified financial services company, 2010-present), and is an employee of Fidelity Investments. Previously, Mr. Coffey served as Vice President and Associate General Counsel of FMR LLC (2005-2009).
Jonathan Davis (1968)
Year of Election or Appointment: 2010
Assistant Treasurer
Mr. Davis also serves as Assistant Treasurer of other funds, and is an employee of Fidelity Investments. Previously, Mr. Davis served as Vice President and Associate General Counsel of FMR LLC (diversified financial services company, 2003-2010).
Adrien E. Deberghes (1967)
Year of Election or Appointment: 2016
Assistant Treasurer
Mr. Deberghes also serves as an officer of other funds. He serves as Executive Vice President of Fidelity Investments Money Management, Inc. (FIMM) (investment adviser firm, 2016-present) and is an employee of Fidelity Investments (2008-present). Prior to joining Fidelity Investments, Mr. Deberghes was Senior Vice President of Mutual Fund Administration at State Street Corporation (2007-2008), Senior Director of Mutual Fund Administration at Investors Bank & Trust (2005-2007), and Director of Finance for Dunkin' Brands (2000-2005). Previously, Mr. Deberghes served in other fund officer roles.
Stephanie J. Dorsey (1969)
Year of Election or Appointment: 2010
Assistant Treasurer
Ms. Dorsey also serves as an officer of other funds. She is an employee of Fidelity Investments (2008-present) and has served in other fund officer roles. Prior to joining Fidelity Investments, Ms. Dorsey served as Treasurer (2004-2008) of the JPMorgan Mutual Funds and Vice President (2004-2008) of JPMorgan Chase Bank.
Howard J. Galligan III (1966)
Year of Election or Appointment: 2014
Chief Financial Officer
Mr. Galligan also serves as Chief Financial Officer of other funds. Mr. Galligan serves as President of Fidelity Pricing and Cash Management Services (FPCMS) (2014-present) and as a Director of Strategic Advisers, Inc. (investment adviser firm, 2008-present). Previously, Mr. Galligan served as Chief Administrative Officer of Asset Management (2011-2014) and Chief Operating Officer and Senior Vice President of Investment Support for Strategic Advisers, Inc. (2003-2011).
Scott C. Goebel (1968)
Year of Election or Appointment: 2015
Vice President
Mr. Goebel serves as Vice President of other funds and is an employee of Fidelity Investments (2001-present). Previously, Mr. Goebel served as Senior Vice President of Fidelity Management & Research Company (FMR) (investment adviser firm, 2016), Secretary of Fidelity SelectCo, LLC (investment adviser firm, 2013-2015), Fidelity Investments Money Management, Inc. (FIMM) (investment adviser firm, 2010-2015), and Fidelity Research and Analysis Company (FRAC) (investment adviser firm, 2010-2015); General Counsel, Secretary, and Senior Vice President of FMR (investment adviser firm, 2008-2015) and FMR Co., Inc. (investment adviser firm, 2008-2015); Assistant Secretary of Fidelity Management & Research (Japan) Limited (investment adviser firm, 2008-2015) and Fidelity Management & Research (U.K.) Inc. (investment adviser firm, 2008-2015); Chief Legal Officer (CLO) of Fidelity Management & Research (Hong Kong) Limited (investment adviser firm, 2008-2015); Secretary and CLO of certain Fidelity® funds (2008-2015); Assistant Secretary of FIMM (2008-2010), FRAC (2008-2010), and certain funds (2007-2008); and as Vice President and Secretary of Fidelity Distributors Corporation (FDC) (2005-2007).
Thomas C. Hense (1964)
Year of Election or Appointment: 2008, 2010, or 2015
Vice President
Mr. Hense serves as Vice President of Fidelity Advisor® Multi-Asset Income Fund (2015) and other funds (High Income (2008), Small Cap (2008), and Value (2010) funds), and is an employee of Fidelity Investments (1993-present). Previously, Mr. Hense served as a portfolio manager for Fidelity's Institutional Money Management Group (Pyramis) (2003-2008).
Brian B. Hogan (1964)
Year of Election or Appointment: 2009
Vice President
Mr. Hogan also serves as Trustee or Vice President of other funds. Mr. Hogan serves as a Director of FMR Investment Management (UK) Limited (investment adviser firm, 2015-present) and Fidelity SelectCo, LLC (investment adviser firm, 2014-present) and President of the Equity Division of FMR (investment adviser firm, 2009-present). Previously, Mr. Hogan served as Senior Vice President, Equity Research of FMR (2006-2009) and as a portfolio manager. Mr. Brian B. Hogan is not related to Mr. Colm A. Hogan.
Colm A. Hogan (1973)
Year of Election or Appointment: 2016
Deputy Treasurer
Mr. Hogan also serves as an officer of other funds. Mr. Hogan is an employee of Fidelity Investments (2005-present). Mr. Colm A. Hogan is not related to Mr. Brian B. Hogan.
Chris Maher (1972)
Year of Election or Appointment: 2013
Assistant Treasurer
Mr. Maher serves as Assistant Treasurer of other funds. Mr. Maher is Vice President of Valuation Oversight and is an employee of Fidelity Investments. Previously, Mr. Maher served as Vice President of Asset Management Compliance (2013), Vice President of the Program Management Group of FMR (investment adviser firm, 2010-2013), and Vice President of Valuation Oversight (2008-2010).
John F. Papandrea (1972)
Year of Election or Appointment: 2016
Anti-Money Laundering (AML) Officer
Mr. Papandrea also serves as AML Officer of other funds. Mr. Papandrea is Vice President of FMR LLC (diversified financial services company, 2008-present) and is an employee of Fidelity Investments (2005-present).
Kenneth B. Robins (1969)
Year of Election or Appointment: 2016
Chief Compliance Officer
Mr. Robins also serves as an officer of other funds. Mr. Robins serves as Compliance Officer of Fidelity Management & Research Company and FMR Co., Inc. (investment adviser firms, 2016-present) and is an employee of Fidelity Investments (2004-present). Previously, Mr. Robins served as Executive Vice President of Fidelity Investments Money Management, Inc. (investment adviser firm, 2013-2016) and served in other fund officer roles.
Stacie M. Smith (1974)
Year of Election or Appointment: 2016
President and Treasurer
Ms. Smith also serves as an officer of other funds. She is an employee of Fidelity Investments (2009-present) and has served in other fund officer roles. Prior to joining Fidelity Investments, Ms. Smith served as Senior Audit Manager of Ernst & Young LLP (accounting firm, 1996-2009). Previously, Ms. Smith served as Deputy Treasurer of certain Fidelity® funds (2013-2016).
Marc L. Spector (1972)
Year of Election or Appointment: 2016
Assistant Treasurer
Mr. Spector also serves as an officer of other funds. Mr. Spector is an employee of Fidelity Investments (2016-present). Prior to joining Fidelity Investments, Mr. Spector served as Director at the Siegfried Group (accounting firm, 2013-2016), and prior to Siegfried Group as audit senior manager at Deloitte & Touche (accounting firm, 2005-2013).
Renee Stagnone (1975)
Year of Election or Appointment: 2016
Assistant Treasurer
Ms. Stagnone also serves as an officer of other funds. Ms. Stagnone is an employee of Fidelity Investments (1997-present). Previously, Ms. Stagnone served as Deputy Treasurer of certain Fidelity® funds (2013-2016).
Shareholder Expense Example
As a shareholder of the Fund, you incur two types of costs: (1) transaction costs, including sales charges (loads) on purchase payments or redemption proceeds, and (2) ongoing costs, including management fees, distribution and/or service (12b-1) fees and other Fund expenses. This Example is intended to help you understand your ongoing costs (in dollars) of investing in the Fund and to compare these costs with the ongoing costs of investing in other mutual funds.
The Example is based on an investment of $1,000 invested at the beginning of the period and held for the entire period (May 1, 2016 to October 31, 2016).
Actual Expenses
The first line of the accompanying table for each class of the Fund provides information about actual account values and actual expenses. You may use the information in this line, together with the amount you invested, to estimate the expenses that you paid over the period. Simply divide your account value by $1,000.00 (for example, an $8,600 account value divided by $1,000.00 = 8.6), then multiply the result by the number in the first line for a class of the Fund under the heading entitled "Expenses Paid During Period" to estimate the expenses you paid on your account during this period. In addition, the Fund, as a shareholder in the underlying Fidelity Central Funds, will indirectly bear its pro-rata share of the fees and expenses incurred by the underlying Fidelity Central Funds. These fees and expenses are not included in the Fund's annualized expense ratio used to calculate the expense estimate in the table below.
Hypothetical Example for Comparison Purposes
The second line of the accompanying table for each class of the Fund provides information about hypothetical account values and hypothetical expenses based on a Class' actual expense ratio and an assumed rate of return of 5% per year before expenses, which is not the Class' actual return. The hypothetical account values and expenses may not be used to estimate the actual ending account balance or expenses you paid for the period. You may use this information to compare the ongoing costs of investing in the Fund and other funds. To do so, compare this 5% hypothetical example with the 5% hypothetical examples that appear in the shareholder reports of the other funds. In addition, the Fund, as a shareholder in the underlying Fidelity Central Funds, will indirectly bear its pro-rata share of the fees and expenses incurred by the underlying Fidelity Central Funds. These fees and expenses are not included in the Fund's annualized expense ratio used to calculate the expense estimate in the table below.
Please note that the expenses shown in the table are meant to highlight your ongoing costs only and do not reflect any transaction costs. Therefore, the second line of the table is useful in comparing ongoing costs only, and will not help you determine the relative total costs of owning different funds. In addition, if these transactional costs were included, your costs would have been higher.
| Annualized Expense Ratio-A | Beginning Account Value May 1, 2016 | Ending Account Value October 31, 2016 | Expenses Paid During Period-B May 1, 2016 to October 31, 2016 |
|
| Class A | 1.13% | |||
| Actual | $1,000.00 | $1,025.80 | $5.75 | |
| Hypothetical-C | $1,000.00 | $1,019.46 | $5.74 | |
| Class T | 1.44% | |||
| Actual | $1,000.00 | $1,024.60 | $7.33 | |
| Hypothetical-C | $1,000.00 | $1,017.90 | $7.30 | |
| Class C | 1.95% | |||
| Actual | $1,000.00 | $1,021.60 | $9.91 | |
| Hypothetical-C | $1,000.00 | $1,015.33 | $9.88 | |
| Class I | .83% | |||
| Actual | $1,000.00 | $1,027.50 | $4.23 | |
| Hypothetical-C | $1,000.00 | $1,020.96 | $4.22 |
A Annualized expense ratio reflects expenses net of applicable fee waivers.
B Expenses are equal to each Class' annualized expense ratio, multiplied by the average account value over the period, multiplied by 184/366 (to reflect the one-half year period).
C 5% return per year before expenses
Distributions (Unaudited)
The Board of Trustees of Fidelity Advisor Value Fund voted to pay to shareholders of record at the opening of business on record date, the following distributions per share derived from capital gains realized from sales of portfolio securities, and dividends derived from net investment income:
| Pay Date | Record Date | Dividends | Capital Gains | |
| Fidelity Advisor Value Fund | ||||
| Class A | 12/12/16 | 12/09/16 | $0.138 | $0.007 |
| Class T | 12/12/16 | 12/09/16 | $0.090 | $0.007 |
| Class C | 12/12/16 | 12/09/16 | $0.000 | $0.000 |
| Class I | 12/12/16 | 12/09/16 | $0.203 | $0.007 |
Class A, Class T, and Class I designate 100% of the dividends distributed in December during the fiscal year as qualifying for the dividends–received deduction for corporate shareholders.
Class A, Class T, and Class I designate 100% of the dividend distributed during the fiscal year as amounts which may be taken into account as a dividend for purposes of the maximum rate under section 1(h)(11) of the Internal Revenue Code.
The fund will notify shareholders in January 2017 of amounts for use in preparing 2016 income tax returns.
Board Approval of Investment Advisory Contracts and Management Fees
Fidelity Advisor Value Fund
Each year, the Board of Trustees, including the Independent Trustees (together, the Board), votes on the renewal of the management contract with Fidelity Management & Research Company (FMR) and the sub-advisory agreements (together, the Advisory Contracts) for the fund. The Board, assisted by the advice of fund counsel and Independent Trustees' counsel, requests and considers a broad range of information relevant to the renewal of the Advisory Contracts throughout the year.
The Board meets regularly and, at each of its meetings, covers an extensive agenda of topics and materials and considers factors that are relevant to its annual consideration of the renewal of the fund's Advisory Contracts, including the services and support provided to the fund and its shareholders. The Board has established various standing committees (Committees), each composed of and chaired by Independent Trustees with varying backgrounds, to which the Board has assigned specific subject matter responsibilities in order to enhance effective decision-making by the Board. The Board, acting directly and through its Committees, requests and receives information concerning the annual consideration of the renewal of the fund's Advisory Contracts. The Board also meets as needed to consider matters specifically related to the Board's annual consideration of the renewal of the Advisory Contracts. Members of the Board may also meet with trustees of other Fidelity funds through ad hoc joint committees to discuss certain matters relevant to all of the Fidelity funds.
At its July 2016 meeting, the Board unanimously determined to renew the fund's Advisory Contracts. In reaching its determination, the Board considered all factors it believed relevant, including (i) the nature, extent, and quality of the services to be provided to the fund and its shareholders (including the investment performance of the fund); (ii) the competitiveness of the fund's management fee and total expense ratio relative to peer funds; (iii) the total costs of the services to be provided by and the profits to be realized by Fidelity from its relationships with the fund; and (iv) the extent to which, if any, economies of scale exist and would be realized as the fund grows, and whether any economies of scale are appropriately shared with fund shareholders.
In considering whether to renew the Advisory Contracts for the fund, the Board reached a determination, with the assistance of fund counsel and Independent Trustees' counsel and through the exercise of its business judgment, that the renewal of the Advisory Contracts was in the best interests of the fund and its shareholders and that the compensation payable under the Advisory Contracts was fair and reasonable. The Board's decision to renew the Advisory Contracts was not based on any single factor, but rather was based on a comprehensive consideration of all the information provided to the Board at its meetings throughout the year. The Board, in reaching its determination to renew the Advisory Contracts, was aware that shareholders of the fund have a broad range of investment choices available to them, including a wide choice among funds offered by Fidelity's competitors, and that the fund's shareholders, who have the opportunity to review and weigh the disclosure provided by the fund in its prospectus and other public disclosures, have chosen to invest in this fund, which is part of the Fidelity family of funds.
Nature, Extent, and Quality of Services Provided. The Board considered Fidelity's staffing as it relates to the fund, including the backgrounds of investment personnel of Fidelity, and also considered the fund's investment objective, strategies, and related investment philosophy. The Independent Trustees also had discussions with senior management of Fidelity's investment operations and investment groups. The Board considered the structure of the investment personnel compensation program and whether this structure provides appropriate incentives to act in the best interests of the fund. Additionally, the Board considered the portfolio managers' investments, if any, in the funds that they manage. Resources Dedicated to Investment Management and Support Services. The Board and the Fund Oversight and Research Committees reviewed the general qualifications and capabilities of Fidelity's investment staff, including its size, education, experience, and resources, as well as Fidelity's approach to recruiting, training, managing, and compensating investment personnel. The Board noted that Fidelity has continued to increase the resources devoted to non-U.S. offices, including expansion of Fidelity's global investment organization. The Board also noted that Fidelity's analysts have extensive resources, tools and capabilities that allow them to conduct sophisticated quantitative and fundamental analysis, as well as credit analysis of issuers, counterparties and guarantors. Further, the Board considered that Fidelity's investment professionals have sufficient access to global information and data so as to provide competitive investment results over time, and that those professionals also have access to sophisticated tools that permit them to assess portfolio construction and risk and performance attribution characteristics continuously, as well as to transmit new information and research conclusions rapidly around the world. Additionally, in its deliberations, the Board considered Fidelity's trading, risk management, compliance, and technology and operations capabilities and resources, which are integral parts of the investment management process. Shareholder and Administrative Services. The Board considered (i) the nature, extent, quality, and cost of advisory, administrative, and shareholder services performed by FMR, the sub-advisers (together with FMR, the Investment Advisers), and their affiliates under the Advisory Contracts and under separate agreements covering transfer agency, pricing and bookkeeping, and securities lending services for the fund; (ii) the nature and extent of the supervision of third party service providers, principally custodians, subcustodians, and pricing vendors; and (iii) the resources devoted to, and the record of compliance with, the fund's compliance policies and procedures. The Board also reviewed the allocation of fund brokerage, including allocations to brokers affiliated with the Investment Advisers, the use of brokerage commissions to pay fund expenses, and the use of "soft" commission dollars to pay for research services.The Board noted that the growth of fund assets over time across the complex allows Fidelity to reinvest in the development of services designed to enhance the value or convenience of the Fidelity funds as investment vehicles. These services include 24-hour access to account information and market information through telephone representatives and over the Internet, investor education materials and asset allocation tools, and the expanded availability of Fidelity Investor Centers.In 2014, the Board formed an ad hoc Committee on Transfer Agency Fees to review the variety of transfer agency fee structures throughout the industry and Fidelity's competitive positioning with respect to industry participants. Investment in a Large Fund Family. The Board considered the benefits to shareholders of investing in a Fidelity fund, including the benefits of investing in a fund that is part of a large family of funds offering a variety of investment disciplines and providing a large variety of mutual fund investor services. The Board noted that Fidelity had taken, or had made recommendations that resulted in the Fidelity funds taking, a number of actions over the previous year that benefited particular funds, including: (i) continuing to dedicate additional resources to investment research and to the support of the senior management team that oversees asset management; (ii) continuing efforts to enhance Fidelity's global research capabilities; (iii) launching new funds and making other enhancements to meet client needs; (iv) broadening eligibility requirements for certain lower-priced share classes of, and streamlining the fee structure for, certain existing equity index funds; (v) lowering expense caps for certain existing funds and classes to reduce expenses paid by shareholders; (vi) eliminating redemption fees for certain variable insurance product funds and classes; (vii) continuing to launch dedicated lower cost underlying funds to meet portfolio construction needs related to expanding underlying fund options for Fidelity funds of funds, specifically for the Freedom Fund product lines; (viii) launching a lower cost share class for use by the Freedom Index Fund product line; (ix) rationalizing product lines and gaining increased efficiencies through fund mergers and share class consolidations; (x) continuing to develop, acquire and implement systems and technology to improve services to the funds and shareholders, strengthen information security, and increase efficiency; (xi) implementing investment enhancements to further strengthen Fidelity's target date product line to increase investors' probability of success in achieving their goals; (xii) accelerating the conversion of all remaining Class B shares to Class A shares, which have a lower expense structure; and (xiii) implementing changes to Fidelity's money market fund product line in response to recent regulatory reforms. Investment Performance. The Board considered whether the fund has operated in accordance with its investment objective, as well as its record of compliance with its investment restrictions and its performance history. The Board noted that there was a portfolio management change for the fund in January 2014.The Board took into account discussions with representatives of the Investment Advisers about fund investment performance that occur at Board meetings throughout the year. In this regard the Board noted that as part of regularly scheduled fund reviews and other reports to the Board on fund performance, the Board considers annualized return information for the fund, for different time periods, measured against a securities market index ("benchmark index") and a peer group of funds with similar objectives ("peer group"), if any. In its evaluation of fund investment performance, the Board gave particular attention to information indicating changes in performance of certain Fidelity funds for specific time periods and discussed with the Investment Advisers the reasons for any overperformance or underperformance.In addition to reviewing absolute and relative fund performance, the Independent Trustees periodically consider the appropriateness of fund performance metrics in evaluating the results achieved. In general, the Independent Trustees believe that fund performance should be evaluated based on net performance (after fees and expenses) of both the highest performing and lowest performing fund share classes, where applicable, compared to appropriate benchmark indices, over appropriate time periods that may include full market cycles, and compared to peer groups, as applicable, over the same periods, taking into account relevant factors including the following: general market conditions; issuer-specific information; and fund cash flows and other factors.The Independent Trustees recognize that shareholders evaluate performance on a net basis over their own holding periods, for which one-, three-, and five-year periods are often used as a proxy. For this reason, the performance information reviewed by the Board also included net cumulative calendar year total return information for the fund and an appropriate benchmark index and peer group for the most recent one-, three-, and five-year periods, as shown below. Returns are shown compared to the 25th percentile (top of box, 75% beaten) and 75th percentile (bottom of box, 25% beaten) of the peer universe.Fidelity Advisor Value Fund
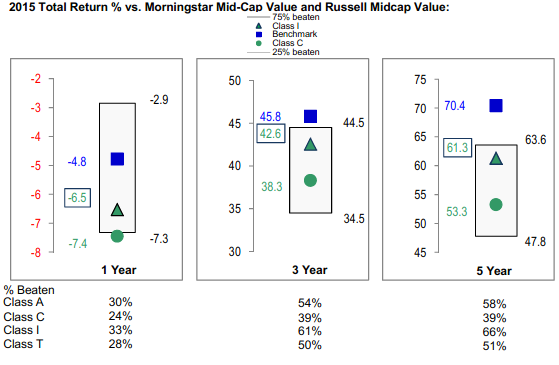
Fidelity Advisor Value Fund
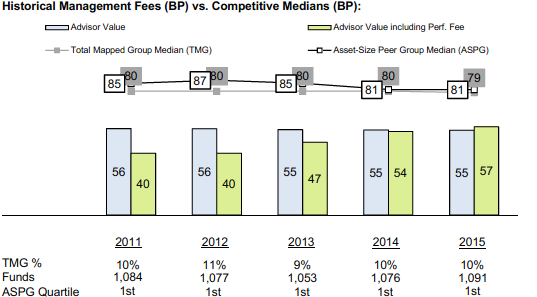
![]()
FAV-ANN-1216
1.808899.112
Item 2.
Code of Ethics
As of the end of the period, October 31, 2016, Fidelity Advisor Series I (the trust) has adopted a code of ethics, as defined in Item 2 of Form N-CSR, that applies to its President and Treasurer and its Chief Financial Officer. A copy of the code of ethics is filed as an exhibit to this Form N-CSR.
Item 3.
Audit Committee Financial Expert
The Board of Trustees of the trust has determined that Joseph Mauriello is an audit committee financial expert, as defined in Item 3 of Form N-CSR. Mr. Mauriello is independent for purposes of Item 3 of Form N-CSR.
Item 4.
Principal Accountant Fees and Services
Fees and Services
The following table presents fees billed by Deloitte & Touche LLP, the member firms of Deloitte Touche Tohmatsu, and their respective affiliates (collectively, “Deloitte Entities”) in each of the last two fiscal years for services rendered to Fidelity Advisor Floating Rate High Income Fund, Fidelity Advisor High Income Advantage Fund, Fidelity Advisor High Income Fund, and Fidelity Advisor Value Fund (the “Funds”):
Services Billed by Deloitte Entities
October 31, 2016 FeesA
| Audit Fees | Audit-Related Fees | Tax Fees | All Other Fees |
Fidelity Advisor Floating Rate High Income Fund | $149,000 | $- | $6,400 | $3,900 |
Fidelity Advisor High Income Advantage Fund | $70,000 | $- | $6,500 | $1,800 |
Fidelity Advisor High Income Fund | $59,000 | $- | $6,400 | $1,600 |
Fidelity Advisor Value Fund | $46,000 | $- | $6,600 | $1,200 |
October 31, 2015 FeesA
| Audit Fees | Audit-Related Fees | Tax Fees | All Other Fees |
Fidelity Advisor Floating Rate High Income Fund | $144,000 | $- | $6,100 | $3,300 |
Fidelity Advisor High Income Advantage Fund | $68,000 | $- | $6,400 | $1,100 |
Fidelity Advisor High Income Fund | $57,000 | $- | $6,100 | $800 |
Fidelity Advisor Value Fund | $45,000 | $- | $6,500 | $600 |
A Amounts may reflect rounding.
The following table presents fees billed by Deloitte Entities that were required to be approved by the Audit Committee for services that relate directly to the operations and financial reporting of the Funds and that are rendered on behalf of Fidelity Management & Research Company (“FMR”) and entities controlling, controlled by, or under common control with FMR (not including any sub-adviser whose role is primarily portfolio management and is subcontracted with or overseen by another investment adviser) that provide ongoing services to the Funds (“Fund Service Providers”):
Services Billed by Deloitte Entities
| October 31, 2016A | October 31, 2015A |
Audit-Related Fees | $40,000 | $- |
Tax Fees | $- | $10,000 |
All Other Fees | $- | $60,000 |
A Amounts may reflect rounding.
“Audit-Related Fees” represent fees billed for assurance and related services that are reasonably related to the performance of the fund audit or the review of the fund's financial statements and that are not reported under Audit Fees.
“Tax Fees” represent fees billed for tax compliance, tax advice or tax planning that relate directly to the operations and financial reporting of the fund.
“All Other Fees” represent fees billed for services provided to the fund or Fund Service Provider, a significant portion of which are assurance related, that relate directly to the operations and financial reporting of the fund, excluding those services that are reported under Audit Fees, Audit-Related Fees or Tax Fees.
Assurance services must be performed by an independent public accountant.
* * *
The aggregate non-audit fees billed by Deloitte Entities for services rendered to the Funds, FMR (not including any sub-adviser whose role is primarily portfolio management and is subcontracted with or overseen by another investment adviser), and any Fund Service Provider for each of the last two fiscal years of the Funds are as follows:
Billed By | October 31, 2016 A | October 31, 2015 A |
Deloitte Entities | $105,000 | $200,000 |
A Amounts may reflect rounding.
The trust's Audit Committee has considered non-audit services that were not pre-approved that were provided by Deloitte Entities to Fund Service Providers to be compatible with maintaining the independence of Deloitte Entities in its audit of the Funds, taking into account representations from Deloitte Entities, in accordance with Public Company Accounting Oversight Board rules, regarding its independence from the Funds and their related entities and FMR’s review of the appropriateness and permissibility under applicable law of such non-audit services prior to their provision to the Fund Service Providers.
Audit Committee Pre-Approval Policies and Procedures
The trust’s Audit Committee must pre-approve all audit and non-audit services provided by a fund’s independent registered public accounting firm relating to the operations or financial reporting of the fund. Prior to the commencement of any audit or non-audit services to a fund, the Audit Committee reviews the services to determine whether they are appropriate and permissible under applicable law.
The Audit Committee has adopted policies and procedures to, among other purposes, provide a framework for the Committee’s consideration of non-audit services by the audit firms that audit the Fidelity funds. The policies and procedures require that any non-audit service provided by a fund audit firm to a Fidelity fund and any non-audit service provided by a fund auditor to a Fund Service Provider that relates directly to the operations and financial reporting of a Fidelity fund (“Covered Service”) are subject to approval by the Audit Committee before such service is provided.
All Covered Services must be approved in advance of provision of the service either: (i) by formal resolution of the Audit Committee, or (ii) by oral or written approval of the service by the Chair of the Audit Committee (or if the Chair is unavailable, such other member of the Audit Committee as may be designated by the Chair to act in the Chair’s absence). The approval contemplated by (ii) above is permitted where the Treasurer determines that action on such an engagement is necessary before the next meeting of the Audit Committee.
Non-audit services provided by a fund audit firm to a Fund Service Provider that do not relate directly to the operations and financial reporting of a Fidelity fund are reported to the Audit Committee on a periodic basis.
Non-Audit Services Approved Pursuant to Rule 2-01(c)(7)(i)(C) and (ii) of Regulation S-X (“De Minimis Exception”)
There were no non-audit services approved or required to be approved by the Audit Committee pursuant to the De Minimis Exception during the Funds’ last two fiscal years relating to services provided to (i) the Funds or (ii) any Fund Service Provider that relate directly to the operations and financial reporting of the Funds.
Item 5.
Audit Committee of Listed Registrants
Not applicable.
Item 6.
Investments
(a)
Not applicable.
(b)
Not applicable
Item 7.
Disclosure of Proxy Voting Policies and Procedures for Closed-End Management Investment Companies
Not applicable.
Item 8.
Portfolio Managers of Closed-End Management Investment Companies
Not applicable.
Item 9.
Purchase of Equity Securities by Closed-End Management Investment Company and Affiliated Purchasers
Not applicable.
Item 10.
Submission of Matters to a Vote of Security Holders
There were no material changes to the procedures by which shareholders may recommend nominees to the trust’s Board of Trustees.
Item 11.
Controls and Procedures
(a)(i) The President and Treasurer and the Chief Financial Officer have concluded that the trust’s disclosure controls and procedures (as defined in Rule 30a-3(c) under the Investment Company Act) provide reasonable assurances that material information relating to the trust is made known to them by the appropriate persons, based on their evaluation of these controls and procedures as of a date within 90 days of the filing date of this report.
(a)(ii) There was no change in the trust’s internal control over financial reporting (as defined in Rule 30a-3(d) under the Investment Company Act) that occurred during the second fiscal quarter of the period covered by this report that has materially affected, or is reasonably likely to materially affect, the trust’s internal control over financial reporting.
Item 12.
Exhibits
(a) | (1) | Code of Ethics pursuant to Item 2 of Form N-CSR is filed and attached hereto as EX-99.CODE ETH. |
(a) | (2) | Certification pursuant to Rule 30a-2(a) under the Investment Company Act of 1940 (17 CFR 270.30a-2(a)) is filed and attached hereto as Exhibit 99.CERT. |
(a) | (3) | Not applicable. |
(b) |
| Certification pursuant to Rule 30a-2(b) under the Investment Company Act of 1940 (17 CFR 270.30a-2(b)) is furnished and attached hereto as Exhibit 99.906CERT. |
SIGNATURES
Pursuant to the requirements of the Securities Exchange Act of 1934 and the Investment Company Act of 1940, the registrant has duly caused this report to be signed on its behalf by the undersigned, thereunto duly authorized.
Fidelity Advisor Series I
By: | /s/ Stacie M. Smith |
| Stacie M. Smith |
| President and Treasurer |
|
|
Date: | December 28, 2016 |
Pursuant to the requirements of the Securities Exchange Act of 1934 and the Investment Company Act of 1940, this report has been signed below by the following persons on behalf of the registrant and in the capacities and on the dates indicated.
By: | /s/Stacie M. Smith |
| Stacie M. Smith |
| President and Treasurer |
|
|
Date: | December 28, 2016 |
By: | /s/Howard J. Galligan III |
| Howard J. Galligan III |
| Chief Financial Officer |
|
|
Date: | December 28, 2016 |