UNITED STATES
SECURITIES AND EXCHANGE COMMISSION
Washington, D.C. 20549
FORM N-CSR
CERTIFIED SHAREHOLDER REPORT OF REGISTERED
MANAGEMENT INVESTMENT COMPANIES
Investment Company Act file number 811-3785
Fidelity Advisor Series I
(Exact name of registrant as specified in charter)
245 Summer St., Boston, Massachusetts 02210
(Address of principal executive offices) (Zip code)
Marc Bryant, Secretary
245 Summer St.
Boston, Massachusetts 02210
(Name and address of agent for service)
Registrant's telephone number, including area code:
617-563-7000
Date of fiscal year end: | August 31 |
|
|
Date of reporting period: | August 31, 2016 |
Item 1.
Reports to Stockholders
|
Fidelity Advisor® Balanced Fund Class A, Class T, Class C, Class I and Class Z Annual Report August 31, 2016 |
 |
Contents
|
Board Approval of Investment Advisory Contracts and Management Fees |
To view a fund's proxy voting guidelines and proxy voting record for the 12-month period ended June 30, visit http://www.fidelity.com/proxyvotingresults or visit the Securities and Exchange Commission's (SEC) web site at http://www.sec.gov.
You may also call 1-877-208-0098 to request a free copy of the proxy voting guidelines.
Standard & Poor's, S&P and S&P 500 are registered service marks of The McGraw-Hill Companies, Inc. and have been licensed for use by Fidelity Distributors Corporation.
Other third-party marks appearing herein are the property of their respective owners.
All other marks appearing herein are registered or unregistered trademarks or service marks of FMR LLC or an affiliated company. © 2016 FMR LLC. All rights reserved.
This report and the financial statements contained herein are submitted for the general information of the shareholders of the Fund. This report is not authorized for distribution to prospective investors in the Fund unless preceded or accompanied by an effective prospectus.
A fund files its complete schedule of portfolio holdings with the SEC for the first and third quarters of each fiscal year on Form N-Q. Forms N-Q are available on the SEC’s web site at http://www.sec.gov. A fund's Forms N-Q may be reviewed and copied at the SEC’s Public Reference Room in Washington, DC. Information regarding the operation of the SEC's Public Reference Room may be obtained by calling 1-800-SEC-0330.
For a complete list of a fund's portfolio holdings, view the most recent holdings listing, semiannual report, or annual report on Fidelity's web site at http://www.fidelity.com, http://www.institutional.fidelity.com, or http://www.401k.com, as applicable.
NOT FDIC INSURED •MAY LOSE VALUE •NO BANK GUARANTEE
Neither the Fund nor Fidelity Distributors Corporation is a bank.
Performance: The Bottom Line
Average annual total return reflects the change in the value of an investment, assuming reinvestment of distributions from dividend income and capital gains (the profits earned upon the sale of securities that have grown in value, if any) and assuming a constant rate of performance each year. The hypothetical investment and the average annual total returns do not reflect the deduction of taxes that a shareholder would pay on fund distributions or the redemption of fund shares. During periods of reimbursement by Fidelity, a fund’s total return will be greater than it would be had the reimbursement not occurred. How a fund did yesterday is no guarantee of how it will do tomorrow.
Average Annual Total Returns
| For the periods ended August 31, 2016 | Past 1 year | Past 5 years | Past 10 years |
| Class A (incl. 5.75% sales charge) | 1.41% | 8.44% | 5.46% |
| Class T (incl. 3.50% sales charge) | 3.55% | 8.70% | 5.47% |
| Class C (incl. contingent deferred sales charge) | 5.79% | 8.90% | 5.28% |
| Class I | 7.93% | 10.01% | 6.37% |
| Class Z | 8.08% | 10.11% | 6.42% |
Class C shares' contingent deferred sales charges included in the past one year, past five years and past ten years total return figures are 1%, 0% and 0%, respectively.
The initial offering of Class Z shares took place on August 13, 2013. Returns prior to August 13, 2013, are those of Class I.
$10,000 Over 10 Years
Let's say hypothetically that $10,000 was invested in Fidelity Advisor® Balanced Fund - Class A on August 31, 2006, and the current 5.75% sales charge was paid.
The chart shows how the value of your investment would have changed, and also shows how the S&P 500® Index performed over the same period.
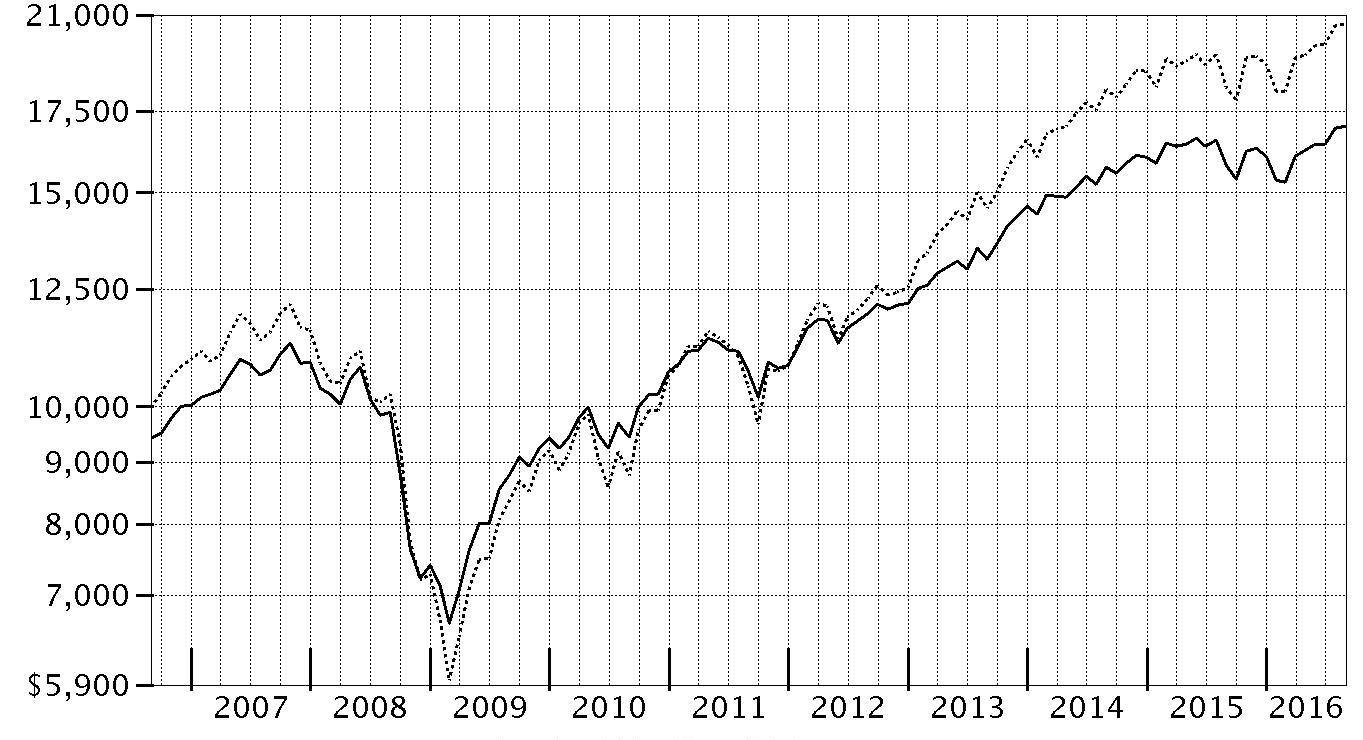
| Period Ending Values | ||
|
| $17,011 | Fidelity Advisor® Balanced Fund - Class A |
|
| $20,628 | S&P 500® Index |
Management's Discussion of Fund Performance
Market Recap: U.S. equities advanced strongly for the year ending August 31, 2016, overcoming persistent concern about global economic growth, U.S. monetary policy and the U.K.'s late-June vote to leave the European Union (Brexit). The S&P 500® index rose 12.55%, with larger-cap, value-oriented stocks and defensive sectors shining brightest. Volatility peaked in early 2016, as continued oil-price weakness and U.S.-dollar strength pushed the S&P 500® to its worst January since 2009. Markets then rose beginning in February amid U.S. job gains, a broad rally in energy and materials markets, global economic stimulus and perceived softening of monetary policy by the U.S. Federal Reserve. The June 23 Brexit vote resulted in a sharp two-day decline for stocks, followed by a rebound as investor sentiment shifted and remained positive through August 31. For the year, dividend-rich telecommunication services, utilities and consumer staples led the way amid strong investor demand for yield. Conversely, a strong run for real estate stocks couldn't help financials outpace the broader market. Meanwhile, the Barclays® U.S. Aggregate Bond Index rose 5.97% the past year, gaining significant ground in the mid-to-late stages of the period. The return primarily was driven by bond-price gains, in part as foreign investors sought the relatively higher yields and stability of U.S. fixed-income securities. Comments from Co-Portfolio Manager Robert Stansky: For the year, the fund's share classes (excluding sales charge, if applicable) posted high-single-digit gains, lagging the 10.09% advance of the Fidelity Balanced 60/40 Composite Index. Weak security selection in the fund's equity subportfolio accounted for virtually all of its underperformance versus the Composite index, while overweighting stocks and underweighting bonds added value, as did security selection in the investment-grade bond subportfolio. A sizable overweighting in the stock of AMETEK, a maker of electronic instruments and motors, was our biggest relative detractor and third-largest holding at period end. A substantial underweighting in strong-performing software giant Microsoft also detracted, as did an overweighting in consumer finance company Capital One Financial. Conversely, the equity subportfolio's top relative contributor was design-software provider Autodesk. Timely ownership of Keurig Green Mountain, maker of single-serve coffee and other beverage products, also contributed. After surging higher in early December on news the company would be taken private, Keurig was sold from the fund. The investment-grade bond subportfolio handily topped its benchmark. Both sector positioning and security selection contributed to our relative results this period. Conversely, out-of-benchmark exposure to Treasury Inflation-Protected Securities, or TIPS, detracted modestly.The views expressed above reflect those of the portfolio manager(s) only through the end of the period as stated on the cover of this report and do not necessarily represent the views of Fidelity or any other person in the Fidelity organization. Any such views are subject to change at any time based upon market or other conditions and Fidelity disclaims any responsibility to update such views. These views may not be relied on as investment advice and, because investment decisions for a Fidelity fund are based on numerous factors, may not be relied on as an indication of trading intent on behalf of any Fidelity fund.
Investment Summary (Unaudited)
The information in the following tables is based on the combined investments of the Fund and its pro-rata share of the investments of Fidelity's Fixed-Income Central Funds.Top Five Stocks as of August 31, 2016
| % of fund's net assets | % of fund's net assets 6 months ago | |
| Apple, Inc. | 2.2 | 1.4 |
| Alphabet, Inc. Class C | 2.0 | 2.1 |
| AMETEK, Inc. | 1.5 | 1.4 |
| Roper Technologies, Inc. | 1.4 | 1.4 |
| Autodesk, Inc. | 1.4 | 0.8 |
| 8.5 |
Top Five Bond Issuers as of August 31, 2016
| (with maturities greater than one year) | % of fund's net assets | % of fund's net assets 6 months ago |
| U.S. Treasury Obligations | 5.6 | 6.6 |
| Fannie Mae | 4.3 | 3.6 |
| Freddie Mac | 2.0 | 1.8 |
| Ginnie Mae | 1.5 | 1.6 |
| Citigroup, Inc. | 1.0 | 1.1 |
| 14.4 |
Top Five Market Sectors as of August 31, 2016
| % of fund's net assets | % of fund's net assets 6 months ago | |
| Financials | 18.1 | 18.0 |
| Information Technology | 13.4 | 12.7 |
| Health Care | 11.1 | 10.7 |
| Consumer Discretionary | 9.8 | 10.3 |
| Consumer Staples | 7.4 | 7.7 |
Asset Allocation (% of fund's net assets)
| As of August 31, 2016* | ||
| Stocks and Equity Futures | 65.7% | |
| Bonds | 31.6% | |
| Other Investments | 0.6% | |
| Short-Term Investments and Net Other Assets (Liabilities) | 2.1% | |

* Foreign investments - 11.2%
| As of February 29, 2016* | ||
| Stocks and Equity Futures | 64.5% | |
| Bonds | 33.4% | |
| Other Investments | 0.8% | |
| Short-Term Investments and Net Other Assets (Liabilities) | 1.3% | |

* Foreign investments - 12.0%
An unaudited holdings listing for the Fund, which presents direct holdings as well as the pro-rata share of any securities and other investments held indirectly through its investment in underlying non-money market Fidelity Central Funds, is available at fidelity.com and/or institutional.fidelity.com, as applicable.
Percentages in the above tables are adjusted for the effect of TBA Sale Commitments.
Percentages are adjusted for the effect of futures contracts and swaps, if applicable.
Investments August 31, 2016
Showing Percentage of Net Assets
| Common Stocks - 64.9% | |||
| Shares | Value (000s) | ||
| CONSUMER DISCRETIONARY - 8.3% | |||
| Automobiles - 0.5% | |||
| Tesla Motors, Inc. (a) | 50,566 | $10,720 | |
| Hotels, Restaurants & Leisure - 1.1% | |||
| Hilton Worldwide Holdings, Inc. | 381,800 | 9,114 | |
| Las Vegas Sands Corp. | 67,500 | 3,389 | |
| Starbucks Corp. | 242,500 | 13,636 | |
| 26,139 | |||
| Internet & Catalog Retail - 1.4% | |||
| Amazon.com, Inc. (a) | 42,260 | 32,505 | |
| TripAdvisor, Inc. (a) | 13,800 | 842 | |
| 33,347 | |||
| Leisure Products - 0.1% | |||
| Mattel, Inc. | 74,184 | 2,458 | |
| Media - 1.6% | |||
| Charter Communications, Inc. Class A (a) | 46,748 | 12,024 | |
| Interpublic Group of Companies, Inc. | 120,900 | 2,798 | |
| Manchester United PLC | 67,200 | 1,118 | |
| MDC Partners, Inc. Class A | 263,531 | 3,252 | |
| The Walt Disney Co. | 186,900 | 17,655 | |
| 36,847 | |||
| Multiline Retail - 0.1% | |||
| Dollar Tree, Inc. (a) | 33,000 | 2,729 | |
| Specialty Retail - 2.5% | |||
| Advance Auto Parts, Inc. | 14,060 | 2,213 | |
| AutoZone, Inc. (a) | 10,200 | 7,566 | |
| Home Depot, Inc. | 148,609 | 19,931 | |
| L Brands, Inc. | 139,604 | 10,639 | |
| Ross Stores, Inc. | 182,751 | 11,374 | |
| TJX Companies, Inc. | 85,565 | 6,626 | |
| 58,349 | |||
| Textiles, Apparel & Luxury Goods - 1.0% | |||
| NIKE, Inc. Class B | 244,764 | 14,108 | |
| VF Corp. | 150,900 | 9,363 | |
| 23,471 | |||
| TOTAL CONSUMER DISCRETIONARY | 194,060 | ||
| CONSUMER STAPLES - 6.6% | |||
| Beverages - 1.5% | |||
| Constellation Brands, Inc. Class A (sub. vtg.) | 41,200 | 6,759 | |
| Molson Coors Brewing Co. Class B | 4,300 | 440 | |
| Monster Beverage Corp. (a) | 34,825 | 5,359 | |
| The Coca-Cola Co. | 488,399 | 21,211 | |
| 33,769 | |||
| Food & Staples Retailing - 1.5% | |||
| CVS Health Corp. | 175,427 | 16,385 | |
| Kroger Co. | 312,836 | 10,008 | |
| Rite Aid Corp. (a) | 202,900 | 1,528 | |
| Sprouts Farmers Market LLC (a) | 47,300 | 1,066 | |
| Wal-Mart Stores, Inc. | 6,900 | 493 | |
| Walgreens Boots Alliance, Inc. | 65,900 | 5,319 | |
| Whole Foods Market, Inc. | 26,100 | 793 | |
| 35,592 | |||
| Food Products - 0.4% | |||
| Bunge Ltd. | 17,600 | 1,125 | |
| Mead Johnson Nutrition Co. Class A | 58,989 | 5,018 | |
| The Hain Celestial Group, Inc. (a) | 31,800 | 1,169 | |
| The Hershey Co. | 15,370 | 1,535 | |
| TreeHouse Foods, Inc. (a) | 10,733 | 1,017 | |
| 9,864 | |||
| Household Products - 1.0% | |||
| Colgate-Palmolive Co. | 207,457 | 15,422 | |
| Procter & Gamble Co. | 87,428 | 7,633 | |
| 23,055 | |||
| Personal Products - 0.3% | |||
| Estee Lauder Companies, Inc. Class A | 67,613 | 6,033 | |
| Nu Skin Enterprises, Inc. Class A | 31,412 | 1,818 | |
| 7,851 | |||
| Tobacco - 1.9% | |||
| Altria Group, Inc. | 313,703 | 20,733 | |
| British American Tobacco PLC sponsored ADR | 126,296 | 15,685 | |
| Philip Morris International, Inc. | 86,300 | 8,624 | |
| 45,042 | |||
| TOTAL CONSUMER STAPLES | 155,173 | ||
| ENERGY - 4.5% | |||
| Energy Equipment & Services - 0.9% | |||
| Baker Hughes, Inc. | 145,200 | 7,134 | |
| Dril-Quip, Inc. (a) | 23,339 | 1,297 | |
| Independence Contract Drilling, Inc. (a) | 69,437 | 350 | |
| Oceaneering International, Inc. | 30,829 | 818 | |
| Schlumberger Ltd. | 150,900 | 11,921 | |
| 21,520 | |||
| Oil, Gas & Consumable Fuels - 3.6% | |||
| Anadarko Petroleum Corp. | 136,811 | 7,315 | |
| Apache Corp. | 100,100 | 4,975 | |
| Black Stone Minerals LP | 69,600 | 1,128 | |
| Cabot Oil & Gas Corp. | 114,715 | 2,825 | |
| Chevron Corp. | 60,776 | 6,113 | |
| Cimarex Energy Co. | 31,300 | 4,137 | |
| ConocoPhillips Co. | 238,000 | 9,770 | |
| Devon Energy Corp. | 108,600 | 4,706 | |
| Exxon Mobil Corp. | 110,291 | 9,611 | |
| Newfield Exploration Co. (a) | 70,500 | 3,057 | |
| Noble Energy, Inc. | 114,245 | 3,939 | |
| Parsley Energy, Inc. Class A (a) | 70,600 | 2,390 | |
| Phillips 66 Co. | 77,074 | 6,046 | |
| Pioneer Natural Resources Co. | 26,800 | 4,799 | |
| PrairieSky Royalty Ltd. | 105,800 | 2,073 | |
| SM Energy Co. | 89,700 | 3,398 | |
| Southwestern Energy Co. (a) | 2,289 | 32 | |
| Suncor Energy, Inc. | 303,155 | 8,220 | |
| 84,534 | |||
| TOTAL ENERGY | 106,054 | ||
| FINANCIALS - 11.1% | |||
| Banks - 3.6% | |||
| Bank of America Corp. | 1,165,591 | 18,813 | |
| Citigroup, Inc. | 354,330 | 16,916 | |
| Comerica, Inc. | 71,000 | 3,358 | |
| Huntington Bancshares, Inc. | 699,245 | 6,999 | |
| JPMorgan Chase & Co. | 166,132 | 11,214 | |
| M&T Bank Corp. | 56,300 | 6,662 | |
| Regions Financial Corp. | 286,200 | 2,853 | |
| Sumitomo Mitsui Financial Group, Inc. | 16,800 | 588 | |
| Synovus Financial Corp. | 53,543 | 1,771 | |
| U.S. Bancorp | 278,833 | 12,310 | |
| Zions Bancorporation | 63,000 | 1,927 | |
| 83,411 | |||
| Capital Markets - 1.3% | |||
| Bank of New York Mellon Corp. | 31,400 | 1,308 | |
| BlackRock, Inc. Class A | 26,190 | 9,764 | |
| Charles Schwab Corp. | 152,000 | 4,782 | |
| E*TRADE Financial Corp. (a) | 68,921 | 1,818 | |
| Goldman Sachs Group, Inc. | 51,200 | 8,676 | |
| Northern Trust Corp. | 54,105 | 3,819 | |
| Oaktree Capital Group LLC Class A | 16,791 | 738 | |
| 30,905 | |||
| Consumer Finance - 1.7% | |||
| Capital One Financial Corp. | 368,034 | 26,351 | |
| Discover Financial Services | 45,900 | 2,754 | |
| Navient Corp. | 127,707 | 1,836 | |
| OneMain Holdings, Inc. (a) | 80,900 | 2,509 | |
| SLM Corp. (a) | 826,986 | 6,132 | |
| 39,582 | |||
| Diversified Financial Services - 1.0% | |||
| Berkshire Hathaway, Inc.: | |||
| Class A (a) | 10 | 2,258 | |
| Class B (a) | 43,400 | 6,531 | |
| Broadcom Ltd. | 50,600 | 8,927 | |
| CME Group, Inc. | 36,500 | 3,955 | |
| KBC Ancora (a) | 24,048 | 883 | |
| On Deck Capital, Inc. (a)(b) | 48,400 | 306 | |
| 22,860 | |||
| Insurance - 1.3% | |||
| American International Group, Inc. | 65,400 | 3,913 | |
| Chubb Ltd. | 77,791 | 9,874 | |
| Dai-ichi Mutual Life Insurance Co. | 41,700 | 580 | |
| Direct Line Insurance Group PLC | 293,227 | 1,421 | |
| Fairfax Financial Holdings Ltd. (sub. vtg.) | 1,400 | 792 | |
| Marsh & McLennan Companies, Inc. | 166,753 | 11,278 | |
| MetLife, Inc. | 31,767 | 1,379 | |
| Unum Group | 36,500 | 1,300 | |
| WMI Holdings Corp. (a)(b) | 4,527 | 11 | |
| 30,548 | |||
| Real Estate Investment Trusts - 2.0% | |||
| Altisource Residential Corp. Class B | 268,710 | 2,948 | |
| American Tower Corp. | 109,050 | 12,364 | |
| Boston Properties, Inc. | 23,700 | 3,321 | |
| Community Healthcare Trust, Inc. | 52,162 | 1,198 | |
| Coresite Realty Corp. | 7,400 | 577 | |
| Duke Realty LP | 89,000 | 2,503 | |
| Equinix, Inc. | 8,100 | 2,986 | |
| Extra Space Storage, Inc. | 47,300 | 3,810 | |
| FelCor Lodging Trust, Inc. | 87,100 | 619 | |
| Omega Healthcare Investors, Inc. | 18,900 | 684 | |
| Outfront Media, Inc. | 110,112 | 2,458 | |
| Store Capital Corp. | 293,400 | 8,693 | |
| Sun Communities, Inc. | 15,142 | 1,159 | |
| VEREIT, Inc. | 304,800 | 3,185 | |
| 46,505 | |||
| Real Estate Management & Development - 0.2% | |||
| CBRE Group, Inc. (a) | 129,048 | 3,857 | |
| Mitsubishi Estate Co. Ltd. | 33,000 | 624 | |
| 4,481 | |||
| Thrifts & Mortgage Finance - 0.0% | |||
| Washington Mutual, Inc. (a) | 130,000 | 0 | |
| TOTAL FINANCIALS | 258,292 | ||
| HEALTH CARE - 10.0% | |||
| Biotechnology - 2.7% | |||
| Alexion Pharmaceuticals, Inc. (a) | 50,964 | 6,414 | |
| Amgen, Inc. | 100,905 | 17,160 | |
| Biogen, Inc. (a) | 30,375 | 9,284 | |
| Celgene Corp. (a) | 62,200 | 6,639 | |
| Gilead Sciences, Inc. | 50,585 | 3,965 | |
| Regeneron Pharmaceuticals, Inc. (a) | 14,600 | 5,731 | |
| Shire PLC sponsored ADR | 35,900 | 6,720 | |
| Vertex Pharmaceuticals, Inc. (a) | 68,400 | 6,464 | |
| 62,377 | |||
| Health Care Equipment & Supplies - 3.1% | |||
| Abbott Laboratories | 219,600 | 9,228 | |
| Boston Scientific Corp. (a) | 600,149 | 14,296 | |
| Danaher Corp. | 181,292 | 14,759 | |
| Edwards Lifesciences Corp. (a) | 54,028 | 6,222 | |
| Intuitive Surgical, Inc. (a) | 3,800 | 2,608 | |
| Medtronic PLC | 239,801 | 20,870 | |
| The Cooper Companies, Inc. | 8,828 | 1,641 | |
| Wright Medical Group NV (a) | 93,946 | 2,326 | |
| 71,950 | |||
| Health Care Providers & Services - 1.8% | |||
| Cigna Corp. | 55,082 | 7,065 | |
| Henry Schein, Inc. (a) | 35,144 | 5,756 | |
| Humana, Inc. | 3,800 | 679 | |
| McKesson Corp. | 44,382 | 8,194 | |
| UnitedHealth Group, Inc. | 122,600 | 16,680 | |
| Universal Health Services, Inc. Class B | 30,000 | 3,616 | |
| 41,990 | |||
| Health Care Technology - 0.1% | |||
| Medidata Solutions, Inc. (a) | 64,442 | 3,486 | |
| Life Sciences Tools & Services - 0.6% | |||
| Agilent Technologies, Inc. | 101,700 | 4,778 | |
| Thermo Fisher Scientific, Inc. | 53,290 | 8,110 | |
| 12,888 | |||
| Pharmaceuticals - 1.7% | |||
| Allergan PLC (a) | 70,019 | 16,422 | |
| Bristol-Myers Squibb Co. | 142,994 | 8,206 | |
| GlaxoSmithKline PLC sponsored ADR | 155,700 | 6,767 | |
| Horizon Pharma PLC (a) | 39,800 | 748 | |
| Merck & Co., Inc. | 37,300 | 2,342 | |
| Teva Pharmaceutical Industries Ltd. sponsored ADR | 119,900 | 6,042 | |
| 40,527 | |||
| TOTAL HEALTH CARE | 233,218 | ||
| INDUSTRIALS - 5.7% | |||
| Aerospace & Defense - 1.0% | |||
| Honeywell International, Inc. | 38,300 | 4,470 | |
| TransDigm Group, Inc. (a) | 20,100 | 5,732 | |
| United Technologies Corp. | 129,400 | 13,772 | |
| 23,974 | |||
| Electrical Equipment - 2.4% | |||
| AMETEK, Inc. | 708,325 | 34,531 | |
| Fortive Corp. | 322,346 | 16,978 | |
| SolarCity Corp. (a) | 75,212 | 1,554 | |
| Sunrun, Inc. (a)(b) | 454,147 | 2,761 | |
| 55,824 | |||
| Industrial Conglomerates - 1.4% | |||
| Roper Technologies, Inc. | 189,398 | 33,628 | |
| Machinery - 0.3% | |||
| Pentair PLC | 107,000 | 6,853 | |
| SPX Flow, Inc. (a) | 12,416 | 365 | |
| 7,218 | |||
| Professional Services - 0.6% | |||
| Verisk Analytics, Inc. (a) | 162,800 | 13,521 | |
| TOTAL INDUSTRIALS | 134,165 | ||
| INFORMATION TECHNOLOGY - 13.1% | |||
| Communications Equipment - 0.1% | |||
| F5 Networks, Inc. (a) | 6,100 | 749 | |
| Electronic Equipment & Components - 0.4% | |||
| Jabil Circuit, Inc. | 284,942 | 6,038 | |
| Samsung SDI Co. Ltd. | 20,318 | 2,103 | |
| 8,141 | |||
| Internet Software & Services - 4.3% | |||
| 2U, Inc. (a) | 98,430 | 3,479 | |
| 58.com, Inc. ADR (a) | 90,999 | 4,140 | |
| Alphabet, Inc.: | |||
| Class A | 2,800 | 2,212 | |
| Class C (a) | 60,499 | 46,406 | |
| Box, Inc. Class A (a)(b) | 58,800 | 808 | |
| Cornerstone OnDemand, Inc. (a) | 73,428 | 3,225 | |
| Facebook, Inc. Class A (a) | 221,413 | 27,925 | |
| Just Dial Ltd. | 84,031 | 623 | |
| New Relic, Inc. (a) | 165,318 | 6,067 | |
| Shopify, Inc. Class A (a) | 15,900 | 658 | |
| SPS Commerce, Inc. (a) | 4,343 | 284 | |
| Yahoo!, Inc. (a) | 124,150 | 5,307 | |
| 101,134 | |||
| IT Services - 0.4% | |||
| Alliance Data Systems Corp. (a) | 3,000 | 614 | |
| Blackhawk Network Holdings, Inc. (a) | 55,375 | 1,897 | |
| Global Payments, Inc. | 14,100 | 1,071 | |
| Travelport Worldwide Ltd. | 447,778 | 6,148 | |
| 9,730 | |||
| Semiconductors & Semiconductor Equipment - 2.0% | |||
| Intersil Corp. Class A | 35,994 | 711 | |
| Lam Research Corp. | 34,300 | 3,201 | |
| Marvell Technology Group Ltd. | 307,275 | 3,810 | |
| Micron Technology, Inc. (a) | 60,687 | 1,001 | |
| NVIDIA Corp. | 42,900 | 2,631 | |
| NXP Semiconductors NV (a) | 74,900 | 6,593 | |
| Qorvo, Inc. (a) | 353,151 | 20,281 | |
| Qualcomm, Inc. | 90,279 | 5,694 | |
| Semtech Corp. (a) | 49,000 | 1,303 | |
| SolarEdge Technologies, Inc. (a)(b) | 88,200 | 1,501 | |
| 46,726 | |||
| Software - 3.1% | |||
| Activision Blizzard, Inc. | 159,100 | 6,582 | |
| Adobe Systems, Inc. (a) | 16,454 | 1,683 | |
| Autodesk, Inc. (a) | 497,461 | 33,529 | |
| Electronic Arts, Inc. (a) | 65,100 | 5,288 | |
| HubSpot, Inc. (a) | 40,378 | 2,251 | |
| Microsoft Corp. | 135,400 | 7,780 | |
| Nintendo Co. Ltd. | 7,900 | 1,744 | |
| RealPage, Inc. (a) | 26,133 | 673 | |
| Salesforce.com, Inc. (a) | 101,899 | 8,093 | |
| ServiceNow, Inc. (a) | 6,700 | 487 | |
| Varonis Systems, Inc. (a) | 47,817 | 1,413 | |
| Zendesk, Inc. (a) | 113,470 | 3,465 | |
| 72,988 | |||
| Technology Hardware, Storage & Peripherals - 2.8% | |||
| Apple, Inc. | 493,652 | 52,368 | |
| EMC Corp. | 203,300 | 5,894 | |
| HP, Inc. | 551,600 | 7,926 | |
| 66,188 | |||
| TOTAL INFORMATION TECHNOLOGY | 305,656 | ||
| MATERIALS - 1.8% | |||
| Chemicals - 1.3% | |||
| CF Industries Holdings, Inc. | 60,100 | 1,563 | |
| E.I. du Pont de Nemours & Co. | 160,700 | 11,185 | |
| Eastman Chemical Co. | 59,074 | 4,011 | |
| Ecolab, Inc. | 21,100 | 2,596 | |
| LyondellBasell Industries NV Class A | 3 | 0 | |
| Monsanto Co. | 37,500 | 3,994 | |
| PPG Industries, Inc. | 44,500 | 4,712 | |
| W.R. Grace & Co. | 43,581 | 3,405 | |
| 31,466 | |||
| Construction Materials - 0.1% | |||
| Eagle Materials, Inc. | 33,698 | 2,708 | |
| Containers & Packaging - 0.4% | |||
| Ball Corp. | 4,300 | 341 | |
| Graphic Packaging Holding Co. | 224,190 | 3,215 | |
| WestRock Co. | 105,174 | 5,038 | |
| 8,594 | |||
| TOTAL MATERIALS | 42,768 | ||
| TELECOMMUNICATION SERVICES - 1.7% | |||
| Diversified Telecommunication Services - 1.6% | |||
| AT&T, Inc. | 497,729 | 20,347 | |
| Cogent Communications Group, Inc. | 30,700 | 1,091 | |
| Level 3 Communications, Inc. (a) | 59,752 | 2,965 | |
| SBA Communications Corp. Class A (a) | 14,100 | 1,610 | |
| Verizon Communications, Inc. | 174,998 | 9,158 | |
| Zayo Group Holdings, Inc. (a) | 72,800 | 2,112 | |
| 37,283 | |||
| Wireless Telecommunication Services - 0.1% | |||
| T-Mobile U.S., Inc. (a) | 21,100 | 978 | |
| Telephone & Data Systems, Inc. | 18,337 | 511 | |
| 1,489 | |||
| TOTAL TELECOMMUNICATION SERVICES | 38,772 | ||
| UTILITIES - 2.1% | |||
| Electric Utilities - 1.4% | |||
| Edison International | 49,067 | 3,568 | |
| Exelon Corp. | 203,000 | 6,902 | |
| FirstEnergy Corp. | 51,800 | 1,695 | |
| NextEra Energy, Inc. | 86,500 | 10,461 | |
| PG&E Corp. | 108,575 | 6,725 | |
| PPL Corp. | 101,700 | 3,537 | |
| 32,888 | |||
| Independent Power and Renewable Electricity Producers - 0.1% | |||
| NRG Yield, Inc. Class C | 44,700 | 753 | |
| Vivint Solar, Inc. (a)(b) | 288,874 | 919 | |
| 1,672 | |||
| Multi-Utilities - 0.6% | |||
| CenterPoint Energy, Inc. | 34,200 | 768 | |
| Dominion Resources, Inc. | 83,549 | 6,196 | |
| Sempra Energy | 79,209 | 8,288 | |
| 15,252 | |||
| TOTAL UTILITIES | 49,812 | ||
| TOTAL COMMON STOCKS | |||
| (Cost $1,254,650) | 1,517,970 | ||
| Convertible Preferred Stocks - 0.0% | |||
| INFORMATION TECHNOLOGY - 0.0% | |||
| Software - 0.0% | |||
| MongoDB, Inc. Series F, 8.00% (a)(c) | |||
| (Cost $281) | 16,802 | 151 | |
| Principal Amount (000s) | Value (000s) | ||
| Nonconvertible Bonds - 12.9% | |||
| CONSUMER DISCRETIONARY - 1.0% | |||
| Automobiles - 0.3% | |||
| General Motors Co.: | |||
| 3.5% 10/2/18 | 350 | 360 | |
| 5.2% 4/1/45 | 273 | 291 | |
| 6.25% 10/2/43 | 58 | 70 | |
| 6.6% 4/1/36 | 338 | 417 | |
| 6.75% 4/1/46 | 568 | 729 | |
| General Motors Financial Co., Inc.: | |||
| 2.625% 7/10/17 | 110 | 111 | |
| 3.15% 1/15/20 | 1,508 | 1,540 | |
| 3.25% 5/15/18 | 180 | 183 | |
| 3.45% 4/10/22 | 1,250 | 1,273 | |
| 3.5% 7/10/19 | 400 | 412 | |
| 4% 1/15/25 | 494 | 503 | |
| 4.2% 3/1/21 | 795 | 839 | |
| 4.25% 5/15/23 | 200 | 209 | |
| 4.75% 8/15/17 | 195 | 201 | |
| 7,138 | |||
| Diversified Consumer Services - 0.0% | |||
| Ingersoll-Rand Global Holding Co. Ltd.: | |||
| 2.875% 1/15/19 | 35 | 36 | |
| 4.25% 6/15/23 | 249 | 274 | |
| 310 | |||
| Hotels, Restaurants & Leisure - 0.1% | |||
| McDonald's Corp.: | |||
| 2.75% 12/9/20 | 128 | 133 | |
| 3.7% 1/30/26 | 338 | 365 | |
| 4.7% 12/9/35 | 175 | 201 | |
| 4.875% 12/9/45 | 274 | 324 | |
| 1,023 | |||
| Media - 0.6% | |||
| 21st Century Fox America, Inc.: | |||
| 6.15% 2/15/41 | 446 | 579 | |
| 7.75% 12/1/45 | 621 | 944 | |
| AOL Time Warner, Inc.: | |||
| 2.95% 7/15/26 | 2,000 | 2,040 | |
| 7.625% 4/15/31 | 500 | 705 | |
| Charter Communications Operating LLC/Charter Communications Operating Capital Corp.: | |||
| 4.464% 7/23/22 (d) | 707 | 767 | |
| 4.908% 7/23/25 (d) | 475 | 524 | |
| 6.484% 10/23/45 (d) | 130 | 160 | |
| Discovery Communications LLC: | |||
| 3.25% 4/1/23 | 51 | 51 | |
| 6.35% 6/1/40 | 236 | 250 | |
| Thomson Reuters Corp.: | |||
| 1.3% 2/23/17 | 122 | 122 | |
| 3.85% 9/29/24 | 319 | 342 | |
| Time Warner Cable, Inc.: | |||
| 4% 9/1/21 | 630 | 672 | |
| 4.5% 9/15/42 | 264 | 255 | |
| 5.5% 9/1/41 | 206 | 224 | |
| 5.85% 5/1/17 | 104 | 107 | |
| 5.875% 11/15/40 | 500 | 558 | |
| 6.55% 5/1/37 | 2,604 | 3,142 | |
| 6.75% 7/1/18 | 439 | 478 | |
| 7.3% 7/1/38 | 725 | 942 | |
| 8.25% 4/1/19 | 700 | 809 | |
| Time Warner, Inc. 6.5% 11/15/36 | 232 | 301 | |
| Viacom, Inc.: | |||
| 2.5% 9/1/18 | 46 | 47 | |
| 3.5% 4/1/17 | 583 | 590 | |
| 14,609 | |||
| TOTAL CONSUMER DISCRETIONARY | 23,080 | ||
| CONSUMER STAPLES - 0.6% | |||
| Beverages - 0.3% | |||
| Anheuser-Busch InBev Finance, Inc.: | |||
| 2.65% 2/1/21 | 1,408 | 1,451 | |
| 3.3% 2/1/23 | 1,517 | 1,592 | |
| 4.7% 2/1/36 | 1,436 | 1,664 | |
| 4.9% 2/1/46 | 1,642 | 1,986 | |
| 6,693 | |||
| Food & Staples Retailing - 0.1% | |||
| CVS Health Corp.: | |||
| 3.5% 7/20/22 | 310 | 333 | |
| 3.875% 7/20/25 | 532 | 586 | |
| Walgreens Boots Alliance, Inc.: | |||
| 2.7% 11/18/19 | 245 | 253 | |
| 3.3% 11/18/21 | 291 | 307 | |
| 1,479 | |||
| Food Products - 0.0% | |||
| ConAgra Foods, Inc. 1.9% 1/25/18 | 131 | 132 | |
| Tobacco - 0.2% | |||
| Altria Group, Inc. 4% 1/31/24 | 212 | 238 | |
| Imperial Tobacco Finance PLC: | |||
| 3.75% 7/21/22 (d) | 589 | 625 | |
| 4.25% 7/21/25 (d) | 589 | 645 | |
| Reynolds American, Inc.: | |||
| 2.3% 6/12/18 | 258 | 262 | |
| 3.25% 6/12/20 | 115 | 121 | |
| 4% 6/12/22 | 395 | 433 | |
| 4.45% 6/12/25 | 287 | 322 | |
| 5.7% 8/15/35 | 149 | 185 | |
| 5.85% 8/15/45 | 1,140 | 1,487 | |
| 6.15% 9/15/43 | 500 | 670 | |
| 7.25% 6/15/37 | 409 | 564 | |
| 5,552 | |||
| TOTAL CONSUMER STAPLES | 13,856 | ||
| ENERGY - 2.2% | |||
| Energy Equipment & Services - 0.2% | |||
| DCP Midstream LLC: | |||
| 4.75% 9/30/21 (d) | 364 | 359 | |
| 5.35% 3/15/20 (d) | 1,027 | 1,042 | |
| El Paso Pipeline Partners Operating Co. LLC: | |||
| 5% 10/1/21 | 494 | 537 | |
| 6.5% 4/1/20 | 92 | 103 | |
| Halliburton Co.: | |||
| 3.8% 11/15/25 | 348 | 360 | |
| 4.85% 11/15/35 | 304 | 325 | |
| 5% 11/15/45 | 416 | 458 | |
| Noble Holding International Ltd.: | |||
| 5% 3/16/18 (e) | 41 | 40 | |
| 6.95% 4/1/25 (e) | 260 | 212 | |
| 7.95% 4/1/45 (e) | 251 | 183 | |
| Transocean, Inc. 5.55% 12/15/16 (e) | 238 | 240 | |
| 3,859 | |||
| Oil, Gas & Consumable Fuels - 2.0% | |||
| Anadarko Finance Co. 7.5% 5/1/31 | 549 | 665 | |
| Anadarko Petroleum Corp.: | |||
| 4.85% 3/15/21 | 900 | 957 | |
| 5.55% 3/15/26 | 489 | 541 | |
| 6.375% 9/15/17 | 86 | 90 | |
| 6.6% 3/15/46 | 660 | 786 | |
| BP Capital Markets PLC: | |||
| 2.315% 2/13/20 | 1,873 | 1,913 | |
| 3.535% 11/4/24 | 1,443 | 1,540 | |
| 3.814% 2/10/24 | 359 | 391 | |
| 4.5% 10/1/20 | 173 | 191 | |
| 4.742% 3/11/21 | 300 | 339 | |
| Canadian Natural Resources Ltd.: | |||
| 1.75% 1/15/18 | 178 | 177 | |
| 3.8% 4/15/24 | 619 | 620 | |
| Cenovus Energy, Inc. 5.7% 10/15/19 | 561 | 603 | |
| Columbia Pipeline Group, Inc.: | |||
| 2.45% 6/1/18 | 110 | 111 | |
| 3.3% 6/1/20 | 536 | 555 | |
| 4.5% 6/1/25 | 164 | 177 | |
| DCP Midstream Operating LP: | |||
| 2.5% 12/1/17 | 168 | 167 | |
| 2.7% 4/1/19 | 494 | 479 | |
| 3.875% 3/15/23 | 164 | 156 | |
| 5.6% 4/1/44 | 146 | 134 | |
| Duke Energy Field Services 6.45% 11/3/36 (d) | 375 | 363 | |
| El Paso Natural Gas Co. 5.95% 4/15/17 | 7 | 7 | |
| Empresa Nacional de Petroleo 4.375% 10/30/24 (d) | 350 | 374 | |
| Enable Midstream Partners LP: | |||
| 2.4% 5/15/19 | 114 | 111 | |
| 3.9% 5/15/24 | 121 | 114 | |
| Enbridge Energy Partners LP: | |||
| 4.2% 9/15/21 | 438 | 452 | |
| 4.375% 10/15/20 | 411 | 428 | |
| EnLink Midstream Partners LP 2.7% 4/1/19 | 572 | 563 | |
| Enterprise Products Operating LP: | |||
| 2.55% 10/15/19 | 85 | 87 | |
| 3.7% 2/15/26 | 600 | 625 | |
| 3.75% 2/15/25 | 285 | 298 | |
| Kinder Morgan Energy Partners LP: | |||
| 2.65% 2/1/19 | 60 | 61 | |
| 3.45% 2/15/23 | 721 | 714 | |
| 3.5% 3/1/21 | 299 | 309 | |
| 3.95% 9/1/22 | 498 | 515 | |
| 4.25% 9/1/24 | 116 | 119 | |
| 6.55% 9/15/40 | 67 | 73 | |
| Kinder Morgan, Inc.: | |||
| 3.05% 12/1/19 | 175 | 180 | |
| 5% 2/15/21 (d) | 376 | 407 | |
| Marathon Petroleum Corp. 5.125% 3/1/21 | 215 | 240 | |
| Motiva Enterprises LLC 5.75% 1/15/20 (d) | 156 | 172 | |
| MPLX LP 4% 2/15/25 | 77 | 75 | |
| Nakilat, Inc. 6.067% 12/31/33 (d) | 279 | 337 | |
| Petro-Canada 6.05% 5/15/18 | 150 | 161 | |
| Petrobras Global Finance BV: | |||
| 4.375% 5/20/23 | 596 | 520 | |
| 4.875% 3/17/20 | 2,484 | 2,434 | |
| 5.625% 5/20/43 | 569 | 439 | |
| 7.25% 3/17/44 | 2,755 | 2,535 | |
| Petrobras International Finance Co. Ltd.: | |||
| 5.375% 1/27/21 | 4,302 | 4,146 | |
| 5.75% 1/20/20 | 611 | 618 | |
| 7.875% 3/15/19 | 115 | 123 | |
| Petroleos Mexicanos: | |||
| 3.125% 1/23/19 | 58 | 59 | |
| 3.5% 7/18/18 | 463 | 473 | |
| 3.5% 7/23/20 | 2,675 | 2,708 | |
| 3.5% 1/30/23 | 285 | 277 | |
| 4.5% 1/23/26 | 1,314 | 1,316 | |
| 4.875% 1/24/22 | 237 | 247 | |
| 4.875% 1/18/24 | 410 | 425 | |
| 5.5% 1/21/21 | 369 | 398 | |
| 5.5% 6/27/44 | 648 | 616 | |
| 5.625% 1/23/46 | 749 | 724 | |
| 6% 3/5/20 | 175 | 191 | |
| 6.375% 1/23/45 | 2,366 | 2,492 | |
| 6.5% 6/2/41 | 661 | 701 | |
| 6.875% 8/4/26 (d) | 700 | 814 | |
| 8% 5/3/19 | 241 | 273 | |
| Phillips 66 Co. 4.3% 4/1/22 | 338 | 372 | |
| Phillips 66 Partners LP 2.646% 2/15/20 | 42 | 42 | |
| Plains All American Pipeline LP/PAA Finance Corp.: | |||
| 3.65% 6/1/22 | 173 | 175 | |
| 6.125% 1/15/17 | 205 | 208 | |
| Shell International Finance BV 4.375% 5/11/45 | 1,246 | 1,372 | |
| Southwestern Energy Co.: | |||
| 5.8% 1/23/20 (e) | 363 | 363 | |
| 6.7% 1/23/25 (e) | 324 | 333 | |
| Spectra Energy Capital, LLC 5.65% 3/1/20 | 10 | 11 | |
| Spectra Energy Partners LP: | |||
| 2.95% 9/25/18 | 63 | 64 | |
| 4.6% 6/15/21 | 90 | 97 | |
| Suncor Energy, Inc. 6.1% 6/1/18 | 395 | 424 | |
| The Williams Companies, Inc.: | |||
| 3.7% 1/15/23 | 116 | 113 | |
| 4.55% 6/24/24 | 1,308 | 1,337 | |
| Western Gas Partners LP: | |||
| 4.65% 7/1/26 | 166 | 172 | |
| 5.375% 6/1/21 | 724 | 786 | |
| Williams Partners LP: | |||
| 3.6% 3/15/22 | 516 | 515 | |
| 3.9% 1/15/25 | 178 | 177 | |
| 4% 11/15/21 | 236 | 243 | |
| 4.3% 3/4/24 | 868 | 889 | |
| 4.5% 11/15/23 | 257 | 267 | |
| 47,866 | |||
| TOTAL ENERGY | 51,725 | ||
| FINANCIALS - 6.7% | |||
| Banks - 3.2% | |||
| Banco Nacional de Desenvolvimento Economico e Social: | |||
| 3.375% 9/26/16 (d) | 365 | 364 | |
| 4% 4/14/19 (d) | 600 | 608 | |
| 5.5% 7/12/20 (d) | 3,200 | 3,395 | |
| 5.75% 9/26/23 (d) | 332 | 354 | |
| 6.5% 6/10/19 (d) | 129 | 139 | |
| Bank of America Corp.: | |||
| 2.6% 1/15/19 | 648 | 662 | |
| 3.5% 4/19/26 | 633 | 661 | |
| 3.875% 8/1/25 | 418 | 448 | |
| 3.95% 4/21/25 | 795 | 827 | |
| 4% 1/22/25 | 206 | 215 | |
| 4.2% 8/26/24 | 750 | 796 | |
| 4.25% 10/22/26 | 418 | 443 | |
| 4.45% 3/3/26 | 106 | 114 | |
| 5.65% 5/1/18 | 205 | 218 | |
| 5.75% 12/1/17 | 2,655 | 2,792 | |
| 5.875% 1/5/21 | 170 | 196 | |
| Barclays PLC: | |||
| 2% 3/16/18 | 2,708 | 2,710 | |
| 2.75% 11/8/19 | 356 | 359 | |
| 3.25% 1/12/21 | 650 | 662 | |
| 4.375% 1/12/26 | 883 | 922 | |
| Capital One NA 2.95% 7/23/21 | 541 | 559 | |
| Citigroup, Inc.: | |||
| 1.8% 2/5/18 | 10,500 | 10,538 | |
| 1.85% 11/24/17 | 2,353 | 2,363 | |
| 2.15% 7/30/18 | 1,228 | 1,240 | |
| 3.875% 3/26/25 | 1,200 | 1,238 | |
| 4.05% 7/30/22 | 151 | 161 | |
| 4.3% 11/20/26 | 1,000 | 1,050 | |
| 5.5% 9/13/25 | 142 | 161 | |
| Citizens Bank NA 2.55% 5/13/21 | 250 | 254 | |
| Citizens Financial Group, Inc. 4.15% 9/28/22 (d) | 216 | 223 | |
| Credit Suisse Group Funding Guernsey Ltd.: | |||
| 2.75% 3/26/20 | 556 | 558 | |
| 3.75% 3/26/25 | 550 | 551 | |
| 3.8% 9/15/22 | 930 | 949 | |
| 3.8% 6/9/23 (d) | 1,257 | 1,275 | |
| Discover Bank 4.2% 8/8/23 | 259 | 277 | |
| Fifth Third Bancorp: | |||
| 2.875% 7/27/20 | 4,000 | 4,142 | |
| 8.25% 3/1/38 | 94 | 142 | |
| HBOS PLC 6.75% 5/21/18 (d) | 180 | 193 | |
| HSBC Holdings PLC 4.25% 3/14/24 | 200 | 208 | |
| HSBC U.S.A., Inc. 1.625% 1/16/18 | 314 | 314 | |
| Huntington Bancshares, Inc. 7% 12/15/20 | 97 | 113 | |
| Huntington National Bank: | |||
| 1.7% 2/26/18 | 3,052 | 3,060 | |
| 2.4% 4/1/20 | 4,000 | 4,049 | |
| Intesa Sanpaolo SpA: | |||
| 5.017% 6/26/24 (d) | 400 | 377 | |
| 5.71% 1/15/26 (d) | 997 | 977 | |
| JPMorgan Chase & Co.: | |||
| 2.75% 6/23/20 | 1,905 | 1,961 | |
| 2.95% 10/1/26 | 572 | 576 | |
| 3.875% 9/10/24 | 2,768 | 2,922 | |
| 4.125% 12/15/26 | 3,524 | 3,777 | |
| MUFG Americas Holdings Corp. 2.25% 2/10/20 | 509 | 513 | |
| PNC Bank NA 2.3% 6/1/20 | 300 | 306 | |
| Rabobank Nederland 4.375% 8/4/25 | 955 | 1,011 | |
| Regions Bank 6.45% 6/26/37 | 652 | 794 | |
| Regions Financial Corp. 3.2% 2/8/21 | 415 | 430 | |
| Royal Bank of Canada 4.65% 1/27/26 | 760 | 836 | |
| Royal Bank of Scotland Group PLC: | |||
| 5.125% 5/28/24 | 6,103 | 6,175 | |
| 6% 12/19/23 | 874 | 924 | |
| 6.1% 6/10/23 | 1,190 | 1,264 | |
| 6.125% 12/15/22 | 694 | 741 | |
| Wells Fargo & Co. 4.48% 1/16/24 | 30 | 33 | |
| 74,120 | |||
| Capital Markets - 1.4% | |||
| Affiliated Managers Group, Inc.: | |||
| 3.5% 8/1/25 | 580 | 579 | |
| 4.25% 2/15/24 | 466 | 491 | |
| Credit Suisse AG 6% 2/15/18 | 1,164 | 1,225 | |
| Deutsche Bank AG 4.5% 4/1/25 | 1,821 | 1,719 | |
| Deutsche Bank AG London Branch: | |||
| 1.875% 2/13/18 | 2,780 | 2,766 | |
| 2.85% 5/10/19 | 1,360 | 1,364 | |
| Goldman Sachs Group, Inc.: | |||
| 1.748% 9/15/17 | 2,964 | 2,971 | |
| 2.55% 10/23/19 | 3,392 | 3,467 | |
| 2.625% 1/31/19 | 1,538 | 1,577 | |
| 2.9% 7/19/18 | 526 | 539 | |
| 5.25% 7/27/21 | 96 | 109 | |
| 5.625% 1/15/17 | 500 | 508 | |
| 5.95% 1/18/18 | 32 | 34 | |
| 6% 6/15/20 | 600 | 685 | |
| 6.15% 4/1/18 | 36 | 39 | |
| 6.75% 10/1/37 | 2,000 | 2,565 | |
| Lazard Group LLC: | |||
| 4.25% 11/14/20 | 324 | 343 | |
| 6.85% 6/15/17 | 18 | 19 | |
| Morgan Stanley: | |||
| 1.875% 1/5/18 | 454 | 456 | |
| 2.125% 4/25/18 | 2,454 | 2,479 | |
| 2.65% 1/27/20 | 1,715 | 1,759 | |
| 3.125% 7/27/26 | 2,000 | 2,012 | |
| 4.875% 11/1/22 | 687 | 761 | |
| 5% 11/24/25 | 93 | 104 | |
| 5.75% 1/25/21 | 268 | 307 | |
| 6.625% 4/1/18 | 600 | 646 | |
| Peachtree Corners Funding Trust 3.976% 2/15/25 (d) | 500 | 504 | |
| UBS AG Stamford Branch: | |||
| 1.375% 6/1/17 | 438 | 438 | |
| 1.8% 3/26/18 | 822 | 827 | |
| 2.35% 3/26/20 | 300 | 307 | |
| UBS Group Funding Ltd. 4.125% 9/24/25 (d) | 682 | 718 | |
| 32,318 | |||
| Consumer Finance - 0.2% | |||
| Discover Financial Services: | |||
| 3.85% 11/21/22 | 462 | 478 | |
| 3.95% 11/6/24 | 1,283 | 1,320 | |
| 5.2% 4/27/22 | 42 | 46 | |
| 6.45% 6/12/17 | 1,019 | 1,055 | |
| Ford Motor Credit Co. LLC 2.875% 10/1/18 | 400 | 410 | |
| Hyundai Capital America: | |||
| 1.45% 2/6/17 (d) | 476 | 476 | |
| 2% 3/19/18 (d) | 752 | 756 | |
| 2.125% 10/2/17 (d) | 521 | 525 | |
| 2.875% 8/9/18 (d) | 163 | 166 | |
| Synchrony Financial: | |||
| 1.875% 8/15/17 | 95 | 95 | |
| 3% 8/15/19 | 140 | 143 | |
| 3.75% 8/15/21 | 211 | 221 | |
| 4.25% 8/15/24 | 213 | 224 | |
| 5,915 | |||
| Diversified Financial Services - 0.1% | |||
| Brixmor Operating Partnership LP: | |||
| 3.25% 9/15/23 | 844 | 846 | |
| 3.85% 2/1/25 | 450 | 459 | |
| 3.875% 8/15/22 | 738 | 771 | |
| 4.125% 6/15/26 | 298 | 309 | |
| IntercontinentalExchange, Inc.: | |||
| 2.75% 12/1/20 | 230 | 240 | |
| 3.75% 12/1/25 | 411 | 450 | |
| 3,075 | |||
| Insurance - 0.6% | |||
| ACE INA Holdings, Inc. 2.875% 11/3/22 | 400 | 421 | |
| AIA Group Ltd. 2.25% 3/11/19 (d) | 200 | 202 | |
| American International Group, Inc.: | |||
| 3.3% 3/1/21 | 346 | 363 | |
| 3.75% 7/10/25 | 1,024 | 1,080 | |
| 4.875% 6/1/22 | 630 | 705 | |
| 5.6% 10/18/16 | 318 | 320 | |
| Aon Corp. 5% 9/30/20 | 133 | 147 | |
| Five Corners Funding Trust 4.419% 11/15/23 (d) | 360 | 389 | |
| Great-West Life & Annuity Insurance Co. 3.3563% 5/16/46 (d)(e) | 12 | 10 | |
| Hartford Financial Services Group, Inc. 5.375% 3/15/17 | 6 | 6 | |
| Liberty Mutual Group, Inc. 5% 6/1/21 (d) | 421 | 466 | |
| Marsh & McLennan Companies, Inc. 4.8% 7/15/21 | 233 | 258 | |
| Massachusetts Mutual Life Insurance Co. 4.5% 4/15/65 (d) | 629 | 639 | |
| MetLife, Inc.: | |||
| 1.903% 12/15/17 (e) | 84 | 85 | |
| 4.368% 9/15/23 (e) | 305 | 338 | |
| 4.75% 2/8/21 | 137 | 154 | |
| Metropolitan Life Global Funding I 3% 1/10/23 (d) | 223 | 230 | |
| Pacific Life Insurance Co. 9.25% 6/15/39 (d) | 203 | 321 | |
| Pacific LifeCorp: | |||
| 5.125% 1/30/43 (d) | 441 | 488 | |
| 6% 2/10/20 (d) | 503 | 558 | |
| Prudential Financial, Inc.: | |||
| 2.3% 8/15/18 | 51 | 52 | |
| 4.5% 11/16/21 | 200 | 224 | |
| 6.2% 11/15/40 | 134 | 168 | |
| 7.375% 6/15/19 | 2,734 | 3,146 | |
| Teachers Insurance & Annuity Association of America 4.9% 9/15/44 (d) | 505 | 576 | |
| TIAA Asset Management Finance LLC: | |||
| 2.95% 11/1/19 (d) | 120 | 123 | |
| 4.125% 11/1/24 (d) | 174 | 183 | |
| Unum Group: | |||
| 3.875% 11/5/25 | 658 | 664 | |
| 4% 3/15/24 | 600 | 620 | |
| 5.625% 9/15/20 | 270 | 302 | |
| 5.75% 8/15/42 | 758 | 868 | |
| 7.125% 9/30/16 | 19 | 19 | |
| 14,125 | |||
| Real Estate Investment Trusts - 0.7% | |||
| Alexandria Real Estate Equities, Inc.: | |||
| 2.75% 1/15/20 | 84 | 85 | |
| 4.6% 4/1/22 | 138 | 149 | |
| American Campus Communities Operating Partnership LP 3.75% 4/15/23 | 101 | 106 | |
| American Tower Corp. 2.8% 6/1/20 | 500 | 512 | |
| AvalonBay Communities, Inc.: | |||
| 3.625% 10/1/20 | 160 | 170 | |
| 4.2% 12/15/23 | 360 | 396 | |
| Boston Properties, Inc. 3.85% 2/1/23 | 432 | 465 | |
| Camden Property Trust: | |||
| 2.95% 12/15/22 | 135 | 136 | |
| 4.25% 1/15/24 | 304 | 329 | |
| Corporate Office Properties LP 5% 7/1/25 | 282 | 304 | |
| DDR Corp.: | |||
| 3.625% 2/1/25 | 242 | 245 | |
| 4.25% 2/1/26 | 243 | 258 | |
| 4.625% 7/15/22 | 247 | 268 | |
| 4.75% 4/15/18 | 313 | 326 | |
| 7.5% 4/1/17 | 203 | 209 | |
| Duke Realty LP: | |||
| 3.25% 6/30/26 | 107 | 110 | |
| 3.625% 4/15/23 | 180 | 190 | |
| 3.75% 12/1/24 | 160 | 170 | |
| 3.875% 10/15/22 | 310 | 330 | |
| 4.375% 6/15/22 | 207 | 225 | |
| 6.5% 1/15/18 | 285 | 303 | |
| 6.75% 3/15/20 | 12 | 14 | |
| 8.25% 8/15/19 | 127 | 149 | |
| Equity One, Inc. 3.75% 11/15/22 | 400 | 410 | |
| ERP Operating LP: | |||
| 2.375% 7/1/19 | 246 | 251 | |
| 4.625% 12/15/21 | 540 | 605 | |
| 4.75% 7/15/20 | 265 | 292 | |
| Federal Realty Investment Trust 5.9% 4/1/20 | 95 | 108 | |
| Government Properties Income Trust 3.75% 8/15/19 | 1,800 | 1,842 | |
| Health Care REIT, Inc.: | |||
| 2.25% 3/15/18 | 147 | 148 | |
| 4% 6/1/25 | 432 | 462 | |
| 4.7% 9/15/17 | 48 | 50 | |
| Lexington Corporate Properties Trust 4.4% 6/15/24 | 131 | 134 | |
| Omega Healthcare Investors, Inc.: | |||
| 4.375% 8/1/23 | 884 | 901 | |
| 4.5% 1/15/25 | 130 | 132 | |
| 4.5% 4/1/27 | 3,808 | 3,851 | |
| 4.95% 4/1/24 | 123 | 129 | |
| 5.25% 1/15/26 | 731 | 785 | |
| Retail Opportunity Investments Partnership LP: | |||
| 4% 12/15/24 | 99 | 100 | |
| 5% 12/15/23 | 67 | 72 | |
| Simon Property Group LP 4.125% 12/1/21 | 229 | 253 | |
| Weingarten Realty Investors 3.375% 10/15/22 | 68 | 70 | |
| WP Carey, Inc. 4% 2/1/25 | 613 | 612 | |
| 16,656 | |||
| Real Estate Management & Development - 0.5% | |||
| Brandywine Operating Partnership LP: | |||
| 3.95% 2/15/23 | 359 | 367 | |
| 4.1% 10/1/24 | 401 | 413 | |
| 4.55% 10/1/29 | 401 | 419 | |
| 4.95% 4/15/18 | 281 | 294 | |
| 5.7% 5/1/17 | 1,000 | 1,028 | |
| Digital Realty Trust LP: | |||
| 3.4% 10/1/20 | 639 | 666 | |
| 3.95% 7/1/22 | 396 | 419 | |
| 4.75% 10/1/25 | 459 | 500 | |
| 5.25% 3/15/21 | 201 | 227 | |
| Essex Portfolio LP 5.5% 3/15/17 | 113 | 115 | |
| Liberty Property LP: | |||
| 3.375% 6/15/23 | 185 | 188 | |
| 4.125% 6/15/22 | 177 | 186 | |
| 4.4% 2/15/24 | 418 | 452 | |
| 4.75% 10/1/20 | 394 | 427 | |
| 5.5% 12/15/16 | 12 | 12 | |
| 6.625% 10/1/17 | 281 | 295 | |
| Mack-Cali Realty LP: | |||
| 2.5% 12/15/17 | 252 | 253 | |
| 3.15% 5/15/23 | 426 | 397 | |
| 4.5% 4/18/22 | 108 | 110 | |
| 7.75% 8/15/19 | 23 | 26 | |
| Mid-America Apartments LP: | |||
| 4% 11/15/25 | 159 | 170 | |
| 4.3% 10/15/23 | 73 | 79 | |
| Post Apartment Homes LP 3.375% 12/1/22 | 70 | 72 | |
| Tanger Properties LP: | |||
| 3.125% 9/1/26 | 367 | 367 | |
| 3.75% 12/1/24 | 300 | 315 | |
| 3.875% 12/1/23 | 160 | 169 | |
| 6.125% 6/1/20 | 478 | 543 | |
| Ventas Realty LP: | |||
| 3.125% 6/15/23 | 189 | 193 | |
| 3.5% 2/1/25 | 189 | 196 | |
| 4.125% 1/15/26 | 192 | 208 | |
| 4.375% 2/1/45 | 85 | 88 | |
| Ventas Realty LP/Ventas Capital Corp.: | |||
| 2% 2/15/18 | 227 | 228 | |
| 4% 4/30/19 | 114 | 120 | |
| 4.25% 3/1/22 | 1,250 | 1,347 | |
| 10,889 | |||
| TOTAL FINANCIALS | 157,098 | ||
| HEALTH CARE - 0.8% | |||
| Biotechnology - 0.1% | |||
| AbbVie, Inc.: | |||
| 1.75% 11/6/17 | 358 | 360 | |
| 2.9% 11/6/22 | 368 | 379 | |
| 3.2% 11/6/22 | 536 | 560 | |
| 3.6% 5/14/25 | 797 | 843 | |
| 2,142 | |||
| Health Care Equipment & Supplies - 0.1% | |||
| Becton, Dickinson & Co. 2.675% 12/15/19 | 147 | 152 | |
| Zimmer Biomet Holdings, Inc.: | |||
| 1.45% 4/1/17 | 1,048 | 1,049 | |
| 2% 4/1/18 | 1,079 | 1,086 | |
| 2,287 | |||
| Health Care Providers & Services - 0.3% | |||
| Aetna, Inc. 2.75% 11/15/22 | 52 | 53 | |
| Cardinal Health, Inc. 3.75% 9/15/25 | 1,000 | 1,084 | |
| Express Scripts Holding Co. 4.75% 11/15/21 | 458 | 515 | |
| HCA Holdings, Inc.: | |||
| 3.75% 3/15/19 | 375 | 387 | |
| 4.25% 10/15/19 | 1,330 | 1,395 | |
| 6.5% 2/15/20 | 2,750 | 3,039 | |
| Medco Health Solutions, Inc. 4.125% 9/15/20 | 259 | 279 | |
| UnitedHealth Group, Inc.: | |||
| 3.35% 7/15/22 | 215 | 231 | |
| 3.75% 7/15/25 | 591 | 655 | |
| 7,638 | |||
| Life Sciences Tools & Services - 0.0% | |||
| Thermo Fisher Scientific, Inc.: | |||
| 1.3% 2/1/17 | 102 | 102 | |
| 2.4% 2/1/19 | 65 | 66 | |
| 4.15% 2/1/24 | 99 | 109 | |
| 277 | |||
| Pharmaceuticals - 0.3% | |||
| Actavis Funding SCS: | |||
| 2.35% 3/12/18 | 1,358 | 1,374 | |
| 3% 3/12/20 | 466 | 482 | |
| 3.45% 3/15/22 | 810 | 848 | |
| Mylan N.V.: | |||
| 2.5% 6/7/19 (d) | 359 | 364 | |
| 3.15% 6/15/21 (d) | 734 | 750 | |
| Mylan, Inc. 1.35% 11/29/16 | 120 | 120 | |
| Perrigo Co. PLC 2.3% 11/8/18 | 200 | 201 | |
| Perrigo Finance PLC 3.5% 12/15/21 | 200 | 205 | |
| Teva Pharmaceutical Finance Netherlands III BV: | |||
| 2.2% 7/21/21 | 520 | 520 | |
| 2.8% 7/21/23 | 372 | 374 | |
| 3.15% 10/1/26 | 443 | 446 | |
| Watson Pharmaceuticals, Inc. 1.875% 10/1/17 | 120 | 121 | |
| Zoetis, Inc.: | |||
| 1.875% 2/1/18 | 57 | 57 | |
| 3.25% 2/1/23 | 138 | 142 | |
| 6,004 | |||
| TOTAL HEALTH CARE | 18,348 | ||
| INDUSTRIALS - 0.1% | |||
| Aerospace & Defense - 0.0% | |||
| BAE Systems Holdings, Inc. 6.375% 6/1/19 (d) | 309 | 344 | |
| Airlines - 0.0% | |||
| Continental Airlines, Inc.: | |||
| 6.648% 3/15/19 | 3 | 3 | |
| 6.9% 7/2/19 | 1 | 1 | |
| U.S. Airways pass-thru trust certificates: | |||
| 6.85% 1/30/18 | 6 | 6 | |
| 8.36% 1/20/19 | 4 | 4 | |
| 14 | |||
| Trading Companies & Distributors - 0.1% | |||
| Air Lease Corp.: | |||
| 2.125% 1/15/18 | 203 | 203 | |
| 2.625% 9/4/18 | 589 | 592 | |
| 3.375% 6/1/21 | 369 | 382 | |
| 3.75% 2/1/22 | 505 | 527 | |
| 3.875% 4/1/21 | 387 | 408 | |
| 4.25% 9/15/24 | 336 | 353 | |
| 4.75% 3/1/20 | 338 | 365 | |
| 2,830 | |||
| TOTAL INDUSTRIALS | 3,188 | ||
| INFORMATION TECHNOLOGY - 0.2% | |||
| Electronic Equipment & Components - 0.0% | |||
| Amphenol Corp. 3.125% 9/15/21 | 131 | 136 | |
| Tyco Electronics Group SA 2.375% 12/17/18 | 74 | 75 | |
| 211 | |||
| Technology Hardware, Storage & Peripherals - 0.2% | |||
| Apple, Inc. 4.375% 5/13/45 | 1,245 | 1,396 | |
| Hewlett Packard Enterprise Co.: | |||
| 3.6% 10/15/20 (d) | 621 | 649 | |
| 4.9% 10/15/25 (d) | 621 | 662 | |
| 6.35% 10/15/45 (d) | 621 | 641 | |
| 3,348 | |||
| TOTAL INFORMATION TECHNOLOGY | 3,559 | ||
| MATERIALS - 0.2% | |||
| Chemicals - 0.0% | |||
| The Dow Chemical Co.: | |||
| 4.125% 11/15/21 | 343 | 375 | |
| 4.25% 11/15/20 | 116 | 126 | |
| 501 | |||
| Metals & Mining - 0.2% | |||
| BHP Billiton Financial (U.S.A.) Ltd.: | |||
| 6.25% 10/19/75 (d)(e) | 258 | 282 | |
| 6.75% 10/19/75 (d)(e) | 641 | 731 | |
| Corporacion Nacional del Cobre de Chile (Codelco): | |||
| 3.875% 11/3/21 (d) | 360 | 381 | |
| 4.875% 11/4/44 (d) | 728 | 757 | |
| Freeport-McMoRan, Inc. 2.3% 11/14/17 | 289 | 284 | |
| Vale Overseas Ltd.: | |||
| 4.375% 1/11/22 | 200 | 195 | |
| 6.25% 1/23/17 | 503 | 512 | |
| 3,142 | |||
| TOTAL MATERIALS | 3,643 | ||
| TELECOMMUNICATION SERVICES - 0.4% | |||
| Diversified Telecommunication Services - 0.4% | |||
| AT&T, Inc.: | |||
| 2.45% 6/30/20 | 380 | 388 | |
| 3.6% 2/17/23 | 971 | 1,025 | |
| 4.8% 6/15/44 | 1,308 | 1,390 | |
| 5.875% 10/1/19 | 440 | 495 | |
| CenturyLink, Inc.: | |||
| 5.15% 6/15/17 | 28 | 29 | |
| 6% 4/1/17 | 70 | 72 | |
| 6.15% 9/15/19 | 226 | 245 | |
| Embarq Corp. 7.995% 6/1/36 | 1,975 | 2,048 | |
| Verizon Communications, Inc.: | |||
| 2.625% 2/21/20 | 615 | 634 | |
| 4.5% 9/15/20 | 1,100 | 1,214 | |
| 5.012% 8/21/54 | 1,641 | 1,799 | |
| 6.25% 4/1/37 | 187 | 240 | |
| 9,579 | |||
| Wireless Telecommunication Services - 0.0% | |||
| America Movil S.A.B. de CV 2.375% 9/8/16 | 276 | 276 | |
| TOTAL TELECOMMUNICATION SERVICES | 9,855 | ||
| UTILITIES - 0.7% | |||
| Electric Utilities - 0.5% | |||
| American Electric Power Co., Inc. 1.65% 12/15/17 | 147 | 147 | |
| Cleveland Electric Illuminating Co. 5.95% 12/15/36 | 1,128 | 1,309 | |
| Duquesne Light Holdings, Inc.: | |||
| 5.9% 12/1/21 (d) | 273 | 308 | |
| 6.4% 9/15/20 (d) | 850 | 964 | |
| Edison International 3.75% 9/15/17 | 226 | 232 | |
| Entergy Corp. 4% 7/15/22 | 600 | 645 | |
| Eversource Energy: | |||
| 1.45% 5/1/18 | 96 | 96 | |
| 2.8% 5/1/23 | 435 | 446 | |
| Exelon Corp.: | |||
| 1.55% 6/9/17 | 114 | 114 | |
| 3.95% 6/15/25 | 539 | 589 | |
| FirstEnergy Corp.: | |||
| 2.75% 3/15/18 | 1,093 | 1,104 | |
| 4.25% 3/15/23 | 1,949 | 2,061 | |
| 7.375% 11/15/31 | 608 | 793 | |
| FirstEnergy Solutions Corp. 6.05% 8/15/21 | 649 | 564 | |
| IPALCO Enterprises, Inc. 3.45% 7/15/20 | 944 | 968 | |
| LG&E and KU Energy LLC 3.75% 11/15/20 | 49 | 53 | |
| Nevada Power Co. 6.5% 5/15/18 | 165 | 179 | |
| NV Energy, Inc. 6.25% 11/15/20 | 115 | 135 | |
| PG&E Corp. 2.4% 3/1/19 | 55 | 56 | |
| Progress Energy, Inc. 4.4% 1/15/21 | 823 | 903 | |
| TECO Finance, Inc. 5.15% 3/15/20 | 141 | 155 | |
| 11,821 | |||
| Gas Utilities - 0.0% | |||
| Southern Natural Gas Co./Southern Natural Issuing Corp. 4.4% 6/15/21 | 122 | 131 | |
| Texas Eastern Transmission LP 6% 9/15/17 (d) | 326 | 340 | |
| 471 | |||
| Independent Power and Renewable Electricity Producers - 0.0% | |||
| Emera U.S. Finance LP: | |||
| 2.15% 6/15/19 (d) | 176 | 178 | |
| 2.7% 6/15/21 (d) | 173 | 177 | |
| 3.55% 6/15/26 (d) | 277 | 292 | |
| 647 | |||
| Multi-Utilities - 0.2% | |||
| Dominion Resources, Inc.: | |||
| 2.9311% 9/30/66 (e) | 823 | 650 | |
| 3.4561% 6/30/66 (e) | 26 | 23 | |
| NiSource Finance Corp.: | |||
| 5.45% 9/15/20 | 468 | 527 | |
| 6.4% 3/15/18 | 24 | 26 | |
| 6.8% 1/15/19 | 677 | 756 | |
| Puget Energy, Inc.: | |||
| 6% 9/1/21 | 457 | 527 | |
| 6.5% 12/15/20 | 147 | 171 | |
| Sempra Energy: | |||
| 2.3% 4/1/17 | 376 | 379 | |
| 2.875% 10/1/22 | 1,154 | 1,192 | |
| Wisconsin Energy Corp. 6.25% 5/15/67 (e) | 21 | 18 | |
| 4,269 | |||
| TOTAL UTILITIES | 17,208 | ||
| TOTAL NONCONVERTIBLE BONDS | |||
| (Cost $290,007) | 301,560 | ||
| U.S. Government and Government Agency Obligations - 5.7% | |||
| U.S. Treasury Inflation-Protected Obligations - 1.9% | |||
| U.S. Treasury Inflation-Indexed Bonds: | |||
| 0.75% 2/15/45 | $5,990 | $6,229 | |
| 1% 2/15/46 | 1,872 | 2,086 | |
| 1.375% 2/15/44 | 6,774 | 8,088 | |
| U.S. Treasury Inflation-Indexed Notes: | |||
| 0.125% 7/15/24 | 5,799 | 5,822 | |
| 0.125% 7/15/26 | 5,360 | 5,367 | |
| 0.25% 1/15/25 | 3,991 | 4,026 | |
| 0.375% 7/15/25 | 5,580 | 5,705 | |
| 0.625% 1/15/26 | 7,608 | 7,931 | |
| TOTAL U.S. TREASURY INFLATION-PROTECTED OBLIGATIONS | 45,254 | ||
| U.S. Treasury Obligations - 3.8% | |||
| U.S. Treasury Bills, yield at date of purchase 0.3% to 0.33% 9/1/16 to 12/1/16 (f) | 1,140 | 1,139 | |
| U.S. Treasury Bonds: | |||
| 2.25% 8/15/46 | 4,280 | 4,295 | |
| 3% 5/15/45 | 5,443 | 6,335 | |
| 3% 11/15/45 | 10,645 | 12,402 | |
| U.S. Treasury Notes: | |||
| 1.125% 1/15/19 | 9,870 | 9,927 | |
| 1.125% 8/31/21 | 7,061 | 7,036 | |
| 1.25% 3/31/21 | 23,794 | 23,859 | |
| 1.375% 8/31/23 | 23,072 | 22,952 | |
| TOTAL U.S. TREASURY OBLIGATIONS | 87,945 | ||
| TOTAL U.S. GOVERNMENT AND GOVERNMENT AGENCY OBLIGATIONS | |||
| (Cost $128,993) | 133,199 | ||
| U.S. Government Agency - Mortgage Securities - 0.9% | |||
| Fannie Mae - 0.5% | |||
| 2.5% 1/1/28 to 8/1/31 | 509 | 527 | |
| 2.54% 6/1/42 (e) | 28 | 29 | |
| 2.803% 6/1/36 (e) | 7 | 7 | |
| 2.951% 11/1/40 (e) | 13 | 13 | |
| 2.98% 9/1/41 (e) | 15 | 16 | |
| 2.991% 10/1/41 (e) | 9 | 9 | |
| 3% 10/1/30 to 8/1/45 | 2,201 | 2,300 | |
| 3% 9/1/46 | 100 | 104 | |
| 3% 10/1/46 (g) | 100 | 103 | |
| 3.005% 7/1/37 (e) | 13 | 14 | |
| 3.229% 7/1/41 (e) | 23 | 24 | |
| 3.352% 10/1/41 (e) | 12 | 12 | |
| 3.5% 2/1/26 to 5/1/46 | 2,647 | 2,818 | |
| 3.557% 7/1/41 (e) | 30 | 31 | |
| 4% 11/1/31 to 2/1/46 | 2,936 | 3,163 | |
| 4.5% 12/1/23 to 6/1/41 | 752 | 827 | |
| 5% 6/1/39 to 11/1/44 | 459 | 512 | |
| 6% 11/1/35 to 8/1/37 | 237 | 273 | |
| TOTAL FANNIE MAE | 10,782 | ||
| Freddie Mac - 0.3% | |||
| 2.5% 7/1/31 | 92 | 95 | |
| 3% 3/1/45 to 7/1/45 | 567 | 591 | |
| 3.193% 9/1/41 (e) | 16 | 17 | |
| 3.231% 4/1/41 (e) | 21 | 22 | |
| 3.286% 6/1/41 (e) | 19 | 20 | |
| 3.417% 5/1/41 (e) | 17 | 17 | |
| 3.5% 6/1/32 to 5/1/46 | 2,299 | 2,439 | |
| 3.581% 10/1/35 (e) | 13 | 13 | |
| 3.627% 6/1/41 (e) | 25 | 26 | |
| 3.704% 5/1/41 (e) | 22 | 23 | |
| 4% 2/1/41 to 1/1/46 | 760 | 819 | |
| 4.5% 3/1/44 | 141 | 155 | |
| 5% 11/1/40 to 6/1/41 | 496 | 561 | |
| 5.5% 6/1/41 | 1,462 | 1,657 | |
| TOTAL FREDDIE MAC | 6,455 | ||
| Ginnie Mae - 0.1% | |||
| 3% 6/20/42 to 1/20/43 | 162 | 170 | |
| 3% 9/1/46 (g) | 90 | 94 | |
| 3.5% 11/20/41 to 8/20/43 | 1,444 | 1,538 | |
| 3.5% 9/1/46 (g) | 400 | 424 | |
| 4% 9/20/40 to 11/20/45 | 583 | 627 | |
| 4.5% 5/20/41 | 128 | 140 | |
| 5.5% 6/15/35 | 79 | 91 | |
| TOTAL GINNIE MAE | 3,084 | ||
| TOTAL U.S. GOVERNMENT AGENCY - MORTGAGE SECURITIES | |||
| (Cost $19,993) | 20,321 | ||
| Asset-Backed Securities - 0.1% | |||
| Accredited Mortgage Loan Trust Series 2005-1 Class M1, 1.1929% 4/25/35 (e) | $30 | $28 | |
| Ameriquest Mortgage Securities, Inc. pass-thru certificates: | |||
| Series 2003-10 Class M1, 1.5379% 12/25/33 (e) | 2 | 2 | |
| Series 2004-R2 Class M3, 1.3129% 4/25/34 (e) | 4 | 3 | |
| Argent Securities, Inc. pass-thru certificates: | |||
| Series 2003-W7 Class A2, 1.2679% 3/25/34 (e) | 2 | 2 | |
| Series 2004-W11 Class M2, 1.5744% 11/25/34 (e) | 25 | 25 | |
| Series 2004-W7 Class M1, 1.3129% 5/25/34 (e) | 25 | 23 | |
| Series 2006-W4 Class A2C, 0.6844% 5/25/36 (e) | 51 | 17 | |
| Asset Backed Securities Corp. Home Equity Loan Trust Series 2004-HE2 Class M1, 1.3494% 4/25/34 (e) | 70 | 61 | |
| Capital Auto Receivables Asset Trust Series 2016-1 Class A3, 1.71% 4/20/20 | 782 | 783 | |
| Carrington Mortgage Loan Trust Series 2007-RFC1 Class A3, 0.6644% 12/25/36 (e) | 82 | 47 | |
| Citibank Credit Card Issuance Trust Series 2014-A8 Class A8, 1.73% 4/9/20 | 1,000 | 1,010 | |
| Countrywide Home Loans, Inc.: | |||
| Series 2004-3 Class M4, 1.9794% 4/25/34 (e) | 3 | 2 | |
| Series 2004-4 Class M2, 1.3194% 6/25/34 (e) | 4 | 4 | |
| Series 2004-7 Class AF5, 5.868% 1/25/35 (e) | 73 | 75 | |
| Fannie Mae Series 2004-T5 Class AB3, 1.1662% 5/28/35 (e) | 2 | 2 | |
| Fieldstone Mortgage Investment Corp. Series 2004-3 Class M5, 2.6994% 8/25/34 (e) | 13 | 12 | |
| First Franklin Mortgage Loan Trust Series 2004-FF2 Class M3, 1.3494% 3/25/34 (e) | 0 | 0 | |
| Ford Credit Floorplan Master Owner Trust Series 2015-1 Class B, 1.62% 1/15/20 | 615 | 615 | |
| Fremont Home Loan Trust Series 2005-A: | |||
| Class M3, 1.2594% 1/25/35 (e) | 43 | 37 | |
| Class M4, 1.5444% 1/25/35 (e) | 16 | 8 | |
| GCO Education Loan Funding Master Trust II Series 2007-1A Class C1L, 1.2054% 2/25/47 (d)(e) | 38 | 31 | |
| GE Business Loan Trust Series 2006-2A: | |||
| Class A, 0.6877% 11/15/34 (d)(e) | 14 | 13 | |
| Class B, 0.7877% 11/15/34 (d)(e) | 5 | 4 | |
| Class C, 0.8877% 11/15/34 (d)(e) | 8 | 7 | |
| Class D, 1.2577% 11/15/34 (d)(e) | 3 | 3 | |
| Home Equity Asset Trust: | |||
| Series 2003-3 Class M1, 1.8144% 8/25/33 (e) | 18 | 17 | |
| Series 2003-5 Class A2, 1.2244% 12/25/33 (e) | 1 | 1 | |
| HSI Asset Securitization Corp. Trust Series 2007-HE1 Class 2A3, 0.7144% 1/25/37 (e) | 56 | 39 | |
| Invitation Homes Trust Series 2015-SFR3 Class E, 4.2321% 8/17/32 (d)(e) | 163 | 164 | |
| KeyCorp Student Loan Trust: | |||
| Series 1999-A Class A2, 0.9601% 12/27/29 (e) | 2 | 2 | |
| Series 2006-A Class 2C, 1.7901% 3/27/42 (e) | 43 | 21 | |
| MASTR Asset Backed Securities Trust Series 2007-HE1 Class M1, 0.8244% 5/25/37 (e) | 12 | 0 | |
| Merrill Lynch Mortgage Investors Trust: | |||
| Series 2003-OPT1 Class M1, 1.4994% 7/25/34 (e) | 1 | 1 | |
| Series 2006-FM1 Class A2B, 0.5979% 4/25/37 (e) | 1 | 1 | |
| Series 2006-OPT1 Class A1A, 1.0444% 6/25/35 (e) | 30 | 29 | |
| Morgan Stanley ABS Capital I Trust: | |||
| Series 2004-HE6 Class A2, 1.2044% 8/25/34 (e) | 3 | 2 | |
| Series 2005-NC1 Class M1, 1.1844% 1/25/35 (e) | 9 | 8 | |
| Series 2005-NC2 Class B1, 2.2794% 3/25/35 (e) | 7 | 0 | |
| New Century Home Equity Loan Trust Series 2005-4 Class M2, 1.0344% 9/25/35 (e) | 65 | 61 | |
| Park Place Securities, Inc.: | |||
| Series 2004-WCW1: | |||
| Class M3, 2.3994% 9/25/34 (e) | 24 | 22 | |
| Class M4, 2.6994% 9/25/34 (e) | 31 | 19 | |
| Series 2005-WCH1 Class M4, 1.7694% 1/25/36 (e) | 67 | 59 | |
| Salomon Brothers Mortgage Securities VII, Inc. Series 2003-HE1 Class A, 1.3244% 4/25/33 (e) | 0 | 0 | |
| Saxon Asset Securities Trust Series 2004-1 Class M1, 1.2829% 3/25/35 (e) | 29 | 27 | |
| SLM Private Credit Student Loan Trust Series 2004-A Class C, 1.6025% 6/15/33 (e) | 19 | 18 | |
| Structured Asset Investment Loan Trust Series 2004-8 Class M5, 2.2494% 9/25/34 (e) | 2 | 1 | |
| Terwin Mortgage Trust Series 2003-4HE Class A1, 1.3844% 9/25/34 (e) | 1 | 1 | |
| Trapeza CDO XII Ltd./Trapeza CDO XII, Inc. Series 2007-12A Class B, 1.1901% 4/6/42 (d)(e) | 58 | 26 | |
| TOTAL ASSET-BACKED SECURITIES | |||
| (Cost $3,086) | 3,333 | ||
| Collateralized Mortgage Obligations - 0.1% | |||
| Private Sponsor - 0.0% | |||
| Bear Stearns ALT-A Trust floater Series 2005-1 Class A1, 1.0844% 1/25/35 (e) | 37 | 36 | |
| First Horizon Mortgage pass-thru Trust Series 2004-AR5 Class 2A1, 2.7843% 10/25/34 (e) | 15 | 15 | |
| JPMorgan Mortgage Trust sequential payer Series 2006-A5 Class 3A5, 2.9609% 8/25/36 (e) | 35 | 31 | |
| Merrill Lynch Alternative Note Asset Trust floater Series 2007-OAR1 Class A1, 0.6944% 2/25/37 (e) | 23 | 21 | |
| Opteum Mortgage Acceptance Corp. floater Series 2005-3 Class APT, 0.8144% 7/25/35 (e) | 33 | 32 | |
| RESI Finance LP/RESI Finance DE Corp. floater Series 2003-B Class B5, 2.8243% 6/10/35 (d)(e) | 6 | 5 | |
| Sequoia Mortgage Trust floater Series 2004-6 Class A3B, 1.8046% 7/20/34 (e) | 1 | 1 | |
| Structured Asset Securities Corp. Series 2003-15A Class 4A, 3.28% 4/25/33 (e) | 2 | 2 | |
| TOTAL PRIVATE SPONSOR | 143 | ||
| U.S. Government Agency - 0.1% | |||
| Fannie Mae planned amortization class Series 2002-9 Class PC, 6% 3/25/17 | 0 | 0 | |
| Ginnie Mae guaranteed REMIC pass-thru certificates: | |||
| sequential payer Series 2013-H06 Class HA, 1.65% 1/20/63 (h) | 856 | 854 | |
| Series 2015-H21 Class JA, 2.5% 6/20/65 (h) | 852 | 862 | |
| TOTAL U.S. GOVERNMENT AGENCY | 1,716 | ||
| TOTAL COLLATERALIZED MORTGAGE OBLIGATIONS | |||
| (Cost $1,825) | 1,859 | ||
| Commercial Mortgage Securities - 1.2% | |||
| Asset Securitization Corp. Series 1997-D5 Class PS1, 1.4918% 2/14/43 (e)(i) | 11 | 0 | |
| Banc of America Commercial Mortgage Trust: | |||
| sequential payer Series 2006-3 Class A4, 5.889% 7/10/44 (e) | 29 | 29 | |
| Series 2007-2 Class A4, 5.6241% 4/10/49 (e) | 2,087 | 2,104 | |
| Series 2007-3 Class A4, 5.5433% 6/10/49 (e) | 521 | 529 | |
| Banc of America Commercial Mortgage, Inc. sequential payer Series 2001-1 Class A4, 5.451% 1/15/49 | 211 | 213 | |
| Barclays Commercial Mortgage Securities LLC floater Series 2015-RRI: | |||
| Class B, 2.1077% 5/15/32 (d)(e) | 3,264 | 3,212 | |
| Class C, 2.5577% 5/15/32 (d)(e) | 435 | 431 | |
| Class D, 3.4077% 5/15/32 (d)(e) | 228 | 224 | |
| Bayview Commercial Asset Trust floater: | |||
| Series 2003-2 Class M1, 1.7994% 12/25/33 (d)(e) | 1 | 1 | |
| Series 2005-4A: | |||
| Class A2, 0.9144% 1/25/36 (d)(e) | 30 | 26 | |
| Class B1, 1.9244% 1/25/36 (d)(e) | 1 | 1 | |
| Class M1, 0.9744% 1/25/36 (d)(e) | 10 | 8 | |
| Class M2, 0.9944% 1/25/36 (d)(e) | 3 | 2 | |
| Class M3, 1.0244% 1/25/36 (d)(e) | 4 | 3 | |
| Class M4, 1.1344% 1/25/36 (d)(e) | 2 | 2 | |
| Class M5, 1.1744% 1/25/36 (d)(e) | 2 | 2 | |
| Class M6, 1.2244% 1/25/36 (d)(e) | 3 | 2 | |
| Series 2006-3A Class M4, 0.9544% 10/25/36 (d)(e) | 1 | 1 | |
| Series 2007-1 Class A2, 0.7944% 3/25/37 (d)(e) | 17 | 14 | |
| Series 2007-2A: | |||
| Class A1, 0.7944% 7/25/37 (d)(e) | 18 | 15 | |
| Class A2, 0.8444% 7/25/37 (d)(e) | 17 | 13 | |
| Class M1, 0.8944% 7/25/37 (d)(e) | 6 | 5 | |
| Class M2, 0.9344% 7/25/37 (d)(e) | 3 | 2 | |
| Class M3, 1.0144% 7/25/37 (d)(e) | 2 | 2 | |
| Series 2007-3: | |||
| Class A2, 0.8144% 7/25/37 (d)(e) | 19 | 15 | |
| Class M1, 0.8344% 7/25/37 (d)(e) | 3 | 3 | |
| Class M2, 0.8644% 7/25/37 (d)(e) | 4 | 3 | |
| Class M3, 0.8944% 7/25/37 (d)(e) | 6 | 4 | |
| Class M4, 1.0244% 7/25/37 (d)(e) | 9 | 6 | |
| Class M5, 1.1244% 7/25/37 (d)(e) | 4 | 2 | |
| Series 2007-4A Class M1, 1.4379% 9/25/37 (d)(e) | 3 | 1 | |
| Bear Stearns Commercial Mortgage Securities Trust sequential payer Series 2007-PW16 Class A4, 5.7197% 6/11/40 (e) | 32 | 33 | |
| C-BASS Trust floater Series 2006-SC1 Class A, 0.7579% 5/25/36 (d)(e) | 3 | 2 | |
| CDGJ Commercial Mortgage Trust Series 2014-BXCH Class DPA, 3.6801% 12/15/27 (d)(e) | 178 | 176 | |
| CGBAM Commercial Mortgage Trust Series 2015-SMRT Class D, 3.768% 4/10/28 (d)(e) | 446 | 450 | |
| Citigroup/Deutsche Bank Commercial Mortgage Trust sequential payer: | |||
| Series 2006-CD3 Class A5, 5.617% 10/15/48 | 15 | 15 | |
| Series 2007-CD4 Class A4, 5.322% 12/11/49 | 1,470 | 1,476 | |
| COMM Mortgage Trust pass-thru certificates floater Series 2005-F10A Class J, 1.3577% 4/15/17 (d)(e) | 6 | 6 | |
| Credit Suisse Commercial Mortgage Trust Series 2007-C5 Class A4, 5.695% 9/15/40 (e) | 50 | 51 | |
| CSMC Series 2015-TOWN: | |||
| Class B, 2.4077% 3/15/17 (d)(e) | 104 | 102 | |
| Class C, 2.7577% 3/15/17 (d)(e) | 101 | 99 | |
| Class D, 3.7077% 3/15/17 (d)(e) | 153 | 150 | |
| GAHR Commercial Mortgage Trust Series 2015-NRF: | |||
| Class BFX, 3.4949% 12/15/34 (d)(e) | 1,510 | 1,561 | |
| Class CFX, 3.4949% 12/15/34 (d)(e) | 433 | 442 | |
| Class DFX, 3.4949% 12/15/34 (d)(e) | 367 | 369 | |
| GE Capital Commercial Mortgage Corp. sequential payer Series 2007-C1 Class A4, 5.543% 12/10/49 | 1,968 | 1,989 | |
| GS Mortgage Securities Trust sequential payer Series 2006-GG8 Class A4, 5.56% 11/10/39 | 2 | 2 | |
| Hilton U.S.A. Trust Series 2013-HLT: | |||
| Class CFX, 3.7141% 11/5/30 (d) | 100 | 100 | |
| Class DFX, 4.4065% 11/5/30 (d) | 765 | 767 | |
| JPMorgan Chase Commercial Mortgage Securities Trust: | |||
| floater Series 2014-BXH: | |||
| Class C, 2.1577% 4/15/27 (d)(e) | 130 | 128 | |
| Class D, 2.7577% 4/15/27 (d)(e) | 277 | 270 | |
| sequential payer: | |||
| Series 2006-CB17 Class A4, 5.429% 12/12/43 | 11 | 11 | |
| Series 2006-LDP9 Class A3, 5.336% 5/15/47 | 19 | 19 | |
| Series 2007-CB18 Class A4, 5.44% 6/12/47 | 55 | 56 | |
| Series 2007-CB19 Class A4, 5.6986% 2/12/49 (e) | 1,096 | 1,113 | |
| Series 2007-LD11 Class A4, 5.7416% 6/15/49 (e) | 743 | 755 | |
| Series 2007-LDPX Class A3, 5.42% 1/15/49 | 407 | 411 | |
| Series 2007-LDP10 Class CS, 5.466% 1/15/49 (e) | 1 | 0 | |
| LB Commercial Conduit Mortgage Trust sequential payer Series 2007-C3 Class A4, 5.9184% 7/15/44 (e) | 176 | 181 | |
| LB-UBS Commercial Mortgage Trust: | |||
| sequential payer Series 2007-C1 Class A4, 5.424% 2/15/40 | 229 | 231 | |
| Series 2007-C6 Class A4, 5.858% 7/15/40 (e) | 71 | 72 | |
| Series 2007-C7 Class A3, 5.866% 9/15/45 | 424 | 439 | |
| Merrill Lynch Mortgage Trust: | |||
| Series 2005-LC1 Class F, 5.4984% 1/12/44 (d)(e) | 17 | 17 | |
| Series 2007-C1 Class A4, 5.8262% 6/12/50 (e) | 354 | 362 | |
| Merrill Lynch-CFC Commercial Mortgage Trust: | |||
| sequential payer: | |||
| Series 2007-5 Class A4, 5.378% 8/12/48 | 47 | 47 | |
| Series 2007-6 Class A4, 5.485% 3/12/51 (e) | 550 | 557 | |
| Series 2007-7 Class A4, 5.7387% 6/12/50 (e) | 232 | 236 | |
| Series 2007-8 Class A3, 5.8755% 8/12/49 (e) | 63 | 65 | |
| Morgan Stanley Capital I Trust: | |||
| floater Series 2006-XLF Class C, 1.708% 7/15/19 (d)(e) | 16 | 16 | |
| Series 2007-IQ14 Class A4, 5.692% 4/15/49 | 2,968 | 3,004 | |
| Providence Place Group Ltd. Partnership Series 2000-C1 Class A2, 7.75% 7/20/28 (d) | 737 | 991 | |
| Wachovia Bank Commercial Mortgage Trust: | |||
| sequential payer: | |||
| Series 2006-C28 Class A4, 5.572% 10/15/48 | 5 | 5 | |
| Series 2006-C29 Class A1A, 5.297% 11/15/48 | 214 | 215 | |
| Series 2007-C30 Class A5, 5.342% 12/15/43 | 2,086 | 2,103 | |
| Series 2007-C31 Class A4, 5.509% 4/15/47 | 1,010 | 1,021 | |
| Series 2007-C32 Class A3, 5.7021% 6/15/49 (e) | 235 | 240 | |
| Series 2007-C33: | |||
| Class A4, 5.9484% 2/15/51 (e) | 1,145 | 1,164 | |
| Class A5, 5.9484% 2/15/51 (e) | 50 | 51 | |
| Series 2006-C26 Class A1A, 6.009% 6/15/45 (e) | 45 | 45 | |
| TOTAL COMMERCIAL MORTGAGE SECURITIES | |||
| (Cost $28,724) | 28,490 | ||
| Municipal Securities - 0.9% | |||
| California Gen. Oblig.: | |||
| Series 2009, 7.35% 11/1/39 | $70 | $109 | |
| 7.3% 10/1/39 | 535 | 828 | |
| 7.5% 4/1/34 | 465 | 718 | |
| 7.55% 4/1/39 | 1,375 | 2,241 | |
| 7.625% 3/1/40 | 2,275 | 3,672 | |
| Chicago Gen. Oblig.: | |||
| (Taxable Proj.): | |||
| Series 2008 B, 5.63% 1/1/22 | 80 | 81 | |
| Series 2010 C1, 7.781% 1/1/35 | 1,030 | 1,185 | |
| Series 2012 B, 5.432% 1/1/42 | 105 | 97 | |
| 6.314% 1/1/44 | 515 | 524 | |
| Illinois Gen. Oblig.: | |||
| Series 2003: | |||
| 4.35% 6/1/18 | 205 | 210 | |
| 4.95% 6/1/23 | 610 | 644 | |
| 5.1% 6/1/33 | 5,070 | 4,943 | |
| Series 2010-1, 6.63% 2/1/35 | 1,325 | 1,453 | |
| Series 2010-3: | |||
| 5.547% 4/1/19 | 10 | 11 | |
| 6.725% 4/1/35 | 1,350 | 1,483 | |
| 7.35% 7/1/35 | 565 | 651 | |
| Series 2010-5, 6.2% 7/1/21 | 280 | 304 | |
| Series 2011: | |||
| 5.365% 3/1/17 | 15 | 15 | |
| 5.665% 3/1/18 | 410 | 431 | |
| 5.877% 3/1/19 | 1,320 | 1,432 | |
| Series 2013: | |||
| 2.69% 12/1/17 | 110 | 111 | |
| 3.14% 12/1/18 | 115 | 116 | |
| TOTAL MUNICIPAL SECURITIES | |||
| (Cost $20,418) | 21,259 | ||
| Bank Notes - 0.3% | |||
| Capital One NA 1.65% 2/5/18 | 2,362 | 2,365 | |
| Discover Bank: | |||
| (Delaware) 3.2% 8/9/21 | 685 | 704 | |
| 3.1% 6/4/20 | 782 | 804 | |
| KeyBank NA 2.25% 3/16/20 | 1,500 | 1,521 | |
| Marshall & Ilsley Bank 5% 1/17/17 | 259 | 262 | |
| RBS Citizens NA 2.5% 3/14/19 | 404 | 410 | |
| Regions Bank 7.5% 5/15/18 | 1,282 | 1,400 | |
| TOTAL BANK NOTES | |||
| (Cost $7,359) | 7,466 | ||
| Shares | Value (000s) | ||
| Fixed-Income Funds - 9.7% | |||
| Fidelity High Income Central Fund 2 (j) | 566,658 | $62,797 | |
| Fidelity Mortgage Backed Securities Central Fund (j) | 1,486,268 | 164,604 | |
| TOTAL FIXED-INCOME FUNDS | |||
| (Cost $216,995) | 227,401 | ||
| Money Market Funds - 3.2% | |||
| Fidelity Cash Central Fund, 0.42% (k) | 71,291,685 | 71,292 | |
| Fidelity Securities Lending Cash Central Fund 0.44% (k)(l) | 2,823,225 | 2,823 | |
| TOTAL MONEY MARKET FUNDS | |||
| (Cost $74,115) | 74,115 | ||
| TOTAL INVESTMENT PORTFOLIO - 99.9% | |||
| (Cost $2,046,446) | 2,337,124 | ||
| NET OTHER ASSETS (LIABILITIES) - 0.1% | 2,783 | ||
| NET ASSETS - 100% | $2,339,907 |
| TBA Sale Commitments | ||
| Principal Amount (000s) | Value (000s) | |
| Fannie Mae | ||
| 3% 9/1/46 | ||
| (Proceeds $104) | $(100) | $(104) |
| Futures Contracts | |||
| Expiration Date | Underlying Face Amount at Value (000s) | Unrealized Appreciation/(Depreciation) (000s) | |
| Purchased | |||
| Equity Index Contracts | |||
| 183 CME E-mini S&P 500 Index Contracts (United States) | Sept. 2016 | 19,851 | $647 |
The face value of futures purchased as a percentage of Net Assets is 0.8%
Swaps
| Underlying Reference | Rating(1) | Expiration Date | Clearinghouse/Counterparty | Fixed Payment Received/(Paid) | Notional Amount (000s)(2) | Value (000s)(1) | Upfront Premium Received/(Paid) (000s) | Unrealized Appreciation/(Depreciation) (000s) |
| Credit Default Swaps | ||||||||
| Sell Protection | ||||||||
| Ameriquest Mortgage Securities Inc Series 2004-R11 Class M9 | C | Dec. 2034 | Credit Suisse International | 4.25% | USD 21 | $(20) | $0 | $(20) |
(1) Ratings are presented for credit default swaps in which the Fund has sold protection on the underlying referenced debt. Ratings for an underlying index represent a weighted average of the ratings of all securities included in the index. The credit rating or value can be measures of the current payment/performance risk. Ratings are from Moody's Investors Service, Inc. Where Moody's® ratings are not available, S&P® ratings are disclosed and are indicated as such. All ratings are as of the report date and do not reflect subsequent changes.
(2) The notional amount of each credit default swap where the Fund has sold protection approximates the maximum potential amount of future payments that the Fund could be required to make if a credit event were to occur.
Legend
(a) Non-income producing
(b) Security or a portion of the security is on loan at period end.
(c) Restricted securities - Investment in securities not registered under the Securities Act of 1933 (excluding 144A issues). At the end of the period, the value of restricted securities (excluding 144A issues) amounted to $151,000 or 0.0% of net assets.
(d) Security exempt from registration under Rule 144A of the Securities Act of 1933. These securities may be resold in transactions exempt from registration, normally to qualified institutional buyers. At the end of the period, the value of these securities amounted to $39,543,000 or 1.7% of net assets.
(e) Coupon rates for floating and adjustable rate securities reflect the rates in effect at period end.
(f) Security or a portion of the security was pledged to cover margin requirements for futures contracts. At period end, the value of securities pledged amounted to $815,000.
(g) Security or a portion of the security purchased on a delayed delivery or when-issued basis.
(h) Represents an investment in an underlying pool of reverse mortgages which typically do not require regular principal and interest payments as repayment is deferred until a maturity event.
(i) Security represents right to receive monthly interest payments on an underlying pool of mortgages or assets. Principal shown is the outstanding par amount of the pool as of the end of the period.
(j) Affiliated fund that is generally available only to investment companies and other accounts managed by Fidelity Investments. A complete unaudited schedule of portfolio holdings for each Fidelity Central Fund is filed with the SEC for the first and third quarters of each fiscal year on Form N-Q and is available upon request or at the SEC's website at www.sec.gov. An unaudited holdings listing for the Fund, which presents direct holdings as well as the pro-rata share of securities and other investments held indirectly through its investment in underlying non-money market Fidelity Central Funds, is available at fidelity.com and/or institutional.fidelity.com, as applicable. In addition, each Fidelity Central Fund's financial statements, which are not covered by the Fund's Report of Independent Registered Public Accounting Firm, are available on the SEC's website or upon request.
(k) Affiliated fund that is generally available only to investment companies and other accounts managed by Fidelity Investments. The rate quoted is the annualized seven-day yield of the fund at period end. A complete unaudited listing of the fund's holdings as of its most recent quarter end is available upon request. In addition, each Fidelity Central Fund's financial statements, which are not covered by the Fund's Report of Independent Registered Public Accounting Firm, are available on the SEC's website or upon request.
(l) Investment made with cash collateral received from securities on loan.
Additional information on each restricted holding is as follows:
| Security | Acquisition Date | Acquisition Cost (000s) |
| MongoDB, Inc. Series F, 8.00% | 10/2/13 | $281 |
Affiliated Central Funds
Information regarding fiscal year to date income earned by the Fund from investments in Fidelity Central Funds is as follows:
| Fund | Income earned |
| (Amounts in thousands) | |
| Fidelity Cash Central Fund | $263 |
| Fidelity High Income Central Fund 2 | 3,369 |
| Fidelity Mortgage Backed Securities Central Fund | 3,244 |
| Fidelity Securities Lending Cash Central Fund | 132 |
| Total | $7,008 |
Additional information regarding the Fund's fiscal year to date purchases and sales, including the ownership percentage, of the non Money Market Central Funds is as follows:
| Fund (Amounts in thousands) | Value, beginning of period | Purchases | Sales Proceeds | Value, end of period | % ownership, end of period |
| Fidelity High Income Central Fund 2 | $36,370 | $24,286 | $-- | $62,797 | 7.4% |
| Fidelity Mortgage Backed Securities Central Fund | 109,407 | 63,266 | 10,003 | 164,604 | 2.3% |
| Total | $145,777 | $87,552 | $10,003 | $227,401 |
Investment Valuation
The following is a summary of the inputs used, as of August 31, 2016, involving the Fund's assets and liabilities carried at fair value. The inputs or methodology used for valuing securities may not be an indication of the risk associated with investing in those securities. For more information on valuation inputs, and their aggregation into the levels used below, please refer to the Investment Valuation section in the accompanying Notes to Financial Statements.
| Valuation Inputs at Reporting Date: | ||||
| Description | Total | Level 1 | Level 2 | Level 3 |
| (Amounts in thousands) | ||||
| Investments in Securities: | ||||
| Equities: | ||||
| Consumer Discretionary | $194,060 | $194,060 | $-- | $-- |
| Consumer Staples | 155,173 | 155,173 | -- | -- |
| Energy | 106,054 | 106,054 | -- | -- |
| Financials | 258,292 | 257,704 | 588 | -- |
| Health Care | 233,218 | 233,218 | -- | -- |
| Industrials | 134,165 | 134,165 | -- | -- |
| Information Technology | 305,807 | 303,912 | 1,744 | 151 |
| Materials | 42,768 | 42,768 | -- | -- |
| Telecommunication Services | 38,772 | 38,772 | -- | -- |
| Utilities | 49,812 | 49,812 | -- | -- |
| Corporate Bonds | 301,560 | -- | 301,560 | -- |
| U.S. Government and Government Agency Obligations | 133,199 | -- | 133,199 | -- |
| U.S. Government Agency - Mortgage Securities | 20,321 | -- | 20,321 | -- |
| Asset-Backed Securities | 3,333 | -- | 3,190 | 143 |
| Collateralized Mortgage Obligations | 1,859 | -- | 1,859 | -- |
| Commercial Mortgage Securities | 28,490 | -- | 27,489 | 1,001 |
| Municipal Securities | 21,259 | -- | 21,259 | -- |
| Bank Notes | 7,466 | -- | 7,466 | -- |
| Fixed-Income Funds | 227,401 | 227,401 | -- | -- |
| Money Market Funds | 74,115 | 74,115 | -- | -- |
| Total Investments in Securities: | $2,337,124 | $1,817,154 | $518,675 | $1,295 |
| Derivative Instruments: | ||||
| Assets | ||||
| Futures Contracts | $647 | $647 | $-- | $-- |
| Total Assets | $647 | $647 | $-- | $-- |
| Liabilities | ||||
| Swaps | $(20) | $-- | $(20) | $-- |
| Total Liabilities | $(20) | $-- | $(20) | $-- |
| Total Derivative Instruments: | $627 | $647 | $(20) | $-- |
| Other Financial Instruments: | ||||
| TBA Sale Commitments | $(104) | $-- | $(104) | $-- |
| Total Other Financial Instruments: | $(104) | $-- | $(104) | $-- |
Value of Derivative Instruments
The following table is a summary of the Fund's value of derivative instruments by primary risk exposure as of August 31, 2016. For additional information on derivative instruments, please refer to the Derivative Instruments section in the accompanying Notes to Financial Statements.
| Primary Risk Exposure / Derivative Type | Value | |
| Asset | Liability | |
| Credit Risk | ||
| Swaps(a) | $0 | $(20) |
| Total Credit Risk | 0 | (20) |
| Equity Risk | ||
| Futures Contracts(b) | 647 | 0 |
| Total Equity Risk | 647 | 0 |
| Total Value of Derivatives | $647 | $(20) |
(a) For bi-lateral over-the-counter (OTC) swaps, reflects gross value which is presented in the Statement of Assets and Liabilities in the bi-lateral OTC swaps, at value line-items.
(b) Reflects gross cumulative appreciation (depreciation) on futures contracts as presented in the Schedule of Investments. In the Statement of Assets and Liabilities, the period end daily variation margin is included in receivable or payable for daily variation margin for derivative instruments, and the net cumulative appreciation (depreciation) is included in net unrealized appreciation (depreciation).
Other Information
The composition of credit quality ratings as a percentage of Total Net Assets is as follows (Unaudited):
| U.S. Government and U.S. Government Agency Obligations | 14.1% |
| AAA,AA,A | 3.8% |
| BBB | 8.4% |
| BB | 3.8% |
| B | 1.3% |
| CCC,CC,C | 0.6% |
| D | 0.0% |
| Not Rated | 0.0% |
| Equities | 64.9% |
| Short-Term Investments and Net Other Assets | 2.8% |
We have used ratings from Moody's Investors Service, Inc. Where Moody's® ratings are not available, we have used S&P® ratings. All ratings are as of the date indicated and do not reflect subsequent changes. Percentages are adjusted for the effect of futures contracts, if applicable.
Distribution of investments by country or territory of incorporation, as a percentage of Total Net Assets, is as follows (Unaudited):
| United States of America | 88.8% |
| United Kingdom | 2.0% |
| Ireland | 1.9% |
| Netherlands | 1.0% |
| Others (Individually Less Than 1%) | 6.3% |
| 100.0% |
The information in the above tables is based on the combined investments of the fund and its pro-rata share of the investments of Fidelity's Fixed-Income Central Funds
Values shown as $0 may reflect amounts less than $500. Percentages shown as 0.0% may reflect amounts less than 0.05%.
See accompanying notes which are an integral part of the financial statements.
Financial Statements
Statement of Assets and Liabilities
| Amounts in thousands (except per-share amounts) | August 31, 2016 | |
| Assets | ||
| Investment in securities, at value (including securities loaned of $2,737) — See accompanying schedule: Unaffiliated issuers (cost $1,755,336) | $2,035,608 | |
| Fidelity Central Funds (cost $291,110) | 301,516 | |
| Total Investments (cost $2,046,446) | $2,337,124 | |
| Cash | 318 | |
| Receivable for investments sold | 5,282 | |
| Receivable for TBA sale commitments | 104 | |
| Receivable for fund shares sold | 5,148 | |
| Dividends receivable | 2,139 | |
| Interest receivable | 3,959 | |
| Distributions receivable from Fidelity Central Funds | 653 | |
| Prepaid expenses | 8 | |
| Other receivables | 117 | |
| Total assets | 2,354,852 | |
| Liabilities | ||
| Payable for investments purchased | ||
| Regular delivery | $6,868 | |
| Delayed delivery | 725 | |
| TBA sale commitments, at value | 104 | |
| Payable for fund shares redeemed | 2,137 | |
| Bi-lateral OTC swaps, at value | 20 | |
| Accrued management fee | 775 | |
| Distribution and service plan fees payable | 899 | |
| Payable for daily variation margin for derivative instruments | 52 | |
| Other affiliated payables | 425 | |
| Other payables and accrued expenses | 117 | |
| Collateral on securities loaned, at value | 2,823 | |
| Total liabilities | 14,945 | |
| Net Assets | $2,339,907 | |
| Net Assets consist of: | ||
| Paid in capital | $2,055,217 | |
| Undistributed net investment income | 5,624 | |
| Accumulated undistributed net realized gain (loss) on investments and foreign currency transactions | (12,236) | |
| Net unrealized appreciation (depreciation) on investments and assets and liabilities in foreign currencies | 291,302 | |
| Net Assets | $2,339,907 | |
| Calculation of Maximum Offering Price | ||
| Class A: | ||
| Net Asset Value and redemption price per share ($531,040 ÷ 27,690.4 shares) | $19.18 | |
| Maximum offering price per share (100/94.25 of $19.18) | $20.35 | |
| Class T: | ||
| Net Asset Value and redemption price per share ($1,074,855 ÷ 55,481.6 shares) | $19.37 | |
| Maximum offering price per share (100/96.50 of $19.37) | $20.07 | |
| Class C: | ||
| Net Asset Value and offering price per share ($410,623 ÷ 21,569.4 shares)(a) | $19.04 | |
| Class I: | ||
| Net Asset Value, offering price and redemption price per share ($284,278 ÷ 14,559.5 shares) | $19.53 | |
| Class Z: | ||
| Net Asset Value, offering price and redemption price per share ($39,111 ÷ 2,003.0 shares) | $19.53 |
(a) Redemption price per share is equal to net asset value less any applicable contingent deferred sales charge.
See accompanying notes which are an integral part of the financial statements.
Statement of Operations
| Amounts in thousands | Year ended August 31, 2016 | |
| Investment Income | ||
| Dividends | $22,382 | |
| Interest | 17,677 | |
| Income from Fidelity Central Funds | 7,008 | |
| Total income | 47,067 | |
| Expenses | ||
| Management fee | $8,673 | |
| Transfer agent fees | 4,005 | |
| Distribution and service plan fees | 9,847 | |
| Accounting and security lending fees | 839 | |
| Custodian fees and expenses | 93 | |
| Independent trustees' fees and expenses | 10 | |
| Registration fees | 143 | |
| Audit | 121 | |
| Legal | 12 | |
| Miscellaneous | 15 | |
| Total expenses before reductions | 23,758 | |
| Expense reductions | (79) | 23,679 |
| Net investment income (loss) | 23,388 | |
| Realized and Unrealized Gain (Loss) | ||
| Net realized gain (loss) on: | ||
| Investment securities: | ||
| Unaffiliated issuers | 2,775 | |
| Fidelity Central Funds | (35) | |
| Foreign currency transactions | (7) | |
| Futures contracts | 517 | |
| Swaps | 6 | |
| Total net realized gain (loss) | 3,256 | |
| Change in net unrealized appreciation (depreciation) on: Investment securities | 129,158 | |
| Assets and liabilities in foreign currencies | 3 | |
| Futures contracts | 1,346 | |
| Swaps | (6) | |
| Delayed delivery commitments | 9 | |
| Total change in net unrealized appreciation (depreciation) | 130,510 | |
| Net gain (loss) | 133,766 | |
| Net increase (decrease) in net assets resulting from operations | $157,154 |
See accompanying notes which are an integral part of the financial statements.
Statement of Changes in Net Assets
| Amounts in thousands | Year ended August 31, 2016 | Year ended August 31, 2015 |
| Increase (Decrease) in Net Assets | ||
| Operations | ||
| Net investment income (loss) | $23,388 | $17,547 |
| Net realized gain (loss) | 3,256 | 107,827 |
| Change in net unrealized appreciation (depreciation) | 130,510 | (130,700) |
| Net increase (decrease) in net assets resulting from operations | 157,154 | (5,326) |
| Distributions to shareholders from net investment income | (21,687) | (14,662) |
| Distributions to shareholders from net realized gain | (78,813) | (102,364) |
| Total distributions | (100,500) | (117,026) |
| Share transactions - net increase (decrease) | 277,637 | 480,832 |
| Total increase (decrease) in net assets | 334,291 | 358,480 |
| Net Assets | ||
| Beginning of period | 2,005,616 | 1,647,136 |
| End of period | $2,339,907 | $2,005,616 |
| Other Information | ||
| Undistributed net investment income end of period | $5,624 | $4,693 |
See accompanying notes which are an integral part of the financial statements.
Financial Highlights — Fidelity Advisor Balanced Fund Class A
| Years ended August 31, | 2016 | 2015 | 2014 | 2013 | 2012 |
| Selected Per–Share Data | |||||
| Net asset value, beginning of period | $18.76 | $20.10 | $17.84 | $16.31 | $14.83 |
| Income from Investment Operations | |||||
| Net investment income (loss)A | .23 | .22 | .23 | .22 | .24 |
| Net realized and unrealized gain (loss) | 1.13 | (.15) | 3.03 | 1.52 | 1.48 |
| Total from investment operations | 1.36 | .07 | 3.26 | 1.74 | 1.72 |
| Distributions from net investment income | (.22) | (.19) | (.23) | (.21) | (.24) |
| Distributions from net realized gain | (.72) | (1.21) | (.77) | – | – |
| Total distributions | (.94) | (1.41)B | (1.00) | (.21) | (.24) |
| Net asset value, end of period | $19.18 | $18.76 | $20.10 | $17.84 | $16.31 |
| Total ReturnC,D | 7.59% | .51% | 18.93% | 10.74% | 11.72% |
| Ratios to Average Net AssetsE,F | |||||
| Expenses before reductions | .90% | .90% | .92% | .95% | .98% |
| Expenses net of fee waivers, if any | .89% | .90% | .92% | .95% | .98% |
| Expenses net of all reductions | .89% | .90% | .92% | .94% | .98% |
| Net investment income (loss) | 1.27% | 1.13% | 1.22% | 1.27% | 1.56% |
| Supplemental Data | |||||
| Net assets, end of period (in millions) | $531 | $451 | $366 | $270 | $249 |
| Portfolio turnover rateG | 63% | 117% | 79% | 124% | 124% |
A Calculated based on average shares outstanding during the period.
B Total distributions of $1.41 per share is comprised of distributions from net investment income of $.193 and distributions from net realized gain of $1.212 per share.
C Total returns would have been lower if certain expenses had not been reduced during the applicable periods shown.
D Total returns do not include the effect of the sales charges.
E Fees and expenses of any underlying Fidelity Central Funds are not included in the Fund's expense ratio. The Fund indirectly bears its proportionate share of the expenses of any underlying Fidelity Central Funds. Based on their most recent shareholder report date, the expenses of any underlying non-money market Fidelity Central Funds were less than .005%.
F Expense ratios reflect operating expenses of the class. Expenses before reductions do not reflect amounts reimbursed by the investment adviser or reductions from brokerage service arrangements or reductions from other expense offset arrangements and do not represent the amount paid by the class during periods when reimbursements or reductions occur. Expenses net of fee waivers reflect expenses after reimbursement by the investment adviser but prior to reductions from brokerage service arrangements or other expense offset arrangements. Expenses net of all reductions represent the net expenses paid by the class.
G Amount does not include the portfolio activity of any underlying Fidelity Central Funds.
See accompanying notes which are an integral part of the financial statements.
Financial Highlights — Fidelity Advisor Balanced Fund Class T
| Years ended August 31, | 2016 | 2015 | 2014 | 2013 | 2012 |
| Selected Per–Share Data | |||||
| Net asset value, beginning of period | $18.94 | $20.28 | $17.99 | $16.44 | $14.95 |
| Income from Investment Operations | |||||
| Net investment income (loss)A | .19 | .18 | .19 | .18 | .21 |
| Net realized and unrealized gain (loss) | 1.14 | (.16) | 3.05 | 1.54 | 1.49 |
| Total from investment operations | 1.33 | .02 | 3.24 | 1.72 | 1.70 |
| Distributions from net investment income | (.18) | (.14) | (.19) | (.17) | (.21) |
| Distributions from net realized gain | (.72) | (1.21) | (.77) | – | – |
| Total distributions | (.90) | (1.36)B | (.95)C | (.17) | (.21) |
| Net asset value, end of period | $19.37 | $18.94 | $20.28 | $17.99 | $16.44 |
| Total ReturnD,E | 7.31% | .25% | 18.66% | 10.55% | 11.44% |
| Ratios to Average Net AssetsF,G | |||||
| Expenses before reductions | 1.14% | 1.14% | 1.15% | 1.17% | 1.19% |
| Expenses net of fee waivers, if any | 1.14% | 1.14% | 1.15% | 1.17% | 1.19% |
| Expenses net of all reductions | 1.13% | 1.14% | 1.15% | 1.16% | 1.18% |
| Net investment income (loss) | 1.03% | .89% | .99% | 1.05% | 1.36% |
| Supplemental Data | |||||
| Net assets, end of period (in millions) | $1,075 | $988 | $960 | $821 | $737 |
| Portfolio turnover rateH | 63% | 117% | 79% | 124% | 124% |
A Calculated based on average shares outstanding during the period.
B Total distributions of $1.36 per share is comprised of distributions from net investment income of $.144 and distributions from net realized gain of $1.212 per share.
C Total distributions of $.95 per share is comprised of distributions from net investment income of $.185 and distributions from net realized gain of $.768 per share.
D Total returns would have been lower if certain expenses had not been reduced during the applicable periods shown.
E Total returns do not include the effect of the sales charges.
F Fees and expenses of any underlying Fidelity Central Funds are not included in the Fund's expense ratio. The Fund indirectly bears its proportionate share of the expenses of any underlying Fidelity Central Funds. Based on their most recent shareholder report date, the expenses of any underlying non-money market Fidelity Central Funds were less than .005%.
G Expense ratios reflect operating expenses of the class. Expenses before reductions do not reflect amounts reimbursed by the investment adviser or reductions from brokerage service arrangements or reductions from other expense offset arrangements and do not represent the amount paid by the class during periods when reimbursements or reductions occur. Expenses net of fee waivers reflect expenses after reimbursement by the investment adviser but prior to reductions from brokerage service arrangements or other expense offset arrangements. Expenses net of all reductions represent the net expenses paid by the class.
H Amount does not include the portfolio activity of any underlying Fidelity Central Funds.
See accompanying notes which are an integral part of the financial statements.
Financial Highlights — Fidelity Advisor Balanced Fund Class C
| Years ended August 31, | 2016 | 2015 | 2014 | 2013 | 2012 |
| Selected Per–Share Data | |||||
| Net asset value, beginning of period | $18.64 | $19.99 | $17.76 | $16.24 | $14.77 |
| Income from Investment Operations | |||||
| Net investment income (loss)A | .09 | .07 | .09 | .09 | .13 |
| Net realized and unrealized gain (loss) | 1.13 | (.15) | 3.01 | 1.52 | 1.46 |
| Total from investment operations | 1.22 | (.08) | 3.10 | 1.61 | 1.59 |
| Distributions from net investment income | (.10) | (.06) | (.10) | (.09) | (.12) |
| Distributions from net realized gain | (.72) | (1.21) | (.77) | – | – |
| Total distributions | (.82) | (1.27) | (.87) | (.09) | (.12) |
| Net asset value, end of period | $19.04 | $18.64 | $19.99 | $17.76 | $16.24 |
| Total ReturnB,C | 6.79% | (.25)% | 18.01% | 9.93% | 10.81% |
| Ratios to Average Net AssetsD,E | |||||
| Expenses before reductions | 1.65% | 1.66% | 1.68% | 1.71% | 1.73% |
| Expenses net of fee waivers, if any | 1.65% | 1.66% | 1.68% | 1.71% | 1.73% |
| Expenses net of all reductions | 1.64% | 1.66% | 1.68% | 1.70% | 1.72% |
| Net investment income (loss) | .52% | .37% | .46% | .51% | .81% |
| Supplemental Data | |||||
| Net assets, end of period (in millions) | $411 | $282 | $160 | $105 | $80 |
| Portfolio turnover rateF | 63% | 117% | 79% | 124% | 124% |
A Calculated based on average shares outstanding during the period.
B Total returns would have been lower if certain expenses had not been reduced during the applicable periods shown.
C Total returns do not include the effect of the contingent deferred sales charge.
D Fees and expenses of any underlying Fidelity Central Funds are not included in the Fund's expense ratio. The Fund indirectly bears its proportionate share of the expenses of any underlying Fidelity Central Funds. Based on their most recent shareholder report date, the expenses of any underlying non-money market Fidelity Central Funds were less than .005%.
E Expense ratios reflect operating expenses of the class. Expenses before reductions do not reflect amounts reimbursed by the investment adviser or reductions from brokerage service arrangements or reductions from other expense offset arrangements and do not represent the amount paid by the class during periods when reimbursements or reductions occur. Expenses net of fee waivers reflect expenses after reimbursement by the investment adviser but prior to reductions from brokerage service arrangements or other expense offset arrangements. Expenses net of all reductions represent the net expenses paid by the class.
F Amount does not include the portfolio activity of any underlying Fidelity Central Funds.
See accompanying notes which are an integral part of the financial statements.
Financial Highlights — Fidelity Advisor Balanced Fund Class I
| Years ended August 31, | 2016 | 2015 | 2014 | 2013 | 2012 |
| Selected Per–Share Data | |||||
| Net asset value, beginning of period | $19.07 | $20.42 | $18.11 | $16.55 | $15.06 |
| Income from Investment Operations | |||||
| Net investment income (loss)A | .28 | .27 | .29 | .27 | .29 |
| Net realized and unrealized gain (loss) | 1.17 | (.16) | 3.06 | 1.55 | 1.49 |
| Total from investment operations | 1.45 | .11 | 3.35 | 1.82 | 1.78 |
| Distributions from net investment income | (.26) | (.25) | (.28) | (.26) | (.29) |
| Distributions from net realized gain | (.72) | (1.21) | (.77) | – | – |
| Total distributions | (.99)B | (1.46) | (1.04)C | (.26) | (.29) |
| Net asset value, end of period | $19.53 | $19.07 | $20.42 | $18.11 | $16.55 |
| Total ReturnD | 7.93% | .72% | 19.21% | 11.08% | 11.96% |
| Ratios to Average Net AssetsE,F | |||||
| Expenses before reductions | .64% | .65% | .66% | .68% | .70% |
| Expenses net of fee waivers, if any | .64% | .64% | .66% | .68% | .70% |
| Expenses net of all reductions | .64% | .64% | .66% | .67% | .70% |
| Net investment income (loss) | 1.52% | 1.39% | 1.48% | 1.54% | 1.84% |
| Supplemental Data | |||||
| Net assets, end of period (in millions) | $284 | $242 | $124 | $97 | $66 |
| Portfolio turnover rateG | 63% | 117% | 79% | 124% | 124% |
A Calculated based on average shares outstanding during the period.
B Total distributions of $.99 per share is comprised of distributions from net investment income of $.264 and distributions from net realized gain of $.722 per share.
C Total distributions of $1.04 per share is comprised of distributions from net investment income of $.275 and distributions from net realized gain of $.768 per share.
D Total returns would have been lower if certain expenses had not been reduced during the applicable periods shown.
E Fees and expenses of any underlying Fidelity Central Funds are not included in the Fund's expense ratio. The Fund indirectly bears its proportionate share of the expenses of any underlying Fidelity Central Funds. Based on their most recent shareholder report date, the expenses of any underlying non-money market Fidelity Central Funds were less than .005%.
F Expense ratios reflect operating expenses of the class. Expenses before reductions do not reflect amounts reimbursed by the investment adviser or reductions from brokerage service arrangements or reductions from other expense offset arrangements and do not represent the amount paid by the class during periods when reimbursements or reductions occur. Expenses net of fee waivers reflect expenses after reimbursement by the investment adviser but prior to reductions from brokerage service arrangements or other expense offset arrangements. Expenses net of all reductions represent the net expenses paid by the class.
G Amount does not include the portfolio activity of any underlying Fidelity Central Funds.
See accompanying notes which are an integral part of the financial statements.
Financial Highlights — Fidelity Advisor Balanced Fund Class Z
| Years ended August 31, | 2016 | 2015 | 2014 | 2013 A |
| Selected Per–Share Data | ||||
| Net asset value, beginning of period | $19.07 | $20.42 | $18.11 | $18.56 |
| Income from Investment Operations | ||||
| Net investment income (loss)B | .31 | .30 | .32 | .01 |
| Net realized and unrealized gain (loss) | 1.16 | (.17) | 3.06 | (.46) |
| Total from investment operations | 1.47 | .13 | 3.38 | (.45) |
| Distributions from net investment income | (.29) | (.27) | (.31) | – |
| Distributions from net realized gain | (.72) | (1.21) | (.77) | – |
| Total distributions | (1.01) | (1.48) | (1.07)C | – |
| Net asset value, end of period | $19.53 | $19.07 | $20.42 | $18.11 |
| Total ReturnD,E | 8.08% | .85% | 19.40% | (2.42)% |
| Ratios to Average Net AssetsF,G | ||||
| Expenses before reductions | .50% | .51% | .51% | .53%H |
| Expenses net of fee waivers, if any | .50% | .51% | .51% | .53%H |
| Expenses net of all reductions | .50% | .50% | .51% | .52%H |
| Net investment income (loss) | 1.66% | 1.53% | 1.62% | .85%H |
| Supplemental Data | ||||
| Net assets, end of period (000 omitted) | $39,111 | $35,714 | $26,518 | $98 |
| Portfolio turnover rateI | 63% | 117% | 79% | 124% |
A For the period August 13, 2013 (commencement of sale of shares) to August 31, 2013.
B Calculated based on average shares outstanding during the period.
C Total distributions of $1.07 per share is comprised of distributions from net investment income of $.306 and distributions from net realized gain of $.768 per share.
D Total returns for periods of less than one year are not annualized.
E Total returns would have been lower if certain expenses had not been reduced during the applicable periods shown.
F Fees and expenses of any underlying Fidelity Central Funds are not included in the Fund's expense ratio. The Fund indirectly bears its proportionate share of the expenses of any underlying Fidelity Central Funds. Based on their most recent shareholder report date, the expenses of any underlying non-money market Fidelity Central Funds were less than .005%.
G Expense ratios reflect operating expenses of the class. Expenses before reductions do not reflect amounts reimbursed by the investment adviser or reductions from brokerage service arrangements or reductions from other expense offset arrangements and do not represent the amount paid by the class during periods when reimbursements or reductions occur. Expense ratios before reductions for start-up periods may not be representative of longer-term operating periods. Expenses net of fee waivers reflect expenses after reimbursement by the investment adviser but prior to reductions from brokerage service arrangements or other expense offset arrangements. Expenses net of all reductions represent the net expenses paid by the class.
H Annualized
I Amount does not include the portfolio activity of any underlying Fidelity Central Funds.
See accompanying notes which are an integral part of the financial statements.
Notes to Financial Statements
For the period ended August 31, 2016
(Amounts in thousands except percentages)
1. Organization.
Fidelity Advisor Balanced Fund (the Fund) is a fund of Fidelity Advisor Series I (the Trust) and is authorized to issue an unlimited number of shares. The Trust is registered under the Investment Company Act of 1940, as amended (the 1940 Act), as an open-end management investment company organized as a Massachusetts business trust. The Fund offers Class A, Class T, Class C, Class I and Class Z shares, each of which has equal rights as to assets and voting privileges. Each class has exclusive voting rights with respect to matters that affect that class.
After the close of business on June 24, 2016, all outstanding Class B shares were converted to Class A shares. All current fiscal period dollar and share amounts for Class B presented in the Notes to Financial Statements are for the period September 1, 2015 through June 24, 2016.
2. Investments in Fidelity Central Funds.
The Fund invests in Fidelity Central Funds, which are open-end investment companies generally available only to other investment companies and accounts managed by the investment adviser and its affiliates. The Fund's Schedule of Investments lists each of the Fidelity Central Funds held as of period end, if any, as an investment of the Fund, but does not include the underlying holdings of each Fidelity Central Fund. As an Investing Fund, the Fund indirectly bears its proportionate share of the expenses of the underlying Fidelity Central Funds.
Based on its investment objective, each Fidelity Central Fund may invest or participate in various investment vehicles or strategies that are similar to those of the Fund. These strategies are consistent with the investment objectives of the Fund and may involve certain economic risks which may cause a decline in value of each of the Fidelity Central Funds and thus a decline in the value of the Fund. The Money Market Central Funds seek preservation of capital and current income and are managed by Fidelity Investments Money Management, Inc. (FIMM), an affiliate of the investment adviser. Annualized expenses of the Money Market Central Funds as of their most recent shareholder report date are less than .005%. The following summarizes the Fund's investment in each non-money market Fidelity Central Fund.
| Fidelity Central Fund | Investment Manager | Investment Objective | Investment Practices | Expense Ratio(a) |
| Fidelity High Income Central Fund 2 | FMR Co., Inc. (FMRC) | Seeks a high level of income and may also seek capital appreciation by investing primarily in debt securities, preferred stocks, and convertible securities, with an emphasis on lower-quality debt securities. | Loans & Direct Debt Instruments Restricted Securities | Less than .005% |
| Fidelity Mortgage Backed Securities Central Fund | FIMM | Seeks a high level of income by normally investing in investment-grade mortgage-related securities and repurchase agreements for those securities. | Delayed Delivery & When Issued Securities Futures Swaps | Less than .005% |
(a) Expenses expressed as a percentage of average net assets and are as of each underlying Central Fund's most recent annual or semi-annual shareholder report.
An unaudited holdings listing for the Fund, which presents direct holdings as well as the pro-rata share of any securities and other investments held indirectly through its investment in underlying non-money market Fidelity Central Funds, is available at institutional.fidelity.com. A complete unaudited list of holdings for each Fidelity Central Fund is available upon request or at the Securities and Exchange Commission Securities and Exchange Commission (the SEC) website at www.sec.gov. In addition, the financial statements of the Fidelity Central Funds which contain the significant accounting policies (including investment valuation policies) of those funds, which are not covered by the Fund's Report of Independent Registered Public Accounting Firm, are available on the SEC website or upon request.
3. Significant Accounting Policies.
The financial statements have been prepared in conformity with accounting principles generally accepted in the United States of America (GAAP), which require management to make certain estimates and assumptions at the date of the financial statements. Actual results could differ from those estimates. Subsequent events, if any, through the date that the financial statements were issued have been evaluated in the preparation of the financial statements. The following summarizes the significant accounting policies of the Fund:
Investment Valuation. Investments are valued as of 4:00 p.m. Eastern time on the last calendar day of the period. The Board of Trustees (the Board) has delegated the day to day responsibility for the valuation of the Fund's investments to the Fidelity Management & Research Company (FMR) Fair Value Committee (the Committee). In accordance with valuation policies and procedures approved by the Board, the Fund attempts to obtain prices from one or more third party pricing vendors or brokers to value its investments. When current market prices, quotations or currency exchange rates are not readily available or reliable, investments will be fair valued in good faith by the Committee, in accordance with procedures adopted by the Board. Factors used in determining fair value vary by investment type and may include market or investment specific events, changes in interest rates and credit quality. The frequency with which these procedures are used cannot be predicted and they may be utilized to a significant extent. The Committee oversees the Fund's valuation policies and procedures and reports to the Board on the Committee's activities and fair value determinations. The Board monitors the appropriateness of the procedures used in valuing the Fund's investments and ratifies the fair value determinations of the Committee.
The Fund categorizes the inputs to valuation techniques used to value its investments into a disclosure hierarchy consisting of three levels as shown below:
- Level 1 – quoted prices in active markets for identical investments
- Level 2 – other significant observable inputs (including quoted prices for similar investments, interest rates, prepayment speeds, etc.)
- Level 3 – unobservable inputs (including the Fund's own assumptions based on the best information available)
Valuation techniques used to value the Fund's investments by major category are as follows:
Equity securities, including restricted securities, for which market quotations are readily available, are valued at the last reported sale price or official closing price as reported by a third party pricing vendor on the primary market or exchange on which they are traded and are categorized as Level 1 in the hierarchy. In the event there were no sales during the day or closing prices are not available, securities are valued at the last quoted bid price or may be valued using the last available price and are generally categorized as Level 2 in the hierarchy. For foreign equity securities, when market or security specific events arise, comparisons to the valuation of American Depositary Receipts (ADRs), futures contracts, Exchange-Traded Funds (ETFs) and certain indexes as well as quoted prices for similar securities may be used and would be categorized as Level 2 in the hierarchy. Utilizing these techniques may result in transfers between Level 1 and Level 2. For equity securities, including restricted securities, where observable inputs are limited, assumptions about market activity and risk are used and these securities may be categorized as Level 3 in the hierarchy.
Debt securities, including restricted securities, are valued based on evaluated prices received from third party pricing vendors or from brokers who make markets in such securities. Corporate bonds, bank notes, municipal securities and U.S. government and government agency obligations are valued by pricing vendors who utilize matrix pricing which considers yield or price of bonds of comparable quality, coupon, maturity and type or by broker-supplied prices. Asset backed securities, collateralized mortgage obligations, commercial mortgage securities and U.S. government agency mortgage securities are valued by pricing vendors who utilize matrix pricing which considers prepayment speed assumptions, attributes of the collateral, yield or price of bonds of comparable quality, coupon, maturity and type or by broker-supplied prices. Swaps are marked-to-market daily based on valuations from third party pricing vendors, registered derivatives clearing organizations (clearinghouses) or broker-supplied valuations. These pricing sources may utilize inputs such as interest rate curves, credit spread curves, default possibilities and recovery rates. When independent prices are unavailable or unreliable, debt securities and swaps may be valued utilizing pricing methodologies which consider similar factors that would be used by third party pricing vendors. Debt securities and swaps are generally categorized as Level 2 in the hierarchy but may be Level 3 depending on the circumstances.
Futures contracts are valued at the settlement price established each day by the board of trade or exchange on which they are traded and are categorized as Level 1 in the hierarchy. Investments in open-end mutual funds, including the Fidelity Central Funds, are valued at their closing net asset value (NAV) each business day and are categorized as Level 1 in the hierarchy.
Changes in valuation techniques may result in transfers in or out of an assigned level within the disclosure hierarchy. The aggregate value of investments by input level as of August 31, 2016 is included at the end of the Fund's Schedule of Investments.
Foreign Currency. The Fund may use foreign currency contracts to facilitate transactions in foreign-denominated securities. Gains and losses from these transactions may arise from changes in the value of the foreign currency or if the counterparties do not perform under the contracts' terms.
Foreign-denominated assets, including investment securities, and liabilities are translated into U.S. dollars at the exchange rates at period end. Purchases and sales of investment securities, income and dividends received and expenses denominated in foreign currencies are translated into U.S. dollars at the exchange rate in effect on the transaction date.
The effects of exchange rate fluctuations on investments are included with the net realized and unrealized gain (loss) on investment securities. Other foreign currency transactions resulting in realized and unrealized gain (loss) are disclosed separately.
Investment Transactions and Income. For financial reporting purposes, the Fund's investment holdings and NAV include trades executed through the end of the last business day of the period. The NAV per share for processing shareholder transactions is calculated as of the close of business of the New York Stock Exchange (NYSE), normally 4:00 p.m. Eastern time and includes trades executed through the end of the prior business day. Gains and losses on securities sold are determined on the basis of identified cost and may include proceeds received from litigation. Dividend income is recorded on the ex-dividend date, except for certain dividends from foreign securities where the ex-dividend date may have passed, which are recorded as soon as the Fund is informed of the ex-dividend date. Non-cash dividends included in dividend income, if any, are recorded at the fair market value of the securities received. Income and capital gain distributions from Fidelity Central Funds, if any, are recorded on the ex-dividend date. Distributions received on securities that represent a return of capital or capital gain are recorded as a reduction of cost of investments and/or as a realized gain. Subsequent to ex-dividend date the Fund determines the components of these distributions, based upon receipt of tax filings or other correspondence relating to the underlying investment. Interest income is accrued as earned and includes coupon interest and amortization of premium and accretion of discount on debt securities as applicable. The principal amount on inflation-indexed securities is periodically adjusted to the rate of inflation and interest is accrued based on the principal amount. The adjustments to principal due to inflation are reflected as increases or decreases to Interest in the accompanying Statement of Operations. Investment income is recorded net of foreign taxes withheld where recovery of such taxes is uncertain. Debt obligations may be placed on non-accrual status and related interest income may be reduced by ceasing current accruals and writing off interest receivables when the collection of all or a portion of interest has become doubtful based on consistently applied procedures. A debt obligation is removed from non-accrual status when the issuer resumes interest payments or when collectability of interest is reasonably assured.
Class Allocations and Expenses. Investment income, realized and unrealized capital gains and losses, common expenses of the Fund, and certain fund-level expense reductions, if any, are allocated daily on a pro-rata basis to each class based on the relative net assets of each class to the total net assets of the Fund. Each class differs with respect to transfer agent and distribution and service plan fees incurred. Certain expense reductions may also differ by class. For the reporting period, the allocated portion of income and expenses to each class as a percent of its average net assets may vary due to the timing of recording these transactions in relation to fluctuating net assets of the classes. Expenses directly attributable to a fund are charged to that fund. Expenses attributable to more than one fund are allocated among the respective funds on the basis of relative net assets or other appropriate methods. Expense estimates are accrued in the period to which they relate and adjustments are made when actual amounts are known.
Deferred Trustee Compensation. Under a Deferred Compensation Plan (the Plan), independent Trustees may elect to defer receipt of a portion of their annual compensation. Deferred amounts are invested in a cross-section of Fidelity funds, are marked-to-market and remain in the Fund until distributed in accordance with the Plan. The investment of deferred amounts and the offsetting payable to the Trustees are included in the accompanying Statement of Assets and Liabilities.
Income Tax Information and Distributions to Shareholders. Each year, the Fund intends to qualify as a regulated investment company under Subchapter M of the Internal Revenue Code, including distributing substantially all of its taxable income and realized gains. As a result, no provision for U.S. Federal income taxes is required. As of August 31, 2016, the Fund did not have any unrecognized tax benefits in the financial statements; nor is the Fund aware of any tax positions for which it is reasonably possible that the total amounts of unrecognized tax benefits will significantly change in the next twelve months. The Fund files a U.S. federal tax return, in addition to state and local tax returns as required. The Fund's federal income tax returns are subject to examination by the Internal Revenue Service (IRS) for a period of three fiscal years after they are filed. State and local tax returns may be subject to examination for an additional fiscal year depending on the jurisdiction. Foreign taxes are provided for based on the Fund's understanding of the tax rules and rates that exist in the foreign markets in which it invests.
Distributions are declared and recorded on the ex-dividend date. Income dividends and capital gain distributions are declared separately for each class. Income and capital gain distributions are determined in accordance with income tax regulations, which may differ from GAAP. In addition, the Fund claimed a portion of the payment made to redeeming shareholders as a distribution for income tax purposes.
Capital accounts within the financial statements are adjusted for permanent book-tax differences. These adjustments have no impact on net assets or the results of operations. Capital accounts are not adjusted for temporary book-tax differences which will reverse in a subsequent period.
Book-tax differences are primarily due to futures contracts, swaps, foreign currency transactions, passive foreign investment companies (PFIC), market discount, partnerships (including allocations from Fidelity Central Funds), deferred trustees compensation and losses deferred due to wash sales.
The federal tax cost of investment securities and unrealized appreciation (depreciation) as of period end were as follows:
| Gross unrealized appreciation | $319,962 |
| Gross unrealized depreciation | (42,017) |
| Net unrealized appreciation (depreciation) on securities | $277,945 |
| Tax Cost | $2,059,179 |
The tax-based components of distributable earnings as of period end were as follows:
| Undistributed ordinary income | $5,109 |
| Undistributed long-term capital gain | $1,691 |
| Net unrealized appreciation (depreciation) on securities and other investments | $277,920 |
The tax character of distributions paid was as follows:
| August 31, 2016 | August 31, 2015 | |
| Ordinary Income | $33,335 | $ 43,723 |
| Long-term Capital Gains | 67,165 | 73,303 |
| Total | $100,500 | $ 117,026 |
Delayed Delivery Transactions and When-Issued Securities. During the period, the Fund transacted in securities on a delayed delivery or when-issued basis. Payment and delivery may take place after the customary settlement period for that security. The price of the underlying securities and the date when the securities will be delivered and paid for are fixed at the time the transaction is negotiated. The securities purchased on a delayed delivery or when-issued basis are identified as such in the Fund's Schedule of Investments. The Fund may receive compensation for interest forgone in the purchase of a delayed delivery or when-issued security. With respect to purchase commitments, the Fund identifies securities as segregated in its records with a value at least equal to the amount of the commitment. Losses may arise due to changes in the value of the underlying securities or if the counterparty does not perform under the contract's terms, or if the issuer does not issue the securities due to political, economic, or other factors.
To-Be-Announced (TBA) Securities and Mortgage Dollar Rolls. During the period, the Fund transacted in TBA securities that involved buying or selling mortgage-backed securities (MBS) on a forward commitment basis. A TBA transaction typically does not designate the actual security to be delivered and only includes an approximate principal amount; however delivered securities must meet specified terms defined by industry guidelines, including issuer, rate and current principal amount outstanding on underlying mortgage pools. The Fund may enter into a TBA transaction with the intent to take possession of or deliver the underlying MBS, or the Fund may elect to extend the settlement by entering into either a mortgage or reverse mortgage dollar roll. Mortgage dollar rolls are transactions where a fund sells TBA securities and simultaneously agrees to repurchase MBS on a later date at a lower price and with the same counterparty. Reverse mortgage dollar rolls involve the purchase and simultaneous agreement to sell TBA securities on a later date at a lower price. Transactions in mortgage dollar rolls and reverse mortgage dollar rolls are accounted for as purchases and sales and may result in an increase to the Fund's portfolio turnover rate.
Purchases and sales of TBA securities involve risks similar to those discussed above for delayed delivery and when-issued securities. Also, if the counterparty in a mortgage dollar roll or a reverse mortgage dollar roll transaction files for bankruptcy or becomes insolvent, the Fund's right to repurchase or sell securities may be limited. Additionally, when a fund sells TBA securities without already owning or having the right to obtain the deliverable securities (an uncovered forward commitment to sell), it incurs a risk of loss because it could have to purchase the securities at a price that is higher than the price at which it sold them. A fund may be unable to purchase the deliverable securities if the corresponding market is illiquid.
TBA securities subject to a forward commitment to sell at period end are included at the end of the Fund's Schedule of Investments under the caption "TBA Sale Commitments." The proceeds and value of these commitments are reflected in the Fund's Statement of Assets and Liabilities as Receivable for TBA sale commitments and TBA sale commitments, at value, respectively.
Restricted Securities. The Fund may invest in securities that are subject to legal or contractual restrictions on resale. These securities generally may be resold in transactions exempt from registration or to the public if the securities are registered. Disposal of these securities may involve time-consuming negotiations and expense, and prompt sale at an acceptable price may be difficult. Information regarding restricted securities is included at the end of the Fund's Schedule of Investments.
4. Derivative Instruments.
Risk Exposures and the Use of Derivative Instruments. The Fund's investment objective allows the Fund to enter into various types of derivative contracts, including futures contracts and swaps. Derivatives are investments whose value is primarily derived from underlying assets, indices or reference rates and may be transacted on an exchange or over-the-counter (OTC). Derivatives may involve a future commitment to buy or sell a specified asset based on specified terms, to exchange future cash flows at periodic intervals based on a notional principal amount, or for one party to make one or more payments upon the occurrence of specified events in exchange for periodic payments from the other party.
The Fund used derivatives to increase returns, to gain exposure to certain types of assets and to manage exposure to certain risks as defined below. The success of any strategy involving derivatives depends on analysis of numerous economic factors, and if the strategies for investment do not work as intended, the Fund may not achieve its objectives.
The Fund's use of derivatives increased or decreased its exposure to the following risks:
| Credit Risk | Credit risk relates to the ability of the issuer of a financial instrument to make further principal or interest payments on an obligation or commitment that it has to the Fund. |
| Equity Risk | Equity risk relates to the fluctuations in the value of financial instruments as a result of changes in market prices (other than those arising from interest rate risk or foreign exchange risk), whether caused by factors specific to an individual investment, its issuer, or all factors affecting all instruments traded in a market or market segment. |
The Fund is also exposed to additional risks from investing in derivatives, such as liquidity risk and counterparty credit risk. Liquidity risk is the risk that the Fund will be unable to close out the derivative in the open market in a timely manner. Counterparty credit risk is the risk that the counterparty will not be able to fulfill its obligation to the Fund. Derivative counterparty credit risk is managed through formal evaluation of the creditworthiness of all potential counterparties. On certain OTC derivatives such as bi-lateral swaps, the Fund attempts to reduce its exposure to counterparty credit risk by entering into an International Swaps and Derivatives Association, Inc. (ISDA) Master Agreement with each of its counterparties. The ISDA Master Agreement gives the Fund the right to terminate all transactions traded under such agreement upon the deterioration in the credit quality of the counterparty beyond specified levels. The ISDA Master Agreement gives each party the right, upon an event of default by the other party or a termination of the agreement, to close out all transactions traded under such agreement and to net amounts owed under each transaction to one net payable by one party to the other. To mitigate counterparty credit risk on bi-lateral OTC derivatives, the Fund receives collateral in the form of cash or securities once the Fund's net unrealized appreciation on outstanding derivative contracts under an ISDA Master Agreement exceeds certain applicable thresholds, subject to certain minimum transfer provisions. The collateral received is held in segregated accounts with the Fund's custodian bank in accordance with the collateral agreements entered into between the Fund, the counterparty and the Fund's custodian bank. The Fund could experience delays and costs in gaining access to the collateral even though it is held by the Fund's custodian bank. The Fund's maximum risk of loss from counterparty credit risk related to bi-lateral OTC derivatives is generally the aggregate unrealized appreciation and unpaid counterparty payments in excess of any collateral pledged by the counterparty to the Fund. The Fund may be required to pledge collateral for the benefit of the counterparties on bi-lateral OTC derivatives in an amount not less than each counterparty's unrealized appreciation on outstanding derivative contracts, subject to certain minimum transfer provisions, and any such pledged collateral is identified in the Schedule of Investments. Exchange-traded futures contracts are not covered by the ISDA Master Agreement; however counterparty credit risk related to exchange-traded futures contracts may be mitigated by the protection provided by the exchange on which they trade.
Investing in derivatives may involve greater risks than investing in the underlying assets directly and, to varying degrees, may involve risk of loss in excess of any initial investment and collateral received and amounts recognized in the Statement of Assets and Liabilities. In addition, there may be the risk that the change in value of the derivative contract does not correspond to the change in value of the underlying instrument.
Net Realized Gain (Loss) and Change in Net Unrealized Appreciation (Depreciation) on Derivatives. The table below, which reflects the impacts of derivatives on the financial performance of the Fund, summarizes the net realized gain (loss) and change in net unrealized appreciation (depreciation) for derivatives during the period as presented in the Statement of Operations.
| Primary Risk Exposure / Derivative Type | Net Realized Gain (Loss) | Change in Net Unrealized Appreciation (Depreciation) |
| Credit Risk | ||
| Swaps | $6 | $(6) |
| Equity Risk | ||
| Futures Contracts | 517 | 1,346 |
| Totals | $523 | $1,340 |
A summary of the value of derivatives by primary risk exposure as of period end, if any, is included at the end of the Schedule of Investments.
Futures Contracts. A futures contract is an agreement between two parties to buy or sell a specified underlying instrument for a fixed price at a specified future date. The Fund used futures contracts to manage its exposure to the stock market.
Upon entering into a futures contract, a fund is required to deposit either cash or securities (initial margin) with a clearing broker in an amount equal to a certain percentage of the face value of the contract. Futures contracts are marked-to-market daily and subsequent daily payments (variation margin) are made or received by a fund depending on the daily fluctuations in the value of the futures contracts and are recorded as unrealized appreciation or (depreciation). This receivable and/or payable, if any, is included in daily variation margin for derivative instruments in the Statement of Assets and Liabilities. Realized gain or (loss) is recorded upon the expiration or closing of a futures contract. The net realized gain (loss) and change in net unrealized appreciation (depreciation) on futures contracts during the period is included in the Statement of Operations.
Any open futures contracts at period end are presented in the Schedule of Investments under the caption "Futures Contracts". The underlying face amount at value reflects each contract's exposure to the underlying instrument or index at period end and is representative of volume of activity during the period. Securities deposited to meet initial margin requirements are identified in the Schedule of Investments.
Swaps. A swap is a contract between two parties to exchange future cash flows at periodic intervals based on a notional principal amount. A bi-lateral OTC swap is a transaction between a fund and a dealer counterparty where cash flows are exchanged between the two parties for the life of the swap.
Bi-lateral OTC swaps are marked-to-market daily and changes in value are reflected in the Statement of Assets and Liabilities in the bi-lateral OTC swaps at value line items. Any upfront premiums paid or received upon entering a bi-lateral OTC swap to compensate for differences between stated terms of the swap and prevailing market conditions (e.g. credit spreads, interest rates or other factors) are recorded in net unrealized appreciation (depreciation) in the Statement of Assets and Liabilities and amortized to realized gain or (loss) ratably over the term of the swap. Any unamortized upfront premiums are presented in the Schedule of Investments.
Payments are exchanged at specified intervals, accrued daily commencing with the effective date of the contract and recorded as realized gain or (loss). Some swaps may be terminated prior to the effective date and realize a gain or loss upon termination. The net realized gain (loss) and change in net unrealized appreciation (depreciation) on swaps during the period is included in the Statement of Operations.
Any open swaps at period end are included in the Schedule of Investments under the caption "Swaps" and are representative of volume of activity during the period.
Credit Default Swaps. Credit default swaps enable the Fund to buy or sell protection against specified credit events on a single-name issuer or a traded credit index. Under the terms of a credit default swap the buyer of protection (buyer) receives credit protection in exchange for making periodic payments to the seller of protection (seller) based on a fixed percentage applied to a notional principal amount. In return for these payments, the seller will be required to make a payment upon the occurrence of one or more specified credit events. The Fund enters into credit default swaps as a seller to gain credit exposure to an issuer and/or as a buyer to obtain a measure of protection against defaults of an issuer. Periodic payments are made over the life of the contract by the buyer provided that no credit event occurs.
For credit default swaps on most corporate and sovereign issuers, credit events include bankruptcy, failure to pay or repudiation/moratorium. For credit default swaps on corporate or sovereign issuers, the obligation that may be put to the seller is not limited to the specific reference obligation described in the Schedule of Investments. For credit default swaps on asset-backed securities, a credit event may be triggered by events such as failure to pay principal, maturity extension, rating downgrade or write-down. For credit default swaps on asset-backed securities, the reference obligation described represents the security that may be put to the seller. For credit default swaps on a traded credit index, a specified credit event may affect all or individual underlying securities included in the index.
As a seller, if an underlying credit event occurs, the Fund will pay a net settlement amount of cash equal to the notional amount of the swap less the recovery value of the reference obligation or underlying securities comprising an index. Only in the event of the industry's inability to value the underlying asset will the Fund be required to take delivery of the reference obligation or underlying securities comprising an index and pay an amount equal to the notional amount of the swap.
As a buyer, if an underlying credit event occurs, the Fund will receive a net settlement amount of cash equal to the notional amount of the swap less the recovery value of the reference obligation or underlying securities comprising an index. Only in the event of the industry's inability to value the underlying asset will the Fund be required to deliver the reference obligation or underlying securities comprising an index in exchange for payment of an amount equal to the notional amount of the swap.
Typically, the value of each credit default swap and credit rating disclosed for each reference obligation in the Schedule of Investments, where the Fund is the seller, can be used as measures of the current payment/performance risk of the swap. As the value of the swap changes as a positive or negative percentage of the total notional amount, the payment/performance risk may decrease or increase, respectively. In addition to these measures, the investment adviser monitors a variety of factors including cash flow assumptions, market activity and market sentiment as part of its ongoing process of assessing payment/performance risk.
5. Purchases and Sales of Investments.
Purchases and sales of securities (including the Fixed-Income Central Funds), other than short-term securities and U.S. government securities, aggregated $1,140,646 and $967,542, respectively.
6. Fees and Other Transactions with Affiliates.
Management Fee. Fidelity Management & Research Company (the investment adviser) and its affiliates provide the Fund with investment management related services for which the Fund pays a monthly management fee. The management fee is the sum of an individual fund fee rate that is based on an annual rate of .15% of the Fund's average net assets and an annualized group fee rate that averaged .25% during the period. The group fee rate is based upon the average net assets of all the mutual funds advised by the investment adviser, including any mutual funds previously advised by the investment adviser that are currently advised by Fidelity SelectCo, LLC, an affiliate of the investment adviser. The group fee rate decreases as assets under management increase and increases as assets under management decrease. For the reporting period, the total annual management fee rate was .40% of the Fund's average net assets.
Distribution and Service Plan Fees. In accordance with Rule 12b-1 of the 1940 Act, the Fund has adopted separate Distribution and Service Plans for each class of shares. Certain classes pay Fidelity Distributors Corporation (FDC), an affiliate of the investment adviser, separate Distribution and Service Fees, each of which is based on an annual percentage of each class' average net assets. In addition, FDC may pay financial intermediaries for selling shares of the Fund and providing shareholder support services. For the period, the Distribution and Service Fee rates, total fees and amounts retained by FDC were as follows:
| Distribution Fee | Service Fee | Total Fees | Retained by FDC |
|
| Class A | -% | .25% | $1,222 | $39 |
| Class T | .25% | .25% | 5,057 | – |
| Class B | .75% | .25% | 47 | 36 |
| Class C | .75% | .25% | 3,521 | 1,411 |
| $9,847 | $1,486 |
Sales Load. FDC may receive a front-end sales charge of up to 5.75% for selling Class A shares and 3.50% for selling Class T shares, some of which is paid to financial intermediaries for selling shares of the Fund. Depending on the holding period, FDC may receive contingent deferred sales charges levied on Class A, Class T, Class B, and Class C redemptions. The deferred sales charges range from 5.00% to 1.00% for Class B shares, 1.00% for Class C shares, 1.00% for certain purchases of Class A shares and .25% for certain purchases of Class T shares.
For the period, sales charge amounts retained by FDC were as follows:
| Retained by FDC |
|
| Class A | $326 |
| Class T | 90 |
| Class B(a) | 1 |
| Class C(a) | 122 |
| $539 |
(a) When Class B and Class C shares are initially sold, FDC pays commissions from its own resources to financial intermediaries through which the sales are made.
Transfer Agent Fees. Fidelity Investments Institutional Operations Company, Inc., (FIIOC), an affiliate of the investment adviser, is the transfer, dividend disbursing and shareholder servicing agent for each class of the Fund. FIIOC receives account fees and asset-based fees that vary according to the account size and type of account of the shareholders of the respective classes of the Fund, except for Class Z. FIIOC receives an asset-based fee of Class Z's average net assets. FIIOC pays for typesetting, printing and mailing of shareholder reports, except proxy statements.
For the period, transfer agent fees for each class were as follows:
| Amount | % of Class-Level Average Net Assets |
|
| Class A | $932 | .19 |
| Class T | 1,833 | .18 |
| Class B | 13 | .28 |
| Class C | 684 | .19 |
| Class I | 525 | .19 |
| Class Z | 18 | .05 |
| $4,005 |
Accounting and Security Lending Fees. Fidelity Service Company, Inc. (FSC), an affiliate of the investment adviser, maintains the Fund's accounting records. The accounting fee is based on the level of average net assets for each month. Under a separate contract, FSC administers the security lending program. The security lending fee is based on the number and duration of lending transactions.
Brokerage Commissions. The Fund placed a portion of its portfolio transactions with brokerage firms which are affiliates of the investment adviser. Brokerage commissions are included in net realized gain (loss) and change in net unrealized appreciation (depreciation) in the Statement of Operations. The commissions paid to these affiliated firms were $18 for the period.
Interfund Trades. The Fund may purchase from or sell securities to other Fidelity Funds under procedures adopted by the Board. The procedures have been designed to ensure these interfund trades are executed in accordance with Rule 17a-7 of the 1940 Act. Interfund trades are included within the respective purchases and sales amounts shown in the Purchases and Sales of Investments note.
7. Committed Line of Credit.
The Fund participates with other funds managed by the investment adviser or an affiliate in a $4.25 billion credit facility (the "line of credit") to be utilized for temporary or emergency purposes to fund shareholder redemptions or for other short-term liquidity purposes. The Fund has agreed to pay commitment fees on its pro-rata portion of the line of credit, which amounted to $4 and is reflected in Miscellaneous expenses on the Statement of Operations. During the period, the Fund did not borrow on this line of credit.
8. Security Lending.
The Fund lends portfolio securities from time to time in order to earn additional income. For equity securities, a lending agent is used and may loan securities to certain qualified borrowers, including Fidelity Capital Markets (FCM), a broker-dealer affiliated with the Fund. On the settlement date of the loan, the Fund receives collateral (in the form of U.S. Treasury obligations, letters of credit and/or cash) against the loaned securities and maintains collateral in an amount not less than 100% of the market value of the loaned securities during the period of the loan. The market value of the loaned securities is determined at the close of business of the Fund and any additional required collateral is delivered to the Fund on the next business day. The Fund or borrower may terminate the loan at any time, and if the borrower defaults on its obligation to return the securities loaned because of insolvency or other reasons, the Fund may apply collateral received from the borrower against the obligation. The Fund may experience delays and costs in recovering the securities loaned. Any cash collateral received is maintained at the Fund's custodian and/or invested in cash equivalents and/or the Fidelity Securities Lending Cash Central Fund. The value of loaned securities and cash collateral at period end are disclosed on the Fund's Statement of Assets and Liabilities. The value of securities loaned to FCM at period end was $2,737. Security lending income represents the income earned on investing cash collateral, less rebates paid to borrowers and any lending agent fees associated with the loan, plus any premium payments received for lending certain types of securities. Security lending income is presented in the Statement of Operations as a component of interest income. Total security lending income during the period, presented in the Statement of Operations as a component of interest income, amounted to $25. Net income from the Fidelity Securities Lending Cash Central Fund during the period, presented in the Statement of Operations as a component of income from Fidelity Central Funds, amounted to $132 (including $3 from securities loaned to FCM).
9. Expense Reductions.
Commissions paid to certain brokers with whom the investment adviser, or its affiliates, places trades on behalf of the Fund include an amount in addition to trade execution, which may be rebated back to the Fund to offset certain expenses. This amount totaled $62 for the period. In addition, through arrangements with the Fund's custodian, credits realized as a result of certain uninvested cash balances were used to reduce the Fund's expenses. During the period, these credits reduced the Fund's custody expenses by $1.
In addition, during the period the investment adviser reimbursed and/or waived a portion of fund-level operating expenses in the amount of $16.
10. Distributions to Shareholders.
Distributions to shareholders of each class were as follows:
| Year ended August 31, 2016 | Year ended August 31, 2015 | |
| From net investment income | ||
| Class A | $5,839 | $4,011 |
| Class T | 9,527 | 7,310 |
| Class B | 13 | 12 |
| Class C | 1,805 | 666 |
| Class I | 3,923 | 2,227 |
| Class Z | 580 | 436 |
| Total | $21,687 | $14,662 |
| From net realized gain | ||
| Class A | $17,582 | $22,655 |
| Class T | 37,969 | 58,591 |
| Class B | 264 | 624 |
| Class C | 11,727 | 10,374 |
| Class I | 9,935 | 8,438 |
| Class Z | 1,336 | 1,682 |
| Total | $78,813 | $102,364 |
11. Share Transactions.
Share transactions for each class were as follows and may contain automatic conversions between classes or exchanges between affiliated funds:
| Shares | Shares | Dollars | Dollars | |
| Year ended August 31, 2016 | Year ended August 31, 2015 | Year ended August 31, 2016 | Year ended August 31, 2015 | |
| Class A | ||||
| Shares sold | 10,039 | 9,846 | $182,850 | $191,574 |
| Reinvestment of distributions | 1,231 | 1,367 | 22,373 | 25,452 |
| Shares redeemed | (7,649) | (5,359) | (139,168) | (103,975) |
| Net increase (decrease) | 3,621 | 5,854 | $66,055 | $113,051 |
| Class T | ||||
| Shares sold | 13,117 | 12,721 | $241,264 | $249,731 |
| Reinvestment of distributions | 2,527 | 3,418 | 46,369 | 64,182 |
| Shares redeemed | (12,315) | (11,333) | (226,290) | (222,159) |
| Net increase (decrease) | 3,329 | 4,806 | $61,343 | $91,754 |
| Class B | ||||
| Shares sold | 38 | 74 | $688 | $1,411 |
| Reinvestment of distributions | 14 | 31 | 252 | 575 |
| Shares redeemed | (432) | (259) | (7,874) | (5,038) |
| Net increase (decrease) | (380) | (154) | $(6,934) | $(3,052) |
| Class C | ||||
| Shares sold | 10,105 | 8,492 | $182,882 | $164,051 |
| Reinvestment of distributions | 664 | 548 | 11,989 | 10,127 |
| Shares redeemed | (4,328) | (1,919) | (78,234) | (37,100) |
| Net increase (decrease) | 6,441 | 7,121 | $116,637 | $137,078 |
| Class I | ||||
| Shares sold | 10,994 | 9,348 | $204,311 | $185,064 |
| Reinvestment of distributions | 633 | 514 | 11,712 | 9,738 |
| Shares redeemed | (9,749) | (3,233) | (177,996) | (64,102) |
| Net increase (decrease) | 1,878 | 6,629 | $38,027 | $130,700 |
| Class Z | ||||
| Shares sold | 598 | 790 | $11,159 | $15,691 |
| Reinvestment of distributions | 104 | 112 | 1,916 | 2,117 |
| Shares redeemed | (571) | (329) | (10,566) | (6,507) |
| Net increase (decrease) | 131 | 573 | $2,509 | $11,301 |
12. Other.
The Fund's organizational documents provide former and current trustees and officers with a limited indemnification against liabilities arising in connection with the performance of their duties to the Fund. In the normal course of business, the Fund may also enter into contracts that provide general indemnifications. The Fund's maximum exposure under these arrangements is unknown as this would be dependent on future claims that may be made against the Fund. The risk of material loss from such claims is considered remote.
Report of Independent Registered Public Accounting Firm
To the Trustees of Fidelity Advisor Series I and Shareholders of Fidelity Advisor Balanced Fund:
We have audited the accompanying statement of assets and liabilities of Fidelity Advisor Balanced Fund (the Fund), a fund of Fidelity Advisor Series I, including the schedule of investments, as of August 31, 2016, and the related statement of operations for the year then ended, the statement of changes in net assets for each of the two years in the period then ended, and the financial highlights for each of the five years in the period then ended. These financial statements and financial highlights are the responsibility of the Fund's management. Our responsibility is to express an opinion on these financial statements and financial highlights based on our audits.
We conducted our audits in accordance with the standards of the Public Company Accounting Oversight Board (United States). Those standards require that we plan and perform the audit to obtain reasonable assurance about whether the financial statements and financial highlights are free of material misstatement. The Fund is not required to have, nor were we engaged to perform, an audit of its internal control over financial reporting. Our audits included consideration of internal control over financial reporting as a basis for designing audit procedures that are appropriate in the circumstances, but not for the purpose of expressing an opinion on the effectiveness of the Fund's internal control over financial reporting. Accordingly, we express no such opinion. An audit also includes examining, on a test basis, evidence supporting the amounts and disclosures in the financial statements, assessing the accounting principles used and significant estimates made by management, as well as evaluating the overall financial statement presentation. Our procedures included confirmation of securities owned as of August 31, 2016, by correspondence with the custodians and brokers; when replies were not received from brokers, we performed other auditing procedures. We believe that our audits provide a reasonable basis for our opinion.
In our opinion, such financial statements and financial highlights referred to above present fairly, in all material respects, the financial position of Fidelity Advisor Balanced Fund as of August 31, 2016, the results of its operations for the year then ended, the changes in its net assets for each of the two years in the period then ended, and the financial highlights for each of the five years in the period then ended, in conformity with accounting principles generally accepted in the United States of America.
DELOITTE & TOUCHE LLP
Boston, Massachusetts
October 19, 2016
Trustees and Officers
The Trustees, Members of the Advisory Board (if any), and officers of the trust and fund, as applicable, are listed below. The Board of Trustees governs the fund and is responsible for protecting the interests of shareholders. The Trustees are experienced executives who meet periodically throughout the year to oversee the fund's activities, review contractual arrangements with companies that provide services to the fund, oversee management of the risks associated with such activities and contractual arrangements, and review the fund's performance. Each of the Trustees oversees 170 funds.
The Trustees hold office without limit in time except that (a) any Trustee may resign; (b) any Trustee may be removed by written instrument, signed by at least two-thirds of the number of Trustees prior to such removal; (c) any Trustee who requests to be retired or who has become incapacitated by illness or injury may be retired by written instrument signed by a majority of the other Trustees; and (d) any Trustee may be removed at any special meeting of shareholders by a two-thirds vote of the outstanding voting securities of the trust. Each Trustee who is not an interested person (as defined in the 1940 Act) of the trust and the fund is referred to herein as an Independent Trustee. Each Independent Trustee shall retire not later than the last day of the calendar year in which his or her 75th birthday occurs. The Independent Trustees may waive this mandatory retirement age policy with respect to individual Trustees. Officers and Advisory Board Members hold office without limit in time, except that any officer or Advisory Board Member may resign or may be removed by a vote of a majority of the Trustees at any regular meeting or any special meeting of the Trustees. Except as indicated, each individual has held the office shown or other offices in the same company for the past five years.
The fund’s Statement of Additional Information (SAI) includes more information about the Trustees. To request a free copy, call Fidelity at 1-877-208-0098.
Experience, Skills, Attributes, and Qualifications of the Trustees. The Governance and Nominating Committee has adopted a statement of policy that describes the experience, qualifications, attributes, and skills that are necessary and desirable for potential Independent Trustee candidates (Statement of Policy). The Board believes that each Trustee satisfied at the time he or she was initially elected or appointed a Trustee, and continues to satisfy, the standards contemplated by the Statement of Policy. The Governance and Nominating Committee also engages professional search firms to help identify potential Independent Trustee candidates who have the experience, qualifications, attributes, and skills consistent with the Statement of Policy. From time to time, additional criteria based on the composition and skills of the current Independent Trustees, as well as experience or skills that may be appropriate in light of future changes to board composition, business conditions, and regulatory or other developments, have also been considered by the professional search firms and the Governance and Nominating Committee. In addition, the Board takes into account the Trustees' commitment and participation in Board and committee meetings, as well as their leadership of standing and ad hoc committees throughout their tenure.
In determining that a particular Trustee was and continues to be qualified to serve as a Trustee, the Board has considered a variety of criteria, none of which, in isolation, was controlling. The Board believes that, collectively, the Trustees have balanced and diverse experience, qualifications, attributes, and skills, which allow the Board to operate effectively in governing the fund and protecting the interests of shareholders. Information about the specific experience, skills, attributes, and qualifications of each Trustee, which in each case led to the Board's conclusion that the Trustee should serve (or continue to serve) as a trustee of the fund, is provided below.
Board Structure and Oversight Function. James C. Curvey is an interested person and currently serves as Chairman. The Trustees have determined that an interested Chairman is appropriate and benefits shareholders because an interested Chairman has a personal and professional stake in the quality and continuity of services provided to the fund. Independent Trustees exercise their informed business judgment to appoint an individual of their choosing to serve as Chairman, regardless of whether the Trustee happens to be independent or a member of management. The Independent Trustees have determined that they can act independently and effectively without having an Independent Trustee serve as Chairman and that a key structural component for assuring that they are in a position to do so is for the Independent Trustees to constitute a substantial majority for the Board. The Independent Trustees also regularly meet in executive session. Ned C. Lautenbach serves as Chairman of the Independent Trustees and as such (i) acts as a liaison between the Independent Trustees and management with respect to matters important to the Independent Trustees and (ii) with management prepares agendas for Board meetings.
Fidelity® funds are overseen by different Boards of Trustees. The fund's Board oversees Fidelity's high income and certain equity funds, and other Boards oversee Fidelity's investment-grade bond, money market, asset allocation, and sector funds. The asset allocation funds may invest in Fidelity® funds overseen by the fund's Board. The use of separate Boards, each with its own committee structure, allows the Trustees of each group of Fidelity® funds to focus on the unique issues of the funds they oversee, including common research, investment, and operational issues. On occasion, the separate Boards establish joint committees to address issues of overlapping consequences for the Fidelity® funds overseen by each Board.
The Trustees operate using a system of committees to facilitate the timely and efficient consideration of all matters of importance to the Trustees, the fund, and fund shareholders and to facilitate compliance with legal and regulatory requirements and oversight of the fund's activities and associated risks. The Board, acting through its committees, has charged FMR and its affiliates with (i) identifying events or circumstances the occurrence of which could have demonstrably adverse effects on the fund's business and/or reputation; (ii) implementing processes and controls to lessen the possibility that such events or circumstances occur or to mitigate the effects of such events or circumstances if they do occur; and (iii) creating and maintaining a system designed to evaluate continuously business and market conditions in order to facilitate the identification and implementation processes described in (i) and (ii) above. Because the day-to-day operations and activities of the fund are carried out by or through FMR, its affiliates, and other service providers, the fund's exposure to risks is mitigated but not eliminated by the processes overseen by the Trustees. While each of the Board's committees has responsibility for overseeing different aspects of the fund's activities, oversight is exercised primarily through the Operations, Audit, and Compliance Committees. In addition, the Independent Trustees have worked with FMR to enhance the Board's oversight of investment and financial risks, legal and regulatory risks, technology risks, and operational risks, including the development of additional risk reporting to the Board. For example, a working group comprised of Independent Trustees and FMR has worked and continues to work to review the Fidelity® funds' valuation-related activities, reporting and risk management. Appropriate personnel, including but not limited to the fund's Chief Compliance Officer (CCO), FMR's internal auditor, the independent accountants, the fund's Treasurer and portfolio management personnel, make periodic reports to the Board's committees, as appropriate, including an annual review of Fidelity's risk management program for the Fidelity® funds. The responsibilities of each standing committee, including their oversight responsibilities, are described further under "Standing Committees of the Trustees."
Interested Trustees*:
Correspondence intended for a Trustee who is an interested person may be sent to Fidelity Investments, 245 Summer Street, Boston, Massachusetts 02210.
Name, Year of Birth; Principal Occupations and Other Relevant Experience+
James C. Curvey (1935)
Year of Election or Appointment: 2007
Trustee
Chairman of the Board of Trustees
Mr. Curvey also serves as Trustee of other Fidelity® funds. Mr. Curvey is a Director of Fidelity Research & Analysis Co. (investment adviser firm, 2009-present), and Vice Chairman (2007-present) and Director of FMR LLC (diversified financial services company). In addition, Mr. Curvey serves as an Overseer for the Boston Symphony Orchestra and a member of the board of Artis-Naples, Naples, Florida, and as a Trustee for Brewster Academy, Wolfeboro, New Hampshire. Previously, Mr. Curvey served as a Director of Fidelity Investments Money Management, Inc. (investment adviser firm, 2009-2014) and a Director of FMR and FMR Co., Inc. (investment adviser firms, 2007-2014).
Charles S. Morrison (1960)
Year of Election or Appointment: 2014
Trustee
Mr. Morrison also serves as Trustee of other funds. He serves as a Director of Fidelity Investments Money Management, Inc. (FIMM) (investment adviser firm, 2014-present), Director of Fidelity SelectCo, LLC (investment adviser firm, 2014-present), President, Asset Management (2014-present), and is an employee of Fidelity Investments. Previously, Mr. Morrison served as Vice President of Fidelity's Fixed Income and Asset Allocation Funds (2012-2014), President, Fixed Income (2011-2014), Vice President of Fidelity's Money Market Funds (2005-2009), President, Money Market Group Leader of FMR (investment adviser firm, 2009), and Senior Vice President, Money Market Group of FMR (2004-2009). Mr. Morrison also served as Vice President of Fidelity's Bond Funds (2002-2005), certain Balanced Funds (2002-2005), and certain Asset Allocation Funds (2002-2007), and as Senior Vice President (2002-2005) of Fidelity's Bond Division.
* Determined to be an “Interested Trustee” by virtue of, among other things, his or her affiliation with the trust or various entities under common control with FMR.
+ The information includes the Trustee's principal occupation during the last five years and other information relating to the experience, attributes, and skills relevant to the Trustee's qualifications to serve as a Trustee, which led to the conclusion that the Trustee should serve as a Trustee for the fund.
Independent Trustees:
Correspondence intended for an Independent Trustee may be sent to Fidelity Investments, P.O. Box 55235, Boston, Massachusetts 02205-5235.
Name, Year of Birth; Principal Occupations and Other Relevant Experience+
Dennis J. Dirks (1948)
Year of Election or Appointment: 2005
Trustee
Mr. Dirks also serves as Trustee of other Fidelity® funds. Prior to his retirement in May 2003, Mr. Dirks was Chief Operating Officer and a member of the Board of The Depository Trust & Clearing Corporation (DTCC). He also served as President, Chief Operating Officer, and Board member of The Depository Trust Company (DTC) and President and Board member of the National Securities Clearing Corporation (NSCC). In addition, Mr. Dirks served as Chief Executive Officer and Board member of the Government Securities Clearing Corporation, Chief Executive Officer and Board member of the Mortgage-Backed Securities Clearing Corporation, as a Trustee and a member of the Finance Committee of Manhattan College (2005-2008), as a Trustee and a member of the Finance Committee of AHRC of Nassau County (2006-2008), and as a member of the Independent Directors Council (IDC) Governing Council (2010-2015). Mr. Dirks is a member of the Board of Directors for The Brookville Center for Children's Services, Inc. (2009-present).
Alan J. Lacy (1953)
Year of Election or Appointment: 2008
Trustee
Mr. Lacy also serves as Trustee of other Fidelity® funds. Mr. Lacy serves as Chairman (2014-present) and a member (2010-present) of the Board of Directors of Dave & Buster's Entertainment, Inc. (restaurant and entertainment complexes) and a Director of Bristol-Myers Squibb Company (global pharmaceuticals, 2008-present). He is a Trustee of the California Chapter of The Nature Conservancy (2015-present) and a Director of the Center for Advanced Study in the Behavioral Sciences at Stanford University (2015-present). In addition, Mr. Lacy served as Senior Adviser (2007-2014) of Oak Hill Capital Partners, L.P. (private equity) and also served as Chief Executive Officer (2005) and Vice Chairman (2005-2006) of Sears Holdings Corporation (retail) and Chief Executive Officer and Chairman of the Board of Sears, Roebuck and Co. (retail, 2000-2005). Previously, Mr. Lacy served as Chairman (2008-2011) and a member (2006-2015) of the Board of Trustees of the National Parks Conservation Association and as a member of the Board of Directors for The Western Union Company (global money transfer, 2006-2011), The Hillman Companies, Inc. (hardware wholesalers, 2010-2014), and Earth Fare, Inc. (retail grocery, 2010-2014).
Ned C. Lautenbach (1944)
Year of Election or Appointment: 2000
Trustee
Chairman of the Independent Trustees
Mr. Lautenbach also serves as Trustee of other Fidelity® funds. Mr. Lautenbach currently serves as the Lead Director of the Eaton Corporation Board of Directors (diversified industrial, 1997-present). Mr. Lautenbach is Chairman of the Board of Directors of Artis-Naples in Naples, Florida (2012-present), a member of the Council on Foreign Relations (1994-present), and a member of the Board of Governors, State University System of Florida (2013-present). Previously, Mr. Lautenbach was a Partner/Advisory Partner at Clayton, Dubilier & Rice, LLC (private equity investment, 1998-2010), as well as a Director of Sony Corporation (2006-2007).
Joseph Mauriello (1944)
Year of Election or Appointment: 2008
Trustee
Mr. Mauriello also serves as Trustee of other Fidelity® funds. Prior to his retirement in January 2006, Mr. Mauriello served in numerous senior management positions including Deputy Chairman and Chief Operating Officer (2004-2005), and Vice Chairman of Financial Services (2002-2004) of KPMG LLP US (professional services, 1965-2005). Mr. Mauriello currently serves as a member of the Board of Directors of XL Group plc. (global insurance and re-insurance, 2006-present) and the Independent Directors Council (IDC) Governing Council (2015-present). Previously, Mr. Mauriello served as a Director of the Hamilton Funds of the Bank of New York (2006-2007) and of Arcadia Resources Inc. (health care services and products, 2007-2012).
Robert W. Selander (1950)
Year of Election or Appointment: 2011
Trustee
Mr. Selander also serves as Trustee of other Fidelity® funds. Mr. Selander serves as a Director of The Western Union Company (global money transfer, 2014-present) and a non-executive Chairman of Health Equity, Inc. (health savings custodian, 2015-present). Previously, Mr. Selander served as a Member of the Advisory Board of certain Fidelity® funds (2011), and Executive Vice Chairman (2010), Chief Executive Officer (2009-2010), and President and Chief Executive Officer (1997-2009) of Mastercard, Inc.
Cornelia M. Small (1944)
Year of Election or Appointment: 2005
Trustee
Ms. Small also serves as Trustee of other Fidelity® funds. Ms. Small is a member of the Board of Directors (2009-present) and Chair of the Investment Committee (2010-present) of the Teagle Foundation. Ms. Small also serves on the Investment Committee of the Berkshire Taconic Community Foundation (2008-present). Previously, Ms. Small served as Chairperson (2002-2008) and a member of the Investment Committee and Chairperson (2008-2012) and a member of the Board of Trustees of Smith College. In addition, Ms. Small served as Chief Investment Officer, Director of Global Equity Investments, and a member of the Board of Directors of Scudder, Stevens & Clark and Scudder Kemper Investments.
William S. Stavropoulos (1939)
Year of Election or Appointment: 2002
Trustee
Vice Chairman of the Independent Trustees
Mr. Stavropoulos also serves as Trustee of other Fidelity® funds. Mr. Stavropoulos serves as President and Founder of the Michigan Baseball Foundation, the Great Lakes Loons (2007-present). Mr. Stavropoulos is Chairman Emeritus of the Board of Directors of The Dow Chemical Company, where he previously served in numerous senior management positions, including President, CEO (1995-2000; 2002-2004), Chairman of the Executive Committee (2000-2006), and as a member of the Board of Directors (1990-2006). Currently, Mr. Stavropoulos is Chairman of the Board of Directors of Univar Inc. (global distributor of commodity and specialty chemicals), a Director of Teradata Corporation (data warehousing and technology solutions), and Maersk Inc. (industrial conglomerate), and a member of the Advisory Board for Metalmark Capital LLC (private equity investment, 2005-present). Mr. Stavropoulos is an operating advisor to Clayton, Dubilier & Rice, LLC (private equity investment). In addition, Mr. Stavropoulos is a member of the University of Notre Dame Advisory Council for the College of Science, a Trustee of the Rollin L. Gerstacker Foundation, and a Director of the Naples Philharmonic Center for the Arts. Previously, Mr. Stavropoulos served as a Director of Chemical Financial Corporation (bank holding company, 1993-2012) and Tyco International, Ltd. (multinational manufacturing and services, 2007-2012).
David M. Thomas (1949)
Year of Election or Appointment: 2008
Trustee
Mr. Thomas also serves as Trustee of other Fidelity® funds. Mr. Thomas serves as Non-Executive Chairman of the Board of Directors of Fortune Brands Home and Security (home and security products, 2011-present), as a member of the Board of Directors (2004-present) and Presiding Director (2013-present) of Interpublic Group of Companies, Inc. (marketing communication), and as a member of the Board of Trustees of the University of Florida (2013-present). Previously, Mr. Thomas served as Executive Chairman (2005-2006) and Chairman and Chief Executive Officer (2000-2005) of IMS Health, Inc. (pharmaceutical and healthcare information solutions), and a Director of Fortune Brands, Inc. (consumer products, 2000-2011).
+ The information includes the Trustee's principal occupation during the last five years and other information relating to the experience, attributes, and skills relevant to the Trustee's qualifications to serve as a Trustee, which led to the conclusion that the Trustee should serve as a Trustee for the fund.
Advisory Board Members and Officers:
Correspondence intended for an officer or Peter S. Lynch may be sent to Fidelity Investments, 245 Summer Street, Boston, Massachusetts 02210. Officers appear below in alphabetical order.
Name, Year of Birth; Principal Occupation
Peter S. Lynch (1944)
Year of Election or Appointment: 2003
Member of the Advisory Board
Mr. Lynch also serves as Member of the Advisory Board of other Fidelity® funds. Mr. Lynch is Vice Chairman and a Director of FMR (investment adviser firm) and FMR Co., Inc. (investment adviser firm). In addition, Mr. Lynch serves as a Trustee of Boston College and as the Chairman of the Inner-City Scholarship Fund. Previously, Mr. Lynch served on the Special Olympics International Board of Directors (1997-2006).
Marc R. Bryant (1966)
Year of Election or Appointment: 2015
Secretary and Chief Legal Officer (CLO)
Mr. Bryant also serves as Secretary and CLO of other funds. Mr. Bryant serves as CLO, Secretary, and Senior Vice President of Fidelity Management & Research Company (investment adviser firm, 2015-present) and FMR Co., Inc. (investment adviser firm, 2015-present); Secretary of Fidelity SelectCo, LLC (investment adviser firm, 2015-present) and Fidelity Investments Money Management, Inc. (investment adviser firm, 2015-present); and CLO of Fidelity Management & Research (Hong Kong) Limited and FMR Investment Management (U.K.) Limited (investment adviser firms, 2015-present) and Fidelity Management & Research (Japan) Limited (investment adviser firm, 2016-present). He is Senior Vice President and Deputy General Counsel of FMR LLC (diversified financial services company). Previously, Mr. Bryant served as Secretary and CLO of Fidelity Rutland Square Trust II (2010-2014) and Assistant Secretary of Fidelity's Fixed Income and Asset Allocation Funds (2013-2015). Prior to joining Fidelity Investments, Mr. Bryant served as a Senior Vice President and the Head of Global Retail Legal for AllianceBernstein L.P. (2006-2010), and as the General Counsel for ProFund Advisors LLC (2001-2006).
Jeffrey S. Christian (1961)
Year of Election or Appointment: 2016
Assistant Treasurer
Mr. Christian also serves as Assistant Treasurer of other funds. Mr. Christian is an employee of Fidelity Investments (2003-present).
William C. Coffey (1969)
Year of Election or Appointment: 2009
Assistant Secretary
Mr. Coffey also serves as Assistant Secretary of other funds. He is Senior Vice President and Deputy General Counsel of FMR LLC (diversified financial services company, 2010-present), and is an employee of Fidelity Investments. Previously, Mr. Coffey served as Vice President and Associate General Counsel of FMR LLC (2005-2009).
Jonathan Davis (1968)
Year of Election or Appointment: 2010
Assistant Treasurer
Mr. Davis also serves as Assistant Treasurer of other funds, and is an employee of Fidelity Investments. Previously, Mr. Davis served as Vice President and Associate General Counsel of FMR LLC (diversified financial services company, 2003-2010).
Adrien E. Deberghes (1967)
Year of Election or Appointment: 2016
Assistant Treasurer
Mr. Deberghes also serves as an officer of other funds. He serves as Executive Vice President of Fidelity Investments Money Management, Inc. (FIMM) (investment adviser firm, 2016-present) and is an employee of Fidelity Investments (2008-present). Prior to joining Fidelity Investments, Mr. Deberghes was Senior Vice President of Mutual Fund Administration at State Street Corporation (2007-2008), Senior Director of Mutual Fund Administration at Investors Bank & Trust (2005-2007), and Director of Finance for Dunkin' Brands (2000-2005). Previously, Mr. Deberghes served in other fund officer roles.
Stephanie J. Dorsey (1969)
Year of Election or Appointment: 2010
Assistant Treasurer
Ms. Dorsey also serves as an officer of other funds. She is an employee of Fidelity Investments (2008-present) and has served in other fund officer roles. Prior to joining Fidelity Investments, Ms. Dorsey served as Treasurer (2004-2008) of the JPMorgan Mutual Funds and Vice President (2004-2008) of JPMorgan Chase Bank.
Howard J. Galligan III (1966)
Year of Election or Appointment: 2014
Chief Financial Officer
Mr. Galligan also serves as Chief Financial Officer of other funds. Mr. Galligan serves as President of Fidelity Pricing and Cash Management Services (FPCMS) (2014-present) and as a Director of Strategic Advisers, Inc. (investment adviser firm, 2008-present). Previously, Mr. Galligan served as Chief Administrative Officer of Asset Management (2011-2014) and Chief Operating Officer and Senior Vice President of Investment Support for Strategic Advisers, Inc. (2003-2011).
Scott C. Goebel (1968)
Year of Election or Appointment: 2015
Vice President
Mr. Goebel serves as Vice President of other funds and is an employee of Fidelity Investments (2001-present). Mr. Goebel serves as Senior Vice President of Fidelity Management & Research Company (FMR) (investment adviser firm, 2016-present). Previously, Mr. Goebel served as Secretary of Fidelity SelectCo, LLC (investment adviser firm, 2013-2015), Fidelity Investments Money Management, Inc. (FIMM) (investment adviser firm, 2010-2015), and Fidelity Research and Analysis Company (FRAC) (investment adviser firm, 2010-2015); General Counsel, Secretary, and Senior Vice President of FMR (investment adviser firm, 2008-2015) and FMR Co., Inc. (investment adviser firm, 2008-2015); Assistant Secretary of Fidelity Management & Research (Japan) Limited (investment adviser firm, 2008-2015) and Fidelity Management & Research (U.K.) Inc. (investment adviser firm, 2008-2015); Chief Legal Officer (CLO) of Fidelity Management & Research (Hong Kong) Limited (investment adviser firm, 2008-2015); Secretary and CLO of certain Fidelity® funds (2008-2015); Assistant Secretary of FIMM (2008-2010), FRAC (2008-2010), and certain funds (2007-2008); and as Vice President and Secretary of Fidelity Distributors Corporation (FDC) (2005-2007).
Brian B. Hogan (1964)
Year of Election or Appointment: 2009
Vice President
Mr. Hogan also serves as Trustee or Vice President of other funds. Mr. Hogan serves as a Director of FMR Investment Management (U.K.) Limited (investment adviser firm, 2015-present) and Fidelity SelectCo, LLC (investment adviser firm, 2014-present) and President of the Equity Division of FMR (investment adviser firm, 2009-present). Previously, Mr. Hogan served as Senior Vice President, Equity Research of FMR (2006-2009) and as a portfolio manager. Mr. Brian B. Hogan is not related to Mr. Colm A. Hogan.
Colm A. Hogan (1973)
Year of Election or Appointment: 2016
Deputy Treasurer
Mr. Hogan also serves as an officer of other funds. Mr. Hogan is an employee of Fidelity Investments (2005-present). Mr. Colm A. Hogan is not related to Mr. Brian B. Hogan.
Chris Maher (1972)
Year of Election or Appointment: 2013
Assistant Treasurer
Mr. Maher serves as Assistant Treasurer of other funds. Mr. Maher is Vice President of Valuation Oversight and is an employee of Fidelity Investments. Previously, Mr. Maher served as Vice President of Asset Management Compliance (2013), Vice President of the Program Management Group of FMR (investment adviser firm, 2010-2013), and Vice President of Valuation Oversight (2008-2010).
John F. Papandrea (1972)
Year of Election or Appointment: 2016
Anti-Money Laundering (AML) Officer
Mr. Papandrea also serves as AML Officer of other funds. Mr. Papandrea is Vice President of FMR LLC (diversified financial services company, 2008-present) and is an employee of Fidelity Investments (2005-present).
Melissa M. Reilly (1971)
Year of Election or Appointment: 2014
Vice President of certain Equity Funds
Ms. Reilly also serves as Vice President of other funds. Ms. Reilly is an employee of Fidelity Investments (2004-present).
Kenneth B. Robins (1969)
Year of Election or Appointment: 2016
Chief Compliance Officer
Mr. Robins also serves as an officer of other funds. Mr. Robins serves as Compliance Officer of Fidelity Management & Research Company and FMR Co., Inc. (investment adviser firms, 2016-present) and is an employee of Fidelity Investments (2004-present). Previously, Mr. Robins served as Executive Vice President of Fidelity Investments Money Management, Inc. (investment adviser firm, 2013-2016) and served in other fund officer roles.
Stacie M. Smith (1974)
Year of Election or Appointment: 2016
President and Treasurer
Ms. Smith also serves as an officer of other funds. She is an employee of Fidelity Investments (2009-present) and has served in other fund officer roles. Prior to joining Fidelity Investments, Ms. Smith served as Senior Audit Manager of Ernst & Young LLP (1996-2009). Previously, Ms. Smith served as Deputy Treasurer of certain Fidelity® funds (2013-2016).
Renee Stagnone (1975)
Year of Election or Appointment: 2016
Assistant Treasurer
Ms. Stagnone also serves as an officer of other funds. Ms. Stagnone is an employee of Fidelity Investments (1997-present). Previously, Ms. Stagnone served as Deputy Treasurer of certain Fidelity® funds (2013-2016).
Shareholder Expense Example
As a shareholder of the Fund, you incur two types of costs: (1) transaction costs, including sales charges (loads) on purchase payments or redemption proceeds, and (2) ongoing costs, including management fees, distribution and/or service (12b-1) fees and other Fund expenses. This Example is intended to help you understand your ongoing costs (in dollars) of investing in the Fund and to compare these costs with the ongoing costs of investing in other mutual funds.
The Example is based on an investment of $1,000 invested at the beginning of the period and held for the entire period (March 1, 2016 to August 31, 2016).
Actual Expenses
The first line of the accompanying table for each class of the Fund provides information about actual account values and actual expenses. You may use the information in this line, together with the amount you invested, to estimate the expenses that you paid over the period. Simply divide your account value by $1,000.00 (for example, an $8,600 account value divided by $1,000.00 = 8.6), then multiply the result by the number in the first line for a class of the Fund under the heading entitled "Expenses Paid During Period" to estimate the expenses you paid on your account during this period. In addition, the Fund, as a shareholder in the underlying Fidelity Central Funds, will indirectly bear its pro-rata share of the fees and expenses incurred by the underlying Fidelity Central Funds. These fees and expenses are not included in the Fund's annualized expense ratio used to calculate the expense estimate in the table below.
Hypothetical Example for Comparison Purposes
The second line of the accompanying table for each class of the Fund provides information about hypothetical account values and hypothetical expenses based on a Class' actual expense ratio and an assumed rate of return of 5% per year before expenses, which is not the Class' actual return. The hypothetical account values and expenses may not be used to estimate the actual ending account balance or expenses you paid for the period. You may use this information to compare the ongoing costs of investing in the Fund and other funds. To do so, compare this 5% hypothetical example with the 5% hypothetical examples that appear in the shareholder reports of the other funds. In addition, the Fund, as a shareholder in the underlying Fidelity Central Funds, will indirectly bear its pro-rata share of the fees and expenses incurred by the underlying Fidelity Central Funds. These fees and expenses are not included in the Fund's annualized expense ratio used to calculate the expense estimate in the table below.
Please note that the expenses shown in the table are meant to highlight your ongoing costs only and do not reflect any transaction costs. Therefore, the second line of the table is useful in comparing ongoing costs only, and will not help you determine the relative total costs of owning different funds. In addition, if these transactional costs were included, your costs would have been higher.
| Annualized Expense Ratio-A | Beginning Account Value March 1, 2016 | Ending Account Value August 31, 2016 | Expenses Paid During Period-B March 1, 2016 to August 31, 2016 |
|
| Class A | .89% | |||
| Actual | $1,000.00 | $1,111.30 | $4.72 | |
| Hypothetical-C | $1,000.00 | $1,020.66 | $4.52 | |
| Class T | 1.13% | |||
| Actual | $1,000.00 | $1,109.50 | $5.99 | |
| Hypothetical-C | $1,000.00 | $1,019.46 | $5.74 | |
| Class C | 1.64% | |||
| Actual | $1,000.00 | $1,107.20 | $8.69 | |
| Hypothetical-C | $1,000.00 | $1,016.89 | $8.31 | |
| Class I | .63% | |||
| Actual | $1,000.00 | $1,112.80 | $3.35 | |
| Hypothetical-C | $1,000.00 | $1,021.97 | $3.20 | |
| Class Z | .50% | |||
| Actual | $1,000.00 | $1,113.60 | $2.66 | |
| Hypothetical-C | $1,000.00 | $1,022.62 | $2.54 |
A Annualized expense ratio reflects expenses net of applicable fee waivers.
B Expenses are equal to each Class' annualized expense ratio, multiplied by the average account value over the period, multiplied by 184/366 (to reflect the one-half year period). The fees and expenses of the underlying Fidelity Central Funds in which the Fund invests are not included in each Class' annualized expense ratio. In addition to the expenses noted above, the Fund also indirectly bears its proportional share of the expenses of the underlying Fidelity Central Funds. Annualized expenses of the underlying non-money market Fidelity Central Funds as of their most recent fiscal half year ranged from less than .005%.
C 5% return per year before expenses
Distributions (Unaudited)
The Board of Trustees of Advisor Balanced Fund voted to pay to shareholders of record at the opening of business on record date, the following distributions per share derived from capital gains realized from sales of portfolio securities, and dividends derived from net investment income:
| Pay Date | Record Date | Dividends | Capital Gains | |
| Class A | 10/17/16 | 10/14/16 | $0.059 | $0.019 |
| Class T | 10/17/16 | 10/14/16 | $0.047 | $0.019 |
| Class C | 10/17/16 | 10/14/16 | $0.023 | $0.019 |
| Class I | 10/17/16 | 10/14/16 | $0.072 | $0.019 |
| Class Z | 10/17/16 | 10/14/16 | $0.078 | $0.019 |
The fund hereby designates as a capital gain dividend with respect to the taxable year ended August 31, 2016, $3,741,497, or, if subsequently determined to be different, the net capital gain of such year.
A total of 3.84% of the dividends distributed during the fiscal year was derived from interest on U.S. Government securities which is generally exempt from state income tax.
The fund designates $8,216,063 of distributions paid during the period January 1, 2016 to August 31, 2016 as qualifying to be taxed as interest-related dividends for nonresident alien shareholders.
Class A designates 17%, 78%, 100%, and 100%; Class T designates 18%, 98%, 100%, and 100%; Class B designates 24%, 100%, 100%, and 0%; Class C designates 21%, 100%, 100%, and 100%; Class I designates 16%, 64%, 100%, and 100% and Class Z designates 15%, 59%, 100%, and 100%; of the dividends distributed in October 2015, December 2015, April 2016 and July 2016 respectively during the fiscal year as qualifying for the dividends – received deduction for corporate shareholders.
Class A designates 35%, 66%, 100%, and 100%; Class T designates 38%, 83%, 100%, and 100%; Class B designates 48%, 100%, 100%, and 100%; Class C designates 43%, 100%, 100%, and 100%; Class I designates 32%, 55%, 100%, and 100% and Class Z designates 31%, 50%, 100%, and 100%; of the dividends distributed in October 2015, December 2015, April 2016 and July 2016 respectively during the fiscal year as amounts which may be taken into account as a dividend for purposes of the maximum rate under section 1(h)(11) of the Internal Revenue Code.
The fund will notify shareholders in January 2017 of amounts for use in preparing 2016 income tax returns.
Board Approval of Investment Advisory Contracts and Management Fees
Fidelity Advisor Balanced Fund
Each year, the Board of Trustees, including the Independent Trustees (together, the Board), votes on the renewal of the management contract with Fidelity Management & Research Company (FMR) and the sub-advisory agreements (together, the Advisory Contracts) for the fund. The Board, assisted by the advice of fund counsel and Independent Trustees' counsel, requests and considers a broad range of information relevant to the renewal of the Advisory Contracts throughout the year.
The Board meets regularly and, at each of its meetings, covers an extensive agenda of topics and materials and considers factors that are relevant to its annual consideration of the renewal of the fund's Advisory Contracts, including the services and support provided to the fund and its shareholders. The Board has established various standing committees (Committees), each composed of and chaired by Independent Trustees with varying backgrounds, to which the Board has assigned specific subject matter responsibilities in order to enhance effective decision-making by the Board. The Board, acting directly and through its Committees, requests and receives information concerning the annual consideration of the renewal of the fund's Advisory Contracts. The Board also meets as needed to consider matters specifically related to the Board's annual consideration of the renewal of the Advisory Contracts. Members of the Board may also meet with trustees of other Fidelity funds through ad hoc joint committees to discuss certain matters relevant to all of the Fidelity funds.
At its July 2016 meeting, the Board unanimously determined to renew the fund's Advisory Contracts. In reaching its determination, the Board considered all factors it believed relevant, including (i) the nature, extent, and quality of the services to be provided to the fund and its shareholders (including the investment performance of the fund); (ii) the competitiveness of the fund's management fee and total expense ratio relative to peer funds; (iii) the total costs of the services to be provided by and the profits to be realized by Fidelity from its relationships with the fund; and (iv) the extent to which, if any, economies of scale exist and would be realized as the fund grows, and whether any economies of scale are appropriately shared with fund shareholders.
In considering whether to renew the Advisory Contracts for the fund, the Board reached a determination, with the assistance of fund counsel and Independent Trustees' counsel and through the exercise of its business judgment, that the renewal of the Advisory Contracts was in the best interests of the fund and its shareholders and that the compensation payable under the Advisory Contracts was fair and reasonable. The Board's decision to renew the Advisory Contracts was not based on any single factor, but rather was based on a comprehensive consideration of all the information provided to the Board at its meetings throughout the year. The Board, in reaching its determination to renew the Advisory Contracts, was aware that shareholders of the fund have a broad range of investment choices available to them, including a wide choice among funds offered by Fidelity's competitors, and that the fund's shareholders, who have the opportunity to review and weigh the disclosure provided by the fund in its prospectus and other public disclosures, have chosen to invest in this fund, which is part of the Fidelity family of funds.
Nature, Extent, and Quality of Services Provided. The Board considered Fidelity's staffing as it relates to the fund, including the backgrounds of investment personnel of Fidelity, and also considered the fund's investment objective, strategies, and related investment philosophy. The Independent Trustees also had discussions with senior management of Fidelity's investment operations and investment groups. The Board considered the structure of the investment personnel compensation program and whether this structure provides appropriate incentives to act in the best interests of the fund. Additionally, the Board considered the portfolio managers' investments, if any, in the funds that they manage. Resources Dedicated to Investment Management and Support Services. The Board and the Fund Oversight and Research Committees reviewed the general qualifications and capabilities of Fidelity's investment staff, including its size, education, experience, and resources, as well as Fidelity's approach to recruiting, training, managing, and compensating investment personnel. The Board noted that Fidelity has continued to increase the resources devoted to non-U.S. offices, including expansion of Fidelity's global investment organization. The Board also noted that Fidelity's analysts have extensive resources, tools and capabilities that allow them to conduct sophisticated quantitative and fundamental analysis, as well as credit analysis of issuers, counterparties and guarantors. Further, the Board considered that Fidelity's investment professionals have sufficient access to global information and data so as to provide competitive investment results over time, and that those professionals also have access to sophisticated tools that permit them to assess portfolio construction and risk and performance attribution characteristics continuously, as well as to transmit new information and research conclusions rapidly around the world. Additionally, in its deliberations, the Board considered Fidelity's trading, risk management, compliance, and technology and operations capabilities and resources, which are integral parts of the investment management process. Shareholder and Administrative Services. The Board considered (i) the nature, extent, quality, and cost of advisory, administrative, and shareholder services performed by FMR, the sub-advisers (together with FMR, the Investment Advisers), and their affiliates under the Advisory Contracts and under separate agreements covering transfer agency, pricing and bookkeeping, and securities lending services for the fund; (ii) the nature and extent of the supervision of third party service providers, principally custodians, subcustodians, and pricing vendors; and (iii) the resources devoted to, and the record of compliance with, the fund's compliance policies and procedures. The Board also reviewed the allocation of fund brokerage, including allocations to brokers affiliated with the Investment Advisers, the use of brokerage commissions to pay fund expenses, and the use of "soft" commission dollars to pay for research services.The Board noted that the growth of fund assets over time across the complex allows Fidelity to reinvest in the development of services designed to enhance the value or convenience of the Fidelity funds as investment vehicles. These services include 24-hour access to account information and market information through telephone representatives and over the Internet, investor education materials and asset allocation tools, and the expanded availability of Fidelity Investor Centers.In 2014, the Board formed an ad hoc Committee on Transfer Agency Fees to review the variety of transfer agency fee structures throughout the industry and Fidelity's competitive positioning with respect to industry participants. Investment in a Large Fund Family. The Board considered the benefits to shareholders of investing in a Fidelity fund, including the benefits of investing in a fund that is part of a large family of funds offering a variety of investment disciplines and providing a large variety of mutual fund investor services. The Board noted that Fidelity had taken, or had made recommendations that resulted in the Fidelity funds taking, a number of actions over the previous year that benefited particular funds, including: (i) continuing to dedicate additional resources to investment research and to the support of the senior management team that oversees asset management; (ii) continuing efforts to enhance Fidelity's global research capabilities; (iii) launching new funds and making other enhancements to meet client needs; (iv) broadening eligibility requirements for certain lower-priced share classes of, and streamlining the fee structure for, certain existing equity index funds; (v) lowering expense caps for certain existing funds and classes to reduce expenses paid by shareholders; (vi) eliminating redemption fees for certain variable insurance product funds and classes; (vii) continuing to launch dedicated lower cost underlying funds to meet portfolio construction needs related to expanding underlying fund options for Fidelity funds of funds, specifically for the Freedom Fund product lines; (viii) launching a lower cost share class for use by the Freedom Index Fund product line; (ix) rationalizing product lines and gaining increased efficiencies through fund mergers and share class consolidations; (x) continuing to develop, acquire and implement systems and technology to improve services to the funds and shareholders, strengthen information security, and increase efficiency; (xi) implementing investment enhancements to further strengthen Fidelity's target date product line to increase investors' probability of success in achieving their goals; (xii) accelerating the conversion of all remaining Class B shares to Class A shares, which have a lower expense structure; and (xiii) implementing changes to Fidelity's money market fund product line in response to recent regulatory reforms. Investment Performance. The Board considered whether the fund has operated in accordance with its investment objective, as well as its record of compliance with its investment restrictions and its performance history. The Board noted that there were portfolio management changes for the fund in January 2015, July 2015, and October 2015.The Board took into account discussions with representatives of the Investment Advisers about fund investment performance that occur at Board meetings throughout the year. In this regard the Board noted that as part of regularly scheduled fund reviews and other reports to the Board on fund performance, the Board considers annualized return information for the fund, for different time periods, measured against a securities market index ("benchmark index") and a peer group of funds with similar objectives ("peer group"), if any. In its evaluation of fund investment performance, the Board gave particular attention to information indicating changes in performance of certain Fidelity funds for specific time periods and discussed with the Investment Advisers the reasons for any overperformance or underperformance.In addition to reviewing absolute and relative fund performance, the Independent Trustees periodically consider the appropriateness of fund performance metrics in evaluating the results achieved. In general, the Independent Trustees believe that fund performance should be evaluated based on net performance (after fees and expenses) of both the highest performing and lowest performing fund share classes, where applicable, compared to appropriate benchmark indices, over appropriate time periods that may include full market cycles, and compared to peer groups, as applicable, over the same periods, taking into account relevant factors including the following: general market conditions; issuer-specific information; and fund cash flows and other factors.The Independent Trustees recognize that shareholders evaluate performance on a net basis over their own holding periods, for which one-, three-, and five-year periods are often used as a proxy. For this reason, the performance information reviewed by the Board also included net cumulative calendar year total return information for the fund and an appropriate benchmark index and peer group for the most recent one-, three-, and five-year periods, as shown below. Returns are shown compared to the 25th percentile (top of box, 75% beaten) and 75th percentile (bottom of box, 25% beaten) of the peer universe.Fidelity Advisor Balanced Fund
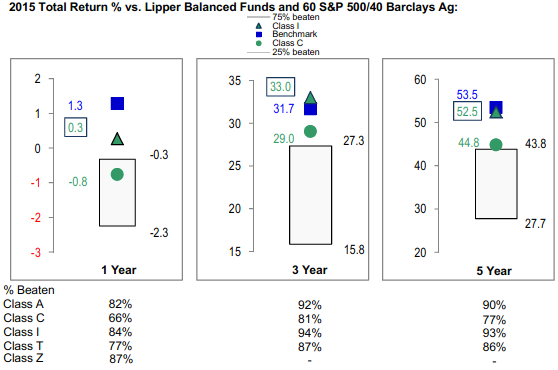
Fidelity Advisor Balanced Fund
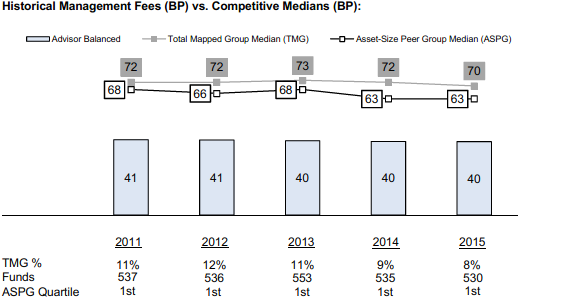
![]()
AIG-ANN-1016
1.538593.119
Item 2.
Code of Ethics
As of the end of the period, August 31, 2016, Fidelity Advisor Series I (the trust) has adopted a code of ethics, as defined in Item 2 of Form N-CSR, that applies to its President and Treasurer and its Chief Financial Officer. A copy of the code of ethics is filed as an exhibit to this Form N-CSR.
Item 3.
Audit Committee Financial Expert
The Board of Trustees of the trust has determined that Joseph Mauriello is an audit committee financial expert, as defined in Item 3 of Form N-CSR. Mr. Mauriello is independent for purposes of Item 3 of Form N-CSR.
Item 4.
Principal Accountant Fees and Services
Fees and Services
The following table presents fees billed by Deloitte & Touche LLP, the member firms of Deloitte Touche Tohmatsu, and their respective affiliates (collectively, “Deloitte Entities”) in each of the last two fiscal years for services rendered to Fidelity Advisor Balanced Fund (the “Fund”):
Services Billed by Deloitte Entities
August 31, 2016 FeesA
| Audit Fees | Audit-Related Fees | Tax Fees | All Other Fees |
Fidelity Advisor Balanced Fund | $88,000 | $- | $7,600 | $2,000 |
August 31, 2015 FeesA
| Audit Fees | Audit-Related Fees | Tax Fees | All Other Fees |
Fidelity Advisor Balanced Fund | $88,000 | $- | $7,300 | $1,000 |
A Amounts may reflect rounding.
The following table presents fees billed by Deloitte Entities that were required to be approved by the Audit Committee for services that relate directly to the operations and financial reporting of the Fund and that are rendered on behalf of Fidelity Management & Research Company (“FMR”) and entities controlling, controlled by, or under common control with FMR (not including any sub-adviser whose role is primarily portfolio management and is subcontracted with or overseen by another investment adviser) that provide ongoing services to the Fund (“Fund Service Providers”):
Services Billed by Deloitte Entities
| August 31, 2016A | August 31, 2015A |
Audit-Related Fees | $35,000 | $- |
Tax Fees | $- | $10,000 |
All Other Fees | $- | $175,000 |
A Amounts may reflect rounding.
“Audit-Related Fees” represent fees billed for assurance and related services that are reasonably related to the performance of the fund audit or the review of the fund's financial statements and that are not reported under Audit Fees.
“Tax Fees” represent fees billed for tax compliance, tax advice or tax planning that relate directly to the operations and financial reporting of the fund.
“All Other Fees” represent fees billed for services provided to the fund or Fund Service Provider, a significant portion of which are assurance related, that relate directly to the operations and financial reporting of the fund, excluding those services that are reported under Audit Fees, Audit-Related Fees or Tax Fees.
Assurance services must be performed by an independent public accountant.
* * *
The aggregate non-audit fees billed by Deloitte Entities for services rendered to the Fund, FMR (not including any sub-adviser whose role is primarily portfolio management and is subcontracted with or overseen by another investment adviser), and any Fund Service Provider for each of the last two fiscal years of the Fund are as follows:
Billed By | August 31, 2016 A | August 31, 2015 A |
Deloitte Entities | $75,000 | $435,000 |
A Amounts may reflect rounding.
The trust's Audit Committee has considered non-audit services that were not pre-approved that were provided by Deloitte Entities to Fund Service Providers to be compatible with maintaining the independence of Deloitte Entities in its audit of the Fund, taking into account representations from Deloitte Entities, in accordance with Public Company Accounting Oversight Board rules, regarding its independence from the Fund and its related entities and FMR’s review of the appropriateness and permissibility under applicable law of such non-audit services prior to their provision to the Fund Service Providers.
Audit Committee Pre-Approval Policies and Procedures
The trust’s Audit Committee must pre-approve all audit and non-audit services provided by a fund’s independent registered public accounting firm relating to the operations or financial reporting of the fund. Prior to the commencement of any audit or non-audit services to a fund, the Audit Committee reviews the services to determine whether they are appropriate and permissible under applicable law.
The Audit Committee has adopted policies and procedures to, among other purposes, provide a framework for the Committee’s consideration of non-audit services by the audit firms that audit the Fidelity funds. The policies and procedures require that any non-audit service provided by a fund audit firm to a Fidelity fund and any non-audit service provided by a fund auditor to a Fund Service Provider that relates directly to the operations and financial reporting of a Fidelity fund (“Covered Service”) are subject to approval by the Audit Committee before such service is provided.
All Covered Services must be approved in advance of provision of the service either: (i) by formal resolution of the Audit Committee, or (ii) by oral or written approval of the service by the Chair of the Audit Committee (or if the Chair is unavailable, such other member of the Audit Committee as may be designated by the Chair to act in the Chair’s absence). The approval contemplated by (ii) above is permitted where the Treasurer determines that action on such an engagement is necessary before the next meeting of the Audit Committee.
Non-audit services provided by a fund audit firm to a Fund Service Provider that do not relate directly to the operations and financial reporting of a Fidelity fund are reported to the Audit Committee on a periodic basis.
Non-Audit Services Approved Pursuant to Rule 2-01(c)(7)(i)(C) and (ii) of Regulation S-X (“De Minimis Exception”)
There were no non-audit services approved or required to be approved by the Audit Committee pursuant to the De Minimis Exception during the Fund’s last two fiscal years relating to services provided to (i) the Fund or (ii) any Fund Service Provider that relate directly to the operations and financial reporting of the Fund.
Item 5.
Audit Committee of Listed Registrants
Not applicable.
Item 6.
Investments
(a)
Not applicable.
(b)
Not applicable
Item 7.
Disclosure of Proxy Voting Policies and Procedures for Closed-End Management Investment Companies
Not applicable.
Item 8.
Portfolio Managers of Closed-End Management Investment Companies
Not applicable.
Item 9.
Purchase of Equity Securities by Closed-End Management Investment Company and Affiliated Purchasers
Not applicable.
Item 10.
Submission of Matters to a Vote of Security Holders
There were no material changes to the procedures by which shareholders may recommend nominees to the trust’s Board of Trustees.
Item 11.
Controls and Procedures
(a)(i) The President and Treasurer and the Chief Financial Officer have concluded that the trust’s disclosure controls and procedures (as defined in Rule 30a-3(c) under the Investment Company Act) provide reasonable assurances that material information relating to the trust is made known to them by the appropriate persons, based on their evaluation of these controls and procedures as of a date within 90 days of the filing date of this report.
(a)(ii) There was no change in the trust’s internal control over financial reporting (as defined in Rule 30a-3(d) under the Investment Company Act) that occurred during the second fiscal quarter of the period covered by this report that has materially affected, or is reasonably likely to materially affect, the trust’s internal control over financial reporting.
Item 12.
Exhibits
(a) | (1) | Code of Ethics pursuant to Item 2 of Form N-CSR is filed and attached hereto as EX-99.CODE ETH. |
(a) | (2) | Certification pursuant to Rule 30a-2(a) under the Investment Company Act of 1940 (17 CFR 270.30a-2(a)) is filed and attached hereto as Exhibit 99.CERT. |
(a) | (3) | Not applicable. |
(b) |
| Certification pursuant to Rule 30a-2(b) under the Investment Company Act of 1940 (17 CFR 270.30a-2(b)) is furnished and attached hereto as Exhibit 99.906CERT. |
SIGNATURES
Pursuant to the requirements of the Securities Exchange Act of 1934 and the Investment Company Act of 1940, the registrant has duly caused this report to be signed on its behalf by the undersigned, thereunto duly authorized.
Fidelity Advisor Series I
By: | /s/Stacie M. Smith |
| Stacie M. Smith |
| President and Treasurer |
|
|
Date: | October 26, 2016 |
Pursuant to the requirements of the Securities Exchange Act of 1934 and the Investment Company Act of 1940, this report has been signed below by the following persons on behalf of the registrant and in the capacities and on the dates indicated.
By: | /s/ Stacie M. Smith |
| Stacie M. Smith |
| President and Treasurer |
|
|
Date: | October 26, 2016 |
By: | /s/Howard J. Galligan III |
| Howard J. Galligan III |
| Chief Financial Officer |
|
|
Date: | October 26, 2016 |